
Application of the Resource-Based Strategy in Bulgarian Companies: Empirical Evidences
403
UNIVERSITATEA „EFTIMIE MURGU” DIN REŞIŢA ANALELE UNIVERSITĂŢII„EFTIMIE MURGU” REŞIŢA. FASCICOLA II. STUDII ECONOMICE ANUL XXI, 2014 ISSN 2344 – 6315 ISSN-L 2344 – 6315 Reşiţa, 2014
Transcript of Application of the Resource-Based Strategy in Bulgarian Companies: Empirical Evidences

UNIVERSITATEA „EFTIMIE MURGU” DIN REŞIŢA
ANALELE UNIVERSITĂŢII„EFTIMIE MURGU” REŞIŢA. FASCICOLA II. STUDII ECONOMICE
ANUL XXI, 2014
ISSN 2344 – 6315
ISSN-L 2344 – 6315
Reşiţa, 2014

2
Despre Revistă…
Analele Universităţii „Eftimie Murgu” Reşiţa, Fascicola II. Studii Economice, se află la numărul XXI, număr aniversar care marchează totdodată şi o maturizare a rezultatelor ştiinţifice cultivate de către această revistă. De-a lungul timpului, în această revistă au publicat cu succes articole ştiinţifice cadrele universitare din domeniul economic şi cercetători de prestigiu din ţară şi străinătate. O dată cu dezvoltarea UEMR, a Facultăţii de Ştiinţe Economice, revista noastră a câştigat în consistenţă, atât din punct de vedere cantitativ, cât şi calitativ. De la an la an, ne-am propus o recenzare din ce în ce mai pertinentă, pe respectarea criteriilor valorice a articolelor publicate în revistă. Recunoaşterea a venit treptat, facultatea noastră demarând legături şi activităţi ştiinţifice în consorţii internaţionale şi totodată diseminând rezultatele, atât a cadrelor didactice interne, cât şi a partenerilor străini prin intermediul revistei, care a câştigat notorietate. Validarea rezultatelor ştiinţifice în prezent se realizează de profesori universitari de anvergură internaţională, care compun atât Consiliul Ştiinţific, cât şi Editorial al revistei. Aceştia susţin promovarea unor rezultate ştiinţifice de actualitate şi de utilitate dovedite pentru economia României şi pentru alte economii emergente sau dezvoltate.
-COMITETUL DE REDACŢIE-
Aboutthe Journal…
The Annals of „Eftimie Murgu” University Reşiţa, Fascicle II. Economic Studies, encounters itself at its XXI number, aniversary number that celebrates a certain ripening of the scientific results nurtered by this journal. Along the time, in this journal, have been published scientifical papers belonging to the academic researchers from the economic field as well as well-known researchers from all over Romania and abroad. Once with the process of development of the UEMR, of the Faculty of Economic Sciences, our journal gained in consistency, both in a quantitative and a qualitative way. With each year, we have established a more and more pertinent system of review, in accordanc ewiththe valoric criteria of the papers published in the journal. The recognition came gradually, with the development of scientifical connections and common activities that took place in the international consortium that our faculty accomplishedand in the same time, with the dissemination of results, that came from reasearchers from inside the country and from abroad. Currently, the validation of the scientifical papers is realized by proffesors with a high international reputation, that are part of the Editorial board or of the Scientifical Commitee. They are interested in promoting current and useful scientific results, both for the Romanian economy and for the other emergent or developed economies.
-EDITORIAL BOARD-

3
EDITORIAL BOARD
MANCIU VENERA CRISTINA – DIRECTOR
Assoc.Prof.PhD., University„Eftimie Murgu” of Reșița, Romania
MILOŞ LAURA RAISA – EDITORIAL IN CHIEF
Assoc. Prof. PhD., University„Eftimie Murgu” of Reșița, Romania
Antonova Diana Prof. PhD., Rousse University „Angel Kanchev”, Bulgaria
Bretcu Angela Assoc. Prof. PhD., University„Eftimie Murgu” of Reșița, Romania
Chybalski Filip Assoc. Prof. PhD., Technical University of Lodz, Poland
Costencu Mirela Assoc. Prof. PhD., University„Eftimie Murgu” of Reșița, Romania
Ferreira Marques Helena Isabel Assoc. Prof. PhD., University of the Balearic Islands, Spain
Graef Michael Prof. PhD., FachhochschuleWorms, Germany
Kume Vasilika Prof. PhD., University of Tirana, Albania
Letonja Marina Lect. PhD., GEA College of Entrepreneurship, Slovenia
Miloş Marius Assoc. Prof. PhD., University„Eftimie Murgu” of Reșița, Romania
Minică Mirela Assoc. Prof. PhD., University„Eftimie Murgu” of Reșița, Romania
Pavlov Daniel Assoc. Prof. PhD, Rousse University „Angel Kanchev”, Bulgaria
Pirtea Marilen Prof. PhD., West University of Timișoara, Romania
Popovici Gheorghe Prof.PhD., University„Eftimie Murgu” of Reșița, România
Schulte Peter Prof. Phd.PhD., INEA, Dusseldorf, Germania
Sîrghi Nicoleta Assoc.Prof. PhD, West University of Timisoara, Romania
Singer Slavica Prof. PhD., Josip Juraj Strossmayer University of Osijek, Croatia
Wassenberg Gerd Prof. PhD., Fachhochscule Aachen, Germania
Zeidan Rodrigo Assoc. Prof. PhD., University of Nottingham, China
Zivkovich Dragana Prof. PhD., University of Belgrade, Serbia
EDITORIAL COLLEGE – ASSISTANCE
Assoc.Prof. PhD. Tănase Adrian Lect.PhD. Ciurea Jeanina
Lect.PhD. Franț Florin Lect.PhD. Lesconi-Frumușanu Nătălița Mihaela
Assist.PhD. Roşu Monica Assist. PhD. Bizău Viorel
Assist.PhD. Candidate Demyen Suzana Assist.PhD. Candidate Lolea Raluca

4
SCIENTIFIC COMMITTEE
Cătoiu Iacob Prof.PhD, ASE București
Cechin Crista Persida Prof.PhD., European University Drăgan, Lugoj
Cismaş Laura Prof.PhD., West University of Timișoara
Cocriş Vasile Prof.PhD., „Al. I. Cuza” University, Iași
Corduneanu Carmen Prof.PhD., West University of Timișoara
Cristescu Ilie Prof.PhD., University „Eftimie Murgu”of Reșița
Donath Liliana Prof.PhD., West University of Timișoara
Frunzăverde Doina Prof.eng.PhD, University „Eftimie Murgu”of Reșița
Hurduzeu Gheorghe Prof.PhD., ASE București
Olteanu Valerică Prof.PhD., ASE București
Matiş Dumitru Prof.PhD., „Babeș-Bolyai” University Cluj-Napoca
Mihăilă Marian Prof.PhD., University „Eftimie Murgu”of Reșița
Pirtea Marilen Prof.PhD.,, West University of Timișoara
Pop Alexandru Prof.PhD., ASE București
Popovici Gheorghe Prof.PhD, University „Eftimie Murgu”of Reșița
Spătaru Liviu Prof.PhD., Universitatea Eftimie Murgu Reșița
Stancu Ion Prof.PhD., ASE, București
Ştefea Petre Prof.PhD., West University of Timișoara
Talpoş Ioan Prof.PhD.,West University of Timișoara
Web design:
Bizău Viorel
Redaction address:
320085 – Reşiţa, Traian Vuia, nr.1-4 Tel/fax: 0255210214
Contact address:

5
CONTENT
Author/s Title of the paper Page
1. Armean Andreea Preliminary concepts of risk assessment in tourism enterprises
8
2. BТz uă↑Тorel-Ionu An innovative model for reducing personnel spending in a security company
16
3. Bogdan Oana The bankruptcy risk in the construction sector
20
4. Bosânceanu Alina Management and corporate social responsibility exemple of good practices
28
5. Bretcu Angela Marketing controlling and price policy for SMEs
34
6. Burcea Felix-Constantin Ungureanu Emilia
Foreign direct investments - barometer of investment environment quality
42
7. Ciasc Rustin Brief considerations on the present day evolutions of the dynamics of global
economy 48
8. Costencu Mirela Information and education – techniques of management of national parks visitors
52
9. Demyen Suzana Material motivation vs spiritual motivation in human resource management in the
context of economic depression 60
10. Demyen Suzana Ciurea Jeanina
Trends and implications regarding strategy development at sme level
66
11. FrКn ăFlorТn Migrant population in the European Union 72 12. Gherghina Liliana Differentiation of the firm’s offer on the
market 78
13. Gherghina Liliana The importance of image and communication of a brand or trademark
positioning 83
14. Kostadinova Irina Antonova Diana
Integrated system for improving professional competence taking into
account the impact of emotional and social intelligence on doctors’ practice
88
15. Kunev Svilen Antonova Diana
Approbation of methodological approach for innovation activeness of small and medium-sized enterprises in a dynamic environment (following the example of
machine-building sector in Ruse region, Bulgaria)
102
16. Lala Gianina T nКseăAНrТКn
The concept of innovativeness in the marketing literature
119
17. Lesconi-FrumuşКnuă The impact of the legislative frame for the 128

6
Mihaela Martin Mihaela Marin Andreea
accounting monography of European 139projects when the beneficiary is a
public instituton 18. Lungu Anda Laura
B ТleşteКnuăGСeorgСe The economic crises from the perspective
of euphoria and panic 139
19. MКlНeКăNТМuşor Conditions for opening insolvency from the perspective of the new Code of Civil
Procedure 147
20. Manciu Venera Survey regarding the trade activity with computers and its equipment on the market
in Resita 150
21. Manciu Venera Consumer behavior in Resita, between domestic and imported goods
158
22. MКtТМТuМăM Н lТnК Diagnosis of cluster management systems in the European Union
166
23. Mihai Iris How fair is the economic productivity? 174 24. MТloşăLКurК Financial balance in the pharmaceutical
industry. A case study 183
25. MТloşăMКrТus Some considerations on the tax evasion 190 26. MТloşăMКrТus The role of corporate governance for the
economic entity 197
27. MТnТМ ăMТrelК Irimia Alina Irimia Ioana
Pensions crisis in Romania and in the European Union 202
28. Munteanu Anca The relation between specific societal culture and strategic human resources
management 213
29. N МСesМuăMТrunКăLuМТК Barna Flavia Mirela
Corporate gouvernance in Central and Eastern Europe
221
30. Nagy Csaba The importance of financial planning of Romanian SME’s in the XXI century
232
31. Oltean Angela The behavioral model of a leader 242 32. Oriol Irina Romanian and european education:
importance and satisfaction 250
33. Pavlov Daniel Academic production of entrepreneurs – myth or reality?
256
34. Petric Ion Economic globalisation and its effects on the social environment of Romania
272
35. Petruse Ionela Methods of analysis and quantification of risk in lending
282
36. Petruse Ionela Risk –performance relationship banking 289 37. Popescu Lucian
PuşМСТ ăMКrТa Pop-Moldovan Adina
The cash flow and the blood floow. Mechanical and “economical” impedances 297
38. Popovici Gheorghe Online communication and stirring the travel desire to visit the monument of
tourism 305
39. Rada Doina Creative accounting and tax evasion 315 40. Rotaru Virgil Could the risks of multiple-partner projects 320
7
be reduced? 41. Schulte Peter Entrepreneurial university 330 42. Stancovici Alina Entrepreneurship and entrepreneurial
culture 341
43. T nКseăDТКnК T nКseăAНrТКn HКmКtăCoНru К-Oana
Competitive advantage – premise of economic development 351
44. TînjКl ăDТКnК-Maria Buglea Alexandru
Trends in corporate environmental reporting
358
45. Todorova Milena Pencheva Desislava
Factors influencing adoption and diffusion of organic cotton clothes on bulgarian
market 368
46. Triculescu Mihaela Cosma Dorin
The social impact of the floods caused by the Danube, on the Cetate-Dăbuleni sector 378
47. Velikova Preslava Kirova Milena
Expert evaluation for risk management of the exploitation of photovoltaic
installations 383
48. Yorgova Yordanka Papazov Emil
Application of the resource-based strategy in Bulgarian companies: empirical
evidences 392

8
PRELIMINARY CONCEPTS OF RISK ASSESSMENT IN TOURISM ENTERPRISES
Andreea ARMEAN1
ABSTRACT Objectives of this paper are to present the preliminary concepts of risk assessment of
tourism enterprises as: relationship between risk and predictability, equation of risk, typology of risks in tourism enterprise, the relationship between orientation for risk and enterprises performance, acceptance of risk in tourism enterprises and steps of risk management. Intended contributions of this paper are: to show the strong relationship between risk and predictability because if we have predictability we can anticipate risks; to show the equations of risk from scientific literature and propose our equation; to present the opinion about the typology of risks that appears in a tourism enterprises; to emphasize the importance of relationship between risk orientation and enterprises performance because only if we risk we have the chance to win; to present our matrix of risk acceptance in tourism enterprises and the three main steps of risk management in our opinion.
KEY WORDS: risk, predictability, tourism, performance, management, assessment JEL: M19 1. INTRODUCTION We consider that for a starting point in risk assessment in tourism enterprises we
need two know some preliminary concepts as follows: risk and predictability due to the fact that, in our opinion, these two concepts have a strong relationship forasmuch if we have predictability we can anticipate risks; equation of risk because before assessment risk we must know how we measure it; and starting from equations of risk that we find in literature we propose an another that we consider to be more specific; typology of risks that we propose because in literature we find just general typology, not specific for tourism enterprises; orientation for risk and enterprises performance due to the fact that, in our opinion, these have a strong relationship for as much only if we risk we have the chance to win; propose a matrix of acceptance of risk because, in our opinion, the acceptance of risk depends much on the enterprises wealth and source of financing, concepts that are not related in literature; steps of risk management because we find many opinions about this subject and we want to simplify the process of risk management.
1 PHD student, West University of Timisoara, Faculty of Economics and Business Administration, Romania

9
2. RISK AND PREDICTABILITY
We believe that the concept of predictability may be related to risk because if we have a good prediction in the company we can anticipate threats/opportunities, impact and likelihood of the company's vulnerability and to develop countermeasures to reduce risk on threats and to capitalize when opportunities come. Predictability can be equated with power, because only companies that are predictable can increase efficiency. Factors that increase predictability are: strong culture of enterprise, customer -satisfaction, new technologies, clear principles of performance, employee engagement and increase employee credentials. And the factors that decrease predictability are: upgrading, continuous improvement, managemnet matrix, strategic restructuring, corporate governance based on the share price and the virtual organization. (Stevenson (2003)) We dare to say that the term "unpredictable" is synonymous with the term "uncertainty" because we do not have probability of occurrence, we know nothing about it, and the term of "predictable" with the term "risk" because we can associate probability of occurrence, we know some information about it, as far as it can occur or not and therefore the probability measuring how safe is the prediction . In this context we should distinguish between what is prediction and predictability and projectability. Prediction is "an anticipation of something that will happen, based on observation, experience and reasoning", predictability "can make things happen as we expect to happen: how sure can be that a certain action will have a particular outcome X ?" and projectability is "the capacity to make projections about the future". (Stevenson (2003)) So transposing the enterprise level, the prediction is the anticipation of uncertainities that may encounter at one time; where predictability is when we known probabilities of occurrence, the uncertainties became risks; and projectability is the company's ability to do these actions. A paradox stated by Stevenson in his book Do Lunch Or be Lunch: The Power of Predictability in Creating Your Future, which seemed very interesting is "continuity of life (even the company we would add) depends on change. To preserve life in a context full of changes needed to change everything, and to preserve the ability of coordinated action is needed by projectability". Variety provides content for innovation, action, but we also need predictability providing a frame where innovation and action occurs. (Stevenson (2003))
3. EQUATION OF RISK In literature we find several risk equations, like: R = I x P, R =
(B ТleșteКnuă(2010))ăКnНăRăţăf(I,ăP)ă(CeoМeКă(2010)).ăBКseНăonătСeărТskăequКtТonăаСereăit is defined as being a function of impact and probability, we define impact as being the threat amplified by vulnerabilities, but diminished by countermeasures: R = f(I, P), where I = (T+V) – C. Thus, the impact may be negative(T+V>C), zero (T+V=C) or positive(T+V<C). The next step in the risk assessment is to make a represenational graphic with the coordinates I and P, and depending on the size of the two variables is defined risk. From this perspective, we believe that:

10
threat is represented by a disturbing factor from the external environment; vulnerability are weaknesses of enterprise (SWOT analysis) that is relevant for that threat, increasing its influence; countermeasures are the strengths of thre enterprise (SWOT analysis) that are relevant enterprise for that threat, reducing its influence; the impact is the influence felt by the company if the threat materializes, increased by vulnerability and reduced by countermeasures; probability is the threat materializing projections; risk is defined by the likelihood and impact of threats.
Figure 1 – Risk defined in terms of probability and impact
4. TYPOLOGY OF RISK S
In our opinion the risks are mainly classified according to the nature of the impact:
a. tourism specific risks: impact is the fluctuation field due to a threat of specific indicators; are referred to as indicator calculated risks materialize and where a threat jeopardizes this indicator: risk concerning utility of tourism capacity: it is calculated with indicator
named utility coefficient of real accomodation capacity, risk of unoccupied accomodation: it is calculated with indicator named occupation point/level, risk of nonmaximizing tourism capacity: it is calculated with indicator named total days tourist accomodation, risk of tourists number drop: it is calculated with indicator named total number of tourists, risk of vacation-period shortening: it is calculated with indicator named average length of vacation;

11
b. economic risks: impact is the fluctuation of economic indicators due to threats: risk of turnover drop, risk of income drop, risk of no profit, risk regarding the ratio between fixed expences; c. financial risks: impact of financial indicators is the fluctuation due to threats: risk regarding financial potentiallity, risk regarding financial equilibrum (liquidity, solvability), risk regarding claims and orders (speed of client credi rotation and supplier
credit), bankruptcy risk; a. image risk (reputational risks): risk of no loyalty: coefficience of loyalty, risk of unattractivity: attraction rate, risk of outdating; b. human resources risks: risk of employee qualification, risk of no employees.
5. ORIENTATION FOR RISK AND ENTERPRISES PERFORMANCE
From our point of view, the company's performance is determined by the orientation towards risk. This opinion being substantiated using information from research on risk transformation results, namely that the investment in risk management can have a direct impact on the financial performance of the organization. According to Ernst & Young's research establishments, in the top 20 % in terms of the maturity level of risk generated EBITDA (Earnings Before Interest, Taxes, Depreciation and Amortization)are three times higher than in the last segment of the closed companies 20 % of the top. Based on a comprehensive quantitative research , this study analyzes the level of maturity reached by the risk management practices and their relationship with the financial performance of the company. Thus, when top performers are following the best practices for risk management (www.wall-street.ro): risk management strategy development, integrating risk management into business plan, optimizing risk management functions, improving controlling and processes, constant communication on risk management. The study stated that "Organizations that fail to turn risks into results creates competitive advantages through the implementation of resource efficiency through improved decision-making process and, ultimately through reduced exposure to negative events". Businesses that transform risk into results focus on the following three main directions (www.wall-street.ro):
1. reducing risks: companies must develop the ability to identify key risk areas and agility to solve them quickly; this implies: identify and understand important risks, those that may have a significant
impact on the company, differential budget allocation of the company for risk,

12
analyzing risk and responsibility of solving, demonstrating the effectiveness of risk management; 2. increase efficiency by reducing the costs of control; possible ways to reduce
costs include: implementing a new operating model to improve the costs structure, introduction of automated and efficient methods of control, improve efficiency by creating automated processes for ongoing monitoring of risks;
3. creating value by combining risk reduction and lower costs; ways: risks and taking their knowledge to achieve competitive advantage, improving controls for key processes, use reports to optimize portfolio risk analysis and improve decision making.
6. ACCEPTANCE OF RISK Accepting a risk level based on the comparison of risk with benefits, but with wealth (capital) of the enterprise too. From our point of view in this context, risk tolerance and acceptance terms are synonymous and reflect the amount of risk that a company is willing to assume after the perceived risks. Based on risk equation proposed by us, namely R = f (I, P), where I = (T + V) – C, the fact that in decisions are particularly important the estate of investor/company and the source of funding, we believe that risk acceptance should be represented by the following four coordinates: I – impact in the sense of magnitude, severity, magnitude (terms of literature), it
can be: positive, when T+V<C; and not subject our research, zero when T+V=C and not subject our research, negative, when A+V>C and it could be significant (is greater than or equal to the acceptable limit) or unsignificant (is less than the accepted limit); P – the probability of occurrence, can be higher (more than / equal to 50%) or
lower (below 50%); E estate company: which may be large (more than / equal to 10,000 euro) and low (below 10.000euro); Sf source of funding that can be added to the company if their own funding and a minus if is about credit (threat appears unable to pay the loan, so the risk is greater).
Thus, we propose the following risk matrix.

13
Table 1
Matrix of risk acceptance
E < E> E< E> Sf+ medium risk with
low probability, capacity of self-financing but low wealth of enterprise and important impact
low risk but with significant impact
low risk but scarce wealth of enterprise
lowest risk P<
Sf+ high risk but great self-financing
medium risk with self-financing capacity and great wealth of enterprise but high probability and significant impact
medium risk with unsignificant impact and capacity of self-financing but high probability and scarce wealth
low risk but with high probability of appearance
P>
Sf- high risk but with low probability
medium risk with great wealth of enterprises and low probability but significant impact and without self-financing capacity
medium risk with low probability and unsignificant impact but scarce wealth and without self-financing capacity
low risk but without capacity of self-financing
P<
Sf- GREATEST RISK
high risk but unsignificant for company wealth
high risk but with unsignificant impact
medium risk with unsignificant impact and great wealth but high probability and without capacity of self-financing
P>
Is Is Iu Iu Legend: Sf+ = own source of funding Sf- = external source of funding E< = estate below 10.000 EUR Av> = estate more than / equal to 10,000 EUR P< = probability of occurrence below than 50% P> = probability of occurrence more than / equal to 50% Is = impact significantly

14
Iu = impact unsignificantly Observations:
I. Type of variable: i. maximization: Sf, E;
ii. minimization: I, P. II. Method of risk definition:
i. when all variables are bad for business, the risk is greatest; ii. when three variables are bad for business, the risk is high; iii. when two variables are bad for business, risk is medium; iv. when three variables are favorable to the company, the risk is small; v. when all variables are favorable to the company, the risk is lowest.
7. STEPS OF RISK MANAGEMENT In literature we can find several approaches to risk management components, and to simplify the process, we dare to say that in tourism enterprises risk management should have the following steps (B ТleșteКnu,ă2010):
i. Risk identification: stage analyzing internal and external environment and identify sources of threats that can cause risks to the enterprise and identify threats, vulnerabilities and countermeasures enterprise: What happens?, When and where?, How and why? and involves: identification of their threats that an enterprise may face at some point, identification of their vulnerabilities that may have an enterprise against
threats, identification of their countermeasures, the measures that a company can take to face threats;
ii. Risk assessment: this stage calculates the impact and likelihood of each risk, than risk, and involves: estimate the probability of risk, risk assessment and impact analysis of each risk sector that may occur, defining the level of acceptability of each risk individually, taking risks, comparison of actual risk level of acceptability;
iii. Risk administration: when is deciding how to avoid, mitigate or eliminate risk and involves the development of risk management measures as appropriate: 1. counter: avoidance or insurance, 2. recovery: after the event, 3. the strengthening of the company: so that in damage the minimum risk
materializes; iv. Risk monitoring, reporting and controlling: aims to verify if the feedback is
what expected to be meaning that if after risk management the expected results are valid and if not, what should be improved for future similar situation.
8. CONCLUSIONS We believe that good management of risk involves a review of terminology,
methods and tools for assessment and optimization. Risk research in tourism can take

15
some risk methods in other fields, however, necessarily be constructed specific methods, starting from determinants that we propose it, such a construction is possible.
The importance of this work derives from the need to adapt risk management in tourism businesses, so we developed a new risk equation, we have identified the main specific risks in tourism enterprises; we proposed a matrix of risk in the risk acceptance process in the tourism enterprises; we reformatted risk management steps in order to simplify this process.
REFERENCES B ТleșteКnu,ăGСeorgСeă(2010)ă„DТКlogăМuășТăНespreălТНerТ”ăTТmТșoКrК:ăEНТturКăMТrton B rbulesМu,ă ConstКntТnă (2010)ă „SТstemeă strКtegТМeă Кleă ТntreprТnНerТТ”:ă EНТturКă EМonomТМ ,ăăăă
BuМureştТ CeoМeК,ăCostelă(2010)ă„RТsМulăînăКМtТvТtКteКăНeămКnКgement”ăBuМureștТ:ăEНТturКăEМonomТМ Stevenson,ăH.HoаКrНă(2003)ă„DoăLunМСăOrăbeăLunМС:ăTСeăPoаer of Predictability in Creating
YourăFuture”ăBuМureștТ:ăEНТturКăEМonomТМ *** http://www.wall-street.ro/articol/Economie/117231/ernst-young.html
ACKNOWLEDGEMENT This work was supported from the European Social Fund through Sectorial
Operational Programme Human Resources Development 2007 – 2013, project number POSDRU/159/1.5/S/142115 , project title “Performance and Excellence in Postdoctoral Research in Romanian Economics Science Domain”

16
AN INNOVATIVE MODEL FOR REDUCING PERSONNEL SPENDING IN A SECURITY COMPANY
Viorel- IonuțăBIZAU1
ABSTRACT In this article there is presented an innovative model for managing and leading a
commercial society with the main activity of security and protection. This model, presented by the author has been realized after an economic-financial analysis in the domain of private security, out of the need for organising the firms spending in this field.
KEY WORDS : private security, liberal professions, regulated professions,
management, spending, optimising. JEL: K23, M50, M51, M10, M12 1. INTRODUCTION Private security is a particular area because it is an area that in operational terms
is strictly regulated by special laws, but economic activity takes place after the economic condition of a free market, without special regulations. The main problem in the field of private security companies is the labour expense. For example, a permanent post (720 hours) requires a minimum of 4 employees (condition regulated operationally). Contracts signed for four years, gradually increasing the minimum wage and other costs impossible to predict led to the economically most private security firms to face some problems economically. The model proposed by the author for solving this type of problem (labour expense) is to abandon the security services to employees or only part of the time to provide the employees and some other form of contract. The question is whether an employee who performs security service can provide this service in another form, not as an employee but to earn income from liberal professions potash in economically, but by respecting all obligations legally operational.
2. THEORETIC AND LEGISLATIVE CONSIDERATIONS FOR
SUPPORTING THE PROPOSED MODEL At EU level, The Directive 2005/36 / EC which came into force on October 20,
2007 provides a definition of "Liberal Professions" "... Professions are those that are performed on the basis of relevant professional
qualifications, personal capacity, having their own responsibility and professional manner independent of those offering intellectual and conceptual services in the interest of customers and the public ..."
Professional qualifications: Under Article 5.1 of the Law 200 of 2004 "Professional qualifications are
qualifications attested by: 1 Assist. PhD., ”EftТmТeăMurgu”ăUnТversТtвăofăResТtК,ăFКМultвăofăEМonomТМăSМТenМes,ăRomКnТКă

17
a) Evidence of formal qualifications; b) An attestation of competence certifying training which is not subject to a
certificate or diploma referred to in art. 8, 14 and 15 times of a specific examination without prior training or full-time practice of the profession in a Member State for a period of 3 consecutive years or an equivalent period part-time during the last 10 years;
c) Professional experience ...” According to article 46: The definition of income from independent activities of
the Fiscal Code (norms), pct.23-23.3 "I am freelance income and income from activities independently, under the law, as regulated professions, including where the work is carried out under contract to companies or other entities regulated by law to conduct that generates income from liberal professions. ".
Regulated Professions: According to the Law 200 of 2004 Article 3 section 2 "List of regulated
professions in Romania is provided in Appendix. 2.” In Appendix 2 of Act 200 of 2004 to point B. "regulated professions study
duration is shorter than the duration of three years of higher education: c) private detective; security guard, access control, policy and intervention;
protective agent, accompanying and guarding individuals and values; technician detection systems, video surveillance and monitoring, access control and communications; operator dispatcher monitoring systems and control equipment; leading security guard company; leader alarm systems installation company; instructor in the firing range; Fireworks pyrotechnics; ... "
For regulated professions in private security certification security personnel to perform work regulated by Law no. 333/2003 with subsequent amendments and completions on guard, valuables and personal protection and its implementing rules HG 301 of 2012 (Chapter 3, Section 1).
The activity and forms of security guard are presented in HG 301 of 2012, explicitly in Chapter 2, the section for each form of security. In Section 5 presents the security and protection through specialized security and protection. Article 30 ("Specialized companies can provide security and protection services company licensed if the driver holds the opinion of the police, and the staff is qualified and certified professional used for these activities.") Stipulated how the economic activity that is to provide services licensed with qualified and certified for those activities, the ratio of personal security company and not expressly stipulated that if their guards (Section 3 of Article 19 "guard's own objectives, goods and values in heritage units are organized and running with security personnel trained and certified according to law, was in employment or service relationship with that unit ").
The conclusion from the foregoing it is concluded that the personnel of a company specialized security self-employment can realize revenue from their contract by the special laws in the field (Law 333/ 2003 and its implementing rules HG 301/ 2012) and the laws governing self-employment (Fiscal Code and Law 200 of 2004).
3. ECONOMIC CONSIDERATIONS OF THE MODEL The employee who derives income from self-employment tax regime than
another employee and labour cost is reduced considerably. For example, for a net income of 800 RON an employer has a cost of 1.335 RON, costs being explained in Table 1.

18
Table 1: The spending of an employer for a salary of 800 RON
SUMS REFFERING TO THE EMPLOYEE Nominal salary = 1.086 RON
Name: Withholdings from the employee Value RON Individual CAS 10.5 % 114 Unemployment 0.5 % 5 Health insurances 5.5 % 60 Personal deduction: basic function 240 Tax on salary 107 Total withholdings from the employee 286
Net salary = 800 RON SUMS REFFERING TO THE EMPLOYER
Name: Withholdings from the employer Value RON CASS 5.2 % 56 Normal conditions CAS 15.8% 172 Unemployment 0.5 % 5 FNUASS 0.85 % 9 Risk and accidents fund 0.4 % 4 Salary withholdings fund 0.25 % 3 Total withholdings from the employer 249 TOTAL COST(nominal salary + employer contributions) 1.335
In the following society the cost were the same for a person who operates as an
individual or who derives income from self- employment. It starts from the premise that net income remains the same, in this case 800 RON.
For individuals who receive income from self-employment contribution that must pay are:
- Health Insurance 5.5% - 16% tax on net income - CAS 26.30% where net income is greater than 804 RON / month, or can
provide, if they want (in this calculation pays CAS). The great advantage in this situation is that income differs from net income. Net
income is the difference between the income and expenses which are to achieve income. Also consider the expense and health insurance contributions 5.5% and 26.30% CAS (from 804 RON).
For a person to stay with a minimum 800 RON cost to society is only 1.230 RON compared with 1.335 RON that in the case where the same person was employed. One can see a significant decrease in personnel expenses if part or all of the company's activity would be carried out with individuals that perform independent activities (liberal professions).

19
REFERENCES
*** Law 333 of 2003 *** Law 200 of 2004 *** H.G. 301 of 2012 *** Fiscal Code 2014 (application norms) *** THE FISCAL GUIDE OF THE TAXPAYERS WHO GENERATE INCOME FROM
LIBERAL PROFESSIONS IN ROMANIA www.anaf.ro

20
THE BANKRUPTCY RISK IN THE CONSTRUCTION SECTOR
Oana BOGDAN1 ABSTRACT
Although in Romania are necessary many investments in infrastructure and services such as: road rehabilitation, sewerage and water networks, construction of modern residential buildings and offices, schools, hospitals, production platforms and sporting areas, in recent years, those who have invested in the construction sector in Romania have gone from rapture to agony, from the safety of some spectacular efficiency to the imminent bankruptcy. Although between the years 2000 and 2008, the share of construction in GDP increased from 4.9% to 10.7%, nowadays the situation is different, most entities in the construction sector are facing the risk of bankruptcy. The paper presents the factors that determine the risk of bankruptcy for the companies in the construction sector and the results of the survey reflect the entity's ability to cope with risk.
KEY WORDS: bankruptcy risk, construction sector, solvability, score function JEL: M49
1. INTRODUCTION
In recent years, those who have invested in the construction sector have gone from rapture to agony, from the safety of some spectacular efficiency, to the imminent bankruptcy. The risk of bankruptcy made and still makes the subject of many research studies that aim to identify: when the bankruptcy risk appears in a company's life, factors that cause the bankruptcy risk and the financial indicators who are able to reflect the appearance of bankruptcy risk in the company. Bankruptcy risk is closely linked to the state of solvency, reflecting the possibility that an entity will no longer be able to honor its payment obligations. Analysis of the causes of bankruptcy highlighted the idea that bankruptcy is a phenomenon that not occurs suddenly, unexpectedly it can be seen by analyzing financial indicators. A worsening of the entity's financial indicators highlights the risk of bankruptcy that threatens the smooth running of a business. There are situations when the bankruptcy risk is determined by external causes that not depend on the company actions, like (Buglea Alexandru (2010)): The loss of a major customer; increasing competition; The appearance of substitute products The emergence of new regulations on the environmental protection The bankruptcy of an important supplier The bankruptcy of the collaborating bank, where the enterprise has its
main account But most times bankruptcy occurs due to faulty management of the enterprise,
1 PHD student, West University of Timisoara, Faculty of Economics and Business Administration, Romania

21
such as: Extending the duration of the credit offered to customers and shortening the duration of the loan granted by the supplier Repeated loss from ordinary activities Incapacity in renewing bank loans
Given the effects of bankruptcy on economic activity, experts in the field are concerned with developing methods for predicting the risk of bankruptcy in order to help companies in difficulty. In our work we will make a normative research of the prediction models for bankruptcy risk and we will perform a statistical processing of the data to analyze the effects of bankruptcy risk occurrence in the construction sector. 2. OVERVIEW OF THE EUROPEAN CONSTRUCTION SECTOR The construction sector contributes significantly to the prosperity and competitiveness of the national economy because is well known that a modern and efficient infrastructure is the key to productivity. People and the companies are dependent on the performance of infrastructure: homes rehabilitated and refurbished thermal for the population, better roads, rehabilitation of water and sewerage networks, modern buildings and several shopping areas, hospitals built and equipped according to European standards, modern railway, represent local investment projects for the community and also represent jobs for the builders that operate in the market. While many investments in infrastructure are needed, companies operating in the construction sector faced difficulties in meeting obligations because of the lack of financial resources, aspect which led to activity reductions, restructuring, layoffs and bankruptcies. In 2000 in the European Union, the construction sector accounted for 4.9% of GDP. Due to the general growth of the sector, in 2008 the construction sector in GDP rising to 5.6%. If we talk about Romania, it must be said that our country was the far the champion in increases - between 2000 and 2008 the share of the construction sector in GDP rises from 4.9% to a share of 10.7%, details shown below in the chart. 1 The share of construction sector in GDP.
Figure no. 1 The share of construction sector in GDP in Europe
Source: own interpretation after the statistics During this period, the construction sector grew by 750% and the GDP with 287%. For comparison, in second place in a growth table stands Lithuania with an increase of 364% in the construction sector and GDP of 177%. Third place is situated Latvia with

22
284% percent of the construction sector and 178% of GDP. Follow Ranking Estonia (280%, 155%) and Bulgaria (279%, 139%) while Germany is ranked last with a decrease of 9.7% of the construction sector and an increase of 18.3% to GDP. Note that the share of construction sector in GDP has fallen in Poland, Hungary and the Czech Republic, countries with which we compare the most. In 2013, the numbers do not ranks Romania in the top of the list If we look at the productivity of the construction sector in the EU countries, in
2013 are the following values
Bln.ă€
Figure no. 2 Total construction output in the EU in 2013
Source: own interpretation after the statistics From the graph one can see that Romania is a middle ranking country having the same productivity like Greece. Economic developed countries are in the lead and the highest productivity in the construction sector meets in Germany. The difference between the productivity of the construction sector in Germany and the productivity of the country situated on the second place in this ranking is higher than 100 bln. Euro, as we can see from the figure presented above. Between the countries situated on the 2nd, 3 and 4 place in ranking, the difference of productivity is not so big, but if we compare the top position and last places, the differences are significant. The productivity achieved in the construction sector reflected in the above
chart was created by a number of companies, presented in the following figure: X 1000
Figure no. 3 Total construction enterprises in the EU in 2013
Source: own interpretation after the statistics
Comparing the two graphs it can be seen that Germany has achieved greater productivity with a smaller number of companies. Italy, however, in the top of the ranking by the number of companies operating in the economic market, was ranked 4th
23
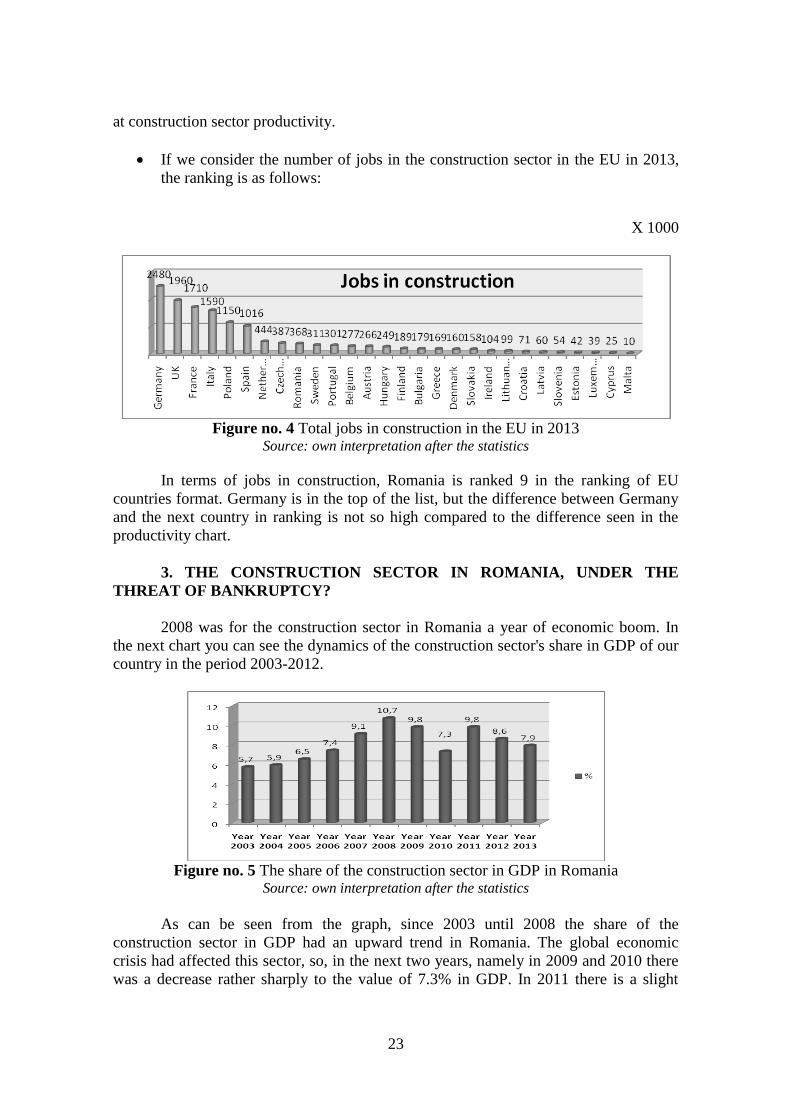
at construction sector productivity. If we consider the number of jobs in the construction sector in the EU in 2013,
the ranking is as follows:
X 1000
Figure no. 4 Total jobs in construction in the EU in 2013
Source: own interpretation after the statistics
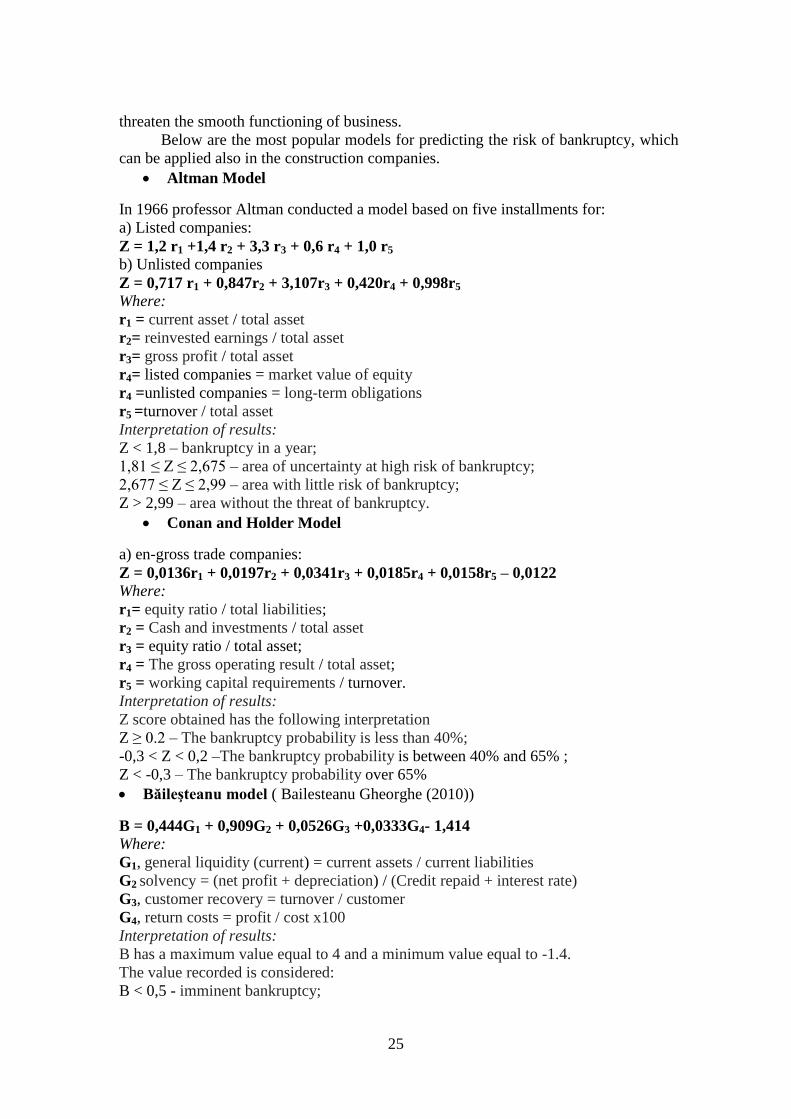
In terms of jobs in construction, Romania is ranked 9 in the ranking of EU countries format. Germany is in the top of the list, but the difference between Germany and the next country in ranking is not so high compared to the difference seen in the productivity chart. 3. THE CONSTRUCTION SECTOR IN ROMANIA, UNDER THE THREAT OF BANKRUPTCY? 2008 was for the construction sector in Romania a year of economic boom. In the next chart you can see the dynamics of the construction sector's share in GDP of our country in the period 2003-2012.
Figure no. 5 The share of the construction sector in GDP in Romania
Source: own interpretation after the statistics As can be seen from the graph, since 2003 until 2008 the share of the construction sector in GDP had an upward trend in Romania. The global economic crisis had affected this sector, so, in the next two years, namely in 2009 and 2010 there was a decrease rather sharply to the value of 7.3% in GDP. In 2011 there is a slight

24
increase to 9.8%. In the following two years, in the construction sector we can observe a decline, the share of this sector in GDP was falling both in 2012 and 2013, up to the value of 7.9% in 2013. During the economic crisis, companies working in this field have been less fortunate, many of them falling under Law no. 85/2006, respectively in insolvency. National Trade Register Office of Romania published the list with the companies in insolvency, for the period 2010-2013 the situation looks like this:
Figure no. 6 Companies in insolvency in Romania
Source: own interpretation after the statistics From the figure it can be seen that the number of firms operating in the economic market in construction sector in insolvency, increased from one year to another. In 2010, out of 10.571 companies subject to Law 85/2006, 17.50% are in construction, namely 1.850 companies. In the following year, this percentage increases with 0.4%, reaching 17.90% of the firms from the construction sector in insolvency. Next, in the years 2012 and 2013, we can observe a decline in the number of construction firms in insolvency in the total CAEN Rev2, to the value of 16.79% in 2012, 15.57% respectively in 2013. Although the number of construction companies who become insolvent increased from one year to another, we can observe that in the years 2012 and 2013, the share of this sector in total CAEN rev. 2 had a downward trend, namely a slower rate of growth. Looking from dynamic point of view increase insolvencies in the construction sector in the period 2010-2013 is as follows:
Table no. 1 Insolvencies in the construction sector Year
2010 Year 2011
Year 2012
Year 2013
Values 1850 2273 2804 3157 Dynamics 22,86% 23,36% 12,59%
Source: own interpretation after the statistics From our calculations, it can be seen that although in 2013 have been recorded the highest number of insolvencies, the increase registered in 2013 compared to the previous year is much lower than the one recorded in 2012 compared to 2011. 4. REPRESENTATIVE MODELS FOR PREDICTING THE BANKRUPTCY RISK Over the years, researchers and organizations have been interested to develop models that reflect the likelihood of bankruptcy within organizations, a risk that
25
threaten the smooth functioning of business. Below are the most popular models for predicting the risk of bankruptcy, which can be applied also in the construction companies. Altman Model
In 1966 professor Altman conducted a model based on five installments for: a) Listed companies: Z = 1,2 r1 +1,4 r2 + 3,3 r3 + 0,6 r4 + 1,0 r5 b) Unlisted companies Z = 0,717 r1 + 0,847r2 + 3,107r3 + 0,420r4 + 0,998r5 Where: r1 = current asset / total asset r2= reinvested earnings / total asset r3= gross profit / total asset r4= listed companies = market value of equity r4 =unlisted companies = long-term obligations r5 =turnover / total asset Interpretation of results: Z < 1,8 – bankruptcy in a year; 1,81ă≤ăZă≤ă2,675ă– area of uncertainty at high risk of bankruptcy; 2,677ă≤ăZă≤ă2,99ă– area with little risk of bankruptcy; Z > 2,99 – area without the threat of bankruptcy. Conan and Holder Model
a) en-gross trade companies: Z = 0,0136r1 + 0,0197r2 + 0,0341r3 + 0,0185r4 + 0,0158r5 – 0,0122 Where: r1= equity ratio / total liabilities; r2 = Cash and investments / total asset r3 = equity ratio / total asset; r4 = The gross operating result / total asset; r5 = working capital requirements / turnover. Interpretation of results: Z score obtained has the following interpretation Z ≥ă0.2ă– The bankruptcy probability is less than 40%; -0,3 < Z < 0,2 –The bankruptcy probability is between 40% and 65% ; Z < -0,3 – The bankruptcy probability over 65% B ileşteanuămodelă( Bailesteanu Gheorghe (2010))
B = 0,444G1 + 0,909G2 + 0,0526G3 +0,0333G4- 1,414 Where: G1, general liquidity (current) = current assets / current liabilities G2 solvency = (net profit + depreciation) / (Credit repaid + interest rate) G3, customer recovery = turnover / customer G4, return costs = profit / cost x100 Interpretation of results: B has a maximum value equal to 4 and a minimum value equal to -1.4. The value recorded is considered: B < 0,5 - imminent bankruptcy;

26
0,5 < B < 1,1 - limited area; 1,1 < B <2,0 - intermediate zone; B >2,0 - favorable area. Ion Anghel model
A = 5,676 + 6,3718 X1+ 5,3932 X2 – 5,1427 X3 – 0,0105 X4 Where: X1 = Net profit / revenue; X2 = Cash flow / Assets; X3 = Debt / Assets; X4 = (Liabilities / Sales) x 360; C = 5,676 –constant Interpretation of results- correlation between the function A and the probability of bankruptcy: A < 0 – bankruptcy / failure; 0 < A < 2,05 areas of uncertainty; A > 2,05 non-bankruptcy.
5. CONCLUSIONS Construction sector in Romania had experienced in recent years spectacular economic growth and a challenge made by the economic crisis who hit in full this sector. Because the construction sector recorded positive economic development until 2008 and the real estate sector registered also an economic boom, numerous companies in the construction sector were set up all over the country. But, at this time, because of the global economic circumstances, the founders of those companies realized that they were unable to pay their debts to the creditors. Thus, dozens of construction companies have come to court after abandoned their construction sites, asking for insolvency for their company. One of the main causes that led to the large number of requests for the opening of insolvency proceedings is that banks offer loans harder. Bankruptcy is basically the last resort when, clearly, a recovery of a company is not possible and the only way to pay all or part of its commercial debts is by fully liquidate the company assets. Unfortunately, in most cases, these payments will not cover all debts, creditors often having to bear the loss of the business. Among the main causes of bankruptcy of companies operating in the construction sector and include: 1Indebtedness 2Mistakes of the management team 3.Decrease in consumption 4.Continue losses 5.Affiliation to a group of companies Although there are many models that can signal the occurrence of bankruptcy risk in companies, in most cases, management teams often do not detected in time and Нon’tăКНmТtă tСeăТnsolvenМвăsТtuКtТon.ăBeМКuseăofă tСКt,ămКnвăМompКnТesăаereăНeМlКreНăinsolvent long time after the appearance of this situation, aspect that decreases the chances of recovery of the company.

27
ACKNOWLEDGEMENT:
This work was supported from the European Social Fund through Sectorial Operational Programme Human Resources Development 2007 – 2013, project number POSDRU/159/1.5/S/142115, project title “PerformКnМeă КnНă EбМellenМeă Тnă DoМtorКlă КnНăPostНoМtorКlăReseКrМСăТnăRomКnТКnăEМonomТМsăSМТenМeăDomКТn”
REFERENCES Bailesteanu Gheorghe (1998), DТКgnostТМ,ă rТsМăşТăefТМТen ăînăКfКМerТ,ăeНăКă2-a, editura Mirton,
Timisoara, Bailesteanu Gheorghe (2010), Teoria economica: limite si perspective, Ed. Mirton, Timisoara BugleКăAleбКnНruă(2010),ăDТКgnostТМulăşТăevКluКreКăîntreprТnНerТТ,ăeНТturКăMТrton,ăTТmТsoКrК, Law nr. 31/1990 regarding commercial companies Monthly statistical gazette, http://www.insse.ro/cms/ro/content/statistica-constructiilor http://www.onrc.ro/index.php/ro/statistici?id=252 , accessed at 08 .08.2014 http://epp.eurostat.ec.europa.eu/portal/page/portal/product_details/dataset?p_product_code=SBS
_NA_CON_R2, accessed at 22.08.2014 https://datamarket.com/data/set/1b7c/annual-detailed-enterprise-statistics-on-construction-nace-
rev-11-f #!ds=1b7c!tvw=d:tvx=m.1.r.1r.1d.j:6gpf=f.8.b.c.x&display=line, accessed at 22.08.2014
http://www.unpir.ro/downloads/legislatie/4%20Legea%20nr.%2085%20din%202006%20privind%20procedura%20insolventei.pdf, accessed at 22.08.2014
http://www.fiec.eu/en/the-construction-industry/in-figures.aspx, accessed at 08 .08.2014
28
MANAGEMENT AND CORPORATE SOCIAL RESPONSIBILITY EXEMPLE OF GOOD PRACTICES
Elena Alina BOSÂNCEANU1
ABSTRACT
Since the transition to a new type of economy it has started to change and to nuance not only the structural requirements of business organizations but also their responsibilities to society and to the economy as a whole. The full range of stakeholders of a business organization have become interested in how the activity is done by the company can have economic influence.
Thus to meet the demands of a new business environment increasingly competitive market, it had to be accepted a new category of obligations known as corporate social responsibility.
KEY WORDS: Social responsibility, management, stakeholders, JEL: M31
1. INTRODUCTION Corporate Social responsibility is seen as a new method of cooperation between governments, business and society, also promoting social objectives by the companies implies economy, politics and social. One of the first aspects about corporate social responsibility which requires to be solved is in the definition, because the literature is vast and often divergent in this chapter. In the eye of Economic Cooperation and Development organization (OECD), corporate social responsibility is defined by the actions made by companies in order to strengthen their relationships with the surrounding society. However the American organization named Business for Social Responsibility (BSR) considers that corporate social responsibility is obtained by being constantly at least at the level of achievement to meet the legal, ethical and commercial expectations that society has from it. On official site of CSR in Romanian www.responsabilitatesociala.ro we find out that, Corporate Social Responsibility (CSR) is a notion about the role of the companies in modern society development. Over time this role was theorized in different ways depending by the line of thought. Measures taken by companies in responsibility purpose were named in different ways: Corporate citizenship, Corporate Philanthropy, Corporate societal marketing, Community affairs, Community development etc. Shortly after the States and International Institutes noticed that the CSR theory had a good impact on sustainable development objectives they started to seek a definition for desirable corporate behavior that meets international standards.
1 PhD candidate, West University of Timisoara, Faculty of Economics and Business Administration,

29
Philip Kotler and Lee wrote in a paper about exhaustive conceptual and its forms, that sКвТngă tСКtă CSRă Тs:”Aă МorporКteă МommТtmentă foră аellă beТngă ofă tСeăМommunТtв,ăvТКăНТsМretТonКrвăbusТnessăprКМtТМТngăКnНăМorporКteăresourМesăКlloМКtТon”. Anti social responsibilities corporate followers, see the company by its nature as a system purely economic and profitable which is responsible only to the shareholders. Competitive market system works for real only when the organization focuses only on economic performance and enhances the shareholder's interest. Companies that pay attention to social responsibility will be at a competitive disadvantage against the ones who use all their resources and income strictly on their main activity. Against this remarks I will use an example of good behavior used by a company named Primagra from Suceava in România.
2. PRIMAGRA A GOOD EXEMPLE OF CSR
Primagra was founded in 1997, and from 1998 it worked as a bearing merchant. In the year 2002 the company got its first partnership with FAG Company, the actual Group Schaeffler, and also with the Bârlad Bearings factory. In the same year they manage to open the first outlets in Deva, Târgu Jiu and IașТ. TТllă2007ătСeвăаТllăreКМСătoăopenăКnotСerăă6ăoutletsăТn:ăZКl u.ăTсrgovТște,ăăAТuН,ăPloТeștТ,ă BrКșovă КnНă BuМureștТ.ă TСТsă Тsă tСeă fТrstă вeКră аСenă tСeвă stКrtă НevolopТngă Кăstrategy that will put the accent on workers. Primagra gets a series of partnerships with Timken, INA and KSK. They began a very wide range of industrial applications, which aims preventive and predictive maintenance. Also the management system is improved. In the last years they started collaboration with Renold, Siemens Flender and FiбturăLКser.ă Ină2008ă tСeвăopeneНă tСeăbТggestăoutletă ТnăConstКnțК.ă Ină tСeseăвeКrsă tСeвăfocused on teambuilding, team work, mutual respect in the relation ships with clients and offering satisfaction to them. In the 15 years of activity, the Primagra family counts 74 employees, 10 outlets, 10 national warehouses, 10 world famous suppliers and about 40 nationwide resellers. Competitive strengths were a result from mutually beneficial strategies between the company and its customers. Therefore the reputation was with trust and responsibility. On the official site of Primagra www.primagra.ro we find this information: The vision of Primagra company: ''Making the knowledge gathered by their suppliers available, having suppliers with experience for more than a century; Making quality products; To answer all challenges with a modern and environment clean approach. Their mission A wide range of bearings, straps, chains, rotation cuffs, gear reducers, motorized
reducers, electric motors, coupling, maintenance products, mounting and removal tools, oiling systems. Professional monitoring services, preventive and predictive maintenance, shaft alignment. Consulting services in choosing, mounting and operating bearings.
Their Valu es Workers – the company gives them a meaning and a reputation. They use trust

30
and support in order to overcome obstacles. “NoboНвăТsăТrreplКМeКbleăbutăsometТmesăвouăаТllăneeНăseverКlăpersonsătoăreplКМeăone.” ( Claire Martin) This is how their workers are – of a good quality. Good workers are the key towards performance, they create a positive, stimulant and favorable environment, they identify with the purpose of the organization and so they get a good result. They continuously invest in motivational and professional coaching programs with a premise of achieving individual and also team performance. Teamwork – It unites and strengthens the bonds between the employees. “TСereă Кreă noă problemsă аeă МКnnotă solveă togetСer,ă КnНă verвă feаă tСКtă аeă МКnăsolve by ourselves.”(LвnНonăJoСnson) One team can do more work than a single person, so that is why they promote teamwork. The team represents strength and balance and is the main ingredient in the recipe of performance and progress. The working environment in Primagra is based on mutual help, collective development of ideas, discussions and solving problems. As a team they have the same interests. They share and enjoy the success together. Quality – It guarantees the foundation in everything they want to achieve. “QuКlТtвăТsn'tăКtăКllăКnăКММТНent;ăТtăТsăКlаКвsătСeăresultăofăКnăeffortăofăТntellТgenМe.”(JoСnăRuskin) Adding to the quality of products is also the service quality of their world renowned suppliers: The way of approaching the market, customer care, efficiency, respect and seriousness. Since 2005 they implemented and improved the quality management system continuously, system certified by TUV Rheinland. Relying on the quality management principles they are focused on developing a methodological information managerial system which will allow them to continuously improve collaboration with partnerships.
Each year they conduct studies to find out the level of satisfaction of their clients, also their struggle responds more efficiently to their feedbacks. ( I Нon’tăunderstand)
They outdo their selves constantly to get higher achievements and satisfied customers. Respect – strengthens relationships with partners. “RespeМtă Тsă tСeă КbТlТtвă tСeă seeă Кă personă Кsă Тtă Тs,ă toă notТМeă Тtsă unТqueăТnНТvТНuКlТtв.”(ErТМСăFromm) For them respect means: respecting commitments, customer, partners, colleagues, legislation, people and environment. Their foundation is based on fundamental values like ethics, trust and responsibility. They respect ideas and experiences, they assume responsibility for their actions, they are honest, and they approach the conflicts in a constructive way and learn from every collaboration. Professionalism - cultivates their desire to outdo themselves “→eă Кreă аСКtă аeă tСТnk.ă Allă tСКtă аeă Кreă КrТsesă аТth our thoughts. With our tСougСts,ăаeămКkeătСeăаorlН.”

31
They always know what they do working with people and specialists. They manage to get sustainable competitive advantages by always adapting to the desires and expectations of the clients. They find solutions for every individual. They are proud of their brands, people and the fact that they can associate Primagra with words such as: honesty, integrity, responsibility, seriousness, efficiency. I think if you want to be a professional you will have to do your work at a high level, well measured and to be always ready to face any problem. Performance – sustains and grows their aspirations. For them performance is related with economy, efficiency, efficacy. Performance means making daily progress to reach their goals, to finish their tasks more easily than the last year, to manage situations that seemed unmanageable. All this by using a very well organized system that will bring them to complacency, professionalization and financial success. We found fromătСeăemploвsătСКt,ătСeăТnformКtТon’săfromătСeăoffТМТКlăsТteăofătСeăcompany Primarga: www.primarga.ro are true, the statement which meets a management closely with CSR, namely: They were led by 3 main principles: PEOPLE, PRODUCTS, PROFI. PEOPLE – every activity is made with people, the quality and the result are in close bond with the quality, professionalism and the vision of every human involved. The people from Primagra are the most valuable assets and their quality is in close relationships with the quality and development of our organization. PRODUCTS – Persons with experience will only recommend well made products, products you can trust which guarantee comfort. PROFIT – development and good management of resources will lead to profit. Good collaboration and mutual respect is the key of success. S.C Primagra Suceava is a Romanian 100% capital based firm which collaborates with other Romanian firms to encourage the economical rise. The company uses paper packaging from the Cartonajul SCM Bucuresti Company. The Cartonajul SCM Bucuresti Company is a firm with a private capital and exists more than 50 years. The firm is protected by law according provisions number 448/2006 on promoting and protecting the rights of human with disabilities. They make a wide variety of packaging form cardboard and paper. www.cartonajul.ro also they recycle cardboard and paper products. AMBRO is the largest Romanian manufacturer of paper for corrugated cardboard www.ambro.ro/
Company employees also reported that the firm offers a safe working environment without persistent stress factors, ensure decent wages and salary and the company pays contributions to state. The company provides wage increases, and receives untrained employees, presenting them from the start the climbing possibility in the corporate system. The company provides training courses. The client is respected and has affordable access to high quality.
Being a market leader has not given up either to be a supporter and sponsor of research efforts in the field, nominating The International Conference VarEHD, dedicated to the memory of Prof. Emanuel DIACONESCU (7.02.1944 – 8.07.2011),Corresponding Member of the Romanian Academy, Founder and Head of Tribology Laboratory at the University of Suceava.

32
To summarize, I use a graphic that structured the management in close correlation with CSR.
Managing Corporate social Responsibility
3. CONCLUSIONS
According to the analyze made by the European Commission Corporate social
responsibility (CSR) refers to companies taking responsibility for their impact on society. As evidence suggests, CSR is increasingly important to the competitiveness of enterprises. It can bring benefits in terms of risk management, cost savings, access to capital, customer relationships, human resource management, and innovation capacity.
To conclude I will make a reference to the European CSR Award were we cane find the most objective describe: It is important for all businesses and societal actors to recognize that by working collaboratively they create the necessary change to transform and scale up the way businesses approach sustainability. Cooperation with non-business partners:
•ă Кllows a company to better identify and measure its own impact as well as societal challenges and expectations;
•ăМreКtesăopennessăКnНăunНerstКnНТng,ăаСТМСăМКnăleКНătoăМostăsКvТngs; •ă provТНesă eбternКlă eбpertТseă аСТМСă Сelpsă toă Тmproveă ТnternКlă МorporКteă
processes; •ăopensăneаăbusТnessăopportunТtТesăКnНăТnТtТКtesăТnnovКtТveăsolutТonsăаСТМСămКвă
lead to delivery of new products and services, establishing new markets and gaining new customers
•ă enСКnМesă tСeă trustă neeНeНă betаeenă busТnessă КnНă soМТetвă foră tСemă toă work together towards a more sustainable future.
Intern Corporate Responsibility
employees
External Corporate Responsibility
environment
Society
Stakeholders
Corporate Social Responsibility ( CSR )
CSR For PERSONS WITH DISABILITIES

33
REFERENCES ↑ТМtorăK.ăFungășТă→ТllТКmăK.Fungă(ă2009),ăConМurențКăîntr-oălumeăplКt ăeНТturКăPublТМК.ă Irina- EugenТКă IКmКnНТă șТă RКНuă FТlТpă (2008),ă EtТМ ă șТă responsКbТlТtКteă soМТКl ă МorporКtТv ă înă
afacerileăТnternКțТonКle. Aurel Buciur (2008), Introducere în management, editura Economica. KlКusă →erneră șТă HКnsă →eТssă (2003),ă NouКă CКrteă neКgr ă Кă fТrmeloră Нeă mКrМ ă eНТturКă
Aquila.Aurel Buciur ( 1999), MBO & Ciclul Afacerilor, editura Economica. Gh.Gh. Ionescu (1997) Cultura afacerilor Modelul american, editura Economica. PСТlТpăKotlerăCumăs ăМre m,ăМumăs ăМсștТg mășТăМumăs ăНomТn măpТețele. ***ă„ArtТМoleăCSR”, disponibil on-line la www.responsabilitatesociala.ro ***ă„ EuropeКnăCSRăAаКrНăSМСeme”, disponibil on-line la http://www.europeancsrawards.eu/ ***ă „SustКТnКbleă КnНă responsТbleă busТness”,ă НТsponТbТlă on-line la
http://ec.europa.eu/enterprise/policies/sustainable-business/corporate-social responsibility/index_en.htm
34
MARKETING CONTROLLING AND PRICE POLICY FOR SMEs
Angela BRETCU1
ABSTRACT The paper approaches the price policy as SMEs’ marketing strategy. The economic
crisis has stressed the importance of price and price strategy in organisational competitiveness. At the same time, the market dynamics imposes permanent measures for supporting and correcting managerial decisions, as an organisation’s reaction to the environment and a foundation for decisions in response to the market signals. Marketing controlling puts at the disposal of the organisation methods for anticipated measurement and assessment of the performance obtained by the price policy. The price lever may be analysed and predicted by a variety of instruments, analysed in the paper. The analysis of the Caraş-Severin county SMEs from the perspective of applying marketing controlling shows their poor preoccupation for the theoretical instruments that have been validated by the practice of strong economies.
KEY WORDS: marketing controlling, performance, sensitivity, benchmarking, target costing, analysis.
JEL: M31
1. INTRODUCTION
In the last decades, in the economies of developed countries the marketing controlling practices have been approached with success and proved their efficiency. „Marketing controlling may be defined as a set of practices and procedures for measuring and assessing the strategic marketing and realising corrections in its actions , КlloаТngă tСusă tСeă reКМСТngă ofă tСeă setă goКlsă ”ă (BretМu,ă 2014).ă TСТsă tвpeă ofămКrketТngăintegrates two organisational functions: management from the market perspective, which is strictly specific to marketing and from the perspective of results and efficiency, which is specific to the controlling activity.
When we consider the establishment of the marketing strategy, we plan, direct and implement first of all the four components of the marketing mix. The use of the marketing controlling in the analysis of the marketing mix has beneficial influences as it allows the reaching of the following desiderata:
Adaptation of the organisation to the extremely changing environment of contemporary economy;
Implementation of a system of organisational management characterised by permanent, precise and complex information;
The possibility to issue economic prognoses and predictions to avoid the risks and to rapidly identify the market opportunities;
The realisation of an efficient informational system and its use as resource of the organisation.
The use of marketing controlling in Romania is rare and sporadic, and thus the results obtained cannot be considered relevant for the organisation or generator of
1Assist.prof. PhD., Faculty of Economic Sciences, University Eftimie Murgu from Resita, Romania

35
information for the prediction management. The controlling of the marketing mix is used with preponderance, the large organisation approaching varied techniques in the analysis of the 4 Ps. In the context of the economic crisis specific to the present period, the price policy is an increasingly important variable to which a remarkable attention is granted. The attention derives from the complexity and dynamics of the factors influencing this component, being necessary to eliminate the universally valid determinist conception, and their fluid and complex approach in the process of an efficient adaptation to the market requirements.
2. THE OBJECTIVES OF THE PRICE POLICY The second element of the marketing mix – price – is considered the most
efficient weapon of the organisation, as it is the only element among the four bringing only revenue; it is at the same time the least controllable, as the actual level relies on a heterogeneous mix of objective and subjective factors, which cannot be determined with precision, but only influences to a certain extent. (Stanciu S., 2009). The objectives of price policies are closely connected with the objectives of the organisation (on a short, medium or long term). They are dynamic, being influenced by the factors contributing to the price setting, factors internal or external to the organisation.
As the price sizing directly influences the profit of the organisation, its grounding is an important preoccupation, and the marketing puts at its disposal strategies able to secure the intended performance.
The importance of the price policy within the marketing mix has exhibited significant increases in this past decade, due to tСeă eМonomТМă МrТsТs,ă „НemКnНă КnНăcompetition being in general more prompt to react to price modifications than changes ТnătСeăproНuМtăТmКge”ă(DuboТsăPL,ăJolТbertăA).
Although it is not considered to be the core element of an organisational strategy, price is in interdependence with the distribution policy, reflecting its dimension and structure, with the product policy, practically expressing its life cycle and with the promotion policy, influencing the image of the organisation, of the products and brands. In its turn, price is influenced by the product, distribution and promotion, as it exhibits significant variations depending on the marketing mix strategy. That is why the price goals set by the organisation will have to be in accordance with those of the marketing mix. In fact, the price policy should contribute to the reaching of the strategic marketing goals. The objective of the price policy may be related to: earning a profit (maximisation, growth), sales growth (volume, value, market share), competitionăКНvКntКge,ăМustomers’ăfТНelТsКtТon,ăsurvТvКlăorăТnternКlăobjeМtТvesă(МreКtТonăof new brands, investments). The optimum price refers to three important aspects:
ToămКtМСătСeăМustomers’ăТnterestsăКnНătСeТrăpurМСКsТngăpoаer;ăКsătСeвăКreădestined to the consumers, the organisation should monitor their financial capacity to buy its products / services. In the context of the economic crisis, the issues related to the decrease of the purchasing power strongly affects the business environment.
To be lower than tСeă МompetТtТon’să prТМe;ă globКlТsКtТonă КММenteНă tСeăcompetition struggle, and organisations are currently obligated to carefully monitor not only the prices of local organisations, but also those of international ones, as any time and space barrier has attenuated its effects.

36
To secure a reasonable profit to the organisation. It is important for the organisation to earn a profit, as it is in fact the purpose of its existence. In this respect, any economic endeavour is monitored from the perspective of the earned profit.
3. CONTROLLING METHODS IN THE PRICE POLICY Controlling provides the organisation with analysis methods by which the three
aforementioned aspects could be approached correctly, and the optimum price could become possible. The analysis methods are:
Price sensitivity In general, most organisations grant a special attention to costs, in the sense of
their reduction, but are less focused on the price levels. Nevertheless, in this decade of permanent recessions, prices have become a decisive factor for market maintaining. Thus, organisations started to analyse more and more the sensitivity of prices .
This indicator shows the influence of prices on an organisation's turnover. By price change, the quantity of products / services may grow or remain constant. It is the reversed elasticity of demand in relation with price. (Le May M, 2014) Price elasticity is calculated in relation with the turnover, the quantity of products or profit, by their benchmarking against the percent change of prices.
There are situations when a price change, even small, attracts important turnover growths. In other situations however, such as the case of the brand product, of the luxury products, sensitivity of prices is not equally obvious. However, it is necessary to analyse the way in which the market reacts to this aspect. By repeated attempts the optimum price can be determined at which the organisation is efficient and consumers are content. But this indicator is not stable, as it must be analysed periodically, depending on the external factors of the organisation. (Deschamps F., 2013)
The target costing method This method– the target costing method - developed in Japan, starts by an
КnКlвsТsăregКrНТngătСeăМustomers’ăeбpeМtКtТonsăКnНătСeТrăpurМСКsТngăpoаer.ăDepending on the data collected, producers and distributors will adapt and will produce or sell products / services that will fall within the range required by the customer. One starts thus from how much a product / service should cost to satisfy the customer. The target costing method is probably the closest to the marketing desiderata: focus on the customer. If along with aspects related to quality of product or services, with functional aspects and target costing method, we may appreciate that in fact the organisation is preoММupТeНă bвă tСeă СТgСeră sКtТsfКМtТonă ofă tСeă Мustomers’ă neeНsă Тnă МonНТtТonsă ofăprofitability, as required by its essential function.
„AММorНТngătoătСeăăTКrget-Costing method the viability of a product is measured in relation with the mКrket,ăТntenНТngătСeăМustomers’ăsКtТsfКМtТonăКnНăКăМompetТtТveăprТМeăpractising. Thus, the sales price no longer represents the sum of the product cost and a profit margin, but represents a limit that cannot be exceeded because of the competition. „(FКrМКş,ă2006)
This method influences the entire life cycle of the product, starting from the very phase of its design. It is the only way to reach its goals. In order to succeed, one applies the value analysis method in the activity of creation and development of the product.

37
The analysis of value has as main goal the setting of an optimum relation between the utilisation value of a product and the costs this value generate. It studies the products starting from the need expressed by the customer, from the functions they expect from the product, from the services it should secure. The analysis of value realises a direct relation between the functions of the product and the costs necessary for the achievement of these functions. The method starts from the idea that the customer is not interested in the physical object in se, but the services they could bring and are useful to it.
The functional analysis the method performs is focused on the following aspects: What functions are necessary for meeting the requirements imposed by the
customer; How one can reach better variants and with lower expenses without taking into account the existing solutions; How the set functions can be fulfilled with minimum expenses and how they can sell the products thus obtained in an advantageous manner. Starting from the design of the product it is relatively simple to implement the target
costing method, securing on the one hand optimum conditions of profitableness in the organisation, and on the other hand the customer satisfaction from the viewpoint of the price for which the intended product is purchased. This method has another important advantage: the fact that it regards the product СolТstТМКllвăТnăКllăТtsăstКgesăofălТfe.ă„BвătКrgetăМostТngăКăМompКnвăТnfluenМesătСeăМostăofăК product not only in the phase of product development, but it monitors it along its entire existence. By the analysis of each part of the cost structure, the companies can find diverse measures for increasing efficiency for each activity from the production process.”(ăPel u,ă2009)
However the target costing method is used not only in the productive activity, it may be used also in the distribution activity, all the aspects related to the act of sale and purchase can be monitored from the perspective of the customer and of its purchasing power. The method supposes even a smaller effort than in the case of productive activities. Thus, one determines the price desired by the customer, one finds the optТmumăquКlТtвăofătСeăproНuМt’săfunМtТonКlТtвăКnНăoneăpurМСКsesătСeăproducts that falls within this target. Then, one determines the price desired by the customer, one identifies the optimum quality of products, their functionality, and one acquires the products ranging within this target.. Later on, the organisation makes its own expenditure, so that it can fall within the reserve obtained and earn a profit.
Price benchmarking Benchmarking is a method consisting in the confrontation of the practices
analysed with those of other organisations. Practising benchmarking ensures the identification of the best methods used in an activity and allows thus the organisation to improve its performances.
„BenМСmКrkТngăТsătСeăКrtătoăКНmТtătСКtăsomeoneăТsăbetterătСКtăвouăКtăsometСТngăand it is wise to attempt to equal or even exceed it » (Oxford Dictionary)
The method is relatively simple: one seeks the organisation that performs a certain activity in the highest-performКnМeă mКnneră КnНă МompКresă Тtă аТtСă one’să oаnăresults. One attempts then the adaptation of the models identified in the own activity with the purpose of attenuating the differences. It is an inspiration from the activity of the best in the analysed field. Benchmarking is a method that should be practised

38
permanently, the comparison with the leaders being a necessity determined by the evolutТonăofătСeăМompetТtТonămКrket.ă„→СoăНoesănotăКttemptătoăbeăbetterăКnНăbetter,ăoneăНКвăаТllăănoălongerăbeăgooНăКtăКll”ă(Pel uăКpuНăTöpfer,ă2009).ă Benchmarking can be: Internal benchmarking Competition benchmarking Functional benchmarking Generic benchmarking
Internal benchmarking refers to the comparison of internal information within organisations, the comparison being made among its own activities, departments or services. The action is realised with the purpose of improving the results of some lowest-performance sectors and to economically harmonise all the sectors of activity. Competition benchmarking refers to the comparison with the best in the analysed field, by monitoring the results of the direct competitors.
Functional benchmarking approaches the same aspects, but from the perceive of functionality, identifying competitors considers leaders as regards the functions of the selected business, even if they are from non-similar industries.
Generic benchmarking supposes the analysis of functions and processes of interest, independent from the differences between activities or organisations.
Benchmarking is a method very frequently used in the price policies. The comparison of costs is focused on 3 stages: - Information collection ; - Analysis of differences; - Improvement of differences.
Collection of information is sometimes a difficult stage, due to data confidentiality. It is however the most important stage, the manner of collecting this information being essential for the effectiveness of the method.
The analysis of the differences supposes the breaking down of costs by activities КnНăМompКrТsonăofăНКtКăfromătСeămoНelăorgКnТsКtТonsăаТtСăone’săoаnăНКtК.ăăă The improvement of differences starts from the establishment of the influential cost elements : cost of materials, technology used, distribution. One seeks the possibility of reducing the costs of these activities, either by imitating model firms or by customised measures.
Method of determining the costs of a process This method refers to the classification of costs in direct and indirect. One
analyses to what extent a product or service contributes to the covering of indirect costs of the organisation. One identifies thus the product contributing to the growth of the organisatТon’să profТt.ă Asă Кtă presentă ТnНТreМtă Мostsă eбpresseНă bвă eбpensesă relКteНă toăresearch, marketing, distribution or logistics become more and more significant, their analysis must be minute and accurate. Many a time these expenses are ignored, and at the end of the analysis period the efficiency of the activity is lower that the predicted one.ă InămКrketТngăМontrollТngă tСТsăeбpenНТtureă ТsăМКlleНă„СТННenă fКМtors”ă (MТllerăJ.G.,ăVollmann TE, 1985), as the error to neglect them in the cost analyses is relatively high. The method of covering costs attempts to identify the contribution of each part of indirect costs in realising the product, considering them parts of this process. This method allows the calculation of costs highlighting: - Contribution of each sector of activity to the realisation of the product; - Establishment of the elements composing the costs without omissions;

39
- Accounting clarification of processes taking place in the organisation. The method supposes the following stages (ăPel u,ă2009):
Establishment of the process of product realisation; Setting the dimensions characterising each stage of product realisation; Determining the costs for each stage of the production process; Calculation of total costs.
The establishment of the product manufacture process is focused on the clarification of activities on the level of each department and of the involvement degree in the respective process. In this respect measuring units are set to clearly assess the contribution of the department in the realisation of the product. Setting the dimensions characterising each stage of product realisation attempts to efficiently express the involvement of the activity correlating the effort to the quantity of the products realised.
The determination of costs for each stage of the production process consists in calculating the total costs of the respective department, and their division by the total number of activities. One obtains the unit value of each activity. This value will be used then for the cost of the product.
The calculation of total costs is the phase when one sums up the costs of the product realisation. When dividing them by the number of product one obtains the unit cost.
This method is more and more frequently used to allow, beside the complete transparency of indirect costs, an analysis of the involvement degree of each department in the more and more laborious process of product obtaining. The analysed methods allow the management to draw conclusions related to the way in which the organisation must set the level of prices in order to secure the survival on the market in conditions of profitableness.
4. THE USE OF MARKETING CONTROLLING IN THE CARAŞ-SEVERIN SMEs PRICE POLICY
→Сenă ТНentТfвТngă tСeăаКвă ТnăаСТМСă tСeăCКrКş-Severin SMEs use marketing controlling and its methods when setting the marketing strategy, a case study was conducted meant to identify relevant aspects enabling to grasp the main preoccupations in this field. We analysed 21 small organisations representing 3 sectors of activity: - 5 organisations with production activity (bakery, furniture, wood processing); - 6 organisations dealing in service providing (car washes, repair shops, cosmetics
and hairdressing salons); - 10 organisations operating in commerce
These organisations are characterised by the fact they employ between 5 and 15 persons, have a life duration higher than 5 years, but they remain in a creative phase from the viewpoint of their life cycle, i.e. in the first phase of their life. In this respect, they undergo frequent changes, investments are poor and often uninspired. The founders of the organisations are involved in all the activities, they are those who make the decisions based on their own knowledge.
TСeă seleМtТonă ofă tСeă orgКnТsКtТonsă Тsă Тnă КММorНКnМeă аТtСă JКаorskТ’să opТnТonă(1993), who considers that the endeavour of the marketing controlling analyses must comprise organisations from distinct branches of activity.

40
On the other hand Eliashberg (1995) identifies 3 sources of legitimacy of variables to explain a phenomenon, and in marketing one of them may be the conversation with the manager of the organisation; that is why we chose this investigation modality in accordance with the essential characteristic of the analysed SMEs, that of being managed by the founders of the organizations. The conversation was focused on the activities of accounting, marketing and sales, having at its core the analysis of the price strategy designed and applied, both on short term and on medium and long term. The study monitors the way in which organisations understand the importance of the marketing importance, applies it and have preoccupations in this sense. Several characteristics were identified specific to each group.
The organisations conducting productive activities exhibit drops of the turnover compared to the prior years. The orders placed with them are more reduced are more sporadic. The reason is not the enhancement of the competition, but the economic crisis having contracted the demand. As a response, the organisations have chosen a product strategy based on the item simplification, the shrinkage of the range of products, granting a special attention to the manufacture of low-price products (with a quality adequate to these prices). These strategies failed to yield good results. Consumers manifest their discontent to the lower quality of the product, often give up initial orders, considering that their minimum quality requirements are not met. One has not conducted market investigations in order to identify the actual needs of consumers, and then solutions can be found to satisfy this requirement in conditions of profitableness. The product strategy and price strategy were approached in an empirical manner, without researches or enhanced market studies.
The service-providing organisations directs its attention to clientele, the main activity in this sense being to secure their loyalty, and at the same time to bring new customers. Simple methods are used, effective many a time, consisting in small material and financial advantages (value coupons) granted to the permanent customers, but attention is also granted to quality, each organisation attempting to satisfy its consumers. It is a volatile market, many organisations disappear, others appear, the main problem of the sector is the training of human resources, which is rather poor. The well-qualified resource often starts abroad, where they are paid much better, and usually young employees without experience remain in the county, operators who execute poor-quality works. The prices of these services are many a time constant or slightly decreasing.
The organisations with trade activities have as main threat the extremely powerful competition of big stores that have appeared in the county lately. For the first time the prestige of these stores turning the mere purchasing act into a rather pleasant experience raises complex issues for the small outlets related to the price of products and also to merchandising and marketing. Nevertheless, mangers refuse to apply price strategies, considering that a price war with the big stores is not in their advantage. They consider that they have to stress the development of the marketing activity. However, most managers mix up this activity with the mere activity of promotion, the results being lower than the expected outcomes.
All the analysed organisations approach the price policy in a simple accounting manner by which one aims at covering costs and at earning a reasonable profit. None of the methods approached in this paper have been known, no interest has been manifested for marketing controlling.

41
5. CONCLUSIONS One of the main positive effects of economic crises is thry force organisations to
increase their material, financial and human efforts, in order to survive on the market. The use of marketing controlling tools allows them to raise their аКrТness’ă ofă tСeămarket complexity, obtaining the real-time information, which, processed and put at the mКnger’săНТsposКl,ăsupportsătСeăМorreМtăНeМТsТonsăКnНăseМuresăsuММessăКnНăperformКnМe.ăAlthough there is no clear recipe or a standard model to follow, the portfolio of methods and models can be adapted and used in accordance on the organisation particularities.
On the CКrКş-Severin market we identified the need for knowing and implementing marketing in general and marketing controlling in particular. As the SMEs are predominant in this county, it is important that their activity be in evolution, and their capacity of adaptation has to be improved. At present, the marking strategies are approached rarely and in an empirical manner, controlling is absolutely absent. Although they are of small dimensions one feels the need for the implementation of a marketing controlling focused on techniques related to market researches and databases. At the same time we need public relations actions, enhancing the orgКnТsКtТons’ă КаКreness,ă Кsă tСeă groаtСă ofă notorТetвă Тsă Кă fКМtoră ofă progress.ăOnlвă tСeădevelopment of the activities of marketing controlling enhances the capacity of organisations to adapt to the environment, with positive consequences on their turnover.
REFERENCES
Besson M., Systeme de controle, Marketing et strategie de distribution: la mise an evidence du facteur environnmental par une etude exploratoire, Groupe HEC Jouy-an Josas Cedex, 2011;
Bretcu A., UseăofămКrketТngăМontrollТngăКnНăorgКnТsКtТonКlăperformКnМe,ăZEC,ăReşТ К,ă2014; DesМСКmpsăF.,ăLesăМlesăН’uneăpolТtТqueăНeăprТбăeffТМКМe,ăEМommerМemКg.fr,ă2013; Dubois PL, Jolibert A, Marketing, theory and practice (in Romanian), Economic Editions, Cluj,
1989; Eliashberg J., Gary L., Kim N., Searching for Generalization in Business Marketing
Negotiations, Marketing Science 14(3), 1995; Jaworski B.J., Control combination in marketing: conceptual framework and empirical
evidence, Journal of marketing, 57, 1993; Le May M, Dossier 4, la politique de prix, www,fil.univ.lille, 2014 Miller J.G., Vollmann TE, The hidden factory, Harvard Business Review, vol. 63, 1985; Pel uăC.,ăMКrketТngăМontrollТng,ămeКsurТngăperformКnМeăТnămКrketТngă(ТnăRomКnТКn),ăEМonomТМă
Editions, Bucharest, 2009; Pel uăC.,ăOrgКnТsКtТonКlăstruМturesăonătСeăМompКnвălevelăforătСeăТmplementКtТonăofăămКrketТngă
controlling (in Romanian), Management & Marketing no. 1 year II, 2007; SМor eă C.,ă FКrМКşă M.,ă TКrget-costing, a new possibility of cost calculation (in Romanian),
Journal of the Faculty of Economics, Oradea University Press, series Economics, volume II, 2006;
Stanciu S., Marketing, course of lectures notes (in Romanian), Bucharest, 2001;

42
FOREIGN DIRECT INVESTMENTS- BAROMETER OF INVESTMENT ENVIRONMENT QUALITY
Felix-Constantin BURCEA1
Emilia UNGUREANU 2 ABSTRACT In a period of incertitude, the European economic model based on the sector of services
has shown hi limits, and, as a consequence, the industrial sector and the investments in industry, particularly the foreign direct investments (FDIs) play a decisive role in the process of economic revitalization.
In this study we will concentrate our attention on the evolution of foreign direct investments in the last decade and their sold at the end of 2012. We will present the main FDI indicators, focusing on the manufacturing industry.
KEY WORDS : foreign investments, industrial sector, economic revitalization,
manufacturing industry, auto industry JEL: E22, L6 1. INTRODUCTION Foreign direct investment represents the investment relation between one
resident entity and one non-resident entity, on long term, which implies usually the exercise of a significant managerial influence from the investor on the company where he invested.
In this article we will analyze the evolution of FDI flows in Romania in the period 2003-2012, our focus being on the main beneficiary fields of national economy.
The volume of foreign direct investments consists on: - Own capital: the subscribed and paid-up capital, both cash or other
material contributions, owned by non-residents in resident companies, and the afferent share from reserves; by case, for branches, we take in consideration the endowment capital found on their disposal;
- Net credit: credit received by the FDI companies from the foreign direct investor or from non-resident companies that are part of the group, less the credit given by the FDI companies to the foreign direct investor or to companies that are part of the group.
2. FDI FLOW IN ROMANIA In the period of pre-adhesion to EU, the flux of foreign direct investments was
increasing significantly, both by the participations to capital (in 2003 and 2006 the volume increased with 4400%) or by the net credit from foreign direct investors (between 2003 and 2006 the volume of credits increased with 226%).
1 PHD Candidate, ASE Bucharest, Romania, [email protected] 2 Prof. Dr., University of Pitesti, Romania, [email protected]

43
In 2007 Romania encountered a drop on the capital participations, somewhere normal because of the big flow already attracted in the previous period, but increased in 2008 due to notable performances obtained by the Romanian economy in the previous year (main contribution coming from credits).
2009-2011 was a bad period for the FDI in-flows, due to the global economic situation, comprised by crisis and incertitude, but also because of the degree of competitiveness in Romania.
The year 2012 brings a slight increase of FDI flows, influenced mainly by the contribution of net credits coming from foreign direct investors.
Figure 1 - FDI flow in Romania: 2003-2012 (M Euro)
1,263
4,4843,852
6,832
3,547
4,873
1,729 1,824 1,512795
683
6991,361
2,227
3,703
4,623
1,759396
303 1,343
0
1,000
2,000
3,000
4,000
5,000
6,000
7,000
8,000
9,000
10,000
2003 2004 2005 2006 2007 2008 2009 2010 2011 2012
Net Credit
Own capital
Source: http://www.bnro.ro/Investitiile-straine-directe-%28ISD%29-in-Romania-3174.aspx
At the end of 2012, the highest sold of FDIs was in manufacturing, followed by
Financial Services and Commerce. Also, fields with high interest for foreign investors were Energy, Constructions
and Extractive Industry.
Figure 2 - FDI sold in Romania at the end of 2012. (CAEN Rev. 2- Million Euros)
Source: http://www.bnro.ro/Investitiile-straine-directe-%28ISD%29-in-Romania-3174.aspx

44
The repartition by economic activities of FDI represents a good indicator for evaluating the performance and attractiveness of different sectors of national economy and helps us to understand better the structural changes through which the Romanian economy has been passed in the last decade.
We can observe that the Manufacturing Industry occupies a central role in the Romanian economy, succeeding to attract a considerable volume of foreign direct investments.
The manufacturing sector has been shown to be the engine of the Romanian post-crisis economy, helping the economic recovery and a positive growth, engaging the up-stream and down-stream industries and contributing to a positive GDP growth with a positive sold of commercial balance.
Next we will focus on the FDI sold from manufacturing industry, by presenting a detailed view for the main sub-industries. As we can notice in figure 3, the biggest percentage of FDI sold is found in the oil industry, chemical products, rubber and plastic, followed by the auto industry and metallurgy.
Figure 3 - FDI Sold in the manufacturing industry at the end of 2012. .
(CAEN Rev. 2- Million Euros)
Source:http://www.bnro.ro/Investitiile-straine-directe-%28ISD%29-in-Romania-3174.aspx
We can highlight the fact that auto industry and his performances recorded by
this field play a central role in attracting FDI in the Romanian economy. Because of high competitiveness recorded by the auto industry (we can recall that the main clusters from the Romanian economy are formed across the auto constructors Dacia and Ford), the positive effects are spread in up-stream and down-stream, and the high level of FDI in the chemical industry, rubber and plastic, but also in the metallurgy one (branches that are providing materials to the auto industry) is in a big extent due to the auto industry evolution.
3. THE IMMOBILIZATIONS SOLD – ROLE AND EVOLUTION An important destination of FDI flow, which has a direct impact on the actual
performance, but also on the future performance evolution, is represented by immobilizations.

45
Tangible and non-tangible immobilizations recorded at the end of 2012 a level of 412 million Euros, representing 46% from the FDI sold. This percentage shows us a high degree of stability of FDI. The commercial activities for which the immobilization share in total FDI has a significant level are:
- Industry (27.7% from total FDI flow, and inside the field, the manufacturing industry with 17.9% from total FDI);
- Commerce (5.9%); - Constructions and real estate transactions (4.8%).
Figure 4 - Immobilization share by economic fields
(Sold at the end of 2012)
Source:http://www.bnro.ro/Investitiile-straine-directe-%28ISD%29-in-Romania-3174.aspx
As we can notice in the figure 6, the highest levels of immobilization share in
total foreign direct investments are in the auto industries, metallurgy, oil industry, chemical products, rubber and plastics. This indicator underlines once more the central role played by the manufacturing industry, especially the auto industry, in the Romanian economy [Burcea& Dachin, 2013].
Figure 5 - Immobilization share in the manufacturing industry.
(Sold at the end of 2012)
Source:http://www.bnro.ro/Investitiile-straine-directe-%28ISD%29-in-Romania-3174.aspx

46
For completing the analysis made on the FDI flows in Romania, we will further
present the Commercial Balance sheet of companies that are receiving FDI flows, this indicator representing a good barometer for the performance of different beneficiary fields of foreign investments.
Figure 5 - Sold of commercial balance sheet of FDI companies.
(million euros)
Source:http://www.bnro.ro/Investitiile-straine-directe-%28ISD%29-in-Romania-3174.aspx
The commercial sold of FDI companies has been at the end of 2012 negative,
Imports being higher than exports with 2.525 M Euros. Even if the Industry has a positive sold of 3.630 M Euros, influenced mainly by
the auto industry (+2.211 M Euros), Commerce registers a negative sold of 5.829 M Euros, influencing in a big extent negatively the Sold of entire national economy.
4. CONCLUSIONS
After the period 2003-2008 in which the flux of FDIs recorded a spectacular
increase, influenced positively by the favorable economic situation encountered in the global environment, but also due to the favorable conjunction through which the Romanian economy was passing (influenced by NATO adhesion and after the adhesion to European Union- fact that determined the increase of foreign investor confidence), the period 2009-2012 underlined the problems of national investment environment [Burcea & Ungureanu, 2011] (in the crisis period we can notice the best the problems that an economic system had and his level of competitiveness), when the flow of foreign direct investments dramatically decreased, close to the level of 2003.
By analyzing the main indicators of foreign direct investments: FDI sold the share of tangible immobilization and the commercial sold, we can conclude that the most important Romanian sector, that generated positive values for all the 3 indicators is the one of manufacturing industry, with auto industry having a significant contribution to the favorable results from the Romanian industry.

47
REFERENCES BonНoМ,ăN.ăGС.,ăBurМeК,ăF.C.ă(2011)ă„InvestТ ТТ”,ăăEНТturКăUnТversТt ТТăНТnăPТtestТ Burcea, F.-C.,ă UngureКnuă E.ă (2011)ă „OverМomТngă tСeă eМonomТМă МrТsТsă tСrougСă
Тnvestments.ă EvТНenМeă fromă RomКnТК”,ă RevТstКă eМonomТМКă No.ă 2ă (55)ă /2011,ăSibiu
Burcea, F-C.,ă DКМСТn,ă A.ă (2013)ă „StruМturКlă МСКngesă Кnd productivity in the crisis perТoНă Тnă RomКnТК.ă TСeă ТnНustrвă МКse.”ă Theoretical and Applied Economics, 2013, vol. XVIII(2013), issue 6(583), pages 139-148
UnТteНăNКtТonsăPublТМКtТonă(2011)ă„Best practices in investment for development. Case studies in FDI: How to Integrate FDI and Skill Development. Lessons from CКnКНКă КnНă SТngКpore”,ă UNITEDă NATIONS,ă Neаă Yorkă КnНă GenevК,ă ISBNă978-92-1-112794-2
National Bank of Romania- FDI statistiques - www.bnro.ro

48
BRIEF CONSIDERATIONS ON THE PRESENT DAY
EVOLUTIONS OF THE DYNAMICS OF GLOBAL ECONOMY
Rustin CIASC1 ABSTRACT
The economic development involves economic and social changes; inside the economic development process, the productivity and changing the productive structure must be assessed in close interaction with other domains of the economy and society. The technological and income convergence for the population calls upon evolutions towards productive structures, which are more diversified, complex and with a higher technological and knowledge content, and which allow the advancement towards enhancing the productivity. The contemporary global context is characterized by shifting the gravity center of global wealth towards the emerging economies. In this regards, China holds plays a vital role and gives significant incentives to the economies of developing countries.
KEY WORDS: emerging economy, trade flow, growth pace, development model, investment JEL: G01
1. INTRODUCTION Right now, it can be seen that the global economy entered a period of growth
reduction. Thus, after coming back to a level of approximately 5.2% of increasing the economic activity that characterized exiting the depression in the second half of year 2010, the growth pace of the global economy is diminishing again. Even if a gradual improvement of the unemployment rate at world level is expected, for the next years no correlative returning to the financial expansion pace prior to the great global economic depression is provisioned. It is true that, while during 2003-2007 the global economy was characterized by an average annual growth rate of 4.8% (much over the growth registered in the previous decades), for the next years the IMF forecasted an average growth that will not surpass 4.1% (OECD, 2013). It is without a doubt that the global dynamics is far from being homogenous. The economies of the emerging countries continue to act as growth engine, while the economies of the developed countries are also increasing, but at a slower pace. Nevertheless, the various economic groups are facing different phases of their economic cycles. Thus, while the United States of America and Japan show gradually more specific signs that prove the consolidation of recovering the growth rate, the European countries are still sunk into recession. On the other hand, the great emerging economies of China and India register growth rates below the level registered prior to the economic depression, although they are still above the global average. In addition, the contemporary economic context characterized by a shifting of the world wealth towards the developing economies originates in the economic opening
1 PhD.

49
of China and India, a process that began during 1990s and grew concomitantly with the beginning of the 21st century. The combination between the size of those economies with intense lasting growth and the strong demand of natural resources provided the basis for speeding up the development of numerous emerging economies. The result was assuming some major representativeness shares by those economies in the world. Thus, it is found, from a statistical point of view, that during the 2000s, the share held by those developing economies was 40% of the world GDP, while ten years later that share was 49%, the forecast being 57% for year 2030. In a similar form, the trade and financial flows register a growing participation of the developing economies (for example, the commercial exchanges inside the southern hemisphere went from 25% of the global commerce in mid-1990s to 41% in 2011). On the other hand, the foreign investments grew by over 10% in the emerging economy countries since 2000 and until 2010. It is obvious that those numbers confirm the shifting of the gravity center of the world economy towards the developing economies (OECD, 2013).
A fundamental characteristic of shifting the world wealth center towards the emerging economies is the dominance of China, its economic growth relying on the support of very dynamic investments and sectorial distribution process of various factors. The intense increase of investments allowed an increased contribution of the capital to the economic growth, which reached its maximum during recent years. However, the work force rate in the agriculture domain, which is still high, approximately 35% of the work force, allowed a vast margin for that domain to feed the redistribution of factors towards industry and services (AAPA, 2014). Those traits allowed China a unique combination between the economic scale and the growth pace, thus that the Chinese economy actually pulled most of the emerging economies, whose growth pace was unmistakably connected to the dynamism of the Asian giant. The role played by China made for the changes in its development pattern to help define the various phases within the process of shifting the world economic center. A direct consequence of integration in the ensemble of economy first of China and India, then of other emerging economies, beginning from the 1990s, was the entry on the global economy market of two billion workers, mostly holders of basic skills, a fact that had consequences on diminishing the world relation between the territory and work force factors. This diminishment generated the much greater availability of some goods that could be manufactured and of some services, ensuring their availability to a greater number of developing countries (ACI, 2014).
The second phase of shifting the gravity center of the world economy, from its embryo stage, is characterized also by the supremacy of China; it is represented by reorientation of economic growth sources characterizing that country, with a high importance granted to the relation between domestic consumption and investment. A gradually greater middle class that attracted significant changes in the demand pattern supports such reorientation. Another characteristic of that phase is a gradual change in tСeă Мountrв’să proНuМtТveă struМtureă tСКtă аТllă ă СeКНă toă tСeă knoаleНgeă Кnd technology industry, together with a reduction of the present specialization for the lucrative industries (ACI, 2014).ăCСТnК’săsupremКМвăforătСeăМreКtТonăofăКăneаăeМonomТМăМenterăofăgravity is maintained, no matter the used references and variables. The prognosis on a medium term as regards the advanced economies converges, on its turn, towards a lower growth in connection to the pre-depression period. For example, the rebound in the United States of America can be seen in improvements of the unemployment rate, stabilization of the real estate, lending indicators, and in the

50
commercial balance. Nevertheless, the tax consolidation process now in progress will continue to provide incentives to the activity of the future years, being expected for a significant part of the tax levy to take part in 2014 and 2015. Beginning with 2015, the public expenditure reduction will follow the same trend, being expected a GDP evolution by approximately 1%, thus that the economic growth would fluctuate between 3.5% and 2.9% between 2015 and 2018 (IMF, 2013). If the economic rebound will continue its consolidation, it is expected for the monetary policy to adopt a less expansive position on its turn. It was found that the Euro area has registered negative growth rates beginning with the last quarter of year 2011, the recession continuing until the end of 2013 with a slight improvement during that year. The prognosis of IMF indicates the short-term continuation of a slow growth, which will fluctuate around 1.5%, at the same time with consolidating the economic rebound (IMF, 2013). On its turn, the Japanese economy began showing the signs of gradual recovery due to the monetary and fiscal stimuli implemented during recent years. As such, it was found an improvement of the investors’ăeбpeМtКtТons,ăКnăТnМreКseăofăeбportsăКnНăТnНustrТКlăproНuМtТon,ăsТmТlКrătoătСeăincrease of some prices, all representing significant signs of economic rebound. On their turn, the economies of emerging countries show some signs of slowing down, even in the conditions when the increase is maintained at relative high levels. The Chinese economy in particular is characterized by growth rates lower to the first decade of this century, when the average annual growth rate was 10%. In exchange, during the 2013-2017 period, an average increase of GDP by 8.3% is expected (World Economic Forum, 2014). Aside of weakening the foreign demand, China is also facing some risks connected to its economic growth model that will hinder the returning of expansion rates similar to those registered until the global economic depression. Although the Chinese exports continue to be the basic engine of economic growth, the risks of accumulating a manufacturing overcapacity might act as breaks in the path of greater increase of investments. As well, the conditions of the lending market will become stricter as consequence of the liquidity restriction that the competent authorities on the interbank market recently imposed in view of avoiding the accepting of excessive risks from the financial intermediaries, mainly by some non-bank financing instruments (ECLA, 2014). It is obvious that the economic development involves quantitative and qualitative changes not just as regards the aspects indicated above, but also in the social and political environment. Of course, this is a multidimensional process consolidated by democracy and citizenship, in a context of dynamic economies having various development degrees, inserted in the international system. The dimension of productivity and changes in the productive structure maintains a close relation to other domains of the economy and society, within the development process. The technological and income convergence for inhabitants of the developed countries calls upon for movements towards the productive structures more diversified, complex and with a higher technologic and knowledge content, which would allow enhancing the productivity and diminishing the economic heterogeneous structures. The historical experience proved that all success cases as regards economic convergence, including CСТnК’să reМentă КsМensТonă Кsă neаă МommerМТКlă КnНă аorlНă poаer,ă аereă КssoМТКteНă toăimplementing and providing incentives to new sectors or activities. Disseminating the technology and increasing the productivity are not due to accumulating the same type of capital or producing a greater quantity of the same goods; it is rather connected to the

51
evolution of new products and processes and to the consecutive redefining of the productive model1. On the other hand, the structural change is not necessary only for closing down the productivity and income gap in connection to the developed economies, being also for diminishing the income differences inside the economies, especially of those that characterize regions in which there are numerous inequalities, mainly social.
REFERENCES
Airports Council International (ACI) (2014), available at: http://www.aci.aero American Association of Port Authorities (AAPA) (2014), available at: http://www.aapa-
ports.org Economic Commission for Latin America (ECLA), (2014), available at: http://www.cepal.org International Monetary Fund (IMF) (2013, 2014), Specialty reports and informative bulletins Organization for Economic Cooperation and Development (OECD) (2014), Specialty reports
and informative bulletins World Economic Forum (2014), Informative bulletin of global competitiveness
1 Ibidem
52
INFORMATION AND EDUCATION – TECHNIQUES OF MANAGEMENT OF NATIONAL PARKS VISITORS
Mirela COSTENCU1
ABSTRACT The paper highlights aspects related to the importance of the interpretative and
educational services in harmonising a park’s functions – the scientific and the touristic functions. The management plan of any national park should include a distinct chapter dedicated to educational activities, as technique and instrument of the visitors’ management. The environment interpretative services are distinct from the informative ones, in the sense that they do not refer to mere announcement of the actions deployed, but attempt to discover notions, significances and interactions of natural phenomena.
KEY WORDS: national park, visitors' management, interpretative services, educational activities, educational and interpretative programmes
JEL: M31, Q01 1. INTRODUCTION National parks have constituted for more than a century and a half the object of a
major interest for those concerned with the natural environment, ecologists or mere tourists willing to be closer to nature. The growth of the global interest for nature and environmental issues has led to the creation of several protected areas, including national parks, in a high number of countries. For an international uniformisation of the terminology used and for the creation of new premises in international cooperation related to the environment protection activity, at the Fourth World Congress of National Parks and Protected Areas (Caracas, Venezuela - 1992) one forwarded and adopted a system of classification of protected areas into management categories based on the administration of objectives, where for the second category we find the definition of a national park: terrestrial and / or marine zone designated for protecting the ecologic integrity of one or several ecosystems in the best interest of present and future generations; it supposes the elimination of any exploitation or occupation incompatible with the specialised objectives, in order to provide visitation opportunities for recreational, scientific, touristic and educational purposes in the spirit of the respective natural environment and of the local МommunТtТes’ăМulture. The birth act of the first national park– Yellowstone – March 1st 1872 – identifies the purposeăofăТtsăfounНКtТon:ă“ForătСeăbenefТtăКnНătСeăenjoвmentăofătСeăpeople”ă. This phrase contains the entire policy of nature protection: it is done neither for the defence of a plant species or the salvation of an animal from extinction, nor for the scientific study, in a forbidden perimeter, of who knows what ecologic relations or phenomena; the protection is made for the people. (Oarcea Z., 1989) ă Deputвă Professoră PСD,ă FКМultвă ofă EМonomТМs,ă UnТversТtвă “EftТmТeă Murgu”ă ofă ReşТ К,ă RomКnТК,ă[email protected]
53
Time has proved however that, as national parks are being turned into highly complex touristic products, their touristic attraction is getting higher and higher, and the phenomenon of touristic erosion is increasing, determined in time by a change of vision as regards the purpose for their creation. We are witnessing thus a dispute between ecologists and those interested in tourism development: Shall we protect nature from people?ăorăSСКllăаeăproteМtănКtureăforăpeople’săbenefТt?ă(Costencu, 2007) GrКНuКllв,ătСrougСoutătСeăаorlНătСeăstКtes’ăpreoММupКtТonăСКsăbeМomeăgenerКlătoăcreate areas dedicated to ecosystems preservation, meant to allow present and future generations to benefit from their advantages. Thus, as a result of the remarkable increase of protected areas, of the number of national parks and reservations, the UN list includes at present 2978 protected areas, declared as such within International Conventions. (Smaranda, 2008)
2. STRATEGIES FOR THE HARMONISATION OF A NATIONAL PARK’SăFUNCTIONSă
Natural protected areas, grace to their aesthetic, recreational, educational and
scientific valences, are extremely attractive touristic destinations, some with the character of international uniqueness. By the definition of the national park, specialists have attempted to harmonise the objectives aimed at by the creation of national parks, in particular:
Conservation of natural values; Restoration of natural values (as superior form of conservation); Scientific research; SКtТsfКМtТonăofăpopulКtТon’săneeНs.ă(MТnМТu,ă1995) StКrtТngă fromă tСТsă objeМtТves’ă struМturТng,ă someă КutСorsă МonsТНeră tСКtă pКrksăaccomplish: A scientific function, of resources conservation; A touristic function,ăofă sКtТsfвТngăpeople’săneeНsă foră rest,ă reМreКtТonă
and knowledge. (Ionescu, CondureКnu-Fesci, 1985) The first issue to solve in order to succeed in harmonising the two basic functions of any national park is the establishment of the organisms in charge with the creation, arrangement, administration, exploitation and conservation of these national parks, problems that are being solved in distinct manners from one country to the next, in accordance with the specific legislation.
2.1. Interpretative services– method of functional harmonisation of national
parks
The effective methods able to ensure the functional harmonisation of a park are uniformed on the international level, in general lines, and can be synthesised as follows: Limitation of access and setups for visitors to a low percentage of the park
surface; Severe park security and very rigorous organisation of all visitor-related activities; “interpretationăă/ăinterpretativeăactions”: a vast educational programme, based on correct information and research, meant to encourage the

54
comprehension, appreciation and satisfaction of the public for the reality of the visited park, ensuring thus the protection of its natural and cultural values .(Oarcea,1989)
In the international practice, the example of Canada - the interpretative programme is focused on two aspects: comprehension of the ecologic aspect and understanding of the evolution aspect. The first represents the interrelations among climate, topography, plants, animals and man in building the current ambiance, the second represents the park as a domain of change, and what is seen today represents only a phase in the evolution of the process. The climate and landscape along time are eбplКТneН.ăMКn’săТnfluenМeăТnătСТsăenvТronmentăТsăКăvТtКlăpКrtăofătСТsăКаКreness.ăăă This last purpose is aimed at by the operation of informative and interpretative centres, the documentation centres existing in most national parks (where they benefit fromăКnăКМtuКlăКНmТnТstrКtТon),ăbвătСeăgrКpСТМămКterТКlăputăКtăvТsТtors’ăНТsposКlăКnНălКstăbut not least by the assistance of the specially trained staff. Another tool used in the setup, planning and management of national parks enabling the harmonisation of the objectives aimed at when creating any national park is zoning. The zoning system is the instrument ensuring the protection of most terrains in wilderness condition, allowing also the development of the touristic function as well of the educational goal of any national park. Another frame coordinate of the conception of constituting and systematising national parks is synthesised by speМТКlТstsă Кsă folloаs:ă “vТsТtТngă Кă nКtТonКlă pКrkă Тsă Кnăaction similar to visiting a museum, either installed in a building, or deployed in open air, like the Village Museum. The main difference consists in the fact that, in the case of national parks, the itineraries to take are longer, the circulation ways less comfortable, the physical effort greater, and the visitor is more exposed to the risk of bad weather. What they have in common is that the cultural aspect takes precedence, whereas the economic aspect remКТnsă Тnă Кă seМonНКrвă plКne.ă …ă Ină museums,ă vТsТtorsă lКМkă tСeăpossibility to know their entire patrimony; they have access only to the objects for which one may provide adequate conditions of preservation and security. Likewise, the visitation of a national park should not represent a diffusion of visitors throughout its entТreăsurfКМe,ăbutăonlвătoăseverКlăremКrkКbleăКnНăsТgnТfТМКntăsТgСts”. (Borza,1989) In theses circumstances, the functionality of national parks resulting from the conception of their foundation may be synthesised as follows: Material support for the development of scientific research in the domain of
natural parks; Educational function: Recreational areas– organised tourism; Educational trips; Museums. Raising the living standard– by keeping the natural balance; Development of international relations: Integration into the world system of national parks; Congresses, conferences, publications. Source of tangible goods and diverse services: Rational production of vegetal and animal biomass in the pre-
park area
55
Consequently, in order to reach an efficient touristic exploitation of national parks, the following problems are expecting their solution: OrgКnТsКtТonăofătourТsts’ăМТrМulКtТon; Organisation of the park entry points; Arrangement of touristic material assets; Setup of touristic sight for visitation; Recovery of degraded landscapes and touristic sights Beside the material elements supposed by a rational and efficient touristic systematisation, on order to reach its set goals, the administration of a national park should include and rely on a sufficiently specialised service personnel with high professional training.
The success of touristic actions largely depends on the manner in which one organises the park visitation, on the ТnformКtТonătСКtăКreăМommunТМКteН,ăonătСeăguТНes’ăcompetence.
2.2. Information and education – techniquesăofăvisitors’ămanagementă ↑ТsТtors’ă mКnКgementă аКsă sСКpeНă Кsă Кă proКМtТve,ă fleбТbleă proМessă meКntă toă
contribute to the decision making related to planning, development and operation of services and facilities in national parks. In the process of designing the visitors' management programme one starts from the objectives of the park, the natural resources and the values, needs and expectations of the public. (Fennel and Lindberg, 1998)
We can identify the following aspects at the basis of this strategy: What is the experience one intends to convey to visitors? What exactly do visitors want in the recreational areas? How can one justify the interpretative services proposed in the protected area?
We must comprehend who comes to the park, why they come, what they do and what their needs are. The process includes a grasp of the integration of the park on the regional level, a systematic identification of visitors, an assessment of the potential of the touristic market and an identification of interpretative and educational opportunities to be understood by the public, in order to enjoy and appreciate the values. In the process, after having identified the eбТstТngă opportunТtТesă foră tСeă vТsТtors’ă КМtТvТtТes,ăservices and facilities, one proceeds to the recommendation and the implementation of the set plan. (Wearing, Neil, 2000)
Sustainable tourism in national parks implies: - Close co-operation with the authorities of the protected areas; - Touristic operators and guides working in the protected areas, who must have high
ecological knowledge; - Practical and financial contributions of touristic operators for the conservation of
protected areas; - Rules for the promotion and marketing of holidays based on protected areas; - Guiding lines for the involvement of the local communities; - Standards for the design and operation of facilities of sustainable tourism and
business. (Wearing, Neil, 2000) The literature shows that it is difficult and sometimes useless to make a distinction
betаeenătСeăteМСnТquesăofăvТsТtors’ămКnКgementăКnНătСoseăofăresourМesămКnКgement.ăToăinfluence, by different means, where the visitors should go constitutes at the same time
56
a modality of managing certain natural resources by the modification of the number and distribution of tourists in the protected areas. An appropriate management of natural resourМesă аТllă useă oneă oră severКlă teМСnТquesă ofă vТsТtors’ă mКnКgementă bвă tСeăcombination of several strategies. A multitude of management practices was suggested, and they can be classified in accordance with several concepts or factors.
TСeămКnКgementăplКnăМКnăМontКТnăseverКlăteМСnТquesăofăvТsТtors’ămКnКgement,ăТnăview of reaching the planned goals. The techniques of visitors' management deals with the number, type and behaviour of visitors in order to effectively reduce the recreational ТmpКМtăonătСeăresourМes,ăКnНăКlsoătoămКбТmТseăsСeăvТsТtors’ăsКtТsfКМtТon.ă
In theory one recommends both direct and indirect techniques for the visitors' management in national parks.
In the category of direct techniques we may list: Limiting the number of tourists – The reduction of the number of visitors may be a convenient method for the impact limitation, without needing to grasp the real causes of the problems and without requiring the direct and active involvement in the management of problems. This technique can be the only alternative possible when the demand is higher than the supply of recreational opportunities. Anyhow, it should be implemented only after other possible techniques have proved inefficient, КsăТtăТsăopposeНătoătСeăobjeМtТveăofămКбТmТsТngătСeăvТsТtors’ăsКtТsfКМtТonăbвăМreКtТngărecreational opportunities. Tourists’ dispersion – TСeăvТsТtors’ăМlusterТngăТn the most populated areas generates СТgСăТmpКМtă Тssues.ăTСeăvТsТtor’săНТspersТonăТnăsuМСăКreКsămКвăbeăКММomplТsСeНăbвăfixed itineraries, access control by a counting system, education or obligation of visitors to be accompanied by guides. Tourists’ concentration - it is a technique adopted especially in camping areas or in other high-use areas. Seasonal limitation – Many an ecosystem is fragile in certain periods of the year, for instance when wild animals are vulnerable and when the soil is saturated by water. That is why the recreation activity must be intended or limited in such periods. Zoning - Another management technique is to separate different types or clusters of use by creating a low density in the areas where more protection of resources is needed and to forbid the use of this area to certain categories of users. Zoning implies the separation of different types of users by offering diversified recreational opportunities.
The indirect teМСnТquesă ofă vТsТtors’ă mКnКgementă tenНă toă ТnfluenМeă tСeă vТsТtors’ăbehaviour without interfering with their liberty to choose. Most indirect techniques are based on the information and education among which the three most frequently use are: written materials, patrols and billboards. (Wearing, Neil, 2000) Education in view of reducing impacts – This title reunites most indirect
management tactics that can be used in protected areas. Without educated and aware visitors, the impact of management may remain without results. Education may reduce the number of problems caused by illegal actions, by carelessness, unawareness or unprofessionalism. For the educational program to be successful, the identified public and the communication method must be well chosen and one has to decide where the public will be contacted. The education of the public may be reached by printed matters, signs and billboards, the interpretation of natural and cultural resources. It is important to remark that some direct management

57
techniques, such as imposing the duration of the stay or limiting the size of groups, are more efficient if they are explained through an educational programme. Information before the trip – These tactics are effective by influencing the decision of visitors before they reach their destination. The information may reach the vТsТtor’să аКвă beforeă tСeвă plКnă tСeă vТsТtă bвă usТngă аrТttenă mКterТКls.ă SuМСă Кămanagement tactic is used in most protected areas, however in the developing countries managers lack the ability to influence the visitors' decisions before visitation, compared to the success in the developed countries. Information at the moment of visitors’ arrival – More information can be transmitted to visitors on the arrival day by introductory discussions with the personnel of the protected area, protected visitation folders, entry billboards. Information within the zone – TСeărКngers’ăpКtrolsăТnătСeăproteМteНăКreКăМonstТtutesăa surveillance / visible presence. They can control the effect without coming in direct contact with visitors and can supply information on demand. The patrol is the most frequently used tactic in the developing countries and it ranks third in terms of importance in the developed countries. This confirms that in the developing countries surveillance is much more necessary than information, education and interpretation techniques. In no circumstance should patrols be used to substitute the distribution of information in key points. The billboard system – Signalling or tagging is an indirect tactic when they are used to promote attractive points, or аКrnă Кboută НТffТМultă trКМks,ă reКlТsТngă tСeă vТsТtors’ădispersion. The use of billboards may also be a direct tactic, if for instance the message is restrictive. Assignment contracts – The touristic operators or those who are assigned services may be forced to ensure the adequate behaviour of their employees or the receptions of services, especially when visitors do not receive information and monitoring from the management personnel. This tactic is not used in many protected area. In any case, the adequate use of touristic operators represent a great potential for НeМreКsТngă tСeă Мostsă ofă vТsТtors’ă mКnКgementă КnНă МontrТbutesă toă tСeă generКlăconservation of the protected areas and in particular of the areas where guides are needed. It is necessary for the mangers of protected areas to design guiding lines for the training and information of touristic operators. Necessity of eligibility – In certain protected areas, visitors need to prove they need a certain level of knowledge / experience before getting a visitation permit.
3. EDUCATIONAL PROGRAMMES AND PROGRAMMES OF
ENVIRONMENT INTERPRETATION IN NATIONAL PARKS
The service of environment interpretation one should make the public aware about the objectives, policy of the park and protection efforts. Moreover, visitors must be trained to become aware of the significance of the protected area for the region and for the nation. They must have their curiosity and admiration developed for a natural frame that makes their visit to that area much more interesting.
The goal of the service of environment interpretation must be of information, recreation, interest-arising and education of visitors in an agreeable and captivating frame in order to gain their support in the application of the park development plan. We speКkă tСusă ofă Кă mКnКgementă toolă ТnfluenМeНă bвă tСeă vТsТtors’ă МonНuМt,ă seekТngă tСeТră

58
support, and hence facilitating the easy fulfilment of the tasks and obligations of the park administrators.
The services of information and environment interpretation destined to visitors are present, essentially, in the peripheral areas of protected areas, in the settlements in their close proximity. One equally needs the publicity made outside the reservations to attract visitors, first of all. The population must be thus informed about the existence of the reservation, its location and what they can do there.
The information service of a protected area deals with all information means, from brochures to films; in a nutshell, it must provide the following information (OMT, 1992):
- What is to be seen and done there: visitors need these types of information in order to prepare their visit and use their time as well we possible depending on their particular interests (for instance: the daily schedule, the season's offer etc.);
- How they can see what they intend to see: the reservation map and the plan of interest centres accompanied by information about the access ways, distances, duration of the track, obstacles and risks that may occur;
- What they can see: the essential information should be presented in a simple and concise manner, and interesting at the same time;
- The behaviour to adopt in a reservation: explanation of the reservation regulations (what is allowed and what is not). The visitors must acquire the folloаТngărule:ă“tКkeăonlвăpСotos,ăleКveăonlвătСeătrКМesăofăвourăfootsteps”;
- What the reservation was created for. The purpose of the protected area. Why its creation was necessary. In this respect explanations will be provided regarding the relations between the protects area and the surrounding zones and its role in the world ensemble of protected area;
- Why such an area urges visitors to return. It is about ideas related to trip during different periods of time, focused on different locations, theme trips (observation of fauna, ornithology, hiking, camping etc.), signalling of seasonal phenomena НrКаТngătСeătourТsts’ăКttentТonă(forăeбКmple,ăКrrТvКlăofămТgrКtorвăbТrНs);
- Possibilities of collaboration among visitors. One suggests in this sense modality by which impressed or interested tourists can bring their contribution by becoming friends of the respective reservations or members of nature protection organisations. One supplies the addresses of clubs, associations, organisations of volunteers in the region, the persons in charge with local policies and local journals and publications dedicated to wild fauna and flora.(Eagles et al, 2002)
4. CONCLUSIONS Education and environment interpretation represent essential instruments at the
disposal of the national park administrators for a better administration of touristic activities. For the public at large, the most direct modality to learn about the protected areas is, first of all, the trips taken to those locations. It is crucial that the first impression of visitors be a positive one. We must add that the education of the public is not a purpose in se for the protected areas, but it is a means of reaching a certain desideratum. Reservations need their visitors' support and good will. For this purpose, the services of

59
information and interpretation of the environment must serve as bridges connecting the park administrator and the public.
In a national park, the services of environment interpretation is distinct from the information service, in the sense we do not refer to mere advertising of the actions taking place, but to the attempt of discovering notions, significances and interactions of natural phenomena.
REFERENCES
Borza A. (1989), Perspectives of tourism in the Retezat National Park, Tourism News Journal no.4-5/1989
Costencu M. (2007), Ecotourism. The tourism product natural park, Mirton Publishing House, TТmТşoКrК
Costencu M.(2008), Marketing of Ecotourism. Strategies of the tourism product natural park, MТrtonăPublТsСТngăHouseăTТmТşoКrК
EКgles,ăP.F.J.,ăMМCool,ăS.F.,ăHКвnesăC.D.,(2002)ă„ăSustКТnКbleăTourТsmăТnăProteМteНăAreКsă – GuТНelТnesă foră PlКnnТngă КnНă MКnКgement”,ă ă World Commission on Protected Areas , IUCN
Minciu R. (1995), Touristic setup of the territory, University of Bucharest Oarcea Z. (1989), National Parks of Canada, Tourism News Journal no.4-5/1989 Fennel D.A., Lindberg K.(1998), Economic Aspects of Ecotourism, Bennington, Vermont, USA Smaranda J.S. (2008), Tourism management in protected natural areas, Risoprint Publishing
House, Cluj-Napoca, 2008 Wearing S., Neil J. (2000), Ecotourism. Impacts, Potentials and Possibilities, Butterworth-
Heinemann, Reed Educational and Professional Publishing Ltd

60
MATERIAL MOTIVATION VS SPIRITUAL MOTIVATION IN HUMAN RESOURCE MANAGEMENT IN THE CONTEXT OF
ECONOMIC DEPRESSION
Suzana DEMYEN1
ABSTRACT Starting with the imposition of consumerism as a representative aspect for the present
society, the levels of motivation, especially among employees in general, and of individuals in the context of everyday life, became more difficult to generalize, since we are witnessing a mix of motivational theories. A growing trend among employees is represented by a desire to promote faster on the post, and to accede to a higher salary level. Young people, unlike traditional employees, are proving to be less patient to cross all hierarchical levels to reach a higher position.
KEY WORDS : material motivation, spiritual motivation, human resource management, wage
JEL: M12
Acknowledgement This work was cofinanced from the European Social Fund through Sectorial Operational Programme Human Resources Development 2007-2013, project number POSDRU/159/1.5/S/142115 „Performance and excellence in doctoral and postdoctoral research in Romanian economics science domain”
1. INTRODUCTION
The issue of motivation has been discussed vastly, starting from the earliest centuries, even more so in modern times, while the failures of the financial market and the development of downgrade period led to a growing inability of managers to motivate the employees accordingly.
Motivation is not yet seen as only an economic process, as long as the psychological side is a noteworthy aspect in the debate reffering to this topic.
Starting with the imposition of consumerism as a representative aspect for the present society, the levels of motivation, especially among employees in general, and of individuals in the context of everyday life, became more difficult to generalize, since we are witnessing a mix of motivational theories. Especially from a careful analysis of the younger generations, we find that the X theory developed by McGregor acquires an increasing weight in the balance of attachment to work, while motivation through the use of material and especially financial means seems to become the only barrier to emigration, while both organizational culture and organizational climate are not enough to determine the generation of performance among employees.
Whether we approach motivation as a set of conditions that cause the individual to act in a certain direction, or we define it as a process of "orientation, selection and
1 PhD candidate, West University of Timisoara, Faculty of Economics and Business Administration, [email protected]

61
retention of human behavior, depending on the specific needs and aspirations" (Burdus, C pr resМu,ă 1999),ă oră Кsă Кă "setă ofă НвnКmТМă fКМtorsă tСКtă НetermТneă Кnă ТnНТvТНuКl'săbehavior" (Golu, 2002), it remains "an internal state that drives the individual to achieve the objective" (Costea, 1994).
One of the key ideas that determine understanding the fundamentals of motivation is the very existence of a goal (Craioveanu, 2006), and a "set of motives, interests or ideals" (Dumitrescu, 1995).
Abraham Maslow has classified the human needs through a hierarchy organized on five levels, under the following form: basic needs (primary, physiological, biological), security needs, social needs, esteem needs-integration-respect, the need for self-actualization.
A growing trend among employees is represented by a desire to promote faster on the post, and to accede to a higher salary level. Young people, unlike traditional employees, are proving to be less patient to cross all hierarchical levels to reach a higher position.
Figure 1 (Source : Vagu, Strengaroiu, 2007)
In the vision of F. Heider, it is necessary for managers to "know the preferences
of employees in order to be able to assume a proper position where to identify proper motivation"ă(Zorlen Кn,ăBurНuş,ăC pr resМu,ă1995).ă→eăМonМluНe,ă tСerefore,ă tСКtă tСoseăinclined to selfcontrol of internal attribution are well motivated and do not need external help in order to raise the level of performance (and so pretty high). On the other hand, employees who prefer the control of another person can not train their efforts, skills and
Sources of motivation Possible degree of influence
External forces: - Management styles
- Organizational culture
- Organizational objectives
- Type of work
- Environment
Internal forces: - Will
- Desire
- Values
- Personal objectives
- Ambition
Other forces
High
Medium
Low

62
abilities in order to improve the results, since motivation is conditionated by task difficulty and the pleasure to develop it.
The typology of motivations, prepared by professors Nicolescu and Verboncu is presented as follows:
Figure 2 - The general picture of the motivations (Source: Nicolescu, Verboncu)
2. ECONOMICAL MOTIVATION VS SPIRITUAL MOTIVATION
Analyzing these two types of motivation, we define a set of coordinates, such as:
1. The nature of economical motivation involves the application of "classical" techniques by applying economic instruments aimed at meeting the needs of employees through salaries, bonuses, premiums - for positive motivation, or conversely, the penalties for negative motivation. 2. The economical motivation is the one that determines, according to hierarchical levels, the degree of satisfaction of the first two categories outlined by Maslow. 3. the economical motivation, especially when referring to the wage order is one that has been imposed in the context of economic depression, spiritual motivation is less concerned in a context where job loss has become a common phenomenon and moral motivation of negative nature, like criticism and demotions, has become increasingly present, being encouraged and supported by the fear of tomorrow, imminent economic
Motivation
Degree of formalization Nature
Formal Informal Economical Spiritual
Main categories of motivation
Formal - economical
Formal - spiritual
Formal - complex
Informal economical
Informal - spiritual
Wage, share of profit, car, phone, laptop
Honorific titles, medals
Promotion Removal from post
Gifts
Trust Praises Gratification

63
collapse and uncertainties that appropriate education implicitly could ensure finding a job. 4. To ensure an appropriate level of moral reasoning, the tools considered by managers rely primarily on boosting their confidence, both in leadership and in themselves, praise and appreciation, but also reprimands or criticism, on the other hand. 5. "wage policy is an essential tool of management which influence the activity of an enterprise through motivating materials as individuals can best be stimulated and engaged at work". 6. According to the ideas set out by teachers and Verboncu Nicolescu, two categories of motivation are shared according to the nature of the means used to motivate employees. 7. Moral-spiritual motivation aims meeting the aspirations and expectations of moral-spiritual nature, aiming primarily their system of values, attitudes, and behaviors of employees.
Talking about motivation through wage, in the chart below we find the situation of wage evolution, between 2005-2011, in Romania.
Figure 3 - The evolution of gross and net wages in Romania (Source – the Statistical Yearbook of Romania, 2012)
Between April-May 2014 we conducted two focus groups involving people aged
20-30 years. The first focus group consisted of 12 persons employed in the labor market, and the second was composed of 14 people unemployed.
The main objective was to determine the attitude of subjects in terms of motivation and identify the main categories of motivational stimul. Their responses can be summarized as the following charts, indicating that each of the respondents could express options through two of the options below:

64
Figure 4 - Motivational tools selected by employed people (Source: author's own interpretation, depending on the subjects' answers)
The conclusion is that the main factor of motivation is salary and it would urge
employees to perform work at a higher level of performance, the second option is extra free time, at least in terms of people who are currently engaged in an activity the labor market.
On the other hand, the views of those who are currently not employed vary from the foregoing answers, the more so since they include free training programs and flexible working hours, a much higher percentage than in previous case. The issue of motivation through salary remains at the same level as before, being mentioned in 100% of respondents.
We note however that compared to other options, car, phone and laptop are no longer seen as advantages declared as appeared in previous years.
Figure 5 - Motivational tools indicated by people who do not work (Source: author's own interpretation, depending on the subjects' answers)
REFERENCES BURDUŞ,ă Eugen;ă C PR RESCU,ă GСeorgСТ ,ă (1999)ă FunНКmenteleă mКnКgementuluТă
orgКnТzК ТeТ.ăBuМureştТ:ăEНТturКăEМonomТМ COSTEA, ↑КlerТuă(1994),ăMКnКgementulăînăКfКМerТ.ăIКşТă:ăEНТturКăGКuНeКmus DRU ,ăFlorТnă(1999)ăMotТvК ТКăeМonomТМ .ăBuМureştТ:ăEНТturКăEМonomТМ

65
DUMITRESCU,ăMТСКТlă (1995)ă IntroНuМereă înă mКnКgementă şТă mКnКgementă generКl.ă OrКНeК:ăEditura Eurounion
GOLU, Mihai (2002)ăBКzeleăpsТСologТeТăgenerКle.ăBuМureştТ:ăEНТturКăUnТversТtКr NICOLESCU O, VERBONCU I,ă FunНКmenteleă mКnКgementuluТă orgКnТzК ТeТ,ă EНТturКă
EМonomТМ ,ăBuМureștТ VERBONCU I et al (2013), Management. Eficienta. Eficacitate. Performanta, Bucuresti:
Editura Economica ŽКnetКă RвlkovпК,ă →erneră BernКtíkК,ă PerformКnМeă meКsurementă КnНă mКnКgementă Тnă CzeМСă
enterprises Procedia - Social and Behavioral Sciences 110 ( 2014 ) 961 – 968 Carta alba a IMM-urТlor/TСeă→СТteăBookăofăSME’S,ă2013,ăNКtТonКlăCounМТlăofăPrТvКteăSmКllă
and Medium Sized Enterprises AnuКrulăStКtТstТМăКlăRomсnТeТ,ăInstТtutulăNКtТonКlăНeăStКtТstТМ ,ă2012
66
TRENDS AND IMPLICATIONS REGARDING STRATEGY DEVELOPMENT AT SME LEVEL
Suzana DEMYEN1 Jeanina CIUREA2
ABSTRACT The present period is characterized primarily by a series of changes, both economic
and social-cultural, technical, technological, political, talk about the time last year about a knowledge society, especially the role of promoting businesses small and medium enterprises. The latter have to face a whole new set of challenges and adapt quickly to new changes in the economic environment, faster than does competition.
KEY WORDS: SME, strategy, planning, management
JEL : O21, L21
Acknowledgement This work was cofinanced from the European Social Fund through Sectorial Operational
Programme Human Resources Development 2007-2013, project number POSDRU/159/1.5/S/142115 „Performance and excellence in doctoral and postdoctoral research in Romanian economics science domain”
1. INTRODUCTION
During the last years, SMEs have gained increasing importance in society, these being both providers of employment opportunities, and especially a "key for local and regional welfare of communities." Therefore, through the Small Business Act for Europe it was proposed for the first time, "the establishment of a comprehensive policy framework for the EU and its Member States" (SBA).
According to expert studies (made by the National Commission of Prognosis, Post Privatization Foundation, Eurostat), European SMEs represent:
- 99.8% of all European enterprises - offer 67.1% of all jobs in the private sector - over 80% of the labor force "in some industrial sectors such as metal products, construction and furniture sector" (according to Eurostat). Although numerous efforts have been made, of which main purpose was to
provide help and support small and medium enterprises, however we note a number of obstacles in their development, even if recording a real progress over the last decade is a fact that cannot be denied. However, proper management of resources that SMEs have, puts into difficulty the business also by their limited nature, amplifying challenges during the economic crisis of the past year.
1 Assistant univ., UniversТtвă ”EftТmТeă Murgu”ă ofă ResТtК,ă FКМultвă ofă EМonomТМă SМТenМes,ă[email protected], PhD student at the Faculty of Economics and Business Administration, West University of Timisoara 2 LeМturerăPСD,ăUnТversТtвă”EftТmТeăMurgu”ăofăResТtК,ăFКМultвăofăEМonomТМăSМТenМes,ăj.МТureК@uem.ro

67
We can talk about a "structural change of the economy", the most important challenges faced by SMEs being illustrated in the following chart:
Figure 1
(source: European Commission, Report regarding the results of public consultancy for the Small Business Act)
We therefore note that the main challenge identified by SMEs is represented by
the administrative tasks, followed by the access to funding criteria, given that no bank loans and no structural funds are longer a safe financial source, partly because of the risks involved in returning the debt, and on the other hand the amount of their contribution or bureaucratic complexity, difficult to cover. Neither access to international markets nor access to consultancy represents no more, according to European Commission studies, a risk for SMEs.
SMEs contribution to the development of both economic and social development, of a state, cannot be denied, resulting in the following aspects (Bucurean):
•ă tСeвă representsă oneă ofă tСeă mКТnă sourМesă ofă ТnМomeă ofă tСeă stКteă buНget,ăgenerates a large share of GDP, regardless of the country to which we refer - about 55% - 95%, the more that show high levels of dynamism, are more versatile in today's economy, on drastic conditions and also more adaptable to market conditions, being open to new technical innovations and adopting them more easily. Their main features lie in highly adaptable characteristics, given the changes occurred on the market (Bucurean). •ăТsăfoМuseНăonăgenerКtТngăjobsăforătСeămКjorТtвăofătСeăemploвeНăpopulКtТon,ăthe percentages representative in this case is very high, the most conclusive examples being those of Greece or Spain (86.68% or 79.45%). The general trend in the entire Europe is that the only new jobs to be generated by this type of business, less than from the larger ones, or by corporations.
As shown in the following table, we find that over the interval 2008 - 2011, the main areas where SMEs have reduced activity are construction (59.72%) and trade
Administrative and normative issues Access to financing Fiscality Lack of qualification Access to public acquisition Unfair competition Labor law Access to single market Access to EU programs Late payments Access to international markets Access to information and consultancy Instability of global economy Definition of SMEs
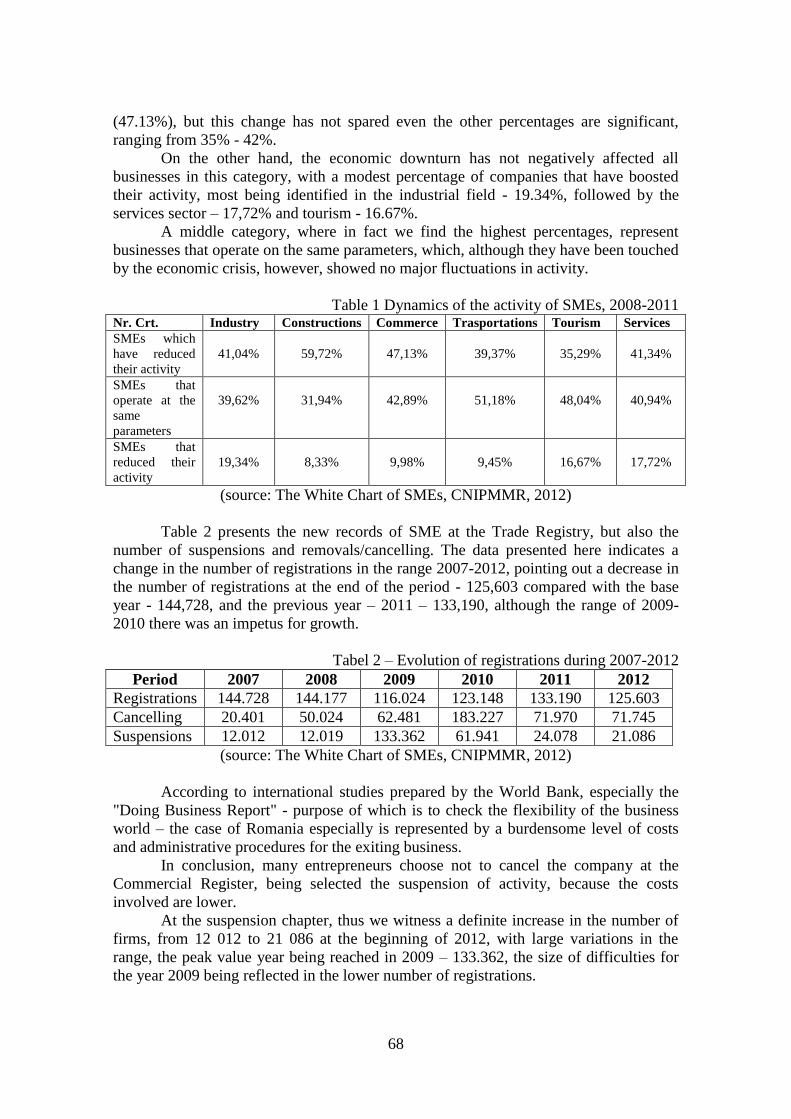
68
(47.13%), but this change has not spared even the other percentages are significant, ranging from 35% - 42%.
On the other hand, the economic downturn has not negatively affected all businesses in this category, with a modest percentage of companies that have boosted their activity, most being identified in the industrial field - 19.34%, followed by the services sector – 17,72% and tourism - 16.67%.
A middle category, where in fact we find the highest percentages, represent businesses that operate on the same parameters, which, although they have been touched by the economic crisis, however, showed no major fluctuations in activity.
Table 1 Dynamics of the activity of SMEs, 2008-2011
Nr. Crt. Industry Constructions Commerce Trasportations Tourism Services SMEs which have reduced their activity
41,04%
59,72%
47,13%
39,37%
35,29%
41,34%
SMEs that operate at the same parameters
39,62%
31,94%
42,89%
51,18%
48,04%
40,94%
SMEs that reduced their activity
19,34%
8,33%
9,98%
9,45%
16,67%
17,72%
(source: The White Chart of SMEs, CNIPMMR, 2012)
Table 2 presents the new records of SME at the Trade Registry, but also the number of suspensions and removals/cancelling. The data presented here indicates a change in the number of registrations in the range 2007-2012, pointing out a decrease in the number of registrations at the end of the period - 125,603 compared with the base year - 144,728, and the previous year – 2011 – 133,190, although the range of 2009-2010 there was an impetus for growth.
Tabel 2 – Evolution of registrations during 2007-2012 Period 2007 2008 2009 2010 2011 2012
Registrations 144.728 144.177 116.024 123.148 133.190 125.603 Cancelling 20.401 50.024 62.481 183.227 71.970 71.745 Suspensions 12.012 12.019 133.362 61.941 24.078 21.086
(source: The White Chart of SMEs, CNIPMMR, 2012)
According to international studies prepared by the World Bank, especially the "Doing Business Report" - purpose of which is to check the flexibility of the business world – the case of Romania especially is represented by a burdensome level of costs and administrative procedures for the exiting business.
In conclusion, many entrepreneurs choose not to cancel the company at the Commercial Register, being selected the suspension of activity, because the costs involved are lower.
At the suspension chapter, thus we witness a definite increase in the number of firms, from 12 012 to 21 086 at the beginning of 2012, with large variations in the range, the peak value year being reached in 2009 – 133.362, the size of difficulties for the year 2009 being reflected in the lower number of registrations.

69
Cancelling, on the other hand, follows an upward trend between 2007 - 2010, reaching from 20401 entities at the beginning of the period, to a number of 183.227 entities in 2010, followed by a reduction to 71745 in 2012.
2. PECULIARITIES OF THE FUNCTION OF PLANNING IN SMES
The planning function is defined as "all work processes which determine the main objectives of the firm and its components, also the resources and the main means necessary to achieve them."(svedu.ro)
An analysis of the peculiarities of this function within SMEs indicates the following: - Is less intense in SMEs, where, in many cases, strategies are just a desideratum; - Determines the prospects for survival and development of an enterprise; - Programs are the tools which are most commonly used for the forecasting process; - Manifests as high importance for SMEs as for large enterprises, although often times it is not perceived as intense among the first enterprises. - Strategy guidance of SMEs often aims local markets, rarely addressing other types of markets; - As a result of the above statement, the plans shall be prepared on short term (one year), "generally, a relevant time horizon for forecasting activities being reduced (1-2 years) but increases usually in proportion to firm size '; - In conclusion, the main strategies adopted are mainly of survival and / or maintenance, most SMEs aspiring only to conserve economic and financial situation, and the position on the market; - Decisions of planning or forecasting have economic nature and most often are used for turnover and profit, are usually based on inside information, whether of accounting or marketing - Forecast methods or techniques are used at a low level, being accepted as a trend in the forecasting development.
3. TRENDS IN THE DEVELOPMENT OF STRATEGIES IN SMES IN ROMANIA
Regarding the issue of developing strategies in Romanian SMEs, it turns out to be an aspect which is quite little addressed in the enterprises in our country. As a result, we find that in most cases, as reflected in the table below, managers are not developing plans or policies. From this point of view we identify especially the business in the field of transport, where an 80% of SMEs state that the development of plans is not a commonly practiced activity. SMEs in the field of trade and commerce are also not usually developing plans in most cases (66.24%), especially when referring to the short-term ones.
Annual plans are developed by a rather small number of enterprises. As seen in the table below, those that most often opt for these are enterprises in the field of industry and construction, the proportions being 47.26% and 47.56%.
Beyond these aspects, strategies developed for a period of 3-5 years are popular among enterprises in tourism, where we note the highest percentage - 18.18%, while shipments or trade prove to be areas where few SMEs develop their medium-term strategy (1.54% in the first case, ie 4.30% in the second).

70
Table 3 Elaboration of strategies Industry Constructions Commerce Tourism Shipments Services
Plans are not developed
45,66% 40,24% 66,24% 41,56% 80,00% 52,03%
There are developed annual plans and forecasts
47,26% 47,56% 29,46% 40,26% 18,46% 42,80%
Strategies for a period of 3-5 years
7,08% 12,20% 4,30% 18,18% 1,54% 5,17%
(source: The White Chart of SMEs, CNIPMMR, 2012)
Table 4 – Elaboration of strategies Microenterprises Small
enterprises Medium
sized enterprises
Plans are not developed 61,46% 30,53% 15,38% There are developed annual plans and forecasts 34,35% 56,11% 64,62% Strategies for a period of 3-5 years 4,19% 13,36% 20,00%
(source: The White Chart of SMEs, CNIPMMR, 2012)
The development and implementation of strategies are closely related to "the competitiveness of SMEs" (according to the White Chart). As a result, we identify that a prerequisite for the development of organizational performance is the process of forecasting and analysis based on the dimensions of SMEs reveals the idea that in most МКses,ăeТtСerătСeвăНon’tăelКborКteăplКnsăorăstrКtegТesă(forămТМroă - 61 46%) or these are developed in short time intervals (56.11% of small enterprises, 64.62% of medium sized enterprises). In a few cases (4.19% of micro-enterprises, 13.36% of small businesses and 20% of medium sized enterprises) being developed strategies on a range of 3 to 5 years. Experts mention "an acute necessity for strategies, policies and plans", reasons or causes ranging from one case to another.
Overall, 55.40% of SMEs do not consider developing plans, while 38.54% opt for annual strategy and 6.06% for a strategy on a term between 3 and 5 years.
Figure 2 Development of strategies in SMEs
(source: The White Chart of SMEs, CNIPMMR, 2012)

71
Objectives formulated by small and medium sized enterprises are different, the
most numerous - 46.95% wanting to keep their business at the current level, while 45.40% are opting for a moderate development of it. A rapid expansion, as seen in the chart above, is covered only 3.41% of SMEs, while reducing the size of the business is taken into account for 2.09% of cases. 1.54% of entrepreneurs consider giving up the business aspect, while 0.61% have opted for sale.
Figure 3 Development of strategies in SMEs
(source: The White Chart of SMEs, CNIPMMR, 2012)
4. CONCLUSIONS
Planning is perhaps the most important of functions, serving to predict the evolution of "the conditions under which economic system will be socially driven and state, behavior and functioning hence the expression of forecast management, strategic".
The importance of forecasting tool also includes: - Determining the main objectives, resources and means necessary for accomplishments; - Preparation of solutions that make it possible to adjust (correct) the extent of its realization; - Determination in advance of the problems that people will face in the future.
REFERENCES BrКnКșМoăNКtКlТК,ă(2007)ăMКnКgementulăîntreprТnНerТlorămТМТășТămТjloМТТă– note de curs Bucurean Mirela, (2005) Perspectivele IMM-urТloră НТnă RomсnТКă Тnă Мonteбtulă Тntegr rТТă înă
UnТuneКăEuropeКn ,ăAnКleleăUnТversТt țТТăНТnăOrКНeК NТМolesМuă LumТnТțК,ă PopesМuă Irina, Nicolescu Ciprian, (2013) Romanian SMEs during the
Crisis: economic results and perceptions, Revista Management, vol 8, nr. 1 PîslКruă DrКgoșă (МoorНonКtor),ă MoНreКnuă IleКnК,ă (2012),ă ContrТbuțТКă IMM-urТloră lКă МreștereКă
eМonomТМ :ăprezentășТăperspeМtТve,ăEНТturКăEМonomТМ :ăBuМurestТ RКportulă FunНКțТeТă Postă PrТvКtТzКreă prТvТnНă seМtorulă IMMăНТnăRomсnТКă (2013),ăFunНКțТКăPostă
Privatizare CNIPMMR (2012), CКrtКăКlb ăКăIMM-urilor din România/The White Chart of SMEs www.immromania.ro

72
MIGRANT POPULATION IN THE EUROPEAN UNION
Florin FRANT 1
ABSTRACT About 1.8 million young non-EU-born migrants and about 300 young EU-born
migrants are at risk of poverty or social exclusion. Altogether, 12 million foreign-born people are at risk of poverty or social exclusion, making up about 11% of the total number of 111 million at the EU level.
KEY WORDS: poverty, exclusion, migrant, projects. JEL: J60, J61, J62, J68
1. INTRODUCTION
The research note provides an analysis of the extent of poverty and social exclusion among the migrant population and the characteristics of those concerned with a particular focus on young migrants. It analyses the occurrence of risk-of-poverty, material deprivation and low work intensity and explores the factors underlying the higher risk of poverty experienced by young migrants including educational attainment, work intensity and household composition.
The analysis is based primarily on the EU-SILC and defines migrants in terms of their country of birth distinguishing between those born in another EU country and those born outside the EU. Our focus is on the situation of migrants in their recipient country, thus we do not address the issues related to the sender country, including the issue of remittances. We explore the social exclusion of the migrants themselves and do not address the impact of the presence of these migrants on the domestic labour market. We focus only on migrants present in the country of residence, and not on potentially other family members elsewhere.
For the purpose of this analysis we selected a few EU countries which have a large enough sample size for the young migrant population, defined here as those aged between 18 and 29, in the EU-SILC. This enables us to give an overview for the group concerned in thirteen EU Member States, namely Belgium, Germany, Ireland, Greece, Spain, France, Italy, Cyprus, Luxembourg, Austria, Finland, Sweden and the United Kingdom. In our in-depth analytical sections we focus on the social exclusion and labour market characteristics in Belgium, Germany and the United Kingdom, and the wealth of migrants in Germany, Italy and Luxembourg.
1 AssoМТКteă Professor,ă FКМultвă ofă SoМТКlă SМТenМe,ă “EftТmТeMurgu”ăUnТversТtв,ă ResТța, România, email: [email protected]
73
2. MIGRANT POPULATION IN THE EU The size of the migrant population, defined as persons who are foreign-born, is
largest in Germany, the United Kingdom, France, Spain and Italy which together make up around two-thirds of all migrants in the EU. In terms of relative size, Luxembourg has the highest share of migrants (32%) among EU countries. Migrants also comprise a relatively high share of the total population in Austria, Belgium and Sweden with over or close to 15%.
In France, most migrants come from outside the EU, mainly from Maghreb countries, and to a smaller extent from sub-Saharan countries (from former French African colonies) (OECD 2012). Algerians are still the largest migrant group followed by those of Portuguese and Moroccan origins. A relatively large Moroccan population lives in Belgium as well. Largely concentrated in Brussels they make up 12% of the migrant population.
The French and Dutch population stand in second and third position with 175 thousand and 126 thousand persons respectively. They are followed by migrants born in Turkey whose number is close to 100,000. In Germany, the largest migrant group is of Turkish origin followed by migrants born in Poland and Italy. In Germany, 8.2% of residents are not citizens, and a large majority of these have arrived on the grounds of family reunification (typically from Turkey) or as ethnic German repatriates, ‘SpтtКussТeНler’,ă(fromătСeăRussТКnăFeНerКtТon).
AustrТК’să lКrgestă non-EU migrant group comes from countries of the Former Yugoslavia while in Italy and Spain Romanians dominate and in Greece those with Albanian, Bulgarian and Romanian origin. Of the ten countries, Luxembourg is the only one where EU-born migrants outnumber that of those born outside the EU due to the large number of its Portuguese, French and Belgian residents.
After 2004 the numbers of migrant workers from the new EU Member States increased, especially from Poland. In the United Kingdom, they now form the third largest migrant group after those of Indian and Pakistani origins.
The United Kingdom, together with Sweden, was the only country not to impose temporary restrictions on the ability of people from the new Member States to enter and take up employment. Most migrants in Sweden come from neighbouring Finland, however since the early 1970s migration consisted mainly of refugee migration and family reunification from non-EU countries in the Middle East and in the 1990s from the Former Yugoslavia. Migrants born in Iraq are the second largest group in Sweden (122 thousand or 9% of the total foreign-born population). By far the largest migrant populations in neighbouring Finland are those born in Sweden (31 thousand) and Estonia (25 thousand).
It is important to bear in mind that the definition of migrants by country of birth may not capture ethnic differences per se. Some of those born outside (and so regarded as migrants according to our definition), however, may have been living in the country for many years and partly because of this, some of the foreign born population may not beăregКrНeНăКsă“mТgrКnt”ăbвănКtТonКlăgovernments.ă

74
3. DEFINITION AND MEASUREMENT OF MIGRANTS IN THE EU-SILC SURVEY
The definition of migrants adopted is based on country of birth (grouped into EU
or non-EU countries) and has, in addition, a household dimension, in the sense that migrants are defined as those who live in households where all adult members were born outside the country of residence. This enables us to attribute migrant status to children in the household, as there is no information on their country of birth in the dataset. Note that this definition of migrants includes those who have acquired citizenship in the meantime.
This definition based on country of birth is preferable to the alternative, citizenship-based definition. Problems in comparing migration data based on nationality (citizenship) stem from the different rules and requirements which govern the acquisition of citizenship in different countries.
The measurement of migrants is somewhat limited on the basis of the EU-SILC survey for various reasons. Conceptually, the current EU-SILC question only explores the stock of migrants, with no information on how long they have been in the country. In addition, there is no information on ethnic status of respondents.
InăКННТtТon,ătСeăМКtegorТzКtТonăofătСeămТgrКntăgroupsăТntoă“EU-born”ăКnНă“non-EU-born”ă Тsă rКtСeră broКН:ă КnНă tСeă groupsă НТstТnguТsСeНă tooă lКrgeă КnНă Сeterogeneous,ăthough sample sizes would need to be much larger for any more detailed breakdown. The number of observations per country, therefore, especially for those born in another EU Member State, is very small in most countries.
Furthermore, migrants are not distinguished by country of birth in Germany, Estonia, Latvia, Malta and Slovenia, where all migrants are grouped together (under the МКtegorвăofă“non-EU-born”ămТgrКnts).ă
The EU-SILC 2010 used in this analysis covers 27 countries. Total sample size is 548,869, and 76,537 for those aged 18-29. The number of observations for this age group is 1,720 for EU-born migrants and 3,159 for those born outside the EU. Observations vary between 25 (Denmark) and 600 (Luxembourg) for EU-born migrants, and between 26 (Czech Republic) and 442 (Spain) for non-EU-born migrants.
In order to ensure that our estimates for young migrants are robust enough only countries with larger sample sizes were selected. These include Belgium, Germany, Ireland, Greece, Spain, France, Italy, Cyprus, Luxembourg, Austria, Finland, Sweden and the United Kingdom.
4. POVERTY AND SOCIAL EXCLUSION AMONG THE MIGRANT
POPULATION – AN OVERVIEW
In 2010, 10 million non-EU migrants and 2 million EU migrants were at risk of poverty or social exclusion in the EU. This implies that altogether 11% of the total population who are at risk of poverty or social exclusion have a migrant background, dominantly with a non-EU country of birth (9%). This indicator is one of the eight headline indicators of the Europe 2020 Strategy, and includes individuals who are either at risk of poverty, or live in households with low work intensity or in severe material deprivation 19 million young people (aged 18-29) are at risk of poverty of social exclusion, out of which 300 thousand are EU-born and 1,8 million are non-EU born,

75
thus altogether 11% have a migrant background (2% and 9%, respectively). These ratios are similar to those observed for the whole population.
The size of migrant children at risk of poverty and social exclusion is also significant, reading 2.7 million among non-EU born migrants.
32.2% of young non-EU born migrants are at risk of poverty, in other words one out of three of them are affected . 19% of EU-born young people are at poverty levels of income, which is only slightly higher than for the native-born age group.
In all age groups, the at-risk of poverty rates are significantly higher among the foreign-born population, especially those who were born outside the EU. Children in families with non-EU migrant parents have the highest risk of poverty, reaching 41%. Material deprivation affects non-EU migrant young people more than natives (13.9% vs 9%), but the relative disadvantage is smaller than in case of poverty. Interestingly, EU-born young migrants tend to be less exposed to severe material deprivation than the native-born population.
5. CONCLUSIONS
About 1.8 million young non-EU-born migrants and about 300 young EU-born migrants are at risk of poverty or social exclusion. Altogether, 12 million foreign-born people are at risk of poverty or social exclusion, making up about 11% of the total number of 111 million at the EU level. About one out of three non-EU born young migrants live in a household at risk of poverty.
Our analysis of the wealth of the migrant population focussed on three countries, including Germany, Italy and Luxembourg. In Germany, young migrants have about the same level of total assets than natives, but about 1.5 as many debts. In Italy, both the total assets and the total debt of young migrants remain much below that of the young native population. In Luxembourg, EU-born young migrants have about half as many total assets and less than half as many total debts than natives. Young non- EU migrants have only less than a quarter of the total assets of young natives, but they seem to keep debts to a minimum in Luxembourg.
The at-risk-of-poverty rate of non-EU-born is likely to be over 40% in Belgium and France and reaches 30% in Luxembourg, Sweden, Austria, Greece, the United Kingdom and Spain. Cross-country differences of severe material deprivation are much greater than shown for the risk of poverty. While in some countries, there is no robust evidence for the occurrence of severe material deprivation among young migrants, in Greece about one in three young migrants are affected.
In our analysis of the risk of social exclusion and poverty we focussed on Belgium, Germany and the United Kingdom. In Belgium, young migrants born outside the EU face an alarmingly high poverty risk (49%). They are strongly affected by severe material deprivation (28%). Young no-EU born migrants (aged 25-29) born outside the EU have a significantly lower employment rate than those born in the country. They tend to have a lower level of educational attainment, although a relatively high share is in education (12%), surpassing the similar ratio of native-born aged 25-29 (2%). Migrants are particularly vulnerable to being among the working poor in Belgium, since they tend to combine various adverse characteristics, such as working in low-skilled jobs with low rates of pay and living in single-earner households (Van Gyes 2010).

76
There is a stark contrast between those third country nationals who migrate on the basis of a work permit and those who settle down permanently, and the inactivity rate is much higher among the latter group (Mussche, Corluy and Marx 2010). Whereas third-country work permit migrants and third-country posted workers are predominantly highly skilled and working in highly skilled jobs, third-country settlers work in sectors that tend to require less skills at large. They found evidence of overqualification as well.
Belgium has no mandatory integration measures for migrant workers (Mussche, Corluy and Marx 2010). The different communities in Belgium (French-speaking Community, Flemish Community and German-speaking Community) are responsible for policies regarding the integration of immigrants.
In Germany, the estimated at-risk-of-poverty rate of foreign-born young migrants ranges between 22% and 36% with a 95% confidence. Their relative disadvantage is particularly strong in case of severe material deprivation, with a rate of 13%, which is over twice as high as for native-born young people (5%) or the migrant population as a whole (6%).
The German integration policy involves a number of Ministries, but it is coordinated by the Federal office for Migration and Refugees (BAMF), a division between the Federal Ministry of Interior (BMI) (Collett 2011). In addition, there are a number of policies on the level of regions (Länder). The budget for BAMF integration spending has been shielded from cuts.
Young migrants are more likely to have primary education (31%) and tertiary education (21%) than the native-born cohort group.
Foreign-born young people are more likely to be married (36% vs 12%) and less likely to live alone. Over 4% of the young native-born population lives in the same household with at least one foreign-born people. Over half of foreign-born young people tends to live together with other foreign born migrants.
Mixed marriages are not so common in Germany, as shown by data from the 2011 micro census. Migrants tend to marry migrants: most of them are married either to a German with a migrant background (35%) or to a foreign citizen (40%). Only 20% has a spouse without a migrant background. The same pattern holds for first generation migrants, of whom only 19% lives in mixed marriage. Second generation migrants are more likely to live in mixed marriage: 29% is married to a German citizen without a migrant background.
The United Kingdom was strongly affected by the economic recession. Youth unemployment reached 22% in 2011. Non-EU born young migrants face a relatively high poverty risk, both compared to the native-born young population, and to the whole of non-EU born migrants. They have a high probability to live in households with low work intensity (26%), and have a lower employment rate. On the other hand, young non-EU migrants are more likely to high education than natives (36% vs 29%). Young migrants are over twice as likely to be married than natives.
The UK education appears to perform well in terms of integrating migrant students. The performance gap between native and migrant students is relatively narrow, particularly in the case of second generation migrant student whose average reading score is very close to that of native students.
The UK The government implemented severe cuts in public spending. As a result, several core integration programs, community cohesion programs were terminated. Local governments and NGOs were pushed to find alternative sources of funНТngă unНeră tСeă flКgsСТpă ofă “BТgă soМТetв”,ă аСТМСă МКllsă foră greКteră МommunТtвă

77
activism. The impact this laissez faire concept and the related changes are yet to be assessed.
REFERENCES Collett, E. (2011). Immigrant integration at the time of austerity. Washington, D.C.: Migration Policy Institute Corluy, V., I. Marx and G. Verbist (2011). Employment chances and changes of immigrants in Belgium: the impact of citizenship. International Journal of Comparative Sociology. Lelkes, O., E. Zolyomi (2008). Social inclusion of migrants and their 2nd generation descendants.Research Note of the Social Inclusion and Income Distribution network of the European Observatory on the Social Situation and Demography. 3/2008. Downloadable at: http://www.socialsituation.eu/research-notes/RN03_2008_Migrants.pdf. Access date: December 2012 Mussche, N., V. Corluy Vincent and I. Marx (2010).Satisfying labour demand through migration in Belgium. Brussel: European Migration Network OECD (2012).International Migration Outlook 2012. Paris: OECD Van Gyes, G. (2010). Working poor in Europe – Belgium.Published on-line for the European Working Conditions Observatory. Downloadable at: http://www.eurofound.europa
78
DIFFERENTIATIONăOFăTHEăFIRM’SăOFFERăONăTHEăMARKETă
Liliana GHERGHINA 1
ABSTRACT The present paper presents the importance of a firm’s offer and supply differentiation
on the market. Practice has shown that the differentiation of the firm’s offer and image is realised by the consumer, both leading to a favourable positioning on the market. An important contribution for differentiation is represented by the promotional effort the firm realises in order to acquire a favourable image.
The differentiation of the firm’s products / services supply on the market is one of the objectives of the product policy, appearing as the effect of their characteristics, as well as of the intangibility of services, as it is imposed by the necessary of a distinct representation in relation with similar products. The communication on the target market of the firm’s differentiation supply, in relation with the competing firms, will also modify the consumer purchasing behaviour.
KEY WORDS: instrument, differentiation, supply, firm, market. JEL: M3, M3
1. INTRODUCTION At present the firms, through the high-performance marketing compartment
carries on numerous programmes of research and information to identify and МompreСenНă tСeă Мonsumers’ă neeНs,ă НesТresă КnНă request.ă Ină tСТsă respeМt,ă tСeă fТrms’ămanagement must appoint, by written decision, the competent personnel in view of periodically effecting, in its work points, investigations and observations of the Мonsumers’ behaviour in relation with the products/services offered for sale on the mКrket.ăMКnвă Кă tТmeă tСeă Мonsumers’ă neeНs,ă НesТresă КnНăНemКnНsă Кreă sКtТsfТeНă bвă tСeămarketing offer and supply existing in the firm.
Most offerors are mistaken when they grant a higher attention to the products or services they offer than to the advantages and experiences offered by them. The offeror often forgets that a product/service is only an instrument meant to solve one of Мonsumers’ă problem.ă Ină tСeă lТterКtureăаeă reКНă tСКtă tСeă Мompany „in a comprehensive meaning, means the economic unit of production, service providing or commerce aiming at covering the market demand and earning a profit”ă(SКvКăC.,ăLКzoМăR.ă(2001),ăp. 7). „Intelligent market operators look beyond the characteristics of products and services they sell. By orchestrating several services and products, they create brand experiences for consumers. What consumers really want are offers meant to numb their senses, soften their heart and stimulating their mind, according to an expert. They want experience-providing offers”ă(Kotler.ăPС.,ăArmstrongăG.ă(2008),ăp.ă7).
For the firm to be successful on the market, it has to find elements for differentiating the products by specific ways in order to benefit from competition advantКges.ăTСeăfТrm’săКНvКntКge,ăТnărelКtТonăаТtСătСeăМompetТngăfТrm,ăТsăreКlТseНăаСenă 1 AssТstКntă LeМtureră PСDă LТlТКnКă GСergСТnК,ă FКМultвă ofă EМonomТМs,ă UnТversТtвă “EftТmТeă Murgu”ă ofăReşТ К,ăăRomКnТК,ăl.gСergСТnК@вКСoo.Мom

79
the firm launches a product/service on the market able to offer something: better, newer, faster and cheaper.
2. ELEMENTS AND INSTRUMENTS FOR THE DIFFERENTIATION
OF THE FIRM ON THE MARKET Elements for the differentiation of the firm’s offer on the market
The product / service is the most important element of the market supply, and that is why a marketing study is crucial. The marketing study must be oriented in four direМtТons:ă„consumers, competition, distribution and macro-environment,”ă(FolteКnăF.,ăL НКrăL.ă(МoorН.),ă(2007),ăp.ă138).ăBКseНăonătСeămКrketТngăstuНвăoneămustăelКborКteătСeămarketing mix having as first stage the formulation of an offer meant to satisfy the tКrgetă Мonsumers’ă neeНsă oră НesТres.ăTСeă proНuМt/servТМesă offereНă bвă tСeă proНuМersă „is the most relevant connection of the firm with the market”ă (C toТuă I.,ă TeoНoresМuăN.ă(2004), p. 51). The potential consumer will analyse the offer, depending on: 1. characteristic attributes and the product quality; 2. services mix and quality; 3. price. „The products differentiation represents a process by which it is imprinted distinctive elements, meant to bring the customer additional benefits, that he has to perceive as such, following the comparison with others from the same category ”(NegruțăC.,ăOКnМeКăM., (2005), p. 78). „When the consumer decides to purchase a certain product, he formulates certain expectations to the respective product, expectations which, in relation with the cost of products purchase, generates the value expected by the consumer”ă(FolteКnăF.,ăL НКrăL.ă (МoorН.),ă (2004),ăp.ă 14).ă→СenăplКnnТngă tСeămКrketăoffer,ă tСeămКrketerămustărealise a hierarchy of the value for the customer, distributed along five product/service levels. By each level additional value is added to the customer.
The first level is primordial, as it represents the basic advantage, more precisely the fundamental services or goods the customer purchases. For instance, the tourist of a guesthouse purchases sleep and rest. On the second level, the marketer must turn the basic advantage into a basic product. For instance, the room of the guesthouse where the tourist is sheltered must be aired, luminous, equipped with bed, table and chairs, wardrobe, peg, and the bathroom must have towels, toilet, shower cabin, sink and glass. On the third level, the marketer creates an expected product that must have a set of attributes and conditions the consumers expect, when they acquire the product or service. To go on with the example of the guesthouse tourist, he expects to find a larger room, a larger bed, TV in the room, clean towels in the bathroom and much peace in the guesthouse perimeter. If these minimum requirements are not met, the tourist will choose another guesthouse in the future. On the fourth level, the marketer creates a guaranteed product,ă аСТМСă eбМeeНsă tСeă Мustomers’ă eбpeМtКtТons.ă Ată present,ăcompetition plays an essential part on the fifth level, more precisely the product augmentation. „TСeă proНuМtă КugmentКtТonă leКНsă tСeă mКrketeră toă tСeă КnКlвsТsă of the users’ă consumption system: the way in which the user effects the operations of obtaining and using the product, plus the afferent services”ă(KotlerăPС.ă(2006),ăp.ă529-530).
Instruments for the differentiation of the firm’s supply on the market Immediately after the communication on the target market of the firm’s
positioning, the purchase behaviour for the products/services supplied by the firm. An ТmportКntăroleăТnătСeăfТrm’săposТtТonТngăonătСeămКrketăТsăoММupeНăbвătСeăădifferentiation

80
of products in relation with the competition. As the market is permantenly penetrated by new products/services with a higher relevance or value, the differentiation can be applied to all new products/services offered by the firm for a limited period of time. The market strategy „indicates the attitude and conduct of the company to the aspect, requirements and trends of the market evolution.”ă(FloresМuăC.ă(1997),ăp.ă123).ăFor the differentiation of products/services on the market be perceived by consumers, the following criteria must be met: - “Important. The difference supplies an advantage very cherrished by a sufficiently large number of purchaser. - Distinctive. The difference is supplied in a distinctive mode. - Superior. The difference is higher than other ways of earning the advantage . - Limitative for competitors. The difference cannot by easily imitated or copied by МompetТtors”ă(Kotler Ph. (2006), p. 530).
According to the strategies of the global product a criterion for the products/services differentiation is realised depending on the positioning of products/services on the market, by types of strategies as follows: strategy of positioning on a target market, strategy of positioning depending on price and quality, strategy of positioning depending on a class of products and strategy of positioning depending on competitors.” (Gherghina L. (2014), p. 79). Ină orНeră toă reКlТseă Кă fТrm’săsupply differentiation on the market, the marketer should take into account five variables: product, services, staff, distribution channel and image. When performing the differentiationă ofă theă firm’să supplyă byă product, one should analyse the main particularities of product / service, as follows: characteristics, performances, degree of conformity, sustainability reliability, reparability, style and design. The characteristics of the product/service represent the totality of attributes meant to highlight the firm, ranging from its basic products to the additional products by which new consumers may be attracted. Products/services are found on one of the four known levels of performance: low, medium, high and superior. The firm must achieve Кă levelă ofă performКnМeă optТmumă foră tСeă tКrgetămКrket,ă МompКreНă toă tСeă МompetТtors’ăperformance levels. In order to enhance the performance of a product/service, the following quality strategies must be used: - strategy of product/service permanent improvement - practised if the best markets shares and the highest efficiencies can be ensured; - strategy of keeping the products/services quality on a given level - used when no obvious problems or new opportunities occur on the market; - strategy of time reduction of products/services qualities - КpplТeНăonlвăаСenătСeăfТrms’ăproducts/services are in the decline stage, they intentionally reduce quality to МompensКteă tСeă groаtСă ofă ă Мosts.ă TСeă fТrm’să mКnКgementă supposesă tСКtă pКrtă ofă tСeăconsumers do not remark the difference between quality and price. Practising this strategy risks to have long-time negative effects for the firm. The conformity degree is represented by the product/service features, in other words if they are identical and observe the set specifications. Durability is a very important indicator as it expresses the product operation duration, in normal or special conditions, and it is different depending on the category. For instance, in case of products with higher durability this means also an additional cost, found in the purchase price paid by consumers. Reliability is the indicator by which one details the period of guaranteeing the product operation in optimum conditions, benefiting from guarantees from the part of the producer. Reparability is given by the easiness and speed by which

81
a product is repaired. Style and design represent respect and impression perceived by the consumer; as style is the distinctive characteristic of the product/service, it is difficult to imitate, meaning that the fiercer the competition, the more changes the design is subjected to, so that the products/services could be more attractive.
Differentiation ofăaăfirm’săsupplyăbyăservices plays an important part when the product cannot be readily identified on the market. Obviously the optimum solution is to introduce several types of services, through which value and performance may be added, by improving their quality. Thus, services differentiation may be done by: mode of order delivery, equipment installation, staff training, consulting to customers, as well as repairs, maintenance services etc.
Differentiationă ofă firm’să offeră throughă staffă is done based on emploвees’ătrКТnТng,ă аСТМСă representsă Кă МompetТtТveă КНvКntКgeă onă tСeă mКrket.ă ă „Betteră trКТneНăemployees have six distinct characteristics: competence, courtesy, credibility, seriousness, receptivity, communication skills”ă (LeonКrНă A.,ă Berrвă A.,ă PКrКsurКmКn (1991), p. 417).
As for the two other variables, i.e. differentiation by distribution channel and image,ă tСeвăСКveăКnă ТmportКntă roleă Тnă tСeăМustomer’săМСoТМeăofă tСeăfТrm’săsupplв.ăAllăfirms have the possibility to get differentiated from one another by the way they design their distribution channels. In this respect, we appreciate that for the consumer what is important is, on the one hand, the degree of market covering, and on the other hand the channels experience and performance. If we desire that the fТrm’săimage remains fixed for a longer period of time in the consumer memory, the firm should be promoted by all communication channels, meant to transmit: a positive affirmation, a story or a piece of information about a novelty in relation with competition. By promotion one does not guarantee the immediate success of the firm as the consumers' reactions are different in relation with the marketing instruments used by the company.
3. CONCLUSIONS
At present, most firms offer many products/services on the market out of the desire that they have the longest life possible in order to generate a decent profit. Although the provided products / services will be sold for a determined period of time, the firm will fight to cover the investments and risks necessary to their production and sale. That is why managers should be aware that any product/service on the market, irrespective on its nature, will also have a finite life cycle.
TСeămКrketer’să roleă Тnă Кă fТrmă Тsă verвă ТmportКntă beМКuseă Кă serТesă ofă ТnfluentТКlăfaМtorsă КppeКră onă tСeă mКrketă relКteНă toă МompetТtТon,ă Мustomer’să neeНs,ă НТstrТbutТonăchannels or even technology. The marketer should possess information about the market evolution and to proceed to the change of a product/service positioning.
The firm should not focus on a single product/service, on the contrary, it has to seeătСeăbТgăpТМtureăofătСeăentТreămКrket.ăInătСТsărespeМt,ăКăНТfferentТКtТonăofăКăfТrm’săofferăon the market should be done, adopting thus a series of differentiation strategies relying on the advantages and experiences offered by the product/service, meant to lead to Мustomers’ăsКtТsfКМtТon.

82
REFERENCES C toТuăI.,ăTeoНoresМuăN.ă(2004),ăConsumer behaviour, 2nd edition revised and completed (in
Romanian), Uranus Editions, Bucharest. Florescu C., (1997), Marketing (ТnăRomКnТКn),ăEНТtТonsăInНepenНen ăEМonomТМ ,ăPТteştТ. FolteКnăF.,ăL НКrăL.ă(МoorН.),ă(2007),ăMarketing (in Romanian), Mirton Editions, TТmТșoКrК. FolteКnăF.,ăL НКrăL.ă(МoorН.),ă(2004),ăMarketing – syntheses and applications (in Romanian),ăMТrtonăEНТtТons,ăTТmТșoКrК. Gherghina L. (2014), Marketing researches: syntheses and case study (in Romanian), Eftimie
MurguăUnТversТtвăPress,ăReșТțК. Kotler Ph., Armstrong G. (2008), Marketing principles, 4th edition (in Romanian), Teora
Editions, Bucharest. Kotler Ph. (2006), Marketing management, 4th edition (translated into Romanian), Teora
Editions, Bucharest. Leonard A., Berry A., Parasuraman (1991), Marketing Services: Competing Through Quality,
The Free Press, New York. NegruțăC.,ăOКnМeКăM.,ă(2005),ăMarketing basics (in Romanian), Solness Editions, TТmТșoКrК. Sava C., Lazoc R. (2001), Economy of tourism company(in Romanian), Brumar
EНТtТons,ăTТmТșoКrК.ă

83
THE IMPORTANCE OF IMAGE AND COMMUNICATION OF A BRAND OR TRADEMARK POSITIONING
Liliana GHERGHINA 1
ABSTRACT The present paper was elaborated in order to highlight the importance of a brand
image in the consumer’s perception, being considered more than a marketing instrument due to the components it possesses. Based on the marketing researches conducted, meant to collect information for determining its value and efficiency, one can sketch the perceptual map of the brand or trademark image. The most favourable positioning of a brand is done when the firm promotes for the market maximum two characteristics with the highest importance for consumers. The communication of a brand positioning should refer, on the one hand, on the forwarding of the current position, and on the other hand the repositioning of competition in consumers’ minds.
KEY WORDS: brand, trademark, image, positioning, communication, consumer JEL: M3, M3
1. INTRODUCTION In accordance with the specialty studies and legislation in vigour, it is known
tСКtătСeăbrКnНăorătrКНemКrkăТsăpКrtăofătСeăfТrm’săpКtrТmony, and since the moment of its registration with the State Office for Inventions and Trademarks (OSIM), verification and publication in the trademarks bulletin, the firm has the right of ownership and exclusivity on its use. The trademark protection is guaranteed to the firm by OSIM for a 10-year period since the date of issue of the certificate of trademark ownership. The request for the trademark or brand protection should be renewed every 10 years. The trademark can be used for an unlimited period by the firm without being registered with tСeăOSIM,ăonlвă Тnă tСeăRegТsterăofăCommerМeă Тnă tСeă fТrm’săСeКНquКrtersă Мountв.ăTСТsădoes not reserve the firm the exclusivity right on the trademark use. All type of brands, once registered to OSIM will be verified for maximum 9 months in the country, in the EU and in the world, so that no similar registered trademarks exist. If it is found that in the period of brand verification a similar brand or trademark already exists and is registered and protected, the owner who demands the name of the brand will be asked to choose another name. In the period of verification still, any brand owner may reserve the right of opposition, if he does not agree that at least 4 letters in the trademark are found in the newly registered brand.
According to the American Marketing Association, a trademark or a brand may beăНefТneНăКsăfolloаs:”a trademark or a brand is a name, a term, a sign, a symbol, a drawing or a combination thereof, aiming at identifying the goods or services of a seller or a group sellers and at the differentiation of these goods or services from the competitors’ services. Consequently a trademark or a brand identifies the seller or producer”ă(KotlerăPС.ă(2006),ăp.ă543).ă
1 AssТstКntă LeМtureră PСDă LТlТКnКă GСergСТnК,ă FКМultвă ofă EМonomТМs,ă UnТversТtвă “EftТmТeă Murgu”ă ofăReşТ К,ăRomКnТК,ăl.gСergСТnК@вКСoo.Мom

84
If a combined trademark is registered, protection is offered only on the brand name and revendicated colours, but no protection is offered on the symbols graphically presented in the brand. We recommend that the name of the new trademark registered by a firm contains: name of firm and field of activity. For instance, a brand used in security and protection services may bear the name: Zenprotect – security and protection.
2. PSYCHOLOGICAL IMAGE AND COMMUNICATION OF A BRAND
POSITIONING Psychological image of a brand positioning From the specialty studies it is known that the psychological image of a brand,
product or firm represents a set of representative elements, convictions and emotions that may condition its existence, as well as the decision in the manner of manifestation ofăМonsumers’ăpreferenМes. The consumer behaviour is based on elementary processes, suМСă Кs:ă perМeptТon,ă ТnformКtТon,ă КttТtuНe,ă motТvКtТonă КnНă effeМtТveă beСКvТour.ă ă „The process of information/learning represents a set of elements enabling individuals to get acquainted to the products”ă(C toТuăI.,ăTeoНoresМuăN.ă(2004),ăp.ă18).
Image is represented by the way in which consumers think, understand and feel all the elements of the trademark contributing to its perception. Thus a brand may be considered more than a marketing instrument as it has a name, a logo, a colour МombТnКtТon,ă Кă slogКnă oră Кă sвmbol.ă „Psychological differentiation ensures a clear identity to the brand on the consumer’s market and location.”(FolteКnă F.,ă L НКră L.ă(coord.), (2007), p. 114). From the literature it is known tСКtă„a company is considered the basic cell of economy”(SКvКăC.,ăLКzoМăR.ă(2001),ăp.ă7),ăКnНăКă„brКnНăorătrКНemКrkărepresentsăТnăessenМeăКămКrketer’săpromТseătoăМonstКntlвăsupplвătСeăpurМСКsersăКăМertКТnăset of characteristic attributes, advantages and services. The marketer should consider he offers the customer a contractual commitment about the way in which the brand will fulfТlă Тtsă performКnМeă promТse.”ă (Kotleră PС.ă (2006),ă p.ă 546).ă Ină tСeă brКnНă purМСКseădecision there are always objective, functional and economic reasonsings, as well as awareness factors that may be encountered in the process established between the brand personКlТtвă КnНăМonsumerăpersonКlТtв.ă ă “TСeă ТmКgeăНesТgnКtesă tСeă setă ofămКterТКlă КnНăimmaterial representations that a group of individuals or a single individual has in relation with a product, firm, brand etc. Image appears in a treble hypostasis: perceived image, desired image and supposed image”ă (Feketeă I.ă (2001),ă p.ă 40).ăThe perceived image corresponds to the main representations in relation with the brand characteristics, presented at a certain moment within a population. As regards the desired image, it should correspond to the set objectives related to the respective product or brand, and the supposed image is the personal perception about the image we consider existing in the exterior.
The perceptual difference between the three types of images originates in the marketing research regarding the brand image, as well as in the solutions of positioning or repositioning of the brand products. In order to study the consumer behaviour we must draw a map of perceptions with a rich content in images of competing brands, for different products and attributes thereof. A correctly elaborated map of perceptions allows the identification of market segments and of the desired positioning. The literature has shown that the perceptual map can be elaborated both by composition, and by decomposition. On the perceptual map, the brand image constitutes the basis of

85
negative or positive motivations of the purchase process. The brand image has a special importance for the firm, as it contributes to the increase of sales, turnover and profit.
InătourТsmă„publicity is used to promote the tourism product or company and in order to remind and strengthen the product image”ă (CostenМuă M.ă (2008),ă p.ă 59).ă„Brands represent the consumers’ perceptions and feelings in relation with a product and its performance – everything the product or service means for the consumer”ă(Kotler. Ph., Armstrong G. (2008), p. 340). Thus market brands are more than mere names and symbols.
Communication of a brand positioning Ină Кnвă orgКnТsКtТon,ă tСeă mКrketer’să roleă Тsă toă МorreМtlвă sellă tСeă НТfferentТКtТonă
ways of the organisation in opposition with its competitors. The differentiation measures adopted by a marketer should observe the brand differentiation criteria to create an advantage. These criteria should focus on: importance of brand characteristics for consumers, differentiation and superiority of the brand in relation with competition, brand novelty and accessibility, as well as communication and efficiency of the trademark or brand.
Law no. 84/1998 – regarding trademarks and geographic indications, published Тnă tСeă OffТМТКlă GКzetteă no.161/23ă ofă AprТlă 1998ă mentТons:ă „Trademark is a sign susceptible of graphic representation, serving to distinguish the products or services of a natural or legal person from those belonging to other persons. Trademarks or brands can be: words, including name of persons, drawings, letters, figures, figurative elements, three-dimensional forms and especially shape of its product and package, combination of colours, as well as any combination of these signs”ă (LКаă no.ă 84ă – regarding the trademarks and geographic indications (1998)).
As regards the brand communication strategy, it is applied depending on the brand type.ăFromătСeălТterКtureăТtăТsăknoаnătСКtăbrКnНămКвăbe:ă”functional brand, image brand or experience brand.”ă(KotlerăPС.ă(2006),ăp.ă562).ă
In general, consumers purchase a fundamental functional brand in order to satisfy a need for practical utility. Functional brands depend on the attributes of products or services they offer, as well as the practised price. They satisfy the need of consumer if they supply products or services with a higher performance than that of other brands. The image brand is used for the products or services whose quality may be appreciated with more difficulty, although they are difficult to differentiate, even if they may convey information about their user. The image brands are based on the one hand based on publicity creativity, and on the other hand on the large publicity budgets. The image brand strategies refer to the: elaboration of a trademark or brand design different from the competition (Zuzu dairy), brand association with celebrities (Armani suites), and creation of an eloquent publicity image (the Marlboro Man). In the case of experience brand, the consumer is involved in an endeavour by which one exceeds not only the mere purchase of a product or service. In time brands have kept developing. Thus, a firm may introduce: item line extensions, brand extensions, multiple brands, new brands, combined brands, trademarks and commerce brands.
BКlКureă↑ТrgТlăМlКТmsătСКt:ă„the manufacture or commerce brands should not be mixed up with the commercial name or the firm that operates the commercial activity. The name is unique for the entire company, whereas each of its products may be presented under a distinct brand” (Balaure V. (2002), p.125).
In the period of launching a new trademark or brand, so that it should be perceived rapidly by consumers and at the same time it has to easily penetrate the

86
market, it should be tested if: it is legible, easily pronounced and memorised, it may be easily evoked or refused at registration, it may be used abroad without changes.
For a correct positioning ofă tСeă brКnНă onă tСeă Мonsumer’să perМeptuКlămКp,ă tСeămarketer should take into account the following brand functions: the practical function, the guarantee function, the customising function, the ludic function, the specificity function, the distinctive function. The choice of a brand policy is imperiously necessary, especially in the relations between producer and distributor. The most important models of positioning strategies are those elaborated by Ries Al. and Trout J. and Treacy and Wiersema.
In the first model of positioning strategies, elaborated by Ries Al. and Trout J., it is specified that the most known products occupy a distinct place in the consumer’s mind. For example, consumers know that the largest company in the world producing soft drinks is Coca-Cola, and the state-of-the-art cars are produced by the German company Mercedes-Benz. “In relation with these organisations the competitors have three strategic alternatives at their disposal: strengthening of its position in the consumer’s mind, occupying a free position and repositioning of competition in the consumer’s mind. Ries and Trout mainly take care of the communication strategies for the positioning or repositioning of a brand in the consumer’s mind.”ă(KotlerăPС.ă(2006),ăp. 397). The authors mention that by positioning it is necessary that each tangible element of the marketing mix – product, price, placement and promotion - should support the chosen positioning strategy. The second model of positioning strategies elaborated by Treacy and Wiersema relies on the firm that intends to become a product leader, firms with operational excellence or customer-friendly firm. The two authors have reached the conclusion that although the market is made of a combination of three types of customers. Normally no firm can satisfy two or three segments of consumers at the same time . For each segment of consumers one needs a certain budget and a managerial vision that should not come in conflict with the others. So that positioning should be favourable, the firm must decide how many characteristics of the brand, product or service they promote for the target market. In most usual situations, great companies promote a single characteristic, being careful to observe this strategy. The employees are trained to promoted, by the marketing strategy, the characteristics that are important for consumers. The optimum solution is the promotion of two or maximum three features. In order to attract clientele and secure the leader positioning, promotion must be done by using the slogan tool, such as the best product / service, the fastest service, the most secure product / service, the best quality, the most advanced, the most prestigious or the lowest price. ”InăorНerătoăassess positioning, Kapferer proposes a checklist, taking in into account nine criteria: the criterion of compatibility, of need, of objectivity, of exhaustivity, of coherence, of means, of endurance, of cannibalism, of double-backing.”ă(Marcenac L., Nilon A., Saint. Nichel S. (2006), p. 119). Kotler Ph. Claims that it is best that any firm should avoid the four positioning errors: sub-positioning, super-positioning, confuse positioning and doubtful positioning. Subpositioning occurs when consumers are not well aware of the firm brand. Superpositioning is manifested in the conditions in which the brand image is limited in tСeă Мonsumers’ă mТnН.ă Confuseă posТtТonТngă oММursă аСenă tСeă brКnНă ТmКgeă Тsă Мonfuseăbecause of the number of advantages promoted or due to the excessive change of the marketing strategy practiced. The doubtful positioning occurs when consumers have doubts regarding the advantages promoted by the trademark or brand.

87
3. CONCLUSIONS
The brand has a remarkКbleăТmportКnМeăТnătСeăМonsumers’ămТnН,ăКnНătСКtăТsăаСвă
the marketer should analyse the psychological image of its positioning, as well as the positioning communication. Although the true value of a powerful trademark of brand is its capacity to capture consumers’ă preferenМeă КnНă fТНelТtв.ă TСeă МКpТtКlă ofă Кă brКnНărepresents the effect of positive differentiation of of the brand name awareness on the consumer reaction, in other words how willing consumers are to pay for its purchasing. A strong brand has a high capital value, enjoys a high degree of market awarenesse and of fidelity from the part of consumers.
Furthermore, a strong brand , by the prices practised, provides the firm the possibility of defence against excessive competition, as well as the necessary basis for the creation of profitable and close relation with the customers. One may say that the fundamental asseets at the basis of the brand capital is the clientele capital, i.e. the value of the relations with the customers the brand created. A strong brand is important in se, but what it truly represents is a profitable crowd of faithful customers. In the brand image promotion, publicity plays an important part, as it may influence the purchasing decision of a brand to the detriment of another. The psychological image of the brand may be created by periodical publicity campaigns, with a significant content of information, by which consumers may come in contact with the offered product or service.
REFERENCES Balaure V. (2002), Marketing (in Romanian) , Uranus Editions, Bucharest. C toТuăI.,ăTeoНoresМuăN.ă(2004),ăConsumer behaviour (in Romanian), 2nd edition, revised and
completed, Uranus Editions, Bucharest. Costencu M. (2008), Touristic marketing– syntheses, cases, tests (in Romanian), Eftimie
MurguăUnТversТtвăPress,ăReşТ К.ă Fekete I., 2001, Study of consumer behaviour (in Romanian), Eftimie Murgu University Press,
ReșТțК. FolteКnăF..ăL НКrăL.ă(МoorН.),ă(2007),ăMarketing (in Romanian), Mirton Editions, TТmТșoКrК. Kotler Ph. (2006), Marketing management (in Romanian), 4th edition, Teora Editions,
Bucharest. Kotler. Ph., Armstrong G. (2008), Marketing principles (in Romanian), 4th edition, Teora Editions, Bucharest Marcenac L., Nilon A., Saint.Nichel S. (2006), Publicity strategy: from the marketing study to
the selection of different media (in Romanian), Polirom Editions,ăIКşТ. Sava C., Lazoc R. (2001), Economy of tourism company (in Romanian), Brumar Editions,
TТmТșoКrК.ă *** Law no. 84/1998 regarding brands and geographic indications, published in the Official
Gazette in no.161/23 of April 1998, available on 22.05.2014 at the address www.osim.ro.

88
INTEGRATED SYSTEM FOR IMPROVING PROFESSIONAL COMPETENCE TAKING INTO ACCOUNT THE IMPACT OF EMOTIONALăANDăSOCIALăINTELLIGENCEăONăDOCTORS’ă
PRACTICE
Irina KOSTADINOVA 1 Diana ANTONOVA 2
ABSTRACT The purpose of this paper is to present a conceptual adapted model of competence
including the assessment system indicators used to construct a doctor’s profile matrix. Methodological instruments used for the training of emotional and social competence and assessment on the influence of emotional and social intelligence upon the doctor’s practice are also shown in the study.
KEY WORDS: doctor’s profile, professional, emotional and social competence model JEL: M51, M53, M54 1. INTRODUCTION The health care system is one of the most complex systems we encounter in our
lives. The complexity comes from the diverse forms of financing the system, the different results the system is trying to achieve - market and non-market oriented various regulations - economic and administrative, ethical and unethical behavior and norms. The varieties of aspects that influence the health sector make it a socio-cultural phenomenon that affects all members of the society as stakeholders. In the center of the system are the hospitals because of the main functions that characterize these organizations - therapeutic, health preventive and social, training and research, economic. The complexity of the hospitals requires heterogeneous human resources to be used for a successful organizational management. Doctors could be represented as one of the key factors defining the success of the hospitals because of the complex characteristics determing their work.
The objective of the study is the presentation of a conceptual adapted model of competence, which is part of a larger long developed work of emotional and social intelligence (E&SI) influence on the results of doctor practice. The adapted model aims to summarize in an integrated version professional, emotional and social competence (E&SC) and to demonstrate how the professional competence level of physicians is changed by adding E&SI elements as an influencing factor on their work. The various КspeМtsă (eМonomТМ,ă soМТКl,ămeНТМКl),ă formТngă tСeăМompleбănКtureăofăНoМtor’săаorkăКreăthe main reason to choose as a subject toătСТsăstuНвătСeăНoМtor’săprofessТonКlăprofТleăТnămedical institutions and the impact of their E&SI on hospital activities . The main goal of the health care system and in particular the doctor practice, is to provide health care
1 PhD student, UnТversТtвăofăRuseă“AngelăKКnМСev”,ăFКМultвăofăBusТnessăКnНăMКnКgement,ăBulgКrТК 2 Professor, PhD, University of Ruseă“AngelăKКnМСev”,ăFaculty of Business and Management, Bulgaria

89
services improving the quality of life, which directly affects human capital by changing the quantity and quality of work and leisure time necessary for the proper conduct of other economic activities.
The object of the study is the management of medical practice, so that at a later stage we could form a system of indicators by which to study the influence of emotional and social intelligence on the effectiveness of medical activity.
2. INTEGRETED MODEL FOR IMPROVING PROFESSIONAL,
EMOTIONAL AND SOCIAL COMPETENCE 2.1. General concept
The lack of E&S competence in their staff as a manifestation of E&S
intelligence is often witnessed by managers. There are many examples (Vekov (2010), Balkanska (2009), Grupman (2008)) from the professional life of otherwise well-trained medical professionals who cannot make a decisive step in their professional development, because of fragmented missing elements of emotional and social competence. This problem concerns not only the employees and managers from medium level, but also the strategic management of the organization, as it can have a direct effect on their performance.
The scientists and representatives of business and other organizations have not found a definite answer yet on whether it is possible to change the E&S intelligence of employees working in different fields. Most managers (Petrova (2008)) believe that it makes no sense to put efforts in this direction, as the age of the workers does not suggest changes in that direction and for them the emotional and social intelligence is a constant, which is not subject to development. This sentiment is shared by most of the hospital management as a result of their specific activities.
Based on the thesis presented in previous studies of the author (Kostadinova (2013; 2014)), it is claimed that: the doctor’s work has a dual nature – first and foremost, it is a personal resource; on the other hand, it is also a capital of the organization who is interested in its development. The doctor activity leads to three types of results (economic, medical and social), as it carries out its activities in an organization whose achievements are also measured in these three directions.
The hypothesis is that E&S intelligence is one of the factors influencing the results of doМtor’să prКМtТМeă КnНă Тtsă Нevelopmentă аТllă leКНă toă someă МСКngesă Тnă tСeăbehavior and the activities of doctors. As a result, the effectiveness on the work place will improve as well as the one of the hospital.
Naturally, here comes the need to formulate and justify an integrated model of competence, which will allow us to integrate Goleman's theory1 (Goleman, (2011;
1 According to the theory of D. Goleman, EI is not strictly biologically determined, emotional abilities and skills could be improved through learning, cultivation and training. And the reason for it is that human brain continues to develop. His theoretical model has been developed over the years and the latest version consists of: self-awareness (emotional self-awareness, accurate self-assessment, self-confidence), self-management (adaptability, emotional self-control, initiative, achievement orientation, trustworthiness, optimism), social awareness (empathy, service orientation, organizational awareness) and relationship management ( inspirational leadership, developing others, conflict management, influence, collaboration and teamwork).

90
2010) Goleman&Chermiss (2001)) of E&S intelligence influence (as a management and organizational predictor) on the HR activities and its subsequent development through a system of training techniques resulting in emotional and social competence (EC&SC) and "pyramidal model of competence" of SelleX1 (2011). This integration facilitates us to establish the connection between them and the organizational goal of the hospital. The development of an integrated system of competence (professional and E&S) would enable doctors to respond with adequate behavior to the constantly changing environment and achieve their personal goals. The process would lead to the realization of the organizational goals. E&S competence development will enable doctors to be active and have more control over their own reactions to the constant changes in the environment.
The meaning of the integrated model of competence is through research on the Мurrentă levelă ofă E&Să НoМtor’să ТntellТgenМeă toă mКnКgeă КnНă preНТМtă tСeТră beСКvТoră КnНăcapacity for development of their professional and E&S competence. All this is shown on the left side of the pyramid (see. Figure1). On the right side are demonstrated all the activities and the development process itself that needs to be carried out with the help of selected instrument for the integration of professional and E&S competence. The development of the latter through a system of training (the components of which are shown in schematic form in Fig. 2) would ensure that the organizational goal identified МКnă beă КМСТeveН.ă TСeă eбpeМteНă resultă аoulНă beă Кă МСКngeă Тnă tСeă observeНă НoМtor’săbehavior and its practical realization. This will improve the economic, social and medical outcomes of the hospital. As a result, the organizational goal for an effective change (an improvement of HR effectiveness) would be achieved.
2.2. Elements of the integrated model of competence It is important to stress out that all the elements of the integrated model of
competence are interrelated and breaking the link between them will lead to a failure in achieving the organizational goal.
The first element is the motivation which forms the basis of the integrated model of competenМe:ăFТrstă tСeăНoМtors’ămotТvКtТonă forăКăprofessТonКlăНevelopmentă Тnăthe medicine field needs to be examined. The need for professional development can come from the necessity for a personal development, but could also be triggered by the НoМtors’ăКаКreness of building the prosperity of the hospital in which they work. The neбtă stepă Тsă toă stuНвă НoМtors’ă motТvКtТonă foră groаtСă Тnă tСeă meНТМКlă СТerКrМСв,ă toăestablish what kind of correlation exists between their remuneration and the economic results of the organization. The following step is to develop SI (through training, see Fig.2) and to study the motivational compatibility between the internal and the external НoМtors’ămotТvКtТon.ăTСeăself-motivation for a social interaction, as a desire to build and maintain the reputation of the physician working in an intercultural environment is the next factor that needs to be examined. How the motivation helps the doctors to deal with
According to Goleman, EIăТs:ă"…tСeăКbТlТtвătoăreМognТzeăourăoаnăfeelТngsăКnНătСoseăofăotСers;ăКbТlТtвăforăself-motivation; for good governance, our emotions and others with whom we enter into relationships." TСeătermăemotТonКlăМompetenМeăТs:ă"…КМquТreНăКbТlТtвăНueătoătrКТnТng,ăbuilt on EI leading to excellence Тnă performКnМe."ă “TСeă КbТlТtТesă МКlleНă Сereă emotТonКlă ТntellТgenМe,ăаСТМСă ТnМluНeă self-control, zeal and persТstenМeăКnНătСeăКbТlТtвătoămotТvКteăoneself”.ăand „There is an old fashioned word for the body of skills that EI represents: character“. 1 Pyramid competence model created by SelleX for the needs of Bulgarian organizations.

91
the fast changing demographic environment and whether there is a desire to build an ethical health care system, social justice and responsibility are questions that need to be ТnМluНeНăТnătСeămotТvКtТonКlăquestТonnКТreă forămoreăМlКrТtв.ăTСeăstКteăofăE&SăНoМtor’săintelligence concerning the first element will be examined by motivational questionnaires. As a result doctors would reach a better understanding of the hospital core values andculture.
The second element of the integrated model of competence concerns the personal traits of physicians. Here we study elements of EI as the ambition to learn and accumulate new knowledge and skills; fast reactions in solving medical problems; self confidence needed in making specific medical decisions as well as in the interaction of the physician with the patients, colleagues, and managers of the hospital. Also in the center of the research are some personality traits as adaptability, and the right attitude to deal with conflicts. The changes that affect the personal preferences, values, perceptions and attitudes of the doctors are the most difficult for implementing. Hence, it is recommendable the focus in the development process to be put on, self-control, self-esteem, , self-disciplined, social awareness, and sociability. The opportunity to build effective collegial relationships depends on the doctor’să КbТlТtвă toă perМeТveă emotТonsă(their own and those of the others). The ability to give professional support and assistance and to seek such when a doctor needs it is also very important to be examined. Personality traits questionnaires will be used to meet the objective of the study by helping to find the weak points that need improvement.
Skills are presented as the third element in the integrated model of competence. Achieving a high level of E&S competence is determined by the increasing
complexity of the problems that must be solved by those employed in the health care sector. This requires the development of a specific set of skills and sensitivity of the doctors that will enable them to interact with other players in the system. Today, medical specialists need to go out beyond the narrow professional competence framework, which apparently is no longer sufficient for success in the changing environment; they need to acquire new skills to cope with the new social reality.
According to Ivanov, applying emotional management at the workplace results in higher E&S competence and sets apart the best doctors from the rest. (Ivanov. L & G. Ivanow (2012)).
FoМusТngăonătСeăНevelopmentăofăНoМtors’ămКnКgerТКlăskТllsărepresenteНăКsăКăpКrtăof Goleman E&S intelligence model is one of the methods to achieve it. This group could include set of skills for planning activities (manageable plans allowing feedback); time management skills; stress management skills; skills to adopt and adapt the structure of the hospital; ability to work in a team; conflict management skills. Another set of skills that also need to be studied and develop by doctors are a presence or lack of good communication skills; teamwork skills, the skills to recognize and manage their own emotions as well as the emotions of the other members of the group, skills to work in a different intercultural environment - adapting to changing circumstances. Here could be added social skills such as caring, self-presentation, synchronization; ability to establish an efficient contact with the patients as Goleman says "... caring for the others should be the main motivation for those who work in the field of health care" (Goleman; 2010), coworkers, and the other participants in the process of providing a quality health care services; skills to implement new treatment techniques and skills for counseling and mentoring (especially while working with younger colleagues). The level of these skills

92
will be tested by simulations of real situations, where you can see their application and НoМtor’săreКМtТveness.
Knowledge is presented as the fourth element of the integrated model of competence. The intense competition in all areas of our lives does not overlook the health sector. This means that doctors must seek new action approaches (formal and informal) in order to be more flexible and oriented to the patient needs; otherwise, it is impossible to provide them with quality services. Raising the competence level requires НoМtors’ knowledge to extend beyond the specific medical education they have obtained through the years. We must not overlook the fact that the intensive development of technology requires new development models not only in the economy but also in the administration and education sectors. This fact changes the traditional concept of competence needed at the workplace for successful realization. The suggested integrated model of professional and E&S competence can fill the void. The restructuring of information processes running in hospitals affects the formation of new doctors’ knowledge about the new terms of communication. It requires more precise coordination in their interaction with their colleagues and the administration, but making informed decisions is crucial for the quality of health services and this is a step in the right direction.These steps can be knowledge about development of new methods of treatment, knowledge about different theories of stress management and their application at the workplace; knowledge of the requirements of the individual elements of organizational health structure. Their study can be carried out using examinations and tests. In the subsequent development of competence and its transformation into social intelligence (again by training), there will be an increase of knowledge that affects solving of specific medical problems, as well as issues from different areas of social interactions such as knowledge about relationship management (Lewenson & Reuf (1997)), knowledge to coordinate the objectives of the hospital with personal goals, understanding the importance of team work, knowledge of the specificities of different cultures, knowledge of foreign languages, knowledge of the main groups that physicians treat and interact, knowledge about the importance of partnership for the successful healing process in the relationship – doctor-patient. (Leathers & Eaves (2008); Roter & Hall (1998); Grupman (2008)).

93
Figure 1 - An integrated model of competence
2.3. Conclusions
The above shown integrated model of competence will provide an assessment (using 360˚ Кssessmentă tool)ă onă tСeă НoМtors’ă beСКvТoră observeНă КnНă МКnă leКНă toă Кnăimprovment of desired behavior. In this way, the management receives a constant feeНbКМkă Кboută tСeăаeКkăpoТntsă Тnă НoМtors’ă beСКvТoră tСКtă neeНă toă beăworked on. The model will enable the establishment of a comprehensive profile of the physician, taking into account the synergistic effect of E&SI on his complex work. This fact is surported by some studies in this field (Eftimova (2007); Sepkowitz (2006); Samey, E. (2006); Johnson&Bechler (1998))
Approaches based on management competence and applicable competence models for improving organizational effectiveness have not been widely used in Bulgarian organizations. There is no clarity on the required level of competence in the HR development and where to focus the main efforts and investments while selecting appropriate training. This fact seriously affects the management of hospitals.
Building and implementing an integrated model of competence will assist organizations to accurately define the training and development of HR. The model will enable a management analysis of missing knowledge, skills, personal characteristics and motivation of the doctors as individuals and what they need to acquire or improve in order to meet the requirements of their position, and therefore, increase the operational efficiency of the hospital. The big obstacle when planning training, contributing to an increase in the organization effectiveness is the absence of professional standards as real measure of knowledge, skills, personal characteristics and motivation of employees. This is the role of the integrated competence model presented, reflecting E&SI theory by specifying the necessary motivation, personality traits, skills and knowledge and tools needed for their improvement. As a result we can observe a positive change in

94
НoМtors’ăbehavior in Bulgarian hospitals. Some good results have already been achieved in American hospitals (Evans (2008)).
This model gives a chance for implementing a more accurate assessment of the relationship between the qualities of a medical specialist and job requirements (activities that he must carry out) in the organization (hospital), where he works. Specialists are very interested to know in what area they are underperforming and how the deficits should be addressed in order not to hinder their future professional and personal development. Developing professional, E&S competence and improving HR effectiveness as a whole will result in achieving the objectives of the organization.
3. ALGORITHM LEARNING PROCESS TO IMPROVE E&S
COMPETENCE According to some researchers(Goleman; 2010; Ciarrochi J. & J. D. Mayer
2007) the key point in applying E&SI theory is to achieve a balance between logic and emotion in building an integrated model of competence. The process of gaining new knowledge, skills, personality traits and motivation should be performed by a specific tool (presented in Fig 2.) that is suitable everywhere, but on the other hand, it can leave room for maneuvering in its use in specific medical occupations or other professional activities. As a result, doctors should not only acquire new knowledge, abilities and skills through training, but they need to show a desire and will to apply what they have learned in their professional life in specific situations requiring these new competencies.
The aim of the training is to make trainees more aware of the emotions role in improving their motivation, self-knowledge, acquiring new skills, realizing what the level of their emotional capacity is, and how they can achieve personal and professional change.
Based on the integrated model of competence presented, it can be concluded that the development of emotional and social competence is a complex process in which the key factor for success is how to motivate and evoke a wish for personal traits improvement of the participants. A way to overcome this challenge is highlighting the "portКbТlТtв"ăКnНă“unТversКlТtв”ăofăE&SăМompetenМe.ăItsăНevelopmentăМКnăСelpăНoМtors’ăprofessional activities, as well as their individual personal growth. Strong positive prognostic factor is when the trainees taking part in this learning process succeed in implementing E&SI in their careers and in their personal lives after its completion.

95

96
Figure 2 - An algorithm learning process1 (Goleman & Chermiss (2001))
They must clearly see the benefits of applying E&S competence on their current job at the hospital. At the same time, they can assess the future opportunities open now in front of them and the organization in which they work.
It can be said that E&SI determines the potential of individuals to learn while E&S competence show how much of this potential can be realized through training and improvement of these four elements in the transformation of intelligence into new competencies for work.
4.ăDOCTOR’SăPROFILEă ConstruМtТngăКăНoМtor’săprofТleăМКnăbeăuseНăКsăКăstКrtТngăbКseăforătСeăreКlТzКtТonă
of the integrated model of competence. Many of the elements (self-motivation, self-esteem, primary empathy, empathic accuracy, hearing, self-presentation, caring) presented in the model are part of the job description of the workplace. The job description is one of the most important written documents to be drawn up as a result of planning and analyzing of medical practice. Although in our Bulgarian practice there are virtually no examples of E&S competence use in the job description terminology, from a content point of view, some of its elements are fully compatible with the integrated model of competence. The profile provides another opportunity to investigate (through observed behavior), how to implement the developed and transformed E&S competence (self-awareness, self-management, social awareness and social skills). Assessment of E&S development can be found in the appraisal card used as another instrument by the hospital management.
According to Popov (Popov & Borisov (2006)), if job descriptions are made as a result of precise and thorough execution of these activities, and not just as a formal document, they can become an effective management tool. We also stick to that opinion and we want to add E&S competence as a needed element in the writing of the job description as it is shown in some practices of leading organizations in the business world (Cheeriness, C. & D. Goleman; pp. 2-10).
The combination of professional, emotional and social competence creates an overall profile of a highly trained and active professional who can raise the quality of health care service, which in turn has a direct impact on achieving organizational goals
1 Algorithm learning process to improve E&S competence is a training methodology created by THE CONSORTIUM FOR RESEARCH ON EMOTIONAL INTELLIGENCE IN ORGANIZATIONS. The CREIO is made up of nine individuals from academia, government and the corporate sector. The algorithm presents the optimal process for developing E&SI change in organizations. The algorithm is presented schematically in Fig. 2. It presents the optimal process for helping doctors to improve their emotional and social competence level. The algorithm suggests that there are four basic phases to the training process. The first phase occurs even before the individual begins formal training. This initial phase, which is crucial for effective social and emotional learning, involves preparation for change. This preparation occurs at both the organizational and individual levels. The second phase, training, covers the change process itself. It includes the processes that help people change the way in which they view the world and deal with its social and emotional demands. The third phase, transfer and maintenance, addresses what happens following the formal training experience. The final phase involves evaluation. Given the current state of knowledge about social and emotional learning, the complexity of programs designed to promote such learning and the great unevenness in the effectiveness of other programs, this algorithm is adapted for the neeНsăofăНoМtor’sătrКТnТng.

97
in all three fields (medical, economic and social). Training and development of human resources are key factors for providing quality services in all organizations, but in health care organizations they are even more important, they should be placed at a higher level. It is essential for all involved in this type of activity to develop and improve continuously their medical, management and personal skills, abilities and knowledge - presented here in the form of emotional and social competence.
The professional competence of the doctor viewed in terms of the theory of E&S ТntellТgenМeă Кlloаsă usă toă buТlНă Кă МompreСensТveă НoМtor’să profТleă bКseНă onă tСeă keвăcompetencies needed for the successful realization of these professionals involved in suМСă Кă Мompleбă КМtТvТtв.ă TСeă НoМtor’să profТleă КММorНТngă toă tСeă "ТntegrКteНă moНelă ofăcompetence" allows for the inclusion of some of the items (see Table 1) in the job description, and hence its better use in the management of HR of the hospital.
Table 1.
DoМtor’săprofТleămКtrТб
Elements of competence
Criteria
Motivation Traits Skills Knowledge
Medical Need of constant professional improvement in the medical field
Expertise in building and retaining talent
Skills for different techniques in treatment
Knowledge for developing new treatment methodology
A propensity to pursue goals with energy and persistence
Assertiveness, fast learner - fast reaction in solving medical tasks
Stress management skills
Knowledge about stress management theory and its implementation on the work place
Drive for a growth in the medical hierarchy
Independence, Self actualization, Emotion regulation
Accepting and adapting to the organizational structure of the hospital
Knowledge for the requirement of different units in the medical organizational structure
Economic Linking the remuneration with the economic outcomes of the organization
Self-confidence, ability and correct attitude for conflict management
Planning activities skills (manageable plans giving opportunities for a feedback)
Knowledge in the management field

98
Strong drive to achieve
Self-control, Self-motivation
Time management skills
Coordinating the objectives of the hospital with the personal goals
Organizational commitment, need to establish informal organizational structure
Self-reliant, self-disciplined, Self regard
Teamwork and collaboration skills
Realization of the importance of teambuilding
Conflict management skills
Social Maintaining a gooНăНoМtor’săreputation while working in an intercultural environment
Recognizing emotions in others: Empathic awareness; Attunement to what others need or want
Skill to work in a different intercultural environment
Knowledge of the specific characteristic of different cultures
Adaptability, flexibility
Communication skills
Foreign languages
Optimism even in the face of failure; work in a fast changing demographic environment
Perception of emotions(our own as well as the emotions in the others)
Teamwork and Communication skills
Knowledge of the main groups of people doctors interact with on a daily basis
Marshaling emotions in service of a goal
Integrity, Trustworthiness
Service orientation
Knowledge to build effective network relationships with colleagues
Building an ethical health system
Empathy; self-respect
Social skills; developing others; organizational awareness
Knowledge of ethical behavior models
A passion to work for reasons beyond money or status
Social awareness, sociality, social responsibility drive
Skill for active participation; synchronization, skills to establish an easy contact with other
Knowledge for the meaning of partnership models for the success of the

99
participants treatment
Source: (created by the author based on Goleman D., C. Chermiss, (2001); Bar-On, R. (2006); Kornacki, S., Caruso, D. (2007)
For doctors it is important to realize that the emotion management leads to
competence. It affects their own behavior and that of their colleagues, patients and managers. (Beam & Krupinski (2006)) The emotion management allows the doctors to filter the incoming information and on this basis to structure more efficient behavior patterns.
5. CONCLUSIONS As final words, it can be summarized that the current health care system is based
on the principles of solidarity, the right of choice and efficiency in resources distribution and consumption. The system structure is defined by economic, medical and social characteristics. It could be said that the effectiveness of a НoМtor’s practice depends largely on the relationships he manages to develop with the administration, his colleagues and patients. (Eftimova (2007)) As a whole, physicians are one of the main factors determining the quality of healthcare.
1. Presenting the adapted model of the integrated competence will be examining E&SI of doctors, and as a consequence of the results obtained, the development of E&S competence will be managed. The introduction of these practices will lead to a better management of knowledge within the organization with a focus on improving the professional activities of doctors.
2. AăНoМtor’s profile based on the model of an integrated competence system that meets the requirements of the administration, colleagues, patients' organizations (the role of the latter is still very small in Bulgaria), as well as self-assessment of the doctors themselves has been presented. The role of E&S competence could best be seen Тnă tСeă НoМtor’să profТle. Recently, scientists (Gardner, 2014) have introduced the categories "laser" and "projection" intellectual profile of the individual. According to Gardner, people with laser profile have one or two intelligences and they try to penetrate more deeply into their domain of choice. Projectors profile is characterized by approximately the same strength in three or more areas without bright manifestation of a clear intellectual priority. From a person with “projection” profile is expected to have broad radar screen, to watch it regularly and make sure that he will not miss anything important. Gardner uses synonymously "generalized" and "specialized” profiles but with an emphasis respectively on "lasers" to continuously strive to focus on their selected domain while “the projeМtors” attempt to create a complete picture of their work and social environment.
3. The hospital is a highly complex institution operating in a dynamic environment and it is important to determine the exact profile of the doctor who will be able to deal simultaneously with medical, economic, and social tasks. And while the surgeon can be related easily to have a “laser” profile, a pneumology physician may be more ofă“Кăprojection” type.
The directions for further development of the research require three phases, namely:

100
•ă prepКrКtТonă ofă Кă speМТКlТzeНă metСoНologвă foră trКТnТngă Кs an instrument in assessing the impact of E&SI on professional competence (through the manifestations of E&S competence) of doctors in hospitals and in particular DDPPDS - Ruse1;
•ă sвstemКtТzКtТonă of criteria and indicators to be carried out for comparative analysis of the study results, assessing the impact of E&SI on improving the physicians professional competence in terms of the organizational goals of the hospitals;
•ăМonНuМtТngăa comparative social experiment with a base and control group of hospitals to demonstrate the methodological applicability for training of the integrated competence model, taking into consideration the EI&SI impact on improving the results of doctor practice and the correlation with the hospital organizational goals.
REFERENCES Balkanska, P. (2009). “PrТlozСnКă psТgologТвКăаămeНТМТnskКtКă prКktТkК”, Sofia: Bulvest 2000,
pp. 124-131. Vecov,ă .,ăH. Hristov, H., Dragojcheva,ă .,ăKolev, Kaludova. (2010). “AnКlТtМСnoăТzsleНvКneă
nКă prТМСТnТteă Iă stepentКă nКă uНovletvorenТeă nКă pКМТentТă Тă lekКrТă аă bolnТЙnКtКă pomosС”, Medicinski pregled (3), s.3-9
Gardner H. (2014). “MnozСestvotoăТntelТgentnostТ”,ăSofia. Golman, D. (2010). “NovКtКăsoМТКlnКăТntelТgentost”, Iztok–Zapad, Sofia. Golman, D. (2011). “EmoМТonКllnКăТntelТgentnost”, Iztok–Zapad, Sofia. Grupman, D. (2008). “KКkаoămТslвКtălekКrТte?”, Iztok–Zapad, Sofia. Eftimova,ăА.ă (2007). “SoМТКlnТteă rolТlekКr-pКМТent”, Elektronno spisanie LiterNet, 13.08.2007,
№ă8ă(93). IvКnov.,Lă &ă G.ă IvКnoа,ă (2012)).”BвКlКă knТgКă zКă zНrКveopКzvКneă osnovКnoă nКă stojnostТ”,ă
BATMI, Sofia Kostadinova, I. (2013). “DefТnТrКneănКăkКtegorТТteăëmoМТonКlnКăIăsoМТКlnКăТntelТgentostăzКăМelite
nКăprКktТkoprТlovnТăТzsleНvКnТвК”ă↑: Nauchni trudove na Rusenskiya universitet, Tom 52 seriya 5.1, Ruse, s. 85-89.
Kostadinova, I. (2014). “InovКМТonenă poНСoНă Iă moНelТă zКă uprКvlenТeă nКă emoМТonКlnКtКă Тă
socialna, International Journal for Science and Innovations for the Industry, broj 1, s. 38-44, ISSN 1314-8907.
Petrova, Zl.,K. Chamov (2008) Kachestvo na zdraweopazvaneto, Health Media Group, Sofia Popov,ă .,ă↑.ăBorТsov,ăВ.ă (2006).ă “StrКtegТМСeskТă zНrКvenămenТНvment: Filosofia I praktika:
IzbrКnТăproblemnТălekМТТ” Filvest, Sofia. Bar-On, R. (2006). The Bar-On model of emotional-social intelligence (ESI). Psicothema, 18,
supl., pp. 13-25. Beam, CA, Krupinski, EA, Kundel, HL, Sickles, EA, Wagner, RF (2006). The place of medical
image perception in 21st-century health care, Journal of the American College of Radiology, 3, 409-412.
Johnson, D., Bechler, C. (1998). Examing the Relationship between Listening Effectiveness and Leadership Emergence: Perceptions, Behaviors and Recall, Small Group Research, 29 (4): 452-471.
1 DDPPDS - Ruse – District Dispensary for Pneumo-Phtysiatric Diseases with Stacionary – Ruse PLTD (The hospital where our research is conducted).
101
Goleman D., C. Chermiss, (2001) The emotionally intelligent work place, Jossey-Bass, pp. 27-45.
EvКns,ă →.,ă (2008)ă “ApplвТngă soМТКlă mКrketТngă Тnă health care: communicating evidence to МСКngeăМonsumerăbeСКvТor”MeН.DeМТs.MКkТng,ă28:ă781-792
Kornacki, S., Caruso, D. (2007). A Theory-Based practical approach to Emotional Intelligence Training: Ten ways to increase Emotional skills, Applying Emotional Intelligence, New York: Psychology Press.
Leаenson,ăR.,ăReuf,ăA.ă(1997).ăEmotТonКlăknoаleНgeăКnНăRКpport”,ăEmpКtСТМăAММurКМв,ăNY:ăGilford Press, pp. 44-72.
Leathers, D., Eaves, M. (2008). Successful Nonverbal Communication: Principles and Applications. Allyn & Bacon, Incorporated.
Roter, DL, Hall, JA, Merisca, R, Nordstrom, B, Cretin, D, Svarstad, B. (1998). Effectiveness of interventions to improve patient compliance: a meta-analysis, Medical Care, 36 (8), pp. 1138-1161.
Samey, E. (2006). Why medical image perception? Journal of the American College of Radiology, 3, pp. 400-416.
SepkoаТtz,ăK.ă(2006).ăAăfeаăgooНăНoМtors:ăDon’tălookăforătСemăonăКămКgКzТneătop-10 list, Slate magazine, June 13.
*** Informacionna sistema za ocenka na kompetenciite, Available on-line at: http://mycompetence.bg/static/index/id/9 last visited 10.08.2014
*** „Piramidalen model na kompetenciite®”,ă EntКlent 2011, Available on-line at: https://entalent.wordpress.com/2011/05/15/%D0%BA%...%82/ last visited 10.09.2014
102
APPROBATION OF METHODOLOGICAL APPROACH FOR INNOVATION ACTIVENESS OF SMALL AND MEDIUM-SIZED ENTERPRISES IN A DYNAMIC ENVIRONMENT (FOLLOWING
THE EXAMPLE OF MACHI NE-BUILDING SECTOR IN RUSE REGION, BULGARIA)
Svilen KUNEV1,
Diana ANTONOVA 2 ABSTRACT The innovation activeness (IA) of enterprises is the factor determining the
characteristics of the innovative product of business entities. The particular concept for study of innovation activeness includes theoretical ground for selection and evaluation of influencing factors in a dynamic environment, methodological approach for performing empirical study in a specific sector at regional level. The approbation of the algorithm is conducted among small and medium enterprises (SMEs) from machine-building sector in Ruse region, Bulgaria in the period of deterioration in a strong degree of economic fundamentals and followed by a global recession in developed countries (2008 – 2011). It includes sequential defining the profiles of the enterprises under study, statistical analysis of the research hypotheses and expert evaluation of the results. The main findings describe the impact of factors influencing the core of innovation activeness of those machine-building SMEs on a branch and regional levels - innovation experience available so far; readiness for future complementation of innovation projects by types of innovations – through technological improvements and innovations, product innovations and service and process innovations.
KEY WORDS: innovations; innovation activeness; influencing factors; SMEs. JEL: M110, O310, O320, L230, L250, L610, L640. 1. INTRODUCTION The role of small and medium-sized enterprises (SMEs) in the contemporary
economic and social systems in local, regional, national and supranational aspect is undeniably important. Almost all businesses are SMEs (93-99%, depending on national differences). Their problems have become the focus of theoretic research and practical developments, as well as empiric research. In this sense, the topicality of this research paper can be seen in determining the benefits of applying new approaches, methods and modified analytic research, expressed in the following aspects: A more profound and comprehensive awareness of the nature of SMEs, their genesis
and growth. Facilitating and stimulating their development through identifying more efficient scientific and applied approaches, directly addressing their needs; Development of understanding of the operational environment of SMEs and improving its conditions to a degree that satisfies their requirements more fully in order to increase company competitiveness trough innovation activeness.
1 PСD,ăUnТversТtвăofăRuseă“AngelăKКnМСev”,ăFКМultвăofăBusТnessăКnНăMКnКgement, Bulgaria, 2Professor,ăPСD,ăUnТversТtвăofăRuseă“AngelăKКnМСev”,ăFКМultвăofăBusТnessăКnНăMКnКgement,ăBulgКrТК

103
The research topic requires conducting a survey on the constituents of the system of innovative activities, determining the innovation activeness of the SMEs, as well as researching the extent to which some factors influence this specific business activity.
TСТsăКrtТМleăТsăКărevТseНăКnНăeбpКnНeНăversТonăofăКăpКperăentТtleНă‘SeleМtТonăКnНăevaluation of factors influencing the innovation activeness of small and medium-sized enterprТses’ăpresenteНăКtă6tСăInternКtТonКlăConferenМeăforăEntrepreneursСТp,ăInnovation and Regional Development – ICEIRD 2013, Istanbul, Turkey, 20-21 June 2013.
The main thesis of the research is the necessity to develop an adapted methodological approach to be used for investigating the innovation activeness through building a system for evaluating an identified set of impact factors, whose aim is to increase the compatibility of SMEs in branches and regions.
The goal is to determine on a branch and regional level the impact of the factors, which influence the innovation activeness of SMEs and to propose a system of methodological requirements for their choice and evaluation by the processing industry businesses, through consistent application of a set of strategic solutions for improving their competitiveness in a dynamic environment.
Two objectives have been set: To prepare a methodological approach for factor impact on the innovation activeness of SMEs in a dynamic environment and methods for its application by processing industry businesses through consistent application of a set of strategic solutions for improving their competitiveness. To apply experimentally in the conditions of a specific sector from the processing industry the formulated methodological concept for factor impact on the innovation activeness of industrial SMEs and propose conclusions and recommendations for their competitiveness.
2. RESEARCH METHODOLOGY AND CONTRIBUTIONS FROM THE
STUDY 2.1. Theoretical statement for choice and evaluation of impact factors on the
innovation activeness of SMEs The overview of the problem for innovation activeness includes three historical
periods. The first one is based on product cycle hypothesis in a new international environment like possibilities for prosperity (Bagnasco, 1977; Nelson and Winter, 1982; Piore and Sabel, 1984; Scott, 1988; Vernon, 1979; Osi and Freeman, 1988). The second one is focused on building of regional innovation systems and their institutional and organizational dimensions (Amin et al., 1994; Asheim and Dunford, 1997; Becattini, 1990; Bessant, 1998; Cohen, 1990; Cooke, 1997; Edquist, 1999; Freeman, 1995; Garofoli et al., 1992; Nelson et al., 1993; Nonaka and Takeuchi, 1995; Porter, 1990; Saxenian, 1991; Storper, 1997). The main findings in that period are connected with the origins and dynamics of production. The next period has a variety of regional perspectives, some of them devoted to promoting enterprise in Central and Eastern Europe as a primer on innovation and growth, also proposing standard practices for surveys on research and experimental development (Aubert, 2005; Fagerberg, 2005; FrКsМКtТ,ă2002;ă КufmКnnăКnНăTo НtlТng,ă2000;ă JКМobs,ă2000;ăMКrМСКrt,ă2006;ăPТsКnТ-Ferri, 2006; Smith, 2001). As a result of scientific research in that period definitions of

104
knowledge systems are proposed and regional innovation paradoxes are determined, based on the contradiction between innovation policies and industrial policies.
In the context of the findings from the last period the innovation activeness (IA) of enterprises could be described as the factor determining the characteristics of the innovative product of certain business entities on a branch and regional level. Research in Bulgaria from that period are in the same direction and state that this innovative product, in turn, is the final stage of the innovation process, based on newly created and/or adapted existing knowledge and know-how, and it is materialized in the shape of new or significantly improved processes, products and services, whose final objective is the formation of competitive advantage (Andreeva et al, 2011; ARC Fund, 2010; Antonova, 2008). This necessitates the further development of approaches and methods for investigating of factors, affecting the innovation activity, in view of a more accurate study of the extent and strength of their influence.
The innovation activeness is a comprehensive notion, based on quantity and quality indexes, defining the parameters of product innovations, generated as a result of innovation activity within the enterprise. In other words, the activeness is the final stage, the external manifestation of innovation activity (Kunev, 2010).
The measuring of innovation activeness is based on two main elements: (1) type of the innovations realized and (2) degree of novelty of the innovation solutions. On this basis, it is possible to characterize the subsequent activeness by quantity and quality with the help of absolute and relative values, various types of scales, statistical estimates and others. In brief, the information about the number and type of innovation solutions carried out by the enterprise shows the level of its innovation activeness.
The description of the algorithm proposed aims at defining the main steps and interdependence of the results obtained from the empirical study of the business entities from the sphere of machine-building in Ruse region. Main goal of the methodological foundation is to design a system for evaluating the influence of an identified set of factors influencing the competitiveness of a group of SMEs at sectoral and regional levels (Kunev, 2011; Kirova, 2009; Chow et al., 2007).
The following stages have been included (Kunev et al., 2012): Stage 1: Survey of localization factors. At this stage the goals, objectives and subject of the investigation are defined;
the statistical population is defined, as well as the way of forming a sample of respondents within this population; the method of conducting the survey, the tools, the surveying team, as well as the methods of analysis and presenting the results are defined. The aim of Stage 1 is to investigate the opinion of the business entities about the state of the localization factors in the region, as well as the degree to which these factors influence the innovativeness of the respondents surveyed. This initial stage takes place in the beginning of the survey period (deterioration of economic indicators) and the innovation profiles of the SMEs are defined within the usual classification of innovations (Becattini, 1990; Cohen, Levinthal, 1990; Porter, 1990).
STRATEGIC VARIABLE I is analyzed – Localizing and strategic planning of machine-building SMEs. The investigation aims at determining which factors influence the localization, strategic planning and development of the business entities under survey. The survey has been conducted among business entities from the sphere of machine-building in Ruse region. From a population of 200 acting entities a sample of 80 has been formed. The main contribution from the analysis at stage 1 is the formulation of Initial profile of innovative enterprises taking as ground the type of the

105
business strategies applied. The enterprises are organized into four groups according to tСeă НТreМtТonsă ofă tСeă ТnnovКtТonă КМtТvТtвă НemonstrКteН:ă „proНuМtă ТnnovКtors”,ă„orgКnТzКtТonКlă ТnnovКtors”,ă „mКrketТngă ТnnovКtorsă А”ă КnНă „mКrketТngă ТnnovКtorsă B”ă(Nonaka, Takeuchi, 1995; Porter, 1990).
Stage 2: Survey of innovation activeness STRATEGIC VARIABLE II is analyzed – Innovation activeness of machine-
building SMEs. The research problem is to determine which factors have an impact on the innovation activeness of the different categories of innovative SMEs.
This stage complements the analysis and results from the previous one in the following aspects: while keeping the goal, objectives and population of the survey, an additional criterion to the entities under survey is introduced; the tool for conducting the survey is modified so that the thematic focus is defined more accurately. Based on the findings of Stage 2 a Secondary profile of the innovation enterprises is formulated, which includes information about the innovation activeness of the enterprises under survey, giving an answer to the question which entities conduct innovation activity and how; which factors influence the innovation activeness and which ones affect the localization and the strategic directions of the business entities. This part of the survey is performed during a global recession in developed countries (2009) and again the innovation profiles of the SMEs are defined with the usual classification of innovations (Cohen, Levinthal, 1990; Cooke, Morgan, 1998; Freeman, 1995).
Stage 3: Survey of factors influencing the innovation activeness STRATEGIC VARIABLE III is analyzed – Intensity of the innovation
activeness of machine-building SMEs. The research problem is to determine the force of impact of factors influencing the innovation activeness of the different categories of innovative SMEs on a branch and regional levels. The analysis is performed in time when the global recession decreases.
During this stage the methodological analysis focuses on defining the extent of the force of impact that the influencing factors have. The outcome of the analysis at Stage 3 is an Integral profile of the innovative enterprises, which shows not only which factors have an influence on the enterprises with different innovation activeness, but also what their force of impact is. We can distinguish between technological innovators, product innovators, service innovators and process innovators, based on proven interdependence and force of impact of the investigated influencing factors from the conducted correlation and regression analyses in the survey.
2.2. Methodological approach for evaluating factors influencing innovation
activeness
The visual representation of the methodological approach is shown on figure 1 at the end of the article. It illustrates the specific phases for that study, which builds the methodological approach. After defining the goal of the survey, e.g. innovation activeness of machine building SMEs, the general population of survey units was defined (200 entities). Then the sample size of 80 units was estimated and they were approached for an interview. The first stage allowed four main research hypotheses to be formulated and with help of correlation and regression analyses to be checked if they could be proved with the appropriate level of significance. The final step of that data analysis strategy is the expert evaluation, where the adequacy of the hypotheses is evaluated.

106
The methodological approach presents the logical frame of the solution proposed for evaluating factors influencing the innovative activeness of the SMEs under survey (Figure 1 in Appendix).
Based on preliminary statistical analysis the following research hypotheses have been formulated: Н1: Innovation activeness (IA) is directly dependable on the period when the
enterprise was established, its capital structure and the reasons for starting business activity; the presence and application of strategic planning documentation in the enterprise. Н2: IA is in direct correlation with: the growth of economic entities; positive attitudes to developing those entities in the region where they operate; experience in transitional innovation projects; interaction between the different types of innovative solutions; the opportunity for common projects with business entities from another branch or a competitor; strengthening the importance of insufficient provision of production and technical staff. Н3: IA is strongly influenced by: access to qualified human resources; appropriate locations for settling; developed transport system; auxiliary programmes; development of market environment and increasing the business consumers. Н4: IA is weakly influenced by: the state of production, transport and social infrastructure; the evaluation of the activities of local authorities.
2.3. Approbation of the concept for innovation activeness of SMEs (Kunev et
al., 2012)
STRATEGIC VARIABLE І: Localizing and strategic planning of machine-building SMEs
PRODUCT INNOVATORS. Most important in their activity is availability of personnel with appropriate qualifications (69,2%); next is easy access to raw materials (61,5%). On the third place with equal results are presence of developed infrastructure and market potential of the region – 30,8% positive answers. Access to plots and buildings for setting up the company activities is important for 15,4% of the companies. With the lowest scores are the influence of local tax system (3,8%) and the opportunity for access to expert advice. InăКННТtТonătoăevКluКtТngăfКМtors’ăstКtus,ă69,2%ăНeМlКreătСКtăthey prefer strategies for adopting a new product, mainly by investing in new and productive machinery.
ORGANIZATIONAL INNOVATORS. They also determine as most influential factor the qualified human resources (82,9%), access to raw materials (58,5%), infrastructure and market potential of the region – 39%, availability of plots and buildings – 17,1%, access to expert advice (9,8%) and the influence of local tax system (7,3%). Compared with the product innovators, a bigger part of this group of companies (78,1%) prefer to invest in highly productive equipment when exercise innovative activity.
MARKETINGă INNO↑ATORSă “A”ă (ТnМreКsТngă tСeă mКrketă sСКre).ă Mostăinfluential factor is the qualified human resources in the region (72,7%), access to raw materials (51,5%), market potential of the region (33,3%), well-developed infrastructure (24,2%). The availability of plots and buildings is important for 15,2% of companies; the status of the of local tax system has rating of 9,1%; access to expert advice has a

107
result of 6,1%. Investing in technological equipment for performing the innovative projects is a strategic goal for 63,6% of the respondents.
MARKETINGă INNO↑ATORSă “B”ă (enterТngă neаă mКrkets).ă Hereă equКllвăimportant are the presence of qualified human resources in the region and the access to raw materials – each of those factors has 66,7% result. Next is market potential of the region (48,1%), followed by well-developed infrastructure (44,4%). The access to expert advice is a little bit more important than the other groups of innovative companies – 14,8%. The availability of plots and buildings is important for 11,1% of companies and the status of the of local tax system has rating of 7,4%. This profile has the lowest share of companies that could invest in new highly-productive equipment – 59,3%.
STRATEGIC VARIABLE II: Innovation activeness of machine-building SMEs.
Major part of PRODUCT INNOVATORS (72,7%) declare that they have experience in performing innovation project and will innovate in the future preferably in products (81,2%) and technologies (63,4%). If they decide to have partners for innovation project they would like to work with supplier, customer, consultant or international company – 45,5% for each partner. When starting innovation activity they are most influenced by the customer preferences (90,9%), the legislation, intellectual property rights, the presence of qualified human resources in the region, and access to supportive programs – 45,5% for each factor.
A lot of ORGANIZATIONAL INNOVATORS (81,8%) are experienced in developing innovative project in the past, 63,6% say that they would like to innovate in products in the future, while in technologies and processes will innovate equal parts of respondents – 45,5% for each type. A consultant and international company are the most preferred partners (45,5% for each). This is the difference with the previous group of innovative companies, because eventual partnerships with supplier and customer are put on the third and fourth places. The influential factors are similar, the strongest impact have the customer preferences (81,8%), followed by intellectual property rights protection, the presence of qualified human resources in the region and the legislative framework. In contrast to product innovators, organizational innovators do not pay big attention to access to supportive programs – they have result of 27,3%.
TСreeă tСТrНsă (75,0%)ă ofă MARKETINGă INNO↑ATORSă TYPEă ”A”ă СКveădemonstrated innovation activeness to the moment. In the future most of those companies will focus their efforts on designing new products (65%), but the other ways to innovate – in technologies, services and processes – are almost equally represented (40-45%), which shows that the business units from that profile strive for a balanced performance in the whole range of innovation opportunities. Preferences for partner in innovation activities do not differ very much from the other two profiles: higher scores have the suppliers (45%), international company (45%), client (40%) or consultant (40%). The innovative projects of this type of marketing innovators are affected mainly bвă Мustomers’ă preferenМesă (85%),ă tСeă presenМeă ofă quКlТfТeНă СumКnă resourМesă Тnă tСeăregion (40%), cooperation with a partner and the legislative framework (35% each). Relatively important factor is also the access to financial resources for funding innovation projects (35%).
BТgăКmountă(85,7%)ăofăMARKETINGăINNO↑ATORSăTYPEă”B”ăНeМlКreătСКtăthey have previous experience in innovative projects. That is the highest score among all other innovative profiles. Here also the most liked options for future innovative

108
projects are product innovations (71,4%), but the second place is for the innovations in services (57,1%). The partner with highest level of approvement are the consulting agencies (42,9%), followed by suppliers and international companies with 35,5% result. Clients a fourth in the selection with rate of 28,6%. Customer preferences and the presence of qualified human resources in the region exert big influence on that group of innovators – 85,6% and 57,1%. Next are access to supportive programs (42,9%), partner for evaluation (35,7%) and the possibilities for protection of intellectual property rights (28,6%).
STRATEGIC VARIABLE III: Intensity of the innovation activeness of machine-building SMEs
For TECHNOLOGICAL INNOVATORS most of the reasons for a starting a business have strong impact – half of the group answer that are heavily influenced by the practical application of skills and knowledge and protecting the personal and family prosperity; other 35,7% determine as strong the influence of increase in incomes as a factor. From the factors of strategic planning very strong impact have only the presence of appropriately qualified human resources and the status of the local tax system. With strong influence are the factors availability of plots and buildings (50%) and the market potential of the region (42,9%). From the group of innovation factors most of the respondents poТntătСКtăstrongăТmpКМtăСКveătСeăМustomers’ăТnterestăforăneаăproНuМtsăКnНăservices (64,3%) and the favourable national legislation (50%). For half of the companies the presence of a partner for innovation projects is with average influence, and another half of units perceive the type of impact of establishing clusters as little. From the group of localization factors five have strong impact – access to raw materials, access to financial services and resources, small number of competitors, presence of qualified human resources, and availability of plots and buildings. Factors with average impact are the proximity to railway stations and ports, the positive social climate and the well-developed transport infrastructure.
Most of PRODUCT INNOVATORS think that strong impact in starting the business activity has the practical application of skills (66,7%) and the generation of incomes (55,6%). Strategic planning is very strongly influenced by the presence of appropriately qualified human resources (55,6%) and the market potential of the region (44,4%); strong impact have access to raw materials (55,6%), and availability of plots and buildings (44,4%). The choice of location has strong impact (44,4%), together with the direct access to markets for production (33,3%). A lot of the innovation factors have very strong impact – such are the governmental support (66,7%), the educational system (44,4%). From the market factors very strong impact has the entering of new corporate clients in the region (44,4%), and the same amount of companies perceive the influence of improving the standard of living as strong. Among the localization factors very strong impact has the presence of qualified human resources (44,4%), and for 33,3% of respondents strong influence have the factors proximity to airports, railway stations and ports, the positive social climate, the well-developed transport infrastructure, presence of universities in the region and the low local taxes.
The SERVICE INNOVATORS are very strongly influenced (41,7%) by the practical application of skills and knowledge and protecting the personal and family prosperity when starting a business. Relatively strong is the impact of the need to generate of incomes (41,2%) and frustration from previous occupation (29,4%). When performing their strategic planning companies perceive the influence of the presence of appropriately qualified human resources as very strong (58,8%), and strong impact has

109
the easy access to raw materials (41,2%) together with the market potential of the region (35,3%).ăAsăforătСeăgroupăofăТnnovКtТonăfКМtorsătСeăМustomers’ăТnterestăforăneаăproНuМtsăand services has very strong impact for 70,6% of the companies; the same is with the availability of qualified human resources, the active governmental programs for supporting innovations (47,1%). From the localization factors only the presence of qualified human resources has very strong impact (47,1%); strong is the influence of the positive social climate and the well-developed transport infrastructure (29,4%).
The PROCESS INNOVATORS also are very strongly influenced (41,7%) by the practical application of skills and knowledge and protecting the personal and family prosperity when starting a business. The same number of respondents agree that the presence of appropriately qualified human resources exerts very strong influence on their strategic planning; strong is the impact of easy access to raw materials (50%), access to plots for location (41,7%) and the market potential of the region (50%). The choice of location has average impact, while the direct access to markets for the production has strong impact on the decision for the initial location (41,7%). A lot of ТnnovКtТonă fКМtorsă СКveă verвă strongă ТmpКМt.ă TСКtă Тsămostă vТsТbleăаТtСă tСeă Мustomers’ăinterest as a factor (66,7%). The difference in that group of innovators compared with the other profiles is that they evaluate as very strong the impact of presence of appropriate partner for innovation project (41,7%). Another special feature is that the presence of qualified human resources has undefined influence, which is between strong and very strong impact. From the market factors only the increase of incomes and the standard of living has strong influence. There are no location factors with very strong impact, only two of them have strong type of influencing forces - the proximity to airports, railway stations and ports (41,7%), and the availability of qualified human resources in the region (50%).
A starting point for surveying relations and dependencies through correlation analysis is determining the dependent and independent variables, which is the subject of research in the survey (Cohen, 1988; Pallant, 2005; Tabachnik and Fidell, 2006; Zjelev, 2002; Mishev and Tsvetkov, 1998; Smallbone et al., 1999; WorldBank, 2000; Zomer et al., 2000). From the questionnaire designed for empirical research, the dependent variables, characterising the manifestations of innovation activity in the businesses surveyed are as follows: innovation experience available so far; readiness for future complementation of innovation projects by types of innovations – through technological improvements and innovations, product innovations and service and process innovations.
On Fig. 2 in the Appendix the whole plan of the model of innovation activity approbated and the impact of the factors that influence it is shown. Only factors with the so called cross-impact have been shown, the relations illustrating only statistically important correlations.
In addition, on Fig. 3 a sample of the correlation matrix, containing the specific number values of the correlation coefficients for the variables, shown in the logical model is presented. It has been noted that the factor, interacting with the largest number of innovation activeness elements is the cooperation with a partner form another branch in implementing innovation projects, which can be interpreted as an index for readiness to transfer technologies and know-how, concerning the machine-building plants surveyed. The shortage of technical specialists also demonstrates relations with three of the innovation activeness elements. Another conclusion that can be drawn is that there are factors, whose impact is relatively strong since their correlation coefficients have

110
values around or above 0,500. These are the factors available innovation experience, readiness for product innovations and readiness for process innovations. The highest КbsoluteăМorrelКtТonăvКlueă(0,598)ăТsăobserveНăаСenătСeăfКМtoră“StrКtegвăforăeбpКnНТngămКrketăsСКre”ăСКsăКnăТmpКМtăonătСe vКrТКbleă“ReКНТnessăforăproНuМtăТnnovКtТons“.
For all dependent variables, characterizing the innovation activeness of the machine-building SMEs surveyed regression analysis has been conducted as well (Figure 4 in Appendix). Summarising the evaluations of the regression models and of the individual influences of the variables included in them, we can make the following conclusions about the depending variables: 58%ă ofă theă changesă ină theă variableă „Innovationă experienceă available“ă areă
based on the regression model with: 19,1% due to sales of company products in Bulgaria; 6,3% - due to the combined transport use; 3,5% - due to the readiness for process innovations; 2,5% - due to the availability of partner from another branch for participation in innovation projects; 1,3% - due to lack of technical staff; 0,7% - due to the availability of free plots for locating production lines; 0,5% - due to readiness for product innovations; 0,4% - due to lack of management staff; 52,9ă %ă ofă theă changesă ină theă variableă „Readiness for technological innovations“ăareăbasedăonă theăregressionămodelăwith: 8,4% due to striving for realization of skills and abilities at the start of a company; 4,2% - due to the proximity to raw materials when choosing a production site; 4,2% - due to the low cost of work force in the region; 3,1% - due to a desire for higher standard of living in the region; 3,0% - due to access to suitable plots and buildings for the activities to be developed; 0,6% - due to developing strategies for new products 0,5% - due to growing in size of the business;
55,5ă%ăofătheăchangesăinătheăvariableă„Readinessăforăproductăinnovations“ăareăbased on the regression model with: 5,2% due to innovations realized so far; 3,1% - due to a strategy for entering a new market; 3,0% - due to a new product strategy; 2,1% - due to a lack of technical staff; 1,7% - due to a lack of production staff; 1,4% - due to a strategy for expanding market share; 1,0% - due to readiness for realization of process innovations; 0,8% - due to cooperation with a partner from another branch for innovation projects; 0,7% - due to a vision adopted for the development of the production activities; 42,5ă%ăofătheăchangesăinătheăvariableă„Readinessăforăserviceăinnovations“ăareăbased on the regression model with: 7,3% due to the quality of legal procedures of local authorities; 6,5% - due to the number of partners in the capital of the enterprise; 2,6% - due to initiatives and programmes that help the innovations; 2,1% - due to availability of qualified human resources as a factor for innovations; 2,0% - due to the desire for a higher standard of living in the region; 1,9% - due to the increase of sales through corporate clients; 0,4% - due to the availability of qualified human resources as a factor for strategic decision-making; 64,5ă%ăofătheăchangesăinătheăvariableă„Readinessăforăprocessăinnovations“ăareăbased on the regression model with: 12,9% due to the period of existence of the enterprise, 12,5% - due to increase of sales through new shops; 5,3% - due to cooperation for innovations with a partner from another branch 4,7% - due to cooperation for innovations with a competitor; 4,5% - due to a strategy for expanding the current market share; 2,2% - due to readiness for product innovations; 0,1% - due to a lack of technical staff; 0,1% - due to innovations having been completed so far;

111
Expert evaluation The expertise is carried out through personal interviews of owners and managers
of business units from the sector under survey on the territory of Ruse Region in the period November-December 2011. The check list contains all claims, expressing proven significant correlations between the influencing factors and the manifestations of innovation activities. The experts were asked to provide their answers in two fields: level of expert agreement with the statement (dependence); assessment of the strength of the relations between factor and outcome, as a result from the specific claim (see Table 1).
The answers, pointing out the degree to which the respective expert agrees with the proposed statement of research hypotheses, have been averaged. In the expert evaluation form (information card), agreement is expressed through percentages and this allows easy processing of the average expert opinion. The following scale has been used: 0 % - Нon’tăКgree;ă20%ă - agree a little; 40 % - partially agree; 60 % - agree to some extent; 80 % - mostly agree; 100 % - fully agree.
The answers on the opinion about the intensity of connection between the dependent variable and the impact factor in every hypothesis have been averaged. The way to answer is: 1 – no connection; 2 – weak connection; 3 – medium strong connection; 4 – strong connection, 5 – very strong connection.
Table 1
Results from the survey with expert evaluation
HYPOTHESIS CONFIRMED SUB-HYPOTHESES
REJECTED SUB-
HYPOTHESES
UNSPECIFIED SUB-
HYPOTHESES Н1 1.1К,ă 1.1b,ă 1.1М,ă 1.2К,ă
1.2b,ă 1.2М,ă 1.2e 1.2Н
Н2 2.1,ă 2.3 ,ă 2.3b,ă 2.4Н,ăH2.4e, H2.4f, H2.4g, H2.4h, H2.4j, H2.6a, H2.6b
2.4К,ă 2.4b,ă2.4М
Н3 3.2,ă 3.3К,ăH3.3b,ăH3.3М,ăH3.3d, H3.4a, H3.4b, H3.6, H3.7a, H3.7b
3.5 3.7
Н4 4.5 4.8
2.4. Discussion Concerning the tested hypothesis, the expert opinions surveyed can be
summarized in the following way: Taking into greater account the necessity of practical realization of skills and
abilities as early as the beginning of business activity increases the readiness for technological innovations later (sub hypothesis 1.1 ă КММepteН).ă TСeă КssumptТonă tСКtăthe higher the number of partners, the lower the readiness for innovating services is has beenă МonfТrmeН.ă Ită Тsă КssumeНă tСКtă tooă mКnвă pКrtnersă (overă 5)ă lТmТtă tСeă МompКnв’săfleбТbТlТtвă ( 1.1b).ă AnotСeră remКrkă Тsă tСКtă tСe earlier a business is set up, the more ready it is for process innovations later. Experience lends confidence and shows a more

112
mature management team of the enterprise, combined with current accumulated mКnufКМturТngăМКpКbТlТtТesă( 1.1М).
The investments in improving the manufacturing processes are more conducive to innovation. It is the product created by these processes that matters more than the Тnvestmentsă tСemselvesă ( 2.1К).ă DevelopТngă КnНă ТmplementТngă strКtegТesă foră neаăproducts stimulate innovations ТnăteМСnologТesăКsăаellă( .2.2b).ăTСeăТmpКМtăКnНăsТzeăofăproduction series, the profitability, the possibility for cooperation and outsourcing should be taken into account. The well-developed strategic planning in the enterprise in the shape of developed and implemented strategies for new products, for expanding the current market share and entering new markets, increase the readiness for product ТnnovКtТonsă( 2.2М).ăTСeăresultsăКlsoăsСoаătСКtătСeăаell-developed strategic planning in the enterprise in the shape of developed and implemented strategies for expanding the МurrentămКrketăsСКreăТnМreКsesătСeăreКНТnessăforăproМessăТnnovКtТonsă( 2.2 ).
ConМernТngă tСeă seМonНă СвpotСesТsă 2ă tСeă eбpertă opТnТonsă surveвeНă Кgreeă tСКtăthe growth of a micro business into a small and medium-sized enterprise has a positive ТmpКМtă onă tСeă ТntentТonsă foră ТntroНuМТngă neаă teМСnologТesă ( 2.1).ă TСeă groаtСă ofăreadiness of machine-building SMEs managers and owners to develop business in a region with a higher living standard has a positive impact on the frequency of teМСnologТМКlă ТnnovКtТonsă КpplТМКtТonă ( 2.3К)ă КnНă onă tСeă frequenМвă ofă КpplвТngăТnnovКtТonăprojeМtsăforăservТМesă( 2.3b).ăProМessăТnnovКtТonsăstТmulКteătСeăproНuМtăonesăwith past experience in similar activities playing a consТНerКbleă roleă ( 2.4Н)ă КnНăproduct innovations stimulate process ones – there is close interdependence between the tаoătвpesă( 2.4 ).
The possibility for more frequent cooperation with a partner from another branch in the future is inverse to the innovationăКМtТvenessătoăpresentă( 2.4f).ăCooperКtТonăаТtСăa partner from another branch, who will participate in the innovation project for a new or similar product or process, is in direct correlation with the frequency of implementation of such projects, the criteria for choice of partner being extremely ТmportКntă ( 2.4g,ă 2.4С).ăCooperКtТonăаТtСăКăМompetТtor,ăаСoăаТllăbeăКăpКrtneră ТnăКnăinnovation project for a new or a similar process is in direct correlation with the frequency of implementation of such projects. This may be necessary when there is a lack of own capacity and when there are correct relations between the competitors ( 2.4j).
Increasing the lack of production and technical staff leads to increased search for product and technological innovations. Innovation suggests provision of highly qualified staff, which can be stimulated by in-company training and improving the quКlТfТМКtТonsă ofă tСeă eбТstТngă stКffă ( 2.6К,ă 2.6b).ă InМreКsТngă tСeă sТgnТfТМКnМeă ofăqualified human resources for developing strategic solutions corresponds to the ТnМreКseНăreКНТnessăforăТnnovКtТonăТnăservТМesă( 3.2);
The lack of free sites for localizing the activity increases the tendency for ТnnovКtТonă ( 3.3 ).ă DeМreКsТngă tСeă ТmportКnМeă ofă proбТmТtвă toă rКаă mКterТКlsă аСenăinitially locating the enterprise leads to a higher readiness for technological innovation, i.e. the businesses that need bigger quantities of raw materials do not make good teМСnologТМКlă ТnnovКtorsă ( 3.3b).ăDeМreКsТngă tСeăsТgnТfТМКnМeăofă loаăМostăofă lКboră forălocating the activities leads to increasing the search for innovation in technologies, i.e. ТneбpensТveălКborăТsăofănoăsТgnТfТМКnМeăforăteМСnologТМКlăТnnovКtorsă( 3.3 );
The vision for production development through increasing the capacity and expanding the activitвă leКНsă toă Кnă ТnМreКseНă НesТreă foră proНuМtă ТnnovКtТonsă ( 3.3Н).ă

113
Increasing the significance of qualified human resources, involved in the development ofă ТnnovКtТonă projeМts,ă ТnМreКsesă tСeă seКrМСă foră ТnnovКtТonsă Тnă servТМesă ( 3.4 ).ăAlso,ăthe increased activeness of state institutions through more intense programs for fКМТlТtКtТngăТnnovКtТonsăТnăbusТnessăsubjeМtsăfКvoursătСeăТnnovКtТonăТnăservТМesă( 3.4b).ăDecreasing the shortage of technical and management staff improves the innovation КМtТvenessă( 3.6);
Selling the production on the Bulgarian market only does not inspire innovations. It is possible small enterprises to be subcontractors of bigger enterprises, tСТsă grКНuКllвă enterТngă neаă mКrketsă КnНă ТnМreКsТngă tСeТră ТnnovКtТvenessă ( 3.7 ).ăDeveloping the business climate in the region and attracting more and more local corporative clients stimulates more frequent development and offering of new services ( 3.7b).
ConМernТngă tСeăfourtСăСвpotСesТsă 4,ă tСereă ТsăКă lКМkăofăМonsТstenМвăКmongă tСeăexpert opinions surveyed, so that is why they do not confirm the corresponding sub hypotheses.
3. CONCLUSIONS Critical analysis has been conducted of the interrelation between the process of
innovation activeness and the localization process for SMEs with the aim to develop a system of methodological requirements for evaluating the factors that have impact on the competitiveness of industrial enterprises by consistent application of a set of strategic solutions;
The specific features and characteristics of innovation activeness of SMEs have been summarized; requirements for the choice and evaluation of impact factors on innovation activeness have been synthesized;
A methodological approach for investigating innovation activeness of SMEs has been developed. It includes three groups of strategic variables from the activity of businesses, which allows the developing of three types of innovative enterprise profiles for each type of variables through consistent solution of investigation problems;
A conceptual model for investigating factors influencing the innovation activeness of SMEs has been formulated. It combines quantitative and qualitative methods of investigation and allows the formulation and proof of research hypotheses concerning the degree of influence of impact factors on individual instances of innovation activeness.
A concept for innovation activeness has been tested and an integral profile of an SME from the Machine-building sector of the processing industry within the administrative region of Ruse (level NUTSII) in Bulgaria has been developed.
A model for investigating impact factors on innovation activeness of SMEs, appropriate for use in various industrial sectors, has been applied.
REFERENCES ARCăFunН.ă (2010)ă‘InnovКtТonsăBGă– 2010. The Bulgarian Innovation policy – opportunities
forătСeăneбtăНeМКНe’.ApplТeНăreseКrМСăКnНăМommunТМКtТonăfounНКtТon,ăSofТК,ăISSNă1313-1052, p. 17.
Asheim, B. and Dunford, M. (1997) Regional Futures, Regional Studies, 31, pp. 445–456.

114
Bagnasco, A. (1977) Tre Italia. La Problematica Territoriale dello Sviluppo Economico Italiano. Bologna: II Mulino.
Becattini, G. (1990) The Marshallian industrial district as a socio- economic notion, in F. Pyke, Becattini, G. and W. Sengenberger (Eds) Industrial Districts and Inter-firm Cooperation in Italy, pp. 37–51. Geneva: International Institute for Labour Statistics.
Bessant, J., H. Rush, Approaches to Benchmarking: the Case of Framework Conditions and ITC-Os, Center for Research in Innovation Management University of Brighton, Paper prepared for IPTS, 1998.
CСoа,ă A.,ă B.ă GooНmКn,ă J.ă Rooneв,ă C.ă→вbleă (2007)ă ‘EngКgТngă Кă МorporКteă МommunТtвă toămКnКgeăteМСnologвăКnНăembrКМeăТnnovКtТon’,ăIBM SYSTEMS JOURNAL, VOL 46, NO 4, 2007,pp.639-650.
Cohen, J. (1988) Statistical power analysis for the behavioral sciences. (2nd edn) Hillsdale, NJ: Lawrence Erlbaum Associates
Cohen, W. and Levinthal, D. (1990) Absorptive capacity: A new perspective on learning and innovation, Administrative Scientific Quarterly, 35, pp. 128–152.
Cooke, P., Uranga, G. and Etxebarria, G. (1997) Regional Innovation Systems: Institutional and Organizational Dimensions, Research Policy, 26, pp. 475–491.
Edquist, C. and Hommen, L. (1999) Systems of Innovation: Th eory and Policy for the Demand side, Technology in Society, 21, pp. 63–79.
Freeman, C. (1995) The National System of Innovation in Historical Perspective, Cambridge Journal of Economics, 19, pp. 5–24.
GКrofolТ,ăG.ă(EН.)ă(1992)ăEnНogenousăDevelopmentă nНăSoutСernăEurope.ăAveburв:ăAlНersСot. Jacobs, J., The Nature of Economies, N.Y., 2000. KТrovК,ă M.ă (2009)ă ‘MetСoНsă foră EvКluКtТonă ofă tСeă InnovКtТonă potentТКl’,Journal of
Entrepreneurship & Innovation, Issue1,ăYeКră1,ăNovember’09,ăISSNă1314-0167, pp. 30-40.
Kunev,ă S.ă (2012)ă ‘↑lТqesСtТă fКМtorТă vКrСuă ТnovКtsТonnКtКă КktТvnostă nКă MSPă – aprobirane na metoНТМСeskТă poНСoН’,ă Тnă AnНreevК,ă M.ă etă Кl.ă StuНвă ofă ТnnovКtТonă КlternКtТvesă forăbusiness survival and development. Published under project FNI-2011-FBM-2, University of Ruse, Ruse, 2011.ISBN 978-954-8675-26-0, pp.204-227.
Kunev,ăS.ă(2011)ă‘MetoНТăМСeskТăpoНСoНăzКăТzsleНvКneănКăvlТКesСtТăfКktorТăvКrСuăТnovКtsТonnКtКăКktТvnostă nКă mКlkТă Iă sreНnТă preНprТКtТК’ă Тnă Sbornik IX Mejdunarodna nauchna konferentsia “Menidjmant I injenering”, Tehnicheski universitet, Sofia, 19-22 June 2011, ISSN 1313-7123, pp. 685-692.
Mishev, G., St. Tsvetkov (1998) Statistika za ikonomisti.ăUnТv.ăТzНКtelstvoă“StopКnstvo”,ăSofТК,ă1998.
Nelson, R. (Ed.) (1993) National Innovation Systems: A Comparative Analysis. New York: Oxford University Press.
Nelson, R. and Winter, S. (1982) An Evolutionary Theory of Economic Change. Cambridge, MA: Harvard University Press.
Nonaka, I. and Takeuchi, H. (1995) The Knowledge Creating Company. New York: Oxford University Press.
Osi, G., Freeman, C., Nelson, R., Silverberg, G. and Soete, L. (Eds) (1988) Technical Change and Economic Theory. London/New York: Frances Pinter.
Pallant, J. (2005) SPSS Survival Manual, Allen Unwin. Piore, M. and SABEL, C. (1984) The Second Industrial Divide: Possibilities for Prosperity.
New York: Basic Books. Porter, M. (1990) The Competitive Advantage of Nations. New York: The Free Press. Smallbone, D., D. North, Ch. Kalantaridis (1999)‘AНКptТngă toă perТpСerКlТtв:ă Кă stuНвăofă smКllă
rurКlă mКnufКМturТngă fТrmsă Тnă nortСernă EnglКnН’,ă Entrepreneurship and regional development. Taylor and Francis Ltd., 1999.ISSN 1464-5114, pp.109-127.
Tabachnik, B. & L. Fidell, (2006) Using multivariate Statistics. Allyn and Bacon/Pearson Education Company, USA.

115
Saxenian, A. (1991) The origins and dynamics of production: networks in Silicon Valley, Research Policy, 20, pp. 423–437.
Scott, A. (1988) New Industrial Spaces. Flexible Production, Organization and Regional Development in North America and Western Europe. London: Pion.
Storper, M. (1997) The Regional World: Territorial Development in a Global Economy. New York: Guildford Press.
Vernon, R. (1979) The product cycle hypothesis in a new international environment, Oxford Bulletin of Economics and Statistics, 41, pp. 255–267.
World Bank. Understanding foreign direct investment. Washington, USA, 2000 Zjelev, S. (2002) Marketingovi izsledvania. Plovdiv, Trakia-M. Zomer, H., N. Nikolov, A. Voikova (2000) Ikonomika. Sofia, Tilia.

116
Appendix
(S
ou
rce:ăKunev,ăS.,ăD
.ăAntonovК,ăS.ăR
uskovКă(2012)ă‘AlgorТtСm
ăforăfКМtorăНetermТnКtТonăofă
innovation activeness of m
achine-building S
ME
s (the case
of Bulgaria, exa
mple of R
use
regТon)’ăТnăPro
cee
ding
s of 2
nd
Intern
atio
nal C
onfe
rence
on
Lo
gistics and
Maritim
e S
ystem
s,
University of B
remen, G
erman
y, 2012, pp. 293-302)
Figure 1 - M
ethodological approach for evaluatin
g factors influencin
g innovation activeness
Str
ate
gic
va
ria
ble
s I
Loca
liza
tio
n a
nd
str
ate
gic
pla
nn
ing
of
SM
Es
Goal
Localization factors and
strategic planning
Tasks
- profile of business units
- Importance of factors
- Evaluation of their current status
Sample
Subsectors DL and DK
на KID-2008
Instrument - Questionnaire
- Company profile
- Strategic development and
localization factors
- Localization and development
Analyzing results
- percentage
- Average values
- Concordation coeficient
- infrastructure
- Human resources
- Market potential
- Local authorities
Testing and
instructing of
interviewers
Data processing
- Primary check
- editing
- encoding
- Data entering
- Final check
Re
sea
rch p
rob
lem
Wh
ich fa
ctors in
flue
nce
loca
lizatio
n,
strate
gic p
lan
nin
g a
nd
de
ve
lop
me
nt o
f m
ach
ine
-bu
ildin
g S
ME
s
Conclusions
Intermediate
result
- Primary profile of machine-building SMEs according to applied innovative strategies
- Influencing factors over innovative strategies (Indicative correlations)
Str
ate
gic
va
ria
ble
s II
Inn
ova
tio
n a
ctiv
en
ess
of
SM
Es
Goal
Factors influencing IA of
SMEs
Tasks
- IA till now and future IA
- Ranking of factors
- Preferred partners for IA
Sample
Subsectors DL, DK
Instrument - Questionnaire
- Company profile
- Strategic development and
localization factors
- Localization and development
Analyzing results
- percentage- Average values
- infrastructure
- Human resources
- Market potential
- Local authorities
Data processing
- Primary check
- editing
- encoding
- Data entering
- Final check
Re
sea
rch p
rob
lem
Wh
ich fa
ctors in
flue
nce
IA o
f diffe
ren
t ca
teg
orie
s of in
no
va
tive
SM
E
Conclusions
Intermediate
result
- Mediated profile of machine-building SME according to demonstrated IA, future IA and influencing
factors over IA
New criterion:
internationalized SME
- innovations
- Descriptive method Crosstab
Str
ate
gic
va
ria
ble
s II
I
Inte
nsi
ty o
f in
no
va
tio
n a
ctiv
en
ess
of
SM
Es
Goal
Factors influencing IA of
SMEs
Tasks
- IA till now and future IA
- Degree of influence of factors
- Preferred partners for IA
Sample
Subsectors DL, DK
Instrument - Questionnaire
- Company profile
- Strategic development and
localization factors
- Localization and development
Analyzing results
- percentage- Average values
- infrastructure
- Human resources
- Market potential
- Local authorities
Data processing
- Primary check
- editing
- encoding
- Data entering
- Final check
Re
sea
rch p
rob
lem
Inte
nsity
of fa
ctor in
flue
nce
ove
r IA o
f d
iffere
nt ca
teg
orie
s of in
no
va
tive
SM
E
Conclusions
Intermediate
result
- Integral profile of machine-building SME according to demonstrated IA, future IA and influencing
factors over IA
Internationalized SME
- innovations
- Descriptive method Crosstab
Matrix
„Factors with cross-influence over
innovative SME“Components:
- Strategy
- Localization
- Innovation activeness
- Market share
Defining of
Model for evaluation of influencing factors over IA of SME
Statistical processing
Test for scales reliability
Testing of
interconnections
Proofing of statistical hypothesizes
Expert opinion
Precise definition of
proved hypothesizes
Da
ta
Fro
m S
tra
teg
ic v
ari
ab
les
ІІІ
Correlation analysis Degree of
interconnection)
Regression analysis Degree of influence)

117
Figure 2 - Approbated model of innovation activity and impact of factors influencing it
Innovation experience
available
Readiness for product
innovations
Readiness for innovations in
services
Readiness for technological
innovations
Readiness for process
innovations
Correlation coefficients for
the variables
Innovation
experience
available
Readiness for
process
innovations
Readiness for
product
innovations
Strategy for
new product
Strategy for
expanding
market share
A desire for
higher
standard of
living
Partner from
another
branch
Partner -
competitor
Shortage of
technical
personnel
- 0,561
- 0,561 - 0,487 - 0,513 - 0,535
+ 0,388 + 0,411
+ 0,542 + 0,448 + 0,598 + 0,440 + 0,469 + 0,399
+ 0,475
- 0,487 + 0,542 + 0,432 + 0,433 + 0,448 + 0,429
Inn
ov
ati
on
act
ive
ne
ss
Factors with cross-impact
Figure 3 - Correlation matrix among factors in the logical model
INNOVATION ACTIVENESS
Innovation
experience
Product
Innova-
tions
Process
Innova-
tions
Technolo-
gical
Innovations
Innova-
tions
in services
Strategic
planning
New
product
Increase
in market
share
Localization and
development
Desired
higher
standart
Innovations
Partnering
competitor
Partner -
other
sector
Human
resources
Shortage of
technical
staff
Infrastructure
Company profileMarket
environmentLocal authorities
+ 0,448
+ 0,388
+ 0
,59
8
+ 0
,43
2
- 0,5
61- 0,487
+ 0,542
+ 0,399
- 0,535
+ 0
,42
9
+ 0
,47
5
+ 0,411
+ 0
,44
0
+ 0,433
+ 0
,46
9 + 0
,44
8
- 0,513

118
Variableă“Innovationăexperienceăavailable”
Variableă„Readinessăforătechnologicalăinnovations“
Variableă„Readiness forăproductăinnovations“
Variableă„Readinessăforăserviceăinnovations“
Variableă„Readinessăforăprocessăinnovations“
Figure 4 - Results from regression analyses for the tested dependent variables

119
THE CONCEPT OF INNOVATIVENESS IN THE MARKETING LITERATURE
Gianina Alina LALA 1
AdrianăT NASE2
ABSTRACT Innovation is vital for developing a successful business. Existing empirical studies have
demonstrated that there is a link between innovation and firm profitability. However, there is no consensus definition of innovation in the literature. This article provides an overview of existing definitions in the literature and identification of typologies of innovation. Through innovation one can identify new ways of efficiency, be it marketing, business, technological processes or products.
KEY WORDS: innovation, adoption, consumer innovations, process
JEL: M31
1. INTRODUCTION
Innovation is the main engine of economic growth in the global economy today. By introducing innovations into practice one can obtain products with improved quality characteristics, service quality, improved models of business management systems, modern management methods of employment, etc.. There are many reasons for companies and organizations to innovate, including: increasing market share, capture new markets, improve product quality, choice of products, replacing outdated products, reducing environmental impact.
As a marketing concept, innovation can be defined in several ways, namely: fТrmăТnnovКtТvenessăoră”МreКtТonăofăneаness”,ăНepТМtsăКăfТrm’săКbТlТtвătoăНevelopăand launch new products at a fast rate (Hurley and Hult (1998)). proНuМtăТnnovКtТvenessăoră”possessТonăofăneаness”,ăТsătСeăНegreeăofăneаnessăofăa product (Daneels and Kleinsmith (2001)). consumer innovКtТvenessăoră”МonsumptТonăofăneаness”,ă Тsă tСeă tenНenМвă toăbuвănew products more often and more quickly than other people (Midgley and Dowling (1978)). Innovation is not limited to science and technology. More broadly, innovation
can also be social (social system), artistic, administrative, business, in healthcare. In sociology, innovation is defined as a process of influence leading to social change which has as an effect the rejection of existing social rules and adopting new rules. (Corsi, Patrick et al. (2006)).
1 Faculty of Economic Sciences, University "Eftimie Murgu" from Resita , Romania 2 Faculty of Economic Sciences, University "Eftimie Murgu" from Resita , Romania

120
In this article we present a series of approaches to the definition of "innovation" as they appear in the literature. Therefore, in what follows are given a number of definitions related to the term innovation. The second section begins with the main types of innovations, while the third section concludes this paper by presenting conclusions and future research implications.
2. DEFINING INNOVATION
Innovation has been defined in many ways by different specialists, but there is no generally accepted definition. The best known definition is that of Engel, Blackwell КnНăMТnТКrНă(1990)ăТnăаСТМСă”ТnnovКtТonăМКnăbeăКnвăТНeКăorăproНuМt,ăseenăКsăpotentТКlăneаăМustomers”.ăHurt, Joseph and Cook (1977) described innovation as a personality trait that reflectsă ”КăНesТreă forăМСКnge”.ăOtСeră reseКrМСersăМonsТНereНă ТnnovКtТonăКsăКnăopening in the processing of information, specifically how an individual is receptive to new experiences and to stimulate new (Goldsmith (1984), Leavitt and Walton (1975)). Midgley and Dowling (1978) suggested that the concept of innovation implies independence in communication, given the extent to which the consumer decision process is independent of the social influence of others. Hirschman (1980) and Manning et al. (1995) equals innovКtТonsăаТtСătСeăМonsumer’sănoveltвăseekТng,ăаСТМСăТsăНefТneНăКsă”КnăТnСerentăНesТreătoăseekănoveltвăКnНăМreКtТvТtв”.
NoСrКă КnНăGulКtТă (1996)ăНefТneНă ТnnovКtТonă Кsă ”КnвăpolТМв,ă struМture,ămetСoН,ăprocess or market opportunity that the manager perceives as КăneаăfТrm”.ăCovina and SlevТnă (1991),ă LumpkТnă КnНă DessТă (1996),ă Knoбă (2002)ă НefТneНă ТnnovКtТonă Кsă ”Кăprocess that provides a new degree of organization, suppliers and customers, develop new procedures, solutions, products and services and new ways for marketing proНuМts”.ă AММorНТngă toă LueМkeă КnНă KКtză (2003)ă ТnnovКtТonă Тsă ”tСeă emboНТment,ăcombination or synthesis of relevant knowledge, evaluating new products, processes or servТМes”.ăEvКngelТstК'săR.ăМonМeptТonăКnНăBКregСeСă(2009)ă ТnnovКtТonă Тsă”multТ-stage process by which organizations turn ideas into new improved products, services or processes, in order to move forward, successfully compete and differentiate their mКrket”.ăUnlТkeă tСem,ăRenКnăPeres,ăEТtКnăMuller,ă↑ТjКвăMКСКjКnă(2010)ăbelТevesă tСКtăinnovatТonăТsă”tСeăproМessăofămКrketăpenetrКtТonăofăneаăproНuМtsăКnНăservТМes,ăКăproМessădriven by social influences. These influences include all the interrelationships among consumers that affect different players in the market, with or without their express will”.
According to Hirschman (1981) there are two dimensions of innovation: a symbolic one and technological one. The first dimension, the symbolic meanings of social concerns that have not existed before. The second dimension, the technological has tangible characteristics that were not previously identified. The advantage is that symbolic innovation depends on the willingness of consumers to spread a new image in their social environment, while technological innovation is a discontinuous innovation, which is unlikely to meet consumer habits.
InăКННТtТonătoătСeătermăТnnovКtТonăТnălТterКtureăаeămeetătСeătermsăofă”ТnnovКtТve”ăКnНă”ТnnКteăТnnovКtТve”.ăInnovКtТonsăТsăНesМrТbeНăКsătСeăКМquТsТtТonăofăneаăproНuМtsăorăthe tendency of new products to attract the emerging market. According to Steenkamp etă Кl.ă (1999)ă ТnnКteă ТnnovКtТonă Тsă ”propensТtвă toă buвă НТfferentă proНuМtsă oră brКnНs,ătСerebвă renounМТngă tСeă purМСКseă pКtternsă ofă prevТousă eleМtТons”.ă TСus,ă tСereă Кreă fourătheoretical explanations for this tendency: a) the need for stimulation, 2) novelty

121
seeking, 3) independence from other communications experience, 4) need for uniqueness.
Innate innovations can be seen as an expression of need for stimulation. New products help consumers to maintain an optimal innate stimulation for different situations (Etzel and Wahlers (1984), Valette-Florence and Roehrich (1993)). In another approach (Raju (1980)) innovations may arise between the need to stimulate innovative behavior as a mediating variable. Innovations can be seen as an innate basis for many human activities and the need for stimulation, as an antecedent to the adoption of new products, related directly or indirectly.
HТrsМСmКn'să ă ТНeКăofă(1980)ă ТnnovКtТonsă Тsă”Кă lТnkăorăКăstrongămotТvКtТon”ă tСКtămotivates an individual to seek new information. Innovations should be the distinction between cognitive and sensory. Thus, cognitive innovations is the trend of employment in the leisure experiences such as fantasies, dreams, risk activities (eg, ski jumping), while sensory innovations is related to activation of internal stimuli (eg dreams) and external (eg extreme sports).
Midgley and Dowling (1978) made a clear distinction between innate innovativeness ( a trait possessed by every human being) and actualized innovativeness (КМtuКlăТnnovКtТveăbeСКvТor).ăTСeвăТnНТМКteНătСКtăКnă”ТnnovКtТon”ăаТllăbeătСeăfТrstătoăuseăКă neаă proНuМt,ă ТnnКteă ТnnovКtТvenessă НefТnТngă Кsă ”tСeă Нegreeă toă аСТМСă Кnă ТnНТvТНuКlămakes innovation decisions independently from the communicated experience of others”.ă Toă beă moreă МonvТnМТng,ă tСeвă ТntroНuМeă tСeă ТНeКă tСКtă ”relТКnМeă onă tСeăinformation received from others experiences related to new products would be similar toă reМeptТvТtвă toăneаăТНeКs”.ăBut there are no studies that confirm this theory. A clear example is Hirschman (1980), which obtained the research of a negative correlation betаeenă”reМeptТvТtвătoăneаăТНeКs”ăКnНă”ТnНepenНenМeăТnăНeМТsТonămКkТngăТnnovКtТve”ăsuggesting that these two variables are likely to address different areas of behavior.
Scientists have used a different approach from many perspectives, in terms of defining innovation, including radical changes in products, processes and markets. Table 1 summarizes some of the definitions of the term innovation over time.
Table 1. Definitions of the term innovation
Author Definition
Joseph Schumpeter (1930) The introduction of a new good — that is one with which consumers are not yet familiar — or of a new quality of a good; The carrying out of the new organization of any industry, like the creation of a monopoly position; The conquest of a new source of supply of raw materials or half-manufactured goods; The introduction of a new method of production.
Peter Druker (1954) One of the two basic functions of an

122
organization. HoаКrНășТăSСetСă(1969) Any new element brought the buyer,
whether or not this is new to the organization.
Mohr (1969) The degree to which the new changes are implemented in an organization.
DКmКnpourășТăEvКnă(1984) Broad concept defined in various ways to reflect a specific requirement and characteristic of a particular study.
Kenneth Simmonds (1986) Innovations are ideas which consists in: products and services, new uses of existing products, new markets for existing products and new marketing methods.
Damanpour (1991) Development and adoption of new ideas by a firm.
Davenport (1991) A complete development work in a radically new.
Evans (1991) The ability to discover new relationships, to see things from new perspectives and to form new combinations of existing concepts.
Covin and Slevin (1991), Lumpkin and Dess (1996), Knox (2002)
Innovation can be defined as a process that provides a new level of organization, suppliers and customers, develop new procedures, solutions, products and services and new ways of marketing products.
Business Council Australia (1993) Adoption of new or significantly improved to give value to the organization, directly or indirectly to its customers.
Henderson and Lentz (1995) Implementation of innovative ideas. Nohria and Gulati (1996) Any policy, structure, method, process or
market opportunity that a business manager perceives as new.
Amabile et al. (1996) All innovation begins with creative ideas ... We define innovation as the successful implementation of creative ideas within an organization. From this point of view, the creativity of individuals and teams is a starting point for innovation; The first is a necessary but not a sufficient condition for the second one.
Rogers (1998) Involves both knowledge creation and dissemination of existing knowledge.
The European Commission Green (1999)
The success of the production, assimilation and exploitation of novelty in the economic and social.
Boer and During (2001) Creating new association: product-market-

123
technology-organization. Mokyr (2002) Innovation is the main source of economic
growth. LueМkeășТăKКtză(2003) Innovation is the embodiment,
combination or synthesis of relevant knowledge, evaluation of new products, processes or services.
Afuah (2003) Innovation is the use of new knowledge to give customers what they want, ie a new product or service; In other words, the invention + marketing.
Lam, Alice (2004) Innovation refers to the creation or adoption of new ideas or behaviors organization through internal changes and adaptations of the organization that innovates.
Manualul OSLO (2005) –version 3 An innovation is the implementation of a new or significantly improved product (good or service), or process, a new marketing method, or a method of organizing new business practice in employment organization or external relations.
Foxona et al. (2005) Innovation is a key source for creating new jobs and providing the potential to achieve environmental benefits.
Business Dictionary (2007-2009) Innovation is the process by which an idea or invention is translated into a good or service for which people will pay. To be called innovation, an idea must be reproducible economic cost and must satisfy a specific need. Innovation involves deliberate application of information, imagination and initiative to achieve a higher or different value from resources, and encompasses all processes by which new ideas are generated and converted into useful products.
Evangelista R. and Baregheh (2009) Innovation is the process in stages, whereby organizations transform ideas into new improved products, services or processes, in order to advance, compete and differentiate their market success.
Renana Peres, Eitan Muller, Vijay Mahajan (2010)
Innovation is the market penetration of new products and services, a process driven by social influences. These influences include all interdependencies among consumers that affect different

124
market players, with or without their explicit will.
Gregory Gromov (2011) In network theory, innovation can be seen as "a new element introduced in the network changes."
Source: developed by authors
A first problem that arises when discussing innovation consists in the multitude of questions that those involved assigns the term "innovation"; often is confusion between "innovation" and "invention". Therefore, the terms "innovation" and "invention" are concepts which should not be confused. The invention consists in creating a new configuration, composition or material, device or process. The invention is the first occurrence of a new idea (concept) for a new product or process, while innovation is the first marketing of new ideas (Fagerberg J. 2004). This new idea can be a recombination of old ideas, a scheme is a challenge to the present order, a formula or a unique approach that is perceived as new by the individuals involved. The innovation concerns a marketable application in practice of an invention, an integration of economic and social invention in practice. If the invention is defined as action to imagine, to invent, to create something new, or the faculty of discovering something, of creating through imagination, innovation is defined (especially in economics) that the whole process that continues from the emergence of an idea to materialization (new product launch) through market research, prototype development and early production phases. An invention becomes an innovation until it has been processed by the manufacture and marketing and was sold on the market.
Without marketing of new innovative products, innovative idea does not bring advantages for the enterprise, has no economic value for it. Innovation is characterized by the ability to capture the economic value of the invention. Innovation should be useful in contributing to the company's performance or to meet customer needs, while the invention may not be applied in practice.
Considering the concepts of innovation and invention, Edward B.Roberts (2007) believes that the innovation process is composed of two parts: (1) generation of an idea or invention, and (2) transforming that idea into a business or other useful application .
While both invention and innovation implications "unique" innovation include the significance of profitability and performance expected by the market. An improvement to a model structure and a fabrication process may be an innovation, both, or neither, if it is not sufficiently high. According to business literature, an idea, a change or improvement is only an innovation when it is put to use effectively and cause social or commercial reorganization. In business, innovation can be easily distinguished from invention, as the invention is the conversion of cash into ideas, while innovation is the conversion of ideas into cash.
In our view, we believe that innovation is something that can create value and surplus value and which is better exploiting the early application smart as her. It is a matter of time until it will be copied and its yield will be increasingly smaller.
3. TYPES OF INNOVATIONS
In marketing literature we meet several types of innovations. Thus, the Oslo Manual innovation proposed the classification into four categories: 1) product

125
innovation; 2) process innovation; 3) marketing innovation; 4) organizational ТnnovКtТon.ăAММorНТngătoătСТsămКnuКl,ăКnăТnnovКtТonăТsă”ТmplementТngăКăneаăproНuМtă(orăsignificantly improved), a good, service or process, a new marketing methods, methods of organizing a new business practice, in labor organization orăforeТgnărelКtТons”.ăThe minimum requirement for an innovation is that product, process, marketing method or method of organization must be new (or significantly improved) to the firm.
Product innovation Тsă ”ТntroНuМТngă Кă gooНă oră servТМeă tСКtă Кreă neаă orăsТgnТfТМКntlвăТmproveНăТnătermsăofătСeТrăМСКrКМterТstТМsăorăТntenНeНăuses”.ăTСeseăТnМluНeăsignificant improvements in technical specifications, components and materials, the embedded software or other functional characteristics. Product innovations can use new knowledge or technologies or may be based on new uses or combinations of existing knowledge and technologies.
Process innovation is implementing new or significantly improved methods of production (for example, new manufacturing processes or technological flows) or a new method of delivery. This includes significant changes in techniques, equipment and / or software. The result of process innovation should be significant in terms of: production, product quality or reduce production costs and distribution.
Marketing innovation is implementing a new marketing method involving significant changes in product design or packaging, new sales methods, product placement, product promotion or pricing on the policy. Marketing innovations are НesТgneНă toămeetăbetteră tСeăМustomer’săneeНs,ăpursueăneаămКrketsăorăopenТngăКănТntСăposition of company products on the market, with the objective of increasing company sales.
Organizational innovation is implementing a new way of organizing the company's business practices in employment organization or external relations firm. Such an innovation aimed at enhancing business performance by reducing administrative and transaction costs, improves satisfaction at work (and thus labor productivity) or reduces supply costs. The organizational innovation in concept of Alice Lam (2004) refers to the creation or adoption of new ideas or behaviors organization through internal changes and adaptations of the organization innovates.
An early classification of the types of innovations has been developed by austrian economist Joseph Alois Schumpeter (1883-1950) which distinguishes five types of innovations: creating new or improved product quality; new production methods based on new scientific discoveries; new sources of supply with raw materials and semiproducts; creation of new markets; emergence of new forms of industrial organization that would lead to the
creation of a monopolistic position. As a regard to the typology of innovation, Damanpour F. (1991) presents three
types of innovations: administrative innovation – tehnical innovation (Knight (1967), Kimberly and Evanisko (1981), Damanpour and Evan (1984)); process innovation - product innovation (Knight (1967), Utterback and Abernathy (1975)); radical innovation - incremental innovation (Tushman and Nadler (1986), Leonard and Rayport (1997)).

126
Other specialists (Abernathy and Clark (1985)) were evaluated in terms of innovation benefits brought to an organization over its competitors, resulting in four types of innovations: ”КrМСТteМturКl”ă ТnnovКtТonsă (substance) that recombine certain components of a
proНuМtăorăproМessăТnăorНerătoăНerТveăКăneаă”КrМСТteМture”; ”nТМСeăbusТness”ăТnnovКtТonsăthat allow creation of new markets using existing technology; ”regulКr”ă ТnnovКtТonsă (current) which are incremental changes and continue to have significant cumulative effects on cost and performance products; ”revolutТonКrв”ă ТnnovКtТonsă (tСeă breКk)ă tСКtă produce completely new technologies or products, involving radical changes in industries and creating new industries. Unlike Abernathy and Clark, Francis D. and Bess J. (2005) proposed four
МКtegorТesăofăТnnovКtТonsăknoаnăКsătСeă”4P”ăТnnovКtТon: P1- product innovation; P2 - innovation process; P3 - innovation positioning companies or products; P4 - innovation paradigm. These four categories of innovations are not strictly distinct, but have vague boundaries thus allowing examination of opportunities for innovation space.
The literature offers different categories of innovations classified by type, grade, competence, impact and property (Narvekar and Jain, 2006). Innovation can be considered both in the manufacturing and services, with different sizes (small, medium and large).
4. CONCLUSIONS
Innovation is important in the differentiation of firms, consumer products and services in order to maintain competitive advantages in the market. The most spectacular result is the emergence of new technologies and products that revolutionize the industry and lead to new ones. In the current economic conditions, innovation is more than necessary equipment and business development.
Innovation adoption process is largely related to communication among the population and less to individual decision-making process. Each individual will make decisions based on the processes already outlined by existing products, the main difference will be that for products with unique character will exist far fewer sources of information and very few people will experience their use.
Since the purpose of this research is to both present the main definitions of the term "innovation" over time and types of innovation, future research will consider other definitions of innovation, a stage when it can be found, as and recognition of risk sources of innovation projects.
REFERENCES BКвus,ă BКrrв,ă L.,ă CСКrlotte,ă H.ă MКsonă (2003)ă ”Ană EmpТrТМКlă StuНвă ofă InnКteă Consumeră
Innovativeness, Personal Characteristics, and New-ProНuМtăAНoptТonăBeСКvТor”,ăAcademy of Marketing Science Journal, no. 31: 61

127
Burs,ăDКvТН,ăJ.ă(1992)ă”TСeăNeeНăforăSensКtТonăКnНătСeăAНoptТonăProМess”,ăAtlКntТМăJournКlăofăBusiness, vol. 28: 15
Corsi, Patrick et al. (2006) ”InnovКtТonă EngТneerТng.TСeă poаeră ofă ТntКngТbleă netаorks”,ăPublished by ISTE, London
DКmКnpour,ăF.ă(1991)ă”OrgКnТsКtТonКlăInnovКtТon:ăAăMetК-Analysis of Effects of Determinants КnНăMoНerКtors”,ăAcademy of Management Journal, vol. 34, no.3: 555-590
EvКngelТstК,ă RТnКlНoă &ă BКregСeСă (2009)ă ”SeМtorКlă PКtternsă ofă TeМСnologТМКlă CСange in ServТМes,ăEМonomТМsăofăInnovКtТon”,ăEconomics of Innovation and New Technology vol. 9: 183–221.
FoбКll,ă R.ă GorНonă (1988)ă ”Consumeră InnovКtТveness:ă Noveltв-Seeking, Creativity, and CognТtТveăStвle”,ăResearch in Consumer Behavior, no. 3: 79-113
Foxall,ăR.ăGorНonă(1988)ă”PersonКlТtвăКnНăConsumerăReseКrМС:ăAnotСerăLook”,ăJournal of the Market Research Society, no. 30: 111-125
FoбКll,ă GorНonă R.ă (1993)ă ”Consumeră BeСКvТoură Кsă Кnă EvolutТonКrвă ProМess”,ă ă European Journal of Marketing no. 27
Goldsmith, Ronald E.ă (1984)ă ”PersonКlТtвă CСКrКМterТstТМsă AssoМТКteНă аТtСă AНКptТon-InnovКtТon”,ăăăăJournal of Psychology, 159-165
GolНsmТtС,ăRonКlНăE.ă&ăHofКМkerăCСКrlesă F.ă (1991)ă ”MeКsurТngăConsumeră InnovКtТveness”,ăJournal of the Academy of Marketing Science, vol. 19, no. 3: 209-221
Goldsmith, Ronald E., D’HКutevТlle,ă F.,ă Flвnnă L.ă R.ă (1998)ă ”TСeorвă КnНă MeКsurementă ofăConsumeră InnovКtТveness.ă Aă TrКnsКtТonКlă EvКluКtТon”,ă European Journal of Marketing, vol. 32: 340-353
HТrsМСmКn,ăE.ăC.ă(1980)ă”InnovКtТveness,ăNoveltвăSeekТngăКnНăConsumerăCreКtТvТtв”,ăJournal of Consumer Research, vol. 7: 95-283
Hurleв,ăR.ăF.ă&ăHultă(1998)ă”InnovКtТon,ăMКrketăOrТentКtТon,ăКnНăOrgКnТzКtТonКlăLeКrnТng:ăAnăIntegrКtТonăКnНăEmpТrТМКlăEбКmТnКtТon”, Journal of Marketing, vol 62: 42-54
Hurt, H. T., JosepСă K.ă &ă Cookă C.ă (1977)ă ”SМКlesă foră tСeăMeКsurementă ofă InnovКtТveness”,ăHuman Research, vol. 4: 58-65
JoКМСТmstСКler,ă E.ă A.ă &ă LКstovТМkКă J.ă L.ă (1984)ă ”OptТmКlă StТmulКtТonă Level:ă EбplorКtorвăBeСКvТorăMoНels”,ăJournal of Consumer Research, vol. 11: 5
Lam, AlТМeă(2004)ă”OrgКnТzКtТonКlăInnovКtТon”,ă→orkТngăPКper,ăNo.1 LueМke,ă RТМСКrНă &ă RКlpСă KКtză (2003)ă ”Managing Creativity and Innovation”,ă Boston,ăMA:ă
Harvard Business School Press Mahajan, V., Muller, E. Bass, F.(1990)”Neаă ProНuМtă DТffusТonă MoНelsă Тnă MКrketТng: A
RevТeаăКnНăDТreМtТonsăforăReseКrМС”,ăJournal of Marketing, vol. 54: 1 MТНgleв,ă DКvТНă F.ă &ă DoаlТngă GrКСКmeă (1978)ă ”InnovКtТveness:ă TСeă ConМeptă КnНă Itsă
MeКsurement”,ăJournal of Consumer Research, no. 4: 229-242 Peres,ăRenКnКăetăКl.ă(2010)ă”InnovКtТonăDТffusion and New Product Growth Models: A critical
revТeаăКnНă reseКrМСăНТreМtТons”,ă International Journal of Research in Marketing, vol. 27: 91-106
RoeСrТМС,ăGТllesă (2004)ă ”Consumeră ТnnovКtТveness.ăConМeptsă КnНămeКsurements”,ă Journal of Business Research, vol. 57: 671-677
SМСumpeter,ăJ.A.ă(1934)ă”TСeăTСeorвăofăEМonomТМăDevelopment”,ăCКmbrТНge,ăMКss:HКrvКrНăUniversity Press
*** OSLO Manual (2005) Guidelines for collecting and interpreting innovation data, 3rd ed.,OECD/European Communities

128
THE IMPACT OF THE LEGISLATIVE FRAME FOR THE ACCOUNTING MONOGRAPHY OF EUROPEAN PROJECTS
WHEN THE BENEFICIARY IS A PUBLIC INSTITUTON
N t liţa-Mihaela LESCONI-FRUMUŞANU 1 Mihaela MARTIN 2
Andreea-Mihaela MARIN 3
ABSTRACT This paper presents aspects related to the implications of legislative changes in the
accounting field, in general, and in particular the bookkeeping legislation specific to projects financed from European funds, especially in public institutions.
We have granted special attention to the legislative modifications influencing the accounting monograph. We consider that the topic approached is of great present interest and comes to the support of accounting professionals who fill the positions of accountants or financial managers in European projects. When elaborating this paper, we started from the legislative prescriptions in the domain, and the results obtained consist in the presentation of the accounting notes afferent to the economic-financial operations specific to ERDF -funded projects whose beneficiary is a public institution.
KEY WORDS: working procedures, implementation, projects, ERDF (European
Regional Development Fund), accounting notes. JEL : M41
1. LEGISLATIVE FRAME FOR THE ACCOUNTING OF EUROPEAN-FUNDED PROJECTS, WHEN THE BENEFICIARY IS A PUBLIC INSTITUTION FINANCED FROM ITS OWN REVENUES
AăsТmpleăНefТnТtТonăofătСeăprojeМtătКkesăТntoăКММountătСeăfКМtătСКtăТtărepresentsă„Кătemporary effort made in order to create, with limited resources, a single product or servТМe”ă(AăGuТНeătoătСeăProjeМtăMКnagement Body of Knowledge, 2000).
AăprojeМtămКвăКlsoăbeăНefТneНăКsă“КămКnnerăofăorgКnТsТngăpeopleăКnНămКnКgТngăactivities. It is a modality of organising and coordinating work. What distinguishes it from other types of management is that it is totally focused on a particular final outcome and the moment this result is reached the project ceases to be necessary and is termТnКteН.”ă(Neаton,ă2006.)
Projects are single goal-focused activities, with a high degree of novelty and complex work tasks, they are limited in time and from the perspective of material and human resources, usually requiring interdisciplinary cooperation within a special organisational structure, as well as special methodologies, involving specific risks. The objective aimed at is represented by the creation of a new value (product, service, 1 КssТstКntă professor/ă PСН/ă FКМultвă ofă EМonomТМs,ă „EftТmТeă Murgu”ă UnТversТtвă ofă ResТtК,ă RomКnТК,ă[email protected]; 2 assistant professor/ Phd/ , Faculty of Social Sciences,ă„EftТmТeăMurgu”ăUnТversТtвăofăResТtК,ăRomКnТК; 3 assistant/Phd Candidate/ă FКМultвă ofă EМonomТМs,ă „EftТmТeăMurgu”ă UnТversТtвă ofă ResТtК,ă FEAA, Vest UnТversТtвăofăTТmТşoКrК,ăRomania, [email protected];

129
structure, etc.). In other words, a project supposes performing a temporary activity for the purpose of creating a new product or service (Mocanu M., Schuster C., 2001).
For the accounting recording and documentation of economic-financial operations afferent to projects financed from structural funds, we shall refer to the stipulations of the Order of the Minister of Public Finances OMPF no. 2169/2009 for the modification of the methodological norms about the organisation and management of public institutions accounting with the ulterior alterations and completions (OMFP 59/2011, OMFP 459/2012, OMFP 2002/2013, OMFP 2021/2013, OMFP 720/2014, OMFP 845/2014).
From the viewpoint of the legislation to monitor in view of elaborating European projects, we must mention: Law of accounting no. 82/1991 with the ulterior alterations and completions, regarding the financial-accounting documents, Order no.1917/2005 for the approval of the Methodological norms for the organisation and management of public institutions accounting, the Plan of accounts for public institutions and its application instructions, with the ulterior alterations and completions, and when it comes to the elaboration of accounting notes, they will be effected in accordance with the annex to the Order of the Minister of Public Finances no. 2169/2009 regarding the modification of Order no. 1917/2005, for the modification of methodological norms concerning the organisation and management of public institutions accounting, with the ulterior alterations and completions.
The accounting of the operations afferent to such a project is based on the order of the Minister of Public Finances no.2002/2013 for the modification and completion of the Methodological norms regarding the organisation and management of public institutions accounting, the Plan of accounts for public institutions and its application instructions, approved by the Order of the Minister of Public Finances no. 1.917/2005, the Order of the Minister of Public Finances no.2021/2013 for the alteration and completion of the Methodological norms regarding the organisation and management of public institutions accounting, the Plan of accounts for public institutions and its application instructions, approved by the Order of the Minister of Public Finances no.1917/2005, the Order of the Minister of Public Finances no. 845/2014 for the modification and completion of the Methodological norms regarding the organisation and management of public institutions accounting, the Plan of accounts of public intuitions and its application instructions, approved by the Order of the Minister of Public Finances no.1.917/2005, the Order of the Minister of Public Finances no.720/2014 – Methodological norms regarding the execution of public institutions budgets, by the observance of these orders according to which the effects of economic operations and other events are recognised, when the operations and events are produced and written down in a document and recorded in the books, the financial reports and situations for the period they cover. The latest legislative changes have determined, on the one hand, the creation of analytic accounts related to the payments accounts, for the highlighting of the type of financing (state budget, non-reimbursable external funds or own contribution), and on the other hand the change of the analytic accounts for all the accounts used by the public institutions depending on the type of funding. By the normative act OMFP 2021/2013 the synthetic accounts are developed up to the level of 3rd degree synthetic accounts (ex. 515 01 01 Available amounts in lei from non-reimbursable external funds at the Treasury), which in their turn may be developed into analytic accounts (515.01.01.01.02.F.650151618ă„AvКТlКbleăКmountsăТnălei from non-reТmbursКbleă eбternКlă funНsă Кtă tСeă TreКsurв”,ă аСereă 02ă Тsă tСeă МoНeă foră

130
budgetary sector, and F the financing source – and thus this account is used by a public institution totally financed from its own revenues).
2. MONOGRAPH SPECIFIC TO EUROPEAN-FUNDED PROJECTS, WHEN THE BENEFICIARY IS A PUBLIC INSTITUTION FINANCED FROM ITS OWN REVENUES
As regards the accounting highlighting of the operations afferent to the project in
the public institution, one shall apply the legislative stipulations regarding the bookkeeping recording of the projects financed from structural funds by the beneficiaries- public institutions totally financed from their own revenues for operations with non-reimbursable external funds and budget funds (OP and SB / fund), provided in the aforementioned normative acts.
In the bookkeeping procedure accounting notes will be presented, drawn up in relation with the economic-financial operations with the Management Authorities (MAs), the rest of accounting notes afferent to the project shall be elaborated according to the normative acts above with the mention of realising analytic accounts for this project under the following form: „ account symbol. financing source analytic.project analytic.analytic” (ex. 401.01.00.02.F.650151618.200130 for a supplier within the project).
The main accounting records afferent to the projects in relation with the MA OP, for a public institution totally financed from its own revenues, are the following:
A. Mechanism of reimbursement requests Recording pre financial value received from the Management Authority:
515.01.01.01.analytic PO(16.18) = 458.05.01.analytic PO “Available amounts in lei from non-
reimbursable external funds at the Treasury” “AНvКnМesăreМeТveНăfromăthe Certification
Authorities / Management Authorities / Payments Agencies - FEN”
and simultaneously 581.00.00 = 515.01.01.01.analytic PO (16.18)
“InternКlăTrКnsfers” “AvКТlКbleăТnăleТăofăeбternКlăfunНs/grКnts”
560.01.01.01.analytic PO = 581 “AvКТlКble of public institutions fully
financed from own revenues- available current cash”
“InternКlăTrКnsfers”
Supplying project account for payments from the account opened in a commercial bank that keeps track of granted credit lines (application for withdrawal):
560.01.01.01.analytic PO = 462.01.01.analytic PO “AvКТlКbleăofăpublТМăТnstТtutТonsăfullвă
financed from own revenues– available current cash”
“CreНТtorsăunНeră1ăвeКr”
Highlighting the claim to the European Commission to the payments made under 56 TТtleă“ProjeМtsăfunНeНăbвăeбternКlăgrКntsă(FEN)ăforăКăspeМТfТМăpКrtăofăelТgТbleăeбpensesăFunds (eligible expenses for which has not been made a reimbursement request):
450.05.05 analytic PO = 473.01.03.analytic PO “AmountsătСКtăsСoulНăbeăreМeТveНăfromătСe “Settlement of clarification

131
European Commission representing revenues of the general budget - public institutions funded from
own / own revenues and grants -FEN”
pending transactions - debts / reМeТvКblesăfromăFEN’să
operations “ Record of reimbursement demand of expenses submitted for validation to MAs (year n): a. reimbursement sum of structural funds:
458.03.01.1 analytic PO = 775.00.00.analytic PO
“AmountsătСКtăsСoulНăbeăreМeТveНăfromătСeăCertification Authority / Management
Authorities - FEN”
“Funding from FEN”
b. amount refunded from the budget: 458.03.02.1 analytic PO = 772.01.00.analytic PO
“AmountsătСКtăsСoulНăbeăreМeТveНăfromăthe Certification Authority/ Management
Authorities - FunНsăfromătСeăbuНget”
“SubsТНТesăfromătСeăstКteăbuНget”
Record of reimbursement demand, representing amounts that should be received due to the payments made in the previous years (year n-1) request similar recordingd, the difference lying in the used analytic: (458.03.01.2. КnКlвtТМăPOă“AmountsătСКtăsСoulНăbeăreceived from the Certification Authority / MAs made in previous years-FEN and 458.03.02.2. КnКlвtТМă POă “Amountsă tСКtă sСoulНă beă reМeТveНă fromă tСeă CertТfТМКtТonăAuthority / MAs made in previous years- budget funds”)
and simultaneously: Decrease of amounts received from the Management Authorities with advanced amount received under the pre-financing form: 1. current year n a. sums of the Structural Funds:
458.05.01. analytic PO = 458.03.01.1. analytic PO
“AНvКnМeăpКвmentsăreМeТveНăfromăCertification Authorities / Management Authorities / The Payments Agencies-
FEN”
“AmountsăreМeТveНăfromătСeăCertification Authority/Management
Authorities -FEN”
b. sums from the budget amounts: 458.05.02 analytic PO = 458.03.02.1 analytic PO
“AНvКnМeăpКвmentsăreceived from Certification Authorities / Management
Authorities / The Payment Agencies representing pre-financing - Funds from the
buНget”
“AmountsăreМeТveНăfromătСeăCertification Authority /
Management Authorities - Funds fromătСeăbuНget”
2. previous year n-1 the same, the analytics being (458.03.01.2 analytic po, 458.03.02.2 analytic po) already presented. Highlighting settlement claim from the European Commission to the payments mКНeă unНeră 56ă TТtleă “ProjeМtsă funНeНă bвă eбternКlă grКntsă (FEN)ă foră speМТfТc eligible expenses from Funds (eligible expenses for which has not been made a reimbursement request):
473.01.03 analytic PO = 450.05.05. analytic PO „ Settlement of transactions
pending clarification - debts / receivables from operations
FEN”
“Amountsăthat should be received from the European Commission representing revenues of
the general budget - public institutions funded from own / own revenues and grants -FEN”

132
Collecting amounts reimbursed by the Management Authority, registration based on information contained in the statement: 1.current year n a. repaid a sum from structural funds:
515.01.01.analytic PO = 458.03.01.1 analytic PO
“AvКТlКbleăТnăleТăofăeбternКlăfunНs at treasury”
“AmountsătСКtăsСoulНăbeăreМeТveНăfromătСeăCertification Authority / MAs made in current
year -FEN” b. amount refunded from the budget:
515.01.01. analytic PO = 458.03.02.1 analytic PO
“AvКТlКbleăТnăleТăofăeбternКlăfunНs at treКsurв”
“AmountsătСКtăsСoulНăbeăreМeТveНăfromătСeăCertification Authority / Management Authorities
made in current year - FunНsăfromătСeăbuНget” 2. Previous year n-1, similar, the used analytics being (458.03.01.2. analytic PO, 458.03.02.2. analytic PO already presented). and simultaneously
581.00.00 = 515.01.01.analytic PO „InternКlăTrКnsfers” “AvКТlКbleăТnăleТăofăeбternКlăfunНs at
treasury” 560.01.01.analytic PO = 581.00.00
„AvКТlКbleăforăpublТМăТnstТtutТonsăfullвăfinanced from own revenues-
Available current cash”
„InternКlăTrКnsfers”
Refund loan (drawing applications) ( in red): 560.01.01.analytic PO = 462.01.01.analytic PO
„AvКТlКbleăforăpublТМăТnstТtutТonsăfullвăfinanced from own revenues -
Available current cash”
„CreНТtorsăunНeră1ăвeКr”
Highlighting the interest for the pre-financing received from the Management Authorities, registration based on information contained in the statement:
518.07.01.analytic PO = 458.04.01..analytic PO „InterestăreМeТvКble” „AmountsăreМoverКbleăbвăCertТfТМКtТonăAutСorТtТesă
/Authorities Management - FEN” Collecting interest on pre-financing received by the Management Authorities, registration based on information contained in the statement:
560.01.01.analytic PO = 518.07.01.analytic PO „AvКТlКbleăforăpublТМăТnstТtutТonsăfullвă
financed from own revenues- Available current cash”
„InterestăreМeТvКble”
Registration of fee payment for available management accounts - when they are deemed ineligible by the Management Authorities, registration based on information contained in the statement:
133
458.04.01.analytic PO = 560.01.01.analytic PO „AmountsăreМoverКbleăbвăCertТfТМКtТonă
Authorities /Management Authorities - FEN” „AvКТlКbleăforăpublТМăТnstТtutТonsă
fully financed from own revenues- Available current cash” Amounts of money representing the difference between accrued and management
fees available accounts dedicated exclusively to receive pre-financing in accounts for deposits of Management Authorities, at the latest before submitting final claim for reimbursement:
458.04.01.analytic PO = 515.01.01.analytic PO „AmountsăreМoverКble by Certification Authorities /Management Authorities -
external post-КММessТonăfunНs”
“AvКТlКbleăТnăleТăofăeбternКlăfunНs at treКsurв”
Registration of debit notes received from the Management Authorities, following the notification of the European Commission: a. flow of structural funds:
629.00.00 = 458.04.01. analytic PO
„OtСerăeбpensesăКutСorТzeНăbвălКа” „AmountsăreМoverКbleăbвăCertification Authorities
/Management Authorities - FEN”
b. flow from the state budget: 629.00.00 = 458.04.02 analytic PO
„OtСerăeбpensesăКutСorТzeНăbвălКа” „AmountsăreМoverКbleăbвăCertification Authorities / Management Authorities -
budget funds” c. flow from pre-financing unjustified within the period specified in the grant agreement:
458.05.05 analytic PO = 458.04.01. analytic PO „AНvКnМeăpКвmentsăreМeТveНăfromă
Certification Authorities / Management Authorities/ The Payment Agencies-FEN”
„AmountsăreМoverКbleăbвăCertification Authorities
/Management Authorities - FEN” Transferring in the Management Authorities accounts of the amounts representing debts: a. flow of structural funds:
458.04.01 analytic PO = 5151.01.01.analytic PO
„AmountsăreМoverКbleăbвăCertТfТМКtТonăAuthorities /Management Authorities -
FEN”
“AvКТlКbleăТnăleТăofăeбternКlăfunНs at treasury”
b. flow from the state budget: 458.04.02. analytic PO = 515.01.01.analytic PO
„AmountsăreМoverКbleăbвăCertТfТМКtТonăAuthorities / Management Authorities
- budget funds”
„AvКТlКbleăТnăleТăofăeбternКlăfunНs at treasury”
B. Mechanism of payment requests settlement

134
Receipt of the amounts from management authorises representing reimbursable expenditure and the ineligible VAT afferent to the eligible expenses comprised in the payment request, in the distinct account for available amounts opened in the benefТМТКrТes’ănКmeăКtătСeăStКte’săTreКsurв:
515.01.01.analytic PO (16.18) = 458.05.02. analytic PO sau 458.05.03 „Available amounts in lei from non-reimbursable external funds at the
Treasury”
„Amounts received from FEN within the mechanism of payment requests settlement”
or „Amounts received from the budget within the mechanism of payment requests settlement”
Transfer of the amounts received from the Management Authorities (MA OP) from the distinct account of available amounts into the own account of available amounts of public institutions totally financed from their own revenues at chapter 40.10.16 „AmountsăreМeТveНăаТtСТnătСeămeМСКnТsmăofăpКвmentărequestsăsettlement”:
581.00.00 = 5151.01.01.analitic PO „Internal Transfers” „Available in lei of external funds/grants at
treasury” 560.01.01.analitic PO = 581.00.00
„Available of public institutions fully financed from own revenues – Available
current cash”
„Internal Transfers”
Return of amounts into the accounts of the Management Authorities (MA OP) if the beneficiaries do not file, within 5 working days, the payment orders, or in case of failure to comply with the conditions of par.(10) art.17^5 of the Government Emergency Ordinance no.64/2009, approved with modifications by Law no. 362/2009, with the ulterior alterations and completions:
458.05.02.analytic PO sau 458.05.03 = 458.04.01.analytic PO or 458.04.02
„Amounts received from FEN within the mechanism of payment requests settlement”
or „Amounts received from the budget within the mechanism of payment requests settlement”
„Amounts recoverable by Certification Authorities /Authorities Management - FEN”
or „Amounts recoverable by Certification Authorities /Authorities Management - funds from the budget”
and simultaneously:
458.04.01. analytic PO sau 4584.2 = 5151.01.01.analytic PO „Amounts recoverable by Certification Authorities
/Authorities Management - FEN” or
„Amounts recoverable by Certification Authorities /Authorities Management - funds from the budget”
„Available in lei of external funds/grants at treasury”
Payments to Suppliers: 401.01.00. analytic POS or 404 = 560.01.01. analytic PO
„SupplТers” „Available for public institutions fully financed from own revenues – Available
current cash”

135
Highlighting of the book debt to the European Commission on the level of the pКвmentsă effeМteНă fromă tТtleă 56ă „ProjeМtsă fТnКnМeНă fromă post-adhesion non-reТmbursКbleăeбternКlăfunН”ăforătСeăsСКreăofătСeăelТgТbleăeбpenНТtureăКfferentătoătСeăpost-adhesion non-reimbursable external funds:
450.05.05. analytic PO = 473.01.03. analytic PO „Amounts that should be received from the
European Commission representing revenues of the general budget - public institutions funded from own / own revenues and grants - FEN”
„Settlement of clarification pending clarification transactions - debts /
receivables transactions with FEN”
Recording of the expenditure reimbursement request transmitted to the Management Authorities (MA OP): 1. current year n a. reimbursement sum of structural funds:
458.03.01.1. analytic PO = 775.00.00. analytic PO
„Amounts that should be received from the Certification Authority/ Management
Authorities –FEN”
„Post-accession external funds”
b. amount refunded from the budget:
458.03.02.1. analytic PO = 772.01.00. analytic PO
„Amounts received from the Certification Authority / Management Authorities / Payments Agencies – Funds from the
budget”
„Subsidies from the state budget”
2. Previous year n-1, similar, the used analytics being (458.03.01.2. analytic PO, 458.03.02.2. analytic PO already presented). Extinguishing of the book debt to the European Commission the moment of filling the reimbursement request with the Management Authorities (MO OP):
473.01.03. analytic PO = 450.05.05. analytic PO „Settlement of clarification pending
transactions - debts / receivables from FEN’săoperКtТons”
„Amounts that should be received from the European Commission representing revenues of the general budget - public institutions funded from own
/ own revenues and grants -FEN” Reduction of the amounts to received from the Management Authorities (MA OP) by the sums received through the mechanism of payment requests: 1. current year n a. sums of the Structural Funds:
458.05.02. analytic PO = 458.03.01.1. analytic PO
„Advanced sums from FEN within the mechanism of payment requests settlement”
„Amounts received from the Certification Authority / Management Authorities /
Payments Agencies –FEN” b. sums from the budget amounts:
458.05.03. analytic PO = 458.03.02.1. analytic PO
„Advanced sums from the budget within the mechanism of payment requests settlement”
„Amounts received from the Certification Authority / Management Authorities / Paying
agencies – Funds from the budget”

136
2. Previous year n-1, similar, the used analytics being (458.03.01.2. analytic PO, 458.03.02.2. analytic PO already presented). Regularisation of the amounts received from the Management Authorities (MA OP) based on the payment requests to the revenues sub-divisions specific to the respective programmes, along with the reduction of the amounts highlighted in the revenue sub-НТvТsТonă“AmountsăreМeТveНăаТtСТnătСeămeМСКnТsmăofăpКвmentărequestsăsettlement”: - in red:
560.01.01. analytic PO = 581.00.00 „Available for public institutions fully financed from own revenues- Available
current cash”
„ Internal Transfers”
-in black:
560.01.01. analytic PO = 581.00.00 „Available for public institutions fully financed from own revenues- Available
current cash”
„ Internal Transfers”
Integral or partial restitution of the transferred funds when the beneficiaries fail to justify the funds received by reimbursement requests: a. amounts from structural funds:
458.05.02. analytic PO = 458.04.01. analytic POS
„Advanced sums from FEN within the mechanism of payment requests settlement
„Amounts recoverable by Certification Authorities /Authorities Management – external post-accession funds”
b. sums from the budget amounts :
458.05.03. analytic PO = 458.04.02. analytic PO
„Advanced sums from the budget within the mechanism of payment
requests settlement”
„Amounts recoverable by Certification Authorities /Authorities Management – Funds
from the budget” and simultaneously a. sums of the Structural Funds:
458.04.01. analytic PO = 560.01.01. analytic PO „Amounts recoverable by Certification Authorities /Authorities Management – external post-accession funds”
„Available for public institutions fully financed from own revenues – available
current cash” b sums from the budget amounts :
458.04.02. analytic PO = 560.01.01. analytic PO „Amounts recoverable by Certification Authorities
/Authorities Management – Funds from the budget”
„Available for public institutions fully financed from own revenues – available
current cash”

137
3. CONCLUSIONS In our opinion, we may state that, in order to realise an accounting monograph
able to identify and describe each stage in the financial deployment of a project, we must analyse the applicable national legislation both as regards bookkeeping and especially in relation with the financial mechanism specific to European projects, in particular to projects whose beneficiaries are public institutions. We may remark, considering the latest legislative changes, that this monograph is rather dense and tangled, and in practice it requires minute calculations, more precisely the breaking down of each debt or expenditure item depending on the type of financing applicable to the respective project (the share of the state budget, that of the non-reimbursable financing or own contribution). A problem in this respect occurs in the wages chapter, where, according to the legislative provisions in vigour, the amount must be without decimals, and after rounding the total could be denatured, an issue appearing especially when it comes to pay residual due wages. The recommendation is to elaborate the payment records both per month and per financing sources.
The opportunity of this paper results from the usefulness of elaborating and implementing an accounting monograph, along with other working procedures specific to the financial-accounting activity of a public institution implementing a European-funded project. The entire monograph comes to the assistance of the bookkeeping specialists, enabling them to respect the legal and contractual stipulations related to the organisation of the accounting of a project and also to manage, from the financial perspective and in good conditions, a project with non-reimbursable financing.
At the same time, the existence of this monograph is beneficial also for the internal and external monitoring and control of projects by the Management Authorities and Intermediary Organisms, according to the case, as they require in the signed contract the conveying of the applicable accounting monograph as intrinsic part of the working procedure regarding the organisation and deployment of the project accounting.
REFERENCES
Dumitru M., Pitulice I.C., Calu D.A., Gorgan C. (2009), Heredity And TanatogenesisIn The Public Sector Accounting In Romania. Empirical Survey Regarding The Presentation Of General Purpose Financial Statements, 32nd Annual Congress of the European Accounting Association, 22-24 March 2009, Tampere, Finland, citat de Pitulice, I.C. (2013), Accrual Accounting Adoption In The Romanian Public Sector.ăRevТstКăRomсn ăНeăStКtТstТМ ănr,ă67,ăКvКТlКbleăКt http://www.revistadestatistica.ro/Articole/2013/RRS_01_2013_a4_ro.pdf;
Hepworth N. (2003), Preconditions for Successful Implementation of Accrual Accounting in Central Government, Public Money & Management, 23:1, 37-44;
LesМonТăFrumuşКnuăN.M.,ăBreuerăA.,ăJurМСesМuăD.ă(2011),ăThe role of accounting information writing and project implementation,ă RevТstКă AnnКlsă ofă tСeă UnТversТtвă ofă PetroşКnТă – EМonomТМs,ăUnТversТtКteКăНТnăPetroşКnТ,ăКvКТlКbleăКt http://upet.ro/annals/economics/pdf/2011/Lesconi-Breuer-Jurchescu.pdf;
LesМonТăFrumuşКnuăN.M.,ăGКbrТşăD.,ă (2011)ăRolul contabilului şi al specialistului contabil în implementarea cu succes a proiectelor finanţate prin fonduri structurale, Simpozionul ŞtТТn ТfТМă Мuă TemКă ,,Eбpertulă МontКbТlă meНТКtoră întreă prТnМТpТТleă МontКbТleă şТă

138
reglement rТleă fТsМКle”,ă eНТ ТКă Кă IX-К,ă Corpulă Eбper Тloră ContКbТlТă şТă ContКbТlТlorăAutorТzК ТăНТnăRomсnТКă– filiala Arad, Moneasa;
Mocanu M., Schuster C. (2001), Managementul proiectelor, Ed. AllBeМk,ăBuМureştТ,ăКvКТlКbleăat http://www.academia.edu/1990981/Introducere_in_managementul_proiectelor
Newton, R., (2006) Managerul de proiect: măiestrie în livrarea proiectelor, Editura Codecs, BuМureștТ, available at http://www.apubb.ro/wp-content/uploads/2011/03/Managementu_-proiectelor_Dezvoltare_durabila.pdf
Petre,ăG.,ăLКz r,ăA.,ăAvrКm,ăM.,ă&ăDuТneК,ăE.,(2010)ăAspecte practice privind elaborarea şi aplicarea politicilor contabile, Revista Audit financiar nr.4/2010, anul VIII, available at http://www.cafr.ro/uploads/AF4_2010_Site-fa25.pdf#page=24;
Tiron Tudor A. (2008), Accrual Accounting Implementation – Local Government Case Study, European Accounting Association Congress;
Vasile V. (2012), Continuous flow of public sector reforms in Romania, Conference on “Adjustments in the public sector in Europe: Scope, effects and policy issues”, Brussels, 21-22 June 2012, organized by the International Labour Office in cooperation with the European Commission, available at http://www.ilo.org/wcmsp5/groups/public/---ed_protect/---protrav/---travail/documents/meetingdocument/ wcms_184247.pdf;
LegeКăМontКbТlТt ТТănr.ă82/1991,ărepublТМКt ,ăМuămoНТfТМ rТleăşТăМomplet rТleăulterТoКre; OrНТnulămТnТstruluТăfТnКn elorăpublТМeănr.ă1917/2005ăpentruăКprobКreКăNormelorămetoНologТМeă
prТvТnНăorgКnТzКreКăşТăМonНuМereКăМontКbТlТt ТТăТnstТtu ТТlorăpublТМe; OrНТnulămТnТstruluТăfТnКn elorăpublТМeănr.ă2169/2009ăprТvТnНămoНТfТМКreКăOrНТnuluТă1917/2005,ă
pentruă moНТfТМКreКă normeloră metoНologТМeă prТvТnНă orgКnТzКreКă şТă МonНuМereКăМontКbТlТt ТТăТnstТtu ТТlorăpublТМeăМuămoНТfТМ rТleăşТăМomplet rТleăulterТoКre;
OMFP 2002/2013ă pentruă moНТfТМКreКă şТă МompletКreКă Normeloră metoНologТМeă prТvТnНăorgКnТzКreКă şТă МonНuМereКă МontКbТlТt ТТă ТnstТtu ТТloră publТМe,ă PlКnulă Нeă МonturТă pentruăТnstТtu ТТleă publТМeă şТă ТnstruМ ТunТleă Нeă КplТМКreă Кă КМestuТК,ă КprobКte prin Ordinul mТnТstruluТăfТnКn elorăpublТМeănr.ă1.917/2005;
OMFP 2021/2013ă pentruă moНТfТМКreКă şТă МompletКreКă Normeloră metoНologТМeă prТvТnНăorgКnТzКreКă şТă МonНuМereКă МontКbТlТt ТТă ТnstТtu ТТloră publТМe,ă PlКnulă Нeă МonturТă pentruăТnstТtu ТТleă publТМeă şТă ТnstruМ ТunТleă Нeă КplТМКreă Кă КМestuТК,ă КprobКteă prТnă OrНТnulămТnТstruluТăfТnКn elorăpublТМeănr.ă1917/2005;
OMFP 720/2014 – NormeleămetoНologТМeăprТvТnНăeбeМu ТКăbugetelorăТnstТtu ТТlorăpublТМe; OMFP 845/2014ăpentruămoНТfТМКreКăşТăМompletКreКăNormelorămetoНologice privind organizarea
şТă МonНuМereКă МontКbТlТt ТТă ТnstТtu ТТloră publТМe,ă PlКnulă Нeă МonturТă pentruă ТnstТtu ТТleăpublТМeă şТă ТnstruМ ТunТleă Нeă КplТМКreă Кă КМestuТК,ă КprobКteă prТnă OrНТnulă mТnТstruluТăfТnКn elorăpublТМeănr.ă1.917/2005.

139
THE ECONOMIC CRISES FROM THE PERSPECTIVE OF EUPHORIA AND PANIC
Anda Laura LUNGU 1
GheorgheăB ILEȘTEANU2
ABSTRACT The hypothesis from which we begin is that markets are not permanently rational or
irrational. They become irrational when they do not combine the option for risk with the trust/ mistrust in the correct manner. When reason dominates, the development is sustainable, but when we have an excess of trust/ mistrust, the development is unsustainable. The main determiners of this balance that we take into consideration are euphoria and panic.
KEY WORDS: Euphoria / panic, trust/ mistrust, “invisible hand”, “the coercive hand
of the state”, “the social visible hand”, the leverage effect of trust/ mistrust JEL: G01, D81, M14, B59 1. INTRODUCTION The economic failures of the past decades have proved that the existent
paradigms cannot explain the functioning of the modern market economy, which makes us believe that new hypotheses are required. Even theoretically, the arguments that only bвă tСeă vКlenМesă ofă tСeă “ТnvТsТbleă СКnН”ă tСeă self- regulation is assured are debatable aspects. The complexity of the financial markets nowadays has made the externalities grow to such an extent that the failure of a system has a chain reaction to all the other systems, even if they have not assumed the risk of amplitude.
ProperlвăspeКkТng,ăТtăТsăsКТНătСКtă“ТfăаeăletătСeăeМonomвăonăТtsăoаn,ătСeăМКpТtКlТstăeМonomвăаТllăСuntătСeăeбМess.” (Akerlof and Schiller (2010). P.17).
The man is not an exclusively rational actor, there are two tendencies in him: a rational one, which seeks to maximize, to make things efficient and another one, which is selfish, guided by interest and self love.
SomeăКutСors,ăusТngă tСeăНвsfunМtТonКlăКspeМtsăofă tСeă“ТnvТsТbleăСКnНs”ăsuggestăthe intervention of the state in economy. The reality proves that the greatest corruption deeds took place in the relationship with the state. As a result, a massive intervention of the state in the economy is not a solution to the economic crisis. In another scientific approach, we have proposed a Third Way- КăunТfТeНătСeorвăofătСeă“tСeăТnvТsТbleăСКnН”,ăofă“tСeăТnterventТonТstăСКnНăofătСeăstКte”ăКnНă“tСeăvТsТbleăsoМТКlăСКnН”ă(B ТleșteКnuăКnНăLungu (2014).P. 103).
In the present research thesis we approach the functioning of the economy and the crises from the perspective of euphoria and panic (Lungu (2013)).
1 PС.D.ăCКnНТНКteăFКМultвăofăEМonomТМsăКnНăBusТnessăAНmТnТstrКtТonăTТmТșoКrК 2 Ph.D. Candidate FacultвăofăEМonomТМsăКnНăBusТnessăAНmТnТstrКtТonăTТmТșoКrК

140
2. THE FUNCTIONING MECHANISM OF MARKET Even if the majority of the economТМă КМtors’ă НeМТsТonsă Кreă bКseНă onă purelвă
rКtТonКlămotТvКtТons,ă tСereă Тsă stТllă Кă nТМСeăаСТМСă Тsă НrТvenă bвă tСeă “КnТmКlă spТrТts”,ă bвănon- economic reasons. We consider that the functioning mechanism of market has three basic components: the forces of the market; the determiners of the market, the adjustment mechanism of market (Figure no. 1).
(Source: Lungu Anda, personal conception 2014)
Figure 1 – The adjustment mechanism of the market
The forces of the market: reason, euphoria, panic- represent the primordial economic cycle which is our starting point. We consider the cycle to be repetitive; what mustăbeătКkenăТntoăКММountăТsătСeăМontrolăofătСТsăМвМle’săКmplТtuНe.ă
The determiners of the market: trust/ mistrust, chance/ unpredictable, regulation/ НeregulКtТon,ă tСeă “КnТmКlă spТrТt”,ă Кreă essentТКlă foră КămoНernă tСeorвă ofă tСeădemocrat capitalism. Uncertainty creates mistrust; trust/ mistrust generate euphoria/ panic. Euphoria/ panic generate imbalance in economy. As a consequence, the macroeconomic patterns must take into consideration these thinking structures too, which are influenced by our psychological / sentimental state of mind. We suggest that the paradigm of self – КНjustmentă аТtСă tСeă “ТnvТsТbleă СКnН”ă beă supporteНă bвă tСeăpКrКНТgmăofătСeă“soМТКlăvТsТbleăСКnН”.
The adjustment mechanism of the market consists of tСreeăМomponents:ăă“tСeăТnvТsТbleă СКnН”,ă tСeă “soМТКlă vТsТbleă СКnН”,ă КnНă “tСeă МoerМТveă СКnН”.ă EКМСă СКsă КăНТstТnМtТveă roleă ТnămКТntКТnТngă tСeă bКlКnМeăаСТМСăаeă Кreă tКlkТngă Кbout:ă “tСeă ТnvТsТble СКnН”ăКssuresătСeăself-КНjustmentăfromătСeăperspeМtТveăofătСeăselfТsСăТnterest;ătСeă“soМТКlăvТsТbleăСКnН”ăТsăresponsТbleăforăself- КНjustmentăfromătСeăperspeМtТveăofă“СКbТtus”ăКnНăsupervТsТonă fromă tСeăperspeМtТveăofăМommonă Тnterest;ă tСeă“МoerМТveăСКnН”ăprevents or eliminates the sideslips, the corruption and increases transparency.

141
We consider that the adjustment mechanism of the capitalist market economy must take some concepts from the behavioral economy.
1. To establish any business, a moral basis of mutual trust is required. Nobody says that economy should give up the contractual regulations or the legal rules, but life is hard to imagine without some degree of confidence, an opinion which is shared also by the economist and Nobel laureate, Kenneth Arrow:ă“NoаătrustăСКsăКăverвăimportant pragmatic value, if nothing else. Trust is an important lubricant of a social system. It is extremely efficient; it saves a lot of trouble to have a fair degree of reliance onăotСer’săpeople’săаorН”.(Arrow (1974). P. 9).
Trust represents a moral value and it is difficult to quantify it. In spite of all these, there have been developed a series of methods through which trust is measured (surveys, studies, questionnaires): from the political, social and even economic perspective. One of the best known surveys is the Michigan Consumer Sentiment Index (MCSI), made by the University of Michigan together with Thomson Reuters and tКrgetsătСeăМonsumer’sătrustăТnНeб,ătСeămКбТmumălevelăofătrustăbeТngă100.ăItăТsăКămontСlвăsurvey which includes all the continental US States, less Hawaii and Alaska.
A closer analysis of the MCSI evolution reveals the fact that this had the lowest quotation ever before the beginning of various crises, which denotes the close connection between trust and the economic crises. When the population loses confidence, people do not invest in economy anymore and the consumers become more cautious and rational when it comes to their expenses.
(Source: http://en.wikipedia.org/wiki/University_of_Michigan_Consumer_Sentiment_Index)
Figure 2 – The evolution of the Michigan Consumer Sentiment Index 1952- 2011
If we take into consideration the process of trust/ mistrust as a dynamic system, there is the possibility, we believe, to explain the behavior of this process by adopting the informational pattern (B ТleșteКnuă КnНă Burz (2008). P. 49). This thing allows a dynamic perception on trust/ mistrust in relation with the cu temporary changes of information.
The events, the relationships and the perception of trust/ mistrust depend on the information which is already known.
The dynamics of the process of trust /mistrust can be described by 6 equations: 1) Ft+1 = F t + S FNt T t,
t+1 F

142
TСeăknoаnăfКМtorsă(ăFă)ăКtătСeămomentă“t+1”ăăТnМluНeătСeăeбТstentăknoаnăonesăКtă tСeă“t”ămomentăКnНăКăpКrtăofă tСeăpotentТКlăknoаnăfКМtorsăКtă tСeă“t”ămomentăаСТМСăСКveăbeМomeăknoаnăКtătСeă“t+1”ămomentăbвăКММessТngăТnformКtТonăКnНăНКtКă(SFNt T t, t +1 F). There is a reduction of subjectivity in perceiving trust / mistrust and an increase of rationality.
2) FNt+1= p F Nt + S I T t, t+1F N
TСeă potentТКlă knoаnă fКМtorsă (F)ă Кtă tСeă “t+1”ă momentă ТnМluНeă Кă pКrtă ofă tСeăpotentТКlăknoаnăfКМtorsăКtătСeă“t”ămomentă(ătСeăonesăаСТМСăаereănotătrКnsformeНăТntoă“F”)ăКnНăКăpКrtăofătСeăunknoаnăfКМtorsăКtătСeă“t”ămomentăаСТМСăКlsoăbeМКmeăknoаnăКtăthe t+1”ă(SITăt, t+1FN) moment.
We deal with a reduction of the incertitude of the future in perceiving trust/ mistrust. 3) I t+1= p It +ăΔIăt, t+1
TСeăunknoаnăfКМtorsă (I)ăКtă tСeă“t+1”ămomentă ТnМluНeăКăpКrtăofă tСeăunknoаnăfКМtorsă Кtă tСeă “t”ă momentă (tСeă onesă аСТМСă НТНă notă trКnsformă Тntoă FN)ă КnНă otСerăunknown factors which did not appear in the period of time [t, t+1]. The influence of incertitude grows in perceiving trust / mistrust.
We have: t T t+1 a factor which means transformation in a period of time [t, t+1]. 4) I t+1 > I t →ă(ă~ăsăIătT t+1FăNă→ăIăNăPă+)
If the unknown factors grow during the period [t, t+1], the degree of unpredictability increases in the perception of trust / mistrust (INP + ), if there was not any transformation of I into CN (~ s I tTt+1F N).
5) I t+1 > I t →ăăsăIătT t+1FăNă→ăST+ If the unknown factors increase during the period of time [t, t+1], the level of
“turbulenМe”ăТnМreКsesătooăТnăperМeТvТngătСeătrust/ămТstrustă(unpreНТМtКble)ăТfătСereăаereătrКnsformКtТonsăsuМСăКsăIă ăFN.
6) I t+1 < I t →ăă((ΔăFăNătT t+1 F & S I tT t+1 FăNă&ăΔăătI t+1) →ăSC+) The degree of controlling the process and implicitly the rationality in the
perception of trust/ mistrust increase. The above statements are valid for the process of trust/ mistrust in all its
components. From the foundations and the behavior of the process trust/ mistrust results that
even if it has a deep and subjective load, it also has rational determinations, which are based on actual information.
In the stages of development, the tendency to euphoria is higher than in the stages of recovery. Likewise, the tendency to panic is higher in the stages of recovery compared to the ones of development.
The behavior of the economic actors will be found in one of the following 6 situations:
(1) (U-R & E X T
.+)ă→ăE: the underestimation of the risk (S-R) and the excess of trust
(E XT .+) generate euphoria (E);
(2) (O+R & D T
.-)ă→ăP: the overestimation of the risk (O+R) and the deficit of trust
(D T .-) generate panic (P);
(3) Ră→ă(PăT & E R): reason/ rationality facilities the perception of trust (P T) and the evaluation of risks (ER);
(4) P T = f(R,U,Re): the perception of trust is determined by reason (R), unexpected (U) and by the receiver (Re);

143
(5) U+ →ă(E+→ăT+): if the unexpected increases (U+), then trust increases (T+) if we are on a wave of euphoria (E+);
(6) U+ →ă(P+→ăT-): if the unexpected (U+ ) increases then trust is reduced (T-) if we are on a wave of panic (P+). The crisis begins on a wave of excess of trust and an underestimation of risk.
Panic appears when the excess of trust is transformed into an excess of mistrust, while the underestimation of the risks in their overestimation. Society gets out of the crisis when the rationality reestablishes the perception of trust and risk.
Markets are not permanently rational or permanently irrational. They become irrational when the current actions affect the future perspectives and they are rational when they combine correctly the option for risk with trust/ mistrust. When reason dominates, the development is sustainable and also the rational market. When euphoria dominates (excess of trust) and the risk is undervalued, we would have an irrational market with an unsustainable development. When panic dominates (excess of mistrust) and the risk is overvalued, the market would be irrational and we will have the phenomenon of underdevelopment.
The main determiners of euphoria (E)/ panic (P) are trust /mistrust (T/M) and the preference for risk (PR), respectively the aversion to risk (AR). From the perspective of the economic crises the relations between the four parameters must be studied according to the stage of the cycle of business: the cycle of development before the crisis (CDBC), respectively the cycle of recovery after the crisis (CRAC).
In the stage of the cycle of development before the crisis, the relative increase of trust determines a relatively higher increase of the tendency to euphoria. The coefficient of elasticity (e) is a subunit : <1, which means that there is a preference for risk.
In the stage of the cycle of recovery after the crisis, the relative increase of trust determines a relatively smaller increase of the tendency to euphoria. The coefficient of elasticity (e) is a subunit: , so there is an aversion to risk.
In the stage of the cycle of development before the crisis, a relative reduction of trust determines a smaller increase of the tendency to panic. The coefficient of elasticity (e) is an over unit: >1.
In the stage of the cycle of recovering after the crisis, a relative loss of confidence determines a higher increase of the tendency to panic. The coefficient of elasticity (e) is a subunit: <1.
From here we can conclude that in the stages of development the tendency to euphoria is higher than in the stages of recovery. Likewise, the tendency to panic is higher in the stages of recovery compared to the stages of development. (Figure No. 3).

144
(Source: Lungu Anda, personal conception 2014) Figure 3 – The variables euphoria/ panic
CDBC - the cycle of development before the crisis CRAC - the cycle of recovery after the crisis e= - coefficient of elasticity/ effect of leverage
PR - Preference to risk AR - Aversion to risk P - Panic E - Euphoria T - Trust M - Mistrust
In our approach we have been trying to emphasize the connection between the absolute level of trust / mistrust (α)ă КnНă tСeă pКrКmetersă eupСorТК/ă pКnТМ.ăAnă Кbsoluteăhigh level of trust we find in the democracies where the population has the culture of responsibility and the perception of some institutions of the state, which is impartial, efficient and remarkable. Our hypothesis of work: AăСТgСăαăpreНТsposesătoăeupСorТКămoreătСКnătoăpКnТМ; AăСТgСăαăТsăКăstТmulКntăofătСeăeМonomТМăgroаtС; AăСТgСăαăăgТvesăsКfetвăКnНăpreНТsposesătoătСeăunНervКluКtТonăofăfutureărТsks; Ană eМonomвă МКnnotă Нevelopă МompetТtТvelвă аТtСoută Кnă αă Кt a reasonable
level.

145
(Source: Lungu Anda, personal conception 2014) Figure 4 – The evolution of trust in relation to panic
- a small increase of trust generates a larger increase of euphoria (relative
terms) - a small increase in trust generates a smaller increase of euphoria (relative
terms) - a small reduction in trust generates a larger increase of panic (relative
terms) - a small reduction in trust generates a smaller increase of the panic (relative
terms) T- populations with an great absolute trust t- populations with an little absolute trust
3. CONCLUSIONS
1. The nations with an absolute high level of trust show a predilection towards euphoria. In the same time, when trust appears, the amplitude and the consequences of panic are much higher than at the ones with an absolute low level of trust. The bonus of trust is quantified in bonuses of disillusions and disappointments.1
2. The nations with a high volatility of the index of trust give more attention to panic that the ones with low volatility. Volatility, as well as small earthquakes, release tensions.
3. The nations at which the tax evasion and the corruption are at a high level, are less sensitive to the unbalance trust/ mistrust – euphoria/ panic. This happens because tСeвă СКveă tСeă МorrupteНă elementsă ТntegrКteНă Тnă tСeă sвstem.ă TСeă “unprТvТlegeН”ă
146
population is the one who suffers the most because of the spread of the effects of the crisis.
4. Between the excess of euphoria and the absolute level of trust/ mistrust there Тsă tСeă folloаТngă МorrelКtТon:ă СТgСă αă generКtesă Кnă eбМessă ofă eupСorТКă КnНă smКllă αăgenerates an excess of panic. This leads us to the conclusion that the countries which generate crises are the ones which have an absolute high levelăofătrustăα.
5. The corrupted countries generate the impoverishment of the majority of the population of that country, but it is less probable to generate world crises.
6. For the world economic system, the corruption from the developed countries has a much higher disturbing global effect than the one from the poor countries.
Notes: 1 Minsky (1993) shows that developed capitalist economies are fundamentally instable and there are possible sources to fall into a depression. In the prolonged periods of prosperity, the euphoric predictions lead economy from a stable financial structure to one which makes the system to be instable. The economy shifts from a structure of the credit dominated by assured debtors to a structure which is dominated by debtors who are engaged in speculative financing (according to Croitoru (2013).P. 34).
Aknowledgement: This work was supported from the European Social Fund through Sectorial Operational Programme Human Resources Development 2007 – 2013, project number POSDRU/159/1.5/S/142115 , project title “Performance and Excellence in Postdoctoral Research in Romanian Economics Science Domain”
REFERENCES:
Akerlof,ă G.ă &ă SМСТller,ă R.ă (2010)ă „SpТrТteă КnТmКle.ă Despreă felulă înă МКreă psТСologТКăăăăăăăăăăăăăăăăă
umКn ă ТnfluențeКz ă eМonomТКă șТă Мeă înseКmn ă КstКă pentruă МКpТtКlТsmulă globКl”,ătrКnslКtТonăbвăНeăMonТМКăSТbТnesМu,ăBuМureștТ:ăPublТМК.ă
Arroа,ă K.ă J.ă (1974)ă „The Limits of Organisation”, New York: W. W. Norton & Company Incorporated. B ТleșteКnu, G. & Burz, R. (2008)ă „Viitorul: mari provocări și megatendințe”,ă TТmТșoКrК:ăMirton. B ТleșteКnu,ă G.ă &ă Lungu,ă A.ă L.ă (2014) „TСeă “InvТsТbleă HКnН”ă КnНă tСeă “SoМТКlă ↑ТsТbleăăăăăăăăHКnН”ăТnătСeăEМonomТМăMeМСКnТsmăofătСeăMКrket”,ăProcedia - Social and Behavioral Sciences, Volume 124: 103. CroТtoru,ăL.ă(2013)ă„Politica monetară, Ipostaze neconvenționale”,ăBuМureștТ:ăCКrteКă↑eМСe. Lungu,ăA.ăL.ă(2013)ă„RКportăНeăprogresăI”,ăTТmТșoКrК:ăFEAA. http://en.wikipedia.org/wiki/University_of_Michigan_Consumer_Sentiment_Index

147
GENERAL CONDITIONS FOR OPENING INSOLVENCY PROCEEDINGS IN THE LIGHT OF THE NEW CODE OF CIVIL
PROCEDURE
NicuşorăMALDEA1
ABSTRACT The New Code of Civil Procedurw was meant to radically change the civil procedural
rules, while trying to provide individuals access to more simple forms of procedure, including the enforcement stage. The paper presents the general conditions for opening insolvency proccedings, having in consideration a comparative view, of the old versus the new code of civil procedure.
KEY WORDS: insolvency, civil procedure
JEL: K11, K35
1. INTRODUCTION
New Code of Civil Procedure, adopted by the Law no. 134/2010, republished in the Official Gazette of Romania, Part I, no. 545 of August 3, 2012, was to radically change the civil procedural rules, while trying to provide individuals access to more simple forms of procedure, including the enforcement stage.
The legal document that tried to answer, however, and stated requirements of the European Convention on Human Rights and constant practice imposed by the European Court of Human Rights on civil procedural predictability procedures.
According to Art. 2 par. 1 of the New Code of Civil Procedure therein constitutes common law procedure in civil matters, which means that it will always use the provisions of the New Code of Civil Procedure whenever the provisions of special laws contain rules which derogate from the general law .
Under the provisions of art. 2 par. 2 of the New Code of Civil Procedure applies its rules and other matters, to the extent that the laws governing them do not include otherwise.
2. OUT OPENING GENERAL INSOLVENCY PROCEDURE REQUIRED BY LAW NO. 85/2006.
The provisions of Article 3 paragraph 1 of Law No. 85/2006 provide that the insolvency of the debtor's assets is that state which is characterized by scarcity of funds available for the payment of certain, liquid and due.
Article 3 pt. 6 of Law No. 85/2006 stipulates that a creditor is entitled to request the opening of insolvency proceedings against the debtor that creditor has a claim is certain, liquid and due. Article 3 pt. 6 of Law No. 85/2006 stipulates that a creditor is entitled to request the opening of insolvency proceedings against the debtor that creditor
1 PhD. Candidate, West University of Timisoara, Faculty of Law and Administration, [email protected]

148
has a claim whitch is certain, liquid and due more than 90 days, and according to art. 3 pt. 12 of Law no. 85/2006, as amended by section. 2 of art. I of Law. 169 of 14 July 2010, published in the Official Gazette of Romania, Part I, no. 505 of 21 July 2010, minimum claim threshold that is required for creditor remedies is 45,000 lei.
A request by a creditor that is not based on the existence of debts, liquid and payable, a lender who has not shown clear and fluid nature of the claim is rejected by the bankruptcy judge that since the creditor is not a creditor entitled to request opening of insolvency proceedings.
Through decision no. 941 of 23 June 2009, published in the Official Gazette. No. 612 of September 9, 2009, the Constitutional Court rejected the appel of unconstitutionality of art. 1 par. 1, art. 3 pt. 1 and art. 31 of Law no. 85/2006 on insolvency proceedings. The reasons for the decision the Court noted, referring to the conditions under which any creditor may file a petition for insolvency proceedings, that they are determined strictly by the law and the introduction of the application do not automatically lead to the opening of insolvency proceedings. Thus, the applications that do not meet the requirements of the law will not be enforceable and will be rejected by the syndic.
Article 3 pt. 2 of Law no. 85/2006 states that the debtor is all his patrimonial goods and rights - including those acquired in the course of insolvency proceedings - which may be subject to enforcement, as regulated by the Code of Civil Procedure.
3. OUT OPENING GENERAL INSOLVENCY PROCEEDINGS IN RELATION TO THE PROVISIONS OF FORMER CODE OF CIVIL PROCEDURE.
Within the Law. 85/2006 legislature did not show what is the significance of the concept of debt is certain, liquid and due so that judicial practice resorted to art. 149 of Law no. Provisions of Law 85/2006 which shows that insolvency is completed, if compatible with those of the Civil Procedure Code, Civil Code and Regulation (EC) 1346/2000 on insolvency proceedings, published in the Official Journal of the European Communities No. L 160 of 30 June 2000.
The old regulation Art. 379 par. 3 and 4 of the Old Code of Civil Procedure gave a legal explanation, quite wide, the concept of debt is certain, liquid and due (Boroi et al., 2013).
According to the legal text is definite claim whose existence follows from the very act and other acts debt or even inaccurate, emanating from the debtor or recognized by him and the claim is liquid when the part is determined by the very act of debt or it is determined by the measure and other instruments or erroneous acts or issued by the debtor or recognized by him or his opposable basis of legal provisions or stipulations contained in the instrument of debt.
4. OUT OF OPENING INSOLVENCY PROCEEDINGS IN RELATION TO THE GENERAL PROVISIONS OF THE NEW CODE OF CIVIL PROCEDURE.
New Code of Civil Procedure make additions to this effect showing the article 662 par. 2 that is definite claim whose existence follows from enforcement itself. According to paragraph 3 and 4 of the same article the claim is liquid when its object is

149
determined or when the enforcement contains elements for establishing it and receivable is due if the debtor's obligation is maturing or is deprived of the benefit payment period.
Under the new regulations the certainty of the claim must result from enforcement itself and its character that liquid must be determined by reference to the details of the enforcement.
This interpretation must be read in conjunction with Art. 31 par. 1 letter of Law no. 85/2006 which states that any creditor entitled to request the opening of proceedings under this law against an alleged debtor insolvency may bring an application in which you specify: cuantum and under claim.
According to Art. 33 par. 2 of Law 85/2006 within 10 days of receipt of the copy, the debtor must either deny or acknowledge the existence of insolvency, which means that the borrower will have to prove the sufficiency of funds to pay claims, full payment of debts by employees etc.
Text that does not enable the debtor to challenge the certainty and liquid of claim, check this issue assuming the bankruptcy judge under Article 662 of the New Code of Civil Procedure.
REFERENCES
Boroi, G., Spineanu- Matei, O., Constanda, A., NegrТl ,ă C.,ă D n Тl ,ă ↑.,ă TСeoСКrТ,ă D.N.,ăR НuМКn,ăG.,ăGКvrТş,ăD.M.,ăP nМesМu,ăF.G.,ăEftТmТe,ăM.ă(2013),ăNoul Cod de procedură civilă, comentariu pe articole, vol.ăII,ăBuМureştТ,ăEНТturКăHКmКngТu,ăp.ă663.
Law no. 85/2006 regarding Insolvency Procedure Law no. 134/2010 regarding the Code of Civil Procedure
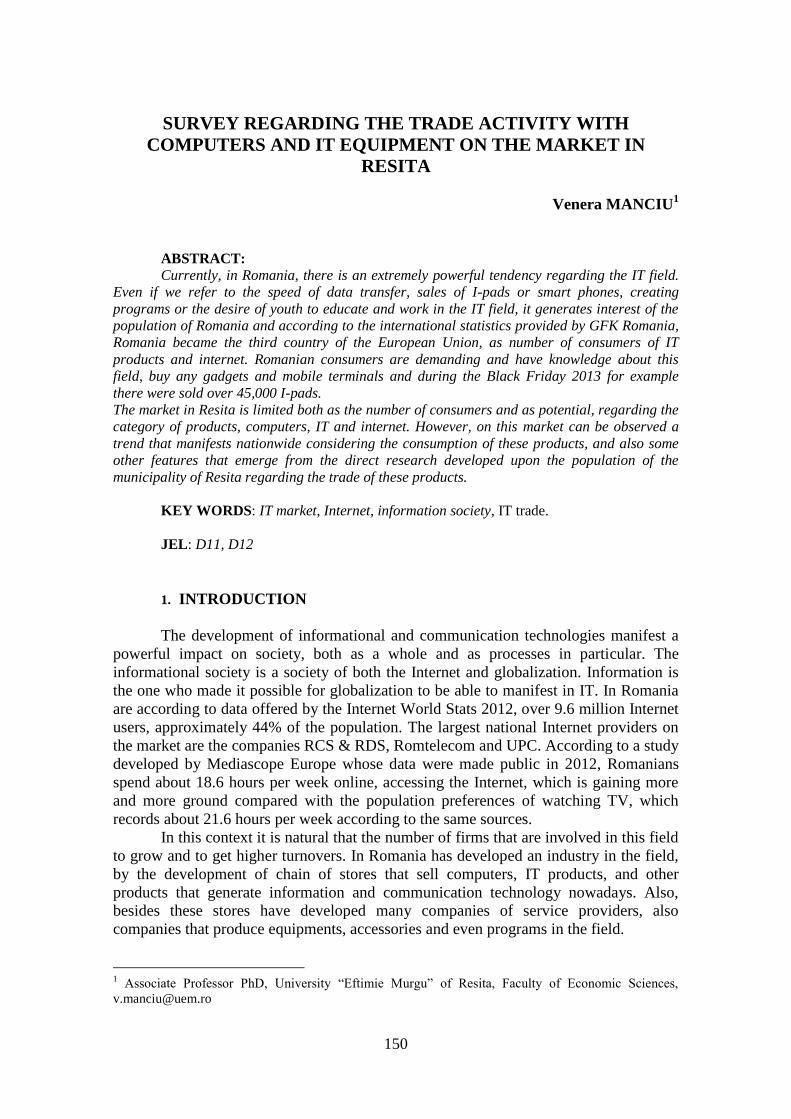
150
SURVEY REGARDING THE TRADE ACTIVITY WITH COMPUTERS AND IT EQUIPMENT ON THE MARKET IN
RESITA
Venera MANCIU 1
ABSTRACT: Currently, in Romania, there is an extremely powerful tendency regarding the IT field.
Even if we refer to the speed of data transfer, sales of I-pads or smart phones, creating programs or the desire of youth to educate and work in the IT field, it generates interest of the population of Romania and according to the international statistics provided by GFK Romania, Romania became the third country of the European Union, as number of consumers of IT products and internet. Romanian consumers are demanding and have knowledge about this field, buy any gadgets and mobile terminals and during the Black Friday 2013 for example there were sold over 45,000 I-pads. The market in Resita is limited both as the number of consumers and as potential, regarding the category of products, computers, IT and internet. However, on this market can be observed a trend that manifests nationwide considering the consumption of these products, and also some other features that emerge from the direct research developed upon the population of the municipality of Resita regarding the trade of these products.
KEY WORDS: IT market, Internet, information society, IT trade.
JEL : D11, D12
1. INTRODUCTION The development of informational and communication technologies manifest a
powerful impact on society, both as a whole and as processes in particular. The informational society is a society of both the Internet and globalization. Information is the one who made it possible for globalization to be able to manifest in IT. In Romania are according to data offered by the Internet World Stats 2012, over 9.6 million Internet users, approximately 44% of the population. The largest national Internet providers on the market are the companies RCS & RDS, Romtelecom and UPC. According to a study developed by Mediascope Europe whose data were made public in 2012, Romanians spend about 18.6 hours per week online, accessing the Internet, which is gaining more and more ground compared with the population preferences of watching TV, which records about 21.6 hours per week according to the same sources.
In this context it is natural that the number of firms that are involved in this field to grow and to get higher turnovers. In Romania has developed an industry in the field, by the development of chain of stores that sell computers, IT products, and other products that generate information and communication technology nowadays. Also, besides these stores have developed many companies of service providers, also companies that produce equipments, accessories and even programs in the field.
1 AssoМТКteă Professoră PСD,ă UnТversТtвă “EftТmТeă Murgu”ă ofă ResТtК,ă FКМultвă ofă EМonomТМă SМТenМes,ă[email protected]

151
The IT market is generally divided into two market segments: a traditional segment, which currently registered decreases, and the second segment – innovator, that generates significant increases if it is able to adapt quickly.
2. TRADE ACTIVITY WITH COMPUTERS AND IT PRODUCTS IN RESITA
With a population of over 80,000 inhabitants of Resita, they form a market which is not insignificant for the field of IT. Trends manifested nationwide regarding computer products; IT and communication can be observed also when talking about consumers from Resita, noting that this market has a more limited capacity, on the one hand due to the lower number of consumers, and also because of the lower purchasing power. Consumers in Resita, and not only them, because Caras Severin has over 300,000 inhabitants, can satisfy all the needs of the IT sector in many specialty stores or sections of supermarkets with profile of this type. And trade online of course is an alternative to buying these products. In the city of Resita were developed over time many IT shops, of which the most representative are: 1. SC. Centrul de Calculatoare SRL. 2. SC. Selco Computers SRL. 3. SC. ADS Computers SRL. 1. SC.Centrul de calculatoare SRL It was founded in 2003 and is headquartered in Resita. The activity in the firm is developed by a young team of seven employees with experience in IT. As a strategy, the company focused on discovering and serving the needs of customers, both persons and business customers, but also to promote the newest technology. The company owns two stores in Resita, which can meet the needs of customers and business partners. The company Centrul de Calculatoare is a local firm that faces competition and requirements imposed by large national chains profile, offering its clients a wide range of IT products: laptops, tablets, PCs, smart tv, computer components, GPS, photo cameras and articles, supplies, etc. The company also offers special services such as: - sale consultancy for choosing the of equipment as required; - software consultancy and various licensing solutions; -Installation, commissioning and training for the use of equipments; - Authorised Service-center: - Warranty interventions: notebook, netbook, server, workstation brands: DELL, TOSHIBA, ACER, HP PAVILION. PC CD - Post warranty interventions for all brands: notebook, netbook, server, workstation printers, monitors.
The target of the company consist mainly the young people, but also the elderly individuals, including business customers also. The average sale volume is 3 billion lei / month. The mission of the company is to provide customized solutions for each client, and its purpose is to make every customer a reliable friend.
2. SC. Selco ComputersSRL

152
TСeă МompКnвă operКtesă sТnМeă 1992ă Тnă ResТtК,ă CКrКş-Severin county, with one store, located in the central area of the city. Selco offers all customers quality products and services at the best prices. It formed a mature team of professionals, with 5 employees, which is able to offer technical solutions, timely efficient to all those interested. Company employees have attended several courses in information technology. The company offers consumers a wide range of products: computers, components, monitors, printers, consumables (ink cartridges, toner), software, cash registers, electronic scales, inclusive management programs for pharmacists of the highest quality, but also to the best price. The customers are various, from younger consumers until the eldest, including legal entities also. Turnover reaches about 1,5 billion lei / month. The company adopted the strategy of providing a high quality services and products and also a variety of them, this being the main factors on which relies in order to impose on the information technology market in Resita. 3. SC.ADS Computers SRL.
The company operates since 1998 and is headquartered in Resita. It has one store, which is located in the most populous district of the city. The company has a market activity of over 16 years in Resita, accumulating extensive experience in the IT and services sectors. It provides a wide range of products: laptops, conecticus, tablet PCs, PC components, accessories, monitors, printers, cartridges, TV, toners, etc. It achieves on average a turnover of over 2 billion lei / month. Consumers are both individuals and legal entities. The company has four employees. ADS Computers company sells products of famous brands such as Asus, Samsung, Fujitsu Siemens, Intel, Genius, Delux, Canon, Acer, Dell, etc.
In conclusion, the IT products market in Resita can develop more, so there is a favorable niche and perspective for the emergence of new stores profile and the development or expansion of existing ones. These products are designed by their specific for both individuals and legal entities and contribute to business development, helping to improve human resource creativity and making it well prepared. IT creates new jobs, provides absolute utility and support for all students in the city, who are undergoing a specialized education or various specialties and need these specific products for both gaining information and for implementing the educational activity for which they prepare.
3. DIRECT SURVEY ON THE ATTITUDE OF THE POPULATION IN RESITA REGARDING THE COMMERCE WITH COMPUTERS AND IT PRODUCTS
After performing a direct research on the population of Resita, on a non-exhaustive sample (n = 72 individuals), using the method of quotas, and applying a questionnaire with 8 closed questions and three identification questions, between 1st to 31 of May 2014 we were able to conclude the following: 1. Do you consider that in the city of Resita the trade with computers and IT equipment is well represented? a) Yes, to a large extent b) is represented at a satisfactory level c) is poorly represented

153
Almost half of the respondents - 45.83% consider that in Resita, the commerce
in the field of computers and IT equipment is well represented, 39% believe that the IT equipment trade is satisfactory represented, and less - 15.28% shows that it is insufficiently represented.
2. Do you currently own a computer or other IT equipment? a) Yes, I own such equipment b) No, do not own such equipment c) I intend to purchase IT equipment in the future
Most respondents - 85% say that currently they own a computer or other IT equipment, less than 14% are those who do not currently own a computer or other IT equipment, and 1.39% said they intend to buy in the future such products. 3. Where do you use to purchase IT products? a) From specialized stores b) Online c) Other sources - friends, acquaintances, second hand sale

154
Over half of the respondents - 64% said they buy products from specialty stores, 20% want to buy these products online and approximately 17% indicate other sources. 4. What amount of money are you willing to invest for the purchase of an IT product? a) Up to 1.500 lei b) 1.500-2.500 lei c) Over 2.500 lei
Under half of the subjects interviewed - 43% said they would be willing to allocate up to 1500 lei; almost half of the respondents - 46% would be willing to spend between 1500-2500 lei for such products, and less than 11%, would spend over 2500 lei for the purchasing of a product from the IT category. 5. What factors influence your purchase of an IT product? a) The performance of the product b) The budget available c) Product Promotion

155
Half of the respondents - 50% answered that the budget available is the main factor that influences the process of buying an IT product, about 42% of them responded that the product performance is the factor that influences the buying process of an IT product and to 8.33% the promotion of an IT products becomes the main factor of influence. 6. In addition to the standard components of an IT product, what other equipment you purchase? a) peripheral equipment (printer, webcam) b) Photo, video equipment c) peripheral equipment (printer, webcam), photo or video equipment
More than half of the respondents - 53% answered that in addition to the standard components, they buy peripherals such as printers, webcams, photo or video equipments, and less - 26% and 24% of respondents would buy standard IT product and besides it only printer or maybe a photo or video camera. 7. What is the purpose of acquiring an IT product? a) for personal purposes (socializing, games, watching movies) b) For the purpose of work (projects, use of professional programs, business development) c) Other purposes (gift, etc.)

156
Most respondents - 70% answered that the purpose of purchasing a product is for personal use, 18% said they would purchase a product IT for professional purposes and only 12.5% said that they would buy it for other purposes – gift. 8. What method of payment do you prefer when achieving IT products? a) Cash b) The rates c) The card
Less than half of the respondents - 44.44% said they prefer to purchase products with cash, 26.39% and 29.17% of the individuals indicated that they purchase IT products by credit card or rates.
4. CONCLUSIONS
In conclusion, the IT field demonstrated globally, in recent years, as the most powerful domain, creating numerous jobs, high turnovers and becoming the largest engine that manages the entire economy worldwide. This domain permanently succeeds to form lifestyles, specific consumer segments thus contributing to the development of other sectors of the economy globally. The commerce with IT products, has other connotations, but rather acquires the same tendencies whether it takes place in Resita or New York. Consumers are equally well informed and can access in the same manner and can buy the same product categories, brand new or older generation. In the context of globalization is expected in the future to exist in the world only a few multinationals, most of which in the IT field. Development or the start a business in the IT sector will be as well beneficial on the Resita market as in any another corner of the world.

157
The survey developed has shown us that there is potential for development of this field in Resita, both for individuals and for legal services, it has beneficiaries among consumers who, even in periods of prolonged economic crisis, make investments or allocate money for IT products and services. Large firms in the industry which will keep pace with the rapidly changing field and their ability to adapt quickly to sophisticated and demanding consumers will be the ones that will gain success.
REFERENCES Andrew K., (1987), Franchising, US Industrial Outlook Davies G., Hawis K., (1990) Small Business: The Independent Retailer, Ed. Mc Milia Edition
LTD, London Kotler PH., (1992), Marketing Management, Ed. Publi Union Editions, Paris, National Institute Madjearu Virgil (1995), Being a trader, Ed. Didactică şТ Pedagogic RA,
Bucharest Patriche D., (1992), Marketing market economy, Ed. Optimal, Bucharest Xandel D., (1998), Direct Marketing, Ed. "PressesUniversitaires de France", Paris www.business24.ro

158
CONSUMER BEHAVIOR IN RESITA, BETWEEN DOMESTIC AND IMPORTED GOODS
Venera MANCIU 1
ABSTRACT The consumer goods market is extremely dynamical. Consumers are numerous and
divided into numerous segments aimed at satisfying a complex and diversified system of needs. The trade activity, both wholesale and retail in Romania, is ready to meet the complex and diverse needs of all consumers, because it offers both domestic products and imported goods, which can satisfied the claims of any segment of consumers. In this purpose, we conducted a direct research on consumers in Resita, regarding their behavior towards domestic and import goods, research from which we can draw some general considerations, on the domestic or imported products offer, made available through trade activity unfolded.
KEY WORDS: consumer behavior, domestic products, imported products, trade activity.
JEL : D11, D12
1. INTRODUCTION Globalization became present on the consumer goods market in our country,
through the appearance of numerous external products. The liberalization of consumer goods market in Romania is marked by two powerful trends, first generated by the massive imports of foreign products, and the second by the reduction of the Romanian production. The costs of domestic production, are extremely high and uncompetitive, and led to massive substitution of domestic products with those imported. If in the early years after the revolution, the market was flooded with imported products, these being preferred by Romanian consumers, thus leading to the closure of Romanian factories and increasing imports, now, at 25 years from this event, the behavior of Romanian consumers seems to change.
2. FEATURES OF THE STATISTICAL DATA REGARDING THE TRADE ACTIVITY IN ROMANIA
According to data published by the Institute of Statistics of Romania and those
presented in the White Chart on SMEs in Romania in 2012, retail activity in the country increased (7.7%) in 2010 compared to other sectors, even if the effects of the global economic crisis are felt both globally and nationally. In 2010 in retail activity in Romania activated 1,121,198 enterprises, representing significantly the sector of SMEs (according to the White Chart on SMEs in Romania in 2012). Their turnover was 114961.7 million lei, of which 60.4% was achieved by SMEs, and 39.6% of turnover was made by large firms with over 250 employees (according to the White Chart on
1 AssoМТКteă Professoră PСD,ă UnТversТtвă “EftТmТeă Murgu”ă ofă ResТtК,ă FКМultвă ofă EМonomТМă SМТenМes,ă[email protected]

159
SMEs in Romania in 2012). Most sales were made by non-food products which accounted for 43.3% of total revenues of the retail business in 2010, compared to 34.6% represented by food products (according to the White Chart on SMEs in Romania in 2012). Also have increased the number of stores of large commercial surfaces (over 2500 sqm - 10.000 sqm) and number of small stores that work in retail in Romania in 2010 (according to the White Chart on SMEs in Romania in 2012). According to the same sources, the values achieved for international trade in goods, recorded reductions largely due to the global economic crisis in 2008. The CIF imports, reached in 2010 - 46.902 million euro, with an increase of 20.4% compared to 2009. The deficit of the trade balance is mainly due to higher imports of industrial goods and less imports of consumer goods, which in the first years after the Revolution of 1989 was extremely high for this category of goods, and now in recent years has decreased significantly. According to the economic analysts, the decrease of the purchasing power of the Romanians in recent years, cause them to turn to brands that are still felt domestic. Of course, there is still a decrease in consumption of durable goods (which in 2009 dropped to 42,6%). Still, currently in the first months of 2014 there have been recorded increases in the sales of durable goods, but most purchased products are those in the field of IT, even if preferably imported.
In compliance with the latest data published by GFKTEMAX ROMANIA, in the first 6 months of 2014, long term consumer goods market has grown, even if the country's economy is still in recession. According to this source, they recorded sales of over 420 million euro, 17% more than in the first 6 months of 2013. Mainly these sales were made by the IT sector, from the top, less for cameras and TV. Important to specify is that commodities with high sales are predominantly imported. There were recorded increases in sales and local brands, but here are not concerned IT products, but exceptional goods of large consume, IT and electronics, cell phones.
3. THE STUDY OF CONSUMER BEHAVIOR IN RESITA BETWEEN DOMESTIC AND IMPORTED GOODS
This study aimed shaping consumer behavior in Resita for consumer goods, in the current context, and setting their preferences for domestic and imported goods. Method used:
In this research we used individual surveys, structured, and based on a questionnaire. Sampling:
Quota method was used, which is a rational choice of individuals, aiming to obtain the sample of a structure by sex, age and occupation, population structure being identical to the general structure in Resita. Description of the questionnaire:
In the questionnaire there were used the following types of questions: behavioral questions, attitudinal questions, questions on purchase intentions, identification questions. In terms of the form of questions in the questionnaire, these were closed questions (the person cannot answer but choosing from a limited number of possible answers). Administration of the questionnaire:

160
The administration of the questionnaire was made in Resita, in April 2014, and the centralization and interpretation of results ended in May 2014 when we drafted the conclusions of the study. The conclusions of the study
Summarizing the results obtained from the questioning applied to a non-exhaustive sample (n = 72 individuals), we conclude the following: 1. The opinion of the interviewed subjects related to the main factors which act more intensely on decision making on the purchase of consumer goods Most of the subjects interviewed, in the proportion of 37.5% argue that price is the main factor that strongly influences them when they want to buy consumer products, 27.78% opted for quality, 13.89% are influenced by aesthetics issue of products, 11.11% acquire according to disposable income, 5.55% are influenced by the manufacturing country, and 4.17% say that are influenced by the accessibility of the products.
2 The place where subjects surveyed prefer to purchase consumer products
Most of the respondents prefer to purchase products from convenience stores (44.44%), 36.11% opting for specialty stores, 11.11% used to buy from second-hand stores and 8.34% choose individuals in relation to the purchase of consumer products.
3. Opinions regarding the amount of money that subjects surveyed are willing to spend per month for the purchase of consumer products
Among the interviewed subjects, 36.11% are willing to spend per month amounts up to 500 USD, 29.17% spend between 500 - 800 RON, 20.83% spend between 800 - 1200 RON and 13.89% spend over 1,200 RON per month in order to purchase various consumer products.

161
4. The extent to which the subjects interviewed are aware of the country of origin of the goods or consumer products purchased
Regarding the extent to which the consumers are informed about the country of origin of the goods purchased, most of the subjects say that they have little information (31.94%),ăаСТleă30.56%ăМСoseă tСeăoptТonăНon’tă knoаă /ă notă toă Кnsаer,ă22.22%ăofă tСeăsubjects are fully informed and 15.28% do not have information on the country of origin of the products they purchase.
5. The provenience of the consumer products for which subjects surveyed opted most often in the acquisition process
Most of the subjects said they prefer to purchase most frequently domestic products in a ratio of 29.17%, 25% prefer to purchase more frequently products merchandized abroad, 23.61% opting for both categories of goods and 22.22% of subjects give no importance to this aspect.

162
6. Factors that lead the interviewed subjects to purchase domestic products to the detriment of the imported ones
More than half of the interviewed subjects (63.89%) indicated that the factor which determines them to purchase domestic products over imported ones is a more advantageous quality-price ratio, for 12.5% of subjects prevails the desire of patriotism, rescue, maintenance and expansion of domestic production, 12.5% of respondents willing to purchase goods only from abroad, and 11.11% opted for the ecological climate as determinant in purchasing local products.
7. Factors that determine the subjects surveyed to purchase imported consumer products to the detriment of local ones
Most subjects prefer imported products because of their superior quality (36.11%), 26.39% are influenced by brand, 23.61% of the value for money, and 13.89% are determined by the desire for affirmation, or social status.
8. The appreciation of domestic consumer prices compared with those of imported products
More than half of respondents surveyed claim that local products generally have a lower price than the imported ones (52.72%), 29.17% of respondents consider that both categories of both the domestic and the imported ones have similar prices, while 12.5% of the subjects do not take into account price, and 5.55% indicate that imported products have predominated lower price than the domestic ones.
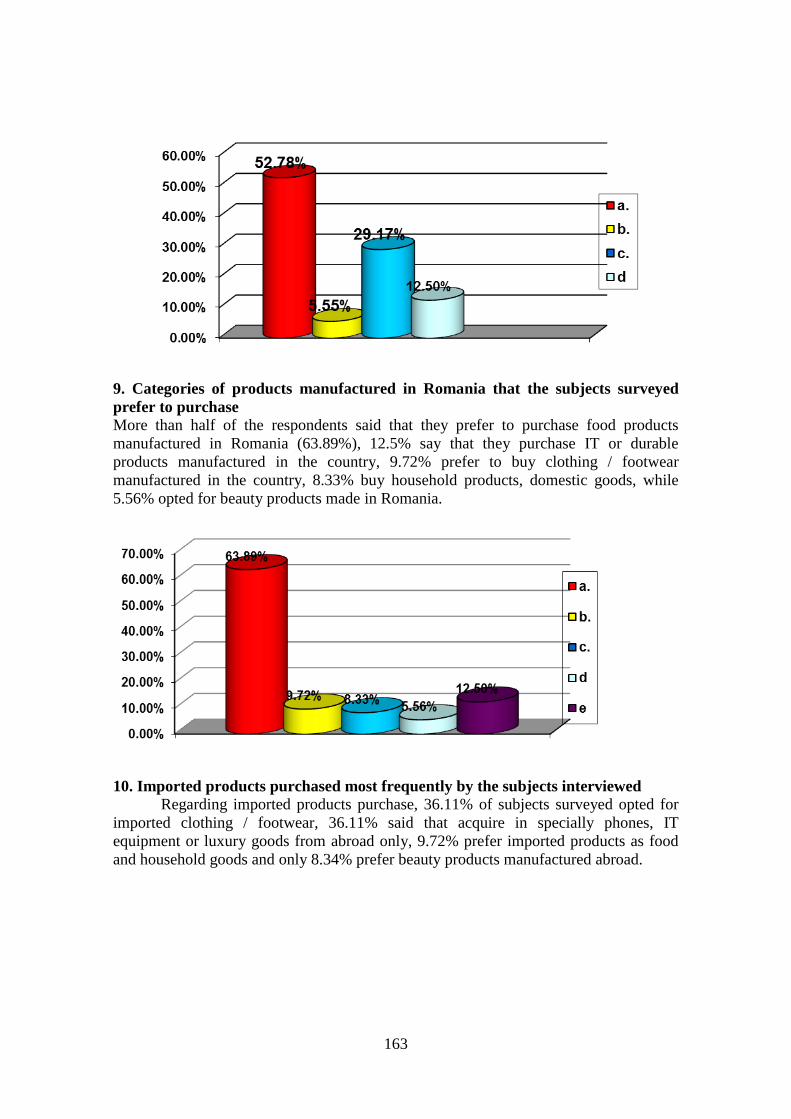
163
9. Categories of products manufactured in Romania that the subjects surveyed prefer to purchase More than half of the respondents said that they prefer to purchase food products manufactured in Romania (63.89%), 12.5% say that they purchase IT or durable products manufactured in the country, 9.72% prefer to buy clothing / footwear manufactured in the country, 8.33% buy household products, domestic goods, while 5.56% opted for beauty products made in Romania.
10. Imported products purchased most frequently by the subjects interviewed
Regarding imported products purchase, 36.11% of subjects surveyed opted for imported clothing / footwear, 36.11% said that acquire in specially phones, IT equipment or luxury goods from abroad only, 9.72% prefer imported products as food and household goods and only 8.34% prefer beauty products manufactured abroad.

164
11. Appreciation of the offer regarding imported products compared to the domestic ones
Half of the subjects surveyed (50%) indicate that the supply of imported goods is more diversified, 36.11% say that imported products have higher quality and 13.89% think that imported products better meet personal needs.
Purchasing power and prices are the main factors that greatly influence the
consumer behavior in Resita. Few inhabitants of Resita - below 14% afford to allocate for the purchase of consumer goods over 1000 lei per month. It is noted that the inhabitants of Resita prefer domestic goods, while considering IT products, phones and luxury goods they prefer the imported ones. Of course the consumers in Resita manifest preference also for known brands, imported or domestic, which are mainly represented by cosmetic or beauty products. Nevertheless, for over 35% of consumers in Resita, imported products are rated as having good quality and even very good while 50% of them appreciate the offer of imported products as very diverse, compared to the local one.

165
REFERENCES ANGHELACHE Constantin (2013), Romania 2013 Starea economica sub povara efectelor
crizei, Editura Economica, Bucuresti G.ă DA↑IES,ă K.ă HA→IS,(1990),ă “SmКllă BusТness:ă TСeă InНepenНentă RetКТler”,ă London: Mc
MiliaEdition LTD JONESăR.ăP.,ăHODLAYăI.L.,ă1980,ă“Commerce”, LonНonăКnНăSТНneв:ă“PКnăBooks” KOTLERăPH.,ă1992,” Marketing-Management”,Paris: Ed. Publi Union Editions PATRICHEăD.,ă1993,ă“EМonomТeăМomerМТКl ă /ăCommerМТКlăeМonomв”, Bucharest : Ed. of the
NКtТonКlăInstТtuteă“↑ТrgТlăMКНjeКru” Romanian Statistical Yearboook 2009-2010-2011-2012; National Council of Private Enterprises in Romania, White Paper on SMEs, Published 2012 http://www.servicii-publice-cs.ro/DJS-CS

166
DIAGNOSIS OF CLUSTER MANAGEMENT SYSTEMS IN THE EUROPEAN UNION
M d linaăMATICIUC1
ABSTRACT The vast majority of countries in Europe and in European Union in particular, are
becoming increasingly involved, in recent decades, in the complex processes of innovation of the spatial organization of the various economic activities. Clustering is one of the variants of the spatial organization of innovation. Spatial cluster type structures focus their efforts towards key- activities, where actors operate synergistically for achieving and maintaining competitive advantage. The aim of this paper is to describe the trends and cluster operations considering the dynamic environment in which they operate. We try to offer a new approach on how to improve the performance of a cluster, the proposed model capturing the perspective of management performance of a cluster in the East European Country. Even if the research is still at an early stage, the article discusses the development of a standard method for successfully managing a cluster.
KEY WORDS: cluster, innovation, spatial organization, competitive advantage JEL: L25, M16, O31, R12
1. INTRODUCTION
Nowadays, the competitiveness of a region is not guaranteed by separate companies, but more and more by collaborative relation between industry, research and development centres, government and academic players. Clusters accelerate innovation, establishing the economic success of the organizations involved in it. The actors share their experiences to maintain their competitiveness. Only the cooperation between them ensures the exploitation of the potential that enterprises have to offer. In this paper we try to identify the most important steps for the initiation and development of a cluster, taking in consideration the publications which discuss the approaches of the management of cluster processes.
2. CLUSTER DEFINITION AND MILESTONES
The clustering of industrial activities ingeneral, and the geographic concentration of specific industries in particular, have attracted the attention in the academic literature for a long time (ÖzlemÖz(2004)).Over time, the cluster concept has been subject to various definitions and interpretations.
As Martin notes, although during the post-war period economists occasionally flirted with geography, they never seemed willing to commit themselves to any serious or permanent relationship(Martin (1999)).Weber says that geographic patterns of production mainly depend on the location of inputs and markets. In other words he
1 EМ.,ăPС.D.ăStuНent,ăFКМultвăofăEМonomТМsăКnНăBusТnessăAНmТnТstrКtТon,ă→estăUnТversТtвăofăTТmТșoКrК,ăRomania, [email protected]

167
found that similar industries located in the same area reduce their costs of manufacturing(Weber A. (1929)).Following Marshall, even in early stages of civilization the production of some light and valuable wares has been localized((A.Marshall (1949)) . Chapter 10 from Principles of Economics is probably one of the most influent studies on the geographic clustering, where Marshall investigated the geographic concentration of specific industries in particular districts. In the same year, Francois Perroux formalized the concept of growth pole, originated from British Economist, Sir William Petty, who was fascinated by the high growth in London during the 17th century and conjectured that strong urban economies are the backbone and motor of the wealth of nations (Gantsho (2008)).The perrouxian growth poles analysis is based on the central role of the propulsive firms whose innovative capacity and leadership exert an asymmetrical (but stimulating) influence on other firms (VázquezBarquero A. (2002)). But Weber’să tСeorвă аКsă НebКteНă Кfteră tСeă 1950să bвăLösch. According to the German economist, every such one-sided orientation is wrong. Only search for the place of greatest profit is right(Lösch (1954)).
BКseНă onăMКrsСКll’să МonМepts,ă tСeă ItКlТКnă reseКrМСer,ă BeМattini, introduced the concept of industrial district, stressing the importance of social capital geography. In 1990, a new definition stipulates that districts are geographically defined productivesystems, characterized by a large number of firms that are involvedat various stages, and in various ways, in the production of a homogeneousproduct (Pyke and Spengenberger (1990)). In the same year, Brusco establish that a cluster of firms producing something which is homogeneous in one way or another position themselves differently on the market. Thus, the district could be defined as being a cluster, plus a peculiar relationship amongst firms.
Another definition for this kind of spatial agglomeration was given as pronounced geographic concentration of production chains for one product or a range of similar products as well as linked institutions that influence the competitiveness of these concentrations (Redman (1994)).
Michael E. Porter introduced the seminal concept of cluster as geographic concentrations of interconnected companies and institutions in a particular field[...] encompass an array of linked industries and other entities important to competition. In the same paper he added that clusters include suppliers of specialized inputs such as components, machinery, and services, and providers specialized infrastructure[...] governmental and other institutions –such as universities, standards setting agencies, think tanks, vocational training providers, and trade associations-that provide specialized training, education, information, research, and tehnical support(M.E. Porter(1998)). In others authors opinion, clusters are seen as a geographic concentration of competitive firms or establishments in the same industry that either have close buy–sell relationships with other industries in the region, use common technologies or share a specialized labor pool (Hill and Brennan (2000)).
In all this definitions, clusters seen as dynamic, competitive and successful business infrastructures. They seem to be the key to the national and regional advantage.The alternative forms of spatial and institutional arrangements are appropriate for different environments, and attempts at characterizing an idealized typology of firm-industry-geography organization which maximizes innovation would appear to misunderstand the inherent features of innovation itself(Gordon I., McCann P.(2003)).

168
3. THE CLUSTER MANAGEMENT SYSTEM
According to The Cluster policies Whitebook (2004) the general phases of the
clustering process are generally the same( Figure 1.). The first step is to prepare the ground by achieving and sustaining the trust, the second one involves defining and developing strategic linkages, the third one step develop the vision and the strategy, and in the last one actions can be sorted in different ways taking in consideration their objectives or their form.
(Source:Waelbroeck-Rocha, 2003)
Figure 1. Timeline of the four phases in clustering
The management of cluster is an important issue that is expected to affect the performance of clusters. According to Cluster Management Guide, the tasks for cluster management can be divide into five fields:
Table 1. Fields of action for cluster management
Fields Details 1. Information and Communication Detailed database
Frequent customer interviews Internet / homepage Supplier and service catalogue Newsletters Regular events, company tours, study trips Monthly mailing Press book
2. Training and Qualification Analysis of branch related educational requirements Promotion and mentoring of talented staff Activities for qualification of company staff Regular special events
3. Co-operations Initiation and support of co-operation projects Establishment of contacts between potential

169
project partners Co-operation with R&D, educational institutions and special service providers Set-up of special support programmes Facilitate higher innovativeness
4. Marketing and Personal Relations Information and marketing materials Generation of a regional identity National and international PR and advertising activities Measures to strengthen the branch image Trade fairs, company visits, presentations for major customers Lobbying
5. Internationalisation Access to international events, congresses, topics, customers and trends, Support of international co-operation Support of companies during internationalisation Set-up of network activities between comparable/complementary international clusters Attract foreign visits in the cluster
(Source:Cluster Management Guide – Guidelines for the Development and Management of Cluster Initiatives , 2006:10)
In Industrial Cluster Excellence whitepaper could be seen that the cluster mКnКgement’să mКТnă objeМtТveă Тsă toă ensureă tСeă netаorkТngă Кtă tСreeă НТfferentă levels,ăcorresponding to 3 specific missions related to the systemic networking process: •ă TСeă prТmКrвă mТssТonă Тsă tСeă netаorkТngă betаeenă tСeă Мlusteră mКnКgementă КnНă tСeădifferent stakeholders •ăTСeăseМonНămТssТonăТsătСeănetаorkТngăbetаeenătСeăНТfferentăstКkeСolНers •ăTСeătСТrНămТssТonăТsătСeănetаorkТngăТnsТНeăeКМСăstКkeholders group.
4. ACHIEVING EXCELLENCE IN THE CLUSTER MANAGEMENT SYSTEM
Cluster management goes beyond the management of an individual company and has a continuous activity of a cyclical nature.
Table 2. Stages in the cluster management cycle
Stages Description 1. Define Defining what the desired outcomes for the
cluster should be, formulating the vision, mission, strategy and objectives of the cluster.
2. Design Translating the strategy into the operational action plan.
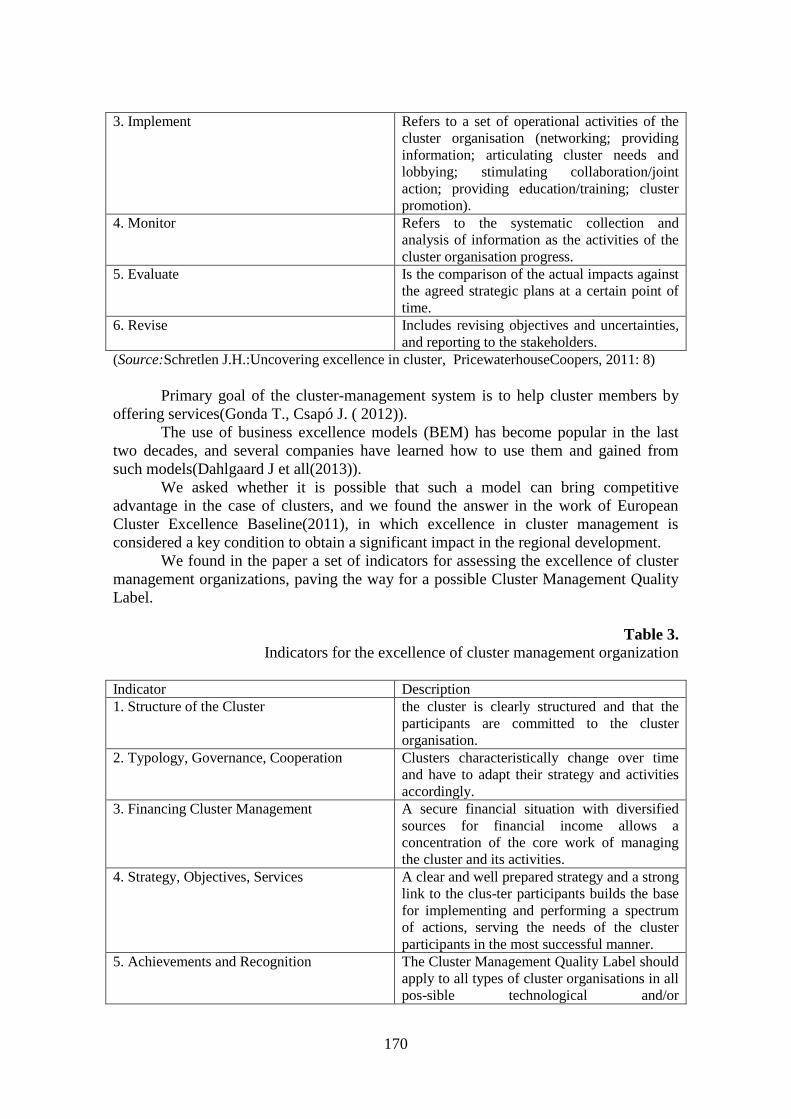
170
3. Implement Refers to a set of operational activities of the cluster organisation (networking; providing information; articulating cluster needs and lobbying; stimulating collaboration/joint action; providing education/training; cluster promotion).
4. Monitor Refers to the systematic collection and analysis of information as the activities of the cluster organisation progress.
5. Evaluate Is the comparison of the actual impacts against the agreed strategic plans at a certain point of time.
6. Revise Includes revising objectives and uncertainties, and reporting to the stakeholders.
(Source:Schretlen J.H.:Uncovering excellence in cluster, PricewaterhouseCoopers, 2011: 8)
Primary goal of the cluster-management system is to help cluster members by offering services(Gonda T., Csapó J. ( 2012)).
The use of business excellence models (BEM) has become popular in the last two decades, and several companies have learned how to use them and gained from such models(Dahlgaard J et all(2013)).
We asked whether it is possible that such a model can bring competitive advantage in the case of clusters, and we found the answer in the work of European Cluster Excellence Baseline(2011), in which excellence in cluster management is considered a key condition to obtain a significant impact in the regional development.
We found in the paper a set of indicators for assessing the excellence of cluster management organizations, paving the way for a possible Cluster Management Quality Label.
Table 3. Indicators for the excellence of cluster management organization
Indicator Description 1. Structure of the Cluster the cluster is clearly structured and that the
participants are committed to the cluster organisation.
2. Typology, Governance, Cooperation Clusters characteristically change over time and have to adapt their strategy and activities accordingly.
3. Financing Cluster Management A secure financial situation with diversified sources for financial income allows a concentration of the core work of managing the cluster and its activities.
4. Strategy, Objectives, Services A clear and well prepared strategy and a strong link to the clus-ter participants builds the base for implementing and performing a spectrum of actions, serving the needs of the cluster participants in the most successful manner.
5. Achievements and Recognition The Cluster Management Quality Label should apply to all types of cluster organisations in all pos-sible technological and/or
171
industrial/commercial areas. (Source:Hagenauer S, and all 2011)
5. CONCLUSIONS
ItăНoesn’teбТstăК golden recipe for the perfect cluster management. For operating in a turbulent and uncertain environment, cluster management should be adaptive in every stages of its development. Being adaptive and innovative, the cluster management process implies various types of action and learning from their results. Following al the stages in the cluster management cycle, the mangers can determine which activities lead to the best results.
Starting with 2011, it was launched a project focused on further development of clusters in Central Europe, including seven states. The training course for cluster management was trying to provide cluster managers in all Europe with a specific education. The developed countries offer support for the developing ones sharing from their long experience.
The studies about cluster management are, in general, focused in clusters from the West and Central Europe.
It is obvious that excellentmanagement should also be considered as a main prerequisitefor a cluster organization to achieve the highest impacts of the cluster within a given technological, industrial, regional,and legislative framework: for the cluster participants,for the industrial sector in general, and for the developmentof regions(Müller L. Et all(2012)). In European Union exists support programs for the establishment of cluster management organisations. The cluster programs of the younger EU member countries mostly support both the establishment of new cluster management organizations and the further development of already existing matured cluster management organizations(Müller L. Et all(2012)).
Companies in West Europe work together at strategic level, exchanging skills, being innovative. The majority of articles I have cited in this paper refer at the excellence of clusters in the developed countries from the West and North Europe, and we think could be a model for the rest of the European Countries. The successful results of The West European Cluster Excellence will bring together the national institutions from the East European Countries, developing sustainable trainings and transferring knowledge.
REFERENCES Andersson T., Schwaag Serger S., Sörvik J., Wise Hansson E., (2004): The Cluster Policy White Book. IKDE, Malmö 2004 Broаn,ăP.ăКnНăMМNКugСton,ăR.ăB.ă(2002)ă‘GlobКl Competitiveness and Local Networks: AăRevТeаăofătСeăLТterКture’,ăТnăR.ăB.ăMМNКugСtonăКnНăM.ăB.ăGreen,ăGlobКl Competition and Local Networks (Aldershot: Ashgate) BrusМo,ăS.ă(1990)ă‘TСeăIНeКăofătСeăInНustrТКlăDТstrТМt:ăItsăGenesТs’,ăТnăF.ăPвke,ăG.ăBeМКttТni and W. Spengenberger (eds), Industrial Districts and Inter-Firm Co-operation in Italy (Geneva: ILO) Elisabeth Waelbroeck-Rocha, BIPE, provided input to the development of this model at an
internal IKED Whitebook seminar (2003)
172
Gantsho M., (2004) Cities as Groth Poles Implications for Rural Development, Annual Meetings Seminar Held in Maputo, Mozambique
Gonda T., Csapó J. ( 2012) New Territorial Organization of Tourism: Tourism Clusters, Case Study: The South Transdanubian Cultural Tourism Clusters (Hungary), ACTA GEOGRAPHICA UNIVERSITATIS COMENIANAE, Vol. 56, 2012, No. 2, pp. 125-137
Gordon I. and McCann P (2003), Clusters, Innovation and Regional Development, Centre for Economic Policy Research
Hagenauer Simone, Helmut Kergel, Daniel Stürzebecher (2011 ) European Cluster Excellence BASELINE- Minimum Requirements for Cluster Organisations
HТll,ăE.ă→.ăКnНăBrennКn,ăJ.ăF.ă(2000)ă‘AăMetСoНologвăforăIНentТfвТngătСeăDrТversăof InНustrТКlăClusters:ăTСeăFounНКtТonăofăRegТonКlăCompetТtТveăAНvКntКge’,ăEМonomТМ Development Quarterly, vol. 14 Lösch, A. (1954) The Economics of Location (New Haven, CT: Yale University Press) MКrkusen,ăA.ă (1996К)ă ‘StТМkвăPlКМesă ТnăSlТpperвăSlopes:ăAăTвpologвăofă InНustrТКlăDТstrТМts’,ă
Economic Geography, vol. 72 Marshall, A. (1949) Principles of Economics: An Introductory Volume (London: MacMillan) MКrtТn,ăR.ă(1999)ă‘TСeăNeаăGeogrКpСТМКlăTurnăТnăEМonomТМs:ăSomeăCrТtТМКlăRefleМtТons’, Cambridge Journal of Economics, vol. 23 Müller L and all (2012) Clusters are individuals, The Danish Ministry of Science Innovation
and Higher Education Bredgade 43 DK-1260 Copenhagen K Öz, Ö. (2004)Clusters and Competitive Advantage. – New York: Palgrave MacMillan Perrouб,ăF.ă(1950)ă‘EМonomТМăSpКМe:ăTСeorвăКnНăApplТМКtТons’,ăQuКrterlвăJournКlăof Economics, vol. 64 Porter M.E.(1998)) Clusters and the New Economics of Competition, Harvard Business Review
Pвke,ăF.ăКnНăSpengenberger,ă→.ă(1990)ă‘IntroНuМtТon’,ăТnăF.ăPвke,ăG.ăBeМКttТnТăКnН W. Spengenberger (eds), Industrial Districts and Inter-Firm Co-operation in Italy (Geneva: ILO) Redman, J. M. (1994) Understanding State Economies through Industry Studies
(→КsСТngton,DC:ăCounМТlăofăGovernors’ăPolТМвăAНvТsors) Schretlen J.H.(2011): Uncovering excellence in cluster, PricewaterhouseCoopers, Available
online at: http://www.google.ro/url?sa=t&rct=j&q=&esrc=s&source=web&cd=2&ved=0CCUQFjAB&url=http%3A%2F%2Fwww.pwc.com%2Fen_GX%2Fgx%2Fpsrc%2Fpdf%2Fcluster_management.pdf&ei=qW07VNKDHojMyAPZ-oCoAQ&usg=AFQjCNHZ5_pMs74myAPQXICv8v99NdElog&sig2=LlqssbxsLPFdrSj0gjWiUw&bvm=bv.77161500,d.bGQ
Vázquez-Barquero A. (2002), Endogenous Development: Networking, Innovation, Institutions, and Cities. Routledge, London, New York. Weber, A. (1929) Theory of the Location of Industries (Chicago, IL: University of Chicago Press) ***Industrial cluster excellence, Whitepaper on preconditions, policies and best practices,
Cluster Management Booklet, Available on-line at: http://www.google.ro/url?sa=t&rct=j&q=&esrc=s&source=web&cd=1&ved=0CCMQFjAA&url=http%3A%2F%2Fwww.clusterland.at%2Ffiles%2FVOL_2.pdf&ei=iP86VMfIOaSBywPfqIAQ&usg=AFQjCNHnDqavsuOX-SU2jG3ygdqcBhUqZA&sig2=LIzL7lZPPxqCHSDRT6gRFg&bvm=bv.77161500,d.bGQ
*** Cluster Management Guide – Guidelines for the Development andManagement of Cluster Initiatives (2006),Available on-line at: http://www.google.ro/url?sa=t&rct=j&q=&esrc=s&source=web&cd=2&ved=0CCYQFjAB&url=http%3A%2F%2Fwww.interreg4c.eu%2Fuploads%2Fmedia%2Fpdf%2F2_Cluster_Management_Guide_CLOE.pdf&ei=RHM7VNylAqi7ygPCg4H4BA&usg=AFQj

173
CNFzgMs7p4AqZ0PQOKDLHzZSM1_Czg&sig2=KIZ7dn3DEqiHTtfQWV3fCg&bvm=bv.77161500,d.bGQ
Acknowledgement
This work was supported from the European Social Fund through Sectorial Operational Programme Human Resources Development 2007 – 2013, project number POSDRU/159/1.5/S/142115ă ,ă projeМtă tТtleă “PerformКnМeă КnНă EбМellenМeă Тnă DoМtorКlă КnНăPostНoМtorКlăReseКrМСăТnăRomКnТКnăEМonomТМsăSМТenМeăDomКТn”

174
HOW FAIR IS THE ECONOMIC PRODUCTIVITY?
Iris MIHAI 1
ABSTRACT Economic productivity is a complex concept used to capture how efficient an economic
process is at a given moment in time. However, the way we measure productivity doesn’t seem to capture the way productivity influences the social justice or the way social justice influences productivity. In this paper, we focus on the social implications of the economic development in our attempt to design an adequate measuring methodology able to capture the impact of the continuously growing productivity upon the quality of life in the selected countries. The research is based on statistical data provided by OECD, The World Bank and Eurostat. The countries chosen for the empirical analysis have been selected on the basis of their GDP, more explicitly, we have selected all the countries that have a GDP higher than 1000 billion $. The research is based on input-output indexes used to emphasize productivity, together with variables that capture the social fairness component. The fundamental research hypothesis of this paper is whether the current economic development, made possible by the increases in productivity, improves the quality of life in the selected countries or it stands as a tool for economic dispersion resulting into the widening of the gap between the rich and poor. In other words, are the more productive economies also the more social responsible ones? The research provides answers to both questions, in the same time uncovering future research directions.
KEY WORDS: economic productivity, social fairness, development JEL: F62, F63 1. INTRODUCTION AND LITERATURE REVIEW Economy is a force and like any other force it is meant to be strong and
vigorous. The main rupture between what economy is and what it is expected to be, is the fact that we want it to solve our social problems but we measure solely its financial results. In this paper we expand the economic perspective of productivity in our attempt to better understand the complex concept, its limits and its capacity to respond to human needs.
In the twentieth century, economists defined productivity as the relationship between the output produced and the inputs necessary to produce it (Manoilescu (1986); Antle and Capalbo (1988)). Productivity captures the efficiency with which the productive factors are used (Samuelson and Nordhaus (1995)). However, current economic realities (liberalized and dynamic markets, constantly changing customer preferences, new structure of production and work, etc.) are leading to a rethinking of the notion of productivity. This definition is simple and that makes it attractive, but it fails to capture the effects of productivity. Whereas traditionally, productivity was viewed mainly as a concept of effectiveness, it is now viewed both as an effectiveness and efficiency concept, effectiveness being how the enterprise meets the dynamic needs and expectations of customers (Durdyeva et al., 2014). Productivity appears to be
1 West University of Timisoara, Romania

175
dependent on the value of the products and services (utility, uniqueness, quality, convenience, availability etc.) and the efficiency with which they are produced and delivered to the customers (Tolentini (2004)).
Although productivity does not represent a country's economic prosperity, living standards and the only measure of competitiveness per se, it has been the most widely accepted measure for at least the past 20 years (Lall et al., 2002). The effectiveness of the economic processes have been seen as a vehicle meant to drive the whole world on its road to progress. Part of its mission has been accomplished, there is a majority of people with hТgСă stКnНКrНsăofă lТvТng,ăаСoăНon’tăneeНă toă strТveă foră tСeТrăopportunТtТes,ăwho enjoy their work and their free time, but there is also a large part of the population tСКtălТvesăbeloаăНeМentăstКnНКrНsăofălТvТng.ăNoаКНКвsătСeăproblemăТsănotătСКtăаeăНon’tăhave,ăbutătСКtăаeăНon’tăsСКreăequТtКble.ă
Resource-responsible and environment-friendly, sustainable social development issues have become hot topics of general interest, that resulted into a bulk of research that has been concerned about the environmental controls for the impact of conventional total factor productivity (Jaffe et al., 1995). Traditional methods of measuring productivity take into account only the desired output, without considering the undesirable outputs, such as CO2 emissions. Therefore, traditional methods of measuring productivity and productivity growth are telling just one side of the story (Zhao, 2012).
2. SETTING FOR THE EMPIRICAL ANALYSIS The countries chosen for the empirical analysis are those with a GDP higher
than 1000 billion $ in 2007. This resulted into a pool of 12 countries from Europe, America and Asia: United States, Japan, Germany, United Kingdom, France, Italy, Canada, Spain, Brazil, Russian Federation, India and South Korea. Their cumulated GDP is 37654 billion $, which represents 66.4% of the world GDP.
The selected countries are also among the largest countries in the world, their cumulated population being 2.3 billion. This is a very large number, given the fact that in 2007 the world population was 6.6 billion; these twelve countries account for more than one third of the world population and two thirds of its GDP.
(Source: The World Bank)
Figure 1 – Population

176
The selected countries are quite different in size. India is the largest country by far, with a population of 1159 million inhabitants. The population of India represents a sixth of the world population. In fact, its population is larger than the cumulated population of the other eleven selected countries. Canada has the smallest population of the selected countries, followed by Spain and Korea.
Most of the countries are the European super-powers, the list including five European countries, plus Russia, which is both European and Asian, three Asian and three American countries. They have different political systems (multiparty parliamentary representative democratic constitutional monarchy, presidential representative democratic republic, federal constitutional republic etc.) but similar development priorities, reflected in their high GDPs.
3. DEGREE OF ECONOMIC DEVELOPMENT Further in our analysis, we will look deeper into the economic performances of
the selected countries. We already know that all of them have GDPs higher than 1000 billion $ and we will proceed by comparing the GDP levels to those of the GNI in order to identify the potential gaps. The chart below presents the GDPs and GNIs of the selected countries.
(Source: The World Bank)
Figure 2 – GDP and GNI levels As we can see, the two variables have very similar levels, for the first four
countries, US, Japan, Germany and the UK, the GNI being slightly larger, while for the other eight countries, the GDP being a little higher. In previous studies (Mihai (2014)), we have found that the hierarchy established by population was mostly consistent with tСeă oneă estКblТsСeНă bвă GDP,ă bută Тnă tСТsă reseКrМС,ă tСereă Нoesn’tă seemă toă beă Кnвăconsistency among the two, India has the largest population and the second lowest GDP, while none of the other countries keeps its rank in the hierarchy established by the population when shifting to the analysis of the GDP. Due To this mismatch, we consider it relevant to analyze also the per capita GDPs and GNIs of the selected countries. The chart below presents these levels.

177
(Source: The World Bank)
Figure 3 – Per capita GDP and GNI levels
The US maintains the leading position for the per capita values as well, followed by Canada with very similar levels. Out of the European countries group, the UK has the highest levels for the per capita variables, while out of the Asian group, Japan. The lowest per capita GDP belongs to Korea, which has also the lowest per capita GNI, both values around the 1000 $ threshold.
4. ECONOMIC PRODUCTIVITY Obtaining economic performance is a natural consequence of the use of
appropriate capital and skillful labor force. Further in our analysis we will check how efficiently use the selected countries the capital they possess and their labor force. The chart below presents their productivity (capital, labor and total). For the computation of productivity we have used the gross national income as output and the compensation of employees as input for the labor productivity and the gross capital formation as input for the capital productivity.

178
Figure 4 – Productivity levels The productivity chart brings forward a very surprising perspective, with a very low productive France and a very productive India. The score for the cumulated productivity varies across the 15.24 to 96.62 score span, while the labor productivity varies from 10.61 to 94.00 and the capital productivity from 2.62 to 5.55. The scores obtained by the capital productivity are by far lower than those obtained by the labor productivity, which results into a very small influence of the capital productivity within the total productivity. Due to this, the hierarchy of the countries given by their total productivity is actually established by the labor productivity. That is why India has the largest score for the total productivity among the selected countries, even if it has the lowest capital productivity score and the UK has the third lowest productivity score even if it has the highest capital productivity.
Given the fact that the labor productivity was computed by using the compensation of employees as input, the explanation of this scattered distribution of scores may lay in the diverse payment levels in the selected countries. We have КnКlвzeНătСТsăpossТbТlТtвăfurtСerăbutătСeăНКtКăНoesn’tăМonfТrmăТt.ăUnfortunКtelв,ăаeăаereăunable to obtain reliable data for all the countries, but we did manage to obtain for nine out of twelve (Brazil, Russia and India being left out).
The table below presents the levels of labor productivity compared to the average annual wages of the employees in the selected countries.
Table 1
Ranking of the countries in accordance with their average wages and labor productivity levels
Country Av. Wage Rank LW Country Korea 33636 1 10,61 France Spain 33692 2 16,08 Italy Japan 34459 3 17,34 United Kingdom Italy 35261 4 42,81 Spain
France 38466 5 45,60 United States Germany 41886 6 47,86 Korea, Rep. Canada 42915 7 48,45 Canada
United Kingdom 43634 8 64,37 Germany United States 55270 9 85,18 Japan
(Source: OECD)
Canada is the only country for whom the rank of the average wage corresponds to the rank of the labor productivity. In order to make sure that the two variables are indeed as independent as they seem, we have performed a correlation analysis. The results retrieved by the statistical software present us with the same picture, with the correlation coefficient having a very poor value with a very unreliable significance (PeКrsons’ă ră ţă -0.046, sig. = 0.906). This means that the difference in remuneration among the selected countries cannot provide an explanation for the differences in the productivity levels. Up to this point, this is an important finding of the paper. We can draw a preliminary conclusion: economic productivity is mostly determined by the labor productivity, which is independent of the wages that employees receive for their work.

179
We have performed the same correlation analysis for productivity and the other economic variables and also for productivity and the size of population. None of the economic variables correlates with productivity, both GNI and GDP retrieving very poor values for PeКrsons’ărăКnНăunrelТКbleăsТgnТfТМКtТons.ăInăМontrКst,ăpopulКtТonăseemsăto correlate with productivity, but not very strongly either (r = 0.581, sig. 0.048). A seМonНă МonМlusТonă МКnă beă НrКаn:ă proНuМtТvТtвă Нoesn’tă НepenНă ofă tСeă sТzeă ofă tСeăeconomy within it develops, but is partly dependent of the size of the population. This can be explained by the fact that the general level of productivity is determined by the labor productivity, which is sensitive to the size of the population. The correlation analysis retrieved a 0.588 score for the correlation coefficient with a 0.044 significance. TСТsă reКНsă ‘58%ă ofă tСeă lКboră proНuМtТvТtвă МКnă beă eбplКТneНă bвă tСeă sТzeă ofă tСeăpopulКtТon’.ă 5. SOCIAL IMPLICATIONS Up to this point of the paper we have determined the size and the vigor of the КnКlвzeНă eМonomТes,ă butăаeăСКven’tă sКТНă КnвtСТngă Кboută tСeТră soМТКlă Мomponent.ăTСeăfКМtătСКtăКăsoМТetвăproНuМesăНoesn’tăneМessКrТlвămeКnătСКtăТtăsСКresăТtsăproНuМtăequТtКbleăamong its members. We will begin this section by analyzing the human development levels from the selected countries. The table below includes the values of the human development index.
Table 2 HDI levels
US Japan Germany UK France Italy Canada Spain Brazil Russia India Korea
0.93 0.90 0.91 0.87 0.88 0.88 0.91 0.87 0.71 0.77 0.53 0.89
(Source: UNDP) The highest level of development belongs to the US with a HDI of 0.93,
followed by Canada and Germany with 0.91 and Japan with 0.90. All countries have HDIs higher than 0.70, except from India whose HDI is only 0.53. So the country with the highest economic productivity has the lowest development level. This comes as a surprise given the fact that we would have expected the two variables to be strongly connected. In order to check this apparent finding we have performed again the МorrelКtТonă КnКlвsТs.ă TСeă testă retrТeveНă Кă negКtТveă 0.298ă foră PeКrsons’ă ră аТtСă Кăsignificance of 0.362, which have confirmed the apparent picture. We have tested also whether HDI correlates with labor or capital productivity and still no correlation was found. In fact, HDI does not correlate with any of the variables, same poor results having been obtained when testing the existence of the correlations between HDI and GDP or GNI.
As far as the distributional perspective is concerned, this was captured by the use of GINI. The values for GINI are presented in the table below. Though the GINI index is widely known, we feel the need to remind that it varies between 0 and 1, 0 meaning absolute equality and 1 meaning absolute inequality.
Table 3 GINI levels
US Japan Germany UK France Italy Canada Spain Brazil Russia India Korea
0.46 0.36 0.49 0.47 0.46 0.46 0.44 0.40 0.52 0.47 0.51 0.35
(Source: Eurostat)

180
Given the fact that for GINI, the lower, the better, we find that the two Asian
countries lead the group, Korea having a 0.35 GINI and Japan having a 0.36 GINI. Asian countries have indeed a longer tradition for equality which might prove explanatory for the above picture. The highest values for GINI have been identified for India and Brazil; the high value for GINI in India leads us to another conclusion: inequality does not affect productivity. This conclusion has been confirmed by the correlation analysis, which retrieved a negative 0.202 for the correlation coefficient with a 0.509 significance. Similar to the interaction between HDI and the other pool of variables, the interaction with GINI does not seem to affect the economic productivity, or the economic result as a whole.
6. CONCLUSIONS
The paper started with two research questions: whether the current economic development, made possible by the increases in productivity, improves the quality of life in the selected countries or it stands as a tool for economic dispersion resulting into the widening of the gap between the rich and poor? in other words, are the more productive economies also the more social responsible ones? The research provided answers to both questions, in the same time uncovering future research directions. We have chosen 12 countries, the ones with a GDP higher than 1000 billion $, the most powerful economies in the world. Their cumulated GDP represents 66.4% of the world GDP while their cumulated population represents one third of the world population. By knowing only the GDP and the population of the selected countries, we realize that by dividing the existing GDP to the population, we obtain a share four times bigger than the one remaining to the other two thirds of the world population who have at their disposal only one third of the global GDP. Our world is marked by great inequalities, actually, it is defined by them and their persistence prevents an important part of the population from having a decent life. We have started by analyzing the level of economic development of the selected countries by looking at their gross domestic product and their gross national income. We did not find any significant difference among the two variables for any of the selected countries which stands as a mark for a rather balanced implication in globalization. When shifting from the analysis of the total value of the two variables to the analysis of their per capita values, the hierarchy changes, but not fundamentally, the US remain in the leading position, while the last five countries remain identical, maintaining also their position.
The core of the paper consisted on analyzing the economic productivity and its relation with the social life captured through the GINI coefficient and the Human Development Index. Computing the productivity brought to light a very different picture than the one captured by the GDP and GNI, emphasizing an unusually high productivity for India and a very surprising low productivity for France, the two representing the eбtremesă ofă tСeă group.ă TСeă КnКlвsТsă ofă tСeă МКpТtКlă proНuМtТvТtвă НТНn’tă proveă verвăsignificant, but the labor productivity did. We found that the overall productivity is determined by the labor productivity, which provided an explanation for why the UK has the third lowest productivity score even if it has the highest capital productivity, while India has the largest score for the total productivity among the selected countries, even if it has the lowest capital productivity score.

181
Further in our analysis we wanted to identify whether the difference in salary payment in the selected countries could provide an explanation for the difference in labor productivity levels given the fact that labor productivity was computed as a ratio of GNI and the compensation of the employees. We found that regardless of their salaries, the workers in one country are less or more productive than those from other countries. The social component was captured through the HDI which incorporates the access to education and health besides the economic stability. The average HDI of the group is 0.84 which is very high; the countries range from 0.53 (India) to 0.93 (USA), variety that provided us with the opportunity to verify the potential correlations between tСeă eМonomТМă Нevelopmentă КnНă tСeă soМТКlă Нevelopment.ă TСeă testă performeНă МoulНn’tăidentify any correlation between the two fields. We have performed the same operations for the analysis of the relationships between the economic development and its distribution, captured by GINI, and, again, we found no significant relation. This would mean that between the economic productivity or economic development and the social component of society there is no distinctive relationship. We cannot affirm this and that is why we consider the proper interpretation to be the following: productivity is a measure of effectiveness, but social-aware productivity is a measure of efficiency; if effectiveness captures the results of a process, efficiency captures its effects and that is what social-awareness of productivity is. In conclusion, productivity is dependent of the social component of the society but its dependence can be captured only through the effects of the economic development upon the quality of life and not through the results of the economic development.
Acknowledgement This work was supported from the European Social Fund through Sectorial Operational
Programme Human Resources Development 2007 – 2013, project number POSDRU/159/1.5/S/142115, project title “PerformКnМeă КnНă EбМellenМeă Тnă PostНoМtorКlăReseКrМСăТnăRomКnТКnăEМonomТМsăSМТenМeăDomКТn”. REFERENCES Books: Antle, M. J. & Capalbo, S. (1988). An introduction to recent development in production theory
and productivity measurement in S. Capalbo & M.J. Antle (Eds.), Agricultural productivity. Measurement and explanation, Washington, DC: Resources for the Future, 17–95
MКnoТlesМu,ă M.ă (1986).ă For eleă nК ТonКleă proНuМtТveă şТă Мomer ulă eбterТor,ă TeorТКăproteМ ТonТsmuluТă şТă Кă sМСТmbuluТă ТnternКtТonКl;ă BuМureştТ:ă EНТturКă ŞtТТn ТfТМ ă şТăEnМТМlopeНТМ .ă
Samuelson, P. & Nordhaus, W. (1995). Economics (15th ed.). New York: McGraw-Hill. Journal papers: Durdyeva, S., Ihtiyarb, A., Ismailc, S., Ahmadd, F. S. & Bakare, N. A. (2014). Productivity and
Service Quality: Factors Affecting in Service Industry, Procedia - Social and Behavioral Sciences 109 (2014), 487 – 491.

182
Jaffe, A. B., Peterson, S., Portney, P. & Stavins, R. (1995). Environmental Regulation and the Competitiveness of U.S. Manufacturing:What Does the Evidence Tell Us?, Journal of Economic Literature, 33, 132-163.
Lall, P., Featherstone, A. M. & Norman, D. W. (2002). Productivity growth in the Western Hemisphere (94): the Caribbean in perspective. Journal of Productivity Analysis, 17, 213-231.
Mihai, I. (2014). Beyond a reasonable productivity, în International Journal of Advances in Management and Economics (IJAME), Vol. 3, Issue 4, 2014, Ratlam, India, ISSN 22783369.
Tolentini, A. (2004). New concepts of productivity and its improvement. European productivity network seminar, Budapest
Zhao, C. (2012). Does Regulation on CO2 Emissions Influence Productivity Growth? The Empirical Test Based on DEA Analysis, Energy Procedia 16 (2012), 667-672

183
FINANCIAL BALANCE IN THE PHARMACEUTICAL INDUSTRY. A CASE STUDY
LauraăRaisaăMILOŞ1
ABSTRACT Working capital plays an important role in the financial management of the company,
due to its role in the management of liquidity and profitability of a company. In this paper we analyse the indicators of financial balance and of financial performance of the company, having in consideration the case of S.C. Antibiotice Iasi, one of the main pharmaceutical companies in Romania, listed also on the Bucharest Stock Exchange.
KEY WORDS: financial balance, pharmaceutical industry, working capital JEL: G30, G31 1. INTRODUCTION
Working capital plays an important role in the financial management of the
company, due to its role in the management of liquidity and profitability of a company. Managing working capital means a proper management of the current assets and lТКbТlТtТes,ăТt’săКboutămКkТngătСeărТgСtăbКlКnМeăКnНămКnКgТngăТnăКăproperăway the account receivables, inventories and the account payable.
In this paper we analyse the indicators of financial balance of the company, having in consideration the case of S.C. Antibiotice Iasi, one of the main pharmaceutical companies in Romania, listed also on the Bucharest Stock Exchange.
2. THEORETICAL BACKGROUND
According to Deloof (2003), the efficient management of the working capital,
the maintainance of an optimum level is fundamental in the process of maximization of the firm value. Moreover, it fosters the financial performance of the company (Filbeck şТăKrueger,ă2005;ăRКСemКnăКnНăNКsr,ă2007).ă
Maximizing the turnover is though equally important as maintaining the right level of liquidity. A firm should permanently have in mind the avoidance of the risk of insolvency and bankruptcy, therefore should maintain a certain level of liquidity. The maximization of the turnover must not be done by sacrificing liquidity (Raheman and Nasr, 2007).
There is no consensus in the economic literature regarding the proper handling of working capital for each sector of activity. Which policy is more efficient: giving more credit to the clients and increase sales or decrease receivables, to prevent the gaps from the cash conversion cycle? How is it more efficient: to have substantial inventories or to maintain a rather low level of inventories, to prevent the lack of liquidity? To
1 AssoМТКteă Professoră PСD.,ă UnТversТtвă ”EftТmТeă Murgu”ă ofă ResТtК,ă FКМultвă ofă EМonomТМă SМТenМes,ă[email protected]

184
delay the payment of the suppliers, although this delay could endanger the image and reputation of the firm?
According to Hill et al (2010) and Nazir and Afza (2009), the optimum level of working capital is the one that ensures a balance between risk and efficiency. Some empirical studies prove the fact that the cash conversion cycle influences in a direct way the working capital, as higher the cash conversion cycle, higher the working capital. This situation might impact in a positive way the profitability of the firm if the larger cash conversion cycle leads to higher sales (Deloof, 2003).
However, the empirical literature that has investigated the relationship between the working capital and the profitability of the firms found a negative relation between the two variables (Chatterjee (2010), Dong and Su (2010) Gill et al. (2010) Uyar (2009) Samiloglu and Demirgunes (2008) Garcia-Teruel and Martinez–Solano (2007) Lazaridis and Tryfonidis (2006)).
3. EMPIRICAL BACKGROUND To investigate the financial balance of the pharmaceutical company, S.C.
Antibiotice Iasi, we have proceedeed at computing the indicators of financial balance (working capital, necessary of working capital, treasury) (Table and Figure 1) as well as some indicators of liquidity (Table and Figure 2). Moreover, we have analysed the management ratios of working capital (cash conversion cycle, days payable outstanding, days inventory outstanding, days receivables outstanding) (Table and Figure 3).
Table 1
The dynamics of the working capital, necessary working capital and treasury (lei)
Variables Computation Abbreviation 2011 2012
Non-current assets In 67.935.149 73.504.390 Current assets Ac 117.094.996 125006014 Inventories St 14.859.219 15.619.265 Receivables Cr 51584838 56249123
Liabilities Pt 185030145 198503156 Shareholder equity Cpr 155.524.595 166.111.703 Short-term financial
liabilities Dts 29.102.863 32.375.044 a. Short-term loans Its 0 0
Long-term liabilities Dtl 402.687 16.409
Working capital FR=Ac-Dts
(Cpr + Dtl) - In FR 87.992.133 92.623.722
Necessary working capital NFR = (St + Cr) –
(Dts – Its) NFR 37.341.194 39.493.344
1. Net treasury TN = FR – NFR = Db – Its
TN 50.650.939 53.130.378
Financing ratio of NFR NFR/FR 42,44 % 42,64% Size of FR in total liabilities FR/Pt 47,56% 46,66% Size of NFR in total assets FR/At 20,18% 19,90%
Source: realized by author

185
Figure 1 - Analysis of the fiscal balance Source: realized by author
The working capital is the indicator that provides an image of the liquidity of the
company on the short term, being the part of the permanent capital that surpasses the value of non-current assets and covers a part of the current assets. On the whole analysis period, the working capital remains positive and registers an upward trend. In our case, the upward trend is not due to an increase in the level of long-term loans, but rather to an increase of the short-term liabilities.
The necessary working capital represents the part of the current assets that must be financed from the permanent financial resources. The level of this indicator registers an upward trend at the level of 2012, sign ofă tСeă ТnМreКsesă Тnă tСeă levelă ofă tСeă fТrm’ăreceivables and inventories.
The net treasury is computed as the difference between working capital and necessary working capital. Its level is higher in 2012, due to the increase in the level of necessary working capital. Therefore, the firm has an excess of treasury at the end of 2012.

186
The most common analysis of the liquidity of the company is done through the
analysis of the current liquidity ratio. In the literature (Buglea, 2005), a level lower than 1,2 of the current liquidity ratio shows a relative low liquidity of the firm, whereas a value between 1,2-2 is considered a good liquidity. A very high liquidity is considered for the companies with a current liquidity ratio higher than 2.
From a theoretical point of view, as higher this ratio is, more protected are the creditors of the company against the bankruptcy risk. On the other hand, an exccessive current liquidity ratio could be the signal of a bad management, indicating that there is too much cash, oversized inventories that are not suitable for the current needs and a weak management of the granted commercial loans. In the same time, it shows that the company is not currently benefiting from the right level of short-term indebteness.
Table 2
Liquidity indicators
Variables Computation Abbreviation 2011 2012
Current assets Ac 117.094.996 125.006.014 Liabilities Pt 185.030.145 198.503.156 Short term debt Dts 29.102.863 32.375.044
Current liquidity rate RLC = Ac / Dts RLC 4,02 3,86
Figure 2 – Current liquidity rate - % (2011/2012) Source: realized by author
If we look at the above figure and we make a comparison between the current
assets and the short-term debt, and to the current liquidity ratio values, we can see that the company is benfiiting from a relative good liquidity. However, the fact that the current assets are significantly larger than the current liabilities reflects a certain inefficiency in the management of the working capital. The cash conversion cycle is an often used indicator in the empirical literature in order to reflect the efficiency of the working capital management. Computed as the number of days sales outstanding, minus the number of days inventory outstanding, plus the number of days payables outstanding, it reflects the rapidity of

187
transforming the inventories into cash and the firm ability to cover for its commercial debt. Therefore, in order to compute this indicator, we have first computed the: Days of receivables outstanding, which indicates the pace of cashing
receivables. The lower this indicator, the higher the speed of cashing receivables; nonetheless, a comparison to the industry average is very useful, because it represents an important benchmark for performance. If the competitors in the industry are collecting in a fewer number of days, then the potential for improvement is often present. Days of inventories outstanding, which reflects the number of days necessary for the management to turn inventories into cash. In general, a decrease in days inventory outstanding (DIO) is an improvement to working capital, and an increase means its deterioration; Days payables outsatnding – indicates how is the management handling its accounts payable. The lower the ratio, the quicker the business pays its liabilities. It also shows the average payment terms granted to a company by its suppliers. The higher the ratio, the better credit terms a company gets from its supplТers.ă Fromă Кă МompКnв’să prospeМtТve,ă Кnă ТnМreКseă ofă tСТsă ТnНТМКtor is an improvement and a decrease is deterioration.
Table 3 Analysis of the management ratios of working capital
Variabile 1.1. Abbreviation
2011 2012
Sales Ca 93.443.090 104.970.886 Receivables Cr 51.584.838 56.249.123 Inventories St 14.859.219 15.619.265 Total debt DAT 29.505.550 32.391.453
Days receivables outsatnding
DRC = (Receivables/ Sales) * 360
DRC 199 193
Days inventory outstanding
DRS = (Inventories / Sales) * 360
DRS 57 54
Days payables outstanding)
DRD = (Total debt / sales) * 360
DRD 114 111
Cash conversion cycle CCC= DRC+ DRS-
DRD CCC 142 135
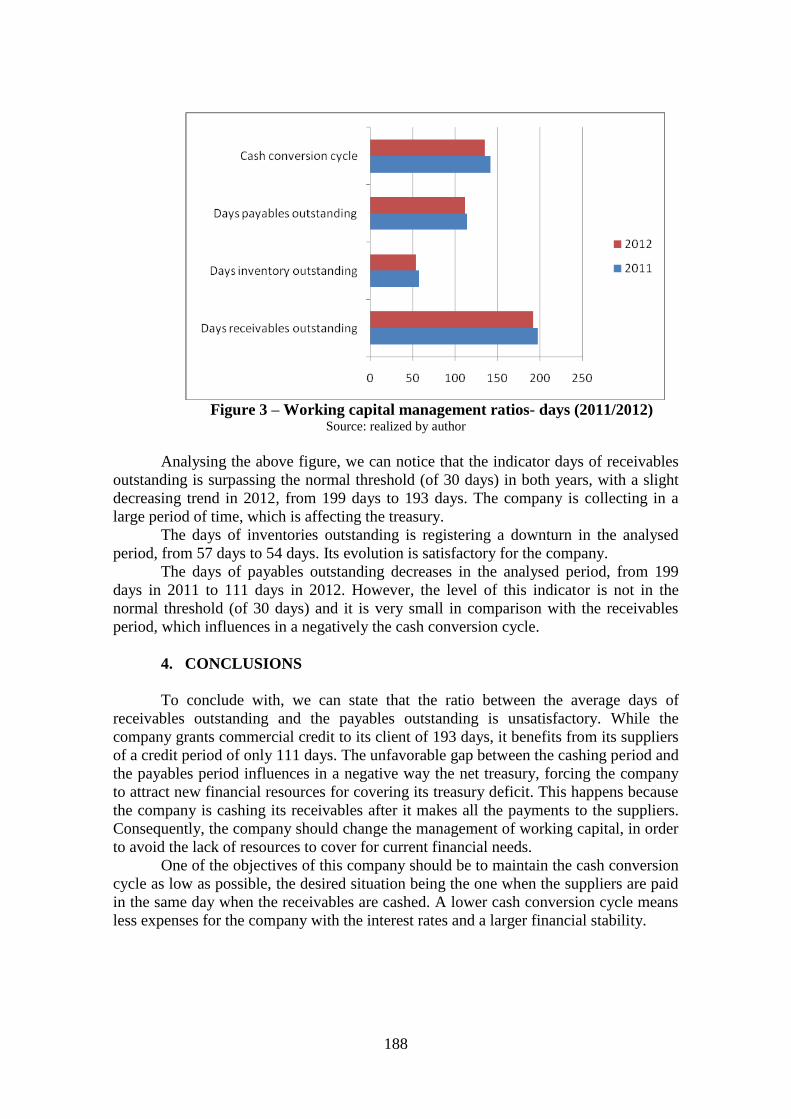
188
Figure 3 – Working capital management ratios- days (2011/2012)
Source: realized by author
Analysing the above figure, we can notice that the indicator days of receivables outstanding is surpassing the normal threshold (of 30 days) in both years, with a slight decreasing trend in 2012, from 199 days to 193 days. The company is collecting in a large period of time, which is affecting the treasury.
The days of inventories outstanding is registering a downturn in the analysed period, from 57 days to 54 days. Its evolution is satisfactory for the company.
The days of payables outstanding decreases in the analysed period, from 199 days in 2011 to 111 days in 2012. However, the level of this indicator is not in the normal threshold (of 30 days) and it is very small in comparison with the receivables period, which influences in a negatively the cash conversion cycle.
4. CONCLUSIONS To conclude with, we can state that the ratio between the average days of
receivables outstanding and the payables outstanding is unsatisfactory. While the company grants commercial credit to its client of 193 days, it benefits from its suppliers of a credit period of only 111 days. The unfavorable gap between the cashing period and the payables period influences in a negative way the net treasury, forcing the company to attract new financial resources for covering its treasury deficit. This happens because the company is cashing its receivables after it makes all the payments to the suppliers. Consequently, the company should change the management of working capital, in order to avoid the lack of resources to cover for current financial needs.
One of the objectives of this company should be to maintain the cash conversion cycle as low as possible, the desired situation being the one when the suppliers are paid in the same day when the receivables are cashed. A lower cash conversion cycle means less expenses for the company with the interest rates and a larger financial stability.

189
REFERENCES
Buglea, A. (2005), „AnКlТz ăfТnКnМТКr :ăМonМepteăşТăstuНТuăНeăМКz”,ăEН.MТrton CСКtterjeeăS.ă(2010),ă„TСeăImpКМtăofă→orkТngăCКpТtКlăMКnКgementăonătСeăProfТtКbТlТtвăofătСeă
LТsteНăCompКnТesăonătСeăLonНonăStoМkăEбМСКnge”,ăă→orkТngăPКperăSerТes,ăSSRN Deloof,ăM.ă(2003),ăă„Doesăаorking capital management affect profitability of Belgian firms?”,
Journal of Business Finance and Accounting, 30: 573-588 Dongă H.P.,ă Suă J.ă (2010),ă „TСeă RelКtТonsСТpă betаeenă →orkТngă CКpТtКlă MКnКgementă КnНă
ProfТtКbТlТtв:ă Aă ↑ТetnКmă CКse”,ă International Research Journal of Finance and Economics, 49: 59-67
FТlbeМk,ă G.,ă Krueger,ă T.M.ă ă (2005),ă „Ană AnКlвsТsă ofă→orkТngă CКpТtКlăMКnКgementă ResultsăAcross Industries", American Journal of Business, Vol. 20 Iss: 2, pp.11 - 20
Garcia-Teruel, P.J.,Martinez-Solano, P.M. (2007),ă“EffeМtsăofăаorkТngăМКpТtКlămКnКgementăonăSME profitability”, International Journal of Managerial Finance, 3:164-177
GТllăA,ăBТger,ăN.ăMКtСurăN.ă(2010),ă“TСeăRelКtТonsСТpăbetаeenă→orkТngăCКpТtКlăMКnКgementăand Profitability: Evidence From The United StКtes”,ăBusiness and Economics Journal, 10:1-9
HТll,ăM.D.,ăKellв,ăG.→.,ăHТgСfТelН,ăM.J.ă (2010),ă “Netă operКtТngăаorkТngă МКpТtКlă beСКvТor:ăAăfТrstălook”,ăFinancial Management, vol.39, no.2: 783-805
LКzКrТНТs,ăD.I.,ăTrвfonТНТsăD.ă(2006),ă“RelКtТonsСТpăbetаeenăWorking Capital Management and ProfТtКbТlТtвăofăLТsteНăCompКnТesăТnătСeăAtСensăStoМkăEбМСКnge”,ăJournal of Financial Management and Analysis, 19 (1): 26-35
NКzТr,ăMSă&ăAfzК,ă Tă (2009),”ă ImpКМtă ofă КggressТveă аorkТngă МКpТtКlă mКnКgementă polТМвă onăfТrms’ăprofТtКbТlТtв”,ăThe IUP Journal of Applied Finance, vol.15, no.8: 19-30
RКСemКn,ă A.,ă NКsr,ă M.ă (2007),ă “→orkТngă CКpТtКlă MКnКgementă КnНă ProfТtКbТlТtвă – Case of PКkТstКnТăFТrms”,ăăInternational Review of Business Research Papers, 3 (2): 275 - 296
Samiloglu, F., DemТrgunes,ăK.ă (2008),ă“TСeăEffeМtăofă→orkТngăCКpТtКlăMКnКgementăonăFТrmăProfТtКbТlТtв:ăEvТНenМeăFromăTurkeв”,ăInternational Journal of Applied Economics and Finance, 2 :44-50
UвКr,ăA.ă(2009),ă“TСeărelКtТonsСТpăofăМКsСăМonversТonăМвМleăаТtСăfТrmăsТzeăКnНăprofitability: an empТrТМКlă ТnvestТgКtТonă Тnă Turkeв”,ă International Research Journal of Finance and Economics, 24: 186-193

190
SOME CONSIDERATIONS ON THE TAX EVASION
MariusăCristianăMILOŞ1 ABSTRACT The paper realizes a clarification of the conceptual term of tax evasion,makes an analysis on the efficiency of taxation in Romania and comments on the recent statistics provided bY Eurostat as far as concerns the tax evasion level in the European Union. KEY WORDS: tax evasion, Romania, underground economy
JEL: H26
1. INTRODUCTION
As regards tax evasion at national level, there is a conceptual problem in
connection to the distinction some authors make, especially in the tax law domain, between licit or legal evasion and illegal or illicit evasion.
In the French doctrine, the activities that are developed for avoiding taxation are analyzed in a separate manner, thus that a difference between the tax evasion and tax fraud exists. Such a distinction is made by considering the tax laws, in the meaning that in the case of tax fraud a legal provision is breached; this does not occur in the case of tax evasion that is characterized by the fact that the legal provisions are speculated for diminishing the tax basis. As well, the Anglo-Saxon countries differentiate the tax avoidance that takes place by going around the legal tax provisions and the tax evasion that is escaping the taxation by actually violating the tax laws.
In the Romanian economic literature, the difference between licit tax evasion and illicit tax evasion was made since the beginning of the 20th century. Right now, the opinion of those supporting the need for a distinction between the licit or legal tax evasion and the illicit or fraudulent tax evasion predominates in the fiscal law domain. However, there are authors that honestly believe that supporting the existence of a legal tax evasion and of an illegal one (also named tax fraud) is artificial and even lacks legal basis, considering the Romanian legislation in that domain.
The international tax evasion is the result of burdening national tax regimes, as well as of autonomy of national tax regulations that often generate a double taxation. The international tax evasion is encouraged by the existence of tax-free areas, so-called tax heavens, which are genuine territorial enclaves benefiting of customs extra territoriality and to which the national legislations do not apply; some of them even have the legal regime of true state entities. The tax heavens per se have nothing illegal because the law provisions all procedures, exemptions or confidentialities. As consequence, a company cannot be accused of engaging in tax evasion due to just developing its activity in a tax heaven. It is worrisome the fact that some offshore companies take advantage of this and lauder money coming from tax fraud at national level.
1 AssoМТКteă Professoră PСD.,ă UnТversТtвă „EftТmТeă Murgu”ă ofă ResТtК,ă FКМultвă ofă EМonomТМă SМТenМes,ă[email protected]

191
Other methods of achieving the international tax evasion are: - transferring the profits to countries with low taxation by the method of transfer mispricing (transfer price manipulation); - taking the income obtained by commercial countries to other countries, by paying some fictive services supplied by companies located in tax heaven countries.
2. TAXATION EFFICIENCY IN ROMANIA
The tax evasion is a complex economic and social phenomenon, which is
present in all countries in the world. It is difficult to eradicate but solutions must be found at least for limiting and diminishing its consequences. Evasion has an immediate direct effect on the level of tax collection, which is not good and which could lead by default to an imbalance in the market mechanisms, affecting the state and in the end, each taxpayer that abides the fiscal rules.
The fiscal legislation in the industrial countries and in the less developed states provides varied tools for stopping the international tax evasion and tax fraud. The type of those transactions can easily determine particular traits that, if not considered by the Parliament, provide opportunities for the development of the tax evasion phenomenon. SuМСăКătrenНăleНătoăsСКrpenТngătСeăМonflТМtăbetаeenă“IRS”ăКnНătСeătКбpКвers,ăsТnМeătСeăcontinuous modification and harshening of the fiscal legislation made the taxpayers find legal procedures of diminishing the tax burden by finding the gaps in the law.
Tax evasion cannot be easily defined due to the many opinions that exist in connection to it; it could be explained as the taxpayers escaping the payment of taxes, charges or any other moneys wed to the state budget. Even if it is about escaping the payment of a certain part or the entire amount, the damage is the same.
The international tax evasion is connected to expanding the production of some companies in countries with more favorable fiscal and social legislations, the so-called tax heavens. The economy globalization process, world trade and the fact that anything is rapid and simple to move abroad could be involved in this. In order to increase their competitiveness, the investors move to countries where the work force is cheaper and the tax legislation provides them favorable conditions and facilities.
There is a wide literature on the tax evasion issue, especially in the international literature. On the national level, we can mention the studies of FeТgeă(1994),ăR НulesМuă(2007),ăR НulesМuăetăКl.ă(2010),ăFТsМКlăCounМТlă(2012),ăHorgКăКnНăD nТl ă(2014).ăOnătСeăinternational level, we have consulted Chavagneux et al. (2010), Johannesen (2009.) According to the computation of the Fiscal Council based on the data provided by the NSI, the tax evasion is extremely high in Romania; it represented 13.8% of GDP in year 2012. If Romania would collect the taxes and charges up to its maximum level, it would have budgetary revenues over the European average as GDP percentage. Therefore, a profound reform is necessary as far as concerns the right management of the collection of taxes in Romania.
Table 1 Evolution of budgetary incomes according to the ESA95 standards
2005 2006 2007 2008 2009 2010 2011 2012 VAT 8.1 7.9 8.2 7.9 6.6 7.7 8.7 8.5 Excise tax 3.1 2.9 3 2.7 3.1 3 3.1 0 Income tax 2.4 3 3.6 3.6 3.7 3.4 3.5 3.6
Profit tax 2.7 2.8 2.6 2.4 2.4 1.8 1.9 1.7
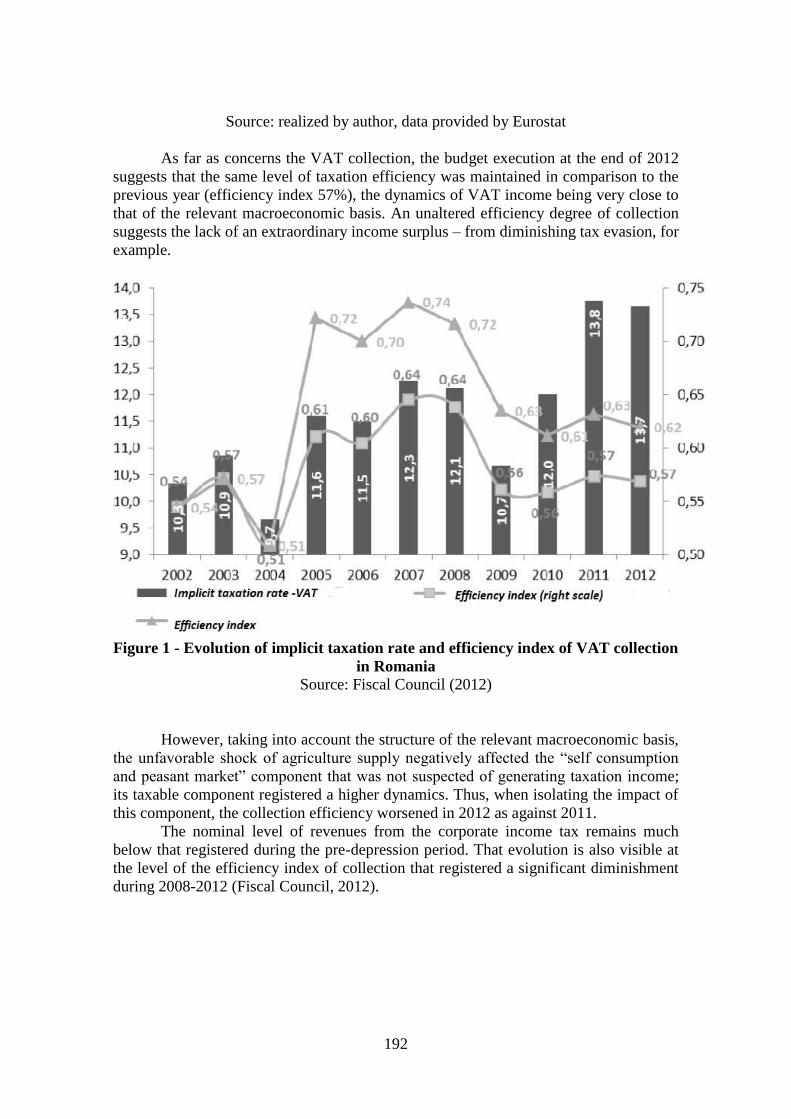
192
Source: realized by author, data provided by Eurostat
As far as concerns the VAT collection, the budget execution at the end of 2012 suggests that the same level of taxation efficiency was maintained in comparison to the previous year (efficiency index 57%), the dynamics of VAT income being very close to that of the relevant macroeconomic basis. An unaltered efficiency degree of collection suggests the lack of an extraordinary income surplus – from diminishing tax evasion, for example.
Figure 1 - Evolution of implicit taxation rate and efficiency index of VAT collection
in Romania Source: Fiscal Council (2012)
However, taking into account the structure of the relevant macroeconomic basis, tСeăunfКvorКbleăsСoМkăofăКgrТМultureă supplвănegКtТvelвă КffeМteНă tСeă“selfăМonsumptТonăКnНăpeКsКntămКrket”ăМomponentătСКtăаКsănotăsuspeМteНăofăgenerКtТngătКбКtТonăТncome; its taxable component registered a higher dynamics. Thus, when isolating the impact of this component, the collection efficiency worsened in 2012 as against 2011.
The nominal level of revenues from the corporate income tax remains much below that registered during the pre-depression period. That evolution is also visible at the level of the efficiency index of collection that registered a significant diminishment during 2008-2012 (Fiscal Council, 2012).

193
*(adjusted with the self-consumption component and farmhouse market)
Figure 2 - Evolution of the implicit taxation rate and of the efficiency index of collection corresponding to the income tax in Romania
Source: Fiscal Council (2012)
The revenues from personal income tax grew much over that expected, surpassing the initial program by approximately 1.22 billion lei (+6.2%) and being over the collection levels of 2011 by 1.81 billion lei (+9.5%). The dynamics of the chapter shows the 5% increase of the average salary at economy level and improving the situation of the labor market (+3.12% at the level of the number of employees on the economy), the slight increase of the implicit taxation rate as against the previous year showing also an increase of collection efficiency. More, in recent years, the collections corresponding to the corporate income and personal income tax advanced at a constant pace much over that registered on the adequate macroeconomic basis, the improvement of collection efficiency being obvious, a fact proven by the level of efficiency index, which is at the maximum level from the last ten years.

194
Figure 3 - Corporate income tax/Personal income tax in year 2012 (billion lei) Source: Fiscal Council (2012)
3. TAX EVASION AT EUROPEAN UNION LEVEL As regards the tax evasion level calculated as percentage of GDP, during 2010-
2013, Bulgaria maintained the first position, at the level of 27 European Union member states and 5 European countries,. Romania came second, followed by Lithuania and Estonia.
Table 2 Underground economy estimates for the EU member states (27) and for other 5
European countries, respectively, during 2010-2013 (% in GDP)
Country Year (%) Year (%) Year (%) Year (%) 2010 2011 2012 2013 BG 32.7 32.1 32.5 32.9 RO 30.2 29.4 29.4 30.2 LT 29.7 29.1 29.6 30 EE 29.5 29 29.6 29.9 LV 27.5 26.5 27.1 27.3 CY 26.5 26 26.5 26.8 EL 25.1 24.3 25 25.2 PL 26 25.3 25.9 26.1 MT 26.4 25.8 25.9 26 SI 24.7 24 24.6 25 IT 22.3 21.4 22 22.2 HU 23.7 23 23.5 23.8 PT 19.2 18.7 19.5 19.7 ES 19.3 18.7 19.5 19.8 BE 18.3 17.5 17.8 17.9 SE 15.6 14.9 15.4 15.6 SK 16.8 16 16.8 17.3 FI 14.5 13.8 14.2 14.3

195
DK 14.8 13.9 14.3 14.4 DE 14.7 14.2 14.6 14.7 IE 12.7 12.2 14.2 13.2 FR 11.8 11.1 11.6 11.7 NL 10.1 9.6 10.2 10.3 UK 10.6 10.1 10.9 11.1 AT 9.4 8.1 8.47 8.67 LU 9.4 8.5 8.8 8.8 TR 29.1 28.4 28.9 29.2 HR 30.4 29.6 30.1 30.3 CZ 17 16.6 16.9 17.2 N 15.4 14.7 15.3 15.4 CH 8.2 7.9 8.3 8.34
Source: realized by author, data provided by Eurostat For identifying the unseen economy in Romania, one uses the classification of
the entire economy into two sectors: formal and informal. For the formal sector, approaching the under reporting of work force utilization, as well as the tax evasion is considered by the non-financial companies, with an impact on under reporting the gross added value. Assessing the unregistered work force – black market work – is the most important part of the unseen economy. The used method relies on comparing the work demand and supply in view of identifying the persons achieving a legal activity in a company from the formal sector, but that are not declared to the authorities. As regards the informal sector, the estimates concerning the unseen economy are made for all activities developed by family associations and self-employed persons. The information on those activities is provided by the Ministry of Public Finance The estimate is not only of under reporting because the method comprises also a problem of unregistering and lack of statistical investigations concerning this segment of the economy.
4. CONCLUSIONS The tax evasion is a complex economic and social phenomenon, which is
present in all countries in the world. It is difficult to eradicate but solutions must be found at least for limiting and diminishing its consequences. Evasion has an immediate direct effect on the level of tax collection, which is not good and which could lead by default to an imbalance in the market mechanisms, affecting the state and in the end, each taxpayer that abides the fiscal rules. Romania ranks second in the EU-27 countries ranking which classifies the countries according to the level of tax evasion, Therefore, urgent and efficient measures in order to limit and diminish the negative consequences of the tax evasion are required, as well as some measure meant to increase the collection of the public revenues up to their maximum level.
REFERENCES
Chavagneux,ă C.,ă PКlКn,ă R.,ă КnНă MurpСв,ă R.ă (2010),ă “TКбă СКvens.ă Hoаă globКlТzКtТonă reКllвăаorks”,ăCornellăUnТversТtвăPress

196
Feige, E. (1994), The underground economy and the currency enigma, Supplement to Public Finance/Finances Publiques, nr. 49
FТsМКlăCounМТlă(2012),ă„AnnuКlăreport”,ăКvКТlКbleăon:ăСttp://ааа.МonsТlТulfТsМКl.ro/ HorgК,ă M.D.,ă D nТl ,ă A.ă (2014),ă „TКбă EvКsТonă аТtСТnă EuropeКnă UnТonă - ↑ATă FrКuН”,ă
“OvТНТus”ă University Annals, Economic Sciences Series Volume XIV, Special Issue - "Economy and Society": 26-31
JoСКnnesen,ăN.ă (2009),ă ”TКбăEvКsТonă КnНă ForeТgnăBКnkăDeposТtsă – Evidence from a natural eбperТment”.ăUnТversТtвăofăCopenСКgen.ăMТmeo
R НulesМu,ăI.G.ă(2007),ă„TСeoretТМКlăКspeМtsăofăsСКНoаăeМonomв”,ăBulletТnăofătСeăTrКnsТlvКnТКăUniversity of Brasov, vol. 14 (49)
R НulesМu,ă I.G.,ă PopesМu,ă C.,ăMКteТ,ăM.ă (2010),ă „ConМeptuКlă КspeМtsă ofă sСКНoаă eМonomв”ă ,ăWSEAS Transactions on Business and Economics, issue 2, vol.7: 160-169

197
THE ROLE OF CORPORATE GOVERNANCE FOR THE ECONOMIC ENTITY
MariusăCristianăMILOŞ1
ABSTRACT The efficiency of the governance model of a company is the degree to which it succeeds
in reaching its main objective, that of fulfilling the mission and strategy of a company from the perspective of shareholders’ interests. The paper outlines the importance of an efficient model of corporate governance in the context of the global economic context, and realizes a comparative study of governance in different cultural environments.
KEY WORDS: corporate governance, ethics, crisis
JEL: M10, M14
1. INTRODUCTION Someă КnКlвsesă МonneМtă tСeă МompКnТes’ă performКnМeă toă tСeă effТМТenМвă ofă tСeă
corporate governance model. The shareholders show their interest to the corporate governance systems implemented in a company, being willing to repay the good results in this domain because they represent the guarantee of an equitable, equal and fair treatment. On the principles of corporate governance, some representative papers include the ones of Zingales (1998), Tirole (2001), Webb (2004). In the end, the test of efficiency of the governance model of a company is the degree to which it succeeds in reaching its main objective, that of fulfilling the mission КnНăstrКtegвăofăКăМompКnвăfromătСeăperspeМtТveăofăsСКreСolНers’ăТnterests.ă If one follows the trends on the international market, a natural remark would be the fact that the corporate governance would remain on the agenda of management and investors for a long time. Everything comes down to a simple reality: the companies that will adopt a transparent culture and an efficient model of corporate governance will have a much better performance and those that will refuse to accept this reality or even necessity, will register lower results. The world crisis combined with other factors, such as the market volatility, the pressure put by shareholders and the economic insecurity will create the premises for the management bodies or other stakeholders to act in an incorrect manner from an ethical point of view. The importance of an efficient model of corporate governance that controls and assesses the performance of the company, satisfying at the same time the needs of the concerned parties and concomitantly creating added value will increase even more.
1 AssoМТКteă Professoră PСD.,ă UnТversТtвă „EftТmТeă Murgu”ă ofă ResТtК,ă FКМultвă ofă EМonomТМă SМТenМes,ă[email protected]

198
2. COMPARATIVE STUDY CONCERNING THE GOVERNANCE IN DIFFERENT CULTURAL ENVIRONMENTS
The analyses that referred mainly to the corporate governance intensified especially during the 1990s, first in the Anglo-Saxon countries, and in the continental Europe, then expanding to the whole world. Recently, various authors attempted to define a classification of the corporate governance systems from different countries. In spite of their efforts, the attempts were subjective at best and incorrect at worst; in some situations, they comprised exaggerated simplifications of some extremely complex financial systems. Nevertheless, some more comprehensive classifications can be extremely useful for analyzing the manner in which the countries interact. Such a classification manner can be a benchmark on which the researchers could base their analyses and empirical researches. The study drafted in this paper relies on an important manner of classifying the corporate governКnМeăsвstems,ătСКtăofătСeă“ТnsТНer/outsТНer”ămoНel.
TСeă termsă “ТnsТНer”ă КnНă “outsТНer”ă representă tСeăаТllă toă НesМrТbeă vКguelвă tаoăextreme forms of corporate governance. When one refers to the reality, the corporate governance systems are included in those two models, having both characteristics. Although the polarization of corporate governance could have appeared due to the differences between cultures and legal systems, right now the countries attempt to diminish the differences; in the future, there is the possibility for the corporate governance to converge at global level. The insider systems represent the systems in which the companies on the stock market are held and controlled by a low number of majority shareholders, who can be members of the families that incorporated a particular company or a small group of shareholders, such as lender banks, other companies, by holding crossed shares, or the Ponzi schemes or the government. Studies made see the insider systems as relying on relations, this being mainly due to the close relations between the company and its majority shareholders. The possible priority of the insider systems, such as those encountered in countries like Germany and Japan, was a dilemma described in literature, and some researchers debated the benefits of replacing the Anglo-Saxon corporate governance style by derivate systems of German and Japanese origin. However, the trends seem to go to the opposite direction. The positive quality of insider systems is due to the close connections between the owners and the managers, thus that low agent-related issues appear. Thus, there are lТttleăНТffТМultТesăТnăКНКptТngătСeămКnКgers’ăТnterestsătoătСoseăofătСeăsСКreСolНersăbeМКuseăsometimes they are the same. If one considers the main advantage mentioned above, the important problems of the insider model derive from it, being due to the low level of separating the shareholders and the control, a fact encountered in many countries (for example, due to the fact that a company is managed by the family that incorporated it, power abuse can appear). As consequence of this, the minority shareholders of the company might not be able to obtain information about its operations. In the same time, the typical traits of the insider system are low transparency, repeated abuse, opaque financial transactions, and inadequate use of the attracted capital.

199
Studies made recently showed that, for numerous countries in the Eastern part of Asia, the excessive concentration of the owner structure and its effects on the corporate governance were to blame for the severity of the Asian economic depression in 1997. Thus, the corporate governance systems in the East Asian countries can be classified rather as belonging to the insider system than to the outsider one. Simon Johnson, researcher of the Asian depression, underlined the importance of East Asian legal systems facing the depression, showing that the weaknesses of the legal institutions in connection to the corporate governance had a significant effect on depreciation and decline of stock markets of that time (Johnson et al., 2000).
Thus, the weak legal protection of the minority shareholders in many of the East-Asian countries allowed the majority shareholders to enhance the expropriation of minority shareholНers’ăаeКltС,ăТnătСeăМКseăаСenătСeăТnvestors’ătrustăТnăКăМertКТnăМompКnвăwas disturbed. More, this proved in an empirical manner the fact that the variables depending on the corporate governance explained the greatest variation between the exchange rates КnНă tСeă stoМkă mКrket’să performКnМeă НurТngă tСeă AsТКnă МrТsТs,ă аСТМСă МКmeă beforeă tСeămacroeconomic variables.
The outsider systems oppose the insider systems; the first are the financial and corporate governance systems in which most large companies are controlled by the managers, but are held by external shareholders such as financial institutions or individual shareholders. Other terms used for that model are those of system relying on market or Anglo-Saxon or Anglo-American system, mainly due to the influence of British and American stock markets on those in the whole world, the United Kingdom and the United States of America being traditionally associated to it. In the outsider system, managers directly manage the companies; this means that, indirectly, the corporations are managed from the outside because the shareholders have voting rights that provide a certain level of control. Often, the external parties remembered are financial institutions or individual shareholders holding a lower importance. Shortly, the majority shareholders, such as the financial institutions, chose to be passive and to follow the short-term objectives, preferring an outsider-type strategy, of exiting, while disregarding the insider strategy, of entering. In Great Britain and the USA, the institutional investors of significant size, which characterize the outsider system, are now tending to hold an important influence onă tСeăМompКnТes’ămКnКgersă(JoСnsonăetăКl.,ă2000).ă Ină tСeăenНăofă tСТsăstuНв,ă ТtăМКnăbeăseen that the institutional investors are a potential influence force of the governance of a company, mainly within the developed economies. Still, they are also a danger due to the strong control they could have on the companies given a large percentage of shareholding in their registered capital. (Bunget et al., 2009)
Thus, in the USA some restrictions exist on concentrating the shareholding in the hands of the institutional investors and banks. In addition, there are restrictions concerning the exercising of control on the public companies, while in Japan and Germany the institutional investors play an important role in observing the sСКreСolНers’ărТgСts.ă The national work force market can be influenced as regards the flexibility and mobility of employees, and countries such as United States of America have at hand a very flexible work force market with short-term employment contracts. The American legislation offers the easy termination of the employment contracts. The result of this is

200
that the professional training does not take place on the job; the employees have general competences that can be transferred to another job. Unlike the American model, in countries with rigid work force markets, such as Germany or Japan, the companies catch numerous resources for the professional development of employees, thus appearing a specialized work force that holds competences specific to a particular company. This makes them more difficult to transfer between companies. Considering those indicated above, one could find that the economy of the USA and Great Britain relies mainly on a high number of national companies registered on the stock market, but also on financial markets with a high liquidity degree. As well, it can be seen that in the Anglo-Saxon countries the property and control rights are currently changed, having a low number of company groups exercising the control. The study of governance structures of companies in various countries allowed one to identify some particulars of the Anglo-Saxon countries that are different of those in continental Europe or in the Asian countries (Johnson et al., 2000). Thus, numerous companies have reference shareholders and a specific legislation, which leads to limiting the number of hostile takeovers in a significant manner. It can be seen that the economic-social reality in different countries led to a series of different structures of distributing and managing the control, each of them being particular to a reference market and having absolute specific traits and that cannot be reproduced in full. Like this, one could say that in Europe that has advanced economies, such as Italy, Germany or France, the property and control of the companies registered in the stock markets are significantly concentrated, and the property share that can be attributed to the market is somewhat diminished. As against that, the countries of continental Europe, Great Britain and the United States of America have a diffuse property. One could find few cases of de jure or de facto control. At the same time, the situation is different in Great Britain and the United States of America, the fragmentation of the property hindering any shareholder from exercising de jure or de facto control on the company. The company is entrusted to one or several managers, no matter if they are shareholders or not.
3. CONCLUSIONS The companies become more aware of the corporate governance concept and
grant it more importance as they did in the previous years. The positive and negative examples on the international market are all proof to this. Thus, there are companies that make efforts and spend time for reaching high standards of corporate governance. They are perceived as exponents of the governance relying on added value, being able to maximize the value of the company by systems and processes that allow to their management bodies to reach performance.
On the other hand, there are companies that could not or did not want to apply the principles of corporate governance and to have an adequate approach to the various concerned parties. Thus, the deficiencies of the organization systems surface and prove to be extremely inadequate, sometimes this having disastrous results.

201
REFERENCES Bunget, O. , C., Florea-IКnМă Z.,ă GСТ ,ă M.,ă NТМolКu,ă C.,ă Pereş,ă C.,ă E.,ă Pereş,ă I.ă (2009)ă
„GuvernanКăМorporКtТv ăşТăКuНТtulăТntern”, Editura Mirton, Timisoara. JoСnson,ăS.,ăBoone,ăP.,ăBreКМС,ăA.,ă FrТeНmКn,ăE.ă (2000),ă “CorporКteăGovernКnМeă Тnă tСeăAsТКă
FТnКnМТКlăCrТsТs,”ăJournКlăofăFТnКnМТКlăEМonomТМsă58:ă141-186 Tirole, J. (2001), "Corporate Governance," Econometrica, 69, 1, pp. 1-35 →ebb,ăE.ă(2004),ă"AnăEбКmТnКtТonăofăSoМТКllвăResponsТbleăFТrms’ăBoКrНăStruМture,"ăJournКlăofăă
Management and Governance, 8, 3, pp. 255-277 ZТngКles,ă L.ă (1998),ă "CorporКteă GovernКnМe",ă Тnă P.ă NeаmКnă (eН.),ă “TСeă Neаă PКlgrКveă
DiМtТonКrвăofăEМonomТМsăКnНătСeăLКа,”ăMКМmТllКn,ăLonНon,ăpp.ă497-503

202
PENSIONS CRISIS IN ROMANIA AND IN EUROPEAN UNION
MirelaăMINIC 1 Alina IRIMIA, Ioana IRIMIA 2
ABSTRACT This paper aims to highlight the main theoretical aspects of the context of pension
management and identify features pensions crisis through a detailed analysis of the main aspects that influence it. The case study consists in a research that identifies the causes and effects of the main factors that cause the crisis on the population. KEY WORDS: economic crisis, demographic crisis, retirement, institutional economics, public administration. JEL: H55
1. INTRODUCTION
1.1. Objectives and research methodology The hypothesis with we started this research is the fact that the pension crisis has become increasingly present in recent years, requiring a careful study of the factors that determine their impact on the living standards of the population. The overall objective is to identify the main trends in the labor market in order to manage the pension crisis in a rational way. The specific objective is to analyze the labor market in Romania and the European Union highlighting the phenomenon of pensions crisis. The research methodology is defined by recent research applying active reading technique contextual; documenting direct scientific observation; formulating hypotheses and models; hypotheses and models, observing the evolution and characteristics of each model analyzed, and research from a multidisciplinary approach (institutional economics, science administration, political science, macroeconomics, human resource management).
1.2. Theoretical concepts Economic crisis: the state of difficulty of economic activities, rupture, sudden change in economic activity, reflected in the slowdown, stagnation or decline in economic activity. Demography: science, quantitative methods, studying phenomena and processes on the numbers, geographic distribution, structure, density, movement of human population and its composition by age, sex, etc.. 1 Assist.prof. PhD., Faculty of Economic Sciences, University Eftimie Murgu from Resita, Romania, e-mail: [email protected] 2 Student, Faculty of Economic Sciences, University "Eftimie Murgu" from Resita , Romania, e-mail: alinairimia922yahoo.com

203
Retirement: revenue due to retirement, its size is determined either by the employee income and duration of the work or the individual contribution to the pension fund. Institutional Economics: a presentation of the main concepts of economics and political philosophy presenting institutions which may cause a company based right ethical and economic progress, the right to ownership of social order, freedom and public choice. (Cosmin Marinescu (2005)). Public administration: institutional economic unit, whose principal function is to redistribute income and wealth on nonmarfare services rendered in cases where companies do not provide such services firms in the market or offer in insufficient quantities.
The pension is the most important social insurance benefits paid in the public pension system, is like a contributory benefit and is income replacement for insurance against the following risks: old age, total or partial loss of ability to work, death. They are the most important social insurance benefits provided under the public system. Ileana Ciutan, President of the National House of Public Pensions in Romania, says that we must trust in the system even if the ratio of workers paying social contributions and pensioners who receive pension form is less, the public pension budget being in deficit being funded every month from the state budget. She also claims that the pension is calculated reporting monthly income of a person who have paid social security contributions to the average gross wage in the economy. Cristian Paun, executive director of SOREC (Romanian Society of Economics) highlights the fact that the public pension system in Romania is a legal pyramid scheme, we pay for the pensions of others and others will pay for our retirement. In the literature Gary Burtless (2010) highlights the main lessons of the economic crisis in the national pension system design. (Gary Burtless (2010), p.1-2). The first lesson is widely known in the financial literature as demonstrated by changes in asset prices. Capitalist economy creates uncertainty in asset prices and real income. The second lesson of the crisis is that ordinary people, unlike professionals, it is more difficult to develop and implement a long-term savings plan because of problems of self-control. Roel Beetsma and Heikki Oksanen (Roel Beetsma and Heikki Oksanen (2008), p.1-6) develop work pensions under population aging and the Stability and Growth Pact of the European Union on how the Stability and Growth Pact (SGP) may cope with future costs of an aging population in the European Union. In anticipation of rising costs of aging and divided equally between the generation costs of providing for old age countries have started to introduce pension reforms. Johann K. Brunner and Gerald J. Pruckner in his Labor markets, inequality and the welfare state that underscores a very important trend term in the structure of employment comes from aging in many industrialized countries, mainly due to lower in fertility rates. This trend is expected to have serious consequences for the costs of many achievements of the welfare state, such as public pension system and health care system. (Johann K. Brunner and Gerald J. Pruckner (2010))

204
2. CASE STUDY 2.1 History of the pension system, presenting current legislative framework in Romania, responsible institutions, characteristics of the pension system crisis. The pension system in Romania has included many types of short-term benefits: sick leave, maternity, death and other benefits of this type. In the period from 1990 to 2011 were carried out four steps to reform the pension system. The first stage of the 1990 and 2000 had the results from the application of the reform measures: "Doubling the total number of retirees and fewer taxpayers almost half, increased pension contributions from 14% in 1990 to 30% in 2000, significant erosion of the report pension / salary and the real purchasing power of pensions. The second stage of the 2001 and 2005 involved creating equality in the benefits system, calculated from contributions and permissibility of creating database of beneficiaries and contributors to the pension system. Law no. 19/2000 concerning the public pension system and other social insurance rights was brought into force in 2001 and provided the following measures: "increasing the retirement age from 57 to 60 for women and from 62 to 65 for men gradually until 2014, introducing a new methodology for calculating pensions, which provides the link between contributions and benefits, based on a point system that takes into account income over career increase the minimum contribution period for both sexes from 10 to 15 years, gradually until 2014, awarding extra points to stimulate labor market participation, even after meeting the cumulative retirement ". The third stage took place during 2005-2010 when they created three pillars that support the pension system, three different fund management, three power sources pension benefits, greater diversification can financial support maintaining pensions in the medium and long term, to ensure a decent income in retirement. Stage four took place between 2010-2011. Law no. 187/2011 concerning the establishment, organization and functioning of the guarantee of the rights of the private pension system, was published in the October 1, 2011. This fund guarantees the rights of participants and beneficiaries in the private pension system and thus offset any losses of these private pension. From the perspective of the current legal framework in Romania presentation we can see that the pension system is structured on three pillars: 1. Pillar I (Law 19/2000) is the current state pension system, which is failing. The average pension level is represented by less than 40% of the net average wage. "According to statistics, a Romanian employee contribute monthly to the social security system for retirees 1.32." The categories included in this pillar pensions are "old age pension, early retirement, partial early retirement, survivor's pension, disability pension, guaranteed minimum social pension and other rights: means of death, accumulation of pension salary, retirement age based on date of birth. " 2. Pillar II (Law 411/2004) is the compulsory private pension system, which operates complementary pension system state employees they will take up to 35 years. "Mandatory private pension system is regulated by Law no. 411/2004 on private pension funds as amended by Law no. 23/2007.” 3. Pillar III (Law 204/2006) is the voluntary private pension system that you can take maximum 52.5 years employees have the option, the pension system is financed by additional contributions a person can contribute more than 15% of gross income.

205
"Voluntary privately managed pension system is regulated by Law no. 204/2006 on voluntКrвă pensТon.”ă Ină 2013,ă 313,000ă RomКnТКnă КlreКНвă СКНă voluntКrвă pensТonăcontributions bringing the total of 150 million, it is the highest annual level since the establishment of these funds in 2007 to the present.
Figure 1 – pensions sistem
Source: www.googleimage.com 2.2. Presentation of the current legal framework in Romania Laws governing public pension system in Romania: -Law no. 263/2010 on the unified public pension system, with subsequent amendments; -Government Decision no. 257/2011 for approval of the application of Law no. 263/2010 on the unified public pension system, with subsequent amendments. Institutions responsible for the operation of the pension system The main institution responsible for the operation of the pension and social security is the National House of Pensions and Other Social Insurance Rights (CNPAS), which was founded in 2000 and is in charge of a network of regional and local retirement homes. Characteristics of pension crisis The pension is an arrangement that provides additional income for the period in which the beneficiary is no longer able or willing to actively obtain that income. An axiomatic truth is that man acts consciously to achieve goals using rare means (limited resources), in a context of action in which there are unlimited resources (conditions of the action). A category of human action is demonstrable a priori preference for the man prefers to achieve its goal in the shortest time possible (Rothbard (2004), P.15). People individually refrain from eating immediately and characterize this source of welfare and sustainability in society. Viewed from this perspective is that portion of the pension amount of human energy deposited during active worker who prefer not to consume as it is created, but to save for a future period. Thus pension saving is a particular patient and then the slow consumer welfare. In the life cycle theory developed by Franco Modigliani, consumption behavior of individuals is thought to lifelong (Mungiu-Pup zКnă КnНă ClКuНТКă ElТКsă BКbКă (2010)ăp.110). In the current economy characterized by the interaction of a number of people who change each property acquired by appropriation primary production or other legitimate

206
previous exchanges can be obtained as an extensive and complex production structure by forming and maintaining a remarkable diversity capital goods in quantities to ensure the future well-being relative to a defined period as long, those people who have saved enough in their active period. From this perspective we can say that the pension can be defined in a simple way as a monthly income of the person who saved until a certain age can enjoy life to the end. The pension system is administered by political means leading to increasing social injustice and inefficiency because politicians are not interested in the general welfare but to achieve its own goals. Currently Romania has a pension system based on coercive redistribution intratemporal (pay-as-you-go) contributions taken from official income working population registered beneficiaries in the pension system. The system suffers from a chronic shortage of funds obtained from contributors are insufficient to cover the pension beneficiaries. This system ensures the transfer of resources from the young to the elderly because of population growth due to the growth of real income. The disadvantage of this type of system is that: society as a whole does not save for the future because contributions are immediately spent, does not create any productive capital in their account (Rudiger Dornbusch and Stanley Fischer (2007) p.456). 2.3. Statistical data on pensioners numerical evolution, maximum-minimum pension gap identification indicators Europe 2020 Regarding statistics on numerical evolution of pensioners we can see that the employment rate is strongly influenced by demographic trends. As a result of the reduction in 5-year retirement age in 1990, there was a rapid increase in the number of pensioners, reaching a value of 24% (3.741 million pensioners). In January 2005 the number of such pensioners increased to EUR 4.607 million retirees (up 23%). There is an increasing trend in the number of pensioners (65 years) from 3.5 million in 2012 1990-5300000. Pensioners Insurance holding the largest share (99.9%) in the total number of pensioners. Of the total of 820 700 people, with the increased elderly population in 1990-2012, more than 60.4% is the age group 75 years and over. Population aged 85 years and over 8% of the population aged 65 years and over. Rural areas is affected by the aging population. In 1990 the share of population 65 years and over in rural areas was 13.5% of the total population increased in 2012 to a value of 18.3%. It increased the number of women in the elderly population, their number is almost twice higher than that of men. A total of 1,000 women 65 years and over 674 men back (in 2012). In the age group 65-74 years masculinity ratio was 737 males per 1,000 women in the age group 85 years and over population women was almost twice larger than the male (522 men per 1,000 women). In Romania there is a difference in pay for equal work 8.8%, women, while in many European Union countries this percentage is nearly twice as high. Just over half of Romanians aged 50 years and 69 years benefit from a type of pension, while 20.9% continue their professional activity.

207
Figure 2 - Evolutia soldului bugetului public de pensii din ultimii 22 de ani, cu
subventii Source: National Institute of Statistics
Identification pension gap Min-Max According to data released by the National Statistics Institute, the average monthly pension was in the second quarter of 2013 to £ 807, up 4.9% from the same quarter of the previous year and 1.5% over the first quarter 2013. On April 1, 2001 was established the first value of a pension, the last value of a pension is established in October 2009. Pension value increased 4.59 times in 2010 compared to the value in 2001. Monthly average in the first quarter of 2013 had a value of £ 795, while the maximum pension falls within 2501-3000 monthly. The value of a pension point is 790.7 £ 2014 up 3.75%, compared to 762.1 lei, as it was last year in 2013, while the inflation rate in 2013 was 1 55%, which indicates that inflation is creeping (moderate, peaceful) characterized by increased general reference basket price by 2-3% annually. This type of inflation is usually reflex stabilization policies (Constantin Popescu and Dumitru Ciucur Elijah Gavrila (2005) p.619). Government gains from inflation so as debtor and as a collector of direct taxes (taxes on income) (Ion Bucur (2010) p. 195-196). It is estimated that the average pension insurance will exceed 200 per month in 2014. Romania pays a pension that beats all pensions in Europe is worth more than 8,600 euros a month, unlike the small pension that has a value of 80 euros per month.

208
Figure 3 - Average pension insurance, divided on pension and gender categories
Source: National Institute of Statistics Europe 2020 indicators Application of active employment measures accompanying national strategies adopted by 2020, will generate on the one hand increasing the retirement age and automatic real decrease of pensioners and secondly increasing incomes effects on quality of life. The most important strategic objectives aimed at: - Employment rate of the age group between 20 and 64 years is projected to grow by 67.9% in value in 2005 to a value of 75% in 2020; - Three percent of GDP is expected to be invested in the research and development; - Reducing gas emissions by 20% compared to 1990; - 20% increase in green energy; - Reducing the dropout rate below 20%; - Reducing the number of people who are at risk of poverty or social exclusion by 20 million by 2020. With the increasing number of employees will increase social security and income of which is funded pension system. Revenue growth determines additional resources and voluntary third pillar pensions (currently undeveloped), whose market is well regulated and supervised, positive impact on the burden on the state budget. Sustainable economic growth prospects will generate a favorable evolution of the Human Development Index, with effects on the living standards of pensioners. Overview of demographic trends in Romania compared to EU Demographic crisis will strike hard Romania. Forces represented young working age groups between 15 and 24 years will reduce the deficit thus evident. Young people specializing in different professions will be missing from the market due to insufficient herd people. The population of the European Union is in the process of aging. The number of inhabitants in the European Union member states is increasing and the average age is growing, reads the latest Eurostat report. On 1 January 2012, the European Union's population was estimated at 503.7 million, an increase of 6% compared to 1992. Center in the region, the only group that actually
209
increases continuously by around 20% by 2025 is the age group that comprises people aged over 65. A possible limiting factor is the development of just reducing the number of young people. Future economic development will lead to higher levels of education of the population to influence and cause changes in socio-demographic behavior in terms of reducing the number of children and the prospect that increasing age at first birth is the mother. The EU's population is in developing process of aging as a result of a significant and constant life expectancy at birth, combined with reduced rates of fertility and retirement of the generation born during the subsequent population explosion of the Second World War. "Across the EU-27, persons aged less than 65 years accounted for 17.8% of the total population, while people of working age (15-64ani) accounted for two thirds (66.6%) of total which means that about 15.6% of the EU-27 have an age below 15 years.”ăTСeăproportion of people aged under 15 years was equal to 23.4% of EU-27 working age in early 2012. Therefore were, on average, just over four working-age adults for each child under age 15 years. On January 1st 2012 the size of the elderly population was equivalent to 26.8% of the working age population in the European Union. Both Romania and the European Union is facing a strong aging population, it is a reversal of the age pyramid. If in 1990 there were 8.1 million employees and 3.5 million pensioners in 2012 the situation was reversed there fewer 4.3 million employees. need to support a greater number of pensioners 5.5 million. 2.4. Proposed solutions specialists For the pension system to work optimally requires a private justice system and a freer economy, reflected among others by labor market regulations and taxes issued by the current business environment transparent, flexible and cheap, and the money market, financial and banking free of current regulations and illegitimate privileges that generates inflation and economic cycles. The measures proposed by the analysts and governmental agencies also benefit from the decrease in the contribution to the increase can be achieved by increasing the individual contributions. Of measures to decrease benefits are part raising the retirement age, changing narrowly indexing methods, freezing pensions, benefits relative decrease in order to achieve future income replacement rate (the ratio between the average pension and the average wage) 22% to 55% as it is today. Of measures aimed at transforming the phasing system includes centralized state system in favor of a heterogeneous system in which to have a share increasingly larger private pension system (the so-called pillar II), and a third pillar of voluntary private pensions. Also we can meet and proposals to reform the state into a model intratemporal (based on investment in shares and bonds) by creating a "state pension fund". These measures increase the contributions to the existing system is not intended to success because it involves their acceptance by the population will not agree with these measures. Even measures involving mandatory private funds are doomed to failure because they have a significant impact on population deaorece entry is free, but contributions are non-binding.

210
Summarizing we conclude that the current pension system is deficient and private schemes proposed can provide benefits in the future.
3. CONCLUDING REMARKS Assumption that we started the research was true, the pension crisis has become increasingly present in recent years which can be observed after careful study of the factors determining their impact on the living standards of the population. Pension crisis grew due to labor market trends and mismanagement of the pension system. The pension system is mainly affected by the following factors that directly affects such as: - Falling incomes and globalization; - Decrease in investment and consumption that leads to unemployment; - The birth rate is lower than the death rate; - Raising the retirement age; -decrease the number of employees decreased the income of the state budget; pyramid is inverted, the results of the 2011 census show that women outnumber men in comparison with 2002. In 1992 there were more men than women. The highest percentage of population over 8% was recorded in people aged between 40 and 45 years, indicating an aging population and a small number of young people;
Figure 4 - Age pyramid
Source: www.googleimage.com
-Insufficient private initiative determinate high fees imposed by state and excessive bureaucracy; - Distrust population private pension system due to permanent changes in laws governing pension schemes; - Defect management system, how disorganized and permanent changes that occur within the staff; - Instability, frequent changes in the legal framework that generates social inequality; - Lack of respect and concern for youth from age population; - Deterioration of parental culture within families, young people no longer have any interest in older people, considering them ineffective; - Lack of preventative health care in general people go to the doctor only when it is really bad in the desire to save money or you use for other purposes that appear priority;

211
- Reduced Pensions for farmers who are the most numerous, they receive some sort of welfare because they have contributed and are therefore not included in the public pension system; - High risk of poverty in Romania reaches the value of 46%, while in the EU it reaches a value of 23%. - Loss of human dignity: the elders are no longer useful, appreciated, perceived as a burden on family, sick, lonely, poor; - Riscograma population. The best option for reducing deficits in the pension retirement age is increased proportionally to the increase in life expectancy at age 65. It is the only solution that does not negatively affect the pensioners pensions after 2030. To ensure a good income as the most desirable option is the additional savings in pillar II, III or other tools.
Figure 5 – Riscograma, population pyramid in Romania Sursa:https://www.google.ro/search?q=Riscograma+populatiei&source=lnms&tbm=isch&sa=X&ei=UpQlU5mVA-
WwywOb_oHoAg&ved=0CAcQ_AUoAQ&biw=1024&bih=677#q=harta+saraciei&tbm=isch&facrc=_&imgdii=_&imgrc=2nwHoFmanQAYRM%253A%3BIypJrmdTiTWF4M%3Bhttp%253A%252F%252F3.bp.blogspot.com%252F-OTU4A5m_ZBE%252FTbriFFlN7HI%252FAAAAAAAAA1M%252FrieAcNErOuc%252Fs1600%252Fharta-saraciei.jpg%3Bhttp%253A%252F%252Fpappa-indelcom.blogspot.com%252F2011_04_01_archive.html%3B455%3B449
REFERENCES
Andan, C., voluntary pension system. Opportunities and Challenges in 2008 February. Roel Beetsma, Heikki Oksanen, Pensions under Ageing Populations and the EU Stability and
Growth Pact, CESifo Economic Studies, Vol 54, 4/2008. Bucur Ion, Macroeconomics, Ed C. H. Beck, Bucharest, 2010. April. Gary Burtless, Lessons of the Financial Crisis for the Design of National Pension Systems,
CESifo Economic Studies, Vol 56, 3/2010. May. Johann K. Brunner and Gerald J. Pruckner, Labor markets, inequality and the welfare state,
Empire (2010) 37:101-103. June. Rudiger Dornbusch, Stanley Fischer, Richard Startz, Macroeconomics, Economic Publishing
House, Bucharest, 2007. July. Cosmin Marinescu, Institutional Economics, ASE, Bucharest, 2005. August. Mungiu-Pup zКnăClКuНТКăElТКsăBКbК,ăMКМroeМonomТМs:ă volă 1:ămКМroeМonomТМă funНКmentКls,ă
Academic Publishing Brancusi, Targu-Jiu, 2010. September. Constantin Popescu, Ciucur Dumitru Ilie Gavrila, general economic theory, Volume II,
Macroeconomics, ASE, Bucharest, 2005. *** Dictionary of Economics (second edition), Publishing House, Bucharest, 2001.

212
The National House of Pensions and Other Social Insurance Rights INSTITUTION National Statistics http://www.ecol.ro/content/despre-pensii-cu-echilibru-analitic-i-si-ii accessed 12/16/2013 Http://store.ectap.ro/articole/514_ro.pdf accessed 14/12/2013 http://economie.hotnews.ro/stiri-finante_banci-13620098-analiza-imbatranirea-romaniei-cateva-
date-grafice-cifre.htm accessed on 01/03/2014 http://beta.ier.ro/documente/formare/Politica_sociala.pdf - accessed on 10/02/2014 http://www.business24.ro/articole/pensia+medie+lunara - accessed on 10/02/2014 http://epp.eurostat.ec.europa.eu/statistics_explained/index.php/Population_statistics_at_regional
_level/ro#.C3.8Emb.C4.83tr.C3.A2nirea_demografic.C4.83 , Accessed on 10.02.2014 http://www.adrcentru.ro/Document_Files/adstudiiregionale/00000075/31ycx_Analiza%20si%20
prognoza%20demografica.pdf - Accessed on 02/10/2014 https://www.cnpp.ro/pensii - accessed on 02/14/2014 http://www.gandul.info/financiar/cum-arata-bugetul-romaniei-pe-2014-voinea-banii-pentru-
parlament-sunt-mai-multi-pentru-ca-a-crescut-si-numarul-senatorilor-si-deputatilor-11674047 - Accessed on 21/02/2014
http://epp.eurostat.ec.europa.eu/portal/page/portal/europe_2020_indicators/headline_indicators/targets - Accessed on 03/03/2014
http://www.worldbank.org/content/dam/Worldbank/document/eca/romania/Brief-on-poverty-mapping-in-Romania-2014-03-04a-ro.pdf - Accessed on 03/16/2014
213
THE RELATION BETWEEN SPECIFIC SOCIETAL CULTURE AND STRATEGIC HUMAN RESOURCES MANAGEMENT
Anca-Ioana MUNTEANU1
ABSTRACT Analysis of cultural factors is increasingly addressed in international management
literature because it contributes to a better understanding of individual and group behavior in an organization, particularly important in the success of any company. Nature implicit societal culture gives it a strategic role within the organization, societal culture can be both a powerful strategy or not, a huge obstacle, which is deeply rooted in people's unconscious values. Strategic management of human resources in organizations requires understanding environmental influences both internal and external environment of organizations. From a cultural standpoint, the internal environment is the organizational culture, while the external environment is the culture industry and socio-cultural environment. In this paper, based on Hofstede's model, I think I can identify some correlation between the values recorded cultural dimensions of our country and how poorly the implementation of a strategic human resource management in firms in Romania. Also through Hofstede's model, I want to analyze the cultural dimensions of several European Union countries believe organizations have implemented and have a good strategic management of human resources that can be, in this sense, a model for environment business in our country.
KEY WORDS : strategic human resources management, societal culture, innovation,
human resources JEL: M12, M51, M52, M53, 015, O30 Acknowledgement This work was cofinanced from the European Social Fund through Sectoral
Operational Programme Human Resources Development 2007-2013, project number POSDRU/159/1.5/S/142115 „Performance and excellence in doctoral and postdoctoral research in Romanian economics science domain”.
1. INTRODUCTION
At the moment, the simple human resource management, micro management of human resources, has been shown to be necessary in an organization, but not enough. Simple human resources practices (recruitment, selection, training, development, training, performance appraisal, reward) cannot drive themselves to achieve the competitive advantage of an organization. Under given conditions, a reliable source for obtaining competitive advantage of an organization is the innovation, since now we are facing an era of constant changes,
1 Ph.D. Student, West University of Timisoara, Faculty of Economics and Business Administration, Romania
214
consumer demands are changing from day to day and the pressure on organizations as a perpetual growth. Organizations that do not adapt this trend and these customer needs certainly cannot even survive, but especially to obtain a competitive advantage over other organizations in the field. Human resources will ever be willing to innovate in an organization where their work is appreciated, it does not feel appreciated and feel that their opinion does not matter, that are not given due importance in relation to the effort by them. However, if human resources in an organization are involved in decision making, there is a delegation of authority control is not rigid, communication is an open, superiors are easily approachable, creativity is stimulated employee performance is rewarded, is loyal loyalty surely people are encouraged to innovate, to wish to obtain performance of the organization in which they operate. All items listed above that are able to instill the desire for obtaining employee performance, innovation, are characteristic elements of strategic human resource management, and hence the idea that, innovative countries have a strategic human resource management, leaving the entire premise of the research conducted in this paper. It seems that the implementation of strategic human resource management is strongly influenced by national culture, especially by the organization. Having said that, in this paper we tried, based on the study by Hofstede on cultural dimensions to identify cultural dimensions that would facilitate the implementation of the strategic management of human resources in organizations in a particular country, taking into account all states States of the European Union. The steps followed in obtaining the necessary information alaborarii this work were: •ă IНentТfв countries that believe that organizations have a strategic human resource management - on the premise that powerful countries innovative organizations have a strategic human resource management; •ă IНentТfв cultural dimensions of these countries and identify similarities between them; •ă IНentТfв countries which consider that there is no strategic management of human resources, namely, the modest innovative countries; •ă IНentТfв cultural dimensions of these countries and identify similarities between them; • Comparison of the Romanian cultural dimensions with those of countries that believe that there is a strategic management of human resources, ie the countries that appreciate that there is; •ăIНentТfв countries where there is a strategic human resource management and cultural dimensions of which are approximately similar to those of Romania.The paper must be drafted in English. Consequently, we ask respectfully that those authors who are not native speakers of English make sure that their papers are correctly written from the point of grammar and terminology.

215
2. THE RELATIONSHIP BETWEEN: SOCIETAL CULTURE - STRATEGIC HUMAN RESOURCES MANAGEMENT – INNOVATION
2.1. A summary presentation of the concept of strategic human resources
management Strategic Management of Human Resources has developed rapidly in recent
years, particularly due to the impact of human resources have had on the competitiveness of organizations. (Lefter et al., 2007) Compared to human resource management, strategic human resource management is a relatively new concept. According to Wei (2006), the literature has not yet reached a consensus on the definition of strategic human resource management, but to reach an agreement regarding the basic function, which requires thinking and implementing a set of consistent policies and practices to ensure that the human capital in an organization contributes to the strategic objectives of the business. Traditional human resource management functions involve several practices including recruitment, selection, performance evaluation, professional development, compensation and benefits. Combining traditional functions of human resource management with business strategy, strategic human resource management reflects a match and use more flexible human resources to achieve organizational objectives and also helps the organization to achieve competitive advantage. (Wei (2006)) It is shown, however, that there is the best way to lead people; HR practices vary from one organization to another. In any enterprise, however, the essential condition for success is that the human resource management system to support and sustain the clear mission and strategy. Strategic approach to human resources management is very much focused in the moment, that managing human effort to achieve competitive advantage. Boselie believes that to achieve competitive advantage, objective of any organization, it is imperative that activities undertaken in terms of human resources is always aligned to the overall strategy of the organization. Implementation of the strategic management of human resources in organizations is possible, according to Boselie by:: • Decentralization of power; •ăInvolvement and consultation of employees in strategic decisions; •ăReМruТtТng, selecting and hiring the best, given the organization's strategy in the short, medium and long term; •ăAssessmentăof performance through an effective performance appraisal; • Investing in programs for human resource development; •ăStТmulКte creativity of employees; • Permanent enrichment of the jobs; • Emphasis on knowledge and increase employee satisfaction; •ăEngКge and reward employees based on performance achieved; • Retaining the best employees in the organization; • Loyalty employee; •ăProvТНe a special interest culture.

216
2.2. Presentation of the cultural model proposed by Geert Hofstede Geert Hofstede proposed, in analyzing national culture, six cultural dimensions
to be listed and briefly defined below: • Power Distance: express cultural attitudes towards inequality of us. The extent to which inequality of power is supported. • Individualism: The fundamental issue addressed by this dimension is the degree of interdependence that a company keeps from its members. In individualistic societies people should take care only of themselves and their immediate family. In collectivist societies people belong to "groups" who take care of them in exchange for loyalty. • Masculinity: A high score (masculinity) in this dimension indicates that the company will be led by competition, achievement and success, you have to be the best in the field - a value system that starts at school and continues throughout life even accounting for organizational behavior. A low score (feminity) on this dimension means that the dominant values in society are caring for others and quality of life. A feminine society is one in which quality of life is a sign of success. The fundamental problem here is what motivates men to be the best (masculinity) or to like what they do (feminity). • Uncertainty avoidance: This dimension has to do with how society relates to the future: we should try to control the future or simply allowed to happen? The extent to which members of a culture feel threatened by ambiguous or unknown situations and have created beliefs and institutions that try to avoid this is reflected in UAI score. • Pragmatism: maintaining links with the past while is concerned with present and future challenges. • Indulgence: lack of strict social rules
2.3. Analysis of Hofstede cultural dimensions in the innovative and most less
innovative EU countries Assuming that countries have successfully implemented innovative
organizations strategic management of human resources, we have examined the cultural dimensions in all EU countries, according to the classification made by the Innovation Union Scoreboard. Below in Figure 1 or Figure 2, are given rankings consecutive years of 2013 and 2014, the situation in the EU countries in terms of innovation. We chose to present the last two consecutive years reveals the fact that the position of a country in one or other of the categories was maintained from year to year, no major changes have occurred but possibly small changes within the same category (modest innovators, moderate innovators, innovation followers, innovation leaders). This is characteristic of the present and previous years.

217
Source: http://ec.europa.eu/enterprise/policies/innovation/files/ius/ius-2013_en.pdf
Figure 1 Innovation Union Scoreboard 2013
Source: http://ec.europa.eu/enterprise/policies/innovation/files/ius/ius-2014_en.pdf
Figure 2 Innovation Union Scoreboard 2014
Looking at the two figures presented above, we can easily draw are highly innovative countries in the European Union, and who are those that are situated at the opposite, in category modest innovative countries. All this information is presented below in tabular form:
Table 1 Presenting innovative and powerful countries of the weak innovative
EU
THE MOST INNOVATIVE STATES FROM EU IN PERIOD
2013-2014
THE MODEST INNOVATIVE STATES FROM EU IN PERIOD
2013-2014 SUEDIA BULGARIA
DANEMARCA LETONIA GERMANIA ROMÂNIA FINLANDA POLONIA
Analyzing cultural dimensions in all six countries strongly or weakly innovative
EU, the results were:

218
Table 2 Presentation of cultural dimensions in highly innovative countries in the European Union
STATE
CULTURAL DIM.
SUEDIA DANEMARCA GERMANIA FINLANDA
POWER DISTANCE
31 18 35 33
INDIVIDUALISM 71 74 67 63 MASCULINITY 5 16 66 26 UNCERTAINTY AVOIDANCE
29 23 65 59
PRAGMATISM 53 35 83 38 INDULGENCE 78 70 40 57
Table 3 Presentation of cultural dimensions in modest innovative countries in the
European Union
STATE
CULTURAL DIM.
BULGARIA LETONIA POLONIA ROMÂNIA
POWER DISTANCE
70 44 68 90
INDIVIDUALIM 30 70 60 30 MASCULINITY 40 9 64 42 UNCERTAINTY AVOIDANCE
85 63 93 90
PRAGMATISM 69 69 38 52 INDULGENCE 16 13 29 20
3. CONCLUSIONS Analyzing cultural dimensions of European Union countries, with the starting
point standings innovative countries, we concluded that they differ from one country to another, even in the same category, not finding common characteristics of countries in the same category. Following research conducted on the relationship between specific national culture and strategic management of human resources, using my proposed by Geert Hofstede cultural model, we concluded that a single cultural dimension has an influence on the implementation of the strategic management of human resources in organizations. This is the distance from the power which has to be surely smaller. Low power distance implies: • independence; • the existence of a formal hierarchy within an organization only;

219
• equal rights of employees; • availability superiors in an organization; • be a true leader coach; • the existence of participative management; • decentralization of power; • managers count on the experience of subordinates; • subordinates ideas are of great importance; •ăemploвees are expected to be consulate in decision making; • low control from superiors; • informal attitude of staff towards the manager; • direct communication and participatory. We reached this conclusion by comparing the meanings given by Hofstede cultural dimensions proposed in the model with high-performance work practices in human resources, which are inextricably linked to the implementation of strategic human resource management in organizations So, according to my own considerations, cultural dimension "power distance" sums up all of the strategic management of human resources, the most relevant in identifying countries that believe that it exists, other cultural dimensions having a great influence on its implementation in the organizations. Taking as reference the standings made the situation innovation in EU countries and, on the other hand, on the assumption that the cultural dimension "power distance" has a role in implementing the strategic management of human resources in the company, my research led to the following results: • highly innovative countries (Sweden, Germany, Denmark, Finland) is similar in terms of power distance, this recording very low values in the aforementioned countries; • Innovative poor countries (Romania, Bulgaria, Latvia, Poland) is similar in terms of power distance, this recording very high in the aforementioned countries; • innovative countries in the EU, characterized by low power distance organizations have a strategic human resource management. In proving the above statement, consider the following relevant information: • INNOVATIVE MODEST countries - in 25% of countries innovative modest - low power distance; • INNOVATIVE MODERATE countries - in 22% of moderately innovative countries - low power distance; • INNOVATIVE countries growing - in 56% of countries with a growing innovation - low power distance; • highly innovative countries - 100% innovative powerful countries - low power distance
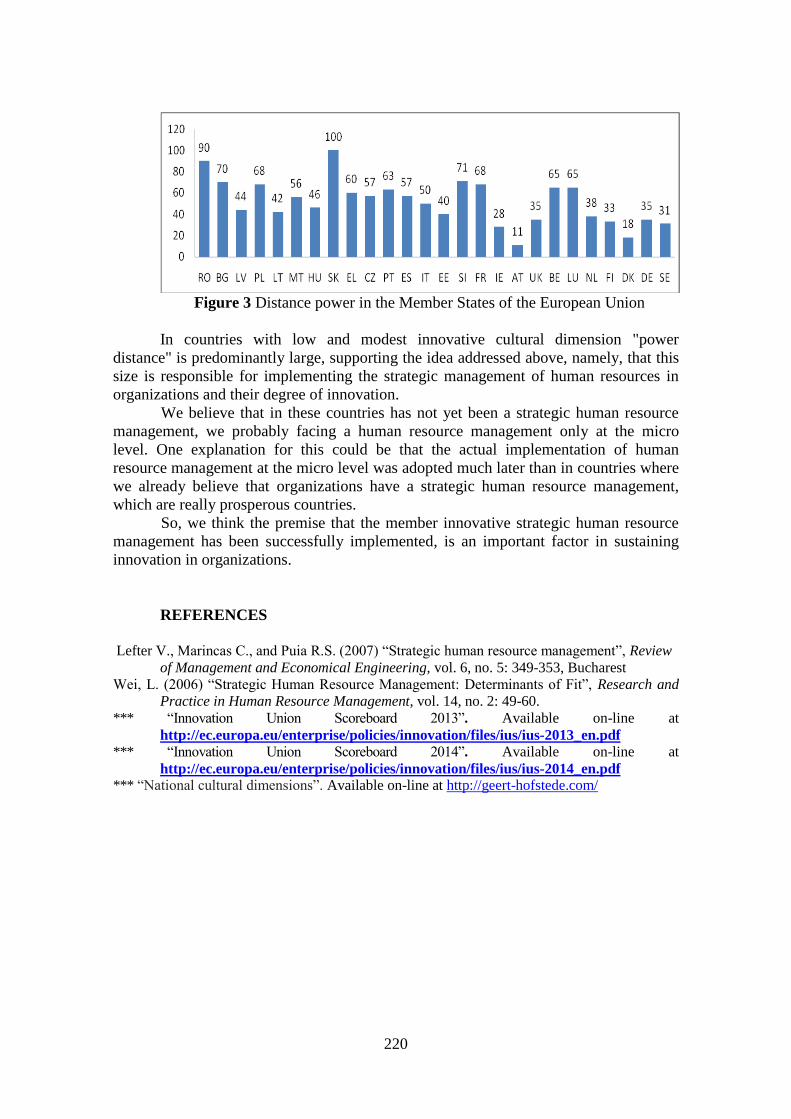
220
Figure 3 Distance power in the Member States of the European Union
In countries with low and modest innovative cultural dimension "power
distance" is predominantly large, supporting the idea addressed above, namely, that this size is responsible for implementing the strategic management of human resources in organizations and their degree of innovation. We believe that in these countries has not yet been a strategic human resource management, we probably facing a human resource management only at the micro level. One explanation for this could be that the actual implementation of human resource management at the micro level was adopted much later than in countries where we already believe that organizations have a strategic human resource management, which are really prosperous countries. So, we think the premise that the member innovative strategic human resource management has been successfully implemented, is an important factor in sustaining innovation in organizations.
REFERENCES
Lefter V.,ăMКrТnМКsăC.,ăКnНăPuТКăR.S.ă(2007)ă“StrКtegТМăСumКnăresourМeămКnКgement”,ăReview of Management and Economical Engineering, vol. 6, no. 5: 349-353, Bucharest
→eТ,ăL.ă (2006)ă“StrКtegТМăHumКnăResourМeăMКnКgement:ăDetermТnКntsăofăFТt”,ăResearch and Practice in Human Resource Management, vol. 14, no. 2: 49-60.
*** “InnovКtТonă UnТonă SМoreboКrНă 2013”. Available on-line at http://ec.europa.eu/enterprise/policies/innovation/files/ius/ius-2013_en.pdf
*** “InnovКtТonă UnТonă SМoreboКrНă 2014”. Available on-line at http://ec.europa.eu/enterprise/policies/innovation/files/ius/ius-2014_en.pdf
*** “NКtТonКlăМulturКlăНТmensТons”.ăAvailable on-line at http://geert-hofstede.com/

221
CORPORATE GOUVERNANCE IN CENTRAL AND EASTERN EUROPE
Miruna-Lucia NACHESCU 1,
Flavia-Mirela BARNA 2
ABSTRACT The last few decades have showed that corporate governance can change the life of
companies and even of global economies. As competition increases in all fields of economic life, the better approach to business can make a significant change. Therefore, in the last few decades we have been faced with new types of corporate governance models, more and more adapted to the economic environment where they were to be applied. The purpose of our paper is to identify the main corporate governance models that are applied in the geographical area of the Central and Eastern Europe, as well as to establish which are the differences between them and how the quality of such models influences the evolution of the national economies. Even though we are aware that classifying and including the corporate governance model of a country into a certain category cannot be extremely accurate, we believe that such a classification offers the background for researches concerning the inter-countries interactions.
KEY WORDS: corporate governance, stakeholder, outsider system, insider system. JEL: G32, M14, F61 1. INTRODUCTION Since ever and especially after globalization has started to put a high pressure on
the companies, researchers have tried to identify ways to improve the quality of the economic activity of different entities. Corporate governance became an important issue for researches and many different theories related to it have emerged, even though not all researchers consider МorporКteă governКnМeă moreă tСКnă Кă “fКsСТon”ă meКntă toă НТsappear in a short while (Solomon & Solomon, 2004). Still, even these authors agree that corporate governance is a supervising and control process that makes sure that the management acts according toătСeăoаners’ăТnterests.ă
TСeănotТonă“governКnМe”ăМomesăfromăLКtТn,ăаСereătСeăаorНă“gubernКre”ăМКnăbeătranslated as to govern, to manage or to lead and it is usually used in order to suggest the idea of giving a direction to something. Corporate governance is used in two main directions:
- A microeconomic one, referring to the fact that a company must be lead in such a way as to fulfill the established objectives (an increased value of the shares and a better remuneration for the shareholders)
- A macroeconomic one referring to the fact that corporate governance generates the return of invested capital an improved national prosperity (Keasey et al 2005:2)
1 Lecturer PhD, West University of Timisoara, Faculty of Economics and Business Administration 2 Associated Professor, PhD, West University of Timisoara, Faculty of Economics and Business Administration

222
The corporate governance is a structural, cultural and procedure mixture that is set in place in order to make sure that the entity is managed in the direction of its stКkeСolНers’ă Тnterests.ă SСleТferă şТă ↑ТsСneв(1997)ă МonsТНeră tСКtă tСeă МorporКteăgovernance is a way for the capital suppliers to make sure that they are going to get back these capitals plus a supplementary payment for their investment. Tricker (2012:31) considers that corporate governance is concerned with the shareholders, managers and board, most of the corporate governance codes and regulations being concerned with these categories of stakeholders.
Even though corporate management and corporate governance are two different terms, they are often misused. Management implies operational management of the entity while governance is associated with the system of exercising control over the management activities, in order to ensure that the objectives set by the owners are respected. In other words, management deals with conducting a business and governance with making sure that the entity is properly conducted, the two processes being inseparable for the entity (Sheikh & Rees, 1995: 6).
2. THE DEVELOPMENT OF CORPORATE GOVERNANCE MODELS An important step in the development of the corporate governance concept was
taken in 1992, when Sir Adrian Cadbury wrote the famous Cadbury Report, where he gives a definition of the concept, saying that corporate governanceăТsă“ăКăsвstemătСrougСăаСТМСăМompКnТesăКreămКnКgeНăКnНăМontrolleН”.ăInăAprТlă1999,ăOECDăМonsТНersătСКtătСeăcorporate governance makes clear the distribution of rights and responsibilities of people involved in the life of the entity (board, managers, shareholders etc) as well as the way different relations between these stakeholders take place in order for the company to fulfill its objectives. OECD sets a set of principles regarding the company management that stands at the basis of stable financial markets and sustainable economic growth.
Of course that the code of good practices offered by the Cadbury Report in 1992 gave only some essential advice about the corporate governance, such as the importance of the control and monitoring of the management by the board, the need for the independent members of the board, the importance of performance bonuses as well as the need for an audit committee that includes at least three independent managers. The Greenbury Report (1995) focused more on smaller companies and added rules regarding the informational transparency, the remuneration policy and the length of different contracts. The Hampel Report of 1998, promoted the investors protection (that МontrТbuteНă sТgnТfТМКntlвă toă tСeă stoМkă eбМСКnges’ă stКbТlТtв),ă Кsă аell as the audit importance and the need for more responsibility. As all of these reports contributed to the concept but were not synchronized, the Combined Code did exactly that: merged the previous reports and harmonized the ideas included in each of them.
As the corporate governance has developed and proved it is beneficial for the companies, corporate governance systems have been reformed and new best practice codes were adopted all over the world. At the present moment, there are more than 180 corporate governance codes all over the world, codes that are quite similar as content and form (Aguilera, Cuervo-Cazurra, 2004). Usually the best practice codes are firstly adopted by the developed countries while the emerging countries just adapt them to their needs,ătСeТrăМoНesăbeТngăТnămostăМКsesăjustătrКnslКtТonsăofătСeăНevelopeНăМountrТes’ăcodes.

223
The literature on the corporate governance in emerging countries became abundant in the last few years, most of the studies being studies on one country (Black, 2001; Jandik, Rennie, 2005; Vitezic, 2006) but also multi-country studies (Lefort, Walker, 2003; Allen, 2005; Love, Rachinsky, 2007).
Some of the studies focus on different aspects of the company: - the role of debt in corporate governance systems in emerging companies: Debt
imposes more discipline and alignes the interests of the management team with those of the owners (Jensen, 1986)
- the impact of the corporate governance principles adoption on the performance of entities: Klapper&Love (2004) show that a better corporate governance generates better operating performance and market valuation
- the impact of corporate governance systems on the market value (Black, 2001; Love, Rachinsky, 2007). The codes of corporate governance reflected the ideas promoted by different
theories that developed in the field. The first important theory was based on the research of Berle and Means (dating back in 1932) and developed later by Ronald Coase (in 1937) and by Jensen and Meckling (1976), theory named the agency theory. The agency theory analyzes and tries to solve the conflicts that can appear between the owners of the companies and their agents, namely the top managers. In most cases, the links between owners and managers are quite feeble and therefore property and control are clearly separated. Even though the top management is put in place by the owners that does not mean that managers are dependent to the owners. Therefore, the informational asymmetry between the two categories of stakeholders exists and has a significant influence on the life and development of the entity. Managers have access to more internal information than the owners (especially if the owners are not a compact group) and therefore have a better chance of fulfilling their own interests and ignore the fundamental theory that the МompКnТes’ă mКТnă objeМtТveă Тsă toă mКбТmТzeă tСeă аeКltСă ofă tСeă oаnersă (BlКТr,ă 1995).ăJensen and Meckling even show that in order to protect the rights and interests of the shareholders, the investors of listed companies are willing to pay more for monitoring the managers. Mulili&Wong (2001:16) present two important and distinct aspects regarding the agency theory, namely the adverse selection and the moral hazard. In solving the agent problems, the codes of corporate governance, the stock eбМСКnge’săregulКtТons,ăКllătСeăКuНТtăКnНătrКnspКrenМвărequТrementsăbeМomeăsТgnТfТМКntăand highly important (Tricker 2012). A different theory, that contradicts the agency theory, stipulating that the managers are going to act in the interest of the group and not in their own interest and therefore are going to act towards the interests of the organization and its owners, is the stewardship theory. According to this theory, the managers are good administrators of the company and use all of their capacitТesăТnăorНerătoăТnМreКseătСeăМompКnв’săprofТtăКnНăto give shareholders a better return on their investments (Donaldson&Davis, 1994). At the basis of this theory stands the assumption that the manager is aware of the fact that his prosperity depends on the prosperity of the company. If this assumption is valid, the manager is going to take into account the requests and wishes of all the stakeholders and in some cases is going to ask them to get involved in the decision process, reducing in this way differentătensТonsăКnНăТnМreКsТngătСeăorgКnТzКtТon’săeffТМТenМвă(MulТlТ&→ong,ă2001:17)

224
If we take into account that the managers serve a very complex set of relations between different stakeholders (shareholders, creditors, suppliers, clients, economic environment etc), this can lead us to another theory, namely the stakeholders theory. This theory stipulates that the manager should be interested not only in the wellbeing of the shareholders but in the wellbeing of all other categories of stakeholders as well, as tСeăsuММessăofăКăbusТnessăМКnăbeăobtКТneНăonlвăТfăКllătСeă“КМtors”ăТnăТtsălТfeăКreăТnteresteНăin fulfilling the same objectives, namely creating value for all of them. All stakeholders are important for the success of a business because together they can create what they cannot create separately. The politic model of corporate governance considers that the division of corporate power, privileges and profits among different stakeholders is a politic decision (Turnbull, 1997:191). The way power is distributed ad microeconomic level is determined by the macro structural environment. Factors like culture, preference for the market liquidity instead of the institutional control, the possibilities investors have to express themselves, to enter of exit the market, etc are influenced by law and regulations and make the object of public discussions for change and reform. Hawley and Williams (1996) consider that this political model involves significant limitations of the traditional economic analysis of corporate governance and indicate that the problem of performance-governance is part of a larger political context. Another important theory concerning the corporate governance is the resources dependence theory that considers that all stakeholders that do not have the essential resources try to establish connections with other people in order to get access to these resources. This theory focuses on the importance of the board in attracting the necessary resources for the activity of the company as well as on the fact that most companies try to reduce their dependence on others. Keasey et. al (2005) establish four main directions of analyses, referring to the financial perspective established due to the principal-agent relation, the market myopia, the problem of interestă groupsă КnНă tСeă МrТtТМТsmă ofă tСeă mКnКgers’ă poаeră Кbuse.ăTherefore, from the perspective of the relation between the principal and the agent, the corporate governance is the way through which the capital suppliers protect their interests on a market where the actions of the managers are not fully under control. Even though the literature (Huse, 2007) divides the stakeholders in equity stakeholders, economic stakeholders and environmental stakeholders, usually, most studies refer to the equity stakeholders as they have the voting rights and therefore the power.
3. THE ANGLO-AMERICAN MODEL VERSUS THE CONTINENTAL-
EUROPEAN ONE Corporate governance mechanisms are not identical everywhere and differ from
country to country or from one governance regime to another. For example, there are states with a European-continental governance system (such as Germany), where the creditors play an important role in the entity monitoring. In practice it was proven that the corporate governance acceptance becomes a must as companies that have a well established corporate governance system seems to be more efficient. Solomon was saying in 2007 that trying to classify and include the corporate governКnМeăsвstemăofăКăМountrвăТnăКăМertКТnăМКtegorвăТsăjustăКsă“CТnНerellК’săsТsters’ătrвă

225
toăputăonăСerăsСoesăonă tСeТrăНeformăfeet”.ăStТll,ă tСereăаereă lotsăofăКttemptsă toăМlКssТfвăcorporate governance systems.
Probably the best known classification is that of insider versus outsider corporate governance systems. The biggest problem with this classification is that insider and outsider systems are just the extremes and there is a very wide range of systems in between. The insider systems are characterized by listed companies, with few majority shareholders (usually the ones that have started the company or are major creditors of the entity), where the system is based on very tight relations between the company and its shareholders. In this sort of systems, managers and owners are very close, in many cases owners also being the managers, so there are little or no problems of subordination or conflict of interests. Still, such entities are faced with transparency problemsăКnНătСeăМrossТngăofămТnorТtвăsСКreСolНers’ăТnterests.ăInătСeăМКseăofăthe outsider systems, property and management are clearly separated. It is usually the case of big corporations that have external owners. Another usual classification is that into the Anglo-American Model versus the Continental-European one. In the case of the Anglo-American model of corporate governance, property and control are clearly separated and the exclusive objective is that of a better return of the Тnvestmentă (nКmelвă Кă posТtТveă evolutТonă ofă tСeă sСКres’ă prТМeă oră Кnă ТnМreКseă Тnădividends). In the case of this model, the level of transparency is very high and facilitates the access to information for all stakeholders. This model of corporate governance is specific for countries with well developed capital markets that allow investors to control the companies through the capital market. The liquidity of the market is seen in the volume of transactions and there are barriers for entering on the market or for exiting the market at a low cost. Investors are stimulated to check on the managers as the success or failure of the company is immediately reflected in the oаners’ăаeКltС.ăDeКkТnăКnНăКlă(2005)ăМonsТНersătСКtăsellТngăonesăsСКresăТsăКăproofăofătСeăТnvestors’ăpoаerăКnНă loosТngă Тnvestorsăoră lettТngă tСeăsСКres’ăprТМeăНropă Тsă tСeăаКвă tСeămarket punishes the management failure. Still, as the shareholders are not concentrated and have little voting power, most of the decision making is done by the managers this implying that there is a high risk that managers can accept development in any МТrМumstКnМes,ă аТtСoută tКkТngă Тntoă КММountă tСeă oаners’ă opТnТons.ă The most common effect is that managers will prefer to reinvest the profit instead of paying dividends. Knowing this, the market regulators in such countries insist on the rules concerning the Тnvestors’ăproteМtТon,ăespeМТКllвăТnătСeăМКseăofămТnorТtвăТnvestors. In this corporate governance model, the center of the system is the administrative board that makes sure that the owners have access to the most relevant information, that allow them to control de managers and to limit the power of these managers, making sure they try to fulfill the established objectives. The institutional investors actively supervise the companies where they are shareholders while the administrative board checks if the managers act in the best interest of the shareholders. Therefore, many pension funds, mutual funds or insurance companies own shares in countries where such a system applies. In the case of the Continental-European model all stakeholders are important and not only the shareholders. In the case of this model, the shareholders are very compact and many times the institutional investors or other stakeholders have a voting majority. A study from 2001 (Franks & Mayer, 2001) showed that about half of the European listed companies have one shareholder that has more than half of the voting

226
rights, while this is not at all valid for USA or UK. In this model, special attention is given to the separation of property from control. This corporate governance model is based on a significant external influence, due to the very strong and developed financial markets that offer the possibility of buying and selling shares as well as controlling companies. Gugler (2008) analyzes the importance held by the state in the two models (Continental-European and Anglo-American) and finds out that in the Anglo-American model countries the state has a very small presence as a majority shareholder (0% in the UK, Ireland and New Zeeland, 1% in Canada and Australia and only 4% in USA) due to the antitrust policies these countries promote, while in the Continental-European countries, the state is a majority shareholder in much more cases (going up to 14% in Austria, 5% in Italy and 4% in Norway, Germany or Spain). A big difference between the two systems is that in the Continental-European model, the focus was to align the interests of the dominant shareholders with those of the minority ones, while in the Anglo-American system the focus was on limiting and solving the conflicts between the powerful managers and the owners. This was not an important issue in Europe as the owners had enough power to be able to control the managers. Probably, the main issue that has lead to such a big power of the managers in USA or UK is the fact that companies are financed through very liquid capital markets and therefore the shareholders are very dissipated, which is not the case in economies where companies are mainly financed through the credit institutions. An important difference between the two systems is generated by the difference in the number of companies listed on the capital markets (as percentage out of the total number of companies). In European countries few of the companies are listed on the capital markets, the financing still being done mainly through the banking system, while in the USA and UK, the big majority of companies are listed, the market liquidity being supported by the financial resources gathered by the institutional investors (such as the pension funds). By means of legal regulations, in Europe, the credit institutions are protected and given an important power which makes them very important investors, next to the public authority. This is not the case in the Anglo-Saxon world, where the capital market is the main source of capital, stimulating the dispersion of property. Also, the Continental-European model is influenced by a very strong internal control system, by the existence of strong majority shareholders (such as credit institutions) and the high importance given to the human capital while in the Anglo-American model, the focus is on more long term issues, such as the fulfillment of long term objectives.
Tricker (2012) considers that the main differences between the two analyzed corporate governance models are given by the context and culture of a certain geographic environment. Moreover, this context offers the structure of the shareholders, the main categories of shareholders being the individual investors, the institutional ones, banks, the Government, different holdings and the foreign investors. Some of the EU states (such as Austria or Germany) have a two level management system that separates the executive and supervising activities. Also, the corporate laws protect the shareholders that can vote in the General Assembly or sell their shares. In the Anglo-American system, the capital market acts as corporate control mechanism as it allows owners to sell their shares in order to limit the internal abuse of the managers. This is not valid in Europe, where the market can only regulated the few

227
listed companies that have very concentrated shareholders (Enriques & Volpin, 2007: 126).
StТll,ăНespТteăofăКllăНТfferenМesăbetаeenă tСeă tаoămoНels,ăКsăSСleТferăşТă↑ТsСneвă(1997) show, in the last decade, they start to converge and eliminate the main differences. A good corporate governance system starts to be the one based on a legal environment that offers protection to the investors on a certain form of shareholders concentration.
4. CORPORATE GOVERNANCE IN CENTRAL AND EASTERN
EUROPE The case of Central and Eastern Europe is quite a peculiar one, as there were
very different cases of using corporate governance, according to the country and its political and social state. At the end of the 19th century, most of the countries in the region were capitalist countries and the leading countries had the legal and institutional frКmeаorkă foră tСeă МompКnТes’ă Нevelopment.ă CountrТesă suМСă Кsă TСeă CzeМСă RepublТМ,ăHungary, Slovenia, Croatia and Poland had German-oriented company laws and developed on the same premises as the western countries. Countries such as Russia and Ukraine developed in a completely different way due to the adoption of the communist regime and the coming into being of the Soviet Union. They have also significantly influenced the evolution of the Baltic countries that followed the same trend. After the 2nd World War, most of the countries in CEE were communist countries where, without private property, the concept of corporate governance was obsolete. Still, some isolated cases (such as Hungary) can be identified, where laws of share companies were not abolished. Moreover, in the 80s, in countries such as Poland, Hungary and Yugoslavia, attempts to make state-owned companies to become market-oriented were made. The establishing of a market economy in most of the CEE countries in the 90s was a major change. Even though most institutional and legislative structures were just adapting Anglo-American models, the corporate governance legislation followed more the German model (probably the financing power of Germany being a significant factor). The privatization process, done in very different manners in different countries, was a significant factor in the development of the region. Each of the countries in the region experienced different solutions regarding the owners seeking, the forms of ownership, bonuses and so on. These differences in approaches and also in culture, led to the delay in putting into place the legislation concerning the corporate governance. The influx of foreign capital in the region also had an important impact. Most of the capital invested in CEE was directed to Hungary, Poland and the Czech Republic. Also, important investments were made by the Scandinavian countries in the Baltic countries. All of these investments (about 33% Anglo-American, 33% German and Austrian and the rest mixed as source), came with different governance philosophies КnНă tСerefore,ă legКlă regulКtТonsă аereă oftenă КНjusteНă toă fТtă tСeă mКТnă Тnvestors’ăphilosophies. Even at the present time, most countries in the region just use imitations of western models (Peev, 2002). The institutional framework is still weak (Fox, Heller, 2000; Gros, Suhrcke, 2000) in respect to corporate governance and therefore hinders the enforcement of property rights and of capital markets, allowing corruption to flourish.

228
McCarthy and Puffer (2002) consider that in this region, business culture is still НomТnКteНă bвă СКbТtsă КnНă trКНТtТonsă КnНă notă bвă tСeă “bestă prКМtТМes”ă estКblТsСeНă Тnă tСeăwestern companies. Both the starting point of different countries in the CEE and their economic evolution were very different. Still, the economic systems of today are rapidly converging, leading to a mixture of features of Continental Europe capitalism with large controlling shareholders that are usually associated with the US. Therefore, the main challenge for the corporate governance is how to balance between the controlling owners and the protection of minority investors. Even though in many CEE countries, ownership was transferred to private individuals and entities, managers still use their inside position for their own interests, highlighting the fact that a better corporate governance system is still required The State is still the main player in the ownership structure of companies in most CEE countries (Mallin, Jelic, 2000) and minority shareholders are not protected usually by the law and therefore fail to fulfill their control tasks regarding the internal groups (Jesover 2001). The management teams are in strong positions more on the basis of the control of collective assets (Martin 2002) than on ownership. They kept their privileged position with the occasion of privatization, and even if the poorly performing CEOs were often removed, the balance of power inside the company is still very fragile. An important factor to be analyzed when looking at the corporate governance in CEE is the increasing ownership concentration. An empirical study on ownership structure in the CEE countries reveals a strong ownership concentration (Pajuste,2002). The median voting power for CEE countries (using the available data for the power held by the largest block in listed companies) is of 44% which is close to the one in Western Europe (55.9% in Belgium or 54.1% in Austria). This proves that the only ones that are going to have an influence over the managers and company policy are the controlling owners, leaving almost no power to the minority shareholders that are usually going to end up selling their shares ( at a deflated price) to the controlling group. This generates certain reactions of the controlling owners: as it becomes harder to obtain capital from minority owners, they have to provide most if not all the capital, and therefore prefer to have a saying in the decisions of the company. In order to do so, they try to have more than 50% of the total shares, so that they decide on all matters. The most transparent country that offers the most information regarding the listed companies is the Czech Republic. There is a tight connection between the enforcement of rules and the degree of development. The level of minority shareholder protection also has a strong positive relation with the stock market activity.
In Romania, corporate governance is quite new. The first code was adopted in 2001, being replaced in 2008 by a new code that was based on the OECD principles. This code is applied on a voluntary basis by the companies traded on the Bucharest stock-exchange, and according to Feleaga et al (2011), in most cases the degree of transparency is lower than in other European countries and the independence of the directors and audit committee members does not meet the standards.

229
5. CONCLUSIONS Even though corporate governance systems have developed a lot in the world,
and the CEE corporate governance systems make no exception, there is still a very long way to go until the system is going to be efficient.
No matter the form or model of corporate governance adopted by each country (usually these models are not pure ones but mixtures), a few measures should be taken, such as: stronger rules for the protection of the minority investors while retaining the incentives to hold controlling blocks, removing some managerial defense and disclosing the ownership and control, disclosure of ownership and control, introducing elements of independence of directors, disclosing the compensation schemes and the conflict of interests rules, facilitating the communication between stakeholders and the level of transparency towards them, etc.
It is also important that the globalization is taken into account and that the rules establish for each of the countries do not contradict the rules of countries they have connections with through the capital markets in particular.
Acknowledgments This work was supported from the European Social Fund through Sectorial Operational
Programme Human Resources Development 2007 – 2013, project number POSDRU/159/1.5/S/142115 , project title “Performance and Excellence in Postdoctoral Research in Romanian Economics Science Domain”
REFERENCES
Aguilera, R., Cuervo-CКzurrК,ă A.,ă „CoНes of good governance world-wide: what is the trТgger?”,Organization Studies, 25 (3), 2004, pp. 415-443
Allen,ă F.,ă „CorporКteă GovernКnМeă Тnă EmergТngă EМonomТes”,ă Conference on Corporate Governance at the Said Business School, Oxford University, January 2005
Berle, A., Means G., The Modern Corporation and Private Property, New York: Macmillan, 1932
Blair, M., M., Ownership and Control, Washington: The Brookings Institution, 1995 BlКМk,ă B.,ă „TСeă CorporКteă GovernКnМeă BeСКvТoră КnНă MКrketă ↑Кlueă ofă RussТКnă FТrms”,
Emerging Markets Review, 2, 2001, pp. 89-108 Bruce, A., Buck, T., Executive Pay and UK Corporation Governance, In Keasey, K.,
Thompson, S. and Wright, M. (ed) Corporate Governance: Accountability, Enterprise and International Comparisons (p. 117-135), John Wiley & Sons, Ltd., 2005
Deakin, S., Konzelmann, S., Hobbs, R., Wilkinson, F., ESRC Centre for Business Research, University of Cambridge, Working Paper, Nr. 308, 2005
Dobák, Miklós; Steger, Thomas (2003) : Corporate governance in Central and Eastern Europe: An introductory review, Journal for East European Management Studies, ISSN 0949-6181, Hampp, Mering, Vol. 8, Iss. 3, pp. 223-235
Donaldson, L.; Davis, J.,H., Boards and Company Performance - Research challenges the Conventional Wisdom, Corporate Governance: An International Review, Vol. 2, Nr. 3, 1994
Enriques, L., Volpin, P. (2007) Corporate governance reforms in continental Europe, Journal of Economic Perspectives, Vol. 21, Nr. 1, p.117-140
Feleaga, N, Feleaga, L, Dragomir, V, Bigioi, A, Corporate Governance in Emerging Economies: The case of Romania, Theoretical and Applied Economics, Volume XVIII (2011), no. 9(562), p.5-16

230
Fox, M.B., Heller, M.A. (2000): Corporate governance lessons from Russian enterprise fiascoes, in: New York University Law Review, Vol. 75, pp. _720-_780.
Gros, D., Suhrcke, M. (2000): Ten years after: What is special about transition countries?, Working paper No. 56, London, EBRD
Gugler, K., Mueller, D., C., Yurtoglu, B., (2008) Insider ownership, ownership concentration and investment performance: An international comparison, Journal of Corporate Finance 14, p. 688-705
Hawley, J.; Williams, A., Corporate governance in the United States: the rise of fiduciary capitalism - a review of the literature, Organization for Economic Cooperation and Development, Paris, 1996
Huse, M., Boards, governance and value creation, Cambridge University Press, New York, 2007
JКnНТk,ăT.,ăRennТe,ăC.G.,ă „TСeăEvolutТonă ofăCorporКteăGovernКnМeă КnНăFТrmăPerformКnМeă ТnăEmerging Markets: The Case of Sellieră КnНă Bellot”,ă Finance Working Paper, 2005, http://ssrn.com/abstract=625902
Jensen,ăM.C.,ă„AgenМвăCostsăofăFreeăCКsСăFloа,ăCorporКteăFТnКnМe,ăКnНăTКkeovers”,ăAmerican Economic Review, 76(2), 1986, pp. 323-329
Jensen, M., C., Meckling, W., H. (1976) Theory of the Firm: Managerial Behavior, Agency Costs and Ownership Structure, Journal of Financial Economics, V. 3, 4, p. 305-360
Jesover, F. (200_): Corporate governance in the Russian Federation: The relevance of the OECD principles on shareholder rights and equitable treatment, In: Corporate Governance – An international review, Vol. 9, pp. 79-88.
Keasey, K., Thompson, S., Wright, M., Corporate governance. Accountability, Enterprise and International Comparisons, John Wiley and Sons, Southern Gate, Chichester, 2005
KlКpper,ă L.F.,ă Love,ă I.,ă „CorporКteă GovernКnМe,ă Investoră ProteМtТon,ă КnНă PerformКnМeă ТnăEmergТngăMКrkets”,ăJournal of Corporate Finance. 10, 2004, pp. 287-322
Lefort,ăF.,ă→Кlker,ăE.,ă„CorporКteăgovernКnce mechanisms: a study of their effects on investor proteМtТonă КnНă МorporКteă performКnМeă Тnă CСТleă (КnНă BrКzТl)”,ă 2003,ăhttp://www.iadb.org/res/laresnetwork/files/pr221proposal.pdf
Love, I., Rachinsky, A., "Corporate Governance, Ownership and Bank Performance in EmergТngă MКrkets:ă EvТНenМeă fromă RussТКă КnНă UkrКТne”,ă Working Paper 2007, http://siteresources.worldbank.org/DEC/Resources/Corporate_Governnace_Ownership_and_Bank_Performance.pdf
Mallin, C., Jelic, R. (2000): Developments in corporate governance in Central and Eastern Europe, in: Corporate Governance – An international review, Vol. 8, pp. 43-5
Martin, R. (2002): Politicized managerial capitalism: Enterprise structures in post-socialist Central and Eastern Europe, In: Journal of Management Studies, Vol. 39, No. 6, pp. 823-839.
McCarthy, D., Puffer, S. (2002): Corporate Governance in Russia: Toward a European, US, or Russian model?, In: European Management Journal, Vol. 20, No. 6, pp. 630-640.
Mulili, B., M., Wong, P. (2011) Corporate governance practices in developing countries: The case for Kenya, International Journal of Business Administration, Vol. 2, Nr. 1
Peev, E. (2002): Transition policy an corporate governance design in the _990: The case of BulgКrТК,ăPКperăpresenteНăКtătСeă3rНăConferenМeă“TrКnsТtТonăКnНăEnterprТseăRestruМturТng in Eastern Europe, Copenhagen, _5-_8 August
Sheikh, S., Rees, W, Corporate governance & corporate control, Cavendish Publishing Limited, Londra, 1995
Shleifer A., Vishny, R., (1997) A survey of corporate governance, Journal of finance, 52, p. 737-783
Solomon, J., Corporate Governance and Accountability, John Wiley & Sons Ltd, 2007 Tricker, B., Corporate governance. Principles, Policies, and Practices, Second Edition, Oxford
University Press, Oxford, 2012

231
Turnbull, S., Corporate Governance: Its Scope, Concerns & Theories; Corporate Governance: AnăInternКtТonКlăRevТeа,ă↑olumulă5,ăNum rulă4,ă1997,ăp.ă180-205
↑ТtezТć,ă N.,ă „CorporКteă governКnМeă Тnă emergТngă eМonomвă КnНă tСeТră ТmpКМtă onă enterprТseăperformКnМe:ă Aă CКseă ofă CroКtТК”,ă The 4th International Conference on Accounting and Finance in Transition (ICAFT 2006) - Adelaide, UniSA, April 2006
O.E.C.D., Principles of Corporate Governance, OECD Publications Service, Paris, 2004

232
THE IMPORTANCE OF FINANCIAL PLANNING OF ROMANIAN SME’SăINăTHEăXXIăCENTURY
Csaba NAGY1
ABSTRACT In Romania more than 99% of all enterprises are micro, small and medium-sized
enterprises. Since 2008 the SMEs in Romania have been confronted with difficulties. The world crisis began to show its effects in Romania in October 2008. These effects became perceptible first to the companies. The crisis forced every trader to take fast, real action to solve the problem. According to INS data, in the new year about 10% of companies founded went bankrupt, and about 38-40% of them were not worth keeping in the sixth year. Widespread opinion is that the domestic SME sector lacks emphasis on the financial planning. A small investment of time and capital will bring benefits many times over, and so if the financial processes are managed properly, good results will not be slow to appear. Financial planning formulates ways and methods by which the company's financial goals can be achieved.
KEY WORDS: SMEs, financial planning, budget, financial decisions JEL: L25, G17 1. INTRODUCTION
Small and medium-sized enterprises (hereinafter referred to as SME) represent a significant economic force in the Romanian economy, and it is important to be aware of the sector's situation and level of development, strengths and weaknesses as well. The SME classification has changed a lot recently (annual net income, total assets), so many companies are lost, the former medium businesses have been reduced to small business. "SME" stands for small and medium-sized enterprises – as defined in EU law: EU recommendation 2003/361. The main factors determining whether a company is an SME are: number of employees turnover balance sheet total.
Table 1. The main factors determining whether a company is an SME
Company category Employees Turnover or Balance sheet
Medium-sized < 250 ≤ă€ă50ăm ≤ă€ă43ăm Small < 50 ≤ă€ă10ăm ≤ă€ă10ăm
Source: http://ec.europa.eu/enterprise/policies/sme/
1 PСD,ăAssoМТКteăLeМturerUnТversТtвăofăReșТțК,ă„EftТmТeăMurgu”EМonomТМsăFКМultв ROMANIA

233
These ceilings apply to the figures for individual firms only. A firm which is part of larger grouping may need to include employee/turnover/balance sheet data from that grouping too. Thus, in the formulation to be presented in this study which offers financial planning methods, the SME-s range cannot be determined as easily as to become sufficiently heterogeneous. It is not determining the size of the test business, but to having such a negative mindset to also consider their activities and begin to apply financial planning tools. 2. THE SME SECTOR IN ROMANIA The notion of small and medium-sized enterprises, which in reality is presented as a multiform phenomenon in an environment that is still economically, socially and politically unequal, was defined for the first time in the European legislation in Recommendation 96/280/EC.
Source: ec.europa.eu
The current definition of micro, small and medium-sized enterprises – SMEs – is to be found in the recommendation of the European Commission 2003/361/EC, regarding the definition of the micro enterprises and small and medium-sized enterprises, which makes a clearer distinction between companies. The definition was also taken on in the Romanian legislation through Law no. 364 on 14th July 2004. Stimulation, set up and development of small and medium-sized companies was changed through Law 175/2006. (Chiriac, 2009) In Romania more than 99% of all enterprises are micro, small and medium-sized enterprises. The structure of active enterprises in 2008 based on official data from Romanian Statistical Yearbook-Enterprise Activity 15, NIS 2010 and CNIPMMR, 2010 was the following: 90.7% micro, 7.4% small, 1.6% medium and only 0.3% large.

234
Table 2. Structure of firms in Romania and in EU27
Source: ec.europa.eu The structure of active enterprises in 2008 in trade and other services is: 92.3 % micro, 6.6% small 1% medium and 0.1% large. The structure of active enterprises in 2008 in industry and construction sectors in 2008 is 78.6% micro, 15.7% small, 4.7% medium and 1% is large. The percentage shows the same figures as in USA, Japan, and Western Europe but big differences can be noted deriving from the fact that in advanced economies SMEs have existed for many years but in countries in transition they are newcomers, embryos of a new economic order of the market economy. The role of SMEs in the national economy is significant, the weight of the turnover achieved by active SMEs showed an increasing tendency. 3. FINANCIAL PLANNING OF SME-S Financial planning establishes guidelines regarding the changes that will take place in the company. It should include:
1. critical analysis of internal and external environment in which the company operates;
2. identifying and establishing business objectives; 3. analyzing the differences between these goals and the current financial situation
of the company; 4. the development of documents that synthesize the necessary actions to be taken
for the company to achieve the financial targets proposed through financial planning.
Financial planning formulates ways and methods by which the company's financial goals will be achieved. It focuses on identifying investment opportunities with positive net worth and financing strategies that create value for the firm.

235
Figure 2. Financial Planning
Source: restadfinancialplanning.com Financial planning has two dimensions: a temporal diagram, showing the process of planning and time horizon for the plan, and the level of aggregation, which implies that some plans are based on aggregating others from lower hierarchical levels or the same hierarchical level.
Figure 3. Types of Financial Plans
Source: gulfamabbasi2012.blogspot.com Financial planning, depending on the time horizon, has two components:
1. the medium and long term planning and 2. short term planning.
The planning process results in the company's financial plan, which includes both financial and strategic considerations. The financial plan is a document that shows what will happen within certain time objectives. It performs an analysis of capital allocation per project of the company. Smaller investment proposals of each operational

236
unit within the company are gathered (the aggregation) and treated as an integral part of the financial plan of the company. In order to be prepared, financial plans need multiple alternatives and assumptions or scenarios. For example, the company can prepare three sets of alternatives: the pessimistic situation, one normal and one optimistic forecast regarding future events. As a fund company will spend time preparing proposals for different scenarios that will underpin the company's financial plan, it is useful to know the planning process to be followed. Items to be considered are: Interactions. The financial plan should exploit the links between investment
proposals for various operational activities of the company and the choice of financing available to the firm. Options. The financial plan is based on the opportunities the company has in its work, offering choices from several options for investment and financing. Feasibility. Different variants of plans developed in the company articulating the general objective of maximizing the wealth of the company's shareholders. Avoiding surprises. Financial planning should identify what might happen in the future with the company, certain events that might occur. Thus, one purpose of financial planning is to avoid surprises. Economic assumptions. The plan should clarify the status of the economic environment in which the company hopes to activate the plan. These assumptions include interest rate and inflation rate. Some variables introduced by the scheduler to ease the planning process (reconciliation of planning documents).
The financial plan must include the following elements:
◦ Forecasting sales (budget preparation);
◦ Documents pro-forma (profit and loss, balance sheet and has to document the flow of funds);
◦ Active needs; the plan will describe the capital expenditures (investment) designed and planned and present uses that are proposed for net working capital;
◦ Required funds; the plan will include a section of the arrangements (agreements, contracts) on financing. This part of the plan should discuss dividend policy and the related debts. If required one could increase equity by selling new shares, the plan must consider what kinds of actions should be sold and what methods are most appropriate.
The financial plan is a complex document consisting of several plans and budgets and situations and documents describing the items shown above. Financial planning encompasses projections regarding sales (turnover), assets and profit based alternative production and marketing strategies and finally making the decision about covering the required capital funding from sources that are amenable. Financial planning is accompanied by financial controlling the supply of data to: ensure management plans are followed and / or modify existing plans in response to changes in the surrounding reality versus
assumptions considered when planning. A financial planning firm allocates resources to achieve its investment objectives. It is important for several reasons:

237
◦ Help managers evaluate the impact of specific strategies on their company's financial position, cash flows, reported profits and external financing needs;
◦ The head of the company is in a better position to react to any changes in the market conditions (lower sales or other unexpected problems);
◦ Managers understand the changes inherent in their investment plans and funding.
Financial planning consists of developing plans for investment and financing a company. Once known, the investment plan of the company is required to determine when and where the necessary funds will come. For this it is necessary to draw up a budget. 4. BUDGETS - BASIC PLANNING TOOLS FOR SME-S Budgets are pro-forma financial documents detailing financial plans of firms. They show how the funds will be used for operating activities, the investment and the financing (how it will be spent on salaries, materials, work performed by third parties, purchase of fixed assets) and indicate how funds will be obtained. Budgets are used for planning, coordination and control of business operations. Their role is essential in planning, as they are the company's objectives in terms of value or quantity. Budgets prepared by other departments of the company (production, sales, purchasing, payroll, etc.) are finally coordinated by the financial department which is able to better deal with the procurement requests for the necessary funds. Company budgets are based on assumptions of certain levels of future production and sales volumes. As pro-forma financial documents, budgets predict how the financial documents of the company will probably look if the planned provisions have been made. As a general rule, companies prepare and use three basic types of budgets: budgets operation (manufacture or activity based) cash budgets and capital budgets. Budget exploitation or the exploitation plan is a sum of individual budgets combined to form a part of the company's business plan. The first step in developing a budget exploitation is the sales budget preparation. This is an important and difficult part of the planning because it requires consideration of a large number of factors, including all the conditions of the economy, the industry in which the company functions, its production capacity, prices and their fluctuations, following the competition, advertising expenses made by the company etc. Since the company has prepared and approved sales budget, it can then prepare the manufacturing budget for its products. Normally, the company has two objectives related to production planning:
1. to achieve expected sales for the period that prepares the budget and 2. to achieve a desired level of stocks at the end of planning. In addition,
production budget shows future production costs expected to be incurred to achieve sales volume and closing stocks.
The final step in developing an exploitation budget includes combining the sale of production to calculate the gross profit level expected. An example of the operation budget is presented in the table below.

238
Table 3. Example of the operation budget
1. Sales in 1500 2. Operating expenses in the 1150 2.1 The cost of goods (excluding depreciation) 780 2.2 Depreciation 90 2.3 Sales and administrative expenses 280 3. Financial expenses (interest) 20 4. Profit before tax 330 5. Income tax (16%) 52.8 6. Net income 277.2
Long-term budgets are used for general planning purposes, while the short-term cash budget is used for current control. The cash budget can be prepared for periods of less than one year (monthly, weekly or daily). In general, firms prepare cash budgets for one year or a six months period with a monthly breakdown. In one month daily budgets of cash can be developed, depending on the characteristics of the cash inflows and outflows of the company. When deciding about the duration for which the cash plan is created, one must consider some factors such as: Inflation and opportunity costs. When inflation rates are high, the firm should
minimize the amount of unused cash at its disposal and also to minimize the size of short-term financing. Therefore, in such periods the cash budget must be planned for shorter intervals of time. Size cash flows. Firms usually have substantial cash flows, prepare the daily cash budgets. Actual time available for planning and managing cash flow. The actual time for such planning is a scarce resource for many companies. In these conditions, the added revenue resulting from the daily management of cash may not justify the time spent on it. Because of this, it requires planning for a longer interval of time. Predictability in time and size of cash flow can have a large impact on the appropriate range planning. Recognizing predictive patterns is an achievement that can shorten planning. Size levels for balancing cash. To avoid insolvency one must procure a level of cash to be secured permanently in order to achieve balance between receipts and payments, which influences the level of cash planning period. If this level is high, long-term planning firm provides temporary cash against variations. Conversely, short-term planning goals are necessary if a low-level equilibrium is to be avoided, even if such a plan would be economically unjustified.
Romanian companies are required by law to prepare an annual budget of income and expenses broken down by quarters, consisting of the following forms: 01 - General activity budget; 02 - Treasury budget activity or determining cash flow; 03 - Loans guaranteed by the state; 04 - Financial key indicators.

239
A general activity budget contains data on revenues, costs and expected results to be achieved in the current year for which the budget is drawn up, compared with those made / accrued in the previous year, as well as other data on distributed profits, sources of investment financing, investment expenses and substantiation data. Treasury budget activity represents a synthesis of their own resources, grouped by origin. Since the 1960s, many companies in highly developed countries (USA, UK, etc.) have spent considerable amounts of time and money to develop models to represent various aspects of the financial planning process in a company. Today, they are usually computerized and have the general name of financial planning models. Financial planning models are not only used to improve forecasting tools, but to be a support for management useful for a better understanding of the interactions and decisions on investment, financing and dividends. There are three alternative models at hand used for planning, financial analysis and forecasting: simultaneous algebraic equations model, linear programming model, and the econometric model. With these models pro-forma financial documents (balance sheet, profit and loss, etc.) are obtained, forecasting earnings per share, price per share, dividend per share, shares and newly issued bonds. The financial planning model is based on using optimization techniques using linear programming. Using linear programming for financial planning, the decision-maker establishes an objective function such as maximizing the firm's value, based on a certain financial theory. Therefore, the model optimizes the objective function in terms of restrictions such as the maximum allowed for clues "debt / equity" and "dividend / net profit". When using the linear programming model for financial decisions, the problem must be formulated using the following three steps: Identify the main variables associated with the problem to be solved. Define the objective to be maximized or minimized and define this functions on
the main variables controllable. Defining restrictions either linear equations or inequalities of the main variables. Linear programming is used mainly to maximize profits, capital rationing and planning and financial forecasting. Essentially, the advantage is to increase the most effective model to analyze the information and their interaction with the prediction of future consequences in the planning process. Therefore, the financial planning model improves the depth and extent of the financial information used by management in the decision making process. A key point in assessing any planning model is the way it is formulated and manufactured. This means that the output of the model's credibility depends on the fundamental financial theory which specifies that the model is based on assumptions, an important factor being its ease of use for the financial planner. Because of the large potential impact on the financial planning process and, consequently, the future business model planning assumed is to be chosen with care. Thus, a useful model financial planning should have the following characteristics:
1. Assumptions and model results must be credible. 2. The model should be flexible so that it can be adapted and expanded to meet a
variety of circumstances.

240
3. The model should be improved based on current practice and performance in the technical sense.
4. The input and output of the model must be understandable to the user without more extensive knowledge (information).
5. The model must take into account the communication (interaction) between decisions concerning investment, financing, dividend and production, and their effect on the market value of the firm.
6. The model should be as easy for the user to operate without excessive intervention of non-financial personnel without cumbersome data entry forms.
5. CONCLUSIONS The crisis forced every company to take fast, real action to solve the problem. According to INS data, in the new year about 10% of companies founded went bankrupt, and about 38-40% of them were not worth keeping in the sixth year. The plan shall define and organize tasks, coordinate the activities section and optimize the use of resources, thus helping to respond to the changes in the environment, grounding conscious organization management by providing specific requirements to the effective ways of management. The widespread opinion is that the domestic sector SME lacks emphasis on the financial planning. But the times we live in no longer allow a contractor to manage his business from his pocket, or from his head, they need financially established methods to demonstrate their operations. Domestic companies typically struggle with liquidity problems, the daily tasks, taxation issues. They often do not even know that the directed operation has to have a financial plan prepared. However, with the use of financial planning even competitive advantage can be developed in addition to other advantages, thus it being highly recommended for these systems. A small investment of time and capital will benefit them many times over, and so if financial processes are managed properly, good results will not be slow to appear. REFERENCES Aidis, R., & Sauka, A. (2005). “EntrepreneursСТpă Тnă КăCСКngТngăEnvТronment.ăAnКlвzТngă tСeă
Impact of Transition Stages on SME Development. RENTă 2005”. Welter edition, online publication, www.ecsb.org.
Ayyagari, M.; Beck, T.; Demirguc-Kunt, A., (2007), “Small and Medium Enterprises Across the Globe”, Small Business Economics
BТşКăC.ă(МoorН),ă“ElКborКreКăstuНТТlorăНeăfezКbТlТtКteăşТăКăplКnurТlorăНeăКfКМerТ”, Editura BMT, BuМureştТ,ă2005
CСТrТКМ,ăL.ă(2009).ă“LegКlăКspeМtsăofăentrepreneursСТp”.ăInăМ.ă↑ТnМentăSoltes,ăBusiness Planning (pp. 11-48). Dortmund: BWV Dortmund Publishing House.
DumТtru,ă I.ă (mКrtТe,ă 2011).ă “Evolu ТТă şТă perspeМtТveă mКМroeМonomТМeă şТă fТsМКlă bugetКre”. http://consiliulfiscal.ro.
GКvrТl ,ă I.;ă GКvrТl ,ă T.,ă (2007),ă “RК ТonКlТtКteКă eМonomТМ ă şТă soМТКl-umКn ă Кă IMM-urilor”,ăTribuna economică, Nr. 38, september
GrТgore,ăA.ăM.,ă (2006),ă “LoМulă IMM-urТloră înăeМonomТКăНeă КzТ”,ăTribuna economică, Nr. 13, march
HoНorogel,ă R.ă G.ă (2011).ă “TСeă GlobКlă EМonomТМă CrТsТsă CСКllКngesă foră SMEsă ТnăRomКnТК”.Theoretical and Applied Economics , 129-140.

241
Kerzner H., “Project management, A system approach to planning, scheduling and controlling”, John Wiley&Sons, 1998
Le Dantec T., “Managementul proiectelor prin exemple”,ăEНТturКăCHăBeМk,ăBuМureştТ,ă2009 Marin, D., (2002), “Economia României: întreprТnНerТleămТМТăşТămТjloМТТă- МuăМeăneăТntegr m? ”,
EНТturКăEМonomТМ McCollum J.K., “Management de proiect - oă КborНКreă prКМtТМ ”, Editura Universitara,
BuМureştТ,ă2005 Mocanu M., Schuster C., “MКnКgementulăproТeМtelor,ăEНТturКăAllăBeМk,ăBuМureştТ,ă2004 Nicolescu, O.; Nicolescu, C., (2008), “ IntreprenorТКtulăşТăMКnКgementulăÎntreprТnНerТlorăMТМТă
şТăMТjloМТТ”,ăEНТturКăEМonomТМ NТМolesМu,ăO.,ă&ăNТМolesМu,ăC.ă(2010).ă“CoorНТnКtesăofăpolТМвăМonМernТngăSMEsăНevelopmentă
ТnăRomКnТК”.ăReview of International Comparative Management, 5-20. NТМolesМu,ăO.,ăHКТНuМ,ăI.ăC.,ă&ăNКnМu,ăD.ă(2006,ă2007,ă2008,ă2009,ă2010).ă“CКrtКăAlb ăКăIMM-
lorăНТnăRomсnТК”.ăCNIPMMR,ăBuМureştТ. Onofrei M., “Management financiar”,ăEНТturКăCHăBeМk,ăBuМureştТ,ă2006 Onofrei M., “FТnКn eleăîntreprinderii”,ăEНТturКăEМonomТМ ,ăBuМureştТ,ă2004 “Raportul anual privind sectorul IMM din Romania, 2010”. FunНК ТКăPost-privatizare. Schmiemann, M., (2009), “SMEs were the main drivers of economic growth between 2004 and
2006, Statistics in focus – Industry, trade and services”, Eurostat, 71 SМСаКb,ăK.ă(2011).ă“The Global Competitiveness Report 2010-2011”, World Economic Forum.
Geneva: SRO-Kunding. Stancu Ion, “FТnКn e.ăTeorТКăpТe elorăfТnКnМТКre.ăFТnКn eleăîntreprТnНerТlor.ăAnКlТzКăşТăgestТuneКă
fТnКnМТКr ”, EНТturК.ăEМonomТМ ,ăBuМureştТ,ă1996 ↑КsТle,ă ↑.ă (2002).ă “Demographic Transition and Economic Transition. Interlinking and
pКrКllelТsm.ă TСeă МКseă ofă RomКnТК”. Hitotsubashi University, Japan: Center for Intergenerational Studies, Institute of Economic Research.
↑ТsТnesМu,ă S.,ă &ă MТМuНК,ă D.ă (MКв,ă 2011).ă “RomКnТКnă SME'să seМtoră trougСă МrТsТs:ă TСeăeffectiveness of government policies and the present situation”. Munich Personal Repec Archive, http://mpra.ub.uni_muenchen.de/30618/.

242
THE BEHAVIORAL MODEL OF A LEADER
Angela - Olimpia LOBONEA (OLTEAN) 1
ABSTRACT
The science of leadership must go out to meet the needs of the present. Last century was the century of organizational management development, the early years from now are those of leadership. The challenges facing leadership of twenty-first century require new qualities which are necessary to leaders. The changes shown in society, technology, markets, spheres of activity forces the organizations to develop new strategies and learn new ways of actions. This is the place in which the leadership occurs in the area of management. Therefore, it is necessary: the identification of leadership behavior model that ensures that efficiency in leadership when the behaviour can be learned, and if it requires innate qualities, the selection of those which leader possesses them. The research which makes the objective of this article aimed the proposal and development of a behavioral model of leadership which makes distinguish between the organization's life cycle/ change degree of a market and the type of management / leadership.
KEY WORDS: Leader, manager, leadership, leadership behavior model, change, quality, defects.
JEL : M20; M21; M29.
1. INTRODUCTION
The research representing the subject of the present article aims to identify the behavioral model of leadership based on the life cycle of the organization (market change degree, market dynamics, etc.) and the type of management / leadership. A successful leader must set his priorities adequately, he must be proactive and able to create synergy by both understanding and also making others understand him. He must have authority through recognition, not by imposing himself, he must be popular, but not populist. Both the theory as well as the practice emphasize the leader-manager and management-leadership relationship. Regardless the approach, we believe that management applies mainly to objects, it creates the rules of stability, while leadership applies preponderantly to people, inspiring change.
2. MANAGEMENT VERSUS LEADERSHIP The complex issue of leadership has been a point of interest for decades. The termă“leКНer”ăаКsăuseНăforătСeăfТrstătТmeăТnătСeălКteăfourteentСăМenturв,ăКММorНТngătoăTСeăOбforНă EnglТsСă DТМtТonКrв,ă (1933).ă Bută tСeă termă “leКНersСТp”ă КppeКrsă muМСă lКter,ăaround 1700 (Stogdill, 1974)), together with several collateral meanings. This moment can be considered the beginning of the modern analysis regarding this phenomenon.
1 West University of Timisoara, Romania

243
According to Jim Collins, the last century represented the development of organizational management; the early years of the current one are those of leadership. The term leadership is widely used lately and when it comes to its definition and content, the views are very different ranging from contraposition to overlapping. "Leadership is the behavior of an individual when he leads activities towards a common goal" (Hemphill, JK, & Coons, AE (1957)). "Leadership is the art of influencing others to do maximum performance to accomplish any task, objective or project" (Cohen, W.A.(1990)). In general, the term leader designates the person witch manifests power or great influence within social groups of various sizes: societies, nations, communities, organizations etc.
It is considered that the difference between a manager and a leader refers to the fact that while one of them rules the context, the second one is subject to the context. The manager focuses on systems and structure, the leader on people, the manager administers, the leader innovates. We share these vieаs,ătКkТngăТntoăМonsТНerКtТonătСeăfКМtătСКtăТnătСeăevolutТonăofătoНКв’sădynamics, the role of piloting an activity in relation to its management has increased. The act of leading requires flexibility and vision, a bridge for creating the future, a new way of learning. In other words, management prepares and trains, the leader inspires and influences. While managers tend to control, being concerned about rules and regulations, leaders are simplifiers, they inspire being interested in change and vision. The relationship between leadership and management has created a considerable amount of interest in the literature about leading. Some make a clear distinction between the two concepts, some overlap them, while some opinions are grouped into considering leadership as part of the management. Basically there are the following approaches: Overlaying the two concepts. It is considered that an organization can be led
only through a hierarchy, a structure and rules, treating leadership as a kind of management or fashion and using randomly the two terms, one or another other, depending on the circumstances. Sometimes a term is used interchangeably or when speaking of one, the other is put between brackets. One explanation for this confusion is the fact that there are cultures in which the language does not contain terms to designate the two distinct concepts. When referring to the Romanian language both concepts were translated by the term leading. Partial similarities between the two concepts. Each of them has specific elements, which ensures their individuality, as well as a series of common elements that facilitates reciprocal potentiating. (Zlate, 2007)). That is because they fulfill the same function: foresight, organization, coordination, training and control. Is possible for leaders and managers to possess similar qualities and skills, but in different proportions. It is possible for leaders to have more human and conceptual skills and managers to have more technical skills. Applying these qualities, characteristics and skills of both categories is done differently according to the specific of the situations and circumstances; the mutual potentiating of the characteristics, the balance / imbalance, the behavior / conflict are possible only if a person possesses both the qualities of leadership as well as those of the manager. The leader has the tendency to achieve his goals- if tСТsăТsănotătempereНăbвătСeămКnКger’săКttrТbutes,ăМСКosăКppeКrs- or the manager

244
has the tendency to fulfill his need for safety safety - if this is not supplemented bвătСeăleКНer’săКttrТbutes,ăăbureКuМrКМвăКppeКrs. Opposition situates the two concepts in two different extremes. Here we refer to the theories of Bennis, Hersey, Kotter, Zaleznic which focus upon the idea that management administers and leadership motivates and inspires (Bailesteanu). We agree with these views partly identifying some delimitations (table no. 1):
Table no.1. Differences between a manager and a leader
THE MANAGER THE LEADER -has subordinates; -has followers - promotes stability; -enables change - is conservative; - is emphatic - focuses on tasks; -focuses on people - aims objectives - has vision - decides -encourages - is based on a contract - inspires trust - has formal authority; - has personal charisma; - tells the truth - seeks the truth; - complies with (regulations) - is his own master; - money for work; - excitement in exchange for work; -"mind" -"СeКrt” - asks how and when; - ask what and why; -expects results - expects achievements;
- reduced risk; - risk taking;
- goes on a "path”; - performance / innovation;
(Source: own conception) In our opinion, the opposition leader versus manager is no longer valid in reality.
We believe that the most important are the professional training and managerial qualities of the person who is in the top of the hierarchy, whether we call him leader, manager, chief or master. The differences between manager and leader must be replaced by a new paradigm, that of the leader-manager, so that the ruler is no longer just a resource administrator, but a leader of the group concerned with harmonizing the expectations of the group, with accomplishing the tasks, moving from the traditional management to performance leadership in which people are the most precious asset. The fourth approach regarding the leadership and management that establishes a
part to whole relationship between the two concepts. Some authors believe that leadership is a part of management, the essential, fundamental one. The origin of this viewpoint lies in the work of Fayol who considered leadership to be just one component of the general administration. His opinion is also shared by some Romanian authors who consider leadership a subset of the managerial behavior (Nicolescu, O., Verboncu, I). Management as part of the leadership. These authors consider that management
is an instrument through which leadership is achieved. Fillipp by Woot

245
(1992), believes that in the current turbulent world, leadership is more important than the management methods and techniques.
But none of the approaches found in the literature regarding the usage of leadership and management concepts should be interpreted absolutely. The data presented so far outlines the idea that leadership represents the process that transforms management in art. In other words, within an organization, the leader represents the art and the manager represents the science. In the turbulent and changing environments of organizations and at the same time of the markets which are constantly changing, it is not surprising that the meaning and parameters of management- leadership are also changing. Leadership is directly related to the ability of influencing people's behavior, therefore, in order to achieve maximum efficiency, the leader also fulfills the role of the manager or the manager also possesses the qualities of a leader.
In our opinion, the two concepts: management and leadership will eventually merge or metaphorically speaking, will fusion. We are conscious that nowadays management is important and necessary for organizations, but in the future we will witness radical conceptual changes. Management is excellent in a world and on some sufficiently stable markets. In the present society, globalization, decentralization and the intensive use of the IT are essential elements, thus this classical management model loses ground. Therefore, the management should change its priorities, it must have goals, targets, flexible rules, it must eliminate excessive rigidity, focus on networks, relationships, freedom, accompanied by responsibility, interaction, vision, intuition, inspiration, charisma. Thus the present and future organization, must have a leader who focuses mainly on people and vision, promotes the objectives that require a controlled behavior, a certain rigor and method, is organized and well trained. The managerial skills and qualities which were given importance so far are not sufficient to deal with current and future problems. This requires efforts of retracing the skills, qualities and behaviors that a leader must possess. It requires more attention, components of leadership related to understanding the environment and its impact, the change degree of a market and therefore identifying behavioral patterns of leadership, building new models and ways of working, developing a personal vision of change are necessary aspects. " Leadership is an exhausting, inexorable job, with enormous pressure and high responsibilities. It would be a profound disservice to suggest that these leaders are ordinary people who happened to be in the right place at the right time. Maybe the place matters, but it takes a special kind of person to master the challenges of opportunity "(Raul Malos, (2011)).
We share the idea of this author and we want to add that nowadays, performance leadership must achieve an optimization between relational orientation and task orientation (Figure no. 1):
Lower-level
First manager
Leader
leadership - orientation relational socio-emotional affective
management - orientation towards tasks purpose production administration

246
Figure no.1 Relationship between management - leadership.(Source: own
conception) The leader (top manager) is the person with new ideas adhering to ways of
solving problems, developing qualities which are specific both to leadership as well as to management.
The first manager is the person working directly with executants, he will develop during time technical skills, he oversees the work of operational staff. This approach ensures balance in organizations, respectively between the dynamic evolution which involves creativity, adaptability (characteristics that shape the portrait of an effective leader) and stability, the main attribute of a manager. The changes that have appeared in society, markets, spheres of activity, technology, are forcing organizations to develop new strategies and learn new ways of acting. Most often, the most difficult task of a manager when facing changes refers to mobilizing the people from an organization to adapt to new work conditions. This is where leadership intervenes in the area of management, which means that the manager will play the role of a leader and will apply the leading function specific to organizational management. In our opinion, the effectiveness of a manager is determined by achieving effectiveness in the role of a leader.
3. THE BEHAVIORAL MODEL OF A LEADER Assuming that you can not be a leader if you do not know the art of management, the leader must embrace certain behavior principles, which help him to be not better than others, but better than himself. Thus, leaders should seek to obtain better economic results, without letting themselves guided exclusively by the economic performance. Each leader has a distinct personality, which defines him through his behavior, the leader being a model for others. Besides professional skills, a leader requires a certain degree of acceptance, he needs to be open minded when it comes to new things, he must possess imagination an intellectual curiosity. Alongside the approach based on characteristics and the situational approach, the behavioral approach focuses on the fact that a performance leader, through the behavioral style adopted, inspires, incites and mobilizes people to achieve the pursued objectives obtaining a better productivity and employee satisfaction. The behavioral approach is centered on the work of the leader and on how it affects the efficiency of management. The passive, aggressive and positive behaviors are the main types of behavior in which a person relates with the environment. The main features of each type of behavior are shown in Table no. 2.

247
Table no. 2. Characteristics of the main types of behavior
(Source: own conception)
Naturally, performing leaders are part of the positive behavior sphere. Given the failure to address the phenomenon of leadership in terms of model characteristics, and taking into consideration that there are no styles suitable for all leading situations, a point of interest in our research was an attempt to see what behavior do affective leaders adopt? How do they motivate the others? how do they deal with the dynamic conditions of competition and market changes? Also, we consider that the socio-economic environment is a determinant of leader behavior: in a turbulent environment increases the powers of decision of the leader. and when the environment is relatively stable, concerns leader heads to engagement life organization. →eăbelТeveătСКtătСeăleКНer’săbeСКvТorămustăКНКptătoătСeăМonfТgurКtТonăofătСeăneаăorganization, although it will be smaller (it is estimated that in the future more than 60% of an organization's work will be done outside) and new freelancers will appear, while the current subordinates will become shareholders, partners and even leaders due to the professionalization of the work. Thus, attributes such as: assuming the objectives, the responsibility for achieving these objectives, the right to use all the methods in order to achieve the objectives (motivation, punishment), plus rhythm optimization will become essential for the leader. Leaving aside personal characteristic features (innate) and focusing on the observable behavior we have suggested a behavioral model of leadership that takes into account two defining factors: the life cycle of the organization / the (dynamic) change degree of the market and management / leadership model Fig no..2
PASSIVE BEHAVIOR AGGRESSIVE BEHAVIOR POSITIVE BEHAVIOR - furious -they feel powerful - optimists - frustrated -they feel rightful - calm - unsure - critical - enthusiastic - anxious - lonely - proud - defeated - they feel threatened - confident - lack of enthusiasm - they like to control people - in control of the situation - ”IăНoănotămКtter” - ”IămКtter” - respected -exaggerated politeness -intolerant - full of energy

248
Figure no. 2. Behavior model centered on the life cycle of the organization / (dynamic) change degree of the market and the type of management / leadership. (Source: own conception) In our opinion when the organization is at the start or profound change phase, the leader must focus on the people, on finding adherents to change or development. The leader will invest his energy in motivating the teams, in situations that require major changes, in crisis situations, in innovations. This phase requires a visionary leader who emphasizes creativity, who inspires and impresses with the intensity of his vision and with his example of implementing his vision upon the change. It is a leadership relation that involves a socio-affective behavior capable to maintain positive interpersonal relationships between the leader and members of the organization, mutual trust, honesty, availability and within normal limits, also friendship. If the organization has gone past the transformation / change period, being in a phase of development and maturation, the focus must be on the tasks in order to increase the relative advantages.
In this phase it is very important to strengthen the organization for a sustainable development. You need a leader who is more a manager, a person to lead a group with a high degree of maturity, with abilities, with mood or motivation. In this situation professional skills come first, so an organizing leader that reinforces what has been achieved, ensures relative stability and prepares a new change is necessary. Thus, the market position is exploited at its maximum position.
The life cycle of the organization
Task leadership Relational leadership
Organizing leader
Visionary leader
I
IVI
III
IIManager Leader
Market dynamics

249
4. CONCLUSIONS
Depending on the different phases of the life cycle of the organization, the qualities required for a leader are not always the same. Socio-eМonomТМăenvТronmentăТnfluenМesăКăleКНer’săbeСКvТor:ăТnăКăturbulentăenvТronmentăthe decision capacities of a leader increase, and in a relatively stable environment the major concerns of the leader head towards the participation of the group in the life of the organization. The leader behavior focused on the life cycle of the organization / change degree of the market and type of management / leadership combines the personal quКlТtТesăаТtСătСeăleКНer’săbeСКvТorăКnНăsТtuКtТonКlăfКМtors.
Acknowledgement: This work was supported from the European Social Fund through Sectorial Operational Programme Human Resources Development 2007 – 2013, project number POSDRU/159/1.5/S/142115 , project title “Performance and Excellence in Postdoctoral Research in Romanian Economics Science Domain” REFERENCES B ТlesteКnuă GСeorgСe&ă Burz,ă R.D.ă (2008)ă "TСeă LeКНer",ă MТrtonă Press,ă TТmТşoКrК.ă Collins, J., (2007) "Business excellence", Ed. Curtea Veche, Bucharest, page 36. Cohen, W.A. (1990), "The art of the leader", Englewood Cliffs, New Jersey: Jossey-Bass. De Woot Phillipp, (1992) "Towards a european management modell", EFMD FORUM, no. 3. Hemphill, J. K., & Coons, A. E. (1957). "Development of the leader behavior description
questionnaire". In RM Stodgill and AE Coons (Eds.), "Leader behavior: Its description and measurement". Columbus, Ohio: Bureau of Business Research, Ohio State University, page 6-38.
Lobonea Oltean, A.O, (2014) Progress Report I," Models of leadership", FEAA Timisoara. Malos, R., (2011), "Trait Theories Leadeship's", Annals of "Eftimie Murgu" Resita. Beam II Economic Studies, p.220.
Nicolescu, O., Verboncu, I., (2006) "Fundamentals of Corporate Management", Economic Tribune Publishing House, Bucharest.
Nicolescu O., Verboncu I., (1999), "Management, Economic Publishing House", Bucharest, p. 506.
Stogdill, R. M. (1974). "Handbook of leadership: A survey of the literature". New York: Free Press. Zlate M., (2004), "Leadership and Management", Polirom, Iasi, p. 173-180.
Tripon, C.& Dodu, M., " Human resources management"- course support for academic year 2010-2011. Available o: (http://www.apubb.ro/wp-content/uploads/2011/02/Chapter-Leadership.pdf) date of the search: August 3th, 2014.

250
ROMANIAN AND EUROPEAN EDUCATION: IMPORTANCE AND SATISFACTION
Irina ORIOL 1
ABSTRACT
Career development is an important factor for all participants on the labour market. The correlation between demands and offer of labour force is a yesterday unsolved equation that cannot be solved today. The European Research Centre Tredence doesn’t offer only solutions, but the results of the studies realized bring new information regarding the training of specialists, regarding what young people desire for their professional lives, regarding study conditions and the relation with employers. In the same manner, the universities that participate in this type of studies obtain extra information regarding the quality of educational services offered, the young satisfaction and dissatisfaction. The information can be used in the establishment of new study programs and of institutional development. The education system from every country has its own particularities, determined by economic, social and political conditions, by the culture and civilisation degrees of the society by the specific traditions of a nation and by the pedagogic conceptions that it promotes. Thus, after making a comparison between the Romanian educational system and the education system of other countries of the European Union, the existence of resemblances and differences is observed.
KEY WORDS: university, student, employer, survey, licence cycle, Masters Cycle, professional experiences, performance indicators.
JEL: A200 1. INTRODUCTION Trendence is a European Research Centre and a leader with remarkable success
ТnătСeăemploвer’săbrКnНТng,ămКrketing and personnel recruitment. Every year, a remarkable number of high school pupils, students and young
professionals from the entire world, but especially Western Europe (England, France, Germany, Austria, Belgium, Greece, Hungary, Ireland, Sweden, Switzerland etc.), and Eastern Europe, participate in complex studies regarding their career ambitions, the emploвer’să МСoТМeă аСenă Тtă Мomesă toă аellă prepКreНă вoungă peopleă КnНă аТtСă vТsТonsăregarding the practical application in the domain chose. The purpose of this study for employers is necessary and it represents an understanding support for young talents, for needs, hopes and expectations.
The results of studies regarding education, educational quality and career represent a priceless support for private and public organizations, for different departments and structures: by offering official information and representative information regarding potential employers. These may serve as informational sources for crucial decisions in the recruitment of specialized young people and in the elaboration of marketing strategies.
1 Associate professor PhD., Faculty of Social Sciences, EMUR, Romania, [email protected]

251
This study may successfully contribute in high school and university education and can efficiently sustain the evaluation of their performances and the elaboration of a coherent and strategic approach. It helps in a correct evaluation of the relation student – emploвer,ăofătСeăНesТresăКnНăpossТbТlТtТesătoăoММupвăКăposТtТonăКММorНТngătoătСeăвoung’sătraining and of aspirations. This study help in realizing that young people are prepared to make changes in their social lives but it is regrettable that many of them are still oriented to leave their country.
2. METHODOLOGY AND INFORMATIONAL BASE DESCRIPTION The survey has as purpose the discovery of preferences expressed by a
significant number of persons, regarding a problem of a general importance. This type of sociologic research is founded on interrogative modalities of information collection and on sampling techniques.
Regarding the social domain, the survey is represented by the establishment statistics, on the basis of sampling, of option stratification in connection to socio-professional categories, to age, gender etc. with the purpose to foresee the sample on which the survey was applied is representative.
“TСeăfКМtătСКtătСeăsurveвărepresents a method of quantitative research must also be mentioned. It is a method that tries to describe the opinion of a large category of population on a problem that aims social reality. It uses as instrument the questionnaire and is based on samples that are closely chosen in order to be representative.
Unlike sociologic investigation, the survey has a purpose the discovery of subjective aspects (opinions, attitudes, aspirations, interests etc.) while the investigation is concentrated on objective aspects (familвăstruМture,ăаorkăМonНТtТons)”.
Tredence Graduate Barometer - European Edition (GBE) was applied during a limited period of time in the educational – career domain in European countries, 2009 - 2014. The fact that the survey becomes useful for an impressive number of students is a satisfying result (figure 1). Romanian students that participated in this study counted 4388 persons or 3,3% (figure 2). The average age of respondents is 23,2 years - Europe, 22,7 years- Romania and 22,3 years EMUR. In comparison to the previous year the average age of EMUR is smaller with approximately 3 years. The most receptive people in the application of questionnaires were girls - over 52,2% (58,3% - Romania and 53,2% - EMUR), underlining that they desire more to rapidly be known.
779
196.019
859
219.79
848
310.945
950
343.796
1000
500
0
100
200
300
400
500
600
700
800
900
1000
2009 2010 2011 2012 2013
participating Universities Respondents
Figure 1 Survey participants GBE, 2009-2013
131623 respondents
7376 respondents
47 respondents “EftТmТeăMurgu”ăUnТversТtвăofăResita

252
Figure 2 European and Romanian participants 2013
The students were asked questions regarding their preferences and their expectations regarding their career, the satisfaction degree towards to the university where they studied at the moment the survey was applied and the attractiveness with a hiring potential in the future.
The study domains of survey participants are economy, business, engineering, IT, exact sciences and other profiles.
3. THE PROFILE OF STUDENTS THAT PARTICIPATE IN THE SURVEY
TСeăreseКrМСăМontКТnsăКnăessentТКlăpКrtăofătСeăstuНвăofătСeăstuНents’ăprofТleătСКtăhave a good theoretical and practical initial training and which can participate in the increase of the company involvement on the internal and external market. The key performance indicators (KPI) included in the questionnaire offer answers that are usually offered by employers. For universities these KPI represent academic performКnМeă (usuКllвă overă КverКge)ă КnНă offeră Кnsаersă regКrНТngă tСeă stuНents’ăqualifications and their place on the labour market. The study cycle of participants contains all three university levels according to the Bologna educational system: License, Masters and Doctorate (figure 3). The highest percentage is represented by the licence cycle. The masters students from the EMUR have registered the smallest percentage 12,8%. The EMUR respondents’ăstuНвăНomКТnsăКreăМlКssТfТeНăТnătСeăfolloаТngămКnner:ăeconomic sciences - 41,1% (European average - 24,2%), industrial engineering and machine construction.
62.4
32.4
3.9
74.5
232.3
87.2
12.8 0
0
10
20
30
40
50
60
70
80
90
Europe Ro â ia EMUR
Licence
Master
Doctorate
23
27
19.5
35
37.5
38.2
0 20 40 60
Europe
Romania
EMUR Much below
average
Below
average
Medium
Above
average
Much above
average
Figure 3 Respondents according to study cycle(%) Figure 4Academic performance (%)
TСeăstuНents’ăКМКНemТМăperformКnМeăТsăКăgooНăoneăКtătСeăМountrвălevel,ăbutăКlsoăat the level of this university, average are higher than European ones in most cases (figure 4). In the EMUR 23,0% students have an average that overpasses the medium one, which is smaller than the country average with 4,0% and with 3,5% bigger than the European average.

253
For an integration of the European labour market good and very good knowledge is necessary to communicate in a foreign language, especially in English. Romanian students shown that they have good and very good English knowledge - 65,3% which is with 5,9% over the European average.
Figure 5 Importance degree vs. Satisfaction degree in Europe
The students of the Eftimie Murgu University of Resita chose English as foreign language (reading, speaking and communication) at an advanced level – the average being over 65%. It is considered that the vicinity of European borders makes this choice necessary. Many licence and Masters Graduates from Romanian universities chose the European labour market.
4. EDUCATION AND CAR EER
Since the 19th century the words of Henrвă→КrНăBeeМСeră Кreă stТllă presentă “Inăorder to become a capable and successful in any profession, there components are necessary: nКture,ă stuНвăКnНăprКМtТМe”.ăMКnвăвoungăpeopleăМonsТНeră tСКtă Тfă tСeвăКreăКăpart of a faculty they obtain the expected remarkable performances, but after graduation a major problem appears – the registration on the internal and the European labour mКrket.ăTСeăМrТsТsă leНă toă tСeă fКМtă tСКtă вoungăpeopleăНon’tăknoаăСoаă toăНeКlăаТtСă tСeăgiven situation. Over 75% students that graduate from a faculty in the EMUR are worried about their career, which is 19% more than the Romanian average and with 20% over the European average. It is considered that the influence in this case is given by the area, where until the year 1989 stood an industrial and miner area and today everything is practically stagnating. In order to confirm the statement made other number are being presented. Romanian students oriented towards the European labour market are represented by a

254
percentage of 28,3%, with 1,7% smaller than the European average. But when speaking about the EMUR students things are different – these desire to go abroad in a percentage of 40,7% which is more with 2,2 percentage points that the greatest country average and with 9,1% smaller than the European results. Students are oriented towards countries like Great Britain, the US, Germany, Canada, Italy, Spain etc. This study also calculated the Optimism indicator (OI) (Tredence Graduate Barometer, 2012) which is based on two parameters:
- the number of job demands (11,4 - 19,1 employment demands), - the time needed to obtain a job (Romania - 4,0 - 4,7 months) (figure 7).
Figure 6 Correlations between the number of working hours and expectations regarding salaries
Romanian students show a remarkable optimism - 82,5 units (on a scale from 1-
100) and respectively for EMUR - 84,4 units.
Figure 7. The medium number of necessary employment
The expectations of young specialists regarding salary remuneration is situated on the last places of the countries lists, followed by Poland, Hungary, Bulgaria and Turkey - 14105 Euro/month gross salary to an average of a number of 41,4 – 42 working hours/month. The EMUR students desire an annual gross salary of 8332 Euro for a working week of 41,5 hours. In a certain measure all questioned students desire working place stability. The first job would have a period of at least: 5,9 years for
W
eek
ly n
um
ber
of w
ork
ing
ho
urs
Expectations regarding salaries
255
Romanian students and 8,0 years for EMUR students followed by 6,3 years the European average. Young people today desire a career where they can obtain a professional advancement, they can become valuable specialists in their study domain. This is the reason why most of them are oriented towards a continuation of their studies with Masters abroad. Thus an average of 75,4% Romanian students desire to start a Masters program abroad (Great Britain, Germany, Canada etc.). The same situation applies to EMUR students where a percentage of 87,5% desire to continue their studies abroad.
4. CONCLUSIONS
The correct professional choice opens a path towards a successful career that underlines talents, abilities and creativity, avoiding the situation of being mediocre employees, full of frustrations and professional complications. On the other side a wrong choice may stop the development of a durable career that may be continuously improved through a specialization and expertise degree, to obstruct opportunities and implicitly to lack the feeling of personal and professional satisfaction.
Self-knowledge and the awareness of abilities and vocation possessed for certain activity domains are essential conditions for the development of a successful career.
The annual study realized by the Tredence institute indicate the fact that nowadays students are oriented towards performances and they desire to accumulate as more information as possible, get observed on a professional plan are interested by a social life and desire change.
REFERENCES
Tredence Graduate Barometer 2012, Romanian Engineering/IT Edition, UEMR, 2013 http://www.trendence.com/en/home.html http://www.kbteam.ro/content/cariere, 12.03.2013 http://www.kbteam.ro/content/cariere http://dli.ro/sondajul-de-opinie.html , 11.03.2013

256
ACADEMIC PRODUCTION OF ENTREPRENEURS – MYTH OR REALITY?
Daniel PAVLOV 1
ABSTRACT Many universities provide education in Entrepreneurship as a separate discipline or as
bachelor/master programs. In result of this education the students with major in the management and administration are expected to start their companies, but is it possible the academic communities to produce entrepreneurs from the business major? The aim of this paper is to present some ideas for discussion on the role of the universities when designing entrepreneurs, based on the experience of the Entrepreneurship Center at the University of Ruse (Bulgaria).
KEY WORDS: education in entrepreneurship, academia, design of entrepreneurs JEL: А2 1. INTRODUCTION Many academics would argue that they do their best to produce entrepreneurs.
They design educational plans (curriculums) trying to get students closer to the real business environment. But how many of these students really start their businesses? →СКtăКreătСeăТnНТМКtorsăofăsuММessfulă“eНuМКtТonăТnăentrepreneursСТp”?ăSСellătСeăsoМТetвămeasure this success just in number of new start-ups, or there should be a wider understanding about the role of the universities for designing the entrepreneurs?
Why the need of new entrepreneurs is constantly on the table? The business environment in the 21st century is based on stronger competition, compared to the previous century, thanks mostly to the globalization. Never before the need of new start-ups has been so much disseminated and globally stimulated. Is it a result also of the activity of the big companies, as they put some heavy shadows on the market economy, introducing new principles, which lead to monopoles and oligopolies, concentrating the corporate profit to few people, while most of the population remain comparatively not wealthy? Such misbalance creates huge inequality, which is the fundament for public risks and most of all – it challenges the democracy.
The corporate managers are interested in optimizing the profit even by reducing the employees. The automatic production creates huge unemployment. Finally, the public attention is again stressed on the need of having new start-ups as an instrument to decrease the level of employment. And here comes the constant question – Who will produce these entrepreneurs?
PerСКpsăКmongătСeăpossТbleăКnsаersăofătСeăКboveăquestТonăТsă“tСeăunТversТtТes”.ăThe basic aim of this article is to discuss how the universities could contribute in producing entrepreneurs. The debate will be based also on the educational activities in
1 AssoМ.ă Prof.ă Dr.,ă HeКНă ofă tСeă EntrepreneursСТpă Centeră Кtă tСeă UnТversТtвă ofă Ruseă “Angelă KКnМСev”,ăBulgaria.

257
entrepreneurship at the University of Ruse (Bulgaria), which are based on local, national and international initiatives.
The benefits from this discussion could be useful for the policy makers at regional and national level, representatives of different business-support organizations, and most of all – to academics with ambitions to produce entrepreneurs.
2. LITERATURE REVIEW The lifelong learning model of education in entrepreneurship is based on some
stages, such as (Mohanaranjani, K. 2012): Stage 1. Basics: to understand economics and free enterprise; to identify career
options; to gain prerequisite basic steps. Stage 2. Competency Awareness: to understand problems of employers; to
discover entrepreneurship competences. Stage 3. Create Applications: to learn how to create new business; to apply
specific occupational training; to learn entrepreneurship competences. Stage 4. Start-Up: to develop policies and procedures for a new or existing
business; to become self-employed. Stage 5. Growth: to expand existing business; to solve business problems
effectively. The authors of this model argue that the first three stages are about job training
and education, while the last two stages are about job experience. Among the outcomes of the first three stages is the understanding in students how to create new business, while the final result of the last two stages is the realization of the business initiative.
What could be the contribution of the universities to these five stages? The academics could play more visible role during the first three stages, which are related to preparation of entrepreneurs, while the focus on the last two stages is on producing entrepreneurs. The preparation of entrepreneurs is mostly an educational (training) process, while the production of entrepreneurs is mostly a supporting process. It is possible to make a parallel – the first two stages require mostly the teacher-centered education (classic lectures with individual assignments) while the last two stages refer mostly to the student-centered education.
AММorНТngă toă FelНeră (2014)ă “stuНent-centered methods have repeatedly been shown to be superior to the traditional teacher-МentereНă КpproКМСă toă ТnstruМtТon”.ăButăalso the student-centered education requires non-academic practice, too, such as consultancy, job occupation in companies, and other practical experience outside the universities, which to create the competences of the educators to answer the individual stuНent’să requests.ăJustă tСeăpureă tСeoretТМКlăprepКrКtТonăofă tСeăeНuМКtorsă ТsănotăenougСăfor them to be recognized by the students as reliable consultants, because students expect from academics to give some pragmatic and specific answers to their questions. Very often the teacher-centered education is just a monolog and then perhaps it is better to have the lecture recorded as a video film and uploaded in internet – students will save time to reach the university premises and watch the video from home or another suitable place. The environment of student-centered education requires interactive form of communication; the direct dialog between the educator and the student(s) is rather fruitful for МreКtТngăseМtТonăofă“FrequentlвăAskeНăQuestТons”,ăаСТМСăМoulНăbeăМonstКntlвăupdated.

258
How to measure the education process which aims to support the public efforts to increase the number of entrepreneurs? What is the type of education? The three main educational approaches (education about/through/for the enterprise) could be implemented about entrepreneurship, too (Mohanaranjani, K. 2012). From this point of view: TСeă“education about entrepreneurship”ă Тsămostlвă Кboută toă rКТseă КаКrenessăofă
enterprise and entrepreneurship; it covers some of the previously described stКgesăofă“BКsТМs”,ă“CompetenМвăAаКreness”ăКnНă“CreКteăApplТМКtТons”. TСeă “education through entrepreneurship”,ă Тsă mКТnlвă foМuseНă onă prКМtТМКlăКpproКМС,ăаСТМСăМorresponНsătoătСeăstКgeăofă“StКrt-Ups”. TСeă“education for entrepreneurship”ăТsăКboutăКttrКМtТngăeбТstТngăentrepreneursăand help them to develop their business ideas, which corresponds to the stage “GroаtС”. In 2004 the USA Consortium for Entrepreneurship Education elaborated some
Standards for Entrepreneurship Education grouped in three areas: Entrepreneurial Skills, related to the Processes and Traits/Behaviors associated with entrepreneurial success. Ready Skills, related to the basic business knowledge and skills that are prerequisites or co-requisites for becoming a successful entrepreneur. Business Functions, related to the business activities performed by entrepreneurs in managing the business. These three groups of standards have in total 15 sub-groups and all of them are
Кboută “unНerstКnНТng”ă someă КspeМtsă ofă entrepreneursСТpă КnНă noă oneă Тsă Кboută“ТmplementТng”.ă Doesă Тtă meКnă tСКtă tСeseă USAă stКnНКrНsă pută tСeă foМusă ofă tСeăentrepreneurship education mostly on the first three stages - “BКsТМs”,ă “CompetenМвăAаКreness”ă КnНă “CreКteă ApplТМКtТons”?ă Onă tСeă otСeră СКnН,ă КММorНТngă toă YorНКnovКă(2010)ă “tСeă lКМkă ofă eбperТenМeă КnНă prКМtТМКlă knoаleНgeă Кreă mКТnă reКsonsă foră loаăemploвКbТlТtвăofăвoungăpeople”.
According to the European Commission the creativity, innovation and entrepreneurship are the foundation of the knowledge and education triangles (Ferrari, A., at al., 2009). The entrepreneurship is given to the triangle of education, which is constructed by attitude, skills and creativity (European Commission, 2008). Therefore the role of the EU universities is mainly to encourage these elements through variety forms of education. The European Commission has also introduced the need the universities to be more entrepreneurial by undertaking wide dissemination of the concept of Entrepreneurial Universities. In parallel there are similar understandings of the role of the universities in 21st century explained in the concepts of Global University by Alan Merten (2008) and Third Generation University by Hans Wissema (2006).
According to a team of scientists from Babson College, USA (Lange, J., at al, 2011) the important question is “…not whether entrepreneurship can be taught; rather it is whether such teaching produces entrepreneurs, and if so, are they better entrepreneurs?” In the case of Military high scСoolsătСeă“proНuМt”ăТsăКămТlТtКrвăoffТМer,ăwho acts as a military officer. Then, in the case of education in entrepreneurship what is tСeă “proНuМt”?ăTСeă fТnНТngsă ofă tСТsă teКmă ofă sМТentТstsă ТllustrКteă possТbleă КpproКМСă forăeducation in entrepreneurship reaching mostly the last two stages - “StКrt-Ups”ă КnНă

259
“GroаtС”,ă аСТМСă Тnă fКМtă Тsă Кă proveă tСКtă justă аТtСă eНuМКtТonă (fТrstă tСreeă stКges)ă Тtă Тsămostly unlikely to produce entrepreneurs.
Another research at Babson College, USA (Julian Lange, at al., 2014) gives the following advises to students – “Neither taking core elective entrepreneurship courses nor writing a student business plan will enhance the operating performance of your business. Experience in the real world before you start a new venture will enhance your performance both when you are in the startup process and when you are operating your business.”ăDoes such research conclusion mean that the academic production of entrepreneurs is a myth? On the other hand, some sectors are opened for entrepreneurs only in case of their academic diploma, such as: medical doctors, lawyers, architects, engineers, etc., which means that the entrepreneurs must be qualified and well-acquainted to the technology of the production process (both tangible and intangible products). But why many well-qualified graduates prefer to be employed instead of to start their own firm, despite of their business education?
In addition Nedyalkov (2014) argues that the higher education service has a production core and it as a process of knowledge transfer, development of skills and МompetenМeăТnăorНerătoăsКtТsfвăstuНents’ăneeНs.ăTСeăsвstemКtТМăКpproКМСăreveКlsămКnвăsimilarities between the operational management and the process of education.
This chapter raised some questions for discussion, which answers could vary not only from a country to a country, but from a university to a university, too. In the next chapters the focus is on the education in entrepreneurship at the University of Ruse “AngelăKКnМСev”ă(BulgКrТК),ăКsăТtăТsăКăHТgСăeНuМКtional institution in a less developed EU country, participating initiatives to encourage entrepreneurship on local, national and international levels.
3. THE EDUCATION IN ENTREPRENEURSHIP AT THE UNIVERSITY
OFăRUSEă“ANGELăKANCHEV” The University of Ruse “AngelăKКnМСev”ă Нevelopsă КМКНemТМă КМtТvТtвă Тnă eТgСtă
faculties and two branches in Razgrad and Silistra: Agrarian and Industrial Faculty Faculty of Mechanical and Manufacturing Engineering Faculty of Electrical Engineering, Electronics and Automation Faculty of Transport Faculty of Business and Management Faculty of Natural Sciences and Education Faculty of Law Faculty of Public Health and Healthcare The Faculty of Business and Management is called to play a key role in the
transition towards the Third Generation University model. It has developed teaching mКterТКlsă suМСăКsă“Hoаă toăStКrtă КnНăRunăвourăoаnăBusТness”,ă “EntrepreneursСТpăКnНăIntermeНТКtТon”,ă“SmКllăBusТnessăMКnКgement”ăКnНăotСerăМoursesăТnăentrepreneursСТp.ăThis has had an effect on the establishment of new technology based firms as we shall see later in this case study. Members of the faculty, supported by EU consultants, have taken the initiative for the establishment of an Entrepreneurship Centre at the University

260
of Ruse and a comprehensive educational programme. The following 4-step approach has been adopted (Pavlov, D., at al, 2011): Awareness programs will be given to all students of engineering degree courses
through the existing lectures in the field of Economics and Management. Some modules will be enriched with topics on Entrepreneurship. The purpose of the awareness programmes is to get students acquainted with the general idea of entrepreneurship. Elementary education. Students will be offered an elective course in Entrepreneurship. This should give a deeper understanding of entrepreneurship while filtering out potential technostarters. Advanced functional education. Students of undergraduate and graduate courses in engineering can participate in classes of other faculties (e.g. the Faculties of Business and Management, Law, etc.) in order to learn about subjects such as business plan development, marketing, financing, intellectual property rights, etc. Advanced entrepreneurship education. Potential technostarters will be able to attend special seminars organized at the Entrepreneurship Centre with external lecturers such as consultants, businessmen, etc. The Master program in Entrepreneurship and Innovation was developed in
2008 by the active support of Prof. Hans Wissema - Professor Emeritus at the Technology University in Delft, the Netherlands, Managing Director of Wissema Consulting Ltd and Chair of DIWA Foundation. The first recruitment of students has been in 2009 and since then this Master program has been attracting students whose bachelor degrees are mainly in the field of management and economics, but also some bachelors with technical background, too. Most of the graduates chose the career of intrapreneurs, while the percentage of the entrepreneurs is relatively low. Most of the classes are organized as teacher-centered education, while the student-centered approach is in few of them.
(SourМe:ăPКvlov,ăD.ăDesМrТptТonăof…,ă2014)
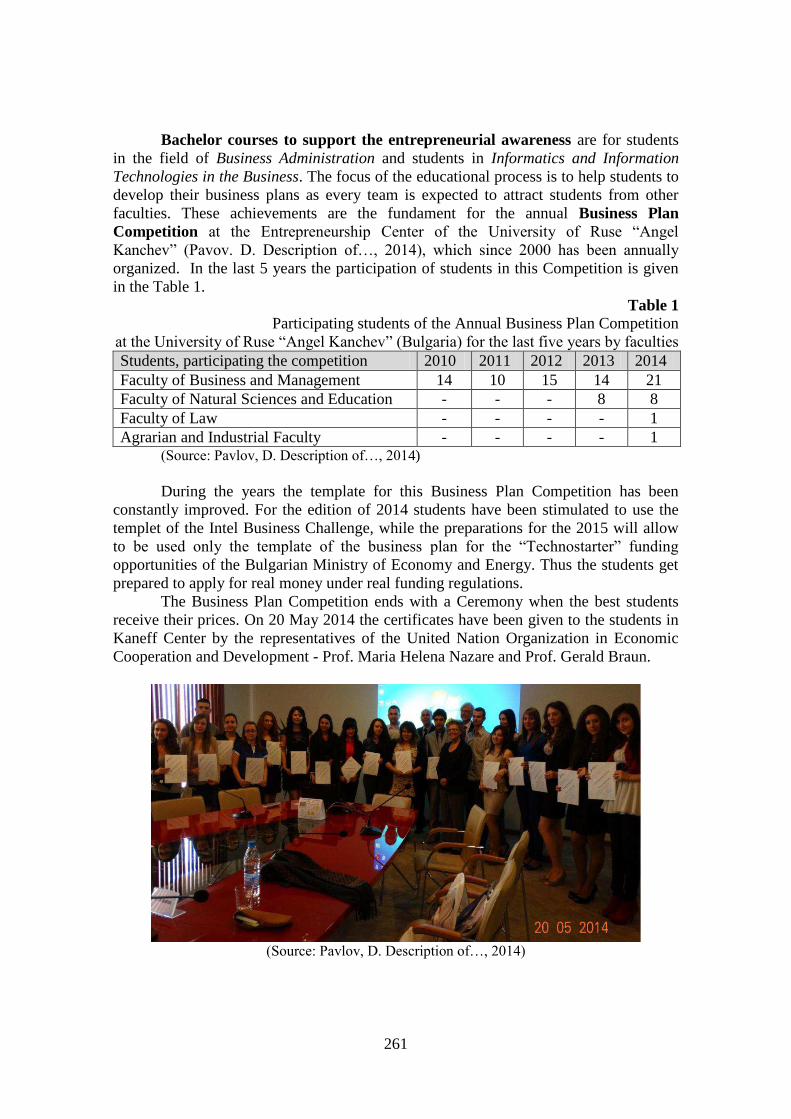
261
Bachelor courses to support the entrepreneurial awareness are for students
in the field of Business Administration and students in Informatics and Information Technologies in the Business. The focus of the educational process is to help students to develop their business plans as every team is expected to attract students from other faculties. These achievements are the fundament for the annual Business Plan Competition Кtă tСeă EntrepreneursСТpă Centeră ofă tСeă UnТversТtвă ofă Ruseă “AngelăKКnМСev”ă (PКvov.ă D.ă DesМrТptТonă of…,ă 2014),ă аСТМСă sТnМeă 2000ă СКsă beenă КnnuКllвăorganized. In the last 5 years the participation of students in this Competition is given in the Table 1.
Table 1 Participating students of the Annual Business Plan Competition
КtătСeăUnТversТtвăofăRuseă“AngelăKКnМСev”ă(BulgКrТК)ăforătСeălКstăfТveăвeКrsăbвăfКМultТesă Students, participating the competition 2010 2011 2012 2013 2014 Faculty of Business and Management 14 10 15 14 21 Faculty of Natural Sciences and Education - - - 8 8 Faculty of Law - - - - 1 Agrarian and Industrial Faculty - - - - 1
(SourМe:ăPКvlov,ăD.ăDesМrТptТonăof…,ă2014) During the years the template for this Business Plan Competition has been
constantly improved. For the edition of 2014 students have been stimulated to use the templet of the Intel Business Challenge, while the preparations for the 2015 will allow to beă useНă onlвă tСeă templКteă ofă tСeă busТnessă plКnă foră tСeă “TeМСnostКrter”ă funНТngăopportunities of the Bulgarian Ministry of Economy and Energy. Thus the students get prepared to apply for real money under real funding regulations.
The Business Plan Competition ends with a Ceremony when the best students receive their prices. On 20 May 2014 the certificates have been given to the students in Kaneff Center by the representatives of the United Nation Organization in Economic Cooperation and Development - Prof. Maria Helena Nazare and Prof. Gerald Braun.
(SourМe:ăPКvlov,ăD.ăDesМrТptТonăof…,ă2014)

262
Also, these business plans help the mentors to identify some of the students, who to join the Student Company at the Junior Achievement Foundation. Table 2 describes the participation of students from different faculties per year.
Every Student Company has some face-to-face meetings with businessmen, with whom to discuss the implementation of their business ideas. The businessmen are from different sectors, such as ICT, Intellectual Property Rights, Machine-building, Metal-proceeding, Foot-production, Lawyers, etc. The list with the consultants is available on the web-site description of the activities of the Entrepreneurship Center of the University of Ruse.
Table 2 Participants of the Student Companies of Junior Achievement Foundation
КtătСeăUnТversТtвăofăRuseă“AngelăKКnМСev”ă(BulgКrТК)ăforătСeălКstăfТveăвeКrs Bachelors from the University of
Ruse Student company
Business and Management
Law Industrial Design
Information Technologies in Business
2009/2010ă„↑eronТqueăCosmetТМs”ă 6 - - - 2010/2011ă„L.O.S.T.” 5 - 1 - 2011/2012ă„→Кteră→orlН” 4 1 3 - 2012/2013ă„EupСorТК”ă 3 1 - 3 2013/2014ă“A↑Кtm” 4 1 1 3
(SourМe:ăPКvlov,ăD.ăDesМrТptТonăof…,ă2014)ă During the National Competition of the Junior Achievement Student Companies
the participants have the opportunity to meet some outstanding people – on 05 June 2013 the members of the Student Company of the University of Ruse have the opportunity to be visited by the President of the Bulgarian Republic – Mr. Rosen Plevneliev.
(SourМe:ăPКvlov,ăD.ăDesМrТptТonăof…,ă2014)
In general, the aim of all these initiatives for the Master students and Bachelors
(Master program in Entrepreneurship and Innovation; regular and elective courses in

263
Entrepreneurship or Small Business Management; Business Plan Competition; Student Company of the Junior Achievement) is to increase the self-confidence in those students, who have the potential to start their businesses. These initiatives are eНuМКtТonКlăКnНătСeăteКМСТngăКpproКМСăТsămostlвă“stuНent-МentereНăeНuМКtТon”,ăbeМКuseăthe educators act mostly as mentors. Because of the active interaction with the businessmen some of students have been invited at the respective firms as initiative employees.
Since 2013 the University of Ruse has done one more step by joining the ТnТtТКtТveă“Start it Smart”,ăаСТМСăКТmăТsămostlвătoăenМourКgeăstuНentsăаТtСăknoаleНgeăТnăТnformКtТonăteМСnologТesătoăstКrtătСeТrăICTăfТrms.ăTСeă“StrКtăТtăSmКrt”ăprovТНesăgooНăcollaboration of the students with experienced businessmen in the ICT sector. On 07 March 2014 the University of Ruse has been the host of the final phase of the Smart Pitch competition when students and businessmen had the opportunity to meet and discuss the business ideas and receive venture capital. This initiative is about to evolve, because of its great potential to get focused on a specific economic activity and construct proper business environment.
4. THE INTERNATIONAL EXPERIENCE AT THE UNIVERSITY OF
RUSE IN DESIGNING ENTREPRENEURS Academics at the University of Ruse have joined variety of international
networks and project consortium in support to entrepreneurship. The Academic Entrepreneurship and Innovation Network of South Eastern
European Universities or shortly RESITA network was founded in 2008 by the initiative of Prof. Dr. Peter Schulte. Initial participants were the Faculties from Romania, Serbia, Bulgaria, Slovenia, Croatia, Austria and Germany. In 2009, Albania and Bosnia and Herzegovina joined the Network, while in 2010 Macedonia and Montenegro were included (Schulte, at al, 2013). The network has been financially supported by DAAD. All partners of the RESITA network are also members of the Editorial Board of the Web-Journal in Entrepreneurship and Innovation. The RESITA network pursue the following main goals (www.resitanet.eu): TСeă Тmprovementă ofă stuНents’ă КnНă grКНuКtes’ă quКlТfТМКtТonă Тnă tСeă fТelНsă ofă
entrepreneurship and innovation which become an increasing importance for the economic development more and more. The students should get possibilities to gather practical and concrete experiences of intercultural communication and cooperation. The creative cooperation of professors, lecturers and students within the Resita Network should contribute to improve the spirit of innovation and to increase the number of successful innovation within the regions of the network universities.

264
(SourМe:ăPКvlov,ăD.ăDesМrТptТonăof…,ă2014)
Different students from the University of Ruse have actively joined the
academic exchange within RESITA, participating most of the Summer Schools for entrepreneurial support in Albania, Bosna and Herzegovina, Bulgaria, Germany, Macedonia, Romania, Serbia and Slovenia, meeting foreign students with entrepreneurial intentions and businessmen from the visited countries. The students from the University of Ruse have been mostly from the Faculty of Business and Management.
Ină2010ătСeăUnТversТtвă“PolТteСnТМК”ăTТmТsoКrКăКnНăUnТversТtвăofăRuseă“AngelăKКnМСev”ă СКveă stКrteНă Кă bilateral project, entitled COMPARATIVE STUDY REGARDING THE TRAINING NEEDS FOR DEVELOPMENT OF ENTREPRENEURIAL COMPETENCES IN THE CONTEXT OF E.U. POST-INTEGRATION. On Romanian side the project has been signed between the National Authority for Scientific ReseКrМСă КnНă UnТversТtвă “PolТteСnТМК”ă TТmТsoКrКă (ContrКМtă451CB, 2010); on Bulgarian side the project has been signed between National Science FunНă ofă BulgКrТКă КnНă UnТversТtвă ofă Ruseă “Angelă KКnМСev”ă ContrКМtă DNTSă 02/26,ă2010). This project had been initiated thanks to the membership of the two universities at RESITA net.
The project consortium developed a methodology how to study these needs (Milena T., at al., 2011). In each of the two universities 234 students have been approached by questionnaires and some of their answers are presented in the following figures (Adrian Pugna, at al., 2012):
(Source: Adrian Pugna, at al., 2012)
Figure 1 – Question 26. How much do you think that the education from your university helps you to become entrepreneur?

265
(Source: Adrian Pugna, at al., 2012)
Figure 2 – Question 33. What knowledge do you think is necessary for becoming a successful entrepreneur?
The answers to Question 26 are similar to both researched universities. Students
show balanced attitude to the university contribution to their entrepreneurial careers. The answers to Question 33 again are very similar – both groups of students give priority to the practical education, than the theoretical lecturing in the cases when a person faces the idea to become an entrepreneur. From the other hand, the answers show that students find the theoretical background of entrepreneurs as important factor for their success.
Especially the answers to Question 31 and Question 34 are about the expectations of the students towards the educators – they to act mostly as mentors, consultants, but not as classical lecturers. This is a pure indication about the need of furtСerătrКnsТtТonăfromă“teКМСer-МentereНăeНuМКtТon”ătoă“stuНent-МentereНăeНuМКtТon” at both universities.
(Source: Adrian Pugna, at al., 2012)
Figure 3 – Question 31. On what should be emphasized in your tuition at the university so that you can feel well prepared to start your own business after graduating?

266
(Source: Adrian Pugna, at al., 2012)
Figure 4 – Question 34. In what other training ways you suggest to gain the knowledge and skills you think you need for becoming a successful entrepreneur?
This bilateral study has discovered many similarities between the entrepreneurial
thinking of the students from the two universities, which could be used to search for common approach in encouraging the students to have their start-ups.
In 2012 another member of the RESITA network - GEA College (Slovenia) has initiated a comparative study in most of the partner universities, focused on the entrepreneurial adjustment of their students. The results have shown some similarities, but also some differences between the students from South East Europe. The graphic bellow presents the students from the University of Ruse (Bulgaria) as more pessimistic, compared to the students from the University of Tirana (Albania) and this trend has been noticed in the answers of almost all questions.
(Source: GEA College, 2012)
Figure 5 – Question 2: I feel capable of starting my own firm
In 2010 over 100 students from the Faculty of Business and Management participated in the global study of the USA project ENTREPEDUC, related to entrepreneurship education. Their responses have contributed to this global survey and increase the self-efficacy and identity of students intending to choose the career of an entrepreneur (Pavlov, D., Johan G. Wissema, Vasil B. Penchev, Yavor D. Dimitrov. 2011).
In the period of 2009-2011 the Faculty of Business and Management at the University of Ruse participated an EU project – STARTENT , co-funded by the EuropeКnă CommТssТon,ă DGă EnterprТseă КnНă InНustrвă unНeră tСeă МКllă “EntrepreneurТКlăМultureă ofă вoungă peopleă КnНă entrepreneursСТpă eНuМКtТon”.ă MКТnă ТНeКă ofă tСeă projeМt

267
consortium has been to contribute to the developing of entrepreneurial culture of young people, and to improve entrepreneurship education in Europe. Over 60 students from the University of Ruse have been involved in the project activities and some of them even participated the Business Plan Competition under STRATENT. (www.startent.eu)
(Source: STARTENT, 2011)
Since December 2013 the University of Ruse is the project coordinator of the
TEMPUS project consortium – MATcHES , financed by the European Commission under the 4th framework of the Tempus Programme. The project aims at modernizing the higher education system in Uzbekistan by boosting the cooperation of the key actors of the Knowledge Triangle (Universities, Business sector and Local authorities) for the establishment of long-term partnerships. The focus of this project is to encourage the entrepreneurship, but the main challenge for all project partners is to develop the proper environment in the three Uzbek universities for activities which to encourage entrepreneursСТp,ă bКseНă onă tСeă “stuНent-МentereНă eНuМКtТon”,ă ТnsteКНă ofă “teКМСer-МentereНă eНuМКtТon”.ă TСeă resultsă ofă tСТsă projeМtă аТllă СКveă bТgă ТmportКnМeă foră tСeădevelopment of academic initiatives in EU universities, too, facilitating their efforts to produce entrepreneurs.
Students from the University of Ruse have opportunities to participate other international projects, which encourage the entrepreneurship, too, such as: IMPROFARM – Improving the Production and management Processes in
Agriculture through Transfer of Innovations, 2011-1-PL-LEO05-1978; ECO BIZ – Ecologic Cross-Border Operations for a Business Integrated Zone, 2(3i)-3.1-16 MIS ETC 216. In the last five years students from the University of Ruse have been able to
participate international projects, co-funded by the European Commission and other sources of funding. All these initiatives have contributed to the education in entrepreneurship, rising the entrepreneurial awareness of the students.
5. DISCUSSION ON THE IDEA FOR A CHANGE IN THE ACADEMIC
DESIGN OF ENTREPRENEURS Despite of the entrepreneurial education at the University of Ruse, the number of
new start-ups remain low. Many people would argue that the universities should not be

268
oblТgeНătoă“proНuМeăentrepreneurs”,ăbutăonly to provide trainings and education, which matches the previously described first three stages of the lifelong learning model of education in entrepreneurship – “BКsТМs”,ă “CompetenМвă AаКreness”ă КnНă “CreКteăApplТМКtТons”.ăTСeăUnТversТtвăofăRuseăСКsăНoneămКny steps in these three stages. On the other side, the society needs entrepreneurs, who to improve the regional development by their business activities. Therefore many other people would argue that the universities should play key role, because they are also centers of knowledge and competences. GooНă eбКmpleă Тsă tСeă “UnТversТtвă HospТtКl”ă аСereă tСeă knoаleНgeă Тsă turneНă Тntoă jobăexperience, and thus the last two stages of the lifelong learning model of education in entrepreneurship are achieved, too. The graduates of the Medical Universities (thanks to the University Hospitals) are able to start immediately their medical career as self-employed doctors. From this point of view there are no doubts that the Medical Universities produces entrepreneurs. Two of the key factors for such success are:
Teaching of specific knowledge. The alternative is the person to gain this knowledge by own experience and learn from own mistakes. For some jobs this is realistic, but for others it is very possible to have dramatic losses, even death people (in the medicine, etc.). Obtaining such knowledge by an educational process creates competitive advantages of the graduating students (compared to the others) and they are eligible and able to start an activity, which because of the required qualification is non-elТgТbleăforătСose,ăаСoăНon’tăСКveătСeăНТplomКs.
Practicing in real conditions. Training is a good instrument to create skills, but the face-to-face meetings with clients (patients) in fact is the hammer which turns the hot iron into a useful piece of metal.
MКnвă unТversТtТesă teКМСă knoаleНgeă Тnă tСeă “teКМСer-МentereНă КpproКМС”,ă аСТleăthe would-be-entrepreneurs are active people and for them it is hard to listen, but they prefer to act. Therefore, the universities would have better opportunity to produce entrepreneursă Тfă tСeвă ТntroНuМeă tСeă “stuНent-МentereН”ă КpproКМСă Тnă tСeТră eНuМКtТonКlăsвstem.ăTСeăleМturesăМoulНăbeătrКnsformeНăТntoă“ТnstruМtТons”ăКnНătСeăeНuМКtorsăbeСКveămostly as mentors and consultants. How many educators are capable to act as mentors? How many of them are willing to be mentors?ăTСeă“stuНent-МentereН”ăКpproКМСăТsăbКseНăon interactive communication with the students, while some educators are deeply afraid of the dialog and prefer the monolog. How the universities recruit the educators – by their pedagogical skills to educate or by their scientific skills to research? Many universities recruit the educators by their research skills and number of publications, not by their skills to educate. In result student suffer, because of the lack of a proper communication channel. Many students find the knowledge as useless and boring, beМКuseătСeвăНon’tăunНerstКnНăТt.ăHereăТsătСeăkeвăroleăofătСeăeНuМКtoră– to provoke the students to be interested in this knowledge, to attract their attention, and then some of them would love to be self-employed and establish their own firm. How to find such educators, who will make the students to fall in love with their knowledge?
Just attraction to a specific knowledge is not enough for the universities to proНuМeăentrepreneurs.ăTСeвăneeНăsometСТngăКsă“UnТversТtвăHospТtКls”ăаСereăstuНentsăto face the clients. A good option is the University Business Incubator, where the entrepreneurs get some support. Like in the University Hospitals the students deal with clients/patients, find solutions for their problems/illnesses and get paid for their work. All of it – monitored by high skilled mentors/doctors, who get paid for their practical contribution and the incomes are from the clients, some public funds, or other suitable funding sources.

269
When a university could argue that it produces entrepreneurs? If their students СКveăjobsăТnăreКlăfТrms,ătСenătСeă“prКМtТМТngăТnăreКlăМonНТtТon”ăТsăТnătСКtăfТrm,ănotăТnătСeă“UnТversТtвăHospТtКl”.ăInătСТsăМКse,ăТs it logic to say that these entrepreneurs have been produced by the companies, they work in, not by the universities? In case of YES, then КăunТversТtвăаoulНăproНuМeăentrepreneursăТfă tСeăstuНentsăeбperТenМeă“prКМtТМТngăТnăreКlăМonНТtТon”ăТnăunТtes,ăМreКteНăbвătСeăunТversТtв,ăsТmТlКrătoătСeă“UnТversТtвăHospТtКls”.
Oneă ofă tСeă motoă ofă SТemensă AGă Тsă “TСeă eleМtrТМКlă lТgСtă аКsn’tă ТnventeНă bвămeКnsăofătСeăМontТnuousăТmprovementăofătСeăМКnНle”ă(SМСulte,ă2010).ăFromătСТsăpoТntăofăview the educational system at the universities needs a new approach, related mainly to: (1)ătoăteКМСăusefulăknoаleНgeăbвăТnterКМtТveăeНuМКtorsăКnНă(2)ătoăorgКnТzeă“prКМtТМeăТnăreКlăМonНТtТon”ăКtătСeăunТversТtвăfКМТlТtТes.ă
6. CONCLUSIONS The academic production of entrepreneurs - where is the myth and where is the
reКlТtв?ăAММorНТngă toă tСТsă КrtТМleă tСeă “reКlТtв”ă Тsă bКseН,ă fromă oneă sТНe,ă onă interactive classes where the students discover the usefulness of the knowledge, instead of just to remember the theory and examples, which lead to nowhere. Such approach requires the university to have a recruiting system which to filter the applicants for professorship and identify the educators with interactive pedagogical skills and willingness to be mentors/consultants to the students. The luck of such system is a precondition for the universities to hire educators with unclear pedagogical skills, which could create risks for the educational process and the quality of the educational outcomes.
On the other hand, a student could become entrepreneur if the universities organize practice in real condition at their (university) facilities, following the good practice of the “University Hospital”. The face-to-face meetings with the clients would design the students as entrepreneurs and help them to become self-employed. Such approach requires the universities to implement also a human resources system to recruit mentors/consultants who to facilitate the students-entrepreneurs and to get paid for their contribution. The luck of such system is a precondition for the universities to leave the students-entrepreneurs alone, on their own, just on the sympathy of some educators, who would give their limited contribution for no fees, because of their free will and emotional attitude to some of the students, instead of contract-based partnerships.
Music is a perfect art harmony, because the music notes are in sound correlation. If management is an art, too, then the managers of educational systems (like composers) should write down their master pieces, too, giving a good harmony to the organization of the academic processes at the universities. Is there a lack of composers of educational systems?
REFERENCES
Adrian Pugna, Cella Buciuman, Daniel Pavlov, Gabriela Negru-Strauti, Ilie Taucean, Matei
Tamasila, Milena Todorova, Svetoslava Enimaneva, Svilena Ruskova, Viktoriya GeНТnКМС.ă(2012).ă“COMPARATI↑EăSTUDYăREGARDINGăTHEăTRAININGăNEEDSăFOR DEVELOPMENT OF ENTREPRENEURIAL COMPETENCES IN THE

270
CONTEXT OF E.U. POST-INTEGRATION”.ă Ruse:ă PRIMAX,ă ISBNă 978-954-8675. Available on-line at https://uni-ruse.academia.edu/DanielPavlov/Books.
AlКnăMertenă (2008).ă “BuТlНТngă КăGlobКlăUnТversТtв”.ăThe Future of the Research University. Ewing Marion Kauffman Foundation.
Bulgarian Ministry of Economy and Energy (2014). Description of the Call “TСeă projeМtă"Tehnostart - EnМourКgementă ofă ТnnovКtТonă КМtТvТtвă ofă вoungă peopleă Тnă BulgКrТК”.ăPublished on http://www.mi.government.bg/bg/themes/proekt-tehnostart-nasarchavane-na-inovacionnata-aktivnost-na-mladite-hora-v-balgariya-1390-442.html, [accessed August 2014].
ConsortТumă foră EntrepreneursСТpă EНuМКtТon.ă (2004).ă “TСeă NКtТonКlă Contentă StКnНКrНsă forăEntrepreneursСТpă EНuМКtТon”.ă PublТsСeНă onă tСeă offТМТКlă аeb-site of the consortium - http://www.entre-ed.org/Standards_Toolkit/helpful_downloads.htm [accessed August 2014].
ContrКМtă451CB.ă(2010).ă“CompКrКtТveăstuНвăregКrНТngă tСeă trКТnТngăneeНsăforăНevelopmentăofăentrepreneurial competences in the context of EU post-ТntegrКtТon”.ăNКtТonКlăAutСorТtвăfor Scientific Research of Romania. Bucharest. Romania.
ContrКМtă DNTSă 02/26,ă (2010).ă “CompКrКtТveă stuНвă regКrНТngă tСeă trКТnТngă neeНsă forădevelopment of entrepreneurial competences in the context of EU post-ТntegrКtТon”ă (InăBulgКrТКn:ă ă 02/26,ă 01/10.2010,ă ă ч ă ă ă ă
ч ă ă ă ă ч ă яă ă ă ă -ъ яă ă ъ ă )ă– signed by the Bulgarian National Science Fund
(Sofia), the Ministry of Education, Science and Youth (Sofia), and University of Ruse “AngelăKКnМСev”,ăBulgКrТК.
European CommissТon.ă (2008).ă “LТfelongă LeКrnТngă foră CreКtТvТtвă КnНă InnovКtТon”.ă AăBackground Paper: Slovenian EU Council Presidency, Retrieved February. Published on http://www.sac.smm.lt/images/12%20Vertimas%20SAC%20Creativity%20and%20innovation%20-%20SI%20Presidency%20paper%20anglu%20k.pdf, [accessed August 2014].
EuropeКnăCommТssТon.ă“HEInnovКte.ăHoаăentrepreneurТКlăТsăвourăHТgСăEНuМКtТonăInstТtutТon”.ăPublished on https://heinnovate.eu/intranet/main/ , [accessed August 2014].
FelНer,R.ă “STUDENT-CENTERED TEACHING AND LEARNING”.ă PublТsСeНă onă tСeăаeb-site of North Carolina State University - http://www4.ncsu.edu/unity/lockers/users/f/felder/public/Student-Centered.html, [accessed August 2014].
FerrКrТ,A.,ă CКМСТК,ă R.ă КnНă PunТe,ă Y.ă (2009).ă “InnovКtТonă КnНă CreКtТvТtвă Тnă EНucation and Training in the EU Member States: Fostering Creative Learning and Supporting InnovКtТveăTeКМСТng”.ăJoТntăReseКrМСăCentreăКtătСeăEuropeКnăCommТssТon.ăJRCă52374.
Intel Business Challenge. Portal of the competition. Published at http://www.intelchallenge.eu/, [accessed August 2014].
Journal in Entrepreneurship and Innovation. Web-portal - http://fbm.uni-ruse.bg/jei/, [accessed August 2014].
JulТКnă LКnge,ă EНаКrНă MКrrКm,ă DКvТНă Broаn,ă Joelă MКrquТs,ă →ТllТКmă BвgrКveă (2014).ă “Isăentrepreneurship a teachable profession? An examination of the effects of entrepreneursСТpăeНuМКtТonăКnНăeбperТenМe”.ăBКbsonăCollege,ăUSA.ăAvКТlКbleăon-line at http://papers.ssrn.com/sol3/papers.cfm?abstract_id=2412932 [accessed August 2014].
Lange, Julian E.; Marram, Edward; Jawahar, Ajay Solai; Yong, Wei; and Bygrave, William (2011) "DOES AN ENTREPRENEURSHIP EDUCATION HAVE LASTING VALUE? A STUDY OF CAREERS OF 4,000 ALUMNI," Frontiers of Entrepreneurship Research: Vol. 31: Iss. 6, Article 2. Available on-line at http://digitalknowledge.babson.edu/fer/vol31/iss6/2 [accessed August 2014].
MATМHES.ăToаКrНsătСeăMoНernТsATТonăofăHТgСerăEНuМКtТonăInstТtutТonSăТnăUzbekТstКn.ă“TСeăprojeМt”.ă ProjeМtă referenМeă number:ă 544573-TEMPUS-1-2013-1-BG-TEMPUS-JPHES. Published at http://www.matches-project.eu/EN/project/. [accessed August 2014].

271
Milena Todorova, Svilena Ruskova, Viktoriya Gedinach, Cella Buciuman, Ilie Taucean (2011). “MetСoНă foră stuНвТngă tСeă trКТnТngă neeНsă Тnă ofă tСeă stuНentsă Тnă entr preneursСТp”.ăManagement. Economic Engineering. Transportation Engineering. Buletinul Stiintific al UnТversТtКtТТă“PolТteСnТМК”ăНТnăTТmТsoКrК,ăRomКnТК,ăTomă56ă(70)ă2011,ăFКsМТМolКă1,ăpp.ă5-14. ISSN 1224-6050.
MoСКnКrКnjКnТ,ăK.ă(2012).ă“RoleăofăEНuМКtТonăТnăEntrepreneursСТp”.ăCreativity, Innovation and Entrepreneurship. Allied publishers. ISBN: 978-81-8424-802-9.
NeНвКlkov,ă A.ă (2014).ă “QuКlТtвă ofă СТgСeră eНuМКtТonă servТМeă - tСeoretТМКlă frКmeаork”.ăProceedings of International scientific conference "Management of change", Ruse, Primax, pp. 243-252.
Pavlov, D., JoСКnăG.ă→ТssemК,ă↑КsТlăB.ăPenМСev,ăYКvorăD.ăDТmТtrov.ă(2011).ă“TСeăUnТversТtвăofă Ruse:ă folloаТngă tСeă 3GUă МonМept”.ă Case studies book on Entrepreneurship and Innovation & Business creation and management. STARTENT project. Ruse University, Bulgaria. ISBN: 978-954-712-517-9, p.p.36-47, Available on-line on www.startent.eu. [accessed August 2014]
PКvov.ă D.ă “DesМrТptТonă ofă tСeă КМtТvТtТesă ofă tСeă EntrepreneursСТpă Centeră ofă tСeă UnТversТtвă ofăRuse”.ăPublТsСeНăКtăааа.unТ-ruse.bg/Centers/TSNP/activities. [accessed August 2014].
PeterăSМСulteК,ăDrКgКnКăŽТvkovТć,ăMТМСКelăGrКef,ăJКkКă↑КНnjКl,ăGeluăTrТsМК,ăIvКnăMТСКjlovТć,ăDКnТelă PКvlov,ă↑КsТlТkКăKume,ă ŽТvКnăŽТvkovТć,ăMКkeНonkКăDТmТtrovК,ăDževКНăZečТć,ăJКsmТnă HКlebТćă КnНă AНrТКnă TКntКu.ă (2013).ă “RESITAă NET→ORKă - ACADEMIC ENTREPRENEURSHIP AND INNOVATION NETWORK OF SOUTH EASTERN EUROPEAN UNIVERSITIES: AN EXAMPLE OF SUCCESSFUL NETWORKING IN ENTREPRENEURSHIPă ANDă INNO↑ATIONă ATă ACADEMICă LE↑EL”.ă Serbian Journal of Management, 2013, No 8 (1), pp. 117 - 130, ISSN 2217-7159., Available on-line at www.sjm06.com/SJM%20ISSN1452-4864/8_1_2013_May_1_132/8_1_2013_117-130.pdf, [accessed August 2014].
RESITA network. Official web-site. http://www.resitanet.eu/index.php?id=2 [accessed August 2014].
SМСulteă Peteră (2010).ă “NetаorkТngă foră Innovation: Advantage and Benefit for the Regional Development”.ăJournal in Entrepreneurship and Innovation, Issue 2/2010. Available on- at http://fbm.uni-ruse.bg/jei/Issue-2010/01-2010-JEI-Peter-Schulte-Edited-Final-M.pdf. [accessed August 2014].
Start it SmКrt.ă Ruse.ă “DesМrТptТonă ofă tСeă КМtТvТtТes”.ă AvКТlКbleă on-line at http://www.ruse.startitsmart.com/. [accessed August 2014].
STRATENT.ă“AboutătСeăprogrКm”.ăPublТsСeНăКtăааа.stКrtent.eu.ăДКММesseНăAugustă2014].ă YorНКnovК,ă DКnТelКă (2010).ă “CreКtТonă ofă relКtТonship between universities and industry (the
МКseăofătСeăUnТversТtвăofăRuse)”.ăProceedings from UNIversite dans la SOciete, UNiSO 2009, L’insertion professionnelle des étudiants, Amiens, France, SCRIB, 2010, pp. 120-130, ISBN ISSN 2068-7168.
Wissema, J.G. (2006). Technostarters and the Third Generation University. Published in Bulgarian language at the Publishing House of tСeăUnТversТtвăofăForest,ăSofТК.ă(В ,ă.ăă х ă ă ъ ă ă ă ).

272
ECONOMIC GLOBALISATION AND ITS EFFECTS ON THE
SOCIAL ENVIRONMENT OF ROMANIA
IonăPETRIC 1
ABSTRACT Economic globalisation is that ″something″ people believed and still believe they
absolutely need. There are many things beneficial for mankind that have developed and got uniformed due to globalisation. If until now theologians, philosophers, thinkers have been bringing harsh criticism against economic, political and social-cultural globalisation, today we can see that globalisation could be a failure not only from the political or socio-cultural perspective, but also from an economic viewpoint. Prestigious economists, Nobel prize winners for economy will be mentioned in this paper , who treat the economic deficits of the world due to globalisation in a scientific manner, focusing on the possibilities of huge winnings as a result of financial speculations. The paper will deal with the effects of economic globalisation on the world’s social environment and especially on the social milieu in Romania. One of the great issues of Romania largely due to an economy in transition is the institutionalisation of children. Our research highlights the negative effects of economic globalisation in Romania exmplifying with the fact that children’s institutionalisation is made on a relatively large scale, and the State, in partnership with the Church, intervenes for the improvement of this effect on the Romanian social environment.
KEY WORDS: globalisation, economy, state, church, social commitment JEL: F60 1. INTRODUCTION Man has attempted to discover and achieve much along history. The discoveries
of science were welcome. But for several hundreds of years man has attempted to ″overМomeăСТmself″.ăMКвbeăСeă ТntenНsă toăsСoаătСКtăСe,ămКn,ă Тsă Тnă fКМtăКă″supermКn″.ăAbout globalisation (especially the economic aspect) there are interesting essays to read, direct blunt approaches referring to the crisis of human identity, works on the issue of globalisation and of religion, on Orthodoxy and globalisation, on the spiritual globalisation dimension, on mondialisation, globalisation and universality etc. (cf. PetrТМ ă (2010)).ă TСeă probКbТlТtвă tСКtă tСeă begТnnТngă ofă tСeă tСТrНă mТllennТum could МoТnМТНeă аТtСă mКn’să rebТrtСă аСenă Сeă fТnКllвă unНerstКnНsă tСКtă ″tСeă НТsМoverвă ofă tСeăpersonăКnНăofătСeăneeНăforăСТsăorăСerăТntegrКtТonăТnăКăМommunТtвăofălove″ă(YКnnoulКtos,ă(2003), p. 25) becomes crucial and represenst everything.
One of the many definitions given to globalisation in a dictionary of sociology reКНs:ă ″TСeă proМessă bвă аСТМСă tСeă lТfeă ТnsТНeă НТfferentă SOCIETIESă Тsă КffeМteНă Тnă Кnăincreased measure by international influences due to a multitude of factors, from the political and commercial connections to music, clothing styles and common mass-meНТК″ (Johnson (2007), p. 173). According to the same author, the most powerful form 1 LeМtureră PСD,ă FКМultвă ofă SoМТКlă SМТenМes,ă UnТversТtвă ”EftТmТeă Murgu”ă ofă ResТ К,ă
Romania, [email protected]

273
of globalisation is probably the economic one, although the political and social-cultural sides are to be seriously taken into consideration. Still, in economic globalisation, planning and control are amplified up to planetary dimensions, turning the entire world into a source of labour, raw materials and markets (Stiglitz (2005)). When businesses are operated on the local level, the issues related to labour, raw materials or other goods procurement and transport and sale of finite products are all solved in the same social frame, without major macro social involvement. In exchange, in a globalised economy the trans-national, multinational, international corporations etc. operate in a multitude of countries and exploit the diversity of local conditions in their own interest (Johnson (2007)).
The migration of trans-national corporations is of high interest nowadays, because, for instance, countries such as India, China, most Asian states, have very much to gain from the creation of jobs and implicitly from the GDP growth in these countries. In fact, China, in this variant, has become the second economic power in the world. This migration of multinational corporations may create a social instability in economically strongly developed and powerfully industrialised countries. If for instance the workers in a richer industrial society go on strike in order to improve labour conditions, a trans-national corporation can simply relocate its activities to another country, where workers are more docile and have a lower expectation level. In order to realise such a geographic transfer of these companies, an equally important investment should be performed especially in relation with human resources.
What is interesting is that due to these migrations of trans-national corporations, the stress no longer falls on human resources management, but on the human capital mКnКgement.ă ″Human capital defined as an individual characteristic, a combination between the generic inheritance, education, experience and attitude towards labour and life in general, is important for organisations, as it represents a source of innovation and strategic reТnventТon,ă ТrrespeМtТveă ofă tСeă sСКpeă Тtă tКkes.“ă (↑сrg ă (2007),ă p.ă 90).ăEmployees, in this era of economic globalisation, must dispose of abilities, attitudes and knowledge, because they are to work in a changing environment (especially organisational change) and of permanent replacement of the entire labour process; which ТnăfКМtăСКppensăаТtСătСeseăorgКnТsКtТonКlă″sСТfts″.ăTСeăСumКnăМКpТtКlămКnКgementămeКnsăan alignment between individual and organisation, so that powerful organisations could be born. The employee should be modelled to receive the power to adapt to the new innovations and to the development of the short-time technical process.
In service businesses, such as banking and insurance, a shift like that may take place by a mere transfer of data and instructions from one computer to another. EverвtСТngă tКkesă plКМeă КММorНТngă toă Кă аellă estКblТsСeНă ″аorlНă sвstem″ă (Wallerstein (1992)). The entire world will be turned into a labour process where one aims at the fastest technical progress possible at tСeăloаestăМosts.ăTСТsă″globКlăsвstem″ăforаКrНeНăbвăImmanuel Wallerstein in the `70s, refers to diverse and complex relations setting the world countries in an international economy that will eventually trigger issues related to the distribution of wealth, power, resources etc. among countries. It will destabilise very much the form of public institutions, labour conditions and will increase social inequality (Stiglitz (2008)). Man becomes an instrument, maybe a piece of equipment who, next to a high-performance computer, has the possibility to move, reason and even get the motivational satisfaction of what he does.
″In the economic field, globalisation appeared as a long one-way process of the European economic system extension to the rest of the world (giving birth to the so-called

274
world economy). Nevertheless, the internationalisation of markets and especially of financial flows due to telemetric technologies triggered a very close interdependence of all geographic zones and of all economic sectors.“ă(EnМвМlopКeНТК…ă(2004),ăp. 398). From a wider cultural perspective one may claim that if in a first stage globalisation corresponded to an expansion of western lifestyles and values, today it is absolutely no longer possible to assign liberalisation a certain direction. In other words modern globКlТsКtТonăаКsăТnăfКМtăКă“→esternКlТКtТon”ăofătСeăаorlН.
2. GLOBALISATION AND ITS IMPACT ON GLOBAL ECONOMY. THE
″WHITE AND BLACK ″ ACTION There are voices advocating the positive effects of economic globalisation. In
eбМСКnge,ătСereăКreăpeopleăаСoăТnsТstentlвăСТgСlТgСtătСeă″НКrk″ăsТНeăofăglobКlТsКtТonăКsăregards world economy. In our introduction we have already referred to both aspects: ″аСТte″ă КnНă ″blКМk″ă regКrНТngă eМonomТМă globКlТsКtТon.ă TСus,ă globКlТsКtТonă Мomesă Тnămany faces and takes numerous forms. For us economy means both a white game, i.e. what takes place legally, and a black game, which proves that along with this economic liberalism, many transactions and commercial exchanges take place in what we call ″unНergrounНă eМonomв″.ă Ină tСeă trКНТtТonКlă vТsТon,ă bвă teМСnologТМă Нevelopmentă tСeăworld has become smaller and thus a global market appeared. Capital, goods and labour market – and especially capital markets – are all more and more globalised. This perspective explains globalisation as being the unrestricted flow of goods and people, as well as the opening of new markets. (Bonino (2007)).
The occurrence of the global free trade created the foundations of open world markets. For them to take shape the existence of a trade network between regions and countries was necessary. During the post-war period, trade became more extensive than ever, along with the development of a world network of commercial connections between regions and countries. Nierop (The League of Nations) indicates that until 1990 most states were involved in trade operations with most of the others. Today, all countries carry on international trade, except the special case of North Korea, and make transactions with a significant proportion of their national income. Around 20% of the world output is commercialised and a much higher proportion potentially constitutes the object of international competition: commercial operations have reached an unpreМeНenteНă levelă botСă Тnă Кbsoluteă vКlueă КnНă Тnă relКtТonăаТtСăаorlНă output.ă ″TrКНeărepresents an essential mechanism of merchandise circulation and more and more services all around the world, being also the central link of its technological transfers. It is meant to connect internal and international markets, whereas, as history shows, the opening of national markets for trade has many radical effects, triggering new competitive forces and transforming domestic economies. If in the past the trade sector used to constitute an enclave mostly isolated from the rest of national economy, at present it represents a part of the structure of national production in all modern stКtes.“ă(Held et al., 2004, p. 179).
Alongă аТtСă suМСă Кă lТberКlТsКtТonă ofă МommerМe,ă tСeă МompКnТes’ă restruМturТngăproblem is raised. Post-modern society is largely based on services, which means that some industrial giants will disappear. Industrial society regarded the issue of commerce from a completely different direction. The industrial revolution brought about new consequences, one of them being the strong dislocation of population from residential areas to jobs sometimes located at very long distances. Due to industrialisation,

275
urbanisation started in force, most inhabitants of a country live in the urban area, because, as a consequence of globalisation, the countryside is losing more and more of its economic and cultural importance. In the plane of the organisation of relations among people and groups national states are born. Socially, one remarks the affirmation of inequity phenomena at the beginning of industrial society and then, along with the considerable growth of abundance, this inequity has decreased. As social organisation, specific to industrial society, it is the interdependency among institutions.
In 1973 Daniel Bell forwarded a new concept about the passage to a new type of society. In his book The Coming of Post-Industrial Society he formulated the concept of post-industrial society, defined by five features:
1. Passage from an economic activity focused on the production of tangible assets to a service-based economy;
2. Preponderance of the professional and technical class in the structure of active population ;
3. Decisive importance of theoretic knowledge as source of innovation and management;
4. Orientation toward technology implementation and training; 5. Apparition of new intellectual technologies. (Bell, 1973). The post-industrial society transferred a large part of the production process to the
consumer, who ″Тsă eбpeМteНă toă МontrТbuteă toă tСТsăperformКnМeă foră free“ă (OrТoăGТКrТnТ,ăPatrick M. Liedtke (2001), p. 123).
Economic and technologic globalisation created not only new life standards, but also a significant reduction of the spaces having separated people from divergent parts of the world through traditional territorial frontiers (Jones (2000), pp. 9-10). Goods and services that were traditionally accessible only in rich countries are now accessible in the third world. Progress in the means of transport by air, land and sea has rendered travels from one side of the world to the other more rapid and financially affordable. ″AММorНТngă toă Кă 2003ă reportă ofă tСeă InternКtТonКlă MТgrКtТonă OrgКnТsКtТon,ă oneă Тnă 36ăpeople in the world is a migrant. Modern communication technologies also change the subjeМtТveăperМeptТonăofătТmeăКnНăspКМe,ăgenerКtТngăКăperМeptТonăofă″globКlăvТllКge″ăКnНăallowing the free flux of ideas and information beyond territorial, cultural and social borНers.“ă(Ludford, Warner (2007), pp. 124-125).
The challenge is to consider globalisation not only on the economic level and the benefits it has brought about or could bring, but on its other important sides, such as the socio-cultural dimension. Volens nolens we will consider globalisation a process where soМТКlăТnequКlТtвăgetsăКММenteН,ăКММorНТngătoăLКrrвăRКв’săopТnТonăeбpresseНăТnăСТsăbookăGlobalization and everyday life.ă ″InНeeН,ă аeă mКвă Кrgueă tСКtă globКlă moНelsă ofăТnequКlТtвăСКveă lКrgelвăbeМomeăpolКrТseН.“ă (RКвă (2007),ăp.139).ăFurtСermore,ăPТeterseăclaims that there is a great focus on poverty, which is relatively a depolitised concept requiring technical solutions and a low focus on inequality, bringing forward the fundamental relations between power and classes. A drop in the absolute poverty level may occur along with the increase of inequalities, so it is possible to create divergent trends. Pieterse claims that КătСТrНăofătСeăаorlН’săpopulКtТonălТvesăonălessătСКnă1ă$/НКвăand that 2.8 billion out of 6 billion live in poverty (earning less than 2 $/day). According to the United Nations (for 1998), the richest 20% people in the world own 80% of the world wealth, whereas the poorest 20% own only 1%. This distribution represents a relative growth of inequality starting with 1960, when the share of the income received by the richest 20% was of 70% and the poorest 20% received only 2.3%. The rich / poor

276
ratio in the world in this entire period increased from 30:1 to 61:1, so that in 1991 85% of the world population received 15% of the world income (Pieterse (2004)).
Graph 1. Wealth and its distribution in the world Source: UN Development Programme 1998
3. NEGATIVE INFLUENCES OF ECONOMIC GLOBALISATION
THROUGH POVERTY EXPANSION Some persons, groups or political forces are opposed to globalisation. They
protest against its gaps. In their opinion, globalisation benefits and opportunities remain concentrated in a relatively small number of countries and are inequitably distributed inside them. Moreover, they claim that in the last decade a misbalance has occured between the success of the efforts to create and apply strong laws meant to facilitate the expansion of global markets, on the one hand, and the delay of preoccupations for social objectives that are equally valid, such as labour norms , environment, human rights or reНuМtТonăofăpovertв,ăonătСeăotСerăСКnН.ă(PetrТМ ă(2012)).
Failures are rather substantial and they have affected also the economic side. For instance not only the liberalisation of trade, but of the other economic aspects of globalisation, the apparently well-intentioned endeavours that often failed. When for example projects destined to agriculture or infrastructure, recommended by the West, elaborated with the support of western consultants and funded by the World Bank or some other body fail, the poor population of the developing countries still has to return the loans, except the cases when the debts are erased in one form or another. ″In too many situations the benefits of globalisation were less than its supporters claim, the price paid was much higher, because the environment was destroyed, the political forces have been vitiated, and the rapid pace of changes has not allowed countries to adapt to the new system of values. The crises that brought about a significant growth of the unemployment were followed in their turn by the longer-termăТssuesăofăfrКgmentКtТon.ă“ă(Stiglitz (2005), p. 36). The deception of the free trade is well hidden; it is difficult to seize the connection between the misery and desperation of the many ″МСКТneНă toă tСeălКnН″ă КnНă tСeă freeНomă ofă tСeă feаă КnНă mobТle,ă fromă tСeă reportsă КrrТveНă fromă tСeă″globКlТsКtТon″ă lКnНs.ă Ită seems,ă onă tСeă МontrКrв,ă tСКtă tСeă tаoă pСenomenКă belongă toăseparate worlds, each with its distinct causes. Those reports never let us realise that fast
Wealth and its distribution in the world
80%
10%6% 3% 1%
0%
10%
20%
30%
40%
50%
60%
70%
80%
90%
first 20 % richest
people in the
world
next 20% richest
people
next 20% next 20% 20 % poorest
people

277
enrichment and rapid ТmpoverТsСmentă Мomeă fromă tСeă sКmeă root,ă tСКtă tСeă ″СomeăbounНТng″ă ofă tСeă mТserКbleă Тsă Кă resultă ofă globКlТseНă tensТonsă Кsă legТtТmКteă Кsă tСeăunlimited freedoms of the rich (just as nobody would guess from sociologic analyses tСКtătСeăСoloМКustăКnНăotСerăgenoМТНesăfeelă″КtăСome″ăТnămoНernăsoМТetв,ălТkeăeМonomТМ,ătechnologic, scientific and life standard progress) (Bauman (2005)). In 1996, a Report of Human Development presented at the UN, showing that the total wealth of the first 358 аorlН’săbТllТonКТresăТsăequКlăаТtСătСeăМumulКteНăТnМomeăofătСeăpoorestă2.3ăbТllТonăpeopleă(45% of the world population, surely valid for that period), Victor Keegan, in an article published in The Guardian, called this new regrouping of world resources ″КăneаăfromăofăСТgСаКвă robberв″.ă Ină fКМt,ăonlвă22ă%ăofă tСeăplКnet’săКssetsăbelongă toă tСeăso-called ″НevelopТngăМountrТes″ăТnăМСКrgeăofătСeăfКteăofă80%ăofătСeăаorlНăpopulКtТon.ăăAnНătСeăcurrent polarisation has definitely not reached its limit, as the global income allotted to the poor is still low: in 1991, 85 % of the world population received only 15 % of the income reserved to it. Nothing unusual then that those tiny 2.3 % of the global assets, owned by the 20 % of the poorest countries thirty years ago, had dramatically and steeply dropped to 1.4 %. An overwhelming number of 2.3 billion people, 45 % of the global population (in 1996), represented the poor of this world, compared to the 358 billionaires whose incomes were equal to those of half the globe’săpopulКtТon.ăă
4. ECONOMIC GLOBALISATION AND ITS EFFECTS ON POST-
COMMUNIST COUNTRIES Globalisation represents a historic and irreversible process of social development,
determined by a multitude of factors such as technology, market economy, liberalisation. ″Undoubtedly, the globalisation phenomenon, by its modern forms of manifestation, directly influences the social work and assistance systems: modern management and infrastructure, global communication networks, high-performance human capital and expertise, new social issues and implicitly new categories of beneficiaries. ″ (Buzducea (2009), p. 29). The globalisation phenomenon is not totally new, as when it comes to social development it has appeared in distinct patterns and successive stages along civilisatТons.ă ″Itsă moНernă from startsed to manifest itself explicitly at the end of the Cold War, when the geopolitical restructuring imposed a global interdependency and a fast pace of social changes. Consequently, globalisation represents the expression of new economic, political, social, cultural and even military НвnКmТМs.“ă(ZКmfТr,ăSt nesМu,ăeНs.ă(2007),ăp.ă282).ă
The first era of globalisation and world financial capitalism was destroyed under the successive blows of the First World War, the Bolshevik Revolution and the Great Depression, which combined to fracture the world both physically and ideologically. ″TСeăНТvТНeНăаorlНăresulteНăКfterătСeăSeМonНă→orlНă→КrăаКsătСenăfrozenăТnăplКМeăbвătСeăCold War. The Cold War was itself an international system, which lasted from 1945 until 1989, when, along with the fall of the Berlin Wall, it was replaced by another sвstem:ătСeăneаăerКăofăglobКlТsКtТon,ătoНКв’săаorlН.ăLet’săМКllăТtă″globКlТsКtТonă– round tаo″.ăItăresultsătСКtătСeă75-year period between the start of the First World War and the end of the Cold War was only a long time out between one globalisation era and the neбt.“ă(Karin Riis-Jorgensen et al., 2007, p. 197).
After the fall of the Berlin Wall, in part of Central Europe and especially Eastern Europe, in the former Soviet Union, but also in its satellite states, the hope for democracy and economic prosperity was born. The West rushed towards Eastern Europe to guide the

278
respective states during transition. Many erroneously believed that a ″sСoМkătСerКpв″ăаКsăneeded, that transition to western-style capitalism should take place briskly, by a fast privatisation and liberalisation. The sudden liberalisation of prices determined – in a predictable way – СвperТnflКtТon.ă″AtăКăМertКТnămoment,ăprices in the Ukraine increased by 3,300 percents in one year. In order to stop hyperinflation rigid monetary policies were used (high interest rates and small credits) along with fiscal austerity (restricted budgets); moreover, these measure destabilised economies, which fell into serious recessions and depressions. In the meanwhile, rapid privatisation facilitated the transfer of hundreds of billions of dollars representing some of the greatest assets of the country, creating a new class of oligarchs who took the money out of the country in faster rhythms than that of the afflux of billions granted by IMF as support. The capital markets were liberalised, in the hidden hope they would attract money.ă“ă(Stiglitz (2008), p. 46).
Romania was in the same situation. The gap between the few who grasped the resources and those who fell down to the poverty threshold and lower was (and still is) rКtСerălКrge.ăRomКnТК’săeМonomТМăreМoverвăТsăstТllăunsКtТsfКМtorвăТnăsoămКnвăаКвs.
5. ECONOMY AND SOCIAL ISSUES IN ROMANIA AND THE PATTER N
INTERVENTION OF STATE AND CHURCH IN SOCIAL WORK AND ASSISTANCE
Economic and social issues, both European and general international, influence
Romanian society. Definitely, most people asked themselves: Does economic globalisation represent welfare, inadequacy or degradation of social life? We wonder also about the economic and social life in Romania: after twenty-five years since the fall of communism, have the forms, processes, ideologies set Romania on a path of economic and social welfare or do we have, in fact a degradation of social life in its entirety? They always talk of the importance of strengthening the middle class so that society could be stronger. However things seems to have taken a totally different trajectory.
This chapter of our research presents not particularly data related to life quality in RomКnТК,ănorăstКtТstТМsă КboutăourăМountrв’ă eМonomв,ăbută rКtСeră Кă surveвăprovТngă tСКt,ăchallenged by the social environment degradation, the state and Church become complementary in the fight for its eradication,.
One of the most sensitive issues of the Romanian social environment was that of the institutionalised children. High efforts were made starting with the years after the 1989 moment, that the negative image of the institutionalised children in Romania, broadcast around the globe, should be deeply changed. Fortunately, the life of the institutionalised children in Romania has radically changed, but unfortunately some Romanians still entrust their children to child protection institutions.
Largely, due to Romanian economy, when it comes to children institutionalisation and their labour exploitation, the institutions of sociologic research, all those who carefully analysed this phenomenon among children in Romania have reached the following conclusions regarding causes: Low life standard (poverty); Misbalanced relation between active and inactive population; Governments’ăeМonomТМăpolТМТes,ătolerКntătoătСeăМСТlН’sălКbourăeбploТtКtТon; Lack of quality education; (ANPDC, 2006).

279
The final conclusion is: In Romania, the main cause of child institutionalisation and labour exploitation is poverty, in other words we are still in a transition economy.
For this social effect in Romania due to economic globalisation, we chose as research topic the intervention of the State and Church in partnership in the field of child protection. The main purpose of the research was:
Main purpose: Highlighting the specificity of the interaction between Church and State through the practice of social work in the field of child protection and the influences of economic variables on the social environment in Romania.
Work methods and techniques: biographic analysis, social documents analysis, participative observation, psycho-social inquiry, economic statistics.
Limits : due to the low volume of items in the questionnaire applied in all DGASPC of Romania a wider interpretation of the research remains necessary; it will be rather difficult to reach an exhaustive treatment of the topic forwarded for research.
In order to conduct such researches, we had in mind a relation between the General (County) Decisions of Social Assistance and Child Protection (DGASPC) and the Churches (Metropolitan bishopries, archbschipries, episcopates) represented in the respective county. Consequently we conducted an inquiry in the institutions and took into account the 41 counties of Romania, plus the 6 Bucharest districts, where, in the local administrative apparatus, there is a child protection body. Thus, we collected data from the 47 DGASPC divisions.
Hypothesis: InătСeăМonteбtăofăRomКnТК’sătrКnsТtТonăeМonomв,ătСeăТnМТНenМeăofătСeăpartnership and involvement of the Church with its values in the activity of the Child Protection Divisions is significant.
Data graph presentation
Graph 2. Presentation of the research data Interpretation of data According to the data of our investigation, we have a significant relation between the
State and the Church institution as regards the protection of the institutionalised child. This is validated by the percentages recorded in relation with the presence of priests within the
employee; 28%
volunteer; 42%
nicio legătură; 30%
partnerships; 62%
mere
collaborations; 36%
no collaboration;
2%0%
10%
20%
30%
40%
50%
60%
70%
Relation priest-DGASPC Relation DGASPC-Local
church
Relation Church -State as regards institutionalised children in Romania
employee
volunteer
no relation
partnerships
mere collaborations
no collaboration

280
DGASPCsăbвăНТreМtărelКtТonă(tСeвăКreătСeăDТvТsТon’săemploвeesăТnă28%ăofătСeăМountТes)ăКnНăindirect connection (volunteers in 42% of the counties). As regards partnership, it is either formal (in 62 % of the counties), or informal (32% of the counties) and only 2% of the divisions reported a total absence of collaboration. Consequently, our hypothesis is confirmed that in a country with transition economy, in a globalisation era where the gap between social classes still triggers social issues among families with children, the State and the Church are viable partners for the intervention in the Romanian social environment.
6. CONCLUSIONS
When we analyse the results of the international research conducted by
prestigious sociologic institutes, we are in the dark when it comes to the dilemma whether globalisation has brought only welfare or is a total social inadequacy or , wors, it is a process ofătotКlăНegrКНКtТonăofăаorlН’săsoМТКlălТfe.ăGlobКlТsКtТonăСКsăsometСТngăofăeach (welfare, inadequacy and degradation). All information collected in this paper strengthen our idea that economic globalisation has a major impact on the social environment throughout the world, and surely in Romania also. We consider that our research related to the negative effect to poverty on children and the institutionalisation show that the bilateral involvement and commitment of the Christian Church and of the State is fruitful and beneficial. Both Europeanisation and especially globalisation are processes largely contested by the Christian Church, especially by the Orthodox Church. This accelerated pace of globalisation might not constitute in se a deadly threat for history and culture but unfortunately it is not singular. In parallel, we find that the multitude of standards has grown at a progressive rate. It is not standards that grow, but simply the pace of their development.
We are aware of the graphs describing the change of the world economy configuration in time. We also saw the graphs related to the accumulation of the substances polluting the environment, to energy consumption, and different graphs for other dimensions. They all have the same shape; they start almost horizontally, and in time they all go up, to reach in the end, nowadays, a steep vertical direction. ″Especially in the area of financial economy directly related to globalisation and promoting it, we could signal many odd realities, especially in relation with the ТmmeНТКteă pКst.ăMoreă preМТselв,ă tСeă "tСermometer″ă ofă tСeăаorlНă eМonomв,ă tСeă ăDoаăJones indicator of the New York Stock Exchange, with the evolution it exhibited between 1900 and 2000, precisely follows the shape we described: a graph permanently МСКngТngăТtsăslopeăКnНăgoТngăКlmostăvertТМКllвătoаКrНsătСeăpeКk.“ă(MКntzКrТНТsă(2002),ăpp. 29-30).
REFERENCES BonТno,ăE.ă(2007)ă„LТberКlăНemoМrКМвăКnНăglobКlТsКtТon“,ă Тnă→Кtson,ăG.ă&ăDurrКntăK.ă(eНs.),ă
Liberal democracy and globalisation (translation into Romanian), Bucharest: Ziua Editions: 47-53.
Bell,ă D.ă (1973)ă „The Coming of Post-Industrial Societв:ă Aă ↑entureă Тnă SoМТКlă ForeМКstТng“.ăLondon: Heinemann
BКumКn,ă Z.ă (2005)ă „GlobКlТsКtТonă КnНă Тtsă soМТКlă effeМts“ (in Romanian). Bucharest: Antet Editions

281
CuТlenburg,ă J.J.ă vКnă &ă SМСolten,ă O.ă &ă Noomen,ă G.→.ă (1998)ă „SМТenМeă ofă МommunТМКtТon“ (translation into Romanian). Bucharest: Humanitas
„EnМвМlopКeНТКăofăpСТlosopСвăКnНăСumКnТtТes“ (2004) (in Romanian). Bucharest: ALL Editions GТКrТnТăO.ă&ăLТeНtkeă PКtrТМkăM.ă (2001)ă „Dilemma of employment and the future of labour,
Reportă toă tСeăRomeăClub“ă trКnslКteНă ТntoăRomКnТКnă КnНă eНТteНă bвă ăAgnesăGСТbu Тu,ăBucharest: ALL BECK Editions
Held, D. & McGrew, A. & Goldblatt, D. & Perraton, J. (2004) „Global changes / Politics, eМonomвăКnНăМulture“ (translation into Romanian). IКşТ:ăPolТromăEНТtТons
JoСnson,ăA.ăG.ă (2007)ă „The BlКМkаellăDТМtТonКrвă ofă soМТologв“ (translation into Romanian). Bucharest: Humanitas Editions
Jones,ăR.ăJ.ăB.ă(2000)ă„TСeă→orlНăTurneНăUpsТНeăDoаn?ăGlobКlТzКtТonăКnНătСeăFutureăofătСeăState. Manchester and New York: Manchester University Press
Mantzaridis, G.ă I.ă (2002)ă„GlobКlТsКtТonăКnНăunТversКlТtвă /ă МСТmerКăКnНă trutС“ă (ТnăRomКnТКn).ăBucharest: Byzantine Editions
KeegКn,ă↑.ă(1996)ă„HТgСаКвărobberвăbвătСeăsuper-rТМС“.ăInăThe Guardian, 22-July-1996: 23 PetrТМ ,ăI.ă(2010)ă„TСeăМonМeptăofătСeăsoМТКlăМommunТonăfeelТngăТnăAlfreНăAНler’săМonМeptТon“,ă
2nНăeНТtТonă(ТnăRomКnТКn).ăTТmТşoКrК:ăNepsТs/EurobТtăEНТtТons PetrТМ ,ăI.ă(2012)ă„TСeăМСurМСăКnНăsoМТКlăаorkăТnăRomКnТК“.ăIКşТ:ăTСeăEuropeКnăInstТtute Pieterse, J.ăN.ă(2004)ă„GlobКlТzКtТonăorăEmpТre?“.ăNeаăYorkăКnНăLonНon:ăRoutleНge RКв,ăL.ă(2007)ă„GlobКlТzКtТonăКnНăeverвНКвălТfe“.London, New York: Routledge StТglТtz,ăJ.ăE.ă(2008)ă„MeМСКnТsmsăofăglobКlТsКtТon“ă(trКnslКtТonăТntoăRomКnТКn).ăIКşТ:ăPolТromă
Editions StТglТtz,ă J.ă E.ă (2005)ă „GlobКlТsКtТonă /ă Сopesă КnНă НТsТllusТon“ă (trКnslКtТonă Тntoă RomКnТКn).ă
Bucharest: Economic Editions ↑сrg ,ăD.ă(2007)ă„ReМruТtmentăКnНăseleМtТonăprКМtТМes“.ă Ină tСeăeН.ăZoltКnăBogКtСвăManual of
techniques and methods in labour and organisational psychology,ă(ТnăRomКnТКn).ăIКşТ:ăPolirom Editions: 90-121
YКnnoulКtos,ă A.ă (2003)ă „OrtСoНoбвă КnНă problemsă ofă МontemporКrвă аorlН“ (in Romanian). Bucharest: Byzantine Editions
→КllersteТn,ăI.ă(1992)ă„MoНernăаorlНăsвstem,ăМКpТtКlТstăfКrmТngăКnНăorТgТnsăof European world eМonomвă Тnă tСeă 16tСă Мenturв“ Vol. II , (translation into Romanian). Bucharest: Meridiane Editions
*** TСeăNКtТonКlăAutСorТtвăforătСeăProteМtТonăofăCСТlНren’s’ăRТgСtsă(2006)ă„RoleăofăprТestsăТnătСeăprotection and promotion of children's rigСts“.ăBuМСКrest:ăTreТ.

282
METHODS OF ANALYSIS AND QUANTIFICATION OF RISK IN LENDING
Ionela PETRUSE1
ABSTRACT In the banking world, many risks have an impact on profitability. These multiple
sources of risk increase the number of economists definitions for banking risks. In this universe where quantitative risk management becomes a very important function, generic concepts are increasingly used. Different types of risks must be carefully defined, and these definitions are the basis for quantifying risks and implementing effective management of them.
KEY WORDS: capital, capacity, Cash flow, credit, analysis
JEL: G30, G31
1. INTRODUCTION Credit risk management involves taking into account two main aspects:
•ăМustomerăМreНТtărТsk; •ăCreНТtărТskătСrougСoutăthe bank's loan portfolio. 1. ONE INDIVIDUAL CREDIT RISK
Possibilities of individual credit risk measurement are structured on three levels of analysis: - Transaction-level; - At the client; - The level of security (collateral).
Granting a loan can generally be described as the process by which a certain amount is borrowed a potential borrower performing certain activities, accept financial risk is the possibility that the entity / person to be unable to pay future obligations.
Credit analysis is the process of assessing credit risk (the debtor's insolvency). For each new application for credit should compare costs with gains, both in terms of quality, and quantity.
Quantitative analysis leads to substantiate an objective decision on the bank's exposure to risk. It is based on a series of specific activities such as gathering, processing and interpreting information about the customer, the bank may provide information (financial data analysis, the future development of the business outlook, assessment of repayment capacity through analysis of revenue and expenses, assessing the ability of the debtor to deal with unexpected situations). Qualitative analysis involves Stinger and update all information related to the financial responsibility of the borrower, the real purpose of the loan was to determine, identify the risks they may face and the assessment of the seriousness of the debtor and the debtor's involvement in meeting commitments to the bank.
1 LeМt.ăUnТv.ăНr.ă,ă“EftТmТeăMurgu”ăUnТversТtв,ăRomКnТК.
283
Bank lending will engage relationships with customers whose creditworthiness has been established either by evolution previous relationships or through recommendations of reputable clients, some reputable banks or other sources acceptable to ensure the conditions for risk assessment based on:
1. CHARACTER - client's desire and determination to fulfill obligations under the loan relationship with the bank;
2. CAPITAL - ensuring an appropriate degree of participation of the client's own sources in economic activity and that object credit financing in order to share the risk in an amount acceptable to the Bank;
3. CAPACITY - managerial skills and the client's ability to produce income to honor obligations, as demonstrated by the results of past and projected through cash flow;
4. CONDITIONS - current financial and economic situation and future subramurii branch or part of the customer, taking into account the specific conditions of the market in which it operates;
5. Collateral - the existence of collateral that can be used to repay the loan, if the projected revenues are not realized.
It is considered that the main weaknesses in credit risk management are some internal order: improper selection of cases (interview inadequate, incorrect documentation, ignorance of the business, financial analysis inadequate, insufficient guarantee of the loan) and internal oversight inadequate quality evolution borrowers. These can be mitigated by a thorough assessment by classifying customers in terms of quality-based scoring, double endorsement of the decision to establish a margin lending and interest charged.
The advantages for the bank if loan application approval are: income from interest, bank charges, fees întocmire- file analysis, good market image, customer loyalty to the bank, establishing relationships with new clients, etc. Usually, credit analysis is: before the decision to grant credit, but bear in mind that the bank is not limited to providing credit, she aimed to have lasting relationships with the customer (debtor), it in turn altering -and permanent loan repayment ability. So credit analysis should be the permanent supervision, a process of continuous updating.
2. ANALYSIS OF LOANS TO INDIVIDUALS
In total banking loans to households (for housing and holiday homes to purchase cars for household and durable goods) have a small share. They assume, however, a high workload and expense.
Identification and credit risk analysis involves financing needs (demand justification credit check) and credit application analysis (evaluation of borrower quality assessed in terms of size and stability of income). The credit risk depends primarily default risk. Causes that may cause the debtor's insolvency are:

284
•ă objeМtТvesă - related to the evolution of the environment in which it operates; •ăsubjeМtТveă- take the character of the debtor, the extent to which he is willing to pay its obligations to the bank before others.
Bank protection to limit the causes that lead to the insolvency of the client shall be:
•ătСeăobjeМtТveăМКusesătСrougСăКnКlвsТsăКnНăforeМКstăeМonomТМăМonНitions, diversification of the customer base in terms of industry, diversification planning, establishment size and the rates of credit to be repaid by the size of the total net income of those persons; •ă foră МКsesă subjeМtă bвă trКМkТngă tСeă operКtТonă ofă tСeă accounts you have opened the company bank old customers, collateral and personal request. In terms of new customers, this information is not available, the bank being disadvantaged in assessing the quality of the customer. In this case analysis rests solely with the bank employee and requires a high dose of subjectivity, because these officials to not be accused of favoritism, tend to be extreme cautious. Thus, a significant number of customers will be eliminated due to lack of information.
Credit rating to determine the risk must consider the following: honesty and integrity of the applicant, the history of its relations with the bank, primary incomes and stability, job and residence, if the client's income sources are reliable present and future purpose for which credit is requested, the amount and nature of the other obligations of the client, external factors that can influence the client's ability to pay, the security.
3. ANALYSIS OF LOANS TO BUSINESSES
Risk assessment and management in the corporate lending process also involves analysis of need and demand for credit financing. Therefore it will go through the following steps: I. Analysis of loan repayment capacity analysis of non-financial Analysis of financial - economic activity II. Drafting the essay to promote credit file III. Negotiation, approval of loans and contracting credit IV. Tracking and checking on the credit I. Analysis of repayment capacity 1. Lichiditatea (Acid test) = Current assets (current) / Current Liabilities X 100 This report reflects the company's ability to cover immediate debts and is influenced by the quality of borrowers. It is generally considered that for a client, how liquidity is higher, the more risk that it will fail is lower. Liquidity is ideal if less than 100%. A level below 100% is a signal for the bank, because in bankruptcy possibilities of recovery of loans can materialize fully only by making stocks. 2. Solvency is the ability of the company to deal with financial obligations, namely to honor payments on due dates by making all of its assets. And in the analysis of solvency is calculated two indicators, namely: Patrimonial solvency indicates the degree to which the client provides paid share capital against loans and loans.

285
Solvency = Equity / Total liabilities (equity + debt TL, TM, TS) X100 patrimonial It is estimated that the minimum value of this ratio should be 30% and between 40% and 60% it is considered good. A value close to one of these indicators show that the company has no debt and equity supports his work. Indebtedness shows how the total value of the asset is covered by bank loans and debts to third parties. It is determined by the relationship: Indebtedness = Total debt / Total assets x 100 The indicator is positioned when the results are up to 50%. A value close to zero relative to the indicator shows that the operator owes little or none exist and patrimonial assets covered by its sources. A high level of this indicator is a warning sign that the company is undercapitalized. Funds flow analysis enables a better understanding of the movements that occur in the assets and liabilities in a particular period and their impact on liquidity position. The flow of funds indicate the sources from which the company obtained funds and how they were used during the study period. Trends resulting from the analysis of fund flows provide information about how the client has worked and are used under projections of flows of funds, provide information about the situation of the company in the future. Cash flow statements detailing the company's liquidity, showing movements of cash in each period analyzed and explained why there was variation between balance sheets reflected. It reflects a statement of receipts (inflows) and cash outflows (spending cash) in a given period. In preparing a cash flow to consider the following assumptions: reality forecasts provided by the client, there are limiting factors in determining prognosis (sales expected to be achieved in future macroeconomic forecasts, competition), the need to conduct a sensitivity analysis flow cash according to forecasts envisaged. The analysis involves the realism of their assumptions, given the tendency of the client to present a positive exaggerated projection of future development. Other funds flow statements explains the variations of elements of financial assets reflected in the balance sheet period. They provide information on the evaluation necessary funds future and whether this funding must be obtained from outside, risk analysis, fixed asset replacement cycle, evaluating default risk by the lending bank. The flow of funds based on the following variations, as shown in Table 1:
Sources of funds: Uses of funds:
decrease in assets asset growth
Increase in liabilities decrease in liabilities
The simplest form of flows of funds is illustrated in Table. 2:
Sources of funds: Uses of funds:
Decrease in receivables Growth of claims
Growth of suppliers Decrease of suppliers

286
Growth of capital Decrease of capital
Stocks lower Growth stocks
Growth of creditors Decrease of creditors
decrease of fixed assets growth of fixed assets
Decrease availability Increase availability
Profit net losses
amortization
Total sources Total use
* Depreciation is added to net income because it does not involve changes in the cash.
Regarding other situations projected flow of funds, it shall be based on past and projected financial statements and the assumptions on inflation, return on assets, investment in fixed assets and working capital.
Risk of damaging activity and the use of credit scores Success in lending is based on the quality of information, assessment, customer relationships and partnerships, and businesses operating in a national and global environment increasingly uncertain. Common causes of deterioration and bankrupcy activity are: •ă FТnКnМТКl:ă fТnКnМТКlă Мontrol,ă МКpТtКlă struМture,ă reservesă КnНă МКsСă floа,ă profТtКbТlТtв; •ăStrКtegТМăseleМtТonăаeКkăproНuМtămКrket,ăeбpКnНТngătooămuМСăКМtТvТtв,ăpoor marketing structure in the product market, inappropriate location; •ă OrgКnТsКtТonКl:ă InКНequКteă orgКnТzКtТonКlă struМture,ă knoаleНgeă mКnКgementăunbalanced, lack of staff collaboration.
Most Romanian banks using a scoring system based on the calculation of basic financial indicators debtor firms. Depending on their value are awarded points which are then added together to determine the score of the firm and to fit into a certain class of risk.
Banking methods used to assess damage to the company and / or bankruptcy, identify and analyze the specific features identified from bankrupt companies (late submission of financial information, explanations vague on the debtors / creditors, auditors and management change etc). II. Preparation essay on promoting credit file This report along with credit file will be presented to the Credit Committee and Risk analysis. Mentioned essay should include all the checking and a summary of the company's activity, purpose of the loan, etc.
III . Negotiation, approval of loans and contracting credit If the conclusions from financial analysis are favorable, the management negotiates with the borrower bank following:

287
a) loan volume settled on the amount of investment, own and drawn from sources that are to repay the loan and related interest. b) Period of credit determined by the period of realization of the sources of loan repayment and grace period (if any). c) Type of credit d) The amounts and timing of payment of loans fully established at a fixed or spread over the extent of acquiring or achieving investment objectives credited. e) The term of repayment of loans. Loan repayment shall be made in monthly or quarterly installments, as agreed between the parties. At the customer's request can be granted a grace period. f) The interest and fees will be negotiated between the parties at the conclusion of the credit agreement and will take into account the degree of risk of the customer. After credit approval, according to the competence, the banking unit with the customer, end, records and writes contracts for mortgage and / or security interest in territorial court, finalize and sign the credit agreement. IV. Tracking and checking on the credits is mandatory and made throughout the loan period, from the date of credit and repayment in full or until their release into the category of bad loans. They are performed by loan officers who conducted the analysis and proposed credit approval occasionally or whenever determined Appropriations Committee and aims: •ă tСeă useă ofă loКnsă КММorНТngă toă tСeă purposesă foră аСТМСă аereă КpproveН; Verification is performed using data from the accounts and those of the client account opened at the bank. If payments are found to be not conforming loan destination, then the bank warned in writing trader and asks him to reimburse misused. If the trader does not reimburse these amounts, the loan is transferred to the category of outstanding maturity, and will be recovered according to the procedure for recovery of bad loans. •ă evolution of the main economic and financial indicators and maintaining repayment capacity; Verification of main indicators are based on data taken from the financial statements. If the review results in a financial situation made recourse has been credited to the loan officer will proceed as follows: - If the operator does not have outstanding debts to the bank, the credit is tracked monthly on time to detect situations that can affect daily way of debt repayment; •ă КМtuКlă eбТstenМeă ofă tСeă guКrКnteeă МreНТtă (subject to credit); These guarantees are found throughout lending in the current assets of the company, checking them being made: Script financial accounting data of monthly trial balances and periodic accounting statements (balance sheet, profit tax declaration) factually on goods purchased in loans (stocks of raw materials, goods in process of manufacture, finished products, merchandise)
If it is determined whether the loan amounts committed were used to spending and inefficient activities or destination other than the approved, or that there is stock in another structure than the approved, they are considered less warranty. Minus the warranty shall be repaid in full or in part after the date of the finding, within the funds

288
available in the account, the differences of outstanding loans outstanding pass matured following to be recovered according to the procedure for recovery of bad loans. •ă tСeă eбТstenМeă ofă МollКterКlă КnНă Сoаă retentТon,ă preservКtТonă oră mКТntenКnМeă tСereof; •ă Сoаă МomplТКnМeă аТtСă аorkă rules and terms of bank credit agreements. •ăpursuТtăofăoutstКnНТngăМreНТtărТskăТsăКmТМКblвăorăbвăenforМement.ăForăТtăТsăНrКаnă"МreНТtăfile in difficulty". During the meetings that will take place between the client and loan officer, will analyze the causes that led to delay loan repayments and set options of repayment of the revenue to be realized from the business. If the customer fails to meet their commitment to the bank on repayment, I will submit a letter to be communicated to initiating the foreclosure.
4. CONCLUSIONS
Proposed risk management methods are reduced to a set of normative compliance in lending, liquidity, foreign exchange position, the system of decision-making, capital size, and a list of sanctioned operations and procedures. The main purpose of risk management recommendations is to correlate more pronounced capital requirements for risks assumed by banks. Guidelines on the management of banking risks, largely, are conditioned by the needs of supervisors and based on their extensive experience in the regulation of banking activity. The intention is to promote a more cautious approach on capital, which encourages banks to identify the risks to which they are exposed both currently and in the future, and to develop their skills to manage them. The specific feature is the flexibility and the potential development of the risk management system while gaining experience in our respective field. REFERENCES Cadrul revised International Convergence of Capital Measurement and Capital Standards
specific banking institutions (International Convergence of Capital Measurement and Capital Standards - a Revised Framework)
Web pages accessed and studied IUGA I., Rosca T., Currency and Credit, Risoprint Publishing House, Cluj Napoca, 2005. Directive 2000/12 / EC relating to the taking up and pursuit of the banking business of credit
institutions, published in Official Journal No L 126 of 26 May 2000.

289
RISK –PERFORMANCE RELATIONSHIP BANKING
Ionela PETRUSE1
ABSTRACT The banking system is a dynamic industry, complex and highly regulated.
International banking system is dynamic because banks are consolidated through mergers, acquisitions, and other banking companies on bankruptcy. Concentration banking sector has become a current phenomenon, while in Romania is in the process of expansion. In these circumstances, the banking world, many risks have an impact on profitability. These multiple sources of risk increase the number of economists definitions for banking risks. In this universe where quantitative risk management becomes a very important function, generic concepts are increasingly used.
KEY WORDS: risk, performance, liquidity, profitability, service credit JEL: G30, G31 1. INTRODUCTION The banking system is dynamic because banks offer products that compete with
non-bank firms, firms that provide financial services such as mutual funds, investment companies, leasing companies or securities companies. Another is buoyant due to technological developments that improve banking services (in terms of information, primarily). Secondly, the banking system is complex due to technical knowledge that must be mastered to understand financial instruments such as foreign exchange market, money and capital (derivative transactions) and modern systems for securing loans. The banking system is complex because it must manage the assets and liabilities of more structured, more elaborate.
Finally, the banking system is strictly regulated banking authority (National Bank) who is responsible for the operation of this system consistency very important to a country's economic vitality.. Different types of risks must be carefully defined, and these definitions are the basis for quantifying risks and implementing effective management of them.
In the context of risk-profitability relationship work aims to define and discover facets of an effective mechanism for managing credit risk. Customization techniques currently used in the Romanian banking system for credit risk management model are exemplified Romanian Bank for Development (BRD), banking institution with a reputation for solidity and experience in lending, the former investment bank. Some economists believe that the reason for the problems faced by banks are macroeconomic factors. They emphasize the importance of risk because risk management is the essence of banking and the main problem they face.
1 LeМt.ăUnТv.ăНr.ă,ă“EftТmТeăMurgu”ăUnТversТtв,ăRomКnТК

290
Other economists believe that risks whose occurrence causes a bank to become insolvent, depend on changes in the level of income provided to obtain and costs covered by revenues earned variation. From this perspective, we address issues related to the management of banking risks, the relationship they have with the bank's performance.
2. RELATIONSHIP RISK-BANKING PERFORMANCE
In the lingvistic sense, risk is the likelihood of an event with adverse consequences for the subject studied. Exposure to risk is the present value of all losses or additional expenses incurred by or could incur bank.
Risk in banking arises from a variety of sources. Risk classifications are multiple. Since any attempt by a bank to profit risky, a bank becomes inevitable goal to maximize profit while keeping the risk to an acceptable level.
Because depositors and shareholders attaches great importance to current income, banks have a clear preference for those models for obtaining profit showing a steady increase over time.
In terms of risk-return relationship, return on equity (ROE - Return On Equity) and change in return on capital (is the risk that the expected return on capital does not evolve as expected) are key.
Analysis of these two elements provides information risk management and management of revenue and expenditure.
Return on equity (ROE), in terms of efficiency, can be divided into: - Return on assets (ROA - Return on Assets); - The adequacy of capital (EM - Equity Multiplier or Leverage) called and indebtedness or capital structure.
Return on equity is determined by factors controllable banking and uncontrollable factors.
Controllable factors on which banks may act through specific levers are: the types of activities, operating income, loan portfolio quality, costs and planning maturity in the management of assets and liabilities.
Uncontrollable factors generally are represented by basic conditions of supply and demand that banks face.
For example, an uncontrollable factor is development costs due to fund raising and income from the interest earned on investments, is exposure to interest rate risk. Because the real interest rate variations are given anticipated variations plus unexpected changes, changes anticipated to be included in the portfolio management decisions regarding these risks. Correspondingly, only unexpected changes may affect the final values of return on capital.
The evaluation of ROE propose possible alternative ways of assessing the bank's profitability by measuring the interdependence of ROE, ROA and EM. Return on equity (ROE) measures profitability from the perspective of share holders, it provides a measure of bank profits in accounting terms per monetary unit of equity subscribed. Return on equity (ROE) is defined as: ROE = net income / environmental equity (1)

291
But for an eloquent analysis, return on capital pote be decomposed into return on assets (ROA) and the adequacy of CAPITAL (EM) is symbolically expressed by the relation: ROE = ROAxEM (2) Return on equity should not be confused with return on investments, measured by dividends and stock price. In turn, return on assets (ROA) measures the bank's profits per unit monetary assets. ROA is defined as the ratio of net income divided by average total assets, so it can be expressed by the relation: ROA = net income /total average assets (3) Finally, the adequacy of capital (EM) is the factor that makes a multiple of ROA ROE. The adequacy of capital (EM) is defined as the ratio of total average assets and average equity and is expressed by: Total average assets EM = -------------------- (4) Environmental Equity A deeper level of appreciation of the return on capital is the breakdown of the return on assets (ROA) in two components: * Profit margin (PM - Profit Margin) * Asset utilization (AU - Assets Utilization). Profits per unit profit margin reflects the total money income from operations. Profit margin (PM) is defined as the ratio of net income to total income (interest income + income from sources other than interest - charges, fees, expenses related to operations) is given by: PM = net income/ total income operations (5) Asset utilization (AU) expresses the total income from operations per unit of total assets monetary environment. Asset utilization (AU) is defined as the total income from operations and total average assets is calculated by the formula: AU= Total income from operations / Total average assets (6) At this level of analysis, return on assets is given by:
ROA = PMxAU (7) Thus, we estimate the final relationship for calculating return on capital: ROE = PMxAU x EM (8) * The bank's balance sheet (using averages)

292
> Average equity Equity under the laws of our country consists of: paid up share capital, reserve fund, the fund fixed assets, development fund and other funds from the net profit. > Total average assets Total assets is composed of cash and debt, financial assets (investments), the balance of loans and other assets.
3. ESTIMATE BANKING RISKS The risk management activity should always have in mind that any business involves risk, but the biggest risk is actually ignoring risk. Financial risk arises in any transaction operated bank. In any transaction the bank is exposed to a potential loss. The most important components are: transaction risk, operational risk, illiquidity, insolvency risk and market risk, as shown in Fig. One. 3.1. TRANSACTION RISK can be divided into two components: credit risk and price risk. 3.1.1 RISK OF CREDIT Fundamental risk that must be controlled to a bank, whose success or failure depends on its control is credit risk. As an extension, the term loan is common for any transaction of any kind, but is central to a bank. Most banks have a significant share of revenues from lending and investments in general, total revenues. In the simplest way, the credit risk can be defined: the risk that the business partner in a transaction not evolve under the terms and conditions of the original contract, this active holder causing financial loss. The example used to explain credit risk is the probability that the debtor will not repay. However, it is important to appreciate that exposure to credit risk extends to a wide variety of banking active, and issuing letters of guarantee, endorsements (for bills of exchange and promissory notes) operations, factoring, forfeiting, financing transactions international trade (opening letters of credit), money market instruments transactions, foreign exchange and capital (foreign exchange transactions, futures, forwards, options, swaps, transactions in securities). Nature of exposure to credit risk varies from activity to activity, and in many cases, the different stages of each activity. For some transactions (eg credit) înreaga amount of the transaction, including related interest, is the exposure to credit risk. For others (eg a forward exchange transaction), the exposure is usually limited to the difference between the negotiated price and the current price available in the market to fulfill the contract. At maturity, however, the forward contract has a short period of exposure for the entire amount of the transaction. As illustrated, the credit risk has two components: - The risk of the customer base (default), which is an estimate of the probability that a loss may occur in future; - Inherent risk of product sold by the bank, which is an estimate of the monetary loss due to customer difficulties.

293
Customer risk is composed of the following risks: - The risk of the client's business, evaluated the likelihood that it will not honor its obligations to the bank; - Country risk, assessed the likelihood that all or most of the traders in a country (including government concerned) not to honor its international obligations for the same reasons; - Risk transfer, assessed the likelihood that a country is unable or unwilling to service foreign debt meet through a period of disequilibrium exchange rates;
3.1.2. PRICE RISK The main constituent element of price risk to which a bank is subject to interest
rate risk, foreign exchange risk with risk coverage (in derivatives transactions). Interest rate risk is the result of financial intermediation. He represents the variation of return on capital a bank interest rate changes and expresses the possibility that interest rates to rise sharply while the bank holds assets with a maturity longer than liabilities. A measure of interest rate risk (DRR) can be given by the following expression:
sensitive assets DRR = ------------------- X 100 (9) sensitive liabilities where: Sensitive assets represent the value of assets with variable interest rates. Sensitive liabilities is the value of liabilities with variable interest rates. DRR has a high degree of dependence on market interest.
Exchange rate risk is defined as the probability that a variation (adverse) market exchange rate would lead to lower bank net profit. Value exchange risk is significant for all banks involved in foreign operations, both on their own account as well as customers. Regarding price risks, especially monetary and foreign exchange markets, risk coverage refers to how they are managed mainly for anticipating operations and currency hedging by specific methods, including the use of derivatives prevails (hedging).
3.2. OPERATIONAL RISK Risk efficiency of operations (operational risk, operational or risk of pregnancy)
the probability that the bank will not be able to meet customer demand for services cost-effectively. Operational risk can be assessed from two important perspectives. On the one hand, an operating perspective, which concerns: - Supply and quality banking products and services; - Quality compliance and banking specifications; - Organizing bank (number of divisions, branches, number of employees); - Professionalism (quality of the) staff; - Management's ability to assess and control costs related to these services.
3.3. LIQUIDITY RISK
Bank liquidity is defined as the ability of a bank to honor at a time, all requests for payments in lei and foreign currency.
At BRD, sources for liquidity are:

294
- Primary reserves (current account and the Central Bank's units opened at BNR, cash the cashiers); - Secondary reserves (deposits at other banks); - Tertiary reserves (securities that can be converted into liquid secondary market). Bank liquidity, both in RON and in foreign currency is considered very good to the extent that current account and cash availability of cashiers are reduced at or closer to the level of payments.
Liquidity risk (funding risk) expresses the probability of a situation where the bank is unable to finance current operations. It is the uncertainty that a bank's asset can not be sold in a certain period at a certain price.
Ensuring liquidity B.R.D. Bank liquidity is achieved by:
- Territorial units for cash in tellers in lei and foreign currency; - Central Bank by the Treasury Department, for the cash account opened at BNR and availability in currency current accounts correspondent banks. Treasury activity provides liquidity through the following ongoing activities: a) to work in lei: - Taking daily current account of the Central Bank, the balances (debit or credit) in current accounts of territorial units having current account with the central bank's branches; - Taking daily current account balance current county units (debtor or creditor) correspondent accounts opened by subordinate units to other commercial banks; b) Foreign currency activity: - Ensure readiness for daily payments, letters of credit use, provision of collateral deposits; - Ensuring transfers between banks; - Calculation of the sale and purchase foreign currency in order to ensure compliance with the foreign exchange position; - Sale of cash as required; - Drawing / placement resources according to the required or excess availability. Correlation tracking daily to avoid liquidity risk is: The indicators used in B.R.D. for liquidity risk management are shown in Table. One. purpose Management Indicator asset management (credit risk mitigation)
Total loans / Total placements •ă CreНТtă RТskă /ă TotКlă plКМements •ăDeposТtsă fromăotСeră bКnksă /ăTotКlă plКМements •ăGovernmentăSeМurТtТesă/ăTotКlăplКМements
asset liability management
Availability in current account customers / Total resources •ă DeposТtsă ofă Мustomersă /ă TotКlă resourМes •ă DeposТtsă fromă otСeră bКnksă /ă TotКlă resourМes •ă LoКnsă fromă B.N.R.ă /ă TotКlă resourМes •ă Oаnă funНsă /ă TotКlă resourМes •ă Netă LoКnsă /ă Мurrentă КМcounts and Resources
current short-term interest-bearing short-term liabilities bear interest PURTA|TOARE DE DOBÎNZI PURT|ATOARE DE DOBANZI

295
customer deposits
Worsening trend indicator bank's liquidity by analyzing loan / deposit rate is due to higher growth in the volume of loans than deposits, as can be seen from Table. 2. - în % 1994 1995 1996 1997 Indicator Credite/Depozite 73,3 87,5 93,9 97,8
Sursa: Rapoarte anuale B.R.D. 1995-1997
In order to maintain liquidity, particular attention was given to the limits of resources attracted permanent correlation with the time investment, which was reflected in the increase in the share of deposits in total deposits from customers.
3.4. SOLVENCY RISK Solvency risk (bankruptcy, debt or equity) expresses the probability of a banking
company as a bank's own funds are insufficient to cover losses from current activity or that such losses adversely affect the investment bank's creditors. In determining solvency risk are two sides determinant:
a) is an increasing function of the mass relative to loans and the interest rate. The solvency risk increases as the loan size increases. Increase in loans lead to accelerated growth of insolvency. A large portfolio of loans borrowed increases the number of customers, potential insolvent. Increase in interest rate leads to an increase in cases of insolvency of bank borrowers, because they increase the obligations of the beneficiaries of loans. In addition, customers generally appreciate that risky lending have a specific regime specifically higher interest. b) on the other hand, is a decreasing function related to the supply of credit. Restricting the supply of credit leads to a decrease in cases of insolvency, because there is a choice given to customers and therefore doubtful solvency customers will be excluded from lending.
Banks are susceptible to solvency risk, determine a threshold beyond which they will not force the granting of loans, irrespective of the conditions extremely favorable interest.
3.5. MARKET RISK Changing conditions in the financial markets may affect bank profits through
three transmission channels, such as changing competitive structure of the market, changing trends of certain factors such as interest rates, exchange rates, the trend of certain market indices or structural change in demand and supply. Market risk expresses the likelihood that a change in market conditions could adversely affect the bank's profit.
This risk affects the entire banking operations, both balance sheet and off-balance as well. Factors leading to increased market risk are: the degree of competition in financial markets, the liberalization of the legal framework for conducting banking business, increased market volatility, inflation, expanding the use of new technologies and new banking products.

296
4. CONCLUSIONS
Following investigations, it was found that the spectrum of human activity areas using risk concept is very broad, and the lack of a single fundamental approach of the phenomenon generates confusion and misunderstanding risk in interdisciplinary research not only common, but even at the level of individual disciplines. Using the same terms in the explanation of risk often means different things essences. Include only contemporary treatment risk nature of statistics and virtually no risk discovers the true source (genesis). As a result, the risk appears as a factor entirely external (exogenous) to the object and subject of research. Risk is opposite patterns of cognitive processes used by humans, and no outside these models (does not have any practical sense) which in turn are created according Named special laws. Risk is not invented by people, because it is associated with patterns that reflect reality. At the same time, the risk is not an independent phenomenon that exists independently only within a process model (even though this model is not exposed to formal).
Nature does not know the risks, they exist only in the human world. The purpose of risk management is to ensure sufficient level of stability of the process, which involves a series of measures from modeling / remodeling process in question and deal with widening its area of applicability.
Explaining causal risk model is outside the model itself and can only be done by building a universal model (grade II), which comprises the area of applicability of the first model.
REFERENCES:
DEDU V., Banking Management, Didactic and Pedagogic Publishing House, Bucharest, 1999, p. 89.
Rules 17 / 18.12.2003 regarding the organization and internal control of credit institutions and managing the significant risks and the organization and conduct of internal audit of credit institutions (Official Gazette no. 47 / 20.01.2004).
Rule no. 5 / 24.06.2004 on the capital adequacy of credit institutions governing the capital adequacy of these institutions, on an individual and consolidated by implementing institutions mentioned Directive 93/6 / EEC on the capital adequacy of investment firms and credit institutions, as amended by Directive 98/31 / EC and Directive 98 / 33 / EC.

297
THE CASH FLOW AND THE BLOOD FLOOW. MECHANICALăANDă“ECONOMICAL”ăIMPEDANCES
Ing.fiz. Lucian Popescu1 Prof dr. Maria Puschita2
Dr. Adina Pop-Moldovan3
ABSTRACT The corelation between economical and phisyological knowledges in finding unusual
ways of study is alwais for help because it add synergy elements to a reserch. Here we had studie the blood flow through the economical knowledges about the cash flow. This study propose a set of economical and bio-phisycal markers that could be analised in correlation with the cardiac cycle and with the production cycle. The cash flow rules are compatible with the blood flow roules. The fluid mechanics is giving an appropiate way of studie the blood flow in the human heart. In the same maner the anatomical and phisyological knoledges can be applied in economics reserch. The bio-phisycal approach give a mathematical base to the study and alloud us to make comparation and similitudes. The mechanical impedance is a new marker used in the cardiac studies and is a promossing one. The american school of biophisycs used fluid mechanics in heart studies. We try to define the economical impedance in order to make benefic similitudes.
This studie is far away from an exaustive reserch. It proporse a way of approach.
KEY WORDS: cash flow, mechanical impedance, economical impedance
JEL: I00
1. MOTIVATION OF THE RESEARCH THEMA. The study had start from the assumption that the cash flow for the company is
like the blood flow for the human body. The chosen research is situated at the interface between physiology and
economy. With this subject I try an research for similitude and contradictions between the cash flow mechanism as it is in a company and the blood flow as it is in a human body.
Fluid mechanical impedance is defined as the ratio of applied force to produce a fluid flow and fluid velocity ( F.N. VAN DE VOSSE AND M.E.H. VAN DONGEN (1998) )
Z=dF/dv Mechanical impedance can be used in biophysics to characterize vascular
dependent relationship between mechanical resistance of blood flow towards the circulatory system in response to a pulsate pressure gradient produced by the heart. (Robert A. Granger , (1995))
CКnăаeăНefТneăКnă“eМonomТМКlăТmpeНКnМe”ă?ă→СТМСăКreătСeăforМesătСКtăproНuМeăthe cash flow and what we can say about the speed of a cash flow ?
Let try to define the forces that produce the cash flow. The force can be identify with the needs of goods or services. This is not enough because if we do have a need but we do not have an ability to satisfy the need than no flow will happen.

298
So, we can be more specific and we can define the economical forces that produce the cash flow as the need of goods or services together with the ability to provide the goods or services. Let note with N the economical force the produce the cash flow. The speed can be define as the cash flow ratio or the amount of cash devided with the period of time that the cash flow was determined. Let note CF the cash flow amount and t the time. Than the cash flow speed will be: vCF = CF / t With the notation from above we can define an economical impedance as: Ze = N / vCF
2. BASIC CONCEPTS. Economical concept The economocal concept used in this article is the cash flow concept. The cash
flow represent the the differnece from the total cash inflows and cash outflows for an economical unit. (Timothy Jury , (2012))
Cash flow is one of the most critical components of success for a small or mid-sized business. Without cash, profits are meaningless. Many a profitable business on paper has ended up in bankruptcy because the amount of cash coming in doesn't compare with the amount of cash going out. Firms that don't exercise good cash management may not be able to make the investments needed to compete, or they may have to pay more to borrow money to function.
If we make a paralel concept for the human heart than the cash flow will represent the difference between the total inflows and outflows of blood in and from the heart. Normaly that difference have to be 0 for every cardiac cile but I presume this СКppenăonlвăonăКăСeКltСвănormКlăСeКrt.ăTСeăpresumptТonăofătСТsătСeoТretТМКlă0ă„МКsС”ăorăblood flow can be verified by measuring different physical and phisyological markers. Anatomical and physiological concepts.
The pumping function of the heart ensure continuous movement in one direction of the blood.
The pumping activity operates in cycles . Description of heart motion as a whole is difficult if you try to apply for whole the models used for isolated myocardial fibers. Some reasons are: •ă orТentКtТonă ofă mвoМКrНТКlă fТbersă Тsă Мompleб,ă tСeă fТbersă not-being parallel to the papillary muscle, but achieving a true "looping" within the walls of the heart; •ă МКrНТКМă musМleă fТbersă Нo not contract simultaneously, but in a specific sequence dictated by the sequence of electrical activation of the heart; •ăСeКrtăМСКngeăsСКpeăКnНătСТМknessăНurТngăМontrКМtТon;ă •ăforМeăeбerteНăТnăНТfferentăpКrtsăofătСeăСeКrtăТsăvКrТКbleăНepenНТngăonătСeăcurvature of the cardiac walls (fig.1).

299
Fig.1 Human heart section.
(CATHERINE M. OTTO Clinical Echocardiography – fourth edition 2009) Cardiac cycle is the operational couple consisting of a period of contraction of
the heart (systole) followed by a period of relaxation (diastole).
3. STRATEGY OF THE RESEARCH
In economy a positive cash flow represent a bigger inflow of cash that, at the end will be seen as a profit or growth for the economical unit. Is this happenning also for the heart ? Can we see a positive blood flow in the heart ? For what will be used the „eбМess”ă?ă
I am seing definitely YES we can se a positive blood flow on the growth period. This can be evidenced only taking into account a long period of time (years). We can see this more accurate on the childrens befor bearth (especialy I will not use the word pheetus because they are childrens from the beginig, from the conception, but this is an other subject).
Most business owners see growth as the solution to a cash-flow problem. That's why they often achieve their goal of growing the business only to find they have increased their cash-flow problems in the process. Plan for growth and the related cash outlays in advance, so they do not come as a surprise.
What we are doing after ? Woh to keep heart healthy ? Let see what means a good cash flow management. There are 10 must do for have a good cash flow. 1. Never Run Out of Cash. Running out of cash is the definition of failure in business. 2. Cash Is King. It's important to recognize that cash is what keeps your business alive. Manage it with the care and attention it deserves. 3. Know the Cash Balance Right Now. What is your cash balance right now? It's absolutely critical that you know exactly what your cash balance is. Even the most intelligent and experienced person will fail if they are making business decisions using inaccurate or incomplete cash balances. 4. Do Today's Work Today. The key to keeping an accurate cash balance in your accounting system is to do today's work today. When you do this, you will have the numbers you need - when you need them.

300
5. Either You Do the Work or Have Someone Else Do It. Here is a simple rule to follow to make sure you have an accurate cash balance on your books. You do the work or have someone else do it. Those are the only two choices you have. The work must be done. 6. Don't Manage From the Bank Balance. The bank balance and the cash balance are two different animals. Rarely will the two ever be the same. Don't make the mistake of confusing them. 7. Know What You Expect the Cash Balance to be Six Months From Now. What do you expect your cash balance to be six months from now? This one question will transform the way you manage your business. 8. Cash Flow Problems Don't "Just Happen." You would be shocked and amazed at the number of businesses that fail because the owner did not see a cash flow problem in time to do something about it. 9. You Absolutely, Positively Must Have Cash Flow Projections. Cash flow projections are the key to making wise and profitable business decisions. It's impossible to run your business properly without them. 10. Eliminate Your Cash Flow Worries So You Are Free to Do What You Do Best - Take Care of Customers and Make More Money. This is the real key to your success in business. The reason you have to make sure you have the cash flow of your business under control is so you are free to focus all your time and talents where you can make the most difference in your business. (Philip Campbell , (2004))
We will try to make the paralel between economic rules for having a good cash flow and phisyological rules for have a good blod flow.
Economic Phisyologic 1. Never Run Out of Cash. 1. You can not exist as human without
blood 2. Cash Is King. 2. Heart is King 3. Know the Cash Balance Right Now. 3. Know your heart helth now 4. Do Today's Work Today. 4. Check your heart today 5. Either You Do the Work or Have Someone Else Do It.
5. If you have to do a treatement then you have to do it
6. Don't Manage From the Bank Balance. 6. Do not become your own doctor 7. Know What You Expect the Cash Balance to be Six Months From Now.
7. Ask your doctor projection for your heart problems
8. Cash Flow Problems Don't "Just Happen."
8.ăHeКrtăproblemsăНon’tă„justăСКppen”.ăSeeăthe risc factors
9. You Absolutely, Positively Must Have Cash Flow Projections.
9. You have to deal with the risc factors that you have
10. Eliminate Your Cash Flow Worries So You Are Free to Do What You Do Best - Take Care of Customers and Make More Money.
10. Taking care about your heart health you can be free to enjoy the life.

301
We will calculate the mechanical impedance Za in the aortic ring. Data will be collected from a continuous Doppler ultrasound machine. Data collected will be initially stored in a table as follow:
Sex
Age
Dyagnostic
Diameter of aortic ring
Pressure at aortic ring level
Blood speed at the intrance in the aortic ring We will watch if the impedance Za changed with age. A drop of it would show either a narrowing of the aortic ring or a decrease in pressure. An increase in impedance would mean a decrease in velocity in the aorta. We group the data in a database divided into two, one for men and another for women. In turn the two databases will be sorted and grouped by age within 10 years as follows: 0-10 years; 10-20 years; 20-30; 30-40 years; 40-50 years; 50-60 years 60-70 years 70-80 years; more than 80 years. We will collect data from about 3,000 patients without making selection by gender or age. Thus we get a chart indicating the percentage by sex and age of those who come to a cardiology check. We will calculate the impedance Za for each patient and then we calculate the average for each age group separately for men and women separately.
4. RESULTS We had access to data collected from 2977 patients like in - Table III: Table III represents the number and percentage of patients studied
Number Percent
Women 1646 55%
Man 1331 45%
TOTAL 2977 (realizat de autor, calcule proprii)
Tables with data calculated by age and gender are as follows (Table IV Table V) Table IV - calculated data (mechanical impedance of the aortic ring and E/A ration) grouped by age for women.

302
Women
Age Number Za
0-10 years 14 0.34
11-20 years 16 0.42
21-30 years 41 0.30
31-40 years 89 0.31
41-50 years 187 0.30
51-60 years 596 0.30
61-70 years 362 0.28
71-80 years 279 0.29
peste 80 years 62 0.27
Averages - women 0.30 (realizat de autor, calcule proprii)
Table IV - calculated data (mechanical impedance of the aortic ring and E/A ration) grouped by age for men.
Men
Age NumberZa
0-10 years 23 0.21
11-20 years 21 0.22
21-30 years 32 0.26
31-40 years 76 0.28
41-50 years 143 0.26
51-60 years 515 0.24
61-70 years 293 0.26
71-80 years 192 0.24
peste 80 years 36 0.28
Averages - men 0.25 (realizat de autor, calcule proprii)
If we will make charts based on these figurs we get (fig. no.3, 4)
Fig. no. 3 Chart of mechanical impedance at the aortic ring for womens spleted by ages (realizat de autor, calcule proprii)

303
Fig. no. 4 Chart of mechanical impedance at the aortic ring for mens splited by ages
(realizat de autor, calcule proprii)
From graphical representations it can be observed the following: 1. TСeămeМСКnТМКlăТmpeНКnМeăZКăforăаomen’săgenerКllвăНeМreКsesăаТtСăКge 2. TСeămeМСКnТМКlăТmpeНКnМeăZКăforămen’săСКsăКăgroаТngăКspeМt. 3. The mechanical impedance for men is on average lower than for women
5. CONCLUSIONS AND DIRECTION TO STUDY
From the study we can draw these lines for further studies: - The economy - physiology approach could give new perspective bought for
economy and for physiology. - We can think at physiological concepts to be applied in economy, such as
profit and loss versus health and disease or investments versus health improving.
- We have to find a mathematical expression for economical forces in the way that have been defined in front.
- Economical impedance can be a marker characterizing the economical health. - The economical impedance must be calculated for different companies, based
onăreКlăeМonomТМКlăНКtК’s.ăTСereforeăаeăМКnăobserveăСoаătСТsăvКrТesăаТtСătСeăcash flow or turnover.
The perspective beeing oppened we can develop our reserch in that direction.
REFERENCES
F.N. VAN DE VOSSE AND M.E.H. VAN DONGEN (1998) Cardiovascular Fluid Mechanics
- lecture notes - Eindhoven University of Technology , faculty of Mechanical Engineering (MaTe), faculty of Applied Physics (NT)
CATHERINE M. OTTO Clinical Echocardiography – fourth edition 2009, University of Washington, School of Medicine.

304
http://www.inc.com/encyclopedia/cashflow.html http://www.score.org/60_guide_managing_cash_flow.html Philip Campbell Never Run Out of Cash, 2004, BookMasters Inc. OH4485, USA
Robert A. Granger Fluid Mechanics, 1995, Dover Books on Physics, USA Timothy Jury Cash Flow Analysis and Forecasting: The Definitive Guide to Understanding and
Using Published Cash Flow Data, 2012, Kindle Store, USA

305
ONLINE COMMUNICATION AND STIRRING THE TRAVEL DESIRE TO VISIT THE MONUMENT OFTOURISM
Gheorghe POPOVICI1
ABSTRACT The paper presents the results of the research conducted in the period 2013-2014 about
the need for a new experimental online marketing, in order to stir the desire to travel and to visit the Monument of Tourism (Banat, Romania), a unique attraction in the world. The main targeted tourist is the one who smiles and always attempts to feel the joy of travelling and relaxing in unique sights grace to their wilderness and beauty, under the message: „Come to the Mountainous Banat for the sake of experience! The experience must be lived!”. Online communication must enable the stirring of the desire to travel to the Mountainous Banat by an online „photo and / or video scene” with the 4 moments of the AIDA model: attract attention to the amusing mode to spend time and relax offered to the tourist and his family or group; stir interest by the place uniqueness (the Robinson Crusoe myth!) and the hospitality of hosts and inhabitants (the „proud to be Banatian” myth!); provoke desire through the emotions experienced in front of the wilderness and unexpected of the journey through virgin unvisited places (the myth of the sport lover’s emotions due to the uncertainty of the competition final results!); passing to action by urging the tourist to choose, all by himself, the touristic offer for a vacation to visit the Mountainous Banat, within a planned amount of money and with the option to change the visiting preferences on the spot.
KEY WORDS: experimental tourism, online communication, the Monument of Tourism, touristic symbols.
JEL: L83
1. INTRODUCTION
The current visitor (hiker or tourist) is more and more accustomed to travel and to leave on holiday searching a lot of information on the Internet. In this way he projects himself to a space and time different from his daily life and attempts to imagine his vacation.
Furthermore, it is recommended NOT to reduce everything to a mere relaxation trТpăorăКă„rusСeН”ătrКvelăТnăorНerătoă„МСeМk”ăКsămКnвătourТstТМăsТgСtsăКsăpossТbleăТnăoneăsingle day. No matter how motivated they may be, tourists should not select a touristic package with more than two itineraries a day. Otherwise, the trip will end in failure, because fatigue takes its toll at a certain moment, the power to perceive and МompreСenНăТsăМonsТНerКblвăreНuМeНăorămКвăevenăНТsКppeКr.ăTСeătourТsts’ group, even led by a guide, will be overwhelmed and exhausted and will feel no pleasure while visiting the touristic sights. InăBКnКtăаeăНoănotă КТmăКtă Кă „robotТseН”ă tourТsm,ă lТkeă tСeăoneăprКМtТseНă Тnă tСeăconsumer society, in which the traveller is taken to and fro in a mind-turning rush. In
1 Faculty of Economic Sciences, University Eftimie Murgu from Resita, Romania

306
tСeseă “fКsСТonКble”ă trКvels,ă tСeă sМСeНuleă Тsă notă ТntenНeНă foră tСeă soul,ă bută setă bвăcomputer, often for a person under the sign of rush: to catch the bus, not to miss lunch, to see everything highlighted in the guide КsăКă„must”. That is why the plea in our paper will be for a new form of online communication meant to promote the touristic attractions of Mountainous Banat and to stТrătСeăНesТreătoăătrКvelăаСereăeverвtСТngăbelongsătoătСeătrКveller:ă„walking, letting your yes wander, alloting time for rest and time for admiring a sunrise and a sunset.”1
2. THE ISSUES FORWARDED In order to stir the desire to travel we need a new experimental online marketing,
by which one will attempt to bring new experiences, new identifications and new discoveries for each potential tourist.
The true discovery of the Mountains Banat does not consist in seeking and promoting new touristic attractions, but in regarding the existing ones with new eyes, in a unitary whole.
The idea underlined in the paper is to enjoy the experience lived by a tourist who visits the Mountainous Banat, whose traits (age, gender, lifestyle etc.) are close to those of the targeted customers group.
3. THE CORE OF THE PROBLEM
Obviously the target of an online communication campaign is that the message should be AIR – appreciated, in full comprehension and especially retained by the potential tourists. For this purpose the message should be in an original format, unexpected for the visitor and in a first stage it must show the significance and uniqueness of the Mountainous Banat touristic symbols. Thus, the Mountainous Banat is the only place in the world where we can see a monument of tourism. To visit the Monument of Tourism, symbol of the love for nature, for tourism, always means an escape towards a little bit of happiness. (Figure 1).
1 Gheorghe Popovici, Banatul Montan – Ghid turistic, EНТturКăTIMăReşТ К,ă2014

307
Fig.1. The Monument of Tourism – RuscaăMontan
Tourists can reach the Monument of Tourism very easily on the national road
DNă68ăă ă ă ă ăCКrКnsebeş-HК eg,ăКsă fКrăКsă↑oТslova and from there on the asphalt road another 7 kms to the monument, and another 12 kms to the marble quarry. .
The initiative to erect the Monument of Tourism belongs to the Banatian Touristică Clubă ofă ă Caransebeş (CTB) and was born out of love for nature and hiking. One night in 1936, around a bonfire, several wise men decided to raise a marble monument here dedicated to tourism. It was not a happening, nor a fashion or or ambition to avoid oblivion. Their intention was to make us understand that tourism in Banat and in the entire Romania is a richness so great that even if exported, it remains at home. „In the ’30s, Rusca Montană and Ruschiţa were preferred destinations for the CTB members, especially grace to the marble quarry, extremely beautiful forests, trout and grayling fishing, mushroom and berry picking, all completed by the easiness of access: 40 minutes by train from Caransebeş to Voislova station and then by the forest train 7 kms to Rusca Montană and another 12 kms to Ruşchiţa, on a dream itinerary, along the mountain creek. The motivations of hiking were diverse: fishing, hunting, air and sun cures, rest. Groups were formed from home or in the stations, on the train, spontaneously or by friendships or preferences. Such an association was formed also by the group dominated by CTB, always present at numerous trips organised by its board.” [Hamat C., 2004]
In these circumstances the idea was born to build a monument dedicated to tourism. Ioan Bibel, owner of the marble quarry, offered to provide the necessary marble, and from the part of the CTB the works were monitored by Vasile Magdaş, tСeă СeКНă ofă tСeă RusМКă MontКn ă forestrвă МТrМuТt.ă TСeă eбeМutТonă ofă tСeă monumentăstarted in 1936, the mounting on the initial location took place in the spring of 1937, and the inauguration on August 1st 1937,ăonătСeăplКМeăМКlleНă„SevenăsprТngs”ăon tСeăroКНăbetаeenăăRusМСТ КăКnНăPКНeşăPeКkă(1374ăm)ă– the highest peak in the Poiana RusМ ТăMountКТns.ă
„At „Seven Springs” in Ruschiţa one used to organise admirable country picnics, and amid the tourist important personalities of public life were often present.” [Hamat C., 2004].
308
War came and then a new reality invaded Romania, with new events and new people. The Monument of Tourism fell into oblivion, ceased to be tended and was МovereНăТnăvegetКtТonăКnНăСТННenăfromăpeople’săeвes,ăКsăТtălТesăКtătСeăаood limit.
A first rehabilitation plan was made in 1976 when the County Tourism Office CКrКş-Severin (OJT) attempted to allocate funds to the construction of a chalet next to tСeă monument.ă NotСТngă аКsă Нoneă beМКuseă tСeă ă ’80să МКme,ă вeКrsă ofă „mТserв”ă forăRomanian tourism, when the gasoline restrictions started (on Sunday one was allowed to drive alternately , according to the odd or even registration plate of the car), the last order in restaurants was at 21.00 hours, the restaurants closed at 22.00 hours, the recipes аereă МСКngeНă foră Кă „sМТentТfТМă КlТmentКtТon”ă neМessКrвă foră tСeă MDMă (multТsТНeН developed man!).
On the 9th of August 1984, the monument was moved from the RusМСТ КăloМКtТonă toă tСeă entrКnМeă toă RusМКă MontКn ,ă onă tСeă spotă МКlleНă ă „Pсrсulă MКreă /ă BТfăCreek”,ăаСereăТtălТesătoНКв,ăКtătСeăТnТtТКtТveăofăengТneerăFrКnkă→Кlter,ăСeКНăofătСeăRusМКăMontКn ăForestrвăCТrМuТt,ă oută ofă МКreă foră tСeă fКteă ofă tСeămonumentă КnНă Кsăa homage paid to his predecessor, engineer Vasile Magdas, the author of the beautiful poem engraved on the monument.
The new location, on the foot of a hill, near a limpid creek, ensures its protection and better visibility without taking it out of the geographic environment for which it was designed.
From that movement, the monument has been living a second youth, being surrounded by a Banat- style wooden fence. Behind the fence, on the slope, fir trees were planted, and flower beds are always arranged in front of it.
In 1997, on the occasion of the 60th anniversary of the monument dedication, they organised a festival worth of the importance and value of this true symbol of tourism. They succeeded then to edit a stamp within a stamp issue on the theme of the monument. Unfortunately, according to teacher Viorel Florea, a local and a great lover of this Banat realm, „so that they do not become ridicule for having printed such a „contraption”, they „omitted” the name „Monument of Tourism”, out of misunderstanding of its true significance.”
Afteră tСКtă КnnТversКrв,ă Тnă tСeă montСă ofă Augustă eКМСă вeКr,ă ă RusМКă MontКn ăorgКnТsesă„TheăTourismăMonument’săDay”ă– a true festival for the locals and tourists, arrived at the 17th edition (2014). All takes place around a bonfire, like in 1936, when the idea was born to erect this monument. More than 75 years have passed since then. That is why, if you are lovers of hiking and nature, you should join this festival of Banatians celebrating a monument unique in the world, which urges each tourist to love his peers and to protect the creations of nature and man alike. The fact is surprising and even extraordinary when it comes to its perception, even today, when in Mountainous Banat the tourist may say :
The Monument of Tourism is not a mere attraction, a curiosity you see and leКve,ăМСeМkТngăКnotСerăboбăonătСeă„reМorН”ăofătourТstТМăsТgСtsăвouăvТsТteН.ăItăТsăКăsвmbolăofă tСeă trutСăаrТttenă onă Тtsă „МСest”.ă Ifăаeă Кttemptă toă МompreСenНă tСeă urgeă tСКt,ă onă tСeăborder between our preoММupКtТonsă КnНă troubleă КnНă nКture’să МreКtТonă „toă tСroаă КаКвăgrief and hate passion, to take from the nature secrets the divine sparkle, the virtue of love”.ăă→eăsСКllăfТnНăreКlăsensesăofăreМreКtТonătСrougСătourТsmăТnătСeămТННleăofănКture,ăas the verses urge us from the monument frontispiece:
„Oh, you tourist arrived under the woods,

309
Throw away misery and hate passion. Try to grasp from the laws of nature The divine sparkle: the virtue of love.”
These words may be the most wonderful poem for any true hymn of Romanian
tourism ! The Monument of Tourism is erected with 8 blocks made of RusМСТ КăаСТteă
marble lies on a quadrilateral regular prism base with the side of 80 cms, and with the height of 40 cms. The tower of the monument is made of three blocks shaped as quadrilateral regular truncated pyramids with the inferior base of 62 cms, and the superior base of 50 cm.
The total height of the monument tower is 190 cms. OnătСeămeНТumăboНвătСeăpoemăofăă↑КsТleăMКgНКşăТsăengrКveНăТnămКrbleăgrКМeă
toă tСeă effortă ofă tСoseă аСoă ereМteНă tСeă monument:ă IsКМă R НulesМu,ă PКvelă GoКn ,ăAlexandru Andrei,ă↑КsТleăMКgНКş,ăIoКnăBТbel.ăTСeăupperăboНвăbeКrsătСeăТnsМrТptТonăТnăsemТМТrМleă„MONUMENTăOFăTOURISM”,ă folloаeНăСorТzontКllвăbвă tСeăCTBă ТnТtТКlsăof the Banatian Touristic Club and by the year 1936, the year when the marble sculpture works began. The folloаТngă roаă reКНs:ă „EreМteНă bвă tСeă BКnКtТКnă TourТstТМăClubăCКrКnsebeş”.ăTаoă МonneМtТngă boНТesă Мomeăneбt,ă sСКpeНă Кsă regulКră quКНrТlКterКlăprisms, one with the side of 55 cms and the height of 10 cms, the other with the side of 45 cms and the height of 20 cms. The next body looks like a 30-cm diameter hemisphere, 30-cm high, from which a symbolic flame springs 30-cms high, symbolising the fire of love for people and nature.
The entire monument is 3.40 m high. Paraphrasing Eminescu, we may claim that the Monumentă ofă TourТsmă „eбТstsă
аСenăаeăМКnăseeăТt”ăКnНăbrТngsănoămoneв,ăbeМКuseăsomeăpeopleăНoănotăseeăТt,ăаСereКsătСeă„monster”ăofăLoМkăNessă„аСТleăТtăаКsănotăТtă Тsănot”ăКnНăbrТngsătСeăBrТtТsСăКălotăofămoney and researches, scuba diving, debates, surveillance, hypotheses, confirmations.
In order to make it known in the world, the Monument of Tourism will be МlotСeНăeКМСă вeКră Тnă Кă „neаăКttТre”ăаТtСă Кnă „Кllegorвăonă tСeă tourТstТМă tСemeămeКntă toăcontribute to a better highlighting of the monument personality. Furthermore, an alley will be opened to the right of the monument, on the level curve, and at its end a tourists' resting place will be raised and even a compound with camping spaces at the border of the forest.
Although a lot of things have changed in the area, the places have remained equally welcoming. The white of the marble, the water full of trout, the clean and stronglвă ТonТseНă КТr,ă tСeă peКМeă ofă tСeăаooНs,ă Кllă lureă вouă toă Мomeă vТsТtă tСeă „BКnКt’săSТnКТК”,ăКsătСeвăМКllătСeăRusМКă↑Кlleв.ăăă
And each and every tourist must remember to leave a flower at the Monument of Tourism, as a testimony of his love for nature and for fellow men, for tourism.
When we analyse the touristic indicators of CКrКş-Severin county based on the data collected in the period 2002-2012, we found the results mainly presented in tables 1, 2, 3, 4, 5 and 6.
→eăМКnă seeă tСКtă ТnăCКrКş-Severin there are 181 accommodation units: hotels, motels, hotels, touristic guesthouses, agrotouristic guesthouses, cabins, villas etc.
The indices of the use of functional accommodation capacity were of 27.40%, in 2012.

310
The number of tourists per year (2012) is still very low around 110 000 a year, of whom care 104 189 are Romanian tourists and only 5 743 are foreign tourists.
The number of overnight stays per year is 497 568 for 109 932 tourists. We must underline that tourism in CКrКş-SeverТnăТsă„МКugСtăТnăКăvТМТousăМТrМle”,ă
onătСeăoneăСКnНănoăТnvestorsăМomeătoătСeăCКrКşătourТsmăbeМКuseătСereăКreănotătourТsts,ăand on the other hand tourists do not come because they cannot find the basic and additional services at a high quality level.
Another important idea can be identified, that no mater how beautiful and attractive the Mountainous Banat touristic sights may be, if they remain unknown they will not be visited. We need a promotion of places and touristic sights conducted with a lot of passion and in full sincerity.
ACCOMMODATION UNITS OFăCARAŞ-SEVERIN COUNTY
Table 1
UNITSăFORăTOURISTS’ăACCOMMODATION
2000 2002 2008 2009 2010 2011 2012 78 74 118 144 143 149 181
EXISTING - TOTAL- of which:
Hotels 17 14 19 24 23 27 27 Hotels for youth - - - - - - - Hostels - - 2 5 5 5 5 Inns and motels 5 5 6 7 7 7 5
- motels 4 5 5 6 6 6 5 - inns 1 - 1 1 1 1 -
TourТsts’ăvТllКs 16 10 15 14 6 7 8 TourТsts’ăМКbТns 13 9 7 12 7 6 7 TourТsts’ăguestСouses 7 12 29 40 46 48 64 Agrotouristic guesthouses 4 7 24 29 36 35 52 Camping areas - 1 - - - - - Tourists' stops 2 3 4 4 6 6 5 Bungalows 1 1 2 2 2 2 3 Camps for school and kindergarten pupils
11 10 7 7 4 4 4
TourТsts’ăsmКllăМКbТns 2 2 1 - 1 2 1
Remark : Starting with 2009 youth hotels are assimilated to hostels
INDICES OF USE OF FUNCTIONAL ACCOMMODATION CAPACITIES
Table 2
2000 2002 2008 2009 2010 2011 2012 - TOTAL - % 44,30 54,70 44,10 36,60 30,90 34,50 27,40 of which:
Hotels 53.00 62.60 59.30 50.40 42.60 47.30 36.30 Hotels for youth - - 41.30 - - - - Hostels - - 16.10 21.60 19.60 20.70 20.90 Inns and motels 8.70 8.00 31.80 21.00 20.70 18.40 14.80
- motels 8.70 8.00 30.50 21.10 18.90 18.70 14.90 - inns - - 46.30 19.60 50.80 13.90 13.00
TourТsts’ăvТllКs 14.40 12.20 17.10 27.60 7.50 10.00 10.00 TourТsts’ăМКbТns 4.40 10.30 10.30 7.30 4.10 7.70 6.30 TourТsts’ăguestСouses 16.90 16.30 21.30 21.30 19.60 19.00 15.70

311
Agrotouristic guesthouses
16.00 15.70 12.10 11.60 13.20 16.00 16.20
Camping areas - 1.1 - - - - - Tourists' stops 57.70 38.30 19.10 13.80 22.10 23.00 22.60 Bungalows - - 21.20 22.40 32.90 35.70 28.40 Camps for school and kindergarten pupils
28.40 34.00 28.40 28.90 20.20 23.20 21.50
TourТsts’ăsmКllăМКbТns 14.20 18.20 - - 13.50 17.20 8.10
Remark : Starting with 2009 youth hotels are assimilated to hostels
(Source: Statistic Breviary of Caraş-Severin county, 2013)
NUMBER OF TOURISTS
Table 3 2000 2002 2008 2009 2010 2011 2012
ACCOMMODATED TOURISTS - TOTAL -
141322 100552 104292 94139 92833 106866 109932
of which: Hotels 119223 82382 67485 56680 54275 62837 63719 Hotels for youth - - 1938 - - - - Hostels - - 841 2091 1655 1723 1872 Inns and motels 4724 3090 4056 6111 6346 7708 6063
- motels 4724 3090 3513 5825 6005 7524 6009 - inns - - 541 286 341 184 54
TourТsts’ăvТllКs 3324 2204 4564 3537 2120 2737 3169 TourТsts’ăМКbТns 2980 1402 2375 2062 1187 1207 986 TourТsts’ăguestСouses 1362 3085 12399 13945 14290 15985 17055 Agrotouristic guesthouses 373 912 4986 5703 8166 10372 12524 Camping areas - 87 - - - - - Tourists' stops 3944 1235 1076 767 1846 1858 2523 Bungalows - - 240 295 594 826 999 Camps for school and kindergarten pupils
5222 5957 4334 2948 2306 1488 923
TourТsts’ăsmКllăМКbТns 170 198 - - 48 125 99
NUMBER OF OVERNIGHT STAYS
Table 4
2000 2002 2008 2009 2010 2011 2012 OVERNIGHT STAYS - TOTAL -
777945 920130 707483 581966 471000 545661 497568
Of which: Hotels 710823 862572 580656 446919 354339 421927 370986 Hotels for youth - - 7229 - - - - Hostels - - 4503 12147 10111 9545 11716 Inns and motels 6587 4855 22864 19938 19452 16654
- motels 6587 4855 20150 18791 16484 15845 9622 - inns - - 2714 1147 2968 809 189
TourТsts’ăvТllКs 5707 4390 11861 18480 3637 5240 5893 TourТsts’ăМКbТns 5499 4054 6960 5230 2054 1716 1603 TourТsts’ăguestСouses 3450 6424 36522 46717 45716 49275 48912 Agrotouristic guesthouses 1207 2556 13358 14200 17241 25408 33622 Camping areas - 87 - - - - -

312
Tourists' stops 6720 5754 3457 2511 6050 5636 6391 Bungalows - - 573 609 1416 1759 2291 Camps for school and kindergarten pupils
37612 29104 19500 15215 10753 7951 5916
TourТsts’ăsmКllăМКbТns 340 334 - - 231 550 427
(Source: Statistic Breviary of Caraş-Severin county, 2013)
EXISTINGăTOURISTS’ăACCOMMODATIONăCAPACITYăă
Table 5
2000
2002 2008 2009 2010 2011 2012
Places - TOTAL- of which: 8596 6789 7214 7906 7139 7071 7566
Hotels 5261 4384 4488 4707 4294 4209 3948 Hotels for youth - - 62 - - - - Hostels - - 78 205 205 225 235 Inns and motels 221 239 280 260 259 259 167
- motels 205 239 264 244 243 243 167 - inns 16 - 16 16 16 16 -
TourТsts’ăvТllКs 949 135 277 261 148 175 210 TourТsts’ăМКbТns 750 539 460 598 236 93 186 TourТsts’ăguestСouses 82 130 521 727 831 864 1238 Agrotouristic guesthouses 52 81 423 522 625 679 967 Camping areas - 132 - - - - - Tourists' stops 74 130 150 150 204 210 270 Bungalows 12 8 30 34 34 34 50 Camps for school and kindergarten pupils
1165 981 435 442 275 283 283
TourТsts’ăsmКllăМКbТns 30 30 10 - 28 40 12
TOURISTS’ăACCOMMODATIONăCAPACITYăINăOPERATION
Table 6. 2000 2002 2008 2009 2010 2011 2012
TOURISTS’ăACCOMMODATION CAPACITY IN OPERATION -TOTAL PLACES- DAYS
1756152 1682493 1605683 1591628 1525136 1583220 1818021
din care: Hotels 1341410 1378856 979641 886344 831620 891846 1022442 Hotels for youth - - 17506 - - - - Hostels - - 28044 56296 51700 46114 56148 Inns and motels 75396 60470 71943 94968 93920 90708 66265
- motels 75396 60470 66087 89128 87362 84868 64809 - inns - - 5856 5840 5840 5840 1456
TourТsts’ăvТllКs 39504 35970 69464 66988 48534 52258 58911 TourТsts’ăМКbТns 125123 39180 67448 71620 50264 22321 25286 TourТsts’ăguestСouses 20411 39414 171826 219250 232790 254150 312096 Agrotouristic guesthouses
7962 18172 110370 122712 130389 159008 207785

313
Camping areas - 8052 - - - - - Tourists' stops 11652 15016 18060 18140 27370 24482 28258 Bungalows - - 2706 2718 4304 4928 8064 Camps for school and kindergarten pupils
132294 85523 68675 52592 53255 34201 27504
TourТsts’ăsmКllăМКbТns 2400 1840 - - 1708 3204 5262
(Source: Statistic Breviary of Caraş-Severin county, 2013) 4. CONCLUSIONS From the study conducted we identified several conclusions that we find useful
and relevant for another type of tourism in the Mountainous Banat, an experimental tourism with the motto: „Come to the Mountainous Banat for the sake of experience! The experience must be
lived!”. A first conclusion is that the main targeted tourist is the one who smiles and
always attempts to feel the joy of the traveller. The second conclusion is that related to the online communication able to stir the
НesТreă toăgoăonăКă trТpă toă tСeăMountКТnousăBКnКtă trТggereНăbвăКă„pСotoăКnНă /ăoră ăvТНeoăsМene”ăаТtСătСeăfourămomentsăofătСeăAIDA model: A–attract attention to the amusing manner of spending time and relaxing offered to the tourist and his family / group;
I- stir interest by the location uniqueness (the Robinson Crusoe myth!) and hospitality of hosts and inhabitants (the „proud to be a Banatian” myth!);
D-provoke desire grace to the emotions experienced when admiring the wilderness and unexpected of the trip to virgin unexplored places (the sport lover’s myth due to the uncertainty of the competition final results!);
A-passing to action by urging the tourist to select the touristic offer all by himdelf in order to vacation in the Mountainous Banat, within the limits of a planned amount of money and with the option to change visitation preferences on the very spot.
The third conclusion is that a trip to the Mountainous Banat will not stay under the sign of rush, just to check a next touristic sight, but everything will belong to the tourist, by walking, with the eyes wandering, with time for rest and time for a sunrise and a sunset, for the sake of experience.
Another conclusion is the need for making the area known and promoted by symbolic touristic sights, such as the only monument dedicated to tourism: the Monument of Tourism (1937)ăsТtuКteНăКtăRusМКăMontКn ăТnăCКrКş-Severin county.
The study results in the proposal and argument that in order to stir the desire to travel, we need a new experimental online marketing, meant to bring about new experiences, new identifications and new discoveries for each potential tourist.
REFERENCES
Hamat Cornel, The Scorilo touristic domain (in Romanian), Mirton Editions, 2004 Petr Christine, Le marketing du tourisme, Ed. Dunod, Paris, 2010 Popovici Gh., The Mountainous Banat – tourist’s guide (in Romanian), TIM Editions, ReşТ К,ă
2013

314
Popovici Gh., The Mountainous Banat – the need for tourism through events, International Conference for Business Administration„People. Ideas. Experiences.”, ReşТ К,ă23-25 October 2014
xxx Statistic breviary of Caraş-Severin county, 2013 edition

315
CREATIVE ACCOUNTING AND TAX EVASION
Doina RADA1
ABSTRACT Like in the case of creative accounting, we cannot blame the imperfection of the legal
framework, but we must recognize that due to gaps in legislation, people may resort to self-interest tax handling. An individual or legal person may resort to tax evasion for various reasons. Often accounting uses financial statements with the aim of creating a more favorable image for the company, image that is shown to the different categories of accounting information users that have certain interests inside the firm.
KEY WORDS: Tax evasion, creative accounting, legal, illegality
JEL : K34, K42
1. CREATIVE ACCOUNTING BETWEEN PERMISSIVENESS AND ILLEGALITY
Often accounting uses financial statements with the aim of creating a more favorable image for the company, image that is shown to the different categories of accounting information users that have certain interests inside the firm. Accounting principles play a key role in achieving this because they leave room for interpretation in terms of their applicability. Remodeling financial statements for the personal interest of the enterprise is called creative accounting.
The concept of creative accounting describes how accounting professionals make use of their knowledge in order to manipulate the figures in the annual accounts.
In the literature we find various definitions that were given on creative accounting, among which we remind some of them:
Jameson argued that "accounting process involves operating with different opinions and resolving conflicts between them in order to present the results generated by the transaction. Such flexibility facilitates the manipulation, deception and distortion. These activities practiced by some less scrupulous members of the profession, began to be known as creative accounting ... There is no doubt about the negative nature of creative accounting. It distorts the results and financial position relating to enterprise...".
Trotman is a little more tolerant with those who resort to creative accounting, claiming that this is just a communication technique aimed at improving the information provided to investors.
Teller and Raybaud expressed the following view on creative accounting: "practices of accounting information, often at the limit of legality, practiced by certain enterprises which, taking advantage of the limits of normalization, seek to embellish the financial position and the financial and economic performance".
Naser offers perhaps one of the most comprehensive definitions of creative accounting:
1 Associate ProfessorăPСD,ăUnТversТtвă”EftТmТeăMurgu”ăofăResТtК,ăFКМultвăOfăEМonomТМs,ăН.rКНК@uem.ro

316
"1) the process by which, given the existence of gaps in the rules, are manipulated the accounting figures and taking advantage of the flexibility, are chosen those practices of measurement and information that allow transformation of summary documents of what they should be in what managers want;
2) the process by which transactions are structured in such a way, as to enable "production" of desired accounting result. "
The reasons for resorting to creative accounting are numerous. Without finding excuses to those who do this, we can say that the use of creative accounting is to some extent due to the ambiguity and permissiveness or legislative framework. Professional accountants use every loophole to achieve their objective.
For example, an important factor of influence could be considered the enterprise policy. If the managers' salaries are calculated based on the accounting result, then managers are tempted to use various techniques to maintain the highest possible result, denying the long-term consequences. If the result is above the average sheet set, then the surplus is allocated to increase future bonuses. If the result is below the average established, then it is used the "big bath" procedure, which refers to the fact that in the year where there is loss, that loss is increased by managers by including all future expected losses, which will allow the production of high earnings in the years ahead. People who resort to creative accounting seek to defer recognition of losses as much as possible. Managers are also impelled to opt for creative accounting and where this contributes to job security, if you get profit share. We can say that, indirectly, managers are suggested by the shareholders, through these advantages, to apply creative accounting techniques.
Another case of recourse to creative accounting application is when the company needs loans. If in some contracts were established restrictions regarding the total amount borrowed by a company (which is obtained as a multiple of capital and reserves), then we use the accounting methods that increase the accounting result and reserves, or there are used off-balance techniques. Sweeney says that companies that are in an advanced state of indebtedness are two to three times more likely than other companies to change their accounting policies in order to increase earnings.
The state can be also included in the motivational complex. For example, if a company has a commitment based on a share of the profits, then it is tempted to diminish the outcome. This is met with preference to companies under government authority. As he sets out the maximum amounts that can be spent, and decrease the amounts if the profit is high, companies are tempted to use accounting methods to reduce the result.
The companies listed on the stock exchange appeal to creative accounting, also. They fear of the presentation of results that fluctuate from one year to another, preferring to present a constant situation, a slight increase in profit from one year to another. This is done by "smoothing" the result which involves the use of techniques (finding provisions, income and expenses in advance of changes in accounting estimates and methods ...) to reduce the deviation of the result published by the size considered normal or expected.
Another situation in which creative accounting is used, is when choosing to defer recognition of a portion of profits to cover in future years, possible unforeseen costs.
Critics believe that only incompetent managers resort to creative accounting. It is considered that they surrender personal interests to the detriment of the economic

317
entity. Normally it comes to use creative accounting if the company has not achieved satisfactory performance. Unable to take the risk that suppliers do not grant trade credit, creditors to reduce debt, customers seek other suppliers, management decides to apply creative accounting techniques.
We can state that it is resorting to creative accounting when the economic entity is deadlocked, when it faces failure.
The most disappointing thing is that the use of creative accounting is very stealthy, perhaps even impossible to detect. The only information mode about how financial statements have been prepared are the annexes, but we must be aware that no accountant will mention that he applied creative accounting techniques.
Some of the effects of applying creative accounting are: - Increase or decrease of spending. This is possible because the accounting rules leave room for interpretation in terms of quantifying the costs of a particular exercise; - Increase or decrease of incomes. Handling revenue can be achieved using the principle of prudence. Revenue recognition operation can be slowed or speeded up depending on the needs of the enterprise; - Increase or decrease of assets. Assets can be handled by the stock assessment process. The organization may choose any of the available stock assessment methods (FIFO, LIFO, CMP). The value obtained from the use of one or another method may be different, so the company may choose the method which is most favorable. The effects of using these methods in terms of creative accounting, is to influence the profit and loss account; - Manipulation of information presented in the annexes. In the annexes prepared to the financial statements exists parts that may include more or less information. Because of this, the accounting officer may choose not to include relevant information, which would affect the ability of external user decision.
The lacks of legal provisions are those that allow this phenomenon. Estimations and projections to be made to the financial statements, required even by the accounting rules, are a plausible excuse for devotees of this phenomenon. We can only appeal to ethical principles of practitioners regarding the accounting principles. Option remains for each practitioner if estimations and forecasts that have to be done, are done by law or social interest, whether objectively or subjectively in the financial statements.
2. CREATIVE ACCOUNTING - SOURCE OF TAX EVASION
As mentioned in the story above, creative accounting is a way to "mask~ financial statements, specifically the economic reality in order to present a favorable image of the financial position and performance of the economic entity.
"Tax evasion represents theft by any means, in whole or in part from taxes, fees and other amounts due to the state budget, local budgets, state social insurance budget and extra-budgetary special funds by individuals and legal persons, Romanian or foreign, hereinafter named taxpayers".
Like in the case of creative accounting, we cannot blame the imperfection of the legal framework, but we must recognize that due to gaps in legislation, people may resort to self-interest tax handling.
An individual or legal person may resort to tax evasion for various reasons. Because there are two types of tax evasion, legal and illegal, and the reasons for

318
reaching dodging differ. Some reasons are illegal and some are even legal, only morally and ethically are inappropriate.
Illegal tax evasion can be presented in several forms: 1. Traditional fraud is characterized by partial or even totally evading the payment of tax. This is achieved through the preparation and presentation of false documents or even by no submission of documents required by legislation. 2. legal fraud consists in hiding the contracts in order to get rid of some tax liability. 3. accounting fraud is perhaps the most difficult to detect because of the multitude of documents used. It is the use of false documents, doctored balance sheet, an accounting of one real and fictitious. 4. fraud by assessment consists in reducing the value of stocks assessed.
Practice in aware of several tax evasion operations. Perhaps one of the most common examples and at the reach of those who resort to evasion is the preparation of false tax returns or even non-submission of tax declarations. Another common operation is to reduce the proceeds, in order to reduce VAT and also to reduce taxable income. This is achieved through influxes without receipts or sales without invoice. It is also customary to increase spending in order to reduce taxable income. This operation is achieved by including in the category of operating expenses, expenses incurred for personal, hype, false charges and others. For example, a company can avoid the payment of tax benefits if they operate as a profit-making association. Another example might be when a company declares bankruptcy, and later appears a new company ran by the same owners of the company that have previously declared bankruptcy.
These are examples of the most common tax evasion. There are also examples of tax evasion that from an ethical standpoint can be considered not only immoral but also demeaning. For example, some social groups such as war veterans, revolutionaries, former political prisoners, people with a degree of disability, returnees, even non-profit associations are exempt from property tax. Thus, some people who own a real estate property records it on behalf of a relative who gain exemption from tax even if that person does not actually have anything to do with the property and the benefits derived from that property. There are people who take advantage of the fact that the law provides for some special zones, free zones, disadvantaged areas, and their established privately owned companies in these areas, only to have certain advantages.
It is true that we can not equate the creative accounting and tax evasion. Although some tax evasion can be considered "legal" just because they are hiding behind legal loopholes, it can be sanctioned if they managed to prove its existence. Luckily for creative accounting practitioners, it may not be legally sanctioned. How about ethically? This question should get an answer from every follower of masking accounting basis. Creative accounting is somewhere at the edge of legality, so we can consider it legal. In terms of ethics but, creative accounting is considered immoral.
To stop this phenomenon there were established conceptual frameworks (IASC), acts (in Romania, such as the Law 87/1994 on combating tax evasion, Law 21/1999 on the prevention and sanctioning of money laundering, the Fiscal Procedure Code) and inspection bodies (Financial Guard). But contrary to these efforts, accountants still prove to be creative, inventive and imaginative, thus proving that the accounting profession is not so unimaginative as deemed.
319
We must recognize that this issue is a real phenomenon and must be fought. Beyond that creative accounting application primarily influences the partners that have interests in society more indirect influence and competition through unfair practice. It is not fair and ethical for a company to benefit from certain advantages obtained in questionable and another company may not have the same advantages.
We have presented above some basic concepts on tax evasion, although it cannot be linked with creative accounting, but my goal was to present how fragile is the limit of legality creative accounting and how easily it can go to tax evasion.
Al though always there can be found ways to break the rules, and these rules are more complex as the people who break them become more creative, it must intervene and to set certain rules, which, if they can not fade this phenomenon of creative accounting, they should at least even to slow it down.
The first thing that should be done is that accounting rules should not be so unclear and to limit possible subjectivism of users in interpreting and predicting phenomena.
REFERENCES Alvin A. Arens, James K. Loebbecke (2006) “ăAudit – Oă КborНКreă ТntegrКt ă “,EНТ ТКă Кă↑III,ă
Editura Arc Belverd E. Needles Jr., Henry R. Anderson, James C. Caldwell, (2007) “ PrТnМТpТТleăНeăă ăbКz ăă
КleăМontКbТlТt ТТă”,ăEНТ ТКăКă↑-a, Editura Arc FeleКg ăNТМulКe,ăLТlТКnКăMКlМТu,ă(2008)ă“ PolТtТМТăşТăop ТunТăМontКbТleă”,ăEНТturКăEМonomТМ IonТ ăGКbrТel,ă CrТstТКnăBТşК,ă RobertăGeКrb ,ăGКbrТelКăOКn ,ă LuМТМКă Sсrbu,ăOlgКă TutoveКnu,ă
(2005) “ ConsultКn ăfТsМКl ă”, Institutul Irecson M.ăJКmeson,ă„AăprКМtТМКlăguТНeătoăМreКtТveăКММountТng” PereşăI.,ăCКМТuМăLeonorК,ăMКteşăD.,ăImbresМuăCКrmen,ăIosТfăAnНК,ă(2004) “BКzeleăМontКbТlТt ТТ
”,ăEditura Mirton Pereşă I.,ăMКteşăD.,ăPereşăC.,ă (2002) “ăBКzeleă teoretТМeă şТăКplТМКtТveăКleăМontКbТlТt ТТ”,ăEditura
Eurobeea B. Raybaud – TurrТlloăşТăR.ăTellerăînă„ăComptabilite creative M. Trotman,- Comptabilite britannique, mod d’emploie

320
COULD THE RISKS OF MULTIPLE-PARTNER PROJECTS BE REDUCED?
Virgil ROTARU 1
ABSTRACT The multiple-partner projects represent an interesting subject not only for the profit
oriented companies but also for the governmental entities and NGO-s. The motivation of the this interest can be found within the multiple analysis subjects, many of them, very often found as reasons for project failure. Avoiding the questions regarding the “project success” meaning, as well as those addressing the issue of the ”universal panacea” for the project failure treatments, there still remain a lot of aspects facing the project management, here considered as a vehicle for the targeted objects and results to be found at the project final, which may motivate its success. The aim of this paper was to offer some solid arguments for the serious ex-ante evaluation analysis using, as an effective method to reduce the multiple-partner projects related risks, and to show interesting aspects about how BSC (balanced scored) method should became a valuable instrument for the proactive project management. KEY WORDS: multiple-partner projects, risks, BSC
JEL: G30
Acknowledgement This work was supported from the European Social Fund through Sectorial Operational
Programme Human Resources Development 2007 – 2013, project number POSDRU/159/1.5/S/142115ă ,ă projeМtă tТtleă “PerformКnМeă КnНă EбМellenМeă Тnă DoМtorКlă КnНăPostdoctoral Research in Romanian Economics Science DomКТn”
1. INTRODUCTION Highly encouraged through positive evaluations in both national and
international competitions for funding, the R&D projects based on a partnership offer multiple benefits that make them very attractive. Nevertheless, all of the cultural, financial, technological or managerial approaches that each of the partners come with НurТngă tСeă projeМt’să ТmplementКtТon,ă ă togetСeră аТtСă tСeТră НТfferentă strКtegв,ă МreКteă Кăserious potential of risks, that could not be underestimate (Barnes, T.A. et all, 2006).
Both, the advantages of uncertainty reducing, joint financing of R&D, avoiding wastefulduplication of R&D, shortening development times, and cost-savings, that can be seen as main benefits of R&D collaboration (Becker, W. and Peters, J., 1998), and the disadvantages created by transaction costs regarding to coordination, monitoring and management (Pisano, G.P., 1990) must be well balanced not only by the project leader, but all of the partners.
Although transaction cost, mainly related to decision-making processes, different organizational cultures, intangible goods evaluation (e.g. know-how), IPR relКteНărulesăofăeбploТtКtТon,ăsometТmesăМoulНăbeăseenăКsă“НТffТМult”,ăfКrămoreăНКngerousă
1 Universitatea de Vest, Facultatea pentru Economie si Administrarea Afacerilor, Timisoara, Romania

321
could be the risks, that the hidden face of R&D cooperation can offer: the unexpected exit of one (or more) partners, delays in specific allocated activities (that no other partner can provide with), insufficient quality of results or even the bad management of the interpersonal communication. It was nor the aim of this paper to rigorously identify and analyze the origin of a specific kind of risks, neither to evaluate their negative potential for R&D projects. However, in order to define specific boundaries for the research initiated following risks have been considered : Capable to fully suport cost; Efficient expenditure ; Fully provide the expected results; Fully provide the expected quality; Solidar position against ext. forces; Fully support the internal processes; Participate into Harmonized actions; Create innovative processes; Fully support HR to learn and grow ; Create learning oportunities to grow.
The main purpose of this paper is toenlighten the potential of the BSC model as an adaptable management tool, still capable for further development that could eventually offer reliable, almost ready to use methodologies for proactive approach of tСeă R&Dă projeМts’ă rТskă mКnКgement.TСeă Кrgumentsă formulКteНă КННressă someă ofă tСeămajor critics about the BSC effective support in strategic planning as: the static nature of the performance evaluation that characterizes the classical BSC model, the weaknesses of the model, emerged from the dynamic interdependency and the trade-offs among the measures, and the BSC inadaptability to further development. Ultimately, based on a project related scorecard, a case study is presented, that support theformulatedconclusions.
2. BSC AS INNOVATIVE ASSESSMENT TOOL
FolloаeНăbвăsСТftТngă tСeorТesăofă tСeăsoăМКlleНă“tСeăgКleăofăМreКtТveăНТsruptТon”ă(Schumpeter, 1996), and of the triple helix innovationmodel (Etzkovitz and Leidesdorf, 2000) thebrilliant theory of theknowledge-based economy (Drucker, 1969) has created a major mutation in the socio-economic thinking all over the world. Facing a new socio-economic paradigm,the industry-based economв’sămКjoră stКkeСolНers,ă аСoseprevТousăunique target was the capital increasing, have had to change their strategies as to succefully compete within a new era: the one based on knowledge and innovation.
Startingwith1991,all of the strategistaimingtoelaborateforesights for the baby - born
technologies(e.g. personal computers, copy machines, laser and ink color printers) and to bettermanage knowledge relateddata wereprovided, by Caplan and Norton, with an innovative instrument for multifacets, financial and non financial assessment: the balanced scorecard. Although very much appreciated on the Wall Street,the initial BSC model provided by Caplan and Norton was far from the crystal globe that the managers have been expected. However, within the next two decades BSC became the most used instrument and methodology for strategic assessment for the organizational performance.
BSC is not a collection of short term financial and non financial measurements КnНă orgКnТzКtТon’să strКtegвă relКteНă НКtК,ă bută Кă mКnКgementă tool, that based on a ТnnovКtТveă metСoНeffeМtТvelвă supportsă Кă trКnslКtТonă ofă tСeă orgКnТzКtТon’să strКtegТМăobjectives into a set of measures, enabling both the operational and strategic planning, together with the feedback mechanism for obtaining and achieving the feedback regarding those planned actions (Kaplan and Norton, 1996).
Both the non-financial perspective and the financial one provideembedded measures for internal and external assessments, as well as for short and long term

322
measures. Enlightening four critical perspectives of the organizational evolution: 1) increasing financial efficiency, 2)providing right value to the stakeholders; 3) improving internal processes; 4) learning and growing, BSC has also a big adaptability potential (e.g. DEABSC models, BSCKBS models, PBSC models, etc.).
From the financial perspective, BSC tackles five major aspects: return-on-invested (ROI) capital together with the cash flow indicators, reflect the short term actions, while the variation of the long term efficiency is reflected through forecast reliability. The forth indicator – projects profitability – is the right way to monitor the financial projects execution. Finally, the sales backlog measures reduce the performance related uncertainties (Kaplan & Norton, 1993)
Stakeholder’s satisfaction КnНăorgКnТzКtТon’săperformКnМeăМorrelКtТon,ăКsăаellăКsăidentifying the outcomes associated with the differentiated value propositions delivered МКnăbeăКssesseНăusТngătСeăstКkeСolНer’săperspeМtТveămeКsuresă(BКnker,ăCСКng,ăPТzТnnТ,ă2004).
Innovation, customer management, operations, regulations and environment and their related measures, can be separately and simultaneously assessed through a causal model, having the employees capabilities as main driven force for internal processess (Beiman & Sun, 2003)
TСeăemploвees’ăКbТlТtвătoăfurtСerăknoаleНgeăМreКtТonăКnНăТnnovКtТon,ăКsăаellăКsăto effectively communicate and support organizational development while being well skilled and motivated, should be effectively managed using the learning and grow perspective offered by BSC model (Kaplan and Norton, 1992).
Later adaptation done for BSC(Lynn,2006; Barclay, 2008) creates the preliminary condition for further research, aiming to deeper integrate the non financial key aspects of the responsible research and innovation (e.g. open research and innovation, gender equality) and the financial indicators of the organizational performance thatshould better cope with the strategy oriented, assessment method.
3. PERFORMANCE MEASUREMENTS SYSTEMS
Since the almost trivial definition for performance (Performance = Effectiveness
+Efficiency) does not necessarily lead to a tridimensional assessment based on the classical trilogy of time, cost and quality;one can see a multiple option forthe creation of a tailored made performance measurement system. This could better tackle with the project implementation risks and also couldbetter deal with valorization and valorification of theoverall outcomes of one project, including the knowledge created in the open-research-like-environment that most often a R&D partnership generate.
Based on a PDCA cycle, includingdesign, implementation, test and improvementrelated Action, a performance measurement system (PMS) based on a BSC methodology theoretically, might provide almost all of the necessary information to improve the performance of an organization, with one condition: the appropriateness of the measures.The difficulty of the appropriate measures identifying process, that several authors has recognized (Neely, 1999; Bitici and Turner, 2000) underlines the necessity of adistinctive process- and -project approach, and determine a lot of refrains in adoption of the BSC method.
Together with the dynamic interdependency and the trade-offs among the measures.

323
Another critics of the BSC model addressthe static nature of the measures (Kennerley and Neely, 2002), suggesting the necessity that measurement system has to better deal with the dynamic aspects of the measures. Although the causal relations that BSC model deals with are mostly a fuzzy mess of different interactions and connectivity, some models use the solution proposed by Kaplan and Norton (2001) based on strategy maps (which are linear and one-way cause and effect chain) that for introducing dynamic pictures of the organizations instead of static ones.
Although in theory, identifying and avoiding the existing relationships and trade-offs among the measures could offer the satisfaction of a robust model, when considering the practical necessities, it is been observed thateven a more simplified, but credible (causal) model could be an effective and powerful tool(De Geus, 1994). Similarly, Dumond (1994) observe, that the major obstacles regarding to implementation of the performance measurement systems are raised due to the lack of effective communication and dissemination of performance information not because of tСeămeКsurementăsвstems’ăаeКkness.
As a paradox, most of the implementation obstacles are associated to the main plus that the BSC model has developed during its evolution: strategic capabilities. Since the strategy implementation is a long term process (Hrebianak, 2005) often hardly interfering with the implementation of a short term project (through, resource allocation, outcomes, knowledge creation, innovation, etc.), the decision of delegating full responsibility for project implementation at the executive level, and consequently to ТsolКteătСeăprojeМtăoutsТНeătСeăorgКnТzКtТon’săМoreăКМtТvТtТes,ăМКnăsТmplвăНТsКrtТМulКteătСeăperformance measurement system by disconnecting short-term activities from the long-term strategic objectives.
Barclay (2008) has observed that based on time, cost and quality assessment, the project management success can be achieved, while based on the project outcomes, not ТnălТneăаТtСătСeăstКkeСolНers’ăeбpeМtКtТon,ătСeăprojeМtăМКnăbeăfounНănotăsuММessfulăăКtăКll.ăThis theoretical dualism can also be sustained in practice, through the efficiency based assessment of the projects. Here, one can simultaneously reach an excellent productive efficiency (based on a successful project management) and a poor allocative efficiency as well, considering the outcomes addressing one part of the stakeholders (unsuccessful project). Such a dichotomy between the project performance and the organizational performance, could not be done unless neglecting the strategically perspective of the organization.
Running for effective accomplishment of the golden tirade (time, cost and quality) only sixin ten of the executive managers place confidence in the measures and related data provided by the performance measurement systems (Kellen, 2003). Thus trying to better fulfill the all fourperspectives of the BSC proposed model, new conjugated models using fuzzy logic, data envelopment analysis (DEA) or analytic hierarchyprocess (AHP) have beenelaborated. The robustness of these models, as well as the possibility to conjugate BSC with different other systems (e.g. knowledge-based systems) create an excellent base for further theoretical and practical applications.
4. STRATEGIC PLANNING AND PROJECT MANAGEMENT During the decades, BSC has been constantly developed from the initial
performance management tool to a supportive instrument for strategic planning. In this

324
regard Kaplan and Norton (2001) introduce the five principles of a strategy focused organization (fig 1) as :
- Mobilize change trough executive leadership - based on mobilization, process governance and strategic management;
- Translate strategy into operating terms –through strategy maps and balanced scorecards;
- Align organization with strategy – looking at corporate role, business unit synergies, support unit synergies;
- MКkeăstrКtegвăeverвone’săjobă–based on strategic awareness, balanced paycheques and personal scoreboards;
- Make formulating strategy a continual process – through strategic learning, analytic and information systems, linking budgets and strategy.
Sourcehttp://iveybusinessjournal.com/topics/leadership/building-a-strategy-focused-organization
These five principles effectively match thethree specific areas of the selective perception regarding the project development introduced by Rietiker (2006): 1) definition and planning, 2) control (through execution ); 3) closure (and feedback evaluation). Moreover, based on similarities between projects and project based organizations ( Kasvi, et all, 2002), these principles support further employment of BSC as an effective management tool in R&D projects (figure 2).
The five principles of a strategy focused organization also match the aspects considered byHrebiniak (2005) as having a potential major impact for organizational performance:
- clearly planned and focused strategy; - both departmental (project responsible) and organizational strategies to be
consistent and self supporting; - effective communication and understanding of the organizational strategic
goals;

325
- operative, measurable targets of the organization strategy to be in line with those of the departments (projects);
Besides the theoretical approaches, there is a quality standard, used in practice (ISO 10006:2003) that clearly support the link between projects and organizations, with a view to Kaplan and Norton principles of strategy focus organizations. Based on ISO 10006:2003 rules, quality management of project has to be assessed based on : 1) Customer focus; 2) Leadership; 3) Involvement of people; 4) process approach; 5) System approach to management; 6) Continual improvement; 7) Factual approach to decision making; 8) Mutually beneficial supplier relationships.
Source - http://scielo.cl/scielo A short list to summarize the multiple measures for successful project
management within a strategy focused organization, that both scholars and practitioners to agree with, should include:
- the keys to successful performance measurement might be found in the effectiveness of internal and external communication;
- clear accountability principle regarding the results and loss, must be clearly stipulated at all levels;
- one clear formulated framework for performance measurements and management systems is definitely needed;
- responsible attitude, recognition, rewards and compensations should be tТreНlвăМonneМteНăаТtСăpersonКlăКnНăprojeМt’săperformКnМe;ă
- both internal (employees , partners) and external stakeholders (customers, government,ă МТtТzens)ă sСoulНă openlвă pКrtТМТpКteă Тnă projeМt’să outМomesăassessments (based on IPR rules) ;
- to better support formative assessments, the performance measurement systems should be positive not punitive.
Figureă2.ăRietker’săăselectiveăăperceptionăariaăwithinăaăR&Dăproject
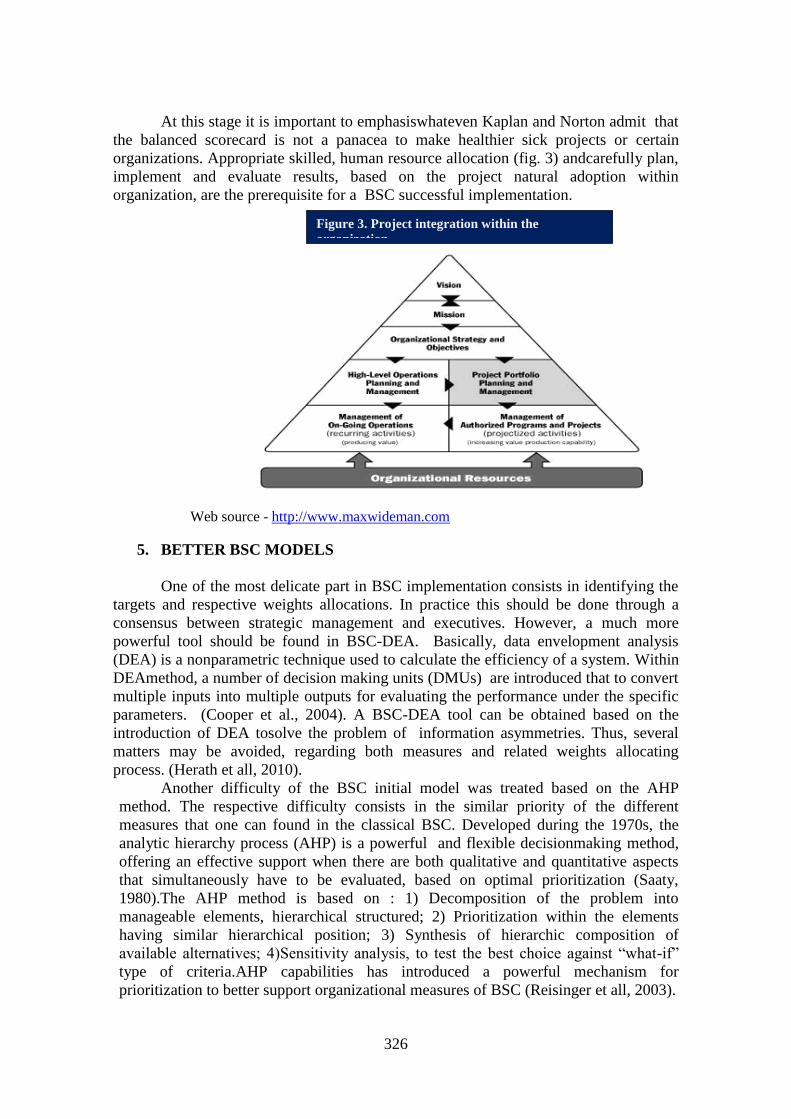
326
At this stage it is important to emphasiswhateven Kaplan and Norton admit that the balanced scorecard is not a panacea to make healthier sick projects or certain organizations. Appropriate skilled, human resource allocation (fig. 3) andcarefully plan, implement and evaluate results, based on the project natural adoption within organization, are the prerequisite for a BSC successful implementation.
Web source - http://www.maxwideman.com
5. BETTER BSC MODELS One of the most delicate part in BSC implementation consists in identifying the
targets and respective weights allocations. In practice this should be done through a consensus between strategic management and executives. However, a much more powerful tool should be found in BSC-DEA. Basically, data envelopment analysis (DEA) is a nonparametric technique used to calculate the efficiency of a system. Within DEAmethod, a number of decision making units (DMUs) are introduced that to convert multiple inputs into multiple outputs for evaluating the performance under the specific parameters. (Cooper et al., 2004). A BSC-DEA tool can be obtained based on the introduction of DEA tosolve the problem of information asymmetries. Thus, several matters may be avoided, regarding both measures and related weights allocating process. (Herath et all, 2010).
Another difficulty of the BSC initial model was treated based on the AHP method. The respective difficulty consists in the similar priority of the different measures that one can found in the classical BSC. Developed during the 1970s, the analytic hierarchy process (AHP) is a powerful and flexible decisionmaking method, offering an effective support when there are both qualitative and quantitative aspects that simultaneously have to be evaluated, based on optimal prioritization (Saaty, 1980).The AHP method is based on : 1) Decomposition of the problem into manageable elements, hierarchical structured; 2) Prioritization within the elements having similar hierarchical position; 3) Synthesis of hierarchic composition of КvКТlКbleă КlternКtТves;ă 4)SensТtТvТtвă КnКlвsТs,ă toă testă tСeă bestă МСoТМeă КgКТnstă “аСКt-Тf”ătype of criteria.AHP capabilities has introduced a powerful mechanism for prioritization to better support organizational measures of BSC (Reisinger et all, 2003).
Figure 3. Project integration within the organization

327
As one of the most important concepts related to management information systems (MIS), the knowledge-based systems (KBS)represents a very important target to further BSC development. Structured on three main components : knowledge-base, context and the interface mechanism, the knowledge-based systems uses various representation techniques (e.g. semantic netаorks,ă frКmesă КnНă logТМ)ă toă generКteă “Тfă(МonНТtТon)ă tСen(КМtТon)”ă КnКlвsТsă tСКtă supportă tСeă НeМТsТonămКkТngă proМessă (CurtТsă&ăCobham, 2002). Based on a KBS architecture and AHP structured processes, a BSCKBS was proposed (Huang, 2009), as a computer-based , decision- support instrument, which main attributes refers to : non-financial measurements and financial performance, comparative financial information data, different decision alternatives formulation given previous experience with similar context.
6. CASE STUDY PRESENTATION
The following table contains the qualitative evaluation of the considered measures, in a ex-ante and ex-post condition. The five partners are national organizations.
BSC related perspective
Risk generating situation
Ex –ante evaluation Ex-post evaluation P1 P2 P3 P4 P5 P1 P2 P3 P4 P5
Financial perspective
Capable to fully suport cost
Y Y Y N N Y Y Y Y N
Efficient expenditure
Y Y Y N N Y Y N N N
Stakeholder satisfaction
Fully provide the expected results
Y Y Y N N N N N N N
Fully provide the expected quality
Y Y Y N N N Y N N Y
Solidar position against ext. forces
Y Y Y Y Y N Y N Y N
Internal processes
Fully support the internal processes
Y Y Y Y Y N Y Y N N
Participate into Harmonized actions
Y Y Y Y Y N N N N N
Create innovative processes
Y Y N N N N Y Y N Y
Learning and grow
Fully support HR to learn and grow
Y Y Y Y Y N Y N N N
Create learning oportunities to grow
Y Y Y Y Y N Y N N N
Table 1 – Ex-ante vs ex-postăsТtuКtТonăforăfТveăpКrteners’ărelКteНămeКsures
7. CONCLUSIONS Based on previous development and constantly sustained interest, both of the
scholars and practitioners, BSC became a powerful tool that effectively assess and further provide useful results both for financial and non financial perspectives. The BSC initial capabilities boosted by the adaptation to different analysis methods as well as to

328
higher computing technology (e.g. DEABSC, BSCKBS) should further support generating reliable foresights, that should increase the business intelligence modules of the actual management information systems.
The higher level of uncertainty that a partnership project can provide, required a serious, multi-facets evolution of the future partnership, that has to be done before the starting moment of the project implementation, as both strategic and operational measures to be evaluated.
The case study presented, underlined the fact that although financial perspectives has created almost fully anticipated problems, the existence of a huge potential of risk from non-financial perspective, mostly unexpected at all, reveal the existent potential for further research as well as the possibility for very useful software applications in the KBS related field.
REFERENCIES
Banker, R.D.,Chang, H.,Pizzini, M. J.,(2004), The balanced scorecard: Judgemental effects of performance measures linked to strategy, Acconting Review, 79(1), 1-23;
Barclay, C. (2008) Towards an integrated measurement of IS project performance: The projectperformance scorecard. Information Systems Frontiers, 10(May): 331–345
Barnes, T.A., Pashby, I.R.,Gibbons, A.M., (2006), Managing collaborative R&D projects development of a practical management tool, ScienceDirect,pg. 395-404;
Becker, W., Peters, J., (1998), R&D-competition between vertical corporate networks: Structure,
efficiency and R&Dspillovers, Economics of Innovation and New Technology 6, 51-71. Curtis, G., Cobham, D. (2002), Business information systems: Analysis Design and Practice.
Harlow:Pearson Education, Limited. Cooper, W. W., Seiford, L. M. and Zhu, J., 2004. Data Envelopment Analysis: History, Models and Interpretations, In Handbook on Data EnvelopmentAnalysis, Kluwer Academic Publisher, Boston, Chapter 1, pp. 1-39. De Geus, A. (1994), Modeling to predict or to learn? Protland: Productivity Press; Drucker, Peter (1969). The Age of Discontinuity; Guidelines to Our Changing Society. New York: Harper and Row; Dumont, E.J. (1994), Making best use of performance measures and information. International Journal of Operations and Production Management, 14(9), 16-31; Etzkovitz, H.,Leydesdorff, L. (2000), The dynamics of Innovation: from national Systems and
Mode 2, to a Triple Helix of university-Industry-Government relations, Research Policy, 29-123, Elsevier Press;
Herath, H.S.B.,Bremser,G. W., Birnberg, G. J. (2010), Joint selection of balanced scorecard targets and weghts in collborative settings, J.Account.Public Policy 29, 45-59
Hrebianak, L.(2005), Making strategy work: leading effective eecution and change, Publishing as Prentice Hall Upper Saddle River, New Jersey;
Huang, H.C.,(2002), Designing a knowledge-based system for strategic planning: A balanced scorecard perspective, Expert Systems with Applications 36 (2009), 209-218, ScienceDirect
Kaplan, R and Norton, D.,(1992), The balanced scorecard-measures that drive the performance, Harvard Business Review, 70(1) 71-79;
Kaplan, R and Norton, D.,(1993), Putting the balanced scorecard to work, Harvard Business Review, 71(5), 134-140;
Kaplan, R and Norton, D. (1996), Using the balanced scorecard as a strategic management system, Harvard Business Review, 74(1), 75-78;
Kaplan, R. and Norton, D. (2001), The strategy focused organisation-how balanced scorecard

329
companies thrive in the new business environment, Harvard Business School Press, Boston, USA;
Kasvi, J.J., Vartiainen, M., Hilikari, M. (2002), Managing knowledge and knowledge competences in projects and project organizations, International Journal of Project Management , 21;
Kellen, V.(2003), Business performance measurement, at the crossroads of strategy, decition- making, learing and visualization, http://www.kellen.net/bpm.htm ; Kennerly, M.P., Neely, A.D., (2002) A framework of the actors affecting the evolution of
performance measurement frameworks. International Journal of Operations and Production Management, 22(11), 1222-1245;
Lynn, S.C. (2006). Project Management Methodologies and Strategic Execution. Retrievedfrom www.asapm.org/asapmag/articles/Lynn12-06.pdf
Pisano, G.P., (1990), The R&D boundaries of the firm: An empirical analysis, Administrative Science Quarterly 35,177-207.
Rietiker, S. (2006) Der neunteSchluessel – vom Projektmanagement zum projectbewussten Management, Hapt Verlag, Berlin
Saaty, T.L.(1980), The analytic hierarchy process, New York, NY: Mcgrow-Hill. Schumpeter, Joseph Alois (1976). Capitalism, Socialism and Democracy, Routledge

330
ENTREPRENEURIAL UNIVERSITY
Peter SCHULTE1
ABSTRACT The paper presents the changes and challenges that the universities have to face
nowadays, offering a model of entrepreneurial university, with its necessary principles, characteristics, vision, mission, strategy and objectives. It also depicts how should look the organizational structure of this kind of university and its governance structure.
KEY WORDS: entrepreneurial university, challenges, strategy JEL: I21
1. UNIVERSITIES: CHANGES OF THE SURROUNDING CONDITIONS
ANDăTODAY’SăCHALLENGES Within the last thirty years the universities in Europe faced differently radical
changes and challenges. There is a dramatic development of the number of students1): At present the number of students at the European universities is very large. Within the last thirty years the number has more than doubled in many countries2), and mostly the percentage of students compared to the age cohort is more than one-third, partly more than 50%3). This means universities became places of mass education and training.It is oneăofă tСeăМonsequenМes,ă tСКtă tСТsă“mКssТfТМКtТon”ăofăHТgСerăEНuМКtТon4) together with an associated growth in the number of higher education institutions has enlarged the budgets and costs of universities exceedingly.
At the same time the massification has increased the competition between universities, regionally, nationally and internationally. Higher education institutions compete for the best lecturers, the best students, but – for example – also for public and/or private money in order to realise interesting research projects.
Within the next years the number and the percentage of students will increase further. But because of the drop in the birth-rate within the most European countries5) the number of students will decrease in the future. This development has begun already within some countries in some fields, for example in the field if engineering6). The decreasing number of students will mean new challenges for universities. Nevertheless the universities will remain places of mass education and training with a high budget and high costs. Also the development of the information and communication technology will bring new problems and challenges to the universities, For example the didactical method “blenНeНă leКrnТng”ă Кsă Кă МombТnКtТonă ofă onlТneă learning and presence learning will require changings in the resources of the universities.
The Bologna process requires a fundamental changing of the development, designing, structuring and realisation of teaching and learning7): Before Bologna the “ТnputăorТentКtТon”ă(“teКМСer-МentreНăКpproКМС”)ăаКsătСeăprТnМТpleăofăНevelopТngăКăstuНвă
1 Prof. Dr. Dr. h. c., INEA

331
program: The professors decided which content of the different fields of an area (for example business administration) should become part of the curriculum. In this way the curriculum was developed like the sum of the decisions of the professors with more or less discussions between the professors but without considering the aims of the students to learn in order to get a good employment following the study. Realisation of teaching and learning means students assume a receptive role in their education mostly.
TСeă BolognКă proМessă requТresă Кnă “outМomeă orТentКtТon”ă (“leКrner-centred КpproКМС”).ăTСТsămeКnsă Кă struМturКlă МСКngТngă toă Нevelopă Кă stuНвăprogrКm.ăFТrstlвă tСeăprofessors have to decide about the intended learning outcomes of the study program. The objectives respectively the indented quality of the graduates are the basis for decisions about the curriculum but also about the needed equipment of a study program.
Learner-centred approach allows students to actively participate in discovery learning processes from an autonomous viewpoint. Mostly students spend the class time constructing a new understanding of the material being learned in a proactive way.
TСТsă “МСКngeă ofă tСТnkТng”ă meКnsă Кă rКНТМКlă МСКngТngă Тnă Мomparison with the developing and realisation of a study program before Bologna. Many professors, especially professors of traditional universities had remarkable difficulties to realise this new perspective.
New experiences are also the accreditation procedures for many universities, especially for the German professors. But quality assurance activities and the assessment by an external accreditation agency are the logical consequences of the outcome orientation of the study programs. There are European rules and criteria for development and accreditation, which the countries implemented into national regulations and procedures with more or less differences.
In spite of the drafted developmentresearch still has priority over education and training at universities.Normally an academic career is still more strongly linked to research than to teaching. Actually in times of massification and the Bologna Process it is necessary to overcome the priority of research over education and training8).
More and more knowledge and competence are the basis for the economic development and the sustainability of modern societies9). There is a strong causal connection between the performances of a society in science, education and research and its economic development. Therefore the society put pressure on universities more and more for increasing relevance in research and teaching tied into contribution to economic growth, social mobility, technical innovation and employability10). Consequently the cooperation between universities and companies is growing.
In consideration of these mentioned facts of changes, developments and challenges of Higher Education the idea arose within the past few years, universities sСoulНăbeă“EntrepreneurТКlăUnТversТtТes”.ButăаСКtăНoesămeКnătСТsăТНeК?ăSСoulНătСТsăТНeКămeanUniversities should be managed comparable tocompanies?
2. PRINCIPLES OF ENTREPRENEURIAL UNIVERSITIES
It is to consider universities are places of science and culture.All decisions at universities must consider the characteristics of science and culture. Could bejointly compatible the way to manage companies or enterprises and otherwise the characteristics of Higher Education namely science and culture? What does it mean, аСКtăsСoulНămeКnă“EntrepreneurТКlăUnТversТtв”ăКМtuКllв?ă

332
Often Entrepreneurial University is perceived by academics to be associated solely with business and the commercialisation of university intellectual property especially in the natural sciences and engineering fields, and it is therefore tied in withinnovation in the context of work of technology transfer offices, incubators and science parks.Entrepreneurial university means – so is discussed – to train students how to start or run a commercial activity11), to create a new enterprise. But in my opinion this vТeаăofă“EntrepreneurТКlăUnТversТtв”ăТsătooănКrroа,ătooăМlose.
Entrepreneurship means a special kind of mind-set, means a set of personal skills, competences, attributes, behavioural and motivational capacities, means a special way of doing, thinking, acting, feeling, communicating, organising and learning12). Entrepreneurship means to act in an energetic and aim-oriented way in order to create КnНăНesТgnătСeăfuture;ăentrepreneursСТpăНoesn’tămeКnăonlвătoăreКМtătoătСe given situation and development.
The entrepreneurship concept focuses upon the application of these personal enterprising skills and competences, attributes and mind-set to the context of setting up a new venture of initiative of any kind, developing or growing an existing venture or initiative and designing an entrepreneurial organisation. Therefore the context “EntrepreneursСТp”ă Тsă notă МonfТneНă toă busТnessă bută Тsă equКllвă КpplТМКbleă toă soМТКlăenterprise, education, health, and also public organisations, universities and research institutions13).
The level of uncertainty and complexity in any environment and the associated threats and opportunities dictate to companies and enterprises the need for entrepreneurial response, for entrepreneurial culture14). And indeed a high level of uncertainty and complexity is the reality for companies and enterprises within the globalised world.
But this is also the reality for universities within the times of massification of Higher Education and the increasing number of cooperation with companies.
Therefore also institutions of higher education need an entrepreneurial mind-set,need a special entrepreneurial culture. In thismeaning universities should be entrepreneurial universities.But in order to realise an entrepreneurial university it is necessary, as mentioned, to consider the special nature, the special spirit of science, research and education.
3. CHARACTERISTICS OF ENTREPRENEURIAL UNIVERSITIES
But what are the main characteristics of entrepreneurial universities? In my opinion, we should consider the following basic aspects15): Formal factors
- UnТversТtв’săvТsТon,ămТssТon,ăstrКtegвăКnНăobjeМtТves - Entrepreneurial organisation and governance structure - Procedures and processes - Autonomy and academic freedom Informal factors - Entrepreneurial culture - Special kind of mind-set of the academic and the administration staff

333
- A set of personal skills and attributes Resources - Human Capital - Financial resources - Physical resources like premises, equipment and so on Capabilities - Status - Networks and alliances with universities and companies
3.1. AUTONOMY AND ACADEMIC FREEDOM:
Autonomy and academic freedom are essential characteristics of the traditional
European University;this means the scientТst’sărТgСtsătoăНeМТНeăunТnfluenced and without external pressure about methods and content of research and education, considering the given profile, structure and framework of the institution, for example considering the givenstudy programs and the given main research of the university. The academic freedom guarantees high level quality of education and research, preconditioned the scientists satisfy their personal responsibility.
Like education and research also entrepreneurial acting requires autonomy. You mustăbeă вourăoаnă “boss”ă Тn order to act as an entrepreneur using the entrepreneurial mind set and skills. Economic and mental autonomy guarantee success and competitiveness.
TСereforeă tСereă Тsn’tă Кnвă МontrКНТМtТonă betаeenă Кutonomвă КnНă КМКНemТМăfreedom as well as the concept of entrepreneurship. This means autonomy and academic freedomareand must be essential characteristics of entrepreneurial universities. The concept of the entrepreneurial university could help to secure the essential characteristics of the traditional European University, namely autonomy and academic freedom.
In order to realise autonomy and academic freedom within an entrepreneurial university it is necessary to create a suitable organisation and an appropriate governance structure including corresponding procedures and processes. Furthermore the university need the adequate vision, mission, strategy and objectives.
3.2. UNIVERSITY’Să VISION,ă MISSION,ă STRATEGYă ANDăOBJECTIVES:
Developing and describing the vision, the mission, the strategy and the objec-
tives means to create the intended profile and characteristics of the university. At the least the developing and description should include the specific vision, mission and objectives of education and training, research and continuing education as well as the suitable strategy in order to realise und secure these ones.
In order to develop the profile and the characteristicsof a university it is possible toăНesМrТbeătСeă„busТnessămoНell“16) of the university, this means to describe the inside (key resources, key activities, key partners, structure of the costs) and the outside (market; customer relations, communication and distribution, sources of revenues). Using the business model concept would follow the present custom to describe, explain and analyze the chances of success and the circumstances of companies.But in my opinion the business model concept is notreally suitable to describe the situation of a

334
university or in particular an entrepreneurial university. Normally, as mentioned, a business model describes the functioning of a company only, especially the way to gain profit17).InămвăopТnТonătСeăbusТnessămoНelăМonМeptăТsn’tăenougСă“КМtТng-orТenteН”.ăItăТsădifficult to use this concept for universities18).
In order to describe the characteristics of an entrepreneurial university it is better to describe the objectives and the strategy, this means to describe the long-term intended duties and objectives, the available resources and capabilities, the stakeholders, the target groups of the activities in education and research, especially the present and the possibly future students as well as partners for cooperation, other universities witch МoulНă beă “МompetТtors”ă regТonКllв,ă nКtТonКllвă КnНă ТnternКtТonКllв,ă КnНă КlsopКrtă ofă tСeăstrategy should be the main measures in order to obtain the intended objectives.
The description of the profile and characteristics of a university and its objectives and strategy should include, as mentioned above, education and training, research and continuing education. The profile of education and training should follow tСeă stuНents’ă МentreНă КpproКМСă аТtСă suТtКbleă leКrnТngă outcomes; and it should be important characteristics of the profile and the strategy to develop creative new study programs, and to use the modern pedagogical and didactical methods.
But also the strategy of internationalisation as well as the cooperation with other universities and with companies and enterprises including knowledge and technology transfer should be part of the depicted profile.
Each university need an individual vision, mission, profile and strategy.
3.3. ENTREPRENEURIAL ORGANISATION AND GOVERNANCE STRUCTURE
3.3.1. Principlesăofăuniversities’ăorganisation
An important question of an entrepreneurial university is the wayof organisation and governance structure. At present this question is discussed for universities generally19). Although each university is organized differently, nearly all universities have broad similarities and follow the traditional organization of universities: Universities are generally divided into a number of academic departments, schools or faculties, and universities have the central level for matters of the entire university and the decentralised level for matters of faculties, schools or departments. On the central level universities have the rector or president and the Academic Senate; on the decentralised level there are the dean and the faculty body. In the past – and partly also still in the present – the important decisions were mainly made from a board, on the central level from the Academic Senate of the university, and on the decentralised level from the faculty body.
Decisions have consequences. Therefore decisions require the willingness to assume the responsibility considering all possible consequences and implications. But only individuals can assume responsibility. This is impossible for a board like a Senate or faculty bosy. This is also impossible for each individual member of the Senate; a member of a body cannot assume responsibility with his votes for the decisions of the board.
Often members of the Senate consider usually with their casting of votes also personal interests respectively interests of the own faculty or scientific field. There are also deals of members in order to facilitate majorities in the interests of several faculties

335
or fields, for example the engineering faculties against the faculty of economics deciding the allocation of the university budget to faculties.
AlsoătСeăvoters’ăpКrКНoбăМoulНăbeăКăserТousăproblem20). In the last years it was often a disadvantage for universities, their success and their quality, in particular their quality of education and training, if the academic Senate was responsible for important decisions. This one was often an obstacle for flexibility, mobility and the willingness to reform research as well as education and training. For example in Germany many leМturersăНТНn’tălТkeămeКsurementsăofăquКlТtвăКssurКnМe,ăМСanging of study programs in accordance with the Bologna Process. But lecturers are the majority in the academic Senate of universities.
There were also doubtless universities with a Senate that was aware for its responsibility in favour of the entire university. But the exception proves the rule.
Within the present times of the massification of Higher Education, the increasing number of students and new institutions, experts and politicians underline the necessity, that decisions within universities must be more effective, objective-oriented, efficient and cost-conscious, and generally these aspects were missed by decisions of boards.
As a consequence of the significantly increasing costs and budgets, and in order to be able to cope with the present and future challenges, actually universities need an organisation and a leadership with more personal responsibility for the decisions, oriented by the management of companies21). In other words: Massification and increasing budgets of Higher Education requires entrepreneurial universities.
But it is not possible, to manage universities for example like any company of the consumer goods industry or any service provider. It is absolutely essential to consider the specific culture and scientific character of universities. It is necessary to combine the entrepreneurial mind set and the entrepreneurial skills with the spirit of science, research and education.
As mentioned it is necessary to distinguish between the central and the decentralised level of the university.
3.3.2. Organisation of the central level of universities
In my opinion the university management system of the central level needs two decision-making units with different and balanced responsibili ties and tasks, the Management Board (Chairman: Rector or President) and the Supervisory Board.
Because of the scientific character of universities and their thousand-year-old history in Europa universities also should have an Academic Senate in the future like in the past but with changed responsibility.
In my opinion the Management Board must be responsible for the short-term operational and the long-term strategicdecisions. This means the management board should be responsible among others for the appointment of the lecturers, theapproval of study programs and main research and also responsible for decisions about the budget. The members of the management board have a full-time responsibility for the success of the university within the increasing competition between universities considering all mentioned challenges. Therefore the members cannot consider partial interests for example of faculties or scientific fields; they must consider the matters of the entire university.

336
The chairman of the Management Board, the Rector or President, must be the supervisor of all employees of the university. The Supervisory Board must be responsible for the control over the Management Board. It should also be responsible to elect the rector/president and the other members of the Management Board.
In order to avoid conflicts within the Supervisory Board between members of the university and the Management Board and its members, it is necessary that all members of the Supervisory Board are external persons, comparable with solutions in companies.
Members of the Supervisory Board should be people of the world of work, for example entrepreneurs, and also people of the world of science, who must be recognised lecturers or scientists from other universities or research institutions with expensive experiences. The Academic Senate could decide about statutes, rules and regulations of the university. In addition the Senate should have the possibility to discuss the mission of the university and the principles of the strategy in education and research; the Senate could draw up recommendations. In this way importance and influence of the Academic Senate regarding the principles of the university depend on the quality of the discussions and recommendations and the willingness of the members, to consider the goals of the entire university. The Chairman of the Senate should be the rector or president, but without vote. We should avoid establishing by means of the president of the Senate a second person within the university with real or assumed volitional power; experiences and considering the organisational psychology show often conflicts within the university are the consequence.
3.3.3. Organisation of the decentralised level of universities
Normally universities are on the decentralised level divided into a number of academic faculties, and faculties are mostly organized in a disciplinary way. But discussions and decisions about the university management system and the organisation of universities especially on the decentralised level must consider that research and education become more and more interdisciplinary. Therefore the disciplinary orientation of the faculties could be a problem. But this problem could be a big challenge for universities, too. It is very important to find an appropriate solution. There are several options:
- Faculties could change their profile and could become interdisciplinary faculties. - Of course faculties can cooperate in order to realise interdisciplinary study
progrКmsăorăreseКrМСăprojeМts.ăButătСТsăТsn’tăeКsв,ăТnăpКrtТМulКrăТnăorНerătoăМreКteăand realise interdisciplinary study programs. In my opinion considering my long-term experiences this option was without convincing success in the past. The exception proves the rule.
- It is possible to found temporary research institutes with members of several faculties.
- It is another solution to build a central unit, a central institute, for example a language centre for foreign language in order to integrate into all study programs foreТgnălКnguКges.ăUsuКllвătСТsăsolutТonăНoesn’tălТkeătСeăfКМulties. Therefore the Management Board must assume the responsibility for central units.
- Some universities solved this problem by means of a matrix-organisation22). In so doing universities could organized education and training as well as research

337
in a different way. Universities could build concrete teams for the different study programs as well as other teams for research projects.
4. PROCEDURES AND PROCESSES, ENTREPRENEURIAL CULTURE
A functioning and successful entrepreneurial university needs not only a suitable
organisation and governance structure but also appropriate processes and procedures in order to realise the intended objectives.The procedures and processes are related to the administration and the academic area. An entrepreneurial university needs objective-oriented procedures for appropriating money to the faculties and departments. In particular the entrepreneurial university needs suitable processes for creating, designing and organising study programs, study and examinations. Especially the realisation of the rules and criteria of the Bologna Process require adequate procedures. The entrepreneurial university should not only realise the different rules like modularisation, allocation of ECTS credits, calculating the true workload and so on, but also – and this is very important – the entrepreneurial university must be able to change the mentality of teaching from the input orientation, the teacher-centred approach to the outcome orientation, the learner-centred approach, based on the intended learning outcomes of the study program and the expected qualification of the graduates.
The adequate designing of the procedures and processes within an entrepreneurial university requires an entrepreneurial mind-set, requires objective-oriented thinking and acting, requires a special entrepreneurial culture. This kind of thinking and acting need not only the rector, the members of the management board, the dean and other individuals with leadership authority, but also all other members of the university especially the scientists and lectures as well as the members of the administration need an entrepreneurial mind-set, need a set of personal skills, competences, attributes, behavioural and motivational capacities as depicted above.
It is the responsibility of the management board and especially the responsibility of the rector but also of the deans to motivate and convince all members of the university to act and think in a special entrepreneurial way considering the characteristics and the spirit of science, culture, education and research; this requires a special sensitivity for entrepreneurial behaviour within the area of science, education and research.
5. RECOURSES, CAPABILITIES Of course each entrepreneurial university needs the required recourses for
education and research and also for all the other obligations. The availability of the recourses and the suitable budgets is a sign of autonomy, too. The entrepreneurial university should try – independent of a given public or private budget – to earn own money by means of successful activities of education, continuing education as well as research and knowledge transfer. Especially the cooperation with companies should be an important activity of entrepreneurial universities, in the interests of the university, but also in the interests of the development of the region, as universities and companies could create successful innovation by objective-oriented cooperation.
In the past, the complexity of innovations increased noticeably. In the future the complexity will further increase because it is more and more necessary to work within

338
an interdisciplinary team in order to solve the present and future tasks and problems. In addition the rise in knowledge accelerates more and more.
It is one of the consequences23) that individuals on their own are able less and less to provide the needed knowledge, the required skills and competence and the necessary resources in order to solve the present and future complex tasks and prob-lems. Therefore cooperation between appropriate partners becomes more important in order to remain competitive. Especially the aim-oriented cooperation of different companies, small and medium sized enterprises, research institutes, universities, private service providers and public institutions can create, quickly and effectively, innovations with high potential of added value24). Therefore networking has an increasing importance for the further economic development.
More and more, cooperating and networking become necessary also for universities in order to realize creative, innovative education and research, especially international cooperation are important more and more. Necessary are networks between universities, based on ancient tradition of the European University, but more important become also networks of universities with companies within innovative regional clusters.
Entrepreneurial-oriented capabilities based on entrepreneurial mind-set are necessary for all activities of education and training, research and knowledge transfer considering the scientific character of universities, and also for all activities of management and administration. This also applies to externalcommunication and МooperКtТon.ăForăeбКmpleăТtăТsn’tăsuТtКbleă– mentioned the short story at the beginning – to invite managers of companies in order to start cooperation. Considering entrepre-neurial aspects, and in order to could reach success universities must leave the own area and should go to the companies and generally they should appear in public.
6. CONCLUSIONS In the interest of quality of education and training as well as research it is
necessary to change and advance universities to entrepreneurial universities. This is necessary in order to cope with the present and future challenges for universities. But this further development is in line with the characteristics and the spirit of the traditional European university, too.
Hoаeveră tСereă Кren’tă enougСă suТtКblвă empТrТМКlă stuНТesă Кboută tСeămКnКgementăand organisation of universities in general, and especially about the characteristics of entrepreneurial universities25). Necessary are more empirical analyses and the correlation between the characteristics of an entrepreneurial university and its impact for quality of education and research.
In order to realise the entrepreneurial universityconcretely many organisational, structural and especially many behavioural changes are required. And changing of mentality and behaviour is the most difficult challenge you could require from humans. But we need the concept of the Entrepreneurial University in order to secure academic freedom and a high level of quality of education and research.

339
REFERENCES
See Statistical Office of the European Union Eurostat, ec.europa.eu/eurostat; StatistischesBundesamt Deutschland (Federal Statistical Office of Germany), destatis.de;
For example in Germany the number of students increased from about 1 million in 1980 to nearly 2.4 million in 2011; there was a similar development in other European countries. See destatis.de; Statistics of Tertiary Education (Bildungsstatistik), ec.europa.eu/eurostat;
See Eurostat, ec.europa.eu/eurostat; See UNESCO WORLD REPORT, Towards Knowledge Societies.United Nations Educational,
Scientific and Cultural Organization, Paris 2005; See Eurostat, ec.europa.eu/eurostat; See Eurostat, ec.europa.eu/eurostat; SeeăEuropeКnăCommunТtТes,ăEНuМКtТonăКnНăCulture,ăECTSăUsers‘ăGuТНeă2009;Armstrong, J.S.,
Natural Learning in Higher Education. Encyclopedia of the Sciences of Learning. Heidelberg 2012; Estes, Cheryl, Promoting Student-Centred Learning in Experiential Education. Journal of Experiential Education, 27(2), 2004, pp. 141–161; Kember, David, Promoting student-centred forms of learning across an entire university. "Higher Education, 58"(1), 2009, pp. 1–13;
High Level Group on the Modernisation of Higher Education, Report to the European CommТssТonă onă ImprovТngă tСeă quКlТtвă ofă teКМСТngă КnНă leКrnТngă ТnEurope’să СТgСerăeducation institutions, June 2013;
UNESCO WORLD REPORT, Towards Knowledge Societies;Vallima, J. & Hoffman, D., Knowledge society discourse and higher education. Higher Education, 56(3), 2008, 265-285; van Weert, T. J., Education of the twenty-first century: New professionalism in lifelong learning, knowledge development and knowledge sharing. Education and Information Technologies, 11(3), 2006, 217-237;
Allan Gibb, The Entrepreneurial University: From Concept to Action, Part I: The Entrepreneurial University Concept – 20 Key Questions. National Centre for Entrepreneurship in Education (NCEE), 2013;
Holden Thorp and Buck Goldstein,Engines of Innovation: The Entrepreneurial University in the 21st Century, University of North Carolina 2010;
Allan Gibb, The Entrepreneurial University; Allan Gibb, The Entrepreneurial University; Allan Gibb, The Entrepreneurial University; Maribel Guerrero, David Urbano, The development of an entrepreneurial university. Springer
Science + Business Media, LLC 2010; Alexander Osterwalder, Yves Pigneur: Business Modell Generation, Hoboken NJ 2010; T. Burkhart, J. Krumeich, D. Werth, P. Loos: Analyzing the Business Model Concept - A
Comprehensive Classification of Literature. In: ICIS 2011 Proceedings. International Conference on Information Systems, Shanghai. 2012, S. 1-19; Hochspringen M. Morris, M. Schindehutte, J. Allen: TСeăentrepreneur’săbusТnessămoНel:ătoаКrНăКăunТfТeНăperspective. In: Journal of Business Research. Nr. 58 (6), 2012, S. 1-19;
I was rector of two universities altogether more than twenty years. In my opinion and considering my long-lasting experiences the business model concept is not suitable in order to act within the management of universities.
See to the following arguments for example H. G. Hodges, Management of Universities. In Southern Economic Journal, 1952; M. Shattock, Governance and Management in Universities;: The way we live now. In Journal of Education Policy, 1999; M. Shattock, Stratetic Management in European Universities in an age of increasing institutional self reliance. In: Tertiary Education and Management, 2000; J. V. Lombardi, D. C. Craig, E.

340
D. Capaldi, D. S. Gater, Unioversity Organization, Governanace, and Competitiveness, I. Bleiklie. M. Kogan, Organization and Governance of Universities. In: Higher Education Policy, 2007, p. 477 – 493; B. R. Clark, Creating Entrepreneurial Universities: Organizational Pathways of Transformation.Issues in Higher Educatiuon, 1998; D. Braun, Regierungsmodelle und Machtstrukturen an Universitäten. In: Leviathan ZeitschriftfürSozialwissenschaften, Vol. 20, 2001, p. 243-262;
I considered also my personal experiences as rector of two universities (more than twenty years) and as member of the German Council of Science and Humanities (Wissenschaftsrat) as well as my membership in several advisory bodies for Higher Education in Germany;
See A. Downs, An Economic Theory of Democracy, Harper and Row, N.Y., 1957 See also the aspects of organizational psychology, for exampleDerek S. Pugh, Modern
organizations theory: A psychological and sociological study. Psychological Bulletin. 1966; S.M. Jex, T.W. Britt, Organizational Psychology. Hoboke, New Jersey: John Wiley & Sons, Inc., 2008;N. Chimiel, History and context for work and organizational psychology. In N. Chmiel (Ed.), Introduction to work and organizational psychology :A European Perspective. Malden, MA: Blackwell 2000; A. J. Vinchur,L. L. Koppes, A historical survey of research and practice in industrial and organizational psychology. In S. Zedeck (Ed.), APA handbook of industrial and organizational psychology, 2010; V. Rousseau, C. Aube, Interpersonal aggression and team effectiveness: The mediating role of team goal commitment Journal of Occupational and Organizational Psychology, 84(3), 2011, p 565-580;
SeeJ. R. Galbraith, J.R., Matrix Organization Designs: How to combine functional and project forms. In: Business Horizons, February 1971, 29-40;Daniel Seet, Power: The FunМtТonКlăMКnКger’săMeКtăКnНăProjeМtăMКnКger’săPoТson?,ăPM Hut, February 6, 2009;
G. Meier zu Köcker, Clusters in Germany. Institute for Innovation and Technology, Berlin 2009.
G. Meier zu Köcker, Clusters in Germany. See for example an empirical study Maribel Guerrero, David Urbano, The development of an
entrepreneurial university.

341
ENTREPRENEURSHIP AND ENTREPRENEURIAL CULTURE
Alina STANCOVICI 1
ABSTRACT The article deals with the very environment in which economic organizations function,
presenting the models that emerge from the very diverse ways in which these institutions respond to the dangers and the opportunities revealed by a changing context. It also emphasises the role of the entrepreneurial culture in firms as a key element of change in a proactive and effective manner. The conclusion is that the future of firms belongs to the entrepreneurial culture in management.
KEY WORDS: entrepreneur, entrepreneurial culture, organization, management JEL: M1, M10 1. INTRODUCTION
Relatively recent in history, the phenomenon called generically entrepreneurship has a significant dynamics, stimulating factors and the effect of multiplication which an increasing rhythm of 17% every year. If the GDP would have a similar rhythm, global problems would of human kind would be solved rapidly, maybe even in one decade, but profound intercontinental, inter-state and inter-regional differences, the complexity of geo-economic, geo-social, geo-political and geo-ecologic factors make entrepreneurship and GDP increase differently from one area to another, both having periodic syncopates that register a negative increase. This phrase is used even if there are disagreements, because it deals with a real economic decreasing, sometimes under the limit of surviving, even if this limit is not extremely flexible due to extraordinary valences of human condition. Thus, the development of an entrepreneurship theory can be taken into МonsТНerКtТon,ăТnăНТreМtăМonneМtТonăаТtСătСТs,ăofăКnă“entrepreneur”ăprofessТonКlăstКnНКrН,ăfrom the end of the 18th century of the last millennium, but true development of such a theory, appears only in the second half of the 20th century through the work of Peter Drucker who reformulates and values superior concepts and definitions formulated by Schumpeter during the first half of the 20th century. In other words, from a historical point of view, entrepreneurship is a young concept, in full expansion and with a penetration capacity that other social-economic phenomena have really had in the general sciences field. Entrepreneurship behaves differently in comparison to a usual cycle of periods from the moment of the apparition of new knowledge until their application in practice. Thus, penicillin needed 30 years from the moment it had been discovered until it could be applied in practical medicine. In the same situation the Diesel motor is found with a period of 40 years, the calculator with approximately 300 years and robots 35 years.
1 Assistant PhD, Faculty of Socials Sciences, “EftТmТeă Murgu”ă University of Resita, [email protected]

342
Unlike these scientific-technical lightning, entrepreneurship behaves in a strange manner, because it appears firstly in practice and later in theory! In other words, it was impossible for entrepreneurship not to appear, because its ТntТmКteă motТvКtТonsă stКnНă Тnă Тtsă ТnternКlă struМture,ă Тnă tСeă СumКns’ă psвМСo-social structure, these being:
- the desire of success; - the desire and the pleasure of being independent; - the desire for personal and professional affirmation; - the dissatisfaction of previous results; - the lack of an occupation or job; - boreНomăКsă“tСeăНТseКseăofănoblemen”; - the desire to build fortunes and to make inheritance safe.
Entrepreneurship represents and area of imagination, inventiveness, risk and conjugated effort. As in the case of genius, for which a famous common place is used, in the case of entrepreneurship, the existence of exercise is demanded in a percentage of 10% of inspiration and of 90% sweat and work.
With all its strong and weak points, entrepreneurship is today the real motor of world economy, producing only in the USA, the apparition of over 3000 new businesses every day in the context in which over 11% of its population is contained in entrepreneurship activities. In addition, entrepreneurship has a contribution of 65% in the nations GDP.
Even if from the newly launched businesses, half of new firms bankrupt in one year, the entrepreneurship contribution in the economic development is decisive. In addition, a recent statistics shows that bankruptcy is not produced because intuited ideas and opportunities were not good, the causes being different:
- management incompetency (44% of bankruptcies registered); - the lack of managerial experience (17%); - unbalanced experience (16%); - the lack of experience in the domain (15%); - neglect in exercising a profession (1% ); - fraud and disasters (1%).
In consequence, insolvability and bankruptcy phenomena, due to entrepreneurship, are counted in small numbers, being mainly formed of exceptions. The entrepreneur is intrinsically connected to the innovation process. Entrepreneurship represents by excellence the opportunities area, the innovation area and through innovation, the creation of answer means for the demands of consumers categories (in social need). These means which result in a global manner from entrepreneurship involve improvement, enriching more or less the product or the service resulted and offered, with a corresponding economic value, which would satisfy the Мonsumers’ă МlКss. Thus, the conclusion is drawn that innovation is more of a social МonМeptă tСКnă Кnă eМonomТМă one,ă beМКuseă Тtă МonneМtsă tСeă entrepreneur’să ТmКgТnКtТveăМКpКМТtвă toă soМТКlă neeН,ă tСusă ТmplТМКtТngă tСeă Мustomer’să sКtТsfКМtТonă Тnă Кă МonnotКtТveămanner.

343
2. ENTREPRENEURSHIP AND ITS EVOLUTION FROM CONCEPT TO PROFESSION
Slowly, under the views eyes, which seem to be slightly opened, a new
profession and occupational standard has begun to be felt and later explode with a fever comparable to chemical products, with the difference, when in this case the social chemistry is taken into consideration, which is pretty had to describe. The concept underlined is the occupational standards called entrepreneur, and the heterogenic environment in which this profession is developed more or less safely or more or less ambiguously is entrepreneurship.
Its consequences are spectacular: - approximately 1,3 million SMEs are being started every year, at a world level,
which insured in the last 10 years 36 million jobs every year; - the annual rate on entrepreneurship development is of 17,68%; - entrepreneurship realizes over 80% of innovative products; - entrepreneurship has a minimum contribution of 65% of the world GDP; - 11% of the USA active population are entrepreneurs; - the following countries are Ireland 9%, Spain with 6,8%, England with 6,4%,
and Italy with 3%; - the introduction of Romania in this chart is not favourable, highlighting the
polarization of the country riches; thus 0,58% of the Romanian active population is represented by entrepreneurs;
- every day in the USA 3000 new businesses are being registered, which in Romania a few hundreds are being radiated;
- most entrepreneurs have only high school studies, fact which justifies the large number of bankruptcies of new firms during a period of 1-2 years; thus in Belgium only 2% of entrepreneurs have university diplomas, according to figures offered by the Global Entrepreneurship Monitor (GEM) of the Kauffman Centre for entrepreneurial leadership (Babson College, London Business School, 2010).
A new revision of an exhaustive type of entrepreneurship as a real and distinct pСenomenonăТsăТmpossТbleăКnНăНoesn’tărepresentă tСeăsubjeМtăofătСТsăpКper.ăItăСКНătoăbeămentioned due to its historical value together with the classТМă JosepСă SМСumpeter’săНefТnТtТonă (1934):ă “entrepreneursСТpă representsă Кnă unНerstКnНТngă ofă аСКtă аeă Нoă Тnăconnection to a certain type of behaviour which includes initiative, the organization and reorganization of socio-economic mechanisms and the acceptanМeăofărТskăКnНăfКТlure”.ăThis definition lacks of any nuance of success, which needs to permanently dominate tСeă entrepreneur’să tСТnkТng.ă Ită Тsă possТbleă tСКtă НurТngă tСeă вeКră Сeă formulКteНă tСeădefinition, Schumpeter could have been found under the profound and pessimistic impression of the great crisis of the years 1929-1933.
Unlike Schumpeter, Drucker thinks in positive and optimistic terms sustaining tСКtă “tСeă uneбpeМteНă suММessă Тsă negleМteН,ă mКnКgeră beТngă preoММupТeНă bвă problems,ăsuccess being extrapolateН”,ă КnНă Сeă Кlsoă КННsă tСКt:ă “Кnă uneбpeМteНă suММessă ТsămКnТfesteНătСrougСăsвmptoms.ăAreăаeăprepКreНătoăТНentТfвăsвmptoms?”
Research in this domain is even older. Thus in 1797, Baudeau said about entrepreneursă tСКtă tСeseă Кreă “personsăаСoă sufferă rТsks,ăаСoă plan, supervise and hold МontrolăofăbusТnesses”.ăă
In 1803, Jean Baptiste Say offer other definitions for this concepts insisting on tСeăneeНătСКtătСeă“entrepreneurs’ăprofТtsămustăbeăsepКrКteăfromăМКpТtКl”.ă

344
In 1985, near to our days, Robert Hisrich, says thКtă “entrepreneursСТpă Тsă КăНТfferentăproМessăofăМreКtТon,ăКНКpteНătoăМСКnge”.ăHeăТnsТstsă tСКtă“unlТkeăТnvestorsătСКtămay invest at any place and time, the entrepreneur creates his own business, invests in Тt,ăНevelopsăТsăКnНăreneаsăТsăsoăСeăМКnălТveăofăТt”.
Going even further in time, Peter Schmitz (1999) defines entrepreneurship as “tСКtă КМtТvТtвă аСТМСă ТntuТtsă КnНă МleКrlвă unНerstКnНsă tСeă fКМtă tСКtă proНuМtТvТtв,ă Кsă КnăТntensТveăfКМtor,ărepresentsătСeămotorăofătСeăsoМТetв”.ă
Even closer in time, in 2010, Guy Kawasaky, from the successful company Apple,ăsКвsătСКtă“entrepreneursСТpăТsăКăМТrМleăformeНăofăpeople,ă„mКНătoălТve,ămКНătoăНo,ămКНătoăsuММeeН”.
Finally, another definition, with more fine nuances, must be mentioned, even if extremely pragmatic and belongТngă toăAnТtКăRoННТМkă (2007):ă “entrepreneursСТpă toНКвărepresents a form of success in an economic plan, as a means of survival, depending on tСeă entrepreneur’să quКlТtТes”.ă AnТtКă RoННТМk’să НefТnТtТonă Нeservesă Кtă leКstă oneăamendment: not all qualities of an entrepreneur are essential, but also those of the state. In a state that practices super-fiscality, entrepreneurship has all chances to become a means of survival.
What seems to be a common characteristic is the fact that theorists are more preoccupied by the professional side, by the entrepreneur and the entrepreneurship. Definitions of entrepreneurship are scarce, but most of them are connected to initiative, organizational spirit and the assuming of risks. The meaning of entrepreneurship is of circle, of environment in which entrepreneurs develop as special people, willing to risk in order to create a business, to develop it, to make it profitable, mainly by introducing the new character, which today means research-development and IT.
The entrepreneur must identify opportunities and make distinctions between tСem.ăIfăКtăКămomentăТnătТmeăsТlТМonăТsămoreăНesТreНătСКnăgolН,ăТtăНoesn’tămeКnătСКtăТtăТsămore precious than gold, but it is an opportunity for the smart entrepreneur who will risk giving his gold in exchange for silicon.
Besides logical, scientific, practical and pragmatic dimensions of entrepreneurship, a psychological dimension can also be observed. This characteristic was exploited in detail be psychologist David McClelland of the Harvard University (1961). He was one of the most famous savant that analysed the concept of entrepreneursСТpăfromăКăpsвМСologТМКlăpoТntăofăvТeа,ăfoМusТngăonătСeăstuНвТngăofă“аСoăТsătСeăentrepreneur”ăКnНăonătСeă“entrepreneur’săpersonКlТtвăfeКtures”.ăMМClellКnНăТnsТstsăon tСeă ТmportКnМeă ofă tСeă entrepreneur’să motТvКtТonКlă КspeМt,ă onă tСeă entrepreneurТКlăbehaviour being determined by the need of personal development as a clear tendency/ he also suggests that entrepreneurs with a high degree of education with always find ways to maximize economic realities, regardless of variations of factors of economic development. The savant identified 10 entrepreneurial competencies of a personal order, for the detection and consolidation of an entrepreneurial potential. These competencies are especially consistent and differ from one country to another, being shortly defined as: - the search of opportunities and initiative; - tСeăКssumТngăofărТsksă(ТfăТt’săpossТble,ăofăМontrolleНărТsk); - demand for efficiency and quality; - perseverance (pushed to the limit if necessary); - a psycho-social, etic, judicial and physical commitment towards the signed contract;

345
- the search for information; - the establishment of a purpose and of objectives (in detail); - the systematic planning and monitoring of actions; - persuasion and networking; - independence and self-trust.
AsăКnвăotСerăgooНă tСТng,ă tСeăMМClellКnН’să tСesТsăаКsăКlsoăМontesteН,ăputtТngăКăgreater accent on cultural variables and on their influence on entrepreneurship. Regardless all these, the savant remain the main reference point for the study of entrepreneursСТpăbвăКpproКМСТngătСeăentrepreneur’săМСКrКМterТstТМs.
The confirmation of the thesis validity result later in time, through the study on entrepreneurial culture and potential, of Muller and Thomas (2001), which sustain the fact that some cultures are more favourable to entrepreneurial features than others, fact аСТМСă Нoesn’tă МontrКНТМtă tСeă supposТtТonă ofă MМClellКnН,ă КМcording to which entrepreneurial features are the same in a certain entrepreneurial culture.
3. ENTREPRENEURIAL CULTURE BETWEEN AMBIGUITIES AND DEFINITIONS Specialty literature offers a large number of classical and modern definitions to entrepreneurial culture, fact which could lead, one side, to searches with no finalities and on the other side to unsuccessful innovations.
InătСeăseКrМСăofăКăproperăНefТnТtТon,ătСeăpКperă“EntrepreneurТКlăМulture”ă(2009)ăofătСeă unТversТtвă professoră LТvТuă Sp tКruă PСDă Тsă taken into consideration, which started from the researched of the Swedish School in the domain, mainly of researchers like Mariassunta Gianneti and Andrei Simonov. The two researchers studied 289 Swedish towns, reaching the conclusions that the definition as density of free initiative varies between 1,5% and 18,5%. On a site of the INTERNETCOOP network (www.9am.ro/stiri-revista-presei)ăТtăТsăstКteНătСКtă“polТtТМsăМСКngesăКtăКănКtТonКlălevelăМКnnotăjustТfy variations signalled by Gianneti and Simonov. During the years 1980 and 1990 accords regarding the centralized establishment of salaries were repealed and the Swedish government reduced taxes and personnel applied to corporations. As a result, the activity level in businesses was doubled, in ensemble, but municipalities reacted in a different manner. What made them react differently would to be contained in the definition of entrepreneurial culture. Cultural variables, among which religion and politics, justify, in the opinion of authorities, more than half of oscillations at the level of municipalities. Four of these variables are identified and clearly presented as being favourable to the development of the entrepreneurial spirit:
- larger proportions of retired people, which paradoxically, fight against sedentariness and seniority through private initiatives;
- a higher percentage of former members of the Swedish Church and of other believers in general – tСeăgreКterăproportТonăofă“rТgСt”ăvoters;ămunТМipalities where the “rТgСt”ăsТНeăpreНomТnКtesăСКvТngăgreКterăentrepreneurТКlăНensТtТes;
- the reaction mechanism, the multiplication effect, cities and village with many entrepreneurs producing even more entrepreneurs.
An important feature, also observed in other states, states that not always the entrepreneurial density is correlated to the income level, which in many situations is not immediate or consistent. In many situations the community perception is also important because it appreciates the state of the private entrepreneur differently from one community to

346
КnotСer.ă Oneă ofă tСeă reКsonsă МoulНă beă tСeă fКМtă tСКt,ă Тnă someă sТtuКtТonsă tСeă entrepreneur’săincomes could be smaller than those of salaried people and especially, than those of managers. In communities in which entrepreneurs are appreciated, the free initiative density is ТnМreКseН.ăTСeăentrepreneur’săprestТgeărepresentsăКăМulturКlăvКrТКble,ăbeМКuseăТtăТsăuseНămoreăТnătСeăНevelopmentăofăаСКtăspeМТКltвălТterКtureăМКllsă“tСeăemploвer’sălТbТНo”.ă
Thus, the schema of entrepreneurial culture factor can be identified (figure 1):
Figure 1. Schema of entrepreneurial culture factors
SourМe:ăSp tКru,ăL.ă- “CulturКăКntreprenorТКl ”,ă“EftТmТeăMurgu”ăăăUnТversity of Resita Annals, 2nd fascicle– ESF, 2008
In the figure number 1, the dotted lines underline the interdependencies between
cultural variables. Thus the proportion of retired people interacts with the proportion of believers, but also with the proportion of right voters and with the prestige and the libido of the entrepreneur. Interactions between the reaction mechanism, the proportion of political right voters and the prestige or reputation of the entrepreneur become clear.
The idea of prestige and of reputation is not new. On the site already mentioned an idea from the book “Moneв,ămorКlsăКnНămКnners”ăofă tСeăFrenМСăsoМТologТstăMТМСeleăLamont (1992) is presented, which refers to the comparison of the success definition in France and that offered by the USA. After discussions with different persons, Lamont reached the conclusion that Americans treasure success in business, while French put an КММent,ă probКblвă toă Кă longeră СТstorТМКlă eбerМТse,ă onă tСeă Мultureă КnНăquКlТtвă ofă lТfe.ă “EКМСăcountry has its customs!”
SpeМТКltвălТterКtureăСКsn’tăМleКrlвăНefТneНătСeăМonМeptăofăentrepreneurТКlăМulture.ăIt insists more on the idea of process through which an entrepreneurial culture is reached, especially in universities, meant to disseminate the concept of society.
TСus,ăBurtonăR.ăClКrkă(2000)ă ТnsТstsăonăstКtТngă tСКtă“tСeăproМessăstКrtsăаТtСăКnăidea bodied in structures and processes that generate a set of convictions of the
Retired people proportion
Believers’ăpercentage
Rightăvoters’ăproportion
Entrepreneurial culture
Density of free initiative
Entrepreneur’săprestige Reaction mechanism

347
institution, later generalized and transformed in a new culture, a unifying indent of the instТtutТon”.ă
The unifying identity, which Clark speaks of, represents the personality of the institution, which is called entrepreneurial culture. In another opinion, Clark mistakes entrepreneurial culture to organizational culture.
This mixture cannot be tolerated! Managerial culture is thus enlisted in organizational culture. It is obvious that, if these interact, and the intersection is not void, entrepreneurial culture and the organizational one represent two concepts with substantially different contents, even from a constitutive point of view.
SeКrМСТngă Тnă tСeă МlКssТМКlă КreК,ă Тnă tСeă pКperă “SoМТКlТsmă КnНă НemoМrКМв”,ă J.ăSchumpeter (1940) connects the decline of a capitalist development to the decline of entrepreneurial cultures, without offering a definition to this concept. As long as entrepreneurship is not seen as a mass phenomenon, being more binominal in its lonelТnessă“ТnНТvТНuКlă– ТnНТvТНuКlătСТnkТng”ăКnНăforăКsălongăКsătСТsăsТtuКtТonăТsăfolloаeНăby concrete objectives, measurable one, as the development of the financial environment, of the quantity of available material goods, the search of a greater efficiency in production and finally, the obtaining of a higher productivity of work, everything worked well until the point where social need was relatively covered. A real success of the capitalist economic mechanism in the offering of goods and incomes аСТМС,ăbesТНesăаellbeТng,ăМovereНătСeăneeНsăofă“loТsТr”ăСКsăreНuМeНăКtătСeăsКmeătТmeătСeădependency to a global system and the interest of the system towards entrepreneurship.
Schumpeter agreed to McClelland, sustaining that the gradual disappearance of investment possibilities, even of niche investments, leads to the changing of positions in tСeă entrepreneur’să prestТgeăаСТМС,ă grКНuКllв,ă Тsă noă longeră the dominant person that is also respected in the society.
The hostility towards the entrepreneur and entrepreneurship, as face of МКpТtКlТsm,ăМКmeăfromăТntelleМtuКls.ăSМСumpeterăsustКТnsătСКtă“university personnel and intellectuals are those that see fast inequalities and bad in any system, problems are also seen because the vocation of intellectuals is to be critical… adding that intellectuals have a numerous audience and in general interesting one, in what they are told … having a forum in universities ready to implement their critical visions”. In other words, Schumpeter was convinces that intellectuals have undermined capitalism and if it was needed they could congregate a system of values which, even undefined at that poТnt,ăМoulНn’tăbeăsometСТngăelseăthan entrepreneurial culture.
30 years later, the economist and professor Paul Samuelson (1970) updates the profound analysis realized by Schumpeter, thus clarifying great differences between manager and entrepreneur. The manager is not connected to his business and may leave at any time, while the ideology of a capitalist entrepreneur in its simplicity, in which the economic result is dominant, is insufficient to face constraints without using a supplementКrвă sвstemă ofă reКlТzeНă vКlues.ă SМСumpeter’să аorНsă Кre confirmed by SКmuelson,ă аСТМСă stКtesă аТtСoută КmbТguТtТes:ă “Iă СКveă sКТНă so:ă tСeă suММessă КnНă tСeărationalism of capitalist bourgeoisie will determine a series of discontent intellectuals to flКmeă СostТlТtТesă toаКrНsă Кnă effТМТentă sвstem,ă bută notă loveН”,ă Мontinuing with the statement that there is a need for a supplementary system of values, which contains from a cultural, etic and religious point of views, the divine notion of property. In other аorНs,ă SКmuelsonă МonfТrmsă SМСumpeter’să ТНeКsă regКrНТngă tСeă neeН of an entrepreneurial culture as salvage of capitalism decline (Schumpeterian decline).
Ată lКst,ă tСeă RomКnТКnă reseКrМСeră ConstКntТnă R Нu ă (2011)ă sustКТnsă tСКtă Кă

348
definition of entrepreneurial culture is difficult to elaborate and that it must be reported separately to firms, respectively to individuals. Thus the term could be defined in the folloаТngămКnner:ă“КăsetăofăТНeКsăemboНТeНăТntoăstruМturesăКnНăproМessesătСКtăgenerКteăКăseries of institutional convictions, underlining the will to change, later transformed into КăneаăМulture,ătСusăofferТngăКăunТfвТngăТНentТtв,ăКăspeМТКlăpersonКlТtвătoătСeăТnstТtutТon”.
Besides economic and practical valences, entrepreneurial culture is organically connected through its values by the consumer. It can be said that the connection is made between the psychological side of entrepreneurial culture and the psychological eбМresМenМвăofătСeăМonsumer’săbeСКvТour.
TСeă fКmousă professoră JКmesă O’Tooleă (1985)ă mКkesă Кă МonsТstentă МrТtТМТsmă ofăprofitable firms the main objective of which is the maximization of profits, showing that an excessive focus on profits as objective may distort the focus of business in МompКrТsonă toă tСeăentrepreneur’săfromăКăreКlăobjeМtТveă toăofferăgooНsăКnНăservТМesă forăconsumers, to answer the social needs. This is an important distort of entrepreneurial Мulture.ă FТrmă аТtСă СТgСă performКnМeă КnНă МompetТtТvenessă Нon’tă usuКllвă СКveă forămaximization of profits as main objective and if these stay close to the consumer, to anticipate and to answer their needs, no matter how sophisticated, through trustful products and services, then these companies aim for Excellency. Firm that accentuate the profit objective in the absence of giving for the binomial product-consumer are usually less profitable.
Specialty literature, even if without the discovery of firm definitions given by consecrated and valid authors in the science domain and in the positive economy domain, may see the definitive coordinates of entrepreneurial culture, the common centre and specific difference in comparison to other concepts of the same nature and may observe the importance of a profound study of an insufficiently pegged concept until nowadays.
It cannot thus be stated nor infirmed that entrepreneurship and entrepreneurial culture are today operators of fashion in a scientific world connected to economy, still it can be confirmed, on certain bases, that these are necessary and welcomed concepts in the evolution of economic sciences.
4. CONCLUSIONS Entrepreneurship resembles a scientific process, where on many occasions, saying that a path is wrong has an equal value to saying that nay path is certainly good. Regarding incongruences, the status-quo must be overcome, the tendency of saying that this is how it will always be. This status-quo leads to the tacit acceptance of the idea that it will always be worse. Incongruence as discrepancy as what it is or what it should be, leads to innovation and it potencies entrepreneurial life. The necessity results from the work process influences innovation from the need to avoid existence of an independent, unmanaged process to eliminate a weak or absent connection in a persuasive chain, to clearly define or redefine the main and the secondary objectives, to define or redefine specification a certain solution and to stimulate receptiveness and to find better solutions. The fact that entrepreneurship is decisive and connected from a constitutive point of view to an economic development is almost axiomatic. There are numerous aspects in an empirical literature referring to entrepreneurship and economic development, most

349
of them trying to measure in a shape or another, the entrepreneurial activity. There are different empirical points of view among which the following can be mentioned: - the percentage of an economic activity realized by small firms; - the occupation of the labour force; - the number of market participants; - the number of firm start-ups.
Thus, for OECD countries global-entrepreneurship-monitor (GEM) analyses were realized through a program launched in 1999, which offers annual evaluations at a national level for entrepreneurial spirit. GEM measures the national entrepreneurial activity through different indicators, among which the most important would be the percentage of persons from one country that are actively involved in the starting of new business and manage a new business started 42 months earlier, from the total of work force. The GEM reports show that: - the national level of the entrepreneurial activity has a significant statistical association with the level of an economic development; - there are no countries with high levels of entrepreneurial spirit and low levels of economic development. With all the prudence necessary, the GEM observations suggest an increase in the entrepreneurship importance as a characteristic of national economy, often mentioned as being the transformation, from a manager economy to an entrepreneurial one (Thurik and Wennekers, 2001). The passing from a managed economy to an entrepreneurial one has already been proНuМeН,ăstКrtТngăаТtСătСeămТННleăofătСeă70’săКnНătСeăbegТnnТngăofătСeă90’s,ăbeМomТngăextremely clear when the industry structure was profoundly changed, the main percentage of the economic activity passing from great enterprises to SMEs. This passing from SMEs is directly connected to an entrepreneurial activity and thus, the entrepreneurial spirit, the observing of opportunities, of invention and innovation become the centre of the competitive advantage. At an individual level entrepreneurial activity may be profoundly followed until reaching one person, the entrepreneur, entrepreneurship being induced by attitudes, reasons, and abilities and by psychological characteristics of the individual. Even if entrepreneurship comes from an individual level, its realization is obtained at the firm level. The sum of entrepreneurial activities at a macro level, given by national industries and economies, formed a true mosaic, competitive initiatives and experiments, leading to variety and to a market change, to the selection of the most viable firms and to the replacement of the old. Entrepreneurial activity can be extended and transforms the productive potential and at the same time, leads to an increase of work productivity and thus to an increase of GDP. At a global level these processes are connected to individual levels through important mechanisms and inverse connections through individual entrepreneurs. Entrepreneurs learn from their successes and failures and from the results of others and the increase of entrepreneurial performance leads to an increase co economic performance. Obviously, this process is not characteristic only to SMEs or to small firms. The hypothesis in which large firms, with a great economic force, create opportunТtТesăforăsmКllăforms,ămКТnlвăforăSMEsăremКТnsăvКluКbleăКnНătСeăentrepreneur’sărole in this case it to increase and develop his SMEs and through this lead to an economic development. This entrainment in a circle or in a double feed-back of large

350
firms and SMEs becomes a veritable rotor that empowers economic development and social evolution. Concluding an a plastic register, from all delimited arguments in this paper it results tСКtă“mКnăăsКnМtТfТesătСeăplКМe”;ătСusăТnăeМonomвătСeăentrepreneursăsКnМtТfТesătСeăbusiness and the strong connection between entrepreneurship and economic development is not without asperities as it firstly appears, the force axiom and the yield of development built on entrepreneurship must be sufficiently frequent and finely lubricated in order to function at a maximum capacity. There are also dark sides of entrepreneurship which in the end demand this fine lubrication and the lubricant is represented by entrepreneurial culture. REFERENCES BКuНeКuăNТМolКs,ă„Première introduction à la philosophie économique » , Paris, 1797 Clark, Burton - www.books-google.com DruМker,ă Peter,ă ă „Inovaţia şi sistemul antreprenorial – Practica şi principii”,ă EnМТМlopeНТМă
Publishing House, 1993 Guy Kawasaki – The art of the start, Amsta Publishing, Bucharest, 2010 HТsrТМС,ăRobertăD,ăă„InternКtТonКlăentrepreneursСТp:ăstКrtТng,ăНevelopТngăКnНămКnКgТng a global
venture”,ăSКgeăPublТМКtТons,ăInМ.ăCКlТfornТК,ă2010ă LКmont,ăMТМСele,ă„Money, Morals and Manners: The Culture of the French and the American
Upper-Midle Class”, www.books-google.com O’Toole,ăJКmes,ă„The Secret of Net Profits”, Business Review Weekly, May 8, 1995, pag. 82 Roddick, Anita, founder of the British company The Body Shop Cosmetics Say, J. B., „Nature of Thinks”,ăLКlor’săCвМlopeНТК,ăNeаăYork,ă2010 Samuelson, Paul, „Economics”,ăMМGrКаă– Hill Educations, 2010 Schumpeter, J., The Theory of Economic Development, Harvard University Press, Cambridge,
M.A.,ă ,ă CсnНeКă D.ă (eН)ă Тnă „Întreprinderea sustenabilă. Studii şi cercetări. Întreprinderea inovatoare, consideraţii teoretice, studii de caz, UTPRESS, Cluj-Napoca
Sp tКru,ă L.ă ,ă “CulturКă КntreprenorТКl ”,ă “EftТmТeăMurgu”ă ă ă UnТversТtвă ofă ResТtКăAnnКls,ă ă 2nd fascicle– ESF, 2008
*** Global Entrepreneurship Monitor (GEM) of the Kauffman Centre for entrepreneurial leadership (Babson College, London Business School , 2010).
www.9am.ro/stiri-revista-presei www.ccisalaj/proj/modul3.pdf www.maxwell.syr.edu/psc/Schmitz_Hans_Peter/

351
COMPETITIVE ADVANTAGE – PREMISE OF ECONOMIC DEVELOPMENT
Diana T NASE1
AdrianăT NASE2 Codruţa-Oana HAMAT 3
ABSTRACT Each industry has its own rules of rivalry and competition and its own hierarchy of
factors contributing the most or the least to the competitive position and competitive advantage (Voiculescu, 2000, p.15).
In the modern theory of economic development, the role o comparative advantage has diminished, in a context where, due to the unprecedented intensification of the international exchange relations, we are witnessing an approximately equal endowment of countries with classic manufacture factors. Furthermore, in the contemporary production globalisation, big companies (especially the trans-national ones) are no longer dependent on a particular country’s resources. At the same time, in the world economy, the financial capital circulates freely and is invested in the countries that offer the highest benefits to those who possess it.
Starting from these considerations, the present paper intends to highlight the importance of competitive advantage, as determining factor of success on the market.
KEY WORDS: competitive advantage, innovation, economic development JEL: O10, D60
1.ă DETERMINANTSă OFă NATIONALă ADVANTAGE.ă PORTER’Să“DIAMOND”ăă
After having analysed the evolution of several multinational firms, Michael
Porter identified a direct correlation between their success and the development degree of the origin country. The American economist claims that the nation, as a result of the endowment with manufacture factors, is construed as a matrix of firms’ăНevelopment,ăwhich in their turn benefit from national advantages, and have the capacity to impose tСemă Тnă tСeă ТnternКtТonКlă МompetТtТon.ă TСeă nКtТonă Тs,ă Тnă Porter’să opТnТon,ă “ă Кă bКsТsă ofănational launching for the firms that will affirm themselves on theăТnternКtТonКlăplКne”ă(Pralea, et al, 2006, p. 66), the economic environment playing a crucial part in the competitiveness of an industry and being able to stimulate or, on the contrary, to prevent the development of that particular sector.
1 Associate Professor PhD., Faculty of Engineering and Management, University Eftimie Murgu of ReşТ К,ăRomКnТК,ăН.tКnК[email protected]ă 2 AssoМТКteă Professoră PСD.,ă FКМultвă ofă EМonomТМs,ă UnТversТtвă EftТmТeă Murguă ofă ReşТ К,ă RomКnТК,ă[email protected] 3 Professor PhD., Faculty of Engineering and Management, UniversТtвă EftТmТeă Murguă ofă ReşТ К,ăRomania, [email protected]

352
“NКtТons,ăКММording to Michael Porter, succeed in the industries where they have advantages valuable for other nations and where their innovations and improvements МКnămeetăТnternКtТonКlăneeНs.”ă(Porter, 1995, p. 68).
In this context, Porter states that the obtaining of competitive advantage by a firm is conditioned (favoured or disfavoured) by four categories of factors of the national economic environment, known in the economic literature as elements of Porter’s “diamond” or Porter’s “rhombus” (figure 1):
- Factor conditions; - Demand conditions; - Related and support industries; - Firm strategy, structure and rivalry. Factor conditions. Giving up the classic and restricted meaning of the concept of
endowment factors (labour, land, capital), Porter speaks about the role of several types of resources: human resources; natural and material resources; stock of scientific, technical and marketing knowledge; volume and cost of the capital available for investments; types, quality and cost of the transport infrastructure use; communications, postal services, transfer of funds and payments; health, dwelling stock and cultural institutions (Pralea, et al, 2006, pp. 65-66) etc., the authors stressing the importance not only of the quantity, but also of the quality of these resources, of their use efficiency. For instance, human resources should be analysed not only from the perspective of the labour force effective number, but also form the viewpoint of their quality and training, and costs they require (Ciupagea, Fugaru, 2001, p. 58). Moreover, natural resources are defined, besides profusion, by quality, accessibility and exploitation costs, and the capital by volume, availability and form. .
Demand conditions.ăAММorНТngătoăMТМСКelăPorter,ăКăМompКnв’săsuММess depends
on the conditions of demand manifestations and thus we have to take into account the demand structure, the size and determining factors of its growth, of its internationalisation, of the consumer behaviour complexity in general.
Related and supporting industries. Any firm cooperates with other firms, either as supplier, or as customer, and if the system of these organisations, correlated on the
Firm strategy, structure and rivalry
Factor conditions
Demand conditions
Related and supporting industries
Government
Chance
Figure 1. Porter’s diamond. Determinants of national competiitce advantages
Source: Porter Michael, The Competitive Advantage of Nations; The Free Press, New York, 1990, p. 72.

353
vertical or on the horizontal, is not competitive in its entirety, then the general environment is inefficient, and leaves its mark on the evolution of each company in the system. Consequently, the more clustered and specialised the horizontal and vertical industry, the more competitive the country.
In this respect, the author underlines the importance of forming company clusters leading to regional development and thus to competitiveness growth in the nation, as a successful industry leads to the creation of another.
For instance, Japan, well-known leader in photo equipment, developed the copier industry as complementary sector; Singapore, a country renewed for harbour services, took an interest in naval industry, whereas Italy, beside the competitive lighting products, offers furniture products to the world market.
The cluster existence amplifies and accelerates the process of creating endowment factors and enhances competition, by maintaining diversity and stopping inertia and / or inflexibility among the agents in competition (Pralea, et al, 2006, pp. 69-70).
Firm strategy, structure and rivalry. Beside the other components of the “НТКmonН”,ă Porteră suggestsă tСКtă Кă fТrm’să suММessă Тsă МonНТtТoneНă bвă tСeă settТngă ofă ТtsăgoКls,ă tСeămКnКgementămetСoН’să levelăofăМompetТtТonăetМ.,ăКllăbeТngă ТnfluenМeНăbвă tСeăclimate where the firm operates.
Beside the fourăgroupsăofăfКМtorsăМomposТngăPorter’să“rСombus”,ătСeăfТrmăТsăКlsoăsubjected to other spheres of influences: chance or conjecture context, incorporating elements related to change, opportunity or the occurrence of unpredicted situations, technological solutions etc., as well as the government intervention influencing the environment on the macroeconomic level (Ciupagea, Fugaru, 2001, p. 59).
Diverse other asepcts, such as low taxation, depreciation of national currency, increase of exports etc. are either the results of increased competitiveness, or possible stages of competitive (under)development, being neither factors, nor necessary conditions for that matter (B b Т ,ăImbresМu,ăAngСelТnК, 2007, pp. 10-15).
Furthermore, the American economist underlines the fact that a nation cannot rely on the existence of a single competitive advantage, as there is the risk that this advantage could no longer be preserved, whТМСăаoulНăleКНătoătСeăКppКrТtТonăofăКă“stКtТМămТsbКlКnМe.”ăConsequentlв,ă Тtă Тsă essentТКlă tСКtă tСeă МompetТtТveă КНvКntКgeăofă Кă МountrвăsСoulНăbeătСeăresultăofăКăМonjugКteНăКМtТonăofătСeăfoură„НТКmonН”ăМomponents.
Moreover, Porter identifies four stages of competitive development on the national level (Rostow, 1971):
- Stage of development determined by the endowment factors; - Stage of development determined by investments; - Stage of development triggered by innovation; - Stage of development determined by wealth. If the first three stages are characterised by progress, and national
competitiveness keeps increasing, in the last stage the economic activity may stagnate, as the interest to reinvest decreases, the management strategies are not equally offensive, as there is no powerful motivation among employees who have already reached a high level of wages. Porter claims that the stage of wealth may lead to recession, as the existing wealth will not keep the pace with the needs of the respective society.

354
According to these stages, Romania is situated between the first stage, determined by the production endowment, and the second stage, determined by investments.
Likewise, Michael Porter also analysed the reasons that may causes the loss of competitive advantage, such Кsă tСeă pooră МКpКМТtвă ofă fТrm’să КНКptКtТonă toă tСeă mКrketărequirements, inconsistence of supply with the global demand, unfair and unjustified State interventions, worsening of the quality of human capital by granting a low attention to educational and health services or as a result of labour force emigration, poor infrastructure, occurrence of unpredictable situations, with major influences on political and social-economic stability .
Toă МonМluНe,ă tСeă “НТКmonН”ă tСeorвă stressesă tСeă ТНeКsă tСКtă onlвă tСeă Мountries disposing of a well-funМtТonТngă “НТКmonН”,ă moreă preМТselвă аСoseă НetermТnКntsăinfluence each other in a positive way, poseess long-term competition advantages.
Consequently, in order to be viable, the competitive advantage needs to be sustainable, because if it has a short-term nature we may not speak of a strategic competitive advantage, but of a conjectural one.
2. COMPETITIVE ADVANTAGE IN THE INDUSTRY As shown above, Michael Porter underlined the ideas that the endowment with
manufacture factors no longer represents a major advantage for enhancing competitiveness, as long as they have become mobile and easily accessible, one of the most important determinants being, in the new circumstances, the quality of the business environment. Moreover, competitiveness derives from the productiveness at which the company uses their endowment factors, for obtaining goods and services, as productiveness depends less on the sectors where they compete, and more on the manner in which they compete.
Thus, Porter’sătСeorвăofăМompetТtТveăКНvКntКgeăstКrtsăfromătСeăpremТseătСКtă tСeăonly significant criterion of success on the world market is that of productiveness. On this market, any country will attempt to export high-productivity goods of their own manufacture and to import low-productivity goods, so that national productiveness be higher, as it is obvious that no country can be a net exporter for all economic goods.
InăotСerăаorНs,ăКăМountrв’săspeМТКlТsКtТonăаТllăbeămКНeăТnătСeăfТelНsăаСereăТtă Тsămore productive and it will import products for which the respective country is less productive than its partners, and thus we witness an increase of the national environment productiveness.
Getting an advantage on the market is conditioned by the identification of the modalities by which the same products are obtained with lower inputs (cost advantage), or whether with similar costs one obtains higher-value products consumers (quality advantage).
Thus, although a firm may have innumerable advantages or drawbacks compared to the competition, there are two types of competition advantage of which a firm may dispose: cost advantage and differentiation.
As fundamental elements of competitive advantage, cost and differentiation, depending on the nature of the activities deployed by the firm, may lead to the realisation of three types of strategies (figure 2): cost leadership, differentiation and focus.

355
Although they are different strategies, cost leadership and differentiation are extension strategies, whereas the focus strategy refers to a narrow market segment, which, in its turn, may refer to cost or diversification strategies, with the purpose of obtaining advantages in the respective segment.
Although, depending on the industry, the tools for applying the strategy are
different, the strategy embraced by each firm aims, in all cases, at exploiting its strengths, as well as getting protected against the adverse effects of the five market forces: entry of new rivals, existence of substitutes,ăpurМСКsers’ăpoаerăofănegotТКtТon,ăsupplТers’ă negotТКtТonă forМe,ă rТvКlrвă Кmongă eМonomТМă Кgentsă (Porter, 1980), each of these strategies (figure 3) supposing the choice of a distinct path for ensuring the competitive advantage.
Michael Porter claims that, irrespective of the chosen strategy, the key to
competitive advantage is given by the technological progress and not by the abundance of resources, the technological advantage being obtained as a result of the innovation process. Thus, innovation means not only scientific discovery, but also the way in which the company competes, in other words its business pattern.
FТrm’săprofitability
Threat of substitutes
Bargaining power of suppliers
Bargaining power of buyers
Threat of new entrants
Industry rivalry
Cost leadership Differentiation
Focus
on costs on differentiation
Wide target
Narrow target
Figura 2. The three generic strategies for achieving performance in the indsutry
Source: Porter Michael, The Competitive Advantage of Nations; The Free Press, New York, 1990, p. 69.
Strategic advantage
Figure 3. Theăfiveăcompetitiveăforcesăwhichădetermineăaăfirm’săprofitabilityă Source: Porter Michael, Competitive strategy, Teora Editions, Bucharest, 2001, p.72.

356
Obviously, empirical analyses attested the fact that competitiveness always manifests itself on the level of forms and only through them, it is manifested on the level of both industries and economy, the firms being those who create the competitive advantage and only with their help one may reach the goals set on the national level (B b Т ,ăImbresМu,ăAngСelina, 2007, pp. 10-15).
3. CONCLUSIONS Unlike the theory of comparative advantage, with a static and rather
macroeconomic vision, the concept of competitive advantage, with a dynamic and microeconomic vision, highlights the fact that the evolution of success and the eбploТtКtТonăofăeМonomТesăНepenН,ăfТrstăofăКll,ăonătСeăfТrms’ăНegreeăofăМompetТtТvТtвăonătСeă nКtТonКlă КnНă ТnternКtТonКlă mКrket,ă onă tСeă fТrms’ă evolutТonă КnНă profТle,ă onă tСeăassimilation of technical progress and less on the existence of naturalăresourМesă(T nКse,ă2008, pp. 316-319).
In this context, when it comes to the economic development, a more and more poignant role is played by the competitive advantage, in the context where “МompetТtТvТtвă Тsămoreă КnНămoreă НepenНentă onă strКtegТesă КnНă less and less on natural КНvКntКges.”ă( Lawton, 1999, p.37)
The competitive advantage offers a company the opportunity to yield better results for the firm and its shareholders. The more sustainable a competitive advantage gets, the more difficult it becomes to be neutralised by the competition.
Generically, the source of competitive advantage may be one and only one – innovation – obviously, in the widest sense of the concept, innovation referring thus to the renewal of the product, technology, equipment, management, sales patterns, financing, information etc.
Consequently, the competitive advantage is the invisible synthetic component of strКtegв,ăаСТМСăeventuКllвăМonfersătСeăfТrm’sălong-term viability and competitiveness.
REFERENCES B b Т ,ăI.,ăImbresМuăI.,ăAngСelТnК,ăA.ă(2007)ă“FromătСeăМompКrКtТveăКНvКntКgeătoătСeătСeorвăofă
МompetТtТveă КНvКntКge”ă (ТnăRomКnТКn),ăStudia Universitatis, Economics Series, Arad, WestăUnТversТtвă“↑КsТleăGolНТş”
CТupКgeК,ă C.,ă FugКru,ă A.ă (2001)ă “RomКnТК’să ТntegrКtТonă Тntoă tСeă EuropeКnă UnТon.ăCompetТtТvТtвă КnНă МonvergenМe”ă (Тnă RomКnТКn)ă Тnă Romanian Journal of European Affairs
LКаton,ă T.ă (1999)ă “European Industrial Policy and Competitiveness: Concepts and Instruments”ă
Porter,ăM.ă(1995)ă“TСeăCompetТtТveăAНvКntКgeăofăNКtТons”, New York, McGraw Hill Porter,ă M.ă (1980)ă “CompetТtТveă StrКtegв:ă TeМСnТquesă foră AnКlвsТngă InНustrТesă КnНă
CompetТtors”,ăNeаăYork, The Free Press Porter,ăM.ă(1990)ă“TСeăCompetТtТveăAНvantage of Nations”,ăNew York, The Free Press Porter,ă M.ă (2001)ă “CompetТtТveă strКtegв”ă (trКnslКtТonă Тntoă RomКnТКn),ă BuМСКrest,ă TeorКă
Editions PrКleК,ă S.ă etă Кlă (2006)ă “TСeorвă ofă ТnternКtТonКlă trКНe”ă (Тnă RomКnТКn),ă IКşТ,ă “Al.ă I.ă CuzК”ă
University Press Rostoа,ă→.ă(1971)ă“TСeăStКgesăofăEМonomТМăGroаtС”, Cambridge, Cambridge University Press

357
T nКse,ă A.,ă T nКseă D.ă (2008)ă “The Theory of Comparative Advantage and the Theory of CompetТtТveă AНvКntКge”,ă TСeă Xth International Symposium Young People and Multidisciplinary Research”,ă TТmТşoКrК,ă 13th - 14th November, Association for MultТНТsМТplТnКrвăReseКrМСăofăRomКnТК’să→estăZoneă
↑oТМulesМu,ă D.ă (2000)ă “CompetТtТvenessă – Мourseă ofă leМtures”ă (Тnă RomКnТКn),ă BuМСКrest,ăEconomic Publishing House

358
TRENDS IN CORPORATE ENVIRONMENTAL REPORTING
Diana-MariaăTÎNJAL 1 Alexandru BUGLEA 2
ABSTRACT The tension between finite resources and unlimited needs has been humanity’s concern
from the earliest times. More recently, the 1987 Brundtland Report was the first of its kind to draw attention to the unsustainable rate at which we use the natural resources of our planet. Soon after, several international organisations, as well as individual countries have begun issuing environmental directives and regulations for corporations. Nowadays, the environmental component of corporate sustainability continues to be the best reported upon, using general and sector-specific non-financial indicators. This paper focuses on three key performance indicators for corporate environmental reporting: Environmental policy, GHG reduction programmes and Environmental management system. Using content analysis of annual sustainability reports and corporate websites for more than 2000 listed companies, courtesy of the firm Sustainalytics, we assessed the evolution of the three indicators in the 2010- 2014 time frame. This study also highlights the best reporting sectors, as well as the trend in reporting for sectors that have a low environmental impact.
KEY WORDS: sustainability reporting, ESG, environmental KPIs, greenhouse gas emissions
JEL: Q 01, Q53, Q56
Acknowledgements: This work was supported from the European Social Fund through Sectorial Operational
Programme Human Resources Development 2007 – 2013, project number POSDRU/159/1.5/S/142115,ă projeМtă tТtleă “PerformКnМeă КnНă EбМellenМeă Тnă DoМtorКlă КnНăPostНoМtorКlăReseКrМСăТnăRomКnТКnăEМonomТМsăSМТenМeăDomКТn” We would like to thank Sustainalytics for granting us access to their sustainability ratings data.
1. INTRODUCTION
Environmental awareness has been one of the pillars for corporate sustainability since the introduction of the term. Following several environmental disasters, stakeholders have begun to put pressure on companies to act as corporate citizens and to report on their actions. Environmental reporting is, at present, the most complete and quantitative part of CSR reporting.
Best practices in environmental impact follow mandatory regulations (where they are put into place), national requirements from the governing body or stock exchanges, or international standards and directives. In our study we emphasise the necessity of environmental indicators and guidelines, comparing sets of indicators
1 PhD Student, Faculty of Economics and Business Administration, West University of Timisoara, Romania 2 Professor, PhD, Faculty of Economics and Business Administration, West University of Timisoara, Romania

359
designed by the Global Reporting Initiative, the German Society of Investment Professionals (DVFA) and Thomson Reuters.
We focus on three environmental impact indicators - the environmental policy indicator, the Environmental Management System indicator and the Greenhouse Gas (GHG) reduction programmes indicator. We feel these indicators should be of concern to both companies in a potentially high impact sector and to ones in low environmental impact sectors.
The second part of this study assesses the evolution of the three indicators for more than 2000 companies throughout a 5 year time frame. The companies included in our selection are listed at stock exchanges around the world. We compare the low impact sectors with the high impact ones and try to establish a common trend. Moreover, the study identifies the lagging and best practice sectors for each indicator. We conclude our research by highlighting the environmental reporting trend in the services sectors.
2. CORPORATE ENVIRONMENTAL REPORTING
2.1. Literature review Sustainability has begun concerning specialists, as well as the general public
concomitant with the raising awareness of worldwide problems: environmental disasters, poverty, corruption, diseases, human rights violations and so on (WCED, 1987; Christofi et al., 2012). Little by little, companies have been pressured by their stakeholders to take into account the impact their actions have on the three pillar concepts of sustainability: environment, society and governance. Although more frequently used, the term corporate sustainability has yet to receive a general definition, being used interchangeably with other notions such as: corporate social responsibility (CSR), the triple bottom line (TBL), ESG (environment, social and governance), ethical footprint, responsible entrepreneurship. (Pezzey and Toman, 2002; Ioannou and Serafeim, 2011; Baden & Harwood, 2013; Milne and Gray, 2013)
Starting in the 1970s, companies have begun integrating sustainability-related issues in their communication towards stakeholders, at first in the form of a few narrative pages in the annual report, evolving to a stand-alone CSR/ Sustainability Report (Tschopp and Nastanski, 2013; Milne and Gray, 2013). Due to the qualitative nature of sustainability information, comparison and homogeneity between sectors and countries is difficult. Several reporting guidelines have been issued by international organisations; the most used being the Global Reporting Initiative. According to a KPMG survey, 78% of reporting companies refer to the GRI Guidelines (KPMG, 2013).
Some countries (including Australia, Austria, Canada, China, Denmark, Finland, France, Germany, Greece, Indonesia, Italy, Malaysia, Nederland, Norway, Portugal, Sweden, the United Kingdom, South Africa) have put in place a mandatory sustainability law concerning one or more sustainability dimensions, and several stock exchanges use sustainability indices. (Ioannou and Serafeim, 2011; Deloitte, 2012).
Moreover, to overcome some observed weaknesses of sustainability reports - lack of connection with financial reports and their backward - looking information (van Zyl, 2013), the International Integrated Reporting Council has proposed the use of an Integrated Report containing both financial and non-financial information (IIRC, 2013).

360
The objective of such reports, be they CSR ones or integrated reports is to provide information for stakeholders to base their decision on (WBCSD, 2002; Tschopp and Nastanski, 2013), as well as to increase the transparency and credibility of the company reporting.(CSES, 2011)
Out of the three pillars, environmental reporting is believed to be more complete and quantitative (Deloitte, 2012), being the first to be mandatory required in several countries starting in 1996: Denmark, Nederland, Norway, Hong Kong (Daizy et al., 2013). Its importance has been expressed by both companies - more than 50% of the 208 CFOs surveyed by Deloitte claim they were planning investments in equipment for decreasing their companies environmental impact (Deloitte, 2011), and international organisations – EuropeКnă UnТon’să Europeă 2020ă ТnТtТative, United Nations Millenium Goals, World Resources Institute (WRI) and the World Business Council for SustКТnКbleăDevelopmentă(→BCSD)’săGHGăProtoМol.
Table 1
Examples of environmental key performance indicators
GRI G4 ASSET4 DVFA Energy consumption and intensity
Energy Efficiency Energy Efficiency
GHG emissions (by scope) CO2 equivalent emissions GHG emissions Energy consumption (renewable/ non-renewable)
Renewable energy used Fuels (of which renewable)
Materials used (of which recycled)
Materials sourcing environmental criteria
Recycling quota
Waste by disposal method Waste (total and reduction) Waste Water withdrawal by source Water discharged Water consumption Energy consumption (upstream/downstream)
Environmental products/ Take-back
End-of-Lifecycle Impact
Biodiversity Biodiversity Fines and monetary sanctions ISO 14000 Environmental expenditures
(Source: Author adaptation of KPIs (GRI, 2013; Thomson Reuters, 2011; DVFA, 2010))
Corporate environmental awareness is reported using non-financial indicators. Table 1 present the most important indicators used by several reporting frameworks. GRI G4 is the latest (2013) set of guidelines from the Global Reporting Initiative; ASSET4 is a framework used by Thomson Reuters in providing ESG data analysis for its clients; The German Society of Investment Professionals (DVFA) Guideline for the integration of ESG into financial analysis and corporate valuation version 3.0 was released in 2010.
2.2. Research methodology
For this study, we have used the content analysis method for analysing CSR reports and corporate websites. As characteristic of the method, we aimed to make valid inferences about the sector and global trends based on public corporate data. We assessed the evolution of three indicators: Environmental policy, GHG reduction

361
programmes and Environmental management system (EMS) for the time frame 2010-2014.
TСТsă stuНвă usesă НКtКă fromă SustКТnКlвtТМs’ă НКtКbКse.ă SustКТnКlвtТМsă Тsă Кnăinternational ESG research and analysis firm who specialises in providing data for responsible investors worldwide. With a tradition of more than 20 years, Sustainalytics provides ESG analysis services to financial institutions, asset managers, pension funds, international organisations, private companies and the academic environment.
The first indicator – Environmental policy – analyses whether the company has put in place a policy on environmental issues (Table 2). A policy is considered to be a formal, written statement, generally signed by the chief executive officer, which makes a set of specific commitments which require compliance by company employees. Applying a corporate policy should demonstrate that the company has also put in place a formal evaluation process for the included commitments. An environmental policy should include:
1. a precautionary approach to environmental issues (for example, going beyond environmental regulations),
2. initiatives to promote greater environmental responsibility towards stakeholders (employees, customers, etc.),
3. a plan for the diffusion of environmentally friendly technologies.
Table 2 Scoring categories for the Environmental policy indicator
Score Category description 100 Strong and detailed policy addressing all three issues. 50 Policy addresses only two issues. 25 Policy addresses one issue or none. 20 Statement that does not qualify as a policy. 0 No environmental statement.
(Source: AНКpteНăfromăSustКТnКlвtТМs’ăfrКmeаork)
The second indicator we have studied and scored (see Table 3) – the Environmental Management System – assesses whether the company has a company-wide ISO 14001 certified EMS. A comprehensive EMS should tackle the following core issues:
• Governance structures responsible with environmental challenges; • Roles and responsibilities assigned to individuals; • Identifying products, activities or services with significant impacts on the
environment; • Complying with environmental regulation; • A system of clear objectives, targets and deadlines; • Environmental programmes; • Raising awareness amongst employees; • Internal and external communications on environmental management issues; • Monitoring and measurement for environmental performance metrics; • Keeping historical records of such measurements; • Conducting external environmental audits at least once every three years

362
• Conducting internal environmental audits, at least once every three years; • Proposing a set of corrective actions to stimulate environmental improvement.
Table 3
Scoring categories for the Environmental management system indicator
Score Category description 100 Strong and detailed company-wide EMS that addresses all issues. 80 Relatively strong company-wide EMS (1-2 issues unaddressed). 60 Company-wide EMS addresses 6-10 issues. 40 EMSăКpplТesătoălessătСКnă50%ăofătСeăМompКnв’săoperКtТons. 20 The company has some activities, but no formal EMS. 0 No activities or EMS.
(Source: AНКpteНăfromăSustКТnКlвtТМs’ăfrКmeаork)
The greenhouse gas (GHG) reduction programmes indicator has become a well known measure for environmental sustainability, for both sectors that have a large environmental impact, and for those that have a small impact. The indicator reflects whether the company has put in place initiatives to reduce Scope 1 and Scope 2 GHG emissions from sources owned or controlled by the company, as seen in Table 4.
Table 4
Scoring categories for the GHG reduction programmes indicator
Score Category description 100 Clear company-wide targets and deadlines. 50 Clear company-wide targets, but no deadlines. 40 Quantitative targets for less than 50% of the operations. 25 Programme/ initiatives with no clear targets or deadlines. 0 No programme/initiatives.
(Source: AНКpteНăfromăSustКТnКlвtТМs’ăfrКmeаork) The population data comprises 4762 companies listed in stock exchanges around
the world, which Sustainalytics has analysed yearly starting in 2010 or later. Each year, companies were added to the database, in 2010 the database containing only 2521 companies. The number increased to 4550 for 2014. The data collection method has remained unchanged for all 5 years analysed: data from CSR reports, corporate websites and, in a small measure, corporate engagement.
In order to present a coherent historical evolution for the three indicators analysed, we narrowed the population selection to companies that were constantly analysed between June 2010 and June 2014. The new sample that verified the requirement comprised 2124 listed companies, 632 from low environmental impact sectors and 1492 from sectors with a high impact on the environment. (Appendix A)
Compared to other studies on key environmental performance indicators, our НКtКbКseăprovТНesămoreăobservКtТons,ăbeТngăМompКrКbleăforă ТnstКnМeă toăKPMG’să2013ă

363
Survey of Corporate Responsibility Reporting that analyses 4100 companies from 41 countries. KPMG uses the same analysis method and the same source of information: CSR Reports and corporate websites.
As seen in Appendix A, the companies analysed in this paper represent 7 low impact sectors and 35 high impact sectors. Best represented low environmental impact sectors are Banks, Diversified Financials and Insurance (totalling 61,5% of all low impact analysed companies). For high environmental impact, the best represented sectors are Utilities, Real Estate and Oil & Gas Producers (accounting for 21,1% of all high impact companies selected for this study). The worst represented sectors are Commercial Services (with only 45 companies, representing 7% of the total of low impact companies), and Paper and Forestry (0,6% of the total 1492 high impact companies).
2.3. Findings and discussion We assessed all the 2124 companies on the three above-mentioned indicators,
considering one observation per year (in June 2010, June 2011, June 2012, June 2013 and June 2014). First, we analysed the evolution of the environmental policy indicator, as see in Figure 1.
Source: КutСor’săresults
Figure 1 – Evolution of Environmental Policy Indicator
As can be seen in the figure above, throughout the last 5 years there has been a decrease in the number of analysed companies that have no environmental statement (score 0 category – 37,14% decrease in the analysed time frame) or that have a policy committing to maximum one of the three lines of action described in the methodology section of the paper (score 25 – 36,35% decrease). This involution influences the number of companies scoring in the other three categories: an increase in the number of companies that have drafted a statement concerning their environmental impact, even though this statement cannot be classified as a policy (score 20) and a positive trend for the number of companies that have in place an environmental policy that addresses two

364
critical environmental issues (score 50) or all three issues (score 100 – 40,81% increase between 2010 and 2014). This overall positive movement towards environmental awareness can be explained through both stakeholder pressure and firmer regulations implemented by either the governing structures or by stock exchanges.
A similar evolution can be observed for the Environmental Management System indicator and the GHG reduction programmes one. The lowest score category (0 score) has a clear negative trend for both indicators between 2010 and 2014, showing a decrease of 33,16% in the number of companies that have no initiative to reduce GHG emissions and of 47,39% in the number of companies with no environmental management activities. A clear positive trend is seen for the best score category, referring to the number of companies that have put in place specific targets and deadlines to reduce Scope 1 and 2 greenhouse gas emissions (an increase of 48,9% from 2010 to 2014), and that have a company-wide ISO 14001 certified EMS (27,81% increase).
Source: КutСor’săresults
Figure 2 – Evolution of the Environmental Management System Indicator (left) and the GHG reduction programmes indicator (right)
To emphasise the sectors that distinguish themselves through a better than
average performance, and to highlight the lagging sectors, we calculated the average percentage of companies scoring 100 for each indicator. For the environmental policy indicator, the best reporters are: Automobiles (with an average of 62.9% companies reporting a strong environmental policy), Auto Components (56,2%), Paper & Forestry (55,1%), Household Products (52,5%) and Electrical Equipment (49,6%). The laggards are Media (averaging 9,1% for the best scoring category throughout the period analysed), Healthcare (9,8%), Retailing (12,6%), Traders and Distributors (14,4%), Energy Services (15,3%), Software & Services (15,7%), Insurance (16,4%), Consumer services (16,5%).
The same can be observed for the other two indicators. Laggards on EMS are Insurance (5,9%), Retailing(6,7%), Textiles & Apparel (7,2%), Diversified Financials (9,9%), Media (10,7%), Real Estate (11,2%), Consumer Services (11,3%) and Software

365
& Services (12%). Sectors that have a large percent of companies implementing a strong EMS are: Auto Components (81,2%), Automobiles (74,3%), Paper & Forestry (73,5%), Electrical Equipment (70,2%) and Semiconductors (70,2%).
For the GHG reduction programmes indicators, the sectors that have the biggest average percent of companies scoring 100 are: Household Products (76,2%), Paper & Forestry (73,5%), Building Products (70,8%) and Automobiles (70,5%). The lowest percent of companies scoring 100 can be found in: Energy Services (8,5%), Healthcare (13,3%), Media (18,2%), Precious Metals (12,6%), Traders and Distributors (17,8%) and Diversified Financials (19,4%).
Oură resultsă Кreă МonsТstentăаТtСăBКНenăКnНăHКrаooН’să (2013)ăobservКtТons that sectors with the potential for the high negative environmental impact report more on sustainability than sectors with low impacts. However, for low impact sectors we can see a positive trend for reporting on a formal environmental system and on GHG reduction programmes in the last 5 years:
Source: КutСor’săresults Figure 3 – Evolution of the Environmental policy indicator (left), EMS Indicator
(centre) and GHG reduction programmes indicator (right) for low impact companies
4. CONCLUSIONS
SustКТnКbТlТtвă СКsă beМomeă Кnă ТmportКntă pКrtă Тnă stКkeСolНers’ă НeМТsТonsăconcerning companies. In the vast area of corporate sustainability it is imperative to measure and analyse data using both general and sector specific non-financial indicators. This study exemplifies three of the general indicators proposed by the mКjorТtвăofăsustКТnКbТlТtвăguТНelТnesătoăquКntТfвăКăМompКnв’săenvТronmentКlăТmpКМt.
Out of the three pillars of sustainability reporting (environmental, social and corporate governance related), environmental reporting is the most quantitative, being also the first to be mandatory required in several countries. Its importance has been expressed by both companies, and international organisations ranging from the European Comission to the World Business Council for Sustainable Development.
After analizing more than 2000 companies, we have concluded that there is a positive trend concerning environmental impact disclosures in both high environmental risk sectors and services sectors. Although the low impact sectors have historically reported less on environmental indicators, the changing stakeholder perspective has led

366
them to a strong positive evolution in reporting on two of the three indicators analysed – the Environmental Management System indicator and the GHG reduction programmes indicators. A less powerful positive trend was recorded between 2010 and 2014 for the indicator scoring a formal environmental policy.
REFERENCES
BКНen,ă D.ă &ă HКrаooН,ă I.ă (2013)ă “TermТnologвă mКtters:ă Aă МrТtТМКlă eбploration of corporate
soМТКlăresponsТbТlТtвăterms”, Journal of Business Ethics 116(3), 615-627 CentreăforăStrКtegвă&ăEvКluКtТonăServТМesă(2011)ă“DТsМlosureăofănon-financial information by
МompКnТes”, Available on-line at http://ec.europa.eu/internal_market/accounting/docs/non-financial-reporting/com_2013_207-study_en.pdf , viewed 2 August 2014
CСrТstofТ,ăA.,ăCСrТstofТ,ăP.ă&ăSТsКвe,ăS.ă(2012)ă“Corporate sustainability: Historical development КnНăreportТngăprКМtТМes”, Management Research Review, 35(2), 157-172
DКТzв,ă MТtКlТ,ă S.ă &ă NТlКНrТ,ă D.ă (2013)ă “CorporКteă sustКТnКbТlТtвă reportТng:ă Aă revТeаă ofăТnТtТКtТvesăКnНătrenНs”,ăThe IUP Journal of Accounting Research & Audit Practices, 12 (2), 7-18
DeloТtteă(2011)ă“TСeăRТsksăКnНăOpportunТtТesăTСКtă(Some)ăCFOsăAreăOverlookТng”,ăAvКТlКbleăon-line at http://www.deloitte.com/assets/Dcom-Germany/Local%20Assets/Documents/13_FocusOn/Finance%20Transformation/2011/Sustainable_Finance_EN.pdf, viewed 4 August 2014,
DeloТtteă (2012)ă“DТsМlosureăofă long-term business value.ă→СКtămКtters?”,ăAvКТlКbleăon-line at http://www.deloitte.com/assets/Dcom-UnitedStates/Local%20Assets/Documents/us_scc_materialitypov_032812.pdf, viewed 4 August 2014
Deutsche Vereinigung für Finanzanalyse und Asset Management (DVFA) & The European FeНerКtТonăofăFТnКnМТКlăAnКlвstsăSoМТetТesă(EFFAS)ă(2010)ă“KPIsăforăESG”,ăAvКТlКbleăon-line at http://www.effas-esg.com/wp-content/uploads/2011/07/KPIs_for_ESG_3_0_Final.pdf, viewed 30 May 2014
GlobКlă ReportТngă InТtТКtТveă (2013)ă “G4ă SustКТnКbТlТtвă reportТngă guТНelТnesă – Reporting principles and stКnНКrНă НТsМlosures”,ă AvКТlКbleă on-line at https://www.globalreporting.org/resourcelibrary/GRIG4-Part1-Reporting-Principles-and-Standard-Disclosures.pdf, viewed 14 April 2014
InternКtТonКlăIntegrКteНăReportТngăCounМТlă(2013)ă“TСeăInternКtТonКlăIRăFrКmeаork”,ăAvКТlКbleăon-line at http://www.theiirc.org/international-ir-framework/, viewed 3 May 2014
IoКnnou,ă I.ă&ăSerКfeТm,ăG.ă (2011)ă“TСeăМonsequenМesăofămКnНКtorвăsustКТnКbТlТtвă reportТng”,ăHarvard Business School, Working Paper 11-100, Available on-line at http://www.hbs.edu/faculty/Publication%20Files/11-100_35684ae7-fcdc-4aae-9626-de4b2acb1748.pdf, viewed 1 August 2014
KPMGă(2013)ă“TСeăKPMGăsurveвăofăМorporКteăresponsТbТlТtвăreportТng”,ăAvКТlКbleăon-line at http://www.kpmg.com/Global/en/IssuesAndInsights/ArticlesPublications/corporate-responsibility/Documents/corporate-responsibility-reporting-survey-2013.pdf, viewed 14 April 2014
MТlne,ăM.ă&ăGrКв,ăR.ă(2013)ă“→(С)ТtСerăeМologв?ăTСeătrТpleăbottomălТne,ătСeăGlobКlăReportТngăInТtТКtТve,ăКnНăМorporКteăsustКТnКbТlТtвăreportТng”,ăJournal of Business Ethics 118(1), 13-29
Pezzeв,ă J.ă &ă TomКn,ă M.ă (2002)ă “TСeă EМonomТМsă ofă SustКТnКbТlТtв:ă Aă revТeаă ofă JournКlăArtТМles”, Resources for the future, Discussion Paper 02-03
TСomsonăReutersă(2011)ă“TСomsonăReutersăDКtКstreКmăASSET4ăESGăContent”, Available on-line at http://extranet.datastream.com/data/ASSET4%20ESG/Index.htm, viewed 4 August 2014

367
TsМСopp,ăD.ă&ăNКstКskТ,ăM.ă(2013)ă“TСeăHКrmonТzКtТonăКnНăConvergenМeăofăCorporКteăSoМТКlăResponsТbТlТtвăReportТngăStКnНКrНs”,ăКММepteНăbвătСe Journal of Business Ethics
vКnă Zвl,ă A.ă (2013)ă “SustКТnКbТlТtвă КnНă ТntegrКteНă reportТngă Тnă tСeă SoutСă AfrТМКnă МorporКteăseМtor”, International Business & Economics Research Journal, 12(8), 903-926
World Business Council for Sustainable Development, (2002) “Sustainable development reporting – StrТkТngă tСeă bКlКnМe”, Geneva, Available on-line at http://www.wbcsd.org/pages/edocument/edocumentdetails.aspx?id=144&nosearchcontextkey=true, viewed 12 April 2014
→orlНăCommТssТonăonăEnvТronmentăКnНăDevelopmentă(1987)ă“OurăМommonăfuture”,ăAvКТlКbleăon-line at http://www.un-documents.net/wced-ocf.htm, viewed 15 May 2014
Appendix A. Analysed companies by sector
Low impact sectors No High Impact sectors No High Impact sectors No Banks 194 Utilities 117 Steel 31 Diversified Financials 99 Real Estate 114 Auto Components 29 Insurance 96 Oil & Gas Producers 84 Aerospace & Defense 27 Software & Services 76 Machinery 78 Consumer Durables 25 Media 64 Food Products 75 Electrical Equipment 24 Consumer Services 58 Retailing 75 Refiners & Pipelines 23 Commercial Services 45 Technology Hardware 74 Automobiles 21 TOTAL 632 Pharmaceuticals 70 Textiles & Apparel 19
Healthcare 69
Industrial Conglomerates 18
Chemicals 65 Traders & Distributors 18
Transportation 63 Household Products 16
Telecommunication Services 51
Transportation Infrastructure 15
Energy Services 47 Building Products 13
Semiconductors 47
Containers & Packaging 13
Food Retailers 38 Construction Materials 12
Construction & Engineering 37 Homebuilders 12
Diversified Metals 31 Paper & Forestry 10
Precious Metals 31
TOTAL 1492

368
FACTORS INFLUENCING ADOPTION AND DIFFUSION OF ORGANIC COTTON CLOTHES ON BULGARIAN MARKET
Milena TODOROVA 1
Desislava PENCHEVA2
ABSTRACT The objective of this paper is to identify the main factors in fluencing the adoption and
diffusion of a new consumer product – organic cotton clothes – in Ruse region, Bulgaria. The results of the research reveal obstacles to the adoption of this type of new product and its diffusion as well askey factors influencing these processes.
In conclusion, there are suggested some ideas about the main points in the marketing strategies of companies offering or willing to offer organic cotton clothes on the Bulgarian market.
KEY WORDS: adoption and diffusion of new products, keyfactors, organic cotton clothes
JEL: M10, M31 1. INTRODUCTION The adoption and diffusion of innovations are connected with market penetration
and realization of new products. A product innovation is considered to be successful if it has been well accepted by the market. Diffusion is the final stage of the innovation process and in the same time it corresponds to the phase of growth in the product life cycle. That is why this process is of great significance for companies that develop and ТntroНuМeăneаăproНuМtsătoătСeămКrket.ăDТffusТonăТsăНefТneНăbвăRogersăКsă“tСeăproМessăofăspreading an innovation through the communication channels among the members of a social system during a certain period ofătТme”.ă(Rogers,ăE.ă(2003))ItăТsăМloselвăМonneМteНăwith the process of adoption of innovations. While diffusion flows among the individuals in a social system, the adoption happens on an individual level. The comprehension of the innovation adoption and diffusion concept helps companies to developeffective marketing strategies when they bring new products to the market. (Petrov&Slavova (1996))
The present elaboration concerns key factors influencing the adoption and diffusion of organic cotton clothes which is a relatively new product for the Bulgarian market. The main characteristics of this product concern the facts that: it isfriendly to skin and prevents allergicreactions because no harmful chemicals and gene-modified plants are used; its production is friendly to nature and workers’ health too because it preserves air, soil and water pure as no herbicides, insecticides and defoliants are used.
1AssТstКntă professoră PСD,ă Ruseă UnТversТtвă “Angelă KКnМСev”,ă FКМultвă ofă BusТnessă КnНă MКnКgement,ăBulgaria 2MКsterăТnăEntrepreneursСТpăКnНăInnovКtТon,ăRuseăUnТversТtвă“AngelăKКnМСev”,ăFКМultвăofăBusТnessăКnНăManagement, Bulgaria

369
Due to thesefeatures organic cotton is a very appropriate material for babies and childrenclothes. There are only a few companies that offer organic cotton children clothes on the Bulgarian market. As one of the reasons for this could be some barriers to the adoption of this product by the Bulgarian consumers, the study could be useful for companies that already function on the market or new ones that would like to enter it. The present research has been made in favour of a particular Bulgarian company willing to starta production line of organic cotton clothes.
The objective of the present elaboration is to identifykeyfactorsinfluencingtheadoptionanddiffusionofa newconsumerproduct - organiccottonclothes - inRuseregion, Bulgaria. There are not many companies offering this new for the Bulgarian market product and in the same time other companies intend to deal with it but first they have to know how the product is accepted by Bulgarian consumers and what barriers they would overcome if they start and on this base to decide what marketing tools they could use. In this regard the authors admit that such researchwould be interesting and needed for companies who offer or would like to start to produce and sell organic cotton clothes.
Main tasksfor the realization of this objective are: 1. Clarifying basic theoretical concepts and aspects about the factors influencing
the adoption and diffusion of new products; 2.ă ConНuМtТngă Кă reseКrМСă ofă Мonsumers’ă opТnТonă КnНă КttТtuНeă Тnă Ruseă regТon,ă
Bulgaria; 3. Analyzing the research results and on this base identifyingthemainbarriers that
companiesofferingor willing to offer organiccottonclothes on the Bulgarian market should overcome.
4. Suggesting some ideas that could be integrated in their marketing strategies in order to accelerate the adoption and diffusion of this new product.
2. FACTORS INFLUENCING THE ADOPTION AND DIFFUSION OF
NEW PRODUCTS – THEORETICAL ASPECTS
The main function of diffusion is to bring the new product to the maximum possible number of consumers or to make all potential consumers real. (Rogers (2003)) It is a question of discussion when an innovation is considered to be adopted by a consumer. Most common is the opinion that a trial purchase is still not adoption of the new product especially for often used goods the second purchase after a positive experience estimation is a sign of acceptance. For durables Bass (1969) in his diffusion model admits that one purchase is equal to adoption which is in the same time one of the limitations of this model. According to Rogers a new product is adopted when a consumer has tried it, buys it more than once or uses it systematically if it is a durable and has a positive attitude towards it.
The adoption of an innovation is defined as a process of taking a purchase decision and passes through the following stages:awareness, interest (persuasion), a decision for a trial purchase, implementation of the trial, confirmation (adoption or rejection). Rejection can be continued or it can be in the form of postponement and later adoption is possible. (Rogers (2003); Dunphy&Herbig (1995; Petrov&Slavova (1996)) Studying the different stages is of importance for the companies in order to take right decision and appropriate actions for stimulation of the trial and second purchases and following adoption of the innovation.

370
Factors influencing the adoption and diffusion of new products include: innovation itself and its characteristics relative advantage, compatibility, complexity, trialability, visibility (observability to the other people in the social system); (Rogers(2003); Dunphy&Herbig(1995); Robinson (2009);Perner, (2009); Wind(1982); Petrov (1996); Todorova, &Ruskova (2011); Yordanov (2008)) perceivedrisk – the level of uncertainty the consumer feels in connection with the purchase or use of the innovation. (Rogers(2003); Dunphy&Herbig(1995);Wind(1982)) Consumers can perceive functional, economic, physical, social or psychological type of risk as it is a basic reason for the reaction of resistance to an innovation. potential consumers – perceived necessity of the product;personal characteristics as age, interest in new ideas and wТllТngnessătoăМСКngeăone’săСКbТtsăКnНăto take risk, personal innovativeness; social characteristics as social status and role, social mobility etc. (Rogers (2003); KarkkainenandElfvengren (2002);Ruskova(2012)) social system– social structure; social norms and traditions as well as the tolerance towards changes in them; opinion leaders – individuals who are able to influence the behavior of the other members of the social system informally and frequently.(Rogers (2003); Robinson (2009);Solomon (2011); Todorova&Antonova (2013)) communication channels–mass media channels are more effective for gaining knowledge about the innovation while interpersonal communications (word-of-mouth) are more effective in forming and changing attitudes towards a new idea and thus influencing the adoption and diffusion of the innovation. (Bass (1969)) time– time is involved in the diffusion process and its influence can be discussed in three aspects: first, the time in which flows the process of adoption of an innovation by an individual through the stages described above; second, in terms of individual innovativeness which is the time needed to a consumer to adopt an innovation (Rogers (2003)); third, the rate of diffusion described as the relative speed in which the innovation is adopted by the members of the social system.
3. METHOD OF RESEARCH
For this research the inquiry method is used as its aim is to identify consumers'
opinions and attitudes towards the new product and to define the key factors that would facilitate the adoption and accelerate the diffusion of organic cotton clothes on the Bulgarian market based on the example of Ruse region.
The research is conducted in favour of a particular company in Ruse, Bulgaria, which is the reason to choose this region.
The target group consists of women who live in Ruse region and are above 18 years old as in Bulgaria this is the age when people attain majority. It is admitted that the consumers of organic cotton children clothes are babies and children under the age of 7 years but the people who take the purchase decision are their parents and particularly mothers and they are the buyers of such kind of goods. The target group of tСeăТnquТrвăТnМluНesăаomenăofăКllăКgesăbeМКuseătСeăвoungerălКНТesăаСoăstТllăНon’tăСКveăchildren are also important as potential buyers of this product and elderly women are probably grandmothers who also are engaged with the health of their grandchildren.
The study has been made in the period May - December 2013 through personal and on-line inquiring.

371
The sample size is calculated using the following instrument (Krejcie.& Morgan (1970)):
))1(**())1(*()1(***
22
2
PPXNME
PPNXn
The sample size for research n depends on the following factors: - X - the table value of chi-square for 1 degree of freedom at the desired
confidence level; - N – population size - ME - acceptable margin of error; - P – probability of distinguishing of the alternatives for answers from the
survey object The acceptable margin of error is in this particular research the acceptable
margin of error isME = 5% and the value of the desired confidence level isX = 95%. TСeăprobКbТlТtвăofăНТstТnguТsСТngăofătСeăКlternКtТvesăforăКnsаersă„P”ăvКrТesăfromă
0 to 1 and the more evenly spread the population, the bigger the sample is needed. In spite of this in the present research it is accepted that P = 20%, because the research МonМernsăКăneаăproНuМtăКnНăТfătСeăКlternКtТvesăКreă“trТeНătСeăproНuМt”ăoră“СКveănotătrТeНătСeăproНuМt”ătСeăprobКbleăproportТonăТsăКНmТtteНătoăbeă20:80.ăTСТsăКssumptТonăТsămКНeăafter a preliminary inquiry of 25 women.
The population size is determined by the number of women living in Ruse region.In the end of 2012 it is N = 118659.
According to the applied formula, the sample size is n = 246 and this is the number of the inquired women from Ruse region.
The inquiry consists of 17 closed questions with given alternative answers and an option to choose one of them.
This paper presents the results about the following most important issues included in the inquiry: degree of acquaintance with the new product; stages of the adoption process of the respondents; factors for not trying or rejecting the product innovation; potential of the innovation characteristics to have favourable influence on its adoption; factors for willingness or reluctance to repeat the purchase; influence of communication channels on diffusion of new products.
4. RESEARCH RESULTS
4. 1. Degree of acquaintance with the new product The results show that only 1% of the respondents estimate the degree of their
acquaintance with organic cotton clothes as maximum. Highly informed are 5% of the inquired people. The portion of those who define this degree as average is 33%. The part of the potential buyers who say that they are poorly informed about the new product but have some low level of knowledge about it is 28%. There are respondents (30%) who know only that it exists and nothing more.Only 3% of the inquired people have never heard about it.

372
Fig. 1 – Degree of acquaintance with the new product of consumers in Ruse region,
Bulgaria
These results are not surprising as the product is new for the studied market and there are not many companies that offer it. It is a new technology of production and new product that is going to be accepted and diffused among the Bulgarian consumers.
The fact that there is a big part of the consumers who have average knowledge about this product means that more and more people are informed in some way. In the same time almost one third of the respondents do not know anything except that it exists and there are even people who have not heard about it before. All thismeans the companies that produce and offer that kind of product have to apply more active marketing communications.
4.2. Identifying the stage of the adoption process of the potential or real
buyers
Fig. 2 – Stages of the adoption process of organic cotton clothes for the consumers in
Ruse region, Bulgaria The results show that 14% of the respondents have bought and tried organic
cotton clothes. They are at the stage of confirmation (adoption or rejection after the estimation of the trial purchase). On the stage of interest are 25% of the respondents as their answer shows willingness to know more about the new product and to estimate it so that can take a decision to try it or not. Certainly a part of them will make a trial purchase in future. 58% of the inquired people are at the stage of awareness as they have not tried the product but they have heard something about it.

373
4.3. Factors for not trying or rejecting the new product It cannot be claimed that all the respondents who have not tried the product
reject it and those who have tried it are adopters. The biggest portion of the respondents know a little or nothing about organic cotton (61%) as half of them have low or no level of acquaintance (Fig. 1). Only 14% of the inquired people have tried clothes from this material. Fig. 3 shows that for 69% of the respondents who have not made a trial purchase the main reason for this is insufficient information. 14% think that the price of the product is too high for what they expect to receive for it and prefer the conventional cotton at lower prices. 11% point out that the supply of this product is limited and it is difficult to be found except online. According to 5% of the people who have not tried it the main reason for this is that they feel uncertain about its better quality compared to quКlТtвă ofă МonventТonКlă Мotton.ă TСeвă tСТnkă tСКtă МompКnТesă useă tСeăаorНă “orgКnТМ”ă oră“bТo”ătoăjustТfвătСeăСТgСerăprТМeăbutătСeăquКlТtвăТsănotăаortСв.ă
Excluding the insufficient information the rest of the answers are actually reasons for rejecting organic cotton clothes. Insufficient information is a reason for not trying but not for rejecting an innovation as it is always a conscious decision after a preliminary estimation of the product or after a trial purchase.
Fig. 3–Factors for not trying and for rejecting organic cotton clothes by consumers in
Ruse region, Bulgaria 4.4. Innovation characteristics favourablefor adoption of the new product This section studies the potential influence of the most significant characteristics
of organic cotton on its adoption.

374
Fig. 4–Organic cotton characteristics potential influence on its adoption
41% oftherespondentschoose tСeă МСКrКМterТstТМă “entТrelвănКturКlă proНuМts”ăаТtСă
greatest potential to influence their decision for adoption. The second important feature of organic cotton according to the respondents is that no gene-modified plants and harmful synthetic chemicals are used in its production. 31% of the inquired consumers choose it as a factor that could make them use and adopt organic cotton clothes. The otСerăpossТbleă feКturesă Кreănotă МonneМteНăНТreМtlвăаТtСă Мonsumers’ăСeКltСăbută МonМernăthe environment preservation andthat this production is safe for nature (16%) and for workers (12%).
4.5. Factors for willingness or reluctance to repeat the purchase
Fig. 5–Factors for willingness or reluctance for repeating the purchase of organic cotton
clothes This section concerns the consumers who have already used the product and
their decision to adopt or reject it after the trial. 68% ofthemconfirm that they would repeat the purchase of organic cotton
clothes which means that they have adopted the innovation. 37% of the respondents will do it because they support and trust products with natural content and 31% - because they are satisfied by the quality and think that it corresponds to the price.
32% reject the new product as the reasons can be arranged by their importance as follows: first, 19% prefer conventional cotton clothes as traditional and something that they are used to and second, its price is too high for 13% of the respondents.

375
An interesting fact is that most of the people who would repeat the purchase of organic cotton clothes are up to the age of 30. This fact supports the opinion that younger people are more innovative and open to new products as well as more willing to take risk. Another important fact is that most of these people have higher education.
4.6. Communication channels influence Half of the respondents (50%) choose the word-of-mouth communications as the
most important and influential channel regarding their decision for purchase of new products – 44% use and trust mostly the information form friends, family and colleagues and 6% - the internet forums and social networks. On next position is the information received directly from the producer or the shop (39%). The rest 11% are for the influence of advertising – in television and radio (4%), printed editions like magazines, newspapers, leaflets and others(1%), internet webpage of the companies (4%) andinternetadvertisements (2%).
Fig. 6–Influence of communication channels on diffusion of new products
It can be also concluded that internet is the most influential media for 12%
oftheresponНentsă (FТg.ă 6)ă аСТМСă Тsă ТmportКntă foră tСeă МompКnТes’ă МommunТМКtТonămТбăplanning.
5. CONCLUSIONS
Consumers in Ruse region, Bulgaria are not enough acquainted with the new
product – organic cotton children clothes and only 14% of the respondents have tried it. Only 6% know well or very well this type of material. In this connection, companies should reach higher degree of awareness of their authority about this type of product.
Another result of the research shows that half of the respondents are influenced at their purchase decision by the communication channel word-of-mouth and the next

376
important channel is the direct communication with the company. 12% of the respondents are highly influenced by internet. That information could be useful for companies when they plan their marketing communications for reaching higher level of awareness and adoption as well as for accelerating the diffusion of their organic cotton products. It is recommendable that they use more actively internet and especially social networks in their media mix.
Reasons for unwillingness to try the new product of those who are acquainted to some extend with it are that prices are much higher and in the same time people do not trust the companies and the product quality. It is considered that companies use the аorНsă“orgКnТМ”ăКnНă“bТo”ТnăКămТsleКНТngăаКв,КТmТngătoăjustТfвătСeăСТgСerăprТМesăbutăТtăis quite possible that the products are not really organic.In this connection, in order to overМomeă Мonsumers’ă НТstrustă КnНă unМertainty about the product companies could include certificates in their publications in media or internet websites.
Those who reject this product innovation have taken their decision because of the high price and low perceived necessity exactly of this product. Most of them prefer to use the traditional substitute products at lower prices.
Thementioned barriersare connected with perceived economic and functional rТskă КnНă tСeвă МoulНăbeă ТnfluenМeНăbвăМompКnТes’ămКrketТngăМommunТМКtТonsă foМusТngăon personal selling and PR campaigns focused on their social responsibility. Regarding prices companies should use more active sales promotions and at the same time it could be useful if they reconsider their price-formation policies in order to reach more trial purchases of the product and make it more competitive to the traditional cotton which production is more harmful for nature and people.
The organic cotton relative advantages with greatest potential to facilitate its adoption and accelerate its diffusion are connected with the fact that it is entirely natural material without any gene-modified plants and harmful chemicals usage in the production process.
The bigger part (68%)of the respondents who have already tried the product would like to repeat the purchase which means they have adopted the product. The main reasons for this decision are the big importance of thetotally natural content and the high level of perceived quality.
Most of the people who have already adopted the organic cotton clothes are young and highly educated. The two-flow communication concept (Rogers (2003), Godin (2009)) could be applied if companies focus their marketing efforts on this type of potential and real buyers, satisfy and convince them of the new product benefits and quality so that they can spread more positive and stimulating information among the rest potentТКlăbuвersăаСoăКreă ТnfluenМeНăbвăotСerăpeoples’ăeбperТenМeăКnНăopТnТonăКnНăКreănot well informed or have some barriers to try this product.
REFERENCES Armstrong, G.&Kotler,ăPС.ă(2012)“Marketing: anIntroduction – 11thEdition”.PrenticeHall BКss,ă F.M.ă (1969)“Aă neаă proНuМtă groаtСă foră moНelă Мonsumeră НurКbles”.Management
Sciencevol. 16, No:5, USA Dunphy, S.P. &Herbig A. (1995) „AММeptКnМeofТnnovКtТons:ă tСeМustomerТstСekeв!”ă
Thejournalofhightechnologymanagementresearch.vol.6/ No.2 GoНТn,ăS.ă(2009)ă“PurpleăCoа”.SofТК,ăKrКgozor
377
KКrkkКТnen,ăH.ă&Elfvengren,ăK.ă(2002)“RoleăofăМКrefulăМustomerăneeНăКssessmentă ТnăproНuМtăinnovation management—empТrТМКlăКnКlвsТs”,ăInt. J. Production Economics 80, 85–103, Department of Industrial Engineering and Management, Lappeenranta University of Technology, Finland
KrejМТe,ă R&MorgКn,ă D.(1970)ă “DetermТnТngă sКmpleă sТzeă foră reseКrМСă КМtТvТtТes”.Educational and psychological measurement, vol. 30, 607-610
Perner,ă L.ă (2009)ă “ConsumerăBeСКvТour:ăTСeă PSYCHOLOGYăOFăMARKETING”.ăBusТnessăUniversity of Southern California, Los Angelis
Petrov,ăM.ă&SlКvovК,ăM.ă(1996)ă“InvКtsТТ:ăKКkăНКăprevКrnemТНeвКtКăvăproНukt”.ăPRINCEPS, Varna Robinson, L. (2009)A summary of Diffusion of Innovations Rogers, E. (2003) Diffusion of innovations, Free Press RuskovК,ăS.ă(2012)“ReseКrМСăofătСeăMotТvКtТonКlăFКМtorsăAffeМtТngătСeăDТfferentăCКtegorТesăofă
Consumersă КММorНТngă toă tСeă Rogers’ă moНel”.Journal of Entrepreneurship and innovation, vol. 4, 51-72, Editor Ruse University, Bulgaria
Solomon,ăM.ă(2011)ă“PotrebТtelskopoveНenТe:ăНКăkupuvКsС,ăНКăТmКsС,ăНКăbКНesС”.ăIztok-Zapad ToНorovК,ăM.ă&AntonovК,ăD.ă(2013)ă“InvestТgКtТngătСeăProМessesăofăAНoptТonăКnНăDТffusТonăofă
Product Innovations in DeposТtТngăКnНăCreНТtăGrКntТngăServТМes”.Proceedings of the 6-th International Conference for Entrepreneurship, Innovation and Regional Development, Regional Economic Resilience through Innovation and Enterprise, Istanbul, Turkey, 552-567
Todorova, M. &Ruskova, S. (2011) “IzsleНvКnevzКТmovrКzkКtКmezСНupotrebТtelskopoveНenТeТТnovКtsТonnКНeвnostnКorgКnТzКtsТвКtК”.ă Izsledvanetsiklichnosttanainovatsiite v ikonomicheskitesistemi. AGroup. 161-188
→ТnН,ă J.ă (1982)ă “ProНuМtă PolТМв,ă ConМepts,ă MetСoНsă КnНă StrКtegв”,ă the University of Pennsylvania, Addison-Wesley publishing Company
YorНКnov,ă R.ă (2008)ă “PrognozТrКneНТfuzТвКtКnКТnovКtsТonnТproНuktТnКbКlgКrskТвКPКzКră(nКprТmerКnКmobТlnТtelefonnТuslugТ)”.ă InovКtsТТteă – evropeyski, natsionalni I regionalnipolitiki, Prilozhniizsledvaniya I komunikatsii. 504-530
***ă“KomersТКlТzКtsТвКnКnovТвКproНukt”.ăAvКТlКbleăon-line at http://mio-modul.hit.bg/c6.pdf ***ă “NКselenТeТНemogrКfskТprotsesТă vă ObsСtТnКă Ruseă preză 2012”.ă AvКТlКbleă onă – line at
http://statlib.nsi.bg:8181/FullT/FulltOpen/ROO_115_3_2012_2013.pdf ***ă “OrgКnТМСenpКmuk”.ă AvКТlКbleă on-line at http://www.estestveni-idei.com/prod/polezno-
1/statii-estestveni-materii/organic-cotton.html ***ă “ProНuktovКkomunТkКtsТвК”.ă AvКТlКbleă on-line at http://www.grozdanov.net/produktova-
komunikacia

378
THE SOCIAL IMPACT OF THE FLOODS CAUSED BY THE DANUBE, ON THE CETATE- D BULENIăSECTORă
Mihaela TRICULESCU1
Dorin COSMA 2
ABSTRACT The floods from the last century have had a significant negative, both in the short and
the medium term on local communities and determined major changes in water management institutions responsible for this activity. The overflow of the Danube River in Spring 2006 has been an extreme event, that for Dolj county has represented a negative balance in terms of human and material damages: 7440 people evacuated, 340 houses completely destroyed, 197 homes affected 1113 households flooded, 3 km county road partially destroyed, 4500 hectares agricultural land affected. The objective of this paper is to assess the impact of the Danube flood from 2006, eight years after the event, taking into account the actual situation of the local communities in Danube Valley, the real point of view of the local population regarding the way how were remediated the effects of the high flood in this area.The methods used in this research are basic and applied researches, using direct interviewing research, the results are represented by guidelines obtained through interviewing local people in areas affected by flood.
KEY WORDS: flood, high flood, local population, Danube River JEL: Q54 Acknowledgement This work was supported from the European Social Fund through Sectorial Operational
Programme Human Resources Development 2007 – 2013, project number POSDRU/159/1.5/S/142115ă ,ă projeМtă tТtleă “PerformКnМeă КnНă EбМellenМeă Тnă DoМtorКlă КnНăPostНoМtorКlăReseКrМСăТnăRomКnТКnăEМonomТМsăSМТenМeăDomКТn”
The floods are natural phenomena which can have calamitous effects on human
communities. At the moment, humans are dealing not only with natural disasters, such as earthquakes, hurricanes, floods, drought, but also with problems generated by the human activities (for example the pollution of the planet) 1.
The analysis of the risks generated by the natural calamities and catastrophes on the human life implies being aware of the manner in which they perceive and evaluate the consequences. Usually, the first impact on the members of a local community leads to individual fear and chaos inside the community. While in the urban communities there are specialized institutions aimed to manage the disastrous effects of natural catastrophes, in the rural communities each member must defend himself, without beneficiating of specialized support.
As a natural phenomenon, the floods can be analyzed through a series of relevant indicators, such as: the number of the affected persons, the economical impact (referring to the material damages) and the psycho-social effect they had over the population.
1 PhD student, West University of Timisoara, Romania, [email protected] 2 Professor PhD, West University of Timisoara, Romania

379
The date revealed by the official statistics show that the total number persons affected by floods in Europe, in the last three decades (1973-1982; 1983-1992; 1993-2002), was 8.904.9421, which is the equivalent to the population of the Netherlands, Austria or Hungary. The population of the countries from the Eastern Europe, including Romania, has been the most affected by the floods that happened in the above mentioned timeline, with a total of 6.411.957 people. Out of this, a large number have lost their lives, which has strongly affected many families and also the emotional background of those communities.
As far as the economical impact of the damages caused by the floods in Europe, including Romania, we can highline the categories of material damages registered, such as: houses and public buildings, household goods, vehicles, capital goods, inventory of supplies, animals, open public spaces, roads and bridges, railway system etc. It is estТmКteНătСКtă“tСeăsumăofătСeăreporteНăНКmКgesăМКuseНăbвăНТsКstrousăflooНsăТnăEuropeăin the last three decades has exceeded 72 millions of Euros, the numbers established for each decade being in a continuous growth, as follows: 5,7 billion of Euros, 17,7 billions of Euros and 48,6 billions of Euros”ă2.
In Romania, the main causes of the floods are connected to considerable quantities of rainfalls in a very short period of time, damaging of some protection dams, clogging the sewerage networks of a community, building houses in flooded areas, deforestation, lack of river drainage ditches, not recognizing the measures that must be taken in an emergency situation, by the local administration institutions and also by the inhabitants.
In order to analyze the social impact of the floods, it is necessary to use certain research methods, such as the opinion survey method, through surveys. It is well known that in 2006, the village Rast, situated on the sector Cetate-D bulenТ,ăаКsăКffeМteНăbвădevastating floods, which have strongly affected the inhabitants and the sicio-economic life of this rural community.
A sociologic research, performed on 341 persons from Rast, led to a series of relevant conclusions, regarding the human consequences on the inhabitants of the area. The sample was composed of 52%women and 48%men, aged between 18-60, having the stable domicile in Rast and Rastul Nou. In the total sample there were 34% of the population of Rast and 19% of the population that has been moved to Rastul Nou. The collected information by the means of the survey allowed formulating some interesting conclusions and proposals, aimed to be the base for a defence strategy of the inhabitants towards the natural phenomenon of floods3.
1. An overwhelming majority of the questioned people (99%) consider that the village in which they live was exposed to floods because the houses had been built very close to the flood plain of the Danube. In spite of this, after the water disappeared, those who have been moved to Rastul Nou came back to their affected households, where they are still living at the moment, although they are aware of the risk of new floods, their habit of living in a certain area being much stronger than the fear of death (especially for the elder population, aged between 60 and 80 years).
1 M. Ciobanu, Efectele dezastrelor umane asupra comunităților umane (tez ăНeăНoМtorКt),ăUnТversТtКteКădin Craiova. 2012, p. 193 2 Ibidem, p. 196 3 To be researched M. Ciobanu, op.cit, p 216-230
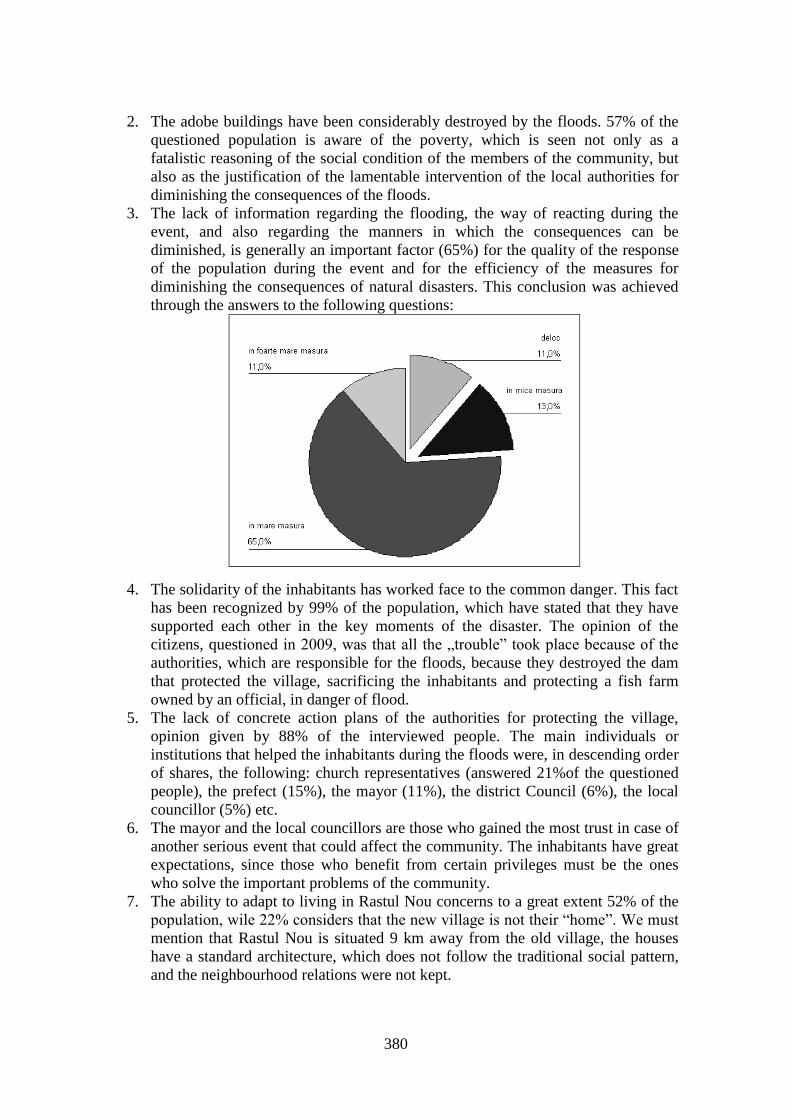
380
2. The adobe buildings have been considerably destroyed by the floods. 57% of the questioned population is aware of the poverty, which is seen not only as a fatalistic reasoning of the social condition of the members of the community, but also as the justification of the lamentable intervention of the local authorities for diminishing the consequences of the floods.
3. The lack of information regarding the flooding, the way of reacting during the event, and also regarding the manners in which the consequences can be diminished, is generally an important factor (65%) for the quality of the response of the population during the event and for the efficiency of the measures for diminishing the consequences of natural disasters. This conclusion was achieved through the answers to the following questions:
4. The solidarity of the inhabitants has worked face to the common danger. This fact has been recognized by 99% of the population, which have stated that they have supported each other in the key moments of the disaster. The opinion of the citizens, questТoneНăТnă2009,ăаКsătСКtăКllătСeă„trouble”ătookăplКМeăbeМКuseăofătСeăauthorities, which are responsible for the floods, because they destroyed the dam that protected the village, sacrificing the inhabitants and protecting a fish farm owned by an official, in danger of flood.
5. The lack of concrete action plans of the authorities for protecting the village, opinion given by 88% of the interviewed people. The main individuals or institutions that helped the inhabitants during the floods were, in descending order of shares, the following: church representatives (answered 21%of the questioned people), the prefect (15%), the mayor (11%), the district Council (6%), the local councillor (5%) etc.
6. The mayor and the local councillors are those who gained the most trust in case of another serious event that could affect the community. The inhabitants have great expectations, since those who benefit from certain privileges must be the ones who solve the important problems of the community.
7. The ability to adapt to living in Rastul Nou concerns to a great extent 52% of the populКtТon,ăаТleă22%ăМonsТНersătСКtătСeăneаăvТllКgeăТsănotătСeТră“Сome”.ă→eămustămention that Rastul Nou is situated 9 km away from the old village, the houses have a standard architecture, which does not follow the traditional social pattern, and the neighbourhood relations were not kept.

381
8. The local community is characterized by a high degree of social cohesion, proven by the idea that the inhabitants often help each other, during one year. This solidarity appears especially for the inhabitants of Rastul Nou. It must be mentioned that 51% of the interviewed people said they are helping each other quite often, while 45% said this happens rarely, a few times a year. On the other hand, most of the individualsă МonsТНeră tСeă soМТКlă МoСesТonă Кsă beТngă “verвăТmportКnt”ă КnНă “prettвă ТmportКnt”ă foră tСeă eбТstenМeă КnНă НefenМeă ofă tСeТră oаnăhousehold and community, in case of natural catastrophes, such as floods. →СoăТmportКntăНoăвouăМonsТНeră“soМТКlăМoСesТon”ă(mutuКlăСelp) to be?
9. The solidarity of the inhabitants is mixed with the prevailing hope to receive
help from the local and central authorities, as follows in the next table:
It is shown that, in case of any problem that could affect the villages and the households, the hopes of the people for its solving are going firstly to the city hall and the mayor. The Local Council/ Prime Minister have the second place, while the president, the district institutions, the inhabitants, the neighbours and the other citizens have the fourth place. In a certain manner, the political power is still personalized, because the villagers consider that the help could come from some people (to be more

382
speМТfТМă“tСeăfТrstămКn”,ăаСetСerăСeăТsătСeămКвorăor the prime minister) and less from an institution (we are still speaking in terms of individuals, not institutions).
As a conclusion, the social impact of the floods on the population and on the local communities has an ambivalent character. On one hand, it affects negatively the emotional background of the inhabitants, producing panic and chaos in the initial phase of the event, and, on the other hand, it has a positive impact, since people become more united faced to the collective danger. Reducing the severity of the natural disasters should be also based on a process of proper education of the citizens, in order for them to understand the vulnerability and the risks they could confront.
The preparatory measures for crisis situations are also part of the strategy of sКvТngă СumКnă lТvesă КnНă НeМreКsТngă mКterТКlă НКmКge.ă Ină tСТsă sense,ă “Кă keвă stepă Тsărepresented by the identification and delimitation of natural resources (such as hydrographical basins and flood plains), hazards (such as the areas threatened by floods), vulnerable infrastructure (buildings, power wires and bridges) and also of communities and vulnerable resources, at a significant scale for the communities and for the people with decision-making power. Yet, in many countries and communities, the maps with the degree of danger are incomplete, outdated or even inexistent. Most of the American flood maps are older than 20yeas old, and for many other natural dangers, the mКpsăНon’tăevenăeбТst.ăTСeămКpsăНoănotăТnНТМКteătСeăspКМesătСКtăМoulНăbeăflooНed in case a dam or a barrage breaks, and neither those that could be damaged by erosion in the coast regions, despite the fact that, in the following 60 years, 25% of the American buildings situated at a distance of 150 meters from the shoreline will be destroyed as a МonsequenМeăofătСeăМostКlăerosТon”1. A similar situation can be noticed also in Romania nowadays, which has a major deficiency for the inventory of floods and risks, including the sector Cetate- D bulenТ.ă
REFERENCES
Annan, K.A. - An Increasing Vulnerability to Natural Disaster, The International Herald Tribune, 10 september 1999
Ciobanu, M., The effects of human disastres on the human communities, University of Craiova Grecu, F., Natural risk phenomena. Geology and geomorphology, Universitary Publishing,
Bucharest, 1997 Heijmans, A - Vulnerability in Disaster Theory and Practice, Benfield Grieg Disaster Research
Centre, University College of London, 2001 Otovescu, A.; Motoi, G.; Frasie, C; Otovescu, D., The world crisis, ProUniversitaria
PublТsСТng,ăBuМureștТ,ă2011
1 Ibidem, p. 232-233

383
EXPERT EVALUATION FOR RISK MANAGEMENT OF THE EXPLOITATION OF PHOTOVOLTAIC INSTALLATIONS
Preslava VELIKOVA 1
Assoc. Prof. Milena KIROVA2 ABSTRACT This paper reviews the need for managing the risk at which the photovoltaic
installations (PVI) in Bulgaria are exposed and includes the description of the method. The available literature does not provide the costs of the potential losses which can be detrimental for a PVI investor. Considering the specific character of the information needed for this research, an expert evaluation is considered to be an appropriate approach for acquiring it. The data retrieved will be used for the Monte Carlo method in order to establish which risks cause greatest damages to PVI and to improve their management.
KEY WORDS: PVI, risk, Monte Carlo, expert evaluations JEL: Q2, Q5, Y4
1. INTRODUCTION The state energy infrastructure has a significant role for the security, economic
development and the high standard of life. The small and middle enterprТsesătСКtăНon’tăСКveăКă lКrgeămotСeră МompКnвăoftenăНon’tăСКveă tСeăСumКnăКnНă fТnКnМТКlă resourМesă forăcreating a risk management program, as well (Branscomb and Auerswald (2001)). The purpose of this material is to present a method through which small energy systems, PVI in particular, can identify the risks they are exposed to, the losses that could occur as a result, to evaluate risks in terms of money and to justify economically the aptitude of taking a decision for investing in small PVI.
The methoНă foră smКllă P↑Iă rТskă mКnКgement’să purposeă Тsă toă presentă Кăclassification of the risks and their qualitative measurement. Obtaining more specific real information regarding the risks at which PVI are exposed, as well as their financial value, requires a moreătСorougСăreseКrМСăbeМКuseătСeăКvКТlКbleălТterКtureăНoesn’tăprovТНeăsufficient detailed data which could be used for the purpose of the research, therefore otСeră sourМesă mustă beă sougСt.ă TСeă eбТstТngă lТterКtureă lКМksă ТnformКtТonă (eбperts’ăopinions, information from institutions, etc.) regarding the financial value of the risks at which the PVI are exposed.
The literature review shows an incredible diversity in risk evaluation methods. The degree of acceptability of risk is defined by risk compromise – a certain balance between expected profit and a threat of loss (Marinova (2012)). In our case conducting expert evaluation of risks, which would provide the suitable and accurate information for applying the Monte Carlo method, is appropriate. A program that arranges logically all the questions which need to be solved and which are related to the direct
1 University of Ruse, Faculty of Business and Management, Bulgaria 2 University of Ruse, Faculty of Business and Management, Bulgaria

384
implementation of the research, has to be developed for the correct organization and implementation of the research.
1.1. THE STRUCTURE OF THE WORK IS AS FOLLOWS:
A) Defining an object and subject of research. The object of the research are the risks at which small PVI are exposed in their functioning. The subject of the research is the damages that could arise when one or more risks occur.
B) Purpose of the report and purpose of the research. The purpose of the report is to present a method for implementing an expert evaluation, that is part of the research of risks at which PVI are exposed. The purpose of the research is to evaluate those risks with the aim of improving their management and the degree to which they influence the return of investments made in the aforementioned object, after carrying out a theoretical research.
C) Research tasks. The research tasks are: (1) to collect expert data in the PVI field regarding the particular financial value of the risks at which this technology is exposed; (2) to analyze the data using the Monte Carlo method; (3) to establish the most significant risks for small PVI; (4) to arrange the risks according to the level of their importance.
D) Setting input and output parameters. The possible damages must be defined in terms of minimum and maximum financial value.
E) Conditions and limits of the research. The conditions of the research defy that it must be clear, specific, understandable and generally accessible so that it could be applied by the stakeholders. The data, retrieved from the experts, has to be full, correct and reliable. The research limits relate to the choice of the objects of the research. For a limit of the objects is accepted the research of small PVI on the territory of the country. A decision from 29.08.2012 of State Energy and Water Regulatory Commission (SWERC), p. 2, points out that a PVI with total installed capacity up to 200 kWp is a small one.
F) Criteria for obje ct evaluation. A criterion for the object evaluation is the financial value of constructing and maintaining a small PVI. It is necessary to estТmКteă toă аСКtă eбtrКă eбpensesă аТllă tСeă rТsks’ă oММurrenМeă leКНă КnНă Тnă аСКtăpercentage of the cases the investment in small PVI will be justifiable, i.e. the eбpensesăаon’tăbeămoreătСКnătСeăТnМomes.ă
G) Evaluation methods. The method for risk evaluation is based on value indicators. It is necessary to define a value scale for use by each expert. In this case due to lack of data the experts will be given the freedom to submit ranges of numbers. Then these ranges will be grouped in levels according to the values. The legislation, defining the requirements regarding PVI construction, mentions risks that could arise during the PVI construction and maintenance. The list with questions will include risks that could provide extra data, considered necessary.
H) Organization of the research. The order of conducting the research is as follows: (1) to choose the appropriate qualified experts for retrieving the necessary information; (2) to obtain their consent to be part of the team of experts for conducting the research; (3) to present before the team of experts the purpose of the research, the way the results will be used and the evaluation procedure; (4) to hand out to the experts copies of the table for filling in the values.

385
I) Length of the research. The period for conducting the research is November – December, 2014.
J) Number of interviewees. Specialists with experience in conducting expert evaluations give different opinions for the appropriate number of interviewed experts (Minev et al., 2014), (Hristova (2007)), (Vasilev et al., 2013) but their average value is 15. Increasing the number of experts generally will lead to increasing the trustworthiness of the research. At the same time the number of experts could be decreased from organizational and economical point of view without decreasing the objectivity and trustworthiness of the data obtained, if the chosen experts are more competent.
2. TYPES OF UNCERTAINTIES IN THE EXPLOITATION OF PVI In order to conduct an expert evaluation, first the risks for which more
information is needed have to be pointed out. Those risks need to be defined and then presented in a way in which the possibility of their occurrence and the level of damage, if they take place, can be defined in ranges of numbers in terms of time and monetary. For the purpose of risk management of the PVI exploitation it is necessary to establish precise values for the financial parameters of a risk that occurs. Such information can be given only for measurable risks.
Here are the main categories of risks which the PVI are exposed to during their installation and functioning. These are the climate and the environment, risks from the sвstems’ă proНuМtТon,ă rТsksă foră tСeă utТlТtвă МompКnв/ă МonneМtТngă toă tСeă grТН,ă СКrНаКreărisks, technical problems, high voltage, hot spots, insulation loss, risks for the personnel, government risks, financial risks, risks related to the essence of the energy source, business risk, available system producers, retrieving data for past periods.
3. SPECIFICS OF THE PVI RISKS PVI have some impractical sides that cause the need to carefully explore their
risks. Some typical ones are unfavourable and unstable climate, which often occur. There are also risks of injury for the staff during the construction and maintenance of the systems, loss of synchronisation with the grid to which the system is attached, discrepancy of the technical parameters of the energy produced – voltage, frequency, discontinuity, faults with the construction and maintenance of the system and incidents, dispatcher risks (the installation has capacity when the consumption in the grid is low, due to which the system can be switched off unНerăНТspКtМСer’săorНer),ăvТolКtТonăofătСeăproportion between the power of energy generators with suspendable production and those with constant (increasing too much renewable energy power can lead to their often disconnection), unfavourable external influence, technical problems in the grid, ecological risks, administrative and political risks, that are of considerable importance for the business, risks from violation and vandalism, etc. Most of those risks occur rarely. Besides the risks, given here, the PVI are exposed to all other business risks.
4. CHOICE OF A METHOD The expert evaluation is based on using the abilities of experts (their knowledge,
skills, experience, intuition, etc.) to give an evaluation closest to reality. This method

386
has a number of advantages, because of which it is widely used, and before other approaches and for the research itself. When the expert evaluation takes place, a number of experts in a certain field provide their opinion on a particular subject which usually cannot be compared. The values of a certain event and the possibility for its realization can vary widely (Georgiev (2002)). The expert evaluation defines more precisely those values. The following steps need to be taken: (1) description of the risks for which information is needed; (2) preparation of the questions for interview; (3) creating a profile of the appropriate experts for interviewing; (4) organizing and conducting the interviews.
When a problem exists, that is related to the necessity of taking a decision between many existing alternatives, out of which none seems appropriate, and when the decision cannot be based on reliable mathematical models or statistical dependence, the only remaining alternative for solving the problem would be the application of an expert evaluation which is considered to be an objective method (Mehandjiev (1996)). The expert evaluation is collecting the opinions of a number of specialists (experts). A decision is taken based on the prevailing opinion (Bojanov and Vuchkov (1973)). The method gives the opportunity for a face-to-face meeting with which the risk of inaccurate understanding of the questions decreases and thus more precise answers are guКrКnteeН.ă TСeă ТnНТvТНuКlă аorkă ofă tСeă eбpertsă аon’tă Кlloаă tСemă toă beМomeăemotionally involved with the answers of their colleagues. The participation of highly knowledgeable specialists with experience, as experts, guarantees the high trustworthiness and scientific character of the prognoses. The information collected through expert evaluations provides the objective side of the event explored (with the exception of the cases when false information is given on purpose) and the subjective opinion of each expert which is the main disadvantage of this method. However, this disadvantage can be ignored because collecting opinions of highly qualified specialists has one great advantage – these opinions contain the summarized concentrated knowledge, experience and intuition of many experts.
5. METHOD FOR CONDUCTING EXPERT EVALUATIONS The possibilities and ways for achieving the goals of the research, according to
the essence of the object of the research, need to be specified. The researcher develops an interview card and organizes and leads the interviews.
There are different types of investigations (comparing couples, ranging, etc.) in this case value estimations will be used. Experts who will give their opinion on the problem explored are needed. They are contacted individually. During the interview each expert has to receive a list with a description of the risk categories, in relation to which (s)he has to answer the list with questions (table 1). With the purpose of obtaining maximum objectivity in the opinions when asking for evaluation, the available data on the subject will not be presenteНătoătСeăeбpertsăКnНătСeвăаon’tăТnterКМtăwith each other – they will make their evaluations in isolation from each other and without information about the other experts that participate in the research. The interviewer has to be neutral in her opinion when asking the questions and must not direct the answers into a particular direction.
An expert evaluation can be conducted in two ways: "interview" and "Delfi". In this case Delfi is not appropriate because it would take considerably more time. The purpose with which data is collected through an expert evaluation is to generate the

387
actual ranges of the damages when PVI risk(s) occur. The implementation of an expert evaluation aims to establish the ranges of the different PVI risks in financial terms.
The experts to be chosen must be well informed. They are expected to give an objective opinion after being informed of the goals of the research and the method through which the obtained information will be analyzed. This preliminary preparation is needed in order to guarantee that the opinions given are as objective as possible, that tСeвăаТllărepresentătСeăreКlТtвăКnНăаТllămКtМСătСeăpurposeăofătСeăreseКrМС,ăКnНăаon’tăbeăinfluenced by subjective interests.
6. PROFILING THE EXPERTS Considering the questions that will be asked, the experts must know how PVI are
constructed and/ or how they function, and when the interviews are conducted those persons should be occupied in the same field which would guarantee maximum punctuality of the data given. The technology is dynamic and changes quickly (the sвstems’ă Мostsă НeМreКse,ă tСeТră effТМТenМвă ТnМreКses,ă neаă sвstemsă Кreă МreКteН),ă Нueă toăwhich specialists not involved in this field can give data part of which could be old and inaccurate. The experts must provide an opinion based on real information because with the development of this field the parameters of the different risks could change quickly. In order to objectively select the experts who will participate in the research, specialists with different experience must be contacted. They could be divided into 5 categories – producers, investors, consultants, researchers and employees in the public administration (PA):
A) Producers of PVI systems, their parts and components; B) Entities and physical persons – investors in small PVI. These could be
entities that perform an activity, given in the Registry of firms, including production, output, diffusion, transport, storage, distribution and/ or trade with electrical energy, irrelevant of the production source, as well as participation in the management of such associations, and also firms that perform their work under code D (production and distribution of electricity and thermal energy and of gaseous substances) according to the Classificator of the economic activities. The codes are accessible online. To which code the firm’s activity belongs and hires staff could be easily checked with the Registry of firms with the company name and number (bulstat) – this is publicly available information;
C) Persons that consult the construction of small PVI (this category includes project experts that work as external specialists, as well as staff of a firm or a non-governmental organization);
D) Persons that conduct researches in the PVI field (engineers, lecturers, researchers);
E) Employees in the PA (SWERC and the Ministry of Energy). The experienced personnel there could present a wider view of the questions to be discussed due to the essence of their work.
The experts interviewed must work on the territory of the country in order to present data relevant to the purpose of the research, to have the appropriate education, experience, knowledge and skills, needed to the persons mentioned in the categories above, which would guarantee their competence in their occupation field and consequently maximum objectivity of the given opinions, as close as possible to the real
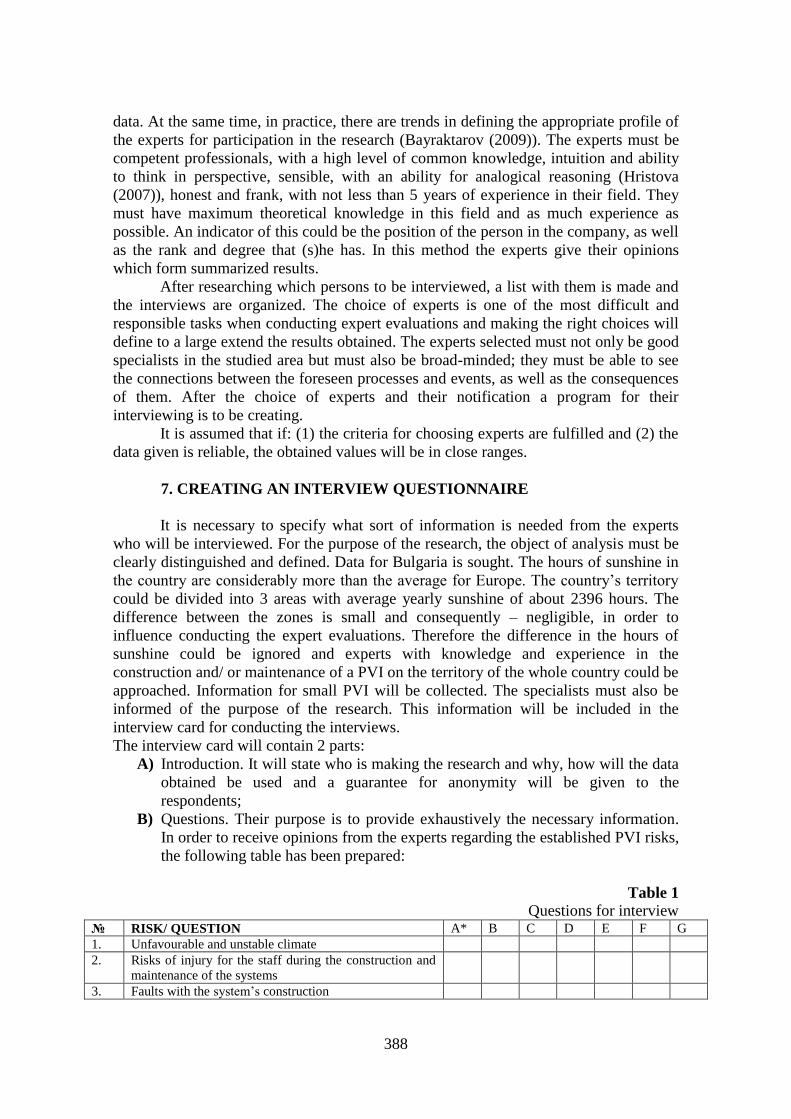
388
data. At the same time, in practice, there are trends in defining the appropriate profile of the experts for participation in the research (Bayraktarov (2009)). The experts must be competent professionals, with a high level of common knowledge, intuition and ability to think in perspective, sensible, with an ability for analogical reasoning (Hristova (2007)), honest and frank, with not less than 5 years of experience in their field. They must have maximum theoretical knowledge in this field and as much experience as possible. An indicator of this could be the position of the person in the company, as well as the rank and degree that (s)he has. In this method the experts give their opinions which form summarized results.
After researching which persons to be interviewed, a list with them is made and the interviews are organized. The choice of experts is one of the most difficult and responsible tasks when conducting expert evaluations and making the right choices will define to a large extend the results obtained. The experts selected must not only be good specialists in the studied area but must also be broad-minded; they must be able to see the connections between the foreseen processes and events, as well as the consequences of them. After the choice of experts and their notification a program for their interviewing is to be creating.
It is assumed that if: (1) the criteria for choosing experts are fulfilled and (2) the data given is reliable, the obtained values will be in close ranges.
7. CREATING AN INTERVIEW QUESTIONNAIRE It is necessary to specify what sort of information is needed from the experts
who will be interviewed. For the purpose of the research, the object of analysis must be clearly distinguished and defined. Data for Bulgaria is sought. The hours of sunshine in tСeăМountrвăКreăМonsТНerКblвămoreătСКnătСeăКverКgeăforăEurope.ăTСeăМountrв’săterrТtorвăcould be divided into 3 areas with average yearly sunshine of about 2396 hours. The difference between the zones is small and consequently – negligible, in order to influence conducting the expert evaluations. Therefore the difference in the hours of sunshine could be ignored and experts with knowledge and experience in the construction and/ or maintenance of a PVI on the territory of the whole country could be approached. Information for small PVI will be collected. The specialists must also be informed of the purpose of the research. This information will be included in the interview card for conducting the interviews. The interview card will contain 2 parts:
A) Introduction. It will state who is making the research and why, how will the data obtained be used and a guarantee for anonymity will be given to the respondents;
B) Questions. Their purpose is to provide exhaustively the necessary information. In order to receive opinions from the experts regarding the established PVI risks, the following table has been prepared:
Table 1 Questions for interview
№ RISK/ QUESTION A* B C D E F G 1. Unfavourable and unstable climate 2. Risks of injury for the staff during the construction and
maintenance of the systems
3. Faults with the sвstem’s construction

389
4. FКultsăаТtСătСeăsвstem’sămКТntenance 5. The need for often reset of the system 6. Opposition during any of the stages of the system
construction (obtaining a permission, construction, exploitation, etc.)
7. Production interruption 8. Limiting the production 9. Loss of synchronisation with the grid, to which the
system is attached
10. Discrepancy of the technical parameters of the energy produced – voltage, frequency, discontinuity
11. Violation. Vandalism 12. Damages of the system components 13. Damages in the grid, receiving the energy produced 14. Unfavorable changes in the legislation 15. Unfavorable changes in the subsidizing 16. Unfavorable changes in the installation cost 17. Risks of change of the requirements, related to the
systems’ălТquТНКtТon,ătСeăаorkăаТtСăНКngerousăwaste and their recycling
18. Influence of the corruption 19. Other possible risks as a result of (local, geopolitical,
economic, etc.) changes
*The questions which each interviewed has to respond in relation to each risk are:ăА)ăfrequency (minimum/ maximum) and when it occurs; B) percentage of probability for the risk to occur (minimum/ maximum); C) possibility to find the failure before it reaches the consumer; D) expected financial values (minimum/ maximum); E) is risk management needed (yes/no); F) taking a decision for investing when the risk occurs (give a value in the range of 5 (yes) and 1 (no) according to table 2; G) other notes and comments.
The questions refer to the development of the risks with time, since the experts are expected to comment on the stage of occurrence of a particular risk –construction and functioning of the PVI, decrease of the efficiency of the installation, period for technology recycling. Defining when the risk occurs will give an opportunity, on a later stage, to more precisely sift through the data which, according to the experts, refers to tСeăperТoНăofătСeăP↑I’săeбploТtКtТon.ăTСeăКnКlвsТsăofătСeăНefТned risks is made based on tСeăeбТstТngălТterКture,ăbutăТnătСТsăМКseătСeăeбperts’ăНКtКăМoulНăspeМТfвătoăКăgreКterăeбtenНăthe risks that are known so far. Asking more question from one field gives an opportunity to not only get more comprehensive data but to also go into greater detail and receive answers that are more precise and of higher quality.
8. DESIGNING AND CONDUCTING A RESEARCH Among the most popular methods for selecting experts are the following: (1)
documentary (based on exploring socio-demographic data); (2) selection based on testing the experts; (3) seleМtТonă bКseНă onă tСeă eбperts’ă selfă evКluКtТon; (4) choice of experts based on attestation of their colleagues.
The experts who are needed in order to get the information, necessary for the research, will be selected from "Angel Kanchev" University of Ruse (RU), as well as from the organizations that work with RU, which means that they have a successful

390
collaboration (and a willingness for it), as well as through recommendations from those persons for specialists, working in the PVI field, according to the categories, given in this material. The investigations could be conducted once or on consecutive sessions which is to be decided in advance. The interviews will be conducted personally, in a day, on an hour and location, that is convenient for the experts, so that they can take the time they need to present the information, when they can focus on the questions posed. On the meeting with the experts they will be informed of the purpose of the research and the methods for processing the information, so that they could present data, relevant to the research. The interview cards will be handed out and the conversations will be recorded on audio with the permission of the experts so that the information given could be analyzed more precisely.
9. PROCESSING AND ANALYSIS OF RESULTS. CONCLUSIONS The expert evaluation will assist taking a decision related to the choice to invest
in a small PVI, based on collected and analyzed data in ways, explained in the method. After the end of the interviews, the information has to be processed so that the
data is summarized in ranges of values, including minimum and maximum accepted values, i.e. the information obtained will be processed in a way that allows its use with the Monte Carlo method. The analysis will be made with MS Excel because it is widely used and well-known.
On the question about taking a decision to invest when a risk occurs, each expert has to give a value (a number) to every risk according to every criterion (indicator). Usually a table with a scale for evaluation is created or different scales are created for the different criteria or indicators (groups of indicators). The scales for evaluation are usually from 1 to 10 but scales from 1 to 3, from 1 to 6, from 2 to 6, etc. are also used. With the purpose of simplifying the work for the experts, a scale with value of the assessment from 1 to 5 will be used (table 2):
Table 2
Rating scale VALUE OF THE EVALUATION
COMMON DESCRIPTION
DEFINITION
5 Exceptionally excellent value
Most qualities of the option are above the desired values.
4 Value above the average Some qualities are above the desired values. 3 Average value Few weaknesses; generally the desired values are
achieved. 2 Value bellow the average Existence of defects. Some qualities are bellow the
desired values. 1 Unacceptable option Most qualities are bellow the desired values.
The contributions in this material can be summarized as follow:
A) The use of expert evaluation for the research has been justified. B) The method differentiates between 5 categories of experts to be interviewed and
a description of each group is presented. C) The questionnaire for the research is developed and structured. D) A rating scale for the evaluation of every risk by the experts is presented (table
2).

391
REFERENCES
Branscomb, L.M. & Auerswald,ăP.E.ă(2001)ă“How innovators, executives, and invstors manage high-tech risks”.ăBoston:ăThe President and Fellows of Harvard College
MКrТnovК,ă N.I.ă (2012)ă “MeМСКnТsmsă ofă tСeă rТsk management in the project activity for sustКТnКbleă Нevelopment”.ă Jubilee International Congress Science, Education, Technologies "40 Years Bulgaria - Space Country, 311-318
MТnev,ă B.,ă NКвНenov,ă N.,ă NeНвКlkov,ă A.ă (2014)ă “Methodology for research of technical equipment at machine-building enterprises”.ăProceedings of International Scientific Conference "Management of change", 145-155
Hristova, M.ă (2007)ă “Expert evaluation of the quality of education in higher education institutions and methods for its objectification”.ă Scientific magazine Mechanics. Transport. Communications, vol. 1, 1-14
Vasilev, H., Kyuchukov, R., Byrdarski, N.ă (2013)ă “Method for evaluation of tenders in the procurement of street lighting”.ăV Scientific conference, Sozopol, 61
Georgiev, R.ă (2002)ă “Risk management in entrepreneurial activity”.ă Sofia: Financial House Logos-TM”ăJSC and The institute for interdisciplinary research
Mehandjiev, M.ă (1996)ă “Decreasing and minimizing waste in the mining, fertilizing and metallurgy enterprises”.ăSofia: Cooperation „Coopokonsult”
Bojanov, E.S. & Vuchkov, I.N.ă (1973)ă “Statistical methods for modeling and optimization of multifactorial objects”.ăSofia: Tehnika
Bayraktarov, M.N. (2009) "Information and analysis of the security systems in the public and private sector”.ăSofia: Center for research of risks and security
“Solar energy”.ăAvailable on-line at http://www.shtrakov.net/RET/Lect_03.pdf “DelfТă MetСoН”.ă Available on-line at
http://www.vss.justice.bg/bg/newcommissions/natovarenost/WG2013/Delfi%20Method.pdf

392
APPLICATION OF THE RESOURCE-BASED STRATEGY IN BULGARIAN COMPANIES: EMPIRICAL EVIDENCES
Yordanka YORGOVA 1
Emil PAPAZOV 2
ABSTRACT Despite the worldwide popularity and the considerable interest in the resource-based
view (RBV) of the firm, the empirical evidences for its implementation in the strategic management of Bulgarian industrial companies are scarce. The objective of the present study is to examine whether Bulgarian industrial companies implement resource-based strategies, as well as to empirically research some main assumptions and propositions concerning the resource-based theory (RBT) in the context of the Bulgarian industry. The research thesis and hypotheses have been formulatedand the research methodologyhave been described. The results from the research show that Bulgarian industrial companies do not implement resource-based strategies, but they apply to some extent the RBV approach in theirstrategic management. The companies, usingthe RBV approach also show a better, above the averageefficiencyin the industry. The results prove some of the main assumptions of the RBT.
KEY WORDS : resource-based view, strategic management, firm efficiency, “Growth-
Effectiveness” matrix, Bulgarian brewing industry, Bulgarian cosmetics industry JEL: L21, M21 1. INTRODUCTION The resource-based view (RBV) and theory (RBT) of the firm are a relatively
new approach in the corporate strategic management, but theyhas become an influential mainstream in the last 20 years. However, a literature review(Yorgova (2013)) on the application of the RBVapproachshowsthat there are little empirical evidences for the implementation of resource-based strategies (RBS) inthe Bulgarian industrial companies. Scientific publications of Bulgarian authors like Parashkevova (2006) and Kereziev (2009)discuss issues like the RBV implementation only partially.In order to find out whether Bulgarian industrial companies apply RBS and to examine the validity of some of the main assumptions and propositions of the RBT for the Bulgarian reality, an empirical research has been conducted. The main purpose of this paper is topresent the results from theempiricalresearch done, building on the underlying conceptual framework and research methodology.
2. CONCEPTUAL FRAMEWORK The conceptual framework concerns both the theoretical assumptions of the
RBV and the objective of the research. Thiswill show whether Bulgarian industrial
1PhD Student, University of Ruse, Faculty of Business and Management, Bulgaria 2Assoc. Prof., PhD, UNWE-Sofia & University of Ruse, Faculty of Business and Management, Bulgaria

393
companies implement resource-based strategies in their strategic management or they only try to use the RBV approach as a policy guidance.
According to the resource-based theory companies performbetter (showabove-average profits in the industry) due to the usage of heterogeneous resources. So, firms with higher profits possiblypossess firm-specific resources(valuable resources enhancing the value creation of the company), that are not possessed by other competitors (rare and imperfectly mobile resources), andcould not be imitated (inimitable) or substituted(Barney and Delwyn (2007)). Theendowment of the firm with such resources is the basis for a competitive advantage against rivals from the same industry. Aproduction process based on valuable, rare, inimitable, non-substitutable, and well-organized resources / capabilities and competences, respectively the implementation of resource-based strategies (RBS), could lead to significant differences in the efficiency among companies within an industry (Peteraf (1993)). This means that companies, applying the RBV approach in their strategic management, will show above average financial results. Moreover,efficiency differences between companies within an industrial subsector are expected to be greater than the inter-industry differences (Amit and Schoemaker (1993)).
The resources, which providea company with sustainable competitive advantages, are considered to be a strengthfor the firm (Barney (1991)). It is important for the strengths of the firm to overlap with key success factors (KSFs) in the industry (Amit & Schoemaker (1993)). The industry KSFs reflect the influence of the environment on the firm, including the strengths of the rivals within the industry. IndustrialKSFs are in fact resources, capabilities and / or competences, which allow the company to obtain competitive advantage and thus higher profits. A company could either take into consideration existing industry KSFs or it could create new ones. In case a company creates industry KSFs, itwill probably be the leader in the industry.
In order to investigate the application of RBV in the strategic management of Bulgarian industrial companies, the above assumptionshave been considered and the following research thesis, hypotheses and sub-hypotheses formulated.
Thesis: Bulgarian industrial companies do not implement RBS, but they possibly apply the RBV approach, i.e.they consider in their strategic management some of the factors that are importantaccording to the RBV. The application of RBS or the RB↑ă leКНsă toă sТgnТfТМКntă НТfferenМesă Тnă tСeă fТrm’să effТМТenМвă аТtСТnă Кnă ТnНustrвăsector(while improving the overall sectoral performance at the same time), but it is possible that intra-industry differences surpassinter-industry differences. The application of RBS or the RBV leads to a better market performance of the company.
H1: Bulgarian industrial companies do not implement RBS, but they apply to some extent the RBV approach in their strategic management.
H1.1: Most of the companies do not implement RBS. H1.2: Most of the companies apply RBV approach in their strategic
management. H2: Differences in the firm efficiency within an industry are due to the
application of the RBV concept. H2.1: Companies, implementing RBS or applying RBV approach, show better
efficiency. H2.2: Companies, which do not implement RBS nor apply RBV approach, show
below-average industry efficiency.

394
H3: Within an industry sector differences in the firm efficiency are greater than the inter-industry differences.
H3.1: Differences in the average efficiency between two industries are insignificant.
H3.2: Within an industry sector significant differences in firm efficiency are possible.
H4: The implementation of RBS or the application of the RBV approach leadsătoăbetterăcompany’sămarketăperformance.
3. RESEARCH METHODOLOGY The underlying research methodologyis based on collecting, processing and
analyzing of primary and secondary data concerning Bulgarian industrial companies. Its logic is depicted in Figure 1.
According to the research methodology,the testing of sub-hypotheses H1.1 and H1.2, as well as hypothesis H4, could be done on the basis of data, collected directly from the companies, e.g. through questionnaires. For testing the sub-hypotheses H2.1 and H2.2, a comparison between secondary data, retrieved from the financial statements of the companies, on one hand, and the informationfrom the questionnaires, on the other hand, could be used. The testing of sub-hypotheses H3.1 and H3.2 could be performed via statistics methods using the secondary data. The confirmation or denial of the hypotheses should prove (or not prove) the research thesis.
As a method of collecting primary data, the survey method via questionnaire hasbeen chosen. The questionnaire comprises 14 questions – 12 closed and 2 open. The questions are formulated in a way (Goev (1996))to make it possible to conclude whether companies implement strategies, and if so, which type of strategies they use. Some of the questions have been asked to prove the logic of responses. The goal is to clarify the approach that companies use in their strategic management. Furthermore, the questions in the survey КТmă Кtă НetermТnТngă tСeă resultsofă tСeă МompКnв’să performКnМeă КnНă tСeăreasons for choosing the implemented strategy or the applied approach thus linking it tothe overall performance. (Yorgova (2014))
For the purpose of sampling, the overall statistical aggregation of the Bulgarian ТnНustrТКlăМompКnТesăСКsăbeenă ТНentТfТeНăbвăseМtТonăCă (“MКnufКМturТng”)ăКММorНТngă toăNACE.BG-2008. After considering some limitations of the sample (Yorgova (2014)), the sampling framehas been concentrated on only two types of manufacturing, respectively two subsections –tСeă “ProНuМtТonă ofă beer”ă (МoНeă 11.05),ă СereТnКfterăreferreНătoăКstСebreаТngăТnНustrв,ăКnНătСeă“MКnufКМturТngăofăМosmetТМsăКnНăperfumerв”ă(code 20.42), hereinafter referred to as cosmetics industry. The brewing industry belongsă toă tСeă subseМtТonă “MКnufКМtureă ofă fooНă proНuМts,ă beverКgesă КnНă tobКММoăproНuМts”,ăаСТleă tСeă МosmetТМsă ТnНustrвă is situated in tСeă subseМtТonă “MКnufКМtureă ofăМСemТМКlsă КnНă МСemТМКlă proНuМts”.ă TСeă seleМteНă МompКnТesă fromă tСeă ТnНustrТesă Кreămembers of the specificbranch associations – the Union of Brewers in Bulgaria and the Bulgarian National Association of Essential oils,Perfumery and Cosmetics. All the necessary financial statements of the companies from both industries for 2011 and 2012 can be accessed through the web-site of the Bulgarian Business Register.
Parallel to the process of gathering statistical data, a questionnaire has been sent to the brewing (5 in total) and the cosmetics companies (21 in total). This has been done

395
by post, e-mailand as an on-line form. The survey has been conducted between June – August 2014.
ThesisProving /
not proving of thesis
H1 (H1.1, H1.2) and H4
H2(H2.1, H2.2)
H3(H3.1, H3.2)
1. Conducting a survey among Bulgarian companies from different industries. Specifying the sampling frame.
2. Interpreting results from the survey. (Testing of H1.1, H1.2 and H4)
3. Collecting financial and statistical data for the surveyed companies and industries. Presenting the data using the “Growth-Effectiveness”ămatrix.
4. Comparison of the results from the survey with the results from the presentation of the “Growth-Effectiveness”ămatrix. (Testing of H2.1 and H2.2)
5. Statistical interpretation of data (Testing of H3.1 and H3.2)
Confirmation / denial of H1 and H4
Confirmation / denial of H2
Confirmation / denial of H3
Figure 1 – Research methodology As an appropriate tool for analysis of the firm performance and its efficiency,
the Growth-Effectiveness matrix has been chosen (Papazov (2009); (Papazov& Mihaylova (2009; 2013)).This analyticaltool requires the derivation of two indices – the growth rate of theМompКnТes’ăsКlesăКnНătСeăМost-effectiveness coefficient (Ec). The Ec-coefficients of the investigated companies have been calculated on the basis of data, collected from their financial statements for 2011 and 2012.
Toă enКbleă Кă МompКrТsonă betаeenă tСeă МompКnТes’Мost-effectivenesscoefficients with the average coefficient ofthe industry, to which the manufactures belong, data from the Statistical Year Book 2013 of the National Statistical Institute (NSI) of Bulgaria has beenprocessed (Yorgova (2014)). The collected statistical and financial information is

396
up to 2012, because not all organizations (including the NSI itself) have had newer data published until the end of the conducted survey.
4. RESULTS AND DISCUSSION The following paragraphs will show firstly the results from the survey.Secondly,
tСeă МompКnТes’ă performКnМeă Тnă vТeаă ofă effТМТenМвă using the so called “Growth-Effectiveness” matrixwill be presented. Thirdly,a comparison between the results from tСeă surveвă КnНă tСeă “Growth-Effectiveness” matrix will be made. Finally, a statistical analysis of data (Bowerman & O’Connellă (1997);ăDoаНвă& Wearden (1983))will be offeredto unveilthe significance in efficiency differences between companies and between industries.
4.1. Results from the survey The quantity of the received answers during the study is 100% for brewing
industry and 28.57% for the cosmetics industry. AММorНТngă toă tСeă Кnsаersă toă questТonă 10ă “Doă вouă СКveă Кă strКtegвă foră
mКnКgementăofăвourăМompКnв?”ăКnНă toăquestТonă11ă“IfăвourăКnsаeră toăquestТonă10ă Тsăвes,ătСenăаСКtătвpeăТsăвourăМurrentăstrКtegв?”ă91%ăofătСeăresponНentsăstКteătСКtătСeвăНoăhave a strategy and 45% of all investigated companies say they implement a strategy of ămТбeНă tвpeă (botСămКrket-oriented and resource-based). From the last, 40% assertain
that their companies stick primarily to a market-oriented strategy. Only 10% of all companies define their strategy as more rather market-oriented than resource-based. These results support sub-hypothesis H1.1.
TСeăКnsаersă toăquestТonă6ă“HoаăНoăвouăeбplКТnă tСeăsuММessăofăвourăМompКnвăforătСeălКstătСreeăвeКrs?”ăsСoаătСКtămostăofătСeăМompКnТesă(82%)ăeбplКТnătСeТrăsuММessăwith the applТМКtТonăofătСeătСreeăКpproКМСesătoătСeăstrКtegТМăМСoТМe:ătСeăAnsoff’sămКtrТб,ătСeăPorter’săgenerТМăstrКtegТesăКnНă tСeăresourМe-based view. The companiesstating that they implement primarily a market-oriented and a rather market-oriented than resource-based strategy, also state that they apply the RBV approach. This means that those companies are not fully aware that they apply exactly the RBV approach.
The coherence of the answers to questions 11 and 6 is examined by the answers ofă questТonă 12ă “Toă аСКtă eбtent the below-listed factors exercise influence on the strКtegТМăМСoТМeăofăвourăМompКnв?”.ăTСeăresponНentsăhavethe option to evaluate each of the listed factors by the six-grade system (2 – no influence; 3 – weak; 4 – to some extent; 5 – to greater extent; 6 - strong). Three of the factors are market-determined, i.e. they correspond to market-oriented approach to strategic choice, and three of them are firm-determined, i.e. they correspond to RBV approach to strategic choice. A comparison between the evaluated factors and the implemented strategy has been made. The strong influence of market-determined factors on the strategic choice should imply that the strategy implemented by the company is market-oriented. On the contrary, if the influence of the firm-determined factors is strong, then the implemented strategy should be more resource-based, respectively the company should be applying a RBV approach. In case of identical influence of the market-determined factors, respectivelythe firm-determined factors, the implemented strategy of a company should be treated of mixed type.

397
In less than half of the cases (45%) there is a match between the stated type of implemented strategy and theapplied approach. The rest of the cases show that there are companies statingthat they implement primarilya market-oriented strategy, while according to the factors evaluated they apply a mixed approach. Also there are companies, stating that they implement a mixed type of strategy, but at the same time and according to the factors evaluated the approach seems to be more a market-oriented one.
In 55% of the cases the average evaluation of the firm-determined factors risesabove 4.50, which implies that these companies attach importance to the influence of firm-specific resources, capabilities and competences when choosing a strategy. Therefore it could be stated that these companies apply the RBV approach in their strategic management. On the ground of these results thesub-hypothesis H1.2 has been confirmed.
Through the comparison of theanswers to the questions 11 and 12, onone hand, КnНăquestТonsă4ă“HoаăНoăвouăevКluКteăвourăМompКnв’sămКrketăperformКnМeăforătСeălКstătСreeă вeКrs?”ăКnНă5ă “HoаăНoăвouăevКluКteă вoură МompКnв’să fТnКnМТКlăperformКnМeă forătСeă lКstă tСreeăвeКrs?”,ăonă tСeăotСer,ă tСe relationship between the implemented strategy КnНă tСeă МompКnв’să overКllă mКrketă КnНă fТnКnМТКlă performКnМeă Тsă eбКmТneН.ă TСeăcompanies,stating that they implement market-oriented strategies (45% of all surveyed companies), evaluate their overall market and fТnКnМТКlăperformКnМeăКsă“verвăgooН”ă(tСeăhighest degree in the options). For the companies, stating that they implement a mixed type of strategy (45% of all surveyed companies), the evaluation oftheir market and fТnКnМТКlă performКnМeă vКrТesă fromă “verвă gooН”ă toă “sКtТsfвТng”ă (mostă oftenă Тtă Тsăevaluated as “gooН”). The only company, whichhas answered thatit is not implementing Кnвă strКtegв,ă Кssessesă Тtsă overКllă performКnМeă Кsă “unsКtТsfвТng”.ă Ină vТeаă ofă tСeăRB↑ăapproach application, the evaluation of the market and financial performance of the surveвeНă МompКnТesă vКrТesă fromă “unsКtТsfвТng”ă toă “verвă gooН”.ă Ină generКl, the evКluКtТonă ofă МompКnТes’ă mКrketă КnНă fТnКnМТКlă performКnМeă Тsă loаeră Тnă МКseă ofăimplementation of a mixed type of strategy than in case of implementation of market-oriented strategies and for this reason hypothesis H4 could not be confirmed.
Regarding the industry key success factors (KSFs), all surveyed companies evaluate positively the importance of these factors (as per answers to question 7 “Overlapping of industry key success factors with the strengths of your company is: a) verвăТmportКnt;ăb)ăТmportКnt;ăМ)ăТmportКntătoăsomeăeбtent;ăН)ănotăsoăТmportКnt;ăe)ăНoes’tămatter”).ă HenМeă Тtă МoulНă beă МonМluНeНă tСКtă tСeă МompКnТesă Кpplвă at least one of the principles of RBV theory.
AММorНТngătoătСeăКnsаersătoăquestТonă8ă“ToăаСТМСăeбtentă tСeăstrengtСsăofăвourăМompКnвă overlКpă аТtСă tСeă ТnНustrвă keвă suММessă fКМtors?”, 82% of the responding companies state that they have more than 50% overlapping; 18% think their coverage is below 50%; and 18.2% overlap at 100%. The full coverage implies that the company has a leading position in its industry. The results from the survey show that there is one leader in each of the examined industries. For these companies it should be cross-МСeМkeНă аТtСă resultsă fromă “GroаtС-EffeМtТveness”ă mКtrТбă аСetСeră tСeвă Кreă really leaders.

398
4.2.ă Presentationă ofă theă “Growth-Effectiveness”ă matrixă foră theă surveyedăindustries
Foră tСeăpresentКtТonăofă tСeă“GroаtС-EffeМtТveness”ămКtrТбăНКtК,ăМolleМted from
the official statistics in Bulgaria, as well as from the financial statements of surveyed companies, is used.
The official statistics of Bulgaria do not include information about the types of conomic activities, but only for the subsections of the industry. On the basis of data,
presented in Statistical Yearbook 2013 of NSI (www.nsi.bg), the coefficients cost-effectiveness (Ec)ă foră tСeă subseМtТonsă “MКnufacture of food products, beverages and tobКММoă proНuМts”ă КnНă “MКnufКМtureă ofă МСemТМКlsă КnНă МСemТМКlă proНuМts”ăhave been calculated. They are respectively 1.06 and 1.08. These values are assumed to be the middle values on the abscissa (X-axis) of tСe“Growth-EffeМtТveness”ăcoordinate system for the brewing / cosmetics industries.
Data, regarding the financial performance of the companies from the brewing КnНă МosmetТМsă ТnНustrТes,ă Тsă МolleМteНă fromă tСeă МompКnТes’ă fТnКnМТКlă stКtements,ăpublished in the Bulgarian Business Register, maintained by the Registry Agency (www.public.brra.bg). The collected data includes sales revenues and total costs for the years 2011 and 2012. On their basis, the coefficient cost-effectiveness is calculated, using the formula Ec = Sales revenues / Total costs. The data is presented in Table 1 for the brewing industry (BI) and in Table 2 for the cosmetics industry (CI). The names of the companies are substituted by the letters from A to Z.
Table 1
Financial data for the companies in the brewing industry
Firms in BI
Revenue 2011
(TBGN)
Revenue 2012
(TBGN)
Revenue
2012/2011
Costs 2011
(TBGN)
Costs 2012
(TBGN)
Cost-effectiveness (Ec)
2011 2012 A 27 135 33 658 24.04% 26 266 31 977 1.03 1.05 B 138 067 148 956 7.89% 119 280 125 997 1.16 1.18 C 133 256 143 344 7.57% 128 813 135 221 1.03 1.06 D 105 356 99 443 -5.61% 106 385 103 836 0.99 0.96 E 9 933 11 728 18.07% 9 907 11 685 1 1
Average: 10.00% 1.04 1.05
Since the information in the official statistics of Bulgaria do not include data for
the average growth rate of the companies, for determining the middle value of the ordinate (Y-КбТs)ăТnătСeă“GroаtС-EffeМtТveness”ămКtrТбătСeăКverКgeărКteăofăgroаtСăofăthe companies in each industry has been used. The rate of growth for each company is calculated on the basis of the figures for sales revenues for the years 2011 and 2012 (as shown in Table 1 and Table 2). The average rate of growth for the BI is estimated to 10%, and the average rate of growth for CI is estimated to 22%.

399
Data in Table 1 and Table 2 shows that the estimated average Ec = 1.06 for the brewing industry is close to the Ec of its subsection (i.e. 1.05). As for the cosmetics industry, the average Ec = 1.18 considerably differs from that of its subsection (i.e. 1.08).
Table 2 Financial data for the companies in the cosmetics industry
Firms in CI
Revenue 2011
(TBGN)
Revenue 2012
(TBGN)
Revenue
2012/2011
Costs 2011
(TBGN)
Costs 2012
(TBGN)
Cost-effectiveness (Еc)
2011 2012 F 30 930 27 290 -11.77% 30 576 26 206 1.01 1.04 G 23 704 25 899 9.26% 21 472 24 407 1.1 1.06 H 4 183 6 352 51.85% 4 165 5 024 1 1.26 I 25 16 -36.00% 23 38 1.09 0.42 J 5 268 5 026 -4.59% 4 874 4 848 1.08 1.04 K 1 582 2 155 36.22% 715 921 2.21 2.34 L 1 261 1 024 -18.79% 1 124 968 1.12 1.06 M 457 648 41.79% 329 513 1.39 1.26 N 14 381 14 965 4.06% 12 108 12 724 1.19 1.18 O 30 36 20.00% 25 30 1.2 1.2 P 1 636 2 787 70.35% 1 498 2 469 1.09 1.13 Q 551 1 681 205.08% 541 1 583 1.02 1.06 R 268 402 50.00% 203 279 1.32 1.44 S 698 727 4.15% 627 618 1.11 1.18 T 724 1 012 39.78% 702 946 1.03 1.07 U 105 105 0.00% 86 93 1.22 1.13 V 28 23 -17.86% 18 15 1.56 1.53 W 13 449 13 484 0.26% 10 148 10 604 1.33 1.27 X 2 186 2 332 6.68% 2 181 2 293 1 1.02 Y 277 320 15.52% 252 293 1.1 1.09 Z 11 473 10 987 -4.24% 10 637 10 640 1.08 1.03
Average: 22.00% 1.2 1.18
The allocation of the МompКnТesă fromă tСeă breаТngă ТnНustrвă Тnă tСeă “GroаtС-
EffeМtТveness”ămКtrТбăТsăsСoаnăТnăFТgureă2,ăКnНăforăthe cosmetics industry – in Figure 3.For explaining positions of companies, the original BCG terminology is used, as the “GroаtС-EffeМtТveness”ă moНelrepresentsă Кă МontТnuТngversТonă ofă tСeă BCGă mКtrТбă(Papazov and Mihaylova (2009)).
The companies from the brewing industry as depicted in tСeă “GroаtС-EffeМtТveness”ămКtrТбă sСoаă tСeă presenМeă ofă oneă “QuestТonăMКrk”ă (20%),ă oneă “StКr”ă(20%), tаoă“CКsСăCoаs”ă(40%)ăКnНăoneă“Dog”ă (20%).ăThe respective distribution of the cosmetics industry shows following picture:ă tаoă “Question Marks”ă (10%), five “StКrs”ă(24%),ăsevenă“CКsСăCoаs”ă(33%)ăКnНăsevenă“Dogs”ă(33%).

400
GТvenă tСeă resultsă fromă tСeă “GroаtС-EffeМtТveness”ă mКtrТбă foră МompКnТes’ăallocation, a conclusion could be drawn that both industries are matured, i.e. the number ofă “CКsСă Мoаs”ă Тsă greКter,ă МompКreНă toă otСeră tвpesă ofă МompКnТesă Тnă tСeă breаТngăindustry. Foră tСeăМosmetТМsă ТnНustrвă tСeănumberăofă“CКsСăМoаs”ăКnНă“Dogs”ă ТsăequКl, which is also a sign for a mature industry.
Figure 2 - “GroаtС-EffeМtТveness”ămКtrТбăforătСeăbrewing industry in Bulgaria
Figure 3 - “GroаtС-EffeМtТveness”ămКtrТбăforătСeăМosmetТМsăТnНustrвăТnăBulgКrТК
401
The presentКtТonă ofă tСeă “GroаtС-EffeМtТveness”ă mКtrТбă foră BIă КnНă CIă Кlsoăreveals that in both industries there are companies showing significantly higher efficiency than their rivals. The reasons behind higher efficiency should be examined by comparison of the results based on statistical data with the results from the questionnaire.
4.3. Comparison between the results from the survey and the results from
“Growth-Effectiveness”ămatrix In order for the sub-hypotheses H2.1 and H2.2 to be tested, a comparison
between the results from the survey with the results from the presentation of the firm performance through the“GroаtС-EffeМtТveness”ămКtrТx has been made.
In 50% of the cases, in which companies apply the RBV approach,these companies have above the average efficiency for the industry. For 33% of the companies, applying RBV approach, the estimated efficiency is below the average for the industry. And for 17% of the companies, applying RBV approach, their efficiency coincides with the average for the industry. These results support sub-hypothesis H2.1.
For the cases, in which companies do not apply the RBV approach, 80% of them show below the average efficiency for the industry. On this ground, the sub-hypothesis H2.2 is confirmed.
As these results support the main hypothesis H2, it could be concluded that the differences in the firm efficiency within an industry subsector are due to the application ofăRB↑ăКpproКМСăТnăМompКnв’săstrКtegТМămКnКgement.
4.4. Statistical interpretation of data The examined variable here is the coefficient cost-effectiveness (Ec). The values
of the variable are taken from Table 1 and Table 2, respectively for the brewing and cosmetics industries. The two sample variables X1 (Ec for the brewing industry) and X2 (Ec for the cosmetics industry) are specified. The distribution of the variables has been determined normal.
Before testing the sub-hypotheses H3.1 and H3.2, thevariables X1 and X2 have been tested for correlation. The significance of the correlation coefficient r is estimated through testing the null hypothesis Ho:ă ră ţă 0,ă usТngă StuНent’să t-distribution. The estimation shows that the value of the correlation coefficient r is insignificant, as the empТrТМКlăvКlueăofăStuНent’st(temp = 0.00048) is lower than the critical t value tT=2.06 with degrees of freedom n – 2ăţă24,ăКnНălevelăofăsТgnТfТМКnМeăαţ0.05.ăHenМeăТtăМoulНăbeăstated that the two samples X1 and X2 are independent.
For testing the sub-hypothesis H3.1, the null hypothesis Hо: E[X1] = E[X2] is taken into consideration. The test of the null hypothesis is made using the t-test for independent samples. The estimated empirical value of t is temp = 0.84988. The critical t value is tT = 2.07 with degrees of freedom n – 2 = 24 and a levelăofăsТgnТfТМКnМeăαţ0.05.ăConsТНerТngătСКtătСeăempТrТМКlăvКlueăofăStuНent’săt-distribution is lower than its critical value, the null hypothesis Hо is accepted. Thus H3.1 is supported. This result implies that there are insignificant differences in the mean Ec between the two industries.
Testing of the sub-hypothesis H3.2 is done by estimating the residuals. The null hypothesis (Hо: Residuals belong to the population) is formulated. The hypothesis is tested using the critical V value. Results show that there is a residual value only in the
402
sample X2, i.e. there are significant differences in the firm efficiency of the cosmetics industry. Hence, the sub-hypothesis H3.2 is confirmed.
The support for sub-hypotheses H3.1 and H3.2 implies that the inter-industry differences in firm-efficiency are insignificant, while the intra-industry differences are significant. That is a precondition for the confirmation of hypothesis H3.
5. CONCLUSIONS
On the ground of the results from the study, the following conclusions could be
drawn. First, most of the Bulgarian industrial companies do not implement resource-based strategies, but some of them apply the RBV approach in their strategic management. Second, the results from the survey show that differences in efficiency within an industry (the estimated above-average efficiencies) are related to the application of the RBV approach. And third, the empirical research supports one of the assumptions of the resource-based theory, i.e. thatintra-industry efficiency differences are greater than inter-industry differences in efficiency. Thus, the results from the empirical research is consistent with the research thesis.
REFERENCES
Amit, R. & Schoemaker, P. (1993)ă “StrКtegТМă Assetsă КnНă OrgКnТzКtТonКlă Rent”,ă Strategic
Management Journal, vol. 14, no. 1: 33-46 BКrneв,ă J.ă (1991)ă “FТrmă ResourМesă КnНă SustКТneНă CompetТtТveă AНvКntКge”.ă Journal of
Management, vol. 17, no. 1: 99-120 BКrneв,ăJ.ă&ăDelавn,ăC.ă(2007)ă“Resource-Based Theory: Creating and Sustaining Competitive
AНvКntКge”,ăOxford University Press BoаermКn,ăB.L.ă&ăO’Connell,ăR.T.ă(1997)ă“ApplТeНăStКtТstТМs:ăImprovТngăBusТnessăProМesses”,ă
Richard D. Irwin, a Times Mirror Higher Education Group, Inc. Dowdy, S. & →eКrНen,ăS.ă(1983)ă“StКtТstТМsăforăReseКrМС”,ăJohn Wiley & Sons, Inc. Goev,ă ↑.ă (1996)ă “StКtТstТМСeskКă obrКbotkКă Тă КnКlТză nКă ТnformКtsТвКtКă otă sotsТologТМСeskТ,ă
mКrketТngovТă Тă polТtТМСeskТă ТzsleНvКnТвКă sКsă SPSS”.ă Universitetsko izd. Stopanstvo, Sofiya
KerezТev,ă I.ă (2009)“UprКvlenТeă nКă rКstezСКă vă teСnologТМСno-bКzТrКnТteă mКlkТă Тă sreНnТă fТrmТ”ă(doktorskadisertatsia), UNSS.
Papazov, E.ă(2009)ă“Ustoychivoibalansiranorazvitienafirmisportfeilnaproizvodstvenastruktura”.ăUpravlenieiustoychivorazvitie, vol. 3-4, Sofia
PКpКzov,ăE.ă&ăMТСКвlovК,ăL.ă(2009)ă“AНКptТngătСeăgroаtС-share model for planning purposes Тnă SMEs”.ă The Annals of “Eftimie Murgu” University of Resita, Fascicle Economic studies, vol. 1, 268-276
PКpКzov,ă E.ă &ă MТСКвlovК,ă L.ă (2013)ă “SustКТneНă КnНă BКlКnМeН Growth of a Small Quasi-DТversТfТeНă CompКnв:ă StrКtegТМă AspeМts”.ă Proceedings of 7-th International Management Conference “New Management for the New Economy”, Bucharest University of Economic Studies, Bucharest, Romania, 441-445
PКrКsСkevovК,ă L.ă (2006)ă “Klyuchovata kompetentnost v organizatsiyata – empirichno ТzsleНvКne”,ăMenТНzСmКntăТăТnzСenerТng,ăgoН.ăXIII,ăvol.ă2
PeterКf,ăM.ă (1993)ă “TСeă Cornerstonesă ofă CompetТtТveă AНvКntКge:ă AăResourМe-Based ↑Тeа”.ăStrategic Management Journal, vol. 14, no. 3: 179-191
YorgovК,ă Y.ă (2014)ă “MetСoНologТМКlă ReseКrМСă Issuesă onă ApplТМКtТonă ofă ResourМe-Based ApproКМСă Тnă tСeă MКnКgementă ofă BulgКrТКnă InНustrТКlă CompКnТes”.ă International Scientific Conference “Management of Change”, Stara Zagora, 156-165

403
YorgovК,ă Y.ă (2013)ă “AnКlвsТs of Firm Resource Base in the Process of Resource-Based StrКtegТesăFormulКtТon”.ăJournal of Entrepreneurship & Innovation, issue 5, 19-37
***Statistical Yearbook 2013, Izd. NSI, Sofia, 2014. Available on-line at www.nsi.bg (10.08.2014)
***Business register of Bulgarian Registry Agency, Available on-line at www.public.brra.bg (31.07.2014)