Quality assessment for site characterization at seismic stations
49
Vol.:(0123456789) Bulletin of Earthquake Engineering https://doi.org/10.1007/s10518-021-01137-6 1 3 ORIGINAL ARTICLE Quality assessment for site characterization at seismic stations Giuseppe Di Giulio 1 · Giovanna Cultrera 2 · Cécile Cornou 3 · Pierre‑Yves Bard 3 · Bilal Al Tfaily 3 Received: 12 November 2020 / Accepted: 25 May 2021 © The Author(s) 2021 Abstract Many applications related to ground-motion studies and engineering seismology benefit from the opportunity to easily download large dataset of earthquake recordings with differ- ent magnitudes. In such applications, it is important to have a reliable seismic characteriza- tion of the stations to introduce appropriate correction factors for including site amplifica- tion. Generally, seismic networks in Europe describe the site properties of a station through geophysical or geological reports, but often ad-hoc field surveys are missing and the char- acterization is done using indirect proxy. It is then necessary to evaluate the quality of a seismic characterization, accounting for the available site information, the measurements procedure and the reliability of the applied methods to obtain the site parameters.In this paper, we propose a strategy to evaluate the quality of site characterization, to be included in the station metadata. The idea is that a station with a good site characterization should have a larger ranking with respect to one with poor or incomplete information. The pro- posed quality metric includes the computation of three indices, which take into account the reliability of the available site indicators, their number and importance, together with their consistency defined through scatter plots for each single pair of indicators. For this purpose, we consider the seven indicators identified as most relevant in a companion paper (Cultrera et al. 2021): fundamental resonance frequency, shear-wave velocity profile, time- averaged shear-wave velocity over the first 30 m, depth of both seismological and engineer- ing bedrock, surface geology and soil class. Keywords Seismic characterization · Quality metrics · Site survey · Seismic station metadata · Seismic network database · Strong-motion database * Giuseppe Di Giulio [email protected] 1 Istituto Nazionale di Geofisica e Vulcanologia, L’Aquila, Italy 2 Istituto Nazionale di Geofisica e Vulcanologia, Rome, Italy 3 Universitè Grenoble Alpes, Universitè Savoie Mont Blanc, CNRS, IRD, Université Gustave Eiffel, ISTerre, Grenoble, France
-
Upload
khangminh22 -
Category
Documents
-
view
1 -
download
0
Transcript of Quality assessment for site characterization at seismic stations

Vol.:(0123456789)
Bulletin of Earthquake Engineeringhttps://doi.org/10.1007/s10518-021-01137-6
1 3
ORIGINAL ARTICLE
Quality assessment for site characterization at seismic stations
Giuseppe Di Giulio1 · Giovanna Cultrera2 · Cécile Cornou3 · Pierre‑Yves Bard3 · Bilal Al Tfaily3
Received: 12 November 2020 / Accepted: 25 May 2021 © The Author(s) 2021
AbstractMany applications related to ground-motion studies and engineering seismology benefit from the opportunity to easily download large dataset of earthquake recordings with differ-ent magnitudes. In such applications, it is important to have a reliable seismic characteriza-tion of the stations to introduce appropriate correction factors for including site amplifica-tion. Generally, seismic networks in Europe describe the site properties of a station through geophysical or geological reports, but often ad-hoc field surveys are missing and the char-acterization is done using indirect proxy. It is then necessary to evaluate the quality of a seismic characterization, accounting for the available site information, the measurements procedure and the reliability of the applied methods to obtain the site parameters.In this paper, we propose a strategy to evaluate the quality of site characterization, to be included in the station metadata. The idea is that a station with a good site characterization should have a larger ranking with respect to one with poor or incomplete information. The pro-posed quality metric includes the computation of three indices, which take into account the reliability of the available site indicators, their number and importance, together with their consistency defined through scatter plots for each single pair of indicators. For this purpose, we consider the seven indicators identified as most relevant in a companion paper (Cultrera et al. 2021): fundamental resonance frequency, shear-wave velocity profile, time-averaged shear-wave velocity over the first 30 m, depth of both seismological and engineer-ing bedrock, surface geology and soil class.
Keywords Seismic characterization · Quality metrics · Site survey · Seismic station metadata · Seismic network database · Strong-motion database
* Giuseppe Di Giulio [email protected]
1 Istituto Nazionale di Geofisica e Vulcanologia, L’Aquila, Italy2 Istituto Nazionale di Geofisica e Vulcanologia, Rome, Italy3 Universitè Grenoble Alpes, Universitè Savoie Mont Blanc, CNRS, IRD, Université Gustave Eiffel,
ISTerre, Grenoble, France
Bulletin of Earthquake Engineering
1 3
1 Introduction
In recent years, the number of stations of permanent seismic networks worldwide has largely increased. As a consequence, the amount of recordings of earthquakes and their applications using real-time data have also risen, together with the improvement of the online databases of seismic networks.
The dissemination of large seismic datasets highlights the complexity of ground-motion prediction (e.g. Akkar et al. 2010; Archuleta et al. 2006; Chiou et al. 2008; Roca et al. 2011; Bozorgnia et al. 2014; Cauzzi et al. 2016; Gee et al. 2011; Luzi et al. 2016; Theod-ulidis et al. 2004; Traversa et al. 2020), and its strict connection to the properties of the site where the recording instrument was settled. Site response may have a large impact on surface ground motions, and its knowledge is required in many seismological studies such as: calibration of strong-motion records (Douglas 2003; Akkar and Bommer 2007; Regnier et al. 2013 among many others), realistic estimates of shaking at seismic stations (Abra-hamson 2006; Convertito et al. 2010; Thompson et al. 2012), site-specific hazard assess-ment (Rodriguez-Marek et al. 2014; Bindi et al. 2017), estimation of ground-motion atten-uation models (Bindi et al. 2011; Campbell and Bozorgnia 2014; Lanzano et al. 2020), and identification of soil classification for building code applications or for microzoning studies (Priolo et al. 2019).
So far, the installation of new instruments and new technologies has been favored for increasing the number of observation sites (Campillo et al. 2019) also with portable arrays (Hetényi et al. 2018), most often neglecting the issue of the quality of site condition meta-data, which is however critical for data analysis. It is then necessary to define standards and quality indicators, for site characterization information at seismic stations to reach high-level metadata. These topics are becoming a key issue within the European Union and worldwide. They have been recently addressed with the SERA European Project (“Seis-mology and Earthquake Engineering Research Infrastructure Alliance for Europe – SERA” Project, no. 730900 funded by the Horison2020 INFRAIA-01–2016-2017 Programme), with a networking activity dedicated to propose standards for site characterization at seis-mic stations in Europe. More specifically, the Task 7.2 of the Network Activity 5 in Work Package 7 (http:// www. sera- eu. org/ en/ activ ities/ netwo rking/) was focused on three goals: (1) definition of the most recommended indicators to get a reliable seismic site characteri-zation; (2) proposition of a compact summary report for each indicator evaluated as most relevant; (3) proposition of a quantitative strategy towards an “objective” assessment of the quality of a site characterization.
The first two issues are described in a companion paper (Cultrera et al. 2021) that pro-posed a list of seven indicators considered as the most recommended for a reliable site characterization, and representing a feasible combination of physical relevance and con-venience of getting and using them. Additionally, the companion paper proposed the scheme of a summary report for each site characterization indicator, containing the most significant background information on data acquisition and processing. The summary reports are planned to be useful tools to assess the quality of a site characterization at the seismic station location.
The present paper faces the issue (3), with the proposition of an overall quality strategy to enable a ranking of the seismic characterization analysis carried out at different sites. In general, the reliability of a single indicator’s value is mainly linked to the methodology to retrieve it. Different methods can result in different values for the same indicator, because each method has its own resolution and limits. These aspects are addressed by some
Bulletin of Earthquake Engineering
1 3
important good-practice guidelines and reference manuscripts that are helpful for assessing the reliability of important indicators commonly adopted in site response analysis, such as the fundamental resonance frequency f0 (SESAME 2004; Molnar 2018), the shear-wave velocity profile (VS) from methods based on surface waves (Socco and Strobbia 2004; Bard et al. 2010; Hunter and Crow 2012; Foti et al. 2018), or VS profile from cross-hole and down-hole methods (ASTM D4428M-00 2000; ASTM D7400M-08 2008). Some bench-marks were performed to test the reliability among different methods, especially to validate the performance of non-invasive and invasive methods for the measurements of shear-wave velocity profiles (Asten and Boore 2005; Stephenson et al. 2005; Cornou et al. 2009; Moss et al. 2008; Cox et al. 2014; Garofalo et al. 2016; Darko et al. 2020). These benchmarks have outlined the feasibility of non-invasive and invasive methods in supplying comparable results together with an estimate on inter-analysts variability.
The lack of standardized procedures in evaluating the quality of a site characterization analysis prevents a homogenous grading of strong-motion sites and a clear picture of the information available at seismic stations, both at European and at world-wide scales. As a consequence, there is not a homogeneous quality information for site characterization among strong-motion web sites. When geophysical measurements are not collected, ter-rain-based site condition proxies can be used integrating surface geology, topographic slope and terrain class (Wills and Clahan 2006; Wald and Allen 2007; Yong et al. 2012; Yong 2016; Kwok et al. 2018), or geotechnical or geomorphic categories, such as done in the NGA-West2 PEER ground motion database (http:// ngawe st2. berke ley. edu/; Ancheta et al. 2014). Also the strong-motion Italian database ITACA (http:// itaca. mi. ingv. it; D’Amico et al. 2020), in absence of direct geophysical measurements of VS30 (time-averaged shear-wave velocity over the first 30 m) at a seismic station, derives the soil class from near-surface geological information or from slope proxies (Felicetta et al. 2017). The European Geotechnical Database (http:// egd- epos. civil. auth. gr/; Pitilakis et al. 2018) includes quality indices only for two indicators (f0 and VS30) on the basis of the method that was used for their estimation and whether a reference is provided; for example in case of VS30 an higher grading is assigned to borehole surveys compared to inferred methods based on geology.
In this paper we propose a general strategy for the quality assessment, accounting for the number and relevance of the seven most recommended indicators, and for their consist-ency based on multi-parametric regressions. We finally applied our strategy to some sites of permanent accelerometric stations that have been characterized in the framework of the Italian Civil Protection Department-INGV agreement (2016–2021). The results allow to rank the seismic stations according to their site characterization.
2 Methodology
We evaluated the overall quality of a seismic characterization at a given site accounting for the seven indicators selected in Cultrera et al. (2021): the fundamental resonance fre-quency (f0), the shear-wave velocity profile (VS) as function of depth, the time-averaged shear-wave velocity over the first 30 m (VS30), the seismological bedrock depth (Hseis_bed, which is defined as the depth of the geological unit controlling the fundamental resonance frequency), the engineering bedrock depth (Heng_bed, the depth at which VS reaches first in the profile the value of a specific value; for example H800 refers to VS = 800 m/s), the sur-face geology and the soil class. The seven indicators considered as most representative are not completely independent from each other; e.g. the soil class is usually linked to the VS30,
Bulletin of Earthquake Engineering
1 3
and the latter can be derived from the VS profile. However, another task of the same SERA Project (Bergamo et al. 2019; 2021) adopted a regression analysis and a neural network approach, to find the correlation between direct and indirect proxies and the true amplifica-tion computed at Swiss and Japan stations. Among the 7 indicators indicated by the Cul-trera et al. (2021), Bergamo et al. (2021) did not consider geological information in their analysis. They found that the actual amplification in the range 1.7–6.7 Hz exhibits a good correlation with a combination of velocity profile (described through specific frequency-dependent “quarter-wavelength” quantities: average velocity and impedance contrast), VS30, bedrock depth and f0.
In our methodology, the quality of a site characterization is expressed by the compu-tation of a final overall quality index (Final_QI), which is a number ranging between 0 and 1 and accounting for the single indicator quality, its relevance for site characterization, and the consistency between all the significant indicators. Specifically, Final_QI is derived from the computation of three simple quality indices (QI1, QI2 and QI3). QI1 quantifies the reliability of each individual indicator, QI2 combines the QI1 values from the indi-vidual indicators available at a given site, and QI3 is aimed at evaluating the consistency between couples of indicators. The principles of such quality metrics have been presented and discussed during a dedicated workshop in Italy (Cultrera et al. 2019) gathering Euro-pean and worldwide scientists.
2.1 Quality index 1 (QI1)
We propose a simple, common expression involving the different aspects of the quality evaluation of a single indicator (QI1 hereinafter), based on (1) the suitability of the method for acquisition and analysis, (2) the type of input data (direct measurements or derived from proxies) and quality of the processing, and (3) the completeness of the site report.
The quality index QI1 varies from 0 to 1 and is defined by the following expression:
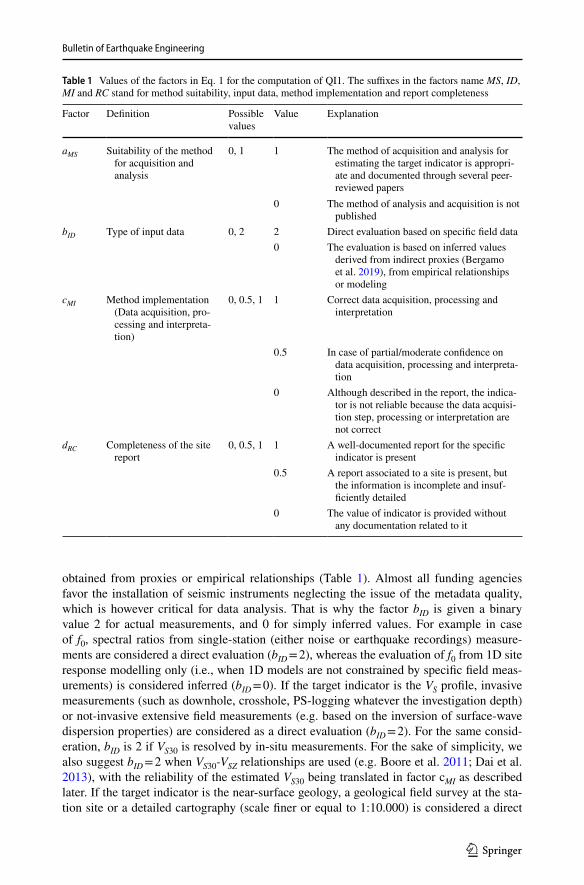
where factors aMS, bID, cMI and dRC are detailed below and summarized in Table 1, together with some indication on how to evaluate them. The factors are given only dis-crete values in order to limit subjective choices. The value 3 in the denominator is equal to aMSmax + bIDmax ⋅ cMImax where the suffix max indicates the maximum values of the factors.
2.1.1 Factors in QI1
In Eq. 1, factor aMS is related to the “theoretical” reliability of the methods used for data acquisition and analysis for deriving the value of the target indicator (the suffix MS stands for “method suitability”). It is equal to 1 when assessed on the basis of peer-reviewed papers or well-established guidelines, otherwise it is given a 0 value (Table 1). As an example, in the case of f0, aMS = 1 when the applied methodology follows published peer-reviewed papers or consolidated guidelines (e.g. Nakamura et al. 1989; Field and Jacobs 1995; SESAME 2004; Picozzi et al. 2005; Haghshenas et al. 2008; Molnar et al. 2018 among many others).
Factor bID deals with the type of data or information used for evaluating the target indi-cator (the suffix ID stands for “input data”). As one of the main objectives is to emphasize the importance of direct measurements rather than inferred estimates, it is assigned a value of 2 in case of dedicated, in-situ field experiments, and a 0 value whenever inferred, i.e.
(1)QI1 =[(
aMS + bID ⋅ cMI
)
⋅ dRC]
∕3
Bulletin of Earthquake Engineering
1 3
obtained from proxies or empirical relationships (Table 1). Almost all funding agencies favor the installation of seismic instruments neglecting the issue of the metadata quality, which is however critical for data analysis. That is why the factor bID is given a binary value 2 for actual measurements, and 0 for simply inferred values. For example in case of f0, spectral ratios from single-station (either noise or earthquake recordings) measure-ments are considered a direct evaluation (bID = 2), whereas the evaluation of f0 from 1D site response modelling only (i.e., when 1D models are not constrained by specific field meas-urements) is considered inferred (bID = 0). If the target indicator is the VS profile, invasive measurements (such as downhole, crosshole, PS-logging whatever the investigation depth) or not-invasive extensive field measurements (e.g. based on the inversion of surface-wave dispersion properties) are considered as a direct evaluation (bID = 2). For the same consid-eration, bID is 2 if VS30 is resolved by in-situ measurements. For the sake of simplicity, we also suggest bID = 2 when VS30-VSZ relationships are used (e.g. Boore et al. 2011; Dai et al. 2013), with the reliability of the estimated VS30 being translated in factor cMI as described later. If the target indicator is the near-surface geology, a geological field survey at the sta-tion site or a detailed cartography (scale finer or equal to 1:10.000) is considered a direct
Table 1 Values of the factors in Eq. 1 for the computation of QI1. The suffixes in the factors name MS, ID, MI and RC stand for method suitability, input data, method implementation and report completeness
Factor Definition Possible values
Value Explanation
aMS Suitability of the method for acquisition and analysis
0, 1 1 The method of acquisition and analysis for estimating the target indicator is appropri-ate and documented through several peer-reviewed papers
0 The method of analysis and acquisition is not published
bID Type of input data 0, 2 2 Direct evaluation based on specific field data0 The evaluation is based on inferred values
derived from indirect proxies (Bergamo et al. 2019), from empirical relationships or modeling
cMI Method implementation (Data acquisition, pro-cessing and interpreta-tion)
0, 0.5, 1 1 Correct data acquisition, processing and interpretation
0.5 In case of partial/moderate confidence on data acquisition, processing and interpreta-tion
0 Although described in the report, the indica-tor is not reliable because the data acquisi-tion step, processing or interpretation are not correct
dRC Completeness of the site report
0, 0.5, 1 1 A well-documented report for the specific indicator is present
0.5 A report associated to a site is present, but the information is incomplete and insuf-ficiently detailed
0 The value of indicator is provided without any documentation related to it
Bulletin of Earthquake Engineering
1 3
evaluation (bID = 2). When the surface geology is derived exclusively from large scale car-tography (i.e. 1:100.000) then bID is assigned equal to 0.
Factor cMI indicates the reliability of the indicator value in relation to the quality of data acquisition, processing and interpretation (the suffix MI stands for the “method implemen-tation” of the selected approach; Table 1). Typically, the quality of the in-situ measure-ments may be assessed on the basis of the compliance with standard and robust procedures, including the performance and suitability of the used equipment, while the quality of the processing should account for the observance of commonly accepted guidelines, including the proper interpretation of the final results. Depending on the degree of correctness, the factor cMI can be equal to 0 (incorrect), 0.5 (partially correct) and 1 (correct). From Eq. 1, the cMI value is obviously irrelevant when the factor bID of Eq. 1 is equal to zero (absence of any direct measurements). Published review papers or guidelines can be used to judge the precision of the analysis. For example, the f0 from single-station noise measurements can be verified through the SESAME (2004) or others criteria (Picozzi et al. 2005), taking into account the sensor cut-off frequency used in the field, the time-window length and number of cycles selected in the analysis step with respect to f0, the amplitude and narrow-ness of the spectral peak etc. In case of VS30 indicator, the factor cMI is set equal to 1 when the relationships between VS30 and different time-averaged velocity VSZ at given depth z are applied (Boore et al. 2011; Régnier et al. 2014; Wang and Wang 2015), assuming that such relationships are calibrated for the studied area. In the estimation of shear-wave velocities at larger depth, the uncertainties of these region-specific relationships obviously increase when the maximum depth of the data is very limited (e.g. for z = 5, 10, 20 m). Because of the large uncertainties, we recommend to set cMI = 0.5 when z is less than 15 m (Boore et al. 2011; Kwak et al. 2017). Note that the evaluation of factor cMI can take advantage from the summary reports as described in Cultrera et al. (2021), where the basic informa-tion of data processing is collected in a compact form.
Factor dRC is related with the quality of the available documentation reporting the data acquisition and processing (the suffix RC stands for “report completeness”): the maximum value of 1 is for a complete report (see companion paper for the necessary information), the intermediate value 0.5 is when partial information is present, whereas the absence of a report leads to a dRC value of 0 (Table 1). The presence of a report is very important in Eq. 1, because QI1 is equal to zero in case of absence of any report, even though there might exist actual measurements followed by a correct interpretation.
The functional form of the generic Eq. 1 includes one addition and two multiplications, which were deliberately introduced with the following rationale:
• Multiplication by a factor that may be equal to 0 indicates that whatever the value of the other term of the multiplication, the absence or poor reliability will affect the whole QI1 term. The product “bID · cMI” may thus be zero in case of absence of site-specific direct measurements (bID), or in case of very inadequate acquisition or processing (cMI). Similarly, the quality of the documentation (dRC) will drastically impact the QI1 what-ever the relevancy of the methodology (aMS), the type of data (bID) and of the method implementation (cMI). The absence or poor quality site documentation greatly hampers the ability of external users to evaluate the indicator’s quality.
• Addition in Eq. 1 makes the factor aMS relatively independent from bID and cMI. For instance, when VS30 is inferred from local slope or geology, aMS may be equal to 1 because the methodology has been published and is commonly accepted, while bID is zero because the derivation is not based on direct measurements but from statistical correlations with very large scatter.

Bulletin of Earthquake Engineering
1 3
It is worthy of note that in the QI1 evaluation a careful examination of the available site information in the proximity of the selected station is needed. Among the factors of Table 1 contributing to the QI1 definition, the one which is more difficult to judge is probably the factor cMI. Specifically, factor cMI takes into account criteria on reliability of the used meth-ods (including their resolution and commonly admitted rules-of-thumb), and appropriate usage of empirical relationship available in literature when indicators are inferred (exam-ples of empirical relationships are VS30-surface topography, Wald and Allen 2007; VS30-VS10, Boore et al. 2011; VS30-phase velocity at 40 m wavelength; Martin and Diehl 2004). The QI1 assignment should be as much as possible independent from subjective choices, but the factor cMI could be biased by personal judgment. In order to reduce such bias for each of the seven site indicators, we believe an expert judgment is necessary in the QI1 assessment; the quality evaluation should be in the responsibility of the analysis team and/or of the network operators involved in site characterization.
2.1.2 QI1 examples
To better explain the effect on the different factor’s choices, we simulate the QI1 computa-tion of f0 as target indicator and for virtual sites with the following characteristics (Table 2):
Site #1—f0 evaluated from horizontal-to-vertical (H/V) spectral ratios on ambient noise data (bID = 2) evaluated following the SESAME (2004) guidelines (aMS = 1). The process-ing is done with the Geopsy code (Wathelet et al. 2020) and a clear H/V peak occurs in the frequency range within the applicability limits of the method (cMI = 1). A complete report exists describing the field activity and data analysis (dRC = 1). All the factors of Table 1 take their maximum value as the resulting QI1 (QI1 = 1).
Site #2—f0 evaluated as a proxy from VS profile (bID = 0) following the simplified approaches described in Dobry et al. (1976) or Wang et al. (2018) (aMS = 1). There are uncertainties on the layered velocity profile used to derive the f0 value (cMI = 0.5): in this case the value of factor cMI is irrelevant for the computation of QI1 because bID = 0 (see Eq. 1). A detailed report exists describing the analysis (dRC = 1). The resulting QI1 is equal to 0.33.
Site #3—as for site #1 but without any report (dRC = 0). QI1 is equal to its minimum value (QI1 = 0).
Site #4—as for site #1 but the processing or interpretation of the final results is eval-uated incorrectly (cMI = 0); this happens for example when f0 doesn’t indicate the fun-damental peak but a secondary peak at higher frequency, or in case of the time-window length too short to allow a robust estimation of f0. QI1 is equal to 0.33.
Site #5—as for site #1 but there is partial confidence in the processing or interpreta-tion of the final results (cMI = 0.5). QI1 is equal to 0.67.
Site #6—All the factors reach the maximum value, except dRC because the site report is considered not complete (dRC = 0.5). QI1 is equal to 0.5.
Site #7—Factors aMS and bID have the maximum values, but the processing or inter-pretation are not correct (cMI = 0) and the site report is incomplete (dRC = 0.5). QI1 is equal to 0.167.
In the next three examples (from #8 to #10 in Table 2), we assume that the target indicator is the VS30 derived from a measured shear-wave velocity profile (aMS = 1 and bID = 2). It is important to highlight that the maximum depth of investigation can be confined in real situations to a very shallow depth (i.e. < 30 m):
Bulletin of Earthquake Engineering
1 3
Site #8—VS30 was calculated using a downhole (DH) test near the seismic station. In this example the DH test is with a maximum depth of 20 m, this is why a relationship between VS20 and VS30 was used (for example Boore et al. 2011, factor aMS = 1). In this case, the DH is a direct measurement (bID = 2) although limited in depth, and the appli-cability of relationship VS20–VS30 is reliable (cMI = 1) because the station is located in the region where the relationship was validated. A complete report exists describing the field activity and data analysis (dRC = 1). All the factors of Table 1 take their maximum value and QI1 is 1.
Site #9—Similar to site #8, but the maximum depth of the available DH survey reaches only 5 m, and a relationship between VS5 and VS30, developed for the area of analysis, was used (aMS = 1). Although the DH is very limited in depth, we consider it as direct measurement (bID = 2) but, because the relationship may lead to large uncertainty, the factor cMI is set equal to 0.5. The resulting QI1 is 0.667.
Site #10—Similar to site #9, except that the station is located in a region where the VS5–VS30 relationship was never calibrated: aMS (published methods), bID (direct meas-urements), dRC (presence of a full report) have their maximum values but cMI is set equal to 0. QI1 is equal to 0.33.
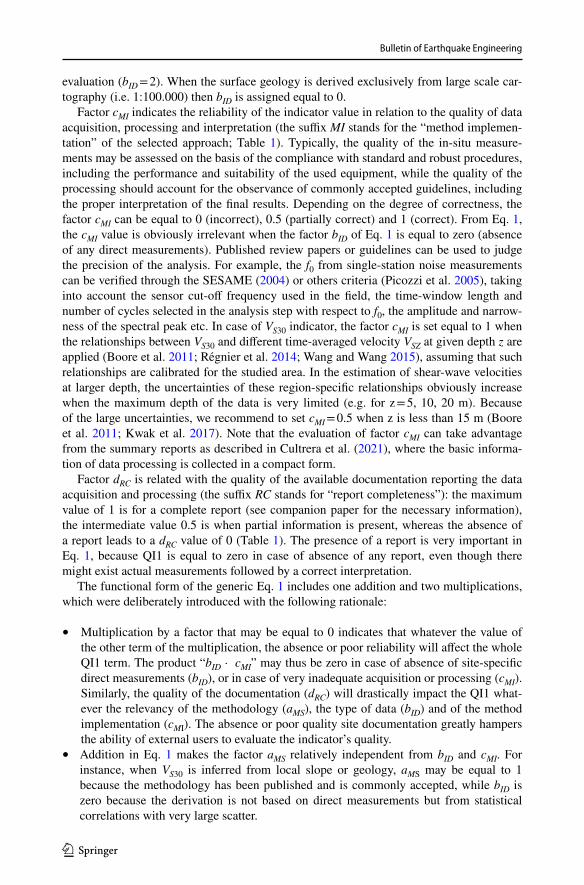
Table 2 summarizes the factors and the resulting QI1 computed for the 10 sites. QI1 can have six possible values (0, 0.167, 0.33, 0.5, 0.667 and 1) that are connected to the reli-ability of each single indicator and can be interpreted in terms of quality as: unreliable (0), very poor (0.167), poor (0.33), acceptable (0.5), good (0.67) and very good (1).
The absence of a report (dRC = 0) implies QI1 equals to zero (e.g. site #3). Another sig-nificant factor is bID: without direct measurements (bID = 0; e.g. site #2) QI1 cannot exceed the value of 0.33. The same QI1 value of 0.33 is reached in case of direct measurements (bID = 2) but with the method implementation having some problem (cMI = 0; e.g. site #4). Although the definition of QI1 in Eq. 1 is aimed at penalizing the lack of a report and the use of proxies or empirical relationships, the absence of a direct measurements (i.e. bID = 0) does not give necessarily a QI1 equal to zero, as shown from the above examples. Strong-motion databases, like the Italian one, lack of in-situ measurements at the recording station, but they usually adopt peer-reviewed methods (aMS = 1) which are properly imple-mented (cMI = 1) and fully described in a report (dRC = 1).
Other examples of how to select the proper value for factor aMS, bID and cMI are reported in the "Appendix" materials ( "Appendix" Tables 7, 8 and 9) and in Bergamo et al. 2019 (see their Tables 1, 2, 3, 4, 5). This auxiliary material provides indications on how to assign
Table 2 Example of QI1 computation at ten sites. The examples from #1 to #7 are referring to f0 as target indicator, the examples from #8 to #10 are referring to VS30 as a target indicator (see text)
Site aMS bID cMI dRC QI1 (Eq. 1)
#1 1 2 1 1 1.00#2 1 0 0.5 1 0.33#3 1 2 1 0 0#4 1 2 0 1 0.33#5 1 2 0.5 1 0.667#6 1 2 1 0.5 0.5#7 1 2 0 0.5 0.167#8 1 2 1 1 1.00#9 1 2 0.5 1 0.667#10 1 2 0 1 0.33
Bulletin of Earthquake Engineering
1 3
the factors that appear in Eq. 1, but is not exhaustive of all situations that may be encoun-tered by analyzing real sites.
2.2 Quality index 2 (QI2)
Once the QI1 is computed for each indicator through Eq. 1, QI2 is evaluated as a weighted sum of the QI1 of all indicators at the target site:
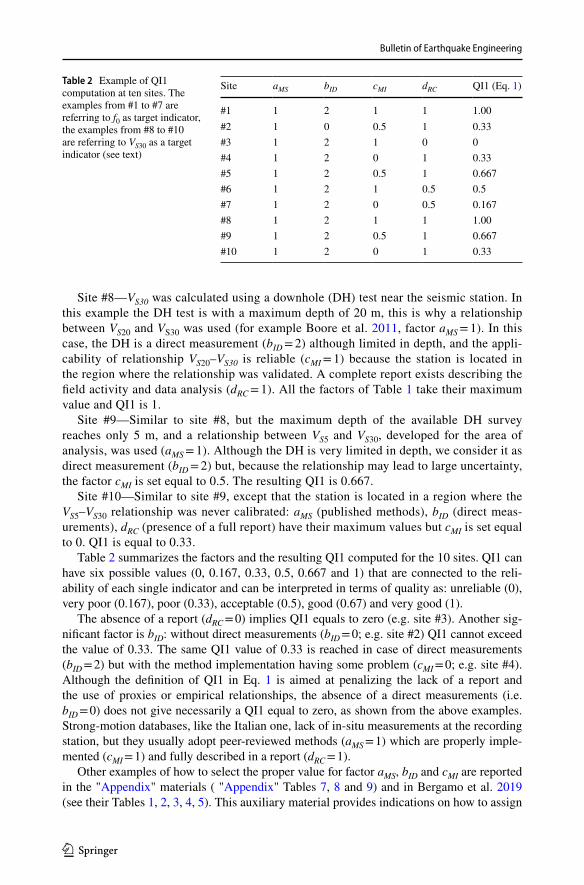
where wi is the weight relative to the i-th indicator and n indicates their total number. In this paper n is equal to 7, i.e. the number of indicators considered as most appropriate fol-lowing the companion paper (Cultrera et al. 2021). If some of the indicators are not avail-able at the target site, its corresponding QI1i is equal to zero in Eq. 2. In detail, QI2 varies from 0 to 1, and it cares for the importance of the indicators on the evaluation of the site characterization through the weights wi. Because QI1 can assume six discrete values, the choice of weights in the definition of QI2 should ensure a wider and gradual distribution of the QI2 values, depending on the number and importance of available indicators at each site. The weights must take into account the relevance of the selected indicators in the site characterization and, after testing various options for the selection of wi values (Di Giulio et al. 2019), we propose three simple weight classes (Table 3) according to the indication provided by the survey described in the companion paper:
• A maximum weight of 1 for f0 and velocity profile VS. These two indicators were the most recommended indicators (72% and 89% respectively; see Table 3) to be used for site metadata, and they are directly linked to the dynamic soil properties and to soil amplification.
• An intermediate weight of 0.5 for the indicators VS30, engineering and seismological bedrock depth, surface geology. In this group, surface geology has a qualitative rela-tion with site effect estimation, and VS30 or bedrock depth can be derived from veloc-ity profile VS and f0. This group of indicators were considered as mandatory by the participants to the online questionnaire in a percentage ranging between 55 and 63% (Table 3).
(2)QI2 =
[
∑
i=1,n
wi ⋅ QI1i
]
∕∑
i=1,n
wi
Table 3 Weights of the relevant indicators for computation of QI2 (Eq. 2). The last column indicates the number of the answer (in percentage) to the online questionnaire indicating the indicator as mandatory (see Fig. 3 of the companion paper Cultrera et al. 2021)
Indicator Weight wi Mandatory (%)
f0 1 89VS30 0.5 63Surface geology 0.5 61Shear-wave velocity profile (VS) 1 72Depth of seismological bedrock (Hseis_bed) 0.5 58Depth of engineering bedrock (H800) 0.5 55Soil class 0.25 56
Bulletin of Earthquake Engineering
1 3
• A minimum weight of 0.25 for the “soil class” indicator. Although this indicator had the same percentage of ‘mandatory’ attribution of the previous group (Table 3), we assigned the lowest value because it is an indirect proxy for site conditions, derived mostly from the other indicators already considered in the weighted average (such as VS30, engineering bedrock depth and geology).
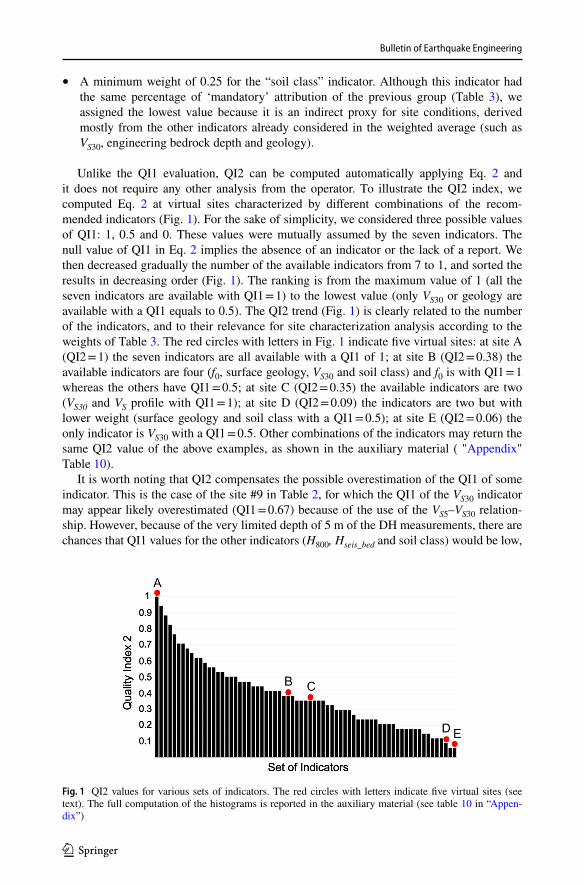
Unlike the QI1 evaluation, QI2 can be computed automatically applying Eq. 2 and it does not require any other analysis from the operator. To illustrate the QI2 index, we computed Eq. 2 at virtual sites characterized by different combinations of the recom-mended indicators (Fig. 1). For the sake of simplicity, we considered three possible values of QI1: 1, 0.5 and 0. These values were mutually assumed by the seven indicators. The null value of QI1 in Eq. 2 implies the absence of an indicator or the lack of a report. We then decreased gradually the number of the available indicators from 7 to 1, and sorted the results in decreasing order (Fig. 1). The ranking is from the maximum value of 1 (all the seven indicators are available with QI1 = 1) to the lowest value (only VS30 or geology are available with a QI1 equals to 0.5). The QI2 trend (Fig. 1) is clearly related to the number of the indicators, and to their relevance for site characterization analysis according to the weights of Table 3. The red circles with letters in Fig. 1 indicate five virtual sites: at site A (QI2 = 1) the seven indicators are all available with a QI1 of 1; at site B (QI2 = 0.38) the available indicators are four (f0, surface geology, VS30 and soil class) and f0 is with QI1 = 1 whereas the others have QI1 = 0.5; at site C (QI2 = 0.35) the available indicators are two (VS30 and VS profile with QI1 = 1); at site D (QI2 = 0.09) the indicators are two but with lower weight (surface geology and soil class with a QI1 = 0.5); at site E (QI2 = 0.06) the only indicator is VS30 with a QI1 = 0.5. Other combinations of the indicators may return the same QI2 value of the above examples, as shown in the auxiliary material ( "Appendix" Table 10).
It is worth noting that QI2 compensates the possible overestimation of the QI1 of some indicator. This is the case of the site #9 in Table 2, for which the QI1 of the VS30 indicator may appear likely overestimated (QI1 = 0.67) because of the use of the VS5–VS30 relation-ship. However, because of the very limited depth of 5 m of the DH measurements, there are chances that QI1 values for the other indicators (H800, Hseis_bed and soil class) would be low,
Fig. 1 QI2 values for various sets of indicators. The red circles with letters indicate five virtual sites (see text). The full computation of the histograms is reported in the auxiliary material (see table 10 in “Appen-dix”)
Bulletin of Earthquake Engineering
1 3
and as consequence QI2 is also expected to be low. Only in case of a bedrock site, with few meters (< 5 m) of weathered outcrop over stiff rock, H800 and Hseis_bed can be intercepted within the first 5 m, and the associated QI2 value gets consistently a relatively high value.
2.3 Quality index 3 (QI3)
QI3 is aimed at evaluating the consistency of various pairs of indicators that are related to each other. It is expressed by the following equation:
where csk is the consistency factor for a pair of indicators identified by k, and m is the num-ber of available couples of indicators at the specific site. The consistency factor csk can be either 0 (no consistency) or 1 (consistency), and the QI3 is ranging from 0 to 1. QI3 has a physical meaning because it represents the proportion of the selected pairs of indicators that are consistent with one another.
In our proposal, out of the 7 recommended indicators, we fixed the number of possible pairs to 5 (m equals to 5). This is because 5 is the number of pairs of indicators which have been measured for a large enough dataset to allow reliable relationships through scatter plots. The five pairs are: f0 & VS30 (k = 1), f0 & seismic bedrock depth (k = 2), f0 & engi-neering bedrock depth (k = 3), VS30 & engineering bedrock depth (k = 4) and VS30 & geol-ogy (k = 5). The value of csk at a specific site is set equal to 0 if one or both indicators of the pair k are not present.
Empirical relationships between various indicators can be found in the form of scat-ter plots in scientific literature for evaluating the consistency between indicators. Several papers propose empirical relationships between pairs of indicators to investigate the ability of different indicators in characterizing site response, or their use for a suitable definition of the amplification factors within seismic codes (Boore et al. 2014; Kamai et al. 2016; Stambouli et al. 2017). As an example, in the following we list a selection of papers show-ing correlations for the five pairs considered in Eq. 3:
(1) f0—VS30 (e.g. Luzi et al. 2011; Gofhrani and Atkinson 2014; Régnier et al 2014; Has-sani and Atkinson 2016; Derras et al. 2017; Stambouli et al. 2017; Zhu et al. 2020);
(2) f0—seismic bedrock depth (e.g. Ibs-Von Seht and Wohlenberg 1999; Parolai et al. 2002; Hinzen et al. 2004; Gosar and Lenart 2009; Luzi et al. 2011);
(3) f0—engineering bedrock depth (H800) (e.g. Derras et al. 2017);(4) VS30—engineering bedrock depth (H800) (e.g. Derras et al. 2017; Piltz and Cotton 2019;
Zhu et al. 2020; Bergamo et al. 2021);(5) VS30—surface geology (e.g. Wills et al. 2000 and 2015; Wald and Allen 2007; Lemoine
et al. 2012; Stewart et al. 2014; Yong et al. 2016; Derras et al. 2017; Foti et al. 2018; Ahdi et al. 2017; Mital et al. 2021).
Such empirical relationships generally refer to a specific database, and several checks are needed to ensure the applicability to the site under study. First, it is important to check the homogeneity of the analysis at the base of such relationships, and if the defi-nition of the indicators is exactly the same (e.g. “peak” or “fundamental” frequency,
(3)QI3 =
[
∑
k=1,m
csk
]
∕m
Bulletin of Earthquake Engineering
1 3
derived from H/V spectral ratios of 5% damped pseudo spectral acceleration, or from Fourier Amplitude Spectra, etc.). Second, the relationships might be variable from region to region. Therefore, the consistency evaluations should, as much as possible, take into account the available studies for the areas including or neighboring the target station.
In order to avoid being stuck to a given region or database, we propose in the present paper a reference set of scatter plots (for the selected five pairs of indicators) to compare with the measured value at a specific site and evaluate csk in Eq. 3. When the indicators are within or out of the confidence interval of our scatter plots, we set csk equal to 1 or 0, respectively.
We first selected 935 sites where real VS profiles are accessible, and we then homoge-neously computed the other indicators assuming a 1D velocity model. Soil class, depth of engineering bedrock (H800) defined as the depth where shear-wave velocity is equal or first exceeds the conventional EC8 (CEN 2004) value of 800 m/s, VS30 and theoretical f0 from SH amplification were evaluated using the reflectivity method (Kennet, 1983), whereas the seismic bedrock (Hseis_bed) came from the depth for which the resonance frequency, provided by simplified Rayleigh’s method (Dobry et al. 1976), is close to the value of the measured f0. The VS profiles were selected from 935 real sites: 602 are from Kiknet network (http:// www. kyosh in. bosai. go. jp/), 243 from California (Boore, 2003; http:// quake. usgs. gov/ ~boore), 21 from European strong-motion sites (Di Giulio et al. 2012), 33 from French (Hollender et al. 2018), and 36 are Italian sites from ITACA database (D’Amico et al. 2020). The complete list of the 935 stations is given in Di Giulio et al. (2019). The maximum depth of investigation is 600 m, but the majority of the sites does not exceed the depth of 300 m. For 15 profiles having shear-wave velocity larger than 800 m/s starting from the surface, we set H800 equal to 1 m. A number of 18 sites within the analyzed profiles never reach a shear-wave velocity of 800 m/s.
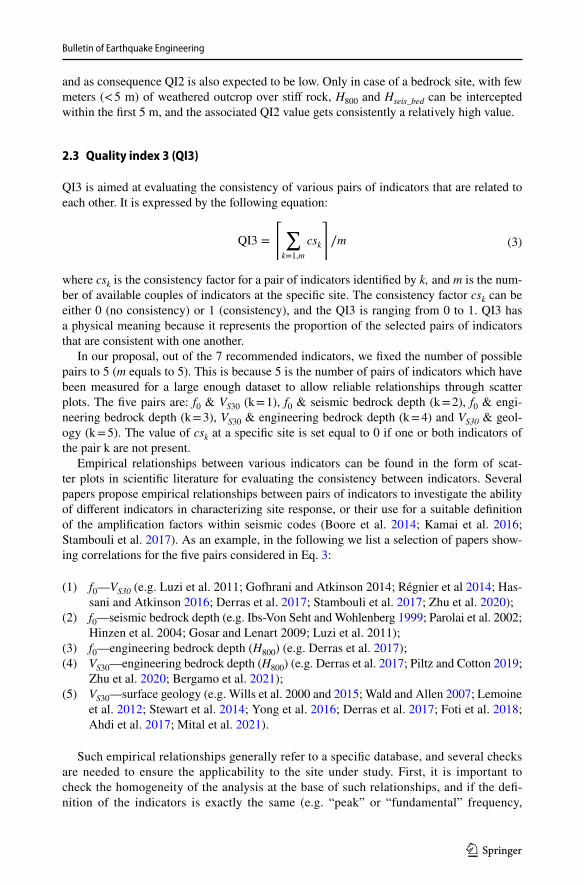
Scatter plots for the different pairs of indicators are shown in Fig. 2: f0 & VS30; f0 & Hseis_bed; f0 & H800; and H800 & VS30. As expected, the seismic (Hseis_bed) and the engi-neering (H800) bedrock depths are inversely proportional to f0: the deeper the seismic interface, the lower the corresponding resonance frequency (Fig. 2b, c). VS30 is increas-ing with f0 (the softer the surface layer, the lower the resonance frequency; Fig. 2a), and is decreasing with increasing H800 (the softer the surface layer, the deeper the engineer-ing bedrock depth; Fig. 2d).
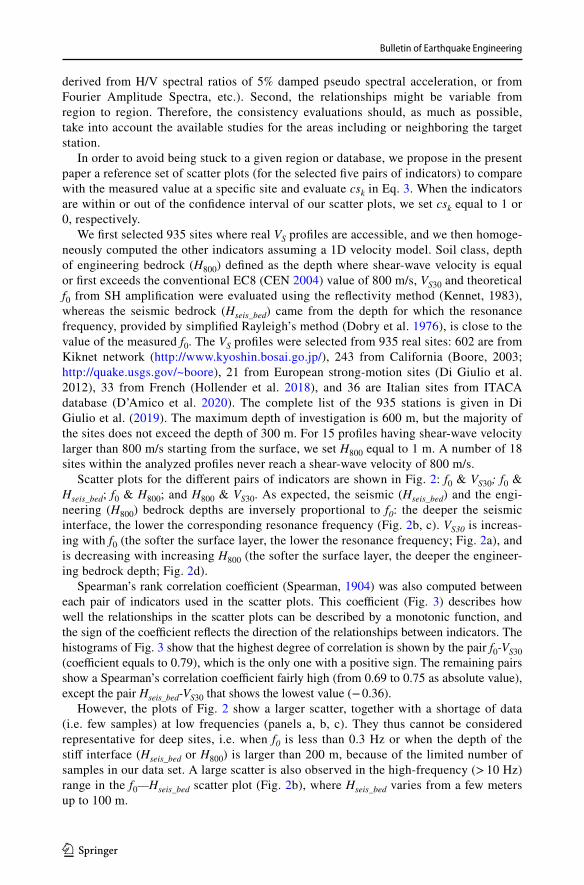
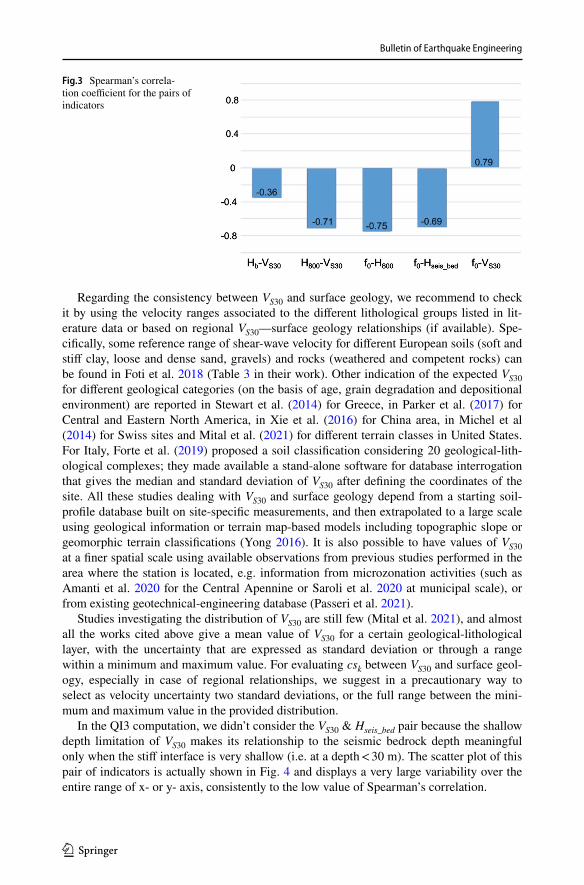
Spearman’s rank correlation coefficient (Spearman, 1904) was also computed between each pair of indicators used in the scatter plots. This coefficient (Fig. 3) describes how well the relationships in the scatter plots can be described by a monotonic function, and the sign of the coefficient reflects the direction of the relationships between indicators. The histograms of Fig. 3 show that the highest degree of correlation is shown by the pair f0-VS30 (coefficient equals to 0.79), which is the only one with a positive sign. The remaining pairs show a Spearman’s correlation coefficient fairly high (from 0.69 to 0.75 as absolute value), except the pair Hseis_bed-VS30 that shows the lowest value (− 0.36).
However, the plots of Fig. 2 show a larger scatter, together with a shortage of data (i.e. few samples) at low frequencies (panels a, b, c). They thus cannot be considered representative for deep sites, i.e. when f0 is less than 0.3 Hz or when the depth of the stiff interface (Hseis_bed or H800) is larger than 200 m, because of the limited number of samples in our data set. A large scatter is also observed in the high-frequency (> 10 Hz) range in the f0—Hseis_bed scatter plot (Fig. 2b), where Hseis_bed varies from a few meters up to 100 m.
Bulletin of Earthquake Engineering
1 3
From the plots of Fig. 2, we assume that the consistency between a pair of indicators is quantified in a binary way depending on whether or not it falls within the confidence interval given by ± 2 standard deviations around the geometric mean (black lines in Fig. 2): we precautionary assume csk = 1 when the values of a site is within this range.
As shown in Fig. 2, the resonance frequency f0 is a very important indicator in our strategy and is therefore present in three over four scatter plots of Fig. 2. However, in case of a site that does not show a resonance peak, the scatter plots of Fig. 2a, b, c can-not be used to verify the consistency between indicators. This is why csk in Eq. 3 can be assumed equal to 1 (for k = 1,2,3) even when a site does not show a resonance peak (e.g. flat H/V curves), but is classified as a stiff soil or bedrock site from geological and geophysical consideration (Pilz et al. 2020; Lanzano et al. 2020).
Fig. 2 Scatter plot for the pairs of indicators: a f0-VS30, b f0-seismic bedrock depth, c f0-H800, d H800-VS30. The gray circles show the values computed at 935 sites, the square symbols indicate the values at the real sites listed in Table 4. The geometric mean and the mean ± 2 standard deviation are computed assuming logarithmic bins along the x-axis and they are reported as black thick and thin lines, respectively. The mean curves and associated variability are given in the "Appendix" material ("Appendix" Tables 17, 18, 19 and 20)
Bulletin of Earthquake Engineering
1 3
Regarding the consistency between VS30 and surface geology, we recommend to check it by using the velocity ranges associated to the different lithological groups listed in lit-erature data or based on regional VS30—surface geology relationships (if available). Spe-cifically, some reference range of shear-wave velocity for different European soils (soft and stiff clay, loose and dense sand, gravels) and rocks (weathered and competent rocks) can be found in Foti et al. 2018 (Table 3 in their work). Other indication of the expected VS30 for different geological categories (on the basis of age, grain degradation and depositional environment) are reported in Stewart et al. (2014) for Greece, in Parker et al. (2017) for Central and Eastern North America, in Xie et al. (2016) for China area, in Michel et al (2014) for Swiss sites and Mital et al. (2021) for different terrain classes in United States. For Italy, Forte et al. (2019) proposed a soil classification considering 20 geological-lith-ological complexes; they made available a stand-alone software for database interrogation that gives the median and standard deviation of VS30 after defining the coordinates of the site. All these studies dealing with VS30 and surface geology depend from a starting soil-profile database built on site-specific measurements, and then extrapolated to a large scale using geological information or terrain map-based models including topographic slope or geomorphic terrain classifications (Yong 2016). It is also possible to have values of VS30 at a finer spatial scale using available observations from previous studies performed in the area where the station is located, e.g. information from microzonation activities (such as Amanti et al. 2020 for the Central Apennine or Saroli et al. 2020 at municipal scale), or from existing geotechnical-engineering database (Passeri et al. 2021).
Studies investigating the distribution of VS30 are still few (Mital et al. 2021), and almost all the works cited above give a mean value of VS30 for a certain geological-lithological layer, with the uncertainty that are expressed as standard deviation or through a range within a minimum and maximum value. For evaluating csk between VS30 and surface geol-ogy, especially in case of regional relationships, we suggest in a precautionary way to select as velocity uncertainty two standard deviations, or the full range between the mini-mum and maximum value in the provided distribution.
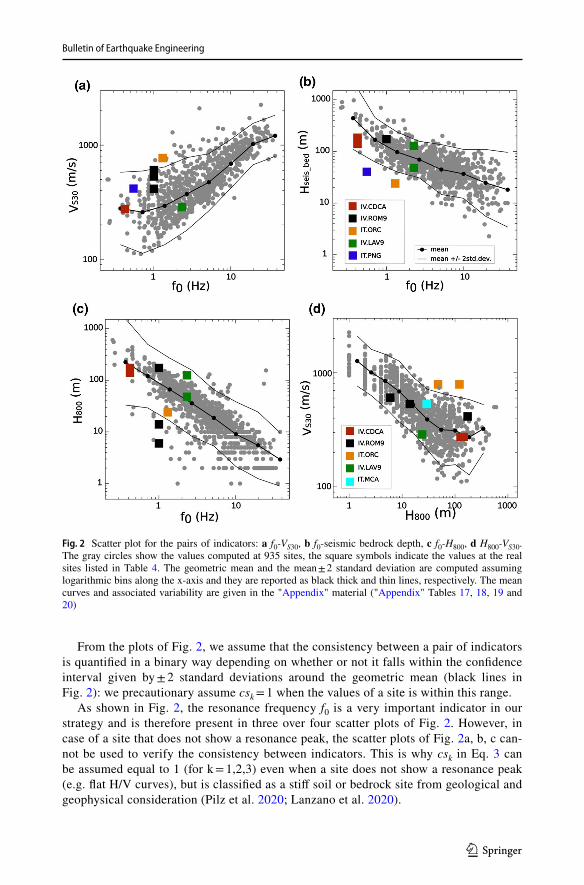
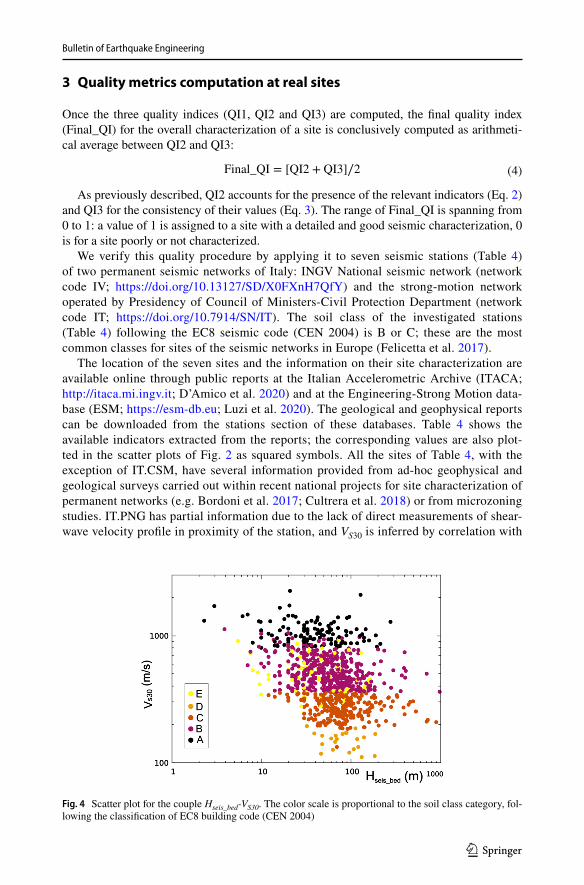
In the QI3 computation, we didn’t consider the VS30 & Hseis_bed pair because the shallow depth limitation of VS30 makes its relationship to the seismic bedrock depth meaningful only when the stiff interface is very shallow (i.e. at a depth < 30 m). The scatter plot of this pair of indicators is actually shown in Fig. 4 and displays a very large variability over the entire range of x- or y- axis, consistently to the low value of Spearman’s correlation.
Fig.3 Spearman’s correla-tion coefficient for the pairs of indicators
Bulletin of Earthquake Engineering
1 3
3 Quality metrics computation at real sites
Once the three quality indices (QI1, QI2 and QI3) are computed, the final quality index (Final_QI) for the overall characterization of a site is conclusively computed as arithmeti-cal average between QI2 and QI3:
As previously described, QI2 accounts for the presence of the relevant indicators (Eq. 2) and QI3 for the consistency of their values (Eq. 3). The range of Final_QI is spanning from 0 to 1: a value of 1 is assigned to a site with a detailed and good seismic characterization, 0 is for a site poorly or not characterized.
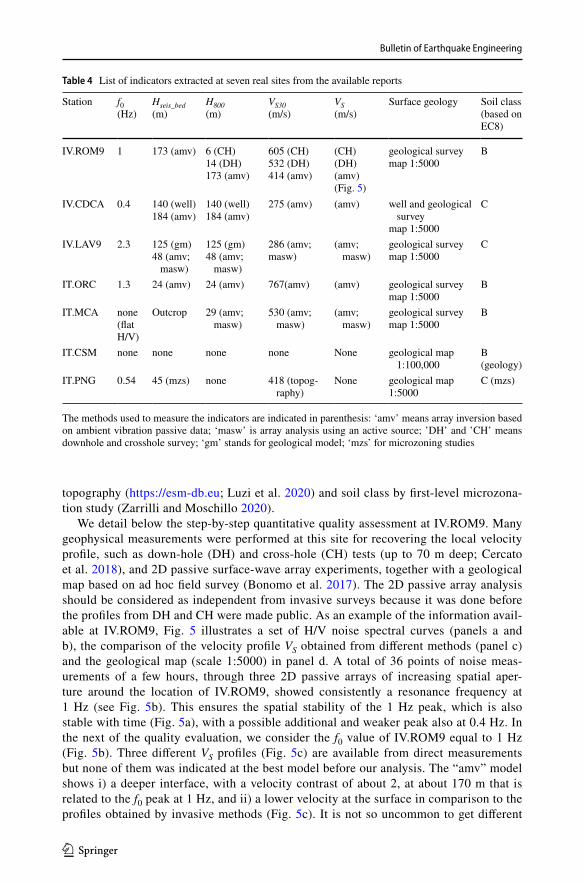
We verify this quality procedure by applying it to seven seismic stations (Table 4) of two permanent seismic networks of Italy: INGV National seismic network (network code IV; https:// doi. org/ 10. 13127/ SD/ X0FXn H7QfY) and the strong-motion network operated by Presidency of Council of Ministers-Civil Protection Department (network code IT; https:// doi. org/ 10. 7914/ SN/ IT). The soil class of the investigated stations (Table 4) following the EC8 seismic code (CEN 2004) is B or C; these are the most common classes for sites of the seismic networks in Europe (Felicetta et al. 2017).
The location of the seven sites and the information on their site characterization are available online through public reports at the Italian Accelerometric Archive (ITACA; http:// itaca. mi. ingv. it; D’Amico et al. 2020) and at the Engineering-Strong Motion data-base (ESM; https:// esm- db. eu; Luzi et al. 2020). The geological and geophysical reports can be downloaded from the stations section of these databases. Table 4 shows the available indicators extracted from the reports; the corresponding values are also plot-ted in the scatter plots of Fig. 2 as squared symbols. All the sites of Table 4, with the exception of IT.CSM, have several information provided from ad-hoc geophysical and geological surveys carried out within recent national projects for site characterization of permanent networks (e.g. Bordoni et al. 2017; Cultrera et al. 2018) or from microzoning studies. IT.PNG has partial information due to the lack of direct measurements of shear-wave velocity profile in proximity of the station, and VS30 is inferred by correlation with
(4)Final_QI = [QI2 + QI3]∕2
Fig. 4 Scatter plot for the couple Hseis_bed-VS30. The color scale is proportional to the soil class category, fol-lowing the classification of EC8 building code (CEN 2004)
Bulletin of Earthquake Engineering
1 3
Table 4 List of indicators extracted at seven real sites from the available reports
The methods used to measure the indicators are indicated in parenthesis: ‘amv’ means array inversion based on ambient vibration passive data; ‘masw’ is array analysis using an active source; ’DH’ and ’CH’ means downhole and crosshole survey; ‘gm’ stands for geological model; ‘mzs’ for microzoning studies
Station f0(Hz)
Hseis_bed(m)
H800(m)
VS30(m/s)
VS(m/s)
Surface geology Soil class(based on EC8)
IV.ROM9 1 173 (amv) 6 (CH)14 (DH)173 (amv)
605 (CH)532 (DH)414 (amv)
(CH)(DH)(amv)(Fig. 5)
geological surveymap 1:5000
B
IV.CDCA 0.4 140 (well)184 (amv)
140 (well)184 (amv)
275 (amv) (amv) well and geological survey
map 1:5000
C
IV.LAV9 2.3 125 (gm)48 (amv;
masw)
125 (gm)48 (amv;
masw)
286 (amv;masw)
(amv; masw)
geological surveymap 1:5000
C
IT.ORC 1.3 24 (amv) 24 (amv) 767(amv) (amv) geological surveymap 1:5000
B
IT.MCA none(flatH/V)
Outcrop 29 (amv; masw)
530 (amv; masw)
(amv; masw)
geological surveymap 1:5000
B
IT.CSM none none none none None geological map 1:100,000
B(geology)
IT.PNG 0.54 45 (mzs) none 418 (topog-raphy)
None geological map1:5000
C (mzs)
topography (https:// esm- db. eu; Luzi et al. 2020) and soil class by first-level microzona-tion study (Zarrilli and Moschillo 2020).
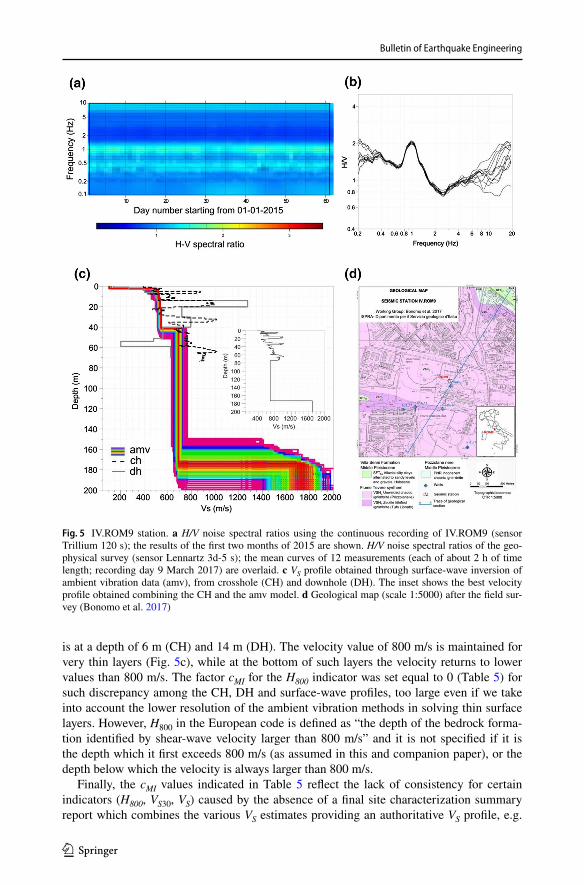
We detail below the step-by-step quantitative quality assessment at IV.ROM9. Many geophysical measurements were performed at this site for recovering the local velocity profile, such as down-hole (DH) and cross-hole (CH) tests (up to 70 m deep; Cercato et al. 2018), and 2D passive surface-wave array experiments, together with a geological map based on ad hoc field survey (Bonomo et al. 2017). The 2D passive array analysis should be considered as independent from invasive surveys because it was done before the profiles from DH and CH were made public. As an example of the information avail-able at IV.ROM9, Fig. 5 illustrates a set of H/V noise spectral curves (panels a and b), the comparison of the velocity profile VS obtained from different methods (panel c) and the geological map (scale 1:5000) in panel d. A total of 36 points of noise meas-urements of a few hours, through three 2D passive arrays of increasing spatial aper-ture around the location of IV.ROM9, showed consistently a resonance frequency at 1 Hz (see Fig. 5b). This ensures the spatial stability of the 1 Hz peak, which is also stable with time (Fig. 5a), with a possible additional and weaker peak also at 0.4 Hz. In the next of the quality evaluation, we consider the f0 value of IV.ROM9 equal to 1 Hz (Fig. 5b). Three different VS profiles (Fig. 5c) are available from direct measurements but none of them was indicated at the best model before our analysis. The “amv” model shows i) a deeper interface, with a velocity contrast of about 2, at about 170 m that is related to the f0 peak at 1 Hz, and ii) a lower velocity at the surface in comparison to the profiles obtained by invasive methods (Fig. 5c). It is not so uncommon to get different
Bulletin of Earthquake Engineering
1 3
VS profiles by using different data and techniques, especially when data are collected at different times and analyzed by different teams in a blind way. In general, amv methods based on surface-wave analysis can provide lower velocities in the uppermost part of the profile with respect to DH and CH surveys (Passeri et al. 2021). This discrepancy may be related to the grouting hole operations, to the different volumes investigated by the methodologies, and to the lower resolution of surface-wave methods in resolving very thin layers. As authoritative choice of the best VS profile, we considered a combined one, obtained by the CH up to a depth of 70 m (the invasive method which is considered as the most reliable for the near-surface part; Di Giulio et al. 2018), and by the joint surface-wave amv model that is characterized by a deeper investigation capability (inset of Fig. 5c). In similar cases, when more measurements for the same indicator are avail-able, it is recommended that the authoritative solution, obtained by expert judgement, is indicated in the seismic databases collecting information for the stations together with a synthesis report.
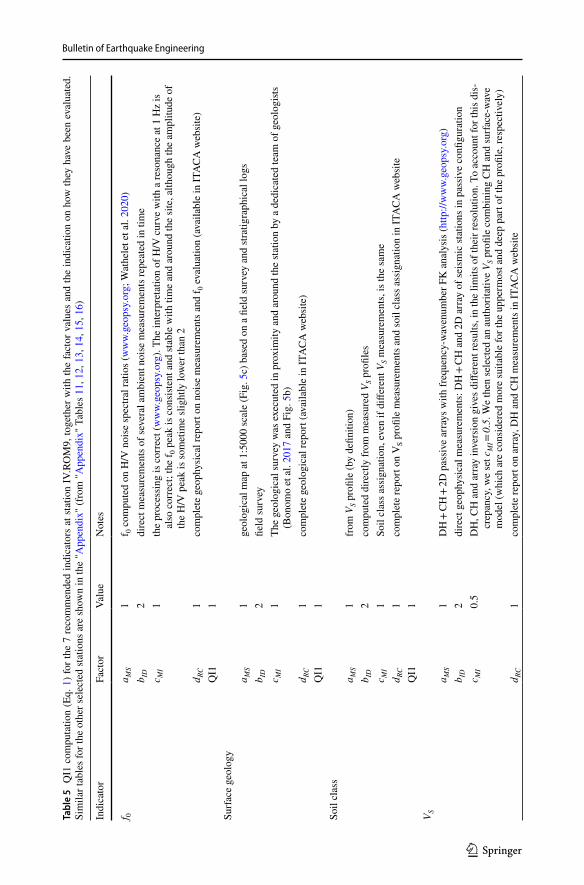
QI1 evaluation at IV.ROM9 of each indicator is summarized in Table 5, together with an explanation of the chosen values. Three indicators (f0, surface geology and soil class) give a QI1 equal to 1, i.e. the maximum value, meaning that they have been computed with reli-able methods (factor aMS = 1 in Eq. 1), direct measurements (bID = 2), confident estimates (cMI = 1) and well documented reports (dRC = 1). One of the SESAME (2004) criteria uses a threshold of 2 in the H/V peak amplitude (assuming a squared average of the horizontal components in the H/V analysis). The amplitude peak is not above 2 for all the 36 points of noise measurements at IV.ROM9, although very close to this threshold value (Fig. 5b). For the indicator f0 the factor cMI, which is connected to the proper method implementation and interpretation of the results, was evaluated equal to its maximum value (cMI = 1) due to the consistent shape of the H/V curves around 1 Hz (Fig. 5b), and to the spatial and time stability of the H/V peak obtained from multiple measurements.
The remaining four indicators have a lower QI1 value: 0.67 for VS, VS30 and Hseis_bed, 0.33 for H800. This is related to the factor cMI which was set to 0.5 for both VS, VS30 and Hseis_bed considering the discrepancies observed in the velocity profiles (Fig. 5c), and equal to 0 for H800 (Table 4).
Concerning the VS30 value, the measurements return 532 m/s for down-hole survey (DH), 605 m/s for Cross-Hole test (CH) and 414 m/s for surface-wave inversion of passive data (Table 4). Each method is considered a direct measurement (factor bID = 2) and has its own resolution in resolving thin layers (Fig. 5c), and the surface-wave inversion was per-formed independently with respect to the invasive methods. Such discrepancy in the VS30 value is also due to the presence of a velocity inversion that is identified by the CH and DH methods, which was not considered during the model parameterization in the surface-wave array analysis, and to the difference between areal and discrete measurements. For these reasons the factor cMI of the VS30 indicator was set equal to the intermediate value of 0.5.
About the seismic bedrock (Hseis_bed), the surface-wave analysis only is able to find it at a depth of about 170 m (Fig. 5c). However, the factor cMI relative to Hseis_bed was set equal to 0.5 (Table 5). This because the assumption of considering the H/V as Rayleigh-wave ellipticity during the inversion step of analysis, not including the possible bias from Love or body waves (Hobiger et al. 2009; Knapmeyer-Endrun et al. 2017), as well as the pres-ence in the area of further H/V peaks at lower frequencies (Marcucci et al. 2019), needs to be verified more in detail.
For the H800 indicator, the shear-wave velocity profile derived from surface-wave analy-sis exceeds 800 m/s only in the deep basement layer (at a depth of 170 m), conversely the CH and DH surveys exceed 800 m/s several times in the uppermost profile: the first time
Bulletin of Earthquake Engineering
1 3
is at a depth of 6 m (CH) and 14 m (DH). The velocity value of 800 m/s is maintained for very thin layers (Fig. 5c), while at the bottom of such layers the velocity returns to lower values than 800 m/s. The factor cMI for the H800 indicator was set equal to 0 (Table 5) for such discrepancy among the CH, DH and surface-wave profiles, too large even if we take into account the lower resolution of the ambient vibration methods in solving thin surface layers. However, H800 in the European code is defined as “the depth of the bedrock forma-tion identified by shear-wave velocity larger than 800 m/s” and it is not specified if it is the depth which it first exceeds 800 m/s (as assumed in this and companion paper), or the depth below which the velocity is always larger than 800 m/s.
Finally, the cMI values indicated in Table 5 reflect the lack of consistency for certain indicators (H800, VS30, VS) caused by the absence of a final site characterization summary report which combines the various VS estimates providing an authoritative VS profile, e.g.
Fig. 5 IV.ROM9 station. a H/V noise spectral ratios using the continuous recording of IV.ROM9 (sensor Trillium 120 s); the results of the first two months of 2015 are shown. H/V noise spectral ratios of the geo-physical survey (sensor Lennartz 3d-5 s); the mean curves of 12 measurements (each of about 2 h of time length; recording day 9 March 2017) are overlaid. c VS profile obtained through surface-wave inversion of ambient vibration data (amv), from crosshole (CH) and downhole (DH). The inset shows the best velocity profile obtained combining the CH and the amv model. d Geological map (scale 1:5000) after the field sur-vey (Bonomo et al. 2017)
Bulletin of Earthquake Engineering
1 3
Tabl
e 5
QI1
com
puta
tion
(Eq.
1) f
or th
e 7
reco
mm
ende
d in
dica
tors
at s
tatio
n IV
.RO
M9,
toge
ther
with
the
fact
or v
alue
s an
d th
e in
dica
tion
on h
ow th
ey h
ave
been
eva
luat
ed.
Sim
ilar t
able
s for
the
othe
r sel
ecte
d st
atio
ns a
re sh
own
in th
e "A
ppen
dix"
(fro
m "A
ppen
dix"
Tab
les 1
1, 1
2, 1
3, 1
4, 1
5, 1
6)
Indi
cato
rFa
ctor
Valu
eN
otes
f 0a M
S1
f 0 c
ompu
ted
on H
/V n
oise
spec
tral r
atio
s (w
ww.
geop
sy. o
rg; W
athe
let e
t al.
2020
)b I
D2
dire
ct m
easu
rem
ents
of s
ever
al a
mbi
ent n
oise
mea
sure
men
ts re
peat
ed in
tim
ec M
I1
the
proc
essi
ng is
cor
rect
(ww
w. ge
opsy
. org
). Th
e in
terp
reta
tion
of H
/V c
urve
with
a re
sona
nce
at 1
Hz
is
also
cor
rect
; the
f 0 p
eak
is c
onsi
stent
and
stab
le w
ith ti
me
and
arou
nd th
e si
te, a
lthou
gh th
e am
plitu
de o
f th
e H
/V p
eak
is so
met
ime
slig
htly
low
er th
an 2
d RC
1co
mpl
ete
geop
hysi
cal r
epor
t on
nois
e m
easu
rem
ents
and
f 0 e
valu
atio
n (a
vaila
ble
in IT
ACA
web
site
)Q
I11
Surfa
ce g
eolo
gya M
S1
geol
ogic
al m
ap a
t 1:5
000
scal
e (F
ig. 5
c) b
ased
on
a fie
ld su
rvey
and
stra
tigra
phic
al lo
gsb I
D2
field
surv
eyc M
I1
The
geol
ogic
al su
rvey
was
exe
cute
d in
pro
xim
ity a
nd a
roun
d th
e st
atio
n by
a d
edic
ated
team
of g
eolo
gists
(B
onom
o et
al.
2017
and
Fig
. 5b)
d RC
1co
mpl
ete
geol
ogic
al re
port
(ava
ilabl
e in
ITA
CA w
ebsi
te)
QI1
1So
il cl
ass
a MS
1fro
m V
S pro
file
(by
defin
ition
)b I
D2
com
pute
d di
rect
ly fr
om m
easu
red
V S p
rofil
esc M
I1
Soil
clas
s ass
igna
tion,
eve
n if
diffe
rent
VS m
easu
rem
ents
, is t
he sa
me
d RC
1co
mpl
ete
repo
rt on
VS p
rofil
e m
easu
rem
ents
and
soil
clas
s ass
igna
tion
in IT
ACA
web
site
QI1
1V S
a MS
1D
H +
CH
+ 2D
pas
sive
arr
ays w
ith fr
eque
ncy-
wav
enum
ber F
K a
naly
sis (
http
:// w
ww.
geop
sy. o
rg)
b ID
2di
rect
geo
phys
ical
mea
sure
men
ts: D
H +
CH
and
2D
arr
ay o
f sei
smic
stat
ions
in p
assi
ve c
onfig
urat
ion
c MI
0.5
DH
, CH
and
arr
ay in
vers
ion
give
s diff
eren
t res
ults
, in
the
limits
of t
heir
reso
lutio
n. T
o ac
coun
t for
this
dis
-cr
epan
cy, w
e se
t cM
I = 0.
5. W
e th
en se
lect
ed a
n au
thor
itativ
e V S
pro
file
com
bini
ng C
H a
nd su
rface
-wav
e m
odel
(whi
ch a
re c
onsi
dere
d m
ore
suita
ble
for t
he u
pper
mos
t and
dee
p pa
rt of
the
profi
le, r
espe
ctiv
ely)
d RC
1co
mpl
ete
repo
rt on
arr
ay, D
H a
nd C
H m
easu
rem
ents
in IT
ACA
web
site

Bulletin of Earthquake Engineering
1 3
Tabl
e 5
(con
tinue
d)
Indi
cato
rFa
ctor
Valu
eN
otes
QI1
0.67
V S30
a MS
1fro
m V
S pro
file
(by
defin
ition
)b I
D2
com
pute
d di
rect
ly fr
om m
easu
red
V S p
rofil
esc M
I0.
5va
lues
from
diff
eren
t met
hods
: 532
m/s
from
DH
, 605
m/s
from
CH
and
414
m/s
from
arr
ay a
naly
sis
d RC
1co
mpl
ete
repo
rt on
VS p
rofil
e m
easu
rem
ents
in IT
ACA
web
site
QI1
0.67
H80
0
a MS
1fro
m V
S pro
file
(by
defin
ition
)b I
D2
com
pute
d di
rect
ly fr
om m
easu
red
V S p
rofil
esc M
I0
14 m
from
DH
, 6 m
from
CH
and
173
m fr
om a
rray
inve
rsio
n. D
iffer
ence
s are
like
ly d
ue to
the
diffe
rent
re
solu
tion
of th
e m
etho
ds fo
r thi
n la
yers
. Fur
ther
the
velo
city
inve
rsio
n is
not
con
side
red
durin
g th
e ar
ray
inve
rsio
n, a
nd th
e va
lue
of 8
00 m
/s in
DH
and
CH
pro
file
is k
ept o
nly
for v
ery
thin
laye
rsd R
C1
com
plet
e re
port
on V
S pro
file
mea
sure
men
ts in
ITA
CA w
ebsi
teQ
I10.
33H
_bed
rock
(Hse
is_b
ed)
a MS
1fro
m V
S pro
file
(by
defin
ition
)b I
D2
com
pute
d di
rect
ly fr
om m
easu
red
V S p
rofil
esc M
I0.
5Pa
ssiv
e ar
ray,
onl
y, is
abl
e to
reac
h th
e la
rges
t vel
ocity
con
trast
(at d
epth
of 1
73 m
) thr
ough
a jo
int i
nver
sion
of
dis
pers
ion
and
H/V
cur
ves.
H/V
cur
ve c
onsi
dere
d as
Ray
leig
h w
ave
ellip
ticity
whi
ch m
ay b
ias t
he
inve
rted
profi
led R
C1
com
plet
e re
port
on V
S pro
file
mea
sure
men
ts in
ITA
CA w
ebsi
teQ
I10.
67
Bulletin of Earthquake Engineering
1 3
as proposed by the Swiss Seismological Service (SED) at ETH Zurich (2015); https:// stati ons. seismo. ethz. ch//. The presence of such a summary report (see companion paper Cul-trera et al. 2021) will most probably increase the cMI value and related Q1.
Once the QI1 for each available indicator is computed (Table 5 and "Appendix" mate-rial), it is straightforward to compute the second index QI2 by applying Eq. 2 with the weights of Table 3. QI2 accounts for the number and importance of the most appropriate indicators, and it is equal to 0.79 in the case of IV.ROM9; the low QI1 for VS30 and H800 does not significantly affect the QI2 value because of the smaller weight of these indicators.
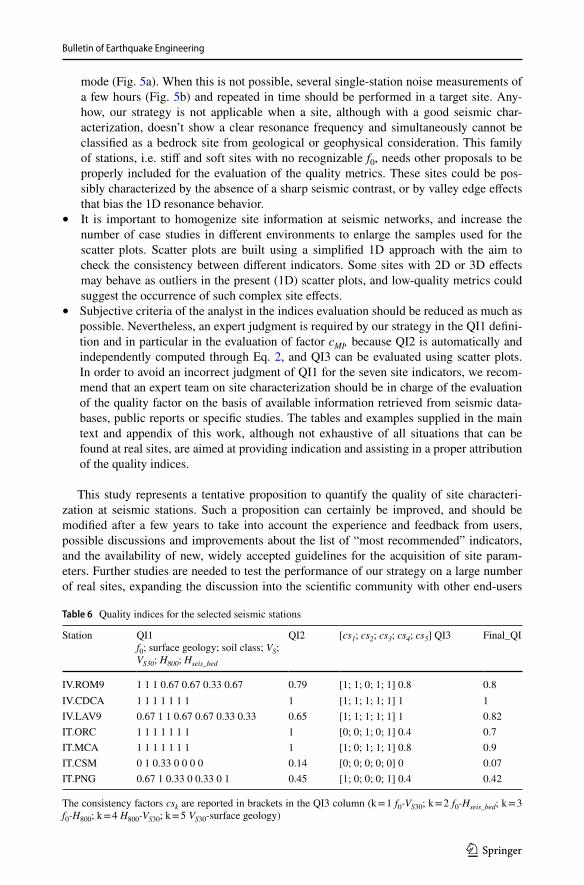
To evaluate QI3 (Eq. 3), we checked the consistency csk between pairs of indicators on the basis of the scatter plots in Fig. 2 (mean values with uncertainties are available in Tables 17, 18, 19 and 20 of the "Appendix"). The square symbols of Fig. 2 referring to IV.ROM9 fall within the confident area (mean ± 2 standard deviations), except for the pair f0—H800 (in panel c) where the values given by DH and CH surveys are out the standard deviation limit. Therefore, csk is set equal to 1 for the pairs corresponding to the scatter plots of panels a, b and d, and csk is set equal to 0 for the pair f0—H800 of panel c (Table 6). The csk is set 1 also for the correlation between VS30 and surface geology: although the different surveys give three values of VS30 spanning from 414 to 605 m/s (see Table 4), such velocity range is compatible with the ignimbrite tuff forma-tion (Fig. 5d) described in the geological report, and within the expected velocity values of the near-surface layer in the area (Pagliaroli et al. 2014; Marcucci et al. 2019). The QI3 value at IV.ROM9 is then equal to 0.8 and the resulting Final_QI (Eq. 4) is 0.8.
The evaluation of QI1, QI2, QI3 and the Final_QI are reported in Table 6 for all the analyzed stations. The station IV.CDCA has the best site characterization, meaning that all the indicators are well computed and their consistency is verified. The worst classifi-cation is for IT.CSM, where direct measurements were not performed and only surface geology (from geological map 1:25,000) and soil class (from topography) are available in seismic databases.
IT.MCA is also well characterized; at this site the H/V noise curve does not exhibit any peak (flat H/V curve) and consistently the basement in the geological report is indi-cated as nearly outcropping although fractured and weathered (soil class is B). The csk for four pairs were set equal to 1 (Table 6) because the absence of a f0 agrees with the geological description (stiff rock outcrops) and with the values retrieved for VS30 and H800 from station reports. However, the depth of bedrock Hseis_bed is ambiguous because H800 is found at a depth of 29 m, and presumably Hseis_bed is at larger depth and then not properly outcropping as indicated in the report. QI3 was 0.8 because the csk for the pair f0-Hseis_bed was set equal to zero.
IV.LAV9 has approximately the same Final_QI of IV.ROM9, even though it is char-acterized by a lower QI2 and higher QI3; the former is due to some mismatches between the outcome of the nearby geophysical surveys, and the latter because the indicators val-ues are all consistent according to the scatter plots of Fig. 2. IT.ORC has the maximum value for QI1 and consequently QI2, but it is penalized by the inconsistency between pairs of indicators as derived from scatter plots (Fig. 2).
IT.PNG has a Final_QI with intermediate value among the other stations, and the 0.42 overall quality value is fairly low (Table 6). This is due mostly to the lack of direct meas-urements of VS and H800. The absence of the H800 indicator leads to cs3 and cs4 equal to 0. cs2 is also 0 because there is inconsistency for the couple f0-Hseis_bed (0.54 Hz and 45 m), suggesting a wrong identification of (at least) one of these indicators. A specific study (Saroli et al. 2020), although focused in a neighboring area located a few kilometers North of IT.PNG, seems indeed to suggest a deeper seismic bedrock.
Bulletin of Earthquake Engineering
1 3
In summary, Table 6 shows very clearly that stations with direct and reliable measure-ments at a large number of indicators get a much higher quality assessment than stations with only inferred values, but that consistency checks between pairs of indicators signifi-cantly modulate the final_QI.
4 Discussion and conclusion
We propose a strategy to assess the quality of site characterization at seismic stations, through relatively simple metrics based on the available information at the station. The quality metrics strategy needs to be as much as possible independent from subjective choices, and an expert judgment is requested to compute the final quality index, because a careful examination of the site information when present from past studies is required by our strategy. We believe that the quality indices evaluation, and the crosscheck of each selected indicator is in the responsibility of the analysis team and/or of the network operators involved in site characteri-zation, with the final aim to associate high-quality metadata to the ground-motion recordings.
The quality evaluation is provided by a single scalar value (Final_QI; Eq. 4), ranging from 0 to 1, that takes into account the number and reliability of a few (7) relevant indi-cators (through QI1 and QI2), and their mutual consistency (QI3) evaluated between five pairs of indicators. In the absence of locally calibrated analyses, the consistency is evalu-ated using scatter plots based on the shear-wave profiles of 935 real sites.
In particular, in the QI and QI2 evaluation we make use of a weighting scheme which assigns a larger grading to direct measurements compared to inferred values. It is worthy to note that a similar classification criteria was recently proposed by Lanzano et al. (2020) for Central Italy seismic stations. Whereas our finality is to rank the site characterization at strong-motion stations whatever their stiffness, these authors were interested in discrimi-nating reference rock sites, i.e. seismic stations unaffected by local amplifications to be used for improving the prediction of site-specific ground motion.
Moreover, to correctly compute the quality index in our classification criteria, it is nec-essary to have an unambiguous definition of the main indicators used for seismic site char-acterization, and recommendations on how to compute them including uncertainties. The details of measurements and computation methods should be reported in a concise form to allow the evaluation of their reliability as addressed in Cultrera et al. (2021).
Our strategy has been applied to seven real seismic stations; the Final_QI values (Table 6) prove the feasibility of the approach in obtaining a quantitative assessment of the overall quality of site characterization for seismic applications. In general, direct and rigorous meas-urements yield better results and allow a reliable picture of the site condition through the selected indicators. However, we are aware that some significant open issues emerge from this work:
• f0 enters in three over the four pairs of indicators for which the consistency of QI3 is computed (see Fig. 2). f0 is actually the indicator that obtained the largest consensus from the online questionnaire as explained in the Cultrera et al. (2021), and a proper evaluation of f0 is thus very important in our strategy. For this aim, it is preferable to analyze large time-periods of ambient noise rather than some hours. This kind of analy-sis can be easily implemented in seismic networks for many modern stations, which are typically six-channels (i.e. velocimeter and accelerometer) recording in continuous
Bulletin of Earthquake Engineering
1 3
mode (Fig. 5a). When this is not possible, several single-station noise measurements of a few hours (Fig. 5b) and repeated in time should be performed in a target site. Any-how, our strategy is not applicable when a site, although with a good seismic char-acterization, doesn’t show a clear resonance frequency and simultaneously cannot be classified as a bedrock site from geological or geophysical consideration. This family of stations, i.e. stiff and soft sites with no recognizable f0, needs other proposals to be properly included for the evaluation of the quality metrics. These sites could be pos-sibly characterized by the absence of a sharp seismic contrast, or by valley edge effects that bias the 1D resonance behavior.
• It is important to homogenize site information at seismic networks, and increase the number of case studies in different environments to enlarge the samples used for the scatter plots. Scatter plots are built using a simplified 1D approach with the aim to check the consistency between different indicators. Some sites with 2D or 3D effects may behave as outliers in the present (1D) scatter plots, and low-quality metrics could suggest the occurrence of such complex site effects.
• Subjective criteria of the analyst in the indices evaluation should be reduced as much as possible. Nevertheless, an expert judgment is required by our strategy in the QI1 defini-tion and in particular in the evaluation of factor cMI, because QI2 is automatically and independently computed through Eq. 2, and QI3 can be evaluated using scatter plots. In order to avoid an incorrect judgment of QI1 for the seven site indicators, we recom-mend that an expert team on site characterization should be in charge of the evaluation of the quality factor on the basis of available information retrieved from seismic data-bases, public reports or specific studies. The tables and examples supplied in the main text and appendix of this work, although not exhaustive of all situations that can be found at real sites, are aimed at providing indication and assisting in a proper attribution of the quality indices.
This study represents a tentative proposition to quantify the quality of site characteri-zation at seismic stations. Such a proposition can certainly be improved, and should be modified after a few years to take into account the experience and feedback from users, possible discussions and improvements about the list of “most recommended” indicators, and the availability of new, widely accepted guidelines for the acquisition of site param-eters. Further studies are needed to test the performance of our strategy on a large number of real sites, expanding the discussion into the scientific community with other end-users
Table 6 Quality indices for the selected seismic stations
The consistency factors csk are reported in brackets in the QI3 column (k = 1 f0-VS30; k = 2 f0-Hseis_bed; k = 3 f0-H800; k = 4 H800-VS30; k = 5 VS30-surface geology)
Station QI1f0; surface geology; soil class; VS; VS30; H800; Hseis_bed
QI2 [cs1; cs2; cs3; cs4; cs5] QI3 Final_QI
IV.ROM9 1 1 1 0.67 0.67 0.33 0.67 0.79 [1; 1; 0; 1; 1] 0.8 0.8IV.CDCA 1 1 1 1 1 1 1 1 [1; 1; 1; 1; 1] 1 1IV.LAV9 0.67 1 1 0.67 0.67 0.33 0.33 0.65 [1; 1; 1; 1; 1] 1 0.82IT.ORC 1 1 1 1 1 1 1 1 [0; 0; 1; 0; 1] 0.4 0.7IT.MCA 1 1 1 1 1 1 1 1 [1; 0; 1; 1; 1] 0.8 0.9IT.CSM 0 1 0.33 0 0 0 0 0.14 [0; 0; 0; 0; 0] 0 0.07IT.PNG 0.67 1 0.33 0 0.33 0 1 0.45 [1; 0; 0; 0; 1] 0.4 0.42
Bulletin of Earthquake Engineering
1 3
including building code operators. The quality values (especially QI1 and Final_QI) can be introduced easily in the station book of online seismic databases. As proposed by the SERA project, the metadata site xml file with enclosed quality values can be indicated in the station xml file (Cornou et al. 2020).
Some decades ago, the site characterization was only binary: rock or soil. It was pro-gressively replaced in the late 90 s by some continuous parameters, mostly VS30, the use of which is now so common that it is included in all strong motion databases as the main site information, and can therefore be used also in ground motion prediction equations (GMPEs). In a similar way, the “quality” of such a site information has been recently intro-duced in a simple, binary way, i.e., “measured” or “inferred”, and the within-event vari-ability modulated according to this binary classification (Chiou and Youngs 2008; Derras et al. 2016). The “continuous” quality index proposed here might help, once implemented in strong (and weak) motion data-bases, to improve GMPEs by including a continuous (rather than binary) dependence of the within-event variability of the quality of site meta-data, and to obtain more appropriate hazard estimates at a target site. It could constitute a strong incentive for all network operators, GMPE developers, and the whole earthquake engineering community, to emphasize the importance of the quality of site metadata, and the need to invest on direct site measurements. We are aware however, that it is only a long term objective, as the concept presented in these two companion papers needs first to be accepted, then probably improved after comprehensive feedback from various worldwide network operators, and finally routinely implemented in the strong motion databases.
Appendix
The next Tables 7, 8 and 9 report examples (after Di Giulio et al. 2019) for the assignment of factors aMS, bID, and cMI in the QI1 definition (Eq. 1 of the main text). Tables 10 refers to histograms of Fig. 1 of the main text. Tables 11, 12, 13, 14, 15 and 16 show the QI1 assign-ment for the real stations that were analyzed in this paper. Tables 17, 18, 19 and 20 refer to the scatter plots of Fig. 2 of the main text.
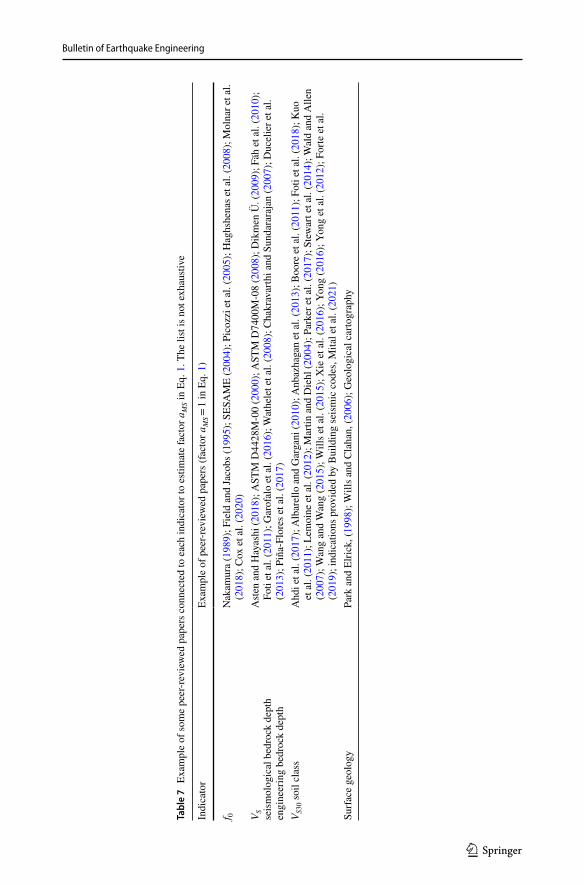
Bulletin of Earthquake Engineering
1 3
Tabl
e 7
Exa
mpl
e of
som
e pe
er-r
evie
wed
pap
ers c
onne
cted
to e
ach
indi
cato
r to
estim
ate
fact
or a
MS i
n Eq
. 1. T
he li
st is
not
exh
austi
ve
Indi
cato
rEx
ampl
e of
pee
r-rev
iew
ed p
aper
s (fa
ctor
aM
S = 1
in E
q. 1
)
f 0N
akam
ura
(198
9); F
ield
and
Jaco
bs (1
995)
; SES
AM
E (2
004)
; Pic
ozzi
et a
l. (2
005)
; Hag
hshe
nas e
t al.
(200
8); M
olna
r et a
l. (2
018)
; Cox
et a
l. (2
020)
V S seis
mol
ogic
al b
edro
ck d
epth
engi
neer
ing
bedr
ock
dept
h
Aste
n an
d H
ayas
hi (2
018)
; AST
M D
4428
M-0
0 (2
000)
; AST
M D
7400
M-0
8 (2
008)
; Dik
men
Ü. (
2009
); Fä
h et
al.
(201
0);
Foti
et a
l. (2
011)
; Gar
ofal
o et
al.
(201
6); W
athe
let e
t al.
(200
8); C
hakr
avar
thi a
nd S
unda
rara
jan
(200
7); D
ucel
ier e
t al.
(201
3); P
iña-
Flor
es e
t al.
(201
7)V S
30 so
il cl
ass
Ahd
i et a
l. (2
017)
; Alb
arel
lo a
nd G
arga
ni (2
010)
; Anb
azha
gan
et a
l. (2
013)
; Boo
re e
t al.
(201
1); F
oti e
t al.
(201
8); K
uo
et a
l. (2
011)
; Lem
oine
et a
l. (2
012)
; Mar
tin a
nd D
iehl
(200
4); P
arke
r et a
l. (2
017)
; Ste
war
t et a
l. (2
014)
; Wal
d an
d A
llen
(200
7); W
ang
and
Wan
g (2
015)
; Will
s et a
l. (2
015)
; Xie
et a
l. (2
016)
; Yon
g (2
016)
; Yon
g et
al.
(201
2); F
orte
et a
l. (2
019)
; ind
icat
ions
pro
vide
d by
Bui
ldin
g se
ism
ic c
odes
, Mita
l et a
l. (2
021)
Surfa
ce g
eolo
gyPa
rk a
nd E
lrick
, (19
98);
Will
s and
Cla
han,
(200
6); G
eolo
gica
l car
togr
aphy
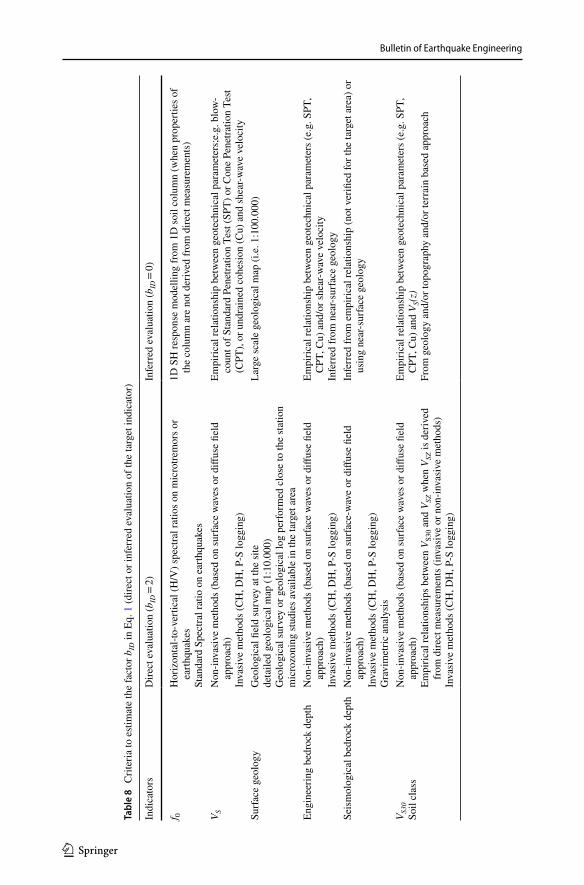
Bulletin of Earthquake Engineering
1 3
Tabl
e 8
Crit
eria
to e
stim
ate
the
fact
or b
ID in
Eq.
1 (d
irect
or i
nfer
red
eval
uatio
n of
the
targ
et in
dica
tor)
Indi
cato
rsD
irect
eva
luat
ion
(bID
= 2)
Infe
rred
eva
luat
ion
(bID
= 0)
f 0H
oriz
onta
l-to-
verti
cal (
H/V
) spe
ctra
l rat
ios o
n m
icro
trem
ors o
r ea
rthqu
akes
Stan
dard
Spe
ctra
l rat
io o
n ea
rthqu
akes
1D S
H re
spon
se m
odel
ling
from
1D
soil
colu
mn
(whe
n pr
oper
ties o
f th
e co
lum
n ar
e no
t der
ived
from
dire
ct m
easu
rem
ents
)
V SN
on-in
vasi
ve m
etho
ds (b
ased
on
surfa
ce w
aves
or d
iffus
e fie
ld
appr
oach
)In
vasi
ve m
etho
ds (C
H, D
H, P
-S lo
ggin
g)
Empi
rical
rela
tions
hip
betw
een
geot
echn
ical
par
amet
ers;
e.g.
blo
w-
coun
t of S
tand
ard
Pene
tratio
n Te
st (S
PT) o
r Con
e Pe
netra
tion
Test
(CPT
), or
und
rain
ed c
ohes
ion
(Cu)
and
shea
r-wav
e ve
loci
tySu
rface
geo
logy
Geo
logi
cal fi
eld
surv
ey a
t the
site
deta
iled
geol
ogic
al m
ap (1
:10.
000)
Geo
logi
cal s
urve
y or
geo
logi
cal l
og p
erfo
rmed
clo
se to
the
stat
ion
mic
rozo
ning
stud
ies a
vaila
ble
in th
e ta
rget
are
a
Larg
e sc
ale
geol
ogic
al m
ap (i
.e. 1
:100
.000
)
Engi
neer
ing
bedr
ock
dept
hN
on-in
vasi
ve m
etho
ds (b
ased
on
surfa
ce w
aves
or d
iffus
e fie
ld
appr
oach
)In
vasi
ve m
etho
ds (C
H, D
H, P
-S lo
ggin
g)
Empi
rical
rela
tions
hip
betw
een
geot
echn
ical
par
amet
ers (
e.g.
SPT
, C
PT, C
u) a
nd/o
r she
ar-w
ave
velo
city
Infe
rred
from
nea
r-sur
face
geo
logy
Seis
mol
ogic
al b
edro
ck d
epth
Non
-inva
sive
met
hods
(bas
ed o
n su
rface
-wav
e or
diff
use
field
ap
proa
ch)
Inva
sive
met
hods
(CH
, DH
, P-S
logg
ing)
Gra
vim
etric
ana
lysi
s
Infe
rred
from
em
piric
al re
latio
nshi
p (n
ot v
erifi
ed fo
r the
targ
et a
rea)
or
usin
g ne
ar-s
urfa
ce g
eolo
gy
V S30
Soil
clas
sN
on-in
vasi
ve m
etho
ds (b
ased
on
surfa
ce w
aves
or d
iffus
e fie
ld
appr
oach
)Em
piric
al re
latio
nshi
ps b
etw
een
V S30
and
VSZ
whe
n V S
Z is d
eriv
ed
from
dire
ct m
easu
rem
ents
(inv
asiv
e or
non
-inva
sive
met
hods
)In
vasi
ve m
etho
ds (C
H, D
H, P
-S lo
ggin
g)
Empi
rical
rela
tions
hip
betw
een
geot
echn
ical
par
amet
ers (
e.g.
SPT
, C
PT, C
u) a
nd V
S(z)
From
geo
logy
and
/or t
opog
raph
y an
d/or
terr
ain
base
d ap
proa
ch
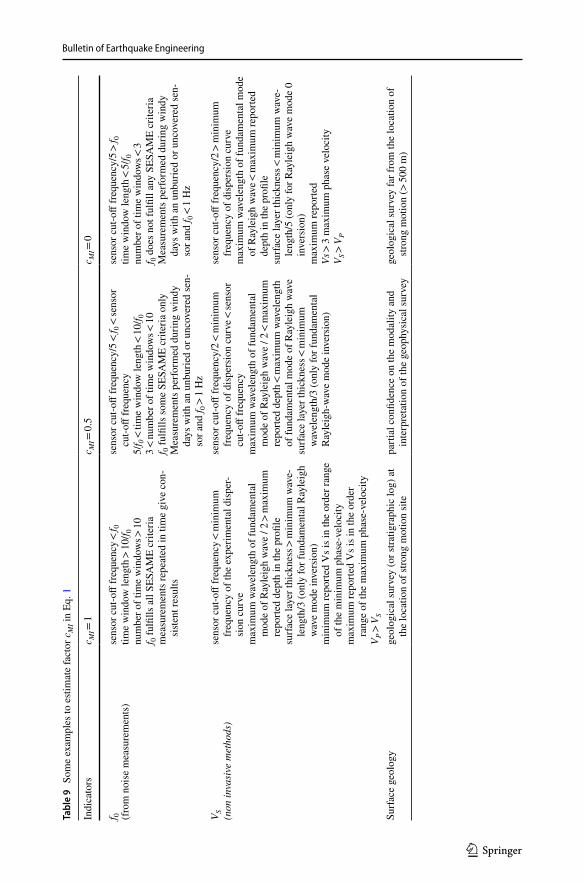
Bulletin of Earthquake Engineering
1 3
Tabl
e 9
Som
e ex
ampl
es to
esti
mat
e fa
ctor
cM
I in
Eq. 1
Indi
cato
rsc M
I = 1
c MI =
0.5
c MI =
0
f 0 (fro
m n
oise
mea
sure
men
ts)
sens
or c
ut-o
ff fr
eque
ncy <
f 0tim
e w
indo
w le
ngth
> 10
/f 0nu
mbe
r of t
ime
win
dow
s > 10
f 0 fu
lfills
all
SESA
ME
crite
riam
easu
rem
ents
repe
ated
in ti
me
give
con
-si
stent
resu
lts
sens
or c
ut-o
ff fr
eque
ncy/
5 < f 0
< se
nsor
cu
t-off
freq
uenc
y5/
f 0 <
tim
e w
indo
w le
ngth
< 10
/f 03 <
num
ber o
f tim
e w
indo
ws <
10f 0
fulfi
lls so
me
SESA
ME
crite
ria o
nly
Mea
sure
men
ts p
erfo
rmed
dur
ing
win
dy
days
with
an
unbu
ried
or u
ncov
ered
sen-
sor a
nd f 0
> 1
Hz
sens
or c
ut-o
ff fr
eque
ncy/
5 > f 0
time
win
dow
leng
th <
5/f 0
num
ber o
f tim
e w
indo
ws <
3f 0
does
not
fulfi
ll an
y SE
SAM
E cr
iteria
Mea
sure
men
ts p
erfo
rmed
dur
ing
win
dy
days
with
an
unbu
ried
or u
ncov
ered
sen-
sor a
nd f 0
< 1
Hz
V S (non
inva
sive
met
hods
)se
nsor
cut
-off
freq
uenc
y < m
inim
um
freq
uenc
y of
the
expe
rimen
tal d
ispe
r-si
on c
urve
max
imum
wav
elen
gth
of fu
ndam
enta
l m
ode
of R
ayle
igh
wav
e / 2
> m
axim
um
repo
rted
dept
h in
the
profi
lesu
rface
laye
r thi
ckne
ss >
min
imum
wav
e-le
ngth
/3 (o
nly
for f
unda
men
tal R
ayle
igh
wav
e m
ode
inve
rsio
n)m
inim
um re
porte
d V
s is i
n th
e or
der r
ange
of
the
min
imum
pha
se-v
eloc
itym
axim
um re
porte
d V
s is i
n th
e or
der
rang
e of
the
max
imum
pha
se-v
eloc
ityV P
> V
S
sens
or c
ut-o
ff fr
eque
ncy/
2 < m
inim
um
freq
uenc
y of
dis
pers
ion
curv
e < se
nsor
cu
t-off
freq
uenc
ym
axim
um w
avel
engt
h of
fund
amen
tal
mod
e of
Ray
leig
h w
ave
/ 2 <
max
imum
re
porte
d de
pth <
max
imum
wav
elen
gth
of fu
ndam
enta
l mod
e of
Ray
leig
h w
ave
surfa
ce la
yer t
hick
ness
< m
inim
um
wav
elen
gth/
3 (o
nly
for f
unda
men
tal
Ray
leig
h-w
ave
mod
e in
vers
ion)
sens
or c
ut-o
ff fr
eque
ncy/
2 > m
inim
um
freq
uenc
y of
dis
pers
ion
curv
em
axim
um w
avel
engt
h of
fund
amen
tal m
ode
of R
ayle
igh
wav
e < m
axim
um re
porte
d de
pth
in th
e pr
ofile
surfa
ce la
yer t
hick
ness
< m
inim
um w
ave-
leng
th/5
(onl
y fo
r Ray
leig
h w
ave
mod
e 0
inve
rsio
n)m
axim
um re
porte
dVs
> 3
max
imum
pha
se v
eloc
ityV S
> V
P
Surfa
ce g
eolo
gyge
olog
ical
surv
ey (o
r stra
tigra
phic
log)
at
the
loca
tion
of st
rong
mot
ion
site
parti
al c
onfid
ence
on
the
mod
ality
and
in
terp
reta
tion
of th
e ge
ophy
sica
l sur
vey
geol
ogic
al su
rvey
far f
rom
the
loca
tion
of
stron
g m
otio
n (>
500
m)
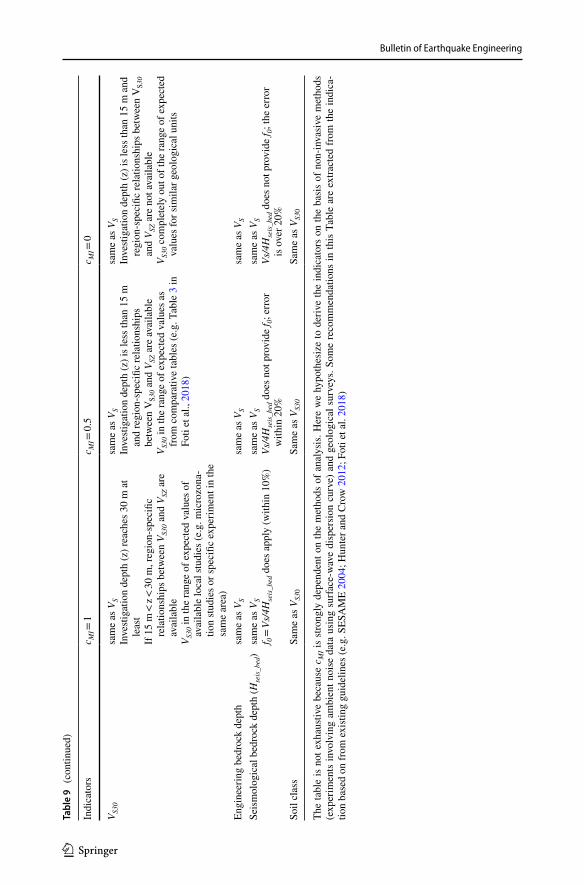
Bulletin of Earthquake Engineering
1 3
The
tabl
e is
not
exh
austi
ve b
ecau
se c
MI i
s str
ongl
y de
pend
ent o
n th
e m
etho
ds o
f ana
lysi
s. H
ere
we
hypo
thes
ize
to d
eriv
e th
e in
dica
tors
on
the
basi
s of
non
-inva
sive
met
hods
(e
xper
imen
ts in
volv
ing
ambi
ent n
oise
dat
a us
ing
surfa
ce-w
ave
disp
ersi
on c
urve
) and
geo
logi
cal s
urve
ys. S
ome
reco
mm
enda
tions
in th
is T
able
are
ext
ract
ed fr
om th
e in
dica
-tio
n ba
sed
on fr
om e
xisti
ng g
uide
lines
(e.g
. SES
AM
E 20
04; H
unte
r and
Cro
w 2
012;
Fot
i et a
l. 20
18)
Tabl
e 9
(con
tinue
d)
Indi
cato
rsc M
I = 1
c MI =
0.5
c MI =
0
V S30
sam
e as
VS
Inve
stiga
tion
dept
h (z
) rea
ches
30
m a
t le
ast
If 1
5 m
< z
< 30
m, r
egio
n-sp
ecifi
c re
latio
nshi
ps b
etw
een
V S30
and
VSZ
are
av
aila
ble
V S30
in th
e ra
nge
of e
xpec
ted
valu
es o
f av
aila
ble
loca
l stu
dies
(e.g
. mic
rozo
na-
tion
studi
es o
r spe
cific
exp
erim
ent i
n th
e sa
me
area
)
sam
e as
VS
Inve
stiga
tion
dept
h (z
) is l
ess t
han
15 m
an
d re
gion
-spe
cific
rela
tions
hips
be
twee
n V
S30 a
nd V
SZ a
re av
aila
ble
V S30
in th
e ra
nge
of e
xpec
ted
valu
es a
s fro
m c
ompa
rativ
e ta
bles
(e.g
. Tab
le 3
in
Foti
et a
l., 2
018)
sam
e as
VS
Inve
stiga
tion
dept
h (z
) is l
ess t
han
15 m
and
re
gion
-spe
cific
rela
tions
hips
bet
wee
n V
S30
and
V SZ a
re n
ot a
vaila
ble
V S30
com
plet
ely
out o
f the
rang
e of
exp
ecte
d va
lues
for s
imila
r geo
logi
cal u
nits
Engi
neer
ing
bedr
ock
dept
hsa
me
as V
Ssa
me
as V
Ssa
me
as V
S
Seis
mol
ogic
al b
edro
ck d
epth
(Hse
is_b
ed)
sam
e as
VS
f 0 =
Vs/
4Hse
is_b
ed d
oes a
pply
(with
in 1
0%)
sam
e as
VS
Vs/4
Hse
is_b
ed d
oes n
ot p
rovi
de f 0
; err
or
with
in 2
0%
sam
e as
VS
Vs/4
Hse
is_b
ed d
oes n
ot p
rovi
de f 0
; the
err
or
is o
ver 2
0%So
il cl
ass
Sam
e as
VS3
0Sa
me
as V
S30
Sam
e as
VS3
0
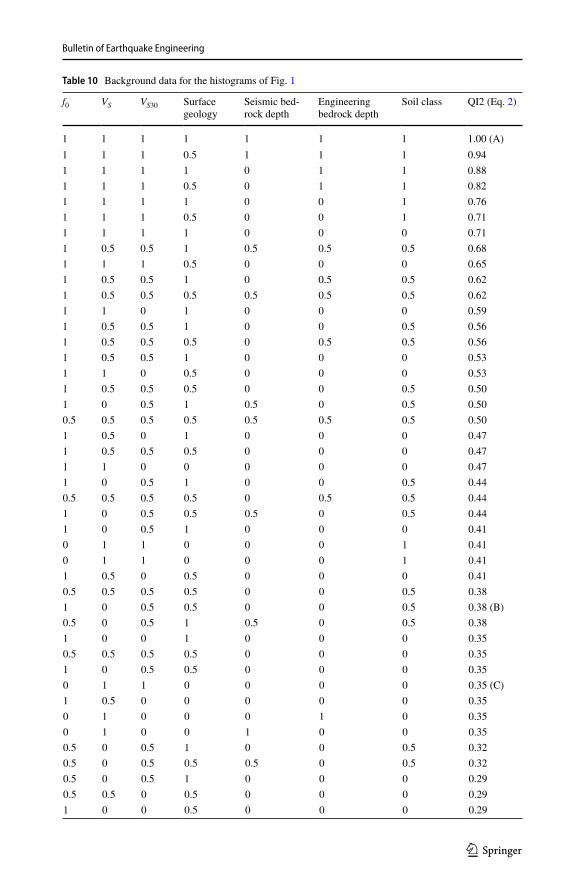
Bulletin of Earthquake Engineering
1 3
Table 10 Background data for the histograms of Fig. 1
f0 VS VS30 Surfacegeology
Seismic bed-rock depth
Engineering bedrock depth
Soil class QI2 (Eq. 2)
1 1 1 1 1 1 1 1.00 (A)1 1 1 0.5 1 1 1 0.941 1 1 1 0 1 1 0.881 1 1 0.5 0 1 1 0.821 1 1 1 0 0 1 0.761 1 1 0.5 0 0 1 0.711 1 1 1 0 0 0 0.711 0.5 0.5 1 0.5 0.5 0.5 0.681 1 1 0.5 0 0 0 0.651 0.5 0.5 1 0 0.5 0.5 0.621 0.5 0.5 0.5 0.5 0.5 0.5 0.621 1 0 1 0 0 0 0.591 0.5 0.5 1 0 0 0.5 0.561 0.5 0.5 0.5 0 0.5 0.5 0.561 0.5 0.5 1 0 0 0 0.531 1 0 0.5 0 0 0 0.531 0.5 0.5 0.5 0 0 0.5 0.501 0 0.5 1 0.5 0 0.5 0.500.5 0.5 0.5 0.5 0.5 0.5 0.5 0.501 0.5 0 1 0 0 0 0.471 0.5 0.5 0.5 0 0 0 0.471 1 0 0 0 0 0 0.471 0 0.5 1 0 0 0.5 0.440.5 0.5 0.5 0.5 0 0.5 0.5 0.441 0 0.5 0.5 0.5 0 0.5 0.441 0 0.5 1 0 0 0 0.410 1 1 0 0 0 1 0.410 1 1 0 0 0 1 0.411 0.5 0 0.5 0 0 0 0.410.5 0.5 0.5 0.5 0 0 0.5 0.381 0 0.5 0.5 0 0 0.5 0.38 (B)0.5 0 0.5 1 0.5 0 0.5 0.381 0 0 1 0 0 0 0.350.5 0.5 0.5 0.5 0 0 0 0.351 0 0.5 0.5 0 0 0 0.350 1 1 0 0 0 0 0.35 (C)1 0.5 0 0 0 0 0 0.350 1 0 0 0 1 0 0.350 1 0 0 1 0 0 0.350.5 0 0.5 1 0 0 0.5 0.320.5 0 0.5 0.5 0.5 0 0.5 0.320.5 0 0.5 1 0 0 0 0.290.5 0.5 0 0.5 0 0 0 0.291 0 0 0.5 0 0 0 0.29
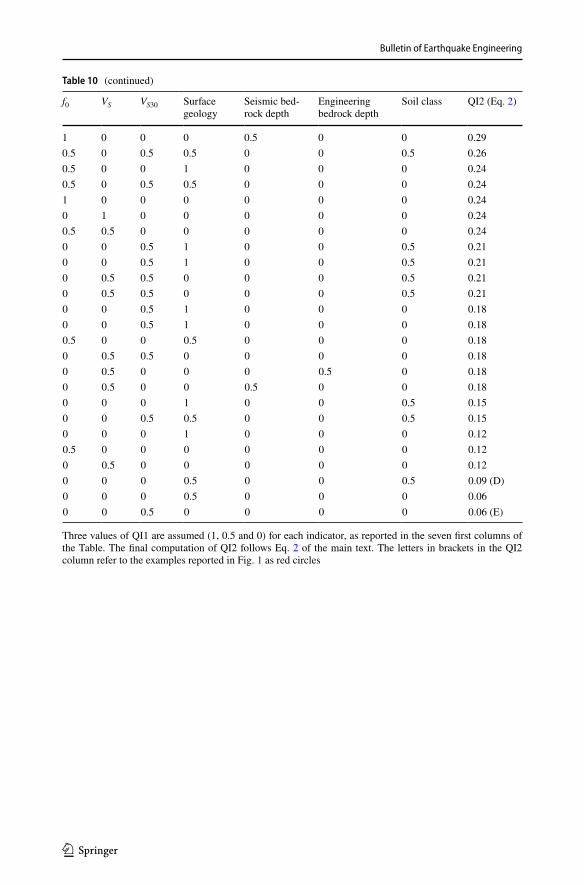
Bulletin of Earthquake Engineering
1 3
Three values of QI1 are assumed (1, 0.5 and 0) for each indicator, as reported in the seven first columns of the Table. The final computation of QI2 follows Eq. 2 of the main text. The letters in brackets in the QI2 column refer to the examples reported in Fig. 1 as red circles
Table 10 (continued)
f0 VS VS30 Surfacegeology
Seismic bed-rock depth
Engineering bedrock depth
Soil class QI2 (Eq. 2)
1 0 0 0 0.5 0 0 0.290.5 0 0.5 0.5 0 0 0.5 0.260.5 0 0 1 0 0 0 0.240.5 0 0.5 0.5 0 0 0 0.241 0 0 0 0 0 0 0.240 1 0 0 0 0 0 0.240.5 0.5 0 0 0 0 0 0.240 0 0.5 1 0 0 0.5 0.210 0 0.5 1 0 0 0.5 0.210 0.5 0.5 0 0 0 0.5 0.210 0.5 0.5 0 0 0 0.5 0.210 0 0.5 1 0 0 0 0.180 0 0.5 1 0 0 0 0.180.5 0 0 0.5 0 0 0 0.180 0.5 0.5 0 0 0 0 0.180 0.5 0 0 0 0.5 0 0.180 0.5 0 0 0.5 0 0 0.180 0 0 1 0 0 0.5 0.150 0 0.5 0.5 0 0 0.5 0.150 0 0 1 0 0 0 0.120.5 0 0 0 0 0 0 0.120 0.5 0 0 0 0 0 0.120 0 0 0.5 0 0 0.5 0.09 (D)0 0 0 0.5 0 0 0 0.060 0 0.5 0 0 0 0 0.06 (E)
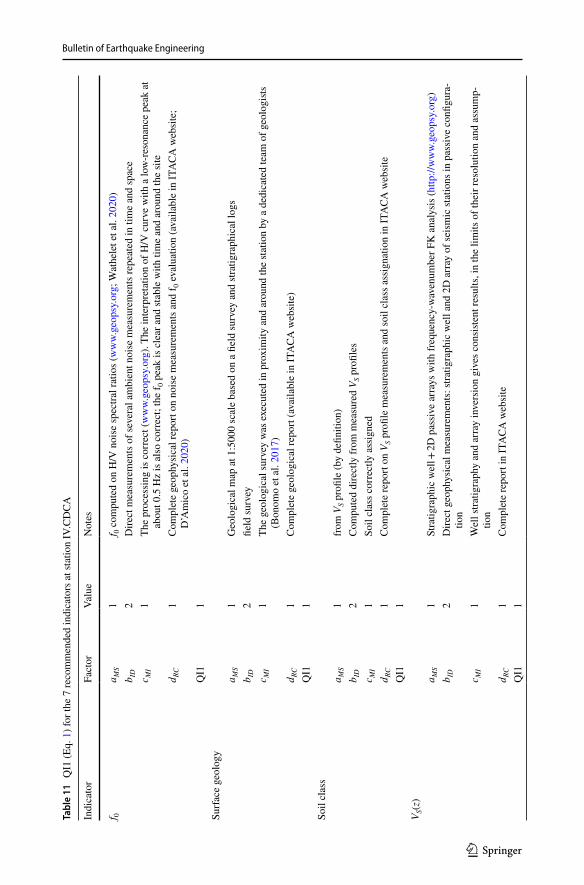
Bulletin of Earthquake Engineering
1 3
Tabl
e 11
Q
I1 (E
q. 1
) for
the
7 re
com
men
ded
indi
cato
rs a
t sta
tion
IV.C
DCA
Indi
cato
rFa
ctor
Valu
eN
otes
f 0a M
S1
f 0 co
mpu
ted
on H
/V n
oise
spec
tral r
atio
s (w
ww.
geop
sy. o
rg; W
athe
let e
t al.
2020
)b I
D2
Dire
ct m
easu
rem
ents
of s
ever
al a
mbi
ent n
oise
mea
sure
men
ts re
peat
ed in
tim
e an
d sp
ace
c MI
1Th
e pr
oces
sing
is c
orre
ct (w
ww.
geop
sy. o
rg).
The
inte
rpre
tatio
n of
H/V
cur
ve w
ith a
low
-res
onan
ce p
eak
at
abou
t 0.5
Hz
is a
lso
corr
ect;
the
f 0 p
eak
is c
lear
and
stab
le w
ith ti
me
and
arou
nd th
e si
ted R
C1
Com
plet
e ge
ophy
sica
l rep
ort o
n no
ise
mea
sure
men
ts a
nd f 0
eva
luat
ion
(ava
ilabl
e in
ITA
CA w
ebsi
te;
D’A
mic
o et
al.
2020
)Q
I11
Surfa
ce g
eolo
gya M
S1
Geo
logi
cal m
ap a
t 1:5
000
scal
e ba
sed
on a
fiel
d su
rvey
and
stra
tigra
phic
al lo
gsb I
D2
field
surv
eyc M
I1
The
geol
ogic
al su
rvey
was
exe
cute
d in
pro
xim
ity a
nd a
roun
d th
e st
atio
n by
a d
edic
ated
team
of g
eolo
gists
(B
onom
o et
al.
2017
)d R
C1
Com
plet
e ge
olog
ical
repo
rt (a
vaila
ble
in IT
ACA
web
site
)Q
I11
Soil
clas
sa M
S1
from
VS p
rofil
e (b
y de
finiti
on)
b ID
2C
ompu
ted
dire
ctly
from
mea
sure
d V S
pro
files
c MI
1So
il cl
ass c
orre
ctly
ass
igne
dd R
C1
Com
plet
e re
port
on V
S pro
file
mea
sure
men
ts a
nd so
il cl
ass a
ssig
natio
n in
ITA
CA w
ebsi
teQ
I11
V S(z
)a M
S1
Stra
tigra
phic
wel
l + 2D
pas
sive
arr
ays w
ith fr
eque
ncy-
wav
enum
ber F
K a
naly
sis (
http
:// w
ww.
geop
sy. o
rg)
b ID
2D
irect
geo
phys
ical
mea
sure
men
ts: s
tratig
raph
ic w
ell a
nd 2
D a
rray
of s
eism
ic st
atio
ns in
pas
sive
con
figur
a-tio
nc M
I1
Wel
l stra
tigra
phy
and
arra
y in
vers
ion
give
s con
siste
nt re
sults
, in
the
limits
of t
heir
reso
lutio
n an
d as
sum
p-tio
nd R
C1
Com
plet
e re
port
in IT
ACA
web
site
QI1
1
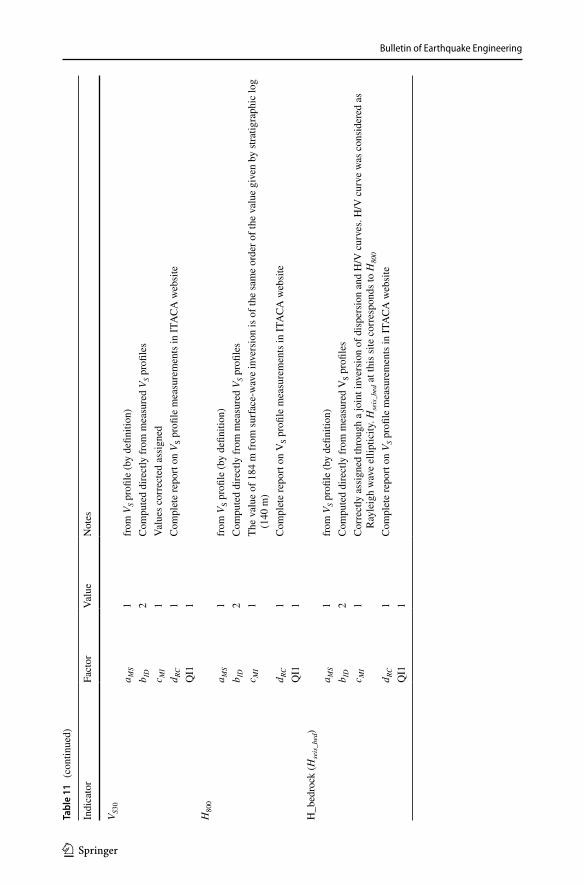
Bulletin of Earthquake Engineering
1 3
Tabl
e 11
(co
ntin
ued)
Indi
cato
rFa
ctor
Valu
eN
otes
V S30
a MS
1fro
m V
S pro
file
(by
defin
ition
)b I
D2
Com
pute
d di
rect
ly fr
om m
easu
red
V S p
rofil
esc M
I1
Valu
es c
orre
cted
ass
igne
dd R
C1
Com
plet
e re
port
on V
S pro
file
mea
sure
men
ts in
ITA
CA w
ebsi
teQ
I11
H80
0
a MS
1fro
m V
S pro
file
(by
defin
ition
)b I
D2
Com
pute
d di
rect
ly fr
om m
easu
red
V S p
rofil
esc M
I1
The
valu
e of
184
m fr
om su
rface
-wav
e in
vers
ion
is o
f the
sam
e or
der o
f the
val
ue g
iven
by
strat
igra
phic
log
(140
m)
d RC
1C
ompl
ete
repo
rt on
VS p
rofil
e m
easu
rem
ents
in IT
ACA
web
site
QI1
1H
_bed
rock
(Hse
is_b
ed)
a MS
1fro
m V
S pro
file
(by
defin
ition
)b I
D2
Com
pute
d di
rect
ly fr
om m
easu
red
VS p
rofil
esc M
I1
Cor
rect
ly a
ssig
ned
thro
ugh
a jo
int i
nver
sion
of d
ispe
rsio
n an
d H
/V c
urve
s. H
/V c
urve
was
con
side
red
as
Ray
leig
h w
ave
ellip
ticity
. Hse
is_b
ed a
t thi
s site
cor
resp
onds
to H
800
d RC
1C
ompl
ete
repo
rt on
VS p
rofil
e m
easu
rem
ents
in IT
ACA
web
site
QI1
1
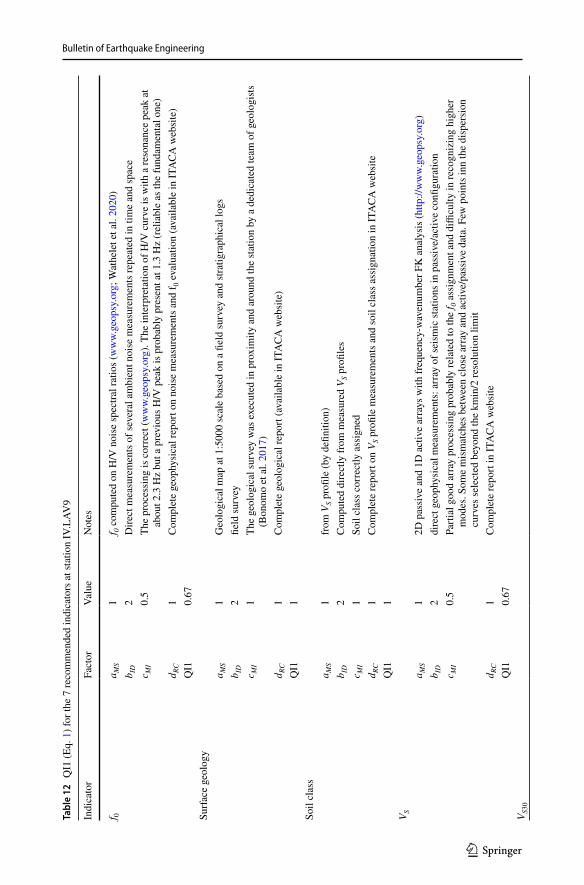
Bulletin of Earthquake Engineering
1 3
Tabl
e 12
Q
I1 (E
q. 1
) for
the
7 re
com
men
ded
indi
cato
rs a
t sta
tion
IV.L
AV9
Indi
cato
rFa
ctor
Valu
eN
otes
f 0a M
S1
f 0 co
mpu
ted
on H
/V n
oise
spec
tral r
atio
s (w
ww.
geop
sy. o
rg; W
athe
let e
t al.
2020
)b I
D2
Dire
ct m
easu
rem
ents
of s
ever
al a
mbi
ent n
oise
mea
sure
men
ts re
peat
ed in
tim
e an
d sp
ace
c MI
0.5
The
proc
essi
ng is
cor
rect
(ww
w. ge
opsy
. org
). Th
e in
terp
reta
tion
of H
/V c
urve
is w
ith a
reso
nanc
e pe
ak a
t ab
out 2
.3 H
z bu
t a p
revi
ous H
/V p
eak
is p
roba
bly
pres
ent a
t 1.3
Hz
(rel
iabl
e as
the
fund
amen
tal o
ne)
d RC
1C
ompl
ete
geop
hysi
cal r
epor
t on
nois
e m
easu
rem
ents
and
f 0 e
valu
atio
n (a
vaila
ble
in IT
ACA
web
site
)Q
I10.
67Su
rface
geo
logy
a MS
1G
eolo
gica
l map
at 1
:500
0 sc
ale
base
d on
a fi
eld
surv
ey a
nd st
ratig
raph
ical
logs
b ID
2fie
ld su
rvey
c MI
1Th
e ge
olog
ical
surv
ey w
as e
xecu
ted
in p
roxi
mity
and
aro
und
the
stat
ion
by a
ded
icat
ed te
am o
f geo
logi
sts
(Bon
omo
et a
l. 20
17)
d RC
1C
ompl
ete
geol
ogic
al re
port
(ava
ilabl
e in
ITA
CA w
ebsi
te)
QI1
1So
il cl
ass
a MS
1fro
m V
S pro
file
(by
defin
ition
)b I
D2
Com
pute
d di
rect
ly fr
om m
easu
red
V S p
rofil
esc M
I1
Soil
clas
s cor
rect
ly a
ssig
ned
d RC
1C
ompl
ete
repo
rt on
VS p
rofil
e m
easu
rem
ents
and
soil
clas
s ass
igna
tion
in IT
ACA
web
site
QI1
1V S
a MS
12D
pas
sive
and
1D
act
ive
arra
ys w
ith fr
eque
ncy-
wav
enum
ber F
K a
naly
sis (
http
:// w
ww.
geop
sy. o
rg)
b ID
2di
rect
geo
phys
ical
mea
sure
men
ts: a
rray
of s
eism
ic st
atio
ns in
pas
sive
/act
ive
confi
gura
tion
c MI
0.5
Parti
al g
ood
arra
y pr
oces
sing
pro
babl
y re
late
d to
the
f 0 as
sign
men
t and
diffi
culty
in re
cogn
izin
g hi
gher
m
odes
. Som
e m
ism
atch
es b
etw
een
clos
e ar
ray
and
activ
e/pa
ssiv
e da
ta. F
ew p
oint
s inn
the
disp
ersi
on
curv
es se
lect
ed b
eyon
d th
e km
in/2
reso
lutio
n lim
itd R
C1
Com
plet
e re
port
in IT
ACA
web
site
QI1
0.67
V S30
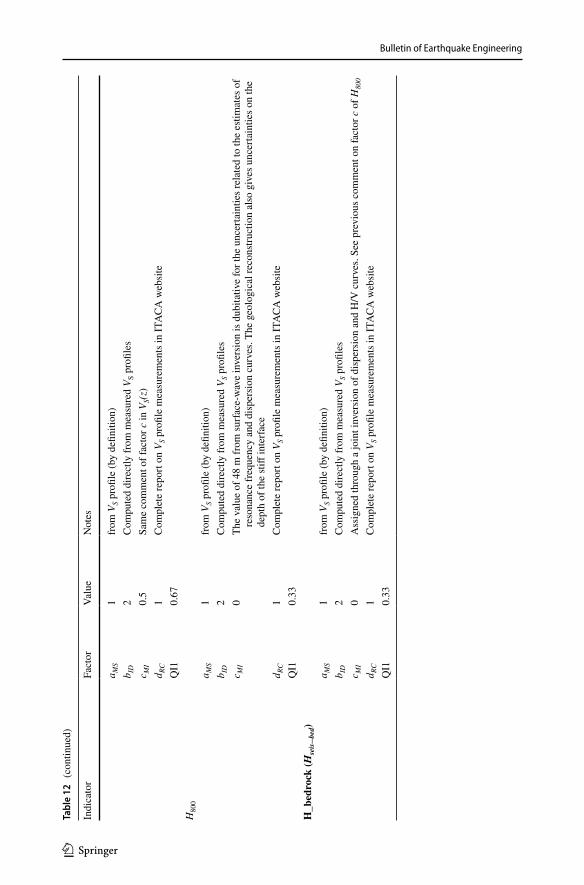
Bulletin of Earthquake Engineering
1 3
Tabl
e 12
(co
ntin
ued)
Indi
cato
rFa
ctor
Valu
eN
otes
a MS
1fro
m V
S pro
file
(by
defin
ition
)b I
D2
Com
pute
d di
rect
ly fr
om m
easu
red
V S p
rofil
esc M
I0.
5Sa
me
com
men
t of f
acto
r c in
VS(
z)d R
C1
Com
plet
e re
port
on V
S pro
file
mea
sure
men
ts in
ITA
CA w
ebsi
teQ
I10.
67H
800
a MS
1fro
m V
S pro
file
(by
defin
ition
)b I
D2
Com
pute
d di
rect
ly fr
om m
easu
red
V S p
rofil
esc M
I0
The
valu
e of
48
m fr
om su
rface
-wav
e in
vers
ion
is d
ubita
tive
for t
he u
ncer
tain
ties r
elat
ed to
the
estim
ates
of
reso
nanc
e fr
eque
ncy
and
disp
ersi
on c
urve
s. Th
e ge
olog
ical
reco
nstru
ctio
n al
so g
ives
unc
erta
intie
s on
the
dept
h of
the
stiff
inte
rface
d RC
1C
ompl
ete
repo
rt on
VS p
rofil
e m
easu
rem
ents
in IT
ACA
web
site
QI1
0.33
H_b
edro
ck (H
seis_
bed)
a MS
1fro
m V
S pro
file
(by
defin
ition
)b I
D2
Com
pute
d di
rect
ly fr
om m
easu
red
V S p
rofil
esc M
I0
Ass
igne
d th
roug
h a
join
t inv
ersi
on o
f dis
pers
ion
and
H/V
cur
ves.
See
prev
ious
com
men
t on
fact
or c
of H
800
d RC
1C
ompl
ete
repo
rt on
VS p
rofil
e m
easu
rem
ents
in IT
ACA
web
site
QI1
0.33
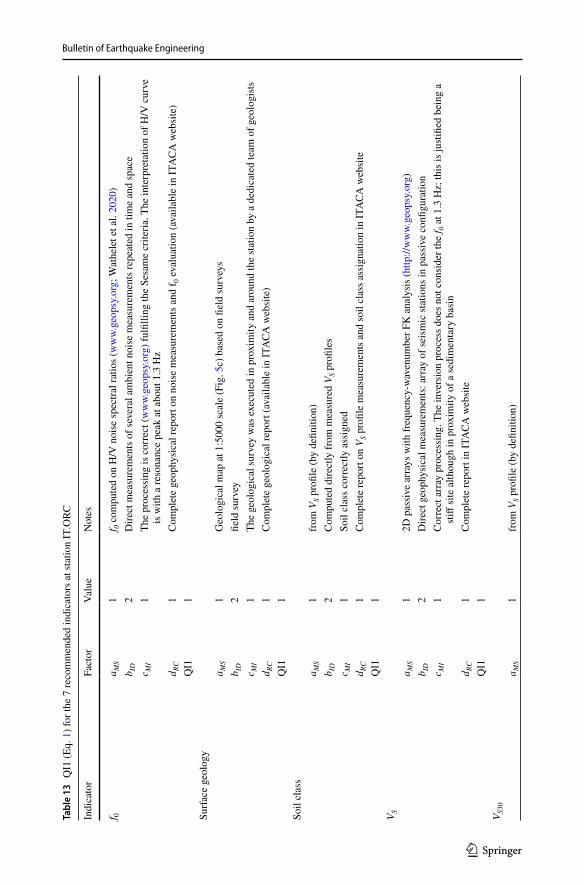
Bulletin of Earthquake Engineering
1 3
Tabl
e 13
Q
I1 (E
q. 1
) for
the
7 re
com
men
ded
indi
cato
rs a
t sta
tion
IT.O
RC
Indi
cato
rFa
ctor
Valu
eN
otes
f 0a M
S1
f 0 co
mpu
ted
on H
/V n
oise
spec
tral r
atio
s (w
ww.
geop
sy. o
rg; W
athe
let e
t al.
2020
)b I
D2
Dire
ct m
easu
rem
ents
of s
ever
al a
mbi
ent n
oise
mea
sure
men
ts re
peat
ed in
tim
e an
d sp
ace
c MI
1Th
e pr
oces
sing
is c
orre
ct (w
ww.
geop
sy. o
rg) f
ulfil
ling
the
Sesa
me
crite
ria. T
he in
terp
reta
tion
of H
/V c
urve
is
with
a re
sona
nce
peak
at a
bout
1.3
Hz
d RC
1C
ompl
ete
geop
hysi
cal r
epor
t on
nois
e m
easu
rem
ents
and
f 0 e
valu
atio
n (a
vaila
ble
in IT
ACA
web
site
)Q
I11
Surfa
ce g
eolo
gya M
S1
Geo
logi
cal m
ap a
t 1:5
000
scal
e (F
ig. 5
c) b
ased
on
field
surv
eys
b ID
2fie
ld su
rvey
c MI
1Th
e ge
olog
ical
surv
ey w
as e
xecu
ted
in p
roxi
mity
and
aro
und
the
stat
ion
by a
ded
icat
ed te
am o
f geo
logi
stsd R
C1
Com
plet
e ge
olog
ical
repo
rt (a
vaila
ble
in IT
ACA
web
site
)Q
I11
Soil
clas
sa M
S1
from
VS p
rofil
e (b
y de
finiti
on)
b ID
2C
ompu
ted
dire
ctly
from
mea
sure
d V S
pro
files
c MI
1So
il cl
ass c
orre
ctly
ass
igne
dd R
C1
Com
plet
e re
port
on V
S pro
file
mea
sure
men
ts a
nd so
il cl
ass a
ssig
natio
n in
ITA
CA w
ebsi
teQ
I11
V Sa M
S1
2D p
assi
ve a
rray
s with
freq
uenc
y-w
aven
umbe
r FK
ana
lysi
s (ht
tp://
ww
w. ge
opsy
. org
)b I
D2
Dire
ct g
eoph
ysic
al m
easu
rem
ents
: arr
ay o
f sei
smic
stat
ions
in p
assi
ve c
onfig
urat
ion
c MI
1C
orre
ct a
rray
pro
cess
ing.
The
inve
rsio
n pr
oces
s doe
s not
con
side
r the
f 0 a
t 1.3
Hz;
this
is ju
stifie
d be
ing
a sti
ff si
te a
lthou
gh in
pro
xim
ity o
f a se
dim
enta
ry b
asin
d RC
1C
ompl
ete
repo
rt in
ITA
CA w
ebsi
teQ
I11
V S30
a MS
1fro
m V
S pro
file
(by
defin
ition
)
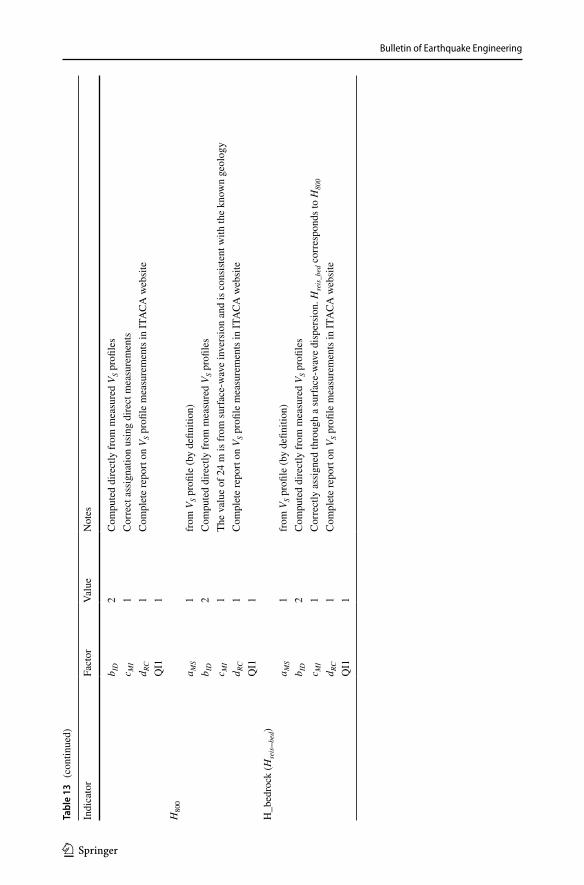
Bulletin of Earthquake Engineering
1 3
Tabl
e 13
(co
ntin
ued)
Indi
cato
rFa
ctor
Valu
eN
otes
b ID
2C
ompu
ted
dire
ctly
from
mea
sure
d V S
pro
files
c MI
1C
orre
ct a
ssig
natio
n us
ing
dire
ct m
easu
rem
ents
d RC
1C
ompl
ete
repo
rt on
VS p
rofil
e m
easu
rem
ents
in IT
ACA
web
site
QI1
1H
800
a MS
1fro
m V
S pro
file
(by
defin
ition
)b I
D2
Com
pute
d di
rect
ly fr
om m
easu
red
V S p
rofil
esc M
I1
The
valu
e of
24
m is
from
surfa
ce-w
ave
inve
rsio
n an
d is
con
siste
nt w
ith th
e kn
own
geol
ogy
d RC
1C
ompl
ete
repo
rt on
VS p
rofil
e m
easu
rem
ents
in IT
ACA
web
site
QI1
1H
_bed
rock
(Hse
is_ b
ed)
a MS
1fro
m V
S pro
file
(by
defin
ition
)b I
D2
Com
pute
d di
rect
ly fr
om m
easu
red
V S p
rofil
esc M
I1
Cor
rect
ly a
ssig
ned
thro
ugh
a su
rface
-wav
e di
sper
sion
. Hse
is_b
ed c
orre
spon
ds to
H80
0
d RC
1C
ompl
ete
repo
rt on
VS p
rofil
e m
easu
rem
ents
in IT
ACA
web
site
QI1
1
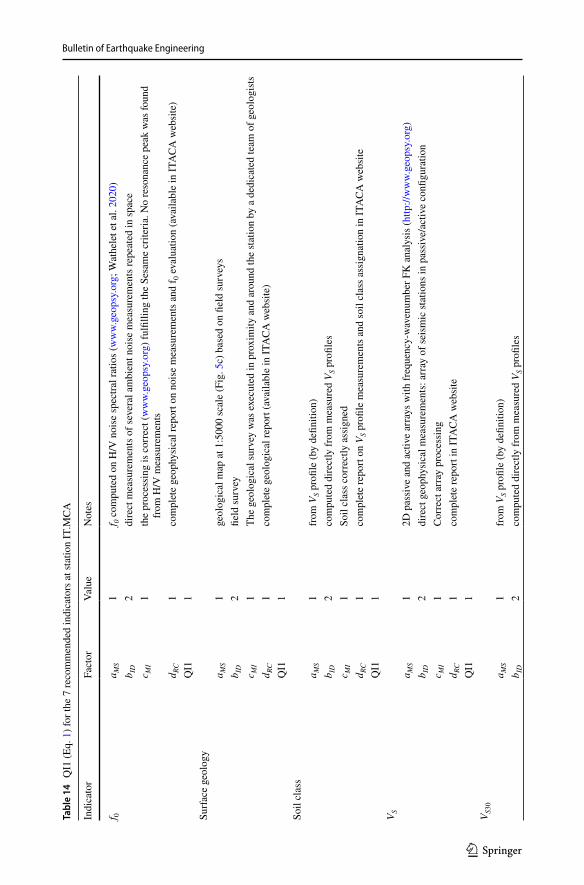
Bulletin of Earthquake Engineering
1 3
Tabl
e 14
Q
I1 (E
q. 1
) for
the
7 re
com
men
ded
indi
cato
rs a
t sta
tion
IT.M
CA
Indi
cato
rFa
ctor
Valu
eN
otes
f 0a M
S1
f 0 co
mpu
ted
on H
/V n
oise
spec
tral r
atio
s (w
ww.
geop
sy. o
rg; W
athe
let e
t al.
2020
)b I
D2
dire
ct m
easu
rem
ents
of s
ever
al a
mbi
ent n
oise
mea
sure
men
ts re
peat
ed in
spac
ec M
I1
the
proc
essi
ng is
cor
rect
(ww
w. ge
opsy
. org
) ful
fillin
g th
e Se
sam
e cr
iteria
. No
reso
nanc
e pe
ak w
as fo
und
from
H/V
mea
sure
men
tsd R
C1
com
plet
e ge
ophy
sica
l rep
ort o
n no
ise
mea
sure
men
ts a
nd f 0
eva
luat
ion
(ava
ilabl
e in
ITA
CA w
ebsi
te)
QI1
1Su
rface
geo
logy
a MS
1ge
olog
ical
map
at 1
:500
0 sc
ale
(Fig
. 5c)
bas
ed o
n fie
ld su
rvey
sb I
D2
field
surv
eyc M
I1
The
geol
ogic
al su
rvey
was
exe
cute
d in
pro
xim
ity a
nd a
roun
d th
e st
atio
n by
a d
edic
ated
team
of g
eolo
gists
d RC
1co
mpl
ete
geol
ogic
al re
port
(ava
ilabl
e in
ITA
CA w
ebsi
te)
QI1
1So
il cl
ass
a MS
1fro
m V
S pro
file
(by
defin
ition
)b I
D2
com
pute
d di
rect
ly fr
om m
easu
red
V S p
rofil
esc M
I1
Soil
clas
s cor
rect
ly a
ssig
ned
d RC
1co
mpl
ete
repo
rt on
VS p
rofil
e m
easu
rem
ents
and
soil
clas
s ass
igna
tion
in IT
ACA
web
site
QI1
1V S
a MS
12D
pas
sive
and
act
ive
arra
ys w
ith fr
eque
ncy-
wav
enum
ber F
K a
naly
sis (
http
:// w
ww.
geop
sy. o
rg)
b ID
2di
rect
geo
phys
ical
mea
sure
men
ts: a
rray
of s
eism
ic st
atio
ns in
pas
sive
/act
ive
confi
gura
tion
c MI
1C
orre
ct a
rray
pro
cess
ing
d RC
1co
mpl
ete
repo
rt in
ITA
CA w
ebsi
teQ
I11
V S30
a MS
1fro
m V
S pro
file
(by
defin
ition
)b I
D2
com
pute
d di
rect
ly fr
om m
easu
red
V S p
rofil
es
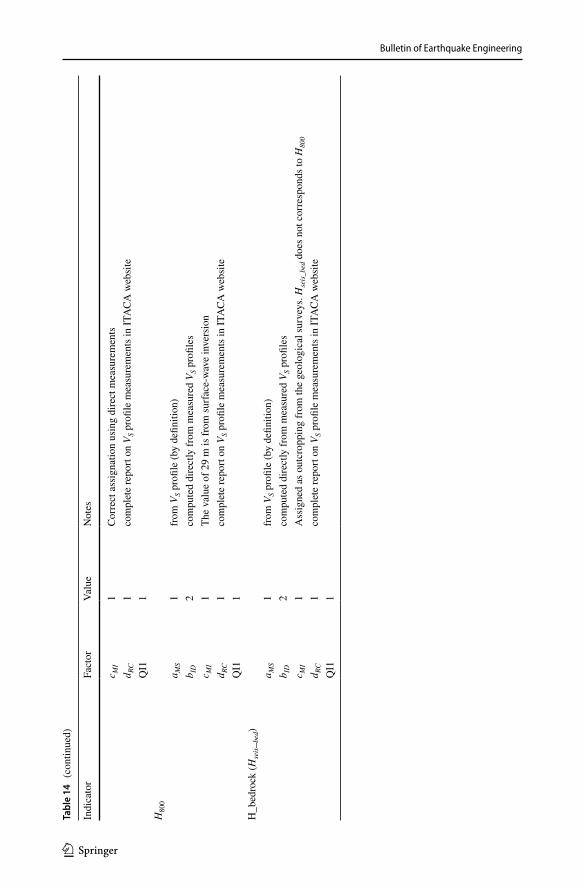
Bulletin of Earthquake Engineering
1 3
Tabl
e 14
(co
ntin
ued)
Indi
cato
rFa
ctor
Valu
eN
otes
c MI
1C
orre
ct a
ssig
natio
n us
ing
dire
ct m
easu
rem
ents
d RC
1co
mpl
ete
repo
rt on
VS p
rofil
e m
easu
rem
ents
in IT
ACA
web
site
QI1
1H
800
a MS
1fro
m V
S pro
file
(by
defin
ition
)b I
D2
com
pute
d di
rect
ly fr
om m
easu
red
V S p
rofil
esc M
I1
The
valu
e of
29
m is
from
surfa
ce-w
ave
inve
rsio
nd R
C1
com
plet
e re
port
on V
S pro
file
mea
sure
men
ts in
ITA
CA w
ebsi
teQ
I11
H_b
edro
ck (H
seis_ b
ed)
a MS
1fro
m V
S pro
file
(by
defin
ition
)b I
D2
com
pute
d di
rect
ly fr
om m
easu
red
V S p
rofil
esc M
I1
Ass
igne
d as
out
crop
ping
from
the
geol
ogic
al su
rvey
s. H
seis
_bed
doe
s not
cor
resp
onds
to H
800
d RC
1co
mpl
ete
repo
rt on
VS p
rofil
e m
easu
rem
ents
in IT
ACA
web
site
QI1
1
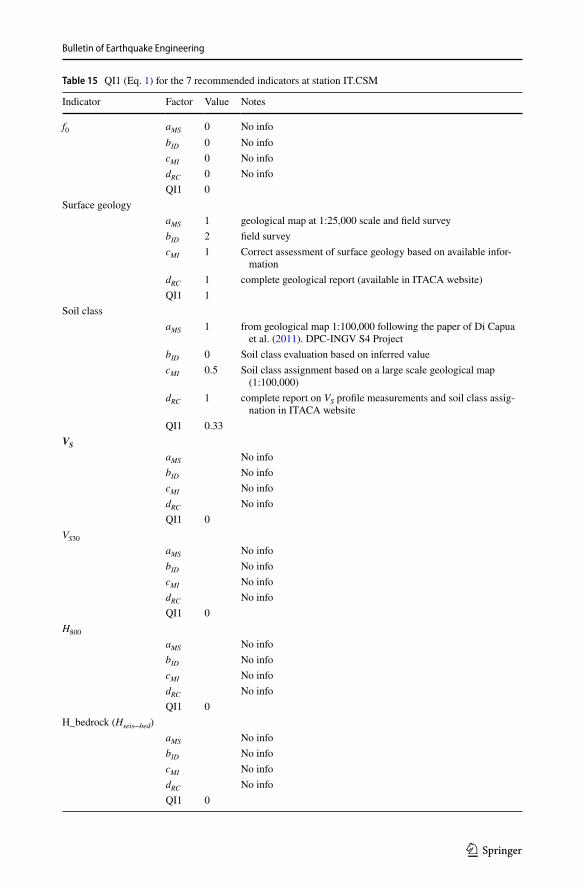
Bulletin of Earthquake Engineering
1 3
Table 15 QI1 (Eq. 1) for the 7 recommended indicators at station IT.CSM
Indicator Factor Value Notes
f0 aMS 0 No infobID 0 No infocMI 0 No infodRC 0 No infoQI1 0
Surface geologyaMS 1 geological map at 1:25,000 scale and field surveybID 2 field surveycMI 1 Correct assessment of surface geology based on available infor-
mationdRC 1 complete geological report (available in ITACA website)QI1 1
Soil classaMS 1 from geological map 1:100,000 following the paper of Di Capua
et al. (2011). DPC-INGV S4 ProjectbID 0 Soil class evaluation based on inferred valuecMI 0.5 Soil class assignment based on a large scale geological map
(1:100,000)dRC 1 complete report on VS profile measurements and soil class assig-
nation in ITACA websiteQI1 0.33
VS
aMS No infobID No infocMI No infodRC No infoQI1 0
VS30
aMS No infobID No infocMI No infodRC No infoQI1 0
H800
aMS No infobID No infocMI No infodRC No infoQI1 0
H_bedrock (Hseis_bed)aMS No infobID No infocMI No infodRC No infoQI1 0
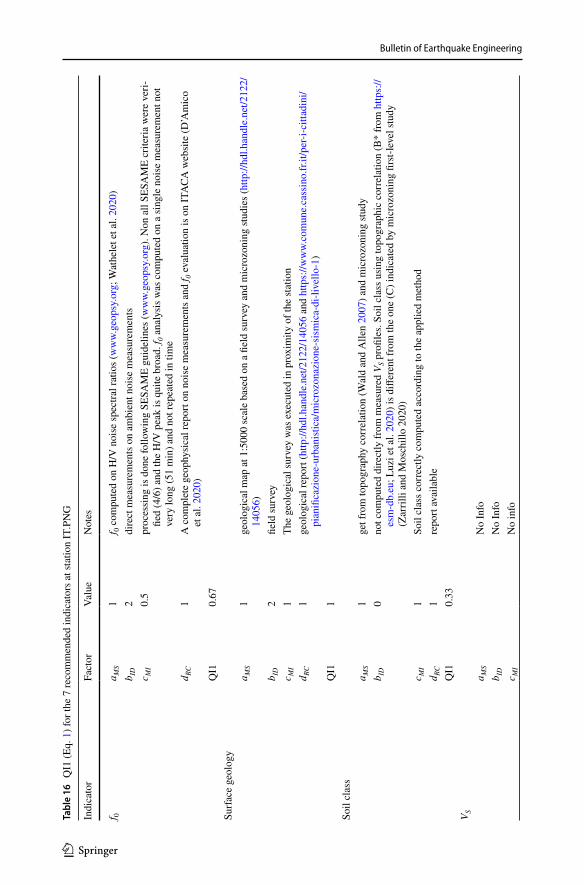
Bulletin of Earthquake Engineering
1 3
Tabl
e 16
Q
I1 (E
q. 1
) for
the
7 re
com
men
ded
indi
cato
rs a
t sta
tion
IT.P
NG
Indi
cato
rFa
ctor
Valu
eN
otes
f 0a M
S1
f 0 co
mpu
ted
on H
/V n
oise
spec
tral r
atio
s (w
ww.
geop
sy. o
rg; W
athe
let e
t al.
2020
)b I
D2
dire
ct m
easu
rem
ents
on
ambi
ent n
oise
mea
sure
men
tsc M
I0.
5pr
oces
sing
is d
one
follo
win
g SE
SAM
E gu
idel
ines
(ww
w. ge
opsy
. org
). N
on a
ll SE
SAM
E cr
iteria
wer
e ve
ri-fie
d (4
/6) a
nd th
e H
/V p
eak
is q
uite
bro
ad. f
0 ana
lysi
s was
com
pute
d on
a si
ngle
noi
se m
easu
rem
ent n
ot
very
long
(51
min
) and
not
repe
ated
in ti
me
d RC
1A
com
plet
e ge
ophy
sica
l rep
ort o
n no
ise
mea
sure
men
ts a
nd f 0
eva
luat
ion
is o
n IT
ACA
web
site
(D’A
mic
o et
al.
2020
)Q
I10.
67Su
rface
geo
logy
a MS
1ge
olog
ical
map
at 1
:500
0 sc
ale
base
d on
a fi
eld
surv
ey a
nd m
icro
zoni
ng st
udie
s (ht
tp://
hdl. h
andl
e. ne
t/ 212
2/
1405
6)b I
D2
field
surv
eyc M
I1
The
geol
ogic
al su
rvey
was
exe
cute
d in
pro
xim
ity o
f the
stat
ion
d RC
1ge
olog
ical
repo
rt (h
ttp://
hdl. h
andl
e. ne
t/ 212
2/ 14
056
and
http
s:// w
ww.
com
une.
cass
i no.
fr. it/
per-i
- citt
a din
i/ pi
ani fi
caz i
one-
urba
n isti
ca/ m
icro
zona
z ion
e- si
smi c
a- di
- live
l lo-1
)Q
I11
Soil
clas
sa M
S1
get f
rom
topo
grap
hy c
orre
latio
n (W
ald
and
Alle
n 20
07) a
nd m
icro
zoni
ng st
udy
b ID
0no
t com
pute
d di
rect
ly fr
om m
easu
red
V S p
rofil
es. S
oil c
lass
usi
ng to
pogr
aphi
c co
rrel
atio
n (B
* fro
m h
ttps:
// es
m- d
b. eu
; Luz
i et a
l. 20
20) i
s diff
eren
t fro
m th
e on
e (C
) ind
icat
ed b
y m
icro
zoni
ng fi
rst-l
evel
stud
y (Z
arril
li an
d M
osch
illo
2020
)c M
I1
Soil
clas
s cor
rect
ly c
ompu
ted
acco
rdin
g to
the
appl
ied
met
hod
d RC
1re
port
avai
labl
eQ
I10.
33V S
a MS
No
Info
b ID
No
Info
c MI
No
info
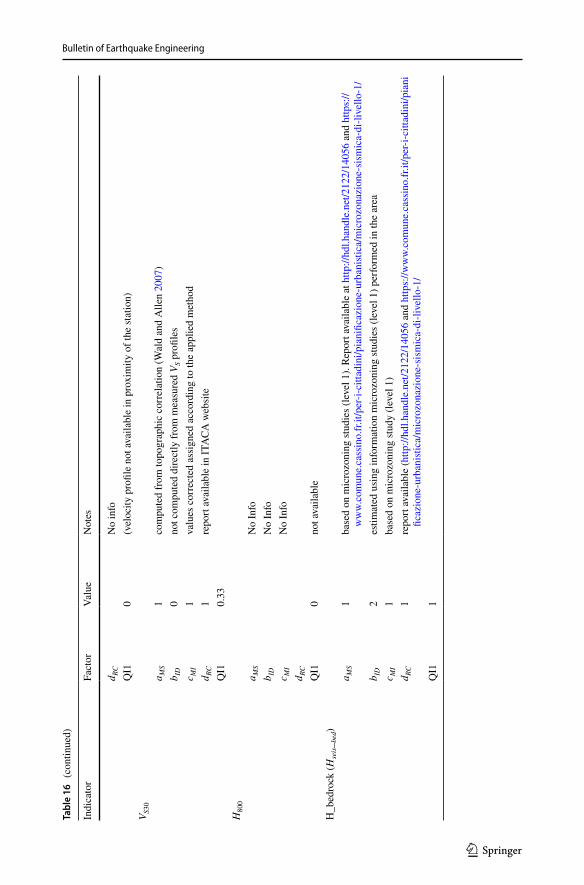
Bulletin of Earthquake Engineering
1 3
Tabl
e 16
(co
ntin
ued)
Indi
cato
rFa
ctor
Valu
eN
otes
d RC
No
info
QI1
0(v
eloc
ity p
rofil
e no
t ava
ilabl
e in
pro
xim
ity o
f the
stat
ion)
V S30
a MS
1co
mpu
ted
from
topo
grap
hic
corr
elat
ion
(Wal
d an
d A
llen
2007
)b I
D0
not c
ompu
ted
dire
ctly
from
mea
sure
d V S
pro
files
c MI
1va
lues
cor
rect
ed a
ssig
ned
acco
rdin
g to
the
appl
ied
met
hod
d RC
1re
port
avai
labl
e in
ITA
CA w
ebsi
teQ
I10.
33H
800
a MS
No
Info
b ID
No
Info
c MI
No
Info
d RC
QI1
0no
t ava
ilabl
eH
_bed
rock
(Hse
is_ b
ed)
a MS
1ba
sed
on m
icro
zoni
ng st
udie
s (le
vel 1
). Re
port
avai
labl
e at
http
:// hd
l. han
dle.
net/ 2
122/
1405
6 an
d ht
tps:
// w
ww.
com
une.
cass
i no.
fr. it/
per-i
- citt
a din
i/ pia
ni fic
az io
ne- u
rban
istic
a/ m
icro
zona
z ion
e- si
smi c
a- di
- live
l lo-1
/b I
D2
estim
ated
usi
ng in
form
atio
n m
icro
zoni
ng st
udie
s (le
vel 1
) per
form
ed in
the
area
c MI
1ba
sed
on m
icro
zoni
ng st
udy
(leve
l 1)
d RC
1re
port
avai
labl
e (h
ttp://
hdl. h
andl
e. ne
t/ 212
2/ 14
056
and
http
s:// w
ww.
com
une.
cass
i no.
fr. it/
per-i
- citt
a din
i/ pia
ni
ficaz
ione
- urb
an ist
ica/
mic
ro zo
naz i
one-
sism
i ca-
di- li
vel lo
-1/
QI1
1
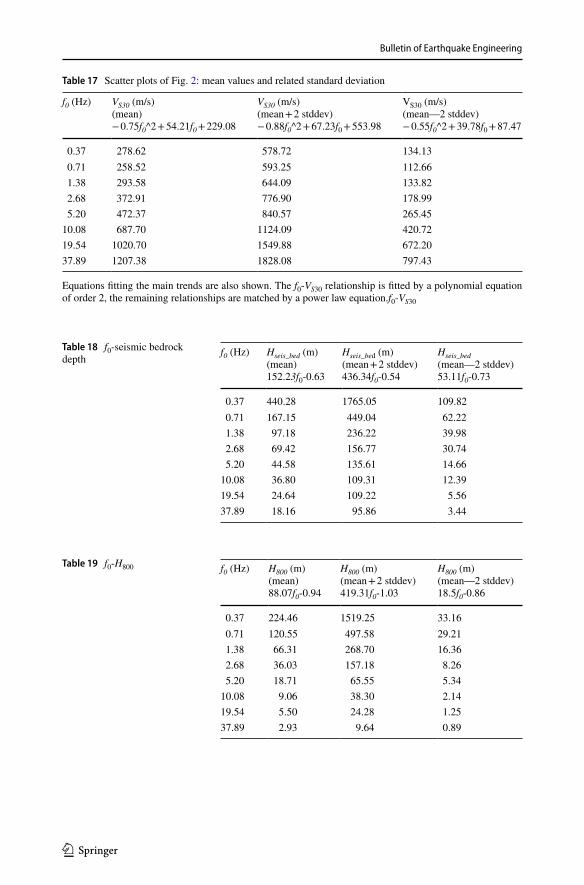
Bulletin of Earthquake Engineering
1 3
Table 17 Scatter plots of Fig. 2: mean values and related standard deviation
Equations fitting the main trends are also shown. The f0-VS30 relationship is fitted by a polynomial equation of order 2, the remaining relationships are matched by a power law equation.f0-VS30
f0 (Hz) VS30 (m/s) (mean)− 0.75f0^2 + 54.21f0 + 229.08
VS30 (m/s) (mean + 2 stddev)− 0.88f0^2 + 67.23f0 + 553.98
VS30 (m/s) (mean—2 stddev)− 0.55f0^2 + 39.78f0 + 87.47
0.37 278.62 578.72 134.130.71 258.52 593.25 112.661.38 293.58 644.09 133.822.68 372.91 776.90 178.995.20 472.37 840.57 265.45
10.08 687.70 1124.09 420.7219.54 1020.70 1549.88 672.2037.89 1207.38 1828.08 797.43
Table 18 f0-seismic bedrock depth
f0 (Hz) Hseis_bed (m) (mean)152.23f0-0.63
Hseis_bed (m) (mean + 2 stddev)436.34f0-0.54
Hseis_bed (mean—2 stddev)53.11f0-0.73
0.37 440.28 1765.05 109.820.71 167.15 449.04 62.221.38 97.18 236.22 39.982.68 69.42 156.77 30.745.20 44.58 135.61 14.66
10.08 36.80 109.31 12.3919.54 24.64 109.22 5.5637.89 18.16 95.86 3.44
Table 19 f0-H800 f0 (Hz) H800 (m) (mean)88.07f0-0.94
H800 (m) (mean + 2 stddev)419.31f0-1.03
H800 (m) (mean—2 stddev)18.5f0-0.86
0.37 224.46 1519.25 33.160.71 120.55 497.58 29.211.38 66.31 268.70 16.362.68 36.03 157.18 8.265.20 18.71 65.55 5.34
10.08 9.06 38.30 2.1419.54 5.50 24.28 1.2537.89 2.93 9.64 0.89
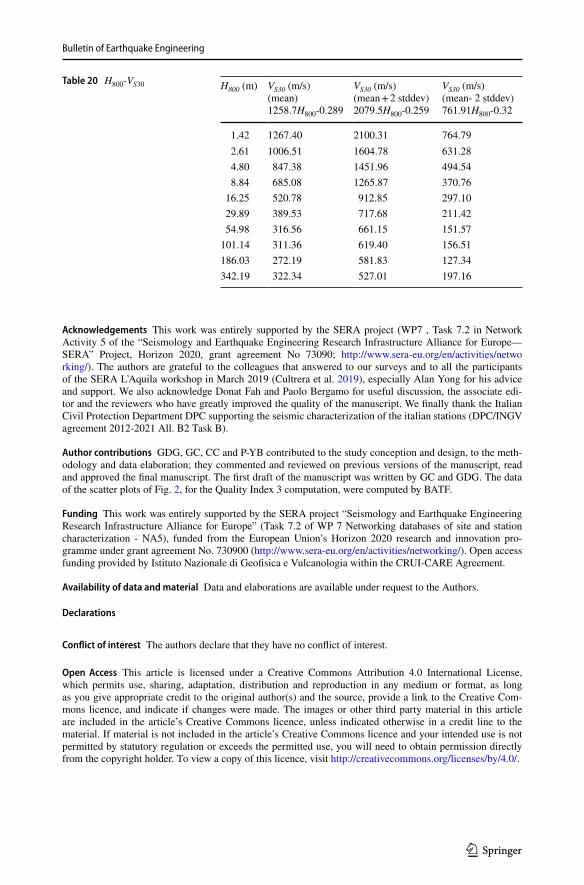
Bulletin of Earthquake Engineering
1 3
Acknowledgements This work was entirely supported by the SERA project (WP7 , Task 7.2 in Network Activity 5 of the “Seismology and Earthquake Engineering Research Infrastructure Alliance for Europe—SERA” Project, Horizon 2020, grant agreement No 73090; http:// www. sera- eu. org/ en/ activ ities/ netwo rking/). The authors are grateful to the colleagues that answered to our surveys and to all the participants of the SERA L’Aquila workshop in March 2019 (Cultrera et al. 2019), especially Alan Yong for his advice and support. We also acknowledge Donat Fah and Paolo Bergamo for useful discussion, the associate edi-tor and the reviewers who have greatly improved the quality of the manuscript. We finally thank the Italian Civil Protection Department DPC supporting the seismic characterization of the italian stations (DPC/INGV agreement 2012-2021 All. B2 Task B).
Author contributions GDG, GC, CC and P-YB contributed to the study conception and design, to the meth-odology and data elaboration; they commented and reviewed on previous versions of the manuscript, read and approved the final manuscript. The first draft of the manuscript was written by GC and GDG. The data of the scatter plots of Fig. 2, for the Quality Index 3 computation, were computed by BATF.
Funding This work was entirely supported by the SERA project “Seismology and Earthquake Engineering Research Infrastructure Alliance for Europe” (Task 7.2 of WP 7 Networking databases of site and station characterization - NA5), funded from the European Union’s Horizon 2020 research and innovation pro-gramme under grant agreement No. 730900 (http:// www. sera- eu. org/ en/ activ ities/ netwo rking/). Open access funding provided by Istituto Nazionale di Geofisica e Vulcanologia within the CRUI-CARE Agreement.
Availability of data and material Data and elaborations are available under request to the Authors.
Declarations
Conflict of interest The authors declare that they have no conflict of interest.
Open Access This article is licensed under a Creative Commons Attribution 4.0 International License, which permits use, sharing, adaptation, distribution and reproduction in any medium or format, as long as you give appropriate credit to the original author(s) and the source, provide a link to the Creative Com-mons licence, and indicate if changes were made. The images or other third party material in this article are included in the article’s Creative Commons licence, unless indicated otherwise in a credit line to the material. If material is not included in the article’s Creative Commons licence and your intended use is not permitted by statutory regulation or exceeds the permitted use, you will need to obtain permission directly from the copyright holder. To view a copy of this licence, visit http:// creat iveco mmons. org/ licen ses/ by/4. 0/.
Table 20 H800-VS30 H800 (m) VS30 (m/s) (mean)1258.7H800-0.289
VS30 (m/s) (mean + 2 stddev)2079.5H800-0.259
VS30 (m/s) (mean- 2 stddev)761.91H800-0.32
1.42 1267.40 2100.31 764.792.61 1006.51 1604.78 631.284.80 847.38 1451.96 494.548.84 685.08 1265.87 370.76
16.25 520.78 912.85 297.1029.89 389.53 717.68 211.4254.98 316.56 661.15 151.57
101.14 311.36 619.40 156.51186.03 272.19 581.83 127.34342.19 322.34 527.01 197.16
Bulletin of Earthquake Engineering
1 3
References
Abrahamson NA (2006) Seismic hazard assessment: problems with current practice and future develop-ments. In First European conference on earthquake engineering and seismology, pp. 3–8
Ahdi SK, Stewart JP, Ancheta TD, Kwak DY, Mitra D (2017) Development of VS profile database and proxy-based models for VS30 prediction in the Pacific northwest region of North America. Bull Seis-mol Soc Am 107(4):1781–1801
Akkar S, Bommer JJ (2007) Empirical prediction equations for peak ground velocity derived from strong-motion records from Europe and the Middle East. Bull Seismol Soc Am 97(2):511–530
Akkar S, Çağnan Z, Yenier E, Erdoğan Ö, Sandıkkaya MA, Gülkan P (2010) The recently compiled Turk-ish strong motion database: preliminary investigation for seismological parameters. J Seismolog 14(3):457–479
Albarello D, Gargani F (2010) Providing NEHRP soil classification from the direct interpretation of effec-tive Rayleigh waves dispersion curves. Bull Seismol Soc Am 100:3284–3294
Amanti M, Muraro C, Roma M, Chiessi V, Puzzilli LM, Catalano S, Romagnoli G, Tortorici G, Cavuoto G, Albarello D, Fantozzi PL (2020) Geological and geotechnical models definition for 3rd level seismic microzonation studies in Central Italy. Bull Earthq Eng 18:1–33. https:// doi. org/ 10. 1007/ s10518- 020- 00843-x
Anbazhagan P, Kumar A, Sitharam TG (2013) Seismic site classification and correlation between standard penetration test N value and shear wave velocity for Lucknow City in Indo-Gangetic Basin. Pure Appl Geophys 170(3):299–318
Ancheta TD, Darragh RB, Stewart JP, Seyhan E, Silva WJ, Chiou BSJ, Wooddell KE, Graves RW, Kottke AR, Boore DM, Kishida T, Donahue JR (2014) NGA-West2 database. Earthq Spectra 30(3):989–1005
Archuleta RJ, Steidl J, Squibb M (2006) The COSMOS virtual data center: a web portal for strong motion data dissemination. Seismol Res Lett 77(6):651–658
Asten MW, Hayashi K (2018) Application of the spatial auto-correlation method for shear-wave velocity studies using ambient noise. Surv Geophys 39:633
ASTM D7400M-08 Standard Test Methods for Downhole Seismic Testing (2008) ASTM International, December 2008
ASTM D4428M-00 Standard Test Methods for Crosshole Seismic Testing (2000) ASTM International, March 2000
Bard PY, Cadet H, Endrun B, Hobiger M, Renalier F, Theodulidis N, Ohrnberger M, Fäh D, Sabetta F, Teves-Costa P, Duval AM (2010) From non-invasive site characterization to site amplification: recent advances in the use of ambient vibration measurements. In: Garevski M, Ansal A (eds) Earthquake Engineering in Europe. Springer, Dordrecht, pp 105–23
Bergamo P, Hammer C, Fäh D (2019) D7.4. Towards improvement of site characterization indicators, Work package WP7/NA5: networking databases of site and station characterization, SERA EU Project (Seismology and Earthquake Engineering Research Infrastructure Alliance for Europe; Horizon 2020, grant agreement No 730900). Available at available on http:// www. sera- eu. org/ it/ Disse minat ion/ deliv erabl es/ (last access April 2021)
Bergamo P, Hammer C, Fäh D (2021) On the relation between empirical amplification and proxies meas-ured at Swiss and Japanese stations: systematic regression analysis and neural network prediction of amplification. Bull Seismol Soc Am 111(1):101–120. https:// doi. org/ 10. 1785/ 01202 00228
Bindi D, Pacor F, Luzi L, Puglia R, Massa M, Ameri G, Paolucci R (2011) Ground motion prediction equa-tions derived from the Italian strong motion database. Bull Earthq Eng 9(6):1899–1920
Bindi D, Spallarossa D, Pacor F (2017) Between-event and between-station variability observed in the Fourier and response spectra domains: comparison with seismological models. Geophys J Int 210(2):1092–1104
Bonomo R, D’Ambrogi C, D’Orefice M, Di Manna PF, Fiorenza D, Gafà RM, Monti GM, Roma M, Vita L (2017) Development of a conceptual geological model for five seismic stations with accelerometer of the INGV seismic network. Scientific technical cooperation ISPRA-INGV
Boore DM, Stewart JP, Seyhan E, Atkinson GM (2014) NGA-West2 equations for predicting PGA, PGV, and 5% damped PSA for shallow crustal earthquakes. Earthq Spectra 30:1057–1085
Boore DM, Thompson EM, Cadet H (2011) Regional correlations of VS30 and velocities averaged over depths less than and greater than 30 meters. Bull Seismol Soc Am 101(6):3046–3059
Bordoni P, Pacor F, Casale P, Cultrera G, Cara F, Di Giulio G, Famiani D, Ladina C, Pischiutta M, Quintil-iani M, and the Site Character Team (2017) Site characterization of the national seismic network of Italy. European Geosciences Union (EGU) General Assembly, Vienna, Austria, April 2017. In EGU 2017 General Assembly Abstracts (Vol. 19, p. 18604)
Bulletin of Earthquake Engineering
1 3
Bozorgnia Y, Abrahamson NA, Atik LA, Ancheta TD, Atkinson GM, Baker JW, Baltay A, Boore DM, Campbell KW, Chiou BSJ, Darragh R (2014) NGA-West2 research project. Earthq Spectra 30(3):973–987
Campbell KW, Bozorgnia Y (2014) NGA-West2 ground motion model for the average horizontal com-ponents of PGA, PGV, and 5% damped linear acceleration response spectra. Earthq Spectra 30(3):1087–1115
Campillo M, Cotton F, Zollo A, Tilmann F, Rietbrock A,Fayjaloun R, Krawczyk C et al. (2019) D4.7 Strate-gies for future network design, Work package WP7/NA5: networking databases of site and station characterization, SERA EU Project (Seismology and Earthquake Engineering Research Infrastruc-ture Alliance for Europe; Horizon 2020, grant agreement No 730900). Submission date 31.10.2019. SERA deliverable. Available at http:// www. sera- eu. org/ en/ Disse minat ion/ deliv erabl es/ (last access April 2021)
Cauzzi C, Sleeman R, Clinton J, Ballesta JD, Galanis O, Kästli P (2016) Introducing the European rapid raw strong-motion database. Seismol Res Lett 87(4):977–986
CEN. Eurocode 8 (2004) Design of structures for earthquake resistance –part 1: general rules, seismic actions and rules for buildings, European Standard EN 1998-1:2004
Cercato M, Desideri FS, Pugliese F (2018) “Risultati delle prove geofisiche in foro di tipo Down-Hole (DH)” Sede INGV - Via di Vigna Murata 605 (RM). DICEA- Univ. La Sapienza (Agreement DPC-INGV 2018, All. B2: Obiettivo 1 - TASKB)
Chakravarthi V, Sundararajan N (2007) 3D gravity inversion of basement relief. A Depth-Depend Density Approach Geophys 72(2):I23–I32
Chiou BSJ, Youngs RR (2008) An NGA model for the average horizontal component of peak ground motion and response spectra. Earthq Spectra 24:173–215
Chiou BSJ, Darragh R, Gregor N, Silva W (2008) NGA Project Strong-Motion Database Earthq Spectra 24(1):23–44
Convertito V, De Matteis R, Cantore L, Zollo A, Iannaccone G, Caccavale M (2010) Rapid estimation of ground-shaking maps for seismic emergency management in the Campania Region of southern Italy. Nat Hazards 52(1):97
Cornou C, Pequegnat C, Maufroy E (2020) D7.5 Validation of pre-operational access phase to selected site and station characterization dataset, Work package WP7/NA5: networking databases of site and station characterization, SERA EU Project (Seismology and Earthquake Engineering Research Infrastructure Alliance for Europe; Horizon 2020, grant agreement No 730900). Submission date 30.04.2020. SERA deliverable. Available at http:// www. sera- eu. org/ en/ Disse minat ion/ deliv erabl es/ (last access April 2021)
Cox BR, Cheng T, Vantassel JP, Manuel L (2020) A statistical representation and frequency-domain win-dow-rejection algorithm for single-station HVSR measurements. Geophys J Int 221(3):2170–2183
Cultrera G, Bordoni P, Casale P, Cara F, Di Giulio G, Famiani D, Ladina C, Pischiutta M, Quintiliani M, Pacor F and Site Characterization Team (2018) Site characterization database of INGV Italian seis-mic network. S34 - Developments in Strong Motion Seismology, a COSMOS Session. ESC-S34–872. The European Seismological Commission ESC2018 36th General Assembly, 2–7 Sept. 2018, La Val-letta, Malta
Cultrera G, Cornou C, Di Giulio G, Bard P-Y (2021) Indicators for site characterization at seismic station: recommendation from a dedicated survey. Bull Earthq Eng. https:// doi. org/ 10. 1007/ s10518- 021- 01136-7
Cultrera G, Di Giulio G, Cornou C, Bard P-Y (2019) SERA workshop on Strong-motion site charac-terization (L’Aquila, Italy). Website: https:// sites. google. com/ view/ site- chara cteri zation- works hop/ home; March 2019; handle: http:// hdl. handle. net/ 2122/ 14700
D’Amico M, Felicetta C, Russo E, Sgobba S, Lanzano G, Pacor F, Luzi L (2020) Italian Accelerometric Archive v 3.1–Istituto Nazionale di Geofisica e Vulcanologia, Dipartimento della Protezione Civ-ile Nazionale. doi: https:// doi. org/ 10. 13127/ itaca.3.1
Dai Z, Li X, Hou C (2013) A shear-wave velocity model for VS30 estimation based on a conditional independence property. Bull Seismol Soc Am 103(6):3354–3361
Darko AB, Molnar S, Sadrekarimi A (2020) Blind comparison of non-invasive shear wave velocity profiling with invasive methods at bridge sites in Windsor, Ontario. Soil Dyn Earthq Eng 129, p.105906
Derras B, Bard PY, Cotton F (2016) Site-conditions proxies, ground-motion variability and data-driven GMPEs. Insights from NGA-West 2 and RESORCE datasets. Earthq Spectra 32(4):2027–2056
Bulletin of Earthquake Engineering
1 3
Derras B, Bard PY, Cotton F (2017) VS30, slope, H800 and f0: performance of various site-condition proxies in reducing ground-motion aleatory variability and predicting nonlinear site response. Earth Planets Space 69:133
Di Capua G, Lanzo G, Pessina V, Peppoloni S, Scasserra G (2011) The recording stations of the Italian strong motion network: geological information and site classification. Bull Earthq Eng 9:1779–1796. https:// doi. org/ 10. 1007/ s10518- 011- 9326-7
Di Giulio G, Bordoni P, Cultrera G, Milana G, Vassallo M (2018) VS profile derived from surface-wave and down-hole methods: comparison at some case studies in Central Italy, 36th General Assembly of the European Seismological Commission, 2–7 September 2018, La Valletta, Malta
Di Giulio G, Cultrera G, Cornou C, Bard PY, Al Tfaily B (2019) D7.2–best practice and quality assess-ment guidelines for site characterization. Work package WP7: networking databases of site and station characterization. Submission date 18.04.2019. Available on http:// www. sera- eu. org/ it/ Disse minat ion/ deliv erabl es/ (last access April 2021)
Dikmen Ü (2009) Statistical correlations of shear wave velocity and penetration resistance for soils. J Geophys Eng 6(1):61–72
Dobry R, Oweis I, Urzua A (1976) Simplified procedure for estimating the fundamental period of a soil profile. Bull Seismol Soc Am 66(4):1293–1321
Douglas J (2003) Earthquake ground motion estimation using strong-motion records: a review of equa-tions for the estimation of peak ground acceleration and response spectral ordinates. Earth Sci Rev 61(1–2):43–104
Ducellier A, Kawase H, Matsushima S (2013) Validation of a new velocity structure inversion method based on horizontal-to-vertical (H/V) spectral ratios of earthquake motions in the Tohoku area. Japan Bull Seismol Soc Am 103(2A):958–970
Fäh D, Poggi V, Marano S, Michel C, Burjanek J, et al. (2010) Guidelines for the implementation of ambient vibration array techniques: measurement, processing and interpretation. Neries deliverable JRA4-D9
Felicetta C, D’Amico M, Lanzano G, Puglia R, Russo E, Luzi L (2017) Site characterization of Italian accelerometric stations. Bull Earthq Eng 15(6):2329–2348
Field EH, Jacob KH (1995) A comparison and test of various site-response estimation techniques, including three that are not reference-site dependent. Bull Seismol Soc Am 85:1127–1143
Forte G, Chioccarelli E, De Falco M, Cito P, Santo A, Iervolino I (2019) Seismic soil classification of Italy based on surface geology and shear-wave velocity measurements. Soil Dyn Earthq Eng 122:79–93
Foti S, Parolai S, Albarello D, Picozzi M (2011) Application of surface-wave methods for seismic site characterization. Surv Geophys 32(6):777–825
Foti S, Hollender F, Garofalo F, Albarello D, Asten M, Bard PY et al (2018) Guidelines for the good practice of surface wave analysis: a product of the InterPACIFIC project. Bull Earthq Eng 16(6):2367–2420. https:// doi. org/ 10. 1007/ s10518- 017- 0206-7
Garofalo F, Foti S, Hollender F et al (2016) InterPACIFIC project: comparison of invasive and non-inva-sive methods for seismic site characterization. Part I: intra-comparison of surface wave methods. Soil Dyn Earthq Eng 82:220–240
Gee LS, Leith WS (2011) The global seismographic network: U.S. Geological Survey Fact Sheet 2011–3021, p. 2
Haghshenas E, Bard PY, Theodulidis N, SESAME WP04 Team (2008) Empirical evaluation of microtremor H/V spectral ratio. Bull Earthquake Eng 6:75–108. https:// doi. org/ 10. 1007/ s10518- 007- 9058-
Hassani B, Atkinson GM (2016) Applicability of the site fundamental frequency as a VS30 proxy for central and eastern North America. Bull Seismol Soc Am 106(2):653–664
Hetényi G, Molinari I, Clinton J, Bokelmann G, Bondár I, Crawfor WC, Dessa J-X, Doubre C, Friederich W, Fuchs F, Giardini D, Gráczer Z, Handy MR, Herak M, Jia Y, Kissling E, Kopp H, Korn M, Mar-gheriti L, Meier T, Mucciarelli M, Paul A, Pesaresi D, Piromallo C, Plenefisch T, Plomerová J, Ritter J, Rümpker G, Šipka V, Spallarossa D, Thomas C, Tilmann F, Wassermann J, Weber M, Wéber Z, Wesztergom V, Živčić M (2018) The AlpArray seismic network: a large-scale European experiment to image the alpine orogen. Surv Geophys 39(5):1009–1033
Hobiger M, Bard PY, Cornou C, Le Bihan N (2009) Single station determination of Rayleigh wave elliptic-ity by using the random decrement technique (RayDec). Geophys Res Lett. https:// doi. org/ 10. 1029/ 2009G L0388 63
Hollender F, Cornou C, Dechamp A, Oghalaei K, Renalier F, Maufroy E, Burnouf C, Thomassin S, Wathe-let M, Bard PY, Boutin V (2018) Characterization of site conditions (soil class, V S30, velocity pro-files) for 33 stations from the French permanent accelerometric network (RAP) using surface-wave methods. Bull Earthq Eng 16(6):2337–2365
Bulletin of Earthquake Engineering
1 3
Hunter JA, Crow HL (ed.), (2012) Shear wave velocity measurement guidelines for Canadian seismic site characterization in soil and rock. Geological survey of Canada, Open File 7078, p. 227, doi:https:// doi. org/ 10. 4095/ 291753
Ibs-von Seht M, Wohlenberg J (1999) Microtremor measurements used to map thickness of soft sediments. Bull Seismol Soc Am 89(1):250–259
Kamai R, Abrahamson NA, Silva WJ (2016) VS30 in the NGA GMPEs: regional differences and suggested practice. Earthq Spectra 32(4):2083–2108
Knapmeyer-Endrun B, Golombek MP, Ohrnberger M (2017) Rayleigh wave ellipticity modeling and inver-sion for shallow structure at the proposed InSight landing site in Elysium Planitia. Mars Space Sci Revs 211(1–4):339–382
Kuo CH, Wen KL, Hsieh HH, Chang TM, Lin CM, Chen CT (2011) Evaluating empirical regression equa-tions for Vs and estimating Vs30 in northeastern Taiwan. Soil Dyn Earthq Eng 31(3):431–439
Kwak DY, Ancheta TD, Mitra D, Ahdi SK, Zimmaro P, Parker GA, Brandenberg SJ, Stewart JP (2017) Performance evaluation of VSZ-to-VS30 correlation methods using global VS profile database. In Proceedings Third international conference on performance-based design in earthquake geotechnical engineering.
Lanzano G, Felicetta C, Pacor F, Spallarossa D, Traversa P (2020) Methodology to identify the reference rock sites in regions of medium-to-high seismicity: an application in Central Italy. Geophys J Int 222(3):2053–2067. https:// doi. org/ 10. 1093/ gji/ ggaa2 61
Lemoine A, Douglas J, Cotton F (2012) Testing the applicability of correlations between topographic slope and vs30 for Europe. Bull Seismol Soc Am 102(6):2585–2599
Luzi L., Lanzano G., Felicetta C., D’Amico M. C., Russo E., Sgobba S., Pacor, F., & ORFEUS Working Group 5 (2020) Engineering strong motion database (ESM) (Version 2.0). Istituto Nazionale di Geofi-sica e Vulcanologia (INGV). https:// doi. org/ 10. 13127/ ESM.2
Luzi L, Puglia R, Russo E, D’Amico M, Felicetta C, Pacor F, Lanzano G, Çeken U, Clinton J, Costa G, Duni L (2016) The engineering strong-motion database: a platform to access pan-European accelerometric data. Seismol Res Lett 87(4):987–997
Marcucci S, Milana G, Hailemikael S, Carlucci G, Cara F, Di Giulio G, Vassallo M (2019) The deep bed-rock in Rome, Italy: a new constraint based on passive seismic data analysis. Pure Appl Geophys 176(6):2395–2410
Martin, AJ, Diehl JG (2004) Practical experience using a simplified procedure to measure average shear-wave velocity to a depth of 30 meters (VS30). In The 13th world conference on earthquake engineer-ing. Tokyo: International Association for Earthquake Engineering
Michel C, Edwards B, Poggi V, Burjánek J, Roten D, Cauzzi C, Fäh D (2014) Assessment of site effects in alpine regions through systematic site characterization of seismic stations. Bull Seismol Soc Am 104(6):2809–2826
Mital U, Ahdi S, Herrick J, Iwahashi J, Savvaidis A, Yong A (2021) A probabilistic framework to model distributions of VS30. Bull Seismol Soc Am. https:// doi. org/ 10. 1785/ 01202 00281
Molnar S et al (2018) Application of microtremor horizontal-to-vertical spectral ratio (mhvsr) analysis for site characterization: state of the art. Surv Geophys 39:613
Nakamura Y (1989) A method for dynamic characteristics estimation of subsurface using microtremor on the ground surface. QR of RTRI 30(1):25–33
Pagliaroli A, Lanzo G, Tommasi P, Di Fiore V (2014) Dynamic characterization of soils and soft rocks of the Central Archeological Area of Rome. Bull Earthq Eng 12(3):1365–1381
Park S, Elrick S (1998) Predictions of shear-wave velocities in southern California using surface geol-ogy. Bull Seismol Soc Am 88:677–685
Parker GA, Harmon JA, Stewart JP, Hashash YM, Kottke AR, Rathje EM, Silva WJ, Campbell KW (2017) Proxy-based VS30 estimation in central and eastern North America. Bull Seismol Soc Am 107(1):117–31
Passeri F, Comina C, Foti S, Socco LV (2021) The Polito surface wave flat-file database (PSWD): sta-tistical properties of test results and some inter-method comparisons. Bull Earthq Eng 16:1–28. https:// doi. org/ 10. 1007/ s10518- 021- 01069-1
Picozzi M, Parolai S, Albarello D (2005) Statistical analysis of noise horizontal-to-vertical spectral ratios (HVSR). Bull Seismol Soc Am 95(5):1779–1786
Pilz M, Cotton F (2019) Does the one-dimensional assumption hold for site response analysis? A study of seismic site responses and implication for ground motion assessment using KiK-Net strong-motion data. Earthq Spectra 35(2):883–905
Pilz M, Cotton F, Kotha SR (2020) Data-driven and machine learning identification of seismic reference stations in Europe. Geophys J Int 222(2):861–873
Bulletin of Earthquake Engineering
1 3
Piña-Flores J, Perton M, García-Jerez A, Carmona E, Luzón F, Molina-Villegas JC, Sánchez-Sesma FJ (2017) The inversion of spectral ratio H/V in a layered system using the diffuse field assumption (DFA). Geophys J Int 208(1):577–588. https:// doi. org/ 10. 1093/ gji/ ggw416
Pitilakis K, Riga E, Anastasiadis A, Liakakis K, Roumelioti Z (2018) EGD. The european geotechnical database. 36th general assembly of the european seismological commission, ESC2018-S2–788, 2–7 September 2018, La Valletta, Malta
Priolo E, Pacor F, Spallarossa D, Milana G, Laurenzano G, Romano MA, Felicetta C, Hailemikael S, Cara F, Di Giulio G, Ferretti G (2019) Seismological analyses of the seismic microzonation of 138 municipalities damaged by the 2016–2017 seismic sequence in Central Italy. Bull Earthq Eng. https:// doi. org/ 10. 1007/ s10518- 019- 00652-x
Régnier J, Bonilla LF, Bertrand E, Semblat JF (2014) Influence of the VS profiles beyond 30 m depth on linear site effects: assessment from the KiK-net data. Bull Seism Soc Am 104(5):2337–2348
Régnier J, Cadet H, Bonilla LF, Bertrand E, Semblat JF (2013) Assessing nonlinear behavior of soils in seismic site response: statistical analysis on KiK-net strong-motion data. Bull Seismol Soc Am 103(3):1750–1770
Roca A, Gueguen P, Godey S, Goula X, Susagna T, Péquegnat C, Oliveira CS, Clinton J, Pappaioanou C, Zülfikar C (2011) The European-mediterranean distributed accelerometric data-Base. In: Akkar Sinan, Gülkan Polat, van Eck Torild (eds) Earthquake data in engineering seismology. Springer, Dordrecht, pp 115–128
Rodriguez-Marek A, Rathje EM, Bommer JJ, Scherbaum F, Stafford PJ (2014) Application of single-station sigma and site-response characterization in a probabilistic seismic-hazard analysis for a new nuclear site. Bull Seismol Soc Am 104(4):1601–1619
Saroli M, Albano M, Modoni G, Moro M, Milana G, Spacagna RL, Falcucci E, Gori S, Mugnozza GS (2020) Insights into bedrock paleomorphology and linear dynamic soil properties of the Cassino intermontane basin (Central Italy). Eng Geol 264:105333. https:// doi. org/ 10. 1016/j. enggeo. 2019. 105333
SESAME (2004) Guidelines for the Implementation of the H/V spectral ratio technique on ambient vibrations—Measurements, processing and interpretation. ESAME European research project WP12 – Deliverable D23.12, European Commission – Research General Directorate Project No. EVG1-CT-2000–00026 SESAME. Available at http:// sesame. geopsy. org/ SES_ Repor ts. htm (last access April 2021)
Socco LV, Strobbia C (2004) Surface wave methods for near-surface characterisation: a tutorial. Near Surf Geophys 2(4):165–185
Spearman C (1904) The proof and measurement of association between two things. Am J Psychol 15:72–101
Stambouli AB, Zendagui D, Bard PY, Derras B (2017) Deriving amplification factors from simple site parameters using generalized regression neural networks: implications for relevant site proxies. Earth Planets Space 69:99
Stephenson WJ, Louie JN, Pullammanappallil S, Williams RA, Odum JK (2005) Blind shear-wave velocity comparison of ReMi and MASW results with boreholes to 200 m in Santa Clara Valley: implications for earthquake ground-motion assessment. Bull Seismol Soc Am 95:2506–2516
Stewart JP, Klimis N, Savvaidis A, Theodoulidis N, Zargli E et al (2014) Compilation of a local VS profile database and its application for inference of VS30 from geologic-and terrain-based proxies. Bull Seismol Soc Am 104(6):2827–2841
Swiss Seismological Service (SED) at ETH Zurich (2015) The site characterization database for seismic stations in Switzerland. Federal Institute fo Technology, Zurich. https:// doi. org/ 10. 12686/ sed- stati oncha racte rizat iondb (retrieved on 18/04/2021 from http:// stati ons. seismo. ethz. ch
Theodulidis N, Kalogeras I, Papazachos C, Karastathis V, Margaris B, Papaioannou C, Skarlatoudis A (2004) HEAD 1.0: a unified HEllenic accelerogram database. Seismol Res Lett 75(1):36–45
Thompson EM, Baise LG, Tanaka Y, Kayen RE (2012) A taxonomy of site response complexity. Soil Dyn Earthq Eng 41:32–43
Traversa P, Maufroy E, Hollender F, Perron V, Bremaud V, Shible H, Drouet S, Guéguen P, Langlais M, Wolyniec D, Péquegnat C (2020) RESIF RAP and RLBP dataset of earthquake ground motion in mainland France. Seismol Res Lett. https:// doi. org/ 10. 1785/ 02201 90367
Wald DJ, Allen TI (2007) Topographic slope as a proxy for seismic site conditions and amplification. Bull Seismol Soc Am 97(5):1379–1395. https:// doi. org/ 10. 1785/ 01200 60267
Wang HY, Wang SY (2015) A new method for estimating VS30 from a shallow shear-wave velocity profile (depth< 30 m). Bull Seismol Soc Am 105(3):1359–1370
Wang SY, Shi Y, Jiang WP, Yao EL, Miao Y (2018) Estimating site fundamental period from shear-wave velocity profile. Bull Seismol Soc Am 108(6):3431–3445. https:// doi. org/ 10. 1785/ 01201 80103
Bulletin of Earthquake Engineering
1 3
Wathelet M, Chatelain JL, Cornou C, Di Giulio G, Guillier B, Ohrnberger M, Savvaidis A (2020) Geopsy: a user-friendly open-source tool set for ambient vibration processing. Seismol Res Lett-. https:// doi. org/ 10. 1785/ 02201 90360
Wathelet M, Jongmans D, Ohrnberger M, Bonnefoy-Claudet S (2008) Array performances for ambient vibrations on a shallow structure and consequences over Vs inversion. J Seismolog 12(1):1–19
Wills CJ, Clahan KB (2006) Developing a map of geologically defined site-condition categories for Califor-nia. Bull Seismol Soc Am 96:1483–1501
Wills CJ, Gutierrez CI, Perez FG, Branum DM (2015) A next generation VS30 map for California based on geology and topography. Bull Seismol Soc Am 105(6):3083–3091
Xie J, Zimmaro P, Li X, Wen Z, Song Y (2016) VS30 empirical prediction relationships based on a new soil-profile database for the Beijing plain area. China Bull Seismol Soc Am 106(6):2843–2854
Yong A (2016) Comparison of measured and proxy-based VS30 values in California. Earthq Spectra 32(1):171–192
Yong A, Hough SE, Iwahashi J, Braverman A (2012) A terrain-based site-conditions map of California with implications for the contiguous United States. Bull Seismol Soc Am 102(1):114–128
Zarrili L, R Moschillo (2020) Geological report at the seismic station IT.PGN – Pignataro Interamna (Fr). Agreement DPC-INGV 2019–21, All.B2-WP1, Task 2. http:// hdl. handle. net/ 2122/ 14056
Zhu C, Pilz M, Cotton F (2020) Which is a better proxy, site period or depth to bedrock, in modelling linear site response in addition to the average shear-wave velocity? Bull Earthq Eng 18:797. https:// doi. org/ 10. 1007/ s10518- 019- 00738-6
Publisher’s Note Springer Nature remains neutral with regard to jurisdictional claims in published maps and institutional affiliations.