Development of new Los Angeles seismic analysis criteria for tall buildings—site-specific...
30
THE STRUCTURAL DESIGW OF TALL BUILDINGS, Vol. 5, 235-264 (1996) DEVELOPMENT OF NEW LOS ANGELES SEISMIC A.NALYSIS CRITERIA FOR TALL BUILDIN'GS-SITE-SPECIFIC CONSIDERATIONS MARSHALL LEW LawiCrandall, Los Angeles, California, U.S.A. GARY C. HART UCLA and Hart Consultant Group, Santa Monica, California, U.S.A FARZAD NAEIM John A. Martin & Associates, Los Angeles, California, U.S.A. ROBERT N. HARDER Los Angcles Department of Building and Safety, Los Angeles, Calif?)rnia, U.S.A. MARTIN B. HUDSON AND BRIAN D. SKYERS LawlCrandall, Los Angeles, California, U.S.A. MUKUND SRINIVASAN Mart Consultant Group, Santa Monica, California, U.S.A. RICHARD E. HOLGUIN Los Angeles Department of Building and Safety, Los Angeles, California, U.S.A. SUMMARY Many tall buildings are planned and constructed in the city of Los Angeles. Significant building code changes as a result of recent earthquakes will complicate the design and plan checking for new buildings, not only in Los Angeles, Ibut throughout all seismic regions in the United States and around the world. This paper reports on new efforts to develop seismic analysis criteria for Los Angeles. The initial efforts have been in the areas of the design basis ground motions, near-source effects on ground motions and building design, and the lirst yield limit state. A study of the design basis ground motions in the Los Angeles area indicates thal the present code-defined level of ground motion may underestimate the seismic forces in design. Near-source effects would affect practically all of the heavily populated and built-up portions of Los Angeles due to the many known and suspected active seismic sources in the region. Studies of the ground motions suggest that a return period of about 40 years may be reasonable to estimate the earthquake demand for the first yield limit state. 1. INTRODUCTION As a result of the 1971 Sylmar Earthquake, the Los Angeles Building Code was revised in 1974 to require a geotechnica.1 report and dynamic analysis for all irregular buildings greater than 75 feet in height, and all buildings greater than 160 feet in height. The geotechnical reports were required to show two levels of site-specific response spectra for the appropriate damping levels. CCC 1062-8002/96/040~235-30 0 1996 by John Wiley & Sons, Ltd. Received March 1996 Revised May 1996
-
Upload
independent -
Category
Documents
-
view
7 -
download
0
Transcript of Development of new Los Angeles seismic analysis criteria for tall buildings—site-specific...
THE STRUCTURAL DESIGW OF TALL BUILDINGS, Vol. 5, 235-264 (1996)
DEVELOPMENT OF NEW LOS ANGELES SEISMIC A.NALYSIS CRITERIA FOR TALL
BUILDIN'GS-SITE-SPECIFIC CONSIDERATIONS
MARSHALL LEW LawiCrandall, Los Angeles, California, U.S.A.
GARY C. HART U C L A and Hart Consultant Group, Santa Monica, California, U.S.A
FARZAD NAEIM John A . Martin & Associates, Los Angeles, California, U.S.A.
ROBERT N. HARDER Los Angcles Department of Building and Safety, Los Angeles, Calif?)rnia, U.S.A.
MARTIN B. HUDSON AND BRIAN D. SKYERS LawlCrandall, Los Angeles, California, U.S.A.
MUKUND SRINIVASAN Mart Consultant Group, Santa Monica, California, U.S.A.
RICHARD E. HOLGUIN Los Angeles Department of Building and Safety, Los Angeles, California, U.S.A.
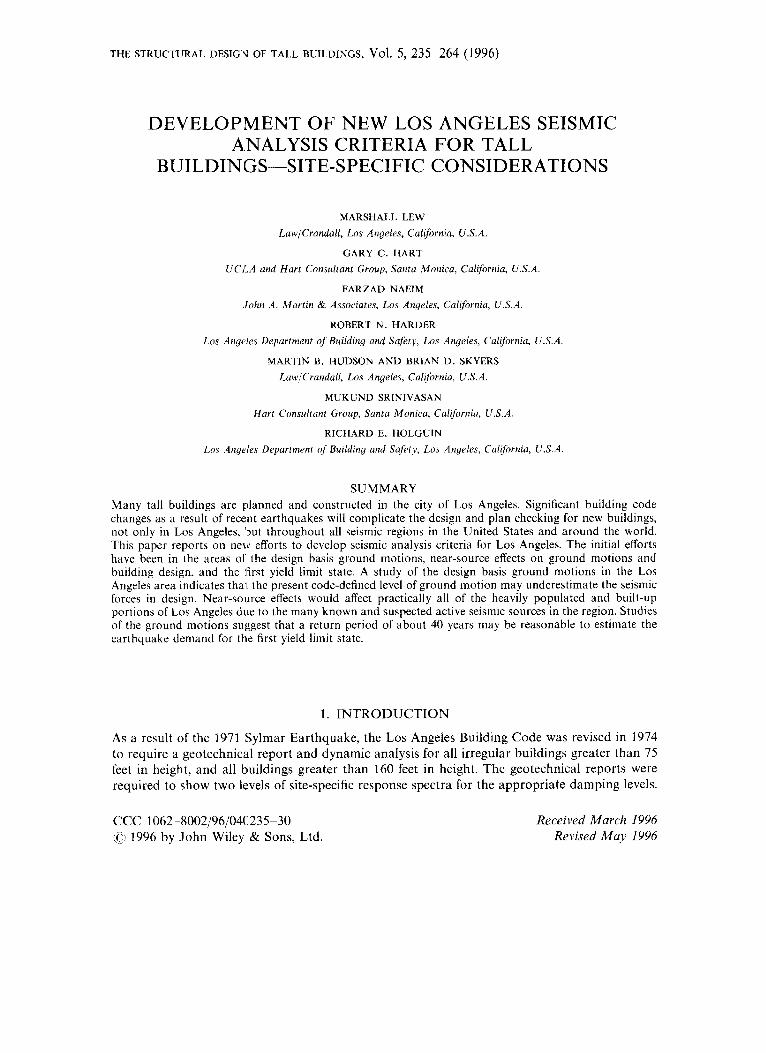
SUMMARY Many tall buildings are planned and constructed in the city of Los Angeles. Significant building code changes as a result of recent earthquakes will complicate the design and plan checking for new buildings, not only in Los Angeles, Ibut throughout all seismic regions in the United States and around the world. This paper reports on new efforts to develop seismic analysis criteria for Los Angeles. The initial efforts have been in the areas of the design basis ground motions, near-source effects on ground motions and building design, and the lirst yield limit state. A study of the design basis ground motions in the Los Angeles area indicates thal the present code-defined level of ground motion may underestimate the seismic forces in design. Near-source effects would affect practically all of the heavily populated and built-up portions of Los Angeles due to the many known and suspected active seismic sources in the region. Studies of the ground motions suggest that a return period of about 40 years may be reasonable to estimate the earthquake demand for the first yield limit state.
1. INTRODUCTION
As a result of the 1971 Sylmar Earthquake, the Los Angeles Building Code was revised in 1974 to require a geotechnica.1 report and dynamic analysis for all irregular buildings greater than 75 feet in height, and all buildings greater than 160 feet in height. The geotechnical reports were required to show two levels of site-specific response spectra for the appropriate damping levels.
CCC 1062-8002/96/040~235-30 0 1996 by John Wiley & Sons, Ltd.
Received March 1996 Revised May 1996
236 M. LEW E T A L .
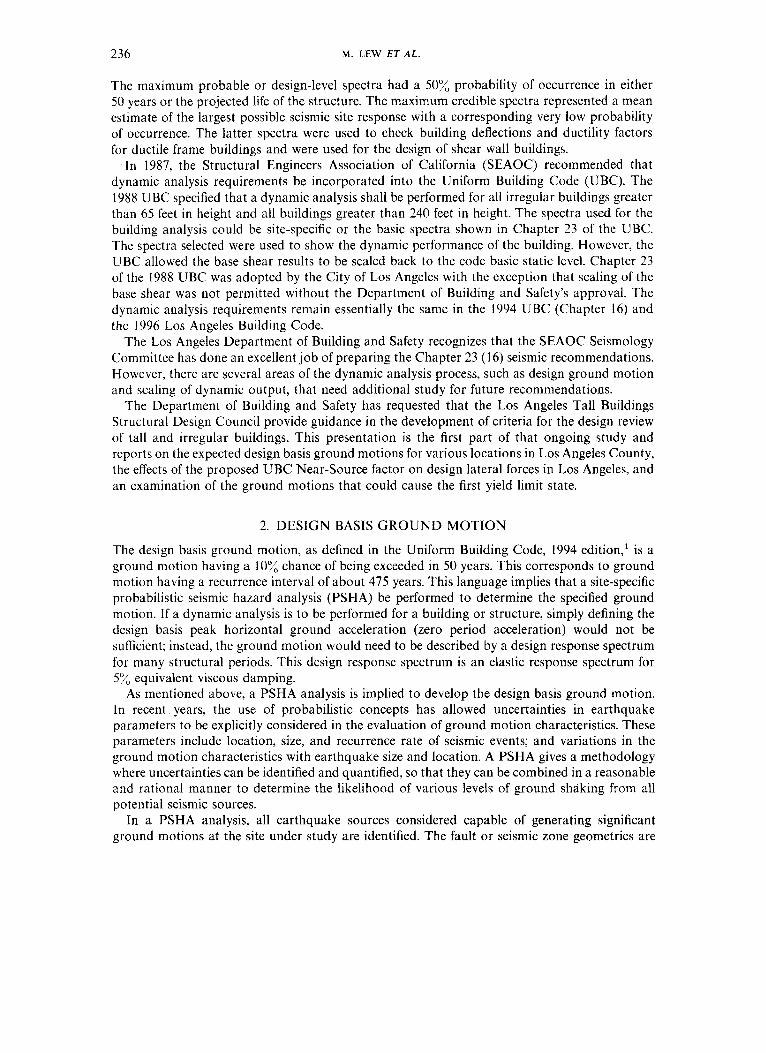
The maximum probable or design-level spectra had a 50% probability of occurrence in either 50 years or the projected life of the structure. The maximum credible spectra represented a mean estimate of the largest possible seismic site response with a corresponding very low probability of occurrence. The latter spectra were used to check building deflections and ductility factors for ductile frame buildings and were used for the design of shear wall buildings.
In 1987, the Structural Engineers Association of California (SEAOC) recommended that dynamic analysis requirements be incorporated into the Uniform Building Code (UBC). The 1988 UBC specified that a dynamic analysis shall be performed for all irregular buildings greater than 65 feet in height and all buildings greater than 240 feet in height. The spectra used for the building analysis could be site-specific or the basic spectra shown in Chapter 23 of the UBC. The spectra selected were used to show the dynamic performance of the building. However, the UBC allowed the base shear results to be scaled back to the code basic static level. Chapter 23 of the 1988 UBC was adopted by the City of Los Angeles with the exception that scaling of the base shear was not permitted without the Department of Building and Safety's approval. The dynamic analysis requirements remain essentially the same in the 1994 UBC (Chapter 16) and the 1996 Los Angeles Building Code.
The Los Angeles Department of Building and Safety recognizes that the SEAOC Seismology Committee has done an excellent job of preparing the Chapter 23 (16) seismic recommendations. However, there are Several areas of the dynamic analysis process, such as design ground motion and scaling of dynamic output, that need additional study for future recommendations.
The Department of Building and Safety has requested that the Los Angeles Tall Buildings Structural Design Council provide guidance in the development of criteria for the design review of tall and irregular buildings. This presentation is the first part of that ongoing study and reports on the expected design basis ground motions for various locations in Los Angeles County, the effects of the proposed UBC Near-Source factor on design lateral forces in Los Angeles, and an examination of the ground motions that could cause the first yield limit state.
2. DESIGN BASIS GROUND MOTION
The design basis ground motion, as defined in the Uniform Building Code, 1994 edition,' is a ground motion having a 10% chance of being exceeded in 50 years. This corresponds to ground motion having a recurrence interval of about 475 years. This language implies that a site-specific probabilistic seismic hazard analysis (PSHA) be performed to determine the specified ground motion. If a dynamic analysis is to be performed for a building or structure, simply defining the design basis peak horizontal ground acceleration (zero period acceleration) would not be sufficient; instead, the ground motion would need to be described by a design response spectrum for many structural periods. This design response spectrum is an elastic response spectrum for 5% equivalent viscous damping.
As mentioned above, a PSHA analysis is implied to develop the design basis ground motion. In recent years, the use of probabilistic concepts has allowed uncertainties in earthquake parameters to be explicitly considered in the evaluation of ground motion characteristics. These parameters include location, size, and recurrence rate of seismic events; and variations in the ground motion characteristics with earthquake size and location. A PSHA gives a methodology where uncertainties can be identified and quantified, so that they can be combined in a reasonable and rational manner to determine the likelihood of various levels of ground shaking from all potential seismic sources.
In a PSHA analysis, all earthquake sources considered capable of generating significant ground motions at the site under study are identified. The fault or seismic zone geometries are
L.A. SEISMIC ANALYSIS CRITERIA FOR TALL BUILDINGS 237
also characterized. The probability distribution of potential rupture locations within each seismic source is characterized. The recurrence relationship that describes the seismicity or temporal distribution of each earthquake source is determined; this relationship specifies the average rate at which an earthquake of some size will occur. The ground motions produced at the site by earthquakes of any posisible size occurring at any possible point in each seismic source zone are then determined by the use of predictive relationships. The uncertainties built into the predictive relationships are also considered in the analysis. The uncertainties in the earthquake size and location and the ground motion parameter prediction are combined to determine that probability that a specific value of ground motion parameter will be exceeded during a particular time period.
In an area as geologically diverse as Los Angeles County, there are numerous seismic sources that can be identified at the ground surface, some of which are strike-slip faults, some are normal faults, and some are thrust faults. In recent years, we have also become aware of 'buried' seismic sources that are not clearly expressed at the ground surface. The 1987 Whittier Narrows and 1994 Northridge earthquakes occurred on 'buried' thrust faults that were previously unknown. It is now postulated thl t there are many of these systems beneath the Los Angeles Basin and that they may represeni: a greater seismic threat to the region that the more famous faults that are known from their surface expressions. Each seismic source has a different activity or slip rate, which affects how large and how often damaging earthquakes can occur. Of course, there are also different local site geology and soil conditions that affect the way seismic waves will cause the ground to shake at different locations.
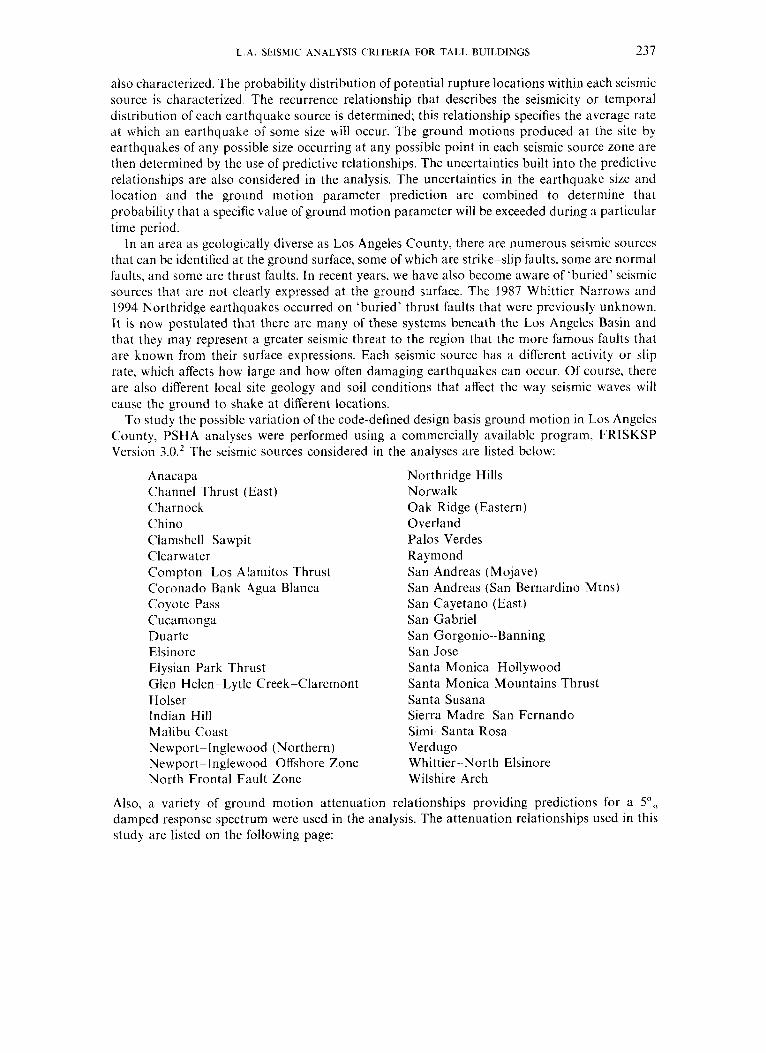
To study the possible variation of the code-defined design basis ground motion in Los Angeles County, PSH A analyses were performed using a commercially available program, FRISKSP Version 3.0.' The seismic sources considered in the analyses are listed below:
Anacapa Channel Thrust (East) Charnock Chino Clamshell-Sawpit Clearwater Compton-Los Alamitos Thrust Coronado Bank 4gua Blanca Coyote Pass Cucamonga Duarte Elsinore Elysian Park Thrust Glen Helen- Lytle Creek-Claremont Holser Indian Hill Malibu Coast Newport-Inglewood (Northern) Newport-Inglewood Offshore Zone North Frontal Fault Zone
Northridge Hills Norwalk Oak Ridge (Eastern) Overland Palos Verdes Raymond San Andreas (Mojave) San Andreas (San Bernardino Mtns) San Cayetano (East) San Gabriel San Gorgonio--Banning San Jose Santa Monica-Hollywood Santa Monica Mountains Thrust Santa Susana Sierra Madre-San Fernando Simi-Santa Rosa Verdugo Whittier --North Elsinore Wilshire Arch
Also, a variety of ground motion attenuation relationships providing predictions for a 5", damped response spectrum were used in the analysis. The attenuation relationships used in this study are listed on the following page:

238 M. LEW E T A L .
Boore, Joyner and Fumal, 1993 (Types ‘B’ or ‘C’)3 Campbell, 1993 and 1990 (Soii Site or Soft Rock Geomatrix Consultants, 1992 (Rock)6 Sadigh, Egan and Youngs, 1987 Idriss, 1993 (Rock)8
Table I. List of sites selected for study
Designation Location Site soil condition
A B C D E F G H I J K L M N 0 P Q R S T U v W X
Los Angeles Downtown-Bunker Hill Los Angeles Downtown-South Park Westwood Los Angeles International Airport Area Sherman Oaks Woodland Hills (Warner Center) Pasadena Glendale Studio City Long Beach Mid-Wilshire (Ambassador Hotel Area) Hancock Park Century City Torrance Palmdale West Covina Hollywood Cerritos Pic0 Rivera Compton Panorama City Santa Monica Chatsworth San Pedro
Rock Soil Soil Soil Soil Soil Soil Soil Soil Soil Soil Soil Soil Soil Soil Soil Soil Soil Soil Soil Soil Soil Soil Soil
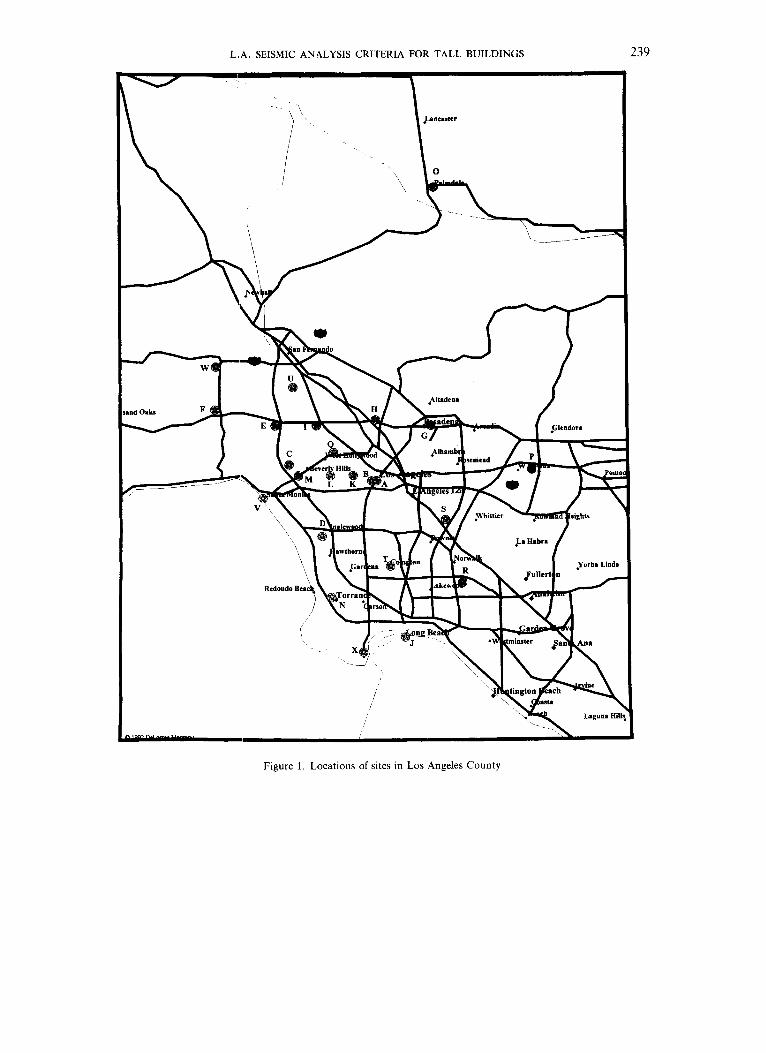
The design basis ground motions were determined at 24 sites throughout Los Angeles County. The locations of these sites are shown on the map in Figure 1. These sites are also listed in Table I; the generalized site soil conditions are also shown in the table.
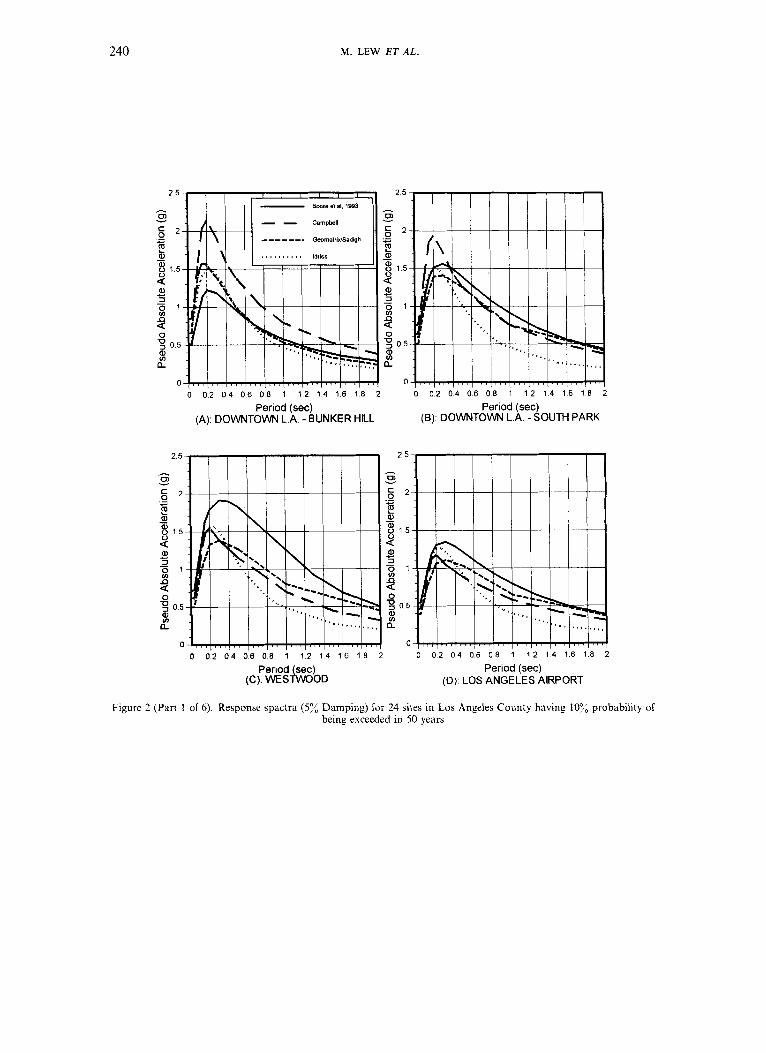
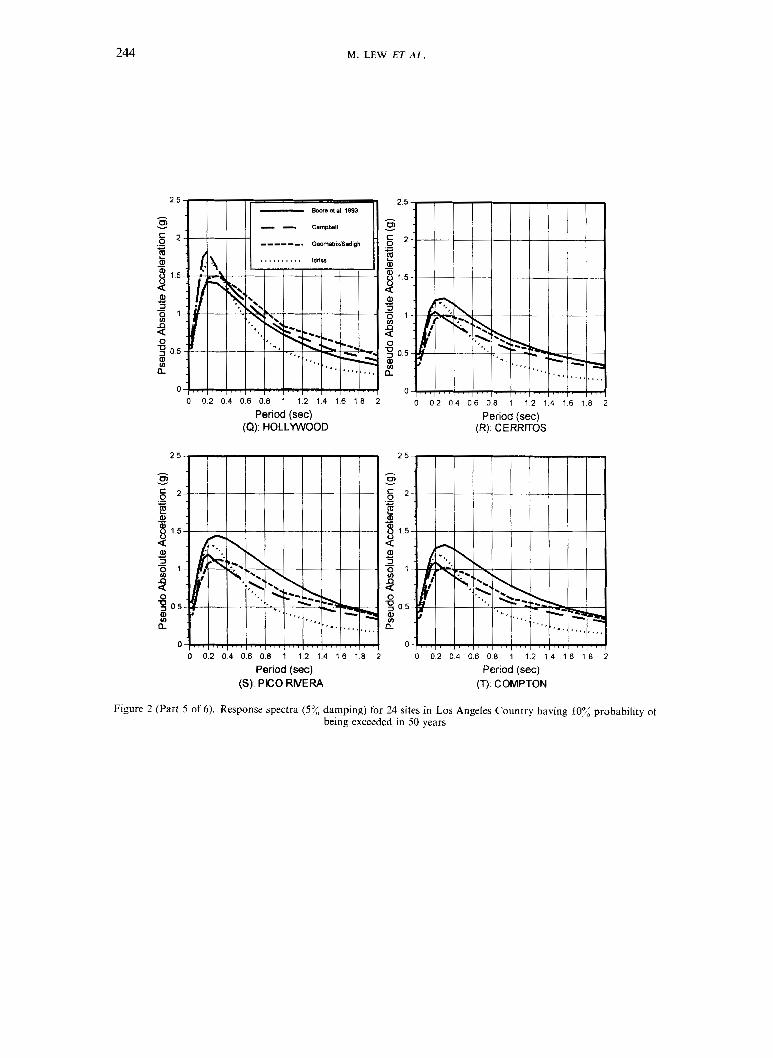
The design basis ground motion response spectra for 5’4 structural damping for the 24 selected sites in Los Angeles County are shown in Figure 2. The ground motions have been derived for a lo?; chance of being exceeded in 50 years or a recurrence interval of about 475 years. The Sadigh et ul. and Geomatrix attenuation relationships were applied to either soil or rock sites, respectively. The Idriss attenuation relationship is for rock only; however, the response spectra derived with the Idriss attenuation relationship are shown at the soil sites for comparative purposes only. The ground motion attenuation relationships used are only a sampie of many relationships that are available and some variation should be expected due to different assumptions inherent in each relationship. Also, the local site conditions may also effect the amplifications of the ground motions at different periods.
Figure 3 shows the ranges of the 5% damped PSHA response spectra at each of the 24 sites. For comparison, the presumed UBC 5% damped design spectra for Zone 4 and the appropriate soil factor is also shown. It should be noted that the PSHA response spectra at many sites in Los Angeles County exceed the UBC design spectra for Zone 4. These results may indicate that
L.A. SEISMIC ANALYSIS CRITERIA FOR TALL BUILDINGS 239
~ ~~
Figure 1. Locations of sites in Los Angeles County
240 M. LEW ET A L .
0 02 0 4 0 6 0 8 1 1 2 1 4 1 6 I 8 2
Period (sec) (A) DOWNTOWN L A - BUNKER HILL
0 0 2 0 4 0 6 0 8 1 1 2 1 4 1 6 1 8 2
Period (sec) (B)' DOWNTOWN L A -SOUTH PARK
Period sec) (C): WESlLoOD
Period (sec) (D): LOS ANGELES AIRPORT
Figure 2 (Part 1 of 6). Response spactra (5% Damping) for 24 sites in Los Angeles County having 107; probability of being exceeded in 50 years

L.A. SEISMIC ANALYSIS CRITERIA FOR TALL BUILDINGS 24 1
0 0 2 0 4 0 6 0 8 1 1 2 1 4 1 6 1 8 > Period (sec)
(El SHERMAN OAKS
_ _ h
0, - - Campbell
------. GeomalridSadigh
v
= 2 o_ ?!
a
z 1 2 3 0 5 2 a
c
a, - ; 1 s
a, 3 c -
0 U
0 , 0 0 2 0 4 0 6 0 8 1 1 2 1 4 1 6 1 8 2
Period (sec) (F) WOODLAND HILLS
- / . . . / . . . ( . . / . . . I . . . I . . / .
0 0 2 0 4 0 6 0.8 1 1 2 1 4 1 6 1 8 2
Period (sec) (G): PASADENA
0 0 2 0 4 0 6 0 8 1 1 2 1 4 1 6 1 8 2
Period (sec) (H) GLENDALE
Figure 2 (Part 2 of 6). Respoisc spectra (Y,, damping) for 24 sites in Los Angeles Country having lo?:, probability of being exceeded in 50 years

242 M. LEW ET AL.
Period (sec) (I): STUD0 CITY
Period (sec (J): LONG BEAdH
Figure 2 (Part 3 of 6). Response spectra (5% damping) for 24 sites in Los Angeles Country having 10% probability of being exceeded in 50 years

L.A. SEISMIC ANALYSIS CRITERIA FOR TALL BUILDINGS 243
0 0 2 0 4 0 6 0 8 1 1 2 1 4 1 6 1 8 2
Period (sec) (M) CENTURY CrlY
0 0 2 0 4 0 6 0 8 I 1 2 1 4 1 6 1 8 2
Period (sec) (N) TORRANCE
0 0 2 0 4 013 0 8 1 1 2 1 4 1 6 1 8 2
Period (sec) (0) PALMDALE
0 0 2 0 4 0 6 0 8 1 1 2 1 4 1 6 1 8 2
Period (sec) (P) WEST COVlNA
Figure 2 (Part 4 of 6). Response spectra (5% damping) for 24 sites in Los Angeles Country having 10% probability of being exceeded in 50 years
244 M. LEW E T A L .
0 0 2 0 4 0 6 08 1 1 2 1 4 1 6 1 8 2
Period (sec) (a) HOLLYWOOD
0 0 2 0 4 0 6 0 8 1 1 2 1 4 1 6 1 8 2
Period (sec) (R) CERRITOS
Period (sec) (S): PCO RNERA
, , 0 0 2 0 4 0 6 0 8 1 1 2 1 4 1 6 1 8 2
Period (sec) (T) COMPTON
Figure 2 (Part 5 of 6). Response spectra (5% damping) for 24 sites in Los AngeIes Country having 10% probability of being exceeded in 50 years

L.A. SEISMIC ANALYSIS CRITERIA FOR TALL BUILDINGS 245
Period (sec) (U): PANORAMA CKY
0 0 2 0 4 Of, 0 8 1 1 2 1 4
Period (sec) (W) CHATSWORTH
Period (sec) (V). SANTA MONICA
0 0 2 0 4 0 6 0 8 1 1 2 1 4 1 6 I 8 2
Period (sec) (X) SANPEDRO
Figure 2 (Part 6 of 6 ) . Response spectra (57" damping) for 24 sites in Los Angeles Country having 10% probability of being exceeded in 50 years

246 M. LEW ET AL.
2 5
h
0) v
= 2 0 c
- f 8 1 5
a 3
a
5 : ' 9 3 0 5 2 a
c -
0 U
0
0 0 2 0 4 0 6 0 8 I 1 2 1 4 1 6 1 8 2
Period (sec) (A) DOWNTOWN L A - BUNKER HILL
2 5 I I I I I I I I I I
0 0 2 0 4 0 6 0 8 1 1 2 1 4 1.6 1 8 i Period sec)
(C): WESlLVOOD
0 0 2 0 4 0 6 0 8 1 1 2 1 4 1 6 1 8 2
Period (sec) (B) DOWNTOWN L A -SOUTH PARK
0 V 3 2 a
0 0 2 0 4 0 6 0 8 1 1 2 1 4 1 6 1 8 2
Period (sec) (D) LOS ANGELES AIRPORT
Figure 3 (Part 1 of 6). Ranges of response spectra (50; damping) for 24 sites in Los Angeles Country having 100" probability of being exceeded in 50 years
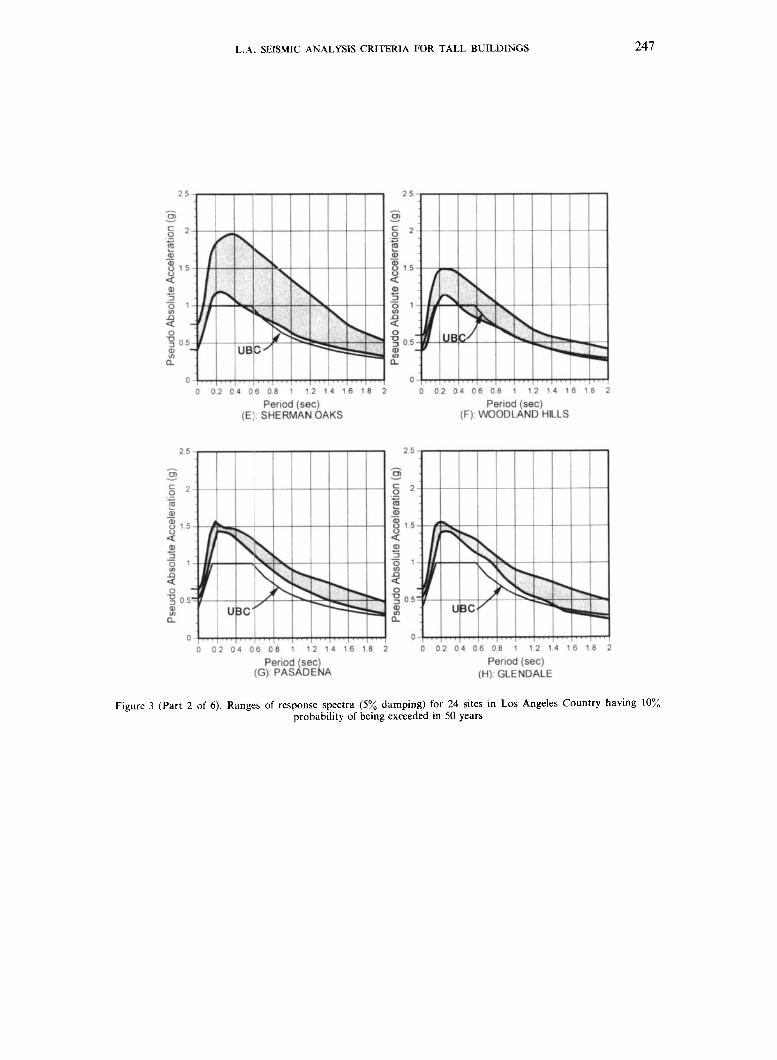
L..4. SEISMIC ANALYSIS CRITERIA FOR TALL BUILDINGS 247
0 0 2 0 4 0 6 0 8 1 1 2 1 4 1 6 1 8 2
Period (sec) (E, SHERMAN OAKS
0 0 2 0 4 0 6 0 8 1 1 2 1 4 1 6 1 8 2
Period (sec) (F) WOODLAND HILLS
Figure 3 (Part 2 of 6). Ranges of response spectra (5% damping) for 24 sites in Los Angeles Country having loo/, probability of being exceeded in 50 years

248 M. LEW ET AL.
0 0 2 0 4 0 6 0 8 1 12 1 4 1 6 1 8 2
Period (sec) (I): STUDIO CTp/
I 2 5 1; 2
- 8 1 5
D 1 2
18 a, - -
0 u 3 0 5
~h 1 0
0 0 2 0 4 06 0 8 1 1 2 1 4 1 6 1 8 2
Period (sec) (J): LONG BEACH
I . , / , I . . . / . . . I l . . . I I I . l I / . l . ~ , 0 0 2 0 4 0 6 0 8 1 1 2 1 4 1 6 1 8 2
Period (sec) (K). MID-WILSHIRE
0 0 2 0 4 0 6 0 8 1 12 1 4 1 6 1 8 2
Period (sec) (L) HANCOCK PARK
Figure 3 (Part 3 of 6) . Ranges of response spectra (5% damping) for 24 sites in Los Angeles Country having lo:(, probability of being exceeded in 50 years

L . A . SEISMIC ANALYSIS CRITERIA FOR TALL BUILDINGS 249
I / I I I I I I I
0 0 2 0 4 O F , 0 8 1 1 2 1 4 1 8 1 8 2
Period (sec) (Nl) CENTURY ClTy
0 0 2 0 4 0 6 0 8 1 1 2 1 4 1 6 1 8 2
Period (sec) (N) TORRANCE
0 0 2 0 4 O E 0 8 1 1 2 1 4 1 6 1 8 2 0 0 2 0 4 O S 0 8 ---I-++
1 2 1 4 1 6 1 8
Period (sec) (0) PALMDALE
Period (sec) (P) WEST COVINA
Figure 3 (Part 4 of 6). Rangcs of response spcctra (52, damping) for 24 sites in Los Angeles Country having lo";, probability of being exceeded in 50 years

250 M. LEW ET AL.
0 0 2 0 4 0 6 0 8 1 1 2 1 4 1 6 1 8 2
Period (sec) (R) CERRITOS
Period (sec) (a): HOLLYWOOD
/ , , ,
0 0.2 0.4 0.6 I 1 1 2 '
Period (sec) (S): PIC0 RNERA
~ 1 6 I - l I I I I 1
2 0 0 2 0 4 0 6 0 8 1
Period (sec) (T): COMPTON
1 6 1 8 2
Figure 3 (Part 5 of 6). Ranges of response spectra (5% damping) for 24 sites in Los Angeles Country having 105, probability of being exceeded in 50 years
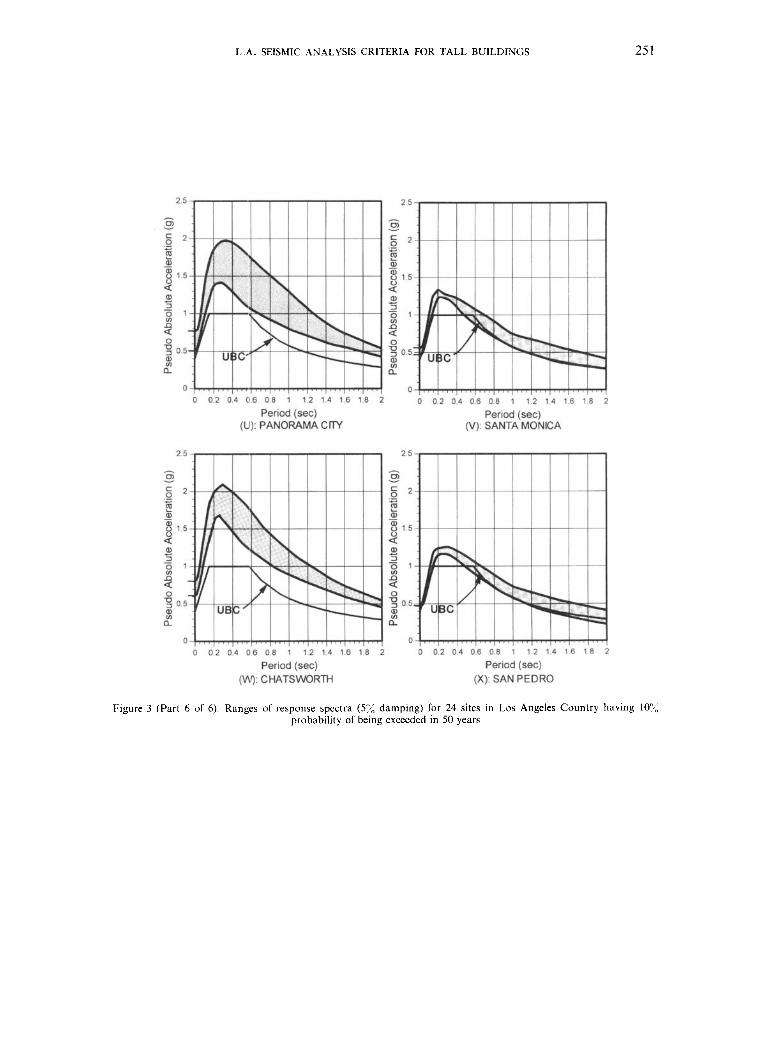
L.A. SEISMIC ANALYSIS CRITERIA FOR TALL BUILDINGS 25 1
2 5
h
0
c Y
._ 0 2 c
E a, 3 1 5
Q al 3 0 1 u)
-
c -
2
%
0 73 3 0 5
a 0
0 0 2 0 4 0 6 0 8 1 1 2 1 4 1 6 1 8 2
Period (sec) (U): PANORAMA CTp/
2 5
h
0 Y
= 2 P P
a
5 : l
2
2
c
al
$ 1 5
a, 3
-
c -
0 D 3 0 5
a
0 0 0 2 04 06 0 8 1 1 2 1
Period (sec)
c .- 0 2
2
2
c
E a,
8 1 5
al 3
-
c -
0 73
0 5 2 R
0
0 0 2 0 4 0 6 0 8 1 1 2 1 4 1 6 1 8 2
(V) SANTA MONICA Period (sec)
i o 0 2 04 06 o a 1 6 1 8 2
I 1 2 1 4 1 6 i a 2
Period (set)
(Vlr): CHATSWORTH (X): SAN PEDRO
Figure 3 (Part 6 of 6). Ranges of response spectra (5% damping) for 24 sites in Los Angeles Country having lO"i, probability of being exceeded in 50 years
252 M. LEW ET A t .
the practice of scaling the base shear levels to the code basic static level may be unconservative in Los Angeles County.
These response spectra should not be used for any specific design purposes. The general site conditions at the 24 locations were determined based on the experience of the authors, and although they are believed to be reasonable for each site, reliance for design purposes is not intended or encouraged. Instead, they are intended to be a guide as to the possible variations in a region as vast and diversified in site conditions as Los Angeles County.
3. NEAR-SOURCE EFFECTS ON STRUCTURAL DESIGN
The proposed Structural Engineers Association of California (SEAOC) strength design code change' for the 1997 Edition of the Uniform Building Code has been given tentative approval by the International Conference of Building Officials (ICBO). An important part of this code change proposal comes from a recognition that ground motions near the earthquake rupture could be larger than previously assumed. This phenomenon was very evident in the recent Northridge and Hyogo-Ken Nanbu (Kobe) earthquakes. For the first time, the building code will include a 'near-source factor,' designated as 'N ' which will be applicable in Seismic Zone 4 and is related to the proximity of the building or structure to known active faults.
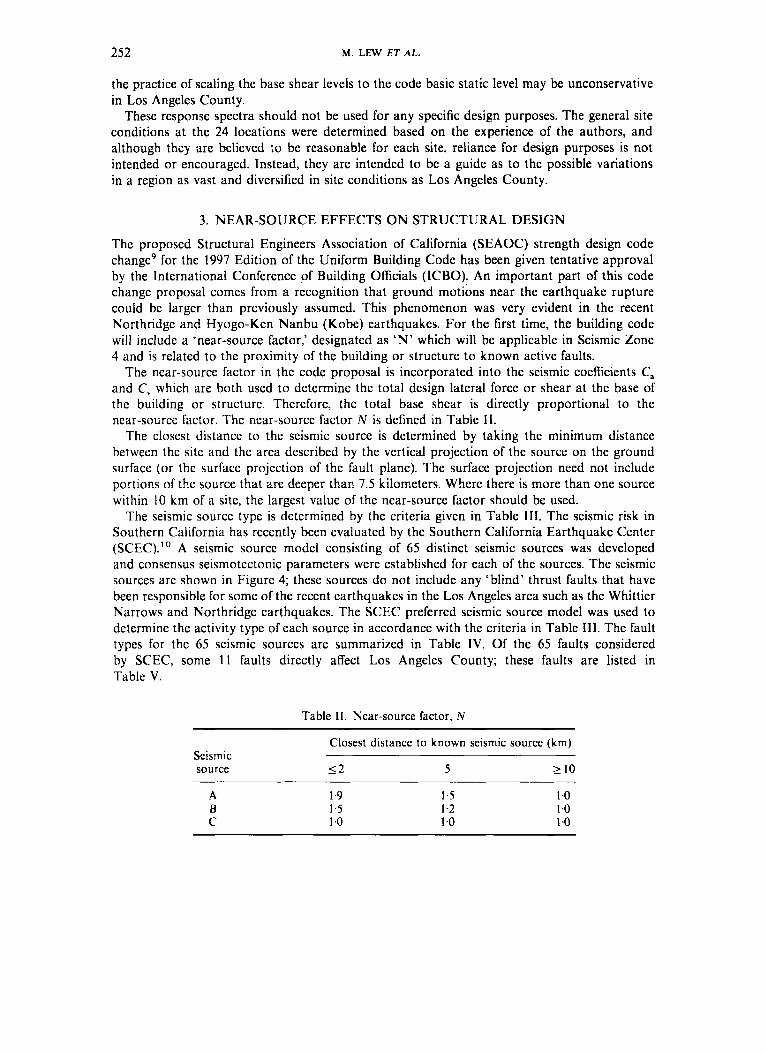
The near-source factor in the code proposal is incorporated into the seismic coefficients C, and C, which are both used to determine the total design lateral force or shear at the base of the building or structure. Therefore, the total base shear is directly proportional to the near-source factor. The near-source factor N is defined in Table 11.
The closest distance to the seismic source is determined by taking the minimum distance between the site and the area described by the vertical projection of the source on the ground surface (or the surface projection of the fault plane). The surface projection need not include portions of the source that are deeper than 7.5 kilometers. Where there is more than one source within 10 km of a site, the largest value of the near-source factor should be used.
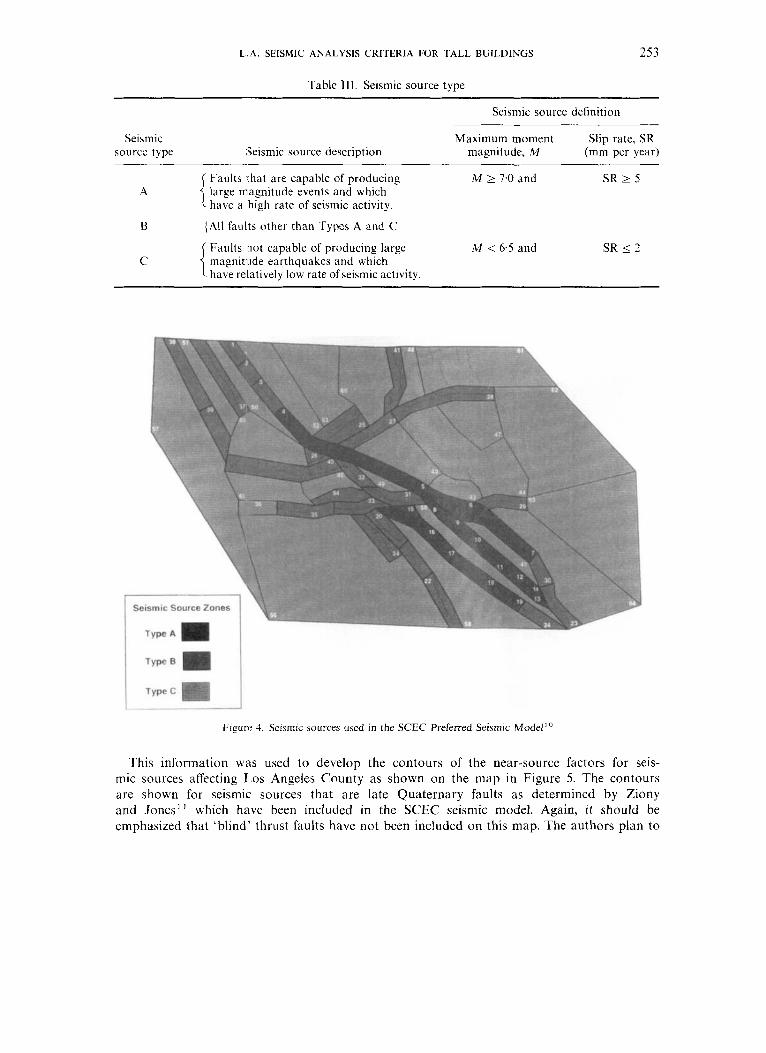
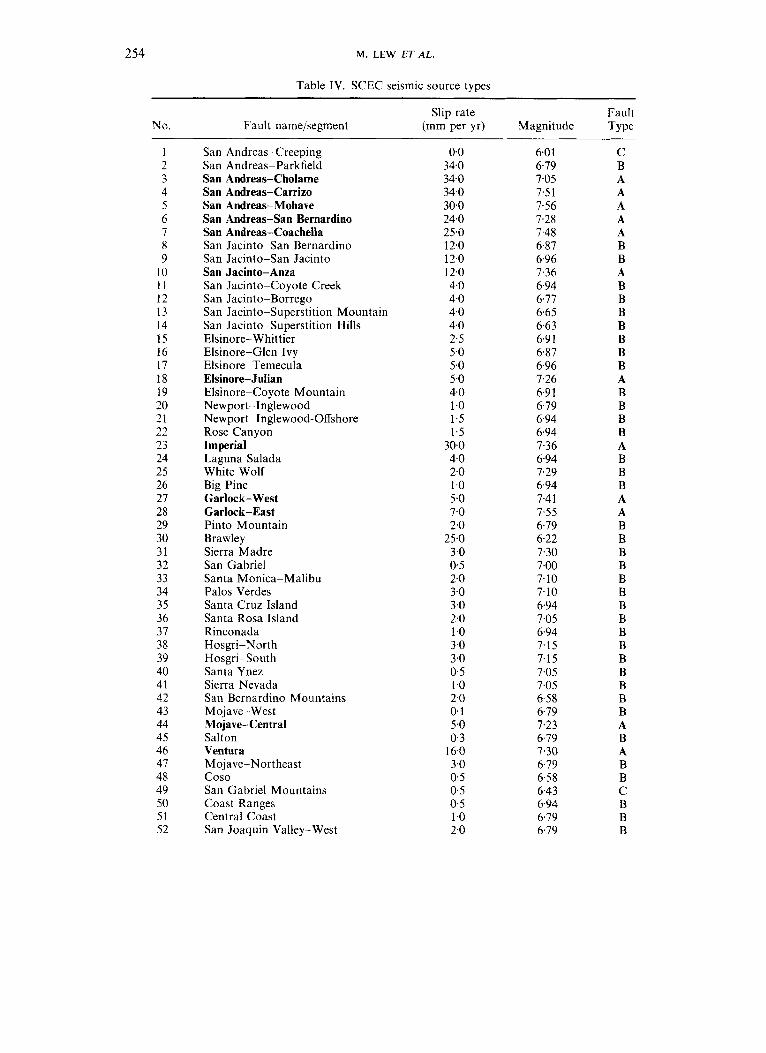
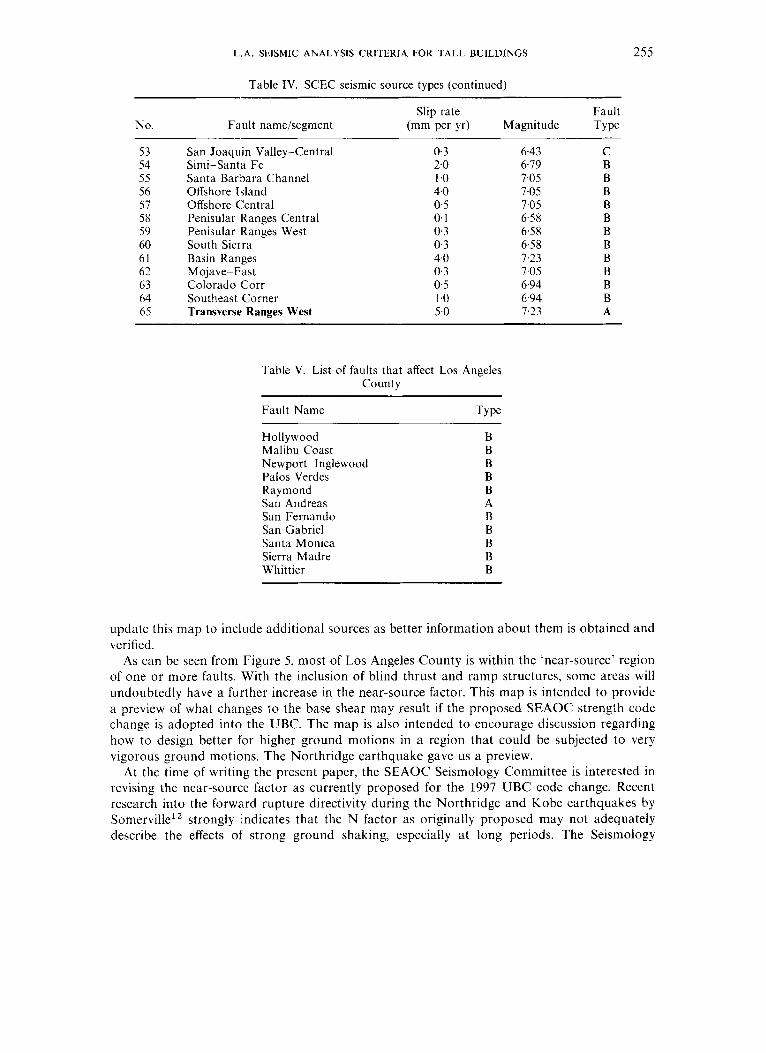
The seismic source type is determined by the criteria given in Table 111. The seismic risk in Southern California has recently been evaluated by the Southern California Earthquake Center (SCEC).'' A seismic source model consisting of 65 distinct seismic sources was developed and consensus seismotectonic parameters were established for each of the sources. The seismic sources are shown in Figure 4; these sources do not include any 'blind' thrust faults that have been responsible for some of the recent earthquakes in the Los Angeles area such as the Whittier Narrows and Northridge earthquakes. The SCEC preferred seismic source model was used to determine the activity type of each source in accordance with the criteria in Table 111. The fault types for the 65 seismic sources are summarized in Table IV. Of the 65 faults considered by SCEC, some 1 1 faults directly affect Los Angeles County; these faults are listed in Table V.
Table 11. Near-source factor, N
Seismic source
Closest distance to known seismic source (km)
- < 2 5 L 10
A B C
1.9 1.5 1 .o
1.5 1.2 1 .o
1 .o 1 .o 1 .o
L.A. SEISMIC ANALYSIS CRITERIA FOR TALL BUILDINGS 253
Table 111. Seismic source type
Seismic source definition
Seismic Maximum moment Slip rate, SR source type Seismic source description magnitude, M (mm per year)
Faults that are capable of producing large magnitude events and which have a high rate of seismic activity.
{All faults other than Types A and C
Faults not capable of producing large magnitude earthquakes and which have relatively low rate of seismic activity.
M 2 7.0 and SR 2 5 A
B
M < 6-5 and SR I 2
Figure 4. Seismic sources used in the SCEC Preferred Seismic Model '
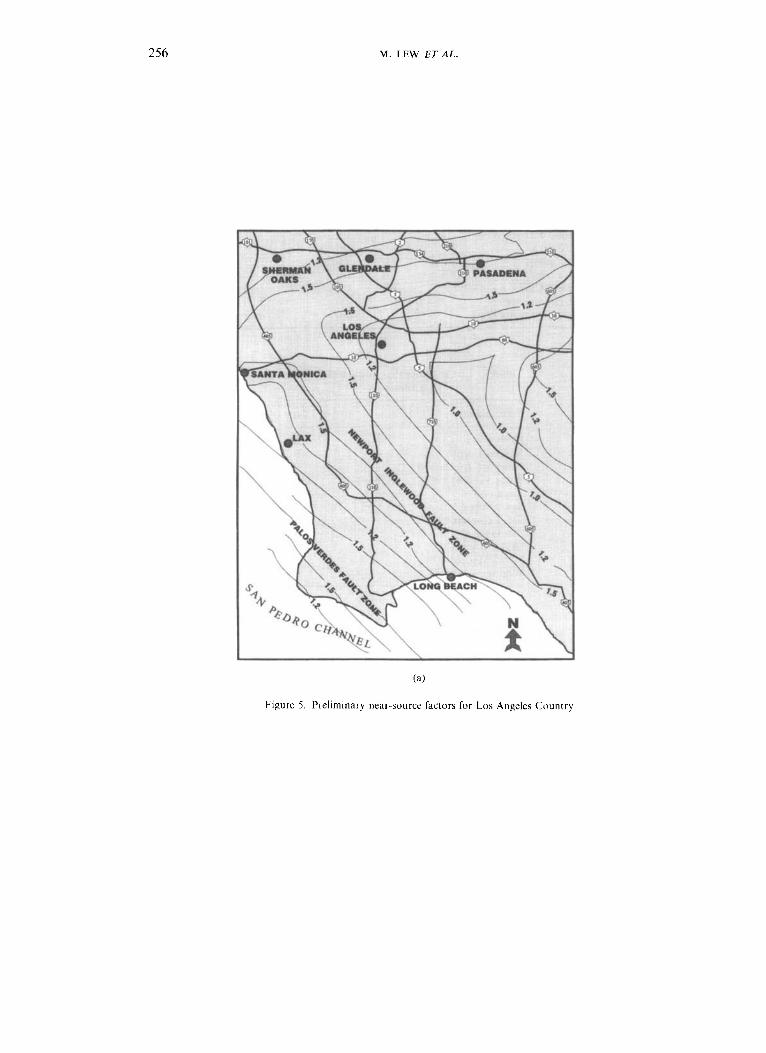
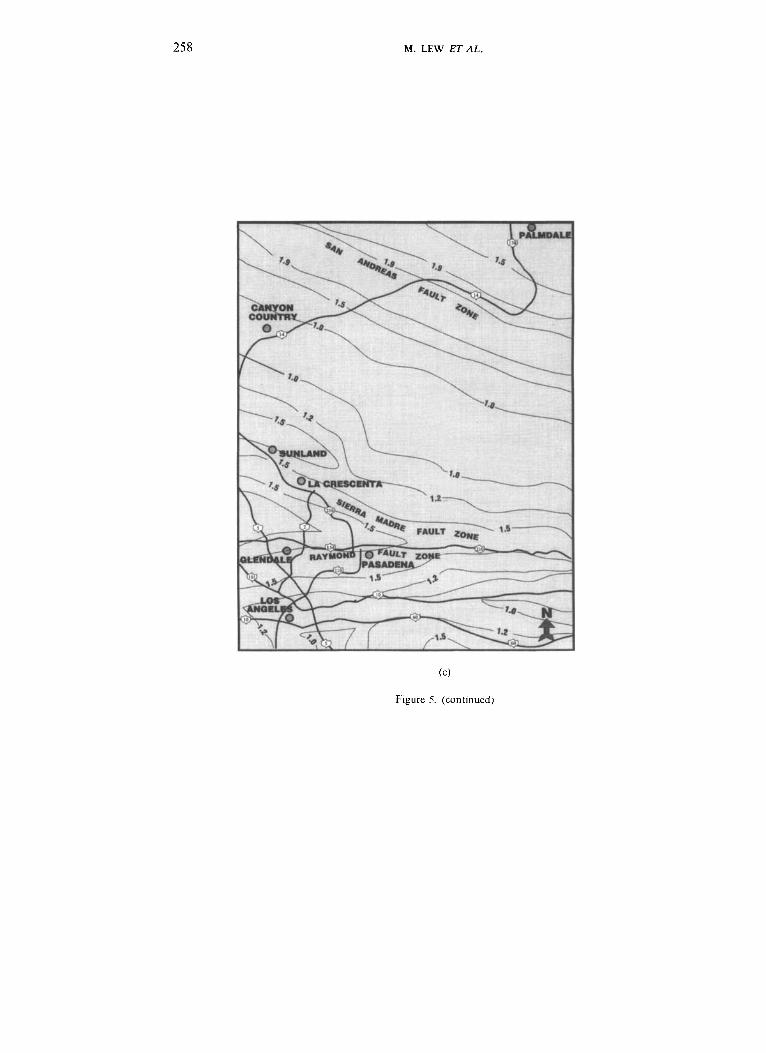
This information wals used to develop the contours of the near-source factors for seis- mic sources affecting L.os Angeles County as shown on the map in Figure 5. The contours are shown for seismic sources that are late Quaternary faults as determined by Ziony and Jones" which have been included in the SCEC seismic model. Again, i t should be emphasized that 'blind' thrust faults have not been included on this map. The authors plan to
254 M. LEW ET AL.
Table IV. SCEC seismic source types
Slip rate Fault No. Fault name/segment (mm per yr) Magnitude Type
1 2 3 4 5 6 7 8 9
10 1 1 12 13 14 15 16 17 18 19 20 21 22 23 24 25 26 27 28 29 30 31 32 33 34 35 36 37 38 39 40 41 42 43 44 45 46 47 48 49 50 51 52
San Andreas-Creeping San Andreas-Parkfield San Andreas-Cholame San Andreas-Carrizo San Andreas-Mohave San Andreas-San Bernardino San Andreas-Coachella San Jacinto-San Bernardino San Jacinto-San Jacinto San Jacinto-Anza San Jacinto-Coyote Creek San Jacinto-Borrego San Jacinto-Superstition Mountain San Jacinto-Superstition Hills Elsinore- Whittier Elsinore-Glen Ivy Elsinore-Temecula Elsinore- Julian Elsinore-Coyote Mountain Newport-Inglewood Newport-Inglewood-Offshore Rose Canyon Imperial Laguna Salada White Wolf Big Pine Garloc k - West Garlock-East Pinto Mountain Brawley Sierra Madre San Gabriel Santa Monica-Malibu Palos Verdes Santa Cruz Island Santa Rosa Island Rinconada Hosgri-North Hosgri-South Santa Ynez Sierra Nevada San Bernardino Mountains Mojave-West Mojave-Central Salton Ventura Mojave-Northeast Coso San Gabriel Mountains Coast Ranges Central Coast San Joaquin Valley-West
0.0 34.0 34.0 34.0 30.0 24.0 25.0 12.0 12.0 12.0 4.0 4.0 4 0 4.0 2.5 5.0 5.0 5.0 4.0 1 .o 1.5 1.5
30.0 4.0 2.0 1.0 5.0 7.0 2.0
25.0 3.0 0 5 2.0 3.0 3.0 2.0 1 .o 3.0 3.0 0.5 1 .O 2.0 0.1 5.0 0.3
16.0 3.0 0.5 0.5 0.5 1 .o 2.0
6.01 6.79 7.05 7.5 1 7.56 7.28 7.48 6.87 6.96 7.36 6.94 6.77 6.65 6.63 6.9 1 6.87 6.96 7.26 6.9 1 6.79 6.94 6.94 7.36 6.94 7.29 6.94 7.4 1 7.55 6.79 6.22 7.30 7.00 7.10 7.10 6.94 7.05 6.94 7.15 7.15 7.05 7.05 6.58 6.79 7.23 6.79 7.30 6.79 6.58 6.43 6.94 6.79 6.79
C B A A A A A B B A B B B B B B B A B B B B A B B B A A B B B B B B B B B B B B B B B A B A B B C B B B
L.A. SEISMIC ANALYSIS CRITERIA FOR TALL BUILDINGS 255
Table IV. SCEC seismic source types (continued)
Slip rate Fault No. Fault name/segment (mm per yr) Magnitude Type
53 54 55 56 51 58 59 60 61 62 63 64 65
San Joaquin Valley-Central SimikSanta Fe Santa Barbara Channel Offshore Island Offshore Central Penisular Ranges Central Penisular Ranges West South Sierra Basin Ranges Mojave-East Colorado Corr Southeast Corner Transverse Ranges West
0.3 2.0 1 .o 4.0 0.5 0.1 0.3 0.3 4.0 0.3 0.5 1.0 5.0
6.43 6.79 7.05 1.05 7.05 6.58 6.58 6.58 1.23 1.05 6.94 6-94 1.23
C B B B B B B B B B B B A
Table V. List of faults that affect Los Angeles County
Fault Name TY Pe
Hollywood Malibu Coast Newport-Inglewood Palos Verdes Raymond San Andreas San Fernando San Gabriel Santa Monica Sierra Madre Whittier
B B B B B A B B B B B
update this map to include additional sources as better information about them is obtained and verified.
As can be seen from Figure 5, most of Los Angeles County is within the ‘near-source’ region of one or more faults. With the inclusion of blind thrust and ramp structures, some areas will undoubtedly have a further increase in the near-source factor. This map is intended to provide a preview of what changes to the base shear may result if the proposed SEAOC strength code change is adopted into the UBC. The map is also intended to encourage discussion regarding how to design better for higher ground motions in a region that could be subjected to very vigorous ground motiam. The Northridge earthquake gave us a preview.
At the time of writing the present paper, the SEAOC Seismology Committee is interested in revising the near-source factor as currently proposed for the 1997 UBC code change. Recent research into the forward rupture directivity during the Northridge and Kobe earthquakes by Somerville” strongly indicates that the N factor as originally proposed may not adequately describe the effects of strong ground shaking, especially at long periods. The Seismology
256 M. LEW ET AL.
(a)
Figure 5. Preliminary near-source factora for Los Angeles Country

L . A . SEISMIC ANALYSIS CRITERIA FOR TALL BUILDINGS
(b)
Figure 5 . (continued)
257
258 M. LEW ET AL.
(c)
Figure 5. (continued)
L . A . SEISMIC ANALYSIS CRITERIA FOR TALL BUILDINGS 259
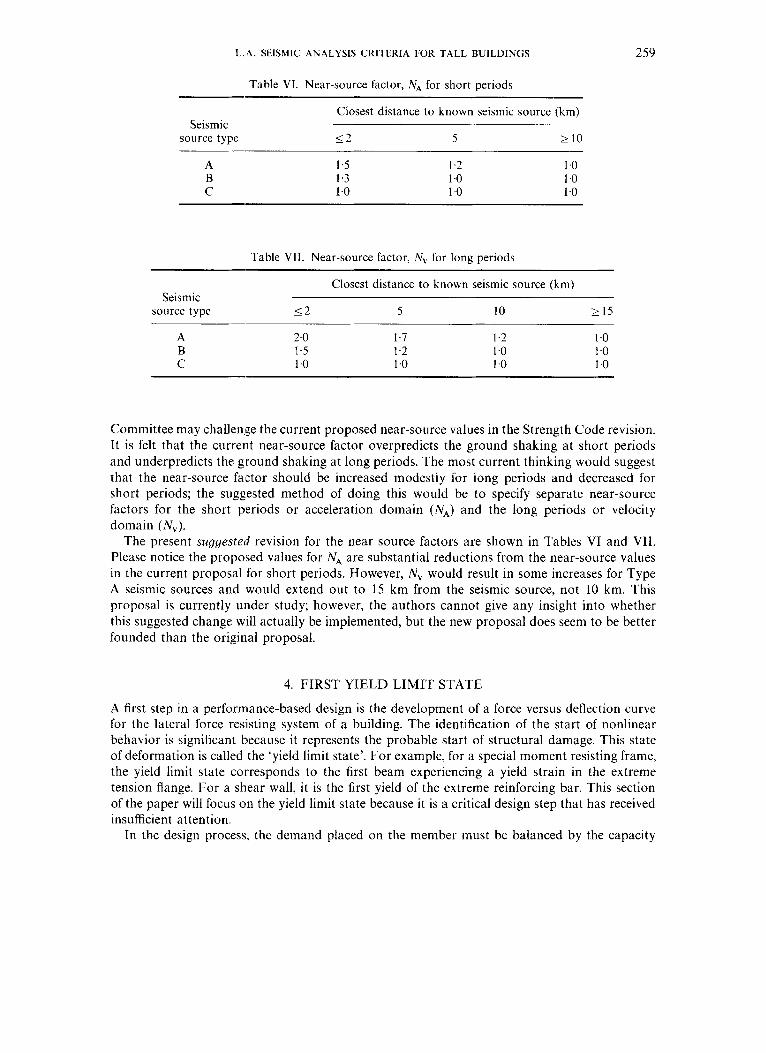
Table VI. Near-source factor, NA for short periods
Seismic source type
Closest distance to known seismic source (km)
1 2 5 2 10
A B C
I .5 1.3 1 .0
1.2 1 .0 1 .0
1 .0 1 .0 1 .0
Table VII. Near-source factor, Nv for long periods
Closest distance to known seismic source (km) Seismic
source type 1 2 5 10 2 15
A B C
2.0 1.5 1 .0
1.7 I .2 1 .0
1.2 1 .0 1 .0
1 .0 1 .0 I .0
Committee may challenge the current proposed near-source values in the Strength Code revision. It is felt that the current near-source factor overpredicts the ground shaking at short periods and underpredicts the ground shaking at long periods. The most current thinking would suggest that the near-source factor should be increased modestly for long periods and decreased for short periods; the suggested method of doing this would be to specify separate near-source factors for the short periods or acceleration domain (NA) and the long periods or velocity domain (A$).
The present suggested revision for the near source factors are shown in Tables VI and VII. Please notice the proposed values for NA are substantial reductions from the near-source values in the current proposal for short periods. However, N , would result in some increases for Type A seismic sources and would extend out to 15 km from the seismic source, not 10 km. This proposal is currently under study; however, the authors cannot give any insight into whether this suggested change will actually be implemented, but the new proposal does seem to be better founded than the original proposal.
4. FIRST YIELD LIMIT STATE
A first step in a performance-based design is the development of a force versus deflection curve for the lateral force resisting system of a building. The identification of the start of nonlinear behavior is significant because it represents the probable start of structural damage. This state of deformation is called the ‘yield limit state’. For example, for a special moment resisting frame, the yield limit state corresponds to the first beam experiencing a yield strain in the extreme tension flange. For a shear wall, it is the first yield of the extreme reinforcing bar. This section of the paper will focus on the yield limit state because it is a critical design step that has received insufficient attention.
In the design process, the demand placed on the member must be balanced by the capacity

260 M. LEW E T A L .
of the member for the yield limit state. In design criteria language, this is
where Md is the earthquake induced moment demand on the beam; M y is the expected yield moment capacity of the beam; 4y is the exp { -0.72flVMy) capacity reduction factor for the beam yield limit state; f i is the safety index (typically 1-5 to 3.0); and VM is the coefficient of variation in the estimated yield moment capacity.
The calculation of the expected yield moment capacity for the beam is
where f, is the expected yield stress and S is the section modulus. The nominal yield stress of the steel (e.g. 36 ksi) is often used instead of the expected yield
stress in lieu of test data. This is not correct because the expected yield stress is equal to the mean yield stress. Sometimes the word ‘mean’ or ‘average’ is used in place of ‘expected.’ The earthquake induced moment demand on the beam involves the definition of the earthquake ground motion and the computer model of the lateral force resisting system. Because this limit state is the upper limit of linear elastic response, computer programs such as SAP90 can be used to calculate the moment demand once the ground motion is established.
The earthquake ground motion for the yield limit state is most often represented by a 5% damped response spectrum and sometimes ensembles of acceleration time histories that correspond to this spectrum. The return period or recurrence interval is often used to define the frequency of the earthquake ground motion. For example, the UBC Design Basis Earthquake (DBE) for life safety protection or the Ultimate Limit State is 475 years. On average, the DBE will occur once every 475 years. This description of the DBE is less than desirable because it does not incorporate how long the building is expected to stand after it is built (i.e. its ‘design life’). Therefore, the UBC uses a better and equivalent definition for the DBE. It is an earthquake ground motion at the building site that has a 10% probability of being exceeded for a building design life of 50 years. As previously noted, the DBE is the earthquake ground motion used when the structural engineer checks to verify that the building provides life safety protection. The new SEAOC document Vision 2000 defines a ‘rare earthquake’ and this is the same as the DBE.
Now consider the ‘yield limit state’ and the frequency of the earthquake ground motion that should be used to define this onset of structural damage. This is the earthquake used to calculate Md in equation (1). Prior L. A. City High Rise Building design criteria called this ‘yield level’ earthquake a ‘maximum probable earthquake’ (MPE) and defined it to be an earthquake with a 50% probability of being exceeded in a 50-year design life. This corresponds to a 72-year return period. The SEAOC Vision 2000 name for this earthquake is an ‘occasional earthquake’. It is reasonable that this MPE or occasional earthquake be used as the earthquake ground motion that is used to calculate the moment demand (Md) that is used to compare with the ‘yield moment capacity’. However, an earthquake with a smaller return period (e.g. 40 years) has been proposed by others and this is also reasonable.
I t is always recommended that for a tall building a licensed geotechnical engineer be retained to provide the response spectrum used to calculate M d . The fault structure and geographic features of Los Angeles County are such that a significant variation in MPE earthquake ground motion can be expected over the county. Table VIII shows six Los Angeles County sites to illustrate the variation of the return period for ground motions with 0.249, 0,369, and 0,489 peak ground acceleration (PGA). These PGAs were calculated using a PSHA and the attenuation relations of Boore et d3 For example, in Pasadena, the 0.249 peak ground acceleration
L . A . SEISMIC ANALYSIS CRITERIA FOR TALL BUILDINGS 26 1
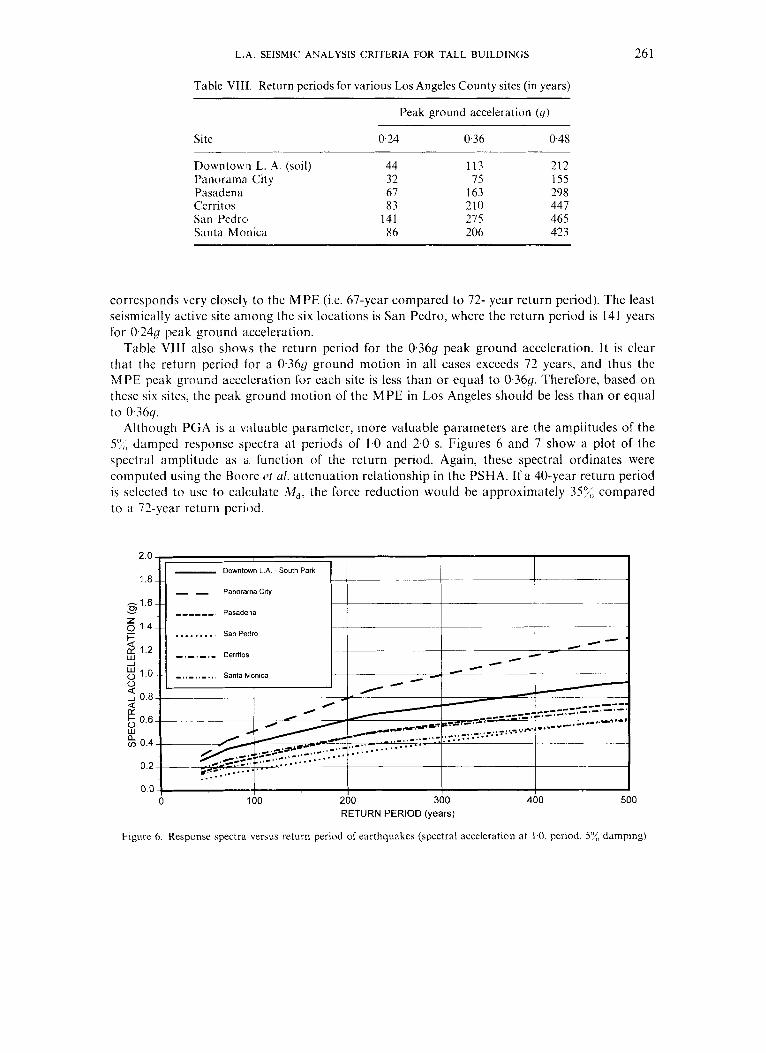
Table VIII. Return periods for various Los Angeles County sites (in years)
Peak ground acceleration (9)
Site 0.24 0.36 0 4 8
Downtown L. A. (soil) 44 113 212 Panorama City 32 75 155 Pasadena 61 163 298 Cerritos 83 210 447 San Pedrcl 141 215 465 Santa Monica 86 206 423
corresponds very closely to the MPE (i.e. 67-year compared to 72- year return period). The least seismically active site aniong the six locations is San Pedro, where the return period is 141 years for 0.24g peak ground acceleration.
Table VIlI also shows the return period for the 0 . 3 6 ~ peak ground acceleration. It is clear that the return period for a 0 . 3 6 ~ ground motion in all cases exceeds 72 years, and thus the M PE peak ground acceleration for each site is less than or equal to 0.3661. Therefore, based on these six sites, the peak ground motion of the MPE in Los Angeles should be less than or equal to 0.366~.
Although PGA is a vduable parameter, more valuable parameters are the amplitudes of the YC; damped response spectra at periods of 1.0 and 2.0 s. Figures 6 and 7 show a plot of the spectral amplitude as a. function of the rcturn period. Again, these spectral ordinates were computed using the Boore 41 nl. attenuation relationship in the PSHA. If a 40-year return period is selected to use to calculate Md, the force reduction would be approximately 35% compared to a 72-year return period.
- - Panorama City
_ _ _ _ _ _ , Pasadeiia
. . . . . . . . , San Pedro
_ ,_ ,_ ._ Cerritos
0 100 200 300 400 500 RETURN PERIOD (years)
Figure 6. Response spectra versus return period of earthquakes (spectral acceleration at 1.0, period, 57, damping)

262 M. LEW ET AL.
- / -,
0.8
_I - Panorama City
_ _ _ _ _ _ I Pasadena
......... San Pedro
- I - I -, - Cerrilos
- - Panoramacity
____--. Pasadena
I I
0 100 200 300 400 500 RETURN PERIOD (years)
Figure 7. Response spectra versus return period of earthquakes (spectral acceleration at 2.0 s period, 5% damping)
0
Figure 8. Occasional earthquake response spectra (5% damping, 50% probability of exceedence in 50 years, 72-year return period)
Figures 8 and 9 show the response spectra for the site compared with the UBC yield-level spectrum. The UBC spectrum is obtained using the standard spectrum for soil profile type S, , dividing by R , = 12, and multiplying by 1.4. It is clear that this spectrum is significantly less than the 40-year return period spectra. The UBC does contain an implied overstrength factor
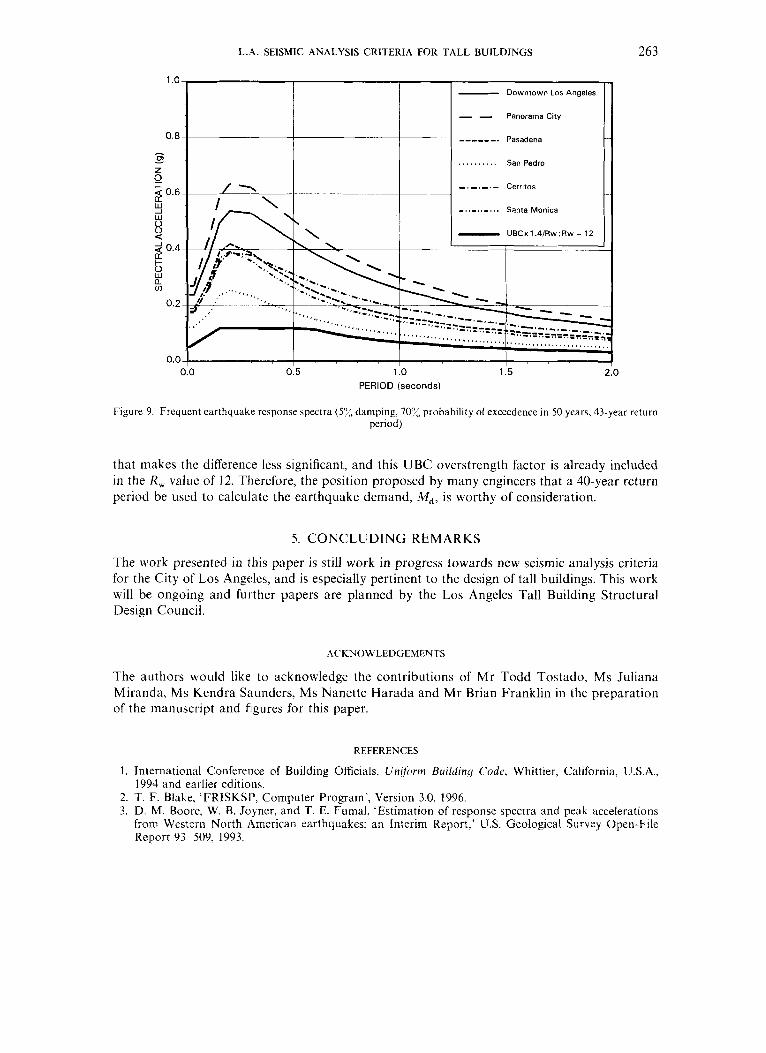
L. 4. SEISMIC ANALYSIS CRITERIA FOR TALL BUILDINGS 263
1 .o
0.8 - CI,
Z
$ 0.6
- 0
Y
a 1
k 3 0.4
LL cn 0.2
0.0 (
- Downtown Los Angeles
- - Panorama City
------. Pasadena
. . . . . . . . . . San Pedro
-.-.-.- Cerritos
-. . - . . _ . . . Santa Monica - UBCxl.4/Rw;Rw = 1 2
1 .o 1.5 0.5 PERIOD (seconds)
0
Figure 9. Frequent earthquake response spectra (57:, damping, 70”/, probability of exceedence in 50 years, 43-year return period)
that makes the difference less significant, and this UBC overstrength factor is already included in the R , value of 12. Therefore, the position proposed by many engineers that a 40-year return period be used to calculate the earthquake demand, Md, is worthy of consideration.
5. CONCLUDING REMARKS
The work presented in this paper is still work in progress towards new seismic analysis criteria for the City of Los Angeles, and is especially pertinent to the design of tall buildings. This work will be ongoing and further papers are planned by the Los Angeles Tall Building Structural Design Council.
ACKNOWLEDGEMENTS
The authors would like to acknowledge the contributions of Mr Todd Tostado, Ms Juliana Miranda, Ms Kendra Saunders. Ms Nanette Harada and Mr Brian Franklin in the preparation of the manuscript and figures for this paper.
REFERENCES
1. International Conference of Building Officials, Unijvrni Building Code, Whittier, California, U.S.A.,
2. T. F. Blake, ‘FRISKS]’, Computer Program’, Version 3.0, 1996. 3. D. M. Boore, W. B. Joyner, and T. E. Fumal, ‘Estimation of response spectra and peak accelerations
from Western North American earthquakes: an Interim Report,’ US. Geological Survey Open-File Report 93-509, 1993.
1994 and earlier editions.
264 M. LEW ET AL.
4. K. W. Campbell, ‘Empirical prediction of near-source ground motion from large earthquakes,’ Proceedings uf’ the International Workshop on Earthquuke Hazard and Large Dams in the Himalaya, sponsored by the Indian National Trust for Art and Cultural Heritage (INTACH), New Delhi, India, 15- 16 January, 1993.
5. K. W. Campbell, ‘Empirical prediction of near-source soil and soft-rock ground motion for the Diablo Canyon Power Plant Site, San Luis Obispo County, California,’ Consultant Report Prepared by Dames & Moore for Lawrence Livermore National Laboratory, September, 1990.
6. Geomatrix Consultants, Modified version of equations originally presented in 1991 report: ‘Seismic ground motion study for West San Francisco Bay Bridge,’ Draft Report to Caltrans, Division of Structures, Sacramento. California, U.S.A., 1992.
7. K. Sadigh, J. Egan and R. Youngs, Predictive ground motion equations reported in Joyner, W. B. and Boore, D. M., ‘Measurement, characterization, and prediction of strong ground motion,’ in Von Thun, J. L. (ed.), Earthquake Engineering and Soil Dynamics 11, Recent Advances it1 Ground Motion Eualuacion, American Society of Civil Engineers Geotechnical Special Publication No. 20, 1988.
8. I. M. Idriss, ’Procedures for selecting earthquake ground motions at rock sites’, National Institute of Standards and Technology, NIST GCR 93-~625, 1993.
9. Structural Engineers Association of California, ‘Strength code change proposal,’ submitted to the International Conference of Building Officials, 1996.
10. Working Group on California Earthquake Probabilities, ‘Seismic hazards in Southern California: probable earthquakes, 1994 to 2024’, Bulletin of the Seismological Society of America, 85(2), 379-439 (1995).
11. J. I. Ziony, and L. M. Jones, ‘Map showing late quaternary faults and 1978-84 seismicity of the Los Angeles region, California’, Department of the Interior, U.S. Geological Survey, Map MF-1964, 1989.
12. P. Somerville, ‘Forward rupture directivity in the Kobe and Northridge earthquakes, and implications for structural engineering’, Seventh U S - J a p a n Workshop on Irnprorement of Structural Design and Construction Practices, Lessons Learned.from Kobe and Northridge, Kobe, Japan, 1996.