Safety Investigation of Partially Filled Railway Tank Cars - CORE
Upload
independentCategory
view
4download
0
Complex seismic site effects insediment-filled valleys andimplications on design spectraE Faccioli and M Vanini
Technical University of Milan, Italy
SummaryEvidence of complex site effects intwo-dimensional geological configurationsis illustrated first, and the related difficulties ininterpreting ground motion observations arediscussed, using weak motion data recorded inthree alpine valleys in Northern Italy. While, onone hand, such valleys are mostly located inregions of low or moderate seismic hazard, whereground motion data are scarce, on the other handinvestment in buildings and infrastructure hasbeen substantial and may not always have beenprotected by adequate earthquake-resistantprovisions and zoning criteria. Moreover,experience and data obtained in regions hit bydestructive earthquakes cannot be easilytransferred to such a different context. The
combined influence of one-dimensionalpropagation effects on the dominant frequenciesof motion, and of two-dimensional effects on theamplification level and significant frequency band,are highlighted.
Concerning design elastic spectra, estimates ofresponse spectra on hard and soft soil areperformed, using observed weak motion data andthe empirical Green’s functions method.Comparison of results with Eurocode 8 spectrashows that the latter may not be conservative atperiods larger than 1 s. The relatively largeresponse at such is related to the geologicalconfiguration of the valleys, which appear torequire a reasonably accurate definition of theirtwo-dimensional geometry.
Key words: earthquakes; site effects; alpine valleys; soil amplification; weak motion; two-dimensional numericalsimulations; design spectra; empirical Green’s functions
Prog. Struct. Engng Mater. 2003; 5:223–238 (DOI: 10.1002/pse.156)
Introduction
It is well established that local soil conditions and, to amore limited extent, irregular surface topography canexert a crucial influence on the severity of buildingdamage and its spatial distribution duringearthquakes. Engineers have traditionally evaluatedsuch influence by simple models based on a one-dimensional description of local soil profile andseismic wave propagation, with reasonable success.However, recent events such as the 1995 HyogokenNanbu ( Japan) earthquake with its narrow‘intensified damage’ belt crossing the city of Kobe andcausing the death of over 6000 people, have discloseda remarkable complexity in seismic amplificationpatterns due to unfavourable combinations of seismicsource and near-surface geology.
One peculiarity of the European context is that itencompasses a broad range of exposure levels toearthquake hazard. While the protection ofpopulation centres from adverse site effects is a
recognized concern in highly seismic regions such asCentral/Southern Italy and Greece, this may not bethe case for some zones of lesser seismicity where thenear-surface geology can exert an unfavourableinfluence. For instance, in many alpine valleys in Italyand neighbouring countries the investment inbuildings and infrastructure has been very large, butbuilding design and land zoning regulations may nottake adequately into account the nature and extent ofadverse local effects. The lack of instrumental datafrom damaging earthquakes is in this case crucialbecause complex (two- or three-dimensional) siteeffects tend to occur on deeply incised, sediment-filled valleys and basins, where cities are located, oron steep topography, where some of the oldestsettlements are found. From the land zoning point ofview, earthquake-triggered slope failures constitutean induced hazard that may be typically overlookedin the alpine environment. It is instructive that thedown-slope fall of some boulders was the apparentcause of the only two deaths occurred in the July 2001
Earthquake Engineering and Structural Dynamics
Copyright & 2003 John Wiley & Sons, Ltd. Prog. Struct. Engng Mater. 2003; 5:223–238
Merano earthquake, an M 5.2 event hitting an area ofthe Italian Alps where no earthquake of comparableenergy has been reported for the last 1000 years[1].
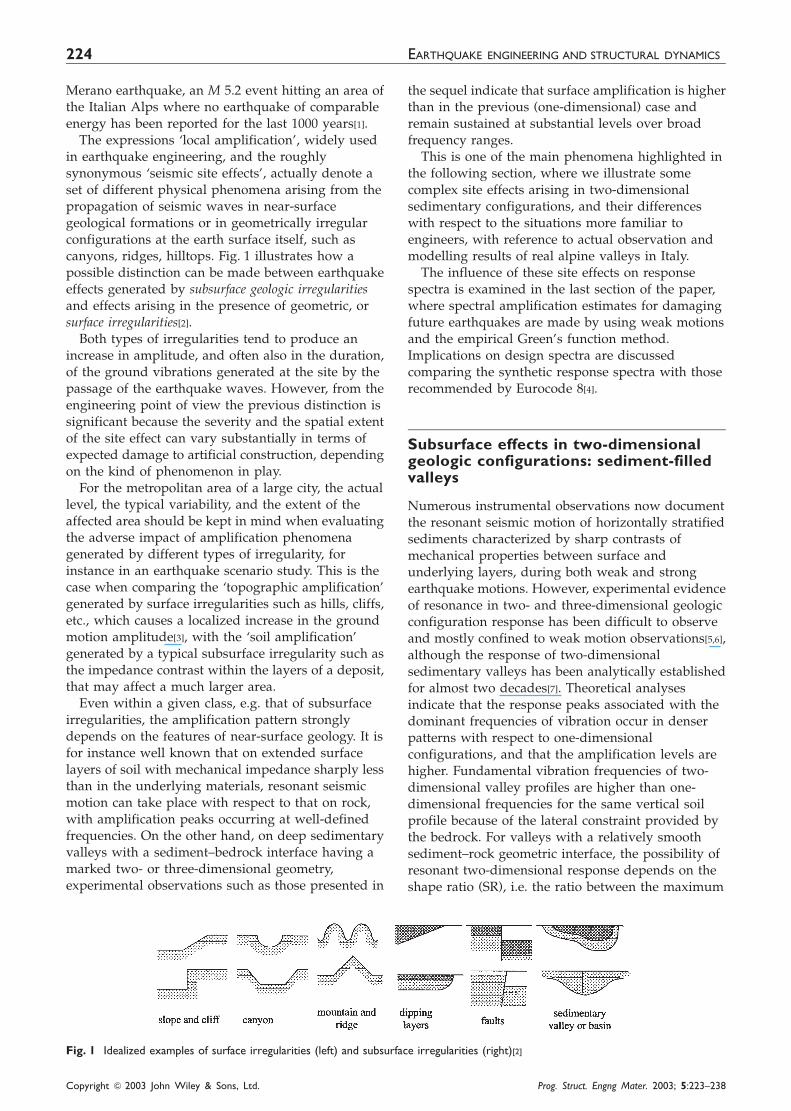
The expressions ‘local amplification’, widely usedin earthquake engineering, and the roughlysynonymous ‘seismic site effects’, actually denote aset of different physical phenomena arising from thepropagation of seismic waves in near-surfacegeological formations or in geometrically irregularconfigurations at the earth surface itself, such ascanyons, ridges, hilltops. Fig. 1 illustrates how apossible distinction can be made between earthquakeeffects generated by subsurface geologic irregularitiesand effects arising in the presence of geometric, orsurface irregularities[2].
Both types of irregularities tend to produce anincrease in amplitude, and often also in the duration,of the ground vibrations generated at the site by thepassage of the earthquake waves. However, from theengineering point of view the previous distinction issignificant because the severity and the spatial extentof the site effect can vary substantially in terms ofexpected damage to artificial construction, dependingon the kind of phenomenon in play.
For the metropolitan area of a large city, the actuallevel, the typical variability, and the extent of theaffected area should be kept in mind when evaluatingthe adverse impact of amplification phenomenagenerated by different types of irregularity, forinstance in an earthquake scenario study. This is thecase when comparing the ‘topographic amplification’generated by surface irregularities such as hills, cliffs,etc., which causes a localized increase in the groundmotion amplitude[3], with the ‘soil amplification’generated by a typical subsurface irregularity such asthe impedance contrast within the layers of a deposit,that may affect a much larger area.
Even within a given class, e.g. that of subsurfaceirregularities, the amplification pattern stronglydepends on the features of near-surface geology. It isfor instance well known that on extended surfacelayers of soil with mechanical impedance sharply lessthan in the underlying materials, resonant seismicmotion can take place with respect to that on rock,with amplification peaks occurring at well-definedfrequencies. On the other hand, on deep sedimentaryvalleys with a sediment–bedrock interface having amarked two- or three-dimensional geometry,experimental observations such as those presented in
the sequel indicate that surface amplification is higherthan in the previous (one-dimensional) case andremain sustained at substantial levels over broadfrequency ranges.
This is one of the main phenomena highlighted inthe following section, where we illustrate somecomplex site effects arising in two-dimensionalsedimentary configurations, and their differenceswith respect to the situations more familiar toengineers, with reference to actual observation andmodelling results of real alpine valleys in Italy.
The influence of these site effects on responsespectra is examined in the last section of the paper,where spectral amplification estimates for damagingfuture earthquakes are made by using weak motionsand the empirical Green’s function method.Implications on design spectra are discussedcomparing the synthetic response spectra with thoserecommended by Eurocode 8[4].
Subsurface effects in two-dimensionalgeologic configurations: sediment-filledvalleys
Numerous instrumental observations now documentthe resonant seismic motion of horizontally stratifiedsediments characterized by sharp contrasts ofmechanical properties between surface andunderlying layers, during both weak and strongearthquake motions. However, experimental evidenceof resonance in two- and three-dimensional geologicconfiguration response has been difficult to observeand mostly confined to weak motion observations[5,6],although the response of two-dimensionalsedimentary valleys has been analytically establishedfor almost two decades[7]. Theoretical analysesindicate that the response peaks associated with thedominant frequencies of vibration occur in denserpatterns with respect to one-dimensionalconfigurations, and that the amplification levels arehigher. Fundamental vibration frequencies of two-dimensional valley profiles are higher than one-dimensional frequencies for the same vertical soilprofile because of the lateral constraint provided bythe bedrock. For valleys with a relatively smoothsediment–rock geometric interface, the possibility ofresonant two-dimensional response depends on theshape ratio (SR), i.e. the ratio between the maximum
Fig. 1 Idealized examples of surface irregularities (left) and subsurface irregularities (right)[2]
EARTHQUAKE ENGINEERING AND STRUCTURAL DYNAMICS224
Copyright & 2003 John Wiley & Sons, Ltd. Prog. Struct. Engng Mater. 2003; 5:223–238

sediment depth and the half-width of the valley. For agiven rock–sediment impedance ratio, there exists athreshold SR value above which the valley motion isdominated by two-dimensional resonance, and belowwhich other patterns of wave propagation (surfacewaves and shear waves) across the valley tend todominate the motion, with a transition between thetwo regimes[7].
In this section we illustrate and try to interpretsignificant aspects of the seismic behaviour of threealpine valleys located in the Trento province ofNorthern Italy, as observed in weak (digitallyrecorded) earthquake motions. Our aim is to highlightobservational characteristics of the valleys’ responsethat deviate significantly from the classical one-dimensional pattern, especially if they point to apotential increase in ground motion hazard in termsof amplitude of shaking and significant frequencyband.
THE THREE SEISMIC ARRAYS
The seismic and other field data presented hereinwere originally obtained in a joint project carried bythe Geological Office of the Trento Provinceadministration with the authors, in order to evaluatethe local earthquake ground motion hazard in specificareas. In particular, the Geological Office providedand operated the temporary seismic stations.
As illustrated in Fig. 2, the valley sites of the seismicobservations were: Riva del Garda (RG), a small townat the northern tip of Lake Garda; Trento Nord (TN), afast developing commercial and industrial area at theoutskirts of Trento city, built on the deepunconsolidated sediments of the river Adige; Val diSole (VS) in the NW part of the province. A local array
typically consisting of 3–4 seismic stations wasinstalled at each valley site, for a period of timevarying between 15 and 19 months, between 1995 and2001. The extended duration of the observationperiods was aimed at obtaining a sufficient number ofgood-quality records at each site, but in some casesthis goal was barely attained, owing to the moderateseismic activity in the region. It must be stressed that,in view also of the reduced number of digital seismicstations available, the primary objective for installingthe arrays was not the observation of two- or three-dimensional site effects, but rather to collect usefuldata for local microzoning studies, particularly in thecase of the RG and TN sites. In the RG and TN first-phase arrays, each station was equipped with threevelocity sensors (oriented vertically, NS, and EW)having 1 or 2Hz natural frequency and with anindependent digital data acquisition system; in theTN second-phase array and in the VS array theprevious sensors were replaced with LennartzLEE3D/5 s velocity meters, characterized by a flatamplitude response between about 0.2 and 20Hz. Thesampling rates used were of 125 samples per secondper channel and 62.5 samples (only for the TN secondphase array).
To reduce the low-frequency errors in computingspectral ratios of signals recorded with sensors ofdifferent natural frequency in the RG and first phaseTN arrays, the time series recorded with the 2Hzsensors were corrected for the difference in amplituderesponse with respect to the 1Hz sensor. In a fewcases, low- or high-pass filtering has been used toremove spurious disturbances in the time series.Fourier spectra were all smoothed by means of analgorithm which computes the 1/FS octave bandaverage of the spectral amplitude (a factor of 6 has
Fig. 2 Location, shown by stars, of the three local seismometer arrays considered in this study: RG (Riva del Garda), TN (Trento Nord)and VS (Val di Sole). Epicentres and magnitudes (M) of earthquakes selected for each array are indicated by different symbols. Seismogeniczones after the Italian GNDT model[8] and the main seismotectonic lineaments in Central and Eastern Italian Alps[9] (kindly provided by C.Meletti) are also shown. Solid circles identify the events used as EGF in the last part of this work
SEISMIC SITE EFFECTS IN SEDIMENT-FILLED VALLEYS 225
Copyright & 2003 John Wiley & Sons, Ltd. Prog. Struct. Engng Mater. 2003; 5:223–238

been used as FS). The resultant smoothing is designedto reduce the variance in the spectral estimates. Eachstation in a given array being independently operated,the control of the recorded events and theiridentification was greatly facilitated by directcomparison with the events recorded and located bythe Trento Province permanent seismic network.
In addition to the array locations, Fig. 2 gives theepicentres of the low- and moderate-magnitudeevents recorded and retained for analysis, lying atdistances between 5 and 400 km from the arrays. The(duration) magnitudes varied between 2.2 and 6; thebasic restrictions adopted for retaining the records ofan event for spectral analysis were that it besimultaneously recorded at a rock station and leastone other station on sediments, and that the signal-to-noise ratio be greater than 5 (lowered to 3 for the VSdata only).
Of particular interest is the M 5.2 Merano event of17 July 2001 (to be discussed later, see Fig. 13), withepicentre located well outside the main belt of seismicsource zones (SSZ) of NE Italy, shown in Fig. 2, in aregion where hardly any record of significanthistorical earthquakes exists. This event occurredsome 40 km from the VS array and provided thehighest amplitude recordings in our dataset.
The Riva del Garda array
The RG array was installed in a wide valley, at thesouthern end of the Sarca River basin, limited to the
South by Lake Garda, to the West by very steepJurassic limestone relief, and to the East by the lower,asymmetric sandstone relief of M. Brione, as shown inFig. 3. The stations in this figure are indicated as BR(Brione) and SA (S. Alessandro), both on outcroppingrock, CI (Cimitero) and VI (Vivaio), on soil deposits.The valley is filled by the Quaternary sedimentarycreated both by the lake, the Sarca River and smallercreeks nearby. Near VI station the sediment thicknessdecrease to some 10–15m and the materials are stifferthan on the lakeshore area at Riva, where soft siltylayers near the surface and thick clayey layers atdepth are present. The water table depth in the areavaries from 1 to 5m from the surface.
Reflection and refraction seismic profiles, as well asa fairly deep drilling were carried out in the valley bythe Geological Office of the Trento Province in 1996[10],after the operation of the seismic array had ended. InFig. 3 the location of the reflection profile and of thedrilling are shown, while in Fig. 4 the geologicalinterpretation of the profile is reproduced, with theprojected position of the drilling. The seismic profilegives quite a clear idea of the position of thediscontinuity (2) between the bedrock (1) and thesediments (3). The characteristics of the latter rangefrom deeper glacial deposits (3a) to stiffer cementedsandy layers (3b and 3c), ending with the surficiallake deposits (5). Down-hole measurements (530m)near CI station gave shear wave velocity Vs values of95–130m/s for the surface silty soil layers (found only
Fig. 3 Location of the RG (Riva del Garda) seismic array stations (CI, VI, BR, SA) and simplified geology of the valley. Locations of thereflection profile and of the deep borehole[10] are also shown
EARTHQUAKE ENGINEERING AND STRUCTURAL DYNAMICS226
Copyright & 2003 John Wiley & Sons, Ltd. Prog. Struct. Engng Mater. 2003; 5:223–238

at some locations) and 200–400m/s for stiffer anddeeper sediments. An average Vs¼ 300m/s in theupper 30m was used for the one-dimensionalresponse analysis described below.
Seismic events at RG were recorded from February1995 to May 1996, mostly corresponding to weak-motion earthquakes. In the end, 13 events wereselected for subsequent analysis, with magnitudesvarying from 2.2 to 4.9 and distances from 5 to 175 km.Time traces recorded at CI on deep soil depositsexhibit durations 2–10 times longer than at rock sites,and amplification levels of 2–3. Records at site VIshow a definite shift of amplification peaks towardshigher frequencies.
During the recording period, the station on rockwas moved from BR to SA. In order to check theadequacy of these two ‘rock’ stations, H/V spectralratios have been computed and no significantamplification has been found; the ratios arereasonably close to unity in the frequency range ofinterest for both stations.
After baseline correction of the signals, standardsoil/rock spectral ratios for horizontal motioncomponents have been computed for simultaneousrecordings of the same event. Since the 1Hz velocitymeter was used at the rock sites BR or SA, and the
2Hz meters at the soil sites CI and VI, the spectralratios were corrected for the difference ininstrumental response, as previously described. Then,the average values and 1s bands were computed forthe spectral ratios CI/rock and VI/rock (Fig. 5),without distinguishing the rock sites. The ratios arenot considered reliable below about 1Hz frequency,owing to instrumental response limitations.
The graphs in Fig. 5 display vast differencesbetween the two sites CI and VI, both in amplificationlevels and peak frequencies. CI exhibits a sustainedamplification of 7–8 over a broad frequency band(1–9Hz), not uncommon at sites prone to significanttwo-dimensional amplification phenomena. Anindependent evaluation of the one- and two-dimensional natural frequencies of the valley(governed by the deep sediments with Vs ¼ 800m/s),performed with the Rayleigh method[11], indicatesthat the peak frequencies observed below 2Hz may berelated more closely to the one-dimensional ratherthan to the two-dimensional response. As a matter offact, the two-dimensional fundamental mode wasestimated at frequencies of 0.65–0.9Hz, for which thesignal-to-noise ratio can no longer be regarded asacceptable, and the same is true a fortiori for the lowestone-dimensional natural frequency. On the other
Fig. 4 Interpretation of the seismic reflection profile of Riva del Garda shown in Fig. 3[10]. The borehole, drilled about 300m S of the
0 2 4 6 8 10 12Frequency [Hz]
0
10
20
Sp
ect
ral r
atio
s
CI13 events2D natural frequency (1st mode)
1D natural frequency (2nd mode)
0 2 4 6 8 10 12Frequency [Hz]
0
10
20
Sp
ect
ral r
atio
s
VI6 events
Fig. 5 RG array: average spectral ratios of horizontal motion (� 1s bands) for stations CI and VI with respect to rock stations BR or SA.Also shown on the left are independent estimates of the two-dimensional (1st mode) and one-dimensional (2nd mode) natural frequencyranges, and the one-dimensional numerical transfer function (dashed-lines)
SEISMIC SITE EFFECTS IN SEDIMENT-FILLED VALLEYS 227
Copyright & 2003 John Wiley & Sons, Ltd. Prog. Struct. Engng Mater. 2003; 5:223–238

hand, the second one-dimensional resonant frequencywas estimated in the 1.2–1.5Hz range, which is closeto the first observed CI peak in Fig. 5. Thetwo-dimensional response features at CI become fullyapparent through comparison with the numericalone-dimensional transfer function, computed with aprofile taken from Fig. 4 and the deep borehole data.While the highest peak frequency close to 1.5Hzconfirms the previous one-dimensional estimation,the inadequacy of the one-dimensional model toaccount for the observed amplification levels is totallyevident. The seismic response at VI shows typicalfeatures of a low thickness alluvial sediment site withmarkedly one-dimensional response; a clearamplification peak can be seen at about 4.5Hz,that may be related to the response of the local soilprofile, that has an estimated thickness of the order of10m and propagation velocity of about 200 m/s( f0 ¼ Vs /4H ¼ 5Hz). It is interesting to note thatthe observed amplification levels at VI are verysimilar to those of the one-dimensional numericalprediction at CI.
Unlike the other two array sites, at RG thesubsurface exploration data were not consideredsufficient for constructing a reliable numerical modelof the valley for the numerical simulation of the two-dimensional seismic response.
The Trento Nord array
The TN seismic array was installed in the northernoutskirts of Trento city, on the deep alluvial sedimentsof the Adige River, (Fig. 6). As shown below, thevalley has a marked two-dimensional configuration,along- a North–South axis. Its width varies from 1 to2 km, while the depth of the alluvial sediments rangesfrom about 300 to about 600m. The configuration ofthe valley was generated by fluvial erosion during theMiocene. The sediments filling the valley range fromalluvium materials (of Pleistocene age at greaterdepth, near the valley centre) to glacial and riverdeposits from 200m depth up to the surface, bothmixed with rock-slide debris near the valley edges.A reflection seismic profile and a number ofgeotechnical exploration boreholes (with SPT
Fig. 6 Location of the Trento Nord seismic array stations (TNR, on rock, TNC and TNI, on soft soil) and simplified geological map ofthe Trento area along the Adige Valley[10]. The position of the seismic refraction profile is also shown
EARTHQUAKE ENGINEERING AND STRUCTURAL DYNAMICS228
Copyright & 2003 John Wiley & Sons, Ltd. Prog. Struct. Engng Mater. 2003; 5:223–238

measurements) carried out along the valley by theGeological Office of the Trento Province allowed areliable reconstruction of the subsurface geologicalstructure of the valley, in a stretch extending from theNorth to the South of Trento[10]. The seismic arrayconsisted originally of four stations but only three ofthem obtained a sufficient number of reliablerecordings, i.e. TNR on rock, TNC and TNI on thedeep soil deposits.
Two different sets of data have been collected: thefirst during the period September 1997 to March 1998,and the second in the period September 1998 toSeptember 1999. As already mentioned, during thefirst period, or phase 1, the stations were equippedwith the same velocity sensors of 2Hz naturalfrequency (for the three stations used) as in RG, whilein the second period, or phase 2, broader-bandinstruments were used with a natural frequency of0.2Hz. Mainly for this reason, the two sets of datawere kept separate.
After careful pre-processing in the time andfrequency domains, only four events were retained forthe first set of data, and six events for the second set.
However, the first set of data is not used here becauseit contains three events with 5.45 M5 6 anddistances around 360 km from the array, which gave astrongly enhanced content of incoming motions atfrequencies of 0.5–1.5Hz, well below the flat responserange of the seismic sensors. For this reason, only thesecond TN dataset is discussed from here on,characterized by lower magnitudes (2.8–3.7) andshorter distances (20–240 km).
In Fig. 7 the standard soil/rock average spectralratios of horizontal motions are shown for thisdataset, for the soil stations TNI and TNC. Thespectral ratios exhibit a broadband response,considered typical of two-, or three-dimensional, siteeffects, with significant amplification values (10–15)from about 1 to 5Hz, particularly at TNCstation.
The geophysical and geotechnical exploration dataavailable for the Trento area allowed us to develop atwo-dimensional numerical model for seismicresponse analyses, the main features of which aresketched in Fig. 8. Though the seismic reflectionprofile providing the basis for the model was located
0
10
20
30
40
Sp
ect
ral r
atio
s
0 2 4 6 8 10Frequency [Hz]
TNI5 events
0
10
20
30
40
Sp
ect
ral r
atio
s
0 2 4 6 8 10Frequency [Hz]
TNC5 events
Fig. 7 TN array, average soil/rock spectral ratios of horizontal motion (� 1s bands) for stations TNI and TNC
-1400 -900 -400 100 600 1100 1600 2100 2600
[m]
-1400
-1200
-1000
-800
-600
-400
-200
0
dept
h [
m]
outline of the numerical model
Vp [m/s] Vs [m/s]
1400 200
1700 500
2080 1100
2200 1170
2400 1300
3500 1900
TNI TNC TNRWEST EAST
Fig. 8 Simplified geometry of the cross-section of the Adige Valley near TN, considered for numerical simulation with the hybridspectral element–finite element code. The projected positions of the seismic stations are indicated
SEISMIC SITE EFFECTS IN SEDIMENT-FILLED VALLEYS 229
Copyright & 2003 John Wiley & Sons, Ltd. Prog. Struct. Engng Mater. 2003; 5:223–238

at about 10 km from the TN array (Fig. 6), comparisonof data (and a joint study with the Geological Office)indicated that an extrapolation of the valley structureto the seismic array line was feasible, allowing theprojection of the seismic stations on the structure ofthe reflection profile, using the relative distances ofthe stations from the valley edges. The mechanicalproperties of the sediments of the valley, shown inFig. 8, have been derived from SPT tests carried outnear the stations (in the upper 30m of soil), from agravimetric profile carried out along the seismic arrayline, and from the longitudinal wave propagationvelocities measured in the profile. The different soillayers have been considered horizontal andhomogeneous, with linear elastic behaviour. Thepresence of the river, close to the West side of thevalley, has been ignored. The shape ratio SR of thevalley approaches unity (h/a¼ 1.1), so that two-dimensional effects in the seismic response areexpected to be rather pronounced[7].
The two-dimensional numerical simulations havebeen performed by means of the hybrid finiteelement–spectral element code AHNSE[12–15]. Thespatial resolution of the model allowed accuratepropagation of frequencies up to about 9Hz, with aspatial sampling rate of three points per wavelength.The computational mesh is purely spectral, containing851 quadrilateral elements with 5� 5 integrationpoints per element and a total of 13929 grid points.Absorbing boundaries of paraxial type have beenintroduced on the vertical sides of the model and at itsbottom. The incident seismic motion has beenintroduced as a plane horizontal SV wave travellingupwards. Two different simulations have beenperformed describing the incident signal with aRicker wavelet with a maximum frequency of 3 and9Hz respectively. Computations have been performedwith a time step of 1.1�10�4 s.
Fig. 9 shows the displacement time sections for thehorizontal and vertical directions, computed at thesurface of the numerical model, for equally spacedreceivers (3Hz analysis). After the first arrival of theinput wave (at about 2.5–3 s for horizontal traces),interference with surface waves generated at theedges of the valley and propagating horizontally canbe clearly seen. Evidence of resonant two-dimensionalmotion can be noted on the horizontal and verticaltraces within the dashed windows shown in Fig. 9.The sign of the vertical displacements at oppositesides of the valley centre line indicates that the valleywould oscillate with an antisymmetric shape about itsaxis. This corresponds to the second natural vibrationmode of the valley.
Fig. 10 shows, at various surface receivers, thenumerical two-dimensional transfer functions
Fig. 9 TN array. Horizontal (top) and vertical (bottom) displacement time sections for equally spaced receivers at the surface of thenumerical model. Windows indicate evidence of resonant motion in a central portion of the valley
0.4 0.8 1.2 1.6 2Frequency [Hz]
0
5
10
15
20
Sp
ect
ral a
mp
lific
atio
n
from valley edgeto centre
1st SV natural frequencyRayleigh's method
0.71 Hz
2nd SV natural frequencyRayleigh's method
1.12 Hz
3rd SV natural frequencyRayleigh's method
1.7 Hz1D anal.2D num.
Fig. 10 TN array: two-dimensional numerical transfer functionscalculated at different locations at the surface, for incident SVwaves. The estimated natural frequencies for the first threemodes[11] are also indicated, together with the one-dimensionalamplification function at the valley centre
EARTHQUAKE ENGINEERING AND STRUCTURAL DYNAMICS230
Copyright & 2003 John Wiley & Sons, Ltd. Prog. Struct. Engng Mater. 2003; 5:223–238
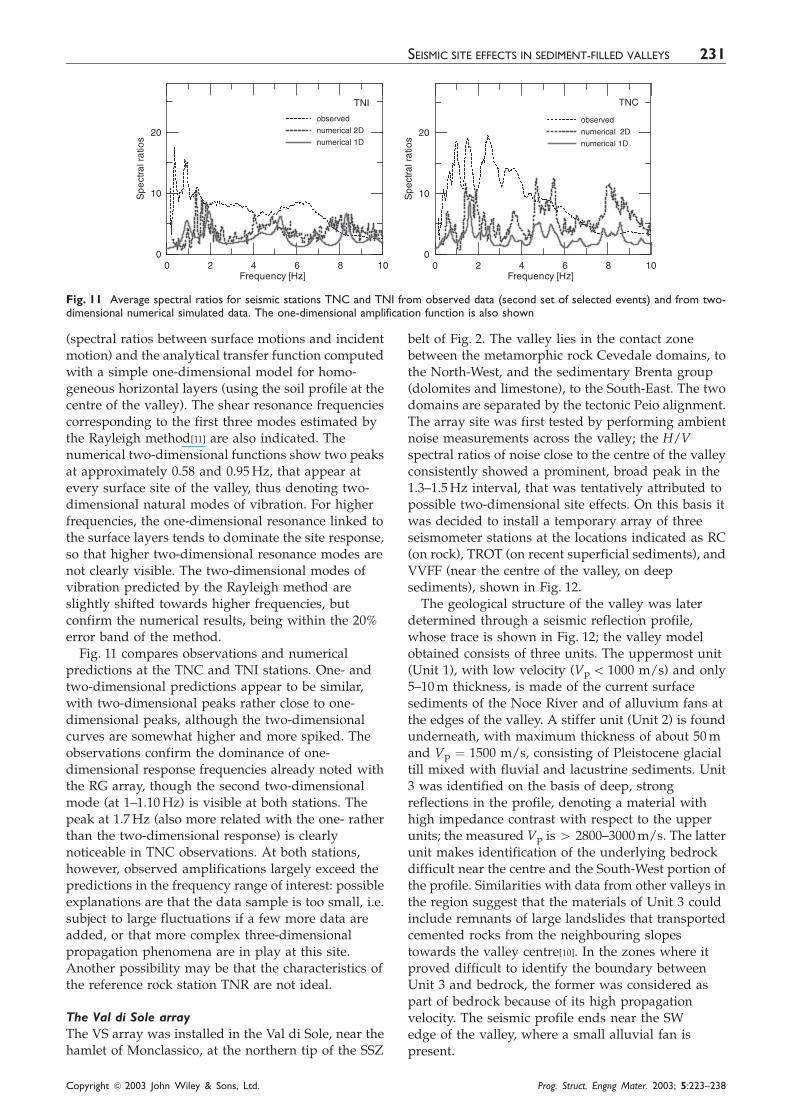
(spectral ratios between surface motions and incidentmotion) and the analytical transfer function computedwith a simple one-dimensional model for homo-geneous horizontal layers (using the soil profile at thecentre of the valley). The shear resonance frequenciescorresponding to the first three modes estimated bythe Rayleigh method[11] are also indicated. Thenumerical two-dimensional functions show two peaksat approximately 0.58 and 0.95Hz, that appear atevery surface site of the valley, thus denoting two-dimensional natural modes of vibration. For higherfrequencies, the one-dimensional resonance linked tothe surface layers tends to dominate the site response,so that higher two-dimensional resonance modes arenot clearly visible. The two-dimensional modes ofvibration predicted by the Rayleigh method areslightly shifted towards higher frequencies, butconfirm the numerical results, being within the 20%error band of the method.
Fig. 11 compares observations and numericalpredictions at the TNC and TNI stations. One- andtwo-dimensional predictions appear to be similar,with two-dimensional peaks rather close to one-dimensional peaks, although the two-dimensionalcurves are somewhat higher and more spiked. Theobservations confirm the dominance of one-dimensional response frequencies already noted withthe RG array, though the second two-dimensionalmode (at 1–1.10Hz) is visible at both stations. Thepeak at 1.7Hz (also more related with the one- ratherthan the two-dimensional response) is clearlynoticeable in TNC observations. At both stations,however, observed amplifications largely exceed thepredictions in the frequency range of interest: possibleexplanations are that the data sample is too small, i.e.subject to large fluctuations if a few more data areadded, or that more complex three-dimensionalpropagation phenomena are in play at this site.Another possibility may be that the characteristics ofthe reference rock station TNR are not ideal.
The Val di Sole array
The VS array was installed in the Val di Sole, near thehamlet of Monclassico, at the northern tip of the SSZ
belt of Fig. 2. The valley lies in the contact zonebetween the metamorphic rock Cevedale domains, tothe North-West, and the sedimentary Brenta group(dolomites and limestone), to the South-East. The twodomains are separated by the tectonic Peio alignment.The array site was first tested by performing ambientnoise measurements across the valley; the H/Vspectral ratios of noise close to the centre of the valleyconsistently showed a prominent, broad peak in the1.3–1.5Hz interval, that was tentatively attributed topossible two-dimensional site effects. On this basis itwas decided to install a temporary array of threeseismometer stations at the locations indicated as RC(on rock), TROT (on recent superficial sediments), andVVFF (near the centre of the valley, on deepsediments), shown in Fig. 12.
The geological structure of the valley was laterdetermined through a seismic reflection profile,whose trace is shown in Fig. 12; the valley modelobtained consists of three units. The uppermost unit(Unit 1), with low velocity (Vp5 1000 m/s) and only5–10m thickness, is made of the current surfacesediments of the Noce River and of alluvium fans atthe edges of the valley. A stiffer unit (Unit 2) is foundunderneath, with maximum thickness of about 50mand Vp ¼ 1500 m/s, consisting of Pleistocene glacialtill mixed with fluvial and lacustrine sediments. Unit3 was identified on the basis of deep, strongreflections in the profile, denoting a material withhigh impedance contrast with respect to the upperunits; the measured Vp is 4 2800–3000m/s. The latterunit makes identification of the underlying bedrockdifficult near the centre and the South-West portion ofthe profile. Similarities with data from other valleys inthe region suggest that the materials of Unit 3 couldinclude remnants of large landslides that transportedcemented rocks from the neighbouring slopestowards the valley centre[10]. In the zones where itproved difficult to identify the boundary betweenUnit 3 and bedrock, the former was considered aspart of bedrock because of its high propagationvelocity. The seismic profile ends near the SWedge of the valley, where a small alluvial fan ispresent.
0
10
20S
pe
ctra
l ra
tios
0 2 4 6 8 10Frequency [Hz]
observed
numerical 2D
numerical 1D
TNI
0
10
20
Sp
ect
ral r
atio
s
0 2 4 6 8 10Frequency [Hz]
observed
numerical 2D
numerical 1D
TNC
Fig. 11 Average spectral ratios for seismic stations TNC and TNI from observed data (second set of selected events) and from two-dimensional numerical simulated data. The one-dimensional amplification function is also shown
SEISMIC SITE EFFECTS IN SEDIMENT-FILLED VALLEYS 231
Copyright & 2003 John Wiley & Sons, Ltd. Prog. Struct. Engng Mater. 2003; 5:223–238

The cross-section in Fig. 12 is about 1100m long andthe largest depth to bedrock is about 160m, giving avalley shape ratio close to 0.3. For this value,occurrence of resonant motion throughout thevalley would require a velocity contrast of at least 5between the bedrock and the (average) sedimentarymaterials[7]. Since this condition cannot be satisfiedwith the velocity values assigned in Fig. 12, expectedmotions will result by a combination of upwardpropagating body waves and horizontally travellingsurface waves generated at the valley edges.
Two SASW (spectral analysis of surface waves)profiles, measured at sites SASW1 (near seismicstation TROT) and SASW2 are also displayed inFig. 12; despite the short distance the two profiles ofthe shear wave velocity Vs are quite different, owingto the heterogeneities in the near-surface Units 1 and2. The approximate weighted average of profileSASW1, i.e. Vs ¼ 150m/s, was associated withUnit 1. For Unit 2, Vs was set at an average value of350 m/s since the two profiles show a variationbetween 250 and 350 m/s. The table in Fig. 12summarizes the soil dynamic properties for the valleymodel to be used in numerical simulations of seismicground response, including Q-factor values[16]. In theperiod May 2000–July 2001, about 15 events wererecorded with signal-to-noise ratios 4 3 over asufficiently wide frequency band at the differentstations; for the present analysis, however, there wereonly 4 events simultaneously recorded at RCand VVFF stations with high signal-to-noise ratio.These include the data from the 17 July 2001, M 5.2Merano earthquake at some 40 km distance, shown inFig. 13.
Illustrated in Fig. 14 is the VVFF/RC averagespectral ratio obtained from the six pairs of horizontalcomponents of three out of the four events justmentioned, together with the average horizontalspectral ratio of the Merano event. The lattergenerated at VVFF and RC station peak horizontalvelocities of 0.738 and 0.196 cm/s, respectively. It isworth noting, as in the previous valley sites, the highand sustained amplification level of the spectral ratios
MONCLASSICO Noce
River
NW
SESASW 1
SASW 2
TROT RC
VVFF
0 100 200 300metres
300
200
100
0Unit 1
Unit 2
Unit 3
Bedrock
NW SE
Material ρ (kg/m3) Vp (m/s) Vs (m/s) Q
Unit 1 2000 800 150 50
Unit 2 2300 1500 350 50
Unit 3 2300 3000 1500 100
Bedrock 5000 3000 200
V (m/s)
-30
-20
-10
0
z (m
)
SASW1
0 100 200 300 400 500
SASW2
2500
Fig. 12 Location of the Val di Sole seismic array stations (VVFF, TROT, RC) and cross-section of the valley along the NW–SE traceshown on the upper left map. The model of the valley as well as the dynamic properties of its materials were based on a seismic reflectionprofile (not shown) conducted along the trace and on the shear wave profiles obtained by SASW method at sites SASW1 and SASW2indicated in the map[16]
-0.6
-0.4
-0.2
0
0.2
0.4
0.6
velo
city
[cm
/s]
0 10 20 30 40 50 60 70 80 90 100time [s]
0 10 20 30 40 50 60 70 80 90 100time [s]
-0.6
-0.4
-0.2
0
0.2
0.4
0.6
velo
city
[cm
/s]
VVFF
RC
Fig. 13 Velocity time traces (NS component) recorded at VVFFand RC stations of Val di Sole seismic array during the M 5.2Merano event of 17 July 2001 (depth¼ 18 km, epicentraldistance¼ 40 km)
EARTHQUAKE ENGINEERING AND STRUCTURAL DYNAMICS232
Copyright & 2003 John Wiley & Sons, Ltd. Prog. Struct. Engng Mater. 2003; 5:223–238

in the wide frequency interval between about 1.5 and7.0Hz. Both sets of data exhibit a broad amplificationpeak of similar shape between about 1.4 and 2.0Hz;the peak level is consistently lower for the strongerevent, a possible effect of a mild nonlinearity in soilresponse, but still contained within the standard errorband of the other events. This peak, as discussedbelow, is probably related to the fundamentalresponse mode in the plane of the valley cross-section.At higher frequencies (4–6Hz), amplification for thestronger event is significantly larger. We shall see thatthe high amplification in this range is well explainedby a two-dimensional model.
As for the TN valley, a discrete two-dimensionalmodel was constructed for VS in order to performtime-domain numerical wave propagation in the planeof the valley cross-section (P-SV), using the samehybrid spectral element–finite element numericalmethod. A salient result of the simulation is illustratedin Fig. 15, which compares the observed VVFF/RCspectral ratio (average of two horizontal components)for the Merano event of July 2001 with the numericaltransfer function at the corresponding receiverposition obtained from the two-dimensional analysis,and also with the numerical one-dimensional transferfunction. The latter was calculated with the soilcolumn underlying the site in question in thehypothesis of linear viscoelastic response. Thecomparison, and the full results of the numericalanalysis, not reported here, clearly support theinterpretation that the low-frequency peak at about1.4Hz is a two-dimensional feature: the frequency ofthe fundamental two-dimensional response mode inthe simulation is in fact 1.3Hz. Further support for thisinterpretation comes from the application of theRayleigh approximation[11] to a simplified valleymodel with three horizontal layers embedded in ahalf-space, which provided fundamental resonancefrequencies between 1.35 and 1.4Hz[16]. On the otherhand, the fundamental one-dimensional frequency is1.2Hz, and the overall features of the one-dimensionalnumerical transfer function appear inadequate to
explain the observations at VVFF: the one-dimensionalpeaks are too narrow and the overall amplificationlevel is too low. In particular, the high amplification inthe 4–6Hz range previously noted in the July 2001record is mostly well reproduced by the two-dimensional analysis.
Finally, in Fig. 16 the average spectral ratiosobtained for a deep alluvium site of each of the threearrays are shown together. The striking similarity inresponse at the RG and VS arrays between about 1and 5Hz should be noted, while the amplificationlevel for the TN site is higher, especially at lowfrequencies. Since both at VS and TN the records werereliable down to about 0.2Hz, the difference is likelydue to the wider and deeper structure of thesedimentary valley at TN. Even disregarding the TNcurve, Fig. 16 confirms that the weak motionearthquake response of the valleys exhibits aconsistently high-amplification level (around 8)over a frequency band extending between about 1 and6Hz.
0 2 4 6 8 10
Frequency [Hz]
0.1
1
10
100
Spe
ctra
l rat
ios
observed VVFF/RC (event 17/7/2001) 1D numerical transfer function2D numerical transfer function
Fig. 15 Standard soil/rock spectral ratio and numerical one- andtwo-dimensional transfer functions at site VVFF
0
10
20
30
Spe
ctra
l rat
ios
average for 3 events (±σ)average for the 17/07/2001 event
0 2 4 6 8 10
Frequency [Hz]
Fig. 14 VS array: average spectral ratios (� 1s bands) of thehorizontal components of the selected events
0 1 2 3 4 5 6 7 8 9 10Frequency [Hz]
0
5
10
15
20
Sp
ect
ral r
atio
s
TNC/TNR (TN)CI/Rock (RG)VVFF/RC (VS)
Fig. 16 Average soil/rock spectral ratios from observed data fordeep alluvium sites of RG, TN and VS seismic arrays
SEISMIC SITE EFFECTS IN SEDIMENT-FILLED VALLEYS 233
Copyright & 2003 John Wiley & Sons, Ltd. Prog. Struct. Engng Mater. 2003; 5:223–238

Implications on design Elastic spectra
As already mentioned, many alpine valleys inNorthern Italy (as well as in France or Switzerland)are characterized by densely populated areas andextensive building. This circumstance, combined withthe fact that these areas are settled on very irregularmorphology and laterally heterogeneous soilconditions, from which complex seismic site effectsmay arise, emphasizes the need of a realisticdefinition of engineering design parameters.
In view also of the new seismic zonation of Italy[17](coming into effect at the time of this writing) theregional administration of the Trento provincepromoted in the late 1990s an extended investigationto quantify the local earthquake ground motionhazard in the Trento urban area. Within the citedzonation, low- and very-low-seismicity areas aredefined by a horizontal maximum groundacceleration on hard ground ag equal to 0.15 g and0.05 g, respectively. Furthermore, the Trentomunicipality is assigned to low-seismicity zones.
Here, we estimate elastic response spectra andmaximum acceleration values for the three seismicstations (TNR, TNC, TNI) of the TN array. Given thelack of strong motion data in the area, we simulatedfuture ground motion of a given intensity, usingavailable recordings of small earthquakes as empiricalGreen’s functions (EGF), and summing themfollowing the scheme of random summationproposed by Ordaz et al.[18]. From simulated eventselastic response spectra were computed andengineering parameters estimated.
SIMULATING FUTURE LARGE EARTHQUAKES
The data used for this study were carefully selectedfrom the events recorded during 1999 by the TNseismic array (second set of data). Table 1 illustratesthe source parameters of the five selected events[19],with M varying from 3.3 to 3.8, identified in Fig. 2 bysolid circles. These events were selected (andprocessed) following the procedure discussed in theprevious section, except for event 5/1 (a local event),which was previously discarded because it had norecording on rock (TNR). An example of theseselected time histories is shown in Fig. 17.
Source parameters
The simulation of future large earthquakes with anEGF method needs an a priori definition of the sourceparameters of both target and small event. Inparticular, these parameters are: seismic moment M0,stress drop Ds and corner frequency fc. As thesummation technique adopted here requires o2
scaling to hold at low and high frequencies of thesource spectra, we estimated source parametersfollowing Brune[20] and Andrews[21].
Starting from the recorded events, we computedFourier spectra, correcting and, where needed, low-pass filtering the signals (as for event 26/4, where weused 10Hz as cut-off frequency). The spectra werethen corrected for attenuation and integrated in orderto calculate fc and the low-frequency spectral levelof source displacement[21], from which M0, andthen Ds[20], were derived:
Ds ¼ M0 � f 3c4:9� 106 bð Þ3
(where b is the average value of velocity in thelithosphere. 3.2 km/s). For the attenuation parametersk and Q0 we used values based on the results fromother studies[22,23]: 0.042 s for k ; 100 for Q0, for eventsrecorded in Friuli, and 200 for events recorded in theTrento area.
Computations were performed with both horizontalcomponents of all the selected events, using the wholeevent and/or the S-wave window. Source parameterswere estimated from the mean values obtained onrock, where available, or on soft soil.
The source parameters definitely used in thesimulation process are shown in Table 2; they havebeen chosen after a great number of simulation tests,with the aim of being consistent with the valuessuggested by other studies[22–24] and by the TrentoProvince, and with the need to calculate as for aspossible, reliable and realistic synthetic motions.
EGF simulation process
The simulation of large earthquakes has been done byan EGF summation technique. The basic assumptionsof this method are that: the small events (the Green’sfunctions) are effectively from step-impulsive point-dislocation sources so that spectral shapes and timeseries are primarily a result of propagation path and
...............................................
......................................................................................................................................................
......................................................................................................................................................
Table 1 Selected small earthquakes for Green’s functions analysis. R is the epicentral distance, Mw the moment magnitude and M0 theseismic moment (Mw ¼ 2/3 log Mo –10.7[19])
Date(1999)
Hour Epicentralregion
R (m) Mw M0 (dyne cm) Records available
TNC TNI TNR
26/4 2.53 Local 16 560 3.5 2� 1021 Yes Yes Yes5/1 3.22 Local 47 040 3.3 1� 1021 Yes Yes No16/7 5.24 Local 58 330 3.5 2� 1021 Yes Yes Yes19/6 20.18 Friuli 131 030 3.7 3.98� 1021 Yes Yes Yes13/5 16.07 Friuli 188 010 3.8 5.62� 1021 Yes Yes Yes
EARTHQUAKE ENGINEERING AND STRUCTURAL DYNAMICS234
Copyright & 2003 John Wiley & Sons, Ltd. Prog. Struct. Engng Mater. 2003; 5:223–238

site effects; they can be interpolated for sourcelocations where small earthquakes did not occur orfor different focal mechanisms and their recording sitegeology has the same linear elastic response for weakand strong ground motion. Users of the methodgenerally postulate some distribution of sub-eventsover a fault plane and sum them in accordance withan assumed geometry of rupture propagation. Wefollowed the summation scheme suggested by Ordazet al.[18], where the number of small events to beadded, their scaling and their time distribution overthe source duration (given by a probability densityfunction) are chosen so that the spectra of both targetand small event conforms to the o2 scaling law overthe entire frequency band of interest.
Response spectra
Two large events were finally simulated as theones actually expected in the Trento area: a ‘local’moderate event of Mw¼ 4.6 and a bigger event ofMw¼ 6, coming from the Friuli region, where thedestructive 1976 earthquake occurred (Mw¼ 6.5).The choice of the first event is dictated by theoccurrence of a damaging event at Riva del Garda(12 December 1976) with similar magnitude. Thesource parameters used for target events are: Ds¼ 100bar, fc¼ 1.57Hz, for Mw¼ 4.6, and Ds¼ 300 bar,fc¼ 0.47Hz, for Mw¼ 6.
We used the small local events recorded by theTN array (the first three in Table 1) to simulate Mw 4.6event, and the small events with Friuli as epicentralregion (the last two in Table 1) for Mw 6 targetevent. In all, 50 simulations were performed with eachhorizontal component of the small events and elasticresponse spectra of acceleration and velocity with5% damping were computed for each simulation. InFig. 18 average horizontal acceleration spectraare shown for each seismic station, together withEurocode 8 spectra of type I (M45.5) and II (M55.5),for rock (soil A, for TNR site) and soil (soil C, forTNC and TNI site); the synthetic spectra shown areidentified by the target Mw value. Although within
0 20 40 60 80 100 120 140 160 180
time [s]
-0.010
-0.005
0.000
0.005
0.010-0.010
-0.005
0.000
0.005
0.010 NS
EW
TN
C (
cm/s
)
0.1 1 10
frequency [Hz]
1E-005
0.0001
0.001
0.01
spe
ctra
l am
plit
ud
esp
ect
ral a
mp
litu
de
spe
ctra
l am
plit
ud
e
NSEW
0 20 40 60 80 100 120 140 160 180
time [s]
-0.010
-0.005
0.000
0.005
0.010-0.010
-0.005
0.000
0.005
0.010
TN
I (cm
/s)
0.1 1 10
frequency [Hz]
1E-005
0.0001
0.001
0.01
NSEW
TN
R (
cm/s
)
0 20 40 60 80 100 120 140 160 180
time [s]
-0.010
-0.005
0.000
0.005
0.010
-0.010
-0.005
0.000
0.005
0.010
0.1 1 10
frequency [Hz]
1E-005
0.0001
0.001
0.01 NSEW
NS
EW
NS
EW
Fig. 17 Velocity time traces and Fourier spectra of horizontal components of motion recorded during a Mw¼ 3.8 event from Friuli atTNC, TNI and TNR seismic stations
........................................................................
........................................................................
Table 2 Source parameters used for small events in thesummation process of Green’s functions
Date M0
(dyne cm)Mw fc (Hz) Dr (bar)
26/4 2.00� 1021 3.5 3.87 305/1 1.00� 1021 3.3 3.38 1016/7 2.00� 1021 3.5 3.38 2019/6 3.84� 1021 3.7 3.11 3013/5 5.62� 1021 3.8 3.25 50
SEISMIC SITE EFFECTS IN SEDIMENT-FILLED VALLEYS 235
Copyright & 2003 John Wiley & Sons, Ltd. Prog. Struct. Engng Mater. 2003; 5:223–238

the new seismic zonation of Italy the Trento areais assigned to low-seismicity zones, we computedEurocode 8 spectra using 0.05 g for ag (the designground acceleration on rock recommended forvery-low-seismicity areas). This has been done for amore realistic comparison with calculated spectra.As shown, spectra for Mw 6 simulations have highervalues for every site and can be considered as the‘expected spectrum’ for the Trento area. In any
case, simulated amplifications tend to be significantlylower than coded ones, at least for periods lower than1 s. Synthetic response spectra, in fact, tend to exhibitrelatively high and sustained amplification values fora broad frequency range, specially for highermagnitudes (Mw¼ 6), suggesting complex two-dimensional site amplification effects taking place inthe Adige Valley, with significant, but not substantial,differences from site to site.
Table 3 shows the expected maximum groundacceleration values for simulated events. Thesevalues have been computed as the average of thehorizontal acceleration response spectra between20 and 30Hz. Expected maximum groundacceleration in the Trento area is then about 0.02 g forsoft sites and 0.006 g for rock, again lower than thoseprescribed by the very recent zonation previouslyquoted.
As a last point concerning elastic spectra we showin Fig. 19 the comparison between coded rockspectrum and response spectra for rock and soil sitesobserved for the 2001 Merano event recorded by theVal di Sole seismic array stations (VVFF for soft soiland RC for hard soil). The Eurocode spectrum clearlyexhibits higher amplification values at all frequencies,and this may be due to the low level of the observedevent. More data and information on the subsurfaceconfiguration would be needed to improve theaccuracy of these observations.
TNC
0.1 1 10
T (s)
1
10
100
aver
age
hor
izon
tal
[cm
/s2]
Friuli Mw 6.0
Local Mw 4.6
EC8 - TYPE I
EC8 - TYPE II
0.1 1 10
T (s)0.1 1 10
T (s)
TNI TNR
Fig. 18 Average acceleration response spectra with 5% damping, for each station of the TN seismic array, simulated with weak motionrecords as EGF. The synthetic spectra are identified by the target Mw value. Eurocode 8[4] horizontal elastic response spectra of type I (forM45.5) and II (for M55.5) for soil (TNC, TNI) and rock (TNR) are shown for comparison
.............
.............
.............
.............
.............
.............
.............
.............
.............
.............
.............
.............
.............
.............
.............
.............
.............
.............
.............
.............
.............
.............
...............................................................................................................................................
Table 3 Maximum ground acceleration for simulated events: average values and standard deviation. Expected values are identified bythe small earthquake used as EGF
Average (cm/s2) Standard deviation (cm/s2) Average (g)
Targetevent
Smallevent
TNR TNI TNC TNR TNI TNC TNR TNI TNC
Mw 4.6 26/4 4.34 9.73 10.28 1.56 3.62 2.8 0.004 0.01 0.015/1 5.73 6.23 1.84 1.74 0.006 0.00616/7 1 4.38 7.31 0.27 1.11 3.05 0.001 0.004 0.007
Mw 6 19/6 1.56 11.77 14.74 1.24 1.71 2.54 0.002 0.012 0.01513/5 5.61 16.5 20.73 1.23 1.52 2.64 0.006 0.017 0.021
0 5 10 15 20 25Frequency [Hz]
0.01
0.1
1
spec
tral
acc
eler
atio
n[m
/s2 ]
EC8 rock
soil
rock
Fig. 19 Response spectra for the event of 17 July 2001 recordedat VVFF (soft soil) and RC (hard soil) stations. Eurocode 8 rockspectrum is shown for comparison
EARTHQUAKE ENGINEERING AND STRUCTURAL DYNAMICS236
Copyright & 2003 John Wiley & Sons, Ltd. Prog. Struct. Engng Mater. 2003; 5:223–238

Conclusions
Concerning the complex features introduced inearthquake ground motions by near-surface geologicalconfigurations with markedly two-, or even three-dimensional geometry, such as the sediment- filledalpine valleys examined in this study, two aspects areworth emphasizing on the basis of the evidencepresented. The first is that the dominant frequencies ofmotions, corresponding to the peaks of experimentalamplification functions, seem mostly controlled by theone-dimensional response of the local sedimentary soilcolumn. Hence, in the case of weak or moderate groundmotions, the frequencies in question can be estimatedwith sufficient accuracy by tools familiar to theearthquake engineer if deep geotechnical borings and/or reliable geophysical surveys (e.g. seismic reflectionprofiles) are available for resolving the layer structureand estimating the S-wave propagation velocities. Thesecond aspect, however, is that one-dimensional wavepropagation models cannot account for the magnitudeof the amplification and the width of the relevantfrequency band observed in weak motion records. Insome cases the two-dimensional models, such as thatillustrated for the VS array, can provide a satisfactoryexplanation of the observed behaviour, while in others,such as the TN array, they are inadequate; possibly, onlyby bringing into the picture the full three-dimensionalgeometry can one expect to improve the accuracy of thenumerical simulations.
The data point to a surprising similarity in theobserved weak motion response at deep alluviumsites in valleys with different dimensions such as RGand VS; this could be related to similarity ingeological structure and mechanical properties of thesediments found in many alpine valleys formed bycombined processes of glacial erosion and riverdeposition.
Simulation of ground shaking for future largeearthquakes by means of empirical Green’s functiontechniques with weak motion data show amplificationvalues significantly lower than those prescribed bythe very recent zonation, specially for periods lowerthan 1 s, and a considerable large response. Werecommend that, when selecting design spectra atvalley sites such as those examined herein, one shouldconsider adopting the code spectra with the widestband of significant periods and the highest siteamplification coefficients compatible with the arealseismic hazard. This recommendation is especiallyrelevant for regions of low and moderate seismicity.
Acknowledgements
The authors are indebted to the Geological Surveyof the Trento provincial administration for thecooperation in providing data and information. Inparticular we gratefully acknowledge the
contributions of Oscar Groaz, Luigi Veronese andLuca Froner. Comments and suggestions of RobertoPaolucci helped to improve the paper. Carlo Meletti,Vera Pessina and Luisa Frassine kindly providedsome of the data. Jose Delgado from the University ofAlicante, Spain, performed some of the analyses forthe Val di Sole array.
References
[1] http://emidius.mi.ingv.it/NT/
[2] Naganoh M, Kagami H & Muratami H. Effects of surface and
subsurface irregularities. In: Earthquake Motions and Ground Conditions. Tokyo:
Architectural Institute of Japan. 1993. Chap. 3.3.
[3] Faccioli E. Seismic amplification in the presence of geological and
topographic irregularities. Proceedings of the 2nd International Conference on
Recent Advances in Geotechnical Earthquake Engineering and Soil Dynamics.
St Louis, 1991: 1779–1797.
[4] Eurocode 8. Design of Structures for Earthquake Resistance. Part I: General
rules, seismic actions and rules for buildings. CEN, January 2003.
[5] Jongmans D & Campillo M. The response of the Ubaye valley (France)
for incident SH and SV waves: comparison between measurements and modelling.
Bulletin Seismological Society of America 1993: 83: 907–924.
[6] Paolucci R, Faccioli E, Chiesa F & Cotignola R. Searching for 2D/3D
site response patterns in weak and strong motion array data from different regions.
Proceedings of the 6th International Conference on Seismic Zonation (6ICSZ) Palm Springs,
12–15 November 2000: Paper 00147. CD-ROM.
[7] Bard PY & Bouchon M. The two dimensional resonance of sediment
filled valleys. Bulletin of the Seismological Society of America 1985: 75: 519–541.
[8] Meletti C, Patacca E & Scandone P. Construction of a seismotectonic
model: the case of Italy. Pure and Applied Geophysics 2000: 157: 11–35.
[9] Onida M, Mirto C, Stucchi M, Galadini F & Leschiutta I. Tettonica
attiva e sismicita nelle Alpi Centrali. In: Galadini F, Meletti C & Redez A (eds). Le
Ricerche del GNDT nel Campo Della Pericolosita Sismica (1996–1999). CNR–Gruppo
Nazionale per la Difesa dai Terremoti. Rome. 2000: 93–104.
[10] Felber M, Vese L, Cocco S, Frei W, Nardin M, Oppizzi P,
Santuliana E & Violanti D. Indagini sismiche e geognostiche nelle valli del Trentino
meridionale (Val d’Adige, Valsugana, Valle del Sarca, Valle del Chiese), Italia. Studi
Trentini di Scienze Naturali } Acta Geologica 2000: 75: 3–52.
[11] Paolucci R. Shear resonance frequencies of alluvial valleys by Rayleigh’s
method. Earthquake Spectra 1999: 15(3): 503–521.
[12] Faccioli E, Maggio F, Paolucci R & Quarteroni A. 2D and 3D elastic
wave propagation by a pseudo-spectral domain decomposition method. Journal of
Seismology 1997: 1: 237–251.
[13] Casadei F & Gabellini E. Implementation of a three-dimensional coupled
spectral element/finite element solver for wave propagation and soil–structure
interaction simulations. Part I}Models. EC EUR Report 17730 EN. JRC, Ispra. 1997.
[14] Casadei F & Gabellini E. Implementation of a three-dimensional coupled
spectral element/finite element solver for wave propagation and soil-structure
interaction simulations. Part II} numerical examples. EC EUR Report 18051 EN. JRC,
Ispra. 1998.
[15] TRISEE. 3D site effects and soil-foundation interaction in earthquake and
vibration risk evaluation. Faccioli E, Paolucci R & Vanini M (eds). Milano. 1998. 92 pp.
(http://www.crs4.it//ssm/Trisee)
[16] Faccioli E & Pessina V. Use of engineering seismology tools in ground
shaking scenarios. In: Lee WHK, Kanamori H, Jennings PC & Kisslinger C (eds).
International Handbook of Earthquake and Engineering Seismology. Academic Press.
Amsterdam 2003. Chap. 62, Part B.
[17] Presidenza del Consiglio dei Ministri. Primi elementi in materia di
criteri generali per la classificazione sismica del territorio nazionale e di normative
tecniche per le costruzioni in zona sismica. Ordinance n. 3274. Rome. 20 March 2003.
[18] Ordaz M, Arboleda J & Singh SK. A scheme of random summation
of an empirical Green’s function to estimate ground motions from future
large earthquakes. Bulletin of the Seismological Society of America 1995: 85: 1635–1647.
[19] Hanks TC & Kanamori H. A moment magnitude scale. Journal of
Geophysical Research 1979: 84: 2348–2350.
SEISMIC SITE EFFECTS IN SEDIMENT-FILLED VALLEYS 237
Copyright & 2003 John Wiley & Sons, Ltd. Prog. Struct. Engng Mater. 2003; 5:223–238

[20] Brune J. Tectonic stress and the spectra of seismic shear waves from
earthquakes. Journal of Geophysical Research 1970: 75(26): 4997–5009.
[21] Andrews DJ. Objective determination of source parameters and
similarity of earthquakes of different size. Earthquake Source Mechanics 1986: 37:
259–267.
[22] Cocco M & Rovelli A. Evidence for the variation of stress drop between
normal and thrust faulting earthquakes in Italy. Journal of Geophysical Research 1989:
94 (B7): 9399–9416.
[23] Rovelli A, Cocco M, Console R, Alessandrini B & Mazza S. Ground
motion waveforms and source spectral scaling from close-distance accelerograms in
a compressional regime area (Friuli, North-eastern Italy). Bulletin of the Seismological
Society of America 1991: 81(1): 57–80.
[24] De Natale G, Faccioli E & Zollo A. Scaling of peak ground motions
from digital recordings of small earthquakes at Campi Flegrei, Southern Italy. Pure and
Applied Geophysics 1988: 126: 37–53.
Professor Ezio Faccioli
Department of Civil Engineering,
Technical University (Politenico) of Milan,
Piazza Leonardo da Vinci 32,
Milan 20133, Italy
E-mail: [email protected]
Manuela VaniniDepartment of Civil Engineering,
Technical University (Politenico) of Milan,
Piazza Leonardo da Vinci 32,
Milan 20133, Italy
E-mail: [email protected]
EARTHQUAKE ENGINEERING AND STRUCTURAL DYNAMICS238
Copyright & 2003 John Wiley & Sons, Ltd. Prog. Struct. Engng Mater. 2003; 5:223–238
Copyright © 2022 FDOKUMEN