Safety Investigation of Partially Filled Railway Tank Cars - CORE
160
Safety Investigation of Partially Filled Railway Tank Cars Iman Hazrati Ashtiani A Thesis in The Department of Mechanical, Industrial and Aerospace Engineering Presented in Partial Fulfillment of the Requirements For the Degree of Doctor of Philosophy (Mechanical Engineering) at Concordia University Montreal, Quebec, Canada May 2018 © Iman Hazrati Ashtiani, 2018
-
Upload
khangminh22 -
Category
Documents
-
view
3 -
download
0
Transcript of Safety Investigation of Partially Filled Railway Tank Cars - CORE
Safety Investigation of Partially Filled Railway Tank Cars
Iman Hazrati Ashtiani
A Thesis
in
The Department
of
Mechanical, Industrial and Aerospace Engineering
Presented in Partial Fulfillment of the Requirements
For the Degree of
Doctor of Philosophy (Mechanical Engineering) at
Concordia University
Montreal, Quebec, Canada
May 2018
© Iman Hazrati Ashtiani, 2018
CONCORDIA UNIVERSITY
SCHOOL OF GRADUATE STUDIES
This is to certify that the thesis prepared
By: Iman Hazrati Ashtiani
Entitled: Safety Investigation of Partially Filled Railway Tank Cars
and submitted in partial fulfillment of the requirements for the degree of
Doctor of Philosophy (Mechanical Engineering)
complies with the regulations of the University and meets the accepted standards with respect to
originality and quality.
Signed by the final examining committee:
Chair
Dr. Tiberiu Popa
External Examiner
Dr. Moustafa El-Gindy
External to Program
Dr. Khaled E. Galal
Examiner
Dr. Youmin Zhang
Examiner
Dr. Ashok Kaushal
Thesis Supervisor
Dr. Subhash Rakheja
Thesis Supervisor
Dr. A.K.W. Ahmed
Approved by
Dr. Ali Dolatabadi Chair of Department or Graduate Program Director
June 22, 2018
Date of Defense
Dr. Amir Asif Dean, Faculty of Engineering and Computer Science
iii
ABSTRACT
Safety investigation of partially filled railway tank cars
Iman Hazrati Ashtiani, Ph.D.
Concordia University, 2018
The adverse effects of liquid cargo slosh on dynamic responses and safety performance of partially
filled road vehicles are well known. The general-purpose railway tank car may also encounter
partial fill conditions due to variations in density of the liquid cargo and track load limit. The
additional slosh forces and moments from the partially filled state of the tank may further affect
the wheel-rail forces, dynamic response, and safety of the rail vehicles. The coupled sloshing cargo
and vehicle system dynamics have been investigated in only a few studies because of complexity
and high computation demand. The objective of this study is to investigate the influence of liquid
cargo sloshing on the dynamic performance of railway tank cars. Other than detail modelling, the
topics of lateral dynamics, curving performance and switch passing responses of partially filled
railway tank cars through a co-simulation approach have been addressed in this dissertation.
The nonlinear damping characteristics of friction wedges in the secondary suspension of a
freight wagon are investigated considering non-smooth unilateral contact, multi-axis motions, slip-
stick conditions, and geometry of the wedges. The parameters of the contact pairs within the
suspension were identified to achieve smooth and efficient numerical solutions while ensuring
adequate accuracy. The friction wedge model was integrated into the multibody dynamic model of
a three-piece bogie to study the effects of wedge properties on hunting characteristics. The resulting
114-degrees-of-freedom wagon model incorporated constraints due to side bearings, axle boxes,
and the centre plates, while the wheel-rail contact forces were obtained using the FastSim
algorithm. The simulation results were obtained to study hunting characteristics of the wagon in
terms of critical speed and the predominant oscillation frequency. The study also examined the
effects of wedge friction and geometry on lateral stability characteristics of the freight car. The
results showed subcritical Hopf bifurcation of dynamic responses of the wagon. The parametric
iv
study showed an increase in the wedge angle, friction coefficient, and springs free length to yield
higher critical speed. The validated dynamic model of the wagon is further used to investigate the
effects of liquid sloshing on hunting speed of partly filled tank car. An analytical liquid slosh model
is used to capture dynamic response of the liquid cargo in a horizontal cylindrical tank using up to
five fundamental modes in the roll plane under lateral as well as yaw motions of the tank car. The
liquid slosh model is co-simulated with the comprehensive nonlinear model of a railway tank car
to evaluate the lateral dynamic response of the tank car. The results suggest that fill levels and the
corresponding slosh forces can adversely affect the lateral stability performance and yield lower
critical hunting speed of railway tank car.
The influence of liquid cargo sloshing on the dynamic performance of railway tanker in a typical
curve negotiation is further examined using the proposed coupled co-simulation model. The
performance measures include car roll angle, unloading of the wheelset and derailment quotient.
The results clearly demonstrate that partial state of the tank car and resulting slosh could lead to a
significantly larger dynamic response of the system and may result in separation of wheel and rail
contact at lower forward speed in comparison to the rigid cargo assumption. Dynamic simulations
of partially filled railway tank cars without fluid slosh consideration will thus lead to
underestimation of overturning critical conditions on the curving manoeuvres. Above performance
measures in a switch-passing manoeuvre is finally examined for different fill ratios and switch
geometries. The results obtained for the coupled vehicle and liquid slosh model clearly showed
strong interactions between the switch-induced transient liquid slosh and vehicle dynamics for the
partial-fill ratio of 60% and less. The effect of fluid slosh on the car body roll angle and wheelset
unloading ratio was observed to diminish with fill ratio above 90%. Neglecting the contributions
due to dynamic slosh force and roll moment may lead to overestimation of the critical speed in
switch-passing manoeuvres if the car is partially filled.
v
ACKNOWLEDGEMENTS
I wish to express my sincere appreciation to my thesis supervisors, Dr. Subhash Rakheja and Dr.
A.K. Waizuddin Ahmed, for their great support and continued guidance and efforts through the
thesis work. It was not possible to survive this undertaking without the discussions and valuable
comments I had with them. I appreciate their time and consideration for reviewing my works
several times. They were always supportive and gave me the opportunity to try.
I would also acknowledge Canadian National Railway for their financial support provided in
the form of Railway Dynamics Fellowship and Concordia University for International Tuition Fee
Remission and Accelerator Awards. Moreover, I should appreciate the Canadian Transportation
Research Forum (CTRF) for granting me one of their prestigious Scholarships for Graduate Study
in Transportation in 2018.
I would like to express appreciation to Dr. Amir Kolaei, who immensely helped me with
developing the liquid slosh code and improving the method. His time and support are highly
appreciated.
I would like to express my special thanks to my family. My parents for their love and
encouragements, for teaching my siblings and me what to avoid but permitting us to pursue our
way of life. I wish I could be a better son!
Finally, I want to acknowledge Mehrnoosh Abedi, my true friend and the wonderful wife. In
past ten years of our companionship, she made immense sacrifices and managed unbearable
situations.
Dear Merhnoosh, you are my champion and your smile is my joy of life!
vi
This dissertation is dedicated to
Mehrnoosh
My lifetime friend, supporter and love.
vii
Contents
LIST OF FIGURES .................................................................................................................................... x
LIST OF TABLES .................................................................................................................................... xv
NOMENCLATURE ................................................................................................................................. xvi
CHAPTER 1 ............................................................................................................................................ - 1 -
Literature review and scopes of the dissertation .................................................................................. - 1 -
1.1 INTRODUCTION ................................................................................................................................ - 1 -
1.2 LITERATURE REVIEW ....................................................................................................................... - 3 -
1.2.1 Dynamics of railway tank cars ................................................................................................ - 3 -
1.2.2 Modeling of the railway wagon ............................................................................................... - 5 -
1.2.3 Wheel-rail contact forces ......................................................................................................... - 7 -
1.2.4 Performance measures of railway tank cars .......................................................................... - 10 -
1.2.5 Liquid slosh models ............................................................................................................... - 15 -
1.2.6 Liquid slosh analysis in railway vehicle ................................................................................ - 18 -
1.3 SCOPE AND OBJECTIVE OF THE DISSERTATION RESEARCH ............................................................ - 22 -
1.4 ORGANIZATION OF THE DISSERTATION ......................................................................................... - 23 -
CHAPTER 2 .......................................................................................................................................... - 26 -
Influence of friction wedge characteristics on lateral response and hunting of freight wagon with
three-piece bogies .................................................................................................................................. - 26 -
2.1 INTRODUCTION .............................................................................................................................. - 26 -
2.2. MULTI-BODY MODEL OF A FREIGHT-CAR WITH THREE-PIECE BOGIES ......................................... - 30 -
2.2.1 Suspension springs modelling ............................................................................................... - 32 -
2.2.2 Frictional wedges modelling.................................................................................................. - 34 -
2.2.3 Identification of contact parameters ...................................................................................... - 36 -
2.3 STABILITY ANALYSIS OF WAGON .................................................................................................. - 41 -
2.3.1 Sensitivity analysis of the lateral response of the system ...................................................... - 42 -
2.3.2 Bifurcation analysis ............................................................................................................... - 46 -
2.3.3 Effects of wedge parameters on lateral stability of wagon .................................................... - 49 -
2.4 CONCLUSIONS ............................................................................................................................... - 54 -
CHAPTER 3 .......................................................................................................................................... - 55 -
viii
Hunting analysis of a railway tank car subject to the partially filled state of the tanker ............... - 55 -
3.1 INTRODUCTION .............................................................................................................................. - 55 -
3.2 MODEL FORMULATION .................................................................................................................. - 58 -
3.2.1 Multi-body model of the tank car .......................................................................................... - 58 -
3.2.2 Liquid cargo slosh analysis .................................................................................................... - 61 -
3.3 METHOD OF ANALYSIS .................................................................................................................. - 66 -
3.4 RESULTS AND DISCUSSIONS .......................................................................................................... - 69 -
3.4.1. Liquid slosh natural frequency and hydrodynamic coefficients ........................................... - 69 -
3.4.2 Hunting analysis of empty tank car ....................................................................................... - 73 -
3.4.3 Hunting analysis of partly filled tank car............................................................................... - 74 -
3.5 CONCLUSIONS ............................................................................................................................... - 79 -
CHAPTER 4 .......................................................................................................................................... - 81 -
Effects of coupled liquid cargo sloshing on roll response of partly filled railway tank cars .......... - 81 -
4.1 INTRODUCTION .............................................................................................................................. - 81 -
4.2 MODEL FORMULATIONS ................................................................................................................ - 83 -
4.2.1 Multi-body dynamic model of the tank car ........................................................................... - 83 -
4.2.2 Liquid slosh model ................................................................................................................ - 86 -
4.3 METHOD OF ANALYSIS .................................................................................................................. - 91 -
4.4 RESULT AND DISCUSSIONS ............................................................................................................ - 93 -
4.4.1 Validation of the liquid slosh model ...................................................................................... - 93 -
4.4.2 Effects of liquid cargo Sloshing during curving .................................................................... - 95 -
4.4.3 Liquid cargo sloshing and overturning ................................................................................ - 101 -
4.5 CONCLUSIONS ............................................................................................................................. - 103 -
CHAPTER 5 ........................................................................................................................................ - 104 -
Investigation of coupled railway tank car dynamics and liquid cargo response subject to switch
passing maneuver ................................................................................................................................ - 104 -
5.1 INTRODUCTION ............................................................................................................................ - 104 -
5.2 MODEL FORMULATIONS .............................................................................................................. - 108 -
5.2.1 Multi-body dynamic model of the tank car ......................................................................... - 108 -
5.2.2 Liquid slosh model .............................................................................................................. - 110 -
5.3 METHOD OF ANALYSIS ................................................................................................................ - 114 -
5.4 RESULT AND DISCUSSIONS .......................................................................................................... - 117 -
ix
5.4.1 Liquid slosh model validations ............................................................................................ - 117 -
5.4.2 Effects of liquid cargo sloshing during switch passing maneuvers ..................................... - 120 -
5.4.3 Critical switch negotiation speeds ....................................................................................... - 127 -
5.5 CONCLUSIONS ............................................................................................................................. - 129 -
CHAPTER 6 ........................................................................................................................................ - 130 -
Conclusions and recommendations ................................................................................................... - 130 -
6.1 MAJOR CONTRIBUTIONS AND HIGHLIGHTS OF THE DISSERTATION RESEARCH ........................... - 130 -
6.2 MAJOR CONCLUSIONS ................................................................................................................. - 131 -
6.3 RECOMMENDATIONS FOR FUTURE STUDIES ................................................................................ - 134 -
References ............................................................................................................................................ - 135 -
x
LIST OF FIGURES
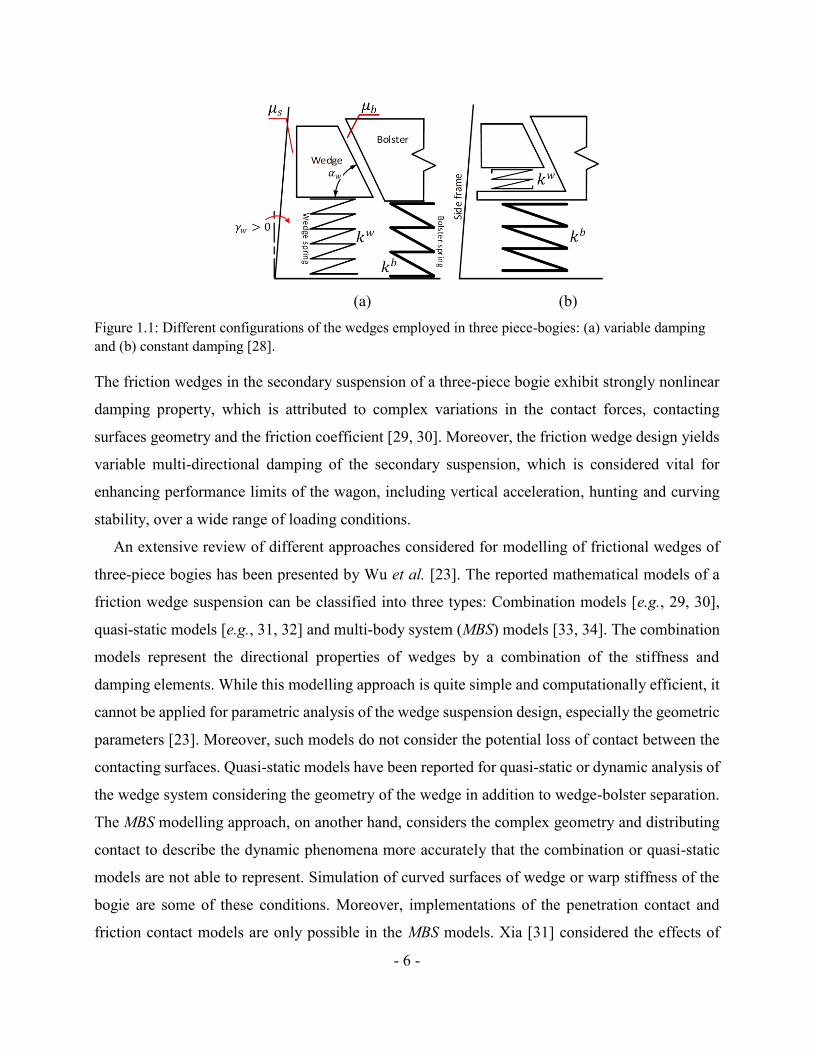
Figure 1.1: Different configurations of the wedges employed in three piece-bogies: (a) variable damping
and (b) constant damping [28]. .................................................................................................................. - 6 -
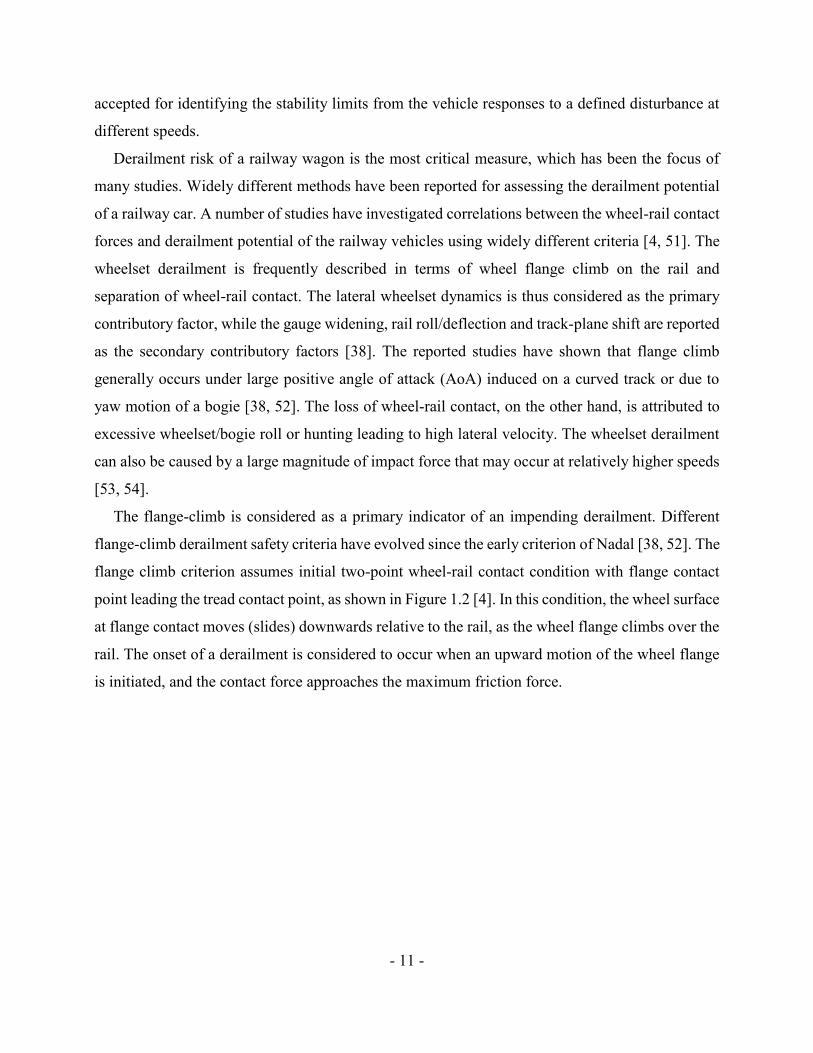
Figure 1.2: Illustration of the Nadal’s wheel-flange contact: (a) two wheel-rail contact points under a positive
angle of attack; and (b) wheel-rail contact corresponding to onset of a potential derailment [4, 38]. .... - 12 -
Figure 2.1: (a) Side-view; and (b) top-view of a typical three piece bogie [38]. .................................... - 31 -
Figure 2.2: Multi-directional deflection and effective stiffness of suspension springs. .......................... - 32 -
Figure 2.3: Schematic of the contact points-planes between the wedge and the bolster, and wedge and the
side frame; (a) Isometric view; and (b) top view of the bolster showing, 1 mm lateral gap between the wedge
and the bolster. ......................................................................................................................................... - 34 -
Figure 2.4: Effects of variations in contact stiffness and damping on (a,b) vertical contact force-
displacement and; (c,d) vertical contact force-velocity response characteristics. ................................... - 38 -
Figure 2.5: Effect of loading condition on response of contact forces in vertical direction; (a) force-
displacement and (b) force-velocity responses. ....................................................................................... - 39 -
Figure 2.6: Lateral response of system subject to the lateral direction for loaded unloaded condition; (a)
lateral displacement; and (b) lateral velocity. .......................................................................................... - 40 -
Figure 2.7: Phase plane orbits of the leading wheelset subjected to 5 mm lateral disturbance at two different
speeds: (a) 17 m/s and (b) 23 m/s. ........................................................................................................... - 42 -
Figure 2.8: Lateral displacement responses of the first wheelset under varying magnitudes of lateral track
disturbance at different speeds. ............................................................................................................... - 44 -
Figure 2.9: Variations in the dominant frequency of lateral movements of the first wheelset of the wagon as
a function of the forward speed and lateral disturbance magnitude. ....................................................... - 45 -
Figure 2.10: Simulation procedure for identifying bifurcation points and limit cycle response. ............ - 46 -
xi
Figure 2.11: Bifurcation diagram of the response of the unloaded wagon with three-piece bogies. ....... - 47 -
Figure 2.12: Influences of variations in wedge angle and friction coefficients on the bifurcation diagram: (a)
Type I-Baseline (b) Type II-Baseline; (c) Type I-Modified; (d) Type II-Modified; (e) Type I-Symmetric; (f)
Type II-Symmetric. ................................................................................................................................. - 51 -
Figure 2.13: Influence of wedge-bolster friction coefficient on the lateral velocity-lateral displacement
responses of the first bolster at a forward speed of 39 m/s (α=45). ......................................................... - 52 -
Figure 2.14: Percentage change in the identified critical speed by 10 mm preload of wedge springs. ... - 53 -
Figure 3.1: Schematic view of the clearances between (a) the wedge and the bolster/side frame; (b) the
wheelset and the axle box; and (c) the car body and the bolster via the center plate. ............................. - 59 -
Figure 3.2: Different cargo models and partially filled terms, (a) frozen, (b) pendulum and (c) liquid slosh
models. .................................................................................................................................................... - 61 -
Figure 3.3: The vehicle and slosh models co-simulation scheme. .......................................................... - 68 -
Figure 3.4: The comparison of the normalized roll mass moment of inertia of fluid as a function of fill
conditions for frozen, pendulum, and liquid models. .............................................................................. - 71 -
Figure 3.5: (a) Car body yaw rate input; and (b) comparison of the proposed yaw slosh simulation response
with CFD simulation for 74% fill with water. ......................................................................................... - 72 -
Figure 3.6: Bifurcation diagram of the empty wagon. ............................................................................ - 74 -
Figure 3.7: Lateral movements of the first and third wheelsets for 97% filled in different modeling
approaches (a) Frozen (b) Pendulum, (c) Liquid cargos without slosh yaw effect and (d) Liquid at 40 m/s
forward speed. ......................................................................................................................................... - 75 -
Figure 3.8: Lateral movements of the first and third wheelsets for 97% fill level in different modeling
approaches (a) Frozen (b) Pendulum, (c) Liquid cargos without slosh yaw effect and (d) Liquid at 48 m/s
forward speed. ......................................................................................................................................... - 75 -
xii
Figure 3.9: Bifurcation diagram of the partially filled railway tank car for (a) Frozen, (b) Pendulum, (c)
Liquid without yaw effect of slosh and (d) Liquid modeling approaches of cargo. ................................. - 77 -
Figure 4.1: Schematic of the railway tank car model with three-piece bogies: 1) underframe, 2) tanker, 3)
three-piece bogie (dimensions are in mm). .............................................................................................. - 84 -
Figure 4.2: Interactions of the car body with the bolster and the center plate, represented by planar visco-
elastic contact elements. .......................................................................................................................... - 85 -
Figure 4.3: Two-dimensional fluid motion in a circular cross-section tank. ........................................... - 86 -
Figure 4.4: The vehicle and slosh models co-simulation scheme. .......................................................... - 91 -
Figure 4.5: (a,b) Comparisons of normalized frequencies and hydrodynamic coefficients corresponding to
four lower antisymmetric modes obtained from the model with those in the reported studies; and (c)
variations in resultant normalized lateral slosh force for the 50%-filled tank subject to a constant lateral
acceleration. ............................................................................................................................................. - 95 -
Figure 4.6: Comparisons of roll angle response of the car with liquid and equivalent rigid cargos during a
600 m radius right-handed curve at a speed of 17 m/s for different fill ratios: (a) Rigid; and (b) liquid cargos.
................................................................................................................................................................. - 96 -
Figure 4.7: Comparisons of lateral force and roll moment components attributed to fluid slosh for the 60%
and 90% fill ratios of the car subject to curving: (a) Lateral force, 𝐹𝑆𝑡; and (b) Roll moment, 𝑀𝑉𝑡. .... - 97 -
Figure 4.8: Unloading ratio response of the outer wheel of leading wheelset, 𝑤𝑠𝑡1𝑙, during a 600 m right-
handed curve at 17 m/s forward speed for different fill ratios: a) 60%; and b) 90%. .............................. - 98 -
Figure 4.9: Comparisons of derailment ratios of the leading wheelset of the car with 60%-filled liquid and
equivalent rigid cargos while negotiating the 600 m radius curve at the speed of 20 m/s:(a) outer wheel,
𝑤𝑠𝑡1𝑙 and (b) inner wheel, 𝑤𝑠𝑡1𝑟. ......................................................................................................... - 98 -
Figure 4.10: Comparisons of the unloading ratio responses of the outer wheel of the leading wheelset, 𝑤𝑠𝑡1𝑙,
xiii
of the car with 60%-filled liquid and equivalent rigid cargos during super-elevated curve at different speeds:
(a) 15 m/s; (b) 17 m/s; and (c) 20 m/s. ..................................................................................................... - 99 -
Figure 4.11: Lateral displacement responses of the 60%-filled liquid and equivalent rigid cargo cars with
respect to track centerline while negotiating the 600 m radius super-elevated curve at different speeds: (a)
15 m/s; (b) 17 m/s; and (c) 20 m/s. ........................................................................................................ - 100 -
Figure 4.12: Derailment ratio values of the leading wheelset of the 60%-filled liquid and equivalent rigid
cargo cars while negotiating the 600 m radius super-elevated curve at different speeds: (a) 15 m/s; (b) 17
m/s; and (c) 20 m/s. ............................................................................................................................... - 101 -
Figure 4.13: Comparison of critical performance measures of the liquid and equivalent rigid cargos in
different filled conditions in terms of lateral acceleration threshold in curving. ................................... - 102 -
Figure 5.1: (a) Top view and (b) side view of the friction wedge suspension [28, 35]. (a) top view of wedge
and spring group suspension (b) side view of the wedge suspension. .................................................. - 109 -
Figure 5.2: (a) Circular cross-section tank with liquid free surface; and (b) two-dimensional motion of the
liquid free surface. ................................................................................................................................. - 110 -
Figure 5.3: The top view of a typical railway switch. ........................................................................... - 115 -
Figure 5.4: Variations in (a) natural frequencies; (b) hydrodynamic coefficients; and (c) normalized damping
coefficient corresponding to lower four antisymmetric modes with the fill ratio. ................................ - 118 -
Figure 5.5: (a) Lateral acceleration of car body passing a 300-1/11 switch at 17 m/s speed for 75% fill
condition; (b) the variations of liquid slosh, 𝐹𝑠(𝑡), subject to the given excitation with proposed liquid slosh
model and alternative CFD model. ....................................................................................................... - 118 -
Figure 5.6: Comparisons of roll angle responses of the car body with liquid and equivalent rigid cargos
during a switch passing maneuver at a speed of 15 m/s for different fill ratios: (a) 60% and (b) 90%. - 121 -
Figure 5.7: Comparisons of lateral slosh force and roll moment responses of the tank car with 60 and 90%
fill ratios while negotiating the 300-1/11 switch at 15 m/s forward speed: (a) lateral force, 𝐹𝑦, 𝑆(𝑡) and (b)
xiv
roll moment, 𝑀𝑉(𝑡). ............................................................................................................................. - 121 -
Figure 5.8: Comparisons of wheelset lateral force responses of the tank car with 60%-filled liquid and rigid
cargos while passing a 300-1/11 switch at 17 m/s forward speed: (a) 𝑤𝑠𝑡1; (b) 𝑤𝑠𝑡2; (c) 𝑤𝑠𝑡3; (d) 𝑤𝑠𝑡4;
and (e) notations of the wheelsets. ........................................................................................................ - 123 -
Figure 5.9: Comparisons of unloading ratio responses of the outer wheel of the leading wheelset, 𝑤𝑠𝑡1𝑙, of
the car with 60%-filled liquid and equivalent rigid cargos during passing a 300-1/11 switch at different
speeds: (a) 15 m/s; and (b) 20 m/s. ........................................................................................................ - 124 -
Figure 5.10: The derailment ratio responses of wheels of the leading wheelset of the car with 60%-filled
liquid and equivalent rigid cargos while passing the 300-1/11 switch at the speed of 20 m/s: (a) 𝑤𝑠𝑡1𝑙; and
(b) 𝑤𝑠𝑡1𝑟. .............................................................................................................................................. - 125 -
Figure 5.11: Comparisons of Weinstock ratios of different wheelsets of the 60% filled tank car while passing
a switch at 17 m/s forward speed, (a) 𝑤𝑠𝑡1𝑙, (b) 𝑤𝑠𝑡3𝑙, (c) 𝑤𝑠𝑡1𝑟, (d) 𝑤𝑠𝑡3𝑟. .................................. - 126 -
Figure 5.12: Comparisons of critical speeds of the tank car with rigid and liquid cargos in the 40 to 97% fill
range, while negotiating two different switch geometries (300-1/11 and 200-1/9). .............................. - 128 -
xv
LIST OF TABLES
Table 2.1: Inertial and geometric properties of the components [109-111]. ............................................ - 31 -
Table 2.2: Total effective stiffness coefficients of the secondary suspension springs supporting the wedge
and the bolster. ......................................................................................................................................... - 33 -
Table 2.3: Contact parameters of different components of the wagon. ................................................... - 38 -
Table 2.4: Geometry and friction parameters of the selected wedge configurations. .............................. - 49 -
Table 3.1: Fill conditions under of tank car subject to different liquid cargos. ....................................... - 67 -
Table 3.2: Normalized slosh normalized natural frequencies and hydrodynamic coefficients for nine modes
for different fill ratios. ............................................................................................................................. - 69 -
Table 3.3: Forward speeds of the vehicle for different fill conditions and modeling approaches that lead to
the initiation of oscillatory hunting response. ......................................................................................... - 76 -
Table 3.4: Critical hunting speeds of the railway tank car for different fill ratios. .................................. - 78 -
Table 5.1: Liquid slosh analysis methods used in reported studies in railway dynamics ...................... - 105 -
Table 5.2: Simulation parameters of multibody dynamic of the tank car [109-111, 143]. .................... - 109 -
Table 5.3: The values and definition of witch parameters [110]. .......................................................... - 116 -
xvi
NOMENCLATURE
SYMBOL DESCRIPTION
𝛼𝑤 Friction wedge angle
𝑘𝑤 Springs of wedge
𝑘𝑏 Springs of the bolster
𝜇𝑠 Friction coefficients between wedge-side frame
𝜇𝑏 Friction coefficients between wedge-bolster
𝛾𝑤 Toe condition of side frame
G Modulus of rigidity
v Poisson’s ratio
μ Friction coefficient on the flange
𝜇𝑡 Friction coefficient in tread region
Y/Q Nadal derailment coefficient
Y Transverse wheel-rail force
Q Vertical wheel-rail force
Fn Normal force of wheel
FT Tangential friction work
𝑘𝑥𝑥 Effective stiffness in longitudinal (x)
𝑘𝑦𝑦 Effective stiffness in longitudinal (y)
𝑘𝑧𝑧 Effective stiffness in longitudinal (z)
𝑘𝜃 Bending stiffness of the springs corresponding to angular deformations about x
𝑘𝛽 Bending stiffness of the springs corresponding to angular deformations about y
𝑘𝜓 Bending stiffness of the springs corresponding to angular deformations about z
Δ Penetration of contact point
Kc Contact stiffness
Cc Damping coefficient of contact point in point-plan model
𝐹𝑠 Friction Force in point-plane contact model
𝜇0 Static friction coefficient
𝜇𝑠 Dynamic friction coefficient
𝜐 𝑠 Sliding velocity vector
xvii
𝑣𝑠𝑡𝑟 Stribeck velocity
𝜇∞ Friction Coefficient at high sliding velocity
𝛿 Empirical exponent of transition in friction coefficient
��𝑤 Lateral displacement of leading wheelset c.g.
��𝑤 Lateral velocity of leading wheelset at c.g.
O Geometric center of Tank
𝑧𝑐.𝑔. Vertical coordinate of the liquid cargo mass center for a given fill ratio
𝑔 Acceleration of gravity
R Cylindrical tank radius
H Liquid fill height
Oyz Tank-fixed coordinate system
𝑦0 Coordinates of the free-surface at the intersection of the tank wall
𝑧0 Coordinates of the free-surface at the intersection of the tank wall
𝜏 Fluid domain
S𝑓 Liquid free surface
𝑆𝑤 Wetted surface of the tank wall
Φ Potential function
ΦR Velocity potential of rigid body motion of liquid
ΦS Velocity potential of relative motion of liquid
��(𝑡) Lateral velocity of the container
��(𝑡) Vertical velocity of the container
𝜃(𝑡) Roll angle of the container
Φ𝑠𝑡 Stokes-Joukowski potential
𝜑𝑖 Natural mode liquid movements
𝛾𝑖 Generalized coordinates
𝜎𝑖 Circular frequency of free surface oscillations
𝜆𝑖 Time-invariable hydrodynamic coefficient
𝜉𝑖 Time-invariable damping coefficient
𝜈𝑠 Liquid cargo kinematic viscosity
𝜌 Fluid density
xviii
m Fluid mass per unit length
L Length of the tank
��𝑖 Normalized damping ratio of liquid cargo
𝑃(𝑦, 𝑧, 𝑡) Hydrodynamic pressure distribution
𝐹𝑧(𝑡) The vertical force of liquid cargo acting on the container
Ω𝑖 Normalized Frequency
ACRONYM DESCRIPTION
UM Universal Mechanism
FRA Federal Railway Association
TC Transportation Canada
DOT Department of Transportation
DoF Degree of Freedom
FE Finite Element
CFD Computational Fluid Dynamic
VoF Volume of Fluid
ANCF Absolute nodal coordinate formulation
FFT Fast Fourier Transform
PSD Power Spectral Density
AoA Angle of attack
UIC Union Internationale des Chemins de fer (International Union of Railway)
c.g. Center of gravity
MBD Multibody dynamics
MBS Multibody system
EN European Norms
AAR Association of American Railroad
ECP Electronically Controlled Pneumatic
- 1 -
CHAPTER 1
Literature review and scopes of the dissertation
1.1 Introduction
Directional stability and dynamics of railway wagons have been extensively investigated over the
past many decades. These have particularly focused on lateral and longitudinal dynamics that are
known to relate to derailment risks. Among the reported 1067 rail accidents in Canada in 2013,
70% involved freight trains. Moreover, 58% of the reported accidents resulted in derailments,
although 48% of these were non-main-track derailments (such as those in the yards) occurring at
low speeds [1]. Main-track derailments could be catastrophic, particularly, when dangerous goods
are involved considering the associated risks to public safety, property in commerce and the
environment. In North America, railway tank cars are the primary movers of hazardous materials,
including petrochemicals, accounting for nearly 20% of the total US fleet (281,923 tank cars) [2].
The curving stability and derailment potential of a railway freight car are strongly influenced
by a number of design and operational factors such as the axle loads, bogie and coupling designs,
track geometry and the travelling speed. For tank cars, liquid free surface movement and thus the
cargo load shift and associated interactions with the car constitute an additional important factor
leading to higher derailment potential, when the tank car is partially-filled [3]. Railway tank cars,
similar to road tankers, in many situations, are known to transport liquid cargos in the partial-fill
state due to variations in density of the liquid cargo and the regulatory load limits. The liquid cargo
movement in a tank car during curve negotiation and/or barking maneuvers can lead to more crucial
lateral/longitudinal and rotational motions of the container, which may adversely affect the wheel-
rail contact forces leading to reduced curving instability and higher derailment potentials [e.g., 4,
5].
Transverse baffles are widely used in highway tanks to limit the liquid cargo free surface
motion, also denoted as fluid slosh, and thus the cargo shift in the longitudinal plane so as to
preserve the braking performance of the vehicle. Such baffles, however, offer only minimal
resistance to cargo slosh in the roll plane caused by a steering maneuver [6]. The use of baffles in
railway tank cars, however, is extremely limited since these tend to increase tare weight of the car
and interfere with cleaning, drain and inspection. A partial fill condition in a tank, however, yields
relatively lower centre of gravity (c.g.) height compared to a completely filled tank, which may be
- 2 -
expected to be beneficial in the context of the curving stability in the absence of load shift due to
cargo slosh. For highway tankers, however, it has been shown a lower fill volume yields higher
load shift and magnitudes of slosh forces, which affects the roll stability of the vehicle in a highly
adverse manner [7, 8].
While the handling, cornering and jack-knifing potential of partially-filled road tankers have
been widely investigated, the effect of cargo movement on the dynamics of railway tank cars has
been addressed in only a few studies [3]. The load shift across the wheelsets and the bogies of a
railway wagon could lead to excessive roll and/or loss of contact between the rail and the wheel,
reduced curving performance and lower critical speeds, which have not yet been investigated in
the presence of fluid slosh. Lateral dynamics (hunting oscillations) of a freight car on a tangent
track is also a critical performance measure that limits the operating speed. An in-depth study on
the influence of fluid slosh on the hunting stability would thus also be of significant interest as
none has been reported to date.
This dissertation research focuses on analyses of effects liquid cargo slosh in the roll plane on
the hunting, curving and switch-passing response characteristics of a partially-filled tank car.
Owing to the important effects of secondary suspensions and various friction pairs on dynamics of
the car, a comprehensive multi-body dynamic model of the vehicle model was formulated
considering multi-dimensional suspension properties and nonlinear subsystem models. An
analytical fluid slosh model was formulated using the mode summation approach to evaluate the
lateral slosh force and roll moment due to lateral acceleration, and roll and yaw motions of the car
body. The model, owing to its superior computational efficiency, was integrated to the multibody
dynamic vehicle model via co-simulations in order to investigate the interactions of the moving
cargo with the wagon. The effects of forces and moments arising from the free surface movements
are investigated on the hunting and curving performance, and wagon’s responses during a switch-
passing maneuver. The simulation results are obtained for different fill volumes of the tank, and
results are further analyzed in terms of measures like critical hunting speed, unloading ratio,
different derailment quotient, car body roll angle and lateral wheelset loads.
- 3 -
1.2 Literature review
Safety dynamic analyses of a partly filled tank car encompasses various challenges involving
modelling the railway tank car with inherent nonlinearities of various subsystems, modelling of
dynamic wheel-rail interactions, modelling for liquid cargo dynamics, simulation methodologies
for hunting and curving responses, and more. The reported relevant studies are reviewed and
discussed in a systematic manner so as to build essential knowledge on the challenges and methods
of analysis. The reported studies grouped under relevant subjects are briefly discussed below in
order to develop the scope of the investigation.
1.2.1 Dynamics of railway tank cars
With growing demands for high load capacity and higher speeds for railway freight cars, the
stability of railway vehicles has been widely investigated to establish safe operating limits and to
seek improved designs [9, 10]. The hunting properties of railway cars, in particular, have been
extensively studied using widely different methods [11, 12]. These have reported the critical
hunting speeds as the lowest running speed at which a constant amplitude limit cycle motion of a
wheelset occurs. Standardized guidelines have also been developed for assessing the lateral
stability limits of railway vehicles [13-15]. Early studies employing linear or linearized wheel/rail
contact and suspension component models, invariably, revealed zero lateral mode damping, when
a critical speed was reached [9, 10]. The kinematic and constitutive relations for the wheel-rail
contact as well as the truck and suspension components, however, are strongly nonlinear. A number
of studies have conducted nonlinear hunting analyses by defining quasi-linear component
characteristics using the describing functions for the nonlinear subsystems [12, 16]. In the quasi-
linear approach, the motion of the system is approximated by a harmonic function at a particular
frequency. Further studies, however, have shown weak correlations between the measured critical
speeds and those obtained from the quasi-linear analyses [17].
Huilgol [18] was the first to show the presence of Hopf bifurcation in the responses of a wheelset
model with nonlinear wheel/rail contact forces. Subsequently, some studies investigated
bifurcations in the lateral responses of different rail truck models, incorporating nonlinear creep-
creep force relationship and wheel/rail contact geometry [11]. These have concluded that the
subcritical Hopf bifurcation is common in railway vehicles’ responses [19], and thus raised
significant concerns about the validity of the concept of critical speed derived from the linear
- 4 -
theories. The nonlinear stability of the freight cars has also been reported using the continuation-
based bifurcation analysis [20]. Yang and Chen [21] also studied the Hopf bifurcation in a railway
truck with suspension nonlinearities and concluded that the suspension hysteresis can lead to
supercritical bifurcations. The study also reported the influence of system parameters on the
amplitude of the limit cycle motion. Wickens [22] conducted nonlinear stability analyses of four
different bogie configurations and illustrated important effects of wheel-rail contact friction
coefficient and traction ratio. It was shown that the stability of a passive bogie is generally very
robust under varying traction and braking conditions as well as with variations in the friction
coefficient. In case of an actively controlled bogie with rigid wheelsets, it was shown that the creep
saturation could reduce the stability limit significantly. Through analyses of both the linear and
non-linear wheel/rail creep and geometry models, Polach [12, 20] showed that the linearized
analysis coupled with the tuning of the suspension damping and contact parameters could lead to
lower critical speeds compared to the those predicted from the non-linear models.
An accurate estimation of the critical speed is vital for the complex railway system such as a
three-piece railway bogie, since it provides essential information leading to designs of components
and wheel/rail profiles. Accurate predictions of the critical speeds and dynamic responses,
however, necessitate in-depth nonlinear component modelling and analysis. The vast majority of
the reported nonlinear analyses utilize simplified representations of the friction damping in the
secondary suspension [e.g., 23, 24]. The friction wedges in the secondary suspension of a three-
piece truck exhibit strongly nonlinear damping property, which is attributed to complex variations
in the contact forces, contacting surfaces geometry and the friction coefficient [25]. Moreover, the
friction wedge design yields variable multi-directional and highly nonlinear damping properties of
the secondary suspension, which could enhance the performance limits over a wide range of
loading conditions. The reported studies, however, generally represent the friction wedges by
simplified kinematic constraints and equivalent linear vertical/lateral damping [23], which may not
represent the secondary suspension components accurately over the probable ranges of loading and
operating conditions.
Accurate analyses of hunting and curving performance characteristics of a railway car
necessitate comprehensive modelling of the subsystems such as the bogie, primary and secondary
suspension, wheel-rail contact geometry, and normal and creep contact forces. These invariably
exhibit strong nonlinear properties. Widely different component models with varying complexities
- 5 -
have been reported. Furthermore, the reported studies have employed widely different analyses
methodologies and performance measures for assessing the lateral/yaw dynamic responses. The
reported component models, analyses methods and performance measures are discussed in the
following sub-sections.
1.2.2 Modeling of the railway wagon
The heavy-haul freight cars used in North America, Australia and Russia generally employ three-
piece bogies. The structure of a three-piece bogie comprises a bolster interfaced with two side
frames with spring nests and wedges, which provide nonlinear friction damping for the suspension.
Such highly nonlinear frictional suspensions are common in freight railway cars due to their low
maintenance and production costs. The modelling of strongly nonlinear and multi-dimensional
properties of the suspension, however, continues to be most challenging. Damping in this bogie
design is due to dry friction in multiple interfaces formed by the wedges, center plate, side bearings
and the adapters. Although the general concept of the bogie design has not changed over the past
many decades, different generations of this bogie have included modifications in the springs as
well as side bearings and wedges to achieve more safe and efficient operations [26, 27].
The highly complex designs of friction wedges provide variable multi-directional damping in
the secondary suspension to enhance performance limits of the vehicle over a wide range of loading
condition. Different combination of wedges and the suspension systems employed in three-piece
bogies can be classified as variable and constant frictional damping on the bases of the design, as
shown in Figure 1.1 [28]. In the variable damping design, the resultant normal forces in the
contacting faces of wedges can be expressed as functions of relative deflections of the wedge and
bolster springs (𝑘𝑤 and 𝑘𝑏,respectively) in addition to the wedge angle, 𝛼𝑤. On the other hand, in
the constant damping design presented in Figure 1.1(b), the preloaded wedge spring generates
constant normal forces in wedge-side frame and wedge-bolster contact faces. The resulting friction
forces are further related to friction coefficients between wedge and side frame, 𝜇𝑠, and wedge and
bolster, 𝜇𝑏 faces. Toe condition of the side frame, 𝛾𝑤, shown in Figure 1.1(a), is another design
parameter that can be divided into no-toe (𝛾𝑤=0), toe-out (𝛾𝑤>0) and toe-in (𝛾𝑤<0) designs. The
toe angle is a significant parameter since it affects not only relative movements of the components
but also the forces developed within the wedge suspensions [28].
- 6 -
(a) (b)
Figure 1.1: Different configurations of the wedges employed in three piece-bogies: (a) variable damping
and (b) constant damping [28].
The friction wedges in the secondary suspension of a three-piece bogie exhibit strongly nonlinear
damping property, which is attributed to complex variations in the contact forces, contacting
surfaces geometry and the friction coefficient [29, 30]. Moreover, the friction wedge design yields
variable multi-directional damping of the secondary suspension, which is considered vital for
enhancing performance limits of the wagon, including vertical acceleration, hunting and curving
stability, over a wide range of loading conditions.
An extensive review of different approaches considered for modelling of frictional wedges of
three-piece bogies has been presented by Wu et al. [23]. The reported mathematical models of a
friction wedge suspension can be classified into three types: Combination models [e.g., 29, 30],
quasi-static models [e.g., 31, 32] and multi-body system (MBS) models [33, 34]. The combination
models represent the directional properties of wedges by a combination of the stiffness and
damping elements. While this modelling approach is quite simple and computationally efficient, it
cannot be applied for parametric analysis of the wedge suspension design, especially the geometric
parameters [23]. Moreover, such models do not consider the potential loss of contact between the
contacting surfaces. Quasi-static models have been reported for quasi-static or dynamic analysis of
the wedge system considering the geometry of the wedge in addition to wedge-bolster separation.
The MBS modelling approach, on another hand, considers the complex geometry and distributing
contact to describe the dynamic phenomena more accurately that the combination or quasi-static
models are not able to represent. Simulation of curved surfaces of wedge or warp stiffness of the
bogie are some of these conditions. Moreover, implementations of the penetration contact and
friction contact models are only possible in the MBS models. Xia [31] considered the effects of
- 7 -
wedge mass and described the system damping by a two-dimensional dry friction model. The
numerical analyses challenge associated with discontinuity of the state inherent in the dry friction
model has been addressed via smoothing different functions for numerical techniques, which has
been treated by a smoothing [28, 34, 35]. In MBS wedge model, the coordinates of the different
corner points of the wedge define the contact domains of wedge with side frame and bolster. The
contact forces are thus obtained using a point-plane model when the instantaneous positions of the
corner points approach interference. Despite this, Wu et al. [23] stated that MBS wedge models are
not yet suitable for stability analysis in the train system due to their complexity and high
computational demand. Tune adjustment of contact models could avoid the extreme
interpenetration of contacting components while it is not needed to define small integration time
steps and error tolerance. The resulting normal forces are thus obtained as a function of the
penetration depth and its time derivative. The method also accounts for the possible separations of
the wedges from the bolster/side frame under extreme unloading. Jamming and warping in addition
to stick and slip conditions of the relative movement of the wedge with respect to side frame and
bolster are also possible in MBS method.
1.2.3 Wheel-rail contact forces
The wheel-rail contact forces directly influence the curving and hunting performance and
derailment potential of a railway wagon. The forces developed at the contact interface are related
to the wheel-rail contact geometry. The determination of the contact region and geometry is known
to be quite challenging considering the complex geometry of the wheel and the rail. A number of
algorithms have been developed to determine the instantaneous contact region of the wheel rolling
on the rail. The reported studies focus on both the contact geometry and contact locations of the
wheel with the rail, which are generally obtained using two methods: (i) solutions of kinematic
algebraic equations describing the wheel and rail profiles [36]; and (ii) the nodal search method
[37]. In the algebraic approach, functions describing the wheel and rail geometries are used to
identify the coordinates of the contact points using the minimum distance between the two
continuous functions. In the nodal approach, the wheel and rail profiles are parameterized by
discrete nodal points and the minimum distances between the nodes on the wheel and rail profiles
are used to determine the contact points. The nodal method is considered meritorious compared to
the algebraic approach since it can be applied to non-smooth surfaces [9].
- 8 -
Both the methods generally assume constant rail and wheel profiles along the track to generate
a lookup table of coordinates, which is subsequently applied to identify coordinates of the contact
points [9, 36, 38]. The lookup table is generally formulated for a defined span covering a range of
wheel/rail motions. It would thus be possible to encounter contact scenarios that are not accurately
described by the lookup table [37]. In dynamic analyses, pre-generated lookup table is used to
estimate coordinates of the contact locations through interpolations of instantaneous wheel
responses (vertical and lateral displacements, and roll and yaw rotations) and the outputs (contact
point coordinates). This method, referred to as “off-line” method, may lead to inaccuracies in
predicted locations of the contact points, particularly under severe contact scenarios [9, 37].
Alternatively, the coordinates of contact points are computed by locating the nearest points between
the two profiles at every instant during the dynamic simulations [39]. A hybrid method, employing
the lookup table for the tread contact and the direct method for the flange contact has also been
proposed to enhance the computational efficiency [40, 41].
The aforementioned studies reporting methodologies for mapping of the wheel-rail contact
surfaces have been derived for rigid wheel and rail surfaces assuming negligible deformations of
the wheel and the rail. The normal contact problem of elastic wheel and rail was addressed on the
basis of the Hertz contact theory by Carter [42], assuming continuous and frictionless contact
surfaces, small deformations of the contacting bodies, and diminishing contact stress in regions
away from the primary contact area (half-space assumption). Although the Hertz’s contact theory
has been widely accepted for analysis of wheel-rail contact problem, a few studies have suggested
several limitations of the theory, particularly in cases involving flange contact, contact with rails
with short pitch irregularities and plastic rail or wheel deformations under excessive loads [40, 43].
Apart from the normal forces, the wheel-rail contact yields substantial creep forces that directly
affect the longitudinal and curving dynamics of the vehicle. Carter [42] presented analytical
formulations for deriving forces developed in a two-dimensional rolling cylinder contact with a
thick plate. Applications of these solutions to the wheel-rail contact have shown notable differences
in the circumferential and longitudinal velocities of the driven wheels, which directly relate to
longitudinal creep force developed at the wheel-rail interface.
Vermeulen and Johnson [44] developed a three-dimensional model of the wheel-rail rolling
contact problem to determine the lateral and longitudinal contact forces attributed to creepage. The
non-dimensional creep factors were used to define deviations from the pure rolling condition in
- 9 -
terms of ratios of slip velocities to the nominal velocities along in longitudinal and lateral
directions. The contact patch in this model was divided into two axisymmetric elliptical regions
corresponding to slip and stick. The contact forces were obtained as functions of the creepage,
normal loads, modulus of rigidity G, Poisson’s ratio v, friction coefficient μ, and coefficients related
to the contact geometry, particularly the minor and major radii of the elliptical contact patch [9].
The creep forces in this method are limited to no-spin and smooth half spaces contact, and may
yield errors in estimating wheel/rail forces during curving or interactions with irregular tracks [9,
40]. Alternatively, Kalker’s linear contact theory has been widely used under steady-state rolling
conditions assuming negligibly small slip within the contact area to obtain estimates of contact
forces and spin moment developed at the contact patch [45]. The ‘CONTACT’ simulation program,
developed by Kalker [45] on the basis of theory of elasticity, provides forces developed between
the two contacting bodies considered as half spaces, as well as stick and slip regions within the
contact patch. The applications of the program to railway vehicle dynamic simulations, however,
have been limited due to its excessive computational demands. The linear Kalker’s theory under
small creepage and spin is reported to yield less than 5% difference when compared to the
CONTACT simulation results [9, 40].
The FastSim simulation program, based on the simplified Kalker’s theory, is generally used in
multi-body railway dynamic simulation platforms, which yields estimates of contact forces in a
highly efficient manner [45]. In this method, the contact patch is discretized into several small
regions and the local strain for each region is determined. The tangential force distributed over the
contact surface is subsequently computed from the longitudinal, lateral, and rotational creepages.
The geometry of contact zone described by the Hertzian function and the maximum tangential force
is limited to the wheel-rail adhesion using the Coulomb’s dry friction relationship. This method
has been reported to yield up to 5% estimation error in the normal condition, 10% error for pure
spin and 20% error for the combined translational and spin creepages, when compared with the
results obtained from the CONTACT benchmark method [40, 45]. Owing to the discretization of
the contact patch, the FastSim delivers detailed insight into the traction distribution and slip-stick
regions as predicted by the simplified theory. Many studies have refined the method by
incorporating non-Hertzian contact (non-elliptical) geometry [43], more elaborate friction laws
[46, 47] and unsteady contact conditions [48, 49]. A number of other methods have also been
- 10 -
proposed to study the rolling contact problem such as, Kalker’s USETAB [9], multi-Herzian and
non-Hertzian [38] methods.
1.2.4 Performance measures of railway tank cars
Reported studies have defined widely different performance measures for evaluating critical speeds
corresponding to instability conditions of a railway vehicle configuration, derailment potential,
lateral load transfer, and more. The reported measures invariably derive from the dynamic motion
and/or force responses under defined inputs or maneuvers. The magnitudes of lateral and yaw
displacements of the wheelset under a given input have been used as the key performance measures
in some of the reported studies [11, 20]. Alternatively, the forces transmitted to the track by the
axle as well as the lateral acceleration of the bogie frame or a wheelset have been used as a measure
for reaching the critical hunting speed, which are also defined in the standards and regulations for
acceptance tests [14, 15]. These responses are generated either due to an input of short duration
followed by an ideal track, or irregularity representing a measured track profile. Testing of the
wagon in straight track with measured irregularities is the most common method used for
assessment of railway vehicle stability in the industry. The standards, UIC 518 [14] and EN 14 363
[15], define two different measurement methods: (i) the “normal measuring method” involving the
measurements of sum of guiding forces for applications to standardized new vehicles; and (ii) the
“simplified measuring method” based on acceleration responses of the bogie frame is an extension
of the standardized method for applications to existing modified vehicles.
It has been reported that applications of each of these methods lead to different critical speeds
for a similar wagon [12]. The application of a lateral excitation can lead to nearly 20 km/h higher
critical speeds than those predicted from simulations of the wagon running on a track with
measured irregularities [12]. Moreover, the normal measuring method based on sum of guiding
forces, as defined in UIC 518 [14] yields higher critical speeds than those obtained from the
simplified measuring method based on measurements of acceleration responses of the bogie
frame). The greatest deviations among the different methods for identifying the critical speeds have
been reported when supercritical bifurcations attributed to small limit cycles occur [20]. Although
the challenges in establishing the critical speeds accurately using a nonlinear model have been
widely recognized [11, 50], the existing methods with certain extensions have generally been
- 11 -
accepted for identifying the stability limits from the vehicle responses to a defined disturbance at
different speeds.
Derailment risk of a railway wagon is the most critical measure, which has been the focus of
many studies. Widely different methods have been reported for assessing the derailment potential
of a railway car. A number of studies have investigated correlations between the wheel-rail contact
forces and derailment potential of the railway vehicles using widely different criteria [4, 51]. The
wheelset derailment is frequently described in terms of wheel flange climb on the rail and
separation of wheel-rail contact. The lateral wheelset dynamics is thus considered as the primary
contributory factor, while the gauge widening, rail roll/deflection and track-plane shift are reported
as the secondary contributory factors [38]. The reported studies have shown that flange climb
generally occurs under large positive angle of attack (AoA) induced on a curved track or due to
yaw motion of a bogie [38, 52]. The loss of wheel-rail contact, on the other hand, is attributed to
excessive wheelset/bogie roll or hunting leading to high lateral velocity. The wheelset derailment
can also be caused by a large magnitude of impact force that may occur at relatively higher speeds
[53, 54].
The flange-climb is considered as a primary indicator of an impending derailment. Different
flange-climb derailment safety criteria have evolved since the early criterion of Nadal [38, 52]. The
flange climb criterion assumes initial two-point wheel-rail contact condition with flange contact
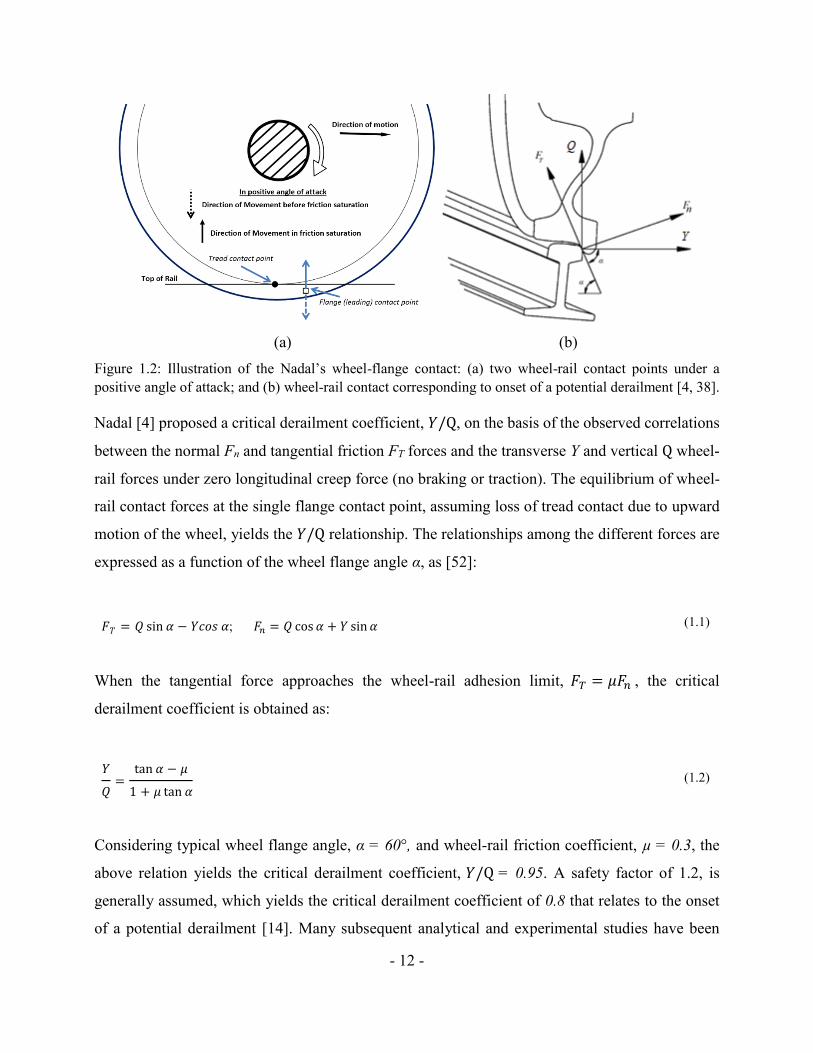
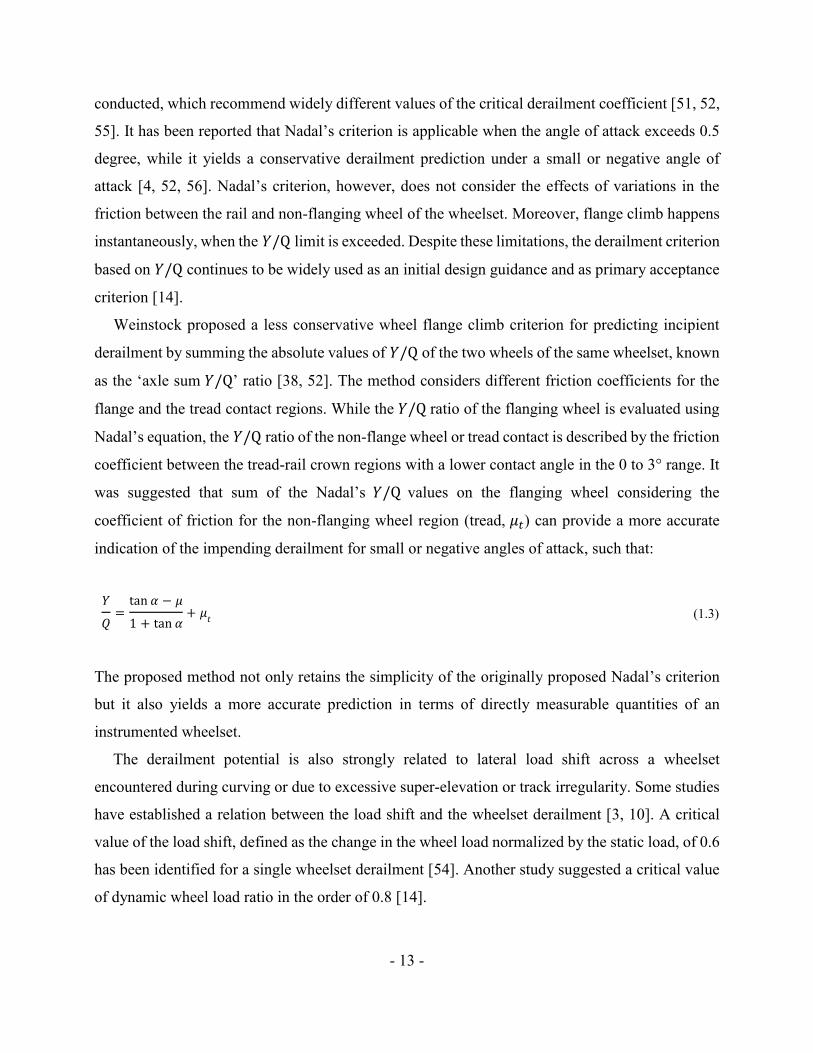
point leading the tread contact point, as shown in Figure 1.2 [4]. In this condition, the wheel surface
at flange contact moves (slides) downwards relative to the rail, as the wheel flange climbs over the
rail. The onset of a derailment is considered to occur when an upward motion of the wheel flange
is initiated, and the contact force approaches the maximum friction force.
- 12 -
(a) (b)
Figure 1.2: Illustration of the Nadal’s wheel-flange contact: (a) two wheel-rail contact points under a
positive angle of attack; and (b) wheel-rail contact corresponding to onset of a potential derailment [4, 38].
Nadal [4] proposed a critical derailment coefficient, 𝑌/Q, on the basis of the observed correlations
between the normal Fn and tangential friction FT forces and the transverse Y and vertical Q wheel-
rail forces under zero longitudinal creep force (no braking or traction). The equilibrium of wheel-
rail contact forces at the single flange contact point, assuming loss of tread contact due to upward
motion of the wheel, yields the 𝑌/Q relationship. The relationships among the different forces are
expressed as a function of the wheel flange angle α, as [52]:
𝐹𝑇 = 𝑄 sin 𝛼 − 𝑌𝑐𝑜𝑠 𝛼; 𝐹𝑛 = 𝑄 cos 𝛼 + 𝑌 sin 𝛼 (1.1)
When the tangential force approaches the wheel-rail adhesion limit, 𝐹𝑇 = 𝜇𝐹𝑛 , the critical
derailment coefficient is obtained as:
𝑌
𝑄=tan 𝛼 − 𝜇
1 + 𝜇 tan 𝛼 (1.2)
Considering typical wheel flange angle, α = 60°, and wheel-rail friction coefficient, µ = 0.3, the
above relation yields the critical derailment coefficient, 𝑌/Q = 0.95. A safety factor of 1.2, is
generally assumed, which yields the critical derailment coefficient of 0.8 that relates to the onset
of a potential derailment [14]. Many subsequent analytical and experimental studies have been
- 13 -
conducted, which recommend widely different values of the critical derailment coefficient [51, 52,
55]. It has been reported that Nadal’s criterion is applicable when the angle of attack exceeds 0.5
degree, while it yields a conservative derailment prediction under a small or negative angle of
attack [4, 52, 56]. Nadal’s criterion, however, does not consider the effects of variations in the
friction between the rail and non-flanging wheel of the wheelset. Moreover, flange climb happens
instantaneously, when the 𝑌/Q limit is exceeded. Despite these limitations, the derailment criterion
based on 𝑌/Q continues to be widely used as an initial design guidance and as primary acceptance
criterion [14].
Weinstock proposed a less conservative wheel flange climb criterion for predicting incipient
derailment by summing the absolute values of 𝑌/Q of the two wheels of the same wheelset, known
as the ‘axle sum 𝑌/Q’ ratio [38, 52]. The method considers different friction coefficients for the
flange and the tread contact regions. While the 𝑌/Q ratio of the flanging wheel is evaluated using
Nadal’s equation, the 𝑌/Q ratio of the non-flange wheel or tread contact is described by the friction
coefficient between the tread-rail crown regions with a lower contact angle in the 0 to 3° range. It
was suggested that sum of the Nadal’s 𝑌/Q values on the flanging wheel considering the
coefficient of friction for the non-flanging wheel region (tread, 𝜇𝑡) can provide a more accurate
indication of the impending derailment for small or negative angles of attack, such that:
𝑌
𝑄=tan 𝛼 − 𝜇
1 + tan 𝛼+ 𝜇
𝑡 (1.3)
The proposed method not only retains the simplicity of the originally proposed Nadal’s criterion
but it also yields a more accurate prediction in terms of directly measurable quantities of an
instrumented wheelset.
The derailment potential is also strongly related to lateral load shift across a wheelset
encountered during curving or due to excessive super-elevation or track irregularity. Some studies
have established a relation between the load shift and the wheelset derailment [3, 10]. A critical
value of the load shift, defined as the change in the wheel load normalized by the static load, of 0.6
has been identified for a single wheelset derailment [54]. Another study suggested a critical value
of dynamic wheel load ratio in the order of 0.8 [14].
- 14 -
Owing to the grave implications of a railway vehicle, the derailment limits are invariably defined
with a safety margin. Different standards, however, recommend varying values of the derailment
safety margin, which are mostly based on Nadal’s criterion. Jun and Qingyuan [54] suggested that
𝑌/Q ratio exceeding 0.8 for a duration of more than 15 ms as the critical value, while Garg and
Dukkipati [10] suggested the consideration of a longer duration of 50 ms. In Western Europe,
𝑌/Q > 0.8 over a moving distance of 2 m is considered as the critical. In China, the safety margin
is based on both the 𝑌/Q ratio and the wheel load shift (𝑌/Q < 1.0 and Δ𝑄/𝑄0 < 0.60 ) as the safe
margin, while 𝑌/Q > 1.2 and ΔQ/𝑄0 > 0.65 are considered critical. In North America, the
benchmark values for safety evaluation are considered as, 𝑌/Q > 1.0 and Δ𝑄/𝑄0 > 0.9 [54]. The
UIC 518 [14] and EN 14 363 [57] recommend that the 𝑌/Q for each wheel over a distance of 2 m
must not exceed 0.8 m on a curved track with radius equal to or greater than 250 m. Using the data
obtained from a single wheelset derailment tests on a rolling rig, it has been shown that a derailment
would occur when the magnitude of wheel lift approaches 25 𝑚𝑚 coupled with relative transverse
displacement of 70 𝑚𝑚 [55].
The wheelset responses in the presence of rail defects, particularly the roll deflections, and the
gauge widening could also cause wheelset derailment. Rail rollover criteria can vary from 𝑌/Q
above 0.6 for the inside flange contact to approximately 0.2 when the contact lies on the outside of
the track [38, 56]. This criterion, defined in AAR M1001 Recommendation Practices [58], assumes
negligible effect of torsional stiffness of the rail and single contact condition for each wheel.
Apart from the above, it has been reported that the lateral shift of the track plane can cause one
of the wheel to drop between the rails leading to wheelset derailment [38, 56]. Lateral track shift
is known as a general phenomenon caused by repeated excessive lateral forces at the wheel-rail
interface. A few studies have shown higher rates of track shift in poorly laid, newly laid and newly
maintained tracks [38, 56]. Concert ties tend to limit the track shift compared to the other ties. A
generalized limiting value of the critical lateral load, Lc, has been proposed as a linear function of
the vertical wheel load, as [56]:
𝐿𝑐 = 𝑎𝑣𝑄𝑎𝑥𝑙𝑒 + 𝑏𝑙 (1.4)
where 𝑄𝑎𝑥𝑙𝑒 is vertical axle load, and av and bl are empirical constants that depend on the type of
ballast and ties used in the track.
- 15 -
Despite the developments in various derailment criteria, a generally applicable criterion does
not yet exist. Some of the proposed derailment criteria are considered conservative for some
applications, while accurate physical interpretations of the derailment phenomena are lacking for
many situations [4, 59].
1.2.5 Liquid slosh models
The dynamic forces and moments arising from movement of liquid cargo within partly-filled
moving containers are known to affect directional performance and stability limits of road, rail as
well as marine vehicles [3, 7]. In railway vehicles, the additional forces induced by the liquid free
surface oscillations in a partly-filled tank, may alter the wheel-rail contact forces and the coupling
forces. The liquid slosh dynamics and the fluid-structure interactions have thus been widely
investigated to study movements of liquid fuels within automobile tanks and spacecraft [60], liquid
cargo in tank trucks [8], rail tank cars [3] and ocean vessels [61, 62]. These studies have focused
on analysis of slosh forces, moments, load shift and natural frequencies of the free surface
oscillations using different liquid slosh models, which are briefly discussed below.
Different numerical and analytical methods have been developed to study fluid slosh within
fixed or moving containers. The most widely used numerical methods involve solutions of the
Navier-Stokes and continuity equations in conjunction with appropriate boundary conditions.
These methods, however, are known to impose excessive computational demands for applications
in moving vehicles’ dynamic analyses [63-65].
Simplified quasi-static slosh models have been widely used to study the effects of liquid cargo
slosh on steady-state roll stability limits and directional performance of road tank vehicles [66, 67].
The quasi-static methods have been used to derive relative rollover threshold limits of articulated
road tank vehicle with various tank cross-sections such as circular, modified-oval, elliptical and
modified square tanks [7, 8, 68, 69]. Kang et al. [70] proposed an optimal tank cross-section using
the quasi-static approach. The study converged to a tank-cross section similar to a ‘Reuleaux
triangle’, which resulted in substantially higher rollover threshold of the vehicle compared to the
circular and modified oval tanks. Quasi-static fluid slosh models, however, do not describe the
transient slosh effect, which has been shown to yield substantially greater forces and moments
compared to the steady-state values predicted from the quasi-static approach [64, 71, 72].
- 16 -
Alternatively, a number of studies have proposed linear slosh models assuming in-viscid fluid
and irrotational flows, thereby permitting the use of the potential flow theory [73, 74]. It has been
shown that the linear slosh theory can effectively predict the slosh forces and moments under low
amplitude excitations, while the method yields substantial errors in the vicinity of the slosh
resonant frequencies [64]. The linear slosh analyses have been widely used to compute slosh
resonance frequencies [75], free surface movements [76, 77], and slosh forces and moments [78].
Early studies on linear slosh analysis focused on upright cylindrical or rectangular stationary tanks
[65]. Conformal mapping techniques have been applied to study slosh problems in horizontal
cylindrical tanks with and without baffles [76, 77]. Multi-modal methods have also been proposed
to study linear slosh in horizontal tanks [78]. The boundary element methods (BEM), yield linear
slosh solutions with relatively greater computational efficiency, particularly for arbitrary cross-
section tanks with partition walls or baffles [79]. Low amplitude liquid sloshing of inviscid and
incompressible fluids in a 3-D arbitrary shape baffled tankers has been investigated by Firouz-
Abadi et al. [80] using BEM coupled with the subdivision of the fluid domains.
A range of numerical methods based on finite difference, finite element, finite volume and
boundary element methods have been developed and applied to study nonlinear slosh dynamics for
different tank cross sections. Rebouillat and Liksonov [81] presented a comprehensive review of
numerical nonlinear slosh analysis methods. Numerical methods of nonlinear slosh have been
categorized by D’Alessandro [63] as Lagrangian, Eulerian, Smoothed Arbitrary Lagrangian-
Eulerian (ALE) and Particle Hydrodynamics (SPH) methods. Lagrangian method tracks the free
surface movement considering that the nodes moves with the fluid. In contrast, the fixed domain
nodes are used in Eulerian method, where the free surface movement does not alter the element’s
shape. The computational cost of moving mesh used in the Lagrangian method is thus higher than
the Eulerian method. The SPH method is a Lagrangian method, where the fluid is divided into a
set of particles. The finite-element, finite-difference and SPH models could be integrated to the
multi-body vehicle dynamics models, although with very high computational demand. As an
example, Fleissner et al. [82] coupled a three-dimensional fluid/granule model based on SPH
method with a 17-DoF model of a truck to study the effects of liquid and grain movements on
braking and steering dynamics of the truck.
Popov et al. [83] used a finite-difference method for numerical integration of Navier-Stokes,
continuity and free surface equations for analysis of two-dimensional nonlinear slosh in a
- 17 -
horizontal cylindrical container assuming incompressible flows with zero surface tension in the
free boundary. A number of recent studies have employed volume of fluid (VoF) and finite
difference methods for analysis of two- and three-dimensional slosh in road tankers of different
cross sections using FLUENT software [71, 72, 84]. These have shown that magnitudes of
dynamics slosh forces and moments are substantially greater than those predicted from the quasi-
static models. Moreover, it is shown that transverse baffles can effectively limit the magnitudes of
longitudinal slosh forces.
Owing to the complexities associated with integration of the dynamic slosh models with the
multi-body dynamic vehicle models, a few studies have proposed mechanical analogous of fluid
slosh [85, 86]. These models provide estimates of liquid slosh characteristics by simple equivalent
mechanical models [74, 87]. The analogy is based on the assumption that liquid in a container can
be divided into stationary (with respect to container structure) and moving components, while the
free surface oscillations can be described by the motion of a simple spring-mass-damper or a
pendulum system. The parameters of the mechanical equivalent models are invariably identified
from the slosh responses obtained from linear slosh analysis [87].
Abramson [88] conducted a series of experimental and analytical studies on forced responses
of liquids in upright cylindrical, spherical and rectangular tanks with separating walls. The data
were used to identify parameters of an equivalent mechanical model. A detailed formulation of an
equivalent model of fluid slosh under translational and pitching movement has been presented by
Roberts et al. [89]. Comprehensive formulations of mechanical equivalent slosh models for some
tank geometries have also been presented by Ibrahim [65]. Considering that, the parameters of
equivalent mechanical models are obtained based on linear slosh theory, such models are
considered valid under low amplitude slosh and when the excitation frequency is not close to the
slosh resonant frequencies, which tends to cause flow separation.
Bauer et al. [60] proposed a mass-spring analogy with a non-linear spring obtained from tests
conducted on a vertical cylindrical tank. Ranganathan et al. [85] employed the pendulum analogy
to describe lateral oscillations of fluid within a two-dimensional circular road tanker. The natural
frequencies of pendulum model were compared with those reported by Budiansky [90].
Ranganathan et al. [86] also proposed an equivalent mass-spring mechanism to simulate
longitudinal movement of fluid in a three-dimensional circular road tanker, which was validated in
terms of fundamental slosh frequencies reported by McCarty et al. [75].
- 18 -
An equivalent trammel pendulum was proposed by Salem et al. [87] to study the lateral fluid
sloshing in a two-dimensional partly-filled elliptical container. The parameters of the equivalent
pendulum model including arms of trammel pendulum, fixed and pendulum masses, and the height
of the fixed mass with respect to the tank base. These were estimated from the fundamental slosh
frequency, horizontal force and roll moment around the tank’s base, obtained from a finite element
fluid slosh model in LS-Dyna. A set of proposed trammel pendulum could be considered to
represent the mechanics of low amplitude slosh and can be integrated for coupling with multi-body
vehicle model without much difficulty. Applications of such methodology, however, have been
limited due to challenges associated with parameters identifications, which generally involve either
experiments or analyses using linear slosh theory or numerical simulations.
1.2.6 Liquid slosh analysis in railway vehicle
While the effects of fluid slosh on roll and yaw dynamics of road tank vehicles have been
investigated in a number of reported studies, only a few studies have explored the effects on the
dynamics of railway vehicles. Furthermore, these studies have mostly employed simple pendulum
slosh models considering only the fundamental slosh mode. Khandelwal and Nigam [91] employed
a pendulum model of liquid slosh considering a rectangular railway wagon moving on an irregular
track with constant longitudinal acceleration. The slosh model parameters were estimated based on
the data reported by Abramson [88] assuming low amplitude free surface motion. The effect of
damping was also considered by introducing a viscous damper with the pendulum. The study
considered bounce and bounce/pitch models of a single wagon tank car permitting slosh due to
track irregularity and longitudinal acceleration/deceleration. The study showed that fluid slosh
serves as an effective damper, when excitation frequencies are distant from the fundamental slosh
frequency.
Bogomaz et al. [92] developed roll, pitch and yaw plane models of a partly-filled tank car using
the equivalent pendulum models of fluid slosh. The pendulum parameters were obtained through
solutions of the boundary value problem over the liquid domain coupled with modal solution of
the free surface. The simulation model in the pitch plane alone was validated from the tests
conducted on a tank car subject to longitudinal impacts at different speeds. The simulation results
revealed notable contributions of fluid slosh to lateral and vertical accelerations under excitations
- 19 -
caused by rail irregularities and curving. The study employed simplified models of tank car
incorporating suspension and wheel/rail contact with linear properties.
A three-dimensional model of a partly-filled tank car developed by Younesian et al. [3]
integrated a two-dimensional mechanical equivalent model of fluid slosh along the longitudinal
axis. The fluid slosh parameters were estimated by representing the cylindrical tank by a
rectangular cross-section in order to utilize the data reported by Abramson [88]. The simulations
were performed under braking in a curve with super-elevation. The results obtained under different
speeds, fill volume and track irregularity showed greater unloading of the inside track wheels in
the presence of fluid slosh. It was concluded that neglecting fluid slosh in a partly-filled tank car
could lead to underestimation of the derailment potential and wheel unloading by 18 and 25
percent, respectively. Transportation of dense liquid cargo in high capacity railway tanks was also
reported to be more critical, as it has been reported for road tankers [8, 93].
In a recent study, Di Gialleonardo et al. [94] investigated the wheel unloading and thus the
derailment of a partly-filled railway tank car subject to ‘S’-curve maneuvers at different speeds.
The liquid slosh was characterized by multiple equivalent lateral mass-spring models distributed
along the length of tank car to account for yaw motion of the tank. The fluid in the tank was
represented by nine identical equi-spaced but uncoupled spring-mass systems to track the fluid
mass motion under lateral and yaw excitations. The parameters of mechanical equivalent model
were identified through minimization of error between the model response and responses obtained
from two-dimensional Computational Fluid Dynamic (CFD) analysis for 25, 50 and 75 % fill ratios
(ratio of the fill height to the tank diameter). The distributed mechanical-equivalent fluid slosh
model was integrated to a 35-DoF model of a 4-axle tank car. The simulation results obtained for
an ‘S’-curve track revealed relatively higher wheel unloading in the presence of fluid slosh, as
reported by Younesian et al. [3]. During the trailing portion of the curve higher wheel unloading
was reported for the third wheelset, while first wheelset revealed higher derailment (𝑌/Q) ratio.
The results also showed greater shift in the liquid load, caused by centrifugal acceleration, which
has been widely reported for the road tankers [8, 65, 72]. The study also showed greater load shift
when the ‘S’-curve frequency was close to the natural frequency of the mechanical-equivalent
model.
The effects of longitudinal and lateral fluid slosh on the oscillatory motions of the coupling
screws were investigated by Vera et al. [95] considering a model of four partly-filled tank cars with
- 20 -
two-axles each. The fluid slosh along the lateral axis was described by a pendulum model, proposed
by Ranganathan [86]. The slosh along the longitudinal axis was modeled by the mass-spring system
proposed by Abramson [88], assuming five compartments for each tank car. The results attained
for the 85% filled wagons under curving showed lateral load shift ratio of 0.6 at the forward speed
of 120 km/h. This load shift is below the limit recommended in the European standard [15]. The
study concluded minimal effects of liquid slosh on the lateral load shift and wheel-rail forces, which
is likely due to relatively higher fill volume of 85% considered.
Hazrati et al. [96] suggested that neglecting the liquid cargo movements may lead to
underestimation of the tank car roll motion and dynamic load ratios during curving. Both the roll
motion and load transfer were found to be significant for low fill level ratios. The liquid cargo
movement could eliminate the performance gain of the low c.g. height due to the lower fill height.
It was further suggested that effects of liquid slosh subject to yaw oscillations of the tank have not
yet been investigated thoroughly for the railway cars, with the exception of the model proposed by
Di Gialleonardo et al. [94] considering multiple uncoupled pendulums along the length of the tank.
This approach may be valid only when the liquid cargo can be consider by multiple uncoupled
bulks separated by rigid partitions.
Although simple quasi-static or mechanical-equivalent models could provide efficient
simulations of the coupled liquid-tank car system, their applications are limited to two dimensional
and circular cross-section tanks. The limited studies of liquid slosh in railway tankers have used
the equivalent mechanism approach which required prior identification of parameters and is not
applicable for three-dimensional inputs [87]. While the computational fluid dynamic models can
provide accurate estimations of dynamic slosh forces, their excessive computational demand
inhibit the implementations in the multibody dynamic vehicle models [84, 97]. Alternate methods
based on multi-modal and boundary element approaches will be meritorious for analysis involving
different tank cross-sections in a computationally efficient manner [64].
Based on reviewed literature, the linear slosh theory can be used to develop an analytical model
of liquid slosh in moving tanks of different cross-sections. The linear slosh formulations have been
reported in many studies and the systematic method has been outlined in detail by Kolaei et al. [64,
98]. The equations of motion for the liquid in a rigid container can be simplified assuming an ideal
liquid with negligible viscosity effect as well as incompressible and irrotational flows. Under these
conditions, the Navier-Stokes equations reduce to Euler equations [88]. Based on the potential flow
- 21 -
theory for irrotational flows, fluid velocity can be derived from a velocity potential so that the
gradient of the potential function yields the flow velocity. The linearized boundary-value problem
of liquid sloshing for two-dimensional containers can be expressed in the form of the Laplace
equation of the velocity potential function. The method offers considerable computational
efficiency and can be easily implemented for co-simulations with the multi-body dynamic codes
[6, 99]. The major motivation for the proposed method is to generate an accurate prediction for
transient liquid slosh that could be extended to three-dimensional models for real-time simulations.
- 22 -
1.3 Scope and objective of the dissertation research
From the review of studies on railway freight cars, dynamics of fluid slosh, fluid-structure
interactions, as well as its potential influences on the dynamic performance and safety of partly
filled railway tanker, clearly provide a scope for the research and contributions in the field. The
thesis research is thus aimed at formulations of a vehicle model incorporating comprehensive
representation of the friction wedges in the secondary suspension together with an effective liquid
slosh model, which can be integrated for efficient analyses of the coupled liquid cargo-vehicle
system dynamics. The resulting coupled model is used to study the effects of cargo slosh within a
partially filled railway tank car on response measures relevant to curving, hunting and switch-
passing, which constitute the primary objective of the dissertation research. The specific goals are
summarized below:
a) Develop a multi-body dynamic (MBD) model of a freight wagon, capturing the non-smoothness
of contact and friction that exists between different components of a freight truck;
b) Examine validity of the MBD model for lateral stability and curving responses using the
available data;
c) Formulate an analytical model of the liquid cargo within the partly-filled cylindrical container
subject to lateral acceleration, roll motion and yaw oscillations of the tank to obtain dynamic
slosh force and roll moment, and liquid cargo shift;
d) Examine validity of the slosh model using the reported slosh mode frequencies and
hydrodynamic coefficients;
e) Develop a co-simulation scheme for analyses of the coupled liquid cargo-wagon models under
lateral, roll and yaw motions of the tank car; and
f) Investigate the effects of cargo slosh on hunting, roll stability and derailment potential of the
partly-filled railway tank car considering different fill volumes and forward speeds.
- 23 -
1.4 Organization of the dissertation
This dissertation is prepared according to the manuscript-based format described in “Thesis
Preparation, Examination Procedures and Regulations” guidelines of the School of Graduate
Studies, Concordia University. The thesis is organized in six chapters, which addresses the research
goals stated in section 1.3. The first chapter presents the review of relevant studies, and the scope
and objectives of the thesis research. The final chapter (Chapter 6) presents the major contributions
and conclusions of the research work together with suggestions for further work. Chapters 2 to 5
are based on the manuscripts that have been either published or submitted for publications in peer-
reviewed journals, which are summarized below.
Chapter 2 presents the multi-body dynamic model of a freight wagon incorporating a set of
three-piece freight bogie with frictional wedges and wheel-rail contact model. This chapter is based
on the following article published in the Journal of Rail and Rapid Transit:
Hazrati Ashtiani I, Rakheja S and Ahmed AKW, “Influence of friction wedge characteristics on
lateral response and hunting of freight wagons with three-piece bogies”. Proceedings of the
Institution of Mechanical Engineers, Part F: Journal of Rail and Rapid Transit, 2016: Page 877-
891.
The MBS modelling approach of friction wedges based on point-plane contact is presented in
this chapter. The nonlinear damping characteristics of the suspension system of three-piece bogie
are investigated considering nonsmooth unilateral contact, multi-axial motions and geometry of
the wedges and slip-stick friction forces. The parameters of contact pairs were identified to achieve
an efficient numerical demand with adequate accuracy. The resulting 114-degrees-of-freedom
wagon model incorporated constraints due to side bearings, axle boxes, and the centre plates, while
the wheel-rail contact forces were obtained using the algorithm. The simulation results were
obtained to study hunting properties of the wagon in terms of critical speed and the predominant
oscillation frequency, and the effects of wedge friction and geometry on stability characteristics of
the freight car. The contributions of this chapter address the objective a and b of the dissertation
addressed above.
Chapter 3 presents liquid cargo model based on linear slosh theory together with mode
summation and its validation and integration to the vehicle model presented in Chapter 2 to study
the effects of liquid slosh on hunting phenomena of the railway tank car. The contributions of this
- 24 -
chapter address the objectives c and d, and partly e and f. The chapter presents following article
that has been submitted for review for publication in the Journal of Multibody System Dynamics.
Hazrati Ashtiani I, Rakheja S and Ahmed AKW, “Hunting analysis of a railway tank car
subject to partially filled state of the tanker”, (2018) Submitted to Multibody System Dynamics.
The chapter presents an analytical liquid slosh model to capture the response of the liquid cargo
up to five natural modes in the roll plane. The validity of the proposed slosh model is illustrated
through comparisons of the model responses with the reported data in terms of modal frequencies
and hydrodynamic coefficients. A co-simulation scheme is presented to integrate the liquid cargo
model with the nonlinear multi-body dynamic (MBD) model of the railway tank car with a set of
three-piece bogies, as described in Chapter 2. The coupled model simulations are performed to
evaluate lateral dynamic responses and critical hunting speeds under different filled conditions.
The results obtained with the proposed linear slosh model for different fill ratios are compared with
those obtained with equivalent rigid cargo to highlight the effects of liquid cargo slosh. The results
are also compared with those obtained from a simple pendulum slosh model.
Chapter 4 presents the following article submitted for review to the Journal of Vehicle System
Dynamics:
Hazrati Ashtiani I, Rakheja S and Ahmed AKW, “Effects of coupled liquid cargo sloshing on
roll response of partly filled railway tank cars” (2018) Submitted to Vehicle System Dynamics.
The paper summarizes the co-simulation scheme integrating the liquid cargo and vehicle
models, developed in Chapter 3, to study the effects of slosh force and moment on the vehicle
responses during curving. The contributions of this chapter partly address the objective f. The
additional slosh force and moment arising from the free surface motion for the partially filled state
of the tank are obtained to study their effects on the wheel-rail contact forces and dynamic response
of the rail vehicle during curving. The liquid slosh effects during curving maneuvers are discussed
through analyses of the roll motion of the tank car, and unloading and derailment ratios. The results
are further compared with those obtained for the equivalent rigid cargo to assess the contributions
of liquid cargo sloshing. The results clearly demonstrated that partial fill state of tank car and
resulting slosh could lead to significantly higher magnitudes of dynamic responses of the car, and
may result in separation of the wheel from the rail at a relatively lower lateral accelerations and
forward speeds, when compared to the rigid cargo car.
- 25 -
Chapter 5 presents the effects of dynamic liquid slosh on the tank car responses during a switch-
passing maneuver. The coupled model integrates a more comprehensive liquid slosh model
considering the effects of roll and yaw motions of the tank car, in addition to the lateral acceleration,
as stated in objective c. This chapter presents the following article submitted for review in the
Journal of Rail and Rapid Transit:
Hazrati Ashtiani I, Rakheja S and Ahmed AKW, “Investigation of coupled railway tank car
and liquid cargo response subject to switch passing maneuver”, Proceedings of the Institution of
Mechanical Engineers, Part F: Journal of Rail and Rapid Transit.
The influences of the liquid cargo motion on different performance measures of the railway
tank car are investigated during transient of a railway switch negotiations. Owing to the
considerable yaw motion of the car during such maneuvers, the liquid slosh mode presented in
Chapter 3 is further enhanced to incorporate the roll and yaw motion excitations. The co-
simulations of the refined slosh model and the vehicle model are performed under transient lateral,
roll and yaw excitations encountered during switch passing maneuvers. The forces and moment
due to sloshing within the partly-filled tank are evaluated through summation of the first four
antisymmetric natural modes. The validity of the slosh model is illustrated through comparisons
with the responses obtained from computational fluid dynamic model. The effects of liquid slosh
dynamics on responses of the coupled system are presented in terms of roll angle, and unloading
and different derailment ratios. The results suggested more significant effects of the liquid cargo
slosh on the response measures when compared to those observed during steady curving. It is
shown that liquid slosh can lead to significantly larger dynamic response magnitudes of the wagon,
when compared to those obtained for the equivalent rigid cargo. The results also revealed greater
potential for separation of the wheel from the rail for the partly-filled tank car at relatively lower
forward speeds.
- 26 -
CHAPTER 2
Influence of friction wedge characteristics on lateral response and hunting of freight wagon
with three-piece bogies
2.1 Introduction
The lateral instability and derailment potentials of railway vehicles have been widely investigated
using diverse methods. These have helped identify safe operating limits, standardized guidelines
[14, 15], and roles of different components designs and operating conditions. Owing to increasing
demands for high load capacity and high-speed freight cars, such efforts are continuing for realizing
designs with enhanced lateral stability limits [100]. The lateral stability of a railway vehicle is
directly related to sustained self-excited lateral and yaw motions of the wheelsets and bogies,
commonly referred to as hunting, which is known to be inherent mechanics of the wheel-rail
geometry. The hunting is initiated as a limit cycle motion with increasing forward speed and it
could lead to comprehensive levels of lateral wheel-rail forces and thus the derailment or track
panel shift.
Early studies on railway vehicle lateral stability based on linearized wheel/rail contact and
suspension models typically showed zero lateral mode damping when a critical speed was reached
[9, 10]. Owing to the inherently nonlinear kinematic and constitutive relations for the wheel-rail
contact as well as truck and suspension components, quasi-linear functions describing essential
components’ characteristics have been employed in the hunting studies. For instance, UIC 519 [16]
represents a methodology for deriving quasi-linear function for describing a given wheel-rail
profile, referred to as equivalent conicity. The quasi-linear analyses, however, generally showed
poor correlations with the measured critical speeds [17]. Huilgol [18] demonstrated the presence
of Hopf bifurcation in the dynamic responses of a wheelset model incorporating nonlinear wheel-
rail contact force. A number of studies have investigated bifurcations in the responses of rail
vehicles considering nonlinear wheel and rail profiles and creep forces relationships [e.g., 21, 100,
101]. The results have raised concerns about adequacy of the critical speed derived from the linear
theory since subcritical Hopf bifurcation is common in railway vehicles responses [102, 103]. Yang
and Chen [21] also investigated dynamic responses of a rail truck model with suspension
nonlinearity, and concluded that hysteresis suspension nonlinearity contributes to supercritical
bifurcation. Ahmadian and Yang [101] investigated hunting and Hopf bifurcation in the responses
- 27 -
of a single wheelset with non-linear yaw damper together with the flange contact, considering a
simplified conical wheel profile and creep forces obtained from the Kalker’s linear contact model
[104]. The study showed higher critical speed with increasing yaw damping of a single wheelset.
Increasing yaw damping beyond a certain value, however, resulted in lower critical speed due to
stronger coupling between the wheelset and the bogie frame, which could not be observed in the
linear analyses. Through analyses of both the linear and non-linear wheel/rail creep models, Polach
[12, 20] concluded that the linearized analysis could lead to lower critical speeds compared to those
predicted from the non-linear models. For this study, Polach recommended a very conservative
parameter of the wheel/rail contact and emphasized the application of non-linear stability
evaluations of the vehicle with friction dampers [12].
The reported studies have also employed somewhat different response measures for obtaining
the nonlinear critical speed corresponding to an instability. These include magnitudes of lateral and
yaw displacements of the wheelset to a given input [20, 105], axle force transmitted to the track
[12, 13] and lateral accelerations of the bogie frame or the wheelset [14, 15]. Such responses are
evaluated under a short duration pulse excitation coupled with the track irregularity. A few
analytical and experimental roller rig studies have identified critical speeds by monitoring
oscillatory response of the wheelset and the truck under an initial condition disturbance. Molatefi
et al. [106, 107] simulated this method to determine hunting velocities of different unloaded freight
wagons considering suspension and wheel-rail contact nonlinearities. The results suggested strong
dependence of limit cycle motions of the bogie on both the forward velocity and the initial
disturbance magnitude, in addition to a non-linear relation between the frequency of oscillations
and speed.
While the linear analyses have provided valuable guidance on influences of various
subsystems’ parameters, geometries and profiles, in-depth nonlinear component modeling and
analysis are essential for accurate predictions of critical speeds and dynamic responses. From the
review of reported nonlinear models, it is evident that even the most complex and detailed nonlinear
models encompass simplified representations of the friction damping present in the secondary
suspension [23, 33]. The friction wedges in the secondary suspension of a three-piece bogie exhibit
strongly nonlinear damping properties attributed to complex variations in the contact forces,
contacting surfaces geometry and the friction coefficient. Moreover, these yield substantial
magnitudes of multi-directional variable damping, which could help realize enhanced performance
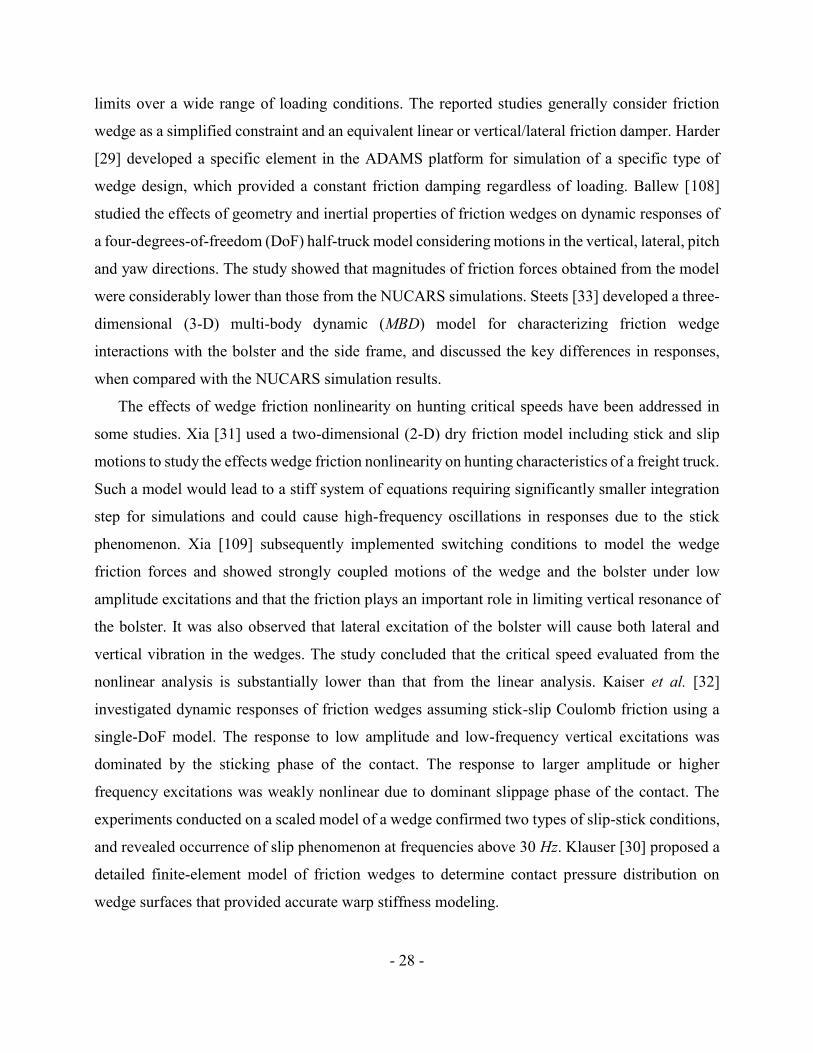
- 28 -
limits over a wide range of loading conditions. The reported studies generally consider friction
wedge as a simplified constraint and an equivalent linear or vertical/lateral friction damper. Harder
[29] developed a specific element in the ADAMS platform for simulation of a specific type of
wedge design, which provided a constant friction damping regardless of loading. Ballew [108]
studied the effects of geometry and inertial properties of friction wedges on dynamic responses of
a four-degrees-of-freedom (DoF) half-truck model considering motions in the vertical, lateral, pitch
and yaw directions. The study showed that magnitudes of friction forces obtained from the model
were considerably lower than those from the NUCARS simulations. Steets [33] developed a three-
dimensional (3-D) multi-body dynamic (MBD) model for characterizing friction wedge
interactions with the bolster and the side frame, and discussed the key differences in responses,
when compared with the NUCARS simulation results.
The effects of wedge friction nonlinearity on hunting critical speeds have been addressed in
some studies. Xia [31] used a two-dimensional (2-D) dry friction model including stick and slip
motions to study the effects wedge friction nonlinearity on hunting characteristics of a freight truck.
Such a model would lead to a stiff system of equations requiring significantly smaller integration
step for simulations and could cause high-frequency oscillations in responses due to the stick
phenomenon. Xia [109] subsequently implemented switching conditions to model the wedge
friction forces and showed strongly coupled motions of the wedge and the bolster under low
amplitude excitations and that the friction plays an important role in limiting vertical resonance of
the bolster. It was also observed that lateral excitation of the bolster will cause both lateral and
vertical vibration in the wedges. The study concluded that the critical speed evaluated from the
nonlinear analysis is substantially lower than that from the linear analysis. Kaiser et al. [32]
investigated dynamic responses of friction wedges assuming stick-slip Coulomb friction using a
single-DoF model. The response to low amplitude and low-frequency vertical excitations was
dominated by the sticking phase of the contact. The response to larger amplitude or higher
frequency excitations was weakly nonlinear due to dominant slippage phase of the contact. The
experiments conducted on a scaled model of a wedge confirmed two types of slip-stick conditions,
and revealed occurrence of slip phenomenon at frequencies above 30 Hz. Klauser [30] proposed a
detailed finite-element model of friction wedges to determine contact pressure distribution on
wedge surfaces that provided accurate warp stiffness modeling.
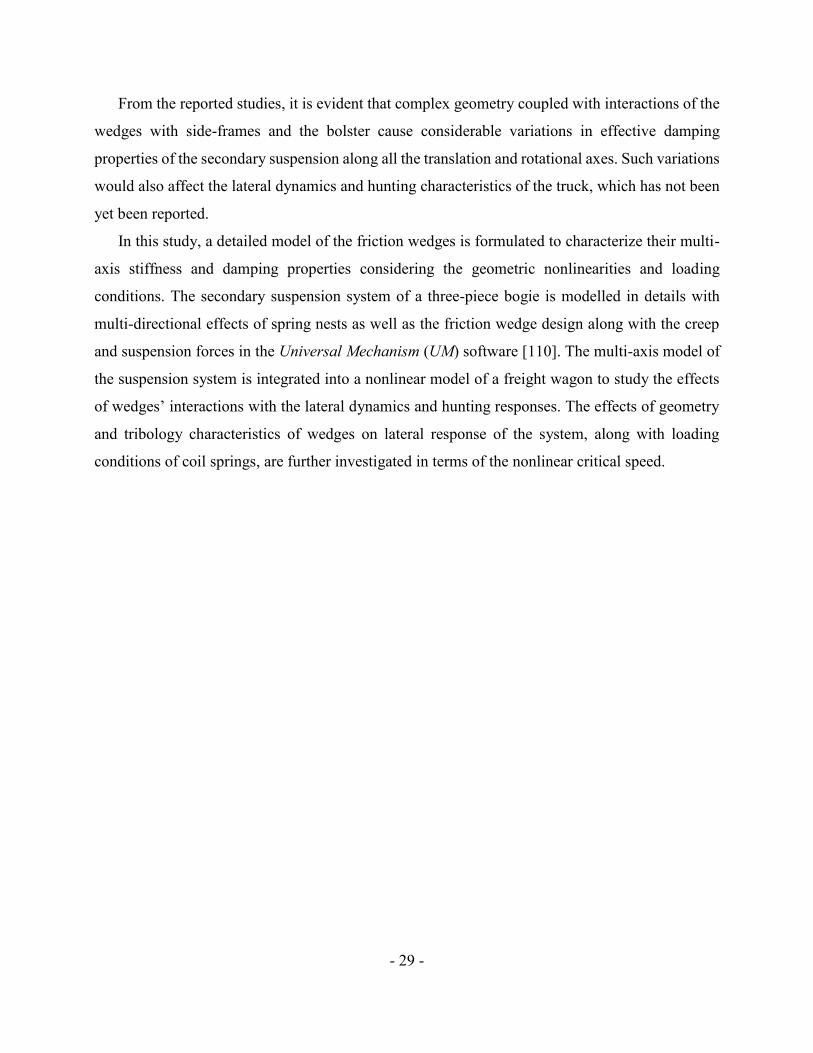
- 29 -
From the reported studies, it is evident that complex geometry coupled with interactions of the
wedges with side-frames and the bolster cause considerable variations in effective damping
properties of the secondary suspension along all the translation and rotational axes. Such variations
would also affect the lateral dynamics and hunting characteristics of the truck, which has not been
yet been reported.
In this study, a detailed model of the friction wedges is formulated to characterize their multi-
axis stiffness and damping properties considering the geometric nonlinearities and loading
conditions. The secondary suspension system of a three-piece bogie is modelled in details with
multi-directional effects of spring nests as well as the friction wedge design along with the creep
and suspension forces in the Universal Mechanism (UM) software [110]. The multi-axis model of
the suspension system is integrated into a nonlinear model of a freight wagon to study the effects
of wedges’ interactions with the lateral dynamics and hunting responses. The effects of geometry
and tribology characteristics of wedges on lateral response of the system, along with loading
conditions of coil springs, are further investigated in terms of the nonlinear critical speed.
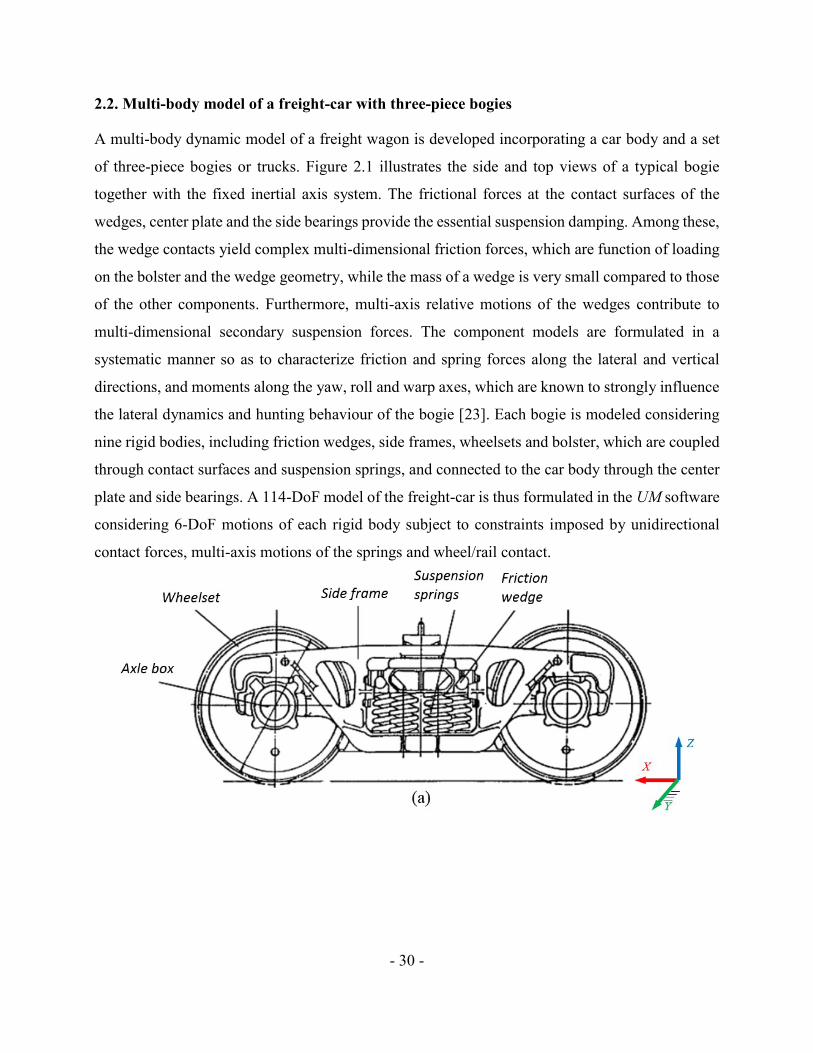
- 30 -
2.2. Multi-body model of a freight-car with three-piece bogies
A multi-body dynamic model of a freight wagon is developed incorporating a car body and a set
of three-piece bogies or trucks. Figure 2.1 illustrates the side and top views of a typical bogie
together with the fixed inertial axis system. The frictional forces at the contact surfaces of the
wedges, center plate and the side bearings provide the essential suspension damping. Among these,
the wedge contacts yield complex multi-dimensional friction forces, which are function of loading
on the bolster and the wedge geometry, while the mass of a wedge is very small compared to those
of the other components. Furthermore, multi-axis relative motions of the wedges contribute to
multi-dimensional secondary suspension forces. The component models are formulated in a
systematic manner so as to characterize friction and spring forces along the lateral and vertical
directions, and moments along the yaw, roll and warp axes, which are known to strongly influence
the lateral dynamics and hunting behaviour of the bogie [23]. Each bogie is modeled considering
nine rigid bodies, including friction wedges, side frames, wheelsets and bolster, which are coupled
through contact surfaces and suspension springs, and connected to the car body through the center
plate and side bearings. A 114-DoF model of the freight-car is thus formulated in the UM software
considering 6-DoF motions of each rigid body subject to constraints imposed by unidirectional
contact forces, multi-axis motions of the springs and wheel/rail contact.
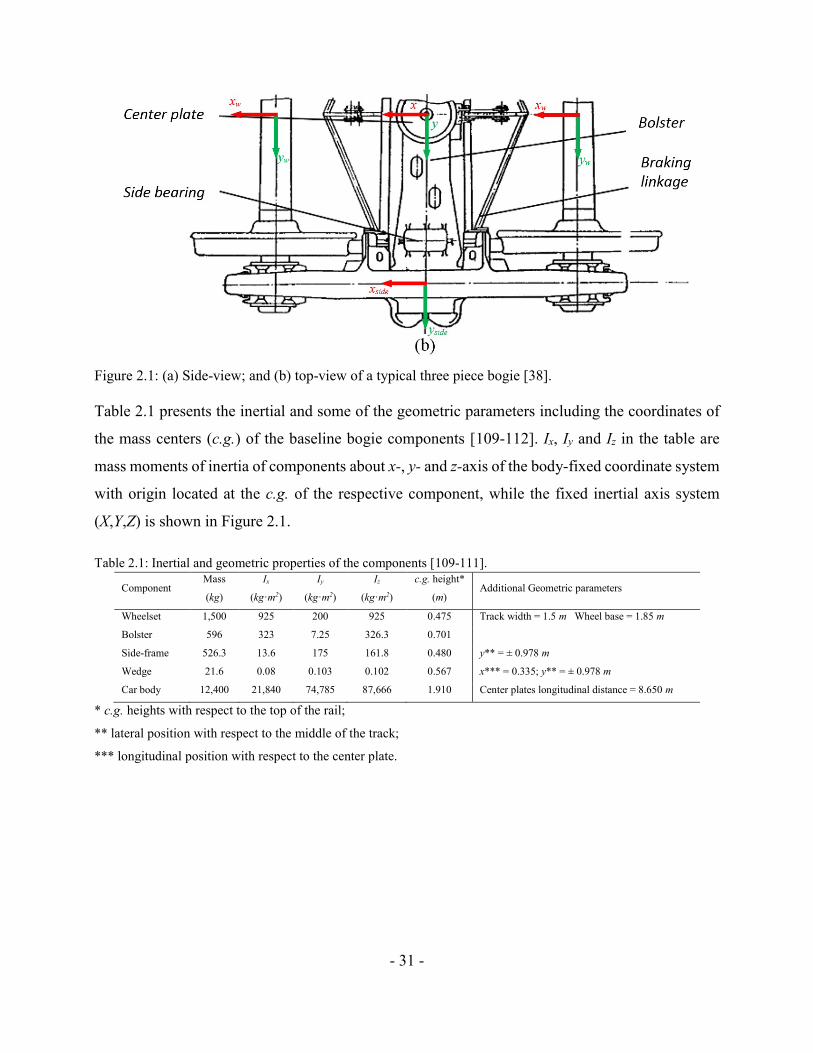
- 31 -
Figure 2.1: (a) Side-view; and (b) top-view of a typical three piece bogie [38].
Table 2.1 presents the inertial and some of the geometric parameters including the coordinates of
the mass centers (c.g.) of the baseline bogie components [109-112]. Ix, Iy and Iz in the table are
mass moments of inertia of components about x-, y- and z-axis of the body-fixed coordinate system
with origin located at the c.g. of the respective component, while the fixed inertial axis system
(X,Y,Z) is shown in Figure 2.1.
Table 2.1: Inertial and geometric properties of the components [109-111].
Component Mass
(kg)
Ix
(kg·m2)
Iy
(kg·m2)
Iz
(kg·m2)
c.g. height*
(m) Additional Geometric parameters
Wheelset 1,500 925 200 925 0.475 Track width = 1.5 m Wheel base = 1.85 m
Bolster 596 323 7.25 326.3 0.701
Side-frame 526.3 13.6 175 161.8 0.480 y** = ± 0.978 m
Wedge 21.6 0.08 0.103 0.102 0.567 x*** = 0.335; y** = ± 0.978 m
Car body 12,400 21,840 74,785 87,666 1.910 Center plates longitudinal distance = 8.650 m
* c.g. heights with respect to the top of the rail;
** lateral position with respect to the middle of the track;
*** longitudinal position with respect to the center plate.

- 32 -
2.2.1 Suspension springs modelling
In the secondary suspension of the bogie, each wedge is seated on a set of helical springs, while
the bolster is supported by a set of five bolster springs on the left- and right-sides, as shown in
Figure 2.2. Each spring set is a parallel and concentric arrangement of inner and outer springs. The
suspension springs are generally considered as linear springs in the axial direction alone [23, 109].
The couplings between different motions and the reaction moments, however, cause transverse and
bending deformations of the springs leading to substantial forces and moments along the non-axial
directions [113].
Side frame
Bolster springsInner spring
Outer springWedge spring
Figure 2.2: Multi-directional deflection and effective stiffness of suspension springs.
The effective stiffness of the suspension springs are thus defined considering the coupling among
translational and rotational motions, and non-axial reaction forces, such that [113]:
[ 𝐹𝑥𝐹𝑦𝐹𝑧𝑀𝑥𝑀𝑦𝑀𝑧]
=
[ 𝑘𝑥𝑥000
𝑘𝑦𝑦𝐻/2
0
0𝑘𝑦𝑦0
−𝑘𝑥𝑥𝐻/200
00𝑘𝑧𝑧000
0−𝑘𝑦𝑦𝐻/2
0𝑘𝜃00
𝑘𝑥𝑥𝐻/2000𝑘𝛽0
00000𝑘𝜓]
[ 𝑥𝑦𝑧𝜃𝛽𝜓]
(2.1)
In the above matrix, 𝑘𝑥𝑥, 𝑘𝑦𝑦 and 𝑘𝑧𝑧 are the effective stiffness of the wedges and bolster springs
along the longitudinal (x), lateral (y) and vertical (z) axis, respectively. 𝑘𝜃 and 𝑘𝛽 are the bending
stiffness of the springs corresponding to angular deformations about x- and y- axis (θ and β),
respectively. 𝑘𝜓 is torsional stiffness attributed to yaw deformation 𝜓 about the z-axis. 𝐹𝑥, 𝐹𝑦 and
𝐹𝑧 are the forces developed by each spring along the x, y, z axis, respectively, and 𝑀𝑥, 𝑀𝑦 and 𝑀𝑧
are the respective moments. In the above equation, H denotes the spring height. The effective
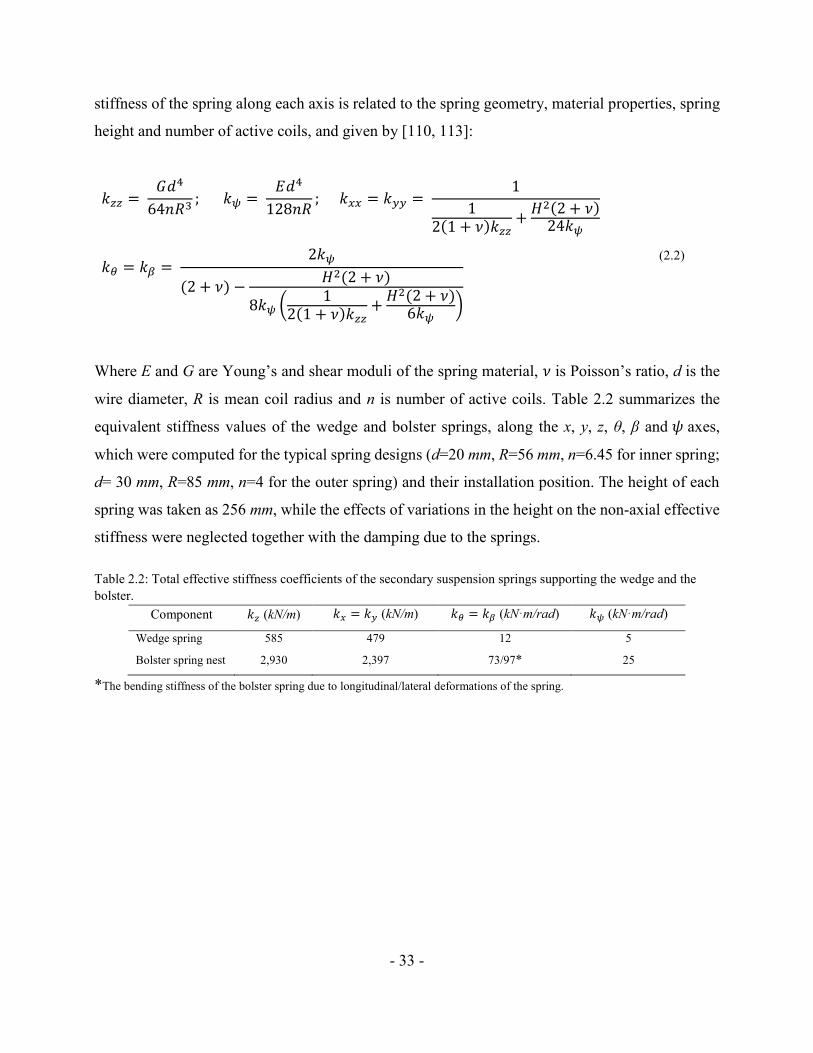
- 33 -
stiffness of the spring along each axis is related to the spring geometry, material properties, spring
height and number of active coils, and given by [110, 113]:
𝑘𝑧𝑧 = 𝐺𝑑4
64𝑛𝑅3; 𝑘𝜓 =
𝐸𝑑4
128𝑛𝑅; 𝑘𝑥𝑥 = 𝑘𝑦𝑦 =
1
12(1 + 𝜈)𝑘𝑧𝑧
+𝐻2(2 + 𝜈)24𝑘𝜓
𝑘𝜃 = 𝑘𝛽 = 2𝑘𝜓
(2 + 𝜈) −𝐻2(2 + 𝜈)
8𝑘𝜓 (1
2(1 + 𝜈)𝑘𝑧𝑧+𝐻2(2 + 𝜈)6𝑘𝜓
)
(2.2)
Where E and G are Young’s and shear moduli of the spring material, 𝜈 is Poisson’s ratio, d is the
wire diameter, R is mean coil radius and n is number of active coils. Table 2.2 summarizes the
equivalent stiffness values of the wedge and bolster springs, along the x, y, z, θ, β and 𝜓 axes,
which were computed for the typical spring designs (d=20 mm, R=56 mm, n=6.45 for inner spring;
d= 30 mm, R=85 mm, n=4 for the outer spring) and their installation position. The height of each
spring was taken as 256 mm, while the effects of variations in the height on the non-axial effective
stiffness were neglected together with the damping due to the springs.
Table 2.2: Total effective stiffness coefficients of the secondary suspension springs supporting the wedge and the
bolster.
Component 𝑘𝑧 (kN/m) 𝑘𝑥 = 𝑘𝑦 (kN/m) 𝑘𝜃 = 𝑘𝛽 (kN·m/rad) 𝑘𝜓 (kN·m/rad)
Wedge spring 585 479 12 5
Bolster spring nest 2,930 2,397 73/97* 25
*The bending stiffness of the bolster spring due to longitudinal/lateral deformations of the spring.
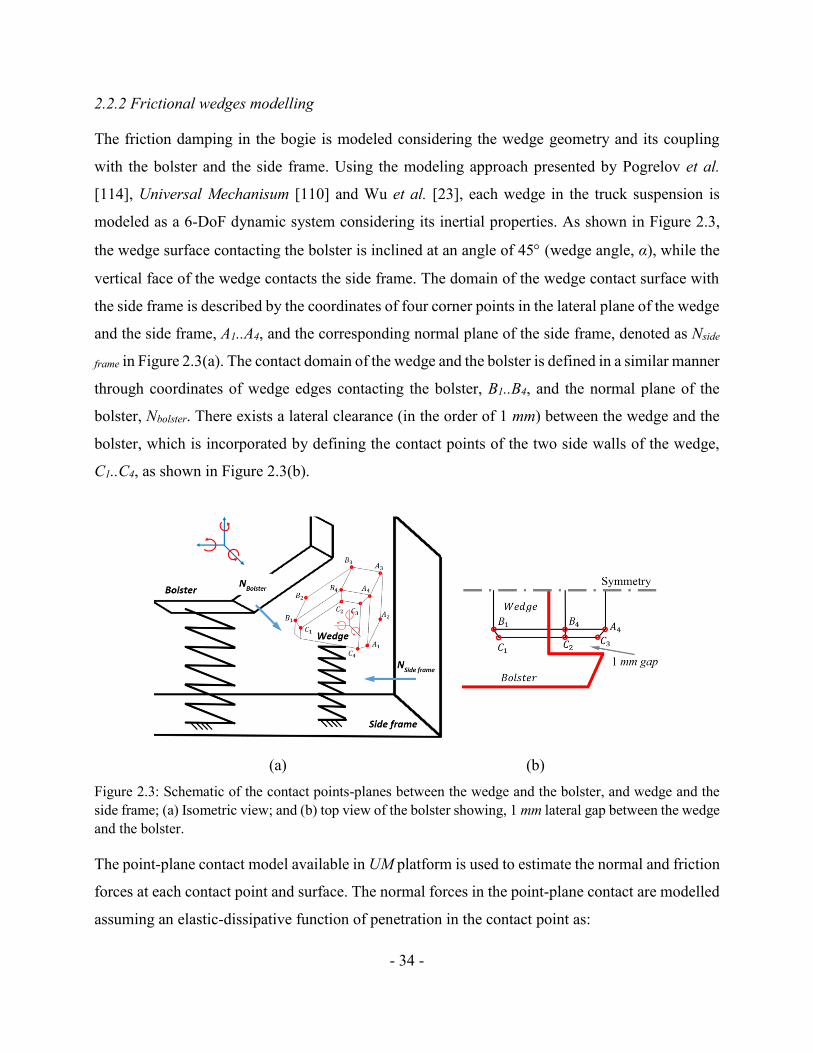
- 34 -
2.2.2 Frictional wedges modelling
The friction damping in the bogie is modeled considering the wedge geometry and its coupling
with the bolster and the side frame. Using the modeling approach presented by Pogrelov et al.
[114], Universal Mechanisum [110] and Wu et al. [23], each wedge in the truck suspension is
modeled as a 6-DoF dynamic system considering its inertial properties. As shown in Figure 2.3,
the wedge surface contacting the bolster is inclined at an angle of 45 (wedge angle, α), while the
vertical face of the wedge contacts the side frame. The domain of the wedge contact surface with
the side frame is described by the coordinates of four corner points in the lateral plane of the wedge
and the side frame, A1..A4, and the corresponding normal plane of the side frame, denoted as Nside
frame in Figure 2.3(a). The contact domain of the wedge and the bolster is defined in a similar manner
through coordinates of wedge edges contacting the bolster, B1..B4, and the normal plane of the
bolster, Nbolster. There exists a lateral clearance (in the order of 1 mm) between the wedge and the
bolster, which is incorporated by defining the contact points of the two side walls of the wedge,
C1..C4, as shown in Figure 2.3(b).
(a) (b)
Figure 2.3: Schematic of the contact points-planes between the wedge and the bolster, and wedge and the
side frame; (a) Isometric view; and (b) top view of the bolster showing, 1 mm lateral gap between the wedge
and the bolster.
The point-plane contact model available in UM platform is used to estimate the normal and friction
forces at each contact point and surface. The normal forces in the point-plane contact are modelled
assuming an elastic-dissipative function of penetration in the contact point as:
- 35 -
𝐹𝑁 = {𝐾𝑐Δ + 𝐶𝑐
𝑑∆
𝑑𝑡if Δ > 0
0 if Δ < 0
(2.3)
where Kc and Cc are the contact stiffness and damping constants, respectively, and Δ is the
penetration. The condition of the penetration simulates a unilateral normal contact model with zero
adhesion. The simulations in the Universal Mechanism platform address the non-smooth
characteristics associated with the stick-slip transition. The friction force, 𝐹𝑠 in sticking phase is
obtained considering the friction as a viscoelastic element. The resulting force 𝐹𝑠 and dynamic
deformation in the direction of the friction force is stored for addition in the successive integration
steps to ensure the continuity of the friction force. The slip mode is assumed when the friction force
magnitude exceeds 𝜇0𝐹𝑁 , where 𝜇0 is static friction coefficient. The sliding friction force is
evaluated considering Coulomb’s friction, such that 𝐹𝑠 = −𝜇𝑠𝐹𝑁𝜐 𝑠/|𝜐 𝑠| , where 𝜇𝑠 is dynamic
friction coefficient, and 𝜐 𝑠 is the sliding velocity vector and 𝐹𝑁 is normal contact force obtained
from Equation (2.3). The dynamic friction coefficient 𝜇𝑠 is defined as a function of the sliding
velocity considering the Stribeck velocity 𝑣𝑠𝑡𝑟, such that [110]:
𝜇𝑠(𝑣𝑠) = 𝜇∞ + (𝜇0 − 𝜇∞)𝑒−(𝑣𝑠𝑣𝑠𝑡𝑟⁄ )
𝛿
(2.4)
Where 𝜇∞ is friction coefficient at a high sliding velocity, and 𝛿 is an empirical exponent used to
smoothen the friction coefficients during sliding velocity transition.
- 36 -
2.2.3 Identification of contact parameters
The wedge contacts in the freight car suspension system constitute very high contact stiffness,
which yield a stiff system of differential equations resulting in not only greater computational
demand but also noise in the system responses [23]. The contact stiffness and damping properties,
Kc and Cc, are identified considering the computational demand as well as the convergence of the
system responses. The contact stiffness is estimated assuming that the oscillations in the contact
forces acting on the wedges occur at substantially higher frequencies than the frequency range of
the dominant dynamic responses that occur only up to 20 Hz [23, 110, 115]. An initial estimate of
the contact stiffness is obtained assuming this frequency as 100 Hz, considering single-DoF
dynamics of the wedge [23]. The contact stiffness is gradually increased up to 20 times the initially
assumed value, and the resulting force-displacement responses are evaluated for both the
convergence and computing time requirement in terms of the integration step-size. The contact
stiffness was selected so as to achieve minimal high frequency oscillations in the contact force with
a reasonable integration time step. For this purpose, a virtual test rig of the bogie was created in
the UM platform considering vertical harmonic motion of the bolster. The test rig comprised the
bolster and wedges, while the two side frames were fixed. A vertical harmonic displacement
excitation was applied to the bolster at the vertical mode resonant frequency of the bolster, which
is estimated from [116]: 𝑓𝑧 = √(2𝐾𝑧𝑏 + 4𝐾𝑧
𝑤)/(𝑚𝑏 + 0.5 × 𝑚𝑐)/2𝜋 , where 𝐾𝑧𝑏 and 𝐾𝑧
𝑤 are
effective stiffness of the bolster and wedge springs; 𝑚𝑏 and 𝑚𝑐 are masses due to bolster and car
body, respectively.
The simulations were performed under 5 mm vertical displacement excitation considering static
and sliding friction coefficients, 𝜇0 and 𝜇∞, respectively, as 0.30 and 0.25 for the wedge-side frame
contact, and 0.12 and 0.10 for the wedge-bolster contact surfaces [23, 115]. The contact stiffness
was varied from the initially assumed value of 8.29 to 165.8 MN/m, and the responses were
obtained considering two different damping ratios (𝜁= 0.01 and 0.1) due to contact damping
constant, Cc. The equations of motion for the virtual test rig were solved using the Park method
[110, 117] with time step varying from 1×10-12 to a maximum of 0.001 sec, and error tolerance of
1×10⁻⁸.
Figure 2.4 illustrates variations in the vertical component of the bolster contact force with
vertical motion and velocity for three different values of contact stiffness and two damping ratios.
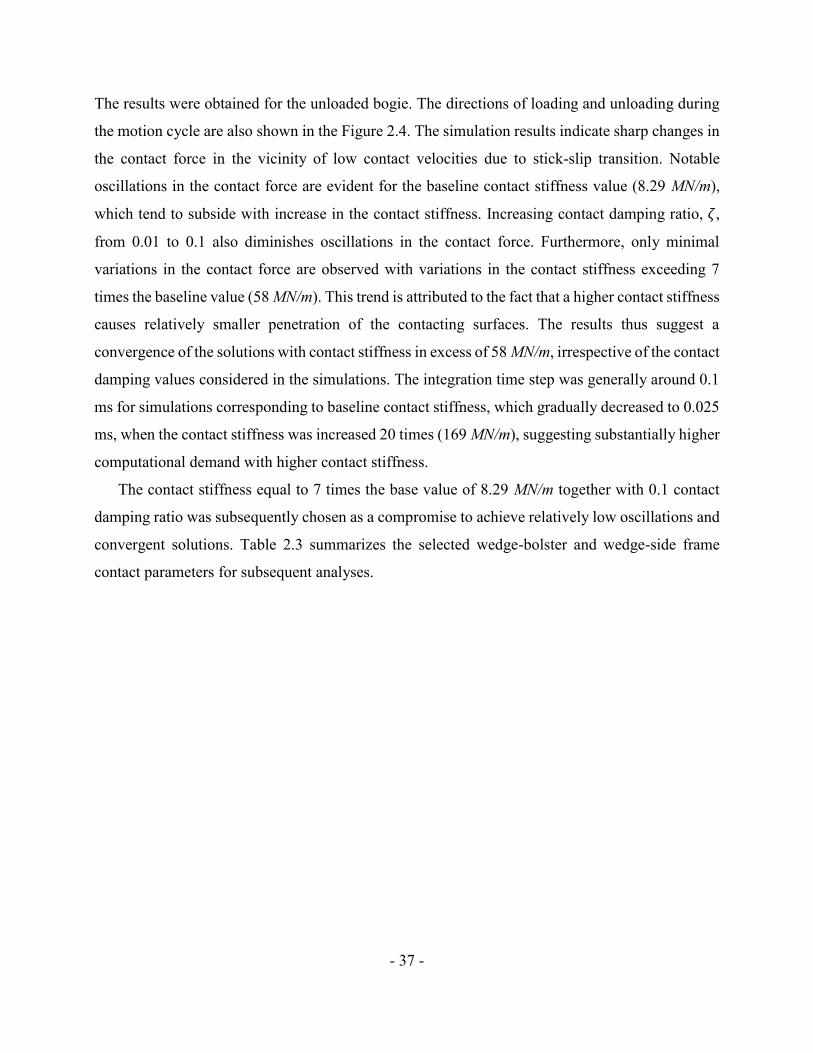
- 37 -
The results were obtained for the unloaded bogie. The directions of loading and unloading during
the motion cycle are also shown in the Figure 2.4. The simulation results indicate sharp changes in
the contact force in the vicinity of low contact velocities due to stick-slip transition. Notable
oscillations in the contact force are evident for the baseline contact stiffness value (8.29 MN/m),
which tend to subside with increase in the contact stiffness. Increasing contact damping ratio, 𝜁,
from 0.01 to 0.1 also diminishes oscillations in the contact force. Furthermore, only minimal
variations in the contact force are observed with variations in the contact stiffness exceeding 7
times the baseline value (58 MN/m). This trend is attributed to the fact that a higher contact stiffness
causes relatively smaller penetration of the contacting surfaces. The results thus suggest a
convergence of the solutions with contact stiffness in excess of 58 MN/m, irrespective of the contact
damping values considered in the simulations. The integration time step was generally around 0.1
ms for simulations corresponding to baseline contact stiffness, which gradually decreased to 0.025
ms, when the contact stiffness was increased 20 times (169 MN/m), suggesting substantially higher
computational demand with higher contact stiffness.
The contact stiffness equal to 7 times the base value of 8.29 MN/m together with 0.1 contact
damping ratio was subsequently chosen as a compromise to achieve relatively low oscillations and
convergent solutions. Table 2.3 summarizes the selected wedge-bolster and wedge-side frame
contact parameters for subsequent analyses.
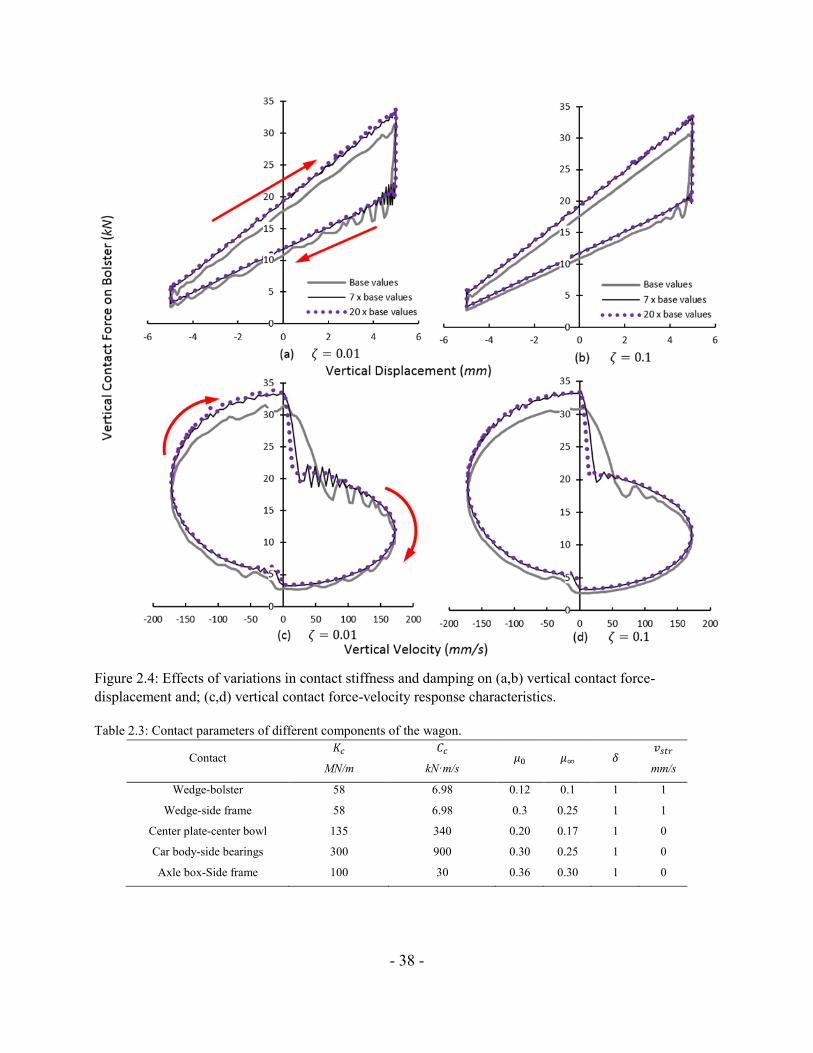
- 38 -
Figure 2.4: Effects of variations in contact stiffness and damping on (a,b) vertical contact force-
displacement and; (c,d) vertical contact force-velocity response characteristics.
Table 2.3: Contact parameters of different components of the wagon.
Contact 𝐾𝑐
MN/m
𝐶𝑐
kN·m/s 𝜇0 𝜇∞ 𝛿
𝑣𝑠𝑡𝑟
mm/s
Wedge-bolster 58 6.98 0.12 0.1 1 1
Wedge-side frame 58 6.98 0.3 0.25 1 1
Center plate-center bowl 135 340 0.20 0.17 1 0
Car body-side bearings 300 900 0.30 0.25 1 0
Axle box-Side frame 100 30 0.36 0.30 1 0
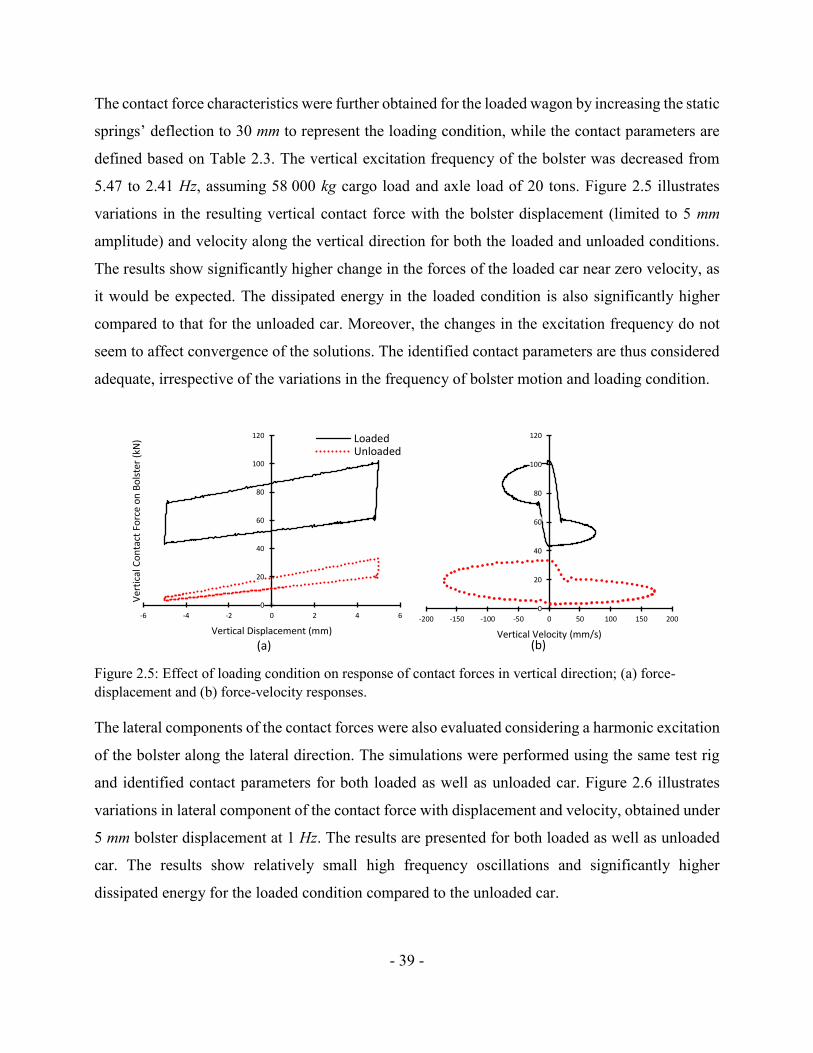
- 39 -
The contact force characteristics were further obtained for the loaded wagon by increasing the static
springs’ deflection to 30 mm to represent the loading condition, while the contact parameters are
defined based on Table 2.3. The vertical excitation frequency of the bolster was decreased from
5.47 to 2.41 Hz, assuming 58 000 kg cargo load and axle load of 20 tons. Figure 2.5 illustrates
variations in the resulting vertical contact force with the bolster displacement (limited to 5 mm
amplitude) and velocity along the vertical direction for both the loaded and unloaded conditions.
The results show significantly higher change in the forces of the loaded car near zero velocity, as
it would be expected. The dissipated energy in the loaded condition is also significantly higher
compared to that for the unloaded car. Moreover, the changes in the excitation frequency do not
seem to affect convergence of the solutions. The identified contact parameters are thus considered
adequate, irrespective of the variations in the frequency of bolster motion and loading condition.
Figure 2.5: Effect of loading condition on response of contact forces in vertical direction; (a) force-
displacement and (b) force-velocity responses.
The lateral components of the contact forces were also evaluated considering a harmonic excitation
of the bolster along the lateral direction. The simulations were performed using the same test rig
and identified contact parameters for both loaded as well as unloaded car. Figure 2.6 illustrates
variations in lateral component of the contact force with displacement and velocity, obtained under
5 mm bolster displacement at 1 Hz. The results are presented for both loaded as well as unloaded
car. The results show relatively small high frequency oscillations and significantly higher
dissipated energy for the loaded condition compared to the unloaded car.
0
20
40
60
80
100
120
-6 -4 -2 0 2 4 6
Ver
tica
l Co
nta
ct F
orc
e o
n B
ols
ter
(kN
)
Vertical Displacement (mm)
LoadedUnloaded
(a)
0
20
40
60
80
100
120
-200 -150 -100 -50 0 50 100 150 200
Vertical Velocity (mm/s)(b)
- 40 -
Figure 2.6: Lateral response of system subject to the lateral direction for loaded unloaded condition; (a)
lateral displacement; and (b) lateral velocity.
Apart from the wedges contact, the model also considers the contact and friction forces/moments
developed at the center plate and the side bearings, and between the axle box and the side frame.
The hunting oscillations of the rail vehicle are known to contribute to substantial contact
forces/moments and thus the damping, particularly in the yaw direction. The contact
forces/moment developed at the center plate and the side bearings in addition to the connection
between the axle box and the side frame are evaluated in the similar manner, and the identified
contact parameters are summarized in Table 2.3, where the clearance between the car body and the
side bearings is taken as 4 mm.
-30
-20
-10
0
10
20
30
-6 -4 -2 0 2 4 6
Late
ral C
on
tact
Fo
rce
on
Bo
lste
r (k
N)
Lateral Displacement (mm)
LoadedUnloaded
(a)
-30
-20
-10
0
10
20
30
-40 -30 -20 -10 0 10 20 30 40
Lateral Velocity (mm/s)
(b)
- 41 -
2.3 Stability analysis of wagon
The multi-body dynamic model of the three-piece bogie with the car body is used to evaluate lateral
stability (hunting) limits in terms of the critical forward speed. The analyses are performed for the
unloaded wagon. A multi-directional wheel/rail contact model incorporating the lateral, vertical
and roll motions of the wheelset is used. The model also includes the flange contact, which is vital
for an in-depth investigation of the hunting behavior. The Kalker’s FastSim [104] algorithm is used
to calculate the creep forces and moment in the contact patch. In this study, the contact region is
discretized by 10 × 20 cells, and the normal and tangential forces are evaluated considering the
UIC 60 rail profile and S1002 wheel profile with identical material properties. Each wheelset is
modeled as a six-DoF dynamic system so as to permit the wheel to climb over the rail within the
profiles constraints or hunting between the wheel and rail gap. The friction coefficient of the wheel
and rail contact surfaces is taken as 0.25 for both the tread and flange regions.
One of the important parameters that affect the stability margin of the bogie is the rail
inclination, the orientation of the rail profile about the longitudinal axis of the track, which is taken
as 1/40 radian [3, 20, 107]. The given profiles and rail inclination lead to a single point contact
condition, when the roll angle and lateral displacement of the wheelset are less than 1 degree and
6.7 mm, respectively. The two-point contact condition will then change to single point at flange for
higher lateral movements. The methodology for treating the single and multiple wheel/rail contact
conditions are described in the Universal Mechanism user’s manual [110].
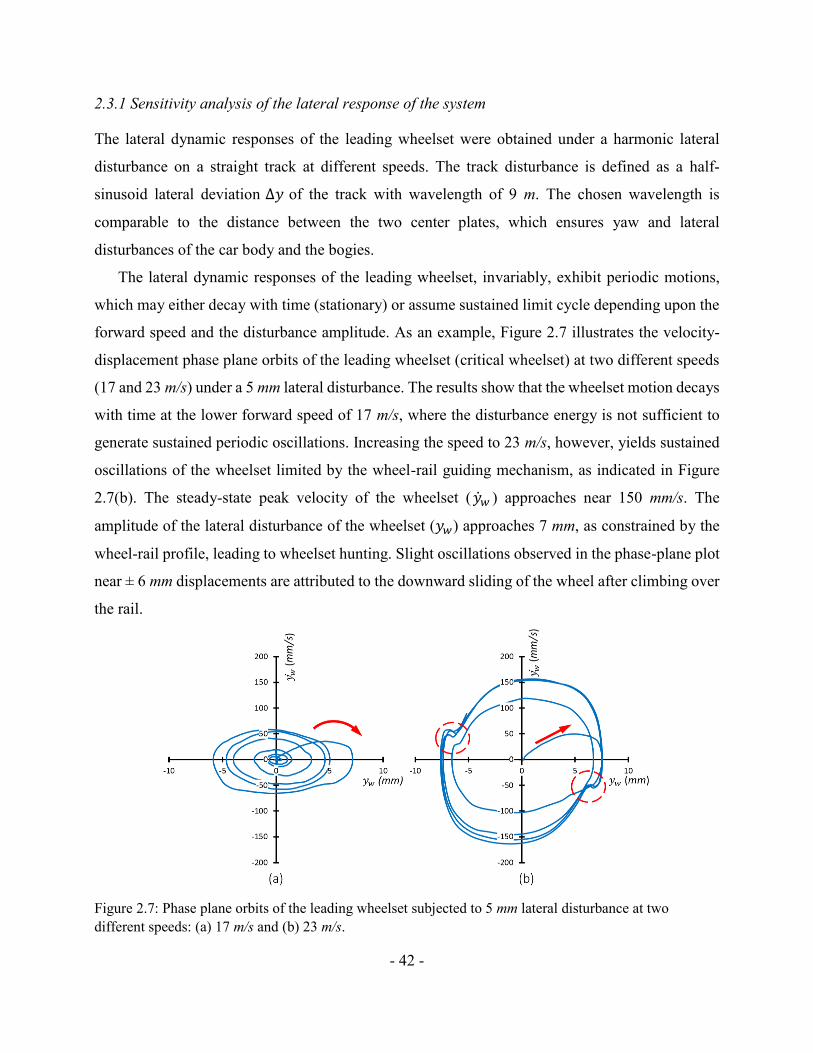
- 42 -
2.3.1 Sensitivity analysis of the lateral response of the system
The lateral dynamic responses of the leading wheelset were obtained under a harmonic lateral
disturbance on a straight track at different speeds. The track disturbance is defined as a half-
sinusoid lateral deviation ∆𝑦 of the track with wavelength of 9 m. The chosen wavelength is
comparable to the distance between the two center plates, which ensures yaw and lateral
disturbances of the car body and the bogies.
The lateral dynamic responses of the leading wheelset, invariably, exhibit periodic motions,
which may either decay with time (stationary) or assume sustained limit cycle depending upon the
forward speed and the disturbance amplitude. As an example, Figure 2.7 illustrates the velocity-
displacement phase plane orbits of the leading wheelset (critical wheelset) at two different speeds
(17 and 23 m/s) under a 5 mm lateral disturbance. The results show that the wheelset motion decays
with time at the lower forward speed of 17 m/s, where the disturbance energy is not sufficient to
generate sustained periodic oscillations. Increasing the speed to 23 m/s, however, yields sustained
oscillations of the wheelset limited by the wheel-rail guiding mechanism, as indicated in Figure
2.7(b). The steady-state peak velocity of the wheelset ( ��𝑤 ) approaches near 150 mm/s. The
amplitude of the lateral disturbance of the wheelset (𝑦𝑤) approaches 7 mm, as constrained by the
wheel-rail profile, leading to wheelset hunting. Slight oscillations observed in the phase-plane plot
near ± 6 mm displacements are attributed to the downward sliding of the wheel after climbing over
the rail.
Figure 2.7: Phase plane orbits of the leading wheelset subjected to 5 mm lateral disturbance at two
different speeds: (a) 17 m/s and (b) 23 m/s.
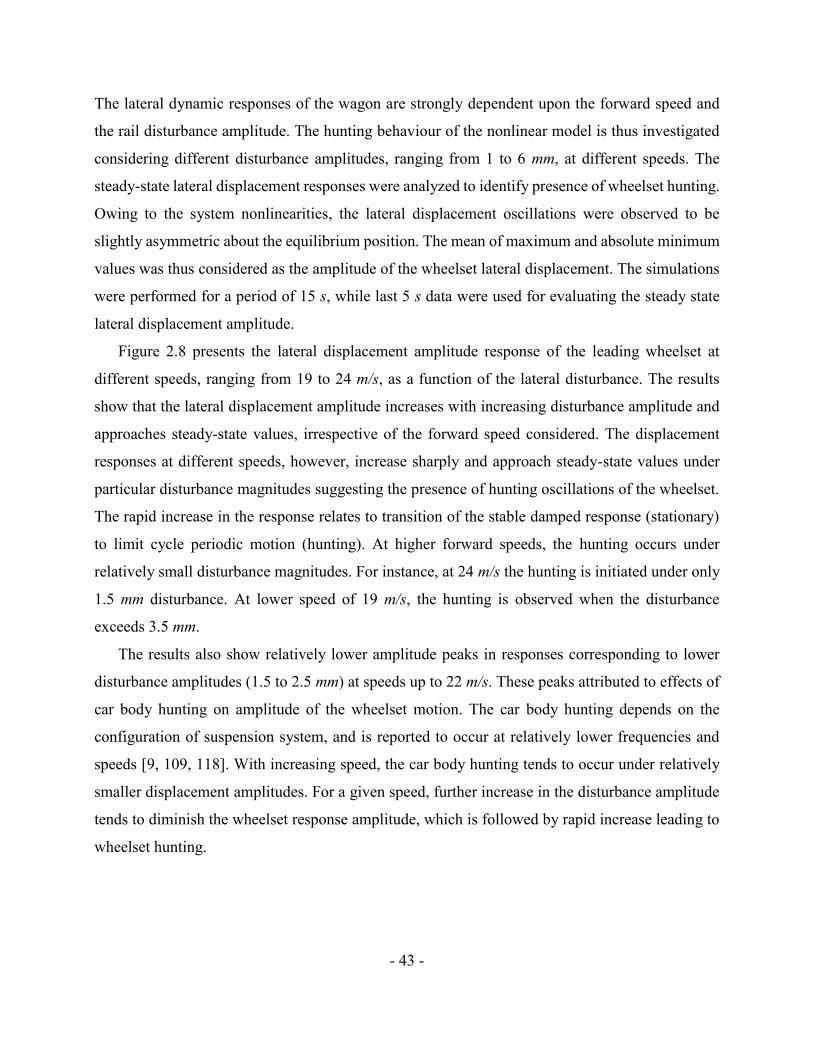
- 43 -
The lateral dynamic responses of the wagon are strongly dependent upon the forward speed and
the rail disturbance amplitude. The hunting behaviour of the nonlinear model is thus investigated
considering different disturbance amplitudes, ranging from 1 to 6 mm, at different speeds. The
steady-state lateral displacement responses were analyzed to identify presence of wheelset hunting.
Owing to the system nonlinearities, the lateral displacement oscillations were observed to be
slightly asymmetric about the equilibrium position. The mean of maximum and absolute minimum
values was thus considered as the amplitude of the wheelset lateral displacement. The simulations
were performed for a period of 15 s, while last 5 s data were used for evaluating the steady state
lateral displacement amplitude.
Figure 2.8 presents the lateral displacement amplitude response of the leading wheelset at
different speeds, ranging from 19 to 24 m/s, as a function of the lateral disturbance. The results
show that the lateral displacement amplitude increases with increasing disturbance amplitude and
approaches steady-state values, irrespective of the forward speed considered. The displacement
responses at different speeds, however, increase sharply and approach steady-state values under
particular disturbance magnitudes suggesting the presence of hunting oscillations of the wheelset.
The rapid increase in the response relates to transition of the stable damped response (stationary)
to limit cycle periodic motion (hunting). At higher forward speeds, the hunting occurs under
relatively small disturbance magnitudes. For instance, at 24 m/s the hunting is initiated under only
1.5 mm disturbance. At lower speed of 19 m/s, the hunting is observed when the disturbance
exceeds 3.5 mm.
The results also show relatively lower amplitude peaks in responses corresponding to lower
disturbance amplitudes (1.5 to 2.5 mm) at speeds up to 22 m/s. These peaks attributed to effects of
car body hunting on amplitude of the wheelset motion. The car body hunting depends on the
configuration of suspension system, and is reported to occur at relatively lower frequencies and
speeds [9, 109, 118]. With increasing speed, the car body hunting tends to occur under relatively
smaller displacement amplitudes. For a given speed, further increase in the disturbance amplitude
tends to diminish the wheelset response amplitude, which is followed by rapid increase leading to
wheelset hunting.
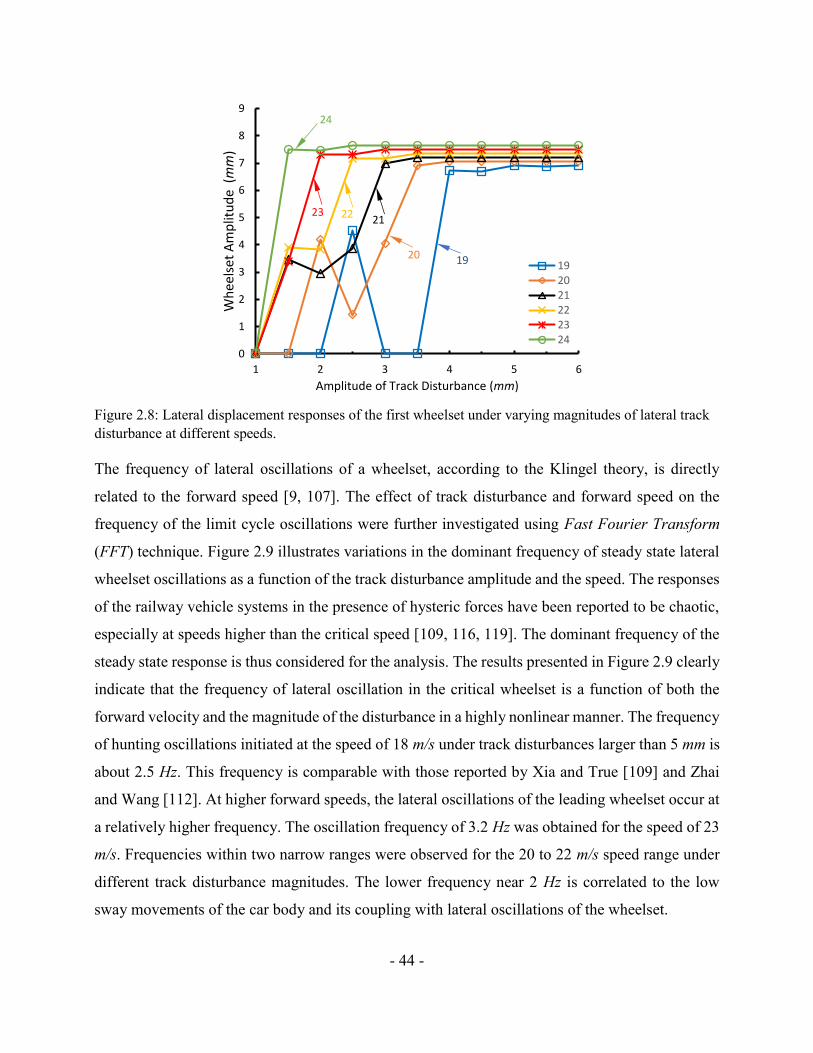
- 44 -
Figure 2.8: Lateral displacement responses of the first wheelset under varying magnitudes of lateral track
disturbance at different speeds.
The frequency of lateral oscillations of a wheelset, according to the Klingel theory, is directly
related to the forward speed [9, 107]. The effect of track disturbance and forward speed on the
frequency of the limit cycle oscillations were further investigated using Fast Fourier Transform
(FFT) technique. Figure 2.9 illustrates variations in the dominant frequency of steady state lateral
wheelset oscillations as a function of the track disturbance amplitude and the speed. The responses
of the railway vehicle systems in the presence of hysteric forces have been reported to be chaotic,
especially at speeds higher than the critical speed [109, 116, 119]. The dominant frequency of the
steady state response is thus considered for the analysis. The results presented in Figure 2.9 clearly
indicate that the frequency of lateral oscillation in the critical wheelset is a function of both the
forward velocity and the magnitude of the disturbance in a highly nonlinear manner. The frequency
of hunting oscillations initiated at the speed of 18 m/s under track disturbances larger than 5 mm is
about 2.5 Hz. This frequency is comparable with those reported by Xia and True [109] and Zhai
and Wang [112]. At higher forward speeds, the lateral oscillations of the leading wheelset occur at
a relatively higher frequency. The oscillation frequency of 3.2 Hz was obtained for the speed of 23
m/s. Frequencies within two narrow ranges were observed for the 20 to 22 m/s speed range under
different track disturbance magnitudes. The lower frequency near 2 Hz is correlated to the low
sway movements of the car body and its coupling with lateral oscillations of the wheelset.
0
1
2
3
4
5
6
7
8
9
1 2 3 4 5 6
Wh
eels
et A
mp
litu
de
(mm
)
Amplitude of Track Disturbance (mm)
192021222324
1920
212223
24
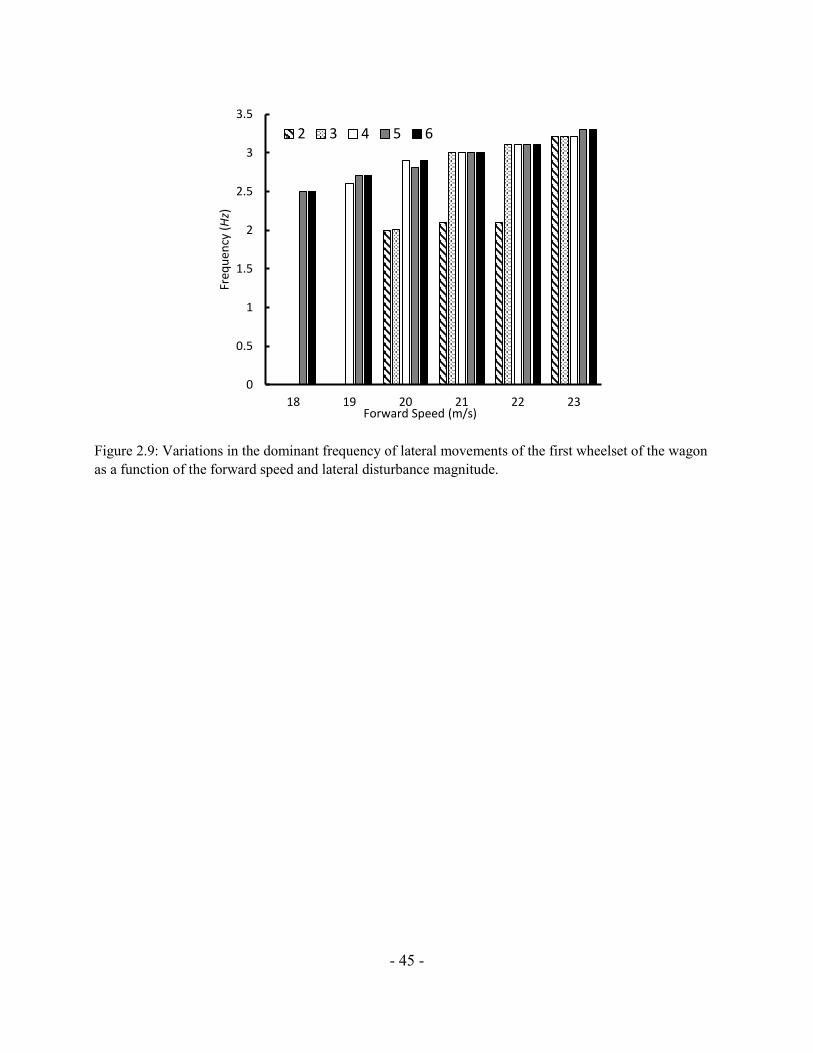
- 45 -
Figure 2.9: Variations in the dominant frequency of lateral movements of the first wheelset of the wagon
as a function of the forward speed and lateral disturbance magnitude.
0
0.5
1
1.5
2
2.5
3
3.5
18 19 20 21 22 23
Freq
uen
cy (Hz)
Forward Speed (m/s)
2 3 4 5 6
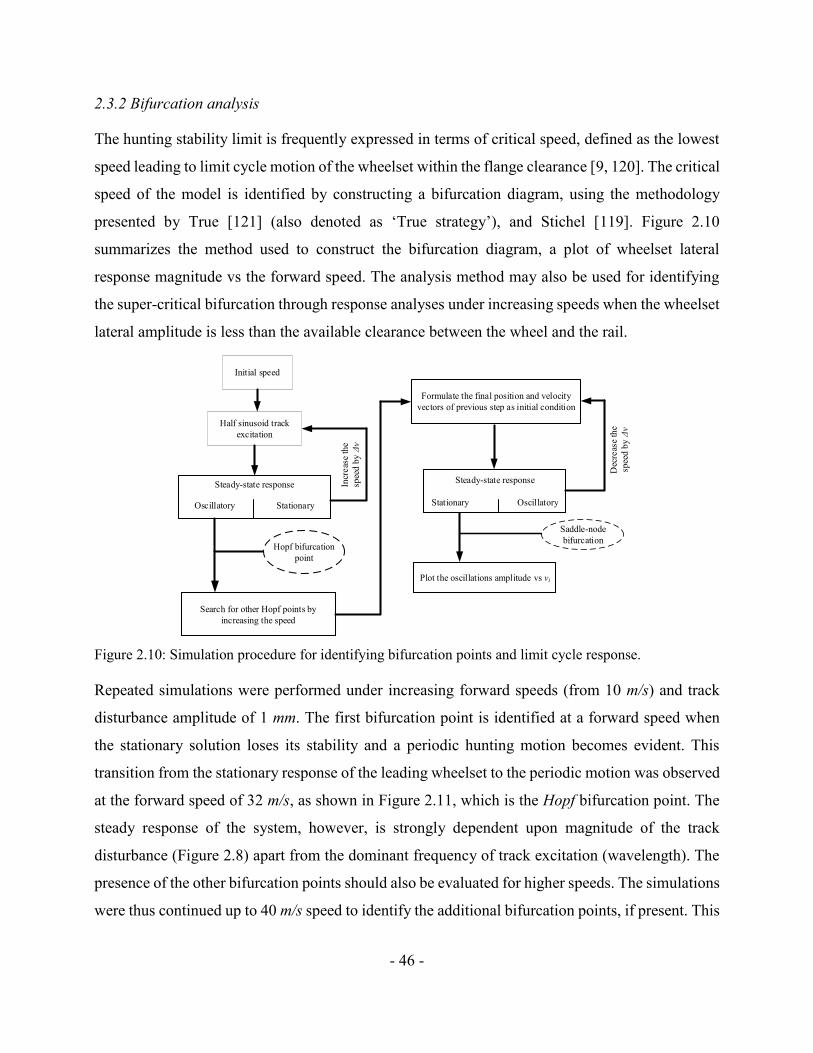
- 46 -
2.3.2 Bifurcation analysis
The hunting stability limit is frequently expressed in terms of critical speed, defined as the lowest
speed leading to limit cycle motion of the wheelset within the flange clearance [9, 120]. The critical
speed of the model is identified by constructing a bifurcation diagram, using the methodology
presented by True [121] (also denoted as ‘True strategy’), and Stichel [119]. Figure 2.10
summarizes the method used to construct the bifurcation diagram, a plot of wheelset lateral
response magnitude vs the forward speed. The analysis method may also be used for identifying
the super-critical bifurcation through response analyses under increasing speeds when the wheelset
lateral amplitude is less than the available clearance between the wheel and the rail.
Initial speed
Half sinusoid track
excitation
Steady-state response
Oscillatory Stationary
Hopf bifurcation
point
Incr
eas
e th
e
spee
d b
y Δ
v
Formulate the final position and velocity
vectors of previous step as initial condition
Dec
reas
e th
e
spee
d b
y Δ
v
Plot the oscillations amplitude vs vi
Saddle-node
bifurcation
Search for other Hopf points by
increasing the speed
Steady-state response
Stationary Oscillatory
Figure 2.10: Simulation procedure for identifying bifurcation points and limit cycle response.
Repeated simulations were performed under increasing forward speeds (from 10 m/s) and track
disturbance amplitude of 1 mm. The first bifurcation point is identified at a forward speed when
the stationary solution loses its stability and a periodic hunting motion becomes evident. This
transition from the stationary response of the leading wheelset to the periodic motion was observed
at the forward speed of 32 m/s, as shown in Figure 2.11, which is the Hopf bifurcation point. The
steady response of the system, however, is strongly dependent upon magnitude of the track
disturbance (Figure 2.8) apart from the dominant frequency of track excitation (wavelength). The
presence of the other bifurcation points should also be evaluated for higher speeds. The simulations
were thus continued up to 40 m/s speed to identify the additional bifurcation points, if present. This
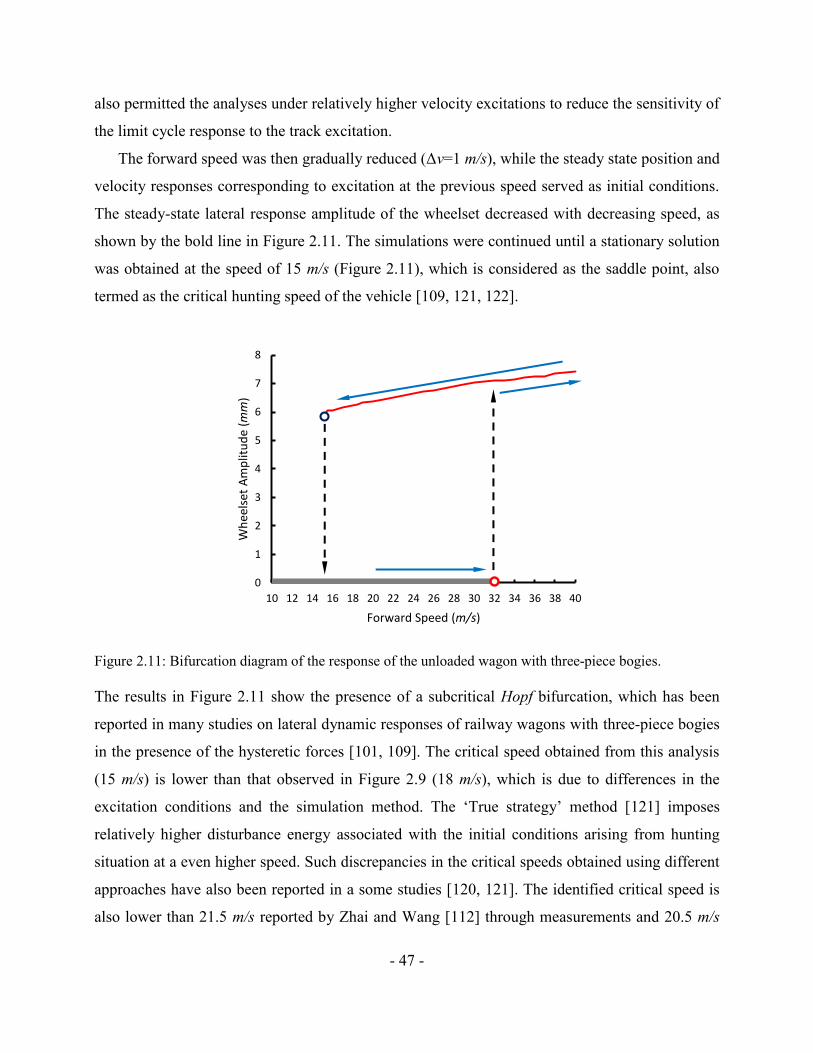
- 47 -
also permitted the analyses under relatively higher velocity excitations to reduce the sensitivity of
the limit cycle response to the track excitation.
The forward speed was then gradually reduced (Δv=1 m/s), while the steady state position and
velocity responses corresponding to excitation at the previous speed served as initial conditions.
The steady-state lateral response amplitude of the wheelset decreased with decreasing speed, as
shown by the bold line in Figure 2.11. The simulations were continued until a stationary solution
was obtained at the speed of 15 m/s (Figure 2.11), which is considered as the saddle point, also
termed as the critical hunting speed of the vehicle [109, 121, 122].
Figure 2.11: Bifurcation diagram of the response of the unloaded wagon with three-piece bogies.
The results in Figure 2.11 show the presence of a subcritical Hopf bifurcation, which has been
reported in many studies on lateral dynamic responses of railway wagons with three-piece bogies
in the presence of the hysteretic forces [101, 109]. The critical speed obtained from this analysis
(15 m/s) is lower than that observed in Figure 2.9 (18 m/s), which is due to differences in the
excitation conditions and the simulation method. The ‘True strategy’ method [121] imposes
relatively higher disturbance energy associated with the initial conditions arising from hunting
situation at a even higher speed. Such discrepancies in the critical speeds obtained using different
approaches have also been reported in a some studies [120, 121]. The identified critical speed is
also lower than 21.5 m/s reported by Zhai and Wang [112] through measurements and 20.5 m/s
0
1
2
3
4
5
6
7
8
10 12 14 16 18 20 22 24 26 28 30 32 34 36 38 40
Wh
eels
et A
mp
litu
de
(mm
)
Forward Speed (m/s)
- 48 -
reported by Xia [109] from simulations. These differences are likely due to differences in the test
wagon configurations and modeling considerations, respectively. Zhai and Wang [112] reported
the critical speed of a test wagon employing different bogies (Z8A), while Xia [109] considered
relatively higher friction coefficients for wedge and center plates surfaces, which likely contributed
to a higher critical speed.
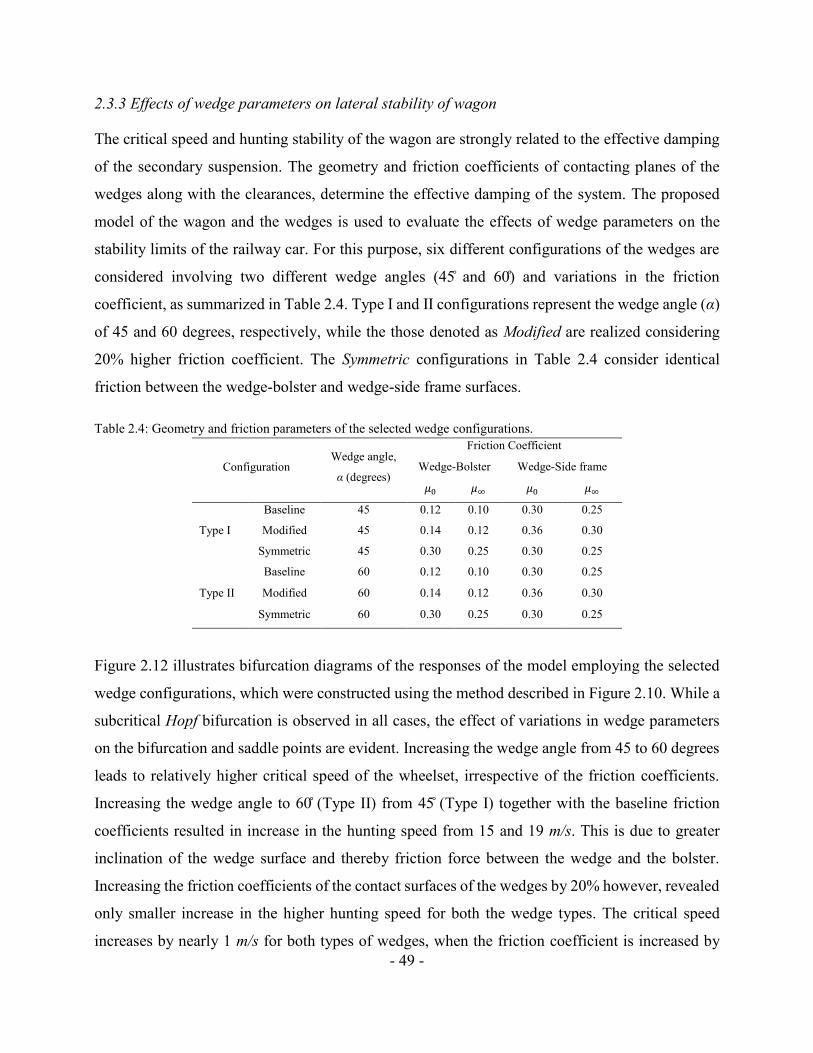
- 49 -
2.3.3 Effects of wedge parameters on lateral stability of wagon
The critical speed and hunting stability of the wagon are strongly related to the effective damping
of the secondary suspension. The geometry and friction coefficients of contacting planes of the
wedges along with the clearances, determine the effective damping of the system. The proposed
model of the wagon and the wedges is used to evaluate the effects of wedge parameters on the
stability limits of the railway car. For this purpose, six different configurations of the wedges are
considered involving two different wedge angles (45 and 60) and variations in the friction
coefficient, as summarized in Table 2.4. Type I and II configurations represent the wedge angle (α)
of 45 and 60 degrees, respectively, while the those denoted as Modified are realized considering
20% higher friction coefficient. The Symmetric configurations in Table 2.4 consider identical
friction between the wedge-bolster and wedge-side frame surfaces.
Table 2.4: Geometry and friction parameters of the selected wedge configurations.
Configuration Wedge angle,
α (degrees)
Friction Coefficient
Wedge-Bolster Wedge-Side frame
𝜇0 𝜇∞ 𝜇0 𝜇∞
Type I
Baseline 45 0.12 0.10 0.30 0.25
Modified 45 0.14 0.12 0.36 0.30
Symmetric 45 0.30 0.25 0.30 0.25
Type II
Baseline 60 0.12 0.10 0.30 0.25
Modified 60 0.14 0.12 0.36 0.30
Symmetric 60 0.30 0.25 0.30 0.25
Figure 2.12 illustrates bifurcation diagrams of the responses of the model employing the selected
wedge configurations, which were constructed using the method described in Figure 2.10. While a
subcritical Hopf bifurcation is observed in all cases, the effect of variations in wedge parameters
on the bifurcation and saddle points are evident. Increasing the wedge angle from 45 to 60 degrees
leads to relatively higher critical speed of the wheelset, irrespective of the friction coefficients.
Increasing the wedge angle to 60 (Type II) from 45 (Type I) together with the baseline friction
coefficients resulted in increase in the hunting speed from 15 and 19 m/s. This is due to greater
inclination of the wedge surface and thereby friction force between the wedge and the bolster.
Increasing the friction coefficients of the contact surfaces of the wedges by 20% however, revealed
only smaller increase in the higher hunting speed for both the wedge types. The critical speed
increases by nearly 1 m/s for both types of wedges, when the friction coefficient is increased by
- 50 -
20%, as seen in Figure 2.12. The results thus suggest that the wedge inclination contributes to
higher effective damping compared to the friction coefficient. A combination of higher wedge
angle and friction coefficients, however, could lead to a sustainably higher critical speed of 23 m/s.
This is evident from the responses of the wagon with symmetric wedge configurations, where the
friction coefficient of the wedge-bolster surfaces is increased significantly, as seen in Figure 2.12
(f). Orlova and Romen [26] also suggested that increasing the friction coefficient and the wedge
angle could provide higher damping over the service life of the wedges.
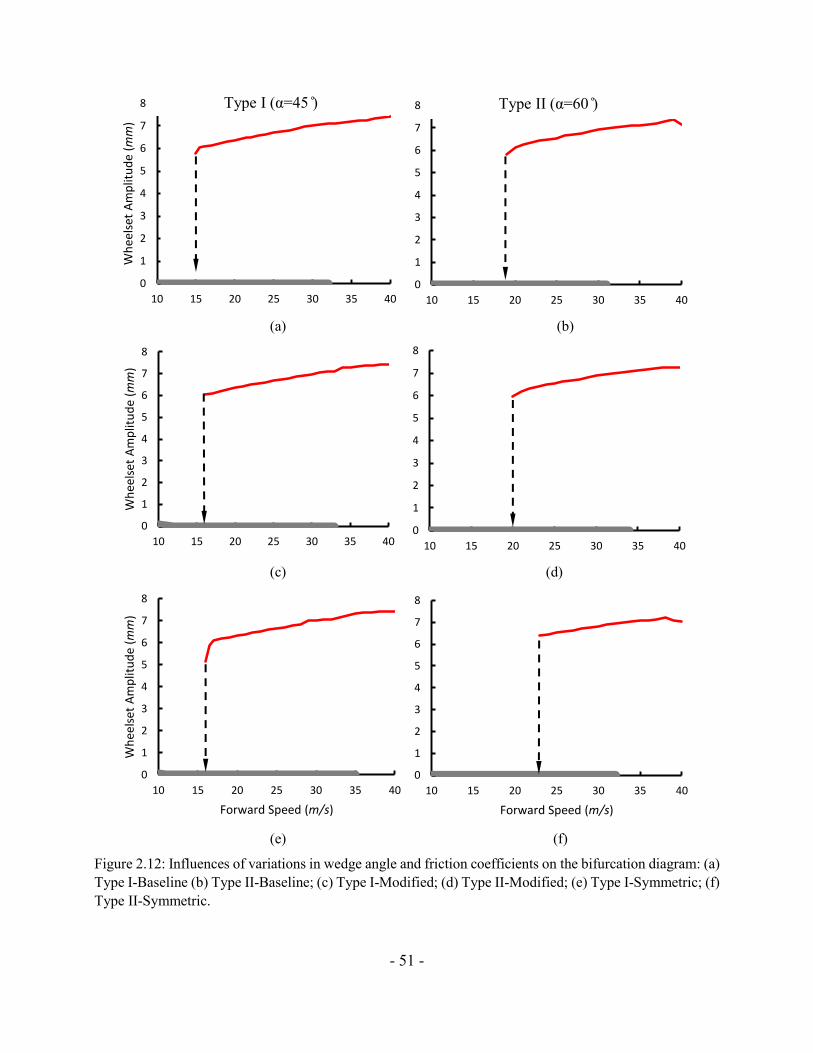
- 51 -
(a) (b)
(c) (d)
(e) (f)
Figure 2.12: Influences of variations in wedge angle and friction coefficients on the bifurcation diagram: (a)
Type I-Baseline (b) Type II-Baseline; (c) Type I-Modified; (d) Type II-Modified; (e) Type I-Symmetric; (f)
Type II-Symmetric.
0
1
2
3
4
5
6
7
8
10 15 20 25 30 35 40
Wh
eels
et A
mp
litu
de
(mm
)
0
1
2
3
4
5
6
7
8
10 15 20 25 30 35 40
0
1
2
3
4
5
6
7
8
10 15 20 25 30 35 40
Wh
eels
et A
mp
litu
de
(mm
)
0
1
2
3
4
5
6
7
8
10 15 20 25 30 35 40
0
1
2
3
4
5
6
7
8
10 15 20 25 30 35 40
Wh
eels
et A
mp
litu
de
(mm
)
Forward Speed (m/s)
0
1
2
3
4
5
6
7
8
10 15 20 25 30 35 40
Forward Speed (m/s)
Type I (α=45 ) Type II (α=60 )
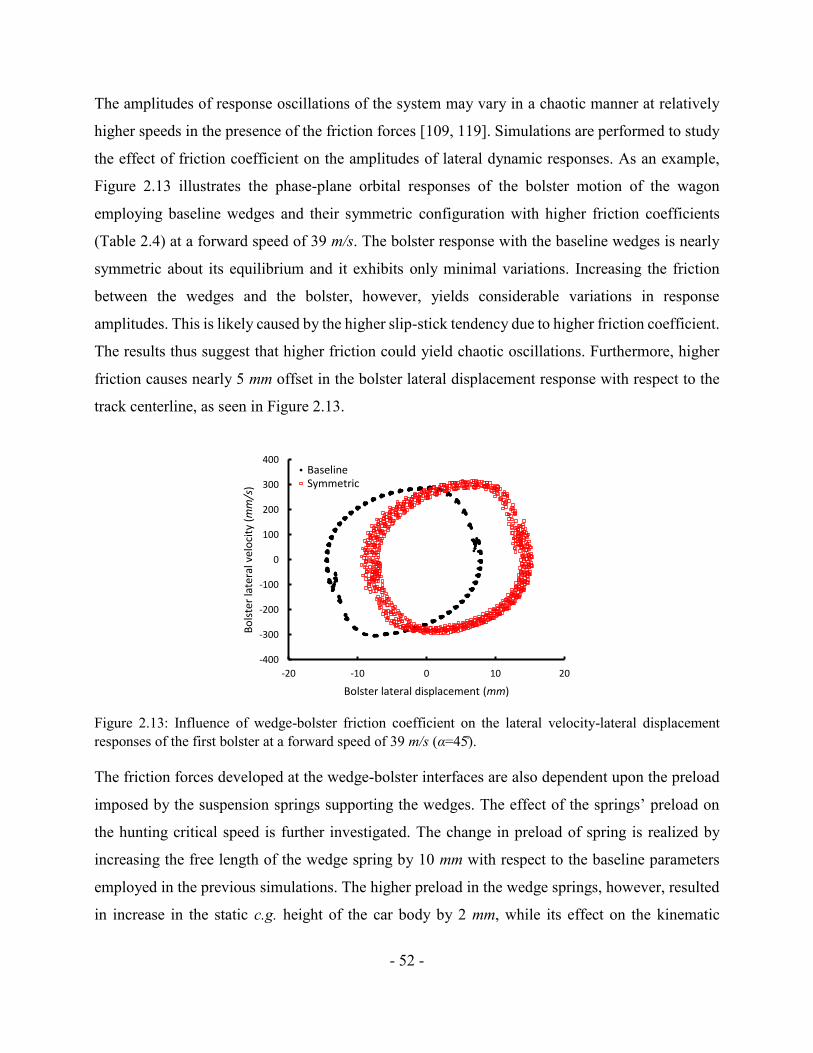
- 52 -
The amplitudes of response oscillations of the system may vary in a chaotic manner at relatively
higher speeds in the presence of the friction forces [109, 119]. Simulations are performed to study
the effect of friction coefficient on the amplitudes of lateral dynamic responses. As an example,
Figure 2.13 illustrates the phase-plane orbital responses of the bolster motion of the wagon
employing baseline wedges and their symmetric configuration with higher friction coefficients
(Table 2.4) at a forward speed of 39 m/s. The bolster response with the baseline wedges is nearly
symmetric about its equilibrium and it exhibits only minimal variations. Increasing the friction
between the wedges and the bolster, however, yields considerable variations in response
amplitudes. This is likely caused by the higher slip-stick tendency due to higher friction coefficient.
The results thus suggest that higher friction could yield chaotic oscillations. Furthermore, higher
friction causes nearly 5 mm offset in the bolster lateral displacement response with respect to the
track centerline, as seen in Figure 2.13.
Figure 2.13: Influence of wedge-bolster friction coefficient on the lateral velocity-lateral displacement
responses of the first bolster at a forward speed of 39 m/s (α=45).
The friction forces developed at the wedge-bolster interfaces are also dependent upon the preload
imposed by the suspension springs supporting the wedges. The effect of the springs’ preload on
the hunting critical speed is further investigated. The change in preload of spring is realized by
increasing the free length of the wedge spring by 10 mm with respect to the baseline parameters
employed in the previous simulations. The higher preload in the wedge springs, however, resulted
in increase in the static c.g. height of the car body by 2 mm, while its effect on the kinematic
-400
-300
-200
-100
0
100
200
300
400
-20 -10 0 10 20
Bo
lste
r la
tera
l vel
oci
ty (mm/s
)
Bolster lateral displacement (mm)
BaselineSymmetric
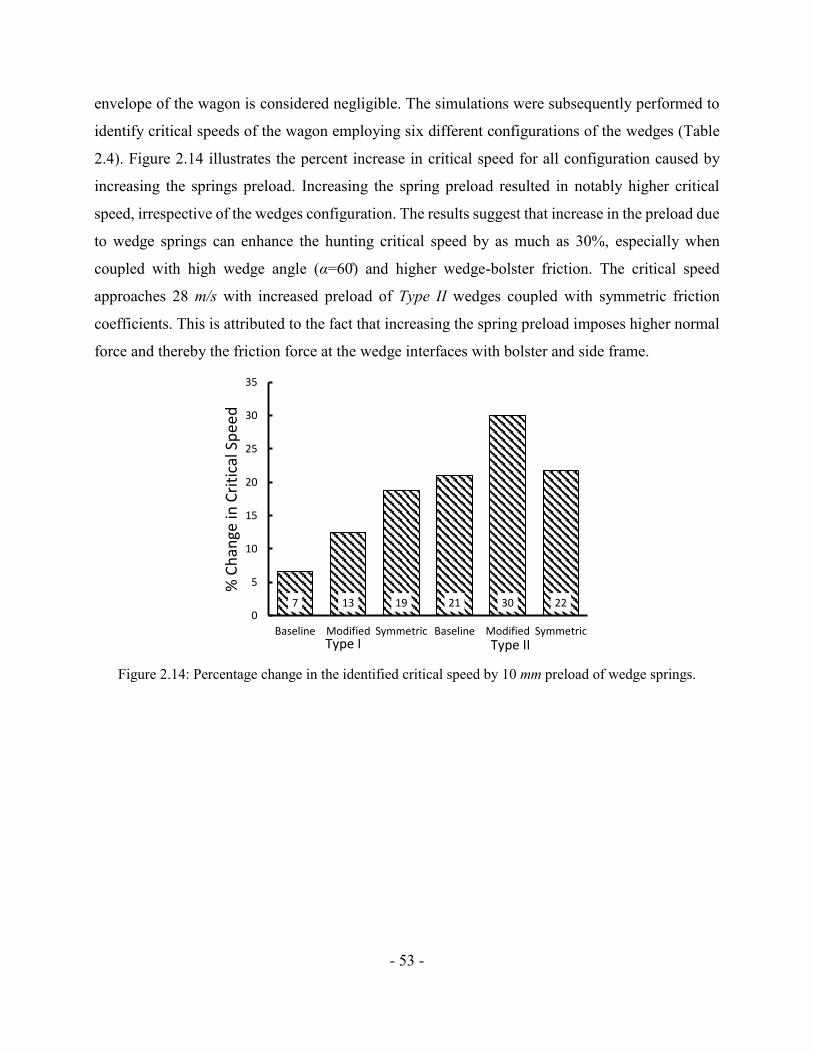
- 53 -
envelope of the wagon is considered negligible. The simulations were subsequently performed to
identify critical speeds of the wagon employing six different configurations of the wedges (Table
2.4). Figure 2.14 illustrates the percent increase in critical speed for all configuration caused by
increasing the springs preload. Increasing the spring preload resulted in notably higher critical
speed, irrespective of the wedges configuration. The results suggest that increase in the preload due
to wedge springs can enhance the hunting critical speed by as much as 30%, especially when
coupled with high wedge angle (α=60) and higher wedge-bolster friction. The critical speed
approaches 28 m/s with increased preload of Type II wedges coupled with symmetric friction
coefficients. This is attributed to the fact that increasing the spring preload imposes higher normal
force and thereby the friction force at the wedge interfaces with bolster and side frame.
Figure 2.14: Percentage change in the identified critical speed by 10 mm preload of wedge springs.
7 13 19 21 30 220
5
10
15
20
25
30
35
Baseline Modified Symmetric Baseline Modified Symmetric
% C
han
ge in
Cri
tica
l Sp
eed
Type I Type II
- 54 -
2.4 Conclusions
A comprehensive model of friction wedges of the secondary suspension is formulated and
integrated to the model of a freight wagon with three-piece bogies to study its lateral stability and
critical speed limits with particular focus on nonlinear characterization of the friction wedges.
Comparing to the reported methods for characterizing the damping properties of wedges, the
proposed model based on points-plane contact method could describe the highly nonlinear
responses of frictional wedges in a computationally efficient manner so as to facilitate parametric
study. The results revealed relatively lower damping levels in both the lateral and vertical directions
for the unloaded wagon compared to the loaded wagon. A subcritical Hopf bifurcation in the
responses of the wagon was identified, which suggested a critical speed of 15 m/s. The sensitivity
analysis of the nonlinear system revealed strong dependency of the response of the system on both
the forward speed and the track disturbance amplitude. The simulation results further revealed
hunting frequency of 2.5 Hz near the critical speed, which increased to about 3.2 Hz at higher
speeds, where partial wheel climb was initiated. It was further shown that increasing the wedge
angle could yield substantial gain in the critical speed, while increasing the friction coefficient of
the contact surfaces resulted in only marginal increase in the critical speed. Increasing the surface
friction, however, can cause greater chaotic oscillations in lateral dynamic responses of the system
at higher speeds. Increasing the springs preload on the wedge could further help limit wheelset
lateral oscillations leading to higher critical speeds. The proposed model of wedges contact could
also be applied to evaluate the effects of worn wedges and increased clearances, and for identifying
optimal wedge design.
- 55 -
CHAPTER 3
Hunting analysis of a railway tank car subject to the partially filled state of the tanker
3.1 Introduction
With increasing demand for high load capacity and high-speeds for railway freight cars, the safe
operation of the railway rolling stock has been widely emphasized. The stability limits of railway
vehicles have been extensively investigated to establish their safe operating limits and to seek
improved designs [9, 10]. The phenomenon of lateral hunting oscillations of the rail vehicle near
its critical speeds is known to cause substantial variations in the lateral wheel-rail forces that may
lead to greater derailment or track panel shift potential.
Apart from wheel/rail and component forces, the dynamic responses of a partly filled railway
tank wagon may be affected by the forces and moments caused by the fluid motions, known as
sloshing. While the potentially destabilizing effects of slosh forces and moments have been widely
reported for road tankers, only a few studies have investigated such impacts in rail vehicles,
especially for the hunting analysis [25, 123]. The dynamic response of partially-filled tank vehicles
has been studied with different approaches to derive forces and moments due to cargo slosh within
a partly-filled tank, which range from simple quasi-static [7], mechanical-equivalent [87] to
nonlinear fluid slosh models [84].
The quasi-static analysis of slosh is a simplified approach to analyze the steady-state directional
performance and roll stability of vehicles. It has been shown that transient slosh dynamic forces
and moments are substantially higher than the magnitudes of steady-state forces predicted from the
quasi-static approach [84]. On the other hand, the nonlinear Computational Fluid Dynamic (CFD)
methods permit the analysis of transient slosh forces and moments but their applications to vehicle
dynamics analyses have been limited due to excessive computational demands [63-65].
Alternatively, the linear slosh theory or mechanical equivalent models based on linear theory have
been applied to evaluate cargo movements and slosh forces. It has been suggested that the linear
theory can efficiently predict slosh responses under low magnitude excitations, but may lead to
considerable errors in the vicinity of the slosh resonance frequencies [64, 75, 90]. The mechanical
equivalent models of liquid can be conveniently integrated into the multibody models of a vehicle
system for response analysis of the coupled vehicle-cargo system in a time-efficient manner. The
- 56 -
parameters of such models are commonly identified from linear slosh theory or through laboratory
measurements [86, 87].
The studies reporting the fluid slosh effects in railways have mostly employed simple pendulum
models or equivalent models [3, 94, 95]. Khandelwal and Nigam [91] employed a pendulum model
to study liquid slosh in a rectangular tanker coupled with bounce and bounce/pitch models of a
wagon subject to track irregularities and longitudinal acceleration. The study showed that fluid
slosh could serve as a damper when excitation frequencies are distant from the fundamental slosh
frequency. Bogomaz et al. [92] developed the roll, pitch and yaw plane models of a partly-filled
tank car using equivalent pendulum models of fluid slosh, and identified the model parameters
from solutions of the boundary value problem over the liquid domain coupled with a modal solution
of the free surface. The simulation model in the pitch plane alone was validated through tests
conducted on a tank car subject to longitudinal impacts at different speeds. The simulation results
obtained with simplified models of a tank car incorporating linear suspension and wheel/rail
contact revealed notable contributions of fluid slosh to lateral and vertical accelerations under
excitations caused by rail irregularities and curving.
Di Gialleonardo et al. [94] investigated the wheel unloading and thus derailment potential of a
partly-filled railway tank car subject to ‘S’-curve maneuvers at different speeds. The simulation
results obtained with a 35 degree-of-freedom (DoF) model of a 4-axle tank car revealed relatively
higher wheel unloading in the presence of fluid slosh. Relatively higher wheel unloading was
reported for the third wheelset during the trailing section of the s-curve, while liquid sloshing only
marginally affected the flange climb derailment. The study also showed greater load shift when the
‘S’-curve frequency was close to the natural frequency of the mechanical-equivalent model.
The lateral slosh force and roll moment, in particular, could alter the dynamic forces developed
at wheel-rail contact and thereby affect the hunting stability of partly-filled tank wagon. The effect
of liquid cargo movement within a partly-filled rail car on its hunting speed, however, has been
attempted in a few recent studies [25, 123]. Hazrati et al. [25] reported that the liquid cargo
movements within the tank car could serve as a damper for suppressing lateral hunting oscillations.
The equivalent pendulum model proposed by Salem et al. [87] was used for simulation of lateral
liquid slosh. This trend was likely due to the relatively higher frequency of hunting oscillation
compared to the fundamental slosh frequency as suggested by Khandelwal and Nigam [91]. Wang
et al. [123] proposed the integration of a low order continuum based slosh model with a multibody
- 57 -
model of a railway tank car incorporating viscosity and inertia distribution. The approximate
runtime was reported as 1440 seconds for each second of simulation on a single-core Intel Core i5-
2400 processor platform. The significant contribution of the liquid slosh on resulting variations in
wheel-rail contact condition was observed. Shi et al. [5] examined the effect of liquid slosh on
curve negotiation and braking scenarios of a railway tank car. The absolute nodal coordinate
formulation (ANCF) was used to capture the response of the liquid cargo. The study showed that
the liquid cargo slosh in curve negotiations at speeds higher than the balanced speed could generate
excessive unloading effect.
In this study, the hunting response of a partly-filled tank wagon is investigated using a linear
slosh model proposed by Kolaei et al. [64, 99] and compared with those obtained from a simple
pendulum slosh model. The dynamic fluid slosh models are integrated to a comprehensive model
of the wagon incorporating non-smooth and nonlinear damping and stiffness properties of friction
wedges, as described in [34]. The effect of slosh force and moment on the hunting critical speed is
demonstrated by comparing the responses of the car with equivalent rigid cargo. The hunting
performance in terms of critical speed is obtained as a function of the liquid cargo fill ratio
considering constant cargo load.
- 58 -
3.2 Model formulation
3.2.1 Multi-body model of the tank car
The multi-body dynamic (MBD) model of a railway tank car is developed in Universal Mechanism
(UM) software [110, 124], incorporated a car body and a pair of three-piece bogies. Each bogie is
modeled considering nine rigid bodies, including friction wedges, side frames, wheelsets and
bolster, which are coupled through contact surfaces and suspension springs. The couplings of the
car body with the bogies are incorporated through the center plate and side bearings of each bogie.
A 114-DoF model of the railway tank car is thus formulated in the UM software considering 6-
DoF motions of each rigid body subject to constraints imposed by unilateral contact forces
generated in the wedges, center plate and side bearings in addition to multi-axis forces due to
suspension springs and wheel/rail contact. The simulation parameters for the dynamic model of the
wagon along with the methodology to identify contact pairs parameters have been presented in
details in [34].
The friction forces in different components of the bogie are modeled considering their geometry
and clearances. The point-plane contact approach is used for simulation of the friction forces [34,
124]. The normal forces in the point-plane contact are modeled assuming an elastic-dissipative
function of penetration of the contact point. The Coulomb friction model is used to simulate the
friction force in the contact plane, considering the sliding and sticking conditions. The Stribeck
formulation is used to simulate the transition from static friction to the dynamic condition [34,
110]. The clearances between different components of the vehicle system are also incorporated in
this contact simulation approach. As indicated in Figure 3.1, the gap between wedge and bolster,
𝑡𝑏𝑤, provides a lower lateral stiffness for lateral movements smaller than 10 mm. The clearances
between the wedges and the side frame is defined so as to limit the lateral movements of the bolster
and wedges with respect to the side frame. The stiffness and damping constants of the contact
elements are defined as 58 MN/m and 6.98 kN.m/s, respectively, based on methodology presented
in [34]. Moreover, the clearances between the wheelset and the axle box, presented in Figure 3.1(b),
are defined as 3 mm in the lateral and longitudinal directions.
The roll angle of the car body is constrained via interaction of the car body with the bolster in
center plate and side bearings. A group of unilateral contact points simulates the interaction of
components in the center plate, as shown in Figure 3.1(c). The static and dynamic friction
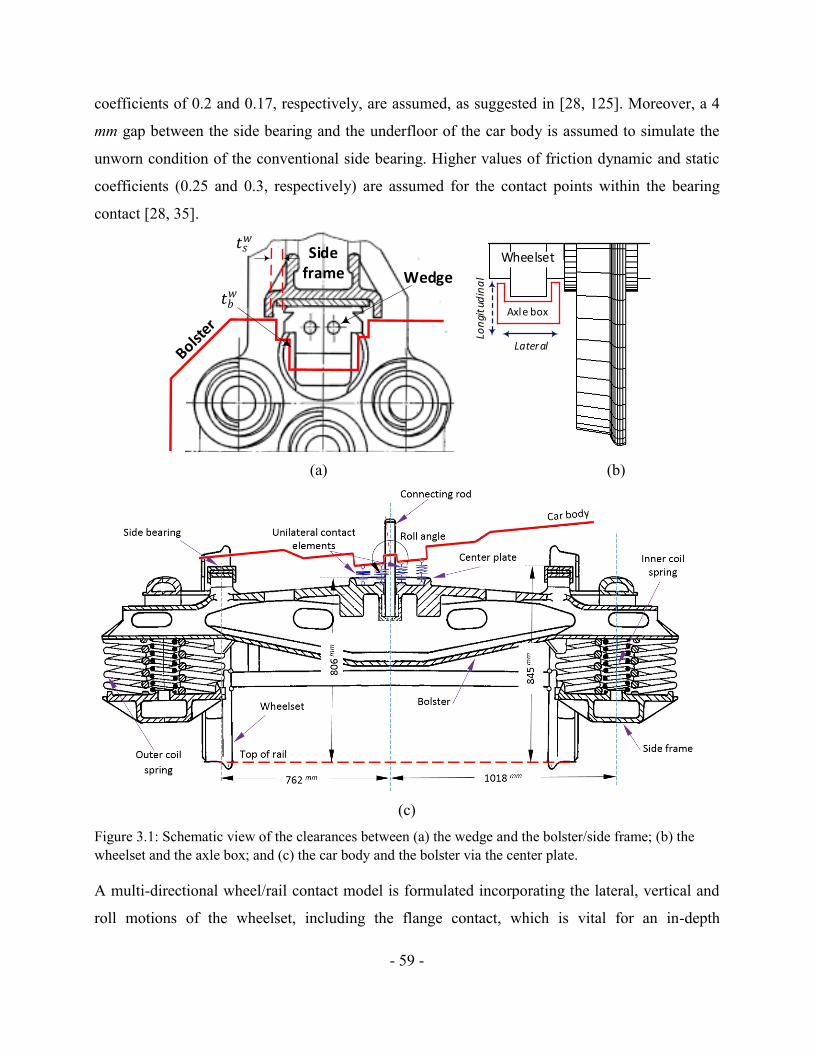
- 59 -
coefficients of 0.2 and 0.17, respectively, are assumed, as suggested in [28, 125]. Moreover, a 4
mm gap between the side bearing and the underfloor of the car body is assumed to simulate the
unworn condition of the conventional side bearing. Higher values of friction dynamic and static
coefficients (0.25 and 0.3, respectively) are assumed for the contact points within the bearing
contact [28, 35].
Side frame
𝑡𝑏𝑤
Wedge
𝑡𝑠𝑤
Wheelset
Axle box
Longitudinal
Lateral
(a) (b)
(c)
Figure 3.1: Schematic view of the clearances between (a) the wedge and the bolster/side frame; (b) the
wheelset and the axle box; and (c) the car body and the bolster via the center plate.
A multi-directional wheel/rail contact model is formulated incorporating the lateral, vertical and
roll motions of the wheelset, including the flange contact, which is vital for an in-depth
- 60 -
investigation of the hunting behavior. The Kalker’s FastSim model [104] is applied to determine
the creep forces and moment at the wheel/rail interface considering an elliptical contact patch. For
this purpose, each contact patch is discretized into 10 equal width strips along the rolling direction
of the wheel, while each of these strips is further divided into 10 cells of equal length. The slip or
stick condition of each cell and resultant tangential contact forces is determined based on Kalker’s
FastSim algorithm [104].
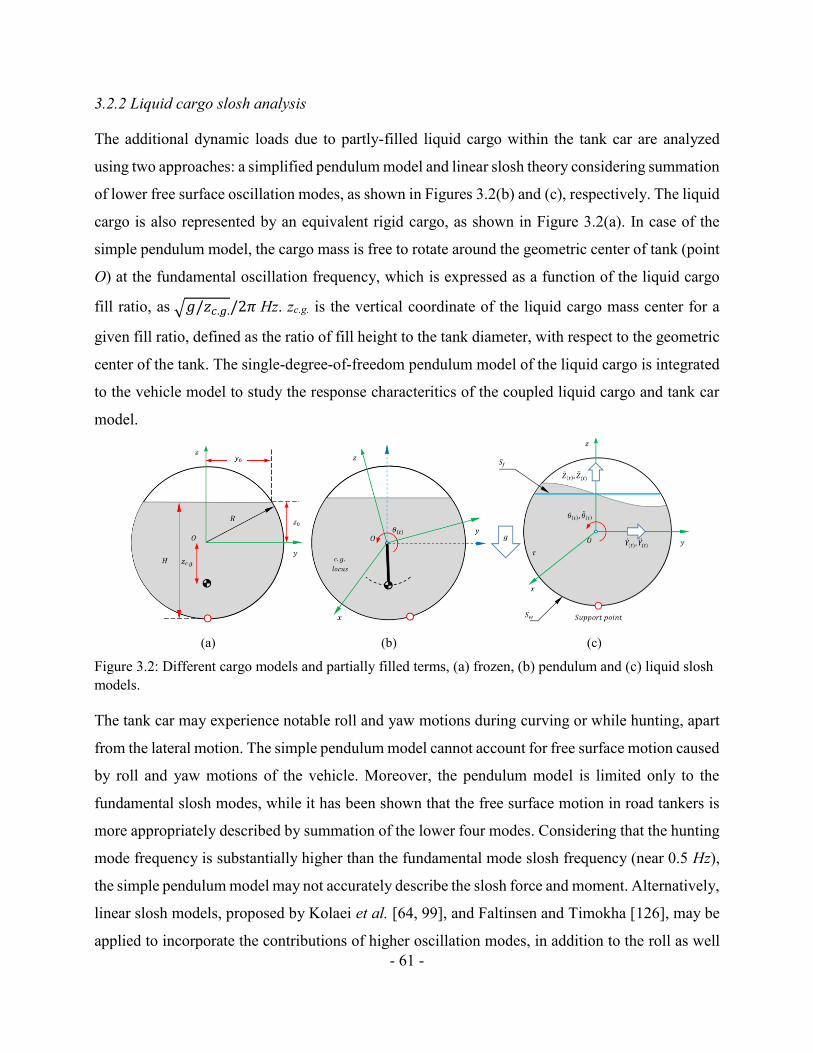
- 61 -
3.2.2 Liquid cargo slosh analysis
The additional dynamic loads due to partly-filled liquid cargo within the tank car are analyzed
using two approaches: a simplified pendulum model and linear slosh theory considering summation
of lower free surface oscillation modes, as shown in Figures 3.2(b) and (c), respectively. The liquid
cargo is also represented by an equivalent rigid cargo, as shown in Figure 3.2(a). In case of the
simple pendulum model, the cargo mass is free to rotate around the geometric center of tank (point
O) at the fundamental oscillation frequency, which is expressed as a function of the liquid cargo
fill ratio, as √𝑔/𝑧𝑐.𝑔./2𝜋 Hz. zc.g. is the vertical coordinate of the liquid cargo mass center for a
given fill ratio, defined as the ratio of fill height to the tank diameter, with respect to the geometric
center of the tank. The single-degree-of-freedom pendulum model of the liquid cargo is integrated
to the vehicle model to study the response characteritics of the coupled liquid cargo and tank car
model.
(a) (b) (c)
Figure 3.2: Different cargo models and partially filled terms, (a) frozen, (b) pendulum and (c) liquid slosh
models.
The tank car may experience notable roll and yaw motions during curving or while hunting, apart
from the lateral motion. The simple pendulum model cannot account for free surface motion caused
by roll and yaw motions of the vehicle. Moreover, the pendulum model is limited only to the
fundamental slosh modes, while it has been shown that the free surface motion in road tankers is
more appropriately described by summation of the lower four modes. Considering that the hunting
mode frequency is substantially higher than the fundamental mode slosh frequency (near 0.5 Hz),
the simple pendulum model may not accurately describe the slosh force and moment. Alternatively,
linear slosh models, proposed by Kolaei et al. [64, 99], and Faltinsen and Timokha [126], may be
applied to incorporate the contributions of higher oscillation modes, in addition to the roll as well
- 62 -
yaw motions of the car, in a computationally efficient manner. In this study, the linear slosh model
based on modes summation, proposed by Kolaei et al. [64, 99], is used considering the lower four
antisymmetric modes. For the partly-filled cylindrical tank of radius R and liquid fill height H,
shown in Figure 3.2(a), the equations of fluid motion in the roll plane are derived in the tank-fixed
coordinate system Oyz, while the tank is subjected to simultaneous lateral, vertical and roll motions.
The coordinates of the free-surface at the intersection of the tank wall are denoted by 𝑦0 and 𝑧0, as
shown in Figure 3.2(a). In Figure 3.2(c), 𝜏, S𝑓 and 𝑆𝑤 represent the fluid domain, liquid free-
surface and wetted surface of the tank wall, respectively. Assuming incompressible and irrotational
flow in the flow domain τ, the equation of motion of the liquid is formulated in the form of the
Laplace equation of velocity potential function Φ, as:
𝛁2Φ = 𝛁2(ΦR +ΦS) = 0 in τ (3.1)
where ΦR and ΦS represent the velocity potential attributed to the rigid body motion of the liquid
bulk and relative motion to the liquid cargo with respect to the tank in the liquid domain, τ. For a
cylindrical tank subject to lateral, vertical and roll excitations, the rigid body potential, ΦR, can be
expressed as:
ΦR = ��(𝑡)𝑦 + ��(𝑡)(𝑧 − 𝑧0) + ��(𝑡)Φ𝑠𝑡 (3.2)
where ��(𝑡) and ��(𝑡) are the lateral and vertical velocities of the container, respectively. The Φ𝑠𝑡
is the potential associated with rolling motion of container, 𝜃(𝑡), which is known as the Stokes-
Joukowski potential [78, 126]. It has been reporting that the effect of viscosity of commonly
transported products is negligibly small compared to the inertia effect [126, 127]. The rigid body
potential, ΦR, thus does not depend on the roll rate of the container. Using the multimodal approach
[28], the potential ΦS can be expressed as a function of the lateral, vertical and roll motions of the
liquid free surface through superposition of natural modes, 𝜑𝑖:
ΦS(𝑦, 𝑧, 𝑡) =∑𝛾𝑖(t)𝜑𝑖(𝑦, 𝑧)
∞
𝑖=1
(3.3)
- 63 -
Where 𝛾𝑖 represent the generalized coordinates. The modal superposition together with the free-
surface boundary condition are applied to express the free surface motion by a set of ordinary
differential equations in the generalized coordinates, 𝛾𝑖:
��𝑖 + 2𝜉𝑖𝜎𝑖��𝑖 + 𝜎𝑖2𝛾𝑖 = −��
𝜅𝑖𝜆𝑖𝑦0 on S𝑓 (3.4)
where �� is the effective lateral acceleration encountered at the geometric center of the container,
which accounts for contribution of roll motion of the container. 𝜎𝑖 is circular frequency of the free
surface oscillations, which is related to 𝜅𝑖 = 𝜎𝑖2/𝑔, where g is acceleration due to gravity. In the
above equation, 𝜆𝑖 and 𝜉𝑖 are the time-invariable hydrodynamic coefficients and modal damping
ratios attributed to liquid viscosity , respectively, given by [78, 99]:
𝜉𝑖 =𝑣𝑠0.5
2√2𝑔0.5𝑅1.5[𝜅𝑖
−0.25 {��𝑖𝜅𝑖𝑦0
+𝑅
𝐿}] (3.5)
𝜆𝑖 = ∫ 𝑦𝜑𝑖𝑑𝑆S𝑓
(3.6)
where 𝜈𝑠 is the fluid kinematic viscosity and L is length of the tank, and ��𝑖 is the normalized
damping ratio that depends on the tangential velocity at the wetted boundary, and obtained from:
��𝑖 = ∫ (𝜕𝜑𝑖𝜕𝑠)2
𝑑𝑆S𝑓
(3.7)
It should be noted that the 𝜆𝑖 for symmetric modes are zero and only the antisymmetric modes are
excited by the lateral acceleration and roll angle responses of the container. Since the coefficients
in differential equations (3.4) are time-independent, these are not required to be evaluted at each
time step and under different exteranl inputs. This ensures computational efficiency of the modal
method and facilitates co-simulations of the liquid slosh model with the vehicle dynamic model.
The natural slosh modes and frequencies are obtained using the Ritz variational method [16], while
- 64 -
solutions of the differential equations (3.4) yield hydrodynamic pressure distribution,
𝑃(𝑦, 𝑧, 𝑡) using the linearized Bernoulli’s equation [126]. The total lateral force, 𝐹𝑦(𝑡), acting on
the container wall, per unit length of the container, is then obtained from integration of
𝑃(𝑦, 𝑧, 𝑡) over the tank wetted area, 𝑆𝑤, such that:
𝐹𝑦(𝑡) = ∫ 𝑃(𝑦, 𝑧, 𝑡)𝑑𝑧𝑆𝑤
= 𝐹𝑦,𝑅(𝑡) + 𝐹𝑦,𝑆(𝑡) (3.8)
The lateral slosh force can also be expressed in two components, 𝐹𝑦,𝑅 and 𝐹𝑦,𝑆, attributed to rigid
body and free surface motion of the liquid, respectively, expressed as:
𝐹𝑦,𝑅(𝑡) = −𝜌��∫ 𝑦𝑑𝑧𝑆𝑤
= −𝑚(�� + 𝜃𝑔) (3.9)
𝐹𝑦,𝑆(𝑡) = −𝜌
𝑔∑𝜆𝑖𝜎𝑖
2��𝑖(t)
∞
𝑖=1
(3.10)
where 𝑚 is fluid mass per unit length of the tank and 𝜌 is fluid density (Figure 3.2). The vertical
force acting on the container, 𝐹𝑧(𝑡), can also be obtained from:
𝐹𝑧(𝑡) = 𝐹𝑧,𝑅(𝑡) = ∫ 𝑃(𝑦, 𝑧, 𝑡)𝑑𝑦𝑆𝑤
= −𝑚(𝑔 + ��) (3.11)
It should be noted that the vertical component of the slosh force is zero, 𝐹𝑧,𝑆(𝑡) = 0, due to
geometric symmetry of the circular tank. The moment due to liquid cargo motion about the support
point of tank can be determined by integrating the hydrodynamic pressure over the wetted surface
of the tank:
𝑀𝑆𝑢𝑝𝑝𝑜𝑟𝑡(𝑡) = −∫ 𝑃(𝑦, 𝑧, 𝑡) [𝑦𝑑𝑦 + (𝑅 + 𝑧)𝑑𝑧]𝑆𝑤
= 𝑀𝑅(𝑡) + 𝑀𝑉(𝑡) + 𝑀𝑆(𝑡)
(3.12)
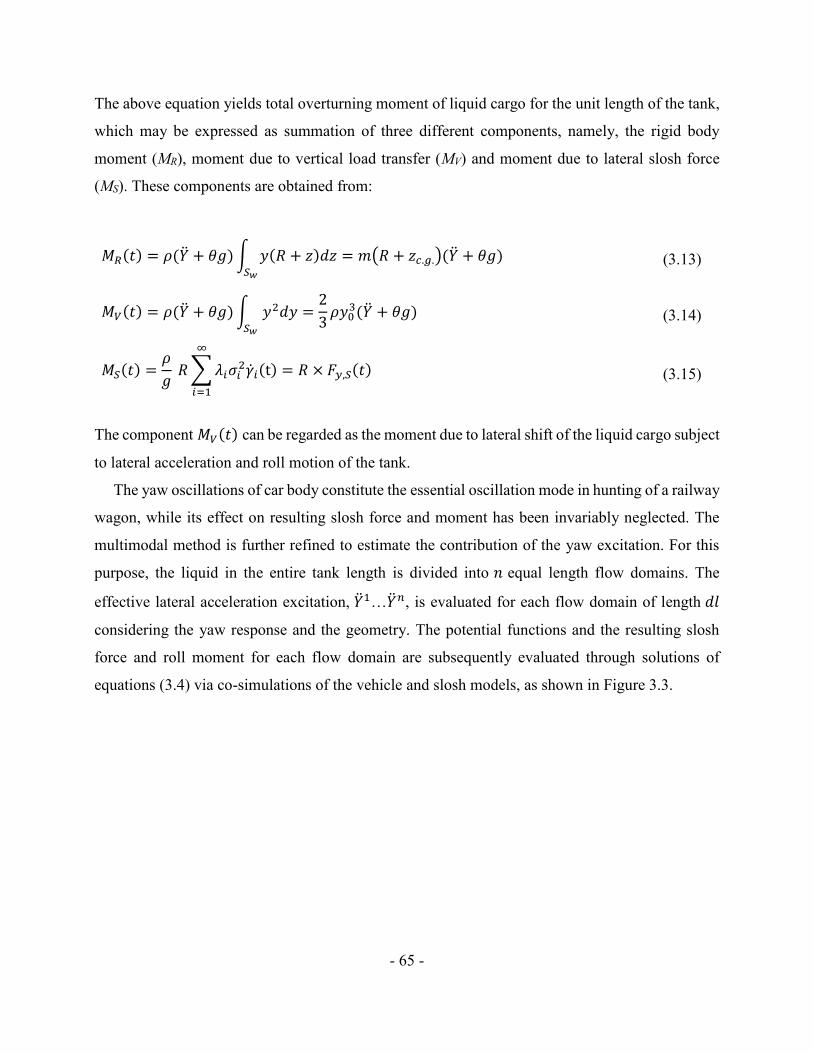
- 65 -
The above equation yields total overturning moment of liquid cargo for the unit length of the tank,
which may be expressed as summation of three different components, namely, the rigid body
moment (MR), moment due to vertical load transfer (MV) and moment due to lateral slosh force
(MS). These components are obtained from:
𝑀𝑅(𝑡) = 𝜌(�� + 𝜃𝑔)∫ 𝑦(𝑅 + 𝑧)𝑑𝑧 = 𝑚(𝑅 + 𝑧𝑐.𝑔.)(�� + 𝜃𝑔)𝑆𝑤
(3.13)
𝑀𝑉(𝑡) = 𝜌(�� + 𝜃𝑔)∫ 𝑦2𝑑𝑦 =2
3𝜌𝑦0
3(�� + 𝜃𝑔)𝑆𝑤
(3.14)
𝑀𝑆(𝑡) =𝜌
𝑔 𝑅∑𝜆𝑖𝜎𝑖
2��𝑖(t)
∞
𝑖=1
= 𝑅 × 𝐹𝑦,𝑆(𝑡) (3.15)
The component 𝑀𝑉(𝑡) can be regarded as the moment due to lateral shift of the liquid cargo subject
to lateral acceleration and roll motion of the tank.
The yaw oscillations of car body constitute the essential oscillation mode in hunting of a railway
wagon, while its effect on resulting slosh force and moment has been invariably neglected. The
multimodal method is further refined to estimate the contribution of the yaw excitation. For this
purpose, the liquid in the entire tank length is divided into 𝑛 equal length flow domains. The
effective lateral acceleration excitation, ��1…��𝑛, is evaluated for each flow domain of length 𝑑𝑙
considering the yaw response and the geometry. The potential functions and the resulting slosh
force and roll moment for each flow domain are subsequently evaluated through solutions of
equations (3.4) via co-simulations of the vehicle and slosh models, as shown in Figure 3.3.
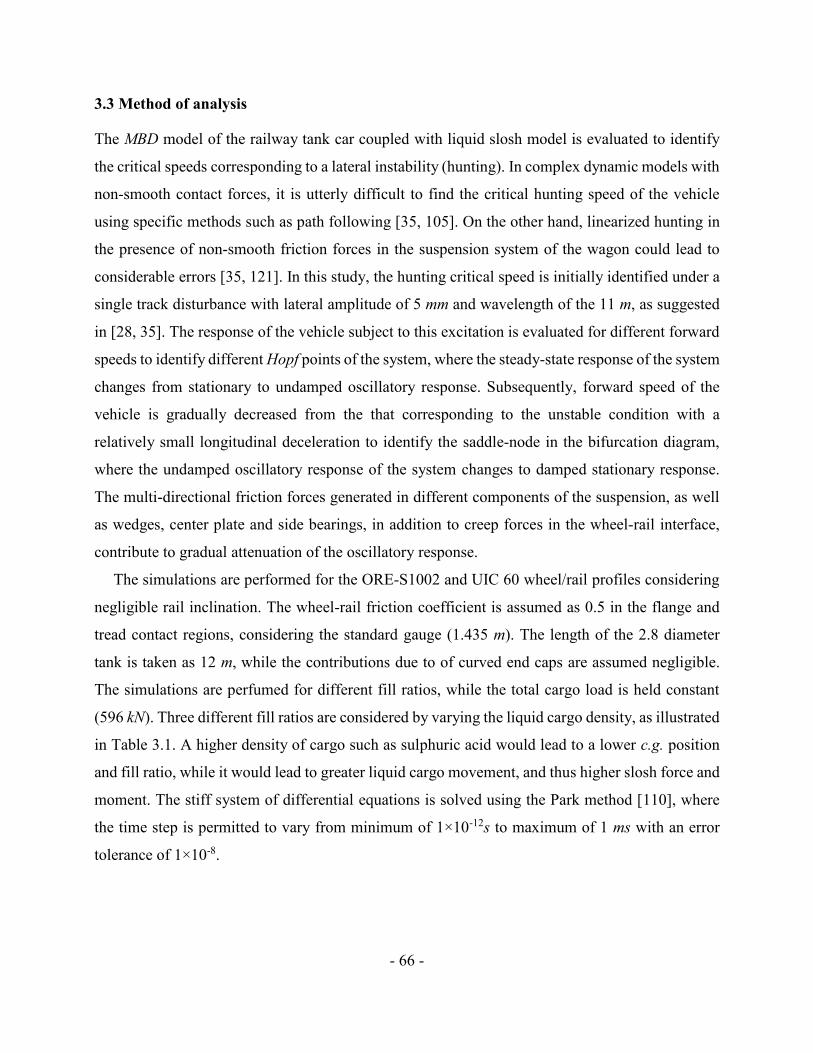
- 66 -
3.3 Method of analysis
The MBD model of the railway tank car coupled with liquid slosh model is evaluated to identify
the critical speeds corresponding to a lateral instability (hunting). In complex dynamic models with
non-smooth contact forces, it is utterly difficult to find the critical hunting speed of the vehicle
using specific methods such as path following [35, 105]. On the other hand, linearized hunting in
the presence of non-smooth friction forces in the suspension system of the wagon could lead to
considerable errors [35, 121]. In this study, the hunting critical speed is initially identified under a
single track disturbance with lateral amplitude of 5 mm and wavelength of the 11 m, as suggested
in [28, 35]. The response of the vehicle subject to this excitation is evaluated for different forward
speeds to identify different Hopf points of the system, where the steady-state response of the system
changes from stationary to undamped oscillatory response. Subsequently, forward speed of the
vehicle is gradually decreased from the that corresponding to the unstable condition with a
relatively small longitudinal deceleration to identify the saddle-node in the bifurcation diagram,
where the undamped oscillatory response of the system changes to damped stationary response.
The multi-directional friction forces generated in different components of the suspension, as well
as wedges, center plate and side bearings, in addition to creep forces in the wheel-rail interface,
contribute to gradual attenuation of the oscillatory response.
The simulations are performed for the ORE-S1002 and UIC 60 wheel/rail profiles considering
negligible rail inclination. The wheel-rail friction coefficient is assumed as 0.5 in the flange and
tread contact regions, considering the standard gauge (1.435 m). The length of the 2.8 diameter
tank is taken as 12 m, while the contributions due to of curved end caps are assumed negligible.
The simulations are perfumed for different fill ratios, while the total cargo load is held constant
(596 kN). Three different fill ratios are considered by varying the liquid cargo density, as illustrated
in Table 3.1. A higher density of cargo such as sulphuric acid would lead to a lower c.g. position
and fill ratio, while it would lead to greater liquid cargo movement, and thus higher slosh force and
moment. The stiff system of differential equations is solved using the Park method [110], where
the time step is permitted to vary from minimum of 1×10-12s to maximum of 1 ms with an error
tolerance of 1×10⁻⁸.
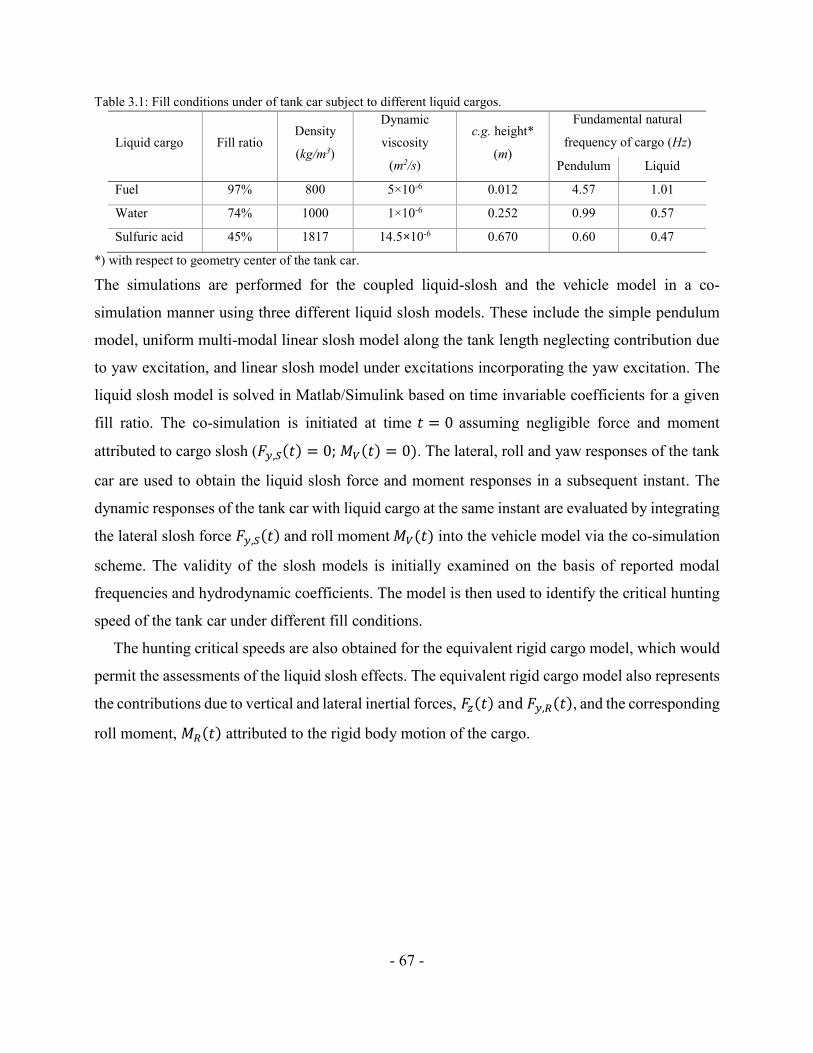
- 67 -
Table 3.1: Fill conditions under of tank car subject to different liquid cargos.
Liquid cargo Fill ratio Density
(kg/m3)
Dynamic
viscosity
(m2/s)
c.g. height*
(m)
Fundamental natural
frequency of cargo (Hz)
Pendulum Liquid
Fuel 97% 800 5×10⁻⁶ 0.012 4.57 1.01
Water 74% 1000 1×10⁻⁶ 0.252 0.99 0.57
Sulfuric acid 45% 1817 14.5×10⁻⁶ 0.670 0.60 0.47
*) with respect to geometry center of the tank car.
The simulations are performed for the coupled liquid-slosh and the vehicle model in a co-
simulation manner using three different liquid slosh models. These include the simple pendulum
model, uniform multi-modal linear slosh model along the tank length neglecting contribution due
to yaw excitation, and linear slosh model under excitations incorporating the yaw excitation. The
liquid slosh model is solved in Matlab/Simulink based on time invariable coefficients for a given
fill ratio. The co-simulation is initiated at time 𝑡 = 0 assuming negligible force and moment
attributed to cargo slosh (𝐹𝑦,𝑆(𝑡) = 0; 𝑀𝑉(𝑡) = 0). The lateral, roll and yaw responses of the tank
car are used to obtain the liquid slosh force and moment responses in a subsequent instant. The
dynamic responses of the tank car with liquid cargo at the same instant are evaluated by integrating
the lateral slosh force 𝐹𝑦,𝑆(𝑡) and roll moment 𝑀𝑉(𝑡) into the vehicle model via the co-simulation
scheme. The validity of the slosh models is initially examined on the basis of reported modal
frequencies and hydrodynamic coefficients. The model is then used to identify the critical hunting
speed of the tank car under different fill conditions.
The hunting critical speeds are also obtained for the equivalent rigid cargo model, which would
permit the assessments of the liquid slosh effects. The equivalent rigid cargo model also represents
the contributions due to vertical and lateral inertial forces, 𝐹𝑧(𝑡) and 𝐹𝑦,𝑅(𝑡), and the corresponding
roll moment, 𝑀𝑅(𝑡) attributed to the rigid body motion of the cargo.
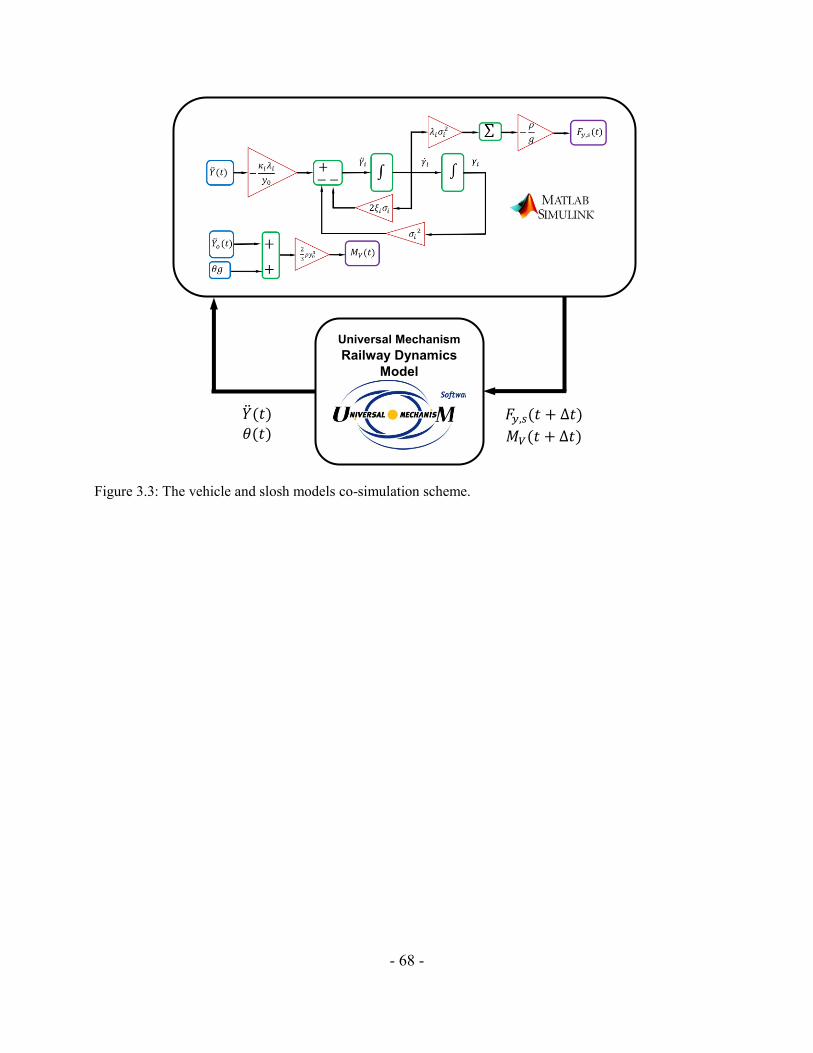
- 68 -
Figure 3.3: The vehicle and slosh models co-simulation scheme.
Universal Mechanism Railway Dynamics
Model
𝐹𝑦,𝑠(𝑡 + ∆𝑡)
𝑀𝑉(𝑡 + ∆𝑡)
��(𝑡) 𝜃(𝑡)
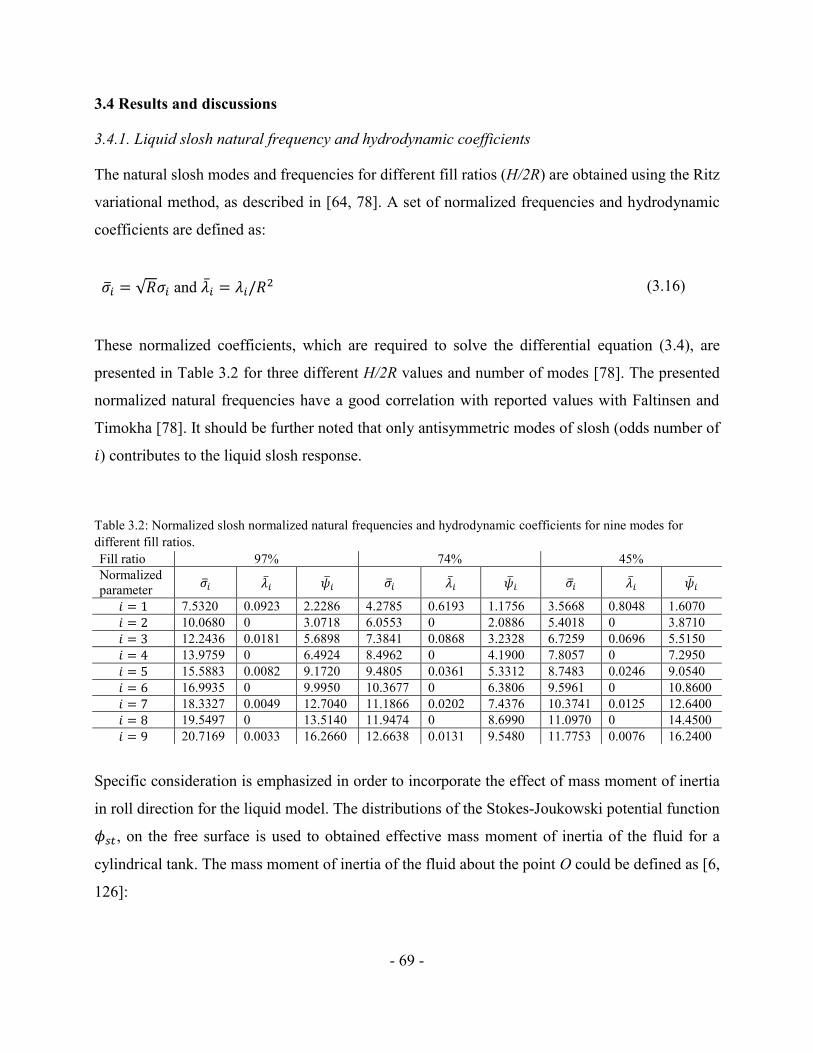
- 69 -
3.4 Results and discussions
3.4.1. Liquid slosh natural frequency and hydrodynamic coefficients
The natural slosh modes and frequencies for different fill ratios (H/2R) are obtained using the Ritz
variational method, as described in [64, 78]. A set of normalized frequencies and hydrodynamic
coefficients are defined as:
𝜎𝑖 = √𝑅𝜎𝑖 and ��𝑖 = 𝜆𝑖/𝑅2 (3.16)
These normalized coefficients, which are required to solve the differential equation (3.4), are
presented in Table 3.2 for three different H/2R values and number of modes [78]. The presented
normalized natural frequencies have a good correlation with reported values with Faltinsen and
Timokha [78]. It should be further noted that only antisymmetric modes of slosh (odds number of
𝑖) contributes to the liquid slosh response.
Table 3.2: Normalized slosh normalized natural frequencies and hydrodynamic coefficients for nine modes for
different fill ratios.
Fill ratio 97% 74% 45%
Normalized
parameter 𝜎𝑖 𝜆𝑖 ��𝑖 𝜎𝑖 𝜆𝑖 ��𝑖 𝜎𝑖 𝜆𝑖 ��𝑖
𝑖 = 1 7.5320 0.0923 2.2286 4.2785 0.6193 1.1756 3.5668 0.8048 1.6070
𝑖 = 2 10.0680 0 3.0718 6.0553 0 2.0886 5.4018 0 3.8710
𝑖 = 3 12.2436 0.0181 5.6898 7.3841 0.0868 3.2328 6.7259 0.0696 5.5150
𝑖 = 4 13.9759 0 6.4924 8.4962 0 4.1900 7.8057 0 7.2950
𝑖 = 5 15.5883 0.0082 9.1720 9.4805 0.0361 5.3312 8.7483 0.0246 9.0540
𝑖 = 6 16.9935 0 9.9950 10.3677 0 6.3806 9.5961 0 10.8600
𝑖 = 7 18.3327 0.0049 12.7040 11.1866 0.0202 7.4376 10.3741 0.0125 12.6400
𝑖 = 8 19.5497 0 13.5140 11.9474 0 8.6990 11.0970 0 14.4500
𝑖 = 9 20.7169 0.0033 16.2660 12.6638 0.0131 9.5480 11.7753 0.0076 16.2400
Specific consideration is emphasized in order to incorporate the effect of mass moment of inertia
in roll direction for the liquid model. The distributions of the Stokes-Joukowski potential function
𝜙𝑠𝑡, on the free surface is used to obtained effective mass moment of inertia of the fluid for a
cylindrical tank. The mass moment of inertia of the fluid about the point O could be defined as [6,
126]:
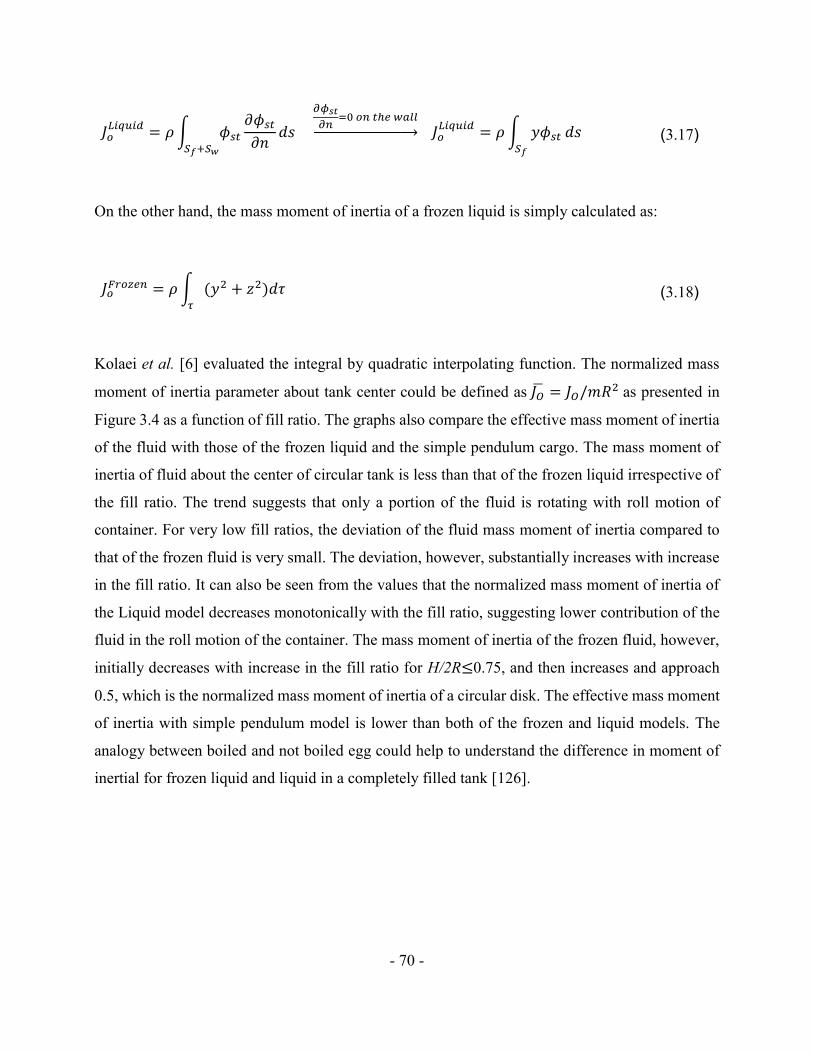
- 70 -
𝐽𝑜𝐿𝑖𝑞𝑢𝑖𝑑 = 𝜌∫ 𝜙𝑠𝑡
𝑆𝑓+𝑆𝑤
𝜕𝜙𝑠𝑡𝜕𝑛
𝑑𝑠
𝜕𝜙𝑠𝑡𝜕𝑛
=0 𝑜𝑛 𝑡ℎ𝑒 𝑤𝑎𝑙𝑙
→ 𝐽𝑜𝐿𝑖𝑞𝑢𝑖𝑑 = 𝜌∫ 𝑦𝜙𝑠𝑡
𝑆𝑓
𝑑𝑠 (3.17)
On the other hand, the mass moment of inertia of a frozen liquid is simply calculated as:
𝐽𝑜𝐹𝑟𝑜𝑧𝑒𝑛 = 𝜌∫ (𝑦2 + 𝑧2)𝑑𝜏
𝜏
(3.18)
Kolaei et al. [6] evaluated the integral by quadratic interpolating function. The normalized mass
moment of inertia parameter about tank center could be defined as 𝐽�� = 𝐽𝑂/𝑚𝑅2 as presented in
Figure 3.4 as a function of fill ratio. The graphs also compare the effective mass moment of inertia
of the fluid with those of the frozen liquid and the simple pendulum cargo. The mass moment of
inertia of fluid about the center of circular tank is less than that of the frozen liquid irrespective of
the fill ratio. The trend suggests that only a portion of the fluid is rotating with roll motion of
container. For very low fill ratios, the deviation of the fluid mass moment of inertia compared to
that of the frozen fluid is very small. The deviation, however, substantially increases with increase
in the fill ratio. It can also be seen from the values that the normalized mass moment of inertia of
the Liquid model decreases monotonically with the fill ratio, suggesting lower contribution of the
fluid in the roll motion of the container. The mass moment of inertia of the frozen fluid, however,
initially decreases with increase in the fill ratio for H/2R≤0.75, and then increases and approach
0.5, which is the normalized mass moment of inertia of a circular disk. The effective mass moment
of inertia with simple pendulum model is lower than both of the frozen and liquid models. The
analogy between boiled and not boiled egg could help to understand the difference in moment of
inertial for frozen liquid and liquid in a completely filled tank [126].
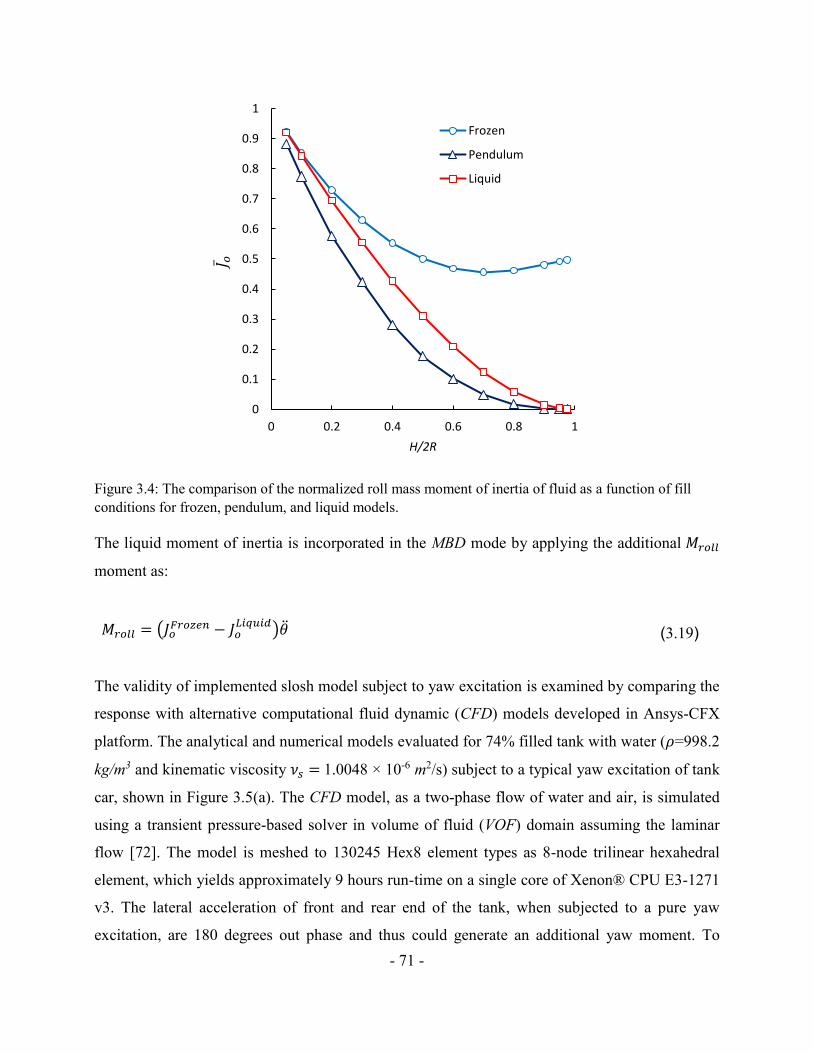
- 71 -
Figure 3.4: The comparison of the normalized roll mass moment of inertia of fluid as a function of fill
conditions for frozen, pendulum, and liquid models.
The liquid moment of inertia is incorporated in the MBD mode by applying the additional 𝑀𝑟𝑜𝑙𝑙
moment as:
𝑀𝑟𝑜𝑙𝑙 = (𝐽𝑜𝐹𝑟𝑜𝑧𝑒𝑛 − 𝐽𝑜
𝐿𝑖𝑞𝑢𝑖𝑑)�� (3.19)
The validity of implemented slosh model subject to yaw excitation is examined by comparing the
response with alternative computational fluid dynamic (CFD) models developed in Ansys-CFX
platform. The analytical and numerical models evaluated for 74% filled tank with water (𝜌=998.2
kg/m3 and kinematic viscosity 𝜈𝑠 = 1.0048 × 10⁻⁶ m2/s) subject to a typical yaw excitation of tank
car, shown in Figure 3.5(a). The CFD model, as a two-phase flow of water and air, is simulated
using a transient pressure-based solver in volume of fluid (VOF) domain assuming the laminar
flow [72]. The model is meshed to 130245 Hex8 element types as 8-node trilinear hexahedral
element, which yields approximately 9 hours run-time on a single core of Xenon® CPU E3-1271
v3. The lateral acceleration of front and rear end of the tank, when subjected to a pure yaw
excitation, are 180 degrees out phase and thus could generate an additional yaw moment. To
0
0.1
0.2
0.3
0.4
0.5
0.6
0.7
0.8
0.9
1
0 0.2 0.4 0.6 0.8 1
H/2R
Frozen
Pendulum
Liquid
𝐽 𝑜
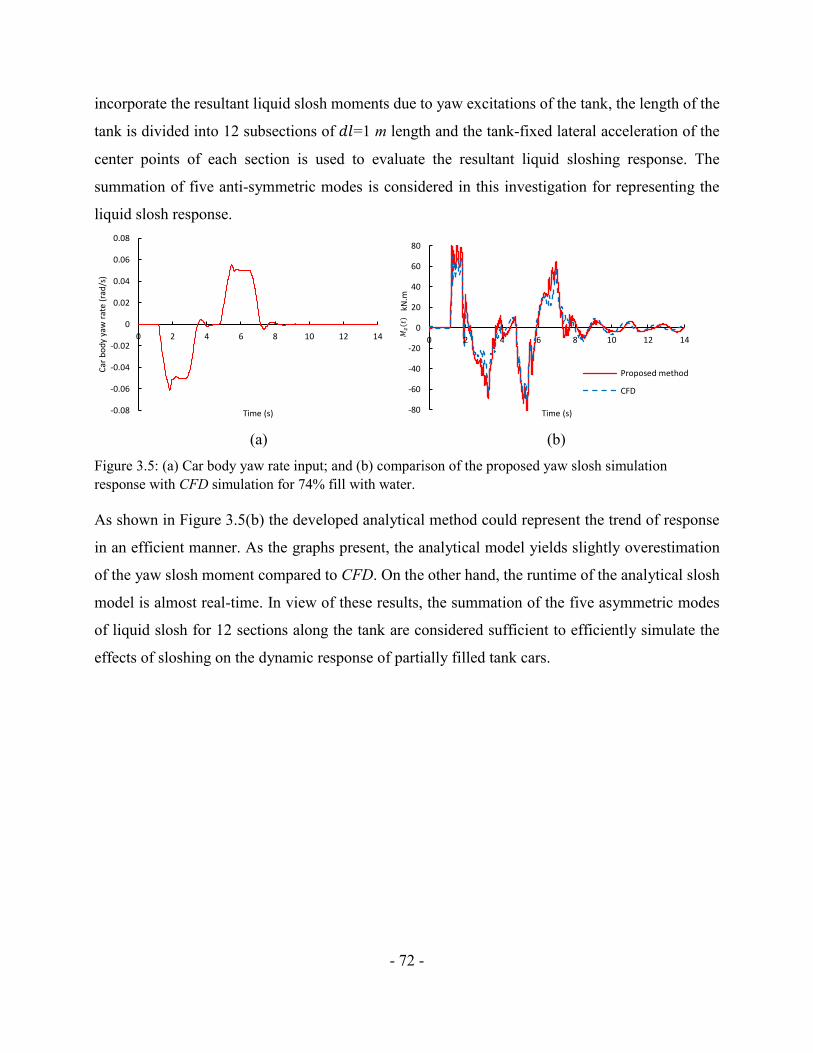
- 72 -
incorporate the resultant liquid slosh moments due to yaw excitations of the tank, the length of the
tank is divided into 12 subsections of 𝑑𝑙=1 m length and the tank-fixed lateral acceleration of the
center points of each section is used to evaluate the resultant liquid sloshing response. The
summation of five anti-symmetric modes is considered in this investigation for representing the
liquid slosh response.
(a) (b)
Figure 3.5: (a) Car body yaw rate input; and (b) comparison of the proposed yaw slosh simulation
response with CFD simulation for 74% fill with water.
As shown in Figure 3.5(b) the developed analytical method could represent the trend of response
in an efficient manner. As the graphs present, the analytical model yields slightly overestimation
of the yaw slosh moment compared to CFD. On the other hand, the runtime of the analytical slosh
model is almost real-time. In view of these results, the summation of the five asymmetric modes
of liquid slosh for 12 sections along the tank are considered sufficient to efficiently simulate the
effects of sloshing on the dynamic response of partially filled tank cars.
-0.08
-0.06
-0.04
-0.02
0
0.02
0.04
0.06
0.08
0 2 4 6 8 10 12 14
Car
bo
dy
yaw
rat
e (r
ad/s
)
Time (s) -80
-60
-40
-20
0
20
40
60
80
0 2 4 6 8 10 12 14
kN.m
Time (s)
Proposed method
CFD𝑀𝑧(𝑡)
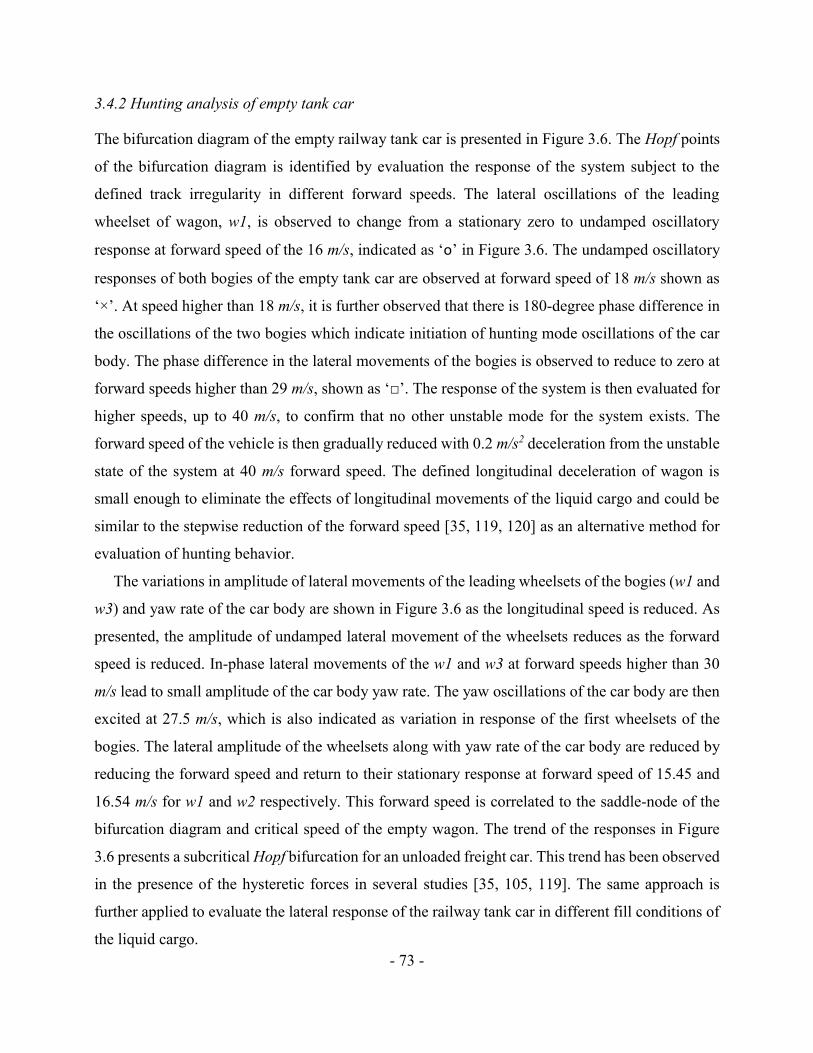
- 73 -
3.4.2 Hunting analysis of empty tank car
The bifurcation diagram of the empty railway tank car is presented in Figure 3.6. The Hopf points
of the bifurcation diagram is identified by evaluation the response of the system subject to the
defined track irregularity in different forward speeds. The lateral oscillations of the leading
wheelset of wagon, w1, is observed to change from a stationary zero to undamped oscillatory
response at forward speed of the 16 m/s, indicated as ‘ο’ in Figure 3.6. The undamped oscillatory
responses of both bogies of the empty tank car are observed at forward speed of 18 m/s shown as
‘×’. At speed higher than 18 m/s, it is further observed that there is 180-degree phase difference in
the oscillations of the two bogies which indicate initiation of hunting mode oscillations of the car
body. The phase difference in the lateral movements of the bogies is observed to reduce to zero at
forward speeds higher than 29 m/s, shown as ‘□’. The response of the system is then evaluated for
higher speeds, up to 40 m/s, to confirm that no other unstable mode for the system exists. The
forward speed of the vehicle is then gradually reduced with 0.2 m/s2 deceleration from the unstable
state of the system at 40 m/s forward speed. The defined longitudinal deceleration of wagon is
small enough to eliminate the effects of longitudinal movements of the liquid cargo and could be
similar to the stepwise reduction of the forward speed [35, 119, 120] as an alternative method for
evaluation of hunting behavior.
The variations in amplitude of lateral movements of the leading wheelsets of the bogies (w1 and
w3) and yaw rate of the car body are shown in Figure 3.6 as the longitudinal speed is reduced. As
presented, the amplitude of undamped lateral movement of the wheelsets reduces as the forward
speed is reduced. In-phase lateral movements of the w1 and w3 at forward speeds higher than 30
m/s lead to small amplitude of the car body yaw rate. The yaw oscillations of the car body are then
excited at 27.5 m/s, which is also indicated as variation in response of the first wheelsets of the
bogies. The lateral amplitude of the wheelsets along with yaw rate of the car body are reduced by
reducing the forward speed and return to their stationary response at forward speed of 15.45 and
16.54 m/s for w1 and w2 respectively. This forward speed is correlated to the saddle-node of the
bifurcation diagram and critical speed of the empty wagon. The trend of the responses in Figure
3.6 presents a subcritical Hopf bifurcation for an unloaded freight car. This trend has been observed
in the presence of the hysteretic forces in several studies [35, 105, 119]. The same approach is
further applied to evaluate the lateral response of the railway tank car in different fill conditions of
the liquid cargo.
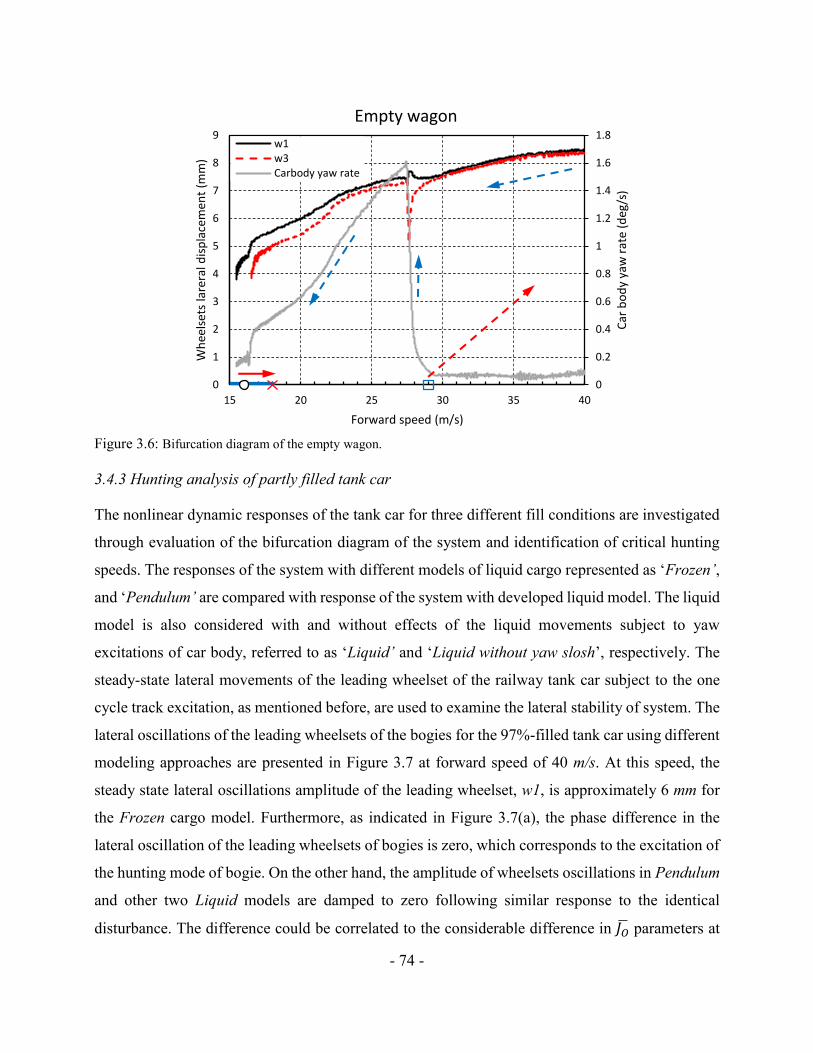
- 74 -
Figure 3.6: Bifurcation diagram of the empty wagon.
3.4.3 Hunting analysis of partly filled tank car
The nonlinear dynamic responses of the tank car for three different fill conditions are investigated
through evaluation of the bifurcation diagram of the system and identification of critical hunting
speeds. The responses of the system with different models of liquid cargo represented as ‘Frozen’,
and ‘Pendulum’ are compared with response of the system with developed liquid model. The liquid
model is also considered with and without effects of the liquid movements subject to yaw
excitations of car body, referred to as ‘Liquid’ and ‘Liquid without yaw slosh’, respectively. The
steady-state lateral movements of the leading wheelset of the railway tank car subject to the one
cycle track excitation, as mentioned before, are used to examine the lateral stability of system. The
lateral oscillations of the leading wheelsets of the bogies for the 97%-filled tank car using different
modeling approaches are presented in Figure 3.7 at forward speed of 40 m/s. At this speed, the
steady state lateral oscillations amplitude of the leading wheelset, w1, is approximately 6 mm for
the Frozen cargo model. Furthermore, as indicated in Figure 3.7(a), the phase difference in the
lateral oscillation of the leading wheelsets of bogies is zero, which corresponds to the excitation of
the hunting mode of bogie. On the other hand, the amplitude of wheelsets oscillations in Pendulum
and other two Liquid models are damped to zero following similar response to the identical
disturbance. The difference could be correlated to the considerable difference in 𝐽�� parameters at
0
0.2
0.4
0.6
0.8
1
1.2
1.4
1.6
1.8
0
1
2
3
4
5
6
7
8
9
15 20 25 30 35 40
Car
bo
dy
yaw
rat
e (d
eg/s
)
Wh
eels
ets
lare
ral d
isp
lace
men
t (m
m)
Forward speed (m/s)
Empty wagon
w1w3Carbody yaw rate
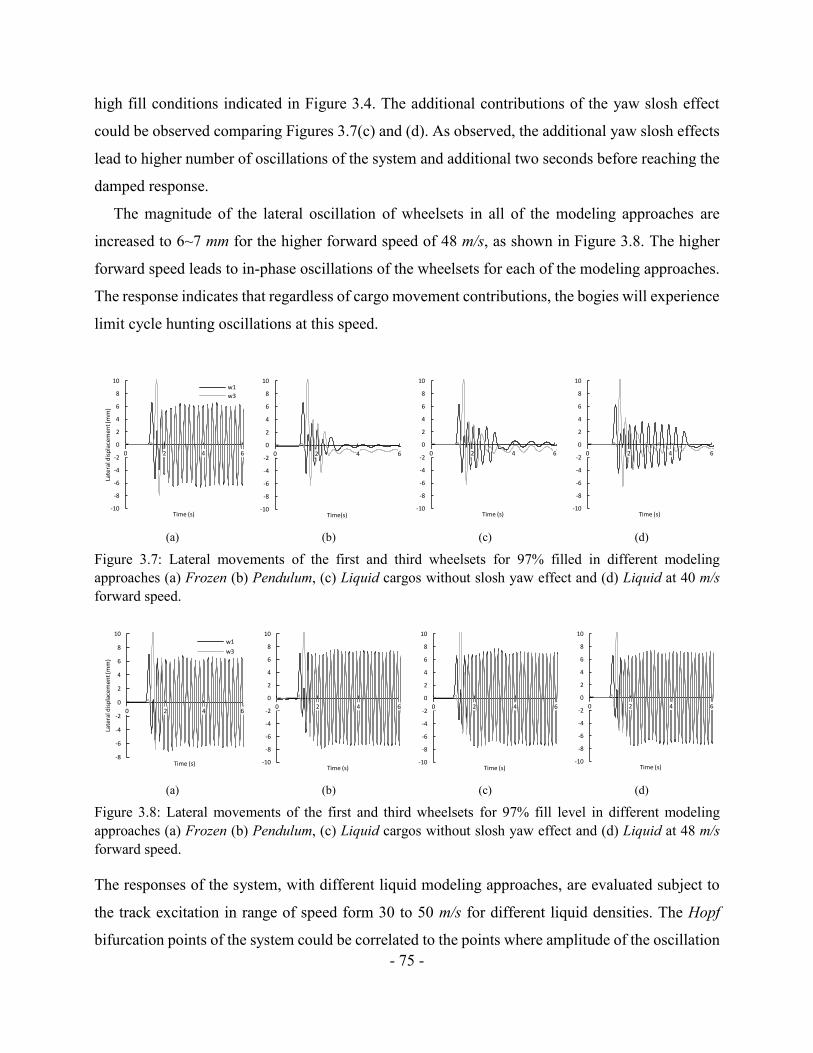
- 75 -
high fill conditions indicated in Figure 3.4. The additional contributions of the yaw slosh effect
could be observed comparing Figures 3.7(c) and (d). As observed, the additional yaw slosh effects
lead to higher number of oscillations of the system and additional two seconds before reaching the
damped response.
The magnitude of the lateral oscillation of wheelsets in all of the modeling approaches are
increased to 6~7 mm for the higher forward speed of 48 m/s, as shown in Figure 3.8. The higher
forward speed leads to in-phase oscillations of the wheelsets for each of the modeling approaches.
The response indicates that regardless of cargo movement contributions, the bogies will experience
limit cycle hunting oscillations at this speed.
(a) (b) (c) (d)
Figure 3.7: Lateral movements of the first and third wheelsets for 97% filled in different modeling
approaches (a) Frozen (b) Pendulum, (c) Liquid cargos without slosh yaw effect and (d) Liquid at 40 m/s
forward speed.
(a) (b) (c) (d)
Figure 3.8: Lateral movements of the first and third wheelsets for 97% fill level in different modeling
approaches (a) Frozen (b) Pendulum, (c) Liquid cargos without slosh yaw effect and (d) Liquid at 48 m/s
forward speed.
The responses of the system, with different liquid modeling approaches, are evaluated subject to
the track excitation in range of speed form 30 to 50 m/s for different liquid densities. The Hopf
bifurcation points of the system could be correlated to the points where amplitude of the oscillation
-10
-8
-6
-4
-2
0
2
4
6
8
10
0 2 4 6
Late
ral d
isp
lace
men
t (m
m)
Time (s)
w1
w3
-10
-8
-6
-4
-2
0
2
4
6
8
10
0 2 4 6
Time(s)-10
-8
-6
-4
-2
0
2
4
6
8
10
0 2 4 6
Time (s)-10
-8
-6
-4
-2
0
2
4
6
8
10
0 2 4 6
Time (s)
-8
-6
-4
-2
0
2
4
6
8
10
0 2 4 6
Late
ral d
isp
lace
men
t (m
m)
Time (s)
w1
w3
-10
-8
-6
-4
-2
0
2
4
6
8
10
0 2 4 6
Time (s)-10
-8
-6
-4
-2
0
2
4
6
8
10
0 2 4 6
Time (s)-10
-8
-6
-4
-2
0
2
4
6
8
10
0 2 4 6
Time (s)
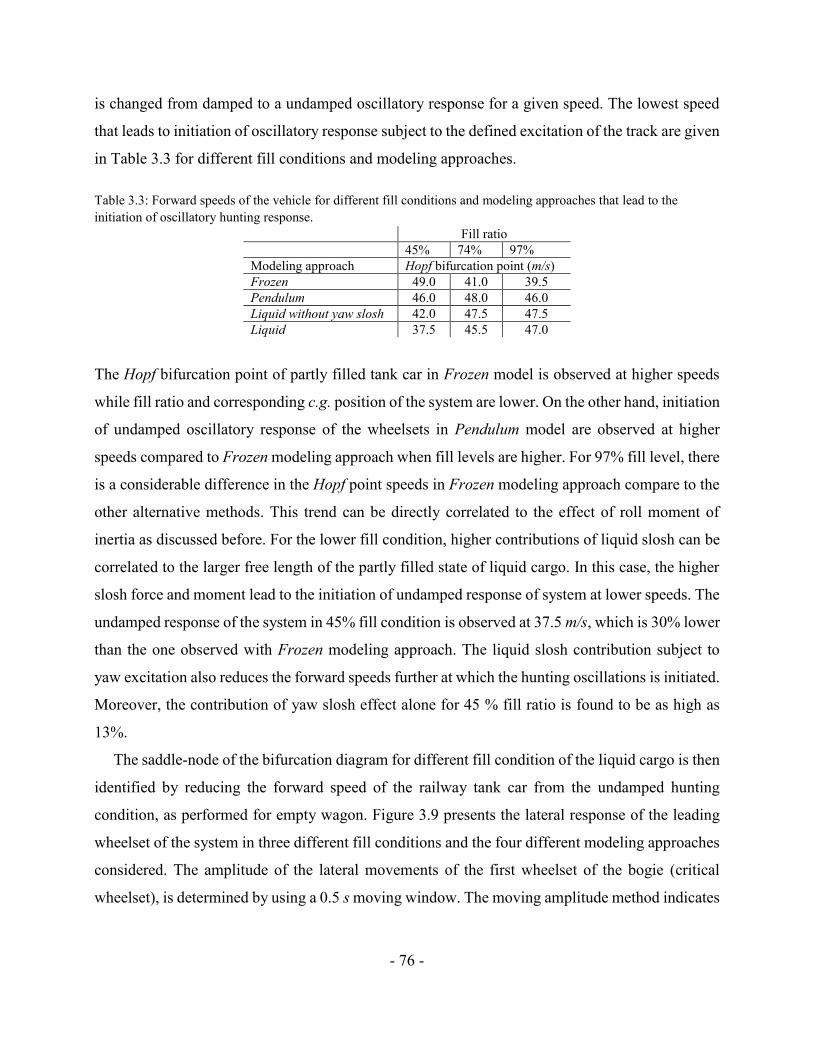
- 76 -
is changed from damped to a undamped oscillatory response for a given speed. The lowest speed
that leads to initiation of oscillatory response subject to the defined excitation of the track are given
in Table 3.3 for different fill conditions and modeling approaches.
Table 3.3: Forward speeds of the vehicle for different fill conditions and modeling approaches that lead to the
initiation of oscillatory hunting response.
Fill ratio
45% 74% 97%
Modeling approach Hopf bifurcation point (m/s)
Frozen 49.0 41.0 39.5
Pendulum 46.0 48.0 46.0
Liquid without yaw slosh 42.0 47.5 47.5
Liquid 37.5 45.5 47.0
The Hopf bifurcation point of partly filled tank car in Frozen model is observed at higher speeds
while fill ratio and corresponding c.g. position of the system are lower. On the other hand, initiation
of undamped oscillatory response of the wheelsets in Pendulum model are observed at higher
speeds compared to Frozen modeling approach when fill levels are higher. For 97% fill level, there
is a considerable difference in the Hopf point speeds in Frozen modeling approach compare to the
other alternative methods. This trend can be directly correlated to the effect of roll moment of
inertia as discussed before. For the lower fill condition, higher contributions of liquid slosh can be
correlated to the larger free length of the partly filled state of liquid cargo. In this case, the higher
slosh force and moment lead to the initiation of undamped response of system at lower speeds. The
undamped response of the system in 45% fill condition is observed at 37.5 m/s, which is 30% lower
than the one observed with Frozen modeling approach. The liquid slosh contribution subject to
yaw excitation also reduces the forward speeds further at which the hunting oscillations is initiated.
Moreover, the contribution of yaw slosh effect alone for 45 % fill ratio is found to be as high as
13%.
The saddle-node of the bifurcation diagram for different fill condition of the liquid cargo is then
identified by reducing the forward speed of the railway tank car from the undamped hunting
condition, as performed for empty wagon. Figure 3.9 presents the lateral response of the leading
wheelset of the system in three different fill conditions and the four different modeling approaches
considered. The amplitude of the lateral movements of the first wheelset of the bogie (critical
wheelset), is determined by using a 0.5 s moving window. The moving amplitude method indicates
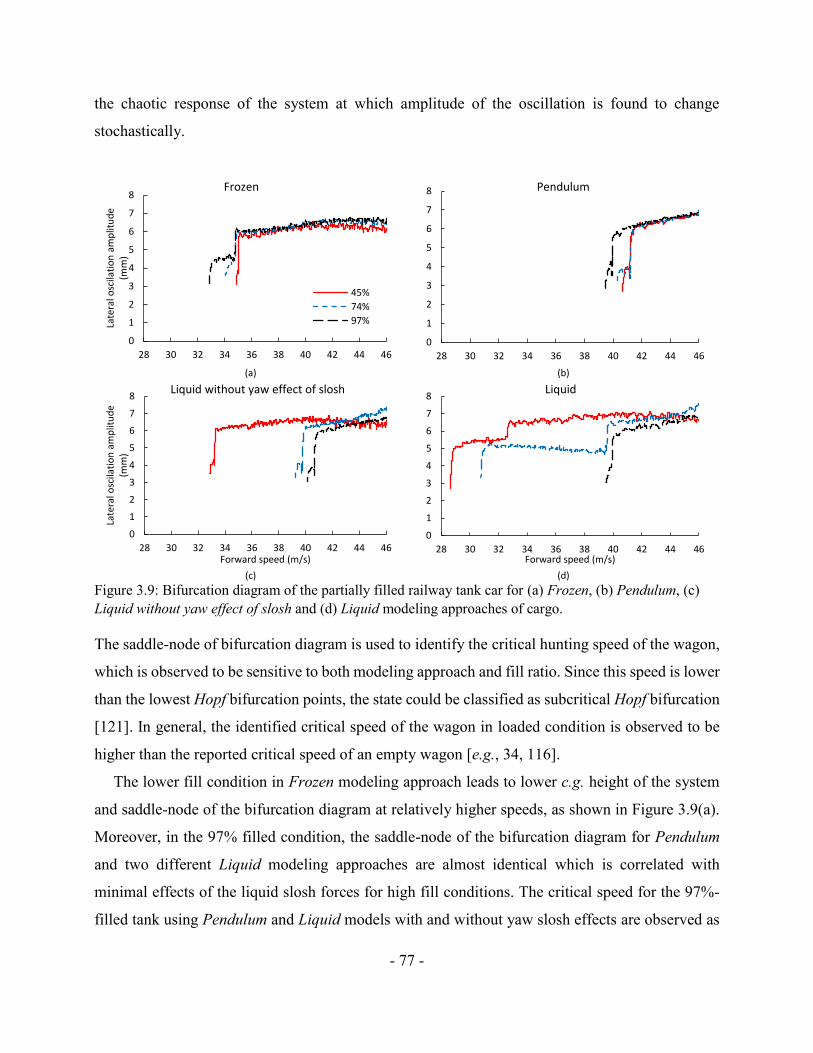
- 77 -
the chaotic response of the system at which amplitude of the oscillation is found to change
stochastically.
(a) (b)
(c) (d)
Figure 3.9: Bifurcation diagram of the partially filled railway tank car for (a) Frozen, (b) Pendulum, (c)
Liquid without yaw effect of slosh and (d) Liquid modeling approaches of cargo.
The saddle-node of bifurcation diagram is used to identify the critical hunting speed of the wagon,
which is observed to be sensitive to both modeling approach and fill ratio. Since this speed is lower
than the lowest Hopf bifurcation points, the state could be classified as subcritical Hopf bifurcation
[121]. In general, the identified critical speed of the wagon in loaded condition is observed to be
higher than the reported critical speed of an empty wagon [e.g., 34, 116].
The lower fill condition in Frozen modeling approach leads to lower c.g. height of the system
and saddle-node of the bifurcation diagram at relatively higher speeds, as shown in Figure 3.9(a).
Moreover, in the 97% filled condition, the saddle-node of the bifurcation diagram for Pendulum
and two different Liquid modeling approaches are almost identical which is correlated with
minimal effects of the liquid slosh forces for high fill conditions. The critical speed for the 97%-
filled tank using Pendulum and Liquid models with and without yaw slosh effects are observed as
0
1
2
3
4
5
6
7
8
28 30 32 34 36 38 40 42 44 46
Late
ral o
scila
tio
n a
mp
litu
de
(mm
)
Frozen
45%
74%
97%
0
1
2
3
4
5
6
7
8
28 30 32 34 36 38 40 42 44 46
Pendulum
0
1
2
3
4
5
6
7
8
28 30 32 34 36 38 40 42 44 46
Late
ral o
scila
tio
n a
mp
litu
de
(mm
)
Forward speed (m/s)
Liquid without yaw effect of slosh
0
1
2
3
4
5
6
7
8
28 30 32 34 36 38 40 42 44 46Forward speed (m/s)
Liquid
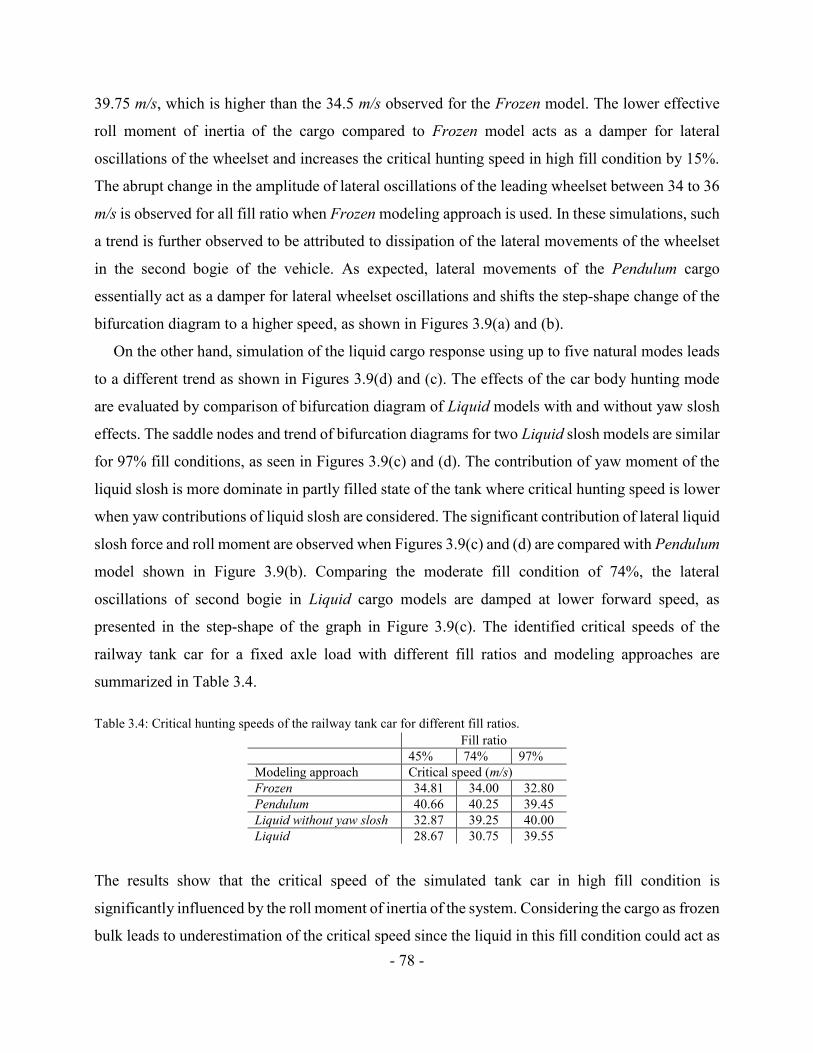
- 78 -
39.75 m/s, which is higher than the 34.5 m/s observed for the Frozen model. The lower effective
roll moment of inertia of the cargo compared to Frozen model acts as a damper for lateral
oscillations of the wheelset and increases the critical hunting speed in high fill condition by 15%.
The abrupt change in the amplitude of lateral oscillations of the leading wheelset between 34 to 36
m/s is observed for all fill ratio when Frozen modeling approach is used. In these simulations, such
a trend is further observed to be attributed to dissipation of the lateral movements of the wheelset
in the second bogie of the vehicle. As expected, lateral movements of the Pendulum cargo
essentially act as a damper for lateral wheelset oscillations and shifts the step-shape change of the
bifurcation diagram to a higher speed, as shown in Figures 3.9(a) and (b).
On the other hand, simulation of the liquid cargo response using up to five natural modes leads
to a different trend as shown in Figures 3.9(d) and (c). The effects of the car body hunting mode
are evaluated by comparison of bifurcation diagram of Liquid models with and without yaw slosh
effects. The saddle nodes and trend of bifurcation diagrams for two Liquid slosh models are similar
for 97% fill conditions, as seen in Figures 3.9(c) and (d). The contribution of yaw moment of the
liquid slosh is more dominate in partly filled state of the tank where critical hunting speed is lower
when yaw contributions of liquid slosh are considered. The significant contribution of lateral liquid
slosh force and roll moment are observed when Figures 3.9(c) and (d) are compared with Pendulum
model shown in Figure 3.9(b). Comparing the moderate fill condition of 74%, the lateral
oscillations of second bogie in Liquid cargo models are damped at lower forward speed, as
presented in the step-shape of the graph in Figure 3.9(c). The identified critical speeds of the
railway tank car for a fixed axle load with different fill ratios and modeling approaches are
summarized in Table 3.4.
Table 3.4: Critical hunting speeds of the railway tank car for different fill ratios.
Fill ratio
45% 74% 97%
Modeling approach Critical speed (m/s)
Frozen 34.81 34.00 32.80
Pendulum 40.66 40.25 39.45
Liquid without yaw slosh 32.87 39.25 40.00
Liquid 28.67 30.75 39.55
The results show that the critical speed of the simulated tank car in high fill condition is
significantly influenced by the roll moment of inertia of the system. Considering the cargo as frozen
bulk leads to underestimation of the critical speed since the liquid in this fill condition could act as
- 79 -
a damper for lateral oscillations of the wheelsets. The results further show that very similar critical
speed is predicted regardless of the modeling approach considered to represent liquid motions at
high fill levels. For partial fill conditions on the other hand, fluid motions lead to lower critical
speeds where the contribution of the yaw slosh moment could be very significant on identified
critical speed. The Pendulum model, can simulate the free roll oscillations of cargo with respect to
tank and is effective just for high fill levels, but will overestimate the critical speed significantly in
comparison to proposed liquid models as the fill level is reduced. For low fill levels where liquid
slosh will influence the dynamics, the proposed liquid model predicts a critical speed of 28.67 m/s
which is 41% less than that predicted by simple pendulum model. Neglecting the liquid slosh
response subject to yaw excitations of tank car yields a critical speed of 32.87 m/s or 15%
overestimation of critical speed.
3.5 Conclusions
A nonlinear dynamic model of a railway tank car with three-piece bogie is simulated to investigate
its lateral response. The primary focus of this investigation is to examine the influence of liquid
cargo sloshing on the lateral stability performances of tank cars. In order to systematically examine
the effect of fluid motions, four different models are developed, namely rigid cargo represented as
frozen liquid, equivalent pendulum to represent liquid slosh forces, and linear slosh model with
and without yaw slosh moments. For the linear slosh model, the lateral movements of fluid in
various fill ratio of a circular tank cross section is represented by five natural modes of liquid
movements. The proposed slosh model is integrated with a 114 DoF model of the tank car and used
to study the stability of the system in a computationally efficient manner. The critical hunting speed
of the wagon characterized by the limit cycle motion of the leading wheelset is established for three
different fill levels with identical total weight. A partially filled tanker with various densities of
cargo leading to different fill ratio, yields a different critical hunting speeds. The higher fill
condition of the cargo leads to the higher resultant c.g. position and lower critical hunting speeds
while the cargo is assumed as frozen. Simulation of the free rotation of the cargo bulk with respect
to tank leads to higher critical hunting speed in high fill conditions as cargo relative motion
introduces damping to the system. The pendulum representation of the cargo leads to higher
hunting speeds compare to frozen modeling approach it also acts as a damper for lateral oscillations
of the tank car. However, the critical hunting speed is not sensitive to the variation of liquid density
- 80 -
and c.g. height, while the cargo is treated as simple pendulum and thus clearly inadequate to
represent fluid slosh in a partially filled tank car. On the other hand, when the tank is nearly full,
all slosh models considered lead to same critical hunting speed which is higher than the speed
predicted for frozen cargo. Such response is expected due to the small free length of liquid cargo
and negligible effects of slosh. For partial fill condition, the proposed liquid model with and
without consideration of yaw slosh moment lead to lower critical speed compare to the results
obtained from frozen and pendulum approaches. The liquid slosh response in partly filled condition
has a tendency to eliminate the dissipative effects of the cargo observed in simple pendulum
approach. Furthermore, initiation of the yaw oscillations of car body leads to additional slosh
moment which cause a further destabilizing effect and even lower critical speed. This trend is more
prominent for lowest fill level considered in comparison to the medium fill level. Sloshing of liquid
in a partially filled railway tank car can thus significantly deteriorate the critical hunting speed
performance.
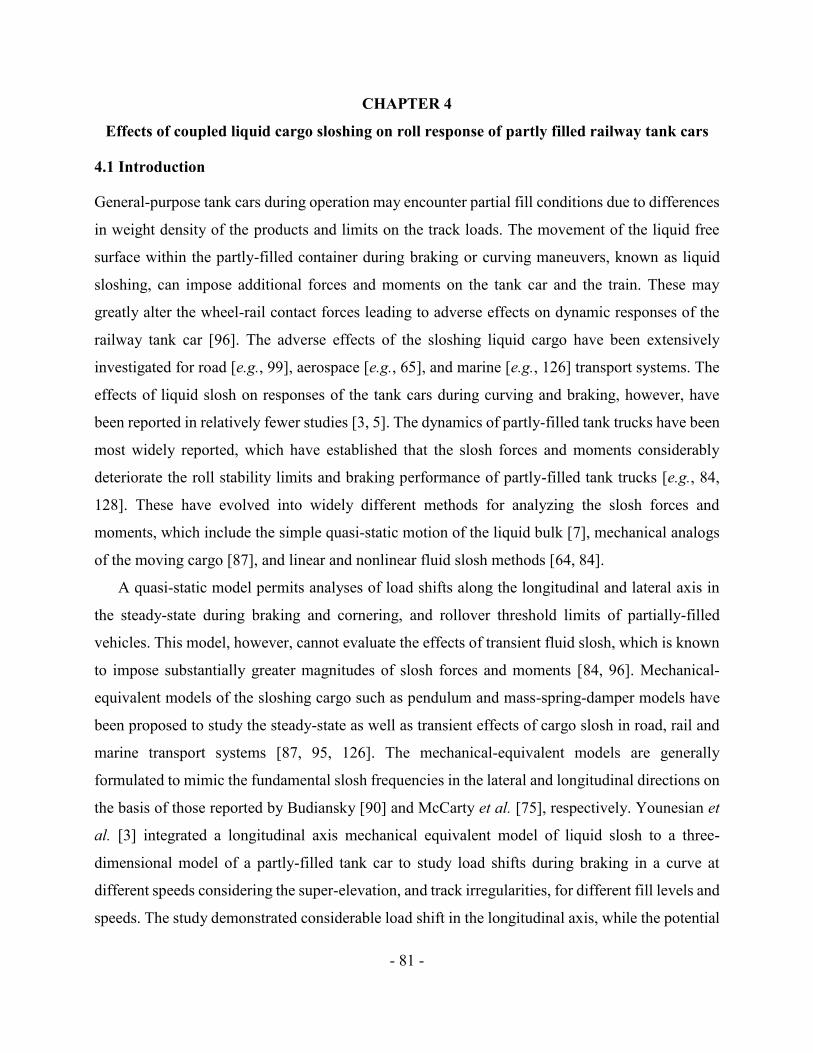
- 81 -
CHAPTER 4
Effects of coupled liquid cargo sloshing on roll response of partly filled railway tank cars
4.1 Introduction
General-purpose tank cars during operation may encounter partial fill conditions due to differences
in weight density of the products and limits on the track loads. The movement of the liquid free
surface within the partly-filled container during braking or curving maneuvers, known as liquid
sloshing, can impose additional forces and moments on the tank car and the train. These may
greatly alter the wheel-rail contact forces leading to adverse effects on dynamic responses of the
railway tank car [96]. The adverse effects of the sloshing liquid cargo have been extensively
investigated for road [e.g., 99], aerospace [e.g., 65], and marine [e.g., 126] transport systems. The
effects of liquid slosh on responses of the tank cars during curving and braking, however, have
been reported in relatively fewer studies [3, 5]. The dynamics of partly-filled tank trucks have been
most widely reported, which have established that the slosh forces and moments considerably
deteriorate the roll stability limits and braking performance of partly-filled tank trucks [e.g., 84,
128]. These have evolved into widely different methods for analyzing the slosh forces and
moments, which include the simple quasi-static motion of the liquid bulk [7], mechanical analogs
of the moving cargo [87], and linear and nonlinear fluid slosh methods [64, 84].
A quasi-static model permits analyses of load shifts along the longitudinal and lateral axis in
the steady-state during braking and cornering, and rollover threshold limits of partially-filled
vehicles. This model, however, cannot evaluate the effects of transient fluid slosh, which is known
to impose substantially greater magnitudes of slosh forces and moments [84, 96]. Mechanical-
equivalent models of the sloshing cargo such as pendulum and mass-spring-damper models have
been proposed to study the steady-state as well as transient effects of cargo slosh in road, rail and
marine transport systems [87, 95, 126]. The mechanical-equivalent models are generally
formulated to mimic the fundamental slosh frequencies in the lateral and longitudinal directions on
the basis of those reported by Budiansky [90] and McCarty et al. [75], respectively. Younesian et
al. [3] integrated a longitudinal axis mechanical equivalent model of liquid slosh to a three-
dimensional model of a partly-filled tank car to study load shifts during braking in a curve at
different speeds considering the super-elevation, and track irregularities, for different fill levels and
speeds. The study demonstrated considerable load shift in the longitudinal axis, while the potential
- 82 -
unloading due to sloshing in the roll plane could not be predicted since the slosh model was limited
only to the pitch plane. The study suggested that neglecting fluid slosh in a partly-filled tank car
could lead to underestimation of the derailment potential and wheel unloading by 18 and 25
percent. Transportation of high-density liquid cargo in a high capacity railway tank was also
reported to be more critical as it has been reported for road tankers [7]. Vera et al. [95] implemented
a similar longitudinal axis mass-spring model distributed along the length of a 87%-filled
compartmented tank together with an uncoupled simple pendulum model in the roll plane to study
fluid slosh in the lateral and longitudinal axes. The study showed negligible effect of fluid slosh on
the running safety of the train, likely due to consideration of the compartmented tank and relatively
high fill level. Di Gialleonardo et al. [94] characterized the lateral liquid slosh by introducing nine
uncoupled lateral mass-spring systems distributed uniformly along the length of the tank car. The
higher unloading and derailment ratio was observed under the influence of liquid movement.
The mechanical models are considered meritorious since these can be conveniently integrated
to multi-body dynamic (MBD) models for simulations of the coupled cargo and vehicle/tank car
system in a computationally efficient manner. The developments of such models, however, pose
considerable challenges in identifications of model parameter, which are dependent upon the tank
geometry and the fill volume in a highly complex manner. Nonlinear computational fluid dynamic
(CFD) methods based on the Navier-Stokes formulations have been widely used to determine the
transient slosh within partly-filled tanks of different cross-sections with and without baffles, while
their implementations in vehicle models have been limited due to excessive computational
demands [63-65]. Alternatively, Shi et al. [5] proposed a continuum based fluid constitutive model,
which was integrated to MBD model of a rail vehicle through the development of a fluid-tank
contact algorithm to study dynamic responses during curve negotiation and ECP braking. The study
showed relatively higher coupler force and greater variations in the wheel loads due to fluid slosh
under braking, when compared to that observed with the rigid cargo. Wang et al. [123] developed
a low order continuum model of a rectangular cross-section tank and iterated it to an MBD railway
vehicle model to study slosh effect during curving. The study concluded greater potential for
wheel-rail separation and thus the derailment in the presence of fluid slosh, especially at higher
operating speeds.
The methods employed in the aforementioned studies are also computationally demanding
similar to the CFD methods. Alternatively, linear slosh theory has been used to simulate fluid slosh
- 83 -
in a computationally efficient manner assuming inviscid and irrotational flows [99, 126]. The
validity of linear slosh theory in predicting mode shapes and natural frequencies of liquid slosh,
and hydrodynamic forces has been presented in several studies [64, 126]. It has been shown that
the linear theory can effectively predict the slosh forces and moments under excitations likely to
be encountered during typical vehicle maneuvers, although it underestimates the resonant slosh
when separation of the free surface occurs [64]. The linear slosh theory has been widely used for
predicting slosh modes, and forces and moments in partly-filled arbitrary cross-section tanks with
and without baffles of varying geometry [6, 98]. The linear slosh theory permits analyses of three-
dimensional slosh under simultaneous braking and curving in a highly efficient manner [129],
which is not possible with mechanical-equivalent slosh models, and is computationally demanding
with the continuum-based or CFD models. Moreover, the linear slosh models can be conveniently
integrated to MBD vehicle models to analyze coupled liquid-vehicle system responses, although it
has not yet been attempted for railway vehicles.
In this study, the liquid slosh within a partly-filled tank is analyzed using a linear slosh model.
A comprehensive multi-body dynamic model of a tank car incorporating non-smooth and nonlinear
damping as well as stiffness properties of friction wedges employed in the secondary suspensions,
developed in Universal Mechanism (UM) platform, is considered to study the effect of fluid slosh
on responses during curving. For this purpose, the slosh model, developed in Matlab/Simulink is
integrated to the vehicle model via co-simulation technique in order to establish a coupling between
the liquid slosh and vehicle dynamic responses. The responses of the coupled liquid-vehicle model
under selected maneuvers are evaluated considering different fill heights of the liquid cargo and
forward speeds. The simulations are performed to identify speed corresponding to wheel-rail
separation during curving, denoted as the critical curving speed. The response characteristics of the
partly-filled tank car are compared with those of the car with an equivalent rigid cargo in order to
illustrate adverse effects of liquid cargo slosh on the directional performance of the railway vehicle.
4.2 Model formulations
4.2.1 Multi-body dynamic model of the tank car
A multi-body dynamic (MBD) model of a railway tank car, comprising the underframe, a circular
cross-section tank and a set of three-piece bogies, is developed in Universal Mechanism (UM)
software [110, 124], as shown in Figure 4.1. Each bogie is modeled considering nine rigid bodies,
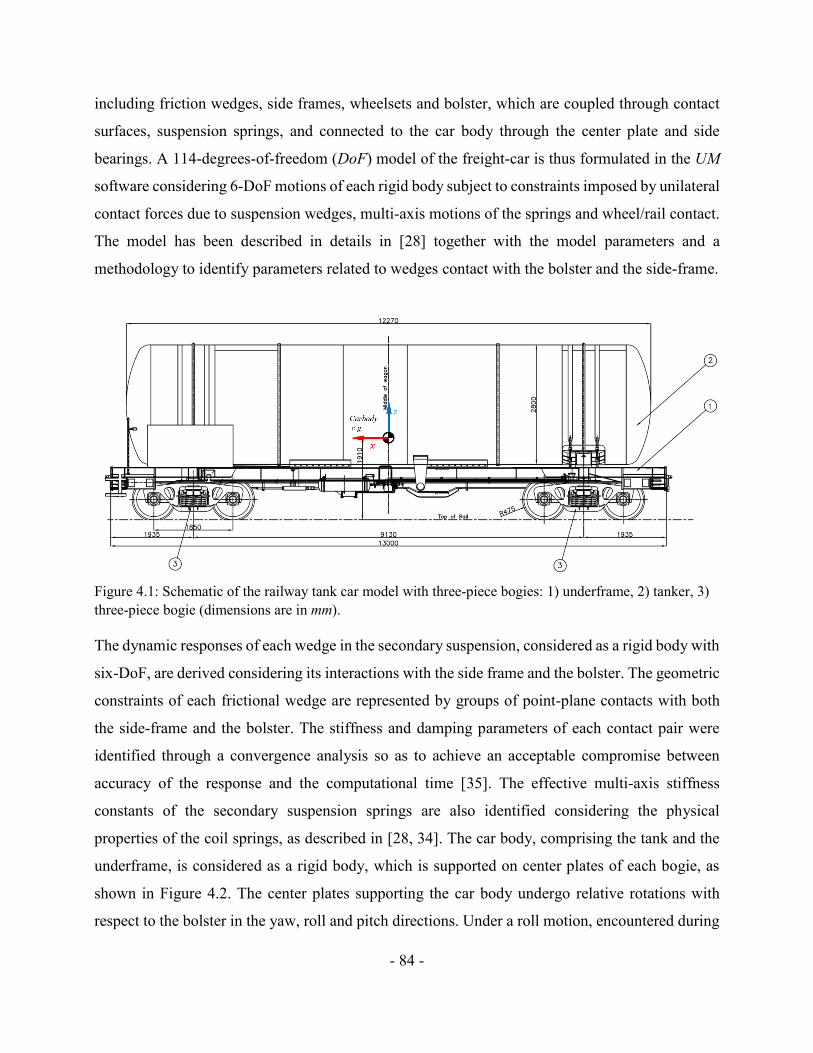
- 84 -
including friction wedges, side frames, wheelsets and bolster, which are coupled through contact
surfaces, suspension springs, and connected to the car body through the center plate and side
bearings. A 114-degrees-of-freedom (DoF) model of the freight-car is thus formulated in the UM
software considering 6-DoF motions of each rigid body subject to constraints imposed by unilateral
contact forces due to suspension wedges, multi-axis motions of the springs and wheel/rail contact.
The model has been described in details in [28] together with the model parameters and a
methodology to identify parameters related to wedges contact with the bolster and the side-frame.
Figure 4.1: Schematic of the railway tank car model with three-piece bogies: 1) underframe, 2) tanker, 3)
three-piece bogie (dimensions are in mm).
The dynamic responses of each wedge in the secondary suspension, considered as a rigid body with
six-DoF, are derived considering its interactions with the side frame and the bolster. The geometric
constraints of each frictional wedge are represented by groups of point-plane contacts with both
the side-frame and the bolster. The stiffness and damping parameters of each contact pair were
identified through a convergence analysis so as to achieve an acceptable compromise between
accuracy of the response and the computational time [35]. The effective multi-axis stiffness
constants of the secondary suspension springs are also identified considering the physical
properties of the coil springs, as described in [28, 34]. The car body, comprising the tank and the
underframe, is considered as a rigid body, which is supported on center plates of each bogie, as
shown in Figure 4.2. The center plates supporting the car body undergo relative rotations with
respect to the bolster in the yaw, roll and pitch directions. Under a roll motion, encountered during
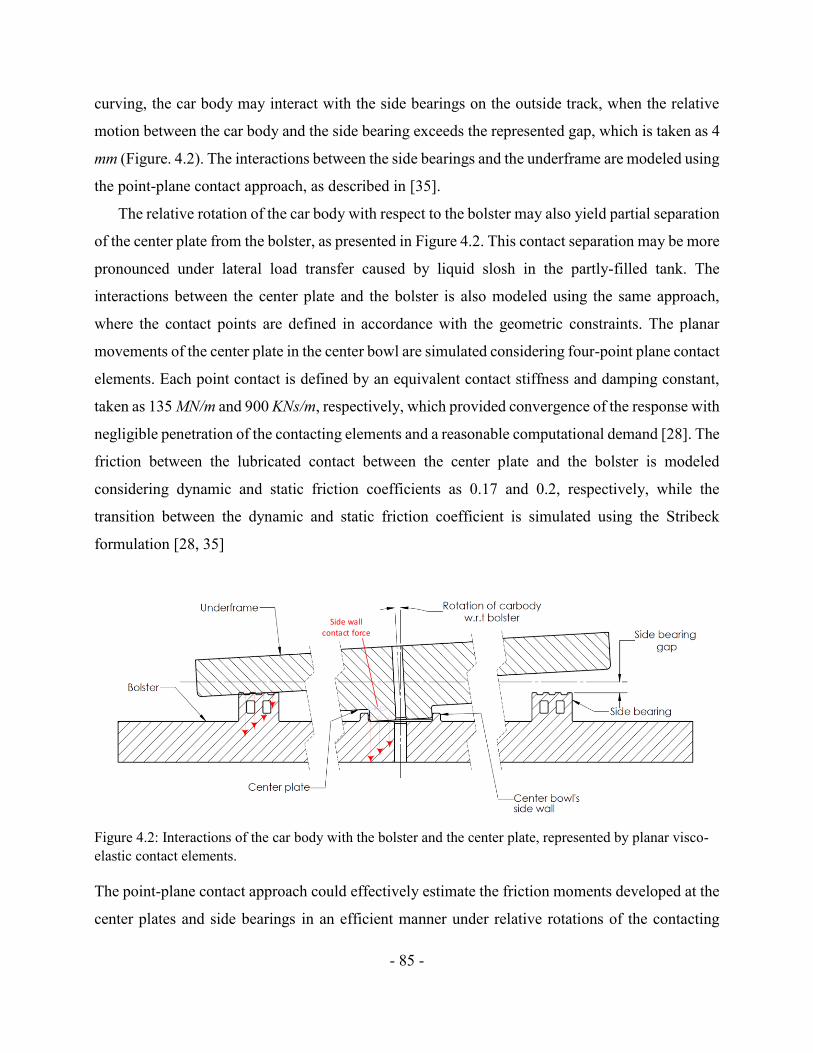
- 85 -
curving, the car body may interact with the side bearings on the outside track, when the relative
motion between the car body and the side bearing exceeds the represented gap, which is taken as 4
mm (Figure. 4.2). The interactions between the side bearings and the underframe are modeled using
the point-plane contact approach, as described in [35].
The relative rotation of the car body with respect to the bolster may also yield partial separation
of the center plate from the bolster, as presented in Figure 4.2. This contact separation may be more
pronounced under lateral load transfer caused by liquid slosh in the partly-filled tank. The
interactions between the center plate and the bolster is also modeled using the same approach,
where the contact points are defined in accordance with the geometric constraints. The planar
movements of the center plate in the center bowl are simulated considering four-point plane contact
elements. Each point contact is defined by an equivalent contact stiffness and damping constant,
taken as 135 MN/m and 900 KNs/m, respectively, which provided convergence of the response with
negligible penetration of the contacting elements and a reasonable computational demand [28]. The
friction between the lubricated contact between the center plate and the bolster is modeled
considering dynamic and static friction coefficients as 0.17 and 0.2, respectively, while the
transition between the dynamic and static friction coefficient is simulated using the Stribeck
formulation [28, 35]
Side wall contact force
Figure 4.2: Interactions of the car body with the bolster and the center plate, represented by planar visco-
elastic contact elements.
The point-plane contact approach could effectively estimate the friction moments developed at the
center plates and side bearings in an efficient manner under relative rotations of the contacting
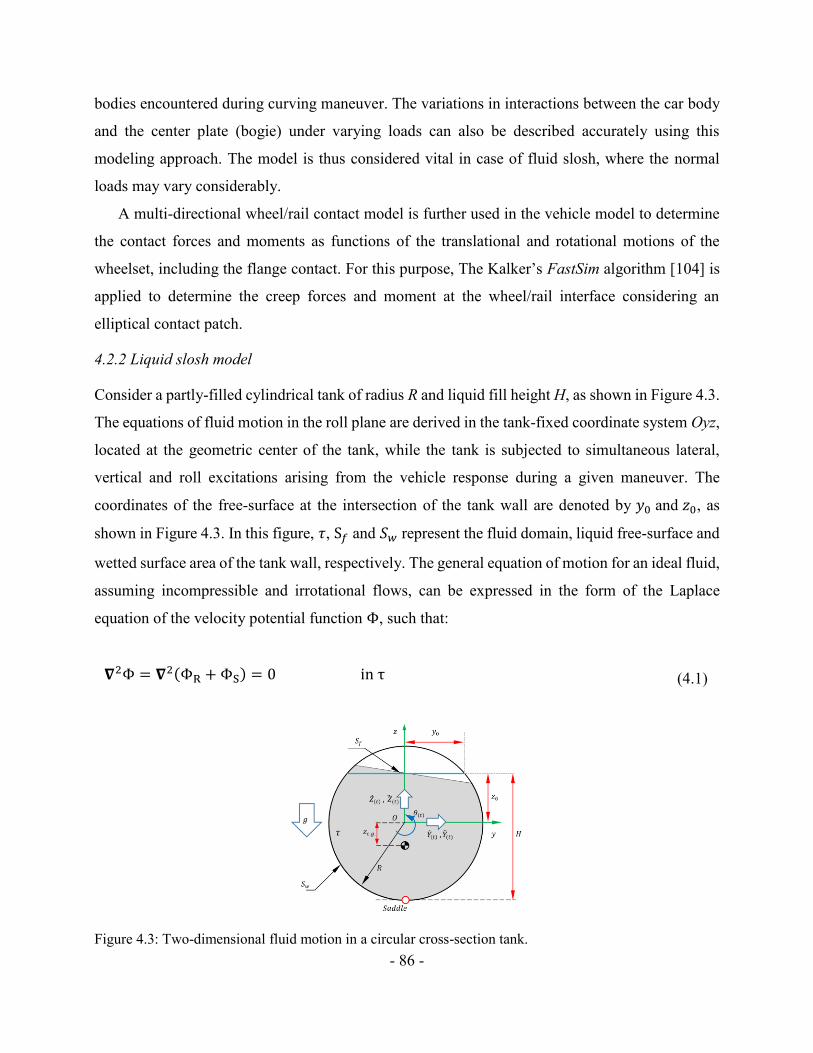
- 86 -
bodies encountered during curving maneuver. The variations in interactions between the car body
and the center plate (bogie) under varying loads can also be described accurately using this
modeling approach. The model is thus considered vital in case of fluid slosh, where the normal
loads may vary considerably.
A multi-directional wheel/rail contact model is further used in the vehicle model to determine
the contact forces and moments as functions of the translational and rotational motions of the
wheelset, including the flange contact. For this purpose, The Kalker’s FastSim algorithm [104] is
applied to determine the creep forces and moment at the wheel/rail interface considering an
elliptical contact patch.
4.2.2 Liquid slosh model
Consider a partly-filled cylindrical tank of radius R and liquid fill height H, as shown in Figure 4.3.
The equations of fluid motion in the roll plane are derived in the tank-fixed coordinate system Oyz,
located at the geometric center of the tank, while the tank is subjected to simultaneous lateral,
vertical and roll excitations arising from the vehicle response during a given maneuver. The
coordinates of the free-surface at the intersection of the tank wall are denoted by 𝑦0 and 𝑧0, as
shown in Figure 4.3. In this figure, 𝜏, S𝑓 and 𝑆𝑤 represent the fluid domain, liquid free-surface and
wetted surface area of the tank wall, respectively. The general equation of motion for an ideal fluid,
assuming incompressible and irrotational flows, can be expressed in the form of the Laplace
equation of the velocity potential function Φ, such that:
𝛁2Φ = 𝛁2(ΦR +ΦS) = 0 in τ (4.1)
Figure 4.3: Two-dimensional fluid motion in a circular cross-section tank.
- 87 -
where ΦR and ΦS are two components of the velocity potential corresponding to the rigid body
motion of the fluid and liquid motion relative to the container, respectively. It can be shown that
for a cylindrical tank under lateral, vertical and roll excitations about the center of the tank, the
rigid body potential, ΦR, can be expressed as [98, 126]:
ΦR = ��(𝑡)𝑦 + ��(𝑡)(𝑧 − 𝑧0) (4.2)
where ��(𝑡) and ��(𝑡) are the lateral and vertical velocities of the container, respectively. It should
be noted that the rigid body potential, ΦR, in the above equation does not depend on the roll rate
of the container sine the roll motion of a cylindrical tank about its center cannot influence the rigid
body potential in case of inviscid flows. This is considered valid since the viscosity effect of most
liquids is nearly negligible compared to the inertia effect [126].
Based on the multimodal method [126], the potential ΦS attributed to liquid slosh can be
expressed as a function of the lateral and vertical motions of the fluid (y,z) through superposition
of natural modes, 𝜑𝑖, expressed in the generalized coordinates, 𝛾𝑖:
ΦS(𝑦, 𝑧, 𝑡) =∑𝛾𝑖(t)𝜑𝑖(𝑦, 𝑧)
∞
𝑖=1
(4.3)
Substituting the above equation into the free-surface boundary condition results in the following
set of ordinary differential equations [64]:
��𝑖 + 2𝜉𝑖𝜎𝑖��𝑖 + 𝜎𝑖2𝛾𝑖 = −𝑌𝜆𝑖 on S𝑓 (4.4)
where 𝑌 is the time derivative of the effective lateral acceleration acting at the geometric center of
the container and 𝜎𝑖 is circular frequency of the liquid oscillations. In the above equation, 𝜉𝑖 and
𝜆𝑖 are the damping coefficients due to the liquid viscosity and hydrodynamic coefficients,
respectively, given by [78, 99]:
- 88 -
𝜉𝑖 =𝑔
2√2𝑅𝑣𝑠1/2𝜎𝑖−5/2
∫ (𝜕𝜑𝑖𝜕𝑠)2
𝑆𝑤
𝑑𝑆 (4.5)
𝜆𝑖 =∫ 𝑦𝜑𝑖𝑑𝑆S𝑓
∫ (𝜑𝑖)2𝑑𝑆S𝑓
(4.6)
where 𝜈𝑠 is the fluid kinematic viscosity and g is acceleration due to gravity. Here the natural slosh
modes and frequencies are obtained using the Ritz variational method as described in [64]. The
solutions of the differential equation (4.4) yield hydrodynamic pressure, 𝑃(𝑦, 𝑧, 𝑡), which directly
relates to the slosh force and moment. The hydrodynamic pressure distribution on the container
wall can be obtained from the linearized Bernoulli’s equation [126], such that:
𝑃(𝑦, 𝑧, 𝑡) = −𝜌𝑔(𝑧 − 𝑧0 + 𝜃𝑦) − 𝜌𝜕(ΦR +ΦS)
𝜕𝑡=
−𝜌𝑔(𝑧 − 𝑧0 + 𝜃𝑦) − 𝜌 {��𝑦 + ��(𝑧 − 𝑧0) +∑��𝑖(t)𝜑𝑖(𝑦, 𝑧)
∞
𝑖=1
} (4.7)
where 𝜌 is fluid density and 𝜃 is roll angle of the tank about its origin O (Figure 4.3). The total
lateral force, 𝐹𝑦(𝑡), acting on the container wall, per unit length of the container, is obtained from
integration of hydrodynamic pressure over the tank wetted area, 𝑆𝑤, such that:
𝐹𝑦(𝑡) = ∫ 𝑃𝑑𝑧𝑆𝑤
= 𝐹𝑦,𝑅(𝑡) + 𝐹𝑦,𝑆(𝑡) (4.8)
where 𝐹𝑦,𝑅 and 𝐹𝑦,𝑆 are components of the lateral force attributed to rigid body and slosh motions
of the liquid, respectively, expressed as:
𝐹𝑦,𝑅(𝑡) = −𝜌(�� + 𝜃𝑔)∫ 𝑦𝑑𝑧𝑆𝑤
= −𝑚(�� + 𝜃𝑔) (4.9)
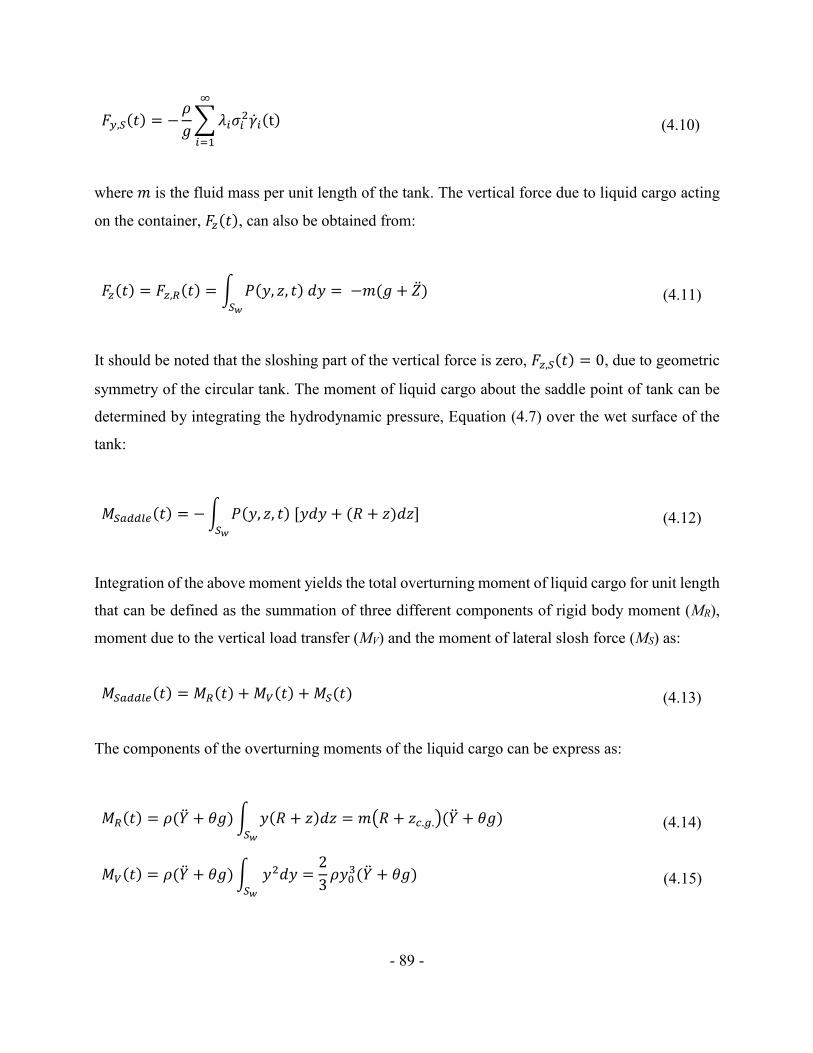
- 89 -
𝐹𝑦,𝑆(𝑡) = −𝜌
𝑔∑𝜆𝑖𝜎𝑖
2��𝑖(t)
∞
𝑖=1
(4.10)
where 𝑚 is the fluid mass per unit length of the tank. The vertical force due to liquid cargo acting
on the container, 𝐹𝑧(𝑡), can also be obtained from:
𝐹𝑧(𝑡) = 𝐹𝑧,𝑅(𝑡) = ∫ 𝑃(𝑦, 𝑧, 𝑡) 𝑑𝑦𝑆𝑤
= −𝑚(𝑔 + ��) (4.11)
It should be noted that the sloshing part of the vertical force is zero, 𝐹𝑧,𝑆(𝑡) = 0, due to geometric
symmetry of the circular tank. The moment of liquid cargo about the saddle point of tank can be
determined by integrating the hydrodynamic pressure, Equation (4.7) over the wet surface of the
tank:
𝑀𝑆𝑎𝑑𝑑𝑙𝑒(𝑡) = −∫ 𝑃(𝑦, 𝑧, 𝑡) [𝑦𝑑𝑦 + (𝑅 + 𝑧)𝑑𝑧]𝑆𝑤
(4.12)
Integration of the above moment yields the total overturning moment of liquid cargo for unit length
that can be defined as the summation of three different components of rigid body moment (MR),
moment due to the vertical load transfer (MV) and the moment of lateral slosh force (MS) as:
𝑀𝑆𝑎𝑑𝑑𝑙𝑒(𝑡) = 𝑀𝑅(𝑡) + 𝑀𝑉(𝑡) + 𝑀𝑆(𝑡) (4.13)
The components of the overturning moments of the liquid cargo can be express as:
𝑀𝑅(𝑡) = 𝜌(�� + 𝜃𝑔)∫ 𝑦(𝑅 + 𝑧)𝑑𝑧 = 𝑚(𝑅 + 𝑧𝑐.𝑔.)(�� + 𝜃𝑔)𝑆𝑤
(4.14)
𝑀𝑉(𝑡) = 𝜌(�� + 𝜃𝑔)∫ 𝑦2𝑑𝑦 =2
3𝜌𝑦0
3(�� + 𝜃𝑔)𝑆𝑤
(4.15)
- 90 -
𝑀𝑆(𝑡) =𝜌
𝑔 𝑅∑𝜆𝑖𝜎𝑖
2��𝑖(t)
∞
𝑖=1
= 𝑅 × 𝐹𝑦,𝑆(𝑡) (4.16)
where 𝑧𝑐.𝑔. in Equation (4.14) is the position of center of gravity for liquid cargo with respect to
tank geometry center, point O. The 𝑦0 in Equation (4.15) is the half of the free length of free surface
as shown in Figure 4.4. The 𝑀𝑉(𝑡) can be regarded as the moment due to lateral shift of liquid
cargo subject to lateral acceleration.
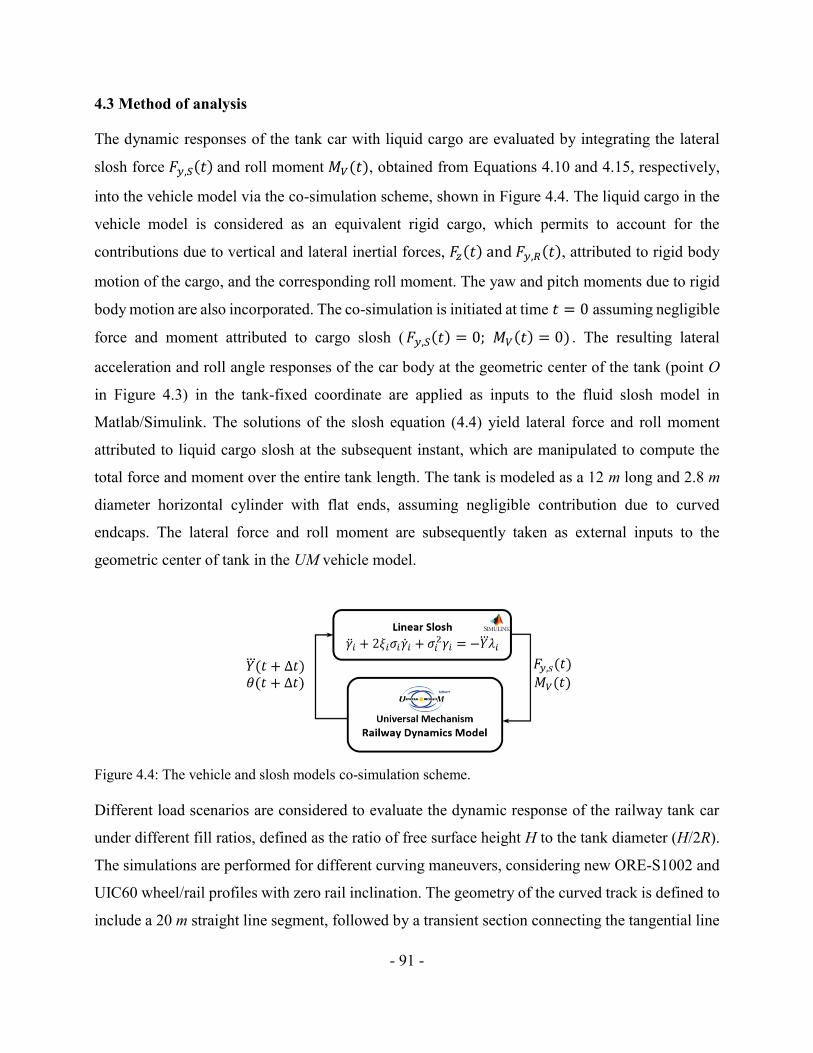
- 91 -
4.3 Method of analysis
The dynamic responses of the tank car with liquid cargo are evaluated by integrating the lateral
slosh force 𝐹𝑦,𝑆(𝑡) and roll moment 𝑀𝑉(𝑡), obtained from Equations 4.10 and 4.15, respectively,
into the vehicle model via the co-simulation scheme, shown in Figure 4.4. The liquid cargo in the
vehicle model is considered as an equivalent rigid cargo, which permits to account for the
contributions due to vertical and lateral inertial forces, 𝐹𝑧(𝑡) and 𝐹𝑦,𝑅(𝑡), attributed to rigid body
motion of the cargo, and the corresponding roll moment. The yaw and pitch moments due to rigid
body motion are also incorporated. The co-simulation is initiated at time 𝑡 = 0 assuming negligible
force and moment attributed to cargo slosh (𝐹𝑦,𝑆(𝑡) = 0; 𝑀𝑉(𝑡) = 0) . The resulting lateral
acceleration and roll angle responses of the car body at the geometric center of the tank (point O
in Figure 4.3) in the tank-fixed coordinate are applied as inputs to the fluid slosh model in
Matlab/Simulink. The solutions of the slosh equation (4.4) yield lateral force and roll moment
attributed to liquid cargo slosh at the subsequent instant, which are manipulated to compute the
total force and moment over the entire tank length. The tank is modeled as a 12 m long and 2.8 m
diameter horizontal cylinder with flat ends, assuming negligible contribution due to curved
endcaps. The lateral force and roll moment are subsequently taken as external inputs to the
geometric center of tank in the UM vehicle model.
Figure 4.4: The vehicle and slosh models co-simulation scheme.
Different load scenarios are considered to evaluate the dynamic response of the railway tank car
under different fill ratios, defined as the ratio of free surface height H to the tank diameter (H/2R).
The simulations are performed for different curving maneuvers, considering new ORE-S1002 and
UIC60 wheel/rail profiles with zero rail inclination. The geometry of the curved track is defined to
include a 20 m straight line segment, followed by a transient section connecting the tangential line
- 92 -
to a constant radius curve, Rc=600 m. The curvature of the 200 m long curved segment is linearly
increased from 0 to 1/Rc over a length of 50 m to realize gradual curving. The curved segment is
subsequently followed by a 50 m long tangent segment. The lateral acceleration developed in a
super-elevated curved track is balanced by the gravity component of the car body at a speed 𝑣𝑏𝑎𝑙.
Assuming negligible contributions of dynamics of the suspension and the cargo, 𝑣𝑏𝑎𝑙 for the steady
curved track can be estimated from [38]:
𝑣𝑏𝑎𝑙 = √𝑔 × 𝑅𝑐 × Δ
𝑡𝑟𝑎𝑐𝑘 𝑔𝑎𝑢𝑔𝑒 (4.17)
where Δ is super-elevation of the outer rail with respect to the inner one. In the presence of liquid
slosh, the slosh force may affect the balance speed 𝑣𝑏𝑎𝑙. The tank car tends to tilt inward of the
curved segment, when 𝑣 < 𝑣𝑏𝑎𝑙, and outward when 𝑣 > 𝑣𝑏𝑎𝑙. The simulations are performed for
the track with and without a super-elevation in order to investigate the influence of slosh force and
moment on 𝑣𝑏𝑎𝑙. For this purpose, a super-elevation of the constant radius segment (0.0736 m) is
introduced, which increases/decreases linearly over the transient segments of the curved track.
The simulations of MBD model of the car are performed using the Park method [117] with
variable time step ranging from a minimum of 1 × 10-12 to maximum of 0.001 s with an error
tolerance of 1 × 10⁻⁸. The selected solver parameters were observed to be adequate for handling
contact problems associated with wheel-rail and suspension components of the bogie in a
computationally efficient manner. The friction coefficient between the wheel and rail profile was
considered as 0.25, as recommended in [52].
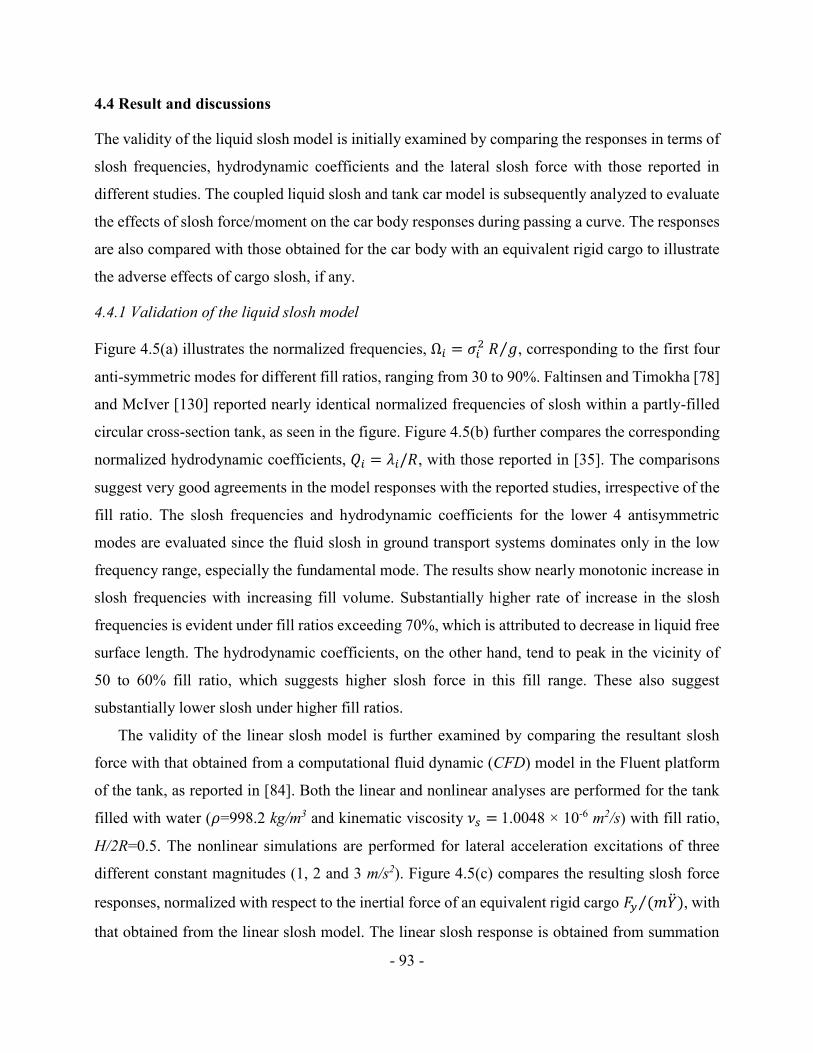
- 93 -
4.4 Result and discussions
The validity of the liquid slosh model is initially examined by comparing the responses in terms of
slosh frequencies, hydrodynamic coefficients and the lateral slosh force with those reported in
different studies. The coupled liquid slosh and tank car model is subsequently analyzed to evaluate
the effects of slosh force/moment on the car body responses during passing a curve. The responses
are also compared with those obtained for the car body with an equivalent rigid cargo to illustrate
the adverse effects of cargo slosh, if any.
4.4.1 Validation of the liquid slosh model
Figure 4.5(a) illustrates the normalized frequencies, Ω𝑖 = 𝜎𝑖2 𝑅 𝑔⁄ , corresponding to the first four
anti-symmetric modes for different fill ratios, ranging from 30 to 90%. Faltinsen and Timokha [78]
and McIver [130] reported nearly identical normalized frequencies of slosh within a partly-filled
circular cross-section tank, as seen in the figure. Figure 4.5(b) further compares the corresponding
normalized hydrodynamic coefficients, 𝑄𝑖 = 𝜆𝑖/𝑅, with those reported in [35]. The comparisons
suggest very good agreements in the model responses with the reported studies, irrespective of the
fill ratio. The slosh frequencies and hydrodynamic coefficients for the lower 4 antisymmetric
modes are evaluated since the fluid slosh in ground transport systems dominates only in the low
frequency range, especially the fundamental mode. The results show nearly monotonic increase in
slosh frequencies with increasing fill volume. Substantially higher rate of increase in the slosh
frequencies is evident under fill ratios exceeding 70%, which is attributed to decrease in liquid free
surface length. The hydrodynamic coefficients, on the other hand, tend to peak in the vicinity of
50 to 60% fill ratio, which suggests higher slosh force in this fill range. These also suggest
substantially lower slosh under higher fill ratios.
The validity of the linear slosh model is further examined by comparing the resultant slosh
force with that obtained from a computational fluid dynamic (CFD) model in the Fluent platform
of the tank, as reported in [84]. Both the linear and nonlinear analyses are performed for the tank
filled with water (𝜌=998.2 kg/m3 and kinematic viscosity 𝜈𝑠 = 1.0048 × 10⁻⁶ m2/s) with fill ratio,
H/2R=0.5. The nonlinear simulations are performed for lateral acceleration excitations of three
different constant magnitudes (1, 2 and 3 m/s2). Figure 4.5(c) compares the resulting slosh force
responses, normalized with respect to the inertial force of an equivalent rigid cargo 𝐹𝑦 (𝑚��)⁄ , with
that obtained from the linear slosh model. The linear slosh response is obtained from summation
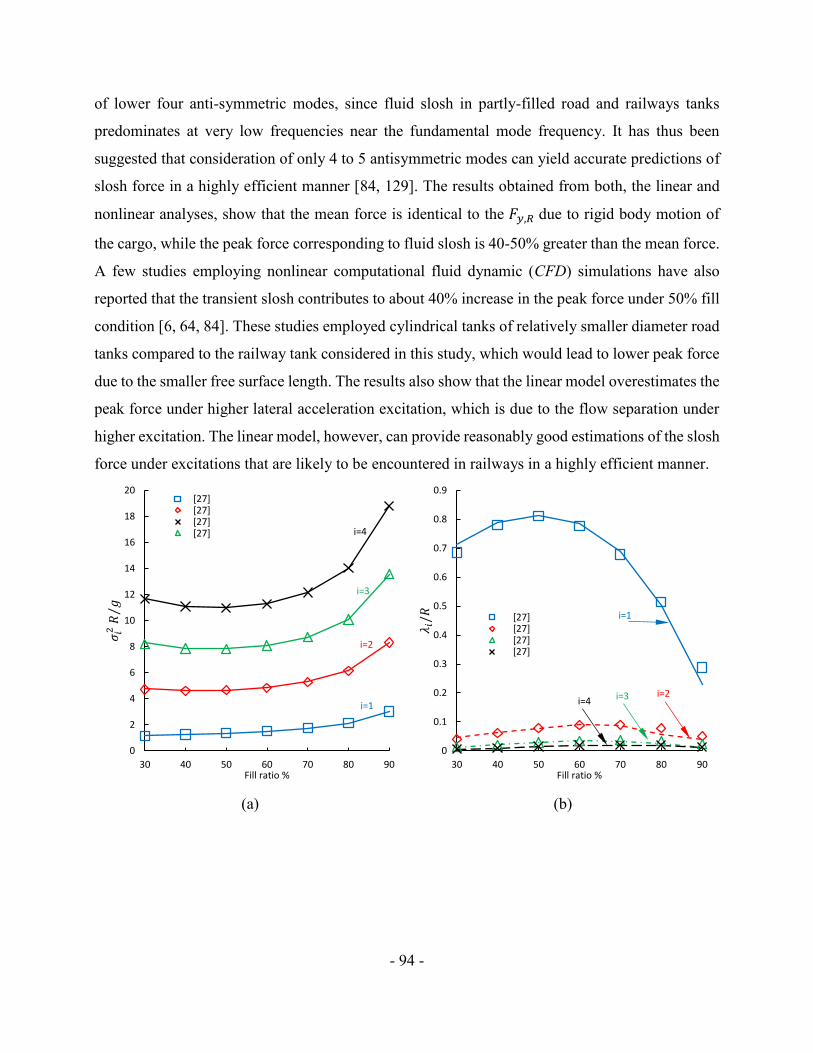
- 94 -
of lower four anti-symmetric modes, since fluid slosh in partly-filled road and railways tanks
predominates at very low frequencies near the fundamental mode frequency. It has thus been
suggested that consideration of only 4 to 5 antisymmetric modes can yield accurate predictions of
slosh force in a highly efficient manner [84, 129]. The results obtained from both, the linear and
nonlinear analyses, show that the mean force is identical to the 𝐹𝑦,𝑅 due to rigid body motion of
the cargo, while the peak force corresponding to fluid slosh is 40-50% greater than the mean force.
A few studies employing nonlinear computational fluid dynamic (CFD) simulations have also
reported that the transient slosh contributes to about 40% increase in the peak force under 50% fill
condition [6, 64, 84]. These studies employed cylindrical tanks of relatively smaller diameter road
tanks compared to the railway tank considered in this study, which would lead to lower peak force
due to the smaller free surface length. The results also show that the linear model overestimates the
peak force under higher lateral acceleration excitation, which is due to the flow separation under
higher excitation. The linear model, however, can provide reasonably good estimations of the slosh
force under excitations that are likely to be encountered in railways in a highly efficient manner.
(a) (b)
0
2
4
6
8
10
12
14
16
18
20
30 40 50 60 70 80 90Fill ratio %
[27][27][27][27]
⁄𝜎𝑖2𝑅𝑔
i=1
i=2
i=3
i=4
0
0.1
0.2
0.3
0.4
0.5
0.6
0.7
0.8
0.9
30 40 50 60 70 80 90Fill ratio %
[27][27][27][27]
𝜆𝑖/𝑅 i=1
i=2i=3i=4
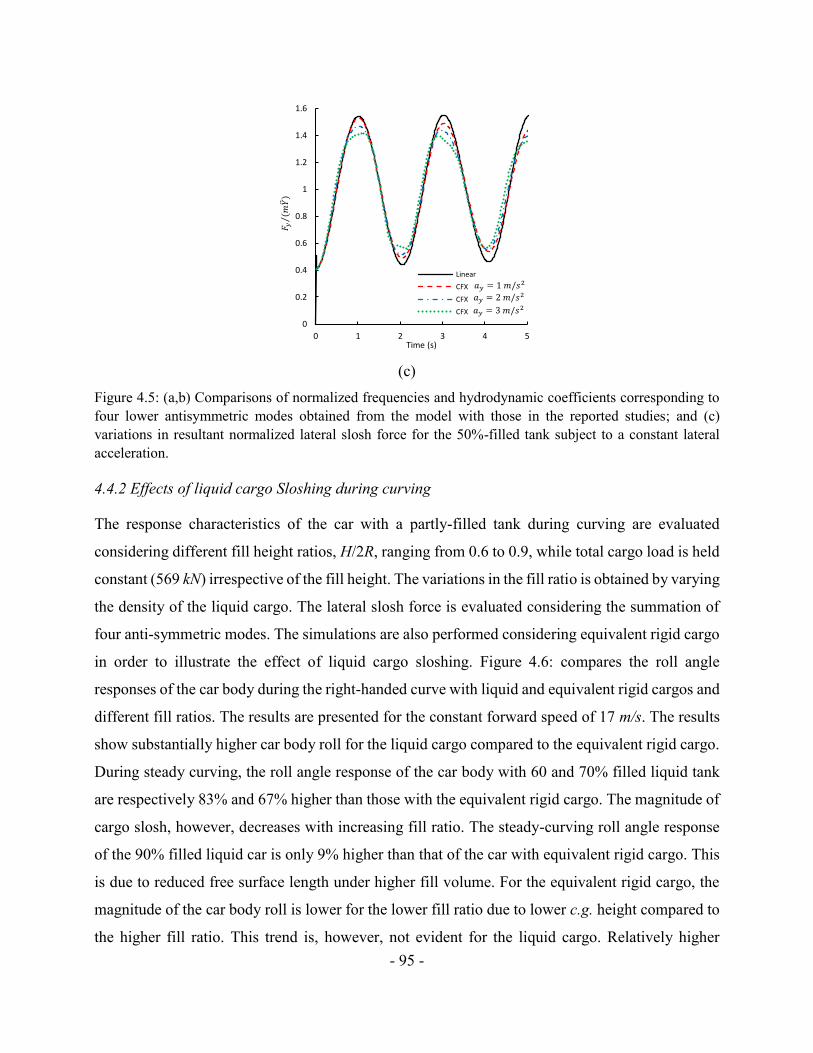
- 95 -
(c)
Figure 4.5: (a,b) Comparisons of normalized frequencies and hydrodynamic coefficients corresponding to
four lower antisymmetric modes obtained from the model with those in the reported studies; and (c)
variations in resultant normalized lateral slosh force for the 50%-filled tank subject to a constant lateral
acceleration.
4.4.2 Effects of liquid cargo Sloshing during curving
The response characteristics of the car with a partly-filled tank during curving are evaluated
considering different fill height ratios, H/2R, ranging from 0.6 to 0.9, while total cargo load is held
constant (569 kN) irrespective of the fill height. The variations in the fill ratio is obtained by varying
the density of the liquid cargo. The lateral slosh force is evaluated considering the summation of
four anti-symmetric modes. The simulations are also performed considering equivalent rigid cargo
in order to illustrate the effect of liquid cargo sloshing. Figure 4.6: compares the roll angle
responses of the car body during the right-handed curve with liquid and equivalent rigid cargos and
different fill ratios. The results are presented for the constant forward speed of 17 m/s. The results
show substantially higher car body roll for the liquid cargo compared to the equivalent rigid cargo.
During steady curving, the roll angle response of the car body with 60 and 70% filled liquid tank
are respectively 83% and 67% higher than those with the equivalent rigid cargo. The magnitude of
cargo slosh, however, decreases with increasing fill ratio. The steady-curving roll angle response
of the 90% filled liquid car is only 9% higher than that of the car with equivalent rigid cargo. This
is due to reduced free surface length under higher fill volume. For the equivalent rigid cargo, the
magnitude of the car body roll is lower for the lower fill ratio due to lower c.g. height compared to
the higher fill ratio. This trend is, however, not evident for the liquid cargo. Relatively higher
0
0.2
0.4
0.6
0.8
1
1.2
1.4
1.6
0 1 2 3 4 5Time (s)
Linear
CFX
CFX
CFX
𝑎𝑦 = 1𝑚/𝑠2
𝑎𝑦 = 2𝑚/𝑠2
𝑎𝑦 = 3𝑚/𝑠2
⁄𝐹 𝑦(𝑚𝑌)
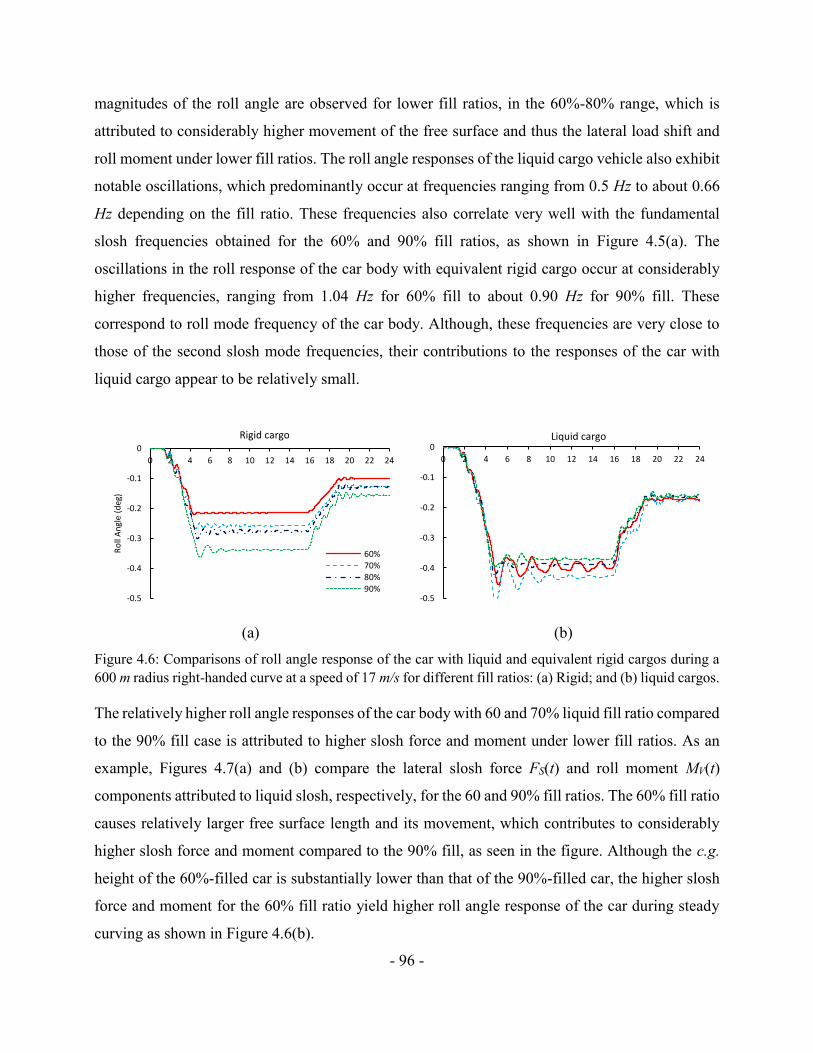
- 96 -
magnitudes of the roll angle are observed for lower fill ratios, in the 60%-80% range, which is
attributed to considerably higher movement of the free surface and thus the lateral load shift and
roll moment under lower fill ratios. The roll angle responses of the liquid cargo vehicle also exhibit
notable oscillations, which predominantly occur at frequencies ranging from 0.5 Hz to about 0.66
Hz depending on the fill ratio. These frequencies also correlate very well with the fundamental
slosh frequencies obtained for the 60% and 90% fill ratios, as shown in Figure 4.5(a). The
oscillations in the roll response of the car body with equivalent rigid cargo occur at considerably
higher frequencies, ranging from 1.04 Hz for 60% fill to about 0.90 Hz for 90% fill. These
correspond to roll mode frequency of the car body. Although, these frequencies are very close to
those of the second slosh mode frequencies, their contributions to the responses of the car with
liquid cargo appear to be relatively small.
(a) (b)
Figure 4.6: Comparisons of roll angle response of the car with liquid and equivalent rigid cargos during a
600 m radius right-handed curve at a speed of 17 m/s for different fill ratios: (a) Rigid; and (b) liquid cargos.
The relatively higher roll angle responses of the car body with 60 and 70% liquid fill ratio compared
to the 90% fill case is attributed to higher slosh force and moment under lower fill ratios. As an
example, Figures 4.7(a) and (b) compare the lateral slosh force FS(t) and roll moment MV(t)
components attributed to liquid slosh, respectively, for the 60 and 90% fill ratios. The 60% fill ratio
causes relatively larger free surface length and its movement, which contributes to considerably
higher slosh force and moment compared to the 90% fill, as seen in the figure. Although the c.g.
height of the 60%-filled car is substantially lower than that of the 90%-filled car, the higher slosh
force and moment for the 60% fill ratio yield higher roll angle response of the car during steady
curving as shown in Figure 4.6(b).
-0.5
-0.4
-0.3
-0.2
-0.1
0
0 2 4 6 8 10 12 14 16 18 20 22 24
Ro
ll A
ngl
e (d
eg)
Rigid cargo
60%
70%
80%
90%-0.5
-0.4
-0.3
-0.2
-0.1
0
0 2 4 6 8 10 12 14 16 18 20 22 24
Liquid cargo
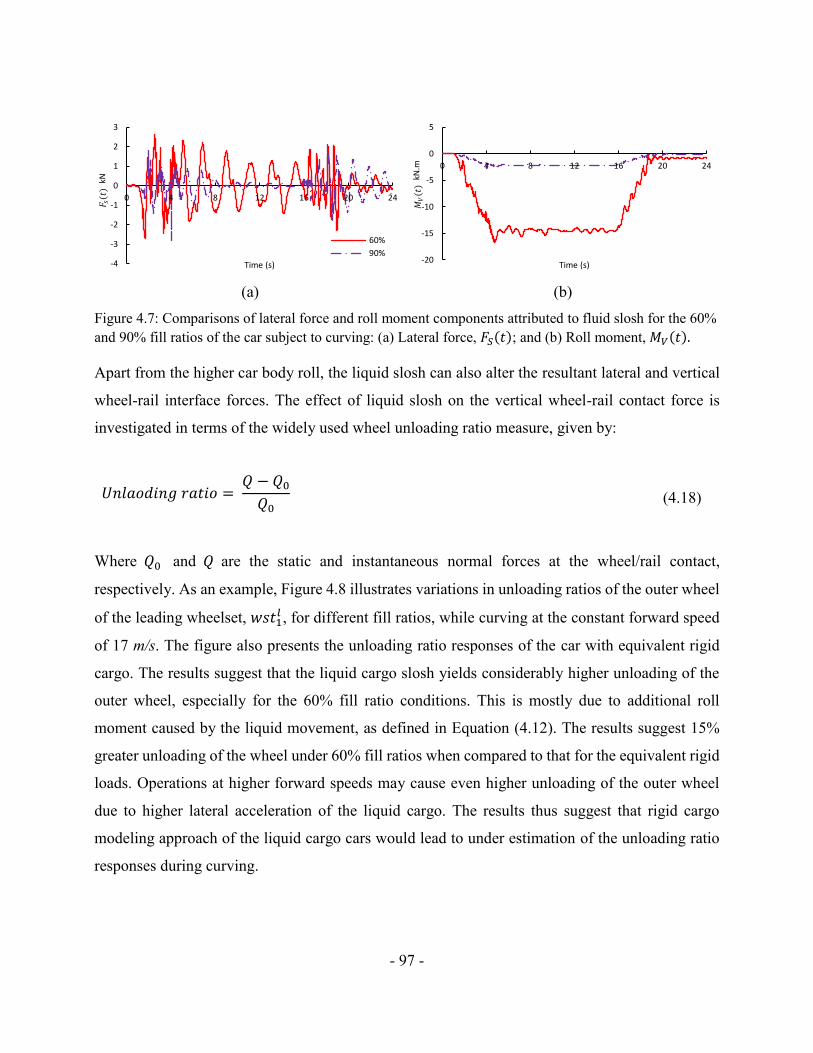
- 97 -
(a) (b)
Figure 4.7: Comparisons of lateral force and roll moment components attributed to fluid slosh for the 60%
and 90% fill ratios of the car subject to curving: (a) Lateral force, 𝐹𝑆(𝑡); and (b) Roll moment, 𝑀𝑉(𝑡).
Apart from the higher car body roll, the liquid slosh can also alter the resultant lateral and vertical
wheel-rail interface forces. The effect of liquid slosh on the vertical wheel-rail contact force is
investigated in terms of the widely used wheel unloading ratio measure, given by:
𝑈𝑛𝑙𝑎𝑜𝑑𝑖𝑛𝑔 𝑟𝑎𝑡𝑖𝑜 = 𝑄 − 𝑄0𝑄0
(4.18)
Where 𝑄0 and 𝑄 are the static and instantaneous normal forces at the wheel/rail contact,
respectively. As an example, Figure 4.8 illustrates variations in unloading ratios of the outer wheel
of the leading wheelset, 𝑤𝑠𝑡1𝑙 , for different fill ratios, while curving at the constant forward speed
of 17 m/s. The figure also presents the unloading ratio responses of the car with equivalent rigid
cargo. The results suggest that the liquid cargo slosh yields considerably higher unloading of the
outer wheel, especially for the 60% fill ratio conditions. This is mostly due to additional roll
moment caused by the liquid movement, as defined in Equation (4.12). The results suggest 15%
greater unloading of the wheel under 60% fill ratios when compared to that for the equivalent rigid
loads. Operations at higher forward speeds may cause even higher unloading of the outer wheel
due to higher lateral acceleration of the liquid cargo. The results thus suggest that rigid cargo
modeling approach of the liquid cargo cars would lead to under estimation of the unloading ratio
responses during curving.
-4
-3
-2
-1
0
1
2
3
0 4 8 12 16 20 24
kN
Time (s)
60%
90%
𝐹 𝑠(𝑡)
-20
-15
-10
-5
0
5
0 4 8 12 16 20 24
kN.m
Time (s)
𝑀𝑉(𝑡)
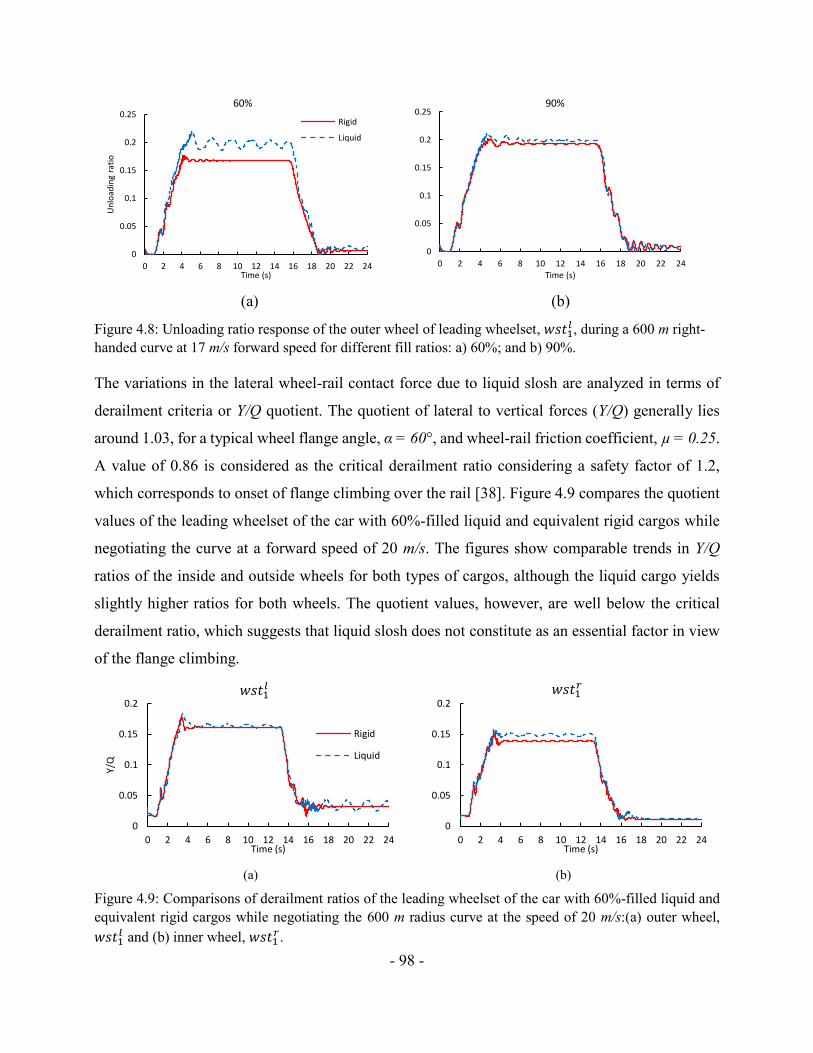
- 98 -
(a) (b)
Figure 4.8: Unloading ratio response of the outer wheel of leading wheelset, 𝑤𝑠𝑡1𝑙 , during a 600 m right-
handed curve at 17 m/s forward speed for different fill ratios: a) 60%; and b) 90%.
The variations in the lateral wheel-rail contact force due to liquid slosh are analyzed in terms of
derailment criteria or Y/Q quotient. The quotient of lateral to vertical forces (Y/Q) generally lies
around 1.03, for a typical wheel flange angle, α = 60°, and wheel-rail friction coefficient, µ = 0.25.
A value of 0.86 is considered as the critical derailment ratio considering a safety factor of 1.2,
which corresponds to onset of flange climbing over the rail [38]. Figure 4.9 compares the quotient
values of the leading wheelset of the car with 60%-filled liquid and equivalent rigid cargos while
negotiating the curve at a forward speed of 20 m/s. The figures show comparable trends in Y/Q
ratios of the inside and outside wheels for both types of cargos, although the liquid cargo yields
slightly higher ratios for both wheels. The quotient values, however, are well below the critical
derailment ratio, which suggests that liquid slosh does not constitute as an essential factor in view
of the flange climbing.
(a) (b)
Figure 4.9: Comparisons of derailment ratios of the leading wheelset of the car with 60%-filled liquid and
equivalent rigid cargos while negotiating the 600 m radius curve at the speed of 20 m/s:(a) outer wheel,
𝑤𝑠𝑡1𝑙 and (b) inner wheel, 𝑤𝑠𝑡1
𝑟.
0
0.05
0.1
0.15
0.2
0.25
0 2 4 6 8 10 12 14 16 18 20 22 24
Un
load
ing
rati
o
Time (s)
60%
Rigid
Liquid
0
0.05
0.1
0.15
0.2
0.25
0 2 4 6 8 10 12 14 16 18 20 22 24
Time (s)
90%
0
0.05
0.1
0.15
0.2
0 2 4 6 8 10 12 14 16 18 20 22 24
Y/Q
Time (s)
Rigid
Liquid
𝑤𝑠𝑡1𝑙
0
0.05
0.1
0.15
0.2
0 2 4 6 8 10 12 14 16 18 20 22 24Time (s)
𝑤𝑠𝑡1𝑟
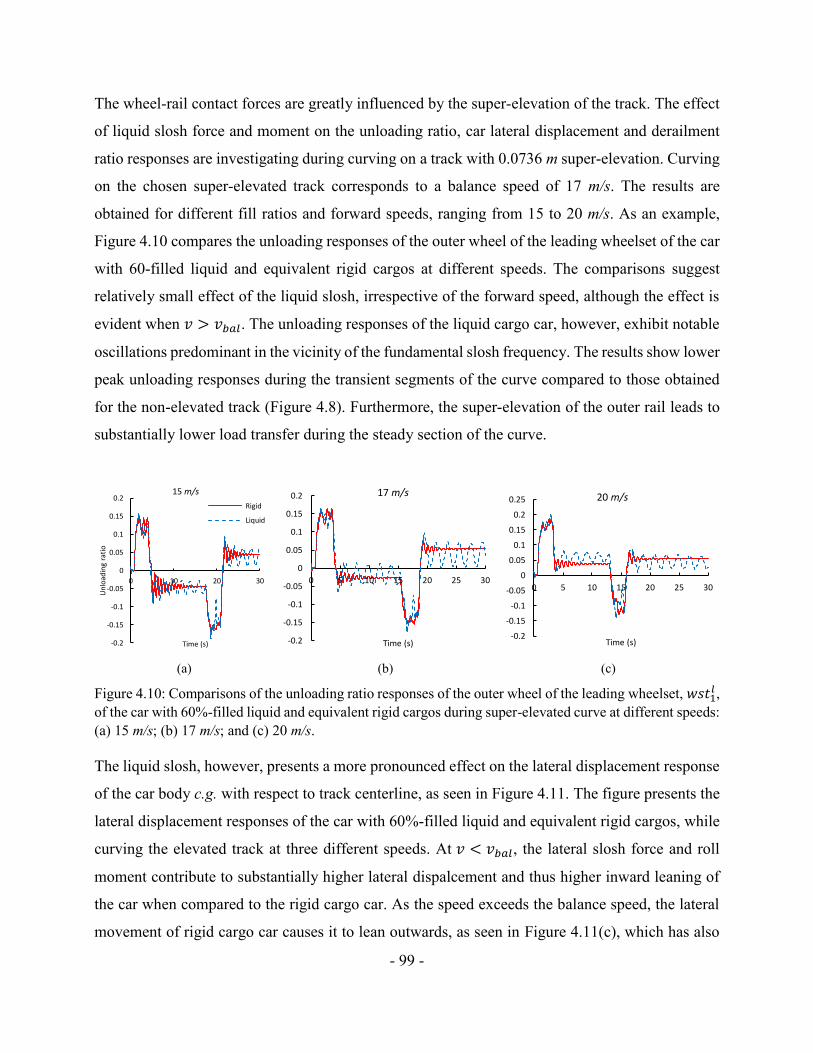
- 99 -
The wheel-rail contact forces are greatly influenced by the super-elevation of the track. The effect
of liquid slosh force and moment on the unloading ratio, car lateral displacement and derailment
ratio responses are investigating during curving on a track with 0.0736 m super-elevation. Curving
on the chosen super-elevated track corresponds to a balance speed of 17 m/s. The results are
obtained for different fill ratios and forward speeds, ranging from 15 to 20 m/s. As an example,
Figure 4.10 compares the unloading responses of the outer wheel of the leading wheelset of the car
with 60-filled liquid and equivalent rigid cargos at different speeds. The comparisons suggest
relatively small effect of the liquid slosh, irrespective of the forward speed, although the effect is
evident when 𝑣 > 𝑣𝑏𝑎𝑙. The unloading responses of the liquid cargo car, however, exhibit notable
oscillations predominant in the vicinity of the fundamental slosh frequency. The results show lower
peak unloading responses during the transient segments of the curve compared to those obtained
for the non-elevated track (Figure 4.8). Furthermore, the super-elevation of the outer rail leads to
substantially lower load transfer during the steady section of the curve.
(a) (b) (c)
Figure 4.10: Comparisons of the unloading ratio responses of the outer wheel of the leading wheelset, 𝑤𝑠𝑡1𝑙 ,
of the car with 60%-filled liquid and equivalent rigid cargos during super-elevated curve at different speeds:
(a) 15 m/s; (b) 17 m/s; and (c) 20 m/s.
The liquid slosh, however, presents a more pronounced effect on the lateral displacement response
of the car body c.g. with respect to track centerline, as seen in Figure 4.11. The figure presents the
lateral displacement responses of the car with 60%-filled liquid and equivalent rigid cargos, while
curving the elevated track at three different speeds. At 𝑣 < 𝑣𝑏𝑎𝑙, the lateral slosh force and roll
moment contribute to substantially higher lateral dispalcement and thus higher inward leaning of
the car when compared to the rigid cargo car. As the speed exceeds the balance speed, the lateral
movement of rigid cargo car causes it to lean outwards, as seen in Figure 4.11(c), which has also
-0.2
-0.15
-0.1
-0.05
0
0.05
0.1
0.15
0.2
0 10 20 30
Un
load
ing
rati
o
Time (s)
15 m/s
Rigid
Liquid
-0.2
-0.15
-0.1
-0.05
0
0.05
0.1
0.15
0.2
0 5 10 15 20 25 30
Time (s)
17 m/s
-0.2
-0.15
-0.1
-0.05
0
0.05
0.1
0.15
0.2
0.25
0 5 10 15 20 25 30
Time (s)
20 m/s
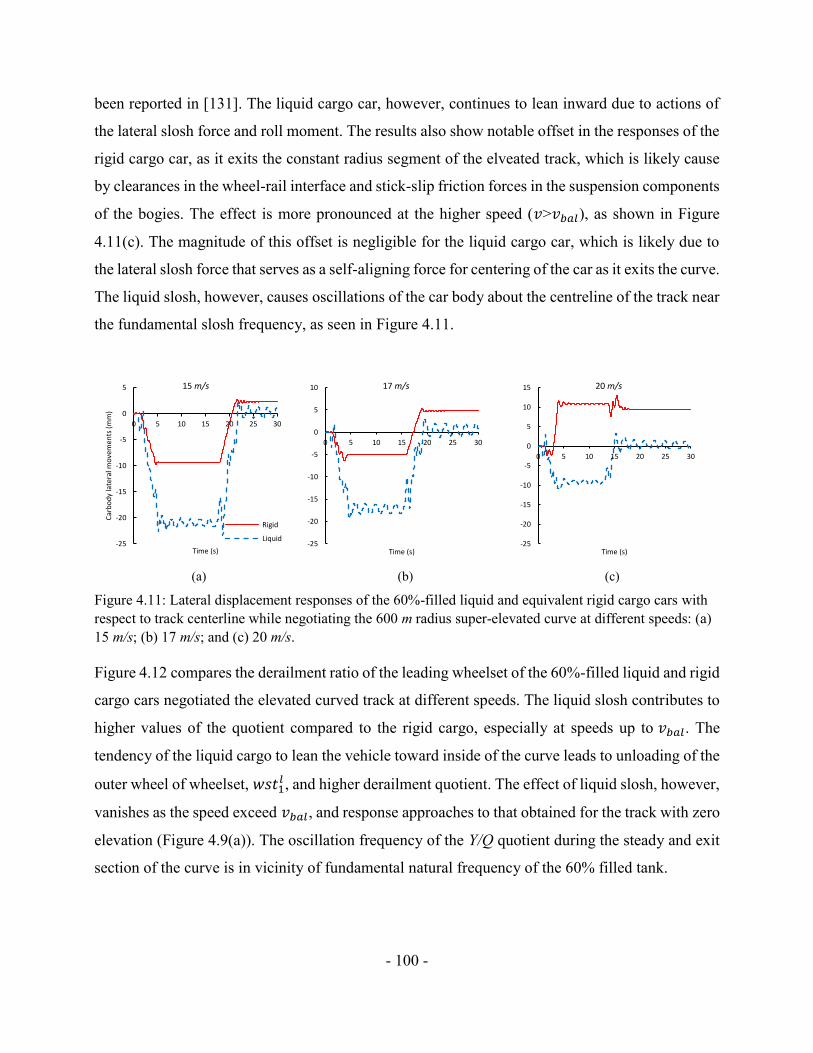
- 100 -
been reported in [131]. The liquid cargo car, however, continues to lean inward due to actions of
the lateral slosh force and roll moment. The results also show notable offset in the responses of the
rigid cargo car, as it exits the constant radius segment of the elveated track, which is likely cause
by clearances in the wheel-rail interface and stick-slip friction forces in the suspension components
of the bogies. The effect is more pronounced at the higher speed (𝑣>𝑣𝑏𝑎𝑙), as shown in Figure
4.11(c). The magnitude of this offset is negligible for the liquid cargo car, which is likely due to
the lateral slosh force that serves as a self-aligning force for centering of the car as it exits the curve.
The liquid slosh, however, causes oscillations of the car body about the centreline of the track near
the fundamental slosh frequency, as seen in Figure 4.11.
(a) (b) (c)
Figure 4.11: Lateral displacement responses of the 60%-filled liquid and equivalent rigid cargo cars with
respect to track centerline while negotiating the 600 m radius super-elevated curve at different speeds: (a)
15 m/s; (b) 17 m/s; and (c) 20 m/s.
Figure 4.12 compares the derailment ratio of the leading wheelset of the 60%-filled liquid and rigid
cargo cars negotiated the elevated curved track at different speeds. The liquid slosh contributes to
higher values of the quotient compared to the rigid cargo, especially at speeds up to 𝑣𝑏𝑎𝑙. The
tendency of the liquid cargo to lean the vehicle toward inside of the curve leads to unloading of the
outer wheel of wheelset, 𝑤𝑠𝑡1𝑙 , and higher derailment quotient. The effect of liquid slosh, however,
vanishes as the speed exceed 𝑣𝑏𝑎𝑙, and response approaches to that obtained for the track with zero
elevation (Figure 4.9(a)). The oscillation frequency of the Y/Q quotient during the steady and exit
section of the curve is in vicinity of fundamental natural frequency of the 60% filled tank.
-25
-20
-15
-10
-5
0
5
0 5 10 15 20 25 30
Car
bo
dy
late
ral m
ove
me
nts
(m
m)
Time (s)
15 m/s
Rigid
Liquid-25
-20
-15
-10
-5
0
5
10
0 5 10 15 20 25 30
Time (s)
17 m/s
-25
-20
-15
-10
-5
0
5
10
15
0 5 10 15 20 25 30
Time (s)
20 m/s
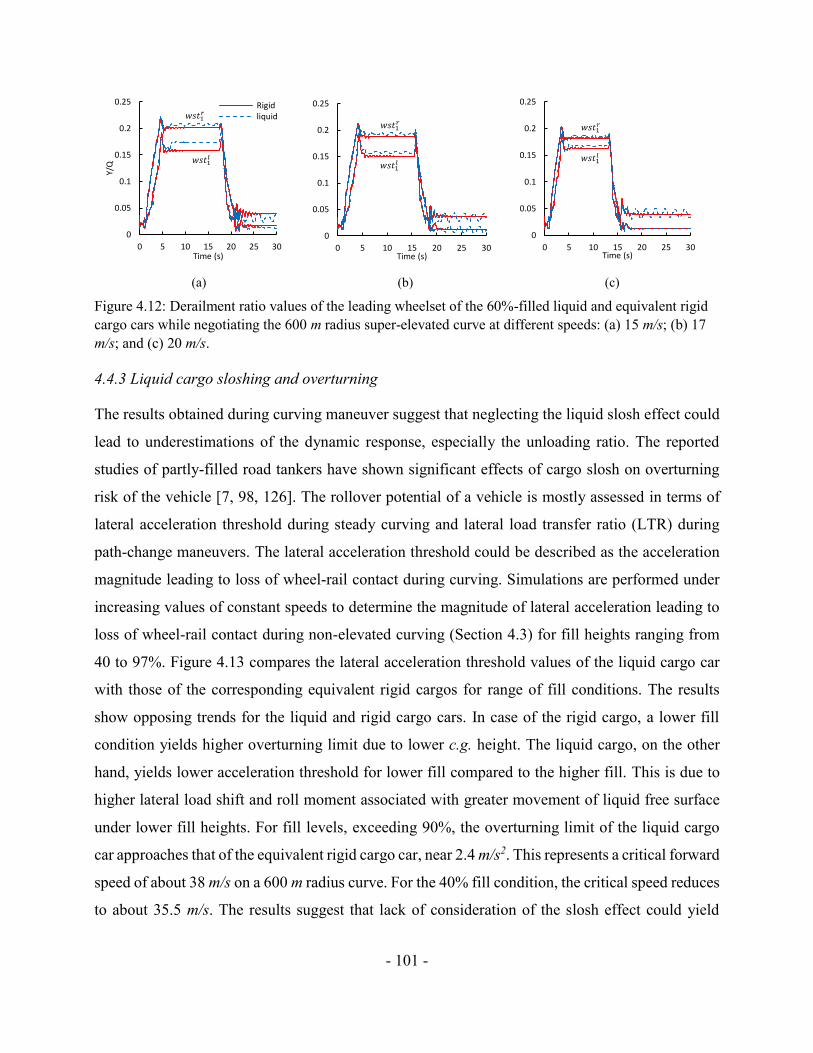
- 101 -
(a) (b) (c)
Figure 4.12: Derailment ratio values of the leading wheelset of the 60%-filled liquid and equivalent rigid
cargo cars while negotiating the 600 m radius super-elevated curve at different speeds: (a) 15 m/s; (b) 17
m/s; and (c) 20 m/s.
4.4.3 Liquid cargo sloshing and overturning
The results obtained during curving maneuver suggest that neglecting the liquid slosh effect could
lead to underestimations of the dynamic response, especially the unloading ratio. The reported
studies of partly-filled road tankers have shown significant effects of cargo slosh on overturning
risk of the vehicle [7, 98, 126]. The rollover potential of a vehicle is mostly assessed in terms of
lateral acceleration threshold during steady curving and lateral load transfer ratio (LTR) during
path-change maneuvers. The lateral acceleration threshold could be described as the acceleration
magnitude leading to loss of wheel-rail contact during curving. Simulations are performed under
increasing values of constant speeds to determine the magnitude of lateral acceleration leading to
loss of wheel-rail contact during non-elevated curving (Section 4.3) for fill heights ranging from
40 to 97%. Figure 4.13 compares the lateral acceleration threshold values of the liquid cargo car
with those of the corresponding equivalent rigid cargos for range of fill conditions. The results
show opposing trends for the liquid and rigid cargo cars. In case of the rigid cargo, a lower fill
condition yields higher overturning limit due to lower c.g. height. The liquid cargo, on the other
hand, yields lower acceleration threshold for lower fill compared to the higher fill. This is due to
higher lateral load shift and roll moment associated with greater movement of liquid free surface
under lower fill heights. For fill levels, exceeding 90%, the overturning limit of the liquid cargo
car approaches that of the equivalent rigid cargo car, near 2.4 m/s2. This represents a critical forward
speed of about 38 m/s on a 600 m radius curve. For the 40% fill condition, the critical speed reduces
to about 35.5 m/s. The results suggest that lack of consideration of the slosh effect could yield
0
0.05
0.1
0.15
0.2
0.25
0 5 10 15 20 25 30
Y/Q
Time (s)
Rigidliquid
𝑤𝑠𝑡1𝑙
𝑤𝑠𝑡1𝑟
0
0.05
0.1
0.15
0.2
0.25
0 5 10 15 20 25 30Time (s)
𝑤𝑠𝑡1𝑙
𝑤𝑠𝑡1𝑟
0
0.05
0.1
0.15
0.2
0.25
0 5 10 15 20 25 30Time (s)
𝑤𝑠𝑡1𝑟
𝑤𝑠𝑡1𝑙
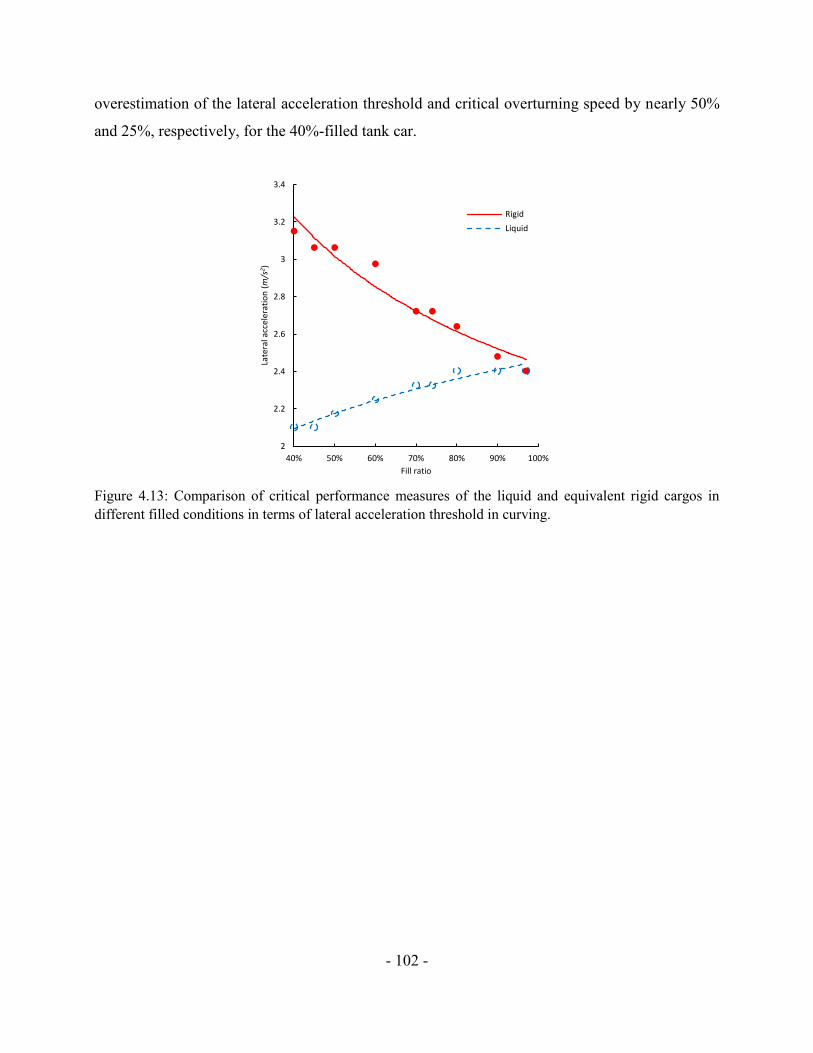
- 102 -
overestimation of the lateral acceleration threshold and critical overturning speed by nearly 50%
and 25%, respectively, for the 40%-filled tank car.
Figure 4.13: Comparison of critical performance measures of the liquid and equivalent rigid cargos in
different filled conditions in terms of lateral acceleration threshold in curving.
2
2.2
2.4
2.6
2.8
3
3.2
3.4
40% 50% 60% 70% 80% 90% 100%
Late
ral a
ccel
erat
ion
(m/s
2)
Fill ratio
Rigid
Liquid
Rigid
Liquid
- 103 -
4.5 Conclusions
A comprehensive coupled fluid-railway car model is developed to investigate the effects of fluid
slosh in partially filled tank during different curve passing manoeuvres. The Freight tanker car with
two three-piece bogie is modelled as multibody dynamic system with 114 DoF. The characteristics
of freight car suspension and connections between car body and bogie is developed with careful
attention to detail including multi-directional spring forces, contacts between suspension wedge
and bogie frames, and side bearing contacts. Linear fluid slosh model with four anti-symmetric
natural mode shapes of a partially filled tanker is shown to be adequate for fill levels in the range
of 40 to 97%. The coupled dynamic model is realized by co-simulation of the linear slosh model
and the multi-body tank car model. The approach is found to be adequate and highly computing
efficient. The slosh model can be extended to other tank configurations with and without baffles,
and without imposing high computational demand such as in the case of CFD models. The results
from the present investigation reveal that for a curving manoeuvre, the fluid slosh effect of 60 to
70% fill level can lead to car roll angles that are more than twice that of equivalent rigid cargo. The
comparison of derailment quotient (Y/Q ratio) consistently show slightly higher value due to fluid
slosh during curving. The magnitude is however significantly lower than critical for the curving
maneuver considered. Liquid slosh dynamics is essential to predict the limit as they are
significantly lower when compared with those of rigid cargo simulations. It should be pointed out
that the present investigation considers the track to be free of any defects or unevenness. In the
presence of track disturbance, the response to a maneuver can be further deteriorated due to fluid
slosh and may be of interest in further studies. The proposed liquid slosh model could also be used
for more computational demanding analyses like wheel-rail wear or rolling contact fatigue test.
- 104 -
CHAPTER 5
Investigation of coupled railway tank car dynamics and liquid cargo response subject to
switch passing maneuver
5.1 Introduction
Transportation of crude oil and other hazardous materials (HAZMAT) via rail and road modes
constitutes important economic and employment factors in North America. Although the bulk of
crude oil is transported via pipelines, the transportation by the railways has been increasing since
2009, which peaked in 2013 to about 16 000 carloads in Canada and over 400 000 in the United
States [132]. The unpressurized US DOT-111 (CTC-111 A in Canada) tank cars accounted a major
number of the tank cars used in North America. The circular cross-section tanks employed in these
cars are designed with a minimum shell thickness of 11.1 mm and maximum capacity of up to
130 000 liters [133, 134]. Such tanks are prone to rupture in the event of an accident, which may
cause catastrophic damages to the environment and property in commerce apart from human
fatalities. Following the Lac-Megantic accident [135], railway authorities have defined alternate
new regulations, namely TP14877 [136-138], to enhance operational safety performance of tank
cars. The standard proposed design modifications for DOT-111 tanks and new tank design, denoted
as TC-117 for transportation of flammable cargo, which requires minimum shell thickness of 14.3
mm together with electronically controlled pneumatic (ECP) brakes to limit the longitudinal forces
developed during braking [138].
Despite the extensive interest in structural aspects of tank car, limited studies are reported on
effects of liquid cargo movements on dynamics of railway vehicles. The partially filled conditions
in the transportation of railway tank cars could be observed due to variations in density of different
liquid products or limitation of the maximum load of specific tracks. The additional force and
moments of liquid cargo due to directional accelerations of tank car could change the dynamic
response of the vehicle in different maneuvers. The movements of liquid cargo in its container,
known as sloshing, has been the subject of a number of extensive studies in road [e.g., 99],
aerospace [e.g., 65], and marine [e.g., 126] transport systems. Deferent methods for liquid cargo
slosh analysis could be summarized as simple quasi-static liquid motion [7], mechanical analogs
of the moving cargo [87], and linear and nonlinear fluid slosh methods [64, 84]. Some of these
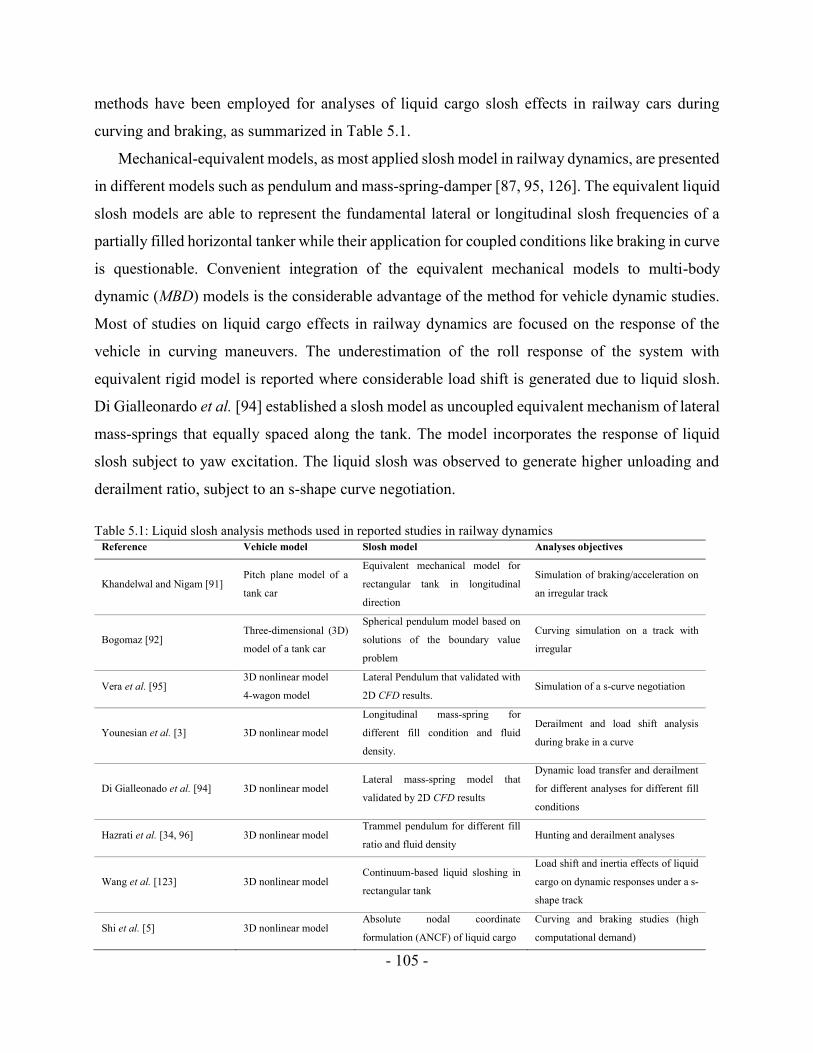
- 105 -
methods have been employed for analyses of liquid cargo slosh effects in railway cars during
curving and braking, as summarized in Table 5.1.
Mechanical-equivalent models, as most applied slosh model in railway dynamics, are presented
in different models such as pendulum and mass-spring-damper [87, 95, 126]. The equivalent liquid
slosh models are able to represent the fundamental lateral or longitudinal slosh frequencies of a
partially filled horizontal tanker while their application for coupled conditions like braking in curve
is questionable. Convenient integration of the equivalent mechanical models to multi-body
dynamic (MBD) models is the considerable advantage of the method for vehicle dynamic studies.
Most of studies on liquid cargo effects in railway dynamics are focused on the response of the
vehicle in curving maneuvers. The underestimation of the roll response of the system with
equivalent rigid model is reported where considerable load shift is generated due to liquid slosh.
Di Gialleonardo et al. [94] established a slosh model as uncoupled equivalent mechanism of lateral
mass-springs that equally spaced along the tank. The model incorporates the response of liquid
slosh subject to yaw excitation. The liquid slosh was observed to generate higher unloading and
derailment ratio, subject to an s-shape curve negotiation.
Table 5.1: Liquid slosh analysis methods used in reported studies in railway dynamics
Reference Vehicle model Slosh model Analyses objectives
Khandelwal and Nigam [91] Pitch plane model of a
tank car
Equivalent mechanical model for
rectangular tank in longitudinal
direction
Simulation of braking/acceleration on
an irregular track
Bogomaz [92] Three-dimensional (3D)
model of a tank car
Spherical pendulum model based on
solutions of the boundary value
problem
Curving simulation on a track with
irregular
Vera et al. [95] 3D nonlinear model
4-wagon model
Lateral Pendulum that validated with
2D CFD results. Simulation of a s-curve negotiation
Younesian et al. [3] 3D nonlinear model
Longitudinal mass-spring for
different fill condition and fluid
density.
Derailment and load shift analysis
during brake in a curve
Di Gialleonado et al. [94] 3D nonlinear model Lateral mass-spring model that
validated by 2D CFD results
Dynamic load transfer and derailment
for different analyses for different fill
conditions
Hazrati et al. [34, 96] 3D nonlinear model Trammel pendulum for different fill
ratio and fluid density Hunting and derailment analyses
Wang et al. [123] 3D nonlinear model Continuum-based liquid sloshing in
rectangular tank
Load shift and inertia effects of liquid
cargo on dynamic responses under a s-
shape track
Shi et al. [5] 3D nonlinear model Absolute nodal coordinate
formulation (ANCF) of liquid cargo
Curving and braking studies (high
computational demand)
- 106 -
Reported studies on curving or braking analyses of railway tank cars have mostly employed
mechanical-equivalent models of fluid slosh such as pendulum and mass-spring-damper models,
generally identified through linear slosh analyses [87, 95, 126]. Such equivalent slosh models are
limited to one-dimensional slosh corresponding to fundamental mode frequencies of a partially
filled horizontal tanker in the lateral or longitudinal direction, while their applications under
multiple axis excitations encountered during braking and curving are questionable. The mechanical
equivalent models of slosh, however, can be conveniently integrated to multi-body dynamic (MBD)
models of the vehicle, which permit analysis of the coupled cargo-vehicle system in a
computationally efficient manner. Most of the studies on liquid cargo effects in railway dynamics
are focused on the response of the vehicle during curving maneuvers. These have shown
considerable load shifts due to liquid slosh [96, 131]. It has been reported that equivalent
mechanical slosh models underestimate the roll response of the vehicle [5]. Di Gialleonardo et al.
[94] employed multiple equally spaced but uncoupled lateral mass-spring models to study fluid
slosh along the tank length under a yaw excitation. The liquid slosh was observed to generate higher
unloading and derailment ratio of the tank car during an s-shape curve negotiation.
As an alternative to the equivalent mechanical analogous of liquid movement, computational
fluid dynamic (CFD) methods have been widely used for analysis of transient liquid slosh, although
a number of these focus on non-circular cross-section and baffled tanks [63, 65, 139]. A number
of studies on partly-filled road containers have employed CFD methods, which are known to
impose extensive computational demands [5, 123]. Shi et al. [5] proposed a continuum based fluid
constitutive model coupled with a fluid-tank contact algorithm. The model was used to evaluate
the tank car responses during curving and electronically-controlled pneumatic (ECP) braking tests.
The proposed method also poses considerable computational demand similar to the CFD methods.
Alternatively, linear slosh theory has been widely applied to study fluid slosh in storage tanks
and road containers in a computationally efficient manner assuming inviscid and irrotational flows
[99, 126]. Through comparisons of linear and nonlinear liquid slosh responses in a partly-filled
horizontal cylindrical container, it has been shown that the linear theory can yield accurate
predictions of the slosh forces and moments under excitations encountered during typical vehicle
maneuvers [13]. The linear theory, however, underestimates the resonant slosh, when separation
of the free surface occurs. The linear slosh theory has been applied for predicting slosh modes, and
force responses in partly-filled arbitrary cross-section tanks with and without baffles of varying
- 107 -
geometry [6, 98]. The linear slosh model can also be easily integrated to the MBD models of the
vehicle as in case of the mechanical equivalent models. Furthermore, unlike the mechanical
models, the linear slosh theory permits analyses of three-dimensional slosh encountered during
simultaneous braking and curving in a highly efficient manner [129].
As stated above, the majority of the reported studies on railway tank cars are focused on
analyses of slosh effects during curving, which generally yields relatively gradual and smooth
variations in acceleration excitation. Studies reported the influences of fluid slosh on road tankers
have shown that considerably more severe effect under transient type of excitations encountered
during path-change operations [6, 99]. The switch-passing maneuver in railway vehicles represents
a transient excitation, where the magnitude of lateral acceleration may vary rapidly [140].
Furthermore, during a switch-passing maneuver, the railway car undergoes considerable lateral
movement, which gives rise to substantial variations in the wheel-rail contact forces that have been
associated with more significant derailment potential [141, 142]. The force arising from the wheel-
rail contact, including the flange contact, during a switching maneuver constitute relatively higher-
frequency excitation for the liquid cargo. The cargo movement under the rapidly varying lateral
acceleration during switching may also contribute to variations in the wheel-rail contact forces.
Moreover, the residual free surface oscillations may serve as continued disturbances to the system
even after passing the switch. A study of liquid cargo movements caused by excitation encountered
during a switch-passing maneuver and their effects on dynamic responses of the tank car is thus
important in seeking guidance for safer operating conditions and maintenance of the switch
segments.
In this study, the liquid slosh within a partly-filled railway tank is analyzed using a linear slosh
model. A comprehensive nonlinear multi-body dynamic model of a tank car is formulated in the
Universal Mechanism (UM) software [110, 124]. The vehicle model comprises the nonlinear
damping and stiffness properties generated by friction wedges in the secondary suspension of the
bogie. The effects of liquid sloshing on the dynamic response of the vehicle in a switch-passing
maneuver are evaluated through co-simulations of the vehicle and liquid cargo models considering
different fill conditions. The response characteristics of the partly-filled tank car are compared with
those of the car with an equivalent rigid cargo in order to illustrate adverse effects of liquid cargo
slosh on the directional performance of the railway vehicle during a switch-passing maneuver. The
simulations are performed to evaluate contributions of the dynamic liquid slosh to different
- 108 -
performance indices, namely, derailment quotient, car body roll and lateral dynamic load applied
to the track. The critical speeds corresponding to wheel-rail separation during the switch-passing
maneuver are further identified as a function of the liquid cargo fill height using different slosh
models.
5.2 Model formulations
5.2.1 Multi-body dynamic model of the tank car
The multi-body dynamic (MBD) model of the railway tank car with three-piece freight bogies is
formulated in Universal Mechanism (UM) software. The model incorporates friction forces in
different suspension components of the bogie and the interface between bogie and the car body,
which resulted in a relatively complex MBD model of the car with 114 degrees of freedom (DoF).
The model has been described in details in [28]. Briefly, the vehicle model employs comprehensive
representations of the friction forces due to suspension wedges, and interactions of the car body
with the center plate and side bearings.
The friction wedges together with the secondary suspension of the bogie were modeled as
multi-directional stiffness and damping elements considering the contact forces and friction, as
shown in Figure 5.1. For this purpose, an array of point-plane contact elements were formulated to
derive frictional forces due to relative motions of the wedges with respect to the side frame and the
bolster. A methodology for identifying the model parameters has been described in [28, 35, 96].
The point-plane contact approach could efficiently estimate the resultant friction moments
developed at the center plates and side bearings under relative rotations of the contacting bodies
encountered during curving or switch-passing maneuvers. The variations in interactions between
the car body and the center plate (bogie) under varying loads could also be described accurately
using this modeling approach. The dynamic model of rail vehicle is thus considered appropriate
for simulation of dynamic respond of the vehicle subject to the disturbance of liquid slosh
movements, where instantaneous load transfer may vary performance of the bogie and suspension
system considerably.
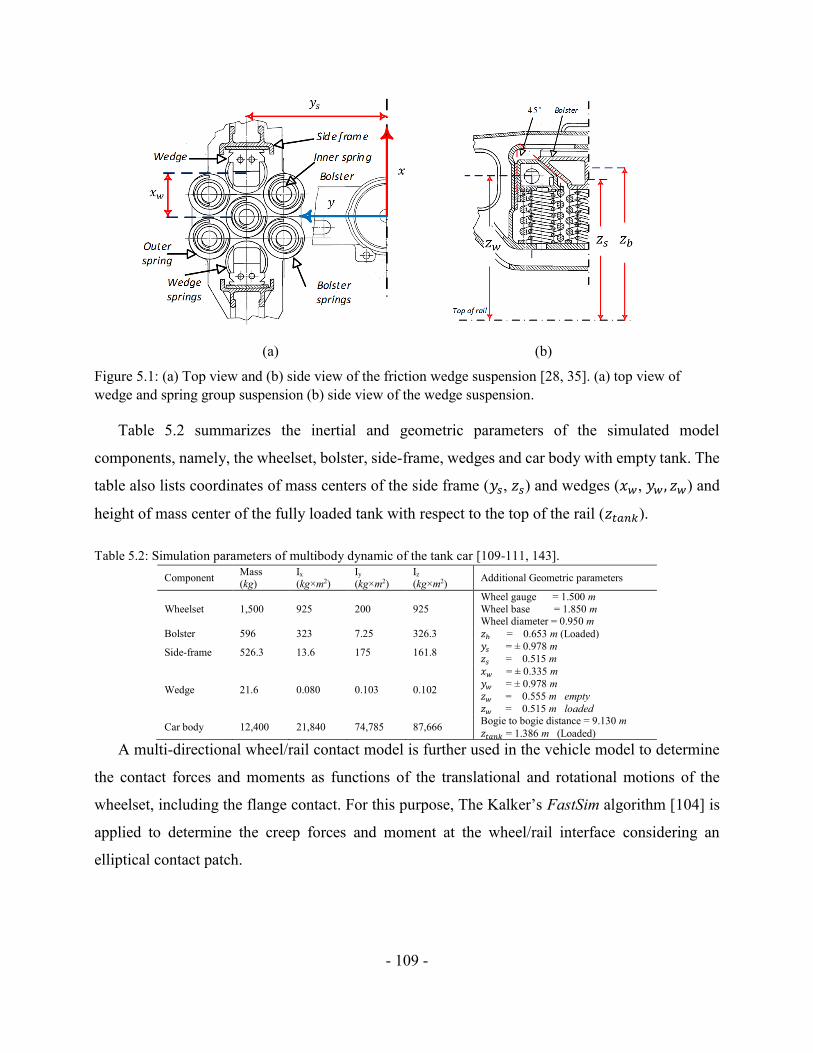
- 109 -
(a) (b)
Figure 5.1: (a) Top view and (b) side view of the friction wedge suspension [28, 35]. (a) top view of
wedge and spring group suspension (b) side view of the wedge suspension.
Table 5.2 summarizes the inertial and geometric parameters of the simulated model
components, namely, the wheelset, bolster, side-frame, wedges and car body with empty tank. The
table also lists coordinates of mass centers of the side frame (𝑦𝑠, 𝑧𝑠) and wedges (𝑥𝑤, 𝑦𝑤, 𝑧𝑤) and
height of mass center of the fully loaded tank with respect to the top of the rail (𝑧𝑡𝑎𝑛𝑘).
Table 5.2: Simulation parameters of multibody dynamic of the tank car [109-111, 143].
Component Mass (kg)
Ix (kg×m2)
Iy (kg×m2)
Iz (kg×m2)
Additional Geometric parameters
Wheelset 1,500 925 200 925
Wheel gauge = 1.500 m
Wheel base = 1.850 m Wheel diameter = 0.950 m
Bolster 596 323 7.25 326.3 𝑧𝑏 = 0.653 m (Loaded)
Side-frame 526.3 13.6 175 161.8 𝑦𝑠 = ± 0.978 m
𝑧𝑠 = 0.515 m
Wedge 21.6 0.080 0.103 0.102
𝑥𝑤 = ± 0.335 m
𝑦𝑤 = ± 0.978 m
𝑧𝑤 = 0.555 m empty
𝑧𝑤 = 0.515 m loaded
Car body 12,400 21,840 74,785 87,666 Bogie to bogie distance = 9.130 m
𝑧𝑡𝑎𝑛𝑘 = 1.386 m (Loaded)
A multi-directional wheel/rail contact model is further used in the vehicle model to determine
the contact forces and moments as functions of the translational and rotational motions of the
wheelset, including the flange contact. For this purpose, The Kalker’s FastSim algorithm [104] is
applied to determine the creep forces and moment at the wheel/rail interface considering an
elliptical contact patch.
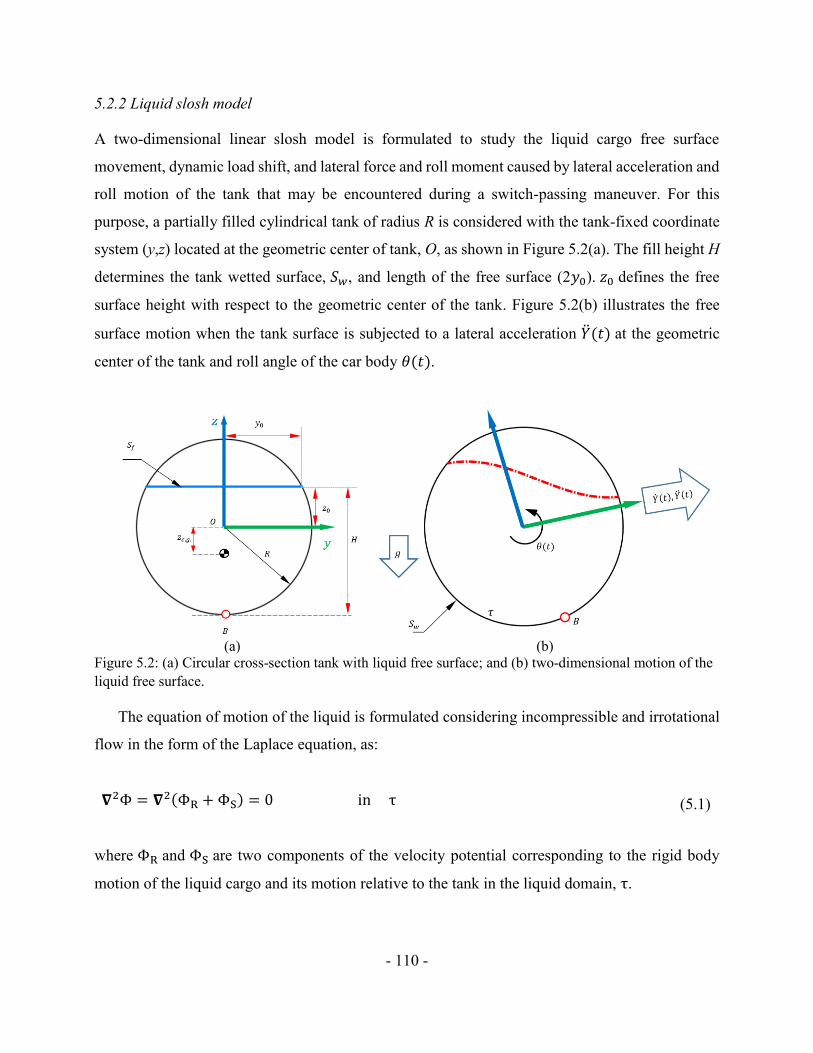
- 110 -
5.2.2 Liquid slosh model
A two-dimensional linear slosh model is formulated to study the liquid cargo free surface
movement, dynamic load shift, and lateral force and roll moment caused by lateral acceleration and
roll motion of the tank that may be encountered during a switch-passing maneuver. For this
purpose, a partially filled cylindrical tank of radius R is considered with the tank-fixed coordinate
system (y,z) located at the geometric center of tank, O, as shown in Figure 5.2(a). The fill height H
determines the tank wetted surface, 𝑆𝑤, and length of the free surface (2𝑦0). 𝑧0 defines the free
surface height with respect to the geometric center of the tank. Figure 5.2(b) illustrates the free
surface motion when the tank surface is subjected to a lateral acceleration ��(𝑡) at the geometric
center of the tank and roll angle of the car body 𝜃(𝑡).
(a) (b)
Figure 5.2: (a) Circular cross-section tank with liquid free surface; and (b) two-dimensional motion of the
liquid free surface.
The equation of motion of the liquid is formulated considering incompressible and irrotational
flow in the form of the Laplace equation, as:
𝛁2Φ = 𝛁2(ΦR +ΦS) = 0 in τ (5.1)
where ΦR and ΦS are two components of the velocity potential corresponding to the rigid body
motion of the liquid cargo and its motion relative to the tank in the liquid domain, τ.
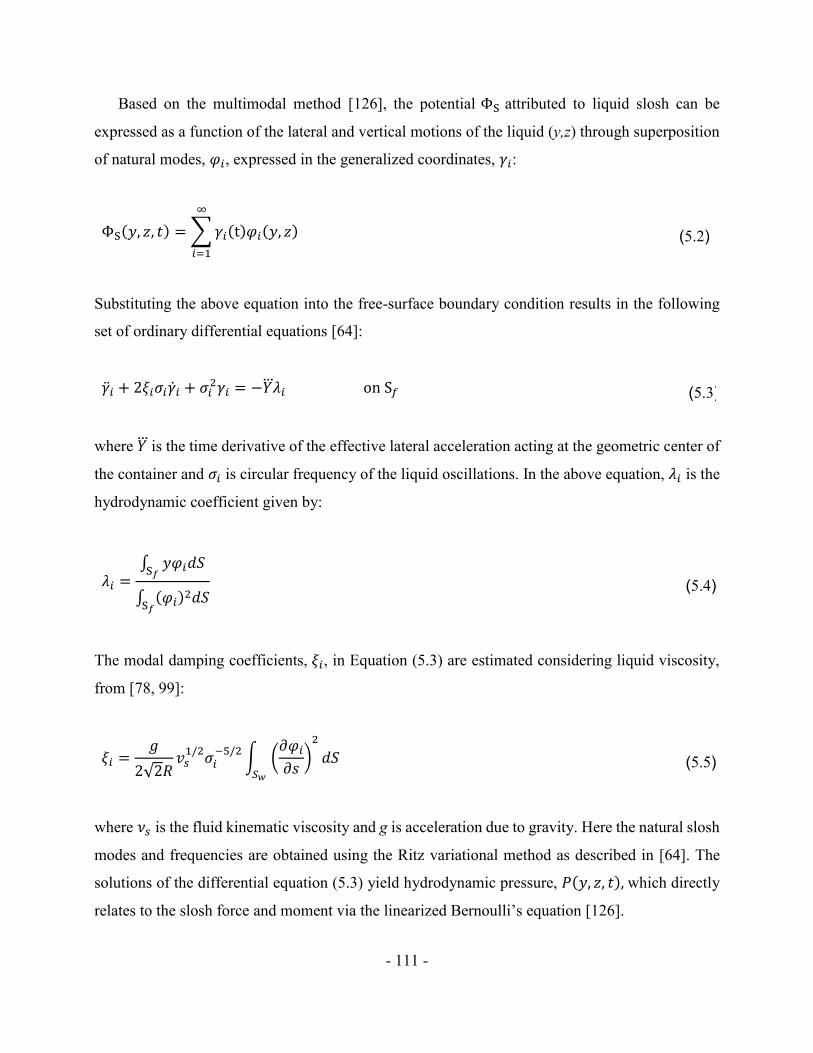
- 111 -
Based on the multimodal method [126], the potential ΦS attributed to liquid slosh can be
expressed as a function of the lateral and vertical motions of the liquid (y,z) through superposition
of natural modes, 𝜑𝑖, expressed in the generalized coordinates, 𝛾𝑖:
ΦS(𝑦, 𝑧, 𝑡) =∑𝛾𝑖(t)𝜑𝑖(𝑦, 𝑧)
∞
𝑖=1
(5.2)
Substituting the above equation into the free-surface boundary condition results in the following
set of ordinary differential equations [64]:
��𝑖 + 2𝜉𝑖𝜎𝑖��𝑖 + 𝜎𝑖2𝛾𝑖 = −𝑌𝜆𝑖 on S𝑓 (5.3)
where 𝑌 is the time derivative of the effective lateral acceleration acting at the geometric center of
the container and 𝜎𝑖 is circular frequency of the liquid oscillations. In the above equation, 𝜆𝑖 is the
hydrodynamic coefficient given by:
𝜆𝑖 =∫ 𝑦𝜑𝑖𝑑𝑆S𝑓
∫ (𝜑𝑖)2𝑑𝑆S𝑓
(5.4)
The modal damping coefficients, 𝜉𝑖, in Equation (5.3) are estimated considering liquid viscosity,
from [78, 99]:
𝜉𝑖 =𝑔
2√2𝑅𝑣𝑠1/2𝜎𝑖−5/2
∫ (𝜕𝜑𝑖𝜕𝑠)2
𝑆𝑤
𝑑𝑆 (5.5)
where 𝜈𝑠 is the fluid kinematic viscosity and g is acceleration due to gravity. Here the natural slosh
modes and frequencies are obtained using the Ritz variational method as described in [64]. The
solutions of the differential equation (5.3) yield hydrodynamic pressure, 𝑃(𝑦, 𝑧, 𝑡), which directly
relates to the slosh force and moment via the linearized Bernoulli’s equation [126].
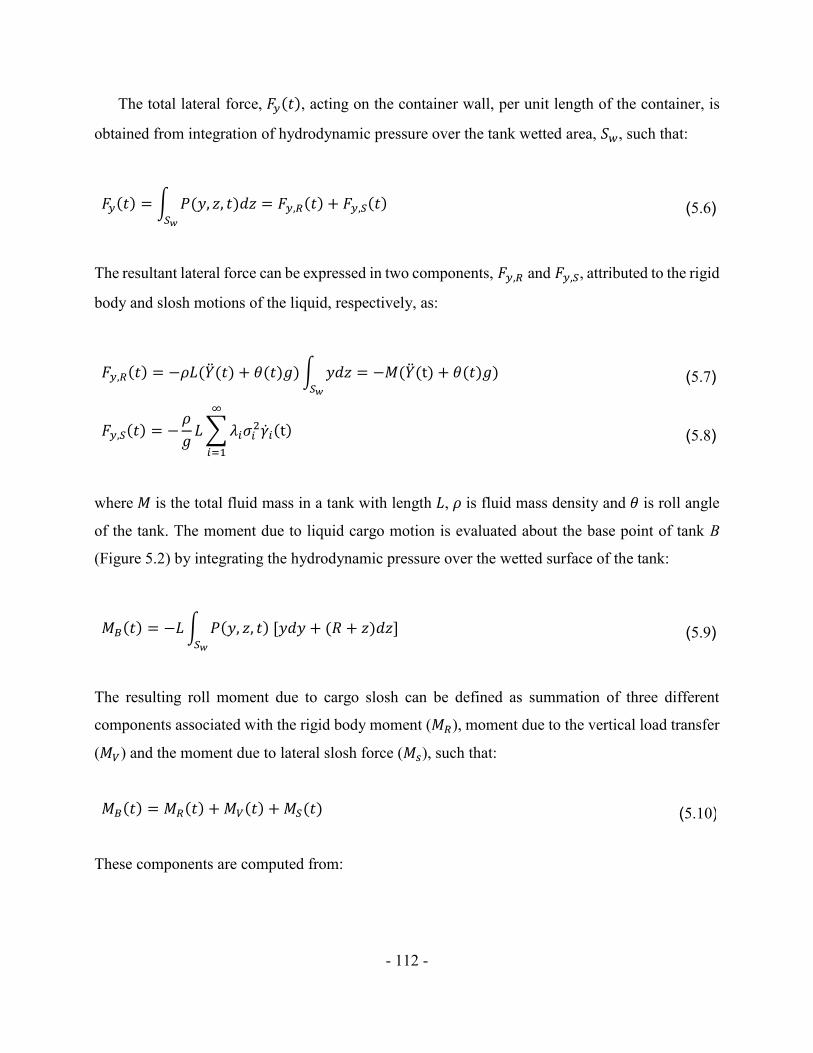
- 112 -
The total lateral force, 𝐹𝑦(𝑡), acting on the container wall, per unit length of the container, is
obtained from integration of hydrodynamic pressure over the tank wetted area, 𝑆𝑤, such that:
𝐹𝑦(𝑡) = ∫ 𝑃(𝑦, 𝑧, 𝑡)𝑑𝑧𝑆𝑤
= 𝐹𝑦,𝑅(𝑡) + 𝐹𝑦,𝑆(𝑡) (5.6)
The resultant lateral force can be expressed in two components, 𝐹𝑦,𝑅 and 𝐹𝑦,𝑆, attributed to the rigid
body and slosh motions of the liquid, respectively, as:
𝐹𝑦,𝑅(𝑡) = −𝜌𝐿(��(𝑡) + 𝜃(𝑡)𝑔)∫ 𝑦𝑑𝑧𝑆𝑤
= −𝑀(��(t) + 𝜃(𝑡)𝑔) (5.7)
𝐹𝑦,𝑆(𝑡) = −𝜌
𝑔𝐿∑𝜆𝑖𝜎𝑖
2��𝑖(t)
∞
𝑖=1
(5.8)
where 𝑀 is the total fluid mass in a tank with length 𝐿, 𝜌 is fluid mass density and 𝜃 is roll angle
of the tank. The moment due to liquid cargo motion is evaluated about the base point of tank B
(Figure 5.2) by integrating the hydrodynamic pressure over the wetted surface of the tank:
𝑀𝐵(𝑡) = −𝐿∫ 𝑃(𝑦, 𝑧, 𝑡) [𝑦𝑑𝑦 + (𝑅 + 𝑧)𝑑𝑧]𝑆𝑤
(5.9)
The resulting roll moment due to cargo slosh can be defined as summation of three different
components associated with the rigid body moment (𝑀𝑅), moment due to the vertical load transfer
(𝑀𝑉) and the moment due to lateral slosh force (𝑀𝑠), such that:
𝑀𝐵(𝑡) = 𝑀𝑅(𝑡) + 𝑀𝑉(𝑡) + 𝑀𝑆(𝑡) (5.10)
These components are computed from:
- 113 -
𝑀𝑅(𝑡) = 𝜌𝐿(��(𝑡) + 𝜃(𝑡)𝑔)∫ 𝑦(𝑅 + 𝑧)𝑑𝑧 = 𝑀(𝑅 + 𝑧𝑐.𝑔.)(��(𝑡) + 𝜃(𝑡)𝑔)𝑆𝑤
(5.11)
𝑀𝑉(𝑡) = 𝜌𝐿(��(𝑡) + 𝜃(𝑡)𝑔)∫ 𝑦2𝑑𝑦 =2
3𝜌𝑦0
3𝐿(��(𝑡) + 𝜃(𝑡)𝑔)𝑆𝑤
(5.12)
𝑀𝑆(𝑡) =𝜌𝐿
𝑔 𝑅∑𝜆𝑖𝜎𝑖
2��𝑖(t)
∞
𝑖=1
= 𝑅 × 𝐹𝑦,𝑆(𝑡) (5.13)
where 𝑧𝑐.𝑔. in Equation (5.11) is the position of center of gravity for liquid cargo with respect to
the geometry center of the tank, point O, as shown in Figure 5.2. The 𝑀𝑉(𝑡) can be regarded as the
moment due to lateral shift of liquid cargo subject to lateral acceleration and roll motion of the tank
car.
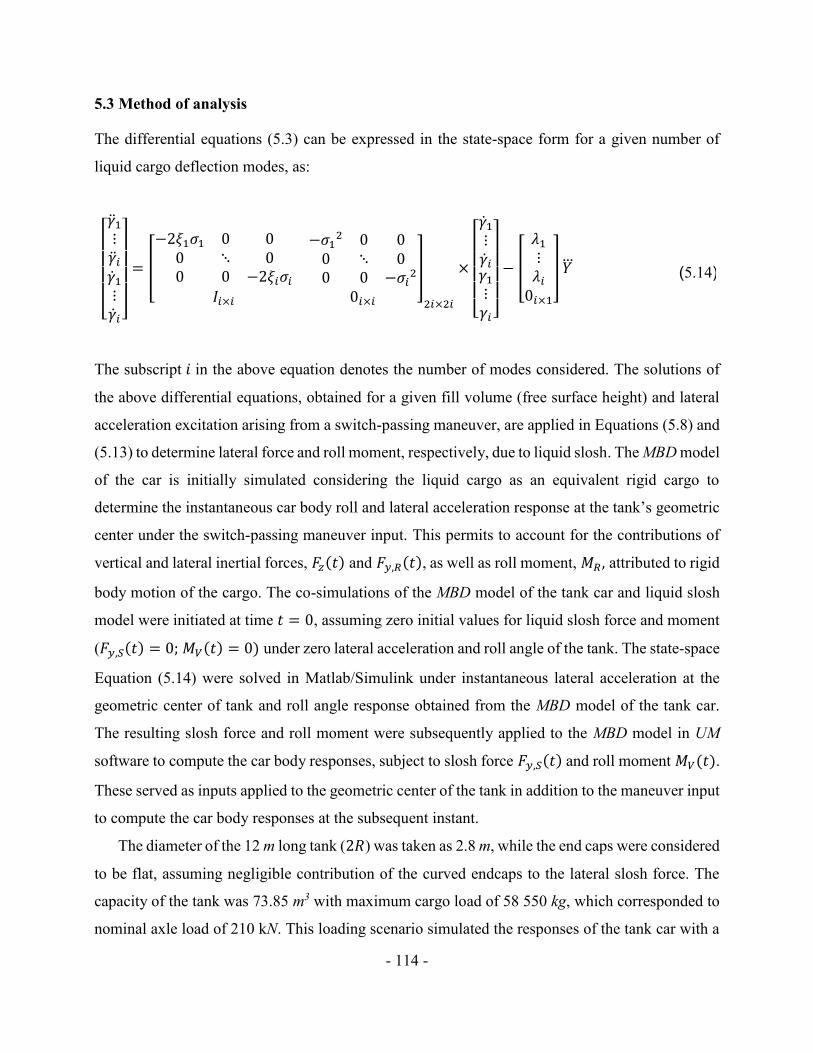
- 114 -
5.3 Method of analysis
The differential equations (5.3) can be expressed in the state-space form for a given number of
liquid cargo deflection modes, as:
[ ��1⋮��𝑖��1⋮��𝑖 ]
= [
−2𝜉1𝜎1 0 00 ⋱ 00 0 −2𝜉𝑖𝜎𝑖
−𝜎12 0 0
0 ⋱ 00 0 −𝜎𝑖
2
𝐼𝑖×𝑖 0𝑖×𝑖
]
2𝑖×2𝑖
×
[ ��1⋮��𝑖𝛾1⋮𝛾𝑖 ]
− [
𝜆1⋮𝜆𝑖0𝑖×1
] 𝑌 (5.14)
The subscript 𝑖 in the above equation denotes the number of modes considered. The solutions of
the above differential equations, obtained for a given fill volume (free surface height) and lateral
acceleration excitation arising from a switch-passing maneuver, are applied in Equations (5.8) and
(5.13) to determine lateral force and roll moment, respectively, due to liquid slosh. The MBD model
of the car is initially simulated considering the liquid cargo as an equivalent rigid cargo to
determine the instantaneous car body roll and lateral acceleration response at the tank’s geometric
center under the switch-passing maneuver input. This permits to account for the contributions of
vertical and lateral inertial forces, 𝐹𝑧(𝑡) and 𝐹𝑦,𝑅(𝑡), as well as roll moment, 𝑀𝑅 , attributed to rigid
body motion of the cargo. The co-simulations of the MBD model of the tank car and liquid slosh
model were initiated at time 𝑡 = 0, assuming zero initial values for liquid slosh force and moment
(𝐹𝑦,𝑆(𝑡) = 0; 𝑀𝑉(𝑡) = 0) under zero lateral acceleration and roll angle of the tank. The state-space
Equation (5.14) were solved in Matlab/Simulink under instantaneous lateral acceleration at the
geometric center of tank and roll angle response obtained from the MBD model of the tank car.
The resulting slosh force and roll moment were subsequently applied to the MBD model in UM
software to compute the car body responses, subject to slosh force 𝐹𝑦,𝑆(𝑡) and roll moment 𝑀𝑉(𝑡).
These served as inputs applied to the geometric center of the tank in addition to the maneuver input
to compute the car body responses at the subsequent instant.
The diameter of the 12 m long tank (2𝑅) was taken as 2.8 m, while the end caps were considered
to be flat, assuming negligible contribution of the curved endcaps to the lateral slosh force. The
capacity of the tank was 73.85 m3 with maximum cargo load of 58 550 kg, which corresponded to
nominal axle load of 210 kN. This loading scenario simulated the responses of the tank car with a
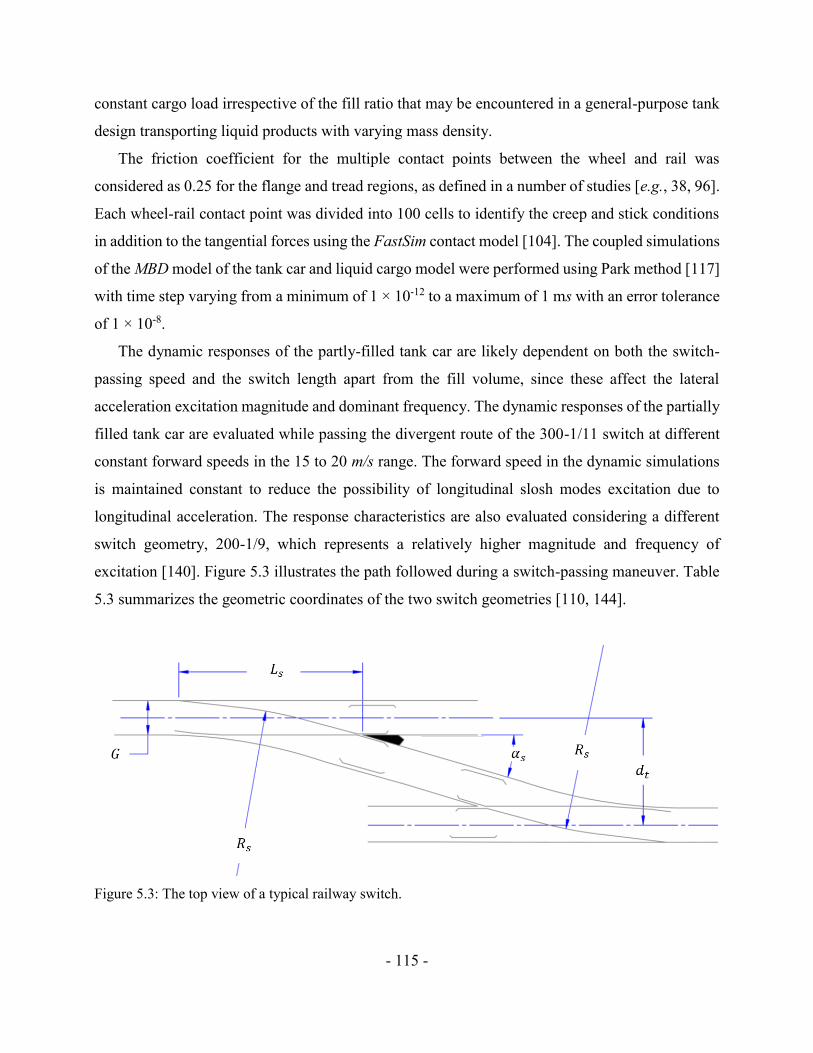
- 115 -
constant cargo load irrespective of the fill ratio that may be encountered in a general-purpose tank
design transporting liquid products with varying mass density.
The friction coefficient for the multiple contact points between the wheel and rail was
considered as 0.25 for the flange and tread regions, as defined in a number of studies [e.g., 38, 96].
Each wheel-rail contact point was divided into 100 cells to identify the creep and stick conditions
in addition to the tangential forces using the FastSim contact model [104]. The coupled simulations
of the MBD model of the tank car and liquid cargo model were performed using Park method [117]
with time step varying from a minimum of 1 × 10-12 to a maximum of 1 ms with an error tolerance
of 1 × 10⁻⁸.
The dynamic responses of the partly-filled tank car are likely dependent on both the switch-
passing speed and the switch length apart from the fill volume, since these affect the lateral
acceleration excitation magnitude and dominant frequency. The dynamic responses of the partially
filled tank car are evaluated while passing the divergent route of the 300-1/11 switch at different
constant forward speeds in the 15 to 20 m/s range. The forward speed in the dynamic simulations
is maintained constant to reduce the possibility of longitudinal slosh modes excitation due to
longitudinal acceleration. The response characteristics are also evaluated considering a different
switch geometry, 200-1/9, which represents a relatively higher magnitude and frequency of
excitation [140]. Figure 5.3 illustrates the path followed during a switch-passing maneuver. Table
5.3 summarizes the geometric coordinates of the two switch geometries [110, 144].
Figure 5.3: The top view of a typical railway switch.
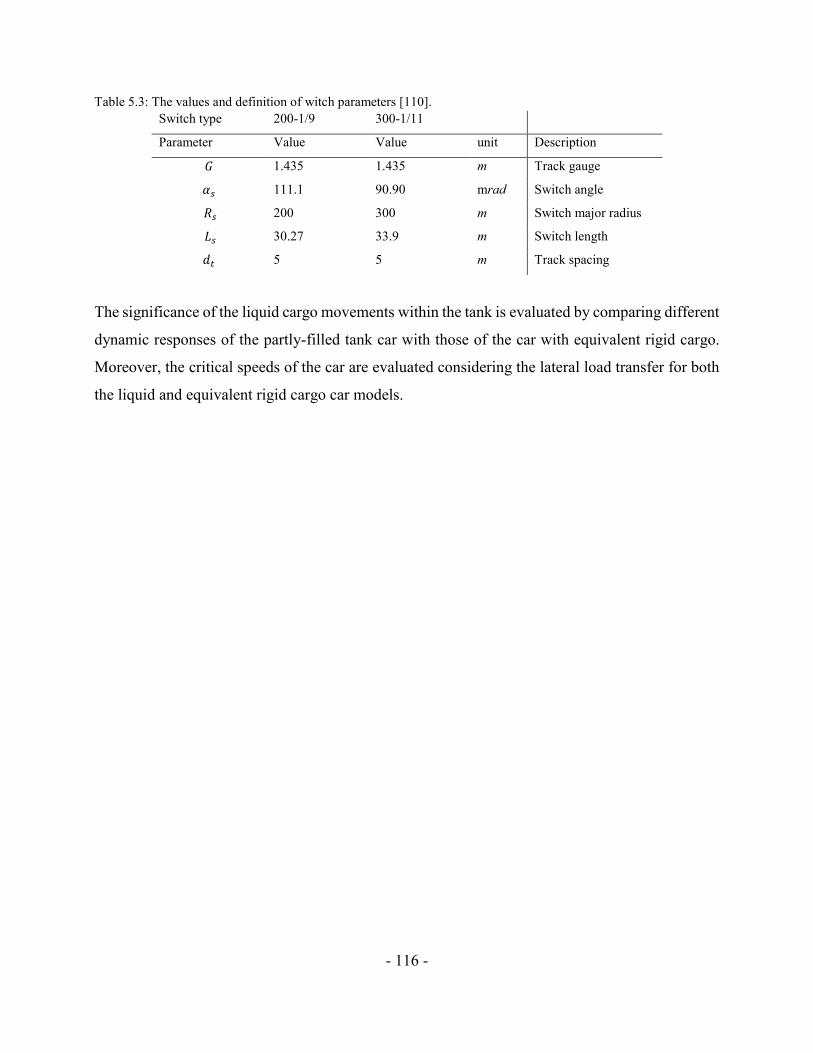
- 116 -
Table 5.3: The values and definition of witch parameters [110].
Switch type 200-1/9 300-1/11
Parameter Value Value unit Description
𝐺 1.435 1.435 m Track gauge
𝛼𝑠 111.1 90.90 mrad Switch angle
𝑅𝑠 200 300 m Switch major radius
𝐿𝑠 30.27 33.9 m Switch length
𝑑𝑡 5 5 m Track spacing
The significance of the liquid cargo movements within the tank is evaluated by comparing different
dynamic responses of the partly-filled tank car with those of the car with equivalent rigid cargo.
Moreover, the critical speeds of the car are evaluated considering the lateral load transfer for both
the liquid and equivalent rigid cargo car models.
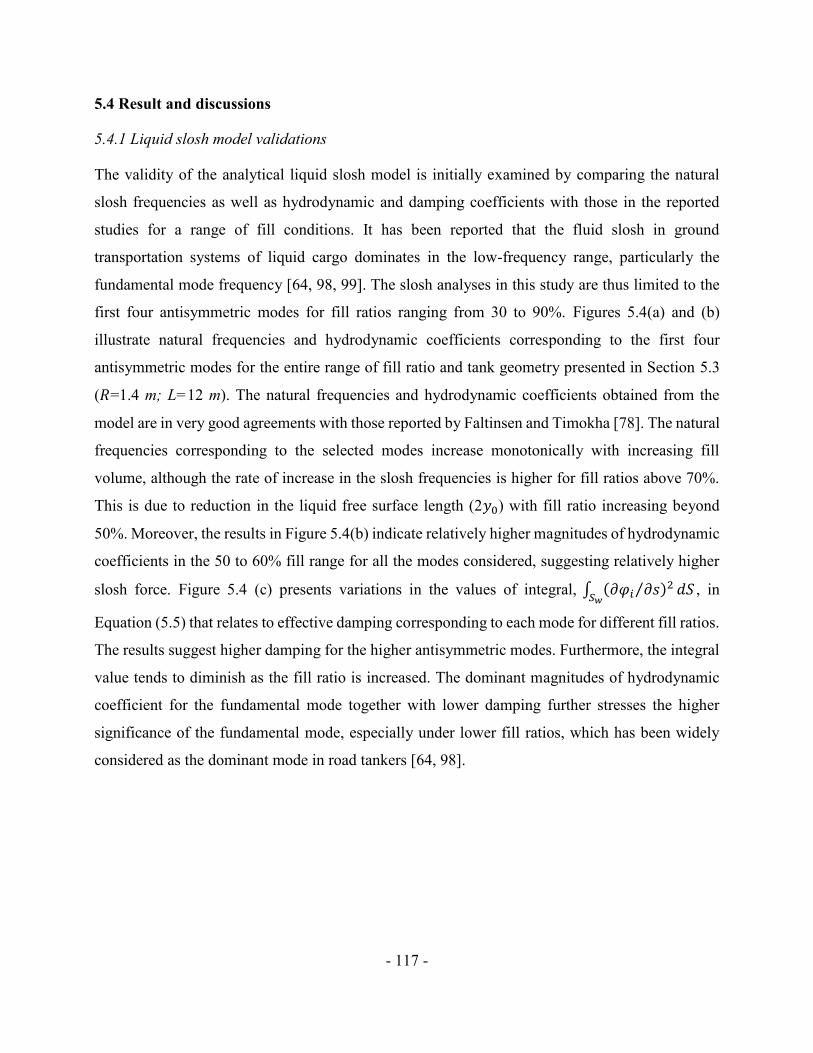
- 117 -
5.4 Result and discussions
5.4.1 Liquid slosh model validations
The validity of the analytical liquid slosh model is initially examined by comparing the natural
slosh frequencies as well as hydrodynamic and damping coefficients with those in the reported
studies for a range of fill conditions. It has been reported that the fluid slosh in ground
transportation systems of liquid cargo dominates in the low-frequency range, particularly the
fundamental mode frequency [64, 98, 99]. The slosh analyses in this study are thus limited to the
first four antisymmetric modes for fill ratios ranging from 30 to 90%. Figures 5.4(a) and (b)
illustrate natural frequencies and hydrodynamic coefficients corresponding to the first four
antisymmetric modes for the entire range of fill ratio and tank geometry presented in Section 5.3
(𝑅=1.4 m; L=12 m). The natural frequencies and hydrodynamic coefficients obtained from the
model are in very good agreements with those reported by Faltinsen and Timokha [78]. The natural
frequencies corresponding to the selected modes increase monotonically with increasing fill
volume, although the rate of increase in the slosh frequencies is higher for fill ratios above 70%.
This is due to reduction in the liquid free surface length (2𝑦0) with fill ratio increasing beyond
50%. Moreover, the results in Figure 5.4(b) indicate relatively higher magnitudes of hydrodynamic
coefficients in the 50 to 60% fill range for all the modes considered, suggesting relatively higher
slosh force. Figure 5.4 (c) presents variations in the values of integral, ∫ (𝜕𝜑𝑖 𝜕𝑠⁄ )2𝑆𝑤
𝑑𝑆 , in
Equation (5.5) that relates to effective damping corresponding to each mode for different fill ratios.
The results suggest higher damping for the higher antisymmetric modes. Furthermore, the integral
value tends to diminish as the fill ratio is increased. The dominant magnitudes of hydrodynamic
coefficient for the fundamental mode together with lower damping further stresses the higher
significance of the fundamental mode, especially under lower fill ratios, which has been widely
considered as the dominant mode in road tankers [64, 98].
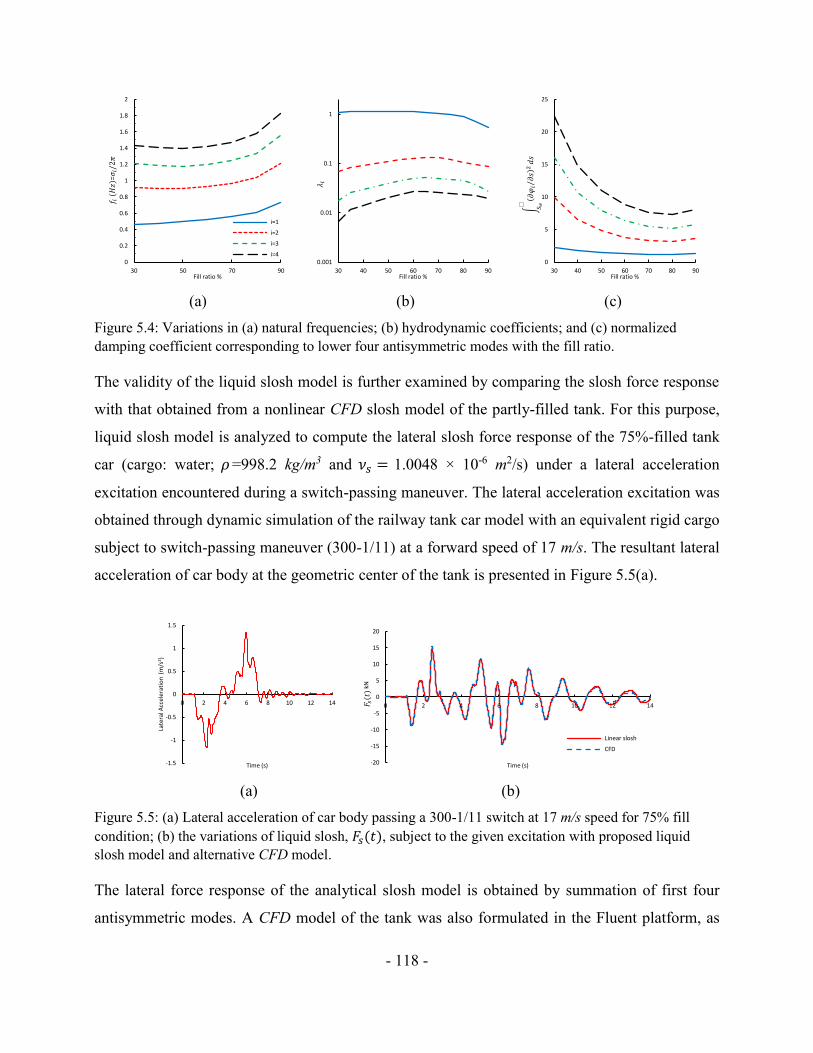
- 118 -
(a) (b) (c)
Figure 5.4: Variations in (a) natural frequencies; (b) hydrodynamic coefficients; and (c) normalized
damping coefficient corresponding to lower four antisymmetric modes with the fill ratio.
The validity of the liquid slosh model is further examined by comparing the slosh force response
with that obtained from a nonlinear CFD slosh model of the partly-filled tank. For this purpose,
liquid slosh model is analyzed to compute the lateral slosh force response of the 75%-filled tank
car (cargo: water; 𝜌=998.2 kg/m3 and 𝜈𝑠 = 1.0048 × 10⁻⁶ m2/s) under a lateral acceleration
excitation encountered during a switch-passing maneuver. The lateral acceleration excitation was
obtained through dynamic simulation of the railway tank car model with an equivalent rigid cargo
subject to switch-passing maneuver (300-1/11) at a forward speed of 17 m/s. The resultant lateral
acceleration of car body at the geometric center of the tank is presented in Figure 5.5(a).
(a) (b)
Figure 5.5: (a) Lateral acceleration of car body passing a 300-1/11 switch at 17 m/s speed for 75% fill
condition; (b) the variations of liquid slosh, 𝐹𝑠(𝑡), subject to the given excitation with proposed liquid
slosh model and alternative CFD model.
The lateral force response of the analytical slosh model is obtained by summation of first four
antisymmetric modes. A CFD model of the tank was also formulated in the Fluent platform, as
0
0.2
0.4
0.6
0.8
1
1.2
1.4
1.6
1.8
2
30 50 70 90Fill ratio %
i=1
i=2
i=3
i=4
𝑓 𝑖(𝐻𝑧)
=𝜎𝑖/2𝜋
0.001
0.01
0.1
1
30 40 50 60 70 80 90Fill ratio %
𝜆𝑖
0
5
10
15
20
25
30 40 50 60 70 80 90Fill ratio %
∫ 𝑆 𝑤⬚
⁄𝜕𝜑𝑖𝜕𝑠2𝑑𝑠
-1.5
-1
-0.5
0
0.5
1
1.5
0 2 4 6 8 10 12 14
Late
ral A
ccel
erat
ion
(m
/s2 )
Time (s) -20
-15
-10
-5
0
5
10
15
20
0 2 4 6 8 10 12 14
kN
Time (s)
Linear slosh
CFD
𝐹 𝑠(𝑡)
- 119 -
described in [84, 129]. The time-histories of the lateral slosh force responses obtained from the
analytical and CFD models are compared in Figure 5.5(b). Both the models yield nearly identical
lateral force response. Both the models also exhibit sustained oscillations in the lateral force even
after the acceleration due to switch-passing diminishes (t>8s). The frequency of such free
oscillations in slosh force response of both models is nearly 0.6 Hz, which is identical to that shown
in Figure 5.4(a) for the first antisymmetric mode corresponding to 75% fill ratio. From the results
presented in Figures 5.4 and 5.5, it may be concluded that the analytical slosh model, considered
in this study, can provide accurate estimation of the slosh response of the partly-filled tank under
the lateral acceleration excitation that may be encountered during a switch-passing maneuver. The
linear slosh model also yields the response in a highly computationally efficient manner compared
to the CFD model that poses considerably higher computational cost. The linear slosh model is
thus considered to be well suited for dynamic analyses of the coupled tank car and liquid cargo
models. Moreover, the linear approach does not require re-computation of the coefficients in the
state-space Equations (5.3 and 5.14) at each iteration step and thereby can facilitate real-time co-
simulations of the MBD model. It should also be noted that these coefficients for an alternate tank
geometry of radius �� can be conveniently estimated from those obtained for the nominal tank
radius:
𝜎𝑖2 × 1.4 = 𝜎𝑖
2× �� and 𝜆𝑖 × �� = 𝜆𝑖 × 1.4 (5.15)
Where 𝜎𝑖 and 𝜆𝑖 are the natural frequencies and hydrodynamic coefficient of the tank of radius ��.
- 120 -
5.4.2 Effects of liquid cargo sloshing during switch passing maneuvers
The dynamic responses of the car body coupled with the liquid slosh are evaluated under the lateral
acceleration excitations due to the 300-1/11 switch at different forward speeds. The responses
obtained for liquid and equivalent rigid cargos are compared to illustrate the effects of liquid slosh
when the tank car is partly-filled with a liquid cargo. The roll responses of the tank car body with
60% and 90%-filled liquid and equivalent rigid cargos are compared in Figure 5.6 considering a
constant forward speed of 15 m/s. The results show considerably higher peak roll angles of the
partly-filled tank car when compared to those with the equivalent rigid cargo. The effect of cargo
slosh is more pronounced for the 60%-filled tank car compared to the 90%-filled car. The results
show that the equivalent rigid cargo consideration of the liquid load will yield considerable
underestimation of the car body roll response, especially for the 60% fill condition. The peak roll
angle of the 90%-filled liquid tank car is nearly 11% lower than that obtained for the 60% fill
condition, even though the cargo c.g. height of the 60%-filled tank car is considerably lower
compared to the 90% fill condition. The higher roll angle is attributed to larger free surface length
for the 60% fill condition compared to the 90%-fill case and thereby higher lateral load shift and
roll moment during the switch-passing maneuver. This is also evident from the lower values of the
hydrodynamic coefficients obtained for fill ratios exceeding 70%, as presented in Figure 5.4(b).
The reduced free surface length of liquid cargo for the 90%-fill condition thus leads to relatively
smaller effect of liquid slosh on the roll response. Moreover, the sloshing within the 60%-filled
tank yields notable oscillations in roll response near the fundamental slosh frequency (≈0.5 Hz)
even after passing the switch. Small oscillations are also observed in the response of the rigid cargo
car, which occurs in the vicinity of roll mode frequency of the car body, near 1.25 Hz.
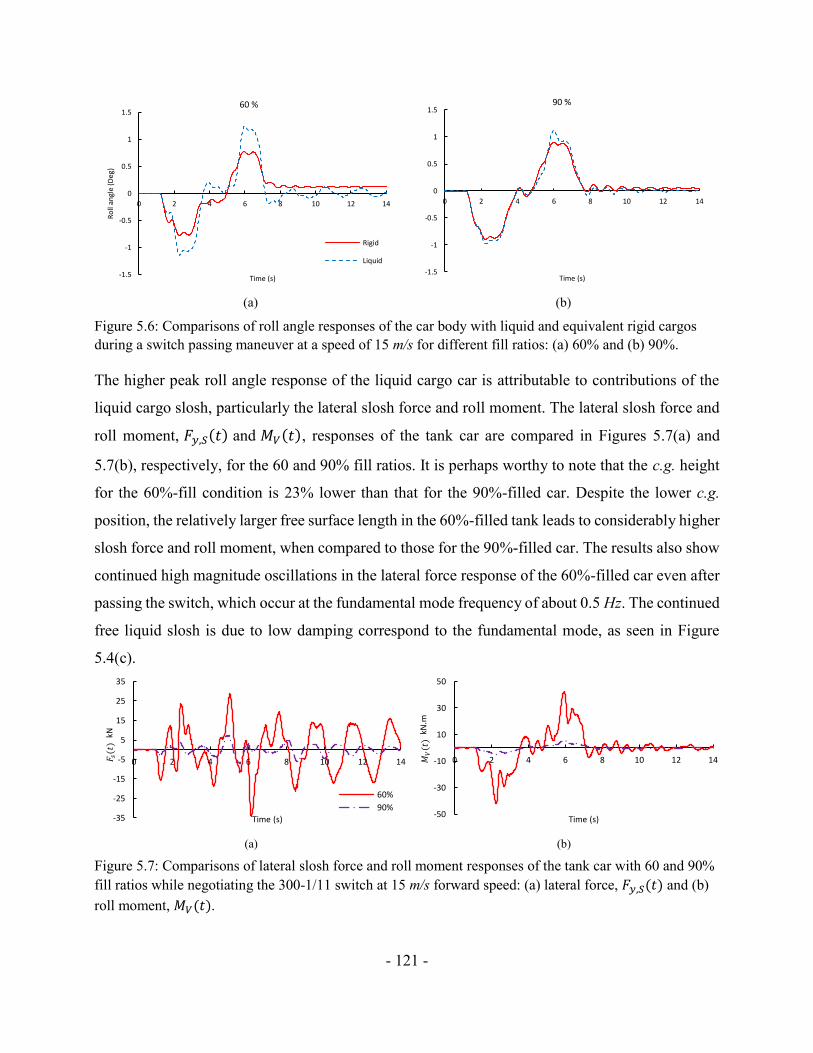
- 121 -
(a) (b)
Figure 5.6: Comparisons of roll angle responses of the car body with liquid and equivalent rigid cargos
during a switch passing maneuver at a speed of 15 m/s for different fill ratios: (a) 60% and (b) 90%.
The higher peak roll angle response of the liquid cargo car is attributable to contributions of the
liquid cargo slosh, particularly the lateral slosh force and roll moment. The lateral slosh force and
roll moment, 𝐹𝑦,𝑆(𝑡) and 𝑀𝑉(𝑡), responses of the tank car are compared in Figures 5.7(a) and
5.7(b), respectively, for the 60 and 90% fill ratios. It is perhaps worthy to note that the c.g. height
for the 60%-fill condition is 23% lower than that for the 90%-filled car. Despite the lower c.g.
position, the relatively larger free surface length in the 60%-filled tank leads to considerably higher
slosh force and roll moment, when compared to those for the 90%-filled car. The results also show
continued high magnitude oscillations in the lateral force response of the 60%-filled car even after
passing the switch, which occur at the fundamental mode frequency of about 0.5 Hz. The continued
free liquid slosh is due to low damping correspond to the fundamental mode, as seen in Figure
5.4(c).
(a) (b)
Figure 5.7: Comparisons of lateral slosh force and roll moment responses of the tank car with 60 and 90%
fill ratios while negotiating the 300-1/11 switch at 15 m/s forward speed: (a) lateral force, 𝐹𝑦,𝑆(𝑡) and (b)
roll moment, 𝑀𝑉(𝑡).
-1.5
-1
-0.5
0
0.5
1
1.5
0 2 4 6 8 10 12 14
Ro
ll an
gle
(De
g)
Time (s)
60 %
Rigid
Liquid
-1.5
-1
-0.5
0
0.5
1
1.5
0 2 4 6 8 10 12 14
Time (s)
90 %
-35
-25
-15
-5
5
15
25
35
0 2 4 6 8 10 12 14
kN
Time (s)
60%
90%
𝐹 𝑠(𝑡)
-50
-30
-10
10
30
50
0 2 4 6 8 10 12 14
kN.m
Time (s)
𝑀𝑉(𝑡)
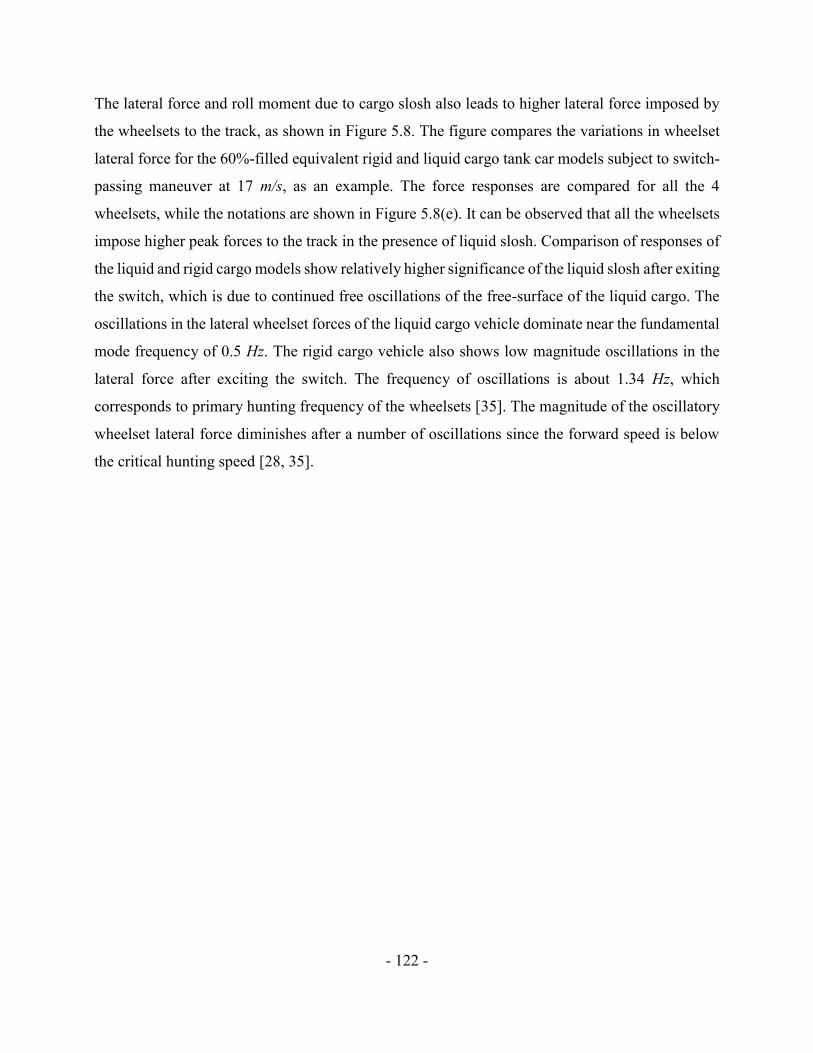
- 122 -
The lateral force and roll moment due to cargo slosh also leads to higher lateral force imposed by
the wheelsets to the track, as shown in Figure 5.8. The figure compares the variations in wheelset
lateral force for the 60%-filled equivalent rigid and liquid cargo tank car models subject to switch-
passing maneuver at 17 m/s, as an example. The force responses are compared for all the 4
wheelsets, while the notations are shown in Figure 5.8(e). It can be observed that all the wheelsets
impose higher peak forces to the track in the presence of liquid slosh. Comparison of responses of
the liquid and rigid cargo models show relatively higher significance of the liquid slosh after exiting
the switch, which is due to continued free oscillations of the free-surface of the liquid cargo. The
oscillations in the lateral wheelset forces of the liquid cargo vehicle dominate near the fundamental
mode frequency of 0.5 Hz. The rigid cargo vehicle also shows low magnitude oscillations in the
lateral force after exciting the switch. The frequency of oscillations is about 1.34 Hz, which
corresponds to primary hunting frequency of the wheelsets [35]. The magnitude of the oscillatory
wheelset lateral force diminishes after a number of oscillations since the forward speed is below
the critical hunting speed [28, 35].
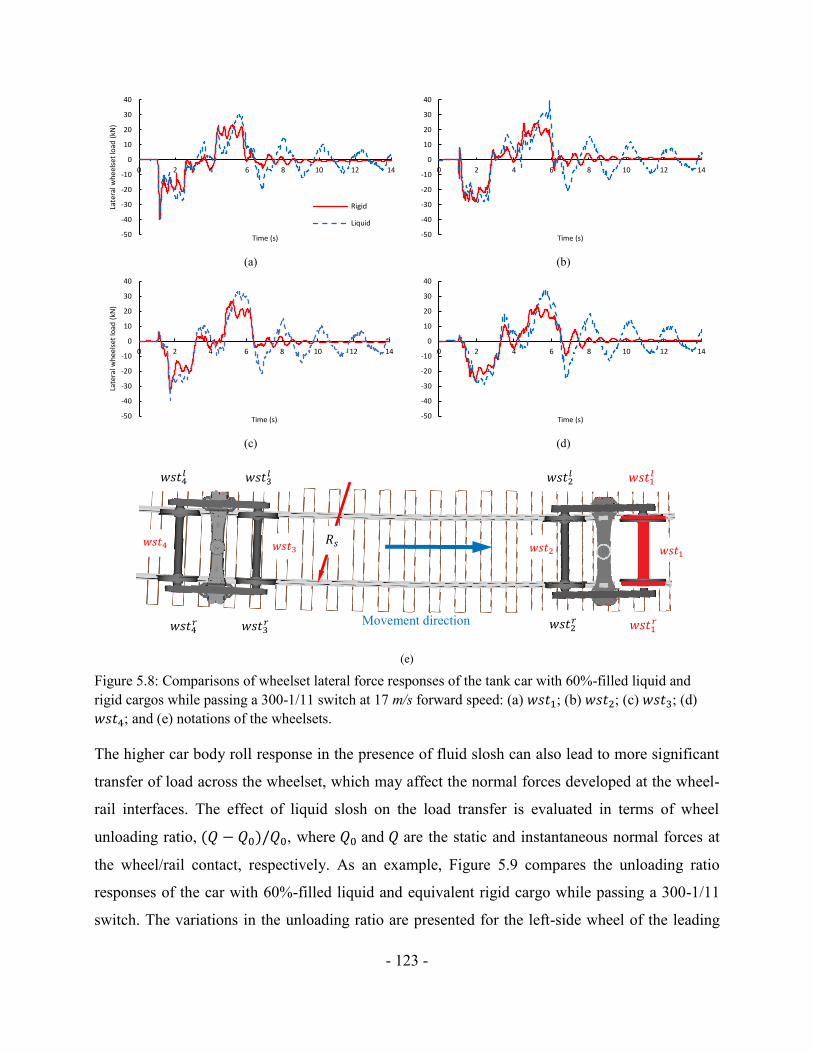
- 123 -
(a) (b)
(c) (d)
(e)
Figure 5.8: Comparisons of wheelset lateral force responses of the tank car with 60%-filled liquid and
rigid cargos while passing a 300-1/11 switch at 17 m/s forward speed: (a) 𝑤𝑠𝑡1; (b) 𝑤𝑠𝑡2; (c) 𝑤𝑠𝑡3; (d)
𝑤𝑠𝑡4; and (e) notations of the wheelsets.
The higher car body roll response in the presence of fluid slosh can also lead to more significant
transfer of load across the wheelset, which may affect the normal forces developed at the wheel-
rail interfaces. The effect of liquid slosh on the load transfer is evaluated in terms of wheel
unloading ratio, (𝑄 − 𝑄0)/𝑄0, where 𝑄0 and 𝑄 are the static and instantaneous normal forces at
the wheel/rail contact, respectively. As an example, Figure 5.9 compares the unloading ratio
responses of the car with 60%-filled liquid and equivalent rigid cargo while passing a 300-1/11
switch. The variations in the unloading ratio are presented for the left-side wheel of the leading
-50
-40
-30
-20
-10
0
10
20
30
40
0 2 4 6 8 10 12 14
Late
ral w
hee
lset
load
(kN
)
Time (s)
Rigid
Liquid
-50
-40
-30
-20
-10
0
10
20
30
40
0 2 4 6 8 10 12 14
Time (s)
-50
-40
-30
-20
-10
0
10
20
30
40
0 2 4 6 8 10 12 14
Late
ral w
hee
lset
load
(kN
)
Time (s) -50
-40
-30
-20
-10
0
10
20
30
40
0 2 4 6 8 10 12 14
Time (s)
Movement direction
𝑤𝑠𝑡4𝑙
𝑤𝑠𝑡4𝑟
𝑤𝑠𝑡3𝑙
𝑤𝑠𝑡3𝑟
𝑤𝑠𝑡2𝑙 𝑤𝑠𝑡1
𝑙
𝑤𝑠𝑡2𝑟 𝑤𝑠𝑡1
𝑟
𝑅𝑠 𝑤𝑠𝑡4 𝑤𝑠𝑡3 𝑤𝑠𝑡2 𝑤𝑠𝑡1
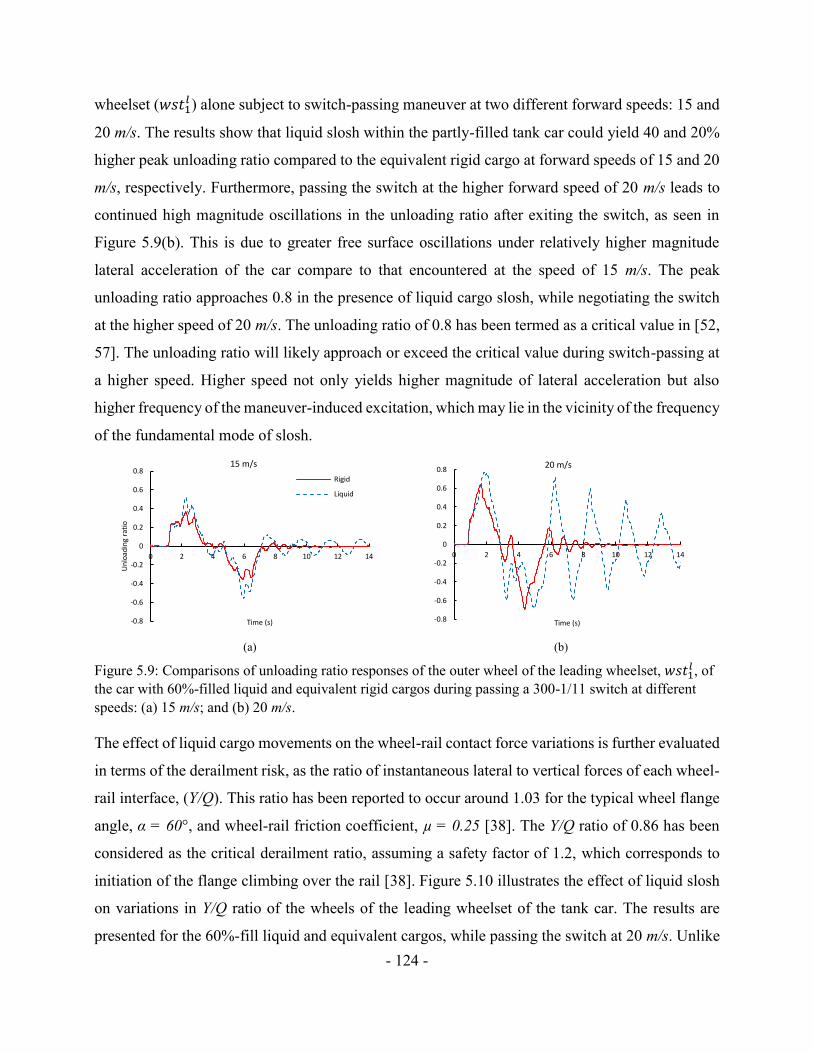
- 124 -
wheelset (𝑤𝑠𝑡1𝑙 ) alone subject to switch-passing maneuver at two different forward speeds: 15 and
20 m/s. The results show that liquid slosh within the partly-filled tank car could yield 40 and 20%
higher peak unloading ratio compared to the equivalent rigid cargo at forward speeds of 15 and 20
m/s, respectively. Furthermore, passing the switch at the higher forward speed of 20 m/s leads to
continued high magnitude oscillations in the unloading ratio after exiting the switch, as seen in
Figure 5.9(b). This is due to greater free surface oscillations under relatively higher magnitude
lateral acceleration of the car compare to that encountered at the speed of 15 m/s. The peak
unloading ratio approaches 0.8 in the presence of liquid cargo slosh, while negotiating the switch
at the higher speed of 20 m/s. The unloading ratio of 0.8 has been termed as a critical value in [52,
57]. The unloading ratio will likely approach or exceed the critical value during switch-passing at
a higher speed. Higher speed not only yields higher magnitude of lateral acceleration but also
higher frequency of the maneuver-induced excitation, which may lie in the vicinity of the frequency
of the fundamental mode of slosh.
(a) (b)
Figure 5.9: Comparisons of unloading ratio responses of the outer wheel of the leading wheelset, 𝑤𝑠𝑡1𝑙 , of
the car with 60%-filled liquid and equivalent rigid cargos during passing a 300-1/11 switch at different
speeds: (a) 15 m/s; and (b) 20 m/s.
The effect of liquid cargo movements on the wheel-rail contact force variations is further evaluated
in terms of the derailment risk, as the ratio of instantaneous lateral to vertical forces of each wheel-
rail interface, (Y/Q). This ratio has been reported to occur around 1.03 for the typical wheel flange
angle, α = 60°, and wheel-rail friction coefficient, µ = 0.25 [38]. The Y/Q ratio of 0.86 has been
considered as the critical derailment ratio, assuming a safety factor of 1.2, which corresponds to
initiation of the flange climbing over the rail [38]. Figure 5.10 illustrates the effect of liquid slosh
on variations in Y/Q ratio of the wheels of the leading wheelset of the tank car. The results are
presented for the 60%-fill liquid and equivalent cargos, while passing the switch at 20 m/s. Unlike
-0.8
-0.6
-0.4
-0.2
0
0.2
0.4
0.6
0.8
0 2 4 6 8 10 12 14
Un
load
ing
rati
o
Time (s)
15 m/s
Rigid
Liquid
-0.8
-0.6
-0.4
-0.2
0
0.2
0.4
0.6
0.8
0 2 4 6 8 10 12 14
Time (s)
20 m/s
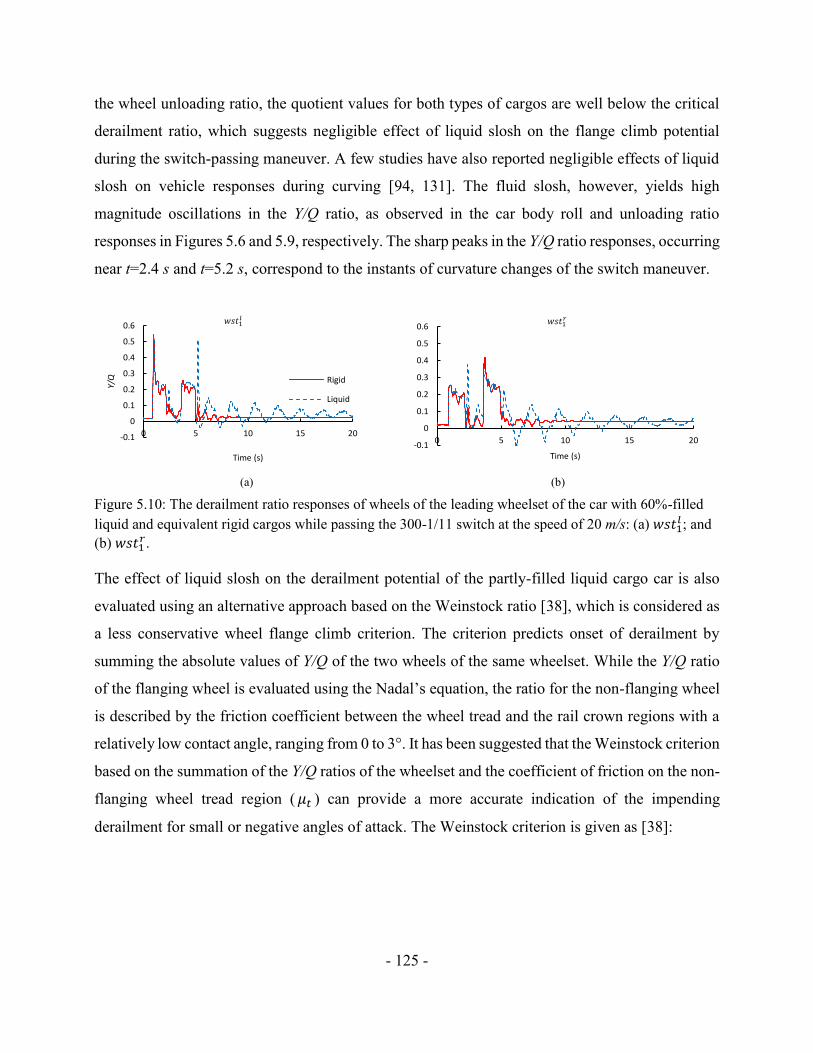
- 125 -
the wheel unloading ratio, the quotient values for both types of cargos are well below the critical
derailment ratio, which suggests negligible effect of liquid slosh on the flange climb potential
during the switch-passing maneuver. A few studies have also reported negligible effects of liquid
slosh on vehicle responses during curving [94, 131]. The fluid slosh, however, yields high
magnitude oscillations in the Y/Q ratio, as observed in the car body roll and unloading ratio
responses in Figures 5.6 and 5.9, respectively. The sharp peaks in the Y/Q ratio responses, occurring
near t=2.4 s and t=5.2 s, correspond to the instants of curvature changes of the switch maneuver.
(a) (b)
Figure 5.10: The derailment ratio responses of wheels of the leading wheelset of the car with 60%-filled
liquid and equivalent rigid cargos while passing the 300-1/11 switch at the speed of 20 m/s: (a) 𝑤𝑠𝑡1𝑙 ; and
(b) 𝑤𝑠𝑡1𝑟.
The effect of liquid slosh on the derailment potential of the partly-filled liquid cargo car is also
evaluated using an alternative approach based on the Weinstock ratio [38], which is considered as
a less conservative wheel flange climb criterion. The criterion predicts onset of derailment by
summing the absolute values of Y/Q of the two wheels of the same wheelset. While the Y/Q ratio
of the flanging wheel is evaluated using the Nadal’s equation, the ratio for the non-flanging wheel
is described by the friction coefficient between the wheel tread and the rail crown regions with a
relatively low contact angle, ranging from 0 to 3°. It has been suggested that the Weinstock criterion
based on the summation of the Y/Q ratios of the wheelset and the coefficient of friction on the non-
flanging wheel tread region (𝜇𝑡 ) can provide a more accurate indication of the impending
derailment for small or negative angles of attack. The Weinstock criterion is given as [38]:
-0.1
0
0.1
0.2
0.3
0.4
0.5
0.6
0 5 10 15 20
Y/Q
Time (s)
Rigid
Liquid
𝑤𝑠𝑡1𝑙
-0.1
0
0.1
0.2
0.3
0.4
0.5
0.6
0 5 10 15 20
Time (s)
𝑤𝑠𝑡1𝑟
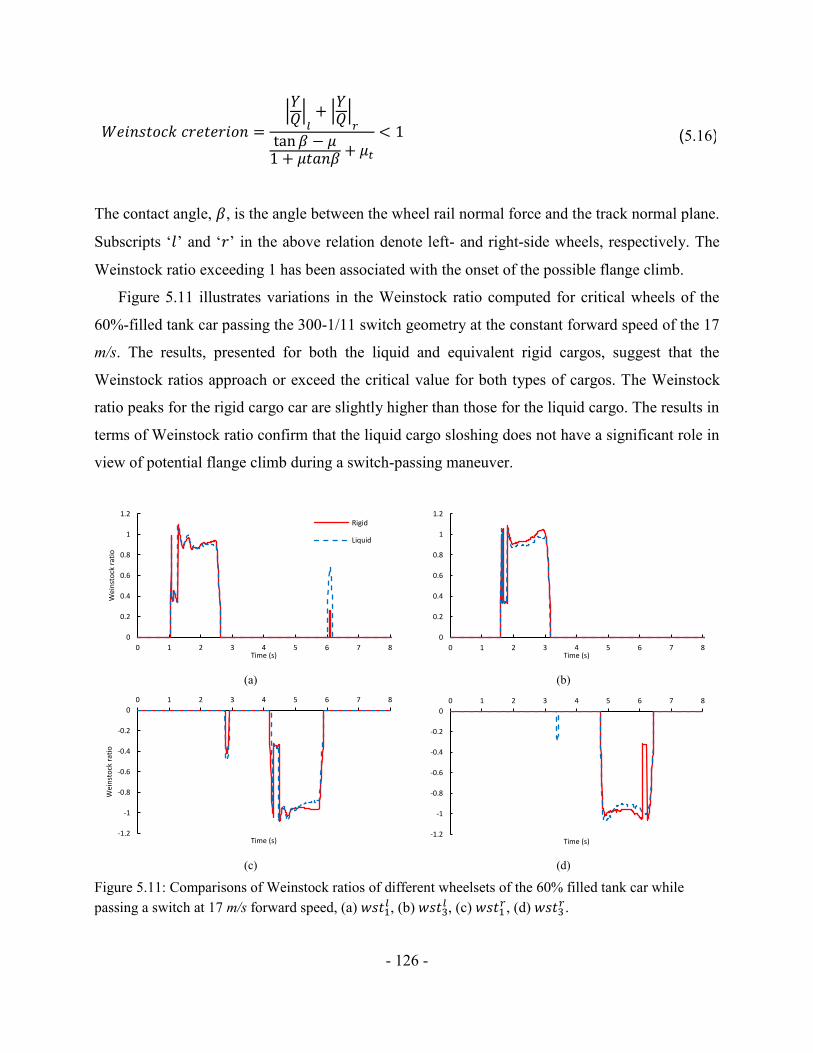
- 126 -
𝑊𝑒𝑖𝑛𝑠𝑡𝑜𝑐𝑘 𝑐𝑟𝑒𝑡𝑒𝑟𝑖𝑜𝑛 =
|𝑌𝑄|𝑙
+ |𝑌𝑄|𝑟
tan 𝛽 − 𝜇1 + 𝜇𝑡𝑎𝑛𝛽
+ 𝜇𝑡
< 1 (5.16)
The contact angle, 𝛽, is the angle between the wheel rail normal force and the track normal plane.
Subscripts ‘𝑙’ and ‘𝑟’ in the above relation denote left- and right-side wheels, respectively. The
Weinstock ratio exceeding 1 has been associated with the onset of the possible flange climb.
Figure 5.11 illustrates variations in the Weinstock ratio computed for critical wheels of the
60%-filled tank car passing the 300-1/11 switch geometry at the constant forward speed of the 17
m/s. The results, presented for both the liquid and equivalent rigid cargos, suggest that the
Weinstock ratios approach or exceed the critical value for both types of cargos. The Weinstock
ratio peaks for the rigid cargo car are slightly higher than those for the liquid cargo. The results in
terms of Weinstock ratio confirm that the liquid cargo sloshing does not have a significant role in
view of potential flange climb during a switch-passing maneuver.
(a) (b)
(c) (d)
Figure 5.11: Comparisons of Weinstock ratios of different wheelsets of the 60% filled tank car while
passing a switch at 17 m/s forward speed, (a) 𝑤𝑠𝑡1𝑙 , (b) 𝑤𝑠𝑡3
𝑙 , (c) 𝑤𝑠𝑡1𝑟, (d) 𝑤𝑠𝑡3
𝑟.
0
0.2
0.4
0.6
0.8
1
1.2
0 1 2 3 4 5 6 7 8
Wei
nst
ock
rat
io
Time (s)
Rigid
Liquid
0
0.2
0.4
0.6
0.8
1
1.2
0 1 2 3 4 5 6 7 8Time (s)
-1.2
-1
-0.8
-0.6
-0.4
-0.2
0
0 1 2 3 4 5 6 7 8
Wei
nst
ock
rat
io
Time (s)-1.2
-1
-0.8
-0.6
-0.4
-0.2
0
0 1 2 3 4 5 6 7 8
Time (s)
- 127 -
5.4.3 Critical switch negotiation speeds
The results presented in Figures 5.6 and 5.9 show significant effects of liquid slosh on the roll
dynamic and lateral load shift (unloading ratio) characteristics of the car during the switch-passing
maneuver. The peak roll angle and unloading ratio responses, however, are strongly related to
geometry of the switch and forward speed apart from the liquid cargo fill ratio. Simulations are
performed to identify the critical forward speeds while negotiating a switch. The studies reporting
dynamics of partly filled road tankers have shown significant effects of liquid cargo movements
on the roll stability limits and overturning of the vehicle [7, 98, 126]. The rollover potential of a
road vehicle during path change maneuver is generally assessed in terms of lateral load transfer
ratio (LTR). The LTR ratio describes the magnitude of load transfer occurring laterally from inside
to the outside tires of the vehicle that may be considered to represent the unloading ratio of a
railway car during a switch-passing maneuver. Critical speed while passing a switch is defined as
the speed when absolute value of the peak unloading ratio approaches the critical value of 0.8. The
critical speeds are evaluated for different fill ratios, ranging from 40 to 97%, and two different
switch geometries, namely, 300-1/11 and 200-1/9. The 1/9 switch represents a relatively more
severe geometry and would yield higher lateral acceleration excitation to the liquid cargo.
Simulations for each fill condition and switch geometry are performed under increasing values of
constant forward speed until the critical speed at which peak unloading ratio approaches 0.8.
Figure 5.12 presents critical speeds of the liquid cargo tank car with fill ratio ranging from 40
to 97%, while negotiating the two different switches. The figure also presents the critical speeds
obtained for the car with equivalent rigid cargo in the same fill ratio range. The results show
opposing trends in critical speeds of the car with increasing fill ratios of the liquid and equivalent
rigid cargos. Moreover, the results obtained for both the switch geometries show comparable
trends, although the critical speeds obtained for 1/9 switch are considerably lower than those for
the 1/11 switch geometry, as it would be expected. For the rigid cargo car subject to both switch
geometries, the critical speed increases with decreasing fill ratio due to the resulting lower c.g.
height. The critical speed obtained for the liquid cargo tank car, however, decreases with decreasing
fill ratio despite the lower c.g. height of the tank car. This tendency is attributed to higher lateral
load shift, lateral force and roll moment caused by enhanced movement of the free surface under
lower fill ratios. Such an opposing tendency in the liquid and equivalent rigid cargo vehicles has
also been reported in curving responses of tank car [131], and rollover threshold lateral acceleration
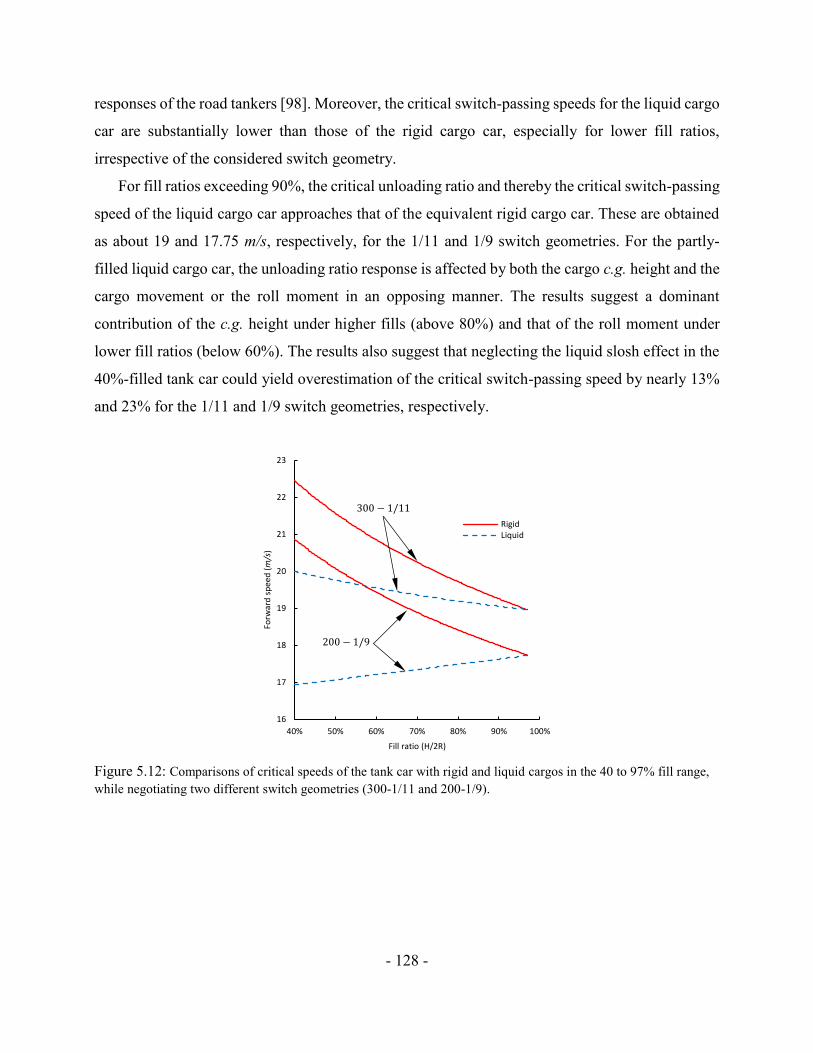
- 128 -
responses of the road tankers [98]. Moreover, the critical switch-passing speeds for the liquid cargo
car are substantially lower than those of the rigid cargo car, especially for lower fill ratios,
irrespective of the considered switch geometry.
For fill ratios exceeding 90%, the critical unloading ratio and thereby the critical switch-passing
speed of the liquid cargo car approaches that of the equivalent rigid cargo car. These are obtained
as about 19 and 17.75 m/s, respectively, for the 1/11 and 1/9 switch geometries. For the partly-
filled liquid cargo car, the unloading ratio response is affected by both the cargo c.g. height and the
cargo movement or the roll moment in an opposing manner. The results suggest a dominant
contribution of the c.g. height under higher fills (above 80%) and that of the roll moment under
lower fill ratios (below 60%). The results also suggest that neglecting the liquid slosh effect in the
40%-filled tank car could yield overestimation of the critical switch-passing speed by nearly 13%
and 23% for the 1/11 and 1/9 switch geometries, respectively.
Figure 5.12: Comparisons of critical speeds of the tank car with rigid and liquid cargos in the 40 to 97% fill range,
while negotiating two different switch geometries (300-1/11 and 200-1/9).
16
17
18
19
20
21
22
23
40% 50% 60% 70% 80% 90% 100%
Forw
ard
sp
eed
(m/s
)
Fill ratio (H/2R)
RigidLiquidRigidLiquidLog. (Rigid)Poly. (Liquid)RigidLiquid
200 − 1/9
300 − 1/11
- 129 -
5.5 Conclusions
The co-simulation of liquid cargo with a multibody dynamic model of a partly filled railway tank
car was used to evaluate dynamic response of the coupled system subject to the switch negotiation.
It is shown that the linear slosh model involving summation of first four antisymmetric natural
modes can provide accurate estimations of the slosh force and roll moment under lateral
acceleration excitation encountered during a switch-passing maneuver. Compared to nonlinear
computational fluid dynamic (CFD) methods, the linear slosh model can be conveniently integrated
to the railway car model to perform analyses of the coupled system in a highly efficient manner.
The results obtained for the coupled vehicle and liquid slosh model clearly showed strong
interactions between the switch-induced transient liquid slosh and vehicle dynamics for partial-fill
conditions. The dynamic liquid slosh force and roll moment contributed to notably higher roll angle
response of car body and lateral load transfer, especially under the lower fill ratio of 60%. The
unloading ratio could approach critical value in the presence of fluid slosh, especially when the fill
ratio occurs in the 50-60% range. The lateral force and roll angle responses showed dominant
oscillations near the fundamental slosh frequency. The effect of fluid slosh on the car body roll
angle and wheelset unloading ratio was observed to diminish with fill ratio above 90%, despite the
higher c.g., which was attributed to reduced free surface length under higher fill ratio. The results
of the study revealed nearly negligible effect of the fluid slosh on the derailment or flange climb
potential during a switch-passing maneuver.
- 130 -
CHAPTER 6
Conclusions and recommendations
The safety concerns related to liquid cargo slosh in road tanker vehicles are widely accepted, yet
there has been only a handful of comprehensive study due to complexities and computational
demand associated with co-simulation of numerical fluid slosh and vehicle models. For railway
tanker vehicles, on the other hand, the possibility of safety hazard from sloshing of liquid cargo
and associated forces are relatively new concern stemmed from several catastrophic derailments
and tanker spills of dangerous liquid cargo reported in recent years. There has been very limited
and simplified preliminary studies that attempt to investigate the effects of liquid cargo slosh in a
railway tanker cars. This dissertation research presents a comprehensive method for incorporating
the dynamic effect of liquid cargo movements in dynamic analysis of railway tank cars. The
developed coupled vehicle/cargo dynamic model incorporates the nonlinearities of the vehicle
system and force response of liquid sloshing for different fill conditions. The study examines the
effects of liquid slosh on the lateral stability characteristics and the associated critical hunting
speed. Further simulations investigate crucial roll response and derailment potentials of the
partially filled tank cars subject to curving and track-switch manoeuvers. The significant aspects
of the dissertation research and the contributions are highlighted in this section. The following
sections outline the major conclusions drawn from this investigation and a list of recommendation
for further studies.
6.1 Major contributions and highlights of the dissertation research
A comprehensive model of a typical freight wagon, which incorporates detail nonlinear
characteristics of the secondary suspension system, was developed systematically.
Highly nonlinear suspension damping properties due to friction wedges used in three-piece
bogies were modelled based on points-plane contact method to facilitate parametric study.
In comparison to reported methodologies, the proposed method for characterizing the
damping properties of the suspension was presented to be highly effective and more
importantly, computationally efficient.
An analytical liquid slosh model based on multimodal approach was formulated and
validated to be used for different excitations appropriate for hunting, curving, and switch
passing of a typical railway tank car.
- 131 -
A simplified method to incorporate the effects of liquid sloshing subject to yaw excitation
of the tank was developed and validated. The model was essential for meaningful
investigation of slosh effect on rail tanker dynamics.
A method for identification of roll moment of inertia of liquid cargo for different fill ratios
was presented for circular cross section tank. The roll moment of inertia of liquid cargo was
observed to be lower than equivalent rigid cargo.
The detailed MBD model of tank car was co-simulated with liquid cargo model to perform
different dynamic simulations in a time-efficient manner.
The effects of liquid cargo sloshing on wheel-rail lateral and vertical forces, the roll angle
of car body and different dynamic safety measures are investigated and compared with
those predicted for equivalent rigid cargo, as well as simplified pendulum slosh mode.
The critical speeds of partly filled tank car in terms of hunting, as well as performance limits
for curving, and switch passing are identified for different fill conditions.
6.2 Major conclusions
The significant findings and conclusions drawn from the studies are summarized below:
The MBD simulation of the suspension system of three-piece bogie using proposed method
revealed relatively lower damping levels in both the lateral and vertical directions for the
unloaded wagon compared to the loaded wagon.
For lateral stability, a subcritical Hopf bifurcation in the responses of the wagon was
identified. The sensitivity analysis of the nonlinear system revealed strong dependency of
the lateral stability characteristics of the system on both the forward speed and the track
disturbance amplitude. Furthermore, at higher forward speeds, the lateral oscillation is
observed to be at higher frequency and the magnitude of oscillation limited by the flange is
also higher indicating partial wheel climb tendency.
Among suspension parameters, an increase in the wedge angle yield substantial gain in the
critical speed, while increasing the friction coefficient of the contact surfaces resulted in an
only marginal increase in the critical speed. Increasing the surface friction, however, could
cause more chaotic lateral oscillations of the system at higher speeds. Increasing the preload
of the spring on the wedge could further help limit wheelset lateral oscillations leading to
higher critical speeds.
- 132 -
The critical hunting speed of partly loaded wagon was observed to be higher than an empty
wagon. The trend was attributed to higher damping characteristics of the suspension system
under different loading conditions.
Linear fluid slosh model with four anti-symmetric natural mode shapes of a partially filled
cargo was shown to be adequate for fill levels in the range of 40 to 97%. The approach was
found to be accurate and highly computing efficient. The coupled dynamic model was
realized by co-simulation of the linear slosh model and the nonlinear multi-body tank car
model.
A very good correlation was observed between the analytical liquid slosh model with
reported values and alternative methods in terms of natural frequencies of natural modes of
slosh and force response of the slosh model subject to excitations in railway application.
The roll moment of inertia of the liquid cargo compare to rigid one is shown to be lower as
the body can roll with respect to liquid cargo. This in turn effectively contribute as a damper
and leads to higher critical hunting speed in high fill conditions of the tank. This effect was
observed for fill ratio conditions higher than 80%.
On the other hand, consideration of liquid cargo with proposed slosh model in partly filled
conditions led to lower critical speed compared to the results obtained from frozen and
pendulum approaches in moderately filled conditions. The liquid slosh response in partly
filled condition tend to eliminate the damping effect of the cargo observed using simple
pendulum approach.
Furthermore, initiation of the yaw oscillations of car body introduced an additional slosh
moment and led to lower critical speed in moderated fill conditions.
The study revealed that for a typical curving maneuver, the fluid slosh effect of 60 to 70%
fill level could lead to roll angles of the car body that is more than twice that of equivalent
rigid cargo. The comparison of derailment quotient (Y/Q ratio) consistently show slightly
higher value due to fluid slosh during curving. The magnitude was however significantly
lower than critical for the considered geometry of curving manoeuvre.
The results show that the track super-elevation in a curve tends to reduce the contributions
of liquid cargo sloshing while the travelling speed of tank car is close to the balance speed
of the curve.
- 133 -
The curving performance of tank car in partially filled condition is evaluated in terms of
unloading ratio, as well as lateral load transfer, derailment quotient and flange climb onset
of wheelsets.
For low to moderate fill levels, the sloshing of liquid cargo reduces the critical speed in
view of curving performance. On a 600 m-radius curve, the critical speed of the 50% filled
tank car can be overestimated by as much as 20% in the event sloshing is not considered.
The transient liquid sloshing in a switch-passing manoeuvre led to the higher roll angle of
car-body, track lateral load, and unloading ratio when compared to rigid cargo. The
dynamic response of partly filled tank car, however, indicated that the liquid cargo sloshing
did not have a significant effect in view of potential flange climb during a switch-passing
manoeuvre. On the other hand, the initiation of free movements of liquid cargo in partly
filled condition led to lightly damped lateral oscillation response in the tangent section of
the switch.
The dynamic liquid slosh force and roll moment contributed to notably higher roll angle
response of car body and lateral load transfer, especially under the lower fill ratio of 60%.
The unloading ratio could approach critical value in the presence of fluid slosh, mainly for
the fill ratio in the 50-60% range. The lateral force and roll angle responses showed
dominant oscillations near the fundamental slosh frequency.
The effect of fluid slosh on the car body roll angle and wheelset unloading ratio were
observed to diminish with fill ratio above 90%, which was attributed to reduced free surface
length under higher fill ratio. The results of the study revealed nearly negligible effect of
the liquid sloshing on the derailment or flange climb potential during a switch-passing
manoeuvre.
The critical switch passing speeds of partly filled tanks are identified for two deferent
switch geometries and fill condition of liquid cargo from 40% to 97%. For 40% fill
condition, the liquid slosh can yield critical speed that is 23% lower than that predicted for
rigid cargo.
- 134 -
6.3 Recommendations for future studies
The proposed vehicle/liquid cargo dynamic model can serve as an effective tool for safety
assessment and dynamic simulation of railway tank car. The liquid cargo model has been directly
integrated to multi-body dynamic model of the railway tank car for coupled simulation. The idea
could be extended to other MBD applications like road vehicles. Moreover, the detail model of the
suspension system of the three-piece bogie considered in this investigation could also be applied
for simulation of a defect in the system as well as improvement of the design. Owing to the high
computation efficiency of the liquid model, it is feasible to apply the method for iterative
simulations or optimization studies. Particular recommendations for future work may include the
following:
The proposed model of wedges contact could be applied to evaluate the effects of worn
wedges and increased clearances, and for identifying optimal wedge design.
The tuning of the properties of different components of suspension system of three-piece
bogie is possible with applied modelling approach.
The method is capable of simulating highly nonlinear characteristics of the system and can
be extended to include other nonlinearities in the system.
The analytical liquid sloshing model could be applied to different field of transportation
like road or tracked vehicles.
Owing to high computation efficiency of the coupled model, the iterative simulation like
wear evolution in wheel and rail profiles are feasible. Moreover, higher lateral and normal
load transfer, that stem from liquid sloshing, could lead to possible crack propagation in the
different sections of the curve and switch sections of the track. The issue has not yet been
addressed in the literature.
The liquid cargo model could be extended to simulate longitudinal and three-dimensional
liquid cargo sloshing. The model then could be coupled with MBD models to evaluate the
dynamic response of the partly filled tank car subject to multi-directional time variable
acceleration inputs.
In longitudinal train dynamic analysis, the transient longitudinal liquid slosh could affect
the coupling forces and stopping distance. The issue has not been yet investigated in the
literature.
- 135 -
References
[1] Transportation Safety Board of Canada (2014). Statistical Summery-Railway Occurrences.
2014.
[2] Rolling Stock: Locomotives and Rail Cars, United States International Trade Commission,.
2011.
[3] Younesian D, Abedi M and Hazrati Ashtiani I, Dynamic analysis of a partially filled tanker
train travelling on a curved track. International Journal of Heavy Vehicle Systems, 2010.
17(3): p. 331-358.
[4] Shabana AA, Nadal’s Formula and High Speed Rail Derailments. Journal of Computational
and Nonlinear Dynamics, 2012. 7(4): p. 041003.
[5] Shi H, Wang L, Nicolsen B, and Shabana AA, Integration of geometry and analysis for the
study of liquid sloshing in railroad vehicle dynamics. Proceedings of the Institution of
Mechanical Engineers, Part K: Journal of Multi-body Dynamics, 2017. 231(4): p. 608-629.
[6] Kolaei A, Rakheja S and Richard MJ, A coupled multimodal and boundary-element method for
analysis of anti-slosh effectiveness of partial baffles in a partly-filled container. Computers
& Fluids, 2015. 107: p. 43-58.
[7] Ranganathan R, Rakheja S and Sankar S, Directional response of a B-train vehicle combination
carrying liquid cargo. Journal of dynamic systems, measurement, and control, 1993. 115(1):
p. 133-139.
[8] Rakheja S and Ranganathan R, Estimation of the rollover threshold of heavy vehicles carrying
liquid cargo: a simplified approach. International Journal of Heavy Vehicle Systems, 1993.
1(1): p. 79-98.
[9] Shabana AA, Zaazaa KE and Sugiyama H, Railroad vehicle dynamics: A computational
approach. 2010: CRC Press.
[10] Garg VK and Dukkipati RV, Dynamics of railway vehicle systems. 1984: Academic Press,
New York.
[11] True H, A method to investigate the nonlinear oscillations of a railway vehicle, in Applied
Mechanics Rail Transportation Symposium. 1988.
[12] Polach O, Comparability of the non-linear and linearized stability assessment during railway
vehicle design. Vehicle System Dynamics, 2006. 44(sup1): p. 129-138.
[13] 49CFR238, (2003). FRA regulations, Title 49: Transportation, Part 238 – Passenger
Equipment Safety Standards, Revised 1 October 2003. Federal Railroad Administration.
[14] UIC Code 518, Testing and approval of railway vehicles from the point of view of their
dynamic behaviour – safety – track fatigue – ride quality. 2003: Paris.
[15] BS EN 14 363. Railway applications – testing for the acceptance of running characteristics of
railway vehicles – testing of running behaviour and stationary tests. 2005, CEN: Brussels.
[16] UIC519: Method for determining the equivalent conicity. 2004, International Union of
Railways: Paris.
[17] Wrang M, Li M, Sundvall P, and Jahlenius Å, Assessing wheel-rail contact conditions based
on in-service values of equivalent conicity and radial steering index, in IAVSD Symposium.
2009: Stockholm.
[18] Huilgol R, Hopf-Friedrichs Bifurcation and Hunting of a Railway Axle. Quarterly of Applied
Mathematics, 1978. 36(1): p. 85-94.
[19] True H, Some Recent Developments in Nonlinear Railway Vehicle Dynamics. Mathematical
Research, 1993. 72: p. 129-130.
- 136 -
[20] Polach O, On Non-Linear Methods of Bogie Stability Assessment Using Computer Simulations.
Proceedings of the Institution of Mechanical Engineers, Part F: Journal Of Rail And Rapid
Transit, 2006. 220(1): p. 13-27.
[21] Yang S and Chen E, The Hopf Bifurcation in a Railway Bogie with Hysteretic Nonlinearity.
Journal of the China Railway Society, 1993. 15(4).
[22] Wickens A, Comparative Stability of Bogie Vehicles With Passive and Active Guidance as
Influenced by Friction and Traction. Vehicle System Dynamics, 2009. 47(9): p. 1137-1146.
[23] Wu Q, Cole C, Spiryagin M, and Sun YQ, A review of dynamics modelling of friction wedge
suspensions. Vehicle System Dynamics, 2014. 52(11): p. 1389-1415.
[24] Gardner JF and Cusumano JP. Dynamic models of friction wedge dampers. in Railroad
Conference, 1997., Proceedings of the 1997 IEEE/ASME Joint. 1997. IEEE.
[25] Hazrati Ashtiani I, Rakheja S, Ahmed AKW, and Zhang J, Hunting analysis of a partially-
filled railway tank car, in 2015 Joint Rail Conference. 2015, American Society of
Mechanical Engineers: San Jose, CA. p. V001T10A003-V001T10A003.
[26] Orlova A and Romen Y, Refining the wedge friction damper of three-piece freight bogies.
Vehicle System Dynamics, 2008. 46(S1): p. 445-455.
[27] Iwnicki S, Stichel S, Orlova A, and Hecht M, Dynamics of railway freight vehicles. Vehicle
system dynamics, 2015. 53(7): p. 995-1033.
[28] Hazrati Ashtiani I, Optimization of secondary suspension of three-piece bogie with bevelled
friction wedge geometry. International Journal of Rail Transportation, 2017. 5(4): p. 213-
228.
[29] Harder RF. Dynamic modeling and simulation of three-piece freight vehicle suspensions with
nonlinear frictional behaviour using adams/rail. in IEEE/ASME Joint Rail Conference.
2001. IEEE.
[30] Klauser PE. Modeling Friction Wedges: Part II—An Improved Model. in ASME International
Mechanical Engineering Congress and Exposition. 2004.
[31] Xia F, Modelling of a Two-Dimensional Coulomb Friction Oscillator. Journal of Sound and
Vibration, 2003. 265(5): p. 1063-1074.
[32] Kaiser AB, Cusumano J and Gardner J, Modeling and dynamics of friction wedge dampers in
railroad freight trucks. Vehicle System Dynamics, 2002. 38(1): p. 55-82.
[33] Steets J, Chan B and Sandu C. A multibody dynamics approach to friction wedge modeling
for freight train suspensions. in ASME/IEEE 2007 Joint Rail Conference and Internal
Combustion Engine Division Spring Technical Conference. 2007. American Society of
Mechanical Engineers.
[34] Hazrati Ashtiani I, Ahmed AKW, Rakheja S, and Zhang J, Hunting characteristics of a freight
car in presence of secondary suspension non-smooth contact dynamics, in IMECE2014.
2014, ASME: Montreal, Canada.
[35] Hazrati Ashtiani I, Rakheja S and Ahmed AKW, Influence of friction wedge characteristics
on lateral response and hunting of freight wagons with three-piece bogies. Proceedings of
the Institution of Mechanical Engineers, Part F: Journal of Rail and Rapid Transit, 2016.
231(8): p. 877-891.
[36] Shabana AA, Tobaa M, Sugiyama H, and Zaazaa KE, On the computer formulations of the
wheel/rail contact problem. Nonlinear Dynamics, 2005. 40(2): p. 169-193.
[37] Shabana AA, Zaazaa KE, Escalona JL, and Sany JR, Development of elastic force model for
wheel/rail contact problems. Journal of sound and vibration, 2004. 269(1-2): p. 295-325.
[38] Iwnicki S, Handbook of railway vehicle dynamics. 2006: CRC press.
- 137 -
[39] Sugiyama H and Suda Y, On the contact search algorithms for wheel/rail contact problems.
Journal of Computational and Nonlinear Dynamics, 2009. 4(4): p. 041001.
[40] Vollebregt E, Iwnicki S, Xie G, and Shackleton P, Assessing the accuracy of different
simplified frictional rolling contact algorithms. Vehicle System Dynamics, 2012. 50(1): p.
1-17.
[41] Sugiyama H, Araki K and Suda Y, On-line and off-line wheel/rail contact algorithm in the
analysis of multibody railroad vehicle systems. Journal of mechanical science and
technology, 2009. 23(4): p. 991-996.
[42] Carter F. On the action of a locomotive driving wheel. in Proc. R. Soc. Lond. A. 1926. The
Royal Society.
[43] Alonso A and Giménez J, Tangential problem solution for non-elliptical contact areas with
the FastSim algorithm. Vehicle System Dynamics, 2007. 45(4): p. 341-357.
[44] Vermeulen P and Johnson K, Contact of nonspherical elastic bodies transmitting tangential
forces. Journal of Applied Mechanics, 1964. 31: p. 338.
[45] Kalker JJ, Three-dimensional elastic bodies in rolling contact. Vol. 2. 2013: Springer Science
& Business Media.
[46] Giménez J, Alonso A and Gómez* E, Introduction of a friction coefficient dependent on the
slip in the FastSim algorithm. Vehicle System Dynamics, 2005. 43(4): p. 233-244.
[47] Piotrowski J and Kik W, A simplified model of wheel/rail contact mechanics for non-Hertzian
problems and its application in rail vehicle dynamic simulations. Vehicle System
Dynamics, 2008. 46(1-2): p. 27-48.
[48] Shen Z and Li Z, A fast non-steady state creep force model based on the simplified theory.
Wear, 1996. 191(1-2): p. 242-244.
[49] Alonso A and Giménez J, Non-steady state modelling of wheel-rail contact problem for the
dynamic simulation of railway vehicles. Vehicle System Dynamics, 2008. 46(3): p. 179-
196.
[50] True H and Kaas-Petersen C, A bifurcation analysis of nonlinear oscillations in railway
vehicles. Vehicle System Dynamics, 1983. 12(1-3): p. 5-6.
[51] Spinola Barbosa R, A 3D contact force safety criterion for flange climb derailment of a railway
wheel. Vehicle System Dynamics, 2004. 42(5): p. 289-300.
[52] Wilson N, Fries R, Witte M, Haigermoser A, Wrang M, Evans J, and Orlova A, Assessment
of safety against derailment using simulations and vehicle acceptance tests: a worldwide
comparison of state-of-the-art assessment methods. Vehicle System Dynamics, 2011. 49(7):
p. 1113-1157.
[53] Cheng Y-C and Hsu C-T, Hunting stability and derailment analysis of a car model of a railway
vehicle system. Proceedings of the Institution of Mechanical Engineers, Part F: Journal of
Rail and Rapid Transit, 2012. 226(2): p. 187-202.
[54] Jun X and Qingyuan Z, A study on mechanical mechanism of train derailment and preventive
measures for derailment. Vehicle System Dynamics, 2005. 43(2): p. 121-147.
[55] Xiang J, Zeng Q and Lou P, Transverse vibration of train-bridge and train-track time varying
system and the theory of random energy analysis for train derailment. Vehicle System
Dynamics, 2004. 41(2): p. 129-155.
[56] Blader F, A review of literature and methodologies in the study of derailments caused by
excessive forces at the wheel/rail interface. 1990: Association of American Railroads,
Research & Test Department.
- 138 -
[57] ČSN E, 14363: 2006 Railway applications – Testing for the acceptance of running
characteristics of railway vehicles – Testing of running behaviour and stationary tests, in
Czech Institute for Normalisation 2006.
[58] AAR Mechanical Division M1001 AAR manual of standards and recommended practices, in
Section C-Part II. 1993.
[59] Braghin F, Bruni S and Diana G, Experimental and numerical investigation on the derailment
of a railway wheelset with solid axle. Vehicle System Dynamics, 2006. 44(4): p. 305-325.
[60] Bauer HF, On the Destabilizing Effect of Liquids in Various Vehicles (part 1). Vehicle system
dynamics, 1972. 1(3-4): p. 227-260.
[61] Zhao W, Yang J and Hu Z, Effects of sloshing on the global motion responses of FLNG. Ships
and Offshore Structures, 2013. 8(2): p. 111-122.
[62] Kim Y, Nam B, Kim D, and Kim Y, Study on coupling effects of ship motion and sloshing.
Ocean Engineering, 2007. 34(16): p. 2176-2187.
[63] D'Alenssandro V. 2012. Modeling of tank vehicle dynamics by fluid sloshing coupled
simulation. Italy.
[64] Kolaei A, Rakheja S and Richard MJ, Range of applicability of the linear fluid slosh theory
for predicting transient lateral slosh and roll stability of tank vehicles. Journal of Sound
and Vibration, 2014. 333(1): p. 263-282.
[65] Ibrahim RA, Liquid sloshing dynamics: theory and applications. 2005: Cambridge University
Press.
[66] Rakheja S, Sankar S and Ranganathan R, Roll plane analysis of articulated tank vehicles
during steady turning. Vehicle System Dynamics, 1988. 17(1-2): p. 81-104.
[67] Ibrahim RA, Pilipchuk V and Ikeda T, Recent advances in liquid sloshing dynamics. Applied
Mechanics Reviews, 2001. 54(2): p. 133-199.
[68] Popov G, Sankar S and Sankar T, Shape optimization of elliptical road containers due to liquid
load in steady-state turning. Vehicle system dynamics, 1996. 25(3): p. 203-221.
[69] Zhanqi W, Rakheja S and Cunzhen S, Influence of partition location on the braking
performance of a partially-filled tank truck. 1995, SAE Technical Paper.
[70] Kang X. 2001. Optimal tank design and directional dynamic analysis of liquid cargo vehicles
under steering and braking. Concordia University.
[71] Modaressi-Tehrani K, Rakheja S and Sedaghati R, Analysis of the overturning moment caused
by transient liquid slosh inside a partly filled moving tank. Proceedings of the Institution of
Mechanical Engineers, Part D: Journal of Automobile Engineering, 2006. 220(3): p. 289-
301.
[72] Yan G, Rakheja S and Siddiqui K, Analysis of transient fluid slosh in partly-filled tanks with
and without baffles: Part 1–model validation. International Journal of Heavy Vehicle
Systems, 2010. 17(3): p. 359-379.
[73] Romero J, Ramírez O, Fortanell J, Martínez M, and Lozano A, Analysis of lateral sloshing
forces within road containers with high fill levels. Proceedings of the Institution of
Mechanical Engineers, Part D: Journal of Automobile Engineering, 2006. 220(3): p. 303-
312.
[74] Dodge F, The new” Dynamic Behavior of Liquids in Moving Containers,” 2000. Southwest
Research Institute, San Antonio, TX.
[75] McCarty JL and Stephens DG, Investigation of the natural frequencies of fluids in spherical
and cylindrical tanks. 1960: National Aeronautics and Space Administration.
- 139 -
[76] Hasheminejad SM and Mohammadi M, Effect of anti-slosh baffles on free liquid oscillations
in partially filled horizontal circular tanks. Ocean Engineering, 2011. 38(1): p. 49-62.
[77] Hasheminejad SM and Aghabeigi M, Liquid sloshing in half-full horizontal elliptical tanks.
Journal of sound and vibration, 2009. 324(1): p. 332-349.
[78] Faltinsen OM and Timokha AN, A multimodal method for liquid sloshing in a two-
dimensional circular tank. Journal of Fluid Mechanics, 2010. 665: p. 457-479.
[79] Zang Y, Xue S and Kurita S, A boundary element method and spectral analysis model for
small‐amplitude viscous fluid sloshing in couple with structural vibrations. International
journal for numerical methods in fluids, 2000. 32(1): p. 69-83.
[80] Firouz‐Abadi R, Haddadpour H, Noorian M, and Ghasemi M, A 3D BEM model for liquid
sloshing in baffled tanks. International journal for numerical methods in engineering, 2008.
76(9): p. 1419-1433.
[81] Rebouillat S and Liksonov D, Fluid–structure interaction in partially filled liquid containers:
a comparative review of numerical approaches. Computers & Fluids, 2010. 39(5): p. 739-
746.
[82] Fleissner F, Lehnart A and Eberhard P, Dynamic simulation of sloshing fluid and granular
cargo in transport vehicles. Vehicle System Dynamics, 2010. 48(1): p. 3-15.
[83] Popov G, Sankar S, Sankar T, and Vatistas G, Dynamics of liquid sloshing in horizontal
cylindrical road containers. Proceedings of the Institution of Mechanical Engineers, Part
C: Journal of Mechanical Engineering Science, 1993. 207(6): p. 399-406.
[84] Modaressi-Tehrani K, Rakheja S and Stiharu I, Three-dimensional analysis of transient slosh
within a partly-filled tank equipped with baffles. Vehicle System Dynamics, 2007. 45(6):
p. 525-548.
[85] Ranganathan R, Ying Y and Miles J, Analysis of fluid slosh in partially filled tanks and their
impact on the directional response of tank vehicles. 1993.
[86] Ranganathan R, Ying Y and Miles J, Development of a mechanical analogy model to predict
the dynamic behavior of liquids in partially filled tank vehicles. 1994, SAE Technical Paper.
[87] Salem M, Mucino V, Saunders E, and Gautam M, Lateral sloshing in partially filled elliptical
tanker trucks using a trammel pendulum. International Journal of Heavy Vehicle Systems,
2009. 16(1): p. 207-224.
[88] Abramson HN, The dynamic behavior of liquids in moving containers. NASA SP-106. NASA
Special Publication, 1966. 106.
[89] Roberts JR and Chen P-Y, Slosh design handbook I. Vol. 406. 1966: National Aeronautics
and Space Administration.
[90] Budiansky B, Sloshing of liquids in circular canals and spherical tanks. 1958, DTIC
Document.
[91] Khandelwal R and Nigam N, Digital simulation of the dynamic response of a vehicle carrying
liquid cargo on a random uneven surface. Vehicle System Dynamics, 1982. 11(4): p. 195-
214.
[92] Bogomaz G, Markova O and Chernomashentseva YG, Mathematical modelling of vibrations
and loading of railway tanks taking into account the liquid cargo mobility. Vehicle System
Dynamics, 1998. 30(3-4): p. 285-294.
[93] Ranganathan R, Rakheja S and Sankar S, Influence of liquid load shift on the dynamic response
of articulated tank vehicles. Vehicle System Dynamics, 1990. 19(4): p. 177-200.
[94] Di Gialleonardo E, Premoli A, Gallazzi S, and Bruni S, Sloshing effects and running safety in
railway freight vehicles. Vehicle System Dynamics, 2013. 51(10): p. 1640-1654.
- 140 -
[95] Vera C, Paulin J, Suarez B, and Gutiérrez M, Simulation of freight trains equipped with
partially filled tank containers and related resonance phenomenon. Proceedings of the
Institution of Mechanical Engineers, Part F: Journal of Rail and Rapid Transit, 2005. 219(4):
p. 245-259.
[96] Hazrati Ashtiani I, Rakheja S and Ahmed AKW, Hunting and derailment analyses of a partly-
filled railway tanker, in International Heavy Haul Association Conference. 2015: Pert,
Australia.
[97] Yan G, Siddiqui K, Rakheja S, and Modaressi K, Transient fluid slosh and its effect on the
rollover-threshold analysis of partially filled conical and circular tank trucks. International
journal of heavy vehicle systems, 2005. 12(4): p. 323-343.
[98] Kolaei A, Rakheja S and Richard MJ, Effects of tank cross-section on dynamic fluid slosh
loads and roll stability of a partly-filled tank truck. European Journal of Mechanics-
B/Fluids, 2014. 46: p. 46-58.
[99] Kolaei A, Hazrati Ashtiani I, Abedi M, and Rakheja S, Application of linear slosh theory on
stability of the B-train combination, in 24th International Symposium on Dynamics of
Vehicles on Roads and Tracks (IAVSD 2015). 2015: Graz, Austria.
[100] Wu X and Chi M, Parameters study of Hopf bifurcation in railway vehicle system. Journal
of Computational and Nonlinear Dynamics, 2015. 10(3): p. 031012.
[101] Ahmadian M and Yang S, Hopf bifurcation and hunting behavior in a rail wheelset with
flange contact. Nonlinear Dynamics, 1998. 15(1): p. 15-30.
[102] Chengrong H and Feisheng Z, The numerical bifurcation method of nonlinear lateral stability
analysis of a locomotive. Vehicle System Dynamics, 1994. 23(S1): p. 234-245.
[103] True H, Engsig-Karup AP and Bigoni D, On the numerical and computational aspects of
non-smoothnesses that occur in railway vehicle dynamics. Mathematics and Computers in
Simulation, 2014. 95: p. 78-97.
[104] Kalker J, A fast algorithm for the simplified theory of rolling contact. Vehicle System
Dynamics, 1982. 11(1): p. 1-13.
[105] Gao X-j, True H and Li Y-h, Lateral dynamic features of a railway vehicle. Proceedings of
the Institution of Mechanical Engineers, Part F: Journal of Rail and Rapid Transit, 2015.
[106] Molatefi H, Hecht M and Kadivar M, Effect of suspension system in the lateral stability of
railway freight trucks. Proceedings of the Institution of Mechanical Engineers, Part F:
Journal of Rail and Rapid Transit, 2007. 221(3): p. 399-407.
[107] Molatefi H, Hecht M and Kadivar MH, Critical Speed and Limit Cycles in The Empty Y25-
Freight Wagon. Proceedings of the Institution of Mechanical Engineers, Part F: Journal of
Rail and Rapid Transit, 2006. 220(4): p. 347-359.
[108] Ballew BS. 2008. Advanced Multibody Dynamics Modeling of the Freight Train Truck
System. Ph. D. thesis, Virginia Polytechnic Institute and State University.
[109] Xia F and True H, The Dynamics of the Three-Piece-Freight Truck. Vehicle System
Dynamics, 2004. 41: p. 212-221.
[110] UM 7.0, Universal Mechanism Software. 2014.
[111] Ghazavi MR and Taki M, Dynamic simulations of the freight three-piece bogie motion in
curve. Vehicle System Dynamics, 2008. 46(10): p. 955-973.
[112] Zhai W and Wang K, Lateral hunting stability of railway vehicles running on elastic track
structures. Journal of Computational and Nonlinear Dynamics, 2010. 5(4): p. 041009.
[113] Sauvage G, Determining the Characteristics of Helical Springs for Application in
Suspensions of Railway Vehicles. Vehicle System Dynamics, 1984. 13(1): p. 19-41.
- 141 -
[114] Pogorelov D, Simonov V, Kovalev R, Yazykov V, and Lysikov N. Simulation of freight car
dynamics: mathematical models, safety, wear. in The 2nd International Conference on
Recent Advances in Railway Engineering. Tehran: Iran University of Science and
Technology. 2009.
[115] Sun YQ and Cole C, Finite Element Modeling and Analysis of Friction-Wedge Dampers
During Suspension Pitch Modes. Journal of Vibration and Acoustics, 2008. 130(2): p.
021003.
[116] Sun YQ and Cole C, Vertical dynamic behavior of three-piece bogie suspensions with two
types of friction wedge. Multibody System Dynamics, 2008. 19(4): p. 365-382.
[117] Park K, An improved stiffly stable method for direct integration of nonlinear structural
dynamic equations. Journal of Applied Mechanics, 1975. 42(2): p. 464-470.
[118] Huang C, Zeng J and Liang S, Carbody hunting investigation of a high speed passenger car.
Journal of Mechanical Science and Technology, 2013. 27(8): p. 2283-2292.
[119] Stichel S, Limit cycle behaviour and chaotic motions of two-axle freight wagons with friction
damping. Multibody System Dynamics, 2002. 8(3): p. 243-255.
[120] Polach O and Kaiser I, Comparison of methods analyzing bifurcation and hunting of complex
rail vehicle models. Journal of Computational and Nonlinear Dynamics, 2012. 7(4): p.
041005.
[121] True H, Multiple attractors and critical parameters and how to find them numerically: the
right, the wrong and the gambling way. Vehicle System Dynamics, 2013. 51(3): p. 443-
459.
[122] Kaas-Petersen C and True H, Periodic, biperiodic and chaotic dynamical behaviour of
railway vehicles. Vehicle System Dynamics, 1986. 15(sup1): p. 208-221.
[123] Wang L, Octavio JRJ, Wei C, and Shabana AA, Low order continuum-based liquid sloshing
formulation for vehicle system dynamics. Journal of Computational and Nonlinear
Dynamics, 2015. 10(2): p. 021022.
[124] Kovalev R, Lysikov N, Mikheev G, Pogorelov D, Simonov V, Yazykov V, Zakharov S,
Zharov I, Goryacheva I, and Soshenkov S, Freight car models and their computer-aided
dynamic analysis. Multibody System Dynamics, 2009. 22(4): p. 399-423.
[125] Wu Q, Sun Y, Spiryagin M, and Cole C, Methodology to optimize wedge suspensions of
three-piece bogies of railway vehicles. Journal of Vibration and Control, 2016: p.
1077546316645698.
[126] Faltinsen OM and Timokha AN, Sloshing. 2009: Cambridge University Press.
[127] Kolaei A. 2014. Dynamic Liquid Slosh in Moving Containers. PhD, Concordia University
[128] Hazrati Ashtiani I and Abedi M, Effects of Liquid Cargo on Lateral Stability of B-Train
Combination. 2014, SAE International.
[129] Kolaei A, Rakheja S and Richard MJ, Three-dimensional dynamic liquid slosh in partially-
filled horizontal tanks subject to simultaneous longitudinal and lateral excitations.
European Journal of Mechanics-B/Fluids, 2015. 53: p. 251-263.
[130] McIver P, Sloshing frequencies for cylindrical and spherical containers filled to an arbitrary
depth. Journal of Fluid Mechanics, 1989. 201: p. 243-257.
[131] Hazrati Ashtiani I, Rakheja S and Ahmed AKW, Effects of coupled liquid cargo sloshing on
roll response of partly filled railway tank cars. Vehicle System Dynamics, 2018. Under
review.
- 142 -
[132] Cairns M. Crude oil by rail: parts I and II potential for the movement of Alberta oil sands
crude oil and related products by Canadian railways. in Halifax, NS: Canadian
Transportation Research Forum (CTRF). 2013.
[133] Liu X, Liu C and Hong Y, Analysis of multiple tank car releases in train accidents. Accident
Analysis & Prevention, 2017. 107: p. 164-172.
[134] Elkins A, Field guide to tank cars, third edition. 2017, Association of American Railroads.
[135] Transportation Safety Board of Canada, Runaway and Main-Track Derailment, Montreal,
Maine & Atlantic Railway, Freight train MMA-002 Mile 0.23, Sherbrooke Subdivision
LAC-Megantic, Quebec 06 July 2013, Railway Investigation Report R13D0054.
[136] Communities SR, Environmental risks of hazardous goods transported by rail. 2015.
[137] Railroads and chemicals. 2017, Association of American Railroads.
[138] TP14877E TCS, Containers for transport of dangerous goods by rail. 2013.
[139] Ibrahim RA, Road Tanker Dynamics Interacting with Liquid Sloshing Dynamics, in Recent
Trends in Applied Nonlinear Mechanics and Physics. 2018, Springer. p. 1-47.
[140] Blanco-Saura AE, Velarte-González JL, Ribes-Llario F, and Real-Herráiz JI, Study of the
dynamic vehicle-track interaction in a railway turnout. Multibody System Dynamics, 2017:
p. 1-16.
[141] Kassa E and Nielsen JC, Dynamic interaction between train and railway turnout: full-scale
field test and validation of simulation models. Vehicle System Dynamics, 2008. 46(S1): p.
521-534.
[142] Skrypnyk R, Nielsen JC, Ekh M, and Pålsson BA, Metamodelling of wheel–rail normal
contact in railway crossings with elasto-plastic material behaviour. Engineering with
Computers, 2018: p. 1-17.
[143] Zhai W, Wang K and Cai C, Fundamentals of vehicle–track coupled dynamics. Vehicle
System Dynamics, 2009. 47(11): p. 1349-1376.
[144] EN B, Railway applications – track – switches and crossings – Part 9: layouts. BS EN 13232-
9. 2006.