Manajemen Portfolio Investor Institusional VS Investor individu
Upload
khangminh22Category
view
2download
0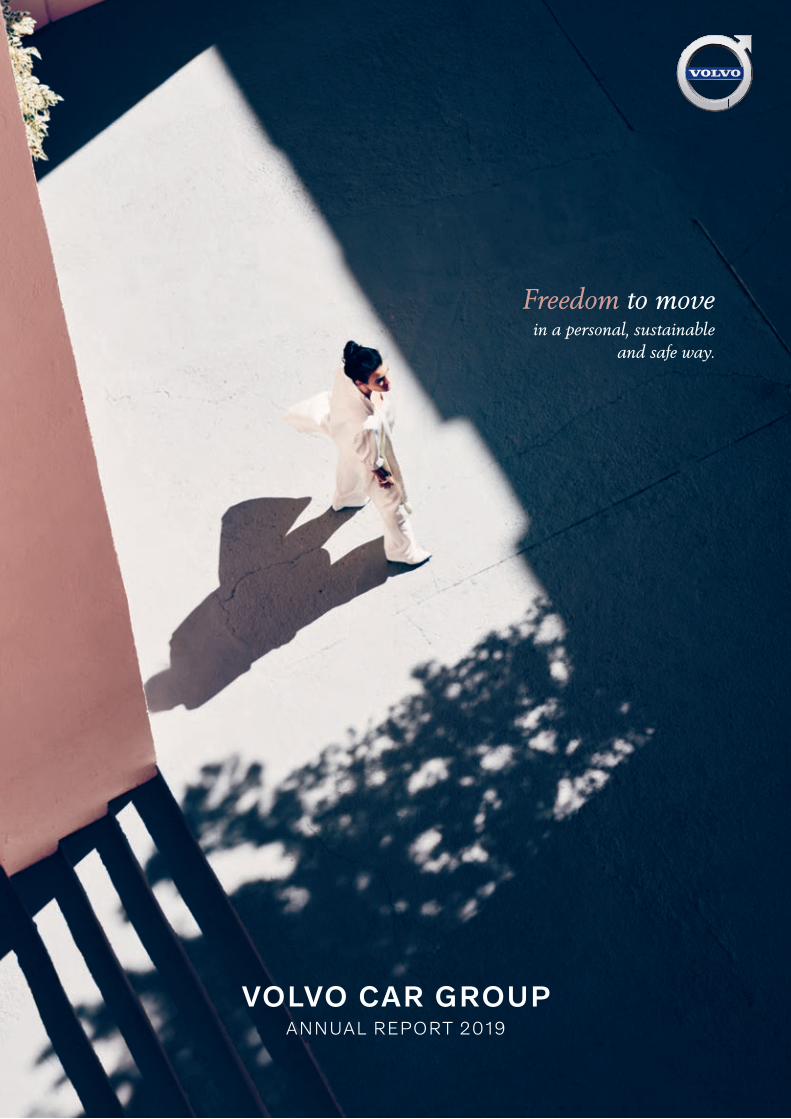
VOLVO CAR GROUPANNUAL REPORT 2019
VO
LV
O C
AR
GR
OU
P A
NN
UA
L R
EP
OR
T 20
19
Freedom to movein a personal, sustainable
and safe way.
OVERVIEW
1 2019 Highlights
2 Market Development
5 CEO Comment
THE WORLD AROUND US
8 Changing Consumer Demands
9 Technology Shift
10 The Volvo Car Group
12 Our Strategic Affiliates
OUR STRATEGY
16 Company Purpose
18 Strategic Framework
HOW WE CREATE VALUE
30 Creating Sustainable Value and Growth
32 Product Creation
46 Manufacturing and Logistics
50 Consumer Experiences
52 People
58 Society
MANAGEMENT REPORT
61 Board of Directors’ Report
65 Enterprise Risk Management
68 Corporate Governance Report
FINANCIAL STATEMENTS
74 Contents Financial Report
75 Consolidated Financial Statements
80 Notes to the Consolidated Financial Statements
120 Parent Company Financial Statements
122 Notes to the Parent Company Financial Statements
128 Auditor’s Report
130 Board of Directors
132 Executive Management Team
SUSTAINABILIT Y – TABLES AND FACTS
134 Sustainability Management and Governance
138 Sustainability Scorecard
143 GRI Index
145 Auditor's Limited Assurance Report on Sustainability
OUR HERITAGE
146 Looking Back Helps Us Look Forward
TA B L E O F C O N T EN T S 2019 Highlights
Volvo Cars' company purpose embodied
Our purpose is to deliver the freedom to move in a personal, sustainable and safe way by offering mobility, regardless of what that looks like or who wants to use it. During the year we continued to deliver on that purpose.
In addition to selling cars via our retail partners, we continued to develop our commercial offers within the direct consumer business area. Care by Volvo, our subscription concept, contin-ued to roll out to the markets, and we also launched our mobil-ity brand M - Volvo Car Mobility, in Stockholm, Sweden.
Furthermore, by introducing the first fully electric XC40, and launching a plan aiming to reduce the lifecycle carbon footprint per car by 40 per cent by 2025, we demonstrated our true commitment to sustainability.
In the interest of safer roads for all, we shared more than 60 years of safety research, underlining our leading position in safety. Also, depending on the development of the Covid-19 situation, we will deliver on our decision to limit the speed on all new Volvo cars to 180 kph from 2020, paving the way for further deliveries on our safety vision that nobody should be seriously injured or killed in a new Volvo car.
Volvo Cars recognised as one of theWorld's Most Ethical Company
For the third consecutive year, Volvo Cars was recognised as one of the World’s Most Ethical Company by the Ethisphere Institute, highlighting that the company performs ethical and responsible business.
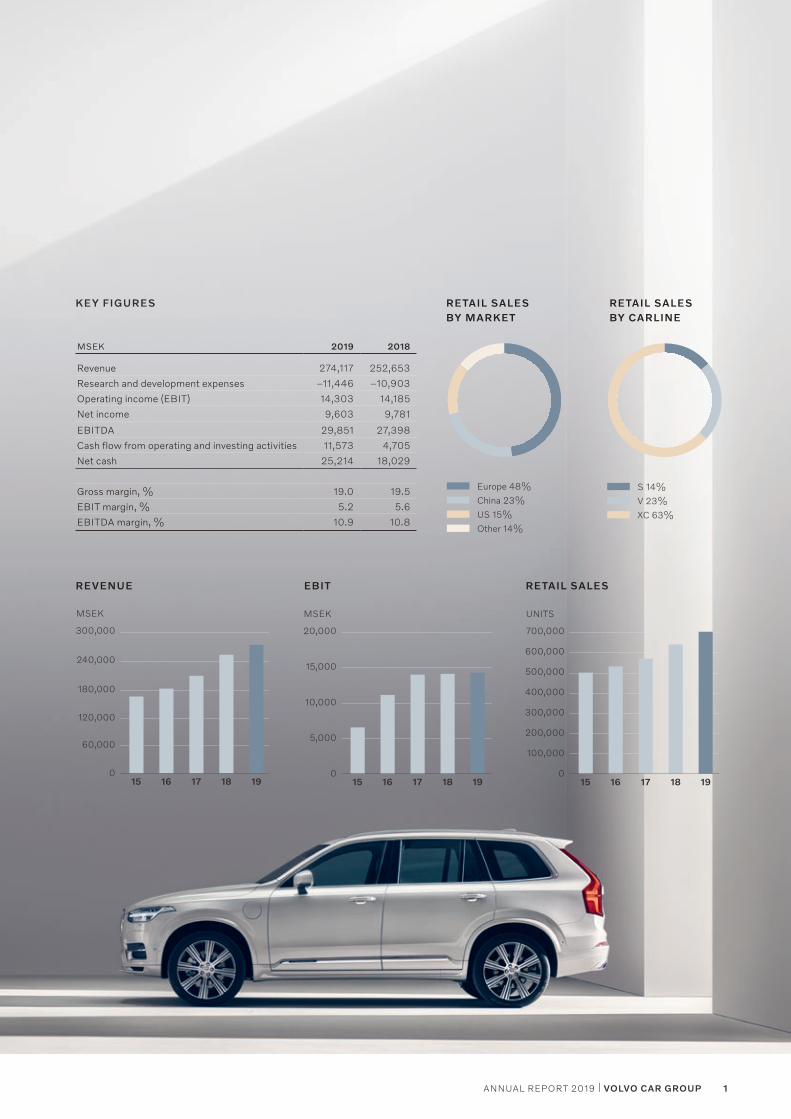
KEY FIGURES
MSEK 2019 2018
Revenue 274,117 252,653
Research and development expenses –11,446 –10,903
Operating income (EBIT) 14,303 14,185
Net income 9,603 9,781
EBITDA 29,851 27,398
Cash flow from operating and investing activities 11,573 4,705
Net cash 25,214 18,029
Gross margin, % 19.0 19.5
EBIT margin, % 5.2 5.6
EBITDA margin, % 10.9 10.8
RETAIL SALES BY CARLINE
RETAIL SALES BY MARKET
RETAIL SALESREVENUE EBIT
Other 14%
US 15%
China 23%
Europe 48%
16 17 1815 19
UNITS
400,000
700,000
600,000
300,000
200,000
100,000
0
500,000
16 17 1815 19
MSEK
300,000
240,000
180,000
60,000
0
120,000
16 17 1815 19
MSEK
20,000
15,000
10,000
5,000
0
XC 63%
V 23%
S 14%
1ANNUAL REPORT 2019 | VOLVO CAR GROUP
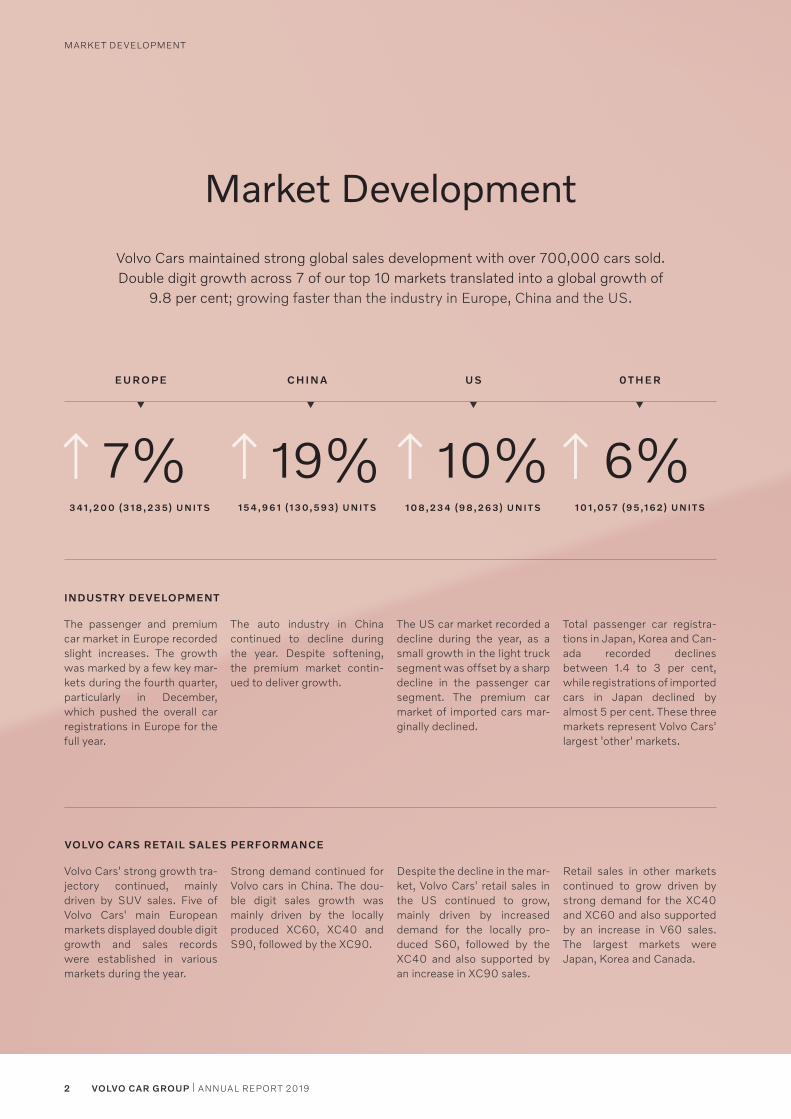
Market Development
EU R O P E C H I N A U S 0 T H E R
VOLVO CARS RETAIL SALES PERFORMANCE
INDUSTRY DEVELOPMENT
1 0 8 , 2 3 4 (9 8 , 2 6 3) U N I T S 1 0 1 ,0 57 (9 5 ,1 6 2) U N I T S3 41 , 2 0 0 (3 1 8 , 2 3 5) U N I T S
7% 19% 10% 6%
Volvo Cars maintained strong global sales development with over 700,000 cars sold. Double digit growth across 7 of our top 10 markets translated into a global growth of
9.8 per cent; growing faster than the industry in Europe, China and the US.
1 5 4 , 9 6 1 (1 3 0, 5 9 3) U N I T S
Volvo Cars' strong growth tra-jectory continued, mainly driven by SUV sales. Five of Volvo Cars' main European markets displayed double digit growth and sales records were established in various markets during the year.
The passenger and premium car market in Europe recorded slight increases. The growth was marked by a few key mar-kets during the fourth quarter, particularly in December, which pushed the overall car registrations in Europe for the full year.
Despite the decline in the mar-ket, Volvo Cars' retail sales in the US continued to grow, mainly driven by increased demand for the locally pro-duced S60, followed by the XC40 and also supported by an increase in XC90 sales.
The US car market recorded a decline during the year, as a small growth in the light truck segment was offset by a sharp decline in the passenger car segment. The premium car market of imported cars mar-ginally declined.
Retail sales in other markets continued to grow driven by strong demand for the XC40 and XC60 and also supported by an increase in V60 sales. The largest markets were Japan, Korea and Canada.
Total passenger car registra-tions in Japan, Korea and Can-ada recorded declines between 1.4 to 3 per cent, while registrations of imported cars in Japan declined by almost 5 per cent. These three markets represent Volvo Cars' largest 'other' markets.
Strong demand continued for Volvo cars in China. The dou-ble digit sales growth was mainly driven by the locally produced XC60, XC40 and S90, followed by the XC90.
The auto industry in China continued to decline during the year. Despite softening, the premium market contin-ued to deliver growth.
2 VOLVO CAR GROUP | ANNUAL REPORT 2019
MARKET DEVELOPMENT
3ANNUAL REPORT 2019 | VOLVO CAR GROUP
CEO COMMENT
4 VOLVO CAR GROUP | ANNUAL REPORT 2019
CEO Comment
Revenue increased by 8.5 per cent to SEK 274bn and led to an operating income of SEK 14.3bn. During the second half of the year, and specifically during the fourth quarter, both profit and profit margin outperformed the comparative period in 2018, and the robust financial result led to a strong cash flow from operating and investing activities. This is a result of continued strong growth in volume, especially in SUVs, as well as cost efficiency measurements initiated early in 2019.
Despite tough market conditions in the auto sector, we are pleased to report growth in all regions, as our progressive and modern products continue to gain attraction. In China, we sold almost 155,000 cars, an increase of nearly 19 per cent, com-fortably outperforming the overall market. We broke the 100,000 cars sold threshold for the first time since 2007 in the US, generating a 10 per cent sales increase. In Europe, we saw strong growth in Germany, where sales reached more than 50,000 cars for the first time. Despite political uncer-tainty, the UK reported its best sales result since 1990.
As part of our electrification strategy, we now offer a plug-in variant on every model, the Recharge line-up, and sales is pick-ing up reaching 7 per cent of sales in 2019. Given the availabil-ity of the Recharge line-up and an increased production capac-ity on electrified vehicles, we aim to sell 20 per cent rechargeable cars in 2020.
In November, as part of the Recharge line-up, we revealed the first fully electric Volvo model, the XC40 BEV. Production is starting in 2020 and orders are already coming in. As part of our ambition to sell 50 per cent fully electric cars and reduce total lifecycle carbon footprint per car by 40 per cent by 2025, we will be launching one fully electric car per year and we have set out our ambition to be a climate-neutral company by 2040.
Sustainability is as important to Volvo Cars as safety – and we target to have the same distinguished reputation for our sustainability achievements as we do for safety. Our commit-ment to conduct business in a responsible manner remain strong and so is our engagement in the UN Global Compact.
We face a great shift in technology, which offers great potential, but also creates a need for new competences. To ensure that we have the right skills for the future, we continue to invest in our people and the evolving technology that sup-port our growing business. With the competence shift, we are also transforming the way we work, becoming an increasingly technologically driven organisation which aims to exceed our customers’ expectations.
During 2020, we will continue to develop our brand with innovative product offers and customer services to further increase sales and revenue, all while maintaining a strong focus on cost. We are seeing positive effects from already implemented, as well as ongoing cost efficiencies and we will
continue to create synergies within the wider Geely Group. As an example, we have announced our intention to separate our combustion engine operations into a stand-alone business unit, including potentially merging these activities with those of Geely. The proposed new business would clear the way for Volvo Cars to focus on the development of its all-electric range of premium cars.
2020 will be the year of electrification. I believe we are well prepared; we have competitive products and a global footprint with sufficient capacity. By delivering on existing, as well as developing new innovative business models and expanding our range of products and services, we will continue to deliver the mobility our customers want and need.
2019 was again a year of growth. For the sixth consecutive year Volvo Cars sets a new sales record of more than 700,000 cars, and we gained market share in all our main markets.
“2020 will be the year of electrification and I believe
we are well prepared.”
Since January 2020, the corona pandemic is spreading and is now severely affecting Volvo Cars in many ways with con-cern for its employees, a weakening market, as well as produc-tion disruptions. As an effect, the European and US manufac-turing plants will be temporarily closed. At the date of signing, the assessment is that the Belgium plant will remain closed until April 5. The Swedish and US plants will be closed between March 26 and April 14.
Our primary focus is the health and safety of all employees. Initially some precautionary measures and travel restrictions were taken, followed by enhanced measures to reduce the spread of the virus by closing production, working from home and taking more personal precautions.
These actions aim at securing jobs, adjust production to demand and to ensure that Volvo Cars can come back to nor-mal production as soon as it is possible and safe.
Earlier in March, Volvo Cars reopened its four manufactur-ing plants in China after an extended closure period. Today's showroom traffic is indicating a return to normal in China's car market, which is demonstrating the advantages of being a global company.
Håkan SamuelssonChief ExecutiveMarch 26, 2020
5ANNUAL REPORT 2019 | VOLVO CAR GROUP
Driven by changing consumer behav-
iours and technology shift, the auto-
motive industry continues to trans-
form. This provides new business
opportunities, urges companies to
evolve their business models and open
up to innovation and collaboration.
6 VOLVO CAR GROUP | ANNUAL REPORT 2019
7ANNUAL REPORT 2019 | VOLVO CAR GROUP
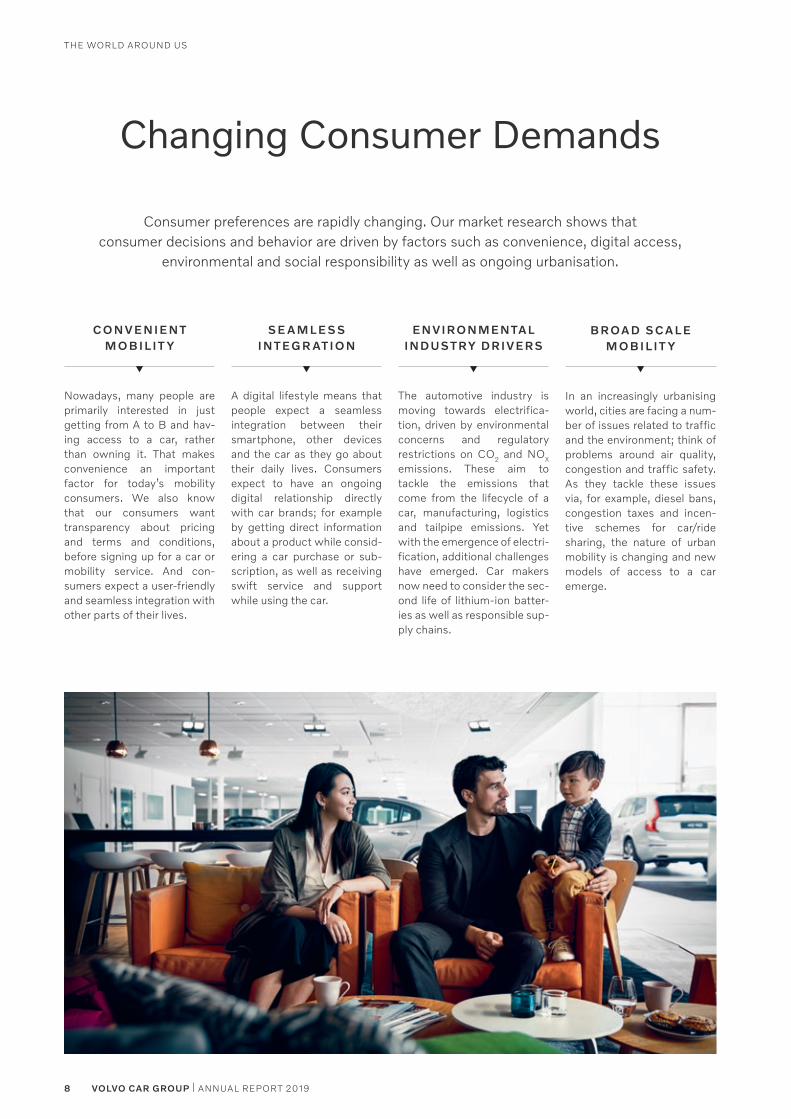
Changing Consumer Demands
Consumer preferences are rapidly changing. Our market research shows that consumer decisions and behavior are driven by factors such as convenience, digital access,
environmental and social responsibility as well as ongoing urbanisation.
C O N V EN I EN T M O B I L I T Y
Nowadays, many people are primarily interested in just getting from A to B and hav-ing access to a car, rather than owning it. That makes convenience an important factor for today’s mobility consumers. We also know that our consumers want transparency about pricing and terms and conditions, before signing up for a car or mobility service. And con-sumers expect a user-friendly and seamless integration with other parts of their lives.
SE A M L E SS I N T EG R AT I O N
A digital lifestyle means that people expect a seamless integration between their smartphone, other devices and the car as they go about their daily lives. Consumers expect to have an ongoing digital relationship directly with car brands; for example by getting direct information about a product while consid-ering a car purchase or sub-scription, as well as receiving swift service and support while using the car.
ENVIRONMEN TAL INDUS T RY DRIVERS
The automotive industry is moving towards electrifica-tion, driven by environmental concerns and regulatory restrictions on CO2 and NOX emissions. These aim to tackle the emissions that come from the lifecycle of a car, manufacturing, logistics and tailpipe emissions. Yet with the emergence of electri-fication, additional challenges have emerged. Car makers now need to consider the sec-ond life of lithium-ion batter-ies as well as responsible sup-ply chains.
B ROA D SC A L E M O B I L I T Y
In an increasingly urbanising world, cities are facing a num-ber of issues related to traffic and the environment; think of problems around air quality, congestion and traffic safety. As they tackle these issues via, for example, diesel bans, congestion taxes and incen-tive schemes for car/ride sharing, the nature of urban mobility is changing and new models of access to a car emerge.
8 VOLVO CAR GROUP | ANNUAL REPORT 2019
THE WORLD AROUND US
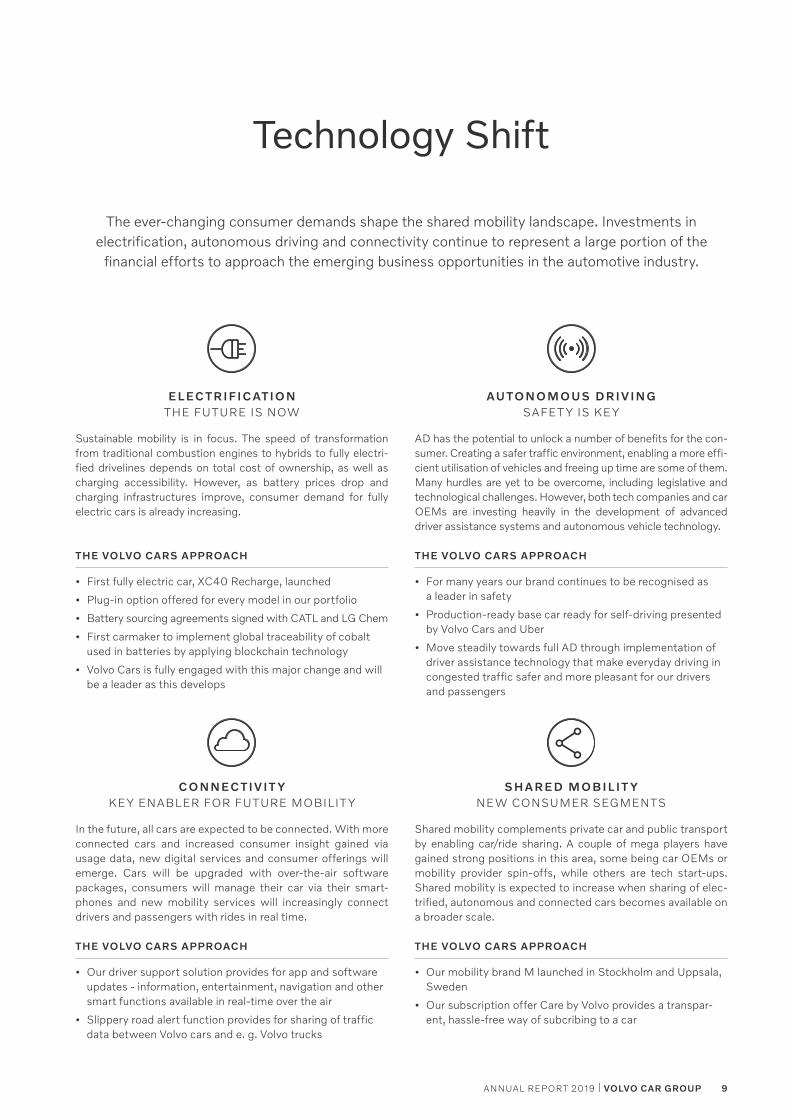
The ever-changing consumer demands shape the shared mobility landscape. Investments in electrification, autonomous driving and connectivity continue to represent a large portion of the
financial efforts to approach the emerging business opportunities in the automotive industry.
Technology Shift
AU T O N O M O US D R I V I N G SAFET Y IS KEY
AD has the potential to unlock a number of benefits for the con-sumer. Creating a safer traffic environment, enabling a more effi-cient utilisation of vehicles and freeing up time are some of them. Many hurdles are yet to be overcome, including legislative and technological challenges. However, both tech companies and car OEMs are investing heavily in the development of advanced driver assistance systems and autonomous vehicle technology.
THE VOLVO CARS APPROACH
• For many years our brand continues to be recognised as a leader in safety
• Production-ready base car ready for self-driving presented by Volvo Cars and Uber
• Move steadily towards full AD through implementation of driver assistance technology that make everyday driving in congested traffic safer and more pleasant for our drivers and passengers
SH A R ED M O B I L I T Y NEW CONSUMER SEGMENTS
Shared mobility complements private car and public transport by enabling car/ride sharing. A couple of mega players have gained strong positions in this area, some being car OEMs or mobility provider spin-offs, while others are tech start-ups. Shared mobility is expected to increase when sharing of elec-trified, autonomous and connected cars becomes available on a broader scale.
THE VOLVO CARS APPROACH
• Our mobility brand M launched in Stockholm and Uppsala, Sweden
• Our subscription offer Care by Volvo provides a transpar-ent, hassle-free way of subcribing to a car
EL EC T R I FI C AT I O N THE FUTURE IS NOW
Sustainable mobility is in focus. The speed of transformation from traditional combustion engines to hybrids to fully electri-fied drivelines depends on total cost of ownership, as well as charging accessibility. However, as battery prices drop and charging infrastructures improve, consumer demand for fully electric cars is already increasing.
THE VOLVO CARS APPROACH
• First fully electric car, XC40 Recharge, launched
• Plug-in option offered for every model in our portfolio
• Battery sourcing agreements signed with CATL and LG Chem
• First carmaker to implement global traceability of cobalt used in batteries by applying blockchain technology
• Volvo Cars is fully engaged with this major change and will be a leader as this develops
C O N N EC T I V I T Y KEY ENABLER FOR FUTURE MOBILIT Y
In the future, all cars are expected to be connected. With more connected cars and increased consumer insight gained via usage data, new digital services and consumer offerings will emerge. Cars will be upgraded with over-the-air software packages, consumers will manage their car via their smart-phones and new mobility services will increasingly connect drivers and passengers with rides in real time.
THE VOLVO CARS APPROACH
• Our driver support solution provides for app and software updates - information, entertainment, navigation and other smart functions available in real-time over the air
• Slippery road alert function provides for sharing of traffic data between Volvo cars and e. g. Volvo trucks
9ANNUAL REPORT 2019 | VOLVO CAR GROUP
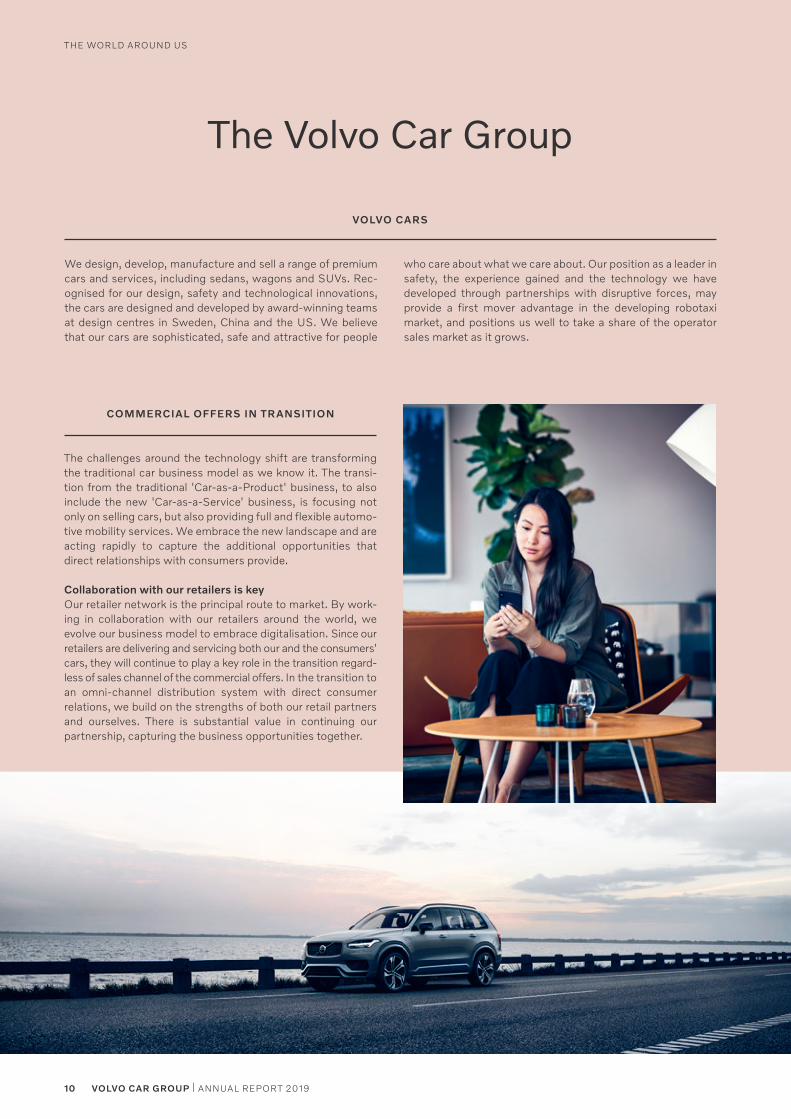
The Volvo Car Group
We design, develop, manufacture and sell a range of premium cars and services, including sedans, wagons and SUVs. Rec-ognised for our design, safety and technological innovations, the cars are designed and developed by award-winning teams at design centres in Sweden, China and the US. We believe that our cars are sophisticated, safe and attractive for people
who care about what we care about. Our position as a leader in safety, the experience gained and the technology we have developed through partnerships with disruptive forces, may provide a first mover advantage in the developing robotaxi market, and positions us well to take a share of the operator sales market as it grows.
VOLVO CARS
COMMERCIAL OFFERS IN TRANSITION
The challenges around the technology shift are transforming the traditional car business model as we know it. The transi-tion from the traditional 'Car-as-a-Product' business, to also include the new 'Car-as-a-Service' business, is focusing not only on selling cars, but also providing full and flexible automo-tive mobility services. We embrace the new landscape and are acting rapidly to capture the additional opportunities that direct relationships with consumers provide.
Collaboration with our retailers is keyOur retailer network is the principal route to market. By work-ing in collaboration with our retailers around the world, we evolve our business model to embrace digitalisation. Since our retailers are delivering and servicing both our and the consumers' cars, they will continue to play a key role in the transition regard-less of sales channel of the commercial offers. In the transition to an omni-channel distribution system with direct consumer relations, we build on the strengths of both our retail partners and ourselves. There is substantial value in continuing our partnership, capturing the business opportunities together.
10 VOLVO CAR GROUP | ANNUAL REPORT 2019
THE WORLD AROUND US
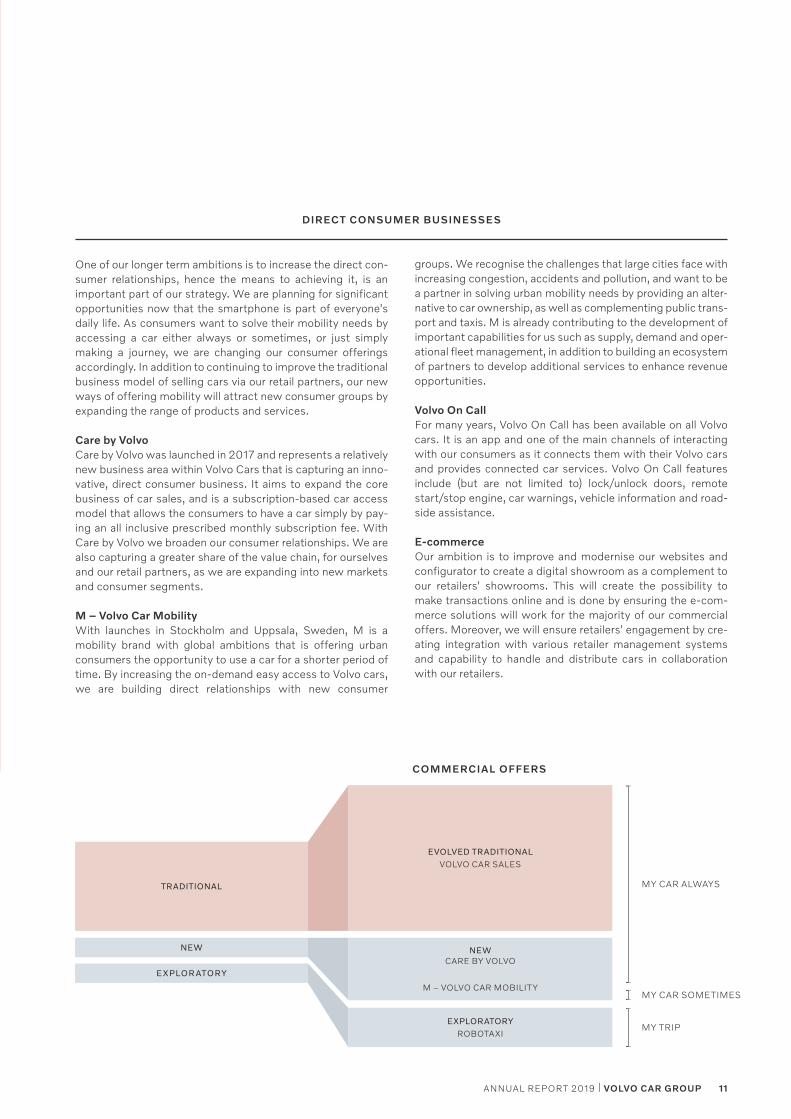
MY CAR ALWAYS
MY TRIP
MY CAR SOMETIMES
COMMERCIAL OFFERS
TRADITIONAL
NEW
EXPLOR ATORY
EVOLVED TRADITIONALVOLVO CAR SALES
NEWCARE BY VOLVO
M – VOLVO CAR MOBILITY
EXPLORATORYROBOTAXI
One of our longer term ambitions is to increase the direct con-sumer relationships, hence the means to achieving it, is an important part of our strategy. We are planning for significant opportunities now that the smartphone is part of everyone's daily life. As consumers want to solve their mobility needs by accessing a car either always or sometimes, or just simply making a journey, we are changing our consumer offerings accordingly. In addition to continuing to improve the traditional business model of selling cars via our retail partners, our new ways of offering mobility will attract new consumer groups by expanding the range of products and services.
Care by VolvoCare by Volvo was launched in 2017 and represents a relatively new business area within Volvo Cars that is capturing an inno-vative, direct consumer business. It aims to expand the core business of car sales, and is a subscription-based car access model that allows the consumers to have a car simply by pay-ing an all inclusive prescribed monthly subscription fee. With Care by Volvo we broaden our consumer relationships. We are also capturing a greater share of the value chain, for ourselves and our retail partners, as we are expanding into new markets and consumer segments.
M – Volvo Car MobilityWith launches in Stockholm and Uppsala, Sweden, M is a mobility brand with global ambitions that is offering urban consumers the opportunity to use a car for a shorter period of time. By increasing the on-demand easy access to Volvo cars, we are building direct relationships with new consumer
DIRECT CONSUMER BUSINESSES
groups. We recognise the challenges that large cities face with increasing congestion, accidents and pollution, and want to be a partner in solving urban mobility needs by providing an alter-native to car ownership, as well as complementing public trans-port and taxis. M is already contributing to the development of important capabilities for us such as supply, demand and oper-ational fleet management, in addition to building an ecosystem of partners to develop additional services to enhance revenue opportunities.
Volvo On CallFor many years, Volvo On Call has been available on all Volvo cars. It is an app and one of the main channels of interacting with our consumers as it connects them with their Volvo cars and provides connected car services. Volvo On Call features include (but are not limited to) lock/unlock doors, remote start/stop engine, car warnings, vehicle information and road-side assistance.
E-commerceOur ambition is to improve and modernise our websites and configurator to create a digital showroom as a complement to our retailers' showrooms. This will create the possibility to make transactions online and is done by ensuring the e-com-merce solutions will work for the majority of our commercial offers. Moreover, we will ensure retailers' engagement by cre-ating integration with various retailer management systems and capability to handle and distribute cars in collaboration with our retailers.
11ANNUAL REPORT 2019 | VOLVO CAR GROUP
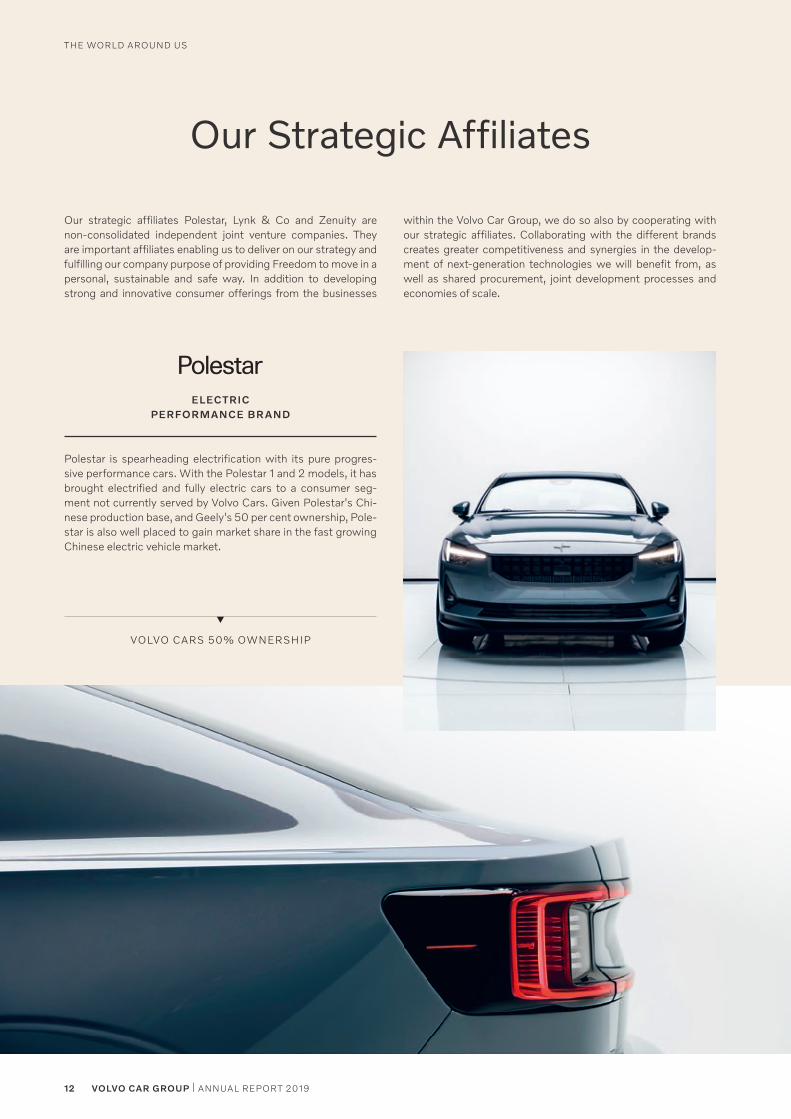
Our strategic affiliates Polestar, Lynk & Co and Zenuity are non-consolidated independent joint venture companies. They are important affiliates enabling us to deliver on our strategy and fulfilling our company purpose of providing Freedom to move in a personal, sustainable and safe way. In addition to developing strong and innovative consumer offerings from the businesses
within the Volvo Car Group, we do so also by cooperating with our strategic affiliates. Collaborating with the different brands creates greater competitiveness and synergies in the develop-ment of next-generation technologies we will benefit from, as well as shared procurement, joint development processes and economies of scale.
ELECTRICPERFORMANCE BRAND
Polestar is spearheading electrification with its pure progres-sive performance cars. With the Polestar 1 and 2 models, it has brought electrified and fully electric cars to a consumer seg-ment not currently served by Volvo Cars. Given Polestar's Chi-nese production base, and Geely's 50 per cent ownership, Pole-star is also well placed to gain market share in the fast growing Chinese electric vehicle market.
VOLVO CARS 50% OWNERSHIP
Our Strategic Affiliates
12 VOLVO CAR GROUP | ANNUAL REPORT 2019
THE WORLD AROUND US
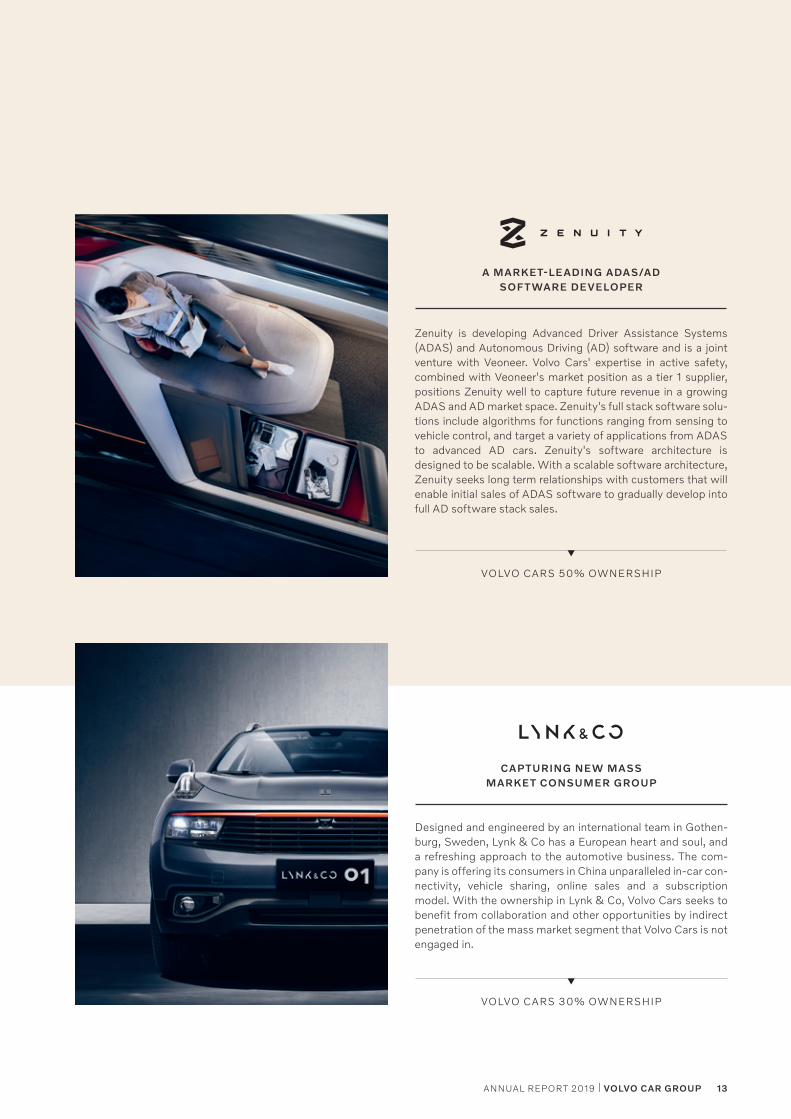
A MARKET-LEADING ADAS/AD SOFTWARE DEVELOPER
Zenuity is developing Advanced Driver Assistance Systems (ADAS) and Autonomous Driving (AD) software and is a joint venture with Veoneer. Volvo Cars' expertise in active safety, combined with Veoneer's market position as a tier 1 supplier, positions Zenuity well to capture future revenue in a growing ADAS and AD market space. Zenuity's full stack software solu-tions include algorithms for functions ranging from sensing to vehicle control, and target a variety of applications from ADAS to advanced AD cars. Zenuity's software architecture is designed to be scalable. With a scalable software architecture, Zenuity seeks long term relationships with customers that will enable initial sales of ADAS software to gradually develop into full AD software stack sales.
VOLVO CARS 50% OWNERSHIP
CAPTURING NEW MASS MARKET CONSUMER GROUP
Designed and engineered by an international team in Gothen-burg, Sweden, Lynk & Co has a European heart and soul, and a refreshing approach to the automotive business. The com-pany is offering its consumers in China unparalleled in-car con-nectivity, vehicle sharing, online sales and a subscription model. With the ownership in Lynk & Co, Volvo Cars seeks to benefit from collaboration and other opportunities by indirect penetration of the mass market segment that Volvo Cars is not engaged in.
VOLVO CARS 30% OWNERSHIP
13ANNUAL REPORT 2019 | VOLVO CAR GROUP
Our strategic framework, which is
guided by our purpose of providing
Freedom to move in a personal, sus-
tainable and safe way, provides the
foundation for reaching our longer term
ambitions and premium profitability.
14 VOLVO CAR GROUP | ANNUAL REPORT 2019

15ANNUAL REPORT 2019 | VOLVO CAR GROUP
Freedom to Move
C O M PA N Y P U R P OSE
Cars used to be the symbol for personal freedom. Owning a car meant that you had the means to be independently mobile - that you owned not just a vehicle, but choice as well. Nothing of that has changed, but the world we live in has. The earth, our cities and our everyday lives are under increased pressure. In such an age, a car can feel more like an obstacle. At Volvo Cars
we have made it our mission to take back the feeling of freedom and let the car be the enabler of a richer life. We will do so by offering mobility, regardless of what that looks like or who wants to use it. We want to democratise mobility by giving all our fans Freedom to move in a personal, sustainable and safe way.
16 VOLVO CAR GROUP | ANNUAL REPORT 2019
OUR STRATEGY
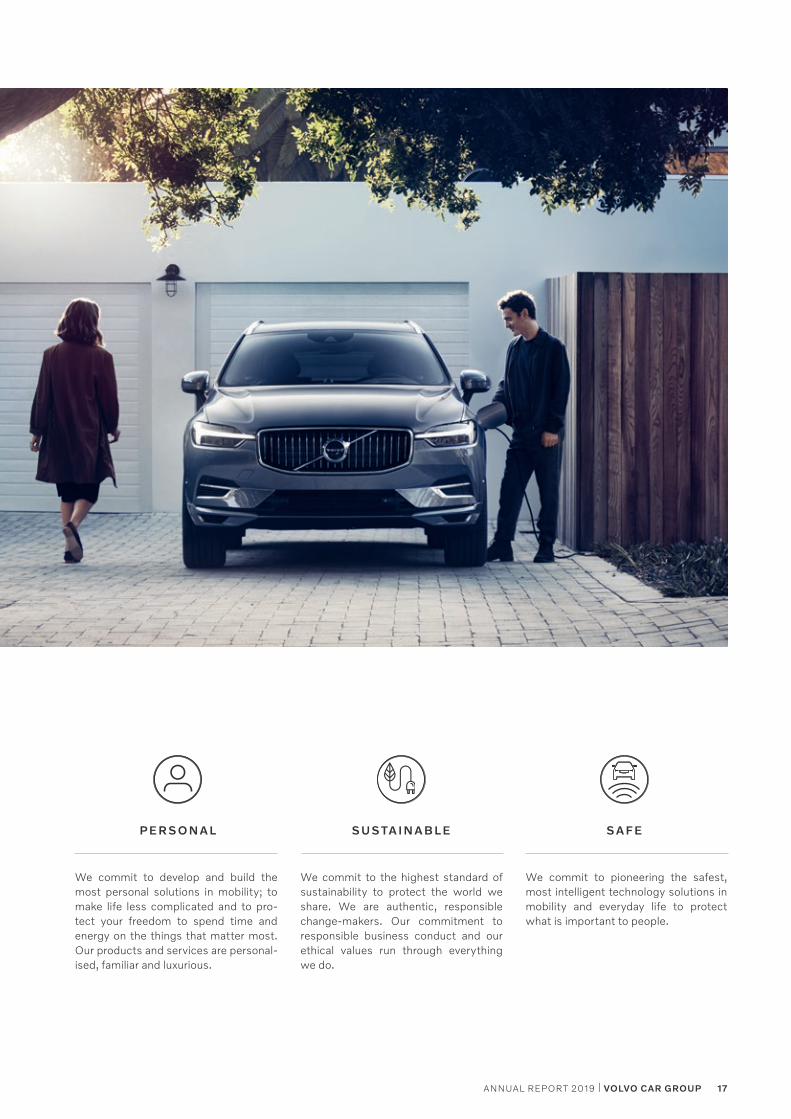
P ERSO N A L SUS TA I N A B L E SA FE
We commit to pioneering the safest, most intelligent technology solutions in mobility and everyday life to protect what is important to people.
We commit to the highest standard of sustainability to protect the world we share. We are authentic, responsible change-makers. Our commitment to responsible business conduct and our ethical values run through everything we do.
We commit to develop and build the most personal solutions in mobility; to make life less complicated and to pro-tect your freedom to spend time and energy on the things that matter most. Our products and services are personal-ised, familiar and luxurious.
17ANNUAL REPORT 2019 | VOLVO CAR GROUP
Strategic Framework
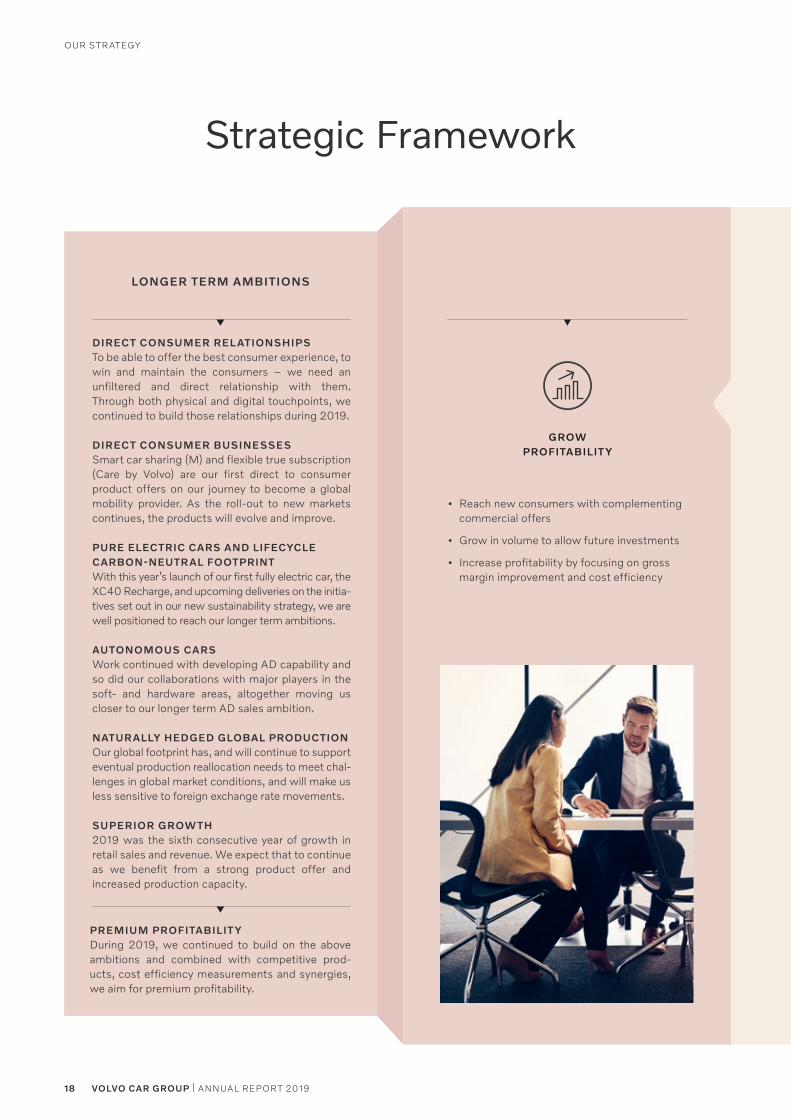
LONGER TERM AMBITIONS
GROW PROFITABILIT Y
DIRECT CONSUMER RELATIONSHIPSTo be able to offer the best consumer experience, to win and maintain the consumers – we need an unfiltered and direct relationship with them. Through both physical and digital touchpoints, we continued to build those relationships during 2019.
DIRECT CONSUMER BUSINESSESSmart car sharing (M) and flexible true subscription (Care by Volvo) are our first direct to consumer product offers on our journey to become a global mobility provider. As the roll-out to new markets continues, the products will evolve and improve.
PURE ELECTRIC CARS AND LIFECYCLE CARBON-NEUTRAL FOOTPRINTWith this year’s launch of our first fully electric car, the XC40 Recharge, and upcoming deliveries on the initia-tives set out in our new sustainability strategy, we are well positioned to reach our longer term ambitions.
AUTONOMOUS CARSWork continued with developing AD capability and so did our collaborations with major players in the soft- and hardware areas, altogether moving us closer to our longer term AD sales ambition.
NATURALLY HEDGED GLOBAL PRODUCTIONOur global footprint has, and will continue to support eventual production reallocation needs to meet chal-lenges in global market conditions, and will make us less sensitive to foreign exchange rate movements.
SUPERIOR GROW TH2019 was the sixth consecutive year of growth in retail sales and revenue. We expect that to continue as we benefit from a strong product offer and increased production capacity.
PREMIUM PROFITABILIT YDuring 2019, we continued to build on the above ambitions and combined with competitive prod-ucts, cost efficiency measurements and synergies, we aim for premium profitability.
• Reach new consumers with complementing commercial offers
• Grow in volume to allow future investments
• Increase profitability by focusing on gross margin improvement and cost efficiency
18 VOLVO CAR GROUP | ANNUAL REPORT 2019
OUR STRATEGY
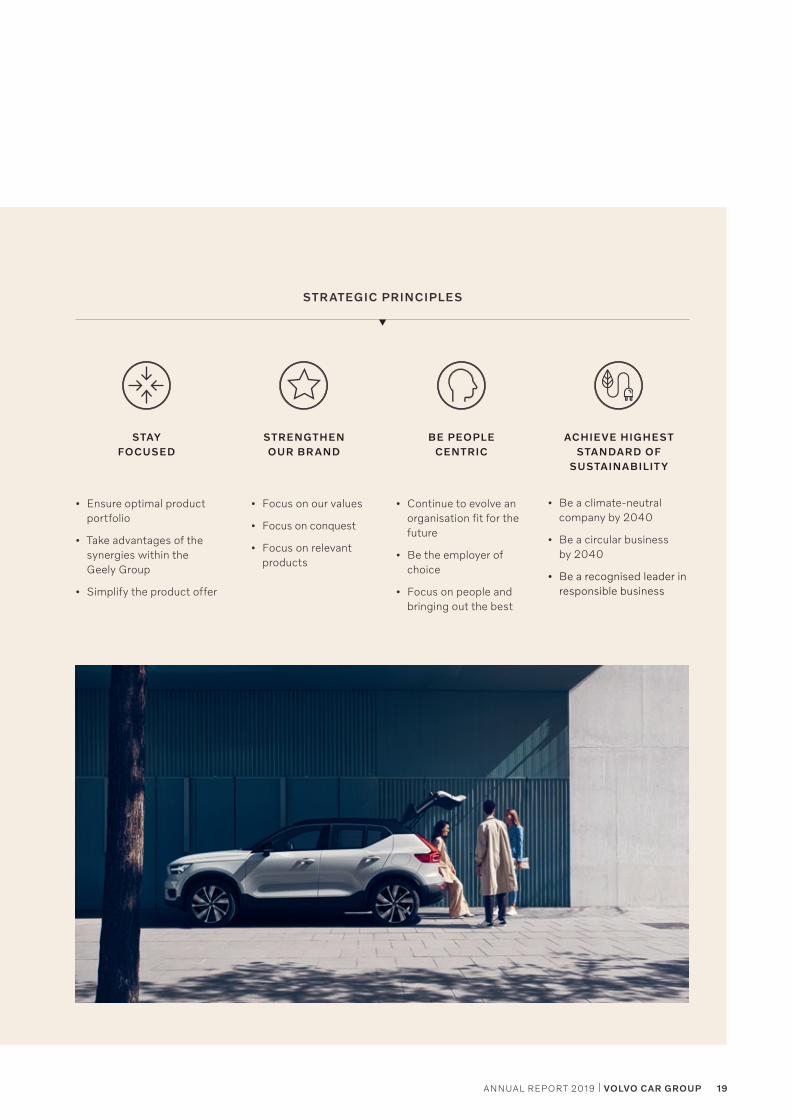
STRATEGIC PRINCIPLES
STRENGTHEN OUR BRAND
ACHIEVE HIGHEST STANDARD OF
SUSTAINABILIT Y
STAY FOCUSED
BE PEOPLE CENTRIC
• Ensure optimal product portfolio
• Take advantages of the synergies within the Geely Group
• Simplify the product offer
• Continue to evolve an organisation fit for the future
• Be the employer of choice
• Focus on people and bringing out the best
• Focus on our values
• Focus on conquest
• Focus on relevant products
• Be a climate-neutral company by 2040
• Be a circular business by 2040
• Be a recognised leader in responsible business
19ANNUAL REPORT 2019 | VOLVO CAR GROUP
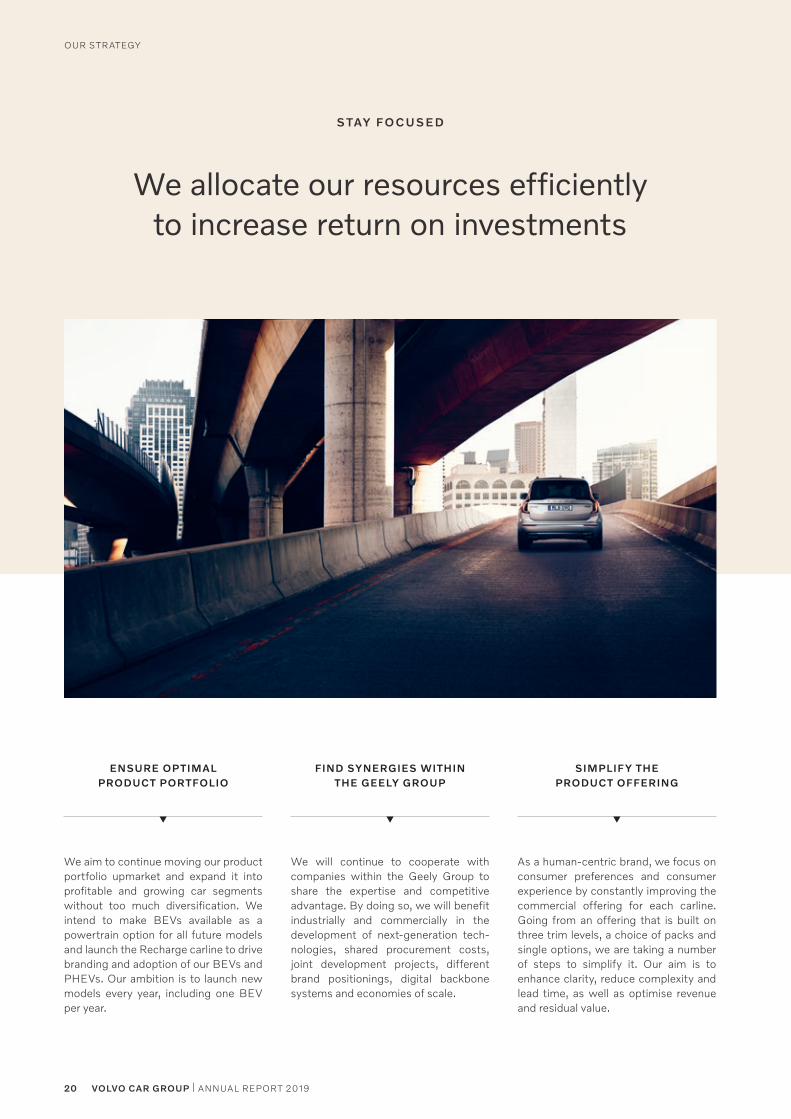
S TAY FO C USED
We allocate our resources efficientlyto increase return on investments
ENSURE OPTIMAL PRODUCT PORTFOLIO
FIND SYNERGIES WITHIN THE GEELY GROUP
SIMPLIFY THE PRODUCT OFFERING
We aim to continue moving our product portfolio upmarket and expand it into profitable and growing car segments without too much diversification. We intend to make BEVs available as a powertrain option for all future models and launch the Recharge carline to drive branding and adoption of our BEVs and PHEVs. Our ambition is to launch new models every year, including one BEV per year.
We will continue to cooperate with companies within the Geely Group to share the expertise and competitive advantage. By doing so, we will benefit industrially and commercially in the development of next-generation tech-nologies, shared procurement costs, joint development projects, different brand positionings, digital backbone systems and economies of scale.
As a human-centric brand, we focus on consumer preferences and consumer experience by constantly improving the commercial offering for each carline. Going from an offering that is built on three trim levels, a choice of packs and single options, we are taking a number of steps to simplify it. Our aim is to enhance clarity, reduce complexity and lead time, as well as optimise revenue and residual value.
20 VOLVO CAR GROUP | ANNUAL REPORT 2019
OUR STRATEGY
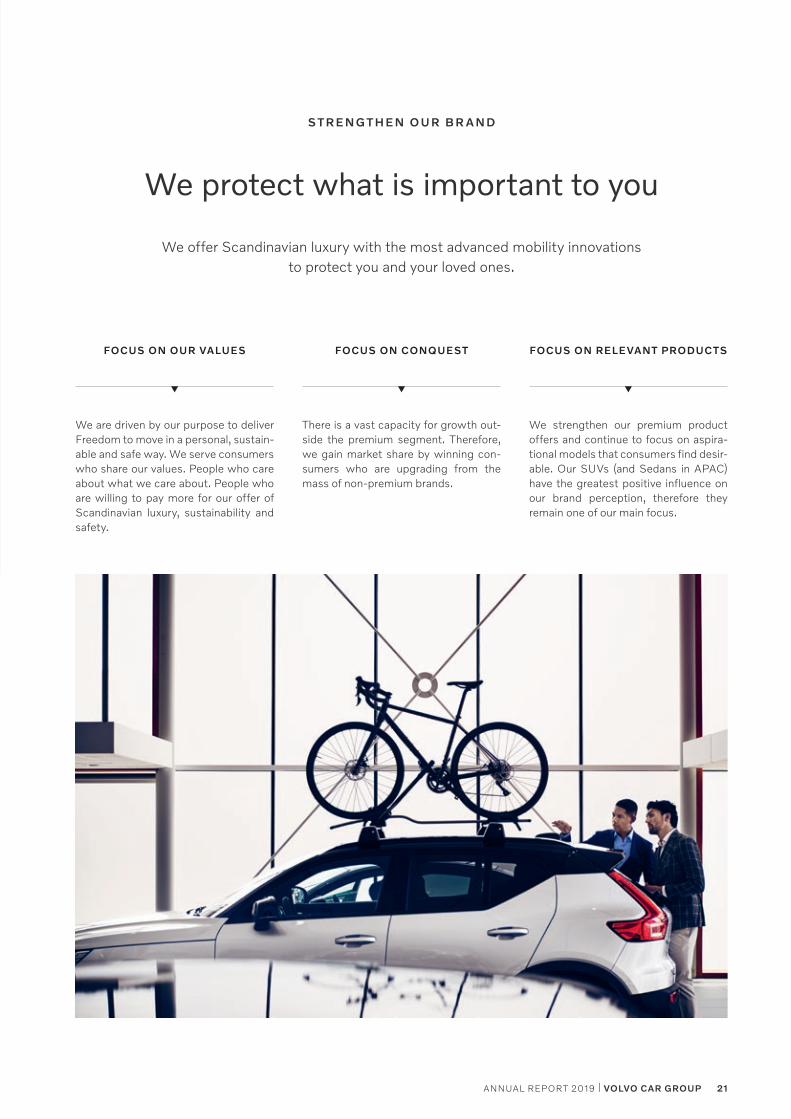
S T R EN G T H EN O U R B R A N D
We protect what is important to you
FOCUS ON OUR VALUES FOCUS ON CONQUEST FOCUS ON RELEVANT PRODUCTS
We are driven by our purpose to deliver Freedom to move in a personal, sustain-able and safe way. We serve consumers who share our values. People who care about what we care about. People who are willing to pay more for our offer of Scandinavian luxury, sustainability and safety.
There is a vast capacity for growth out-side the premium segment. Therefore, we gain market share by winning con-sumers who are upgrading from the mass of non-premium brands.
We strengthen our premium product offers and continue to focus on aspira-tional models that consumers find desir-able. Our SUVs (and Sedans in APAC) have the greatest positive influence on our brand perception, therefore they remain one of our main focus.
We offer Scandinavian luxury with the most advanced mobility innovations to protect you and your loved ones.
21ANNUAL REPORT 2019 | VOLVO CAR GROUP
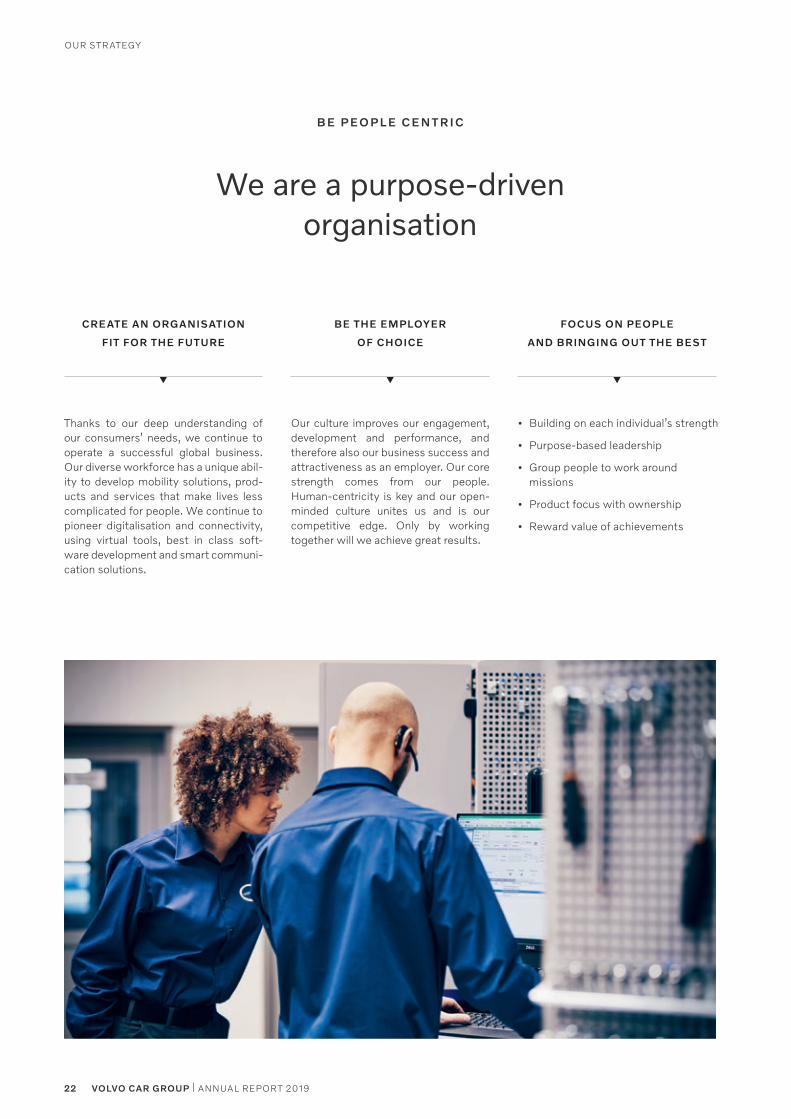
We are a purpose-driven organisation
CREATE AN ORGANISATION
FIT FOR THE FUTURE
BE THE EMPLOYER
OF CHOICE
FOCUS ON PEOPLE
AND BRINGING OUT THE BEST
Thanks to our deep understanding of our consumers’ needs, we continue to operate a successful global business. Our diverse workforce has a unique abil-ity to develop mobility solutions, prod-ucts and services that make lives less complicated for people. We continue to pioneer digitalisation and connectivity, using virtual tools, best in class soft-ware development and smart communi-cation solutions.
Our culture improves our engagement, development and performance, and therefore also our business success and attractiveness as an employer. Our core strength comes from our people. Human-centricity is key and our open-minded culture unites us and is our competitive edge. Only by working together will we achieve great results.
• Building on each individual’s strength
• Purpose-based leadership
• Group people to work around missions
• Product focus with ownership
• Reward value of achievements
B E P EO P L E C EN T R I C
22 VOLVO CAR GROUP | ANNUAL REPORT 2019
OUR STRATEGY
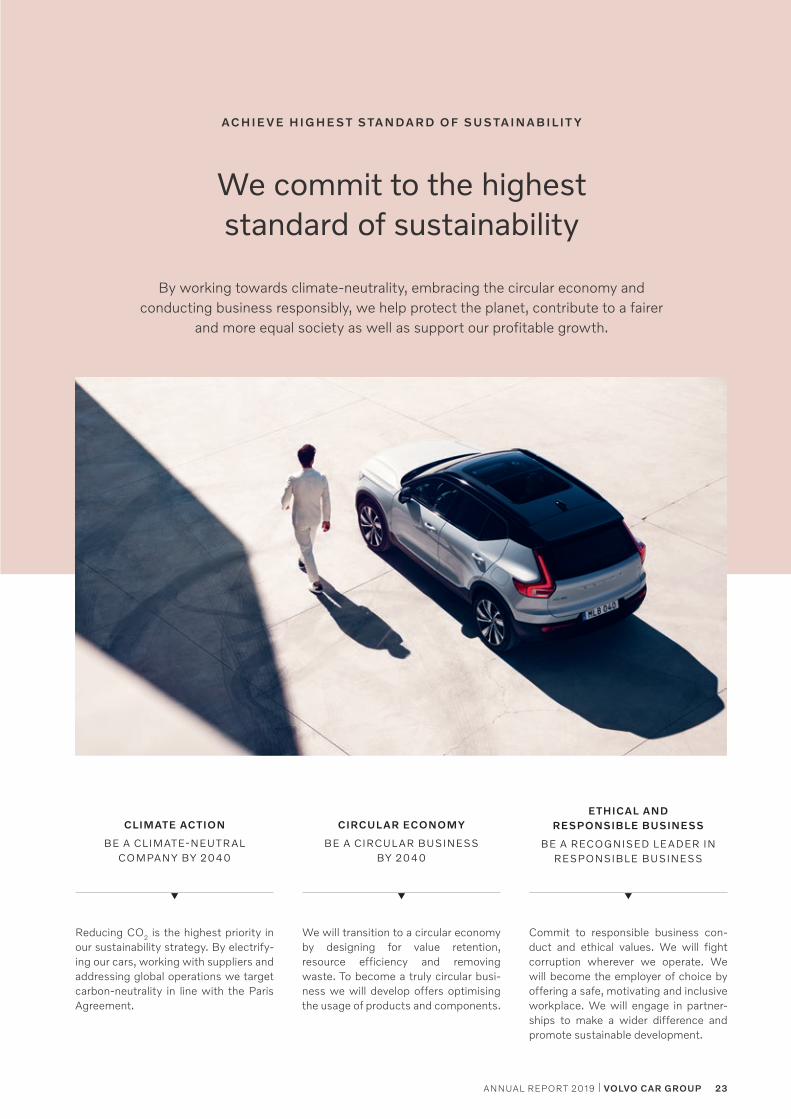
We commit to the highest standard of sustainability
CLIMATE ACTION
BE A CLIMATE-NEUTRAL COMPANY BY 2040
CIRCULAR ECONOMY
BE A CIRCUL AR BUSINESS BY 2040
ETHICAL AND RESPONSIBLE BUSINESS
BE A RECOGNISED LEADER IN RESPONSIBLE BUSINESS
Reducing CO2 is the highest priority in our sustainability strategy. By electrify-ing our cars, working with suppliers and addressing global operations we target carbon-neutrality in line with the Paris Agreement.
We will transition to a circular economy by designing for value retention, resource efficiency and removing waste. To become a truly circular busi-ness we will develop offers optimising the usage of products and components.
Commit to responsible business con-duct and ethical values. We will fight corruption wherever we operate. We will become the employer of choice by offering a safe, motivating and inclusive workplace. We will engage in partner-ships to make a wider difference and promote sustainable development.
AC H I E V E H I G H E S T S TA N DA R D O F SUS TA I N A B I L I T Y
By working towards climate-neutrality, embracing the circular economy and conducting business responsibly, we help protect the planet, contribute to a fairer
and more equal society as well as support our profitable growth.
23ANNUAL REPORT 2019 | VOLVO CAR GROUP
OUR STRATEGY
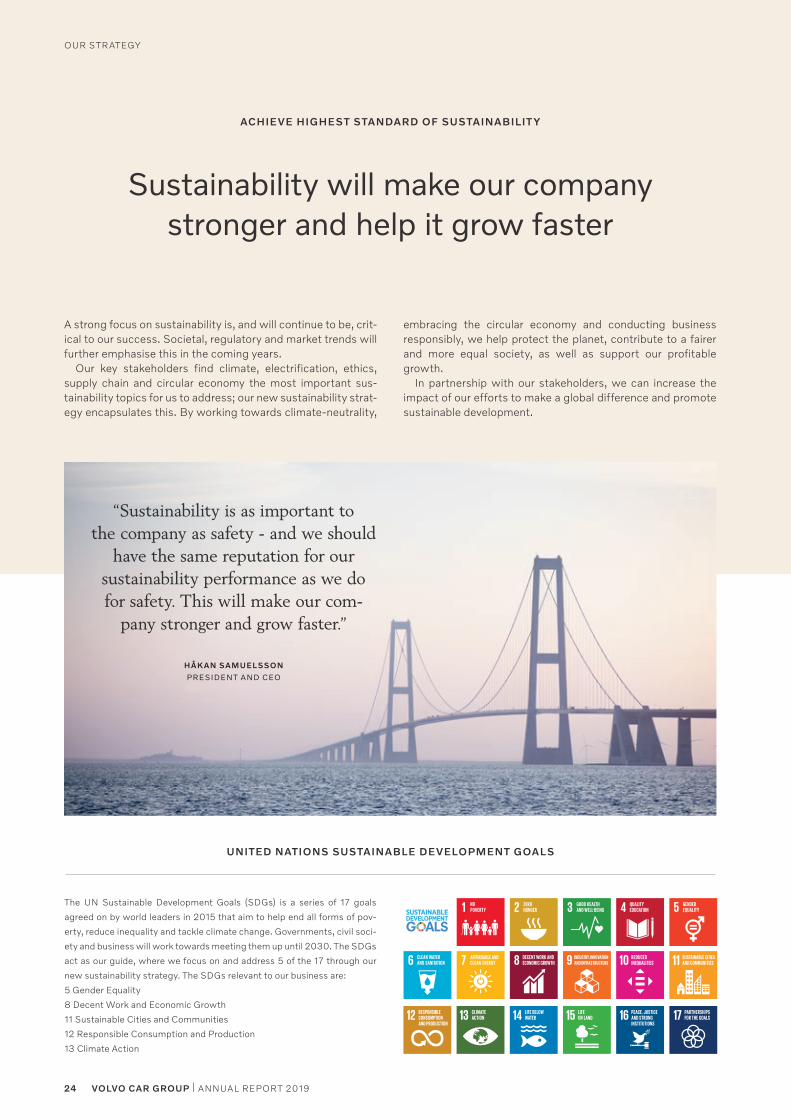
A strong focus on sustainability is, and will continue to be, crit-ical to our success. Societal, regulatory and market trends will further emphasise this in the coming years.
Our key stakeholders find climate, electrification, ethics, supply chain and circular economy the most important sus-tainability topics for us to address; our new sustainability strat-egy encapsulates this. By working towards climate-neutrality,
Sustainability will make our company stronger and help it grow faster
ACHIEVE HIGHEST STANDARD OF SUSTAINABILIT Y
The UN Sustainable Development Goals (SDGs) is a series of 17 goals
agreed on by world leaders in 2015 that aim to help end all forms of pov-
erty, reduce inequality and tackle climate change. Governments, civil soci-
ety and business will work towards meeting them up until 2030. The SDGs
act as our guide, where we focus on and address 5 of the 17 through our
new sustainability strategy. The SDGs relevant to our business are:
5 Gender Equality
8 Decent Work and Economic Growth
11 Sustainable Cities and Communities
12 Responsible Consumption and Production
13 Climate Action
UNITED NATIONS SUSTAINABLE DEVELOPMENT GOALS
embracing the circular economy and conducting business responsibly, we help protect the planet, contribute to a fairer and more equal society, as well as support our profitable growth.
In partnership with our stakeholders, we can increase the impact of our efforts to make a global difference and promote sustainable development.
“Sustainability is as important to the company as safety - and we should
have the same reputation for our sustainability performance as we do for safety. This will make our com-
pany stronger and grow faster.”
HÅK AN SAMUELSSON
PRESIDENT AND CEO
24 VOLVO CAR GROUP | ANNUAL REPORT 2019
OUR STRATEGY
CLIMATE ACTION
Be a climate-neutral company by 2040
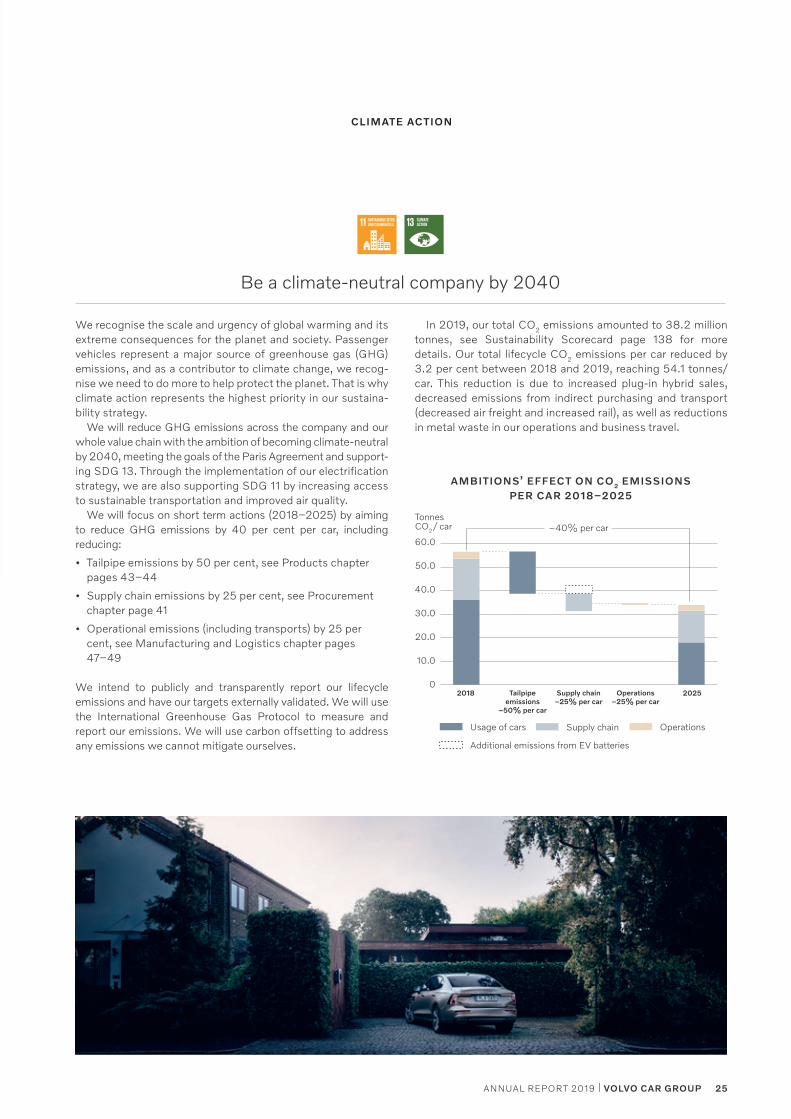
We recognise the scale and urgency of global warming and its extreme consequences for the planet and society. Passenger vehicles represent a major source of greenhouse gas (GHG) emissions, and as a contributor to climate change, we recog-nise we need to do more to help protect the planet. That is why climate action represents the highest priority in our sustaina-bility strategy.
We will reduce GHG emissions across the company and our whole value chain with the ambition of becoming climate-neutral by 2040, meeting the goals of the Paris Agreement and support-ing SDG 13. Through the implementation of our electrification strategy, we are also supporting SDG 11 by increasing access to sustainable transportation and improved air quality.
We will focus on short term actions (2018–2025) by aiming to reduce GHG emissions by 40 per cent per car, including reducing:
• Tailpipe emissions by 50 per cent, see Products chapter pages 43–44
• Supply chain emissions by 25 per cent, see Procurement chapter page 41
• Operational emissions (including transports) by 25 per cent, see Manufacturing and Logistics chapter pages 47–49
We intend to publicly and transparently report our lifecycle emissions and have our targets externally validated. We will use the International Greenhouse Gas Protocol to measure and report our emissions. We will use carbon offsetting to address any emissions we cannot mitigate ourselves.
In 2019, our total CO2 emissions amounted to 38.2 million tonnes, see Sustainability Scorecard page 138 for more details. Our total lifecycle CO2 emissions per car reduced by 3.2 per cent between 2018 and 2019, reaching 54.1 tonnes/car. This reduction is due to increased plug-in hybrid sales, decreased emissions from indirect purchasing and transport (decreased air freight and increased rail), as well as reductions in metal waste in our operations and business travel.
AMBITIONS’ EFFECT ON CO2 EMISSIONS PER CAR 2018–2025
2018 2025
60.0
30.0
20.0
10.0
0
40.0
50.0
Supply chain OperationsUsage of cars
–40% per car
Tailpipeemissions
–50% per car
Supply chain–25% per car
Operations–25% per car
Tonnes CO2 / car
Additional emissions from EV batteries
25ANNUAL REPORT 2019 | VOLVO CAR GROUP
Be a circular business by 2040
A circular economy is an economic system aimed at keeping prod-ucts and components in use for longer, which minimises the need to produce new materials and products, extract finite resources, as well as eliminates waste. We need to move away from a linear economy and apply circular economic principles in order to meet our climate ambitions, secure future availability of materials, ensure efficient raw material usage and waste management prac-tices. This means that we need to transform the way our products are designed, produced and used. We aim to increase our profita-bility through the generation of cost savings and new revenue streams, while substantially reducing our CO2 emissions by:
• Using 25 per cent recycled and bio-based materials in our cars by 2025, and by using the most sustainable options when selecting materials such as leather and wood, see Products chapter page 44
• Increasing resource utilisation and minimising waste, including through reducing production waste by 15 per cent by 2021, see Manufacturing and Logistics chapter page 49
• Retaining component value, including through reusing, refurbishing and remanufacturing parts, see Products chapter page 45
• Developing new business opportunities which optimise the efficient lifecycle use of our products and components
Our path towards 2040 will be divided into two main roadmaps: 1. Towards 2025 – extract as much of the CO2 equivalent emis-sions and cost savings as possible from our current products and services 2. Towards 2040 – transform into a circular business through a new generation of products, services and processes
CIRCULAR ECONOMY
26 VOLVO CAR GROUP | ANNUAL REPORT 2019
OUR STRATEGY
Be a recognised leader in ethical and responsible business
Acting as a responsible business means doing what is morally and ethically right in order to have a positive social and environ-mental impact. Responsible businesses have a powerful influ-encing role within their sector, supply chain and wider indus-try, and they enjoy better employee engagement and retention, as well as attract investment and the best talent.
A strong corporate culture that focuses on ethics and lead-ership, as well as equal opportunities (SDG 5) and decent work for all (SDG 8), is critical towards achieving this.
Our ambition is to be a recognised leader in responsible business. We intend to achieve this by:
• Being an Employer of Choice. We aim to work proactively to increase our people’s well-being and become one of the world’s most parent friendly employers, see People chapter pages 53–55
• Further strengthening the ethical dimension of our culture and corporate governance. This is achieved by ensuring awareness on anti-corruption and unethical business prac-tices among employees and business partners, as well as focusing on our leaders setting the tone and being role models for responsible and ethical behaviour, see People chapter pages 56–57
• Developing partnerships, including through financing, are opportunities we explore to further improve the impact we make.
• Securing a responsible supply chain by ensuring that sustainability performance has equal weight as cost and quality in the sourcing process, and by having 100 per cent transparency of cobalt and 3TG supply by 2020, see Procurement chapter pages 38–41
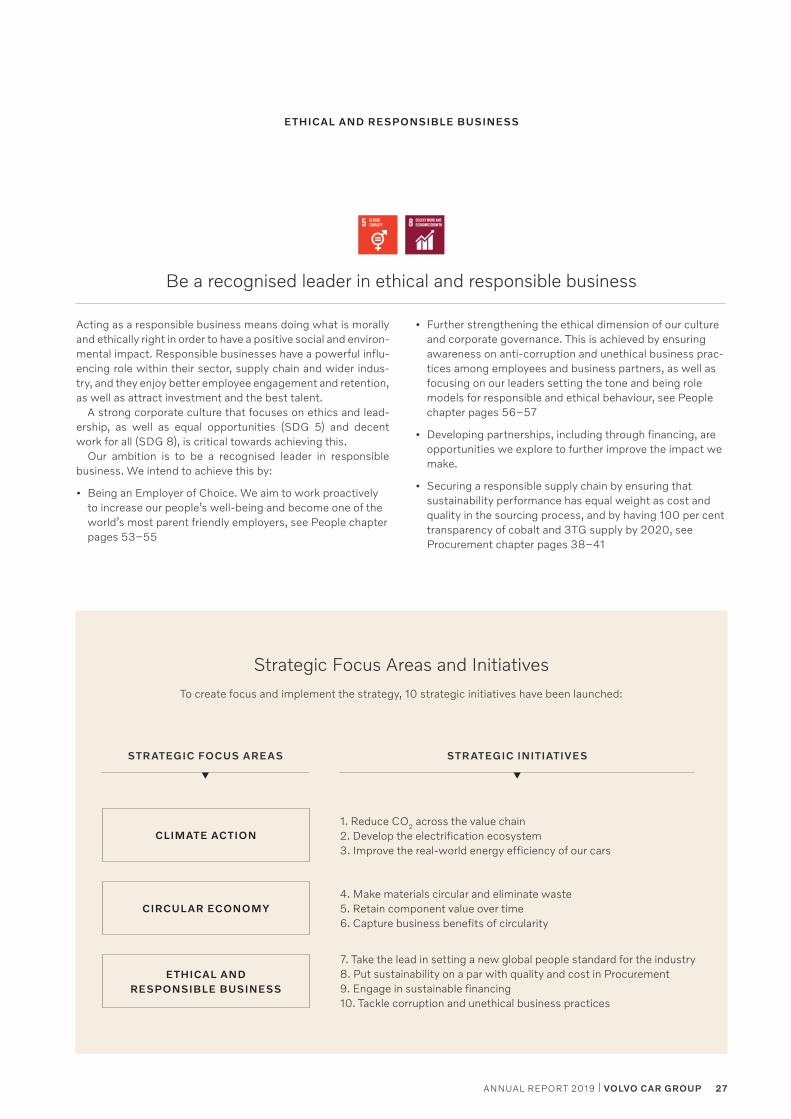
Strategic Focus Areas and Initiatives
STRATEGIC FOCUS AREAS STRATEGIC INITIATIVES
To create focus and implement the strategy, 10 strategic initiatives have been launched:
ETHICAL AND RESPONSIBLE BUSINESS
CLIMATE ACTION
CIRCULAR ECONOMY
ETHICAL AND RESPONSIBLE BUSINESS
1. Reduce CO2 across the value chain2. Develop the electrification ecosystem3. Improve the real-world energy efficiency of our cars
4. Make materials circular and eliminate waste5. Retain component value over time6. Capture business benefits of circularity
7. Take the lead in setting a new global people standard for the industry8. Put sustainability on a par with quality and cost in Procurement9. Engage in sustainable financing10. Tackle corruption and unethical business practices
27ANNUAL REPORT 2019 | VOLVO CAR GROUP
We create sustainable value and
growth by investing and utilising
our resources in a sustainable way
throughout our value chain with con-
cern for people, society and the envi-
ronment in which we operate.
28 VOLVO CAR GROUP | ANNUAL REPORT 2019
29ANNUAL REPORT 2019 | VOLVO CAR GROUP
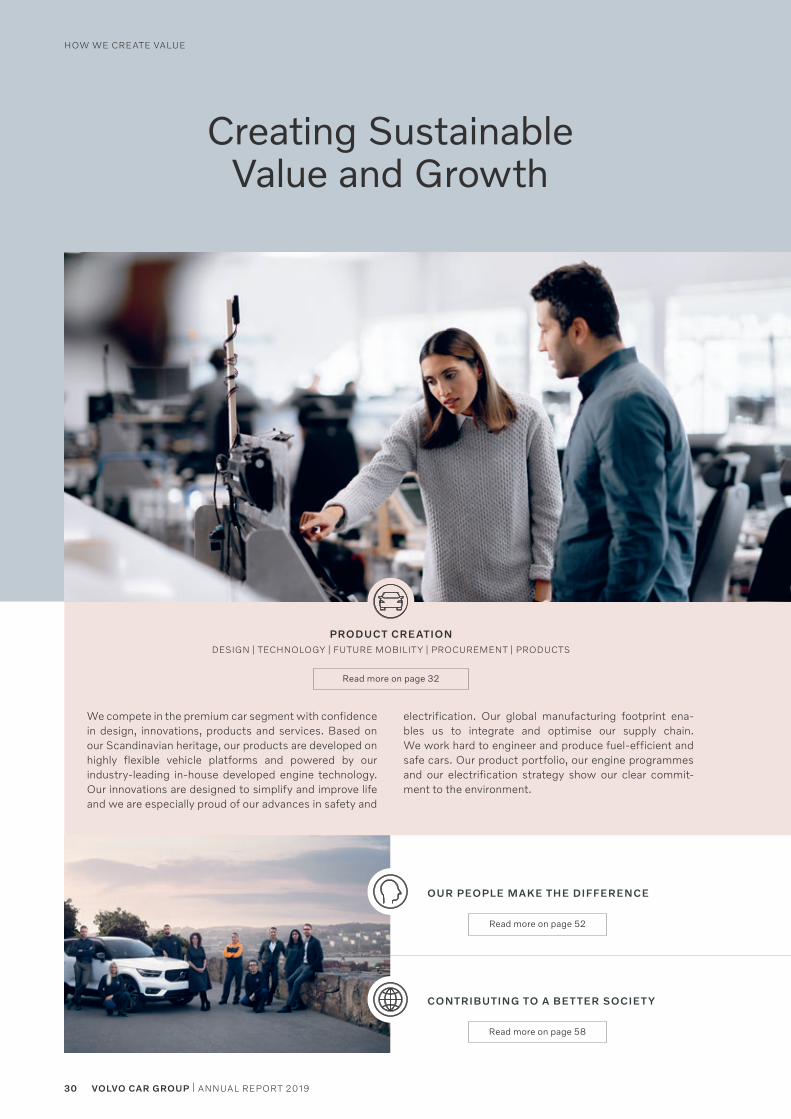
Creating Sustainable Value and Growth
OUR PEOPLE MAKE THE DIFFERENCE
CONTRIBUTING TO A BET TER SOCIET Y
Read more on page 52
Read more on page 58
PRODUCT CREATIONDESIGN | TECHNOLOGY | FUTURE MOBILITY | PROCUREMENT | PRODUCTS
We compete in the premium car segment with confidence in design, innovations, products and services. Based on our Scandinavian heritage, our products are developed on highly flexible vehicle platforms and powered by our industry-leading in-house developed engine technology. Our innovations are designed to simplify and improve life and we are especially proud of our advances in safety and
electrification. Our global manufacturing footprint ena-bles us to integrate and optimise our supply chain. We work hard to engineer and produce fuel-efficient and safe cars. Our product portfolio, our engine programmes and our electrification strategy show our clear commit-ment to the environment.
Read more on page 32
30 VOLVO CAR GROUP | ANNUAL REPORT 2019
HOW WE CREATE VALUE
We contribute to a better society, and protect people and the environment by creating partnerships for sustainable development, as well as promoting traffic safety together with local and international organisations.
Our strength comes from our people. Our open-minded culture unites us and is our competitive edge. We gather around missions and achieve great results. Our culture sets the scene for engagement, development and performance. It is crucial for our business success and therefore also for our attractiveness as an employer.
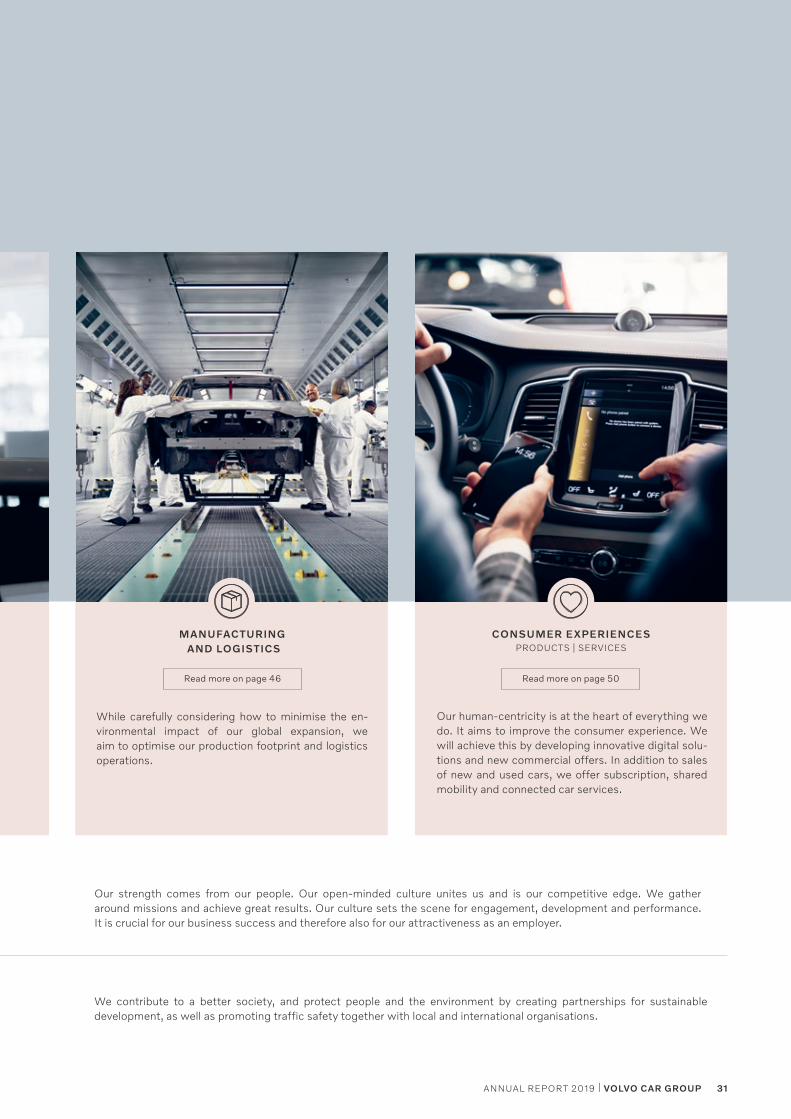
MANUFACTURING AND LOGISTICS
CONSUMER EXPERIENCESPRODUCTS | SERVICES
While carefully considering how to minimise the en -vironmental impact of our global expansion, we aim to optimise our production footprint and logistics operations.
Our human-centricity is at the heart of everything we do. It aims to improve the consumer experience. We will achieve this by developing innovative digital solu-tions and new commercial offers. In addition to sales of new and used cars, we offer subscription, shared mobility and connected car services.
Read more on page 50Read more on page 46
31ANNUAL REPORT 2019 | VOLVO CAR GROUP
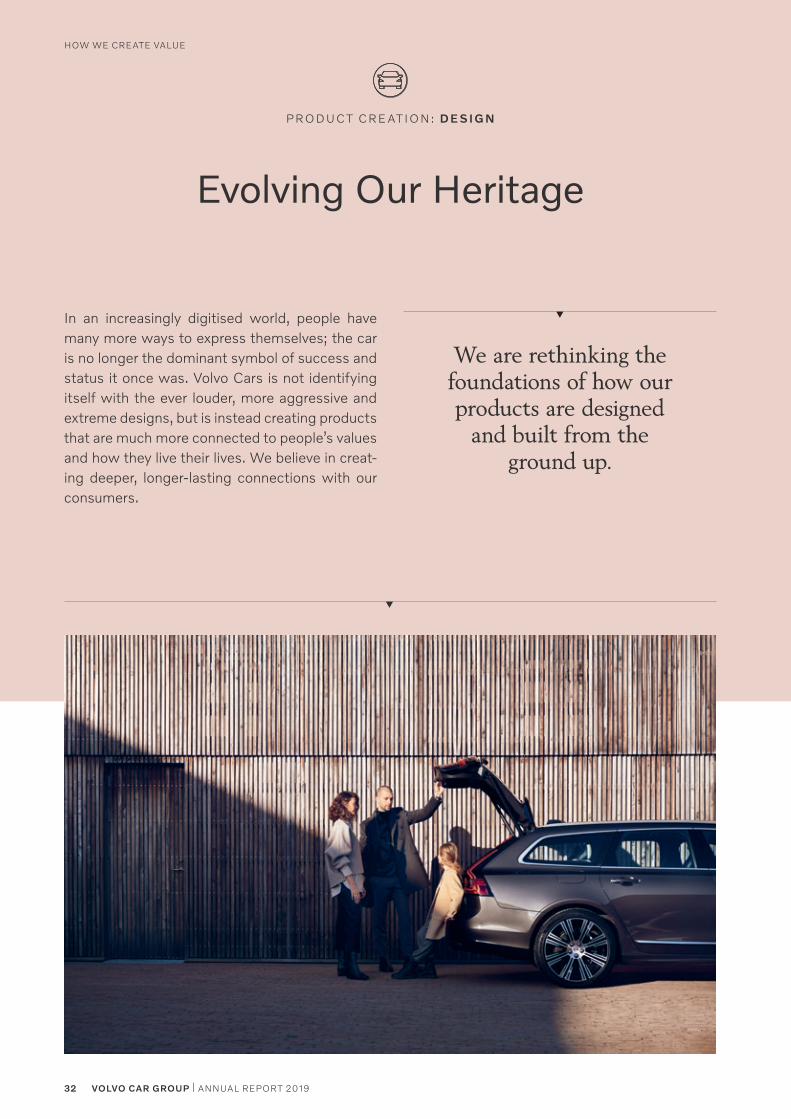
Evolving Our Heritage
In an increasingly digitised world, people have many more ways to express themselves; the car is no longer the dominant symbol of success and status it once was. Volvo Cars is not identifying itself with the ever louder, more aggressive and extreme designs, but is instead creating products that are much more connected to people’s values and how they live their lives. We believe in creat-ing deeper, longer-lasting connections with our consumers.
P RO D U C T C RE AT I O N: D E SI G N
We are rethinking the foundations of how our products are designed
and built from the ground up.
32 VOLVO CAR GROUP | ANNUAL REPORT 2019
HOW WE CREATE VALUE
Placing the consumer at the centre of our creationsWhat is clear is that the car is no longer an object that exists in a vacuum. Key to success in the 2020s is likely to be the crea-tion of an intuitive, consistent and truly personal experience across every touchpoint – whether physical or digital – from the first point of contact a consumer has with our brand to the everyday interaction with one of our cars. In order to achieve this, the User Experience teams have been brought together within the Design department with a focus on placing the con-sumer at the centre of everything we create.
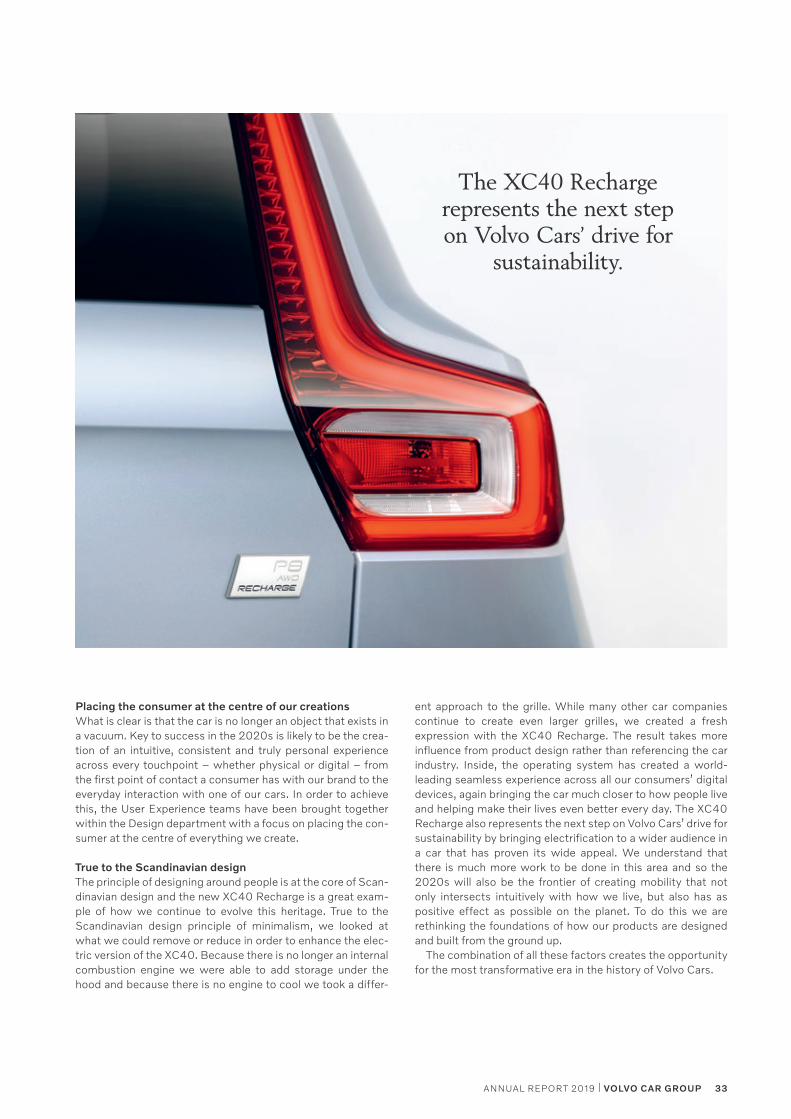
True to the Scandinavian designThe principle of designing around people is at the core of Scan-dinavian design and the new XC40 Recharge is a great exam-ple of how we continue to evolve this heritage. True to the Scandinavian design principle of minimalism, we looked at what we could remove or reduce in order to enhance the elec-tric version of the XC40. Because there is no longer an internal combustion engine we were able to add storage under the hood and because there is no engine to cool we took a differ-
ent approach to the grille. While many other car companies continue to create even larger grilles, we created a fresh expression with the XC40 Recharge. The result takes more influence from product design rather than referencing the car industry. Inside, the operating system has created a world -leading seamless experience across all our consumers’ digital devices, again bringing the car much closer to how people live and helping make their lives even better every day. The XC40 Recharge also represents the next step on Volvo Cars’ drive for sustainability by bringing electrification to a wider audience in a car that has proven its wide appeal. We understand that there is much more work to be done in this area and so the 2020s will also be the frontier of creating mobility that not only intersects intuitively with how we live, but also has as positive effect as possible on the planet. To do this we are rethinking the foundations of how our products are designed and built from the ground up.
The combination of all these factors creates the opportunity for the most transformative era in the history of Volvo Cars.
The XC40 Recharge represents the next step on Volvo Cars’ drive for
sustainability.
33ANNUAL REPORT 2019 | VOLVO CAR GROUP
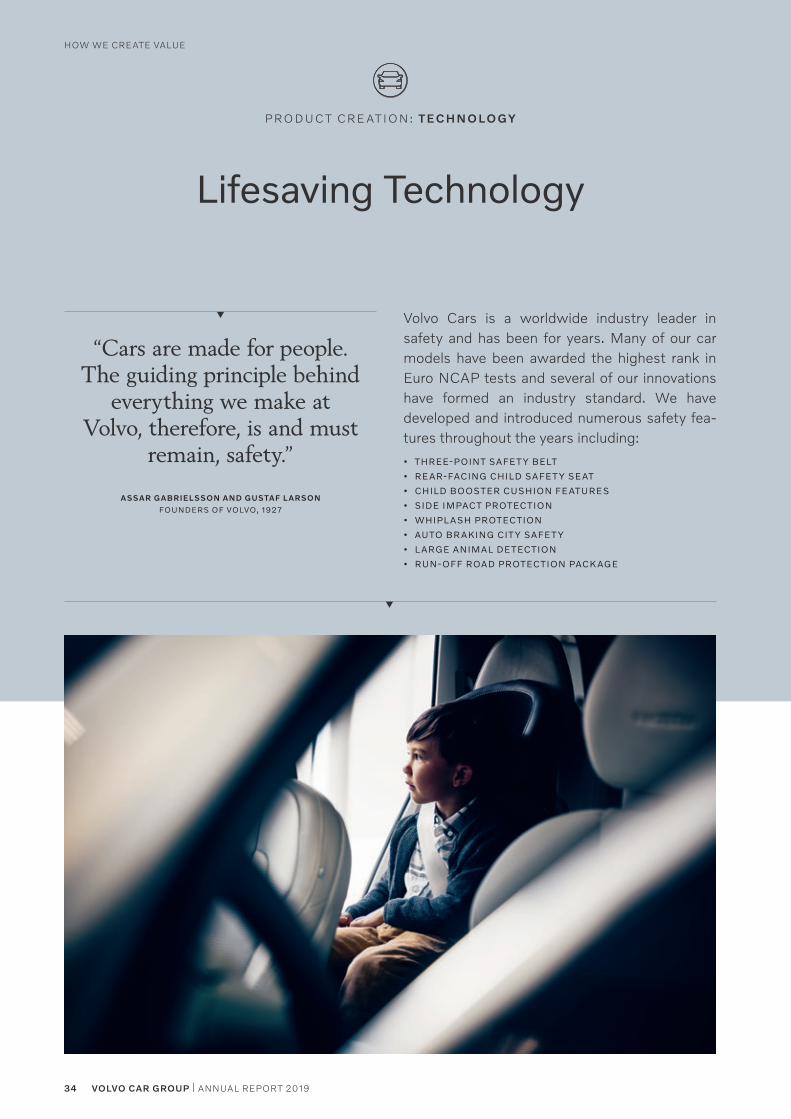
Lifesaving Technology
P RO D U C T C RE AT I O N: T EC H N O LO GY
“Cars are made for people.The guiding principle behind
everything we make at Volvo, therefore, is and must
remain, safety.”
ASSAR GABRIELSSON AND GUSTAF L ARSON
FOUNDERS OF VOLVO, 1927
Volvo Cars is a worldwide industry leader in safety and has been for years. Many of our car models have been awarded the highest rank in Euro NCAP tests and several of our innovations have formed an industry standard. We have developed and introduced numerous safety fea-tures throughout the years including:
• THREE-POINT SAFET Y BELT
• REAR-FACING CHILD SAFET Y SEAT
• CHILD BOOSTER CUSHION FEATURES
• SIDE IMPACT PROTECTION
• WHIPL ASH PROTECTION
• AUTO BR AKING CIT Y SAFET Y
• L ARGE ANIMAL DETECTION
• RUN-OFF ROAD PROTECTION PACK AGE
34 VOLVO CAR GROUP | ANNUAL REPORT 2019
HOW WE CREATE VALUE
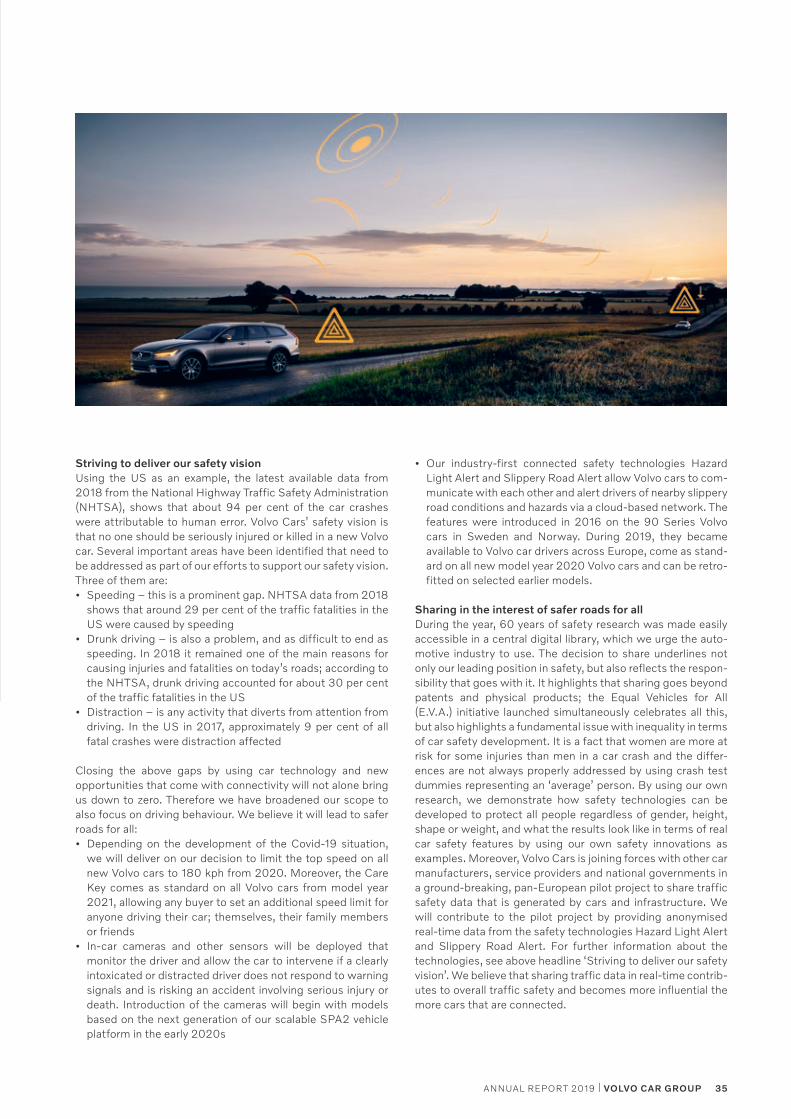
• Our industry-first connected safety technologies Hazard Light Alert and Slippery Road Alert allow Volvo cars to com-municate with each other and alert drivers of nearby slippery road conditions and hazards via a cloud-based network. The features were introduced in 2016 on the 90 Series Volvo cars in Sweden and Norway. During 2019, they became available to Volvo car drivers across Europe, come as stand-ard on all new model year 2020 Volvo cars and can be retro-fitted on selected earlier models.
Sharing in the interest of safer roads for allDuring the year, 60 years of safety research was made easily accessible in a central digital library, which we urge the auto-motive industry to use. The decision to share underlines not only our leading position in safety, but also reflects the respon-sibility that goes with it. It highlights that sharing goes beyond patents and physical products; the Equal Vehicles for All (E.V.A.) initiative launched simultaneously celebrates all this, but also highlights a fundamental issue with inequality in terms of car safety development. It is a fact that women are more at risk for some injuries than men in a car crash and the differ-ences are not always properly addressed by using crash test dummies representing an ‘average’ person. By using our own research, we demonstrate how safety technologies can be developed to protect all people regardless of gender, height, shape or weight, and what the results look like in terms of real car safety features by using our own safety innovations as examples. Moreover, Volvo Cars is joining forces with other car manufacturers, service providers and national governments in a ground-breaking, pan-European pilot project to share traffic safety data that is generated by cars and infrastructure. We will contribute to the pilot project by providing anonymised real-time data from the safety technologies Hazard Light Alert and Slippery Road Alert. For further information about the technologies, see above headline ‘Striving to deliver our safety vision’. We believe that sharing traffic data in real-time contrib-utes to overall traffic safety and becomes more influential the more cars that are connected.
Striving to deliver our safety visionUsing the US as an example, the latest available data from 2018 from the National Highway Traffic Safety Administration (NHTSA), shows that about 94 per cent of the car crashes were attributable to human error. Volvo Cars’ safety vision is that no one should be seriously injured or killed in a new Volvo car. Several important areas have been identified that need to be addressed as part of our efforts to support our safety vision. Three of them are:• Speeding – this is a prominent gap. NHTSA data from 2018
shows that around 29 per cent of the traffic fatalities in the US were caused by speeding
• Drunk driving – is also a problem, and as difficult to end as speeding. In 2018 it remained one of the main reasons for causing injuries and fatalities on today’s roads; according to the NHTSA, drunk driving accounted for about 30 per cent of the traffic fatalities in the US
• Distraction – is any activity that diverts from attention from driving. In the US in 2017, approximately 9 per cent of all fatal crashes were distraction affected
Closing the above gaps by using car technology and new opportunities that come with connectivity will not alone bring us down to zero. Therefore we have broadened our scope to also focus on driving behaviour. We believe it will lead to safer roads for all:• Depending on the development of the Covid-19 situation,
we will deliver on our decision to limit the top speed on all new Volvo cars to 180 kph from 2020. Moreover, the Care Key comes as standard on all Volvo cars from model year 2021, allowing any buyer to set an additional speed limit for anyone driving their car; themselves, their family members or friends
• In-car cameras and other sensors will be deployed that monitor the driver and allow the car to intervene if a clearly intoxicated or distracted driver does not respond to warning signals and is risking an accident involving serious injury or death. Introduction of the cameras will begin with models based on the next generation of our scalable SPA2 vehicle platform in the early 2020s
35ANNUAL REPORT 2019 | VOLVO CAR GROUP
Shaping the Future of Mobility
P RO D U C T C RE AT I O N: FU T U R E M O B I L I T Y
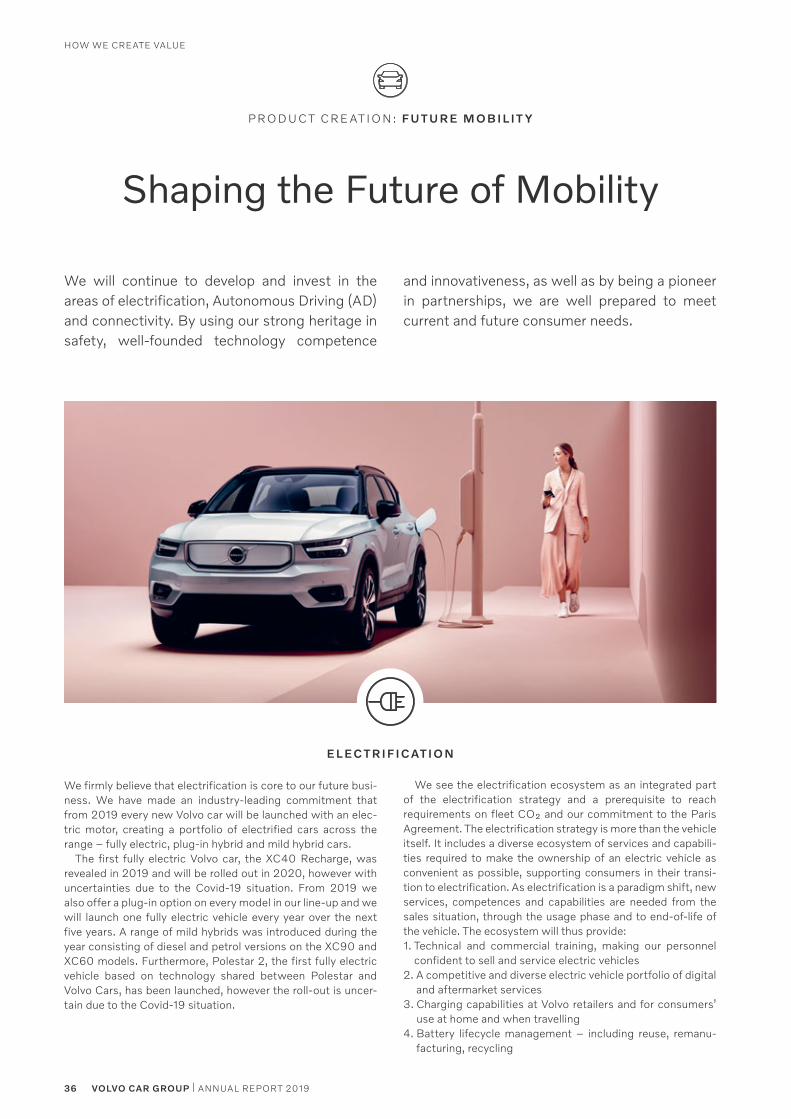
We firmly believe that electrification is core to our future busi-ness. We have made an industry-leading commitment that from 2019 every new Volvo car will be launched with an elec-tric motor, creating a portfolio of electrified cars across the range – fully electric, plug-in hybrid and mild hybrid cars.
The first fully electric Volvo car, the XC40 Recharge, was revealed in 2019 and will be rolled out in 2020, however with uncertainties due to the Covid-19 situation. From 2019 we also offer a plug-in option on every model in our line-up and we will launch one fully electric vehicle every year over the next five years. A range of mild hybrids was introduced during the year consisting of diesel and petrol versions on the XC90 and XC60 models. Furthermore, Polestar 2, the first fully electric vehicle based on technology shared between Polestar and Volvo Cars, has been launched, however the roll-out is uncer-tain due to the Covid-19 situation.
We see the electrification ecosystem as an integrated part of the electrification strategy and a prerequisite to reach requirements on fleet CO₂ and our commitment to the Paris Agreement. The electrification strategy is more than the vehicle itself. It includes a diverse ecosystem of services and capabili-ties required to make the ownership of an electric vehicle as convenient as possible, supporting consumers in their transi-tion to electrification. As electrification is a paradigm shift, new services, competences and capabilities are needed from the sales situation, through the usage phase and to end-of-life of the vehicle. The ecosystem will thus provide:1. Technical and commercial training, making our personnel
confident to sell and service electric vehicles2. A competitive and diverse electric vehicle portfolio of digital
and aftermarket services3. Charging capabilities at Volvo retailers and for consumers’
use at home and when travelling4. Battery lifecycle management – including reuse, remanu-
facturing, recycling
EL EC T R I FI C AT I O N
We will continue to develop and invest in the areas of electrification, Autonomous Driving (AD) and connectivity. By using our strong heritage in safety, well-founded technology competence
and innovativeness, as well as by being a pioneer in partnerships, we are well prepared to meet current and future consumer needs.
36 VOLVO CAR GROUP | ANNUAL REPORT 2019
HOW WE CREATE VALUE
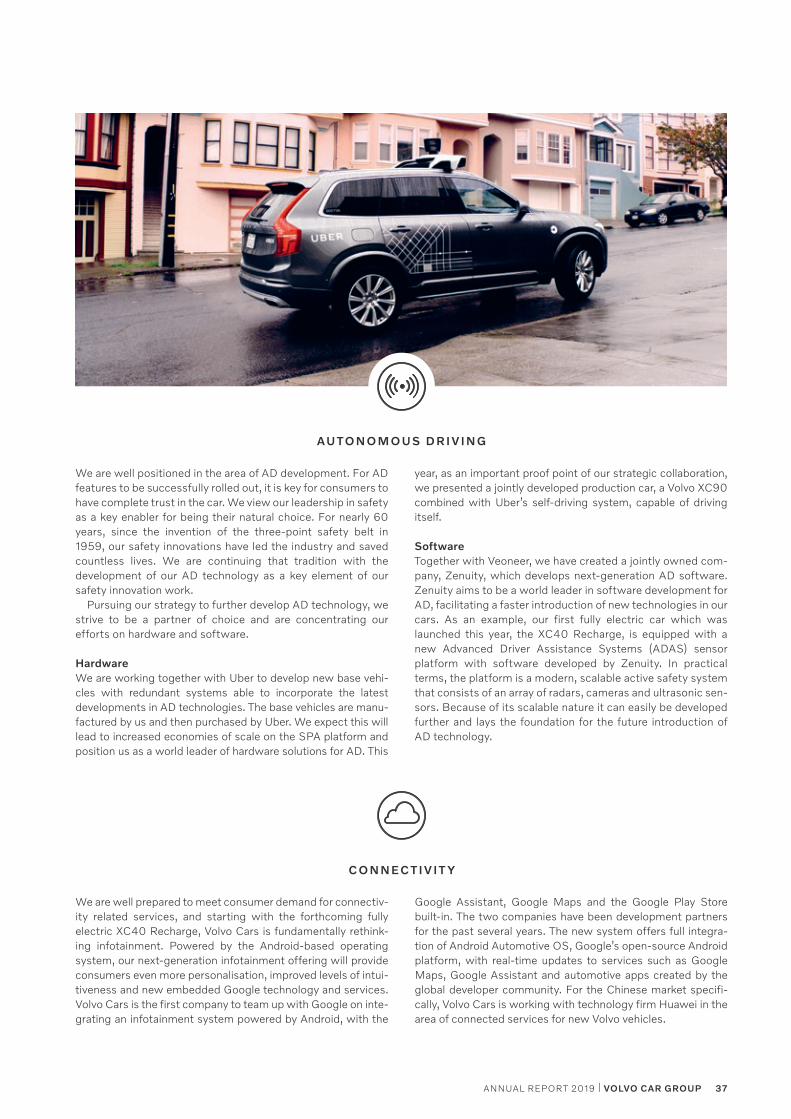
We are well positioned in the area of AD development. For AD features to be successfully rolled out, it is key for consumers to have complete trust in the car. We view our leadership in safety as a key enabler for being their natural choice. For nearly 60 years, since the invention of the three-point safety belt in 1959, our safety innovations have led the industry and saved countless lives. We are continuing that tradition with the development of our AD technology as a key element of our safety innovation work. Pursuing our strategy to further develop AD technology, we strive to be a partner of choice and are concentrating our efforts on hardware and software.
HardwareWe are working together with Uber to develop new base vehi-cles with redundant systems able to incorporate the latest developments in AD technologies. The base vehicles are manu-factured by us and then purchased by Uber. We expect this will lead to increased economies of scale on the SPA platform and position us as a world leader of hardware solutions for AD. This
AU T O N O M O US D R I V I N G
year, as an important proof point of our strategic collaboration, we presented a jointly developed production car, a Volvo XC90 combined with Uber’s self-driving system, capable of driving itself.
SoftwareTogether with Veoneer, we have created a jointly owned com-pany, Zenuity, which develops next-generation AD software. Zenuity aims to be a world leader in software development for AD, facilitating a faster introduction of new technologies in our cars. As an example, our first fully electric car which was launched this year, the XC40 Recharge, is equipped with a new Advanced Driver Assistance Systems (ADAS) sensor platform with software developed by Zenuity. In practical terms, the platform is a modern, scalable active safety system that consists of an array of radars, cameras and ultrasonic sen-sors. Because of its scalable nature it can easily be developed further and lays the foundation for the future introduction of AD technology.
C O N N EC T I V I T Y
We are well prepared to meet consumer demand for connectiv-ity related services, and starting with the forthcoming fully electric XC40 Recharge, Volvo Cars is fundamentally rethink-ing infotainment. Powered by the Android-based operating system, our next-generation infotainment offering will provide consumers even more personalisation, improved levels of intui-tiveness and new embedded Google technology and services. Volvo Cars is the first company to team up with Google on inte-grating an infotainment system powered by Android, with the
Google Assistant, Google Maps and the Google Play Store built-in. The two companies have been development partners for the past several years. The new system offers full integra-tion of Android Automotive OS, Google’s open-source Android platform, with real-time updates to services such as Google Maps, Google Assistant and automotive apps created by the global developer community. For the Chinese market specifi-cally, Volvo Cars is working with technology firm Huawei in the area of connected services for new Volvo vehicles.
37ANNUAL REPORT 2019 | VOLVO CAR GROUP
Shaping Sustainable Supply Chains
P RO D U C T C RE AT I O N: P RO C U R EM EN T
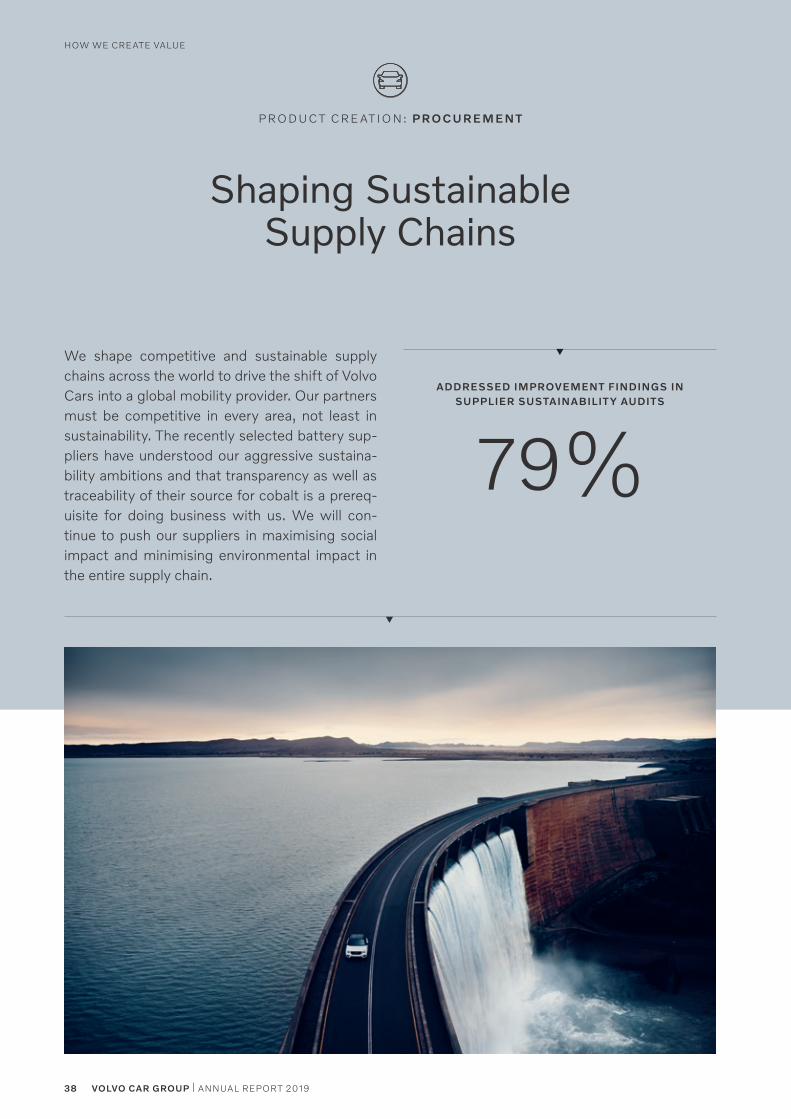
We shape competitive and sustainable supply chains across the world to drive the shift of Volvo Cars into a global mobility provider. Our partners must be competitive in every area, not least in sustainability. The recently selected battery sup-pliers have understood our aggressive sustaina-bility ambitions and that transparency as well as traceability of their source for cobalt is a prereq-uisite for doing business with us. We will con-tinue to push our suppliers in maximising social impact and minimising environmental impact in the entire supply chain.
ADDRESSED IMPROVEMENT FINDINGS INSUPPLIER SUSTAINABILIT Y AUDITS
79%
38 VOLVO CAR GROUP | ANNUAL REPORT 2019
HOW WE CREATE VALUE
Responsible supply chainSustainability requirements for suppliersSustainability requirements are an integrated part of our con-tractual agreements with suppliers. The Volvo Cars Code of Conduct for Business Partners states our basic expectations on their sustainability performance, such as legal compliance, human rights, working conditions, caring for the environment and business integrity. Additionally, all suppliers are screened in a Compliance Due Diligence prior to entering into a contrac-tual arrangement and on a continuous basis. This is to identify and mitigate legal risks in the fields of Corruption and Trade Sanctions, Money Laundering and Violations of Human Rights. Suppliers must meet the requirements and implement sys-tematic management of all areas, including ensuring that employees and sub-suppliers respect the principles. Our con-tractual agreements also include numerous other sustainabil-ity requirements, such as having a certified management sys-tem for quality and environment (ISO9001, IATF16949 and ISO14001), reporting material content to the automotive International Material Data System (IMDS) and to be proactive in addressing issues and driving efficiency.
Supply chain sustainability risk awarenessTo ensure awareness of potential risks and prioritise suppliers based on sustainability assessments, we analyse them accord-ing to the Risk Assessment Tool developed by the Responsible Business Alliance – an industry coalition dedicated to corpo-rate social responsibility in global supply chains.
During 2019, 4,434 supplier sites were included in the risk scoring which corresponds to 100 per cent of active first-tier supplier and directed sub-tier supplier sites delivering vehicle parts, components and services to Volvo Cars at the time of evaluation.
Supplier sustainability assessmentsWe are committed to ensuring that the people who make our products and components, or provide services, are treated with dignity and respect. Our alignment with suppliers on these principles is essential. Volvo Cars applies sustainability assessments to verify compliance with requirements, but also to identify improvement areas which could lead to increased sustainable business practices throughout the supply chain.
Sustainability Self-Assessment QuestionnaireThe Self-Assessment Questionnaire (SAQ) on CSR/Sustaina-bility has been developed in conjunction with the automotive industry as part of a collaborative initiative called Drive Sus-tainability. The questionnaire covers sustainability areas such as business ethics, human rights, environmental management and responsible sourcing. All answers are validated by an external assessor and, based on the SAQ evaluation, the sup-plier can be provided with recommendations on how to improve. We require suppliers to complete the SAQ upon request, and the SAQ is a mandatory element in the sourcing process of all suppliers providing production material since 2019. During the reporting year, 754 supplier sites submitted a completed SAQ with us. All sites delivering production mate-rial have been invited and 88.0 per cent have so far submitted a completed SAQ.
Volvo Cars has the ambition to be a recognised leader in respon-sible business. As a premium global mobility provider, we have an opportunity to have a substantial positive impact on the planet in how we select, collaborate with, and steer our supply chain towards our sustainability strategy. We recognise that there can be significant adverse social and environmental impacts associ-ated with the production of in particular our lithium-ion batteries, including the use of cobalt, copper, lithium and mica, and work proactively with our suppliers to provide confidence to our con-sumers that Volvo Cars sources responsibly with transparency and respect for the planet and people.
In 2019, Volvo Cars announced that the use of blockchain tech-nology would be implemented to ensure complete tracability in the cobalt supply chain, all the way down to the mine.
VOLVO CARS HIGHLIGHTS
Ensuring responsiblesourcing
39ANNUAL REPORT 2019 | VOLVO CAR GROUP
Supplier sustainability auditsThe purpose of Volvo Cars Sustainability Audit Program is to make comprehensive on-site evaluations of suppliers’ sustain-ability performance that is based on the Code of Conduct for Business Partners. Most audits are conducted by an accred-ited third-party auditor, but we also have qualified in-house capacity to perform supplier audits. During 2019, we con-ducted 33 supplier audits prioritised from a list of suppliers receiving a high-risk score or was prioritised for other com-mercial reasons. Since 2015, we have performed 127 sustain-ability audits amongst our first-tier and directed sub-tier sup-pliers. As of 2019, we have addressed approximately 79 per cent of the improvement findings identified in our audit pro-gram. For the remaining findings, we continue to work for improvements in close collaboration with our suppliers.
During 2019, we have also focused on logistic suppliers’ work situation in Europe. With the basis on our Code of Con-duct for Business Partners, we have conducted unannounced interviews with suppliers entering some of our European plants to increase awareness and assess compliance on driv-ers’ working conditions. The feedback from the interviews has encouraged us to review requirements, instructions and signs when entering the plant. We intend to enhance collaborations within the area to scale efforts.
Supply of minerals and metalsVolvo Cars is committed to the responsible sourcing of metals and minerals, including cobalt, within our supply chain. We work hard to ensure that we only use minerals and metals whose extraction, processing, trade and transportation have not directly or indirectly resulted in human rights abuses, severe environmental harm or provided funding to conflicts. As part of that commitment, we fully support the OECD Guid-ance for Responsible Supply Chains of Minerals from Con-flict-Affected and High-Risk Areas. In this respect, we are working with our suppliers and sub-suppliers to secure full transparency and traceability of our cobalt and 3TG supply chain. All our suppliers are expected to comply with our Code of Conduct for Business Partners, which includes the observa-tion of human rights, including labour rights.
Our position statement on metals and minerals is publicly available through our website. We use the Conflict Mineral Reporting Template (CMRT) established under the US Dodd Frank Act, to collect information about smelters, refiners and other entities in our supply chain. As a member of the Respon-sible Mineral Initiative (RMI), we gain access to additional data, most importantly audit status, on a high number of smelters upstream the supply chain. All smelters and refiners are required to undergo audits, which will determine and vali-date their compliance with human rights and the OECD Guid-ance. The aggregated information from the RMI and CMRT forms our due diligence process for conflict minerals where we identify potential discrepancies and follow-up on mitigation action plans.
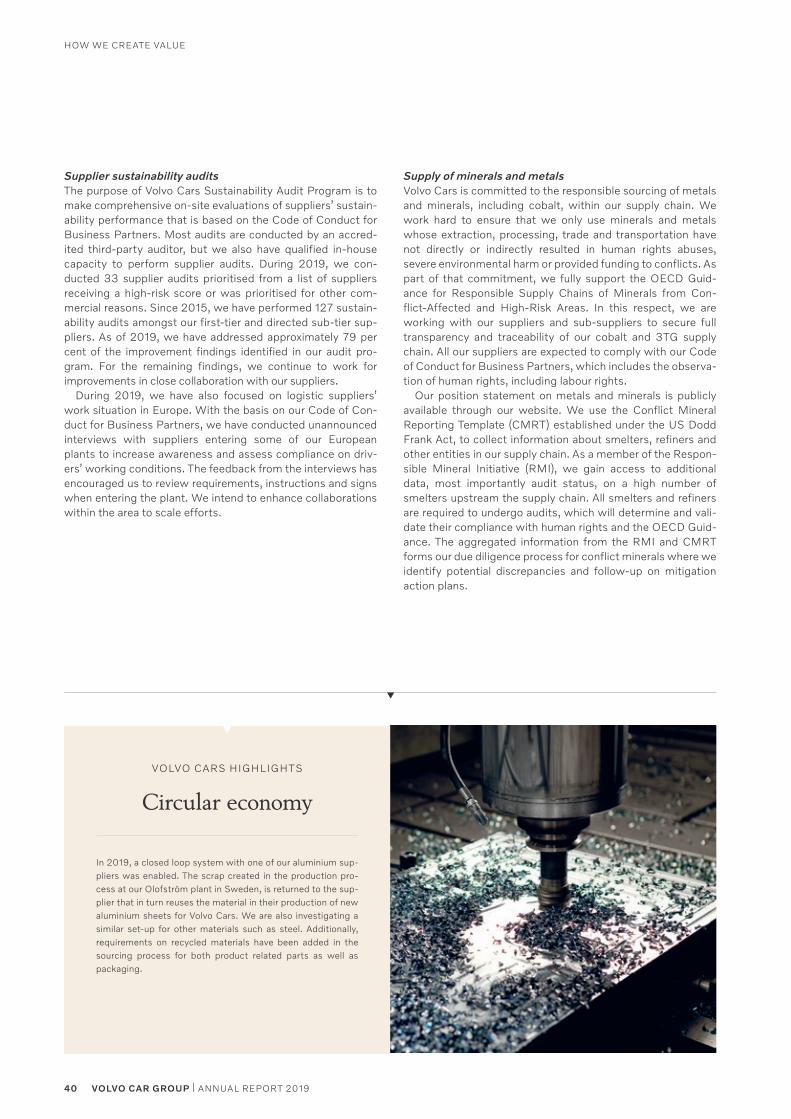
In 2019, a closed loop system with one of our aluminium sup-pliers was enabled. The scrap created in the production pro-cess at our Olofström plant in Sweden, is returned to the sup-plier that in turn reuses the material in their production of new aluminium sheets for Volvo Cars. We are also investigating a similar set-up for other materials such as steel. Additionally, requirements on recycled materials have been added in the sourcing process for both product related parts as well as packaging.
VOLVO CARS HIGHLIGHTS
Circular economy
40 VOLVO CAR GROUP | ANNUAL REPORT 2019
HOW WE CREATE VALUE
Volvo Cars’ target is to have 100 per cent RMI approved 3TG smelters by the end of 2020. So far, around 130 suppliers have reported 3TG content in production materials delivered to Volvo Cars. In 2017, Volvo Cars aligned with its suppliers and started to investigate how many smelters these suppliers had in their supply chains and how many suppliers were conformant with RMI approved smelter list. So far, at the end of 2019, we have reached 71.0 per cent conformant smelters which is in line with our target for this year.
During the year, Volvo Cars signed long-term agreements with leading battery makers CATL and LG Chem to ensure the global supply of lithium ion batteries over the coming decade for next-generation Volvo and Polestar car models. The agree-ments cover the supply of battery modules for all car models on the upcoming SPA2 and the existing CMA modular vehicle platforms. The agreements represent a major step towards realising our electrification strategy, which is key to providing sustainable mobility.
Moreover, Volvo Cars is the first carmaker to implement global traceability of cobalt used in our batteries by applying blockchain technology. Technology firms Circulor and Oracle operate the blockchain technology across CATL’s and LG Chem’s supply chain. We are also members of the Responsible Sourcing Blockchain Network (RSBN). Together with respon-sible sourcing specialists RCS Global and Better Mining we are also involved in monitoring of activities on the ground for the protection of human rights in artisanal and small-scale mining.
Sustainability integration in supply chain management Sustainability in VQESince 2012, Volvo Cars has used the Volvo Cars Quality Excel-lence process (VQE) to monitor suppliers’ performance in rela-tion to our requirements and expectations, such as delivery performance and quality. An award is given to acknowledge suppliers that are successful in all evaluated sets of quality, manufacturing and delivery performance disciplines. Since 2018, sustainability is a new separate element in the VQE evaluation, showing that high sustainability performance is an absolute criteria to become an awarded supplier. The VQE sus-tainability element is based on the SAQ, with a Volvo Cars unique rating.
Supplier Sustainability Dialogue Volvo Cars’ annual Supplier Sustainability Dialogue brings together hundreds of our suppliers to discuss how we can become a more sustainable industry together. This year’s theme was Climate Change. Material production emissions is a large CO2 contributor, and we need each part of the supply chain to look at resource efficiency to reduce their environ-mental footprint. Other topics on the agenda were grievance mechanisms, conflict minerals and the UN Sustainable Devel-opment Goals (SDGs).
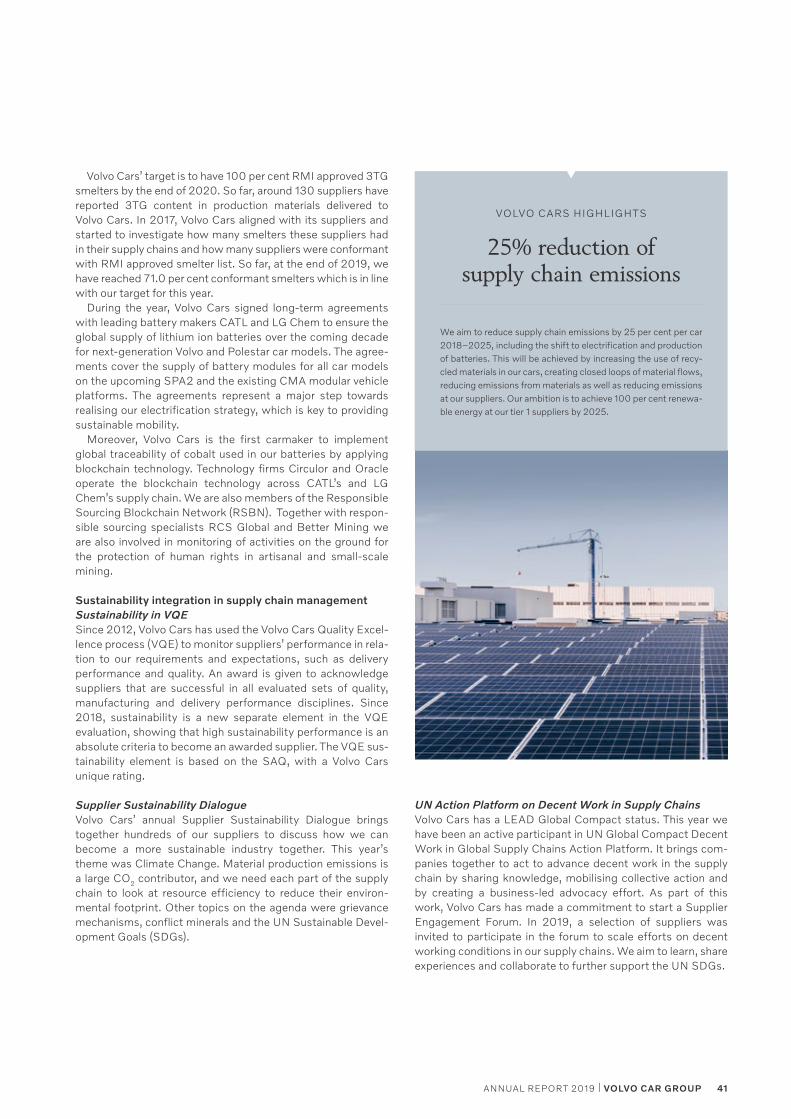
We aim to reduce supply chain emissions by 25 per cent per car 2018–2025, including the shift to electrification and production of batteries. This will be achieved by increasing the use of recy-cled materials in our cars, creating closed loops of material flows, reducing emissions from materials as well as reducing emissions at our suppliers. Our ambition is to achieve 100 per cent renewa-ble energy at our tier 1 suppliers by 2025.
VOLVO CARS HIGHLIGHTS
25% reduction of supply chain emissions
UN Action Platform on Decent Work in Supply ChainsVolvo Cars has a LEAD Global Compact status. This year we have been an active participant in UN Global Compact Decent Work in Global Supply Chains Action Platform. It brings com-panies together to act to advance decent work in the supply chain by sharing knowledge, mobilising collective action and by creating a business-led advocacy effort. As part of this work, Volvo Cars has made a commitment to start a Supplier Engagement Forum. In 2019, a selection of suppliers was invited to participate in the forum to scale efforts on decent working conditions in our supply chains. We aim to learn, share experiences and collaborate to further support the UN SDGs.
41ANNUAL REPORT 2019 | VOLVO CAR GROUP
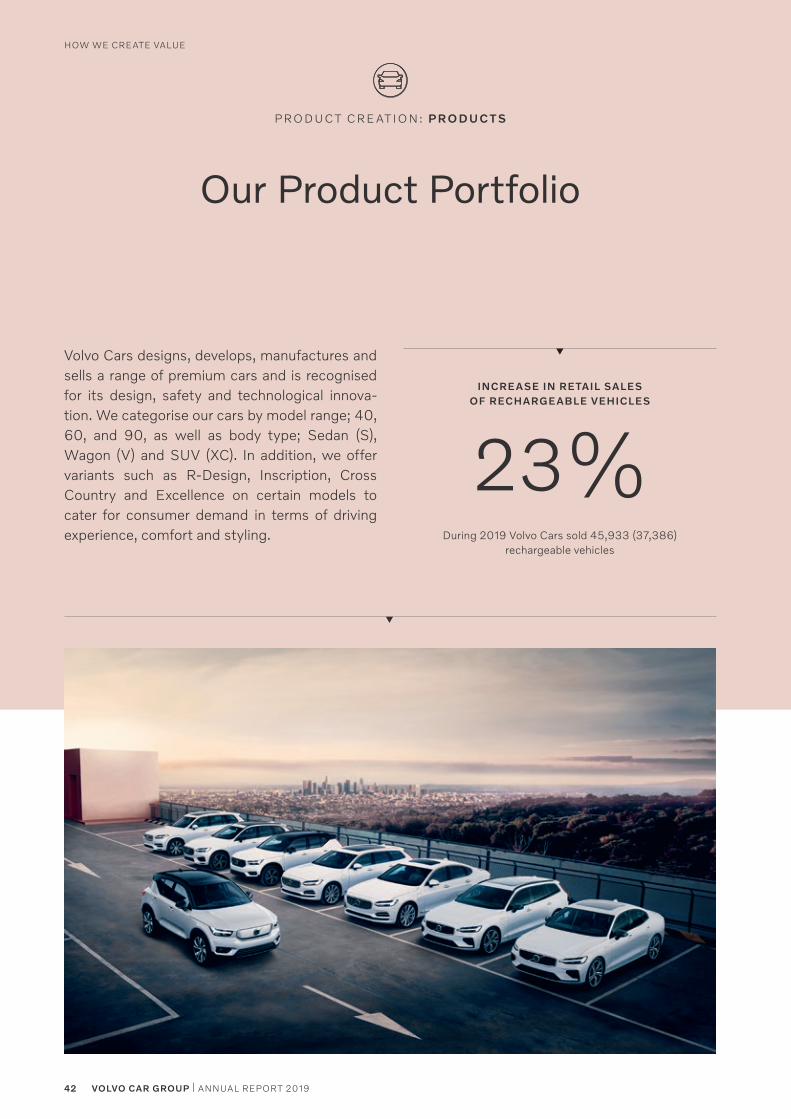
INCREASE IN RETAIL SALES OF RECHARGEABLE VEHICLES
23%
Our Product Portfolio
P RO D U C T C RE AT I O N: P RO D U C T S
Volvo Cars designs, develops, manufactures and sells a range of premium cars and is recognised for its design, safety and technological innova-tion. We categorise our cars by model range; 40, 60, and 90, as well as body type; Sedan (S), Wagon (V) and SUV (XC). In addition, we offer variants such as R-Design, Inscription, Cross Country and Excellence on certain models to cater for consumer demand in terms of driving experience, comfort and styling. During 2019 Volvo Cars sold 45,933 (37,386)
rechargeable vehicles
42 VOLVO CAR GROUP | ANNUAL REPORT 2019
HOW WE CREATE VALUE
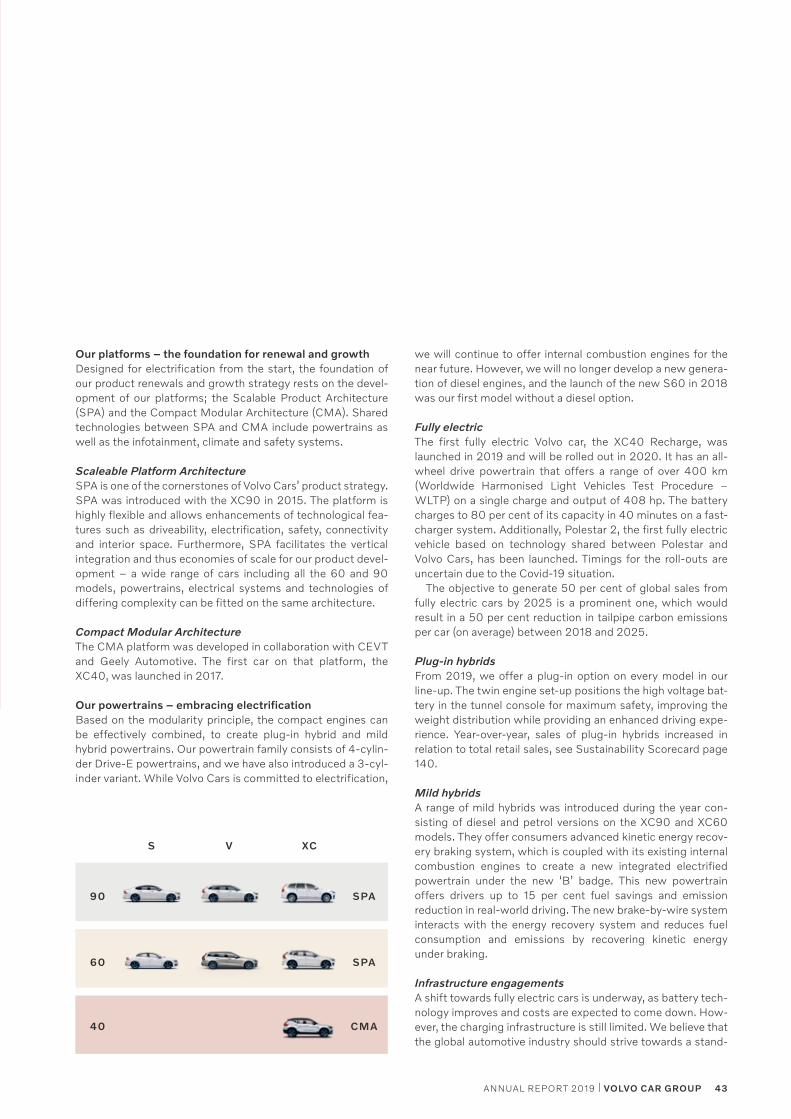
90 SPA
40 CMA
60 SPA
Our platforms – the foundation for renewal and growthDesigned for electrification from the start, the foundation of our product renewals and growth strategy rests on the devel-opment of our platforms; the Scalable Product Architecture (SPA) and the Compact Modular Architecture (CMA). Shared technologies between SPA and CMA include powertrains as well as the infotainment, climate and safety systems.
Scaleable Platform ArchitectureSPA is one of the cornerstones of Volvo Cars’ product strategy. SPA was introduced with the XC90 in 2015. The platform is highly flexible and allows enhancements of technological fea-tures such as driveability, electrification, safety, connectivity and interior space. Furthermore, SPA facilitates the vertical integration and thus economies of scale for our product devel-opment – a wide range of cars including all the 60 and 90 models, powertrains, electrical systems and technologies of differing complexity can be fitted on the same architecture.
Compact Modular ArchitectureThe CMA platform was developed in collaboration with CEVT and Geely Automotive. The first car on that platform, the XC40, was launched in 2017.
Our powertrains – embracing electrificationBased on the modularity principle, the compact engines can be effectively combined, to create plug-in hybrid and mild hybrid powertrains. Our powertrain family consists of 4-cylin-der Drive-E powertrains, and we have also introduced a 3-cyl-inder variant. While Volvo Cars is committed to electrification,
we will continue to offer internal combustion engines for the near future. However, we will no longer develop a new genera-tion of diesel engines, and the launch of the new S60 in 2018 was our first model without a diesel option.
Fully electricThe first fully electric Volvo car, the XC40 Recharge, was launched in 2019 and will be rolled out in 2020. It has an all-wheel drive powertrain that offers a range of over 400 km (Worldwide Harmonised Light Vehicles Test Procedure – WLTP) on a single charge and output of 408 hp. The battery charges to 80 per cent of its capacity in 40 minutes on a fast-charger system. Additionally, Polestar 2, the first fully electric vehicle based on technology shared between Polestar and Volvo Cars, has been launched. Timings for the roll-outs are uncertain due to the Covid-19 situation.
The objective to generate 50 per cent of global sales from fully electric cars by 2025 is a prominent one, which would result in a 50 per cent reduction in tailpipe carbon emissions per car (on average) between 2018 and 2025.
Plug-in hybridsFrom 2019, we offer a plug-in option on every model in our line-up. The twin engine set-up positions the high voltage bat-tery in the tunnel console for maximum safety, improving the weight distribution while providing an enhanced driving expe-rience. Year-over-year, sales of plug-in hybrids increased in relation to total retail sales, see Sustainability Scorecard page 140.
Mild hybridsA range of mild hybrids was introduced during the year con-sisting of diesel and petrol versions on the XC90 and XC60 models. They offer consumers advanced kinetic energy recov-ery braking system, which is coupled with its existing internal combustion engines to create a new integrated electrified powertrain under the new ‘B’ badge. This new powertrain offers drivers up to 15 per cent fuel savings and emission reduction in real-world driving. The new brake-by-wire system interacts with the energy recovery system and reduces fuel consumption and emissions by recovering kinetic energy under braking.
Infrastructure engagementsA shift towards fully electric cars is underway, as battery tech-nology improves and costs are expected to come down. How-ever, the charging infrastructure is still limited. We believe that the global automotive industry should strive towards a stand-
S V XC
43ANNUAL REPORT 2019 | VOLVO CAR GROUP
ardised charging infrastructure for electric cars. To support, we have joined the Charging Interface Initiative (CII), a consor-tium of stakeholders founded to establish a combined charg-ing system as the standard for charging battery powered vehi-cles. The CII is currently drawing up requirements for the evolution of charging related standards and certification for use with carmakers around the globe.
CO2 tailpipe emissionsLimiting CO2 emissions is a challenge for the entire automotive industry. We keep ahead of current and future emission stand-ards in all our markets by developing efficient technological solutions and a thorough follow-up of legal compliance twice a year. Our EU fleet average CO2 emissions (based on NEDC correlated figures from WLTP tests) showed a decrease from 133 g/km in 2018 to 132 g/km in 2019. This was mainly due to increased sales of our plug-in hybrids. We track our CO2 fleet average continuously. With our electrification strategy, we expect to fulfil the Volvo Cars 2021 EU target of approximately 110 g CO2/km (total EU fleet industry target is 95 g CO2/km), without purchasing credits from others. Worldwide Harmonised Light Vehicles Test Procedure (WLTP) has replaced the former NEDC in Europe. All our carlines offered in Europe, are homologated according to the new procedure. NEDC and WLTP figures can be presented to consumers and dealers already during configuration. By doing so, we present the CO2 impact in every configuration step. Volvo Cars was the first automotive company to communicate WLTP figures for the entire range to our EU consumers. The WLTP fleet average figure for Europe in 2019 was 157 g CO2/km. See Sustainability Scorecard page 140 for more details.
Circular economyWe recognise the value of the circular economy in reducing waste and keeping products and materials in use for a longer period of time. In this respect, Volvo Cars is committed to tak-ing a more circular approach to our offer. This will be a focus area moving forward and one of our ways of reducing the envi-ronmental footprint of our vehicles. It includes making greater
use of sustainable materials in our vehicles as well as post- first life electric vehicle battery management. In terms of recyclable materials, we design our cars so that about 95 per cent of the materials can be recovered, either reused or recycled.
The lifecycle performance of our products We have a long history of carrying out environmental analyses with a holistic perspective and work has been intensified in recent years. We carry out simplified Life Cycle Assessments (LCAs) on all our models and we continuously develop and improve our methods. Additionally, we participate in several research projects and networks.
In October, we announced that we will disclose the average lifecycle CO2 footprint of each new model starting with the XC40 Recharge.
Recycled plasticsIn 2018, we announced our Recycled Plastics Vision that by 2025, at least 25 per cent of the plastics used in every newly launched Volvo car will be made from recycled material. This will be achieved by working closely with suppliers and the recycling industry, as well as taking part in research projects and networks. Our vision is to help drive supply of more recy-cled plastics within the automotive industry and are working on an efficient way to measure and follow up on our progress. To demonstrate the viability of the vision, we revealed an XC60 T8 plug-in hybrid demo car with more than 170 parts made from recycled material. Our vision was commended by UN Environment as an example for other companies to follow, par-ticularly in terms of reducing primary plastic production and plastic pollution.
Recycled steel and aluminiumSteel and aluminium represent a significant environmental footprint of the materials in our vehicles. Therefore, this year, we have intensified our work to minimise the negative impacts. Our work includes both increasing the recycled content and decreasing the footprint of the production processes used to create these metals. For aluminium the use of renewable
CO2 EMISSIONS – EU FLEET AVERAGE VOLVO CARS –
16 17 1815 19
NEDC WLTP
CO2 g/km
200
150
100
50
0
44 VOLVO CAR GROUP | ANNUAL REPORT 2019
HOW WE CREATE VALUE
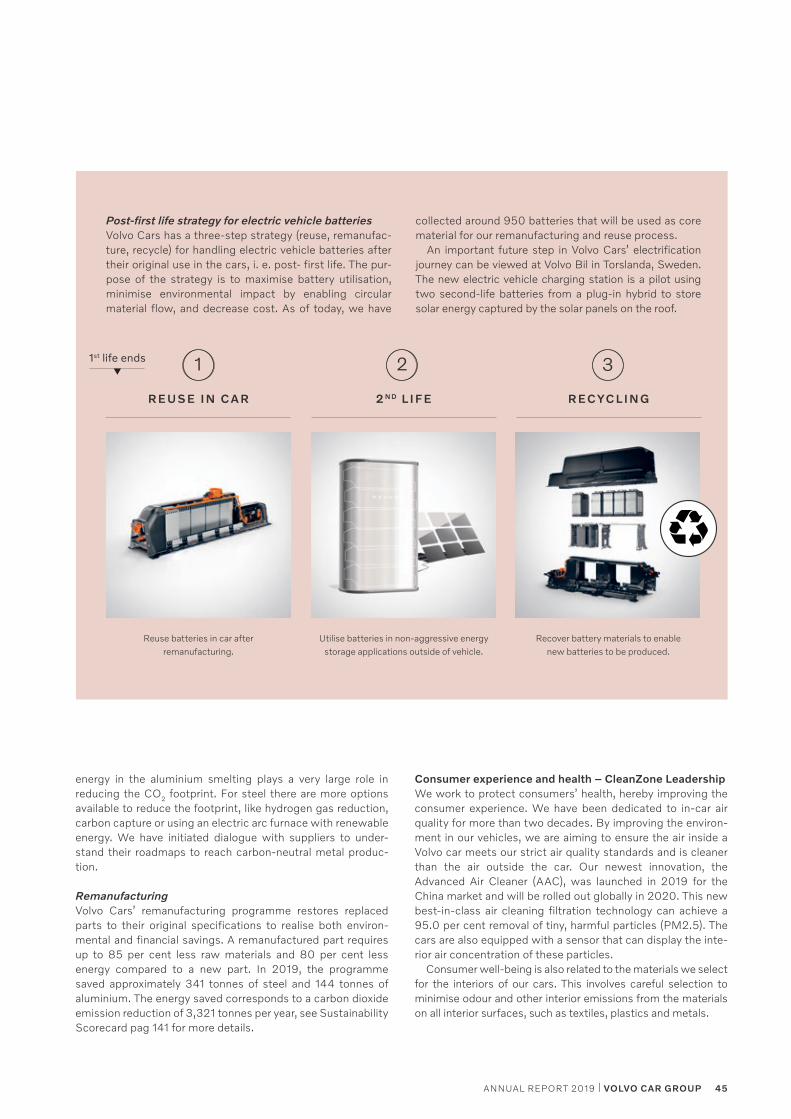
Post-first life strategy for electric vehicle batteriesVolvo Cars has a three-step strategy (reuse, remanufac-ture, recycle) for handling electric vehicle batteries after their original use in the cars, i. e. post- first life. The pur-pose of the strategy is to maximise battery utilisation, minimise environmental impact by enabling circular material flow, and decrease cost. As of today, we have
collected around 950 batteries that will be used as core material for our remanufacturing and reuse process.
An important future step in Volvo Cars’ electrification journey can be viewed at Volvo Bil in Torslanda, Sweden. The new electric vehicle charging station is a pilot using two second-life batteries from a plug-in hybrid to store solar energy captured by the solar panels on the roof.
R EUSE I N C A R 2 N D L I FE R ECYC L I N G
Reuse batteries in car after remanufacturing.
Utilise batteries in non-aggressive energy storage applications outside of vehicle.
Recover battery materials to enable new batteries to be produced.
1 32
energy in the aluminium smelting plays a very large role in reducing the CO2 footprint. For steel there are more options available to reduce the footprint, like hydrogen gas reduction, carbon capture or using an electric arc furnace with renewable energy. We have initiated dialogue with suppliers to under-stand their roadmaps to reach carbon-neutral metal produc-tion.
RemanufacturingVolvo Cars’ remanufacturing programme restores replaced parts to their original specifications to realise both environ-mental and financial savings. A remanufactured part requires up to 85 per cent less raw materials and 80 per cent less energy compared to a new part. In 2019, the programme saved approximately 341 tonnes of steel and 144 tonnes of aluminium. The energy saved corresponds to a carbon dioxide emission reduction of 3,321 tonnes per year, see Sustainability Scorecard pag 141 for more details.
Consumer experience and health – CleanZone LeadershipWe work to protect consumers’ health, hereby improving the consumer experience. We have been dedicated to in-car air quality for more than two decades. By improving the environ-ment in our vehicles, we are aiming to ensure the air inside a Volvo car meets our strict air quality standards and is cleaner than the air outside the car. Our newest innovation, the Advanced Air Cleaner (AAC), was launched in 2019 for the China market and will be rolled out globally in 2020. This new best-in-class air cleaning filtration technology can achieve a 95.0 per cent removal of tiny, harmful particles (PM2.5). The cars are also equipped with a sensor that can display the inte-rior air concentration of these particles.
Consumer well-being is also related to the materials we select for the interiors of our cars. This involves careful selection to minimise odour and other interior emissions from the materials on all interior surfaces, such as textiles, plastics and metals.
1st life ends
45ANNUAL REPORT 2019 | VOLVO CAR GROUP
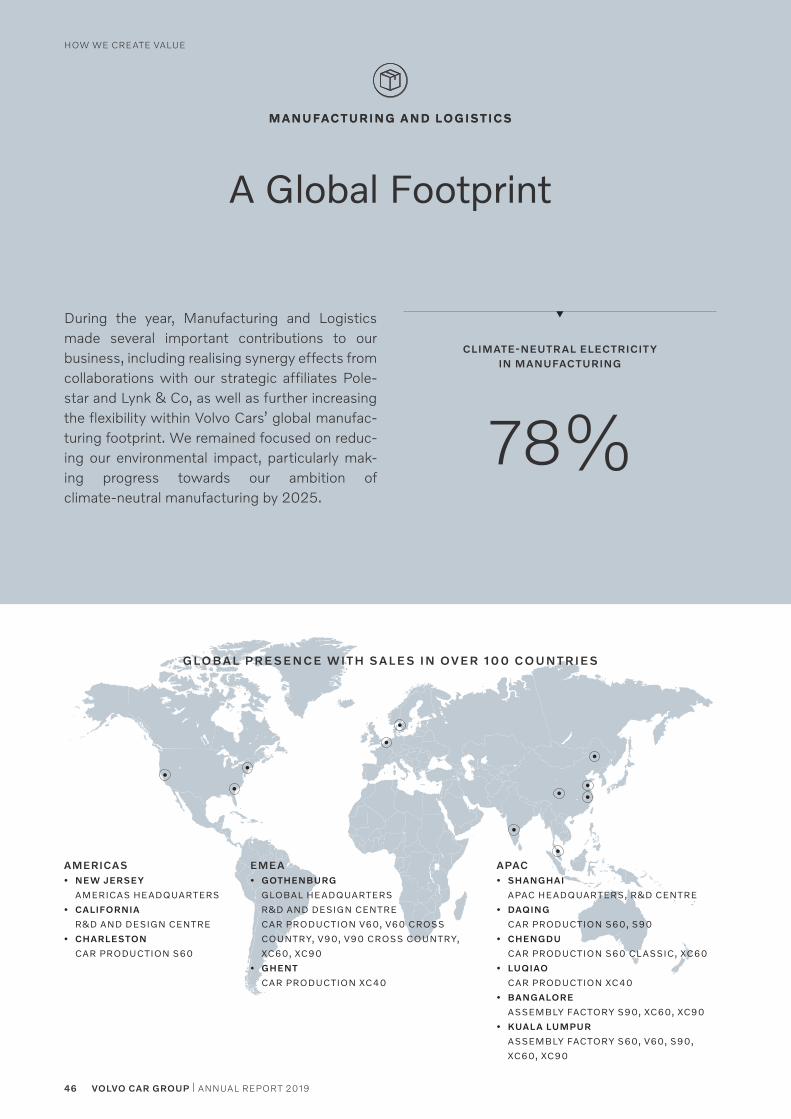
A Global Footprint
M A N U FAC T U R I N G A N D LO G IS T I C SM A N U FAC T U R I N G A N D LO G IS T I C S
During the year, Manufacturing and Logistics made several important contributions to our business, including realising synergy effects from collaborations with our strategic affiliates Pole-star and Lynk & Co, as well as further increasing the flexibility within Volvo Cars’ global manufac-turing footprint. We remained focused on reduc-ing our environmental impact, particularly mak-ing progress towards our ambition of climate-neutral manufacturing by 2025.
CLIMATE-NEUTRAL ELECTRICIT YIN MANUFACTURING
78%
G LO BA L P R E SEN C E W I T H SA L E S I N OV ER 10 0 C O U N T R I E S
EMEA• GOTHENBURG
GLOBAL HEADQUARTERS
R&D AND DESIGN CENTRE
CAR PRODUCTION V60, V60 CROSS
COUNTRY, V90, V90 CROSS COUNTRY,
XC60, XC90
• GHENT
CAR PRODUCTION XC40
AMERICAS• NEW JERSEY
AMERICAS HEADQUARTERS
• CALIFORNIA
R&D AND DESIGN CENTRE
• CHARLESTON
CAR PRODUCTION S60
APAC• SHANGHAI
APAC HEADQUARTERS, R&D CENTRE
• DAQING
CAR PRODUCTION S60, S90
• CHENGDU
CAR PRODUCTION S60 CL ASSIC, XC60
• LUQIAO
CAR PRODUCTION XC40
• BANGALORE
ASSEMBLY FACTORY S90, XC60, XC90
• KUALA LUMPUR
ASSEMBLY FACTORY S60, V60, S90,
XC60, XC90
46 VOLVO CAR GROUP | ANNUAL REPORT 2019
HOW WE CREATE VALUE
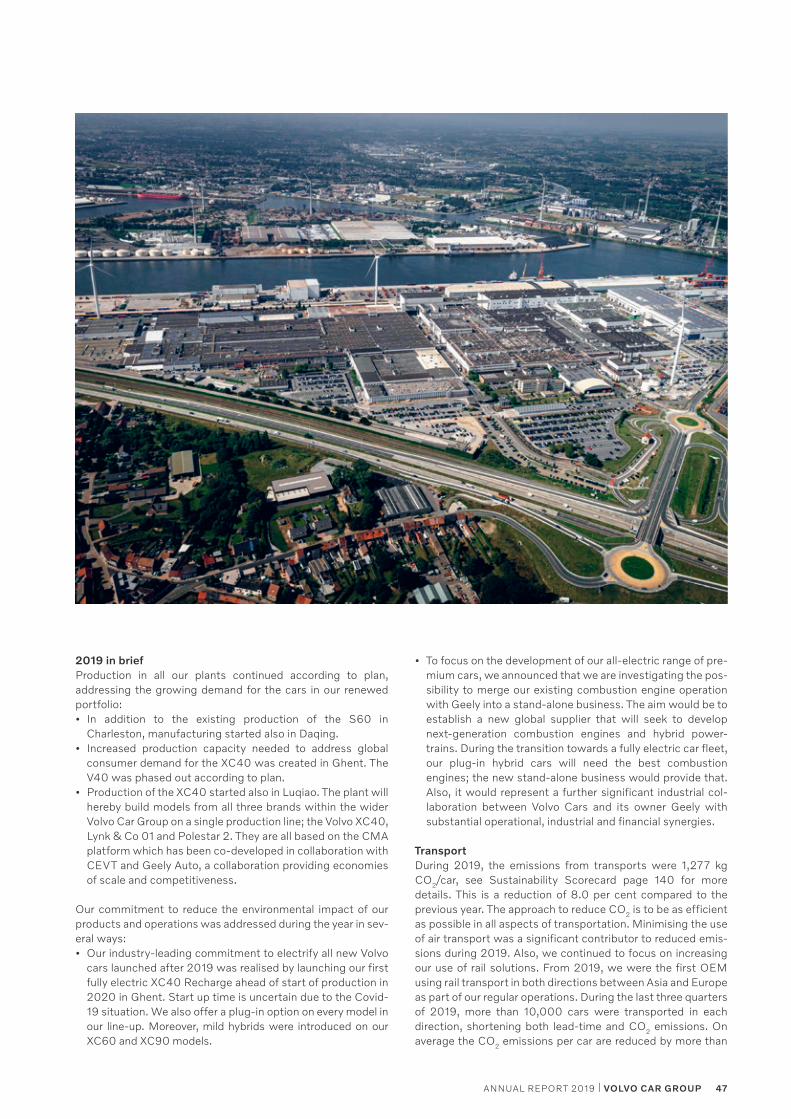
• To focus on the development of our all-electric range of pre-mium cars, we announced that we are investigating the pos-sibility to merge our existing combustion engine operation with Geely into a stand-alone business. The aim would be to establish a new global supplier that will seek to develop next-generation combustion engines and hybrid power-trains. During the transition towards a fully electric car fleet, our plug-in hybrid cars will need the best combustion engines; the new stand-alone business would provide that. Also, it would represent a further significant industrial col-laboration between Volvo Cars and its owner Geely with substantial operational, industrial and financial synergies.
TransportDuring 2019, the emissions from transports were 1,277 kg CO2/car, see Sustainability Scorecard page 140 for more details. This is a reduction of 8.0 per cent compared to the previous year. The approach to reduce CO2 is to be as efficient as possible in all aspects of transportation. Minimising the use of air transport was a significant contributor to reduced emis-sions during 2019. Also, we continued to focus on increasing our use of rail solutions. From 2019, we were the first OEM using rail transport in both directions between Asia and Europe as part of our regular operations. During the last three quarters of 2019, more than 10,000 cars were transported in each direction, shortening both lead-time and CO2 emissions. On average the CO2 emissions per car are reduced by more than
2019 in briefProduction in all our plants continued according to plan, addressing the growing demand for the cars in our renewed portfolio:• In addition to the existing production of the S60 in
Charleston, manufacturing started also in Daqing.• Increased production capacity needed to address global
consumer demand for the XC40 was created in Ghent. The V40 was phased out according to plan.
• Production of the XC40 started also in Luqiao. The plant will hereby build models from all three brands within the wider Volvo Car Group on a single production line; the Volvo XC40, Lynk & Co 01 and Polestar 2. They are all based on the CMA platform which has been co-developed in collaboration with CEVT and Geely Auto, a collaboration providing economies of scale and competitiveness.
Our commitment to reduce the environmental impact of our products and operations was addressed during the year in sev-eral ways:• Our industry-leading commitment to electrify all new Volvo
cars launched after 2019 was realised by launching our first fully electric XC40 Recharge ahead of start of production in 2020 in Ghent. Start up time is uncertain due to the Covid-19 situation. We also offer a plug-in option on every model in our line-up. Moreover, mild hybrids were introduced on our XC60 and XC90 models.
47ANNUAL REPORT 2019 | VOLVO CAR GROUP
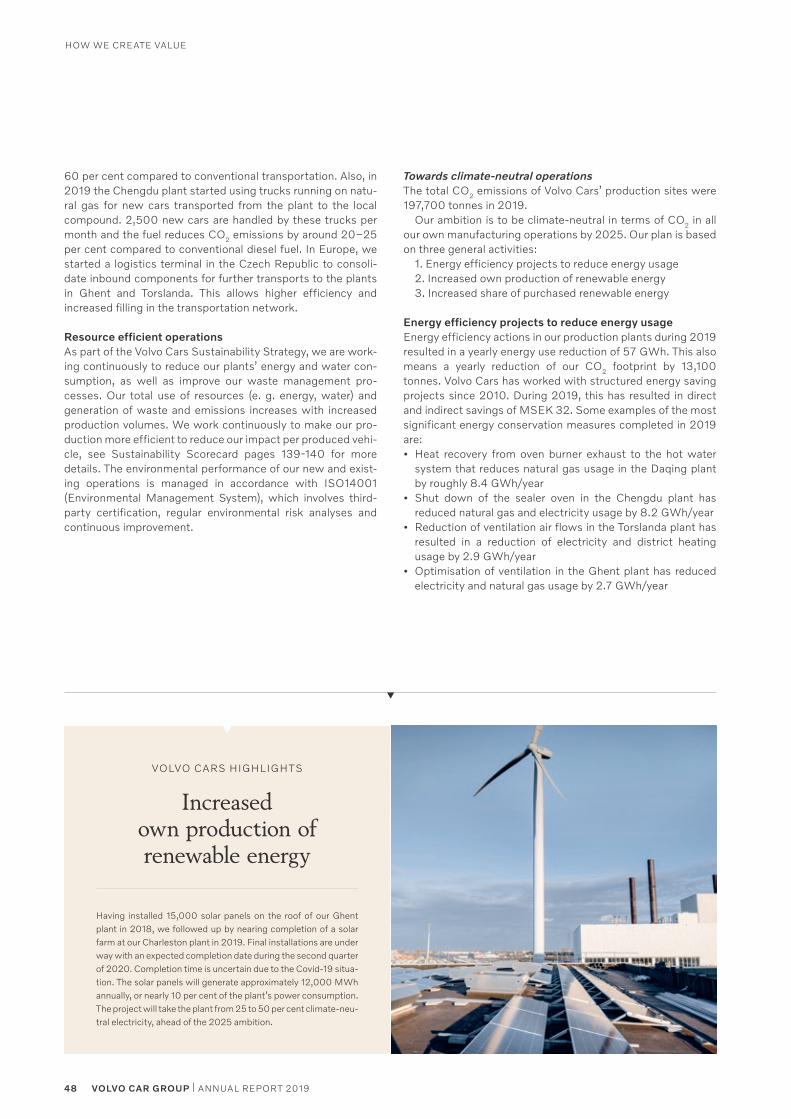
60 per cent compared to conventional transportation. Also, in 2019 the Chengdu plant started using trucks running on natu-ral gas for new cars transported from the plant to the local compound. 2,500 new cars are handled by these trucks per month and the fuel reduces CO2 emissions by around 20–25 per cent compared to conventional diesel fuel. In Europe, we started a logistics terminal in the Czech Republic to consoli-date inbound components for further transports to the plants in Ghent and Torslanda. This allows higher efficiency and increased filling in the transportation network.
Resource efficient operationsAs part of the Volvo Cars Sustainability Strategy, we are work-ing continuously to reduce our plants’ energy and water con-sumption, as well as improve our waste management pro-cesses. Our total use of resources (e. g. energy, water) and generation of waste and emissions increases with increased production volumes. We work continuously to make our pro-duction more efficient to reduce our impact per produced vehi-cle, see Sustainability Scorecard pages 139-140 for more details. The environmental performance of our new and exist-ing operations is managed in accordance with ISO14001 (Environmental Management System), which involves third-party certification, regular environmental risk analyses and continuous improvement.
Towards climate-neutral operationsThe total CO2 emissions of Volvo Cars’ production sites were 197,700 tonnes in 2019.
Our ambition is to be climate-neutral in terms of CO2 in all our own manufacturing operations by 2025. Our plan is based on three general activities:
1. Energy efficiency projects to reduce energy usage2. Increased own production of renewable energy3. Increased share of purchased renewable energy
Energy efficiency projects to reduce energy usageEnergy efficiency actions in our production plants during 2019 resulted in a yearly energy use reduction of 57 GWh. This also means a yearly reduction of our CO2 footprint by 13,100 tonnes. Volvo Cars has worked with structured energy saving projects since 2010. During 2019, this has resulted in direct and indirect savings of MSEK 32. Some examples of the most significant energy conservation measures completed in 2019 are:• Heat recovery from oven burner exhaust to the hot water
system that reduces natural gas usage in the Daqing plant by roughly 8.4 GWh/year
• Shut down of the sealer oven in the Chengdu plant has reduced natural gas and electricity usage by 8.2 GWh/year
• Reduction of ventilation air flows in the Torslanda plant has resulted in a reduction of electricity and district heating usage by 2.9 GWh/year
• Optimisation of ventilation in the Ghent plant has reduced electricity and natural gas usage by 2.7 GWh/year
Having installed 15,000 solar panels on the roof of our Ghent plant in 2018, we followed up by nearing completion of a solar farm at our Charleston plant in 2019. Final installations are under way with an expected completion date during the second quarter of 2020. Completion time is uncertain due to the Covid-19 situa-tion. The solar panels will generate approximately 12,000 MWh annually, or nearly 10 per cent of the plant’s power consumption. The project will take the plant from 25 to 50 per cent climate-neu-tral electricity, ahead of the 2025 ambition.
VOLVO CARS HIGHLIGHTS
Increased own production of renewable energy
48 VOLVO CAR GROUP | ANNUAL REPORT 2019
HOW WE CREATE VALUE
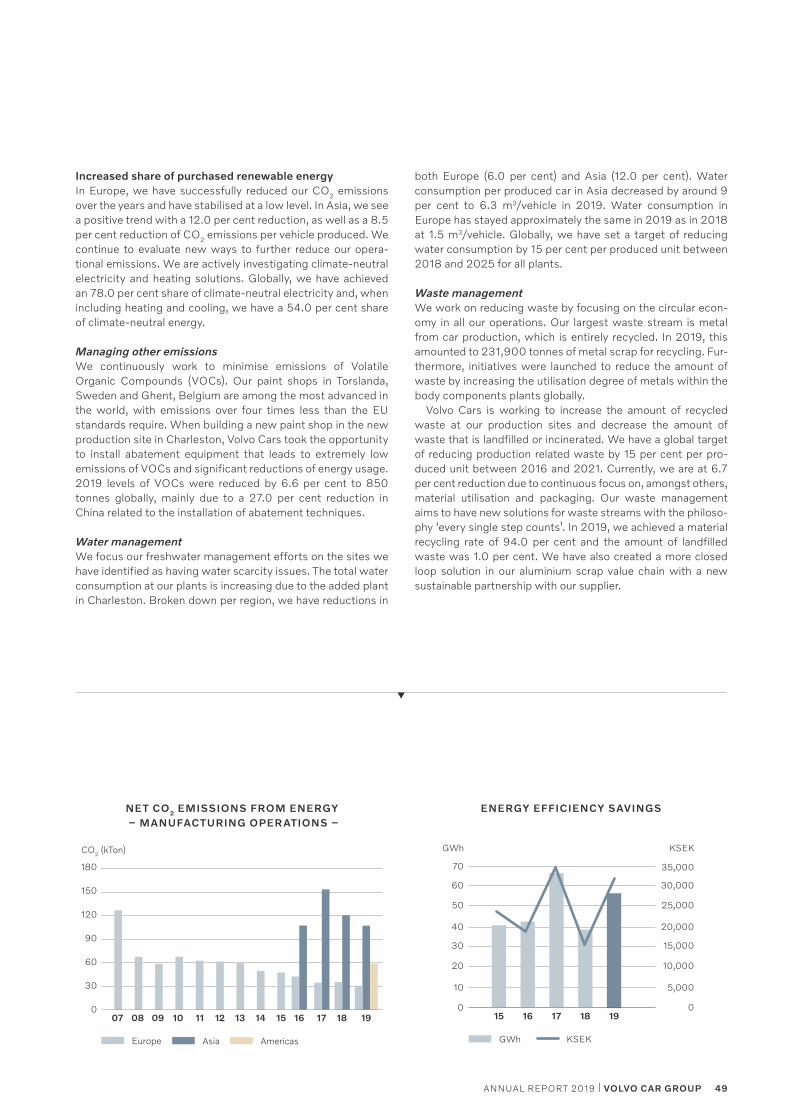
Increased share of purchased renewable energyIn Europe, we have successfully reduced our CO2 emissions over the years and have stabilised at a low level. In Asia, we see a positive trend with a 12.0 per cent reduction, as well as a 8.5 per cent reduction of CO2 emissions per vehicle produced. We continue to evaluate new ways to further reduce our opera-tional emissions. We are actively investigating climate-neutral electricity and heating solutions. Globally, we have achieved an 78.0 per cent share of climate-neutral electricity and, when including heating and cooling, we have a 54.0 per cent share of climate-neutral energy.
Managing other emissionsWe continuously work to minimise emissions of Volatile Organic Compounds (VOCs). Our paint shops in Torslanda, Sweden and Ghent, Belgium are among the most advanced in the world, with emissions over four times less than the EU standards require. When building a new paint shop in the new production site in Charleston, Volvo Cars took the opportunity to install abatement equipment that leads to extremely low emissions of VOCs and significant reductions of energy usage. 2019 levels of VOCs were reduced by 6.6 per cent to 850 tonnes globally, mainly due to a 27.0 per cent reduction in China related to the installation of abatement techniques.
Water managementWe focus our freshwater management efforts on the sites we have identified as having water scarcity issues. The total water consumption at our plants is increasing due to the added plant in Charleston. Broken down per region, we have reductions in
both Europe (6.0 per cent) and Asia (12.0 per cent). Water consumption per produced car in Asia decreased by around 9 per cent to 6.3 m3/vehicle in 2019. Water consumption in Europe has stayed approximately the same in 2019 as in 2018 at 1.5 m3/vehicle. Globally, we have set a target of reducing water consumption by 15 per cent per produced unit between 2018 and 2025 for all plants.
Waste managementWe work on reducing waste by focusing on the circular econ-omy in all our operations. Our largest waste stream is metal from car production, which is entirely recycled. In 2019, this amounted to 231,900 tonnes of metal scrap for recycling. Fur-thermore, initiatives were launched to reduce the amount of waste by increasing the utilisation degree of metals within the body components plants globally.
Volvo Cars is working to increase the amount of recycled waste at our production sites and decrease the amount of waste that is landfilled or incinerated. We have a global target of reducing production related waste by 15 per cent per pro-duced unit between 2016 and 2021. Currently, we are at 6.7 per cent reduction due to continuous focus on, amongst others, material utilisation and packaging. Our waste management aims to have new solutions for waste streams with the philoso-phy ‘every single step counts’. In 2019, we achieved a material recycling rate of 94.0 per cent and the amount of landfilled waste was 1.0 per cent. We have also created a more closed loop solution in our aluminium scrap value chain with a new sustainable partnership with our supplier.
NET CO2 EMISSIONS FROM ENERGY – MANUFACTURING OPERATIONS –
10 1208 1914 1611 130907 15 17 18
CO2 (kTon)
180
90
60
30
0
120
150
Asia AmericasEurope
ENERGY EFFICIENCY SAVINGS
16 17 1815 19
GWh
70
60
50
20
10
0
35,000
20,000
25,000
30,000
15,000
10,000
5,000
0
30
40
KSEK
GWh KSEK
49ANNUAL REPORT 2019 | VOLVO CAR GROUP
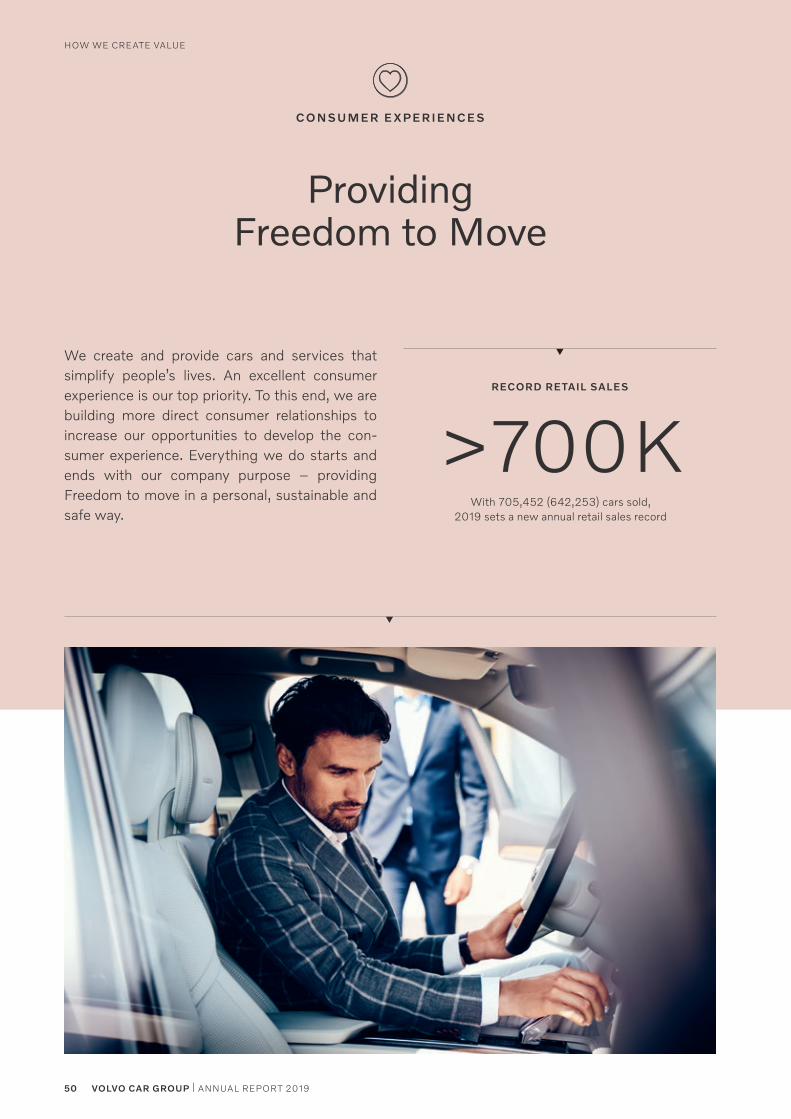
>700K
Providing Freedom to Move
We create and provide cars and services that simplify people’s lives. An excellent consumer experience is our top priority. To this end, we are building more direct consumer relationships to increase our opportunities to develop the con-sumer experience. Everything we do starts and ends with our company purpose – providing Freedom to move in a personal, sustainable and safe way.
C O N SU M ER E X P ER I EN C E S
50 VOLVO CAR GROUP | ANNUAL REPORT 2019
HOW WE CREATE VALUE
RECORD RETAIL SALES
With 705,452 (642,253) cars sold, 2019 sets a new annual retail sales record
During 2019 we started a strategic initiative to ensure that we have a retailer network that reflects our sustainability ambitions. This means that we aim to create a climate-neutral retailer net-work by 2040 in alignment with the company commitment. We will provide retailers with sustainable solutions and guidance for deployment, as well as establish an Engagement Programme to share best practices across geographies.
VOLVO CARS HIGHLIGHTS
A climate-neutral retailer network
services – we have an offer that suits their needs. In the tran-sition to a distribution system also including direct consumer relations, we build on the strengths of both our retail partners and ourselves. We see substantial value in continuing this partnership and capturing the business opportunities together.
Our offerOur promise, communicated through our strategy, is to make our consumers feel special and rewarded by choosing Volvo Cars. By doing so, we believe they share our values, hereby contributing positively to the environment while protecting what is important to them and others. The Volvo Cars brand supports this by offering refined Scandinavian luxury with the aim to simplify life with a human touch, provide better environ-mental technology solutions and the most advanced safety innovations.
Connectivity and digitalisation are fundamentals for premium experience and safetyConnectivity and digitalisation are key enablers in our ambition to simplify consumers’ lives. With Volvo On Call we pioneered technologies to be connected to and communicate with our consumers. Connected services are services enabled through a connected car and a connected consumer. They are services with high potential creating significant consumer value. All new cars are enabled for internet connectivity. Connected ser-vices play an important role in creating a true premium experi-ence for our consumers and the quality will differentiate us from competition. Connectivity and digitalisation are not only key for the premium experience, but also very important ena-blers for safety. We leverage digital solutions and connected cars to create smart systems and active safety solutions that enable vehicles to communicate with each other and for exam-ple warn about hazards on the road. To get speed and ensure ease of integration, we believe in open ecosystems to deliver on our connectivity and digitalisation ambitions.
Direct relations with consumers enable us to offer more personal experiencesAs consumers change the way they solve their mobility needs, we must change our way of offering cars and access to cars. While we continue to improve our traditional business model of selling cars via our retail partners, we also offer new mobility models and move towards a direct consumer business to attract new consumer groups and expand our range of prod-ucts and services. We address consumers directly via our car subscription offer Care by Volvo and our shared mobility solu-tion M. Regardless the way our consumers prefer to access their car – through ownership, subscription or shared mobility
Our retail partners – changing with us to better serve our consumersOur retailer network is the principal route to market and core to ensure that the Volvo Cars brand is widely represented and well-positioned in the premium car segment globally. Our net-work plays a key role in our transition regardless of how our cars are accessed, as the retailer network is delivering, as well as servicing both cars and consumers. By working in collabo-ration with our retailer network around the world, we aim to expand digital commerce activities to enhance the online buy-ing experience, as well as the physical network and ownership experience.
51ANNUAL REPORT 2019 | VOLVO CAR GROUP
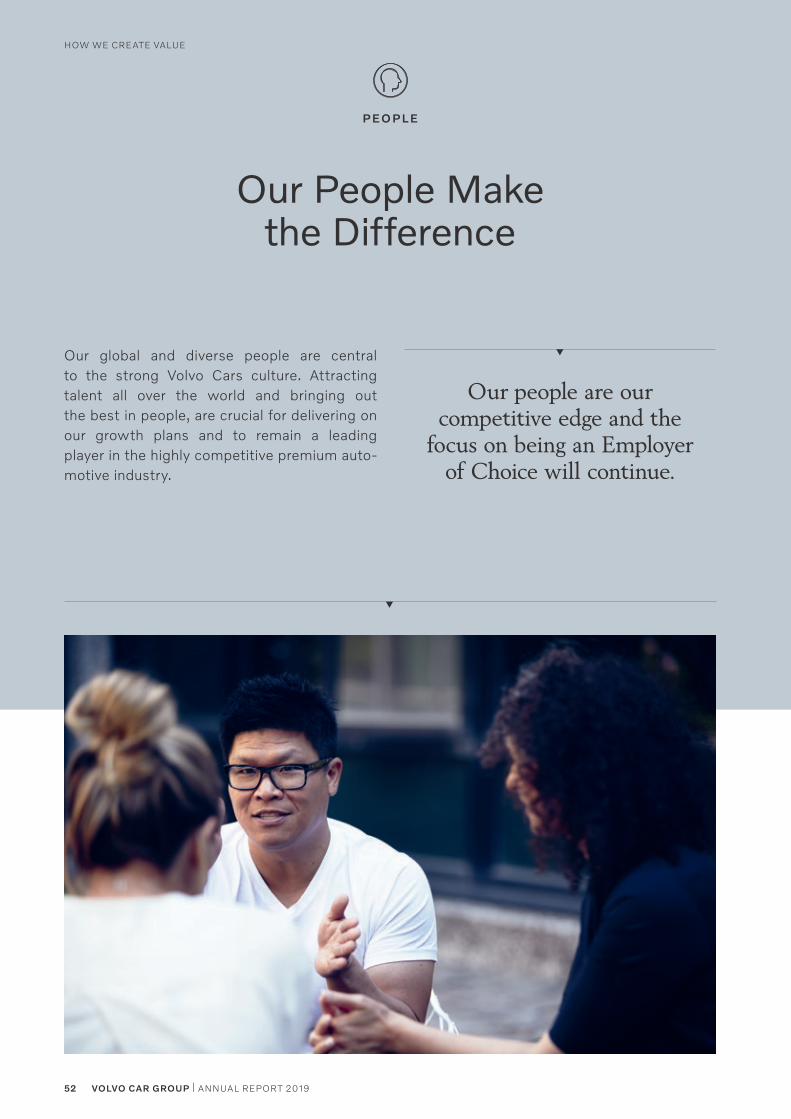
Our People Make the Difference
Our global and diverse people are central to the strong Volvo Cars culture. Attracting talent all over the world and bringing out the best in people, are crucial for delivering on our growth plans and to remain a leading player in the highly competitive premium automotive industry.
P EO P L E
Our people are our competitive edge and the
focus on being an Employer of Choice will continue.
52 VOLVO CAR GROUP | ANNUAL REPORT 2019
HOW WE CREATE VALUE
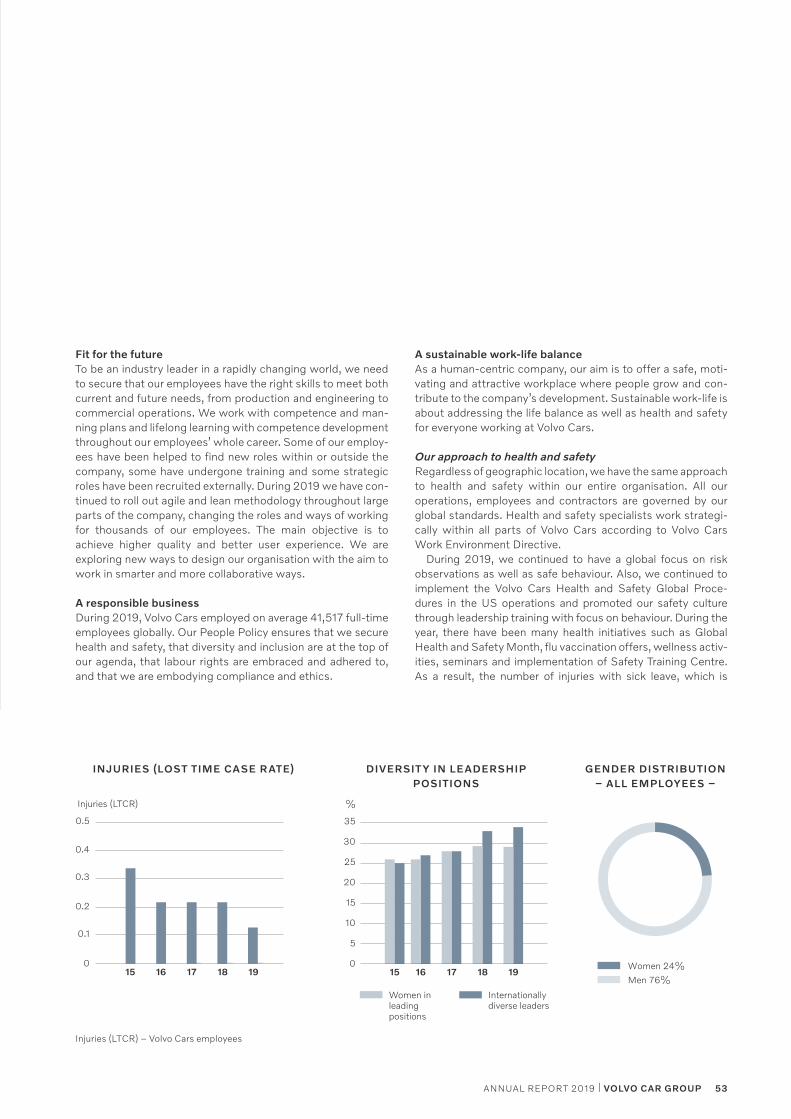
A sustainable work-life balanceAs a humancentric company, our aim is to offer a safe, motivating and attractive workplace where people grow and contribute to the company’s development. Sustainable worklife is about addressing the life balance as well as health and safety for everyone working at Volvo Cars.
Our approach to health and safetyRegardless of geographic location, we have the same approach to health and safety within our entire organisation. All our operations, employees and contractors are governed by our global standards. Health and safety specialists work strategically within all parts of Volvo Cars according to Volvo Cars Work Environment Directive.
During 2019, we continued to have a global focus on risk observations as well as safe behaviour. Also, we continued to implement the Volvo Cars Health and Safety Global Procedures in the US operations and promoted our safety culture through leadership training with focus on behaviour. During the year, there have been many health initiatives such as Global Health and Safety Month, flu vaccination offers, wellness activities, seminars and implementation of Safety Training Centre. As a result, the number of injuries with sick leave, which is
Fit for the futureTo be an industry leader in a rapidly changing world, we need to secure that our employees have the right skills to meet both current and future needs, from production and engineering to commercial operations. We work with competence and manning plans and lifelong learning with competence development throughout our employees’ whole career. Some of our employees have been helped to find new roles within or outside the company, some have undergone training and some strategic roles have been recruited externally. During 2019 we have continued to roll out agile and lean methodology throughout large parts of the company, changing the roles and ways of working for thousands of our employees. The main objective is to achieve higher quality and better user experience. We are exploring new ways to design our organisation with the aim to work in smarter and more collaborative ways.
A responsible businessDuring 2019, Volvo Cars employed on average 41,517 fulltime employees globally. Our People Policy ensures that we secure health and safety, that diversity and inclusion are at the top of our agenda, that labour rights are embraced and adhered to, and that we are embodying compliance and ethics.
Injuries (LTCR) – Volvo Cars employees
INJURIES (LOST TIME CASE RATE)
16 17 1815 19
Injuries (LTCR)
0.5
0.3
0.4
0.2
0.1
0
DIVERSIT Y IN LEADERSHIP POSITIONS
16 17 1815 19
%
35
30
20
15
10
0
25
5
Women in leading positions
Internationally diverse leaders
GENDER DISTRIBUTION – ALL EMPLOYEES –
Men 76%
Women 24%
53ANNUAL REPORT 2019 | VOLVO CAR GROUP
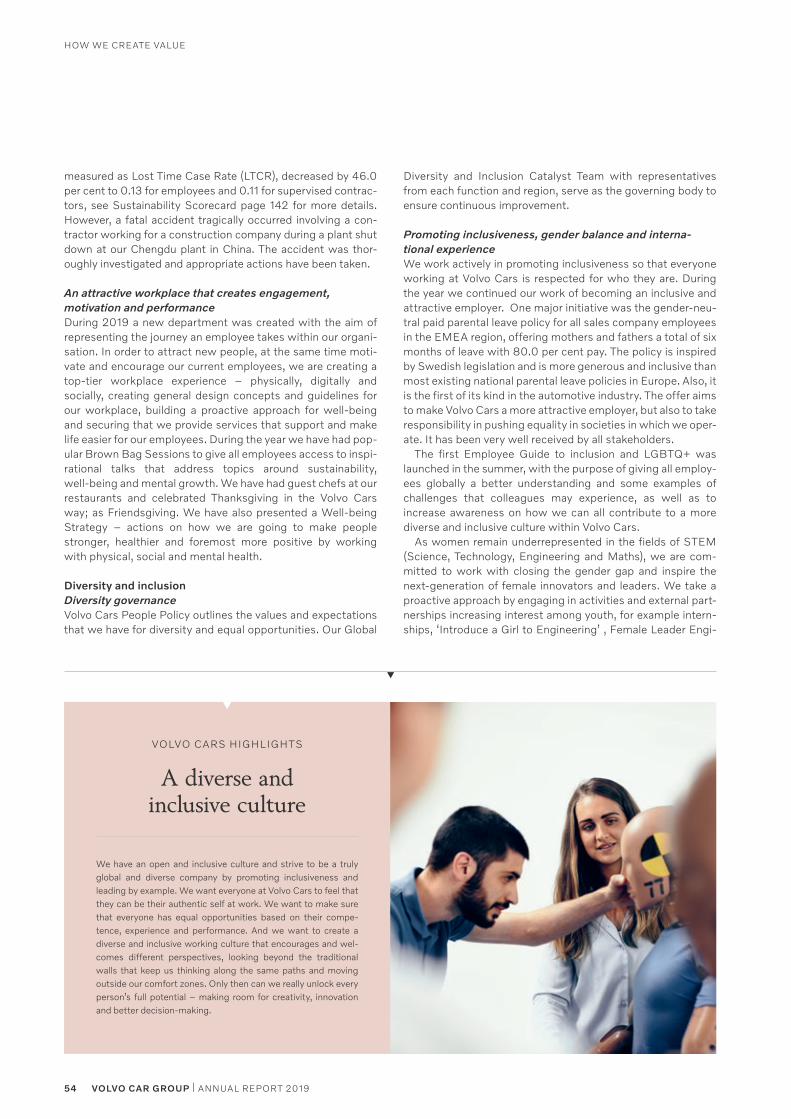
We have an open and inclusive culture and strive to be a truly global and diverse company by promoting inclusiveness and leading by example. We want everyone at Volvo Cars to feel that they can be their authentic self at work. We want to make sure that everyone has equal opportunities based on their competence, experience and performance. And we want to create a diverse and inclusive working culture that encourages and welcomes different perspectives, looking beyond the traditional walls that keep us thinking along the same paths and moving outside our comfort zones. Only then can we really unlock every person’s full potential – making room for creativity, innovation and better decisionmaking.
VOLVO CARS HIGHLIGHTS
A diverse and inclusive culture
measured as Lost Time Case Rate (LTCR), decreased by 46.0 per cent to 0.13 for employees and 0.11 for supervised contractors, see Sustainability Scorecard page 142 for more details. However, a fatal accident tragically occurred involving a contractor working for a construction company during a plant shut down at our Chengdu plant in China. The accident was thoroughly investigated and appropriate actions have been taken.
An attractive workplace that creates engagement, motivation and performanceDuring 2019 a new department was created with the aim of representing the journey an employee takes within our organisation. In order to attract new people, at the same time motivate and encourage our current employees, we are creating a toptier workplace experience – physically, digitally and socially, creating general design concepts and guidelines for our workplace, building a proactive approach for wellbeing and securing that we provide services that support and make life easier for our employees. During the year we have had popular Brown Bag Sessions to give all employees access to inspirational talks that address topics around sustainability, wellbeing and mental growth. We have had guest chefs at our restaurants and celebrated Thanksgiving in the Volvo Cars way; as Friendsgiving. We have also presented a Wellbeing Strategy – actions on how we are going to make people stronger, healthier and foremost more positive by working with physical, social and mental health.
Diversity and inclusionDiversity governanceVolvo Cars People Policy outlines the values and expectations that we have for diversity and equal opportunities. Our Global
Diversity and Inclusion Catalyst Team with representatives from each function and region, serve as the governing body to ensure continuous improvement.
Promoting inclusiveness, gender balance and interna-tional experienceWe work actively in promoting inclusiveness so that everyone working at Volvo Cars is respected for who they are. During the year we continued our work of becoming an inclusive and attractive employer. One major initiative was the genderneutral paid parental leave policy for all sales company employees in the EMEA region, offering mothers and fathers a total of six months of leave with 80.0 per cent pay. The policy is inspired by Swedish legislation and is more generous and inclusive than most existing national parental leave policies in Europe. Also, it is the first of its kind in the automotive industry. The offer aims to make Volvo Cars a more attractive employer, but also to take responsibility in pushing equality in societies in which we operate. It has been very well received by all stakeholders.
The first Employee Guide to inclusion and LGBTQ+ was launched in the summer, with the purpose of giving all employees globally a better understanding and some examples of challenges that colleagues may experience, as well as to increase awareness on how we can all contribute to a more diverse and inclusive culture within Volvo Cars.
As women remain underrepresented in the fields of STEM (Science, Technology, Engineering and Maths), we are committed to work with closing the gender gap and inspire the nextgeneration of female innovators and leaders. We take a proactive approach by engaging in activities and external partnerships increasing interest among youth, for example internships, ‘Introduce a Girl to Engineering’ , Female Leader Engi
54 VOLVO CAR GROUP | ANNUAL REPORT 2019
HOW WE CREATE VALUE
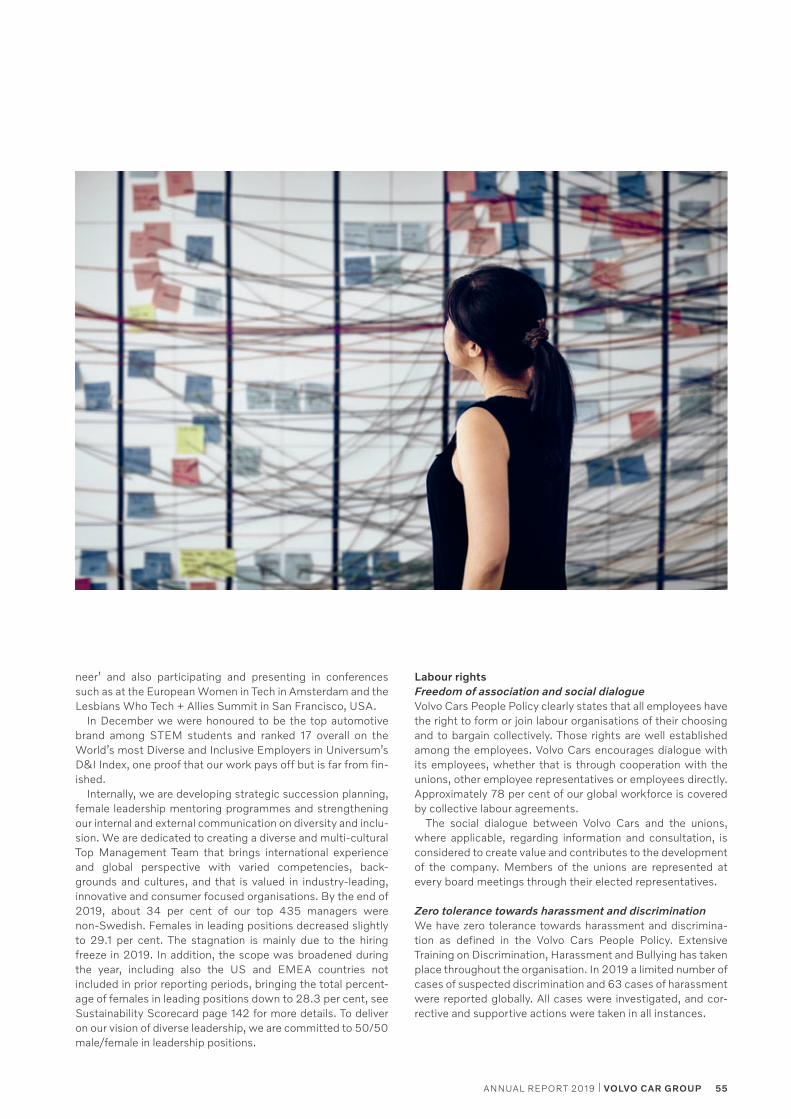
neer’ and also participating and presenting in conferences such as at the European Women in Tech in Amsterdam and the Lesbians Who Tech + Allies Summit in San Francisco, USA.
In December we were honoured to be the top automotive brand among STEM students and ranked 17 overall on the World’s most Diverse and Inclusive Employers in Universum’s D&I Index, one proof that our work pays off but is far from finished.
Internally, we are developing strategic succession planning, female leadership mentoring programmes and strengthening our internal and external communication on diversity and inclusion. We are dedicated to creating a diverse and multicultural Top Management Team that brings international experience and global perspective with varied competencies, backgrounds and cultures, and that is valued in industryleading, innovative and consumer focused organisations. By the end of 2019, about 34 per cent of our top 435 managers were nonSwedish. Females in leading positions decreased slightly to 29.1 per cent. The stagnation is mainly due to the hiring freeze in 2019. In addition, the scope was broadened during the year, including also the US and EMEA countries not included in prior reporting periods, bringing the total percentage of females in leading positions down to 28.3 per cent, see Sustainability Scorecard page 142 for more details. To deliver on our vision of diverse leadership, we are committed to 50/50 male/female in leadership positions.
Labour rights Freedom of association and social dialogueVolvo Cars People Policy clearly states that all employees have the right to form or join labour organisations of their choosing and to bargain collectively. Those rights are well established among the employees. Volvo Cars encourages dialogue with its employees, whether that is through cooperation with the unions, other employee representatives or employees directly. Approximately 78 per cent of our global workforce is covered by collective labour agreements.
The social dialogue between Volvo Cars and the unions, where applicable, regarding information and consultation, is considered to create value and contributes to the development of the company. Members of the unions are represented at every board meetings through their elected representatives.
Zero tolerance towards harassment and discriminationWe have zero tolerance towards harassment and discrimination as defined in the Volvo Cars People Policy. Extensive Training on Discrimination, Harassment and Bullying has taken place throughout the organisation. In 2019 a limited number of cases of suspected discrimination and 63 cases of harassment were reported globally. All cases were investigated, and corrective and supportive actions were taken in all instances.
55ANNUAL REPORT 2019 | VOLVO CAR GROUP
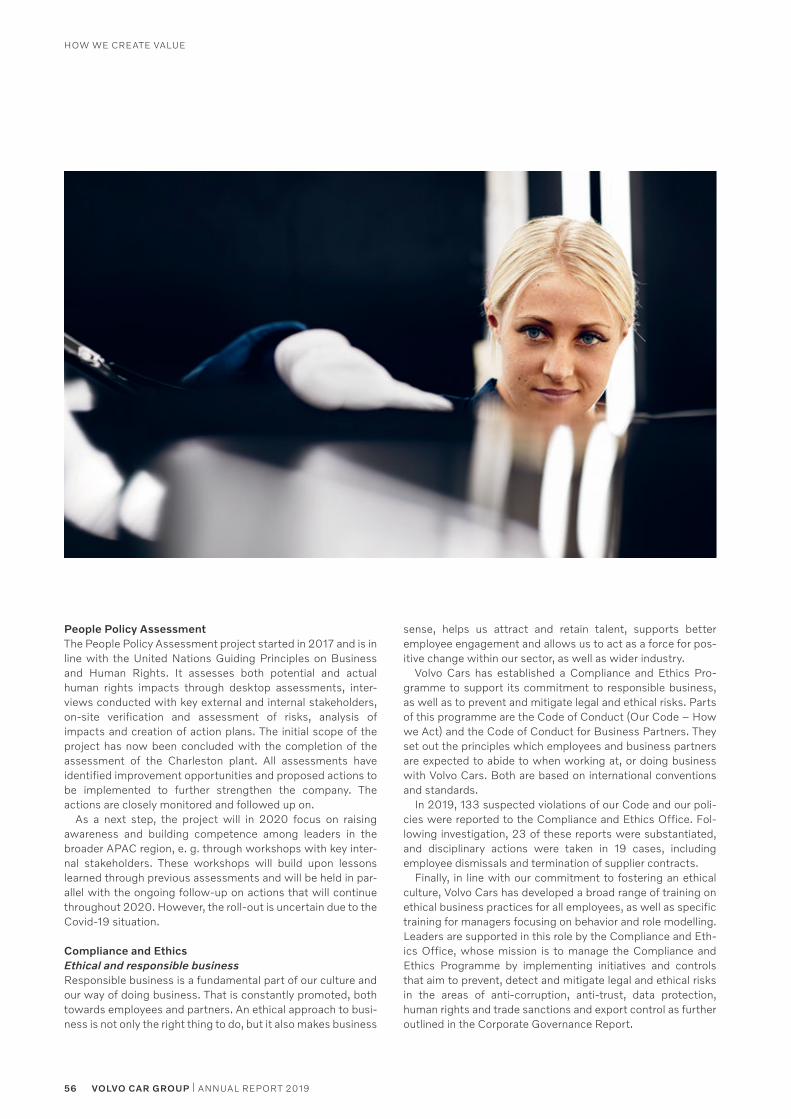
People Policy AssessmentThe People Policy Assessment project started in 2017 and is in line with the United Nations Guiding Principles on Business and Human Rights. It assesses both potential and actual human rights impacts through desktop assessments, interviews conducted with key external and internal stakeholders, onsite verification and assessment of risks, analysis of impacts and creation of action plans. The initial scope of the project has now been concluded with the completion of the assessment of the Charleston plant. All assessments have identified improvement opportunities and proposed actions to be implemented to further strengthen the company. The actions are closely monitored and followed up on. As a next step, the project will in 2020 focus on raising awareness and building competence among leaders in the broader APAC region, e. g. through workshops with key internal stakeholders. These workshops will build upon lessons learned through previous assessments and will be held in parallel with the ongoing followup on actions that will continue throughout 2020. However, the rollout is uncertain due to the Covid19 situation.
Compliance and Ethics Ethical and responsible businessResponsible business is a fundamental part of our culture and our way of doing business. That is constantly promoted, both towards employees and partners. An ethical approach to business is not only the right thing to do, but it also makes business
sense, helps us attract and retain talent, supports better employee engagement and allows us to act as a force for positive change within our sector, as well as wider industry.
Volvo Cars has established a Compliance and Ethics Programme to support its commitment to responsible business, as well as to prevent and mitigate legal and ethical risks. Parts of this programme are the Code of Conduct (Our Code – How we Act) and the Code of Conduct for Business Partners. They set out the principles which employees and business partners are expected to abide to when working at, or doing business with Volvo Cars. Both are based on international conventions and standards.
In 2019, 133 suspected violations of our Code and our policies were reported to the Compliance and Ethics Office. Following investigation, 23 of these reports were substantiated, and disciplinary actions were taken in 19 cases, including employee dismissals and termination of supplier contracts.
Finally, in line with our commitment to fostering an ethical culture, Volvo Cars has developed a broad range of training on ethical business practices for all employees, as well as specific training for managers focusing on behavior and role modelling. Leaders are supported in this role by the Compliance and Ethics Office, whose mission is to manage the Compliance and Ethics Programme by implementing initiatives and controls that aim to prevent, detect and mitigate legal and ethical risks in the areas of anticorruption, antitrust, data protection, human rights and trade sanctions and export control as further outlined in the Corporate Governance Report.
56 VOLVO CAR GROUP | ANNUAL REPORT 2019
HOW WE CREATE VALUE
A risk-based approach to complianceRegular compliance risk assessments allow us to identify and understand the main risk fields to which we are exposed and, in each of these fields, the highrisk areas. These risk assessments also serve as the basis for identifying the appropriate improvement and mitigation measures and to ensure that our Compliance and Ethics Programme is customised to address the areas within the scope of our programme where our main risks are to be found.
Compliance and Ethics FrameworkOur Code – How we Act is at the heart of our Compliance and Ethics Programme. It is based on Volvo Cars’ strong ethical values and our commitment to conduct business in a responsible manner, as well as on relevant international conventions and standards. It describes what is expected from Volvo Cars’ employees when performing their work.
The corporate policies and directives detail the principles set out in Our Code and are supplemented with specific guidelines detailing how the principles stated in the policies and directives can be implemented. These documents constitute the Compliance and Ethics Framework. They apply to all employees in their daily business activities and are available via the Intranet.
We also expect that our business partners follow the same – or similar – principles as those set out in Our Code. For this purpose, we have developed a specific Code of Conduct for Business Partners that outlines Volvo Cars´ requirements on its business partners (retailers, importers, suppliers etc.) in the areas of human rights and working conditions, caring for the environment and business integrity (including zero tolerance for bribery and corruption). The Code of Conduct for Business Partners is contractually binding upon our business partners.
Compliance and Ethics trainingCompliance and Ethics training and communications are important tools to embed responsible business within operations.
A new mandatory Code of Conduct elearning was created in connection with the update in 2018 of the Compliance and Ethics Framework. This elearning, which also includes the yearly Code of Conduct Certification, uses dilemmas to increase the understanding of, and potential risks connected to, the areas covered by Our Code. A mandatory training campaign was launched at the end of 2018 and finalised in 2019, with a completion rate of 87.0 per cent.
Leaders are also trained, via the leadership programmes, to develop their ethical behaviours and culture of ethics. More than 1,500 leaders have been trained since the launch of the leadership programmes and we will continue to focus on these trainings in 2020.
In 2019, all production employees in Sweden have received an introduction to the Code of Conduct, the Tell Us Reporting Line, and the responsibilities of being an employee at Volvo Cars. All other production sites will be covered in 2020. However, training and time to fulfill coverage ambitions are uncertain due to the Covid19 situation.
In 2019, as part of the Strategic Focus Area ‘Ethical and Responsible business’, we launched the strategic initiative ‘Tackle corruption and unethical business practices that aims to make Volvo Cars a recognised leader in responsible business. It fits well with our culture and makes business sense. It strengthens our license to operate and constitutes a competitive advantage, including through enhancing our brand appeal as we recognise that failure to act ethically can damage our company and brand reputation, and lead to financial loss.
VOLVO CARS HIGHLIGHTS
Tackle corruption and unethical business practices
In 2019, we launched three Responsible Business Discussions where managers had to lead discussions with their team members around ethical challenges based on real scenarios. We also launched the Monthly Ethical Highlights which is a monthly series based on real dilemmas and cases that the Compliance and Ethics Office has dealt with.
Continuous improvement of the Compliance and Ethics ProgrammeThe Compliance and Ethics Programme is continuously being improved thanks to a regular analysis of the internal and external audits and assessments that are made. Moreover, taking part in the survey process and being recognised as one of the Ethisphere Institute’s World’s Most Ethical Company for the third consequtive year (2017–2019), has supported us in assessing our gaps and improving our Compliance and Ethics Programme. The areas of improvements identified have been reduced over time and therefore we have decided to not participate in the survey the next couple of years, but to look for other means to drive improvements.
Our main focus in 2019 was to keep improving our Data Protection Compliance Programme with a view to comply with more and more stringent data protection regulations.
Leaders have the responsibility to set the example and promote ethical conduct within the organisation. In this context, our managers are expected to have regular exchanges with their team members regarding Volvo Cars´ commitment to responsible business.
57ANNUAL REPORT 2019 | VOLVO CAR GROUP
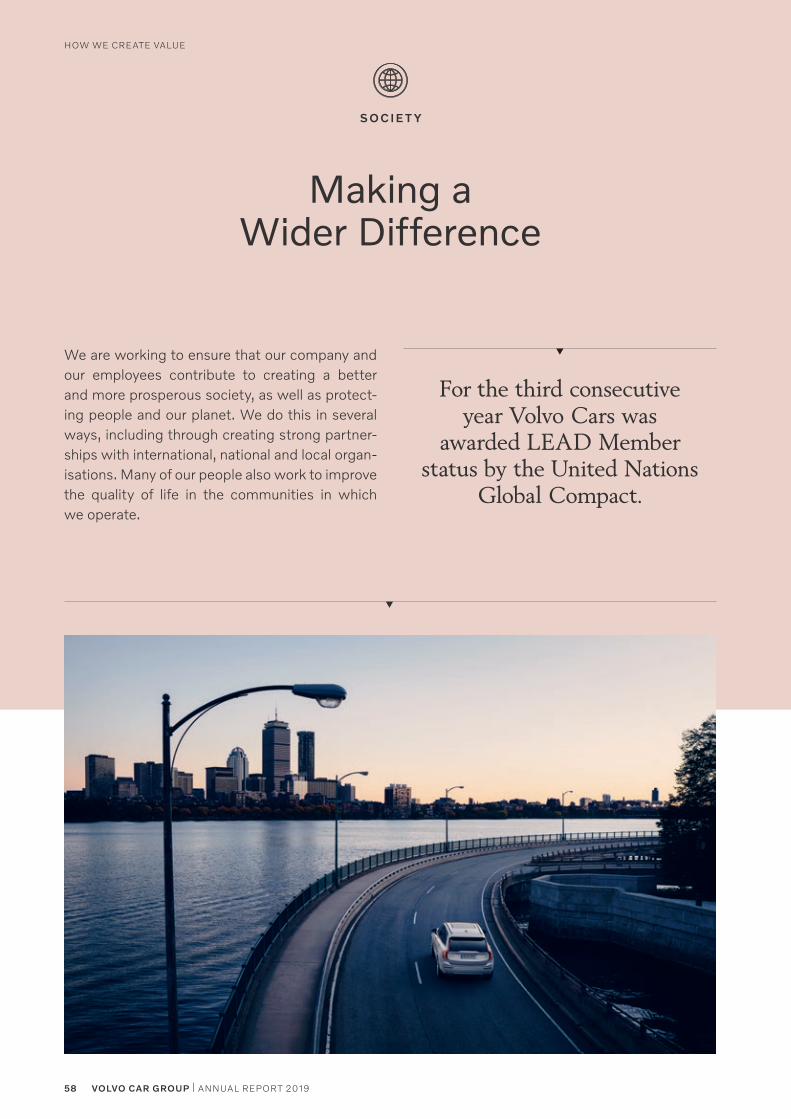
Making a Wider Difference
We are working to ensure that our company and our employees contribute to creating a better and more prosperous society, as well as protecting people and our planet. We do this in several ways, including through creating strong partnerships with international, national and local organisations. Many of our people also work to improve the quality of life in the communities in which we operate.
SO C I E T Y
For the third consecutive year Volvo Cars was
awarded LEAD Member status by the United Nations
Global Compact.
58 VOLVO CAR GROUP | ANNUAL REPORT 2019
HOW WE CREATE VALUE
Enhancing social mobility and promoting diversityIn 2019, Volvo Cars continued its projects aiming at reducing social segregation in its hometown regions, in particular the Gothenburg, Sweden area, and broadening the future talent base for recruitment. The objective is to increase interest among youth and young adults to work in the automotive industry, motivate young people to enter higher education, as well as increase diversity and inclusion within local society. Some examples of activities are:• Volvo Experience Programme Digitalisation (VEP Digi) – a
sixmonth work experience internship programme open to longterm unemployed people in Sweden
• Mentor programmes (Mitt Liv and Öppet Hus) – social enterprises that support recent immigrants to Sweden by helping them integrate into the local job market
• Cooperation with targeted secondary schools – Volvo Cars’ employee role models have inspired and motivated students through school visits
• Activities increasing the interest among youth for the STEM area (Science, Technology, Engineering and Maths) – examples include Introduce a Girl to Engineering Day, Internships, summer jobs and summer jobs for persons with function variations
United Nations Global CompactWe are a founding member of the United Nations Global Compact, the world’s largest corporate sustainability initiative, focused on ensuring that business supports the delivery of the Sustainable Development Goals (SDGs).
Volvo Cars is an active member of two of the United Nations Global Compact Action Platforms; one focuses on ensuring that companies can make a meaningful contribution to the targets set under the Paris Climate Change Agreement; the second acts to advance decent work in global supply chains. In both, Volvo Cars is working with likeminded companies and specialists to demonstrate leadership in these issues. In recognition of this heightened engagement, and our industryleading electrification strategy, the United Nations Global Compact awarded Volvo Cars LEAD Member status in 2017. The recognition continued in 2019 and highlighted the most committed, engaged and ambitious companies within the Global Compact. Volvo Cars is one of only 36 LEAD companies out of a total of 13,000 participants – and one of only two car makers.
Through our projects we work for increasing the
interest among youth and young adults to work in the
automotive industry.
Volvo Cars has joined forces with other car manufacturers, service providers and national governments in a groundbraking, panEuropean pilot project to share traffic safety data generated by cars and infrastructure, boosting overall traffic safety, see page 35 for more details.
VOLVO CARS HIGHLIGHTS
Contributing to overall traffic safety
59ANNUAL REPORT 2019 | VOLVO CAR GROUP
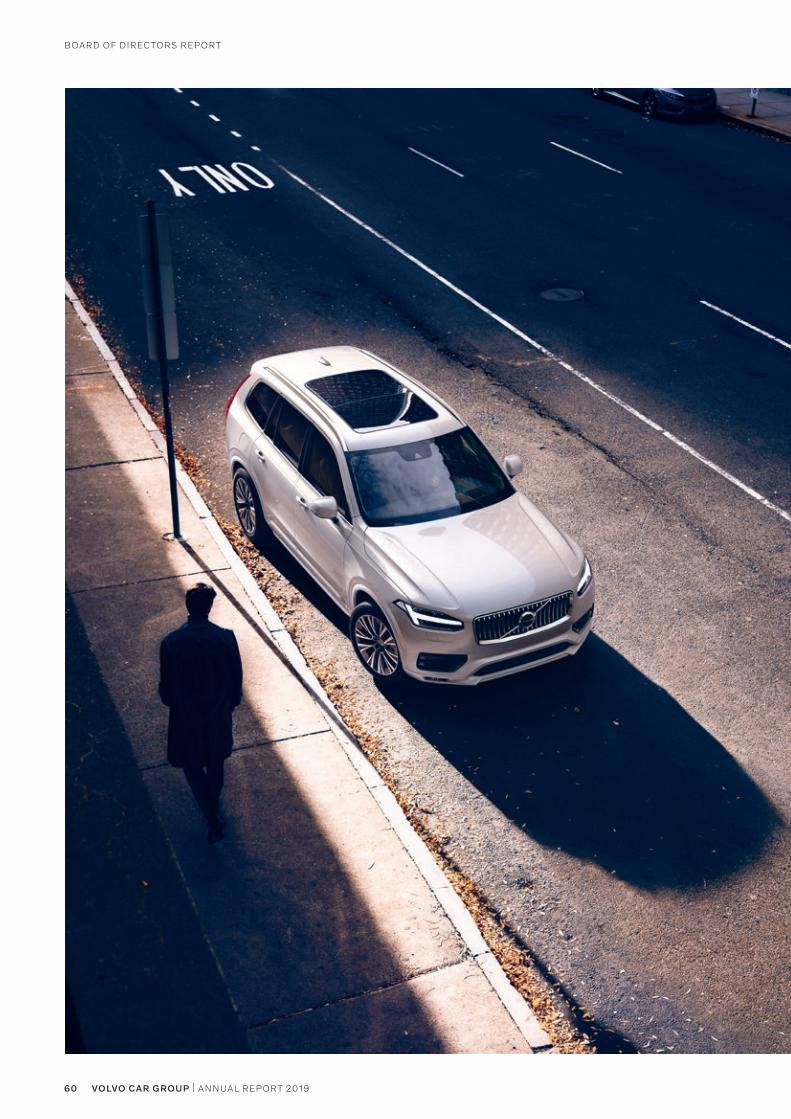
Board of directors report
60 VOLVO CAR GROUP | ANNUAL REPORT 2019
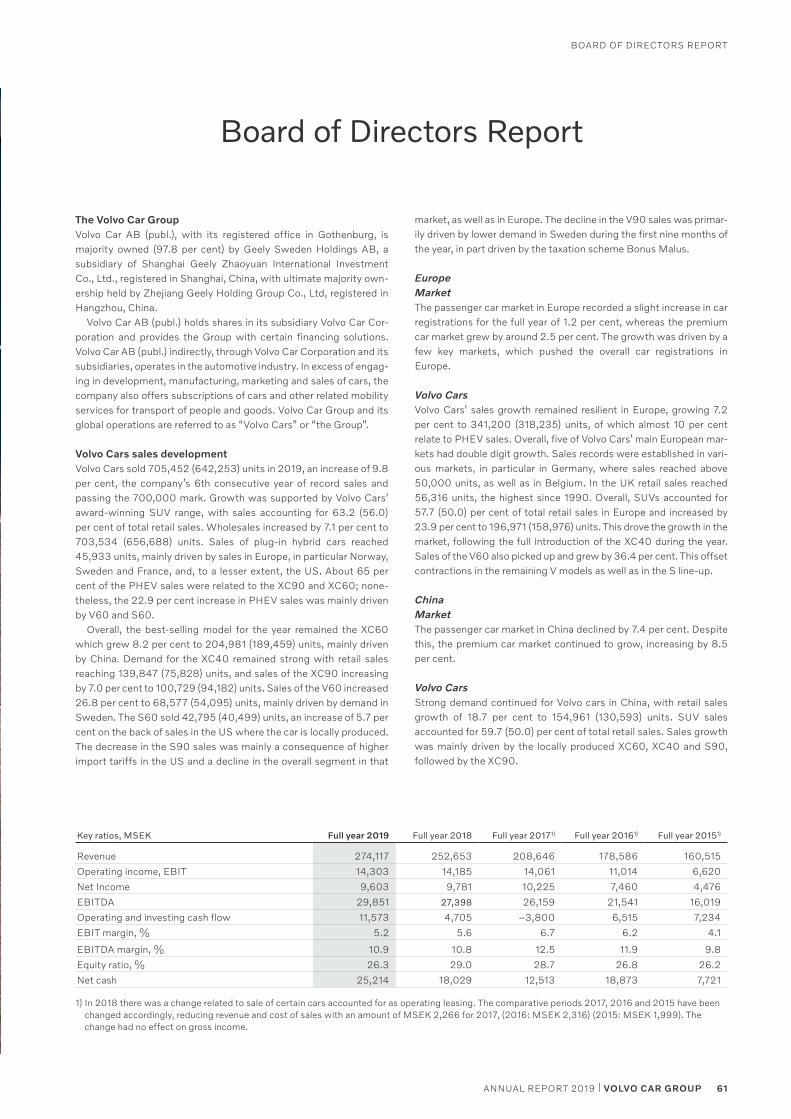
Board of directors report
61ANNUAL REPORT 2019 | VOLVO CAR GROUP
Board of Directors Report
Key ratios, MSEK Full year 2019 Full year 2018 Full year 20171) Full year 20161) Full year 20151)
revenue 274,117 252,653 208,646 178,586 160,515
operating income, eBit 14,303 14,185 14,061 11,014 6,620
Net income 9,603 9,781 10,225 7,460 4,476
eBitda 29,851 27,398 26,159 21,541 16,019
operating and investing cash flow 11,573 4,705 –3,800 6,515 7,234
eBit margin, % 5.2 5.6 6.7 6.2 4.1
eBitda margin, % 10.9 10.8 12.5 11.9 9.8
equity ratio, % 26.3 29.0 28.7 26.8 26.2
Net cash 25,214 18,029 12,513 18,873 7,721
1) in 2018 there was a change related to sale of certain cars accounted for as operating leasing. the comparative periods 2017, 2016 and 2015 have been changed accordingly, reducing revenue and cost of sales with an amount of MseK 2,266 for 2017, (2016: MseK 2,316) (2015: MseK 1,999). the change had no effect on gross income.
The Volvo Car GroupVolvo car aB (publ.), with its registered office in Gothenburg, is majority owned (97.8 per cent) by Geely sweden Holdings aB, a subsidiary of shanghai Geely Zhaoyuan international investment co., Ltd., registered in shanghai, china, with ultimate majority own-ership held by Zhejiang Geely Holding Group co., Ltd, registered in Hangzhou, china.
Volvo car aB (publ.) holds shares in its subsidiary Volvo car cor-poration and provides the Group with certain financing solutions. Volvo car aB (publ.) indirectly, through Volvo car corporation and its subsidiaries, operates in the automotive industry. in excess of engag-ing in development, manufacturing, marketing and sales of cars, the company also offers subscriptions of cars and other related mobility services for transport of people and goods. Volvo car Group and its global operations are referred to as “Volvo cars” or “the Group”.
Volvo Cars sales development Volvo cars sold 705,452 (642,253) units in 2019, an increase of 9.8 per cent, the company’s 6th consecutive year of record sales and passing the 700,000 mark. Growth was supported by Volvo cars’ award-winning sUV range, with sales accounting for 63.2 (56.0) per cent of total retail sales. Wholesales increased by 7.1 per cent to 703,534 (656,688) units. sales of plug-in hybrid cars reached 45,933 units, mainly driven by sales in europe, in particular Norway, sweden and france, and, to a lesser extent, the Us. about 65 per cent of the pHeV sales were related to the Xc90 and Xc60; none-theless, the 22.9 per cent increase in pHeV sales was mainly driven by V60 and s60.
overall, the best-selling model for the year remained the Xc60 which grew 8.2 per cent to 204,981 (189,459) units, mainly driven by china. demand for the Xc40 remained strong with retail sales reaching 139,847 (75,828) units, and sales of the Xc90 increasing by 7.0 per cent to 100,729 (94,182) units. sales of the V60 increased 26.8 per cent to 68,577 (54,095) units, mainly driven by demand in sweden. the s60 sold 42,795 (40,499) units, an increase of 5.7 per cent on the back of sales in the Us where the car is locally produced. the decrease in the s90 sales was mainly a consequence of higher import tariffs in the Us and a decline in the overall segment in that
market, as well as in europe. the decline in the V90 sales was primar-ily driven by lower demand in sweden during the first nine months of the year, in part driven by the taxation scheme Bonus Malus.
EuropeMarketthe passenger car market in europe recorded a slight increase in car registrations for the full year of 1.2 per cent, whereas the premium car market grew by around 2.5 per cent. the growth was driven by a few key markets, which pushed the overall car registrations in europe.
Volvo CarsVolvo cars’ sales growth remained resilient in europe, growing 7.2 per cent to 341,200 (318,235) units, of which almost 10 per cent relate to pHeV sales. overall, five of Volvo cars’ main european mar-kets had double digit growth. sales records were established in vari-ous markets, in particular in Germany, where sales reached above 50,000 units, as well as in Belgium. in the UK retail sales reached 56,316 units, the highest since 1990. overall, sUVs accounted for 57.7 (50.0) per cent of total retail sales in europe and increased by 23.9 per cent to 196,971 (158,976) units. this drove the growth in the market, following the full introduction of the Xc40 during the year. sales of the V60 also picked up and grew by 36.4 per cent. this offset contractions in the remaining V models as well as in the s line-up.
ChinaMarketthe passenger car market in china declined by 7.4 per cent. despite this, the premium car market continued to grow, increasing by 8.5 per cent.
Volvo Carsstrong demand continued for Volvo cars in china, with retail sales growth of 18.7 per cent to 154,961 (130,593) units. sUV sales accounted for 59.7 (50.0) per cent of total retail sales. sales growth was mainly driven by the locally produced Xc60, Xc40 and s90, followed by the Xc90.
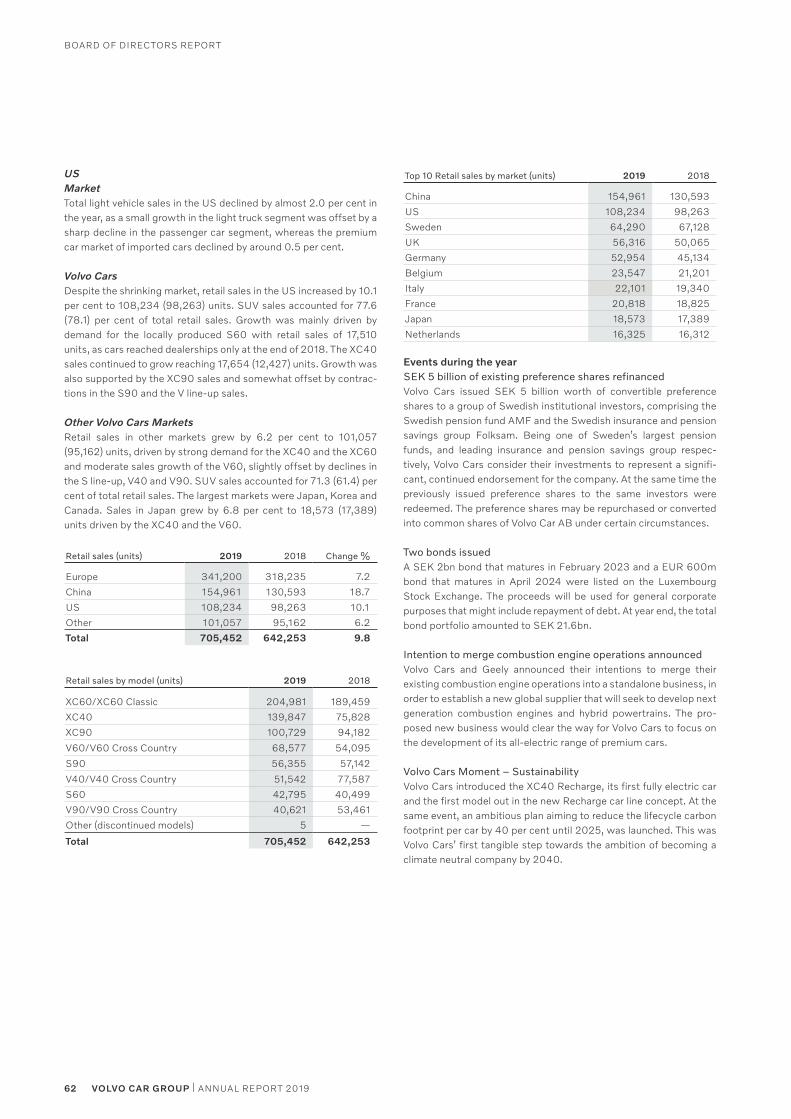
Board of directors report
62 VOLVO CAR GROUP | ANNUAL REPORT 2019
USMarkettotal light vehicle sales in the Us declined by almost 2.0 per cent in the year, as a small growth in the light truck segment was offset by a sharp decline in the passenger car segment, whereas the premium car market of imported cars declined by around 0.5 per cent.
Volvo Carsdespite the shrinking market, retail sales in the Us increased by 10.1 per cent to 108,234 (98,263) units. sUV sales accounted for 77.6 (78.1) per cent of total retail sales. Growth was mainly driven by demand for the locally produced s60 with retail sales of 17,510 units, as cars reached dealerships only at the end of 2018. the Xc40 sales continued to grow reaching 17,654 (12,427) units. Growth was also supported by the Xc90 sales and somewhat offset by contrac-tions in the s90 and the V line-up sales.
Other Volvo Cars Marketsretail sales in other markets grew by 6.2 per cent to 101,057 (95,162) units, driven by strong demand for the Xc40 and the Xc60 and moderate sales growth of the V60, slightly offset by declines in the s line-up, V40 and V90. sUV sales accounted for 71.3 (61.4) per cent of total retail sales. the largest markets were Japan, Korea and canada. sales in Japan grew by 6.8 per cent to 18,573 (17,389) units driven by the Xc40 and the V60.
Retail sales (units) 2019 2018 Change %
europe 341,200 318,235 7.2
china 154,961 130,593 18.7
Us 108,234 98,263 10.1
other 101,057 95,162 6.2
Total 705,452 642,253 9.8
Retail sales by model (units) 2019 2018
Xc60/Xc60 classic 204,981 189,459
Xc40 139,847 75,828
Xc90 100,729 94,182
V60/V60 cross country 68,577 54,095
s90 56,355 57,142
V40/V40 cross country 51,542 77,587
s60 42,795 40,499
V90/V90 cross country 40,621 53,461
other (discontinued models) 5 —
Total 705,452 642,253
Top 10 Retail sales by market (units) 2019 2018
china 154,961 130,593
Us 108,234 98,263
sweden 64,290 67,128
UK 56,316 50,065
Germany 52,954 45,134
Belgium 23,547 21,201
italy 22,101 19,340
france 20,818 18,825
Japan 18,573 17,389
Netherlands 16,325 16,312
Events during the yearSEK 5 billion of existing preference shares refinancedVolvo cars issued seK 5 billion worth of convertible preference shares to a group of swedish institutional investors, comprising the swedish pension fund aMf and the swedish insurance and pension savings group folksam. Being one of sweden’s largest pension funds, and leading insurance and pension savings group respec-tively, Volvo cars consider their investments to represent a signifi-cant, continued endorsement for the company. at the same time the previously issued preference shares to the same investors were redeemed. the preference shares may be repurchased or converted into common shares of Volvo car aB under certain circumstances.
Two bonds issueda seK 2bn bond that matures in february 2023 and a eUr 600m bond that matures in april 2024 were listed on the Luxembourg stock exchange. the proceeds will be used for general corporate purposes that might include repayment of debt. at year end, the total bond portfolio amounted to seK 21.6bn.
Intention to merge combustion engine operations announcedVolvo cars and Geely announced their intentions to merge their existing combustion engine operations into a standalone business, in order to establish a new global supplier that will seek to develop next generation combustion engines and hybrid powertrains. the pro-posed new business would clear the way for Volvo cars to focus on the development of its all-electric range of premium cars.
Volvo Cars Moment – SustainabilityVolvo cars introduced the Xc40 recharge, its first fully electric car and the first model out in the new recharge car line concept. at the same event, an ambitious plan aiming to reduce the lifecycle carbon footprint per car by 40 per cent until 2025, was launched. this was Volvo cars’ first tangible step towards the ambition of becoming a climate neutral company by 2040.
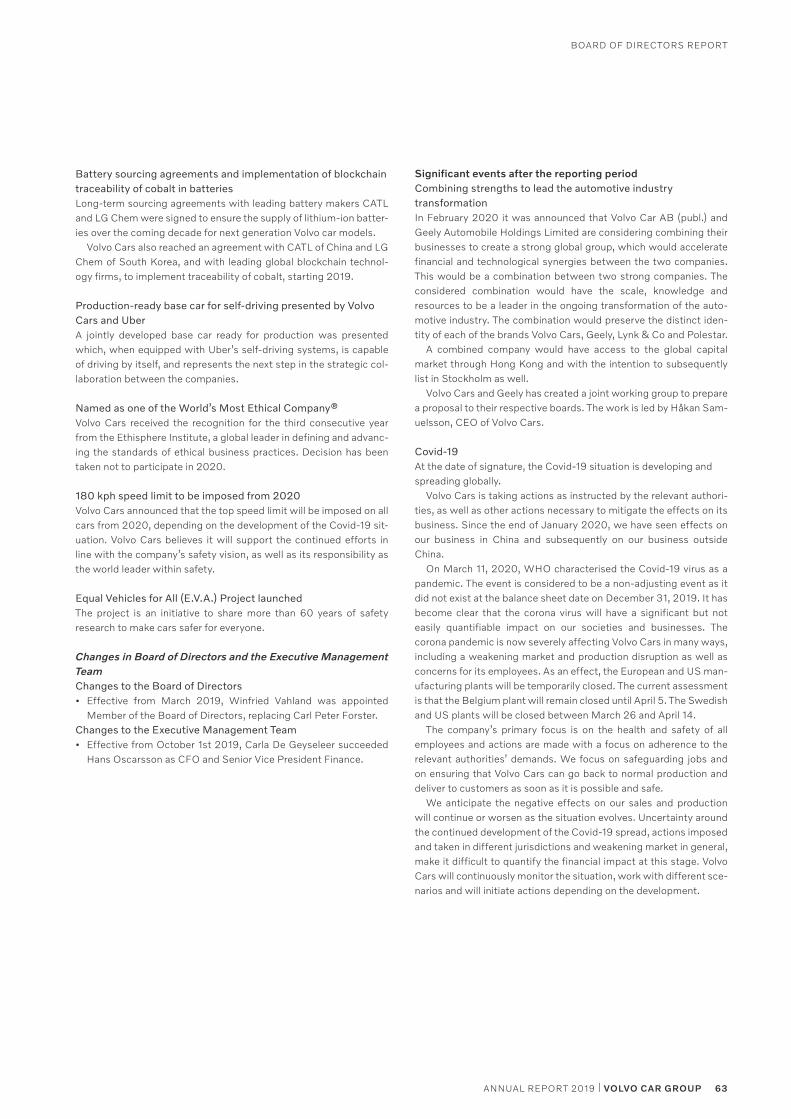
Board of directors report
63ANNUAL REPORT 2019 | VOLVO CAR GROUP
Battery sourcing agreements and implementation of blockchain traceability of cobalt in batteriesLong-term sourcing agreements with leading battery makers catL and LG chem were signed to ensure the supply of lithium-ion batter-ies over the coming decade for next generation Volvo car models.
Volvo cars also reached an agreement with catL of china and LG chem of south Korea, and with leading global blockchain technol-ogy firms, to implement traceability of cobalt, starting 2019.
Production-ready base car for self-driving presented by Volvo Cars and Ubera jointly developed base car ready for production was presented which, when equipped with Uber’s self-driving systems, is capable of driving by itself, and represents the next step in the strategic col-laboration between the companies.
Named as one of the World’s Most Ethical Company®Volvo cars received the recognition for the third consecutive year from the ethisphere institute, a global leader in defining and advanc-ing the standards of ethical business practices. decision has been taken not to participate in 2020.
180 kph speed limit to be imposed from 2020Volvo cars announced that the top speed limit will be imposed on all cars from 2020, depending on the development of the covid-19 sit-uation. Volvo cars believes it will support the continued efforts in line with the company’s safety vision, as well as its responsibility as the world leader within safety.
Equal Vehicles for All (E.V.A.) Project launchedthe project is an initiative to share more than 60 years of safety research to make cars safer for everyone.
Changes in Board of Directors and the Executive Management TeamChanges to the Board of Directors• effective from March 2019, Winfried Vahland was appointed
Member of the Board of directors, replacing carl peter forster. Changes to the Executive Management Team• effective from october 1st 2019, carla de Geyseleer succeeded
Hans oscarsson as cfo and senior Vice president finance.
Significant events after the reporting periodCombining strengths to lead the automotive industry transformationin february 2020 it was announced that Volvo car aB (publ.) and Geely automobile Holdings Limited are considering combining their businesses to create a strong global group, which would accelerate financial and technological synergies between the two companies. this would be a combination between two strong companies. the considered combination would have the scale, knowledge and resources to be a leader in the ongoing transformation of the auto-motive industry. the combination would preserve the distinct iden-tity of each of the brands Volvo cars, Geely, Lynk & co and polestar.
a combined company would have access to the global capital market through Hong Kong and with the intention to subsequently list in stockholm as well.
Volvo cars and Geely has created a joint working group to prepare a proposal to their respective boards. the work is led by Håkan sam-uelsson, ceo of Volvo cars.
Covid-19at the date of signature, the covid-19 situation is developing and spreading globally.
Volvo cars is taking actions as instructed by the relevant authori-ties, as well as other actions necessary to mitigate the effects on its business. since the end of January 2020, we have seen effects on our business in china and subsequently on our business outside china.
on March 11, 2020, WHo characterised the covid-19 virus as a pandemic. the event is considered to be a non-adjusting event as it did not exist at the balance sheet date on december 31, 2019. it has become clear that the corona virus will have a significant but not easily quantifiable impact on our societies and businesses. the corona pandemic is now severely affecting Volvo cars in many ways, including a weakening market and production disruption as well as concerns for its employees. as an effect, the european and Us man-ufacturing plants will be temporarily closed. the current assessment is that the Belgium plant will remain closed until april 5. the swedish and Us plants will be closed between March 26 and april 14.
the company’s primary focus is on the health and safety of all employees and actions are made with a focus on adherence to the relevant authorities’ demands. We focus on safeguarding jobs and on ensuring that Volvo cars can go back to normal production and deliver to customers as soon as it is possible and safe.
We anticipate the negative effects on our sales and production will continue or worsen as the situation evolves. Uncertainty around the continued development of the covid-19 spread, actions imposed and taken in different jurisdictions and weakening market in general, make it difficult to quantify the financial impact at this stage. Volvo cars will continuously monitor the situation, work with different sce-narios and will initiate actions depending on the development.
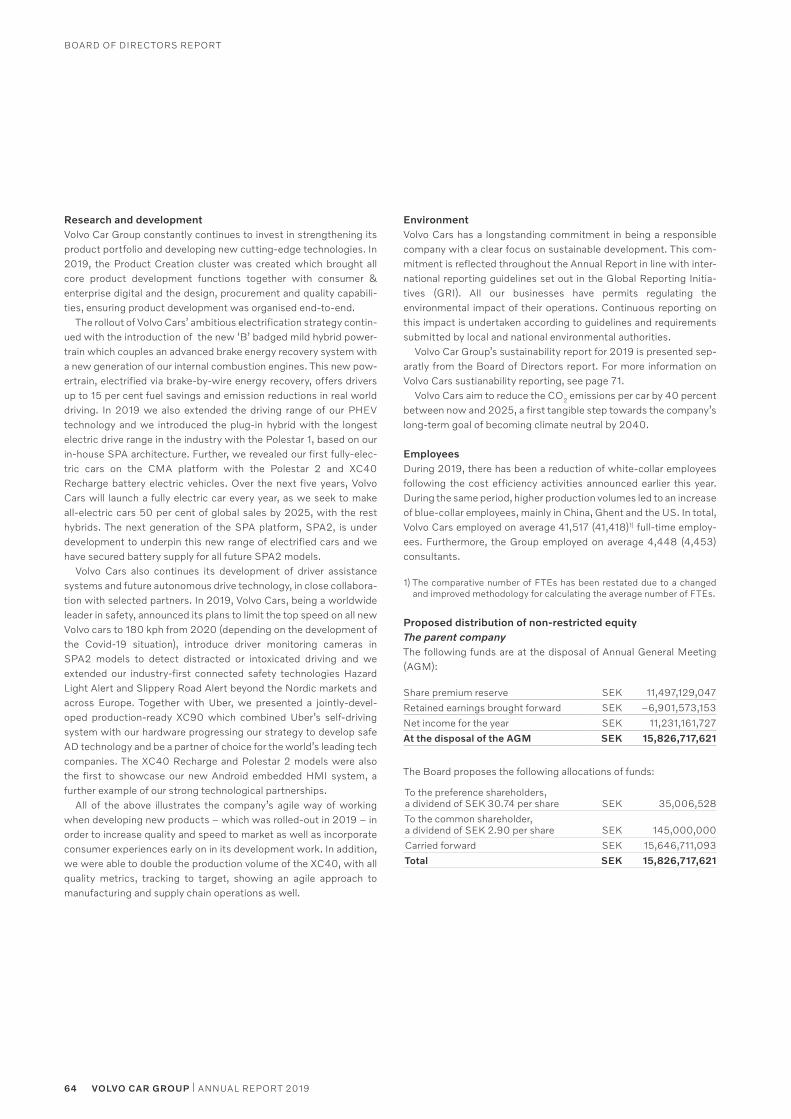
Board of directors report
64 VOLVO CAR GROUP | ANNUAL REPORT 2019
Research and developmentVolvo car Group constantly continues to invest in strengthening its product portfolio and developing new cutting-edge technologies. in 2019, the product creation cluster was created which brought all core product development functions together with consumer & enterprise digital and the design, procurement and quality capabili-ties, ensuring product development was organised end-to-end.
the rollout of Volvo cars’ ambitious electrification strategy contin-ued with the introduction of the new ‘B’ badged mild hybrid power-train which couples an advanced brake energy recovery system with a new generation of our internal combustion engines. this new pow-ertrain, electrified via brake-by-wire energy recovery, offers drivers up to 15 per cent fuel savings and emission reductions in real world driving. in 2019 we also extended the driving range of our pHeV technology and we introduced the plug-in hybrid with the longest electric drive range in the industry with the polestar 1, based on our in-house spa architecture. further, we revealed our first fully-elec-tric cars on the cMa platform with the polestar 2 and Xc40 recharge battery electric vehicles. over the next five years, Volvo cars will launch a fully electric car every year, as we seek to make all-electric cars 50 per cent of global sales by 2025, with the rest hybrids. the next generation of the spa platform, spa2, is under development to underpin this new range of electrified cars and we have secured battery supply for all future spa2 models.
Volvo cars also continues its development of driver assistance systems and future autonomous drive technology, in close collabora-tion with selected partners. in 2019, Volvo cars, being a worldwide leader in safety, announced its plans to limit the top speed on all new Volvo cars to 180 kph from 2020 (depending on the development of the covid-19 situation), introduce driver monitoring cameras in spa2 models to detect distracted or intoxicated driving and we extended our industry-first connected safety technologies Hazard Light alert and slippery road alert beyond the Nordic markets and across europe. together with Uber, we presented a jointly-devel-oped production-ready Xc90 which combined Uber’s self-driving system with our hardware progressing our strategy to develop safe ad technology and be a partner of choice for the world’s leading tech companies. the Xc40 recharge and polestar 2 models were also the first to showcase our new android embedded HMi system, a further example of our strong technological partnerships.
all of the above illustrates the company’s agile way of working when developing new products – which was rolled-out in 2019 – in order to increase quality and speed to market as well as incorporate consumer experiences early on in its development work. in addition, we were able to double the production volume of the Xc40, with all quality metrics, tracking to target, showing an agile approach to manufacturing and supply chain operations as well.
EnvironmentVolvo cars has a longstanding commitment in being a responsible company with a clear focus on sustainable development. this com-mitment is reflected throughout the annual report in line with inter-national reporting guidelines set out in the Global reporting initia-tives (Gri). all our businesses have permits regulating the environmental impact of their operations. continuous reporting on this impact is undertaken according to guidelines and requirements submitted by local and national environmental authorities.
Volvo car Group’s sustainability report for 2019 is presented sep-aratly from the Board of directors report. for more information on Volvo cars sustianability reporting, see page 71.
Volvo cars aim to reduce the co2 emissions per car by 40 percent between now and 2025, a first tangible step towards the company’s long-term goal of becoming climate neutral by 2040.
Employeesduring 2019, there has been a reduction of white-collar employees following the cost efficiency activities announced earlier this year. during the same period, higher production volumes led to an increase of blue-collar employees, mainly in china, Ghent and the Us. in total, Volvo cars employed on average 41,517 (41,418)1) full-time employ-ees. furthermore, the Group employed on average 4,448 (4,453) consultants.
1) the comparative number of ftes has been restated due to a changed and improved methodology for calculating the average number of ftes.
Proposed distribution of non-restricted equityThe parent companythe following funds are at the disposal of annual General Meeting (aGM):
share premium reserve seK 11,497,129,047
retained earnings brought forward seK –6,901,573,153
Net income for the year seK 11,231,161,727
At the disposal of the AGM SEK 15,826,717,621
the Board proposes the following allocations of funds:
to the preference shareholders,a dividend of seK 30.74 per share seK 35,006,528
to the common shareholder,a dividend of seK 2.90 per share seK 145,000,000
carried forward seK 15,646,711,093
Total SEK 15,826,717,621
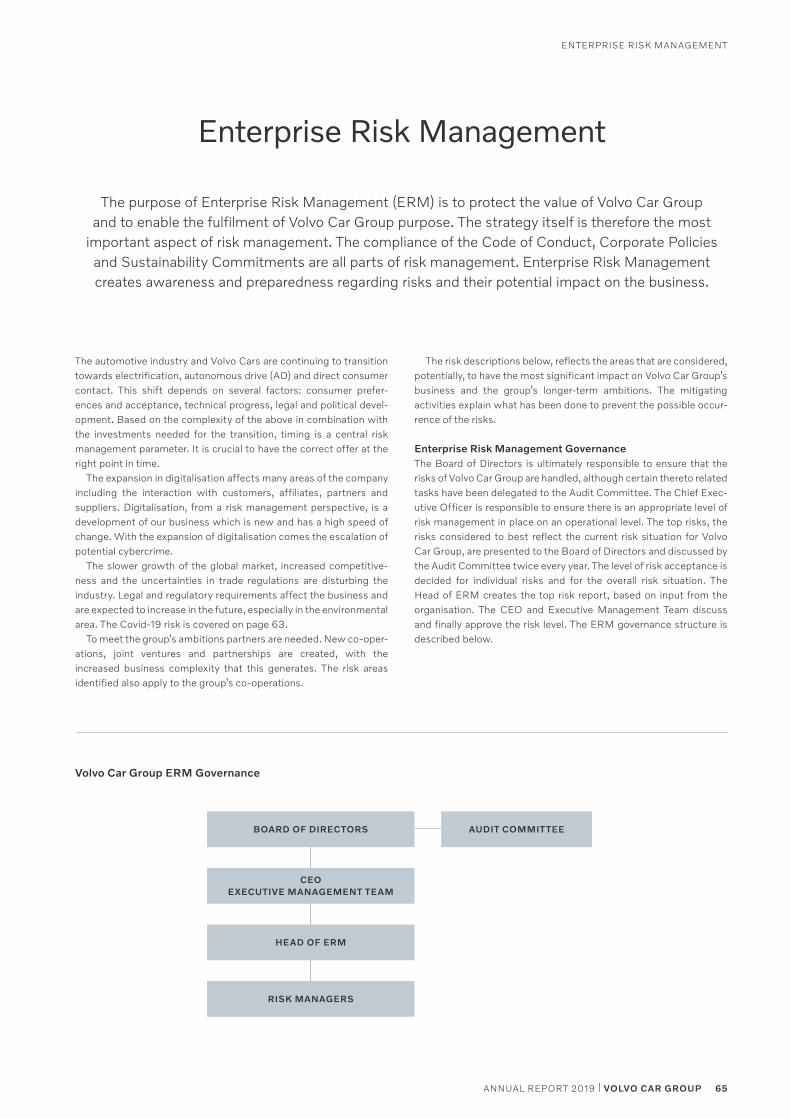
eNterprise risK MaNaGeMeNt
65ANNUAL REPORT 2019 | VOLVO CAR GROUP
Enterprise Risk Management
the purpose of enterprise risk Management (erM) is to protect the value of Volvo car Group and to enable the fulfilment of Volvo car Group purpose. the strategy itself is therefore the most
important aspect of risk management. the compliance of the code of conduct, corporate policies and sustainability commitments are all parts of risk management. enterprise risk Management creates awareness and preparedness regarding risks and their potential impact on the business.
the automotive industry and Volvo cars are continuing to transition towards electrification, autonomous drive (ad) and direct consumer contact. this shift depends on several factors: consumer prefer-ences and acceptance, technical progress, legal and political devel-opment. Based on the complexity of the above in combination with the investments needed for the transition, timing is a central risk management parameter. it is crucial to have the correct offer at the right point in time.
the expansion in digitalisation affects many areas of the company including the interaction with customers, affiliates, partners and suppliers. digitalisation, from a risk management perspective, is a development of our business which is new and has a high speed of change. With the expansion of digitalisation comes the escalation of potential cybercrime.
the slower growth of the global market, increased competitive-ness and the uncertainties in trade regulations are disturbing the industry. Legal and regulatory requirements affect the business and are expected to increase in the future, especially in the environmental area. the covid-19 risk is covered on page 63.
to meet the group’s ambitions partners are needed. New co-oper-ations, joint ventures and partnerships are created, with the increased business complexity that this generates. the risk areas identified also apply to the group’s co-operations.
the risk descriptions below, reflects the areas that are considered, potentially, to have the most significant impact on Volvo car Group’s business and the group’s longer-term ambitions. the mitigating activities explain what has been done to prevent the possible occur-rence of the risks.
Enterprise Risk Management Governancethe Board of directors is ultimately responsible to ensure that the risks of Volvo car Group are handled, although certain thereto related tasks have been delegated to the audit committee. the chief exec-utive officer is responsible to ensure there is an appropriate level of risk management in place on an operational level. the top risks, the risks considered to best reflect the current risk situation for Volvo car Group, are presented to the Board of directors and discussed by the audit committee twice every year. the level of risk acceptance is decided for individual risks and for the overall risk situation. the Head of erM creates the top risk report, based on input from the organisation. the ceo and executive Management team discuss and finally approve the risk level. the erM governance structure is described below.
Volvo Car Group ERM Governance
BOARD OF DIRECTORS AUDIT COMMITTEE
CEO EXECUTIVE MANAGEMENT TEAM
HEAD OF ERM
RISK MANAGERS
eNterprise risK MaNaGeMeNt
66 VOLVO CAR GROUP | ANNUAL REPORT 2019
RISKS MITIGATION
COVID-19
The Covid-19 risk is covered on page 63.
CYBER SECURITY
Cyber security breaches could cause severe disruption for our busi-ness including but not limited to operational disturbances, affecting enterprise as well as consumers, loss of intellectual property (IP) and data leakage.
cybercrime activities lead to business interruption. our strategy is to con-stantly expand digitalisation. this combined with the escalation of cyber-crime threats, e.g. related to our products, digital landscape as well as personnel, are the main drivers.
additional technology and enforced classification of information is being implemented to increase the effectiveness of technology, i.e. our defence. improving the risk awareness, globally, is an important ongoing effort. resources and competence dedicated to the cyber security area have increased during the year. this advances the monitoring, predicting and continuity/crises planning capabilities related to cyber security.
ongoing work to make sure that proper governance, risk and compliance work are introduced in our new way of working, on all levels.
DATA PRIVACY
Volvo Car Group comprises a multitude of entities with operations all over the globe. The regulatory landscape concerning protection of per-sonal data is increasing, the EU General Data Protection Regulation being an example to many other pieces of legislation already passed or currently being discussed in other countries.
the territorial and substantial rules of application of each such data protec-tion law are not consistent, meaning that one organisation may find itself subject to multiple regulatory frameworks at the same time. in addition, technical regulations have started to have a privacy component more often than not.
Volvo cars’ global data protection programme has already passed the stage of focusing on the eU General data protection regulation. in 2019, the focus was on (i) improving the data protection organisation and (ii) alignment between the regions (with coordination at global level) and (iii) raising awareness in the organisation regarding applicable data protection rules. these efforts will continue going forward.
DIGITALISATION
Requirements from new business models and our long-term strategies increase the level of digitalisation. Digital disturbances and outages will affect our contact with and service to potential and current cus-tomers. Connected services are especially critical, possibly causing car malfunctions.
the high speed of change and time to market for digital solutions might affect our customers directly through the interteraction during the buying process and the owning and servicing of the products. over the last 12 months, the speed of developing complex new features has increased. this is expected to continue through the business initiatives such as care by Volvo, M and others. With the introduction of the next generation of prod-ucts and services the digital share will increase further.
there are many strategic initiatives ongoing to address the risks regarding digitalisation. some examples are:- evolving direct customer interaction, enables easy way of selling and charging our customers for any product or service.- Make cars better every day, continuous product updates and easier to own, support future product configuration- focusing digital development by replacing several legacy applications, securing a robust data foundation and intensified license reviewing.
eNterprise risK MaNaGeMeNt
67ANNUAL REPORT 2019 | VOLVO CAR GROUP
RISKS MITIGATION
DIRECT CONSUMER BUSINESS
The speed of change into business models that are new to Volvo Cars.
direct consumer interaction is new to Volvo car Group and consumer expectations are predicted to change very quickly with many new market offerings emerging. Volvo cars expects increasing consumer interest in car subscriptions and other new ways of having your car available, instead of traditional car ownership. Volvo cars see subscriptions as well as e-com-merce as a key area that will lead to direct customer interaction. in addition, mobility services, such as car sharing business, is driving direct customer interaction.
the transition towards more direct consumer business are done to meet customer preferences and automotive trends the Volvo cars’ way - people centric. it is done through our care by Volvo programme. our retailer strat-egy is being updated to ensure that our collaboration with the dealer net-work is relevant and fit to meet the new demands.
ELECTRIFICATION
The timing of a broader consumer demand for electrification is difficult to predict.
Volvo car Group is adjusting its business towards electrification. our com-pany ambition of 50 per cent electrified vehicles by 2025 is completely dependent on the market development. consumer preferences and politi-cal agendas can affect market rollout in ways that are difficult to predict and control. availability of a competitive charging experience is an impor-tant enabler for customers willing to convert to electric vehicles. Volvo car Group needs to provide infrastructure and paying offer for our electric vehi-cles customers in comparison to competition. if not, it will have a direct impact on electric vehicle sales. the charging network market is very immature and different depending on region, where eU is the most frag-mented.
the best mitigation activities to transition to electrification according to our company ambition of 50 per cent electrified vehicles are to have an attractive electric vehicle offer and to offer a competitive charging experi-ence for our customers. these activities are both well advanced. signing of contracts with regional charging network partnerships and service sup-plies are ongoing, which will ensure a competitive set of suppliers for charging and related services. to secure a competitive charging experience this will be followed over time to re-evaluate needed partners.
our recent launch of recharge carline, which includes all pHeV’s and BeV’s, was done to emphasise our focus on electrification and to make it easier for our customers to find an attractive product offer.
LAWS AND REGULATION
New or changing laws, regulations and government policies will affect our business. The number and extent of legal and regulatory require-ments to our business are expected to increase in the future, especially relating to the environment. Currently the EU fleet average CO2 emis-sion requirement is one of them.
Volvo cars Group’s products, services and operations are subject to com-prehensive and constantly changing laws, regulations and policies through-out the world. the group has to fulfil corporate fleet requirements regarding emissions. changes in corporate and other taxation policies as well as changes in export/import policies and other restrictions/incentives given by various governments on tariff policies could also affect Volvo cars’ results of oper-ations and financial condition.
to comply with the emission requirements that affect the vehicle industry, Volvo car Group is working through a number of different activities: - continuously assessing technical capabilities, commercial impact, supply status and regulatory updates- balancing road load (weight, aerodynamics, rolling resistance, friction/losses and auxiliary loads)- market penetration of BeV and pHeV to ensure market compliance- increased focus beyond the 2021 legislation
in order to minimise the negative effect of potential changes, legal and regu-latory awareness and preparedness is established in all areas that might affect Volvo car Group’s business and financial condition.
corporate GoVerNaNce report
68 VOLVO CAR GROUP | ANNUAL REPORT 2019
Corporate Governance Report
Introduction to Volvo Car Group’s Corporate Governancethe purpose of corporate governance in Volvo cars is to create a good foundation for active and responsible ownership, a proper dis-tribution of responsibility between the different company bodies, as well as good communication with all of the company’s stakeholders.
the corporate governance principles adhered to by Volvo cars are based on swedish law (swedish companies act and swedish annual accounts act). Volvo cars applies the principles of sound corporate governance and responsible business practice and has decided to follow relevant parts of the swedish code of corporate Governance (the “code”). Being a company not listed on the stock market, Volvo cars acknowledges it is not required to do so, and that some princi-ples are not relevant to Volvo cars.
the shareholders execute their influence at the shareholders’ meetings, the highest decision-making body of the company, where an annual general meeting shall be held at least once a year within six months after the end of the financial year. some of the decisions made by the shareholders’ during the shareholders’ meeting are (i) election of a Nomination committee which nominates members to the Board of directors of the company (the “Board” or the “Volvo cars Board”), (ii) determination upon number of Board members, composition of the Board and remuneration for the members of the Board, based on suggestions by the Nomination committee, (iii) election of external auditors, (iv) determination of the distribution of dividends and (v) determination of amendments to the articles of association.
the Board is responsible for the organisation of Volvo cars and the management of its business worldwide and is obliged to follow directives provided by the shareholders’ meetings. the Volvo cars Board may appoint committees with specific areas of responsibility and furthermore authorise such committees to decide specific mat-ters in accordance with regulations established by the Volvo cars Board. currently, the Volvo cars Board has established the audit committee, the people and sustainability committee and the prod-uct strategy and investment committee. the chairman of the Board shall direct the work of the Board and monitor that the Board fulfils its obligations and may elect to seek support from the Vice chairman when so is required. the Board annually adopts the regulations for the work of the Volvo cars Board, which sets out the principles as regards the governance of the Board, see below under the heading “the Volvo cars Board” for further information. the president of the company, who is also the chief executive officer (ceo), is appointed by the Board to handle the day-to-day management of Volvo cars and to lead the executive Management team (eMt) as overseen by the Board. eMt’s role is to assist the ceo in the operation of Volvo cars’ business. the eMt has appointed boards of the eMt to assist in carrying out decisions and actions, but the ceo will retain respon-sibility for the actions of the boards of the eMt.
Nomination Committeethe shareholders’ meeting has elected a Nomination committee, which shall nominate members to the Volvo cars Board, proposes appropriate remuneration principles for the Volvo cars Board and on a yearly basis proposes the remuneration and other terms for the Volvo cars Board to be decided by the annual General Meeting. refer to the table under the Volvo cars Board, regarding relevant remuneration for 2019. any changes to the Nomination committee’s
duties are subject to approval at a shareholders’ meeting. appoint-ment or removal of a member of the Volvo cars Board shall be pro-posed by the Nomination committee but is subject to the approval of the shareholders’ meeting. the Nomination committee shall com-prise of three representatives. currently Hans olov olsson (chair-man), Lone fönss schröder and Mikael olsson are members of the Nomination committee. the Nomination committee has adopted a framework for nomination of members to the Board, which stipu-lates that the composition of the Board shall be diverse in terms of gender, nationality, professional background and other compe-tences. this is to ensure that the Board has the appropriate balance of expert knowledge, which matches the scale and complexity of Volvo cars, supports a sustainable development and meets the inde-pendency requirements of Volvo cars. it is Volvo cars’ aim to have a balanced composition when it comes to gender and during 2020 it is the ambition that each gender shall have a share of at least some 40 per cent of the Board members elected by the shareholders’ meeting. the Unions represented in the Volvo cars Board shall be encouraged to apply the corresponding goal when appointing their representatives. the Nomination committee evaluates the perfor-mance of the members of the Board once a year.
The Volvo Cars Board Composition of the Boardat all times, the Volvo cars Board shall consist of a minimum of three and a maximum of twelve members and in addition thereto the num-ber of employee representatives as is required under swedish law. the regulations for the work of the Board stipulates that the major-ity of Volvo cars Board members shall be independent of Volvo cars and the management and at least two of these independent mem-bers shall also be independent of the shareholders. at the end of december 2019, the Board (excluding the employee representa-tives) consisted of ten members as further detailed below as well as in Note 8 - employees and remunerations. No member of the man-agement other than the ceo is a member of the Board. details of the remuneration principles for the Board can be found in Note 8 – employees and remuneration. each new Board member is provided with an introduction programme to learn about the Volvo car Group and the Board visits at least once every year a Volvo car Group site other than the headquarters.
Conflicts of interestthe Board members shall immediately disclose to the chairman and/ or the Vice chairman if they find themselves to have a conflict of interest. a Board member having a conflict of interest in relation to any matter to be dealt with by the Board may not participate in the discussions or decisions regarding such matter.
Board meetingsthe Volvo cars Board is, according to the regulations for the work of the Board, expected to meet four to eight times per year at venues to be agreed by the Volvo cars Board. the Volvo cars Board has held ten meetings during 2019, of which eight were ordinary and two extraordinary. the Volvo cars Board meets the statutory auditor at least once a year without the ceo or any other member of eMt pres-ent. in addition, the Volvo cars Board holds non-executive meetings with regular intervals. the cfo and the General counsel, who is the
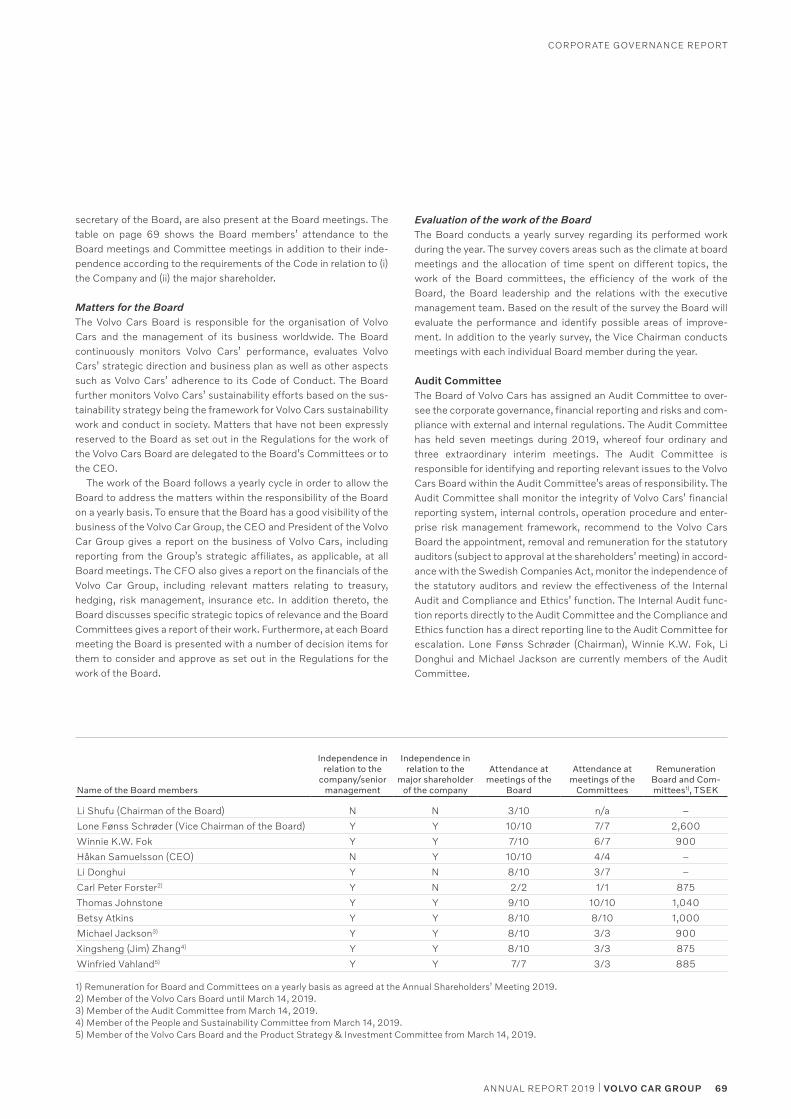
corporate GoVerNaNce report
69ANNUAL REPORT 2019 | VOLVO CAR GROUP
Name of the Board members
Independence in relation to the
company/senior management
Independence in relation to the
major shareholder of the company
Attendance at meetings of the
Board
Attendance at meetings of the
Committees
Remuneration Board and Com-mittees1), TSEK
Li shufu (chairman of the Board) N N 3/10 n/a –
Lone fønss schrøder (Vice chairman of the Board) Y Y 10/10 7/7 2,600
Winnie K.W. fok Y Y 7/10 6/7 900
Håkan samuelsson (ceo) N Y 10/10 4/4 –
Li donghui Y N 8/10 3/7 –
carl peter forster2) Y N 2/2 1/1 875
thomas Johnstone Y Y 9/10 10/10 1,040
Betsy atkins Y Y 8/10 8/10 1,000
Michael Jackson3) Y Y 8/10 3/3 900
Xingsheng (Jim) Zhang4) Y Y 8/10 3/3 875
Winfried Vahland5) Y Y 7/7 3/3 885 1) remuneration for Board and committees on a yearly basis as agreed at the annual shareholders’ Meeting 2019.2) Member of the Volvo cars Board until March 14, 2019.3) Member of the audit committee from March 14, 2019.4) Member of the people and sustainability committee from March 14, 2019.5) Member of the Volvo cars Board and the product strategy & investment committee from March 14, 2019.
secretary of the Board, are also present at the Board meetings. the table on page 69 shows the Board members’ attendance to the Board meetings and committee meetings in addition to their inde-pendence according to the requirements of the code in relation to (i) the company and (ii) the major shareholder.
Matters for the Boardthe Volvo cars Board is responsible for the organisation of Volvo cars and the management of its business worldwide. the Board continuously monitors Volvo cars’ performance, evaluates Volvo cars’ strategic direction and business plan as well as other aspects such as Volvo cars’ adherence to its code of conduct. the Board further monitors Volvo cars’ sustainability efforts based on the sus-tainability strategy being the framework for Volvo cars sustainability work and conduct in society. Matters that have not been expressly reserved to the Board as set out in the regulations for the work of the Volvo cars Board are delegated to the Board’s committees or to the ceo.
the work of the Board follows a yearly cycle in order to allow the Board to address the matters within the responsibility of the Board on a yearly basis. to ensure that the Board has a good visibility of the business of the Volvo car Group, the ceo and president of the Volvo car Group gives a report on the business of Volvo cars, including reporting from the Group’s strategic affiliates, as applicable, at all Board meetings. the cfo also gives a report on the financials of the Volvo car Group, including relevant matters relating to treasury, hedging, risk management, insurance etc. in addition thereto, the Board discusses specific strategic topics of relevance and the Board committees gives a report of their work. furthermore, at each Board meeting the Board is presented with a number of decision items for them to consider and approve as set out in the regulations for the work of the Board.
Evaluation of the work of the Boardthe Board conducts a yearly survey regarding its performed work during the year. the survey covers areas such as the climate at board meetings and the allocation of time spent on different topics, the work of the Board committees, the efficiency of the work of the Board, the Board leadership and the relations with the executive management team. Based on the result of the survey the Board will evaluate the performance and identify possible areas of improve-ment. in addition to the yearly survey, the Vice chairman conducts meetings with each individual Board member during the year.
Audit Committeethe Board of Volvo cars has assigned an audit committee to over-see the corporate governance, financial reporting and risks and com-pliance with external and internal regulations. the audit committee has held seven meetings during 2019, whereof four ordinary and three extraordinary interim meetings. the audit committee is responsible for identifying and reporting relevant issues to the Volvo cars Board within the audit committee’s areas of responsibility. the audit committee shall monitor the integrity of Volvo cars’ financial reporting system, internal controls, operation procedure and enter-prise risk management framework, recommend to the Volvo cars Board the appointment, removal and remuneration for the statutory auditors (subject to approval at the shareholders’ meeting) in accord-ance with the swedish companies act, monitor the independence of the statutory auditors and review the effectiveness of the internal audit and compliance and ethics’ function. the internal audit func-tion reports directly to the audit committee and the compliance and ethics function has a direct reporting line to the audit committee for escalation. Lone fønss schrøder (chairman), Winnie K.W. fok, Li donghui and Michael Jackson are currently members of the audit committee.
corporate GoVerNaNce report
70 VOLVO CAR GROUP | ANNUAL REPORT 2019
People and Sustainability Committee the Board has assigned a people and sustainability committee to prepare remuneration principles for the ceo and eMt members, approve the remuneration to the eMt members and support the chairman or vice chairman of the Board, as applicable, with the approval of the remuneration and benefits for the ceo. the people and sustainability committee has held six meetings during 2019, whereof five ordinary and one extraordinary. the duties of the people and sustainability committee are to prepare, propose and/or decide and present to the Volvo cars Board matters related to remunera-tion, remuneration principles, performance and succession planning of the ceo and the eMt and other matters related thereto. the committee is also responsible for supervising and providing guid-ance with regard to the people strategy. the company’s progress in delivering on the sustainability ambitions expressed in the sustaina-bility strategy is also on the agenda for the people and sustainability committee twice a year, in addition to the Board’s review of sustain-ability matters and the committee is responsible for supervising Volvo cars’ sustainability strategy. thomas Johnstone (chairman), Betsy atkins and Jim Zhang are currently members of the people and sustainability committee.
Product Strategy and Investment Committeethe Board has assigned a product strategy and investment commit-tee to oversee Volvo cars’ product strategy and the investments linked to it. the product strategy and investment committee has held four meetings during 2019, all ordinary. the purpose of the product strategy and investment committee is to review Volvo cars’ product strategy, cycle plan and product programmes to confirm that the strategy and the plans as well as programmes for the overall strategy, meet customer demand and market development and addresses new technology and business opportunities in all segments relevant to Volvo cars. the duties of the product strategy and investment com-mittee are furthermore to ensure that the changes in society, peoples view on mobility and cars as well as changes in the automotive market are reflected in Volvo cars’ strategic product plans and when choosing technologies. Winfried Vahland (chairman), thomas Johnstone, Betsy atkins together with Håkan samuelsson are members of the product strategy and investment committee. Winfried Vahland replaced carl-peter forster in the committee in March 2019 and has been chairman of the committee since october 23, 2019, replacing thomas Johnstone in that role.
Global Audit OfficeVolvo cars has an independent internal audit department with the assignment to determine whether Volvo cars’ governance, internal control and risk management processes, as designed, operated and represented by management, are adequate and effective. the scope for the internal audit is determined by means of a risk assessment process and any additional requirements by the Board. the head of the internal audit function reports to the audit committee.
Corporate Compliance and Ethics Officethe compliance and ethics office supports the business operations in conducting business in a responsible and ethical manner, by devel-oping, implementing and maintaining Volvo cars’ compliance and ethics programme. this programme consists of ten elements
designed on the basis of guidelines describing “effective compliance programme” and “adequate procedures”, such as the Us sentencing Guidelines and the UK Bribery act Guidance (supporting respec-tively the foreign corrupt practices act and the UK Bribery act) as well as guidance from anti-trust offices throughout europe. among these ten elements are: a regular risk assessment that leads to iden-tification, understanding and prioritisations of the main risk fields to which Volvo cars is exposed, so as to customise the compliance and ethics programme with a view to minimise the Group’s exposure to risks; implementation of a compliance and ethics framework (code of conduct and corporate policies, directives and Guidelines); com-pliance and ethics training, awareness and communication; internal reporting and investigations; and monitoring and assessment with a view to continuously improve the compliance and ethics pro-gramme. Volvo cars’ code of conduct (called our code – How We act) reflects Volvo cars’ culture and way of doing business in a responsible manner, by putting the emphasis on our values and com-mitments in addition to focusing on the requirements set out in our corporate policies. the chief compliance and ethics officer reports to the General counsel and further continuously reports on compli-ance issues to the Global compliance committee. the chief compli-ance and ethics officer also reports to the audit committee of the Board of directors and provides compliance training to the Board of directors.
External AuditorsVolvo car Groups’ external auditors are elected by the annual share-holders’ Meeting. deloitte aB was appointed auditor in Volvo car Group in the financial year 2010. the annual shareholders’ Meeting has then re-elected deloitte aB, and the current audit engagement period is ending at the 2020 annual shareholders’ Meeting. Lead audit partner is the authorized public accountant Jan Nilsson. the external auditors discuss the external audit plan, audit findings and risk management with the audit committee. the auditors review the interim report for the period January 1 to september 30 and present the result of the work to audit committee in december. the result from their financial year audit and audit of the annual report of the parent company and the consolidated financial statements is pre-sented to the audit committee and the Board of directors at meet-ings after year-end. When deloitte is asked to provide services other than the external audit, it is done in accordance with general inde-pendency rules. annually deloitte assures its impartiality and inde-pendence in writing to the audit committee in accordance with the swedish companies act and isa 260.
Disclosure CommitteeVolvo car aB is required to comply with certain disclosure obliga-tions following from the listing rules of the Luxembourg stock exchange’s euro Mtf market and the Market abuse regulation (Mar) and other applicable regulations related to trading in the securities issued by Volvo car aB. in order to ensure that Volvo cars follows the relevant requirements Volvo cars has established a dis-closure committee and the Board of directors has adopted a set of procedures for the disclosure committee. the audit committee is kept updated on the discussions and decisions by the disclosure committee via sharing of the minutes kept at the meetings of the committee. the members of the disclosure committee are the Gen-
corporate GoVerNaNce report
71ANNUAL REPORT 2019 | VOLVO CAR GROUP
eral counsel (chairman), the cfo and the Head of corporate com-munication. the Head of ir is a permanent participant as a rappor-teur and other senior company representatives attend the meetings on an agenda-driven basis. the Legal counsel, corporate Govern-ance office acts as secretary. the disclosure committee has been established to i.a. implement required disclosure controls and proce-dures, resolve whether information shall be categorised as inside information or not and consider whether there is a reason to delay disclosure of inside information or if immediate disclosure is required. the disclosure committee also monitors the company’s fulfilment of its disclosure obligations under ifrs and Mar related to transac-tions with related parties.
Internal control over financial reportingaccording to the swedish companies act, the Board is ultimately responsible for ensuring that an effective internal control system exists within the Group. in order to assist the Board and manage-ment in their internal control responsibilities, Volvo cars has imple-mented an internal control function over financial reporting (icfr), with the purpose to ensure that the external financial reporting is reliable and that the financial reports follow generally accepted accounting principles. the internal control function reports to the audit committee on a periodic basis. Volvo cars bases its internal control on the framework for internal control issued by the commit-tee of sponsoring organisations of the treadway commission (coso) and it consist of five components; control environment, risk assessment, control activities, information and communica-tion and Monitoring activities.
Control Environment the foundation of Volvo cars’ control environment is the code of conduct, which is the guiding principle of Volvo cars, as well as the Group’s corporate policies and directives. the foundation of the con-trol environment over financial reporting is further based upon func-tional policies, directives and guidelines and the delegation of authority directive.
Control activities control activities are the procedures that help to ensure that Volvo cars’ policies, directives and instructions are implemented. control activities are performed throughout the organisation, at all levels, and in all functions to manage risk and to detect and correct errors in the financial processes. control activities are documented in Volvo cars’ internal control framework.
Risk assessmentfrom an icfr perspective, the outcome of the risk assessment will define the internal control reviews for the coming year.
each entity and function is responsible for identifying risks, which are then consolidated and reported according to the enterprise risk Management directive, see page 65. additionally, on a yearly basis, the functions of internal control, corporate compliance & ethics office, consumer & enterprise digital and sustainability jointly per-form a risk assessment to evaluate and determine risks that could hinder the achievement of Volvo cars’ business objectives. the out-come from the joint risk assessment is reported to various eMt boards and to the functions having the operational responsibility.
Information and communicationthe information and communication component within Volvo cars includes the systems and processes that support the identification, capture and exchange of information that enable personnel to carry out their responsibilities and that financial reports are generated completely and accurately. information around the planning, risk areas and results of the self-assessment and internal control reviews are communicated within various fora and to the audit committee on a periodic basis.
Monitoringin addition to the internal audit function described above, a separate internal control function performs internal control reviews and coor-dinates evaluation activities through the annual self-assessment programme. this assessment programme focuses on management and transaction levels as well as self-assessments of it general con-trols. When control deficiencies are identified through selfassess-ments, regular operations or internal or external audits, such defi-ciencies are tracked and appropriate corrective actions undertaken to resolve these deficiencies. the Head of the internal control has regular contact with the cfo.
Sustainability reportingVolvo cars has been reporting on environmental, health and safety aspects of its products and production since it signed the UN Global compact in 2000. in 2003, the company produced its first sustain-ability report in line with the international reporting guidelines from the Global reporting initiative (Gri). By applying and living up to the Gri’s international guidelines for sustainability reporting, Volvo cars aims to ensure transparent reporting based on content that is rele-vant to its stakeholders. the 2019 report is prepared in accordance with Gri standards, accordance level core. Volvo cars reports on an annual basis, and this report covers the period January 1 to decem-ber 31, 2019 (except where otherwise stated). Volvo car Group’s sustainability report has been prepared to meet the statutory requirements in accordance with the swedish annual accounts act 6 chap. 11§. the scope and content of the sustainability report is defined by the Gri index presented on pages 143-144 in this docu-ment. definitions regarding boundaries as well as measuring tech-niques and calculations for each performance indicator are given in respect to the disclosure concerned. No significant changes occurred during the reporting period or from previous reporting periods. deloitte aB has performed a limited assurance of the sustainability report in line with isae 3000, see page 145 for the limited assur-ance report. as a signatory to the UN Global compact, the sustain-ability report is also our communication on progress.
additionally, and as part of the new sustainability strategy, Volvo cars has started a project to analyse, identify and select different initiatives and schemes which both support and externally validate our ambitions. climate action is a focus area of the company, as is financial risk. therefore, the task force on climate-related financial disclosures (tcfd) is one such scheme that will be investigated in 2020.
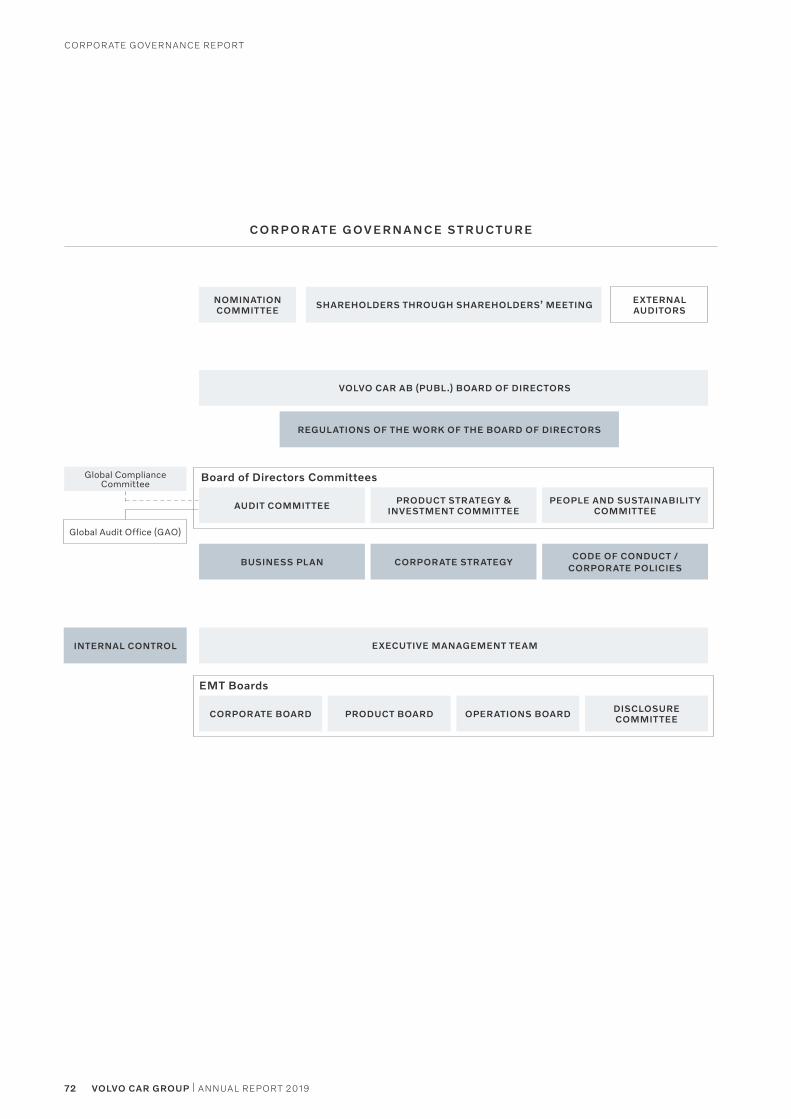
corporate GoVerNaNce report
72 VOLVO CAR GROUP | ANNUAL REPORT 2019
VOLVO CAR AB (PUBL.) BOARD OF DIRECTORS
EXECUTIVE MANAGEMENT TEAM
SHAREHOLDERS THROUGH SHAREHOLDERS’ MEETING
Board of Directors Committees
EMT Boards
Global Audit Office (GAO)
Global Compliance Committee
C O R P O R AT E G OV ER N A N C E S T RU C T U R E
PRODUCT STRATEGY & INVESTMENT COMMITTEEAUDIT COMMITTEE
CORPORATE BOARD PRODUCT BOARD OPERATIONS BOARD DISCLOSURE COMMITTEE
CORPORATE STRATEGYBUSINESS PLAN
REGULATIONS OF THE WORK OF THE BOARD OF DIRECTORS
PEOPLE AND SUSTAINABILITY COMMITTEE
CODE OF CONDUCT / CORPORATE POLICIES
INTERNAL CONTROL
NOMINATION COMMITTEE
EXTERNAL AUDITORS
corporate GoVerNaNce report
73ANNUAL REPORT 2019 | VOLVO CAR GROUP
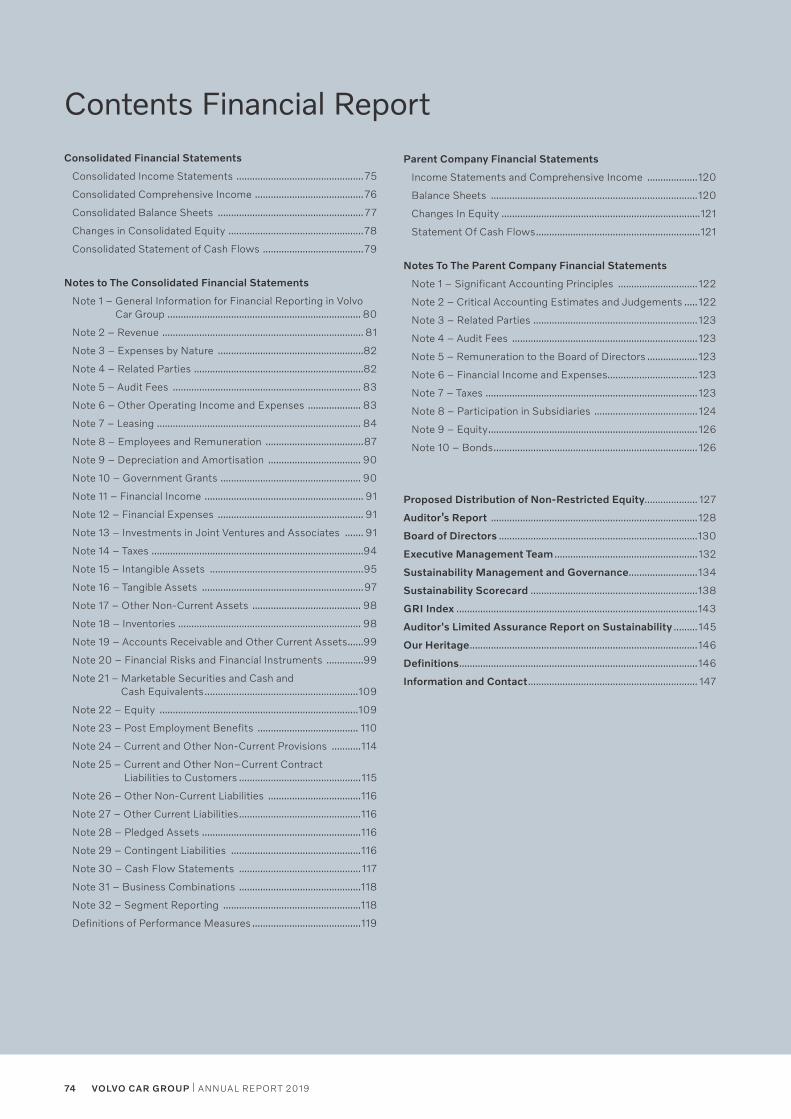
74 VOLVO CAR GROUP | ANNUAL REPORT 2019
Consolidated FinanCial statements
Consolidated Financial Statements
Consolidated income statements ................................................75
Consolidated Comprehensive income .........................................76
Consolidated Balance sheets .......................................................77
Changes in Consolidated equity ...................................................78
Consolidated statement of Cash Flows ......................................79
Notes to The Consolidated Financial Statements
note 1 – General information for Financial Reporting in Volvo Car Group ......................................................................... 80
note 2 – Revenue ............................................................................ 81
note 3 – expenses by nature .......................................................82
note 4 – Related Parties ................................................................82
note 5 – audit Fees ....................................................................... 83
note 6 – other operating income and expenses .................... 83
note 7 – leasing ............................................................................. 84
note 8 – employees and Remuneration .....................................87
note 9 – depreciation and amortisation ................................... 90
note 10 – Government Grants ..................................................... 90
note 11 – Financial income ............................................................ 91
note 12 – Financial expenses ....................................................... 91
note 13 – investments in Joint Ventures and associates ....... 91
note 14 – taxes ................................................................................94
note 15 – intangible assets ..........................................................95
note 16 – tangible assets .............................................................97
note 17 – other non-Current assets ......................................... 98
note 18 – inventories ..................................................................... 98
note 19 – accounts Receivable and other Current assets ......99
note 20 – Financial Risks and Financial instruments ..............99
note 21 – marketable securities and Cash and Cash equivalents ..........................................................109
note 22 – equity ...........................................................................109
note 23 – Post employment Benefits ...................................... 110
note 24 – Current and other non-Current Provisions ...........114
note 25 – Current and other non–Current Contract liabilities to Customers ..............................................115
note 26 – other non-Current liabilities ...................................116
note 27 – other Current liabilities ..............................................116
note 28 – Pledged assets ............................................................116
note 29 – Contingent liabilities .................................................116
note 30 – Cash Flow statements ..............................................117
note 31 – Business Combinations ..............................................118
note 32 – segment Reporting ....................................................118
definitions of Performance measures .........................................119
Contents Financial Report
Parent Company Financial Statements
income statements and Comprehensive income ...................120
Balance sheets ..............................................................................120
Changes in equity ...........................................................................121
statement of Cash Flows ..............................................................121
Notes To The Parent Company Financial Statements
note 1 – significant accounting Principles ..............................122
note 2 – Critical accounting estimates and Judgements .....122
note 3 – Related Parties ..............................................................123
note 4 – audit Fees ......................................................................123
note 5 – Remuneration to the Board of directors ...................123
note 6 – Financial income and expenses ..................................123
note 7 – taxes ................................................................................123
note 8 – Participation in subsidiaries .......................................124
note 9 – equity ...............................................................................126
note 10 – Bonds .............................................................................126
Proposed Distribution of Non-Restricted Equity.................... 127
Auditor’s Report ..............................................................................128
Board of Directors ...........................................................................130
Executive Management Team ......................................................132
Sustainability Management and Governance ..........................134
Sustainability Scorecard ...............................................................138
GRI Index ...........................................................................................143
Auditor's Limited Assurance Report on Sustainability .........145
Our Heritage ......................................................................................146
Definitions ..........................................................................................146
Information and Contact ................................................................ 147
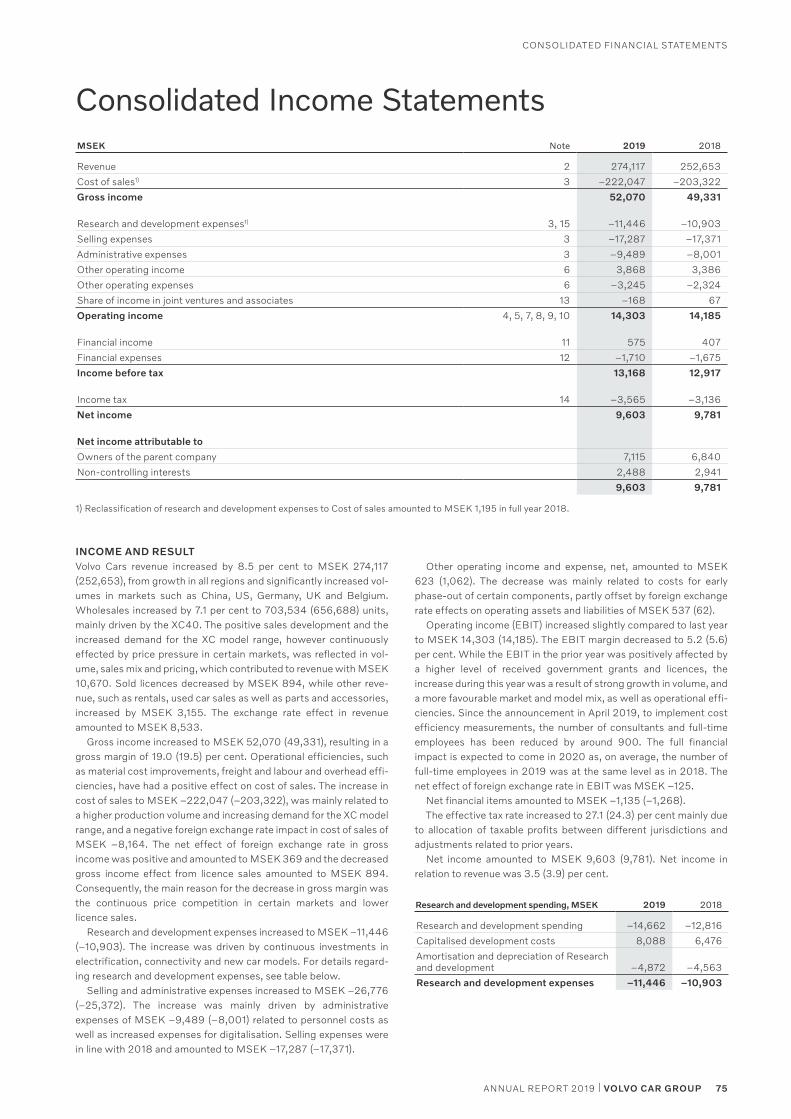
75ANNUAL REPORT 2019 | VOLVO CAR GROUP
Consolidated FinanCial statements
MSEK Note 2019 2018
Revenue 2 274,117 252,653
Cost of sales1) 3 –222,047 –203,322
Gross income 52,070 49,331
Research and development expenses1) 3, 15 –11,446 –10,903
selling expenses 3 –17,287 –17,371
administrative expenses 3 –9,489 –8,001
other operating income 6 3,868 3,386
other operating expenses 6 –3,245 –2,324
share of income in joint ventures and associates 13 –168 67
Operating income 4, 5, 7, 8, 9, 10 14,303 14,185
Financial income 11 575 407
Financial expenses 12 –1,710 –1,675
Income before tax 13,168 12,917
income tax 14 –3,565 –3,136
Net income 9,603 9,781
Net income attributable to
owners of the parent company 7,115 6,840
non-controlling interests 2,488 2,941
9,603 9,781
1) Reclassification of research and development expenses to Cost of sales amounted to mseK 1,195 in full year 2018.
Consolidated Income Statements
INCOME AND RESULTVolvo Cars revenue increased by 8.5 per cent to mseK 274,117 (252,653), from growth in all regions and significantly increased vol-umes in markets such as China, Us, Germany, UK and Belgium. Wholesales increased by 7.1 per cent to 703,534 (656,688) units, mainly driven by the XC40. the positive sales development and the increased demand for the XC model range, however continuously effected by price pressure in certain markets, was reflected in vol-ume, sales mix and pricing, which contributed to revenue with mseK10,670. sold licences decreased by mseK 894, while other reve-nue, such as rentals, used car sales as well as parts and accessories, increased by mseK 3,155. the exchange rate effect in revenue amounted to mseK 8,533.
Gross income increased to mseK 52,070 (49,331), resulting in a gross margin of 19.0 (19.5) per cent. operational efficiencies, such as material cost improvements, freight and labour and overhead effi-ciencies, have had a positive effect on cost of sales. the increase in cost of sales to mseK –222,047 (–203,322), was mainly related to a higher production volume and increasing demand for the XC model range, and a negative foreign exchange rate impact in cost of sales of mseK –8,164. the net effect of foreign exchange rate in gross income was positive and amounted to mseK 369 and the decreased gross income effect from licence sales amounted to mseK 894. Consequently, the main reason for the decrease in gross margin was the continuous price competition in certain markets and lower licence sales.
Research and development expenses increased to mseK –11,446 (–10,903). the increase was driven by continuous investments in electrification, connectivity and new car models. For details regard-ing research and development expenses, see table below.
selling and administrative expenses increased to mseK –26,776 (–25,372). the increase was mainly driven by administrative expenses of mseK –9,489 (–8,001) related to personnel costs as well as increased expenses for digitalisation. selling expenses were in line with 2018 and amounted to mseK –17,287 (–17,371).
other operating income and expense, net, amounted to mseK 623 (1,062). the decrease was mainly related to costs for early phase-out of certain components, partly offset by foreign exchange rate effects on operating assets and liabilities of mseK 537 (62).
operating income (eBit) increased slightly compared to last year to mseK 14,303 (14,185). the eBit margin decreased to 5.2 (5.6) per cent. While the eBit in the prior year was positively affected by a higher level of received government grants and licences, the increase during this year was a result of strong growth in volume, and a more favourable market and model mix, as well as operational effi-ciencies. since the announcement in april 2019, to implement cost efficiency measurements, the number of consultants and full-time employees has been reduced by around 900. the full financial impact is expected to come in 2020 as, on average, the number of full-time employees in 2019 was at the same level as in 2018. the net effect of foreign exchange rate in eBit was mseK –125.
net financial items amounted to mseK –1,135 (–1,268). the effective tax rate increased to 27.1 (24.3) per cent mainly due
to allocation of taxable profits between different jurisdictions and adjustments related to prior years.
net income amounted to mseK 9,603 (9,781). net income in relation to revenue was 3.5 (3.9) per cent.
Research and development spending, MSEK 2019 2018
Research and development spending –14,662 –12,816
Capitalised development costs 8,088 6,476
amortisation and depreciation of Research and development –4,872 –4,563
Research and development expenses –11,446 –10,903
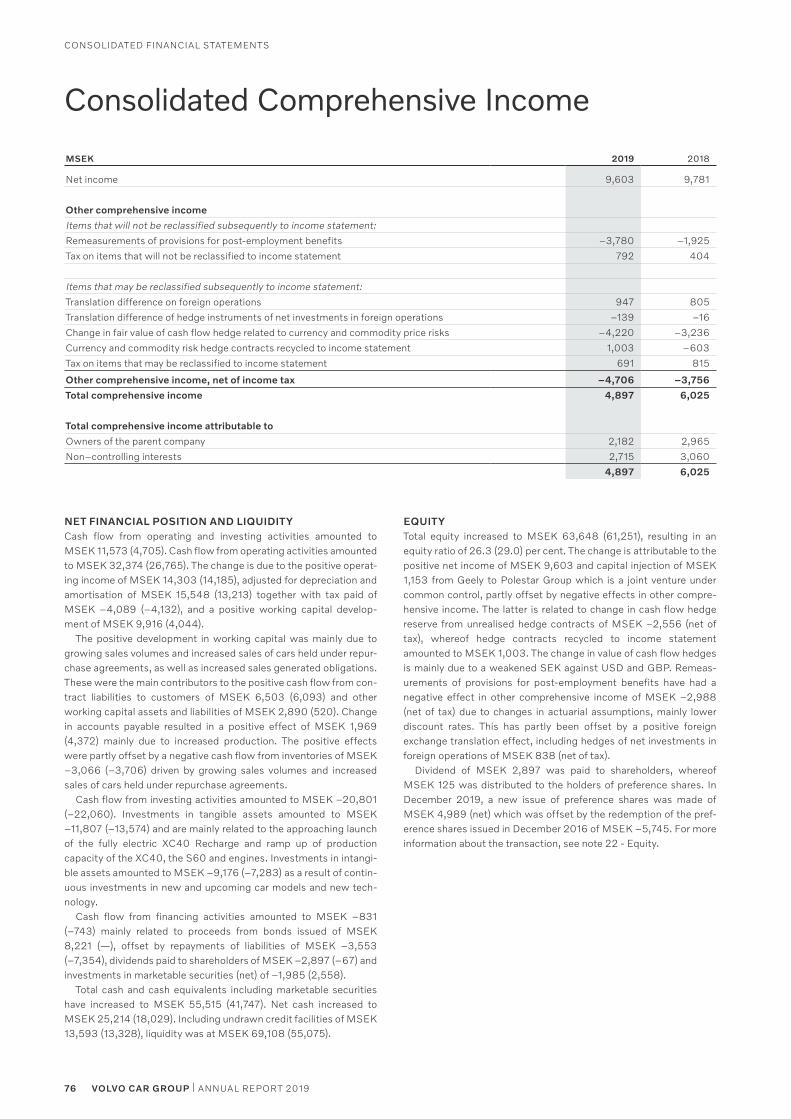
76 VOLVO CAR GROUP | ANNUAL REPORT 2019
Consolidated FinanCial statements
MSEK 2019 2018
net income 9,603 9,781
Other comprehensive income
items that will not be reclassified subsequently to income statement:
Remeasurements of provisions for post-employment benefits –3,780 –1,925
tax on items that will not be reclassified to income statement 792 404
items that may be reclassified subsequently to income statement:
translation difference on foreign operations 947 805
translation difference of hedge instruments of net investments in foreign operations –139 –16
Change in fair value of cash flow hedge related to currency and commodity price risks –4,220 –3,236
Currency and commodity risk hedge contracts recycled to income statement 1,003 –603
tax on items that may be reclassified to income statement 691 815
Other comprehensive income, net of income tax –4,706 –3,756
Total comprehensive income 4,897 6,025
Total comprehensive income attributable to
owners of the parent company 2,182 2,965
non–controlling interests 2,715 3,060
4,897 6,025
Consolidated Comprehensive Income
NET FINANCIAL POSITION AND LIQUIDITYCash flow from operating and investing activities amounted to mseK 11,573 (4,705). Cash flow from operating activities amounted to mseK 32,374 (26,765). the change is due to the positive operat-ing income of mseK 14,303 (14,185), adjusted for depreciation and amortisation of mseK 15,548 (13,213) together with tax paid of mseK –4,089 (–4,132), and a positive working capital develop-ment of mseK 9,916 (4,044).
the positive development in working capital was mainly due to growing sales volumes and increased sales of cars held under repur-chase agreements, as well as increased sales generated obligations. these were the main contributors to the positive cash flow from con-tract liabilities to customers of mseK 6,503 (6,093) and other working capital assets and liabilities of mseK 2,890 (520). Change in accounts payable resulted in a positive effect of mseK 1,969 (4,372) mainly due to increased production. the positive effects were partly offset by a negative cash flow from inventories of mseK –3,066 (–3,706) driven by growing sales volumes and increased sales of cars held under repurchase agreements.
Cash flow from investing activities amounted to mseK –20,801 (–22,060). investments in tangible assets amounted to mseK –11,807 (–13,574) and are mainly related to the approaching launch of the fully electric XC40 Recharge and ramp up of production capacity of the XC40, the s60 and engines. investments in intangi-ble assets amounted to mseK –9,176 (–7,283) as a result of contin-uous investments in new and upcoming car models and new tech-nology.
Cash flow from financing activities amounted to mseK –831 (–743) mainly related to proceeds from bonds issued of mseK 8,221 (—), offset by repayments of liabilities of mseK –3,553 (–7,354), dividends paid to shareholders of mseK –2,897 (–67) and investments in marketable securities (net) of –1,985 (2,558).
total cash and cash equivalents including marketable securities have increased to mseK 55,515 (41,747). net cash increased to mseK 25,214 (18,029). including undrawn credit facilities of mseK 13,593 (13,328), liquidity was at mseK 69,108 (55,075).
EQUITYtotal equity increased to mseK 63,648 (61,251), resulting in an equity ratio of 26.3 (29.0) per cent. the change is attributable to the positive net income of mseK 9,603 and capital injection of mseK 1,153 from Geely to Polestar Group which is a joint venture under common control, partly offset by negative effects in other compre-hensive income. the latter is related to change in cash flow hedge reserve from unrealised hedge contracts of mseK –2,556 (net of tax), whereof hedge contracts recycled to income statement amounted to mseK 1,003. the change in value of cash flow hedges is mainly due to a weakened seK against Usd and GBP. Remeas-urements of provisions for post-employment benefits have had a negative effect in other comprehensive income of mseK –2,988 (net of tax) due to changes in actuarial assumptions, mainly lower discount rates. this has partly been offset by a positive foreign exchange translation effect, including hedges of net investments in foreign operations of mseK 838 (net of tax).
dividend of mseK 2,897 was paid to shareholders, whereof mseK 125 was distributed to the holders of preference shares. in december 2019, a new issue of preference shares was made of mseK 4,989 (net) which was offset by the redemption of the pref-erence shares issued in december 2016 of mseK –5,745. For more information about the transaction, see note 22 - equity.
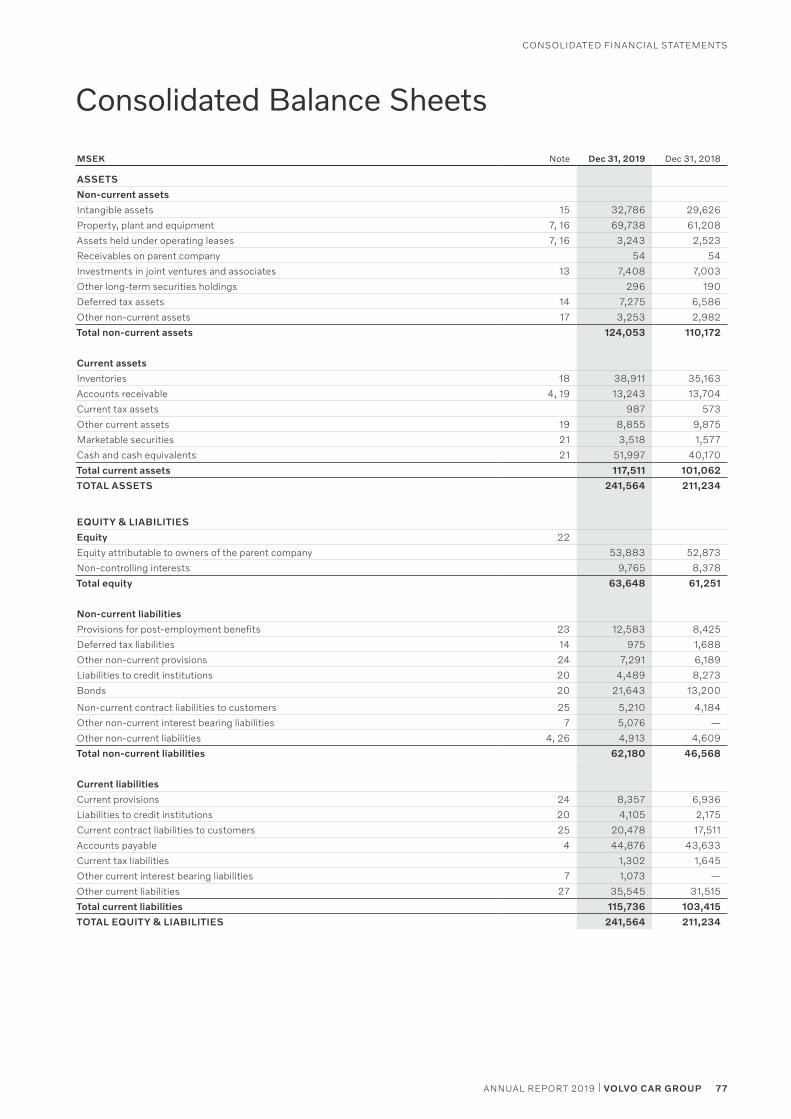
77ANNUAL REPORT 2019 | VOLVO CAR GROUP
Consolidated FinanCial statements
MSEK Note Dec 31, 2019 Dec 31, 2018
ASSETS
Non-current assets
intangible assets 15 32,786 29,626
Property, plant and equipment 7, 16 69,738 61,208
assets held under operating leases 7, 16 3,243 2,523
Receivables on parent company 54 54
investments in joint ventures and associates 13 7,408 7,003
other long-term securities holdings 296 190
deferred tax assets 14 7,275 6,586
other non-current assets 17 3,253 2,982
Total non-current assets 124,053 110,172
Current assets
inventories 18 38,911 35,163
accounts receivable 4, 19 13,243 13,704
Current tax assets 987 573
other current assets 19 8,855 9,875
marketable securities 21 3,518 1,577
Cash and cash equivalents 21 51,997 40,170
Total current assets 117,511 101,062
TOTAL ASSETS 241,564 211,234
EQUITY & LIABILITIES
Equity 22
equity attributable to owners of the parent company 53,883 52,873
non-controlling interests 9,765 8,378
Total equity 63,648 61,251
Non-current liabilities
Provisions for post-employment benefits 23 12,583 8,425
deferred tax liabilities 14 975 1,688
other non-current provisions 24 7,291 6,189
liabilities to credit institutions 20 4,489 8,273
Bonds 20 21,643 13,200
non-current contract liabilities to customers 25 5,210 4,184
other non-current interest bearing liabilities 7 5,076 —
other non-current liabilities 4, 26 4,913 4,609
Total non-current liabilities 62,180 46,568
Current liabilities
Current provisions 24 8,357 6,936
liabilities to credit institutions 20 4,105 2,175
Current contract liabilities to customers 25 20,478 17,511
accounts payable 4 44,876 43,633
Current tax liabilities 1,302 1,645
other current interest bearing liabilities 7 1,073 —
other current liabilities 27 35,545 31,515
Total current liabilities 115,736 103,415
TOTAL EQUITY & LIABILITIES 241,564 211,234
Consolidated Balance Sheets
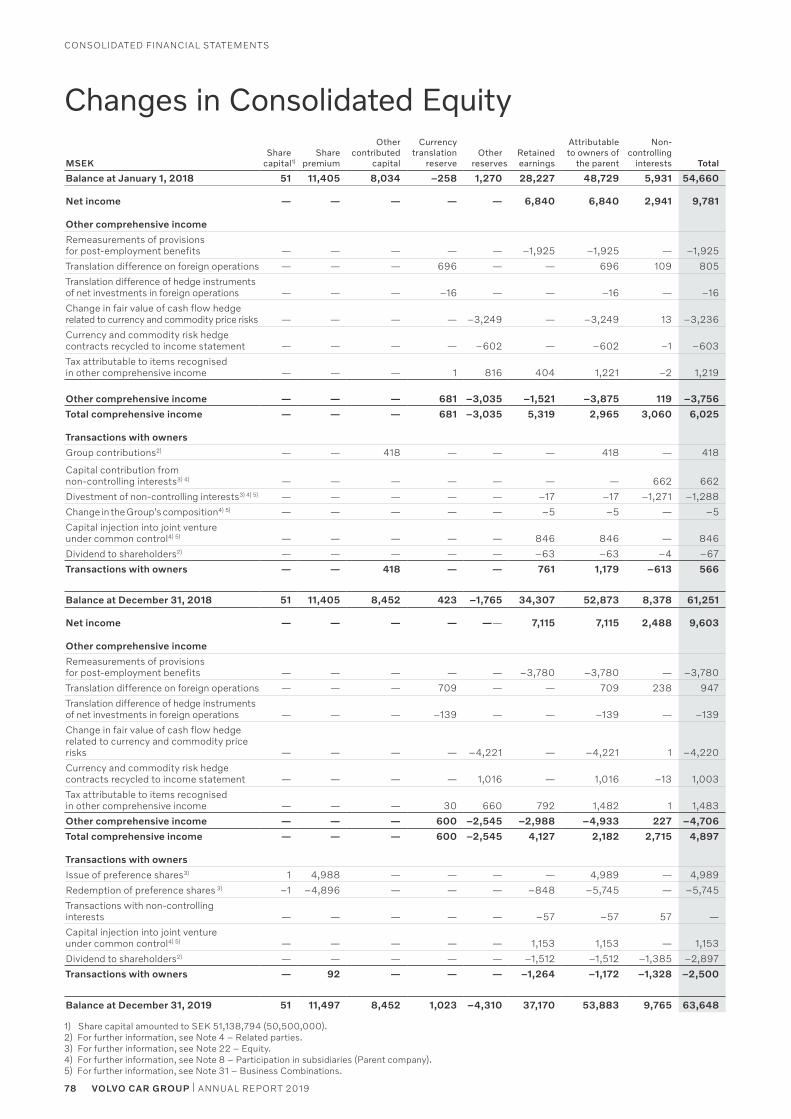
78 VOLVO CAR GROUP | ANNUAL REPORT 2019
Consolidated FinanCial statements
MSEK Share
capital1) Share
premium
Other contributed
capital
Currency translation
reserveOther
reservesRetained earnings
Attributable to owners of
the parent
Non-controlling
interests Total
Balance at January 1, 2018 51 11,405 8,034 –258 1,270 28,227 48,729 5,931 54,660
Net income — — — — — 6,840 6,840 2,941 9,781
Other comprehensive income
Remeasurements of provisions for post-employment benefits — — — — — –1,925 –1,925 — –1,925
translation difference on foreign operations — — — 696 — — 696 109 805
translation difference of hedge instruments of net investments in foreign operations — — — –16 — — –16 — –16
Change in fair value of cash flow hedge related to currency and commodity price risks — — — — –3,249 — –3,249 13 –3,236
Currency and commodity risk hedge contracts recycled to income statement — — — — –602 — –602 –1 –603
tax attributable to items recognised in other comprehensive income — — — 1 816 404 1,221 –2 1,219
Other comprehensive income — — — 681 –3,035 –1,521 –3,875 119 –3,756
Total comprehensive income — — — 681 –3,035 5,319 2,965 3,060 6,025
Transactions with owners
Group contributions2) — — 418 — — — 418 — 418
Capital contribution from non-controlling interests3) 4) — — — — — — — 662 662
divestment of non-controlling interests3) 4) 5) — — — — — –17 –17 –1,271 –1,288
Change in the Group's composition4) 5) — — — — — –5 –5 — –5
Capital injection into joint venture under common control4) 5) — — — — — 846 846 — 846
dividend to shareholders2) — — — — — –63 –63 –4 –67
Transactions with owners — — 418 — — 761 1,179 –613 566
Balance at December 31, 2018 51 11,405 8,452 423 –1,765 34,307 52,873 8,378 61,251
Net income — — — — —— 7,115 7,115 2,488 9,603
Other comprehensive income
Remeasurements of provisions for post-employment benefits — — — — — –3,780 –3,780 — –3,780
translation difference on foreign operations — — — 709 — — 709 238 947
translation difference of hedge instruments of net investments in foreign operations — — — –139 — — –139 — –139
Change in fair value of cash flow hedge related to currency and commodity price risks — — — — –4,221 — –4,221 1 –4,220
Currency and commodity risk hedge contracts recycled to income statement — — — — 1,016 — 1,016 –13 1,003
tax attributable to items recognised in other comprehensive income — — — 30 660 792 1,482 1 1,483
Other comprehensive income — — — 600 –2,545 –2,988 –4,933 227 –4,706
Total comprehensive income — — — 600 –2,545 4,127 2,182 2,715 4,897
Transactions with owners
issue of preference shares3) 1 4,988 — — — — 4,989 — 4,989
Redemption of preference shares 3) –1 –4,896 — — — –848 –5,745 — –5,745
transactions with non-controlling interests — — — — — –57 –57 57 —
Capital injection into joint venture under common control4) 5) — — — — — 1,153 1,153 — 1,153
dividend to shareholders2) — — — — — –1,512 –1,512 –1,385 –2,897
Transactions with owners — 92 — — — –1,264 –1,172 –1,328 –2,500
Balance at December 31, 2019 51 11,497 8,452 1,023 –4,310 37,170 53,883 9,765 63,648
1) share capital amounted to seK 51,138,794 (50,500,000).2) For further information, see note 4 – Related parties.3) For further information, see note 22 – equity.4) For further information, see note 8 – Participation in subsidiaries (Parent company).5) For further information, see note 31 – Business Combinations.
Changes in Consolidated Equity
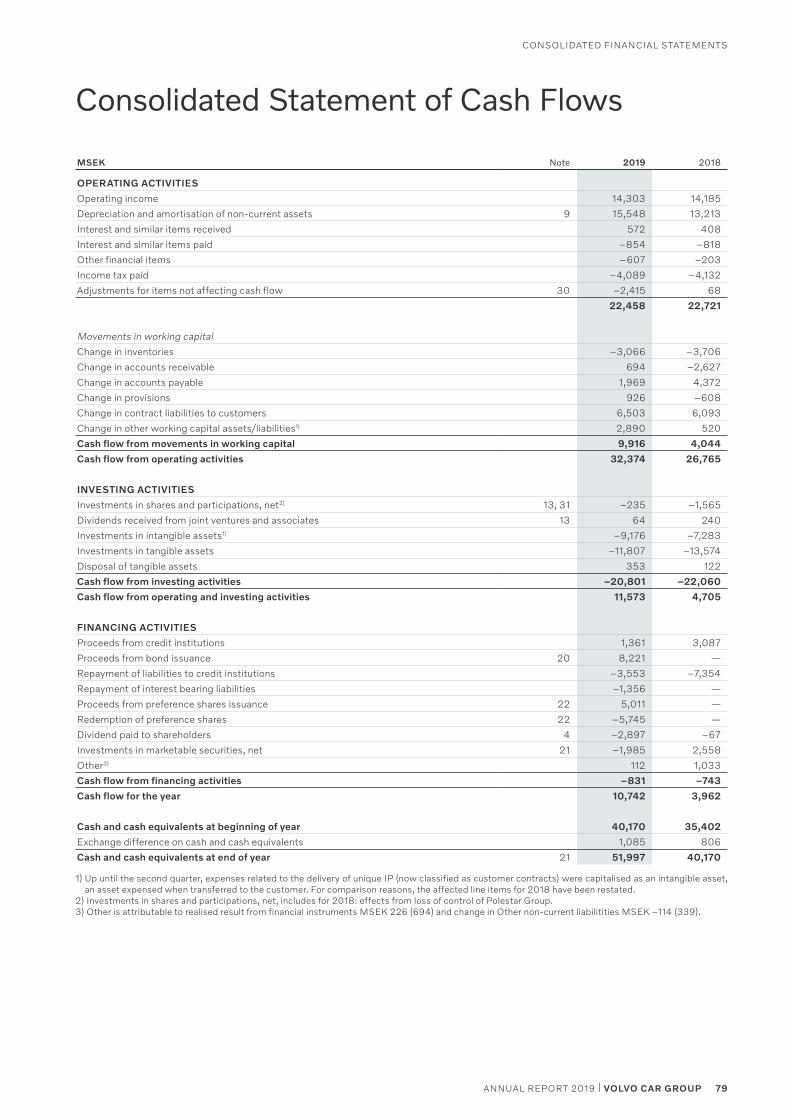
79ANNUAL REPORT 2019 | VOLVO CAR GROUP
Consolidated FinanCial statements
MSEK Note 2019 2018
OPERATING ACTIVITIES
operating income 14,303 14,185
depreciation and amortisation of non-current assets 9 15,548 13,213
interest and similar items received 572 408
interest and similar items paid –854 –818
other financial items –607 –203
income tax paid –4,089 –4,132
adjustments for items not affecting cash flow 30 –2,415 68
22,458 22,721
movements in working capital
Change in inventories –3,066 –3,706
Change in accounts receivable 694 –2,627
Change in accounts payable 1,969 4,372
Change in provisions 926 –608
Change in contract liabilities to customers 6,503 6,093
Change in other working capital assets/liabilities1) 2,890 520
Cash flow from movements in working capital 9,916 4,044
Cash flow from operating activities 32,374 26,765
INVESTING ACTIVITIES
investments in shares and participations, net2) 13, 31 –235 –1,565
dividends received from joint ventures and associates 13 64 240
investments in intangible assets1) –9,176 –7,283
investments in tangible assets –11,807 –13,574
disposal of tangible assets 353 122
Cash flow from investing activities –20,801 –22,060
Cash flow from operating and investing activities 11,573 4,705
FINANCING ACTIVITIES
Proceeds from credit institutions 1,361 3,087
Proceeds from bond issuance 20 8,221 —
Repayment of liabilities to credit institutions –3,553 –7,354
Repayment of interest bearing liabilities –1,356 —
Proceeds from preference shares issuance 22 5,011 —
Redemption of preference shares 22 –5,745 —
dividend paid to shareholders 4 –2,897 –67
investments in marketable securities, net 21 –1,985 2,558
other3) 112 1,033
Cash flow from financing activities –831 –743
Cash flow for the year 10,742 3,962
Cash and cash equivalents at beginning of year 40,170 35,402
exchange difference on cash and cash equivalents 1,085 806
Cash and cash equivalents at end of year 21 51,997 40,170
1) Up until the second quarter, expenses related to the delivery of unique iP (now classified as customer contracts) were capitalised as an intangible asset, an asset expensed when transferred to the customer. For comparison reasons, the affected line items for 2018 have been restated.
2) investments in shares and participations, net, includes for 2018: effects from loss of control of Polestar Group.3) other is attributable to realised result from financial instruments mseK 226 (694) and change in other non-current liabilitities mseK –114 (339).
Consolidated Statement of Cash Flows
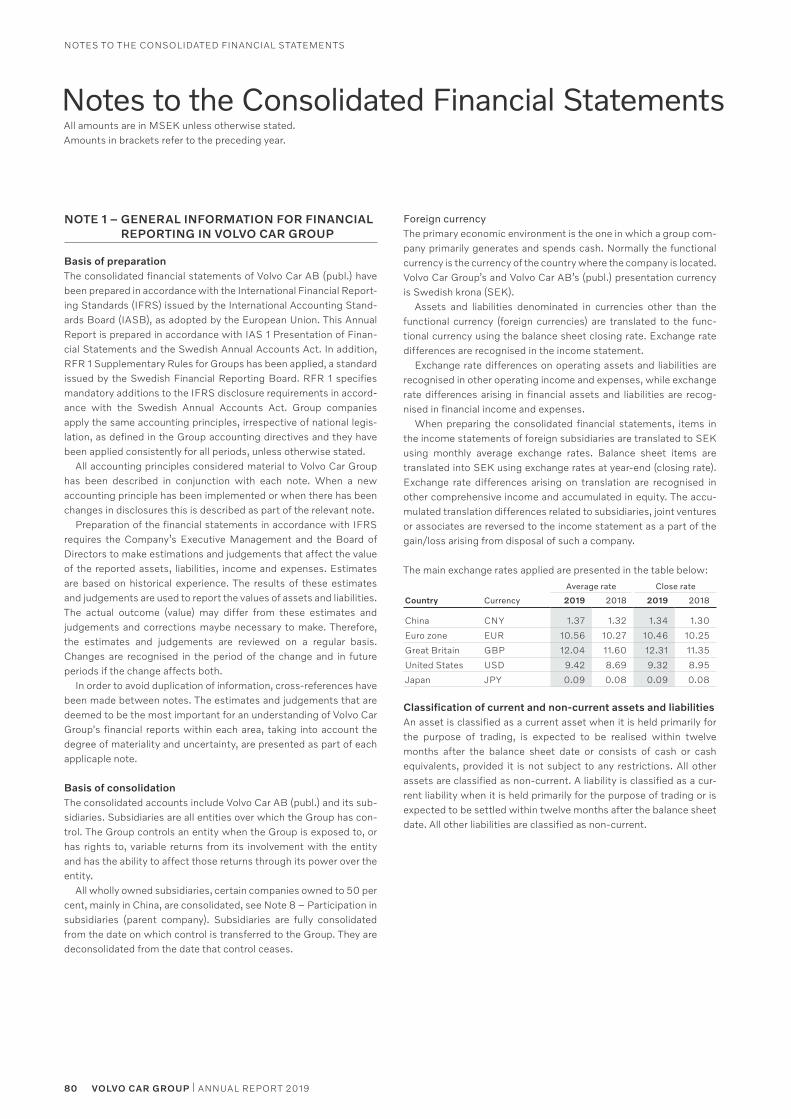
NOTE 1 – GENERAL INFORMATION FOR FINANCIAL REPORTING IN VOLVO CAR GROUP
Basis of preparationThe consolidated financial statements of Volvo Car AB (publ.) have been prepared in accordance with the International Financial Report-ing Standards (IFRS) issued by the International Accounting Stand-ards Board (IASB), as adopted by the European Union. This Annual Report is prepared in accordance with IAS 1 Presentation of Finan-cial Statements and the Swedish Annual Accounts Act. In addition, RFR 1 Supplementary Rules for Groups has been applied, a standard issued by the Swedish Financial Reporting Board. RFR 1 specifies mandatory additions to the IFRS disclosure requirements in accord-ance with the Swedish Annual Accounts Act. Group companies apply the same accounting principles, irrespective of national legis-lation, as defined in the Group accounting directives and they have been applied consistently for all periods, unless otherwise stated.
All accounting principles considered material to Volvo Car Group has been described in conjunction with each note. When a new accounting principle has been implemented or when there has been changes in disclosures this is described as part of the relevant note.
Preparation of the financial statements in accordance with IFRS requires the Company’s Executive Management and the Board of Directors to make estimations and judgements that affect the value of the reported assets, liabilities, income and expenses. Estimates are based on historical experience. The results of these estimates and judgements are used to report the values of assets and liabilities. The actual outcome (value) may differ from these estimates and judgements and corrections maybe necessary to make. Therefore, the estimates and judgements are reviewed on a regular basis. Changes are recognised in the period of the change and in future periods if the change affects both.
In order to avoid duplication of information, cross-references have been made between notes. The estimates and judgements that are deemed to be the most important for an understanding of Volvo Car Group's financial reports within each area, taking into account the degree of materiality and uncertainty, are presented as part of each applicaple note.
Basis of consolidationThe consolidated accounts include Volvo Car AB (publ.) and its sub-sidiaries. Subsidiaries are all entities over which the Group has con-trol. The Group controls an entity when the Group is exposed to, or has rights to, variable returns from its involvement with the entity and has the ability to affect those returns through its power over the entity.
All wholly owned subsidiaries, certain companies owned to 50 per cent, mainly in China, are consolidated, see Note 8 – Participation in subsidiaries (parent company). Subsidiaries are fully consolidated from the date on which control is transferred to the Group. They are deconsolidated from the date that control ceases.
Notes to the Consolidated Financial Statements All amounts are in MSEK unless otherwise stated. Amounts in brackets refer to the preceding year.
Foreign currencyThe primary economic environment is the one in which a group com-pany primarily generates and spends cash. Normally the functional currency is the currency of the country where the company is located. Volvo Car Group’s and Volvo Car AB’s (publ.) presentation currency is Swedish krona (SEK).
Assets and liabilities denominated in currencies other than the functional currency (foreign currencies) are translated to the func-tional currency using the balance sheet closing rate. Exchange rate differences are recognised in the income statement.
Exchange rate differences on operating assets and liabilities are recognised in other operating income and expenses, while exchange rate differences arising in financial assets and liabilities are recog-nised in financial income and expenses.
When preparing the consolidated financial statements, items in the income statements of foreign subsidiaries are translated to SEK using monthly average exchange rates. Balance sheet items are translated into SEK using exchange rates at year-end (closing rate). Exchange rate differences arising on translation are recognised in other comprehensive income and accumulated in equity. The accu-mulated translation differences related to subsidiaries, joint ventures or associates are reversed to the income statement as a part of the gain/loss arising from disposal of such a company.
The main exchange rates applied are presented in the table below:
Average rate Close rate
Country Currency 2019 2018 2019 2018
China CNY 1.37 1.32 1.34 1.30
Euro zone EUR 10.56 10.27 10.46 10.25
Great Britain GBP 12.04 11.60 12.31 11.35
United States USD 9.42 8.69 9.32 8.95
Japan JPY 0.09 0.08 0.09 0.08
Classification of current and non-current assets and liabilities An asset is classified as a current asset when it is held primarily for the purpose of trading, is expected to be realised within twelve months after the balance sheet date or consists of cash or cash equivalents, provided it is not subject to any restrictions. All other assets are classified as non-current. A liability is classified as a cur-rent liability when it is held primarily for the purpose of trading or is expected to be settled within twelve months after the balance sheet date. All other liabilities are classified as non-current.
80 VOLVO CAR GROUP | ANNUAL REPORT 2019
NOTES TO THE CONSOLIDATED FINANCIAL STATEMENTS
NOTE 2 – REVENUE
ACCOUNTING PRINCIPLES
Revenue is defined as the sales price for goods or services net of variable considerations, for instance discounts and variable market-ing expenses.
Revenue is recognised when the customer obtains control of a delivered good or service, and thus has the ability to direct the use and obtain the benefits from the goods or services. Revenue could either be recognised at a point in time or over time depending on the applied business model. The sale of goods or services will sometime give rise to the recognition of contract liabilities to customers. These liabilities are recognised when Volvo Car Group are obligated to transfer goods or services for which consideration is already received. Contract liabilities to customers include sales generated obligations, deferred revenue from extended service business, sales with repurchase commitments as well as advance payments from customers.
Revenue from sale of goodsRevenue is recognised when the customer has gained control over the goods according to agreed contract terms. At the point of reve-nue recognition, there are normally no material unfulfilled obligations that could affect the customer's acceptance. If the customer con-tracts include variable considerations the revenue recognised will be effected. In the case of volume discounts that are triggered over time a contract liability will be recognised. This is as well the case for other variable considerations, like incentive programmes and varia-ble marketing expenses.
Revenue from sale of a vehicle to a customer, where there is a residual value guarantee issued to an independent financing pro-vider, is recognised at the time of sale, less an amount corresponding to the estimated residual value risk. The estimated residual value risk remaining at the Group is classified and recognised as a contract liability, see Note 25 – Current and non-current contract liabilities to customers. Revenue is only recognised provided that transfer of con-trol over the vehicle can be confirmed.
Revenue from sale of a vehicle to a customer combined with a repurchase commitment (the right or obligation (put option) to buy back the car) is recognised over the contract period as if it were an operating lease contract. This is based on the fact that the customer has not obtained the control of the vehicle. Based on historical expe-rience a majority of customers use the put option at the end of the contract period. During the contract period the cars are recognised on the balance sheet and are depreciated to the estimated residual value, see Note 9 – Depreciation and amortisation. The useful life of the asset and the corresponding residual value is monitored closely and changed if necessary, see Note 18 – Inventories and Note 16 –Tangible assets. Liabilities related to repurchase commitments are recognised as other non-current and other current liabilities, refer to Note 26 – Other non-current liabilities and Note 27 – Other current liabilities.
Revenue from sale of servicesVolvo Car Group sells services in the form of maintenance contracts and extended warranties to end customers. Income from these sales is deferred and revenue recognised on a straight-line basis over the contract period. The deferred revenue is presented as contract liabil-ities to customers, since the customers payment is made before the service is transferred. When an extended warranty contract is included in the sales price of the car, and the inclusion in the contract is assessed to be common practice in the market, such extended warranty costs is recognised as a provision. This warranty is not rec-ognised as a separate performance obligation.
Where an extended warranty is included in the sale of a car and the offer goes beyond common practice in the market, it is accounted for as a separate performance obligation; a stand-alone selling price is identified, and revenue is recognised on a straight-line basis over the contract period. The stand-alone selling price is not directly observ-able, why the price in general is estimated based on expected cost plus a reasonable margin.
Revenue from sale of licences Revenue from the sale of licences is recognised at a point in time or over time, depending on whether the sold licence gives the customer a right to use or a right to access the underlying asset. Volvo Car Group sells both types of licences and revenue is therefore recog-nised in accordance with the substance of the relevant agreement. Income from sold licenses related to intellectual property (IP) and other developed technology is classified as revenue.
Revenue from subscription, leasing and rental businessRevenue from subscription, leasing and rental business is recog-nised as revenue on a straight-line basis over the contract period. Revenues related to an operating lease arrangement are recognised as revenue on a straight-line basis over the leasing period.
CRITICAL ACCOUNTING ESTIMATES AND JUDGEMENTS
Variable consideration The inherent risk with regards to different forms of variable consider-ations is that recognised revenue has to be reversed in future periods as an effect of not allocating a correct part of the transaction price to the variable consideration part. As a direct effect of this, Volvo Car Group is prudent in the judgement of variable considerations, in order to minimise the risk of reversal, that is, rather overstating the contract liabilities than overstating revenue. Variable considerations could be paid out in the future or it could be reversed in the income statement.
Volume discountsCars may be sold with volume discounts based on aggregate sales over a 3–12 months period. Revenue from these sales is recognised based on the price specified in the contract, adjusted for volume dis-counts for the whole contract period. Accumulated historical experi-ence is used to estimate and calculate the total discount. A contract liability is recognised for expected volume discounts to customers in relation to sales made until the end of the reporting period.
Residual value guaranteesVolvo Car Group is exposed to residual value risks, meaning that there is a potential loss for Volvo Car Group if the future market value of a used car is lower than the guaranteed value of the car according to the contract. This potential negative effect is recognised as a con-tract liability and the future market value of cars is monitored individ-ually on a continuing basis. An estimate is made based on evaluating recent car auction values, future price deterioration due to expected change of market conditions, vehicle quality data and repair and reconditioning costs etc.
Repurchase CommitmentCars sold with a repurchase obligation are recognised in the balance sheet as assets under operating leases or inventories depending on the contract period. Volvo Car Group is exposed to a risk (in principle the same risk as for contracts including residual value guarantees). During the contract period there is risk for a potential loss for Volvo Car Group as the estimated value of the car is or might be lower than the market value at the time. This potential negative effect is recog-
81ANNUAL REPORT 2019 | VOLVO CAR GROUP
NOTES TO THE CONSOLIDATED FINANCIAL STATEMENTS
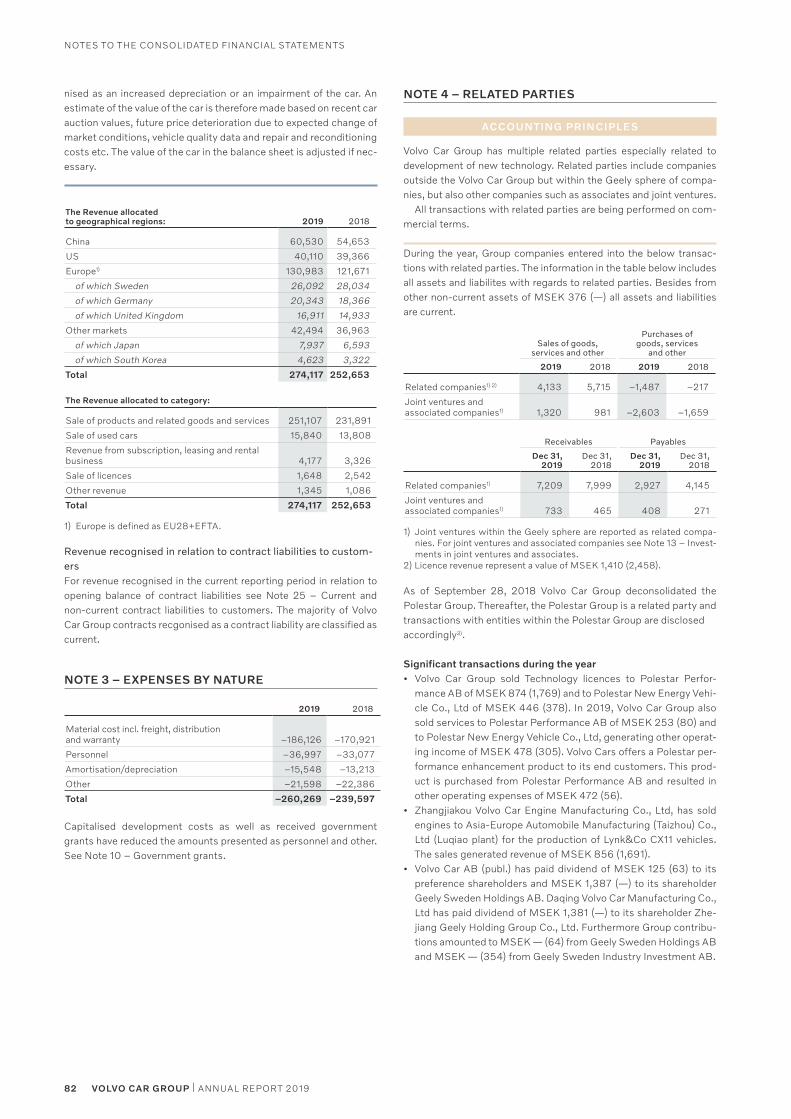
nised as an increased depreciation or an impairment of the car. An estimate of the value of the car is therefore made based on recent car auction values, future price deterioration due to expected change of market conditions, vehicle quality data and repair and reconditioning costs etc. The value of the car in the balance sheet is adjusted if nec-essary.
The Revenue allocated to geographical regions: 2019 2018
China 60,530 54,653
US 40,110 39,366
Europe1) 130,983 121,671
of which Sweden 26,092 28,034
of which Germany 20,343 18,366
of which United Kingdom 16,911 14,933
Other markets 42,494 36,963
of which Japan 7,937 6,593
of which South Korea 4,623 3,322
Total 274,117 252,653
The Revenue allocated to category:
Sale of products and related goods and services 251,107 231,891
Sale of used cars 15,840 13,808
Revenue from subscription, leasing and rental business 4,177 3,326
Sale of licences 1,648 2,542
Other revenue 1,345 1,086
Total 274,117 252,653
1) Europe is defined as EU28+EFTA.
Revenue recognised in relation to contract liabilities to custom-ersFor revenue recognised in the current reporting period in relation to opening balance of contract liabilities see Note 25 – Current and non-current contract liabilities to customers. The majority of Volvo Car Group contracts recgonised as a contract liability are classified as current.
NOTE 3 – EXPENSES BY NATURE
2019 2018
Material cost incl. freight, distribution and warranty –186,126 –170,921
Personnel –36,997 –33,077
Amortisation/depreciation –15,548 –13,213
Other –21,598 –22,386
Total –260,269 –239,597
Capitalised development costs as well as received government grants have reduced the amounts presented as personnel and other. See Note 10 – Government grants.
NOTE 4 – RELATED PARTIES
ACCOUNTING PRINCIPLES
Volvo Car Group has multiple related parties especially related to development of new technology. Related parties include companies outside the Volvo Car Group but within the Geely sphere of compa-nies, but also other companies such as associates and joint ventures.
All transactions with related parties are being performed on com-mercial terms.
During the year, Group companies entered into the below transac-tions with related parties. The information in the table below includes all assets and liabilites with regards to related parties. Besides from other non-current assets of MSEK 376 (—) all assets and liabilities are current.
Sales of goods, services and other
Purchases of goods, services
and other
2019 2018 2019 2018
Related companies1) 2) 4,133 5,715 –1,487 –217
Joint ventures and associated companies1) 1,320 981 –2,603 –1,659
Receivables Payables
Dec 31, 2019
Dec 31, 2018
Dec 31, 2019
Dec 31, 2018
Related companies1) 7,209 7,999 2,927 4,145
Joint ventures and associated companies1) 733 465 408 271
1) Joint ventures within the Geely sphere are reported as related compa-nies. For joint ventures and associated companies see Note 13 – Invest-ments in joint ventures and associates.
2) Licence revenue represent a value of MSEK 1,410 (2,458).
As of September 28, 2018 Volvo Car Group deconsolidated the Polestar Group. Thereafter, the Polestar Group is a related party and transactions with entities within the Polestar Group are disclosed accordingly3).
Significant transactions during the year• Volvo Car Group sold Technology licences to Polestar Perfor-
mance AB of MSEK 874 (1,769) and to Polestar New Energy Vehi-cle Co., Ltd of MSEK 446 (378). In 2019, Volvo Car Group also sold services to Polestar Performance AB of MSEK 253 (80) and to Polestar New Energy Vehicle Co., Ltd, generating other operat-ing income of MSEK 478 (305). Volvo Cars offers a Polestar per-formance enhancement product to its end customers. This prod-uct is purchased from Polestar Performance AB and resulted in other operating expenses of MSEK 472 (56).
• Zhangjiakou Volvo Car Engine Manufacturing Co., Ltd, has sold engines to Asia-Europe Automobile Manufacturing (Taizhou) Co., Ltd (Luqiao plant) for the production of Lynk&Co CX11 vehicles. The sales generated revenue of MSEK 856 (1,691).
• Volvo Car AB (publ.) has paid dividend of MSEK 125 (63) to its preference shareholders and MSEK 1,387 (—) to its shareholder Geely Sweden Holdings AB. Daqing Volvo Car Manufacturing Co., Ltd has paid dividend of MSEK 1,381 (—) to its shareholder Zhe-jiang Geely Holding Group Co., Ltd. Furthermore Group contribu-tions amounted to MSEK — (64) from Geely Sweden Holdings AB and MSEK — (354) from Geely Sweden Industry Investment AB.
82 VOLVO CAR GROUP | ANNUAL REPORT 2019
NOTES TO THE CONSOLIDATED FINANCIAL STATEMENTS
Significant transactions in previous years• In 2016, Volvo Car Group entered into an agreement with Asia-Eu-
rope Automobile Manufacturing (Taizhou) Co., Ltd, the Luqiao plant that produces the range of smaller 40-series CMA-based cars. The plant is owned by Zhejiang Geely Holding Group Co., Ltd but is operated by Volvo Car Group. The agreement covers sup-port service for operating the plant and resulted 2019 in other income of MSEK 356 (307).
• In 2017, Volvo Car Group signed a licence agreement with London Taxi Co., Ltd, a wholly owned subsidiary to Zhejiang Geely Holding Group Co., Ltd, which has resulted in an income during 2019 of MSEK — (300).
During 2019 Volvo Personvagnar AB has sold shares in the company PSINV AB to certain members of EMT to a value of MSEK 38.
With the exception of above described transaction Volvo Car Group does not engage in any transactions with Board Members or senior executives except remuneration for services and the share-based programme as described in Note 8 – Employees and remu-neration.
3) See the Note 31 – Business combinations and Note 8 – Participation in subsidiaries (Parent company).
NOTE 5 – AUDIT FEES2019 2018
Deloitte
Audit fees –37 –34
Audit-related fees –5 –18
Tax services –4 –2
Other services –5 –12
Total –51 –66
Audit fees involve audit of the Annual Report, interim report and the administration by the Board of Directors and the Managing Direc-tors. The audit also includes advice and assistance as a result of the observations made in connection with the audit.
Audit-related fees refer to other assignments to ensure quality in the financial statements including consultations on reporting requirements and internal control.
Tax services include tax-related advisory.
All other work performed by the auditor is defined as other services.
NOTE 6 – OTHER OPERATING INCOME AND EXPENSES
2019 2018
Other operating income
Foreign exchange rate gains 537 62
Sold services 1,379 1,117
Government grants 633 776
Other 1,319 1,431
Total 3,868 3,386
2019 2018
Other operating expenses
Amortisation and depreciation of intangible and tangible assets –244 –229
Royalty –916 –826
Property tax –109 –109
Other –1,976 –1,160
Total –3,245 –2,324
83ANNUAL REPORT 2019 | VOLVO CAR GROUP
NOTES TO THE CONSOLIDATED FINANCIAL STATEMENTS
NOTE 7 – LEASING
ACCOUNTING PRINCIPLES
As of January 1, 2019 IFRS 16 – Leasing has been applied. IAS 17 has been applied for 2018.
Change in accounting principle and disclosures IFRS 16 – Leasing was endorsed by the EU in November 2017 and replaced IAS 17 Leases. IFRS 16 represents a new framework for how to account for and disclose leasing contracts. For lessees, the new standard has had an impact on the financial statements, as most of the leases previously have been accounted for off-balance sheet, operating leases have been recognised on the balance sheet. For lessors, IFRS 16 does not contain substantial changes compared to IAS 17. The lessor still has to classify leases as either finance or operating leases, depending on whether substantially all of the risk and rewards associated with ownership of the underlying asset has been transferred.
In order to implement IFRS 16, Volvo Car Group has analysed all significant contracts where Volvo Car Group is the lessee focusing on the following areas: asset category, contract length, number of leased items, if the contract includes service or maintenance fees and how many short-term leases and/or leases of low value assets there are. Volvo Car Group has defined low value assets as asset classes that are typically of low value, for example small IT equip-ment (cell-phones, laptops, computers, printers) and office furniture. Short-term leases are leases with a lease term of twelve months or less.
The following conclusions have been made:
• The major leasing commitments consist of land and buildings and machinery and equipment as follows: land and buildings 80 per cent and machinery and equipment 19 per cent.
• Low value assets are common within the Group but represent less than 1 per cent of the total remaining leasing commitments.
• Short-term leases are not common since the majority of the leas-ing agreements have a minimum leasing term of more than twelve months.
• The leasing period for larger real estate contracts has taken into consideration extension options.
Volvo Car Group has applied the modified retrospective approach and the comparative information has not been restated. For all asset classes, the Group has recognise the right-of-use assets at an amount equal to the lease liability, adjusted by the amount of any prepaid or accrued lease payments recognised in the balance sheet immediately before the date of initial application. When applying IFRS 16 for the first time, Volvo Car Group has applied relevant prac-tical expedients, that are;
• Leases ending within twelve months from January 1, 2019 has been classified as short-term leases. This means these leases have not been included in the lease liability, but instead accounted for as operating leases.
• Initial direct costs have been excluded from the measurement of the lease liability.
• No hindsight has been applied when determining the lease term for the contract containing options to extend or terminate the lease.
The adoption of IFRS 16 resulted in increased assets of MSEK 6,978 and increased liabilities of MSEK 6,698 as of January 1, 2019. The difference is due to the land-use-rights in China that are prepaid and therefore Volvo Car Group does not recognise a liability for these. The implementation of IFRS 16 has not rendered any change in equity. Further, the implementation has impacted the timing of the expense recognition in the consolidated income statements over the period of the lease and impacted the classification of expenses. The walk from lease commitments for operating lease contracts accord-ing to IAS 17 and the lease liability according to IFRS 16 are pre-sented in the table below.
IAS 17 – applied for year 2018 Volvo Car Group as a lesseeWhen a finance leases, the asset was recognised as a current or non-current asset at the lower of fair value or the present value of the minimum lease payments. The asset was depreciated using the straight-line method over the asset’s useful life or over the term of the lease if this was shorter. The commitment to pay future lease payments was discounted to a net present value and recognised as a current or non-current liability in the balance sheet. The lease pay-ments were allocated between amortisation of liabilities and interest expense.
For operating leases, i.e., when the risks and rewards associated with the ownership of the asset were not transferred to Volvo Car Group, lease payments were expensed as they arose on a straight-line basis over the leasing period.
Volvo Car Group as a lessorVolvo Car Group did not have any finance leases as lessor during 2018.
Sale transactions including repurchase commitments were recog-nised as operating leases. Operating lease contracts with a maturity less or equal to twelve months were recognised as inventory in the balance sheet, see Note 18 – Inventories. Operating lease contracts with a maturity more than twelve months were recognised as Prop-erty, Plant and Equipment, see Note 16 – Tangible assets. These operating leases were mainly related to vehicles sold with repur-chase commitments. The difference between the original sales price and the repurchase price was recognised in the income statement as revenue on a straight-line basis over the lease term, see Note 2 – Revenue. The remaining lease revenue to be recognised was pre-sented as part of current and non-current contract liabilities to cus-tomers in the balance sheet, see Note 25 – Current and non-current contract liabilities to customers. The repurchase obligation was considered to be a financial liability and was classified as Other non-current liabilities, see Note 26 and Other current liabilities, see Note 27.
IFRS 16 – Information on the transition to the new leasing standard
Lease commitments for operational lease contracts as of December 31, 2018 5,818
Discounted with the Group's average incremental borrowing rate 2,5 % –1,131
Include liabilities for financial lease contracts as of December 31, 2018 113
Exclude short-term lease contracts with a lease term of 12 months or less as they are expensed on a linear basis –390
Exclude lease contracts for which the underlying asset is of low value and therefore expensed on a linear basis –53
Exclude lease contracts that have been classified as service agreements —
Include/exclude adjustments due to different handling of options to extend or terminate agreements 2,335
Include/exclude adjustments due to changes in index or price attributable to variable lease payments 6
Lease liability as of January 1, 2019 6,698
84 VOLVO CAR GROUP | ANNUAL REPORT 2019
NOTES TO THE CONSOLIDATED FINANCIAL STATEMENTS
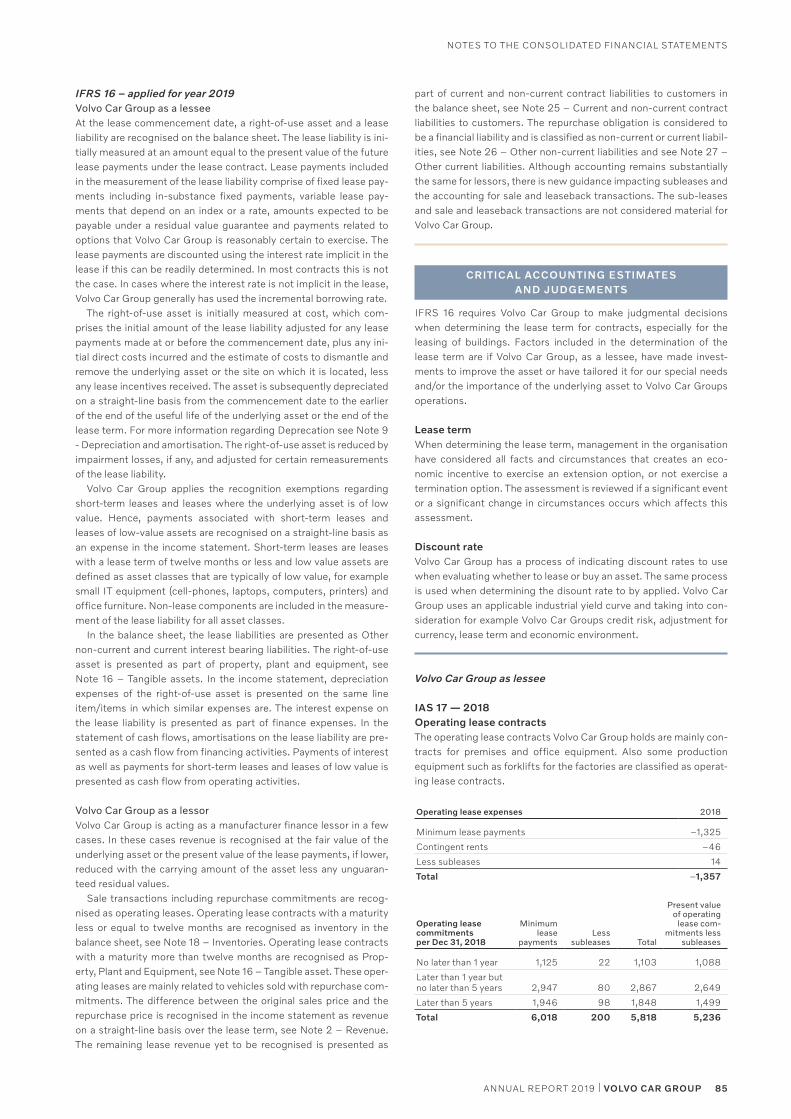
IFRS 16 – applied for year 2019Volvo Car Group as a lessee At the lease commencement date, a right-of-use asset and a lease liability are recognised on the balance sheet. The lease liability is ini-tially measured at an amount equal to the present value of the future lease payments under the lease contract. Lease payments included in the measurement of the lease liability comprise of fixed lease pay-ments including in-substance fixed payments, variable lease pay-ments that depend on an index or a rate, amounts expected to be payable under a residual value guarantee and payments related to options that Volvo Car Group is reasonably certain to exercise. The lease payments are discounted using the interest rate implicit in the lease if this can be readily determined. In most contracts this is not the case. In cases where the interest rate is not implicit in the lease, Volvo Car Group generally has used the incremental borrowing rate.
The right-of-use asset is initially measured at cost, which com-prises the initial amount of the lease liability adjusted for any lease payments made at or before the commencement date, plus any ini-tial direct costs incurred and the estimate of costs to dismantle and remove the underlying asset or the site on which it is located, less any lease incentives received. The asset is subsequently depreciated on a straight-line basis from the commencement date to the earlier of the end of the useful life of the underlying asset or the end of the lease term. For more information regarding Deprecation see Note 9 - Depreciation and amortisation. The right-of-use asset is reduced by impairment losses, if any, and adjusted for certain remeasurements of the lease liability.
Volvo Car Group applies the recognition exemptions regarding short-term leases and leases where the underlying asset is of low value. Hence, payments associated with short-term leases and leases of low-value assets are recognised on a straight-line basis as an expense in the income statement. Short-term leases are leases with a lease term of twelve months or less and low value assets are defined as asset classes that are typically of low value, for example small IT equipment (cell-phones, laptops, computers, printers) and office furniture. Non-lease components are included in the measure-ment of the lease liability for all asset classes.
In the balance sheet, the lease liabilities are presented as Other non-current and current interest bearing liabilities. The right-of-use asset is presented as part of property, plant and equipment, see Note 16 – Tangible assets. In the income statement, depreciation expenses of the right-of-use asset is presented on the same line item/items in which similar expenses are. The interest expense on the lease liability is presented as part of finance expenses. In the statement of cash flows, amortisations on the lease liability are pre-sented as a cash flow from financing activities. Payments of interest as well as payments for short-term leases and leases of low value is presented as cash flow from operating activities.
Volvo Car Group as a lessor Volvo Car Group is acting as a manufacturer finance lessor in a few cases. In these cases revenue is recognised at the fair value of the underlying asset or the present value of the lease payments, if lower, reduced with the carrying amount of the asset less any unguaran-teed residual values.
Sale transactions including repurchase commitments are recog-nised as operating leases. Operating lease contracts with a maturity less or equal to twelve months are recognised as inventory in the balance sheet, see Note 18 – Inventories. Operating lease contracts with a maturity more than twelve months are recognised as Prop-erty, Plant and Equipment, see Note 16 – Tangible asset. These oper-ating leases are mainly related to vehicles sold with repurchase com-mitments. The difference between the original sales price and the repurchase price is recognised in the income statement as revenue on a straight-line basis over the lease term, see Note 2 – Revenue. The remaining lease revenue yet to be recognised is presented as
part of current and non-current contract liabilities to customers in the balance sheet, see Note 25 – Current and non-current contract liabilities to customers. The repurchase obligation is considered to be a financial liability and is classified as non-current or current liabil-ities, see Note 26 – Other non-current liabilities and see Note 27 – Other current liabilities. Although accounting remains substantially the same for lessors, there is new guidance impacting subleases and the accounting for sale and leaseback transactions. The sub-leases and sale and leaseback transactions are not considered material for Volvo Car Group.
CRITICAL ACCOUNTING ESTIMATES AND JUDGEMENTS
IFRS 16 requires Volvo Car Group to make judgmental decisions when determining the lease term for contracts, especially for the leasing of buildings. Factors included in the determination of the lease term are if Volvo Car Group, as a lessee, have made invest-ments to improve the asset or have tailored it for our special needs and/or the importance of the underlying asset to Volvo Car Groups operations.
Lease termWhen determining the lease term, management in the organisation have considered all facts and circumstances that creates an eco-nomic incentive to exercise an extension option, or not exercise a termination option. The assessment is reviewed if a significant event or a significant change in circumstances occurs which affects this assessment.
Discount rateVolvo Car Group has a process of indicating discount rates to use when evaluating whether to lease or buy an asset. The same process is used when determining the disount rate to by applied. Volvo Car Group uses an applicable industrial yield curve and taking into con-sideration for example Volvo Car Groups credit risk, adjustment for currency, lease term and economic environment.
Volvo Car Group as lessee
IAS 17 — 2018Operating lease contracts The operating lease contracts Volvo Car Group holds are mainly con-tracts for premises and office equipment. Also some production equipment such as forklifts for the factories are classified as operat-ing lease contracts.
Operating lease expenses 2018
Minimum lease payments –1,325
Contingent rents –46
Less subleases 14
Total –1,357
Operating lease commitments per Dec 31, 2018
Minimum lease
paymentsLess
subleases Total
Present value of operating
lease commitments less
subleases
No later than 1 year 1,125 22 1,103 1,088
Later than 1 year but no later than 5 years 2,947 80 2,867 2,649
Later than 5 years 1,946 98 1,848 1,499
Total 6,018 200 5,818 5,236
85ANNUAL REPORT 2019 | VOLVO CAR GROUP
NOTES TO THE CONSOLIDATED FINANCIAL STATEMENTS
Finance lease contractsVolvo Car Group holds finance lease contracts for production equip-ment and for some buildings and land used in production. The assets will be owned by Volvo Car Group at the end of the lease contracts at no additional cost. All leases are fixed terms with fixed payments.
Finance lease assets
Asset under
Construction
Buildings and land
Machinery and
equipment
Acquisition cost
Balance at January 1, 2018 — 97 75
Additions 22 47 29
Disposals — –82 —
Effect of foreign currency exchange differences — 4 3
Balance at December 31, 2018 22 66 107
Accumulated depreciation
Balance at January 1, 2018 — –89 –7
Depreciation expense — –10 –4
Disposals — 82 —
Effect of foreign currency exchange differences — –4 —
Balance at December 31, 2018 — –21 –11
Net balance at December 31, 2018 22 45 96
Gross finance lease liabilities – minimum lease payments
Dec 31, 2018
No later than 1 year 18
Later than 1 year but no later than 5 years 57
Later than 5 years 58
Total 133
Future finance charges on finance leases –20
Present value of finance lease liabilities 113
The present value of finance lease liabilities is as follows:
Gross finance lease liabilities – minimum lease payments
Dec 31, 2018
No later than 1 year 15
Later than 1 year but no later than 5 years 50
Later than 5 years 48
Total 113
As of December 31, 2018 the finance lease liabilities are included in the financial statement as Non-current liabilities to credit institutions of MSEK 97 and Current liabilities to credit institutions of MSEK 16.
IFRS 16 — 2019Volvo Car Group mainly leases buildings and other items such as IT-equipment and production equipment.
Right-of-use assetBuildings and land
Machinery and
equipment Total
Acquisition cost
Balance at January 1, 2019 — — —
Reclassification from finance lease of Tangible assets (Note 16) 36 58 94
Operating leases (first application, IFRS 16) 6,294 590 6,884
Additions 308 131 439
Right-of-use assetBuildings and land
Machinery and
equipment Total
Balance at December 31, 2019 6,638 779 7,417
Accumulated depreciation
Balance at January 1, 2019 — — —
Depreciation expense –981 –221 –1,202
Balance at December 31, 2019 –981 –221 –1,202
Net balance at December 31, 2019 5,657 558 6,215
Lease liabilities 2019
Non-current lease liabilities 5,076
Current lease liabilities 1,073
The lease liabilities related to the leasing contracts are presented in the balance sheet as Other non-current interest bearing liabilities and Other current interest bearing liabilities. The difference between Right-of-use asset is due to the land-used-rights in China that are prepaid and therefore not included as a liability. The maturity analysis of lease liabilities is presented in Note 20 – Financial risks and finan-cial instruments.
Amounts recognised in profit and loss 2019
Deprecation expenses on right-of-use –1,225
Interest expense on lease liabilities –236
Expense relating to short-term leases –156
Expense relating to leases of low value assets –27
Expense relating to variable lease payments not included in the measurement of the lease liability –23
Income from sub-leasing right-of-use assets 26
The total cash outflow for leases amounts to MSEK 1,641. The amount include payments for lease agreements recognised as liabil-ities, variable payments, short-term payments and payments for leases of low value.
Volvo Car Group as lessorOperating lease contracts mainly relate to vehicles sold with repur-chase commitments.
IAS 17 — 2018Operating leases contracts
Future lease income of operating lease contracts 2018
No later than 1 year 973
Later than 1 year but no later than 5 years 443
Total 1,416
Finance lease contractsVolvo Car Group did not have any finance leases during 2018.
IFRS 16 — 2019Operating leases contractsThe table contains a maturity analysis of leasing payments and the total of undiscounted lease payments that will be received after the balance day.
Future lease income of operating lease contracts, undis-counted. 2019
No later than 1 year 934
Later than 1 year but no later than 2 years 194
Later than 2 year but no later than 3 years 104
Later than 3 year but no later than 4 years 9
Later than 4 year but no later than 5 years 8
Later than 5 years —
Total 1 249
86 VOLVO CAR GROUP | ANNUAL REPORT 2019
NOTES TO THE CONSOLIDATED FINANCIAL STATEMENTS
Finance lease contracts During 2019 Volvo Car Group entered into finance leasing arrange-ments as a lessor for certain equipment.
Amounts receivable under finance leases 2019
No later than 1 year 59
Later than 1 year but no later than 2 years 59
Later than 2 year but no later than 3 years 59
Later than 3 year but no later than 4 years 59
Later than 4 year but no later than 5 years 59
Later than 5 years 139
Undiscounted lease payments 434
Less unearned finance income 58
Net investment in the lease 376
The following table presents the amounts included in incomestatement
2019
Finance income on the net investment in finance leases 10
NOTE 8 – EMPLOYEES AND REMUNERATION
ACCOUNTING PRINCIPLES
Incentive programmesVolvo Car Group manages different global incentive programmes. Two of them are short-term and one long-term and the design and payout of these programmes are subject to an annual approval of the Board of Directors.
Short-term incentive programmesThere are two short-term programmes. The Short Term Variable Pay for Senior Leaders (STVP for Senior Leaders) is an incentive pro-gramme for the CEO, EMT and certain senior executives. Volvo Bonus is an incentive progamme that includes all other employees. If all prerequisites are met a liability is recognised.
Long-term incentive programmeThe Long Term Variable Pay (LTVP) is a cash-settled share based programme for the CEO, EMT and certain senior executives.
The fair value of the cash-settled payments is determined at the grant date, and revalued at each balance sheet date, and is recog-nised as an expense during the vesting period and as a correspond-ing liability. An assessment whether the terms for allotment will be fulfilled is made continuously. Based on such assessment, the expense might be adjusted.
The fair value is based on the share price reduced by dividends connected with the share during the vesting period. As Volvo Car Group is not listed, no official market value is available. Hence, the LTVP programme is based on a synthetic share price derived from variables known to determine the value of an automotive OEM. Addi-tional social expenses are reported as a liability, revalued at each balance sheet date.
Share-based incentive programmeThis share-based incentive programme is cash-settled. The fair value of the warrants acquired is determined at the grant date and is rec-ognised as a financial liability. The liability is revalued at each balance sheet date and changes of the fair value are recognised in the income statement as a financial expense or income.
During the duration of the programme the participants, at certain predetermined periods, between 2016 to 2021, have an option to sell the received warrants at fair value to the parent company. The warrants have been acquired by the participants at fair value, why the programme will not render any recognition of personnel cost.
Average number of employees by region: 2019
Of whom women 2018
Of whom women
Sweden 23,005 28% 23,078 28%
Nordic countries other than Sweden 736 34% 834 48%
Belgium 5,109 15% 5,521 14%
Europe other than the Nordic countries and Belgium 1,237 32% 974 32%
North and South America 2,036 33% 1,889 29%
China 8,404 16% 8,253 15%
Asia other than China 878 17% 770 17%
Other countries 112 32% 99 31%
Total 41,517 24% 41,4181) 24%
Dec 31, 2019
Of whom women
Dec 31, 2018
Of whom women
Number of Board members and senior executives2)
Board members (Chief Executive
Officers and senior executives)
Board members (Chief Executive
Officers and senior executives)
Parent company 10 30% 10 30%
Subsidiaries111
(301)19%
(26%)106
(287)17%
(23%)
Total121
(301)20%
(26%)116
(287)18%
(23%)
2019 2018
Salaries and other remunerations
Wages and salaries,
other remune
rations
Social security
expenses (of which
pension expenses)
Wages and salaries,
other remune
rations
Social security
expenses (of which
pension expenses)
Parent company 9 3(—) 6 2 (—)
Subsidiaries 22,7278,819
(4,232) 20,2578,229
(3,984)
Total 22,7368,822
(4,232) 20,2638,231
(3,984)
2019 2018
Salaries and other remuneration to the Board3), CEO, Excecutive Management Team (EMT)4) and other employees
Wages and salaries,
other remune
rations (of which
variable salaries)
Social security
expenses (of which
pension expenses)
Wages and salaries,
other remune
rations (of which
variable salaries)
Social security
expenses (of which
pension expenses)
Board, Chief Executive Officers and EMT
296(81)
117(41)
278(41)
102 (35)
Other employees 22,440
8,705(4,191) 19,985
8,129 (3,949)
Total22,736
(81)8,822
(4,232)20,263
(41)8,231
(3,984)
1) The comparative number of FTEs has been restated due to a changed and improved methodology for calculating the average number of FTEs.
2) Senior excecutives are defined as key personnel within the subsidiaries. 3) The Board includes all board members in the subsidiaries within Volvo
Car Group.4) The Excecutive Management Team (EMT) consists of the CEO in Volvo
Car Corporation and key management personnel other than Board members, in total 12 (15).
Compensation to Board membersThe shareholders have elected a Nomination Committee, which on a yearly basis proposes appropriate remuneration principles and remu-neration for Volvo Cars Board within the frames of the remuneration principles decided by the Annual General Meeting. The remuneration to the members of the board is determined at the Annual General Meeting. At the Annual General Meeting 2019 it was decided that Board members elected at the meeting who are employed or other-wise remunerated by Volvo Car Group or the Zhejiang Geely Holding Group shall not be entitled to any remuneration. The other board
87ANNUAL REPORT 2019 | VOLVO CAR GROUP
NOTES TO THE CONSOLIDATED FINANCIAL STATEMENTS
members elected at the Annual General Meeting shall receive remu-neration containing the following elements: (i) a market based fixed remuneration decided at the Annual General Meeting (ii) a company car in accordance with the Company´s company car policy in force from time to time and (iii) to Board members who are members of any of the Boards’ committees an additional market based fixed remuneration as decided at the Annual General Meeting. Expensed remuneration to the individual Board members is specified below:
Board member
2019
Ordinary compensation,
TSEK
2018
Ordinary compensation,
TSEK
Li Shufu, Chairman — —
Håkan Samuelsson — —
Li Donghui — —
Carl Peter Forster (until March 2019) — —
Winfried Vahland (from March 2019) 690 —
Dr. Peng Zhang (until March 2018) — —
Winnie K. W. Fok 869 775
Mikael Olsson (until March 2018) — 750
Lone Fønss Schrøder 2,550 2,012
Thomas Johnstone 1,006 875
Betsy Atkins 969 844
Michael Jackson (from July 2018) 831 262
Jim Zhang (from August 2018) 813 229
Total 7,728 5,747
Terms of employment and remuneration to the CEOThe Board has assigned a People and Sustainability Committee (PSC) to determine the remuneration principles for the CEO, subject to the shareholders' meetings approval. The chairperson of the board shall in dialogue with PSC decide the remuneration to the CEO. The CEO is entitled to a remuneration consisting of a fixed annual salary, STVP, LTVP and other benefits such as a company car and insurance.
The CEO has a defined contribution pension plan to which Volvo Car Group allocates 50 per cent of the fixed monthly salary on a roll-ing basis. The CEO agreement is fixed term and there are no sever-ance pay included in the terms of agreement.
Remuneration to Executive Management TeamThe Board has assigned a People and Sustainability Committee to determine the remuneration to the Executive Management Team (EMT), proposed by the CEO. Volvo Car Group members of EMT are entitled to a remuneration consisting of a fixed annual salary, STVP, LTVP and other benefits such as company car and insurance. In order to retain critical competences and deliveries within Volvo Car Group, some of the members of EMT have an additional variable pay. This variable pay is based on fulfillment of the member of EMT's yearly individual objectives and can vary from 0 up to maximum 20 per cent of the annual salary depending on fulfillment rate.
The notice period for a member of EMT is a maximum of twelve months in case of termination by Volvo Car Group and twelve months in case of termination by the member of EMT. Furthermore the member of EMT is, in case of termination by Volvo Car Group, enti-tled to severance pay based on the fixed salary, during a period of maximum twelve months.
During 2019 3 (—) members of EMT left the Volvo Car Group. Remuneration during the notice period and severance pay amounted to MSEK 4 (—), excluding social expenses.
Members of EMT employed in Sweden are covered by the ITP plan and, where applicable, a supplementary pension plan – Volvo Management Pension (VMP). On average, the contributions for members of EMT is 28–35 per cent of the pensionable salary. Disa-bility benefits follow the ITP and VMP regulations.
For members of EMT employed outside of Sweden, varying pen-sion terms and conditions apply, depending upon the country of employment.
Volvo Car Group’s outstanding post-employment benefits obliga-tions to former CEO’s and EMT amounted to MSEK 59 (61).
Short-term incentive programmesSTVP for Senior LeadersThe purpose of the STVP for Senior Leaders is to support the corpo-rate strategy and the transformation of Volvo Cars. The qualifier for the STVP for Senior Leaders is that the Volvo Car Group profit target (EBIT) is reached. To reach maximum pay-out a number of perfor-mance targets must be reached. The STVP for Senior Leaders is based on a percentage of annual base salary and the remuneration is paid in cash.
Volvo BonusThe purpose of the Volvo Bonus is to strengthen global alignment among employees around Volvo Car Group's vision, objectives and strategies and to encourage all employees to achieve and exceed the business plan targets. The qualifier for the Volvo Bonus is that the Volvo Car Group profit target (EBIT) is reached. In order for the Volvo Bonus to be paid out at all, a minimum acceptable performance regarding EBIT needs to be met. This is called the threshold level and the remaining two levels (target and maximum) increase the bonus paid out in relation to increased performance. Depending on the employee´s position, he/she is eligible for a certain target level that can be either a fixed amount or a percentage of the employee´s annual base salary. The remuneration is paid in cash. For 2019 the cost for the Volvo Bonus/STVP programmes amounted to MSEK 1,402 including social security expenses, of which MSEK 53 related to EMT. For 2018 the threshold level was not met and the Board of Directors decided that no Volvo Bonus should be paid out.
Long-term incentive programmeLong term variable payThe purpose of the LTVP-programme is to attract, motivate and retain key competence within Volvo Car Group. The LTVP-programme is based on calculated market value of Volvo Car Group over three years. As Volvo Car Group is not listed, no official market value is avail-able. Hence, the LTVP programmes for previous years are based on a synthetic share price derived from variables known to determine the value of an automotive OEM. Valuation of Volvo Car Group is based on the 4 year business plan and trading multiplies for listed peers. The business plan is adopted annually by the Board. The valuation of Volvo Cars has been done by an external party and in two ways;
i) through discounted cash flow analysis of Volvo Cars estimated future cash flows, based on Volvo Cars latest business plan four years ahead and certain key assumptions; and
ii) through comparable market analysis based on peer group analysis.
Depending on the participant's position they receive a LTVP bonus award equivalent to a certain percentage of their annual base salary. Each LTVP award has a vesting period of three years and is paid out in cash. The cash amount paid depends on the valuation of Volvo Cars on the vesting date, three years after grant.
The programme is capped to a maximum of 200 per cent of the value of the award at grant. To be eligible for pay out, the employee must remain within the Group on the pay-out date. The cost for the LTVP-programme amounted to MSEK 130 (149) including social security expenses, of which MSEK 37(41) related to EMT. The total liability amounted to MSEK 214 (221).
88 VOLVO CAR GROUP | ANNUAL REPORT 2019
NOTES TO THE CONSOLIDATED FINANCIAL STATEMENTS
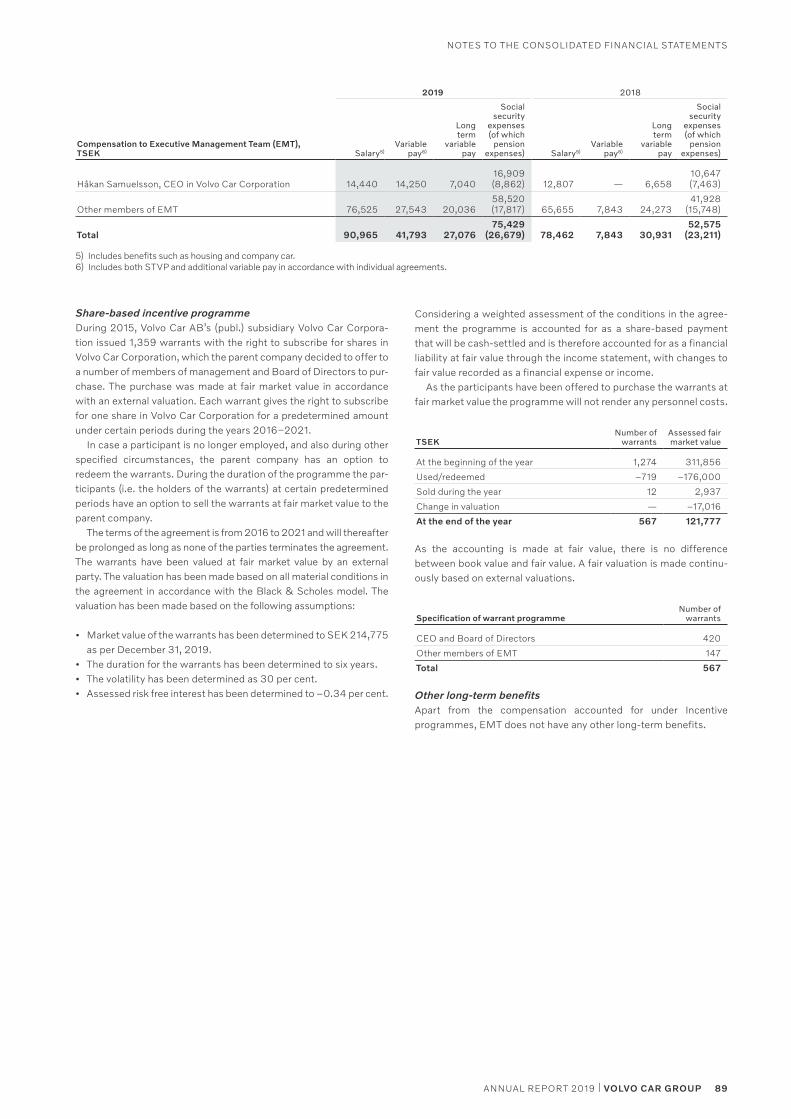
Share-based incentive programmeDuring 2015, Volvo Car AB’s (publ.) subsidiary Volvo Car Corpora-tion issued 1,359 warrants with the right to subscribe for shares in Volvo Car Corporation, which the parent company decided to offer to a number of members of management and Board of Directors to pur-chase. The purchase was made at fair market value in accordance with an external valuation. Each warrant gives the right to subscribe for one share in Volvo Car Corporation for a predetermined amount under certain periods during the years 2016–2021.
In case a participant is no longer employed, and also during other specified circumstances, the parent company has an option to redeem the warrants. During the duration of the programme the par-ticipants (i.e. the holders of the warrants) at certain predetermined periods have an option to sell the warrants at fair market value to the parent company.
The terms of the agreement is from 2016 to 2021 and will thereafter be prolonged as long as none of the parties terminates the agreement. The warrants have been valued at fair market value by an external party. The valuation has been made based on all material conditions in the agreement in accordance with the Black & Scholes model. The valuation has been made based on the following assumptions:
• Market value of the warrants has been determined to SEK 214,775 as per December 31, 2019.
• The duration for the warrants has been determined to six years.• The volatility has been determined as 30 per cent.• Assessed risk free interest has been determined to –0.34 per cent.
2019 2018
Compensation to Executive Management Team (EMT), TSEK Salary5)
Variable pay6)
Long term
variable pay
Social security
expenses (of which
pension expenses) Salary5)
Variable pay6)
Long term
variable pay
Social security
expenses (of which
pension expenses)
Håkan Samuelsson, CEO in Volvo Car Corporation 14,440 14,250 7,04016,909(8,862) 12,807 — 6,658
10,647 (7,463)
Other members of EMT 76,525 27,543 20,03658,520(17,817) 65,655 7,843 24,273
41,928 (15,748)
Total 90,965 41,793 27,07675,429
(26,679) 78,462 7,843 30,93152,575
(23,211)
5) Includes benefits such as housing and company car.6) Includes both STVP and additional variable pay in accordance with individual agreements.
Considering a weighted assessment of the conditions in the agree-ment the programme is accounted for as a share-based payment that will be cash-settled and is therefore accounted for as a financial liability at fair value through the income statement, with changes to fair value recorded as a financial expense or income.
As the participants have been offered to purchase the warrants at fair market value the programme will not render any personnel costs.
TSEKNumber of
warrantsAssessed fair market value
At the beginning of the year 1,274 311,856
Used/redeemed –719 –176,000
Sold during the year 12 2,937
Change in valuation — –17,016
At the end of the year 567 121,777
As the accounting is made at fair value, there is no difference between book value and fair value. A fair valuation is made continu-ously based on external valuations.
Specification of warrant programmeNumber of
warrants
CEO and Board of Directors 420
Other members of EMT 147
Total 567
Other long-term benefitsApart from the compensation accounted for under Incentive programmes, EMT does not have any other long-term benefits.
89ANNUAL REPORT 2019 | VOLVO CAR GROUP
NOTES TO THE CONSOLIDATED FINANCIAL STATEMENTS
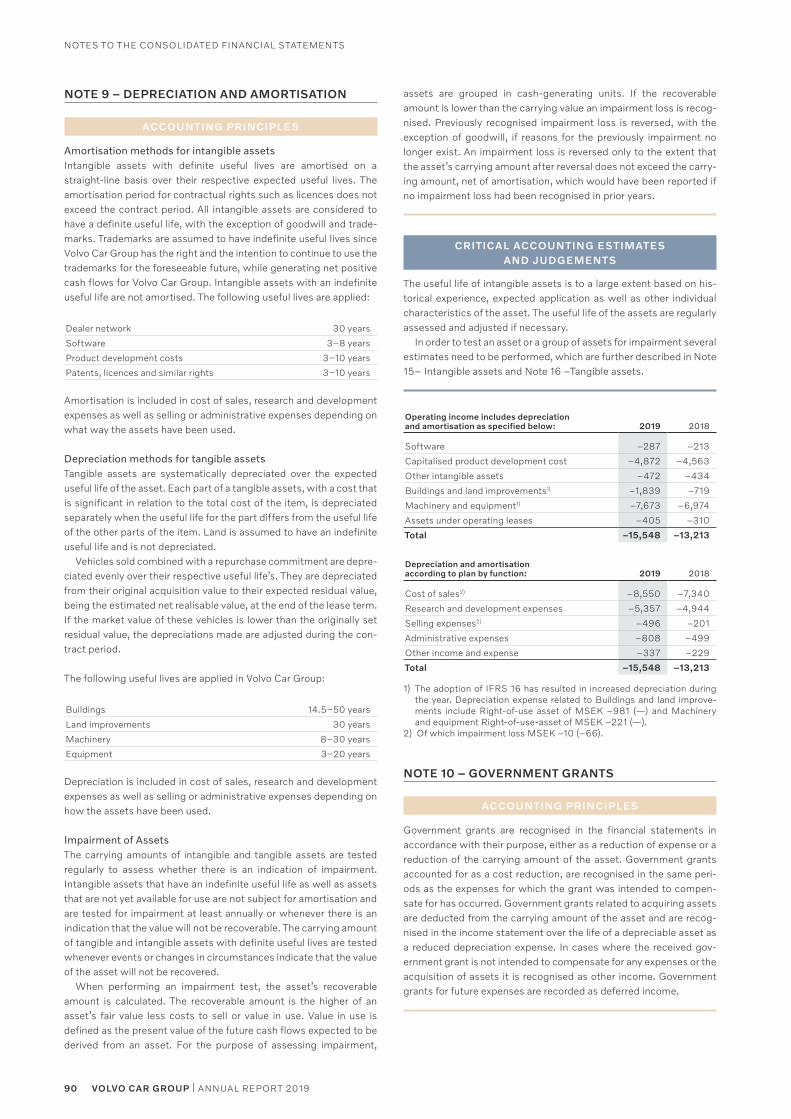
90 VOLVO CAR GROUP | ANNUAL REPORT 2019
NOTES TO THE CONSOLIDATED FINANCIAL STATEMENTS
NOTE 9 – DEPRECIATION AND AMORTISATION
ACCOUNTING PRINCIPLES
Amortisation methods for intangible assets Intangible assets with definite useful lives are amortised on a straight-line basis over their respective expected useful lives. The amortisation period for contractual rights such as licences does not exceed the contract period. All intangible assets are considered to have a definite useful life, with the exception of goodwill and trade-marks. Trademarks are assumed to have indefinite useful lives since Volvo Car Group has the right and the intention to continue to use the trademarks for the foreseeable future, while generating net positive cash flows for Volvo Car Group. Intangible assets with an indefinite useful life are not amortised. The following useful lives are applied:
Dealer network 30 years
Software 3–8 years
Product development costs 3–10 years
Patents, licences and similar rights 3–10 years
Amortisation is included in cost of sales, research and development expenses as well as selling or administrative expenses depending on what way the assets have been used.
Depreciation methods for tangible assetsTangible assets are systematically depreciated over the expected useful life of the asset. Each part of a tangible assets, with a cost that is significant in relation to the total cost of the item, is depreciated separately when the useful life for the part differs from the useful life of the other parts of the item. Land is assumed to have an indefinite useful life and is not depreciated.
Vehicles sold combined with a repurchase commitment are depre-ciated evenly over their respective useful life’s. They are depreciated from their original acquisition value to their expected residual value, being the estimated net realisable value, at the end of the lease term. If the market value of these vehicles is lower than the originally set residual value, the depreciations made are adjusted during the con-tract period.
The following useful lives are applied in Volvo Car Group:
Buildings 14.5–50 years
Land improvements 30 years
Machinery 8–30 years
Equipment 3–20 years
Depreciation is included in cost of sales, research and development expenses as well as selling or administrative expenses depending on how the assets have been used.
Impairment of AssetsThe carrying amounts of intangible and tangible assets are tested regularly to assess whether there is an indication of impairment. Intangible assets that have an indefinite useful life as well as assets that are not yet available for use are not subject for amortisation and are tested for impairment at least annually or whenever there is an indication that the value will not be recoverable. The carrying amount of tangible and intangible assets with definite useful lives are tested whenever events or changes in circumstances indicate that the value of the asset will not be recovered.
When performing an impairment test, the asset’s recoverable amount is calculated. The recoverable amount is the higher of an asset’s fair value less costs to sell or value in use. Value in use is defined as the present value of the future cash flows expected to be derived from an asset. For the purpose of assessing impairment,
assets are grouped in cash-generating units. If the recoverable amount is lower than the carrying value an impairment loss is recog-nised. Previously recognised impairment loss is reversed, with the exception of goodwill, if reasons for the previously impairment no longer exist. An impairment loss is reversed only to the extent that the asset’s carrying amount after reversal does not exceed the carry-ing amount, net of amortisation, which would have been reported if no impairment loss had been recognised in prior years.
CRITICAL ACCOUNTING ESTIMATES AND JUDGEMENTS
The useful life of intangible assets is to a large extent based on his-torical experience, expected application as well as other individual characteristics of the asset. The useful life of the assets are regularly assessed and adjusted if necessary.
In order to test an asset or a group of assets for impairment several estimates need to be performed, which are further described in Note 15– Intangible assets and Note 16 –Tangible assets.
Operating income includes depreciation and amortisation as specified below: 2019 2018
Software –287 –213
Capitalised product development cost –4,872 –4,563
Other intangible assets –472 –434
Buildings and land improvements1) –1,839 –719
Machinery and equipment1) –7,673 –6,974
Assets under operating leases –405 –310
Total –15,548 –13,213
Depreciation and amortisation according to plan by function: 2019 2018
Cost of sales2) –8,550 –7,340
Research and development expenses –5,357 –4,944
Selling expenses2) –496 –201
Administrative expenses –808 –499
Other income and expense –337 –229
Total –15,548 –13,213
1) The adoption of IFRS 16 has resulted in increased depreciation during the year. Depreciation expense related to Buildings and land improve-ments include Right-of-use asset of MSEK –981 (—) and Machinery and equipment Right-of-use-asset of MSEK –221 (—).
2) Of which impairment loss MSEK –10 (–66).
NOTE 10 – GOVERNMENT GRANTS
ACCOUNTING PRINCIPLES
Government grants are recognised in the financial statements in accordance with their purpose, either as a reduction of expense or a reduction of the carrying amount of the asset. Government grants accounted for as a cost reduction, are recognised in the same peri-ods as the expenses for which the grant was intended to compen-sate for has occurred. Government grants related to acquiring assets are deducted from the carrying amount of the asset and are recog-nised in the income statement over the life of a depreciable asset as a reduced depreciation expense. In cases where the received gov-ernment grant is not intended to compensate for any expenses or the acquisition of assets it is recognised as other income. Government grants for future expenses are recorded as deferred income.
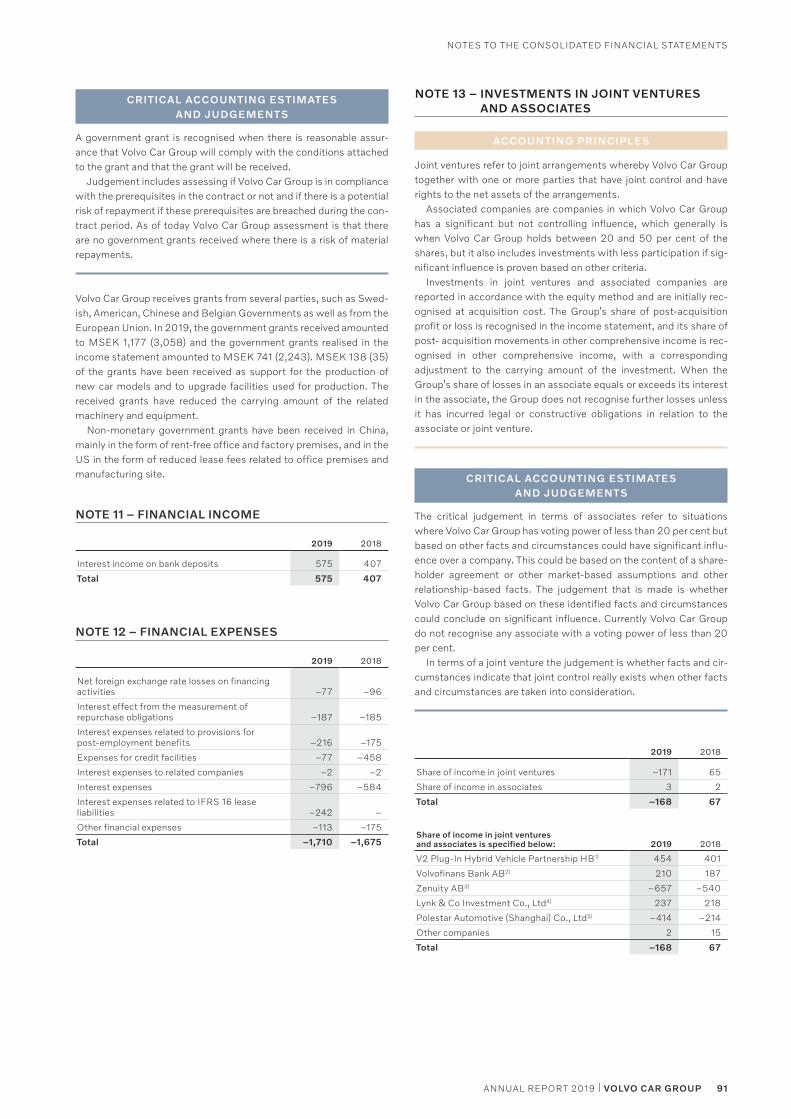
91ANNUAL REPORT 2019 | VOLVO CAR GROUP
NOTES TO THE CONSOLIDATED FINANCIAL STATEMENTS
NOTE 13 – INVESTMENTS IN JOINT VENTURES AND ASSOCIATES
ACCOUNTING PRINCIPLES
Joint ventures refer to joint arrangements whereby Volvo Car Group together with one or more parties that have joint control and have rights to the net assets of the arrangements.
Associated companies are companies in which Volvo Car Group has a significant but not controlling influence, which generally is when Volvo Car Group holds between 20 and 50 per cent of the shares, but it also includes investments with less participation if sig-nificant influence is proven based on other criteria.
Investments in joint ventures and associated companies are reported in accordance with the equity method and are initially rec-ognised at acquisition cost. The Group’s share of post-acquisition profit or loss is recognised in the income statement, and its share of post- acquisition movements in other comprehensive income is rec-ognised in other comprehensive income, with a corresponding adjustment to the carrying amount of the investment. When the Group’s share of losses in an associate equals or exceeds its interest in the associate, the Group does not recognise further losses unless it has incurred legal or constructive obligations in relation to the associate or joint venture.
CRITICAL ACCOUNTING ESTIMATES AND JUDGEMENTS
The critical judgement in terms of associates refer to situations where Volvo Car Group has voting power of less than 20 per cent but based on other facts and circumstances could have significant influ-ence over a company. This could be based on the content of a share-holder agreement or other market-based assumptions and other relationship-based facts. The judgement that is made is whether Volvo Car Group based on these identified facts and circumstances could conclude on significant influence. Currently Volvo Car Group do not recognise any associate with a voting power of less than 20 per cent.
In terms of a joint venture the judgement is whether facts and cir-cumstances indicate that joint control really exists when other facts and circumstances are taken into consideration.
2019 2018
Share of income in joint ventures –171 65
Share of income in associates 3 2
Total –168 67
Share of income in joint ventures and associates is specified below: 2019 2018
V2 Plug-In Hybrid Vehicle Partnership HB1) 454 401
Volvofinans Bank AB2) 210 187
Zenuity AB3) –657 –540
Lynk & Co Investment Co., Ltd4) 237 218
Polestar Automotive (Shanghai) Co., Ltd5) –414 –214
Other companies 2 15
Total –168 67
CRITICAL ACCOUNTING ESTIMATES AND JUDGEMENTS
A government grant is recognised when there is reasonable assur-ance that Volvo Car Group will comply with the conditions attached to the grant and that the grant will be received.
Judgement includes assessing if Volvo Car Group is in compliance with the prerequisites in the contract or not and if there is a potential risk of repayment if these prerequisites are breached during the con-tract period. As of today Volvo Car Group assessment is that there are no government grants received where there is a risk of material repayments.
Volvo Car Group receives grants from several parties, such as Swed-ish, American, Chinese and Belgian Governments as well as from the European Union. In 2019, the government grants received amounted to MSEK 1,177 (3,058) and the government grants realised in the income statement amounted to MSEK 741 (2,243). MSEK 138 (35) of the grants have been received as support for the production of new car models and to upgrade facilities used for production. The received grants have reduced the carrying amount of the related machinery and equipment.
Non-monetary government grants have been received in China, mainly in the form of rent-free office and factory premises, and in the US in the form of reduced lease fees related to office premises and manufacturing site.
NOTE 11 – FINANCIAL INCOME
2019 2018
Interest income on bank deposits 575 407
Total 575 407
NOTE 12 – FINANCIAL EXPENSES
2019 2018
Net foreign exchange rate losses on financing activities –77 –96
Interest effect from the measurement of repurchase obligations –187 –185
Interest expenses related to provisions for post-employment benefits –216 –175
Expenses for credit facilities –77 –458
Interest expenses to related companies –2 –2
Interest expenses –796 –584
Interest expenses related to IFRS 16 lease liabilities –242 –
Other financial expenses –113 –175
Total –1,710 –1,675
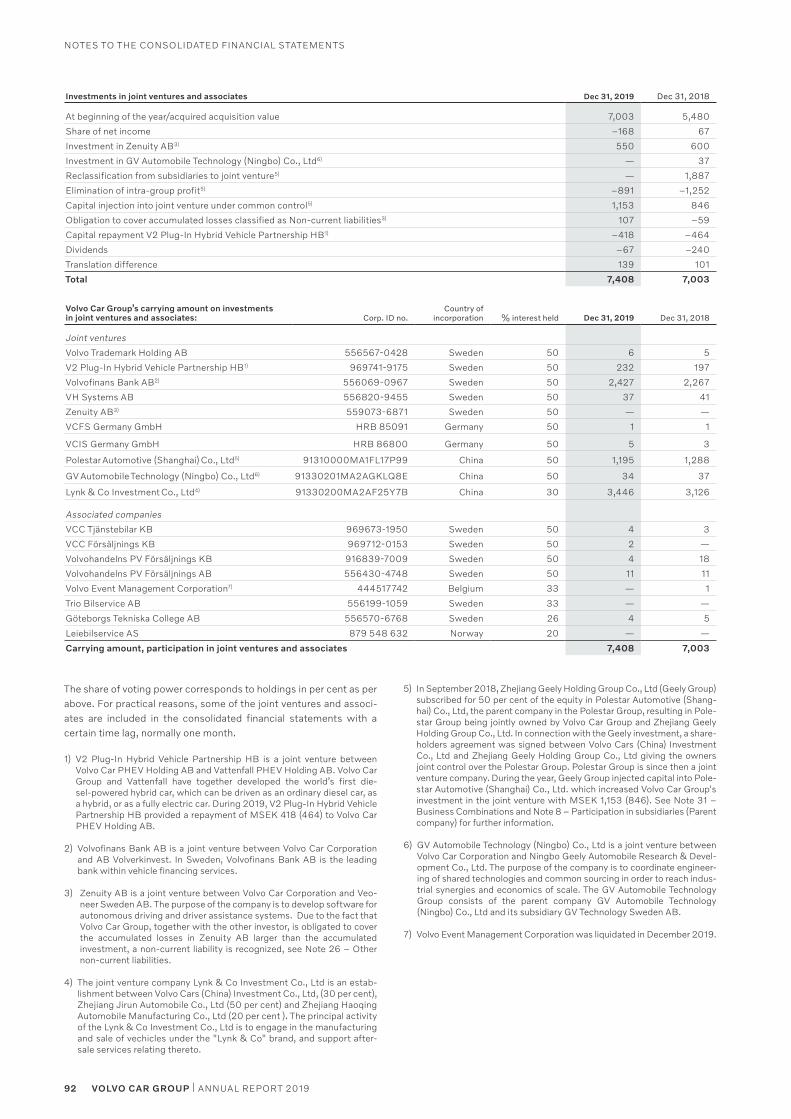
92 VOLVO CAR GROUP | ANNUAL REPORT 2019
NOTES TO THE CONSOLIDATED FINANCIAL STATEMENTS
5) In September 2018, Zhejiang Geely Holding Group Co., Ltd (Geely Group) subscribed for 50 per cent of the equity in Polestar Automotive (Shang-hai) Co., Ltd, the parent company in the Polestar Group, resulting in Pole-star Group being jointly owned by Volvo Car Group and Zhejiang Geely Holding Group Co., Ltd. In connection with the Geely investment, a share-holders agreement was signed between Volvo Cars (China) Investment Co., Ltd and Zhejiang Geely Holding Group Co., Ltd giving the owners joint control over the Polestar Group. Polestar Group is since then a joint venture company. During the year, Geely Group injected capital into Pole-star Automotive (Shanghai) Co., Ltd. which increased Volvo Car Group's investment in the joint venture with MSEK 1,153 (846). See Note 31 – Business Combinations and Note 8 – Participation in subsidiaries (Parent company) for further information.
6) GV Automobile Technology (Ningbo) Co., Ltd is a joint venture between Volvo Car Corporation and Ningbo Geely Automobile Research & Devel-opment Co., Ltd. The purpose of the company is to coordinate engineer-ing of shared technologies and common sourcing in order to reach indus-trial synergies and economics of scale. The GV Automobile Technology Group consists of the parent company GV Automobile Techno logy (Ningbo) Co., Ltd and its subsidiary GV Technology Sweden AB.
7) Volvo Event Management Corporation was liquidated in December 2019.
The share of voting power corresponds to holdings in per cent as per above. For practical reasons, some of the joint ventures and associ-ates are included in the consolidated financial statements with a certain time lag, normally one month.
1) V2 Plug-In Hybrid Vehicle Partnership HB is a joint venture between Volvo Car PHEV Holding AB and Vattenfall PHEV Holding AB. Volvo Car Group and Vattenfall have together developed the world’s first die-sel-powered hybrid car, which can be driven as an ordinary diesel car, as a hybrid, or as a fully electric car. During 2019, V2 Plug-In Hybrid Vehicle Partnership HB provided a repayment of MSEK 418 (464) to Volvo Car PHEV Holding AB.
2) Volvofinans Bank AB is a joint venture between Volvo Car Corporation and AB Volverkinvest. In Sweden, Volvofinans Bank AB is the leading bank within vehicle financing services.
3) Zenuity AB is a joint venture between Volvo Car Corporation and Veo-neer Sweden AB. The purpose of the company is to develop software for autonomous driving and driver assistance systems. Due to the fact that Volvo Car Group, together with the other investor, is obligated to cover the accumulated losses in Zenuity AB larger than the accumulated investment, a non-current liability is recognized, see Note 26 – Other non-current liabilities.
4) The joint venture company Lynk & Co Investment Co., Ltd is an estab-lishment between Volvo Cars (China) Investment Co., Ltd, (30 per cent), Zhejiang Jirun Automobile Co., Ltd (50 per cent) and Zhejiang Haoqing Automobile Manufacturing Co., Ltd (20 per cent ). The principal activity of the Lynk & Co Investment Co., Ltd is to engage in the manufacturing and sale of vechicles under the "Lynk & Co" brand, and support after-sale services relating thereto.
Investments in joint ventures and associates Dec 31, 2019 Dec 31, 2018
At beginning of the year/acquired acquisition value 7,003 5,480
Share of net income –168 67
Investment in Zenuity AB3) 550 600
Investment in GV Automobile Technology (Ningbo) Co., Ltd6) — 37
Reclassification from subsidiaries to joint venture5) — 1,887
Elimination of intra-group profit5) –891 –1,252
Capital injection into joint venture under common control5) 1,153 846
Obligation to cover accumulated losses classified as Non-current liabilities3) 107 –59
Capital repayment V2 Plug-In Hybrid Vehicle Partnership HB1) –418 –464
Dividends –67 –240
Translation difference 139 101
Total 7,408 7,003
Volvo Car Group’s carrying amount on investments in joint ventures and associates: Corp. ID no.
Country of incorporation % interest held Dec 31, 2019 Dec 31, 2018
Joint ventures
Volvo Trademark Holding AB 556567-0428 Sweden 50 6 5
V2 Plug-In Hybrid Vehicle Partnership HB1) 969741-9175 Sweden 50 232 197
Volvofinans Bank AB2) 556069-0967 Sweden 50 2,427 2,267
VH Systems AB 556820-9455 Sweden 50 37 41
Zenuity AB3) 559073-6871 Sweden 50 — —
VCFS Germany GmbH HRB 85091 Germany 50 1 1
VCIS Germany GmbH HRB 86800 Germany 50 5 3
Polestar Automotive (Shanghai) Co., Ltd5) 91310000MA1FL17P99 China 50 1,195 1,288
GV Automobile Technology (Ningbo) Co., Ltd6) 91330201MA2AGKLQ8E China 50 34 37
Lynk & Co Investment Co., Ltd4) 91330200MA2AF25Y7B China 30 3,446 3,126
Associated companies
VCC Tjänstebilar KB 969673-1950 Sweden 50 4 3
VCC Försäljnings KB 969712-0153 Sweden 50 2 —
Volvohandelns PV Försäljnings KB 916839-7009 Sweden 50 4 18
Volvohandelns PV Försäljnings AB 556430-4748 Sweden 50 11 11
Volvo Event Management Corporation7) 444517742 Belgium 33 — 1
Trio Bilservice AB 556199-1059 Sweden 33 — —
Göteborgs Tekniska College AB 556570-6768 Sweden 26 4 5
Leiebilservice AS 879 548 632 Norway 20 — —
Carrying amount, participation in joint ventures and associates 7,408 7,003
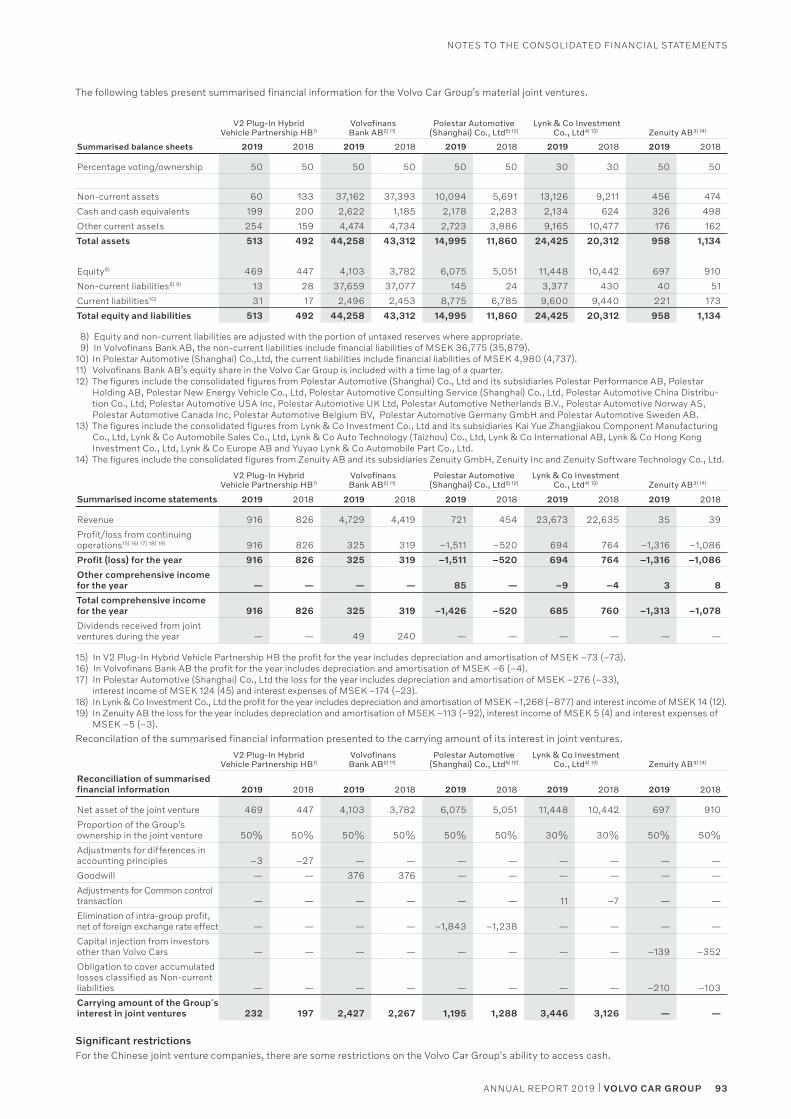
93ANNUAL REPORT 2019 | VOLVO CAR GROUP
NOTES TO THE CONSOLIDATED FINANCIAL STATEMENTS
The following tables present summarised financial information for the Volvo Car Group’s material joint ventures.
V2 Plug-In Hybrid Vehicle Partnership HB1)
Volvofinans Bank AB2) 11)
Polestar Automotive (Shanghai) Co., Ltd5) 12)
Lynk & Co Investment Co., Ltd4) 13) Zenuity AB3) 14)
Summarised balance sheets 2019 2018 2019 2018 2019 2018 2019 2018 2019 2018
Percentage voting/ownership 50 50 50 50 50 50 30 30 50 50
Non-current assets 60 133 37,162 37,393 10,094 5,691 13,126 9,211 456 474
Cash and cash equivalents 199 200 2,622 1,185 2,178 2,283 2,134 624 326 498
Other current assets 254 159 4,474 4,734 2,723 3,886 9,165 10,477 176 162
Total assets 513 492 44,258 43,312 14,995 11,860 24,425 20,312 958 1,134
Equity8) 469 447 4,103 3,782 6,075 5,051 11,448 10,442 697 910
Non-current liabilities8) 9) 13 28 37,659 37,077 145 24 3,377 430 40 51
Current liabilities10) 31 17 2,496 2,453 8,775 6,785 9,600 9,440 221 173
Total equity and liabilities 513 492 44,258 43,312 14,995 11,860 24,425 20,312 958 1,134
8) Equity and non-current liabilities are adjusted with the portion of untaxed reserves where appropriate. 9) In Volvofinans Bank AB, the non-current liabilities include financial liabilities of MSEK 36,775 (35,879). 10) In Polestar Automotive (Shanghai) Co.,Ltd, the current liabilities include financial liabilities of MSEK 4,980 (4,737).11) Volvofinans Bank AB’s equity share in the Volvo Car Group is included with a time lag of a quarter.12) The figures include the consolidated figures from Polestar Automotive (Shanghai) Co., Ltd and its subsidiaries Polestar Performance AB, Polestar
Holding AB, Polestar New Energy Vehicle Co., Ltd, Polestar Automotive Consulting Service (Shanghai) Co., Ltd, Polestar Automotive China Distribu-tion Co., Ltd, Polestar Automotive USA Inc, Polestar Automotive UK Ltd, Polestar Automotive Netherlands B.V., Polestar Automotive Norway AS, Polestar Automotive Canada Inc, Polestar Automotive Belgium BV, Polestar Automotive Germany GmbH and Polestar Automotive Sweden AB.
13) The figures include the consolidated figures from Lynk & Co Investment Co., Ltd and its subsidiaries Kai Yue Zhangjiakou Component Manufacturing Co., Ltd, Lynk & Co Automobile Sales Co., Ltd, Lynk & Co Auto Technology (Taizhou) Co., Ltd, Lynk & Co International AB, Lynk & Co Hong Kong Investment Co., Ltd, Lynk & Co Europe AB and Yuyao Lynk & Co Automobile Part Co., Ltd.
14) The figures include the consolidated figures from Zenuity AB and its subsidiaries Zenuity GmbH, Zenuity Inc and Zenuity Software Technology Co., Ltd.
V2 Plug-In Hybrid Vehicle Partnership HB1)
Volvofinans Bank AB2) 11)
Polestar Automotive (Shanghai) Co., Ltd5) 12)
Lynk & Co Investment Co., Ltd4) 13) Zenuity AB3) 14)
Summarised income statements 2019 2018 2019 2018 2019 2018 2019 2018 2019 2018
Revenue 916 826 4,729 4,419 721 454 23,673 22,635 35 39
Profit/loss from continuing operations15) 16) 17) 18) 19) 916 826 325 319 –1,511 –520 694 764 –1,316 –1,086
Profit (loss) for the year 916 826 325 319 –1,511 –520 694 764 –1,316 –1,086
Other comprehensive income for the year — — — — 85 — –9 –4 3 8
Total comprehensive income for the year 916 826 325 319 –1,426 –520 685 760 –1,313 –1,078
Dividends received from joint ventures during the year — — 49 240 — — — — — —
15) In V2 Plug-In Hybrid Vehicle Partnership HB the profit for the year includes depreciation and amortisation of MSEK –73 (–73).16) In Volvofinans Bank AB the profit for the year includes depreciation and amortisation of MSEK –6 (–4).17) In Polestar Automotive (Shanghai) Co., Ltd the loss for the year includes depreciation and amortisation of MSEK –276 (–33),
interest income of MSEK 124 (45) and interest expenses of MSEK –174 (–23).18) In Lynk & Co Investment Co., Ltd the profit for the year includes depreciation and amortisation of MSEK –1,268 (–877) and interest income of MSEK 14 (12).19) In Zenuity AB the loss for the year includes depreciation and amortisation of MSEK –113 (–92), interest income of MSEK 5 (4) and interest expenses of
MSEK –5 (–3).
Reconcilation of the summarised financial information presented to the carrying amount of its interest in joint ventures.
V2 Plug-In Hybrid Vehicle Partnership HB1)
Volvofinans Bank AB2) 11)
Polestar Automotive (Shanghai) Co., Ltd5) 12)
Lynk & Co Investment Co., Ltd4) 13) Zenuity AB3) 14)
Reconciliation of summarised financial information 2019 2018 2019 2018 2019 2018 2019 2018 2019 2018
Net asset of the joint venture 469 447 4,103 3,782 6,075 5,051 11,448 10,442 697 910
Proportion of the Group's ownership in the joint venture 50% 50% 50% 50% 50% 50% 30% 30% 50% 50%
Adjustments for differences in accounting principles –3 –27 — — — — — — — —
Goodwill — — 376 376 — — — — — —
Adjustments for Common control transaction — — — — — — 11 –7 — —
Elimination of intra-group profit, net of foreign exchange rate effect — — — — –1,843 –1,238 — — — —
Capital injection from investors other than Volvo Cars — — — — — — — — –139 –352
Obligation to cover accumulated losses classified as Non-current liabilities — — — — — — — — –210 –103
Carrying amount of the Group´s interest in joint ventures 232 197 2,427 2,267 1,195 1,288 3,446 3,126 — —
Significant restrictionsFor the Chinese joint venture companies, there are some restrictions on the Volvo Car Group's ability to access cash.
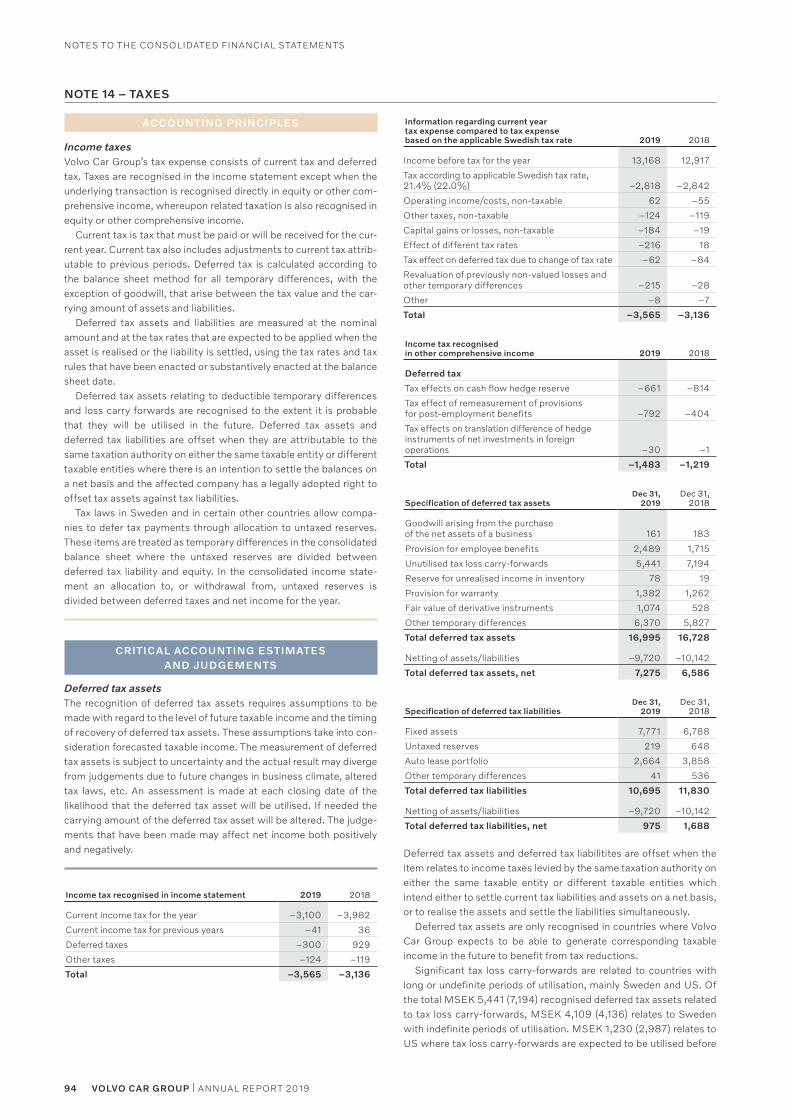
94 VOLVO CAR GROUP | ANNUAL REPORT 2019
NOTES TO THE CONSOLIDATED FINANCIAL STATEMENTS
ACCOUNTING PRINCIPLES
Income taxesVolvo Car Group’s tax expense consists of current tax and deferred tax. Taxes are recognised in the income statement except when the underlying transaction is recognised directly in equity or other com-prehensive income, whereupon related taxation is also recognised in equity or other comprehensive income.
Current tax is tax that must be paid or will be received for the cur-rent year. Current tax also includes adjustments to current tax attrib-utable to previous periods. Deferred tax is calculated according to the balance sheet method for all temporary differences, with the exception of goodwill, that arise between the tax value and the car-rying amount of assets and liabilities.
Deferred tax assets and liabilities are measured at the nominal amount and at the tax rates that are expected to be applied when the asset is realised or the liability is settled, using the tax rates and tax rules that have been enacted or substantively enacted at the balance sheet date.
Deferred tax assets relating to deductible temporary differences and loss carry forwards are recognised to the extent it is probable that they will be utilised in the future. Deferred tax assets and deferred tax liabilities are offset when they are attributable to the same taxation authority on either the same taxable entity or different taxable entities where there is an intention to settle the balances on a net basis and the affected company has a legally adopted right to offset tax assets against tax liabilities.
Tax laws in Sweden and in certain other countries allow compa-nies to defer tax payments through allocation to untaxed reserves. These items are treated as temporary differences in the consolidated balance sheet where the untaxed reserves are divided between deferred tax liability and equity. In the consolidated income state-ment an allocation to, or withdrawal from, untaxed reserves is divided between deferred taxes and net income for the year.
CRITICAL ACCOUNTING ESTIMATES AND JUDGEMENTS
Deferred tax assets The recognition of deferred tax assets requires assumptions to be made with regard to the level of future taxable income and the timing of recovery of deferred tax assets. These assumptions take into con-sideration forecasted taxable income. The measurement of deferred tax assets is subject to uncertainty and the actual result may diverge from judgements due to future changes in business climate, altered tax laws, etc. An assessment is made at each closing date of the likelihood that the deferred tax asset will be utilised. If needed the carrying amount of the deferred tax asset will be altered. The judge-ments that have been made may affect net income both positively and negatively.
Income tax recognised in income statement 2019 2018
Current income tax for the year –3,100 –3,982
Current income tax for previous years –41 36
Deferred taxes –300 929
Other taxes –124 –119
Total –3,565 –3,136
Information regarding current year tax expense compared to tax expense based on the applicable Swedish tax rate 2019 2018
Income before tax for the year 13,168 12,917
Tax according to applicable Swedish tax rate, 21.4% (22.0%) –2,818 –2,842
Operating income/costs, non-taxable 62 –55
Other taxes, non-taxable –124 –119
Capital gains or losses, non-taxable –184 –19
Effect of different tax rates –216 18
Tax effect on deferred tax due to change of tax rate –62 –84
Revaluation of previously non-valued losses and other temporary differences –215 –28
Other –8 –7
Total –3,565 –3,136
Income tax recognised in other comprehensive income 2019 2018
Deferred tax
Tax effects on cash flow hedge reserve –661 –814
Tax effect of remeasurement of provisions for post-employment benefits –792 –404
Tax effects on translation difference of hedge instruments of net investments in foreign operations –30 –1
Total –1,483 –1,219
Specification of deferred tax assetsDec 31,
2019Dec 31,
2018
Goodwill arising from the purchase of the net assets of a business 161 183
Provision for employee benefits 2,489 1,715
Unutilised tax loss carry-forwards 5,441 7,194
Reserve for unrealised income in inventory 78 19
Provision for warranty 1,382 1,262
Fair value of derivative instruments 1,074 528
Other temporary differences 6,370 5,827
Total deferred tax assets 16,995 16,728
Netting of assets/liabilities –9,720 –10,142
Total deferred tax assets, net 7,275 6,586
Specification of deferred tax liabilitiesDec 31,
2019Dec 31,
2018
Fixed assets 7,771 6,788
Untaxed reserves 219 648
Auto lease portfolio 2,664 3,858
Other temporary differences 41 536
Total deferred tax liabilities 10,695 11,830
Netting of assets/liabilities –9,720 –10,142
Total deferred tax liabilities, net 975 1,688
Deferred tax assets and deferred tax liabilitites are offset when the item relates to income taxes levied by the same taxation authority on either the same taxable entity or different taxable entities which intend either to settle current tax liabilities and assets on a net basis, or to realise the assets and settle the liabilities simultaneously.
Deferred tax assets are only recognised in countries where Volvo Car Group expects to be able to generate corresponding taxable income in the future to benefit from tax reductions.
Significant tax loss carry-forwards are related to countries with long or undefinite periods of utilisation, mainly Sweden and US. Of the total MSEK 5,441 (7,194) recognised deferred tax assets related to tax loss carry-forwards, MSEK 4,109 (4,136) relates to Sweden with indefinite periods of utilisation. MSEK 1,230 (2,987) relates to US where tax loss carry-forwards are expected to be utilised before
NOTE 14 – TAXES
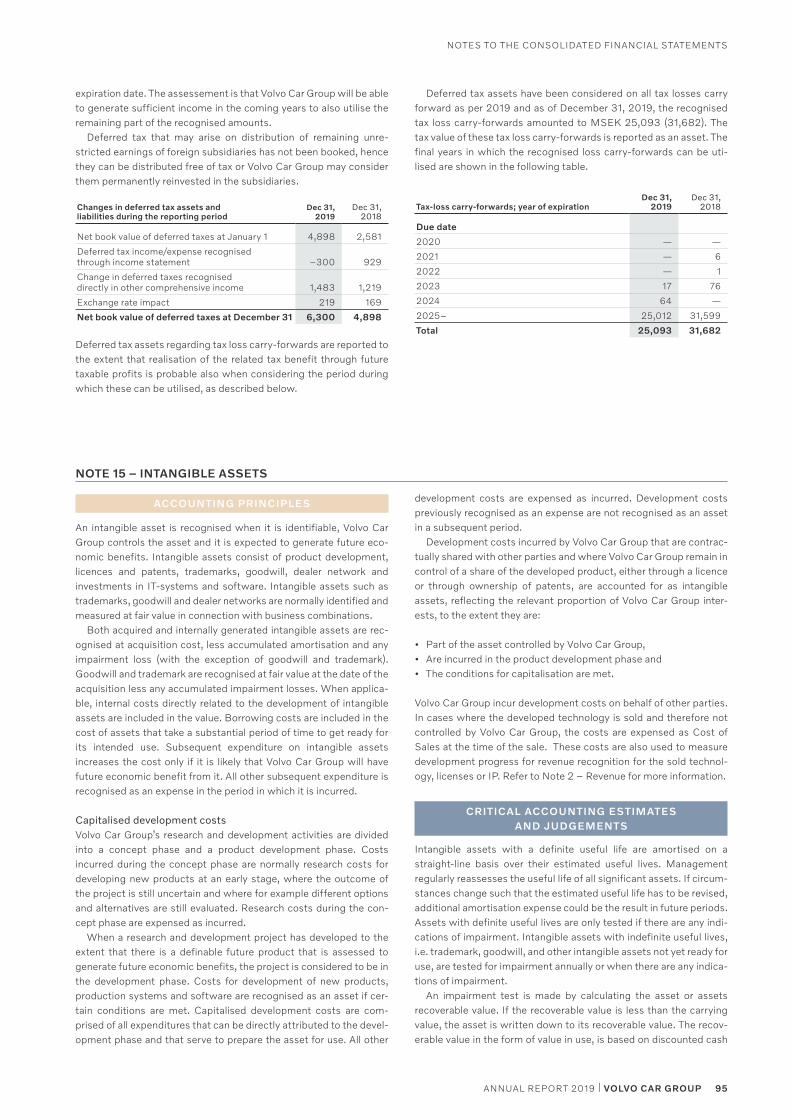
95ANNUAL REPORT 2019 | VOLVO CAR GROUP
NOTES TO THE CONSOLIDATED FINANCIAL STATEMENTS
expiration date. The assessement is that Volvo Car Group will be able to generate sufficient income in the coming years to also utilise the remaining part of the recognised amounts.
Deferred tax that may arise on distribution of remaining unre-stricted earnings of foreign subsidiaries has not been booked, hence they can be distributed free of tax or Volvo Car Group may consider them permanently reinvested in the subsidiaries.
Changes in deferred tax assets and liabilities during the reporting period
Dec 31, 2019
Dec 31, 2018
Net book value of deferred taxes at January 1 4,898 2,581
Deferred tax income/expense recognised through income statement –300 929
Change in deferred taxes recognised directly in other comprehensive income 1,483 1,219
Exchange rate impact 219 169
Net book value of deferred taxes at December 31 6,300 4,898
Deferred tax assets regarding tax loss carry-forwards are reported to the extent that realisation of the related tax benefit through future taxable profits is probable also when considering the period during which these can be utilised, as described below.
Deferred tax assets have been considered on all tax losses carry forward as per 2019 and as of December 31, 2019, the recognised tax loss carry-forwards amounted to MSEK 25,093 (31,682). The tax value of these tax loss carry-forwards is reported as an asset. The final years in which the recognised loss carry-forwards can be uti-lised are shown in the following table.
Tax-loss carry-forwards; year of expirationDec 31,
2019Dec 31,
2018
Due date
2020 — —
2021 — 6
2022 — 1
2023 17 76
2024 64 —
2025– 25,012 31,599
Total 25,093 31,682
ACCOUNTING PRINCIPLES
An intangible asset is recognised when it is identifiable, Volvo Car Group controls the asset and it is expected to generate future eco-nomic benefits. Intangible assets consist of product development, licences and patents, trademarks, goodwill, dealer network and investments in IT-systems and software. Intangible assets such as trademarks, goodwill and dealer networks are normally identified and measured at fair value in connection with business combinations.
Both acquired and internally generated intangible assets are rec-ognised at acquisition cost, less accumulated amortisation and any impairment loss (with the exception of goodwill and trademark). Goodwill and trademark are recognised at fair value at the date of the acquisition less any accumulated impairment losses. When applica-ble, internal costs directly related to the development of intangible assets are included in the value. Borrowing costs are included in the cost of assets that take a substantial period of time to get ready for its intended use. Subsequent expenditure on intangible assets increases the cost only if it is likely that Volvo Car Group will have future economic benefit from it. All other subsequent expenditure is recognised as an expense in the period in which it is incurred.
Capitalised development costsVolvo Car Group’s research and development activities are divided into a concept phase and a product development phase. Costs incurred during the concept phase are normally research costs for developing new products at an early stage, where the outcome of the project is still uncertain and where for example different options and alternatives are still evaluated. Research costs during the con-cept phase are expensed as incurred.
When a research and development project has developed to the extent that there is a definable future product that is assessed to generate future economic benefits, the project is considered to be in the development phase. Costs for development of new products, production systems and software are recognised as an asset if cer-tain conditions are met. Capitalised development costs are com-prised of all expenditures that can be directly attributed to the devel-opment phase and that serve to prepare the asset for use. All other
development costs are expensed as incurred. Development costs previously recognised as an expense are not recognised as an asset in a subsequent period.
Development costs incurred by Volvo Car Group that are contrac-tually shared with other parties and where Volvo Car Group remain in control of a share of the developed product, either through a licence or through ownership of patents, are accounted for as intangible assets, reflecting the relevant proportion of Volvo Car Group inter-ests, to the extent they are:
• Part of the asset controlled by Volvo Car Group, • Are incurred in the product development phase and • The conditions for capitalisation are met.
Volvo Car Group incur development costs on behalf of other parties. In cases where the developed technology is sold and therefore not controlled by Volvo Car Group, the costs are expensed as Cost of Sales at the time of the sale. These costs are also used to measure development progress for revenue recognition for the sold technol-ogy, licenses or IP. Refer to Note 2 – Revenue for more information.
CRITICAL ACCOUNTING ESTIMATES AND JUDGEMENTS
Intangible assets with a definite useful life are amortised on a straight-line basis over their estimated useful lives. Management regularly reassesses the useful life of all significant assets. If circum-stances change such that the estimated useful life has to be revised, additional amortisation expense could be the result in future periods. Assets with definite useful lives are only tested if there are any indi-cations of impairment. Intangible assets with indefinite useful lives, i.e. trademark, goodwill, and other intangible assets not yet ready for use, are tested for impairment annually or when there are any indica-tions of impairment.
An impairment test is made by calculating the asset or assets recoverable value. If the recoverable value is less than the carrying value, the asset is written down to its recoverable value. The recov-erable value in the form of value in use, is based on discounted cash
NOTE 15 – INTANGIBLE ASSETS
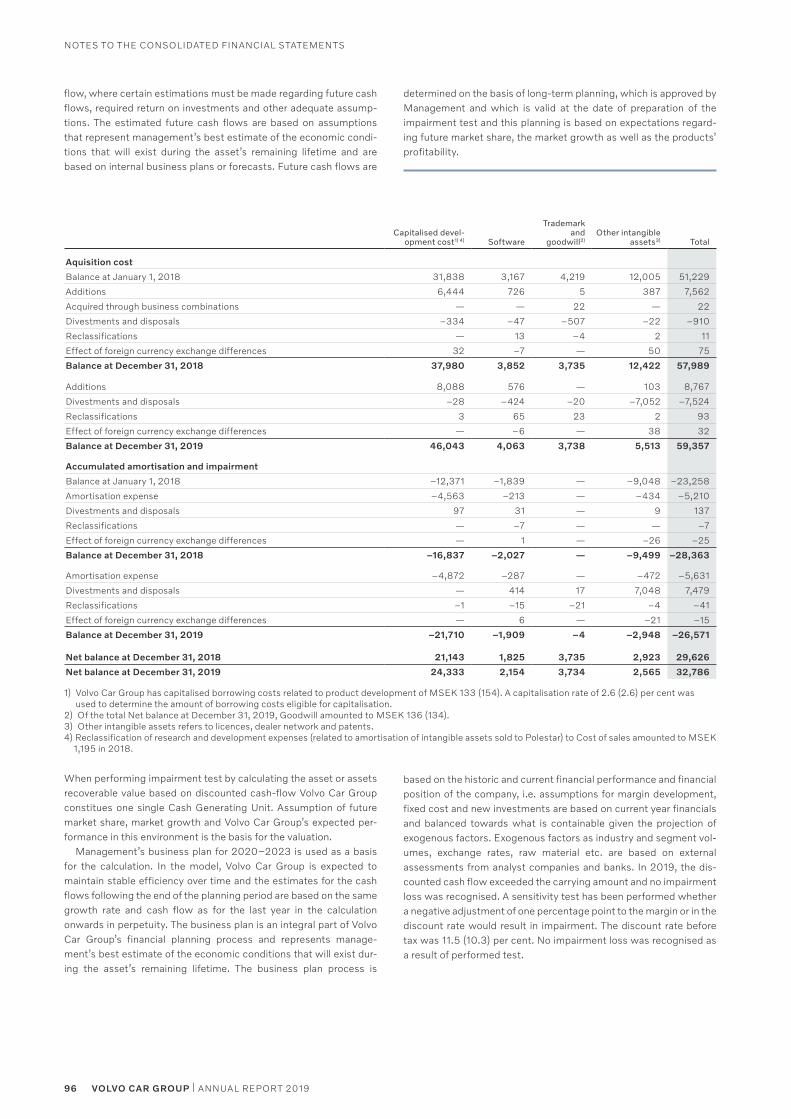
96 VOLVO CAR GROUP | ANNUAL REPORT 2019
NOTES TO THE CONSOLIDATED FINANCIAL STATEMENTS
Capitalised devel-opment cost1) 4) Software
Trademark and
goodwill2)Other intangible
assets3) Total
Aquisition cost
Balance at January 1, 2018 31,838 3,167 4,219 12,005 51,229
Additions 6,444 726 5 387 7,562
Acquired through business combinations — — 22 — 22
Divestments and disposals –334 –47 –507 –22 –910
Reclassifications — 13 –4 2 11
Effect of foreign currency exchange differences 32 –7 — 50 75
Balance at December 31, 2018 37,980 3,852 3,735 12,422 57,989
Additions 8,088 576 — 103 8,767
Divestments and disposals –28 –424 –20 –7,052 –7,524
Reclassifications 3 65 23 2 93
Effect of foreign currency exchange differences — –6 — 38 32
Balance at December 31, 2019 46,043 4,063 3,738 5,513 59,357
Accumulated amortisation and impairment
Balance at January 1, 2018 –12,371 –1,839 — –9,048 –23,258
Amortisation expense –4,563 –213 — –434 –5,210
Divestments and disposals 97 31 — 9 137
Reclassifications — –7 — — –7
Effect of foreign currency exchange differences — 1 — –26 –25
Balance at December 31, 2018 –16,837 –2,027 — –9,499 –28,363
Amortisation expense –4,872 –287 — –472 –5,631
Divestments and disposals — 414 17 7,048 7,479
Reclassifications –1 –15 –21 –4 –41
Effect of foreign currency exchange differences — 6 — –21 –15
Balance at December 31, 2019 –21,710 –1,909 –4 –2,948 –26,571
Net balance at December 31, 2018 21,143 1,825 3,735 2,923 29,626
Net balance at December 31, 2019 24,333 2,154 3,734 2,565 32,786
1) Volvo Car Group has capitalised borrowing costs related to product development of MSEK 133 (154). A capitalisation rate of 2.6 (2.6) per cent was used to determine the amount of borrowing costs eligible for capitalisation.
2) Of the total Net balance at December 31, 2019, Goodwill amounted to MSEK 136 (134).3) Other intangible assets refers to licences, dealer network and patents.4) Reclassification of research and development expenses (related to amortisation of intangible assets sold to Polestar) to Cost of sales amounted to MSEK 1,195 in 2018.
When performing impairment test by calculating the asset or assets recoverable value based on discounted cash-flow Volvo Car Group constitues one single Cash Generating Unit. Assumption of future market share, market growth and Volvo Car Group’s expected per-formance in this environment is the basis for the valuation.
Management’s business plan for 2020–2023 is used as a basis for the calculation. In the model, Volvo Car Group is expected to maintain stable efficiency over time and the estimates for the cash flows following the end of the planning period are based on the same growth rate and cash flow as for the last year in the calculation onwards in perpetuity. The business plan is an integral part of Volvo Car Group’s financial planning process and represents manage-ment’s best estimate of the economic conditions that will exist dur-ing the asset’s remaining lifetime. The business plan process is
based on the historic and current financial performance and financial position of the company, i.e. assumptions for margin development, fixed cost and new investments are based on current year financials and balanced towards what is containable given the projection of exogenous factors. Exogenous factors as industry and segment vol-umes, exchange rates, raw material etc. are based on external assessments from analyst companies and banks. In 2019, the dis-counted cash flow exceeded the carrying amount and no impairment loss was recognised. A sensitivity test has been performed whether a negative adjustment of one percentage point to the margin or in the discount rate would result in impairment. The discount rate before tax was 11.5 (10.3) per cent. No impairment loss was recognised as a result of performed test.
flow, where certain estimations must be made regarding future cash flows, required return on investments and other adequate assump-tions. The estimated future cash flows are based on assumptions that represent management’s best estimate of the economic condi-tions that will exist during the asset’s remaining lifetime and are based on internal business plans or forecasts. Future cash flows are
determined on the basis of long-term planning, which is approved by Management and which is valid at the date of preparation of the impairment test and this planning is based on expectations regard-ing future market share, the market growth as well as the products’ profitability.
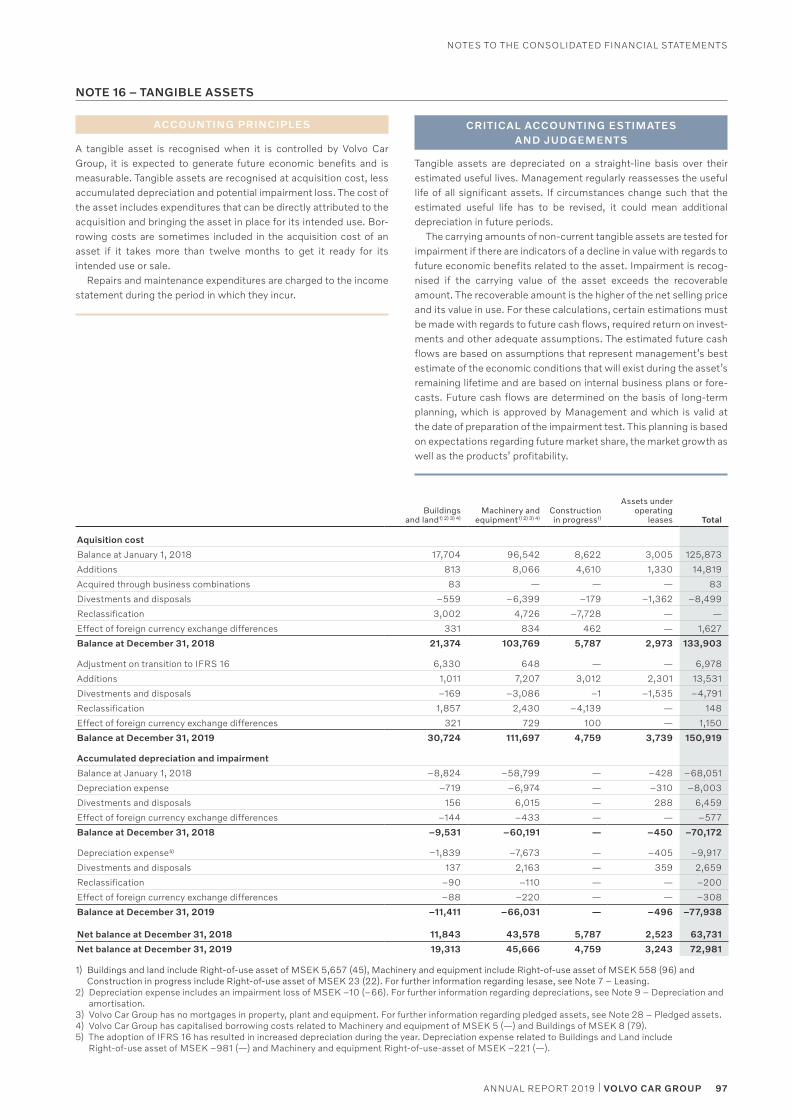
NOTE 16 – TANGIBLE ASSETS
ACCOUNTING PRINCIPLES
A tangible asset is recognised when it is controlled by Volvo Car Group, it is expected to generate future economic benefits and is measurable. Tangible assets are recognised at acquisition cost, less accumulated depreciation and potential impairment loss. The cost of the asset includes expenditures that can be directly attributed to the acquisition and bringing the asset in place for its intended use. Bor-rowing costs are sometimes included in the acquisition cost of an asset if it takes more than twelve months to get it ready for its intended use or sale.
Repairs and maintenance expenditures are charged to the income statement during the period in which they incur.
CRITICAL ACCOUNTING ESTIMATES AND JUDGEMENTS
Tangible assets are depreciated on a straight-line basis over their estimated useful lives. Management regularly reassesses the useful life of all significant assets. If circumstances change such that the estimated useful life has to be revised, it could mean additional depreciation in future periods.
The carrying amounts of non-current tangible assets are tested for impairment if there are indicators of a decline in value with regards to future economic benefits related to the asset. Impairment is recog-nised if the carrying value of the asset exceeds the recoverable amount. The recoverable amount is the higher of the net selling price and its value in use. For these calculations, certain estimations must be made with regards to future cash flows, required return on invest-ments and other adequate assumptions. The estimated future cash flows are based on assumptions that represent management’s best estimate of the economic conditions that will exist during the asset’s remaining lifetime and are based on internal business plans or fore-casts. Future cash flows are determined on the basis of long-term planning, which is approved by Management and which is valid at the date of preparation of the impairment test. This planning is based on expectations regarding future market share, the market growth as well as the products’ profitability.
Buildings and land1) 2) 3) 4)
Machinery and equipment1) 2) 3) 4)
Construction in progress1)
Assets under operating
leases Total
Aquisition cost
Balance at January 1, 2018 17,704 96,542 8,622 3,005 125,873
Additions 813 8,066 4,610 1,330 14,819
Acquired through business combinations 83 — — — 83
Divestments and disposals –559 –6,399 –179 –1,362 –8,499
Reclassification 3,002 4,726 –7,728 — —
Effect of foreign currency exchange differences 331 834 462 — 1,627
Balance at December 31, 2018 21,374 103,769 5,787 2,973 133,903
Adjustment on transition to IFRS 16 6,330 648 — — 6,978
Additions 1,011 7,207 3,012 2,301 13,531
Divestments and disposals –169 –3,086 –1 –1,535 –4,791
Reclassification 1,857 2,430 –4,139 — 148
Effect of foreign currency exchange differences 321 729 100 — 1,150
Balance at December 31, 2019 30,724 111,697 4,759 3,739 150,919
Accumulated depreciation and impairment
Balance at January 1, 2018 –8,824 –58,799 — –428 –68,051
Depreciation expense –719 –6,974 — –310 –8,003
Divestments and disposals 156 6,015 — 288 6,459
Effect of foreign currency exchange differences –144 –433 — — –577
Balance at December 31, 2018 –9,531 –60,191 — –450 –70,172
Depreciation expense5) –1,839 –7,673 — –405 –9,917
Divestments and disposals 137 2,163 — 359 2,659
Reclassification –90 –110 — — –200
Effect of foreign currency exchange differences –88 –220 — — –308
Balance at December 31, 2019 –11,411 –66,031 — –496 –77,938
Net balance at December 31, 2018 11,843 43,578 5,787 2,523 63,731
Net balance at December 31, 2019 19,313 45,666 4,759 3,243 72,981
1) Buildings and land include Right-of-use asset of MSEK 5,657 (45), Machinery and equipment include Right-of-use asset of MSEK 558 (96) and Construction in progress include Right-of-use asset of MSEK 23 (22). For further information regarding lesase, see Note 7 – Leasing.
2) Depreciation expense includes an impairment loss of MSEK –10 (–66). For further information regarding depreciations, see Note 9 – Depreciation and amortisation.
3) Volvo Car Group has no mortgages in property, plant and equipment. For further information regarding pledged assets, see Note 28 – Pledged assets. 4) Volvo Car Group has capitalised borrowing costs related to Machinery and equipment of MSEK 5 (—) and Buildings of MSEK 8 (79).5) The adoption of IFRS 16 has resulted in increased depreciation during the year. Depreciation expense related to Buildings and Land include
Right-of-use asset of MSEK –981 (—) and Machinery and equipment Right-of-use-asset of MSEK –221 (—).
97ANNUAL REPORT 2019 | VOLVO CAR GROUP
NOTES TO THE CONSOLIDATED FINANCIAL STATEMENTS
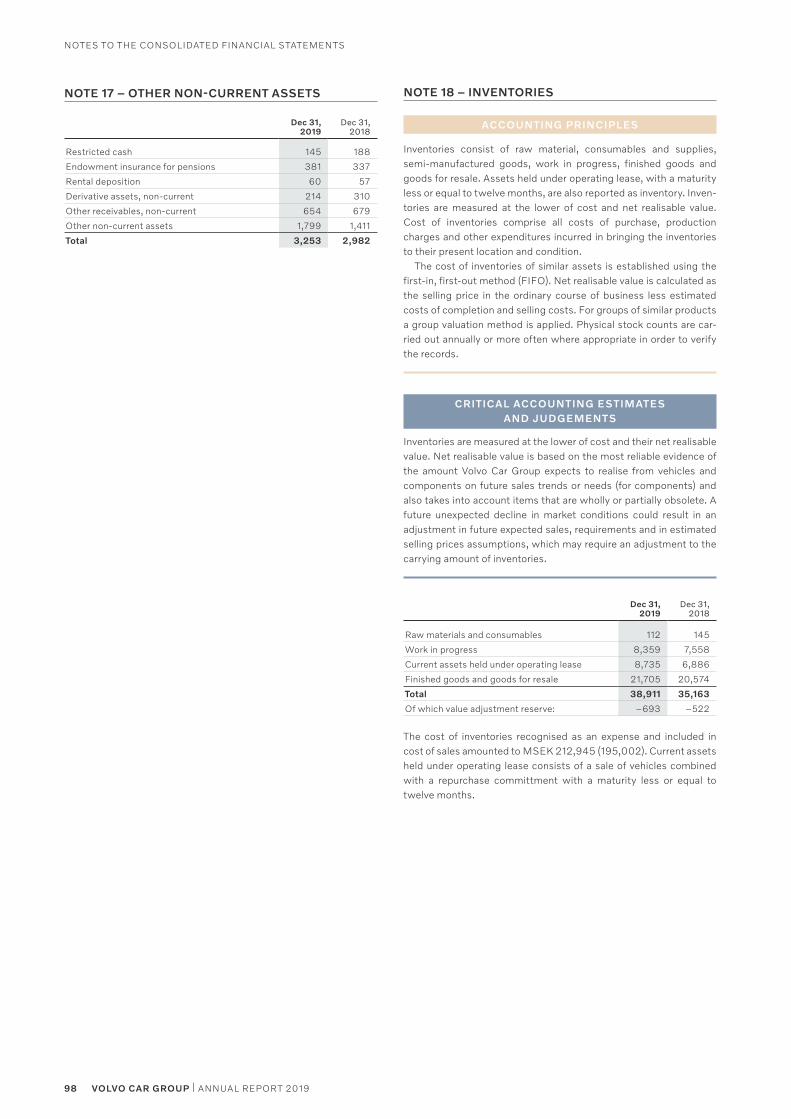
NOTE 17 – OTHER NON-CURRENT ASSETS
Dec 31, 2019
Dec 31, 2018
Restricted cash 145 188
Endowment insurance for pensions 381 337
Rental deposition 60 57
Derivative assets, non-current 214 310
Other receivables, non-current 654 679
Other non-current assets 1,799 1,411
Total 3,253 2,982
NOTE 18 – INVENTORIES
ACCOUNTING PRINCIPLES
Inventories consist of raw material, consumables and supplies, semi-manufactured goods, work in progress, finished goods and goods for resale. Assets held under operating lease, with a maturity less or equal to twelve months, are also reported as inventory. Inven-tories are measured at the lower of cost and net realisable value. Cost of inventories comprise all costs of purchase, production charges and other expenditures incurred in bringing the inventories to their present location and condition.
The cost of inventories of similar assets is established using the first-in, first-out method (FIFO). Net realisable value is calculated as the selling price in the ordinary course of business less estimated costs of completion and selling costs. For groups of similar products a group valuation method is applied. Physical stock counts are car-ried out annually or more often where appropriate in order to verify the records.
CRITICAL ACCOUNTING ESTIMATES AND JUDGEMENTS
Inventories are measured at the lower of cost and their net realisable value. Net realisable value is based on the most reliable evidence of the amount Volvo Car Group expects to realise from vehicles and components on future sales trends or needs (for components) and also takes into account items that are wholly or partially obsolete. A future unexpected decline in market conditions could result in an adjustment in future expected sales, requirements and in estimated selling prices assumptions, which may require an adjustment to the carrying amount of inventories.
Dec 31, 2019
Dec 31, 2018
Raw materials and consumables 112 145
Work in progress 8,359 7,558
Current assets held under operating lease 8,735 6,886
Finished goods and goods for resale 21,705 20,574
Total 38,911 35,163
Of which value adjustment reserve: –693 –522
The cost of inventories recognised as an expense and included in cost of sales amounted to MSEK 212,945 (195,002). Current assets held under operating lease consists of a sale of vehicles combined with a repurchase committment with a maturity less or equal to twelve months.
98 VOLVO CAR GROUP | ANNUAL REPORT 2019
NOTES TO THE CONSOLIDATED FINANCIAL STATEMENTS
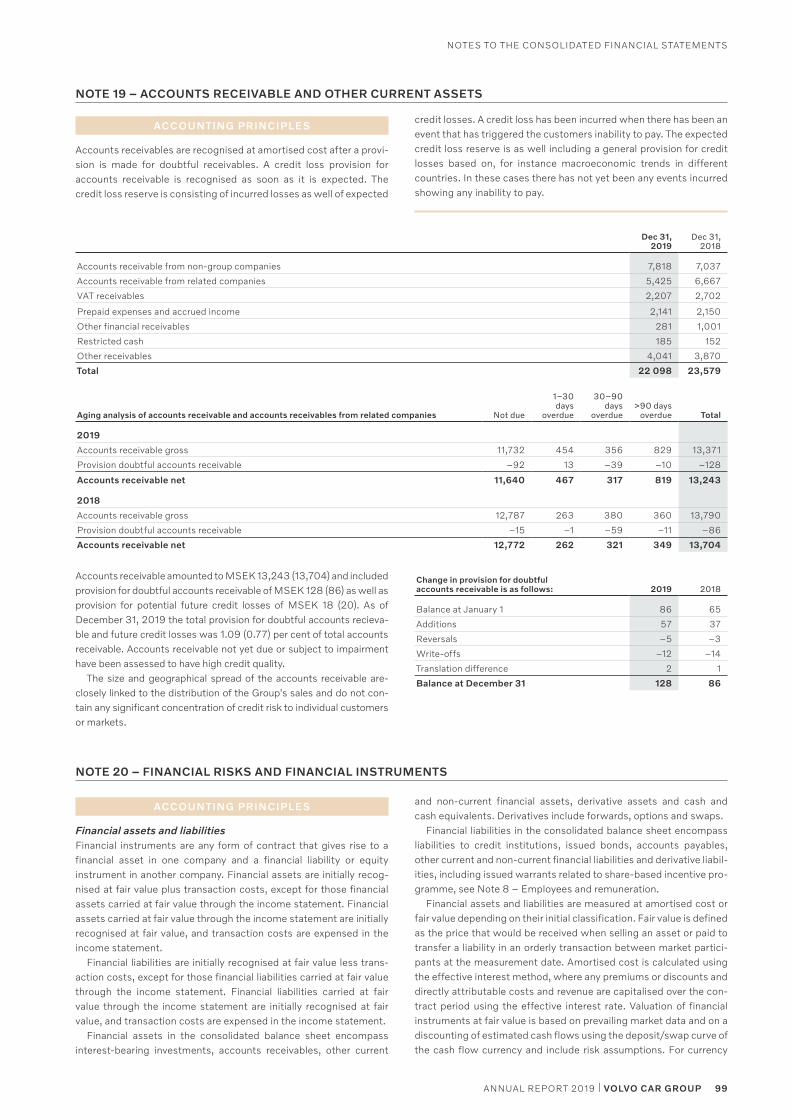
99ANNUAL REPORT 2019 | VOLVO CAR GROUP
NOTES TO THE CONSOLIDATED FINANCIAL STATEMENTS
Accounts receivable amounted to MSEK 13,243 (13,704) and included provision for doubtful accounts receivable of MSEK 128 (86) as well as provision for potential future credit losses of MSEK 18 (20). As of December 31, 2019 the total provision for doubtful accounts recieva-ble and future credit losses was 1.09 (0.77) per cent of total accounts receivable. Accounts receivable not yet due or subject to impairment have been assessed to have high credit quality.
The size and geographical spread of the accounts receivable are-closely linked to the distribution of the Group's sales and do not con-tain any significant concentration of credit risk to individual customers or markets.
ACCOUNTING PRINCIPLES
Financial assets and liabilitiesFinancial instruments are any form of contract that gives rise to a financial asset in one company and a financial liability or equity instrument in another company. Financial assets are initially recog-nised at fair value plus transaction costs, except for those financial assets carried at fair value through the income statement. Financial assets carried at fair value through the income statement are initially recognised at fair value, and transaction costs are expensed in the income statement.
Financial liabilities are initially recognised at fair value less trans-action costs, except for those financial liabilities carried at fair value through the income statement. Financial liabilities carried at fair value through the income statement are initially recognised at fair value, and transaction costs are expensed in the income statement.
Financial assets in the consolidated balance sheet encompass interest-bearing investments, accounts receivables, other current
and non-current financial assets, derivative assets and cash and cash equivalents. Derivatives include forwards, options and swaps.
Financial liabilities in the consolidated balance sheet encompass liabilities to credit institutions, issued bonds, accounts payables, other current and non-current financial liabilities and derivative liabil-ities, including issued warrants related to share-based incentive pro-gramme, see Note 8 – Employees and remuneration.
Financial assets and liabilities are measured at amortised cost or fair value depending on their initial classification. Fair value is defined as the price that would be received when selling an asset or paid to transfer a liability in an orderly transaction between market partici-pants at the measurement date. Amortised cost is calculated using the effective interest method, where any premiums or discounts and directly attributable costs and revenue are capitalised over the con-tract period using the effective interest rate. Valuation of financial instruments at fair value is based on prevailing market data and on a discounting of estimated cash flows using the deposit/swap curve of the cash flow currency and include risk assumptions. For currency
Change in provision for doubtful accounts receivable is as follows: 2019 2018
Balance at January 1 86 65
Additions 57 37
Reversals –5 –3
Write-offs –12 –14
Translation difference 2 1
Balance at December 31 128 86
Dec 31, 2019
Dec 31, 2018
Accounts receivable from non-group companies 7,818 7,037
Accounts receivable from related companies 5,425 6,667
VAT receivables 2,207 2,702
Prepaid expenses and accrued income 2,141 2,150
Other financial receivables 281 1,001
Restricted cash 185 152
Other receivables 4,041 3,870
Total 22 098 23,579
Aging analysis of accounts receivable and accounts receivables from related companies Not due
1–30 days
overdue
30–90 days
overdue>90 days
overdue Total
2019
Accounts receivable gross 11,732 454 356 829 13,371
Provision doubtful accounts receivable –92 13 –39 –10 –128
Accounts receivable net 11,640 467 317 819 13,243
2018
Accounts receivable gross 12,787 263 380 360 13,790
Provision doubtful accounts receivable –15 –1 –59 –11 –86
Accounts receivable net 12,772 262 321 349 13,704
NOTE 20 – FINANCIAL RISKS AND FINANCIAL INSTRUMENTS
ACCOUNTING PRINCIPLES
Accounts receivables are recognised at amortised cost after a provi-sion is made for doubtful receivables. A credit loss provision for accounts receivable is recognised as soon as it is expected. The credit loss reserve is consisting of incurred losses as well of expected
NOTE 19 – ACCOUNTS RECEIVABLE AND OTHER CURRENT ASSETS
credit losses. A credit loss has been incurred when there has been an event that has triggered the customers inability to pay. The expected credit loss reserve is as well including a general provision for credit losses based on, for instance macroeconomic trends in different countries. In these cases there has not yet been any events incurred showing any inability to pay.
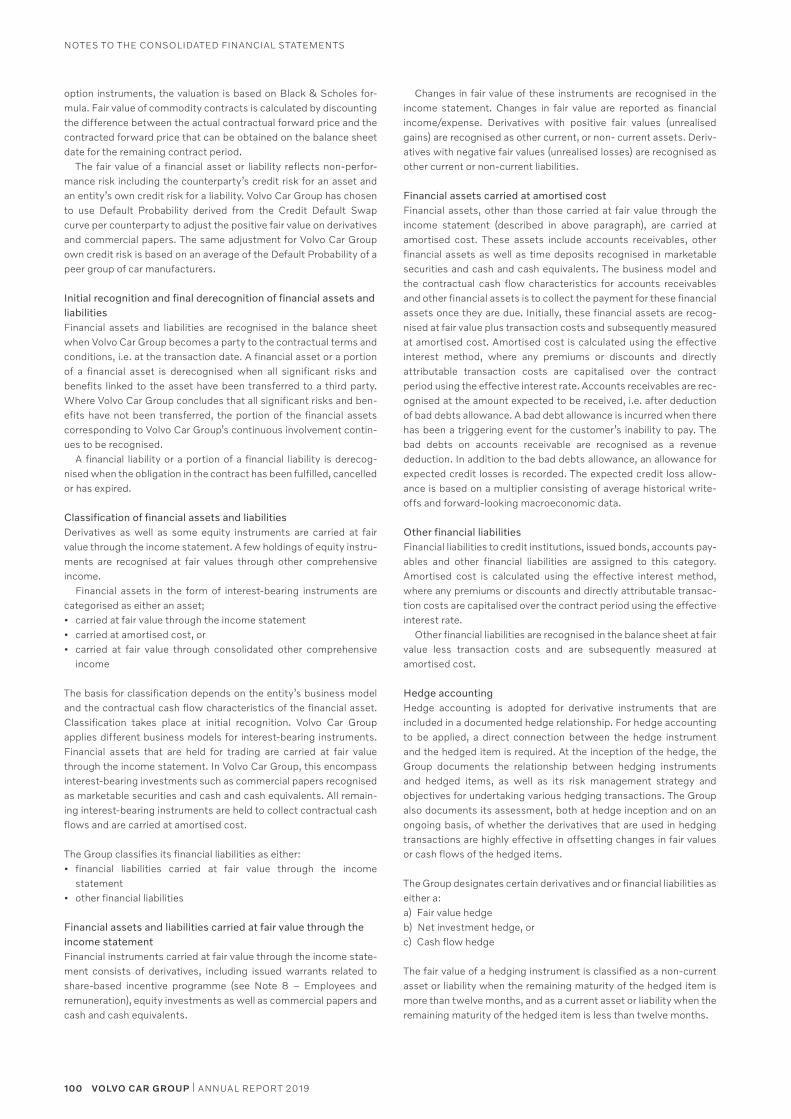
100 VOLVO CAR GROUP | ANNUAL REPORT 2019
NOTES TO THE CONSOLIDATED FINANCIAL STATEMENTS
option instruments, the valuation is based on Black & Scholes for-mula. Fair value of commodity contracts is calculated by discounting the difference between the actual contractual forward price and the contracted forward price that can be obtained on the balance sheet date for the remaining contract period.
The fair value of a financial asset or liability reflects non-perfor-mance risk including the counterparty’s credit risk for an asset and an entity’s own credit risk for a liability. Volvo Car Group has chosen to use Default Probability derived from the Credit Default Swap curve per counterparty to adjust the positive fair value on derivatives and commercial papers. The same adjustment for Volvo Car Group own credit risk is based on an average of the Default Probability of a peer group of car manufacturers.
Initial recognition and final derecognition of financial assets and liabilities Financial assets and liabilities are recognised in the balance sheet when Volvo Car Group becomes a party to the contractual terms and conditions, i.e. at the transaction date. A financial asset or a portion of a financial asset is derecognised when all significant risks and benefits linked to the asset have been transferred to a third party. Where Volvo Car Group concludes that all significant risks and ben-efits have not been transferred, the portion of the financial assets corresponding to Volvo Car Group’s continuous involvement contin-ues to be recognised.
A financial liability or a portion of a financial liability is derecog-nised when the obligation in the contract has been fulfilled, cancelled or has expired.
Classification of financial assets and liabilitiesDerivatives as well as some equity instruments are carried at fair value through the income statement. A few holdings of equity instru-ments are recognised at fair values through other comprehensive income.
Financial assets in the form of interest-bearing instruments are categorised as either an asset;• carried at fair value through the income statement• carried at amortised cost, or• carried at fair value through consolidated other comprehensive
income
The basis for classification depends on the entity’s business model and the contractual cash flow characteristics of the financial asset. Classification takes place at initial recognition. Volvo Car Group applies different business models for interest-bearing instruments. Financial assets that are held for trading are carried at fair value through the income statement. In Volvo Car Group, this encompass interest-bearing investments such as commercial papers recognised as marketable securities and cash and cash equivalents. All remain-ing interest-bearing instruments are held to collect contractual cash flows and are carried at amortised cost.
The Group classifies its financial liabilities as either:• financial liabilities carried at fair value through the income
statement • other financial liabilities
Financial assets and liabilities carried at fair value through the income statement Financial instruments carried at fair value through the income state-ment consists of derivatives, including issued warrants related to share-based incentive programme (see Note 8 – Employees and remuneration), equity investments as well as commercial papers and cash and cash equivalents.
Changes in fair value of these instruments are recognised in the income statement. Changes in fair value are reported as financial income/expense. Derivatives with positive fair values (unrealised gains) are recognised as other current, or non- current assets. Deriv-atives with negative fair values (unrealised losses) are recognised as other current or non-current liabilities.
Financial assets carried at amortised costFinancial assets, other than those carried at fair value through the income statement (described in above paragraph), are carried at amortised cost. These assets include accounts receivables, other financial assets as well as time deposits recognised in marketable securities and cash and cash equivalents. The business model and the contractual cash flow characteristics for accounts receivables and other financial assets is to collect the payment for these financial assets once they are due. Initially, these financial assets are recog-nised at fair value plus transaction costs and subsequently measured at amortised cost. Amortised cost is calculated using the effective interest method, where any premiums or discounts and directly attributable transaction costs are capitalised over the contract period using the effective interest rate. Accounts receivables are rec-ognised at the amount expected to be received, i.e. after deduction of bad debts allowance. A bad debt allowance is incurred when there has been a triggering event for the customer’s inability to pay. The bad debts on accounts receivable are recognised as a revenue deduction. In addition to the bad debts allowance, an allowance for expected credit losses is recorded. The expected credit loss allow-ance is based on a multiplier consisting of average historical write-offs and forward-looking macroeconomic data.
Other financial liabilitiesFinancial liabilities to credit institutions, issued bonds, accounts pay-ables and other financial liabilities are assigned to this category. Amortised cost is calculated using the effective interest method, where any premiums or discounts and directly attributable transac-tion costs are capitalised over the contract period using the effective interest rate.
Other financial liabilities are recognised in the balance sheet at fair value less transaction costs and are subsequently measured at amortised cost.
Hedge accountingHedge accounting is adopted for derivative instruments that are included in a documented hedge relationship. For hedge accounting to be applied, a direct connection between the hedge instrument and the hedged item is required. At the inception of the hedge, the Group documents the relationship between hedging instruments and hedged items, as well as its risk management strategy and objectives for undertaking various hedging transactions. The Group also documents its assessment, both at hedge inception and on an ongoing basis, of whether the derivatives that are used in hedging transactions are highly effective in offsetting changes in fair values or cash flows of the hedged items.
The Group designates certain derivatives and or financial liabilities as either a: a) Fair value hedgeb) Net investment hedge, orc) Cash flow hedge
The fair value of a hedging instrument is classified as a non-current asset or liability when the remaining maturity of the hedged item is more than twelve months, and as a current asset or liability when the remaining maturity of the hedged item is less than twelve months.
101ANNUAL REPORT 2019 | VOLVO CAR GROUP
NOTES TO THE CONSOLIDATED FINANCIAL STATEMENTS
a) Fair value hedgeThe purpose of a fair value hedge is to hedge the variability in the recorded fair value adjustment of fixed-rate debt (issued bond) from changes in the relevant benchmark yield curve for its entire term by converting fixed interest payments to a floating rate (e.g. STIBOR or LIBOR) by using interest rate swaps (IRS). The credit risk is not hedged. The fixed leg of the IRS is matched against the cash flows of the hedged loan/bond. Hereby, the fixed-rate bond is converted into a floating-rate debt. Changes in the fair value of derivatives that are designated and qualify as fair value hedges are recorded in the income statement, together with any changes in the fair value adjustment related to the interest component of the hedged liability (issued bond) that are attributable to the hedged risk. Both gains and losses relating to the interest rate swaps hedging fixed rate borrow-ings and the changes in the fair value of the hedged fixed rate bor-rowings attributable to interest rate risk are recognised in the income statement within Financial expenses.
If the hedge no longer meets the criteria for hedge accounting, the adjustment to the carrying amount of a hedged item for which the effective interest method is used is amortised to the income state-ment over the remaining period to maturity.
b) Net investment hedgeHedging of net investments in foreign operations refers to hedges held to reduce the effect of changes in the value of a net investment in a foreign operation due to changes in foreign exchange rates. The fair value changes on the hedge instrument are recognised in other comprehensive income.
In the event of a divestment, the accumulated result from the hedge is immediately transferred from the hedge reserve in equity to the income statement.
c) Cash flow hedgeCash flow hedging refers to the hedging of expected future commer-cial cash flows in foreign currencies against currency rate risks, as well as for the purpose of hedging expected future commodity con-sumption against commodity price risk. In cash flow hedge account-ing the changes in fair value of the hedging instruments is recognised in other comprehensive income and accumulated in the other reserves in equity. These reserves are recycled to the income statement in the same period as an underlying sales/cost of sales transaction is being recognised in the income statement. The effect from realised cash flow hedges is classified as Revenue and Cost of sales, respectively, depending on the underlying substance of the transaction. The hedging relationship is regularly tested up until its maturity date. If the identified relationships are no longer deemed effective, the fluctuation in fair value on the hedging instrument from the last period the instrument was considered effective is recognised in the income statement. If the hedged transaction is no longer expected to occur, the hedge’s accumulated changes in value are immediately transferred from other comprehensive income to the income state-ment and are included in Operating income.
CRITICAL ACCOUNTING ESTIMATES AND JUDGEMENTS
Accounting for financial instruments includes performing certain estimates and judgements, among others:
• Applied business model with regards to the valuation of interest-bearing instruments: The main purpose of holding interest bearing assets is to collect contractual cash flows of inter-est and principal. Sales of recivables are not performed in that magnitude that the business model could be challenged. A major-ity of interest bearing assets will therefore be valued at amortised cost.
• Derecognition of accounts receivables: Invoiced sales are in certain cases subject to contracts for factoring with a third party (bank or financial institution). If the criteria for derecognition of accounts receivable are not fulfilled, the receivable remains recog-nised on the balance sheet.
• Recognition of fair value changes with regards to holdings of equity instruments: Securities (holdings of for instance equity instruments) include unlisted securities where it is difficult to value them at fair value regularly. Therefore they are revalued each time a transaction is performed and a current value is available.
Financial risksIn its operations, Volvo Car Group is exposed to various types of financial risks such as currency risk, funding and liquidity risk, inter-est rate risk, commodity price risk and credit risk.
Volvo Car Group's treasury function is responsible for manage-ment and control of these financial risks, it ensures that appropriate financing is in place through capital market transactions, loans and committed credit facilities and manages the Group’s liquidity. The management of financial risks is governed by Volvo Car Group's Financial Policy Framework which is approved by the Board of Directors and is subject to annual review. The policy is focused on minimising the effects from fluctuating financial markets on Volvo Car Group's financial earnings.
Currency riskThe currency exposure arises from the production in various countries, procurement and the mix of sales currencies. Relative changes in the currency rates have a direct impact on the Volvo Car Group's operating income, finance net, balance sheet and cash flow statement.
The currency risk is related to:• Expected future cash flows from sales and purchase in foreign
currencies (transaction risk)• Changes in value of assets and liabilities denominated in foreign
currencies (translation risk)• Net investments in foreign operations (translation risk)
Transaction exposure riskVolvo Car Group Financial Policy FrameworkThe currency transaction exposure risk arises from cash flows in other currencies than the presentation currency of the Group, which is SEK. Sales to different markets in combination with purchases in different currencies determine the transaction exposure.
The policy for currency transaction risk management states that up to 80 per cent of the future expected cash flows in the coming twenty-four months and up to 60 per cent of the future expected cash flows in the coming twenty-five to forty-eight months can be hedged with adequate financial instruments: options, forwards or combined instruments with maturities matching expected timing of
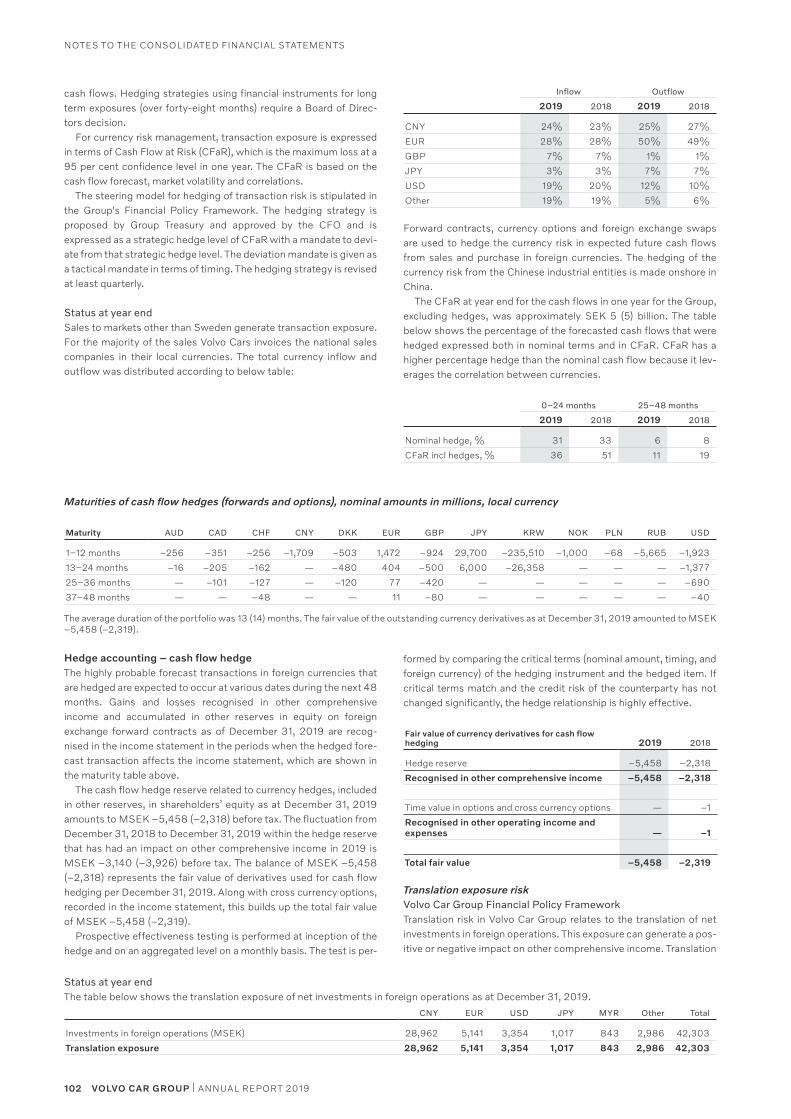
102 VOLVO CAR GROUP | ANNUAL REPORT 2019
NOTES TO THE CONSOLIDATED FINANCIAL STATEMENTS
Hedge accounting – cash flow hedgeThe highly probable forecast transactions in foreign currencies that are hedged are expected to occur at various dates during the next 48 months. Gains and losses recognised in other comprehensive income and accumulated in other reserves in equity on foreign exchange forward contracts as of December 31, 2019 are recog-nised in the income statement in the periods when the hedged fore-cast transaction affects the income statement, which are shown in the maturity table above.
The cash flow hedge reserve related to currency hedges, included in other reserves, in shareholders’ equity as at December 31, 2019 amounts to MSEK –5,458 (–2,318) before tax. The fluctuation from December 31, 2018 to December 31, 2019 within the hedge reserve that has had an impact on other comprehensive income in 2019 is MSEK –3,140 (–3,926) before tax. The balance of MSEK –5,458 (–2,318) represents the fair value of derivatives used for cash flow hedging per December 31, 2019. Along with cross currency options, recorded in the income statement, this builds up the total fair value of MSEK –5,458 (–2,319).
Prospective effectiveness testing is performed at inception of the hedge and on an aggregated level on a monthly basis. The test is per-
Status at year endThe table below shows the translation exposure of net investments in foreign operations as at December 31, 2019.
CNY EUR USD JPY MYR Other Total
Investments in foreign operations (MSEK) 28,962 5,141 3,354 1,017 843 2,986 42,303
Translation exposure 28,962 5,141 3,354 1,017 843 2,986 42,303
Maturities of cash flow hedges (forwards and options), nominal amounts in millions, local currency
Maturity AUD CAD CHF CNY DKK EUR GBP JPY KRW NOK PLN RUB USD
1–12 months –256 –351 –256 –1,709 –503 1,472 –924 29,700 –235,510 –1,000 –68 –5,665 –1,923
13–24 months –16 –205 –162 — –480 404 –500 6,000 –26,358 — — — –1,377
25–36 months — –101 –127 — –120 77 –420 — — — — — –690
37–48 months — — –48 — — 11 –80 — — — — — –40
The average duration of the portfolio was 13 (14) months. The fair value of the outstanding currency derivatives as at December 31, 2019 amounted to MSEK –5,458 (–2,319).
cash flows. Hedging strategies using financial instruments for long term exposures (over forty-eight months) require a Board of Direc-tors decision.
For currency risk management, transaction exposure is expressed in terms of Cash Flow at Risk (CFaR), which is the maximum loss at a 95 per cent confidence level in one year. The CFaR is based on the cash flow forecast, market volatility and correlations.
The steering model for hedging of transaction risk is stipulated in the Group's Financial Policy Framework. The hedging strategy is proposed by Group Treasury and approved by the CFO and is expressed as a strategic hedge level of CFaR with a mandate to devi-ate from that strategic hedge level. The deviation mandate is given as a tactical mandate in terms of timing. The hedging strategy is revised at least quarterly.
Status at year endSales to markets other than Sweden generate transaction exposure. For the majority of the sales Volvo Cars invoices the national sales companies in their local currencies. The total currency inflow and outflow was distributed according to below table:
Inflow Outflow
2019 2018 2019 2018
CNY 24% 23% 25% 27%
EUR 28% 28% 50% 49%
GBP 7% 7% 1% 1%
JPY 3% 3% 7% 7%
USD 19% 20% 12% 10%
Other 19% 19% 5% 6%
Forward contracts, currency options and foreign exchange swaps are used to hedge the currency risk in expected future cash flows from sales and purchase in foreign currencies. The hedging of the currency risk from the Chinese industrial entities is made onshore in China.
The CFaR at year end for the cash flows in one year for the Group, excluding hedges, was approximately SEK 5 (5) billion. The table below shows the percentage of the forecasted cash flows that were hedged expressed both in nominal terms and in CFaR. CFaR has a higher percentage hedge than the nominal cash flow because it lev-erages the correlation between currencies.
0–24 months 25–48 months
2019 2018 2019 2018
Nominal hedge, % 31 33 6 8
CFaR incl hedges, % 36 51 11 19
formed by comparing the critical terms (nominal amount, timing, and foreign currency) of the hedging instrument and the hedged item. If critical terms match and the credit risk of the counterparty has not changed significantly, the hedge relationship is highly effective.
Fair value of currency derivatives for cash flow hedging 2019 2018
Hedge reserve –5,458 –2,318
Recognised in other comprehensive income –5,458 –2,318
Time value in options and cross currency options — –1
Recognised in other operating income and expenses — –1
Total fair value –5,458 –2,319
Translation exposure riskVolvo Car Group Financial Policy FrameworkTranslation risk in Volvo Car Group relates to the translation of net investments in foreign operations. This exposure can generate a pos-itive or negative impact on other comprehensive income. Translation
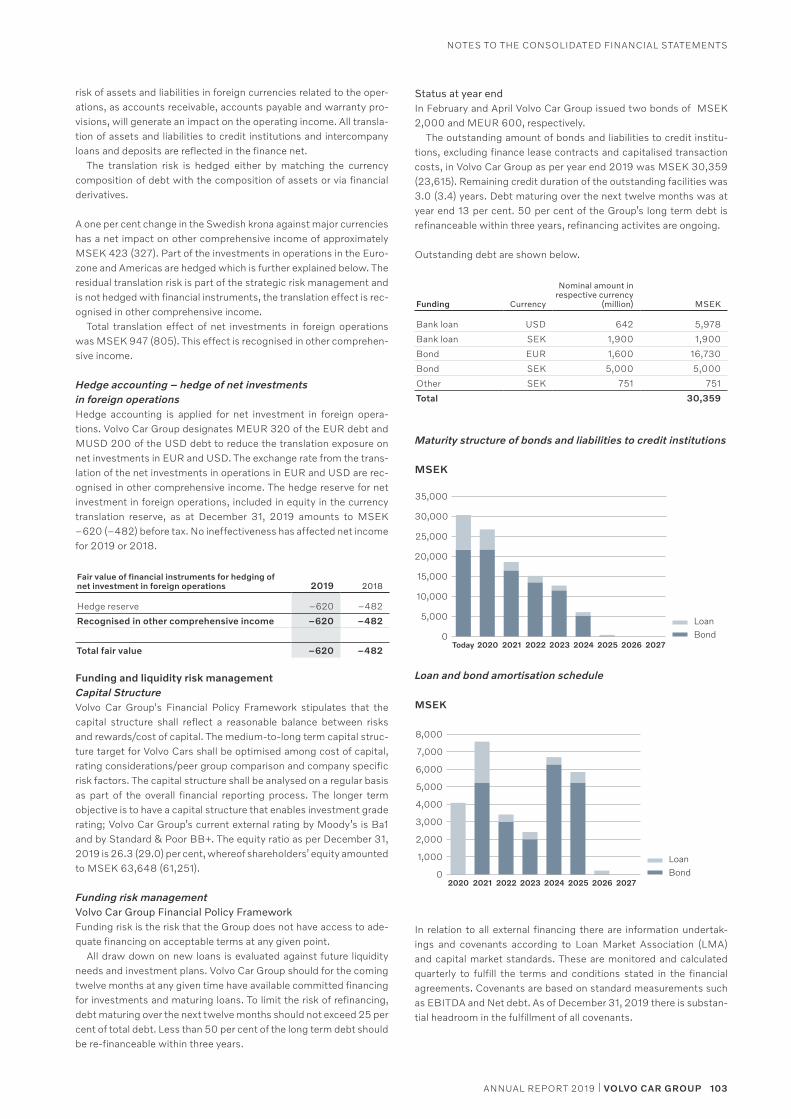
103ANNUAL REPORT 2019 | VOLVO CAR GROUP
NOTES TO THE CONSOLIDATED FINANCIAL STATEMENTS
risk of assets and liabilities in foreign currencies related to the oper-ations, as accounts receivable, accounts payable and warranty pro-visions, will generate an impact on the operating income. All transla-tion of assets and liabilities to credit institutions and intercompany loans and deposits are reflected in the finance net.
The translation risk is hedged either by matching the currency composition of debt with the composition of assets or via financial derivatives.
A one per cent change in the Swedish krona against major currencies has a net impact on other comprehensive income of approximately MSEK 423 (327). Part of the investments in operations in the Euro-zone and Americas are hedged which is further explained below. The residual translation risk is part of the strategic risk management and is not hedged with financial instruments, the translation effect is rec-ognised in other comprehensive income.
Total translation effect of net investments in foreign operations was MSEK 947 (805). This effect is recognised in other comprehen-sive income.
Hedge accounting – hedge of net investments in foreign operationsHedge accounting is applied for net investment in foreign opera-tions. Volvo Car Group designates MEUR 320 of the EUR debt and MUSD 200 of the USD debt to reduce the translation exposure on net investments in EUR and USD. The exchange rate from the trans-lation of the net investments in operations in EUR and USD are rec-ognised in other comprehensive income. The hedge reserve for net investment in foreign operations, included in equity in the currency translation reserve, as at December 31, 2019 amounts to MSEK –620 (–482) before tax. No ineffectiveness has affected net income for 2019 or 2018.
Fair value of financial instruments for hedging of net investment in foreign operations 2019 2018
Hedge reserve –620 –482
Recognised in other comprehensive income –620 –482
Total fair value –620 –482
Funding and liquidity risk managementCapital StructureVolvo Car Group's Financial Policy Framework stipulates that the capital structure shall reflect a reasonable balance between risks and rewards/cost of capital. The medium-to-long term capital struc-ture target for Volvo Cars shall be optimised among cost of capital, rating considerations/peer group comparison and company specific risk factors. The capital structure shall be analysed on a regular basis as part of the overall financial reporting process. The longer term objective is to have a capital structure that enables investment grade rating; Volvo Car Group’s current external rating by Moody’s is Ba1 and by Standard & Poor BB+. The equity ratio as per December 31, 2019 is 26.3 (29.0) per cent, whereof shareholders’ equity amounted to MSEK 63,648 (61,251).
Funding risk managementVolvo Car Group Financial Policy Framework Funding risk is the risk that the Group does not have access to ade-quate financing on acceptable terms at any given point.
All draw down on new loans is evaluated against future liquidity needs and investment plans. Volvo Car Group should for the coming twelve months at any given time have available committed financing for investments and maturing loans. To limit the risk of refinancing, debt maturing over the next twelve months should not exceed 25 per cent of total debt. Less than 50 per cent of the long term debt should be re-financeable within three years.
Status at year endIn February and April Volvo Car Group issued two bonds of MSEK 2,000 and MEUR 600, respectively.
The outstanding amount of bonds and liabilities to credit institu-tions, excluding finance lease contracts and capitalised transaction costs, in Volvo Car Group as per year end 2019 was MSEK 30,359 (23,615). Remaining credit duration of the outstanding facilities was 3.0 (3.4) years. Debt maturing over the next twelve months was at year end 13 per cent. 50 per cent of the Group’s long term debt is refinanceable within three years, refinancing activites are ongoing.
Outstanding debt are shown below.
Funding Currency
Nominal amount in respective currency
(million) MSEK
Bank loan USD 642 5,978
Bank loan SEK 1,900 1,900
Bond EUR 1,600 16,730
Bond SEK 5,000 5,000
Other SEK 751 751
Total 30,359
Maturity structure of bonds and liabilities to credit institutions
MSEK
LoanBond
Outstanding loans MSEK
0
15,000
10,000
5,000
20,000
25,000
35,000
30,000
20242023 2025 2026 2027202220212020Today
Loan and bond amortisation schedule
MSEK
20242023 2025 2026 2027202220212020
LoanBond
Loan and bond amortisation schedule MSEK
0
4,000
3,000
2,000
1,000
5,000
6,000
8,000
7,000
In relation to all external financing there are information undertak-ings and covenants according to Loan Market Association (LMA) and capital market standards. These are monitored and calculated quarterly to fulfill the terms and conditions stated in the financial agreements. Covenants are based on standard measurements such as EBITDA and Net debt. As of December 31, 2019 there is substan-tial headroom in the fulfillment of all covenants.
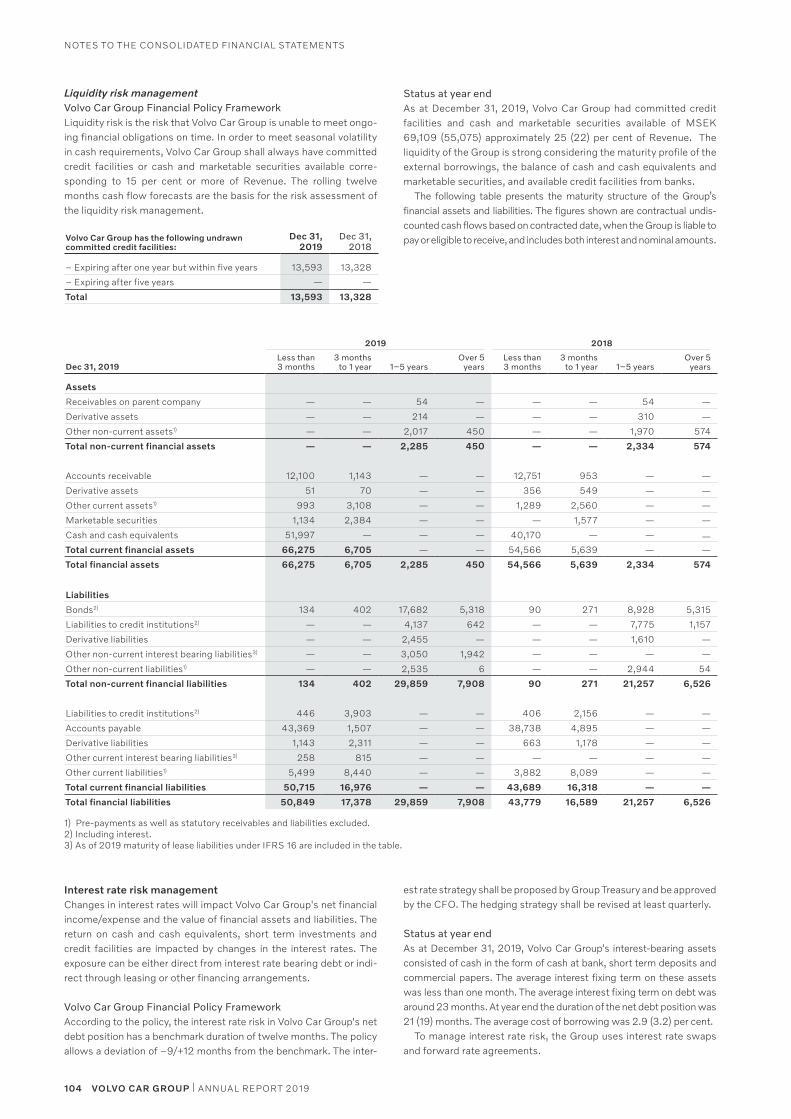
104 VOLVO CAR GROUP | ANNUAL REPORT 2019
NOTES TO THE CONSOLIDATED FINANCIAL STATEMENTS
Interest rate risk managementChanges in interest rates will impact Volvo Car Group's net financial income/expense and the value of financial assets and liabilities. The return on cash and cash equivalents, short term investments and credit facilities are impacted by changes in the interest rates. The exposure can be either direct from interest rate bearing debt or indi-rect through leasing or other financing arrangements.
Volvo Car Group Financial Policy FrameworkAccording to the policy, the interest rate risk in Volvo Car Group's net debt position has a benchmark duration of twelve months. The policy allows a deviation of –9/+12 months from the benchmark. The inter-
est rate strategy shall be proposed by Group Treasury and be approved by the CFO. The hedging strategy shall be revised at least quarterly.
Status at year endAs at December 31, 2019, Volvo Car Group's interest-bearing assets consisted of cash in the form of cash at bank, short term deposits and commercial papers. The average interest fixing term on these assets was less than one month. The average interest fixing term on debt was around 23 months. At year end the duration of the net debt position was 21 (19) months. The average cost of borrowing was 2.9 (3.2) per cent.
To manage interest rate risk, the Group uses interest rate swaps and forward rate agreements.
Liquidity risk managementVolvo Car Group Financial Policy FrameworkLiquidity risk is the risk that Volvo Car Group is unable to meet ongo-ing financial obligations on time. In order to meet seasonal volatility in cash requirements, Volvo Car Group shall always have committed credit facilities or cash and marketable securities available corre-sponding to 15 per cent or more of Revenue. The rolling twelve months cash flow forecasts are the basis for the risk assessment of the liquidity risk management.
Volvo Car Group has the following undrawncommitted credit facilities:
Dec 31, 2019
Dec 31, 2018
– Expiring after one year but within five years 13,593 13,328
– Expiring after five years — —
Total 13,593 13,328
Status at year endAs at December 31, 2019, Volvo Car Group had committed credit facilities and cash and marketable securities available of MSEK 69,109 (55,075) approximately 25 (22) per cent of Revenue. The liquidity of the Group is strong considering the maturity profile of the external borrowings, the balance of cash and cash equivalents and marketable securities, and available credit facilities from banks.
The following table presents the maturity structure of the Group’s financial assets and liabilities. The figures shown are contractual undis-counted cash flows based on contracted date, when the Group is liable to pay or eligible to receive, and includes both interest and nominal amounts.
2019 2018
Dec 31, 2019Less than 3 months
3 months to 1 year 1–5 years
Over 5 years
Less than 3 months
3 months to 1 year 1–5 years
Over 5 years
Assets
Receivables on parent company — — 54 — — — 54 —
Derivative assets — — 214 — — — 310 —
Other non-current assets1) — — 2,017 450 — — 1,970 574
Total non-current financial assets — — 2,285 450 — — 2,334 574
Accounts receivable 12,100 1,143 — — 12,751 953 — —
Derivative assets 51 70 — — 356 549 — —
Other current assets1) 993 3,108 — — 1,289 2,560 — —
Marketable securities 1,134 2,384 — — — 1,577 — —
Cash and cash equivalents 51,997 — — — 40,170 — — —Total current financial assets 66,275 6,705 — — 54,566 5,639 — —
Total financial assets 66,275 6,705 2,285 450 54,566 5,639 2,334 574
Liabilities
Bonds2) 134 402 17,682 5,318 90 271 8,928 5,315
Liabilities to credit institutions2) — — 4,137 642 — — 7,775 1,157
Derivative liabilities — — 2,455 — — — 1,610 —
Other non-current interest bearing liabilities3) — — 3,050 1,942 — — — —
Other non-current liabilities1) — — 2,535 6 — — 2,944 54
Total non-current financial liabilities 134 402 29,859 7,908 90 271 21,257 6,526
Liabilities to credit institutions2) 446 3,903 — — 406 2,156 — —
Accounts payable 43,369 1,507 — — 38,738 4,895 — —
Derivative liabilities 1,143 2,311 — — 663 1,178 — —
Other current interest bearing liabilities3) 258 815 — — — — — —
Other current liabilities1) 5,499 8,440 — — 3,882 8,089 — —
Total current financial liabilities 50,715 16,976 — — 43,689 16,318 — —
Total financial liabilities 50,849 17,378 29,859 7,908 43,779 16,589 21,257 6,526
1) Pre-payments as well as statutory receivables and liabilities excluded.2) Including interest.3) As of 2019 maturity of lease liabilities under IFRS 16 are included in the table.
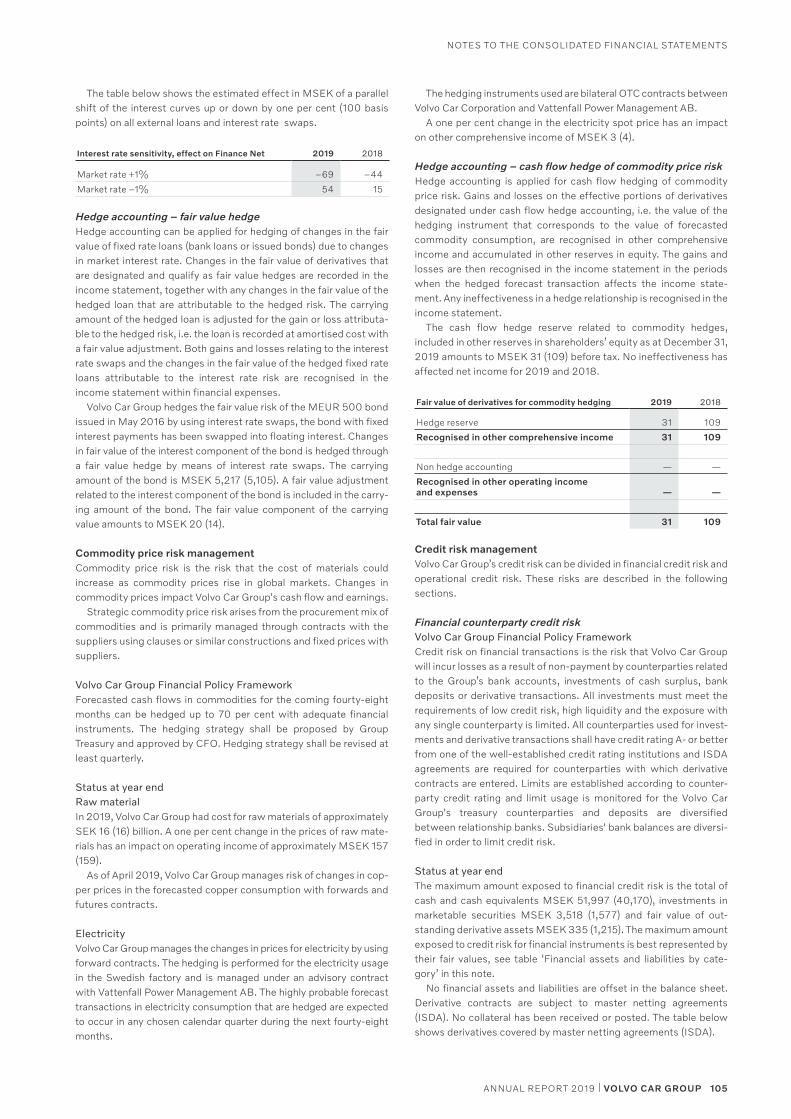
105ANNUAL REPORT 2019 | VOLVO CAR GROUP
NOTES TO THE CONSOLIDATED FINANCIAL STATEMENTS
The table below shows the estimated effect in MSEK of a parallel shift of the interest curves up or down by one per cent (100 basis points) on all external loans and interest rate swaps.
Interest rate sensitivity, effect on Finance Net 2019 2018
Market rate +1% –69 –44
Market rate –1% 54 15
Hedge accounting – fair value hedgeHedge accounting can be applied for hedging of changes in the fair value of fixed rate loans (bank loans or issued bonds) due to changes in market interest rate. Changes in the fair value of derivatives that are designated and qualify as fair value hedges are recorded in the income statement, together with any changes in the fair value of the hedged loan that are attributable to the hedged risk. The carrying amount of the hedged loan is adjusted for the gain or loss attributa-ble to the hedged risk, i.e. the loan is recorded at amortised cost with a fair value adjustment. Both gains and losses relating to the interest rate swaps and the changes in the fair value of the hedged fixed rate loans attributable to the interest rate risk are recognised in the income statement within financial expenses.
Volvo Car Group hedges the fair value risk of the MEUR 500 bond issued in May 2016 by using interest rate swaps, the bond with fixed interest payments has been swapped into floating interest. Changes in fair value of the interest component of the bond is hedged through a fair value hedge by means of interest rate swaps. The carrying amount of the bond is MSEK 5,217 (5,105). A fair value adjustment related to the interest component of the bond is included in the carry-ing amount of the bond. The fair value component of the carrying value amounts to MSEK 20 (14).
Commodity price risk managementCommodity price risk is the risk that the cost of materials could increase as commodity prices rise in global markets. Changes in commodity prices impact Volvo Car Group's cash flow and earnings.
Strategic commodity price risk arises from the procurement mix of commodities and is primarily managed through contracts with the suppliers using clauses or similar constructions and fixed prices with suppliers.
Volvo Car Group Financial Policy FrameworkForecasted cash flows in commodities for the coming fourty-eight months can be hedged up to 70 per cent with adequate financial instruments. The hedging strategy shall be proposed by Group Treasury and approved by CFO. Hedging strategy shall be revised at least quarterly.
Status at year end Raw materialIn 2019, Volvo Car Group had cost for raw materials of approximately SEK 16 (16) billion. A one per cent change in the prices of raw mate-rials has an impact on operating income of approximately MSEK 157 (159).
As of April 2019, Volvo Car Group manages risk of changes in cop-per prices in the forecasted copper consumption with forwards and futures contracts.
ElectricityVolvo Car Group manages the changes in prices for electricity by using forward contracts. The hedging is performed for the electricity usage in the Swedish factory and is managed under an advisory contract with Vattenfall Power Management AB. The highly probable forecast transactions in electricity consumption that are hedged are expected to occur in any chosen calendar quarter during the next fourty-eight months.
The hedging instruments used are bilateral OTC contracts between Volvo Car Corporation and Vattenfall Power Management AB.
A one per cent change in the electricity spot price has an impact on other comprehensive income of MSEK 3 (4).
Hedge accounting – cash flow hedge of commodity price riskHedge accounting is applied for cash flow hedging of commodity price risk. Gains and losses on the effective portions of derivatives designated under cash flow hedge accounting, i.e. the value of the hedging instrument that corresponds to the value of forecasted commodity consumption, are recognised in other comprehensive income and accumulated in other reserves in equity. The gains and losses are then recognised in the income statement in the periods when the hedged forecast transaction affects the income state-ment. Any ineffectiveness in a hedge relationship is recognised in the income statement.
The cash flow hedge reserve related to commodity hedges, included in other reserves in shareholders’ equity as at December 31, 2019 amounts to MSEK 31 (109) before tax. No ineffectiveness has affected net income for 2019 and 2018.
Fair value of derivatives for commodity hedging 2019 2018
Hedge reserve 31 109
Recognised in other comprehensive income 31 109
Non hedge accounting — —
Recognised in other operating income and expenses — —
Total fair value 31 109
Credit risk managementVolvo Car Group’s credit risk can be divided in financial credit risk and operational credit risk. These risks are described in the following sections.
Financial counterparty credit riskVolvo Car Group Financial Policy FrameworkCredit risk on financial transactions is the risk that Volvo Car Group will incur losses as a result of non-payment by counterparties related to the Group’s bank accounts, investments of cash surplus, bank deposits or derivative transactions. All investments must meet the requirements of low credit risk, high liquidity and the exposure with any single counterparty is limited. All counterparties used for invest-ments and derivative transactions shall have credit rating A- or better from one of the well-established credit rating institutions and ISDA agreements are required for counterparties with which derivative contracts are entered. Limits are established according to counter-party credit rating and limit usage is monitored for the Volvo Car Group's treasury counterparties and deposits are diversified between relationship banks. Subsidiaries' bank balances are diversi-fied in order to limit credit risk.
Status at year endThe maximum amount exposed to financial credit risk is the total of cash and cash equivalents MSEK 51,997 (40,170), investments in marketable securities MSEK 3,518 (1,577) and fair value of out-standing derivative assets MSEK 335 (1,215). The maximum amount exposed to credit risk for financial instruments is best represented by their fair values, see table ‘Financial assets and liabilities by cate-gory’ in this note.
No financial assets and liabilities are offset in the balance sheet. Derivative contracts are subject to master netting agreements (ISDA). No collateral has been received or posted. The table below shows derivatives covered by master netting agreements (ISDA).
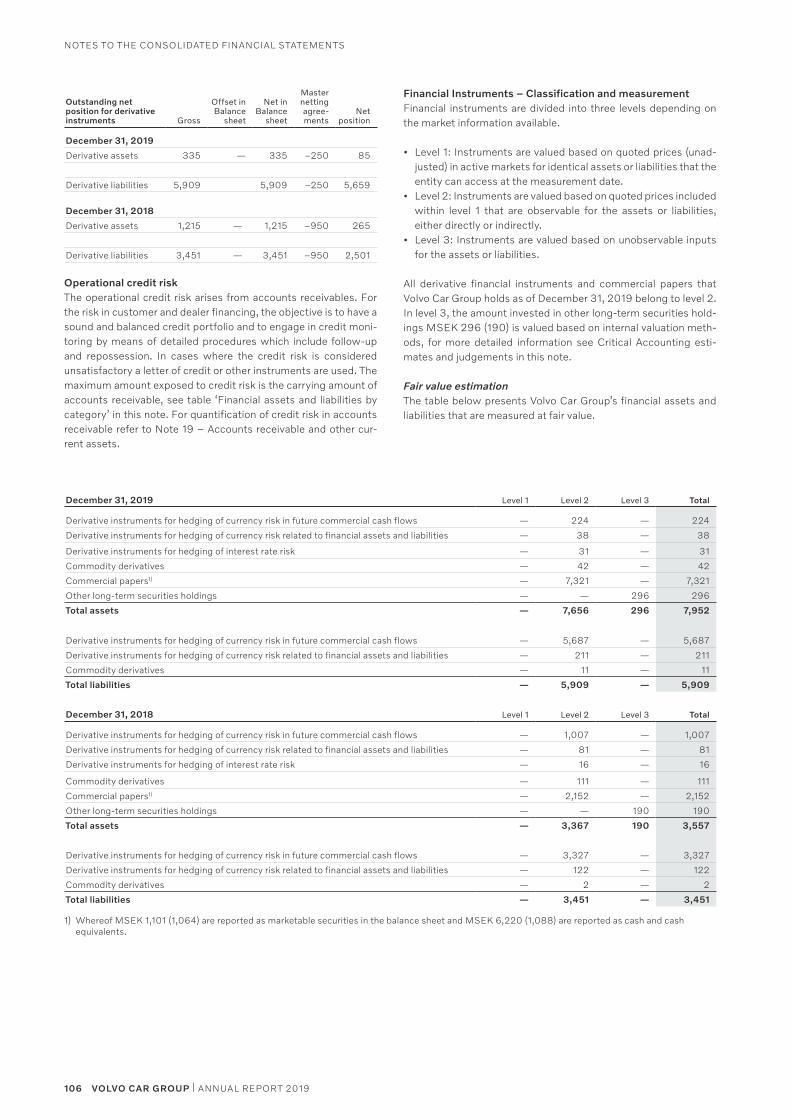
106 VOLVO CAR GROUP | ANNUAL REPORT 2019
NOTES TO THE CONSOLIDATED FINANCIAL STATEMENTS
December 31, 2019 Level 1 Level 2 Level 3 Total
Derivative instruments for hedging of currency risk in future commercial cash flows — 224 — 224
Derivative instruments for hedging of currency risk related to financial assets and liabilities — 38 — 38
Derivative instruments for hedging of interest rate risk — 31 — 31
Commodity derivatives — 42 — 42
Commercial papers1) — 7,321 — 7,321
Other long-term securities holdings — — 296 296
Total assets — 7,656 296 7,952
Derivative instruments for hedging of currency risk in future commercial cash flows — 5,687 — 5,687
Derivative instruments for hedging of currency risk related to financial assets and liabilities — 211 — 211
Commodity derivatives — 11 — 11
Total liabilities — 5,909 — 5,909
December 31, 2018 Level 1 Level 2 Level 3 Total
Derivative instruments for hedging of currency risk in future commercial cash flows — 1,007 — 1,007
Derivative instruments for hedging of currency risk related to financial assets and liabilities — 81 — 81
Derivative instruments for hedging of interest rate risk — 16 — 16
Commodity derivatives — 111 — 111
Commercial papers1) — 2,152 — 2,152
Other long-term securities holdings — — 190 190
Total assets — 3,367 190 3,557
Derivative instruments for hedging of currency risk in future commercial cash flows — 3,327 — 3,327
Derivative instruments for hedging of currency risk related to financial assets and liabilities — 122 — 122
Commodity derivatives — 2 — 2
Total liabilities — 3,451 — 3,451
1) Whereof MSEK 1,101 (1,064) are reported as marketable securities in the balance sheet and MSEK 6,220 (1,088) are reported as cash and cash equivalents.
Outstanding net position for derivative instruments Gross
Offset in Balance
sheet
Net in Balance
sheet
Master netting agree-ments
Net position
December 31, 2019
Derivative assets 335 — 335 –250 85
Derivative liabilities 5,909 5,909 –250 5,659
December 31, 2018
Derivative assets 1,215 — 1,215 –950 265
Derivative liabilities 3,451 — 3,451 –950 2,501
Operational credit riskThe operational credit risk arises from accounts receivables. For the risk in customer and dealer financing, the objective is to have a sound and balanced credit portfolio and to engage in credit moni-toring by means of detailed procedures which include follow-up and repossession. In cases where the credit risk is considered unsatisfactory a letter of credit or other instruments are used. The maximum amount exposed to credit risk is the carrying amount of accounts receivable, see table ‘Financial assets and liabilities by category’ in this note. For quantification of credit risk in accounts receivable refer to Note 19 – Accounts receivable and other cur-rent assets.
Financial Instruments – Classification and measurementFinancial instruments are divided into three levels depending on the market information available.
• Level 1: Instruments are valued based on quoted prices (unad-justed) in active markets for identical assets or liabilities that the entity can access at the measurement date.
• Level 2: Instruments are valued based on quoted prices included within level 1 that are observable for the assets or liabilities, either directly or indirectly.
• Level 3: Instruments are valued based on unobservable inputs for the assets or liabilities.
All derivative financial instruments and commercial papers that Volvo Car Group holds as of December 31, 2019 belong to level 2. In level 3, the amount invested in other long-term securities hold-ings MSEK 296 (190) is valued based on internal valuation meth-ods, for more detailed information see Critical Accounting esti-mates and judgements in this note.
Fair value estimationThe table below presents Volvo Car Group’s financial assets and liabilities that are measured at fair value.
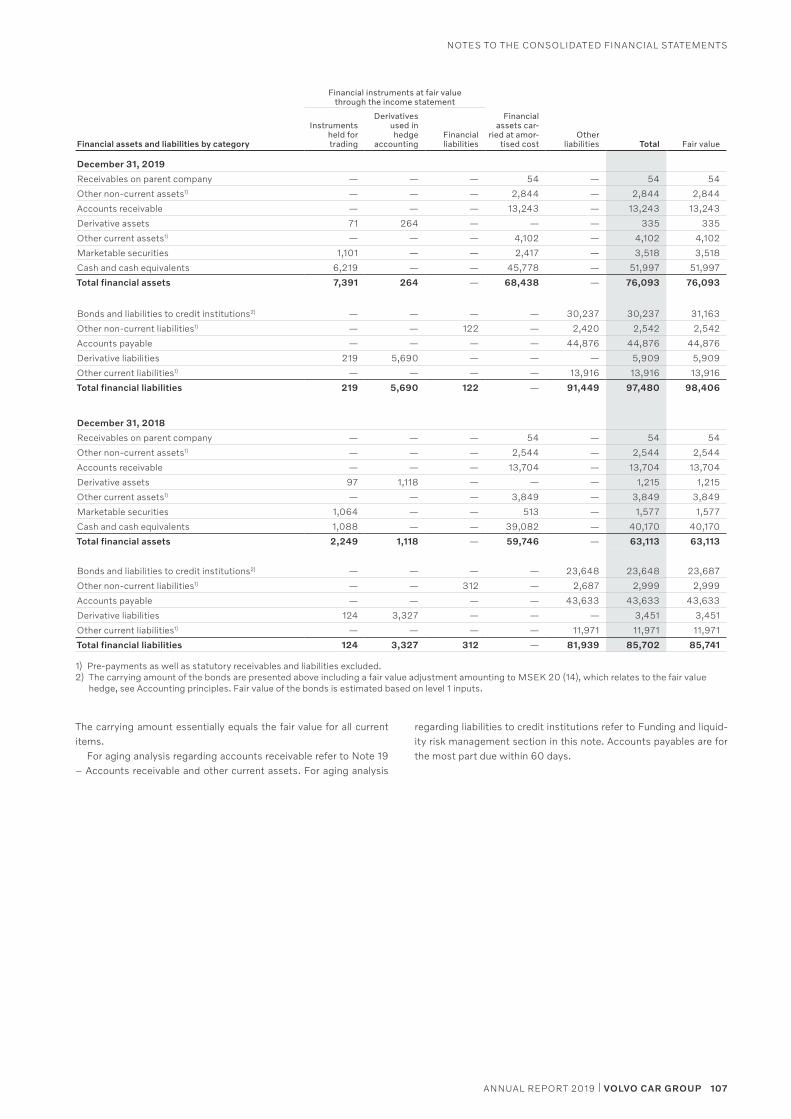
107ANNUAL REPORT 2019 | VOLVO CAR GROUP
NOTES TO THE CONSOLIDATED FINANCIAL STATEMENTS
The carrying amount essentially equals the fair value for all current items.
For aging analysis regarding accounts receivable refer to Note 19 – Accounts receivable and other current assets. For aging analysis
regarding liabilities to credit institutions refer to Funding and liquid-ity risk management section in this note. Accounts payables are for the most part due within 60 days.
Financial instruments at fair value through the income statement
Financial assets and liabilities by category
Instruments held for trading
Derivatives used in hedge
accountingFinancial liabilities
Financial assets car-
ried at amor-tised cost
Other liabilities Total Fair value
December 31, 2019
Receivables on parent company — — — 54 — 54 54
Other non-current assets1) — — — 2,844 — 2,844 2,844
Accounts receivable — — — 13,243 — 13,243 13,243
Derivative assets 71 264 — — — 335 335
Other current assets1) — — — 4,102 — 4,102 4,102
Marketable securities 1,101 — — 2,417 — 3,518 3,518
Cash and cash equivalents 6,219 — — 45,778 — 51,997 51,997
Total financial assets 7,391 264 — 68,438 — 76,093 76,093
Bonds and liabilities to credit institutions2) — — — — 30,237 30,237 31,163
Other non-current liabilities1) — — 122 — 2,420 2,542 2,542
Accounts payable — — — — 44,876 44,876 44,876
Derivative liabilities 219 5,690 — — — 5,909 5,909
Other current liabilities1) — — — — 13,916 13,916 13,916
Total financial liabilities 219 5,690 122 — 91,449 97,480 98,406
December 31, 2018
Receivables on parent company — — — 54 — 54 54
Other non-current assets1) — — — 2,544 — 2,544 2,544
Accounts receivable — — — 13,704 — 13,704 13,704
Derivative assets 97 1,118 — — — 1,215 1,215
Other current assets1) — — — 3,849 — 3,849 3,849
Marketable securities 1,064 — — 513 — 1,577 1,577
Cash and cash equivalents 1,088 — — 39,082 — 40,170 40,170
Total financial assets 2,249 1,118 — 59,746 — 63,113 63,113
Bonds and liabilities to credit institutions2) — — — — 23,648 23,648 23,687
Other non-current liabilities1) — — 312 — 2,687 2,999 2,999
Accounts payable — — — — 43,633 43,633 43,633
Derivative liabilities 124 3,327 — — — 3,451 3,451
Other current liabilities1) — — — — 11,971 11,971 11,971
Total financial liabilities 124 3,327 312 — 81,939 85,702 85,741
1) Pre-payments as well as statutory receivables and liabilities excluded.2) The carrying amount of the bonds are presented above including a fair value adjustment amounting to MSEK 20 (14), which relates to the fair value
hedge, see Accounting principles. Fair value of the bonds is estimated based on level 1 inputs.
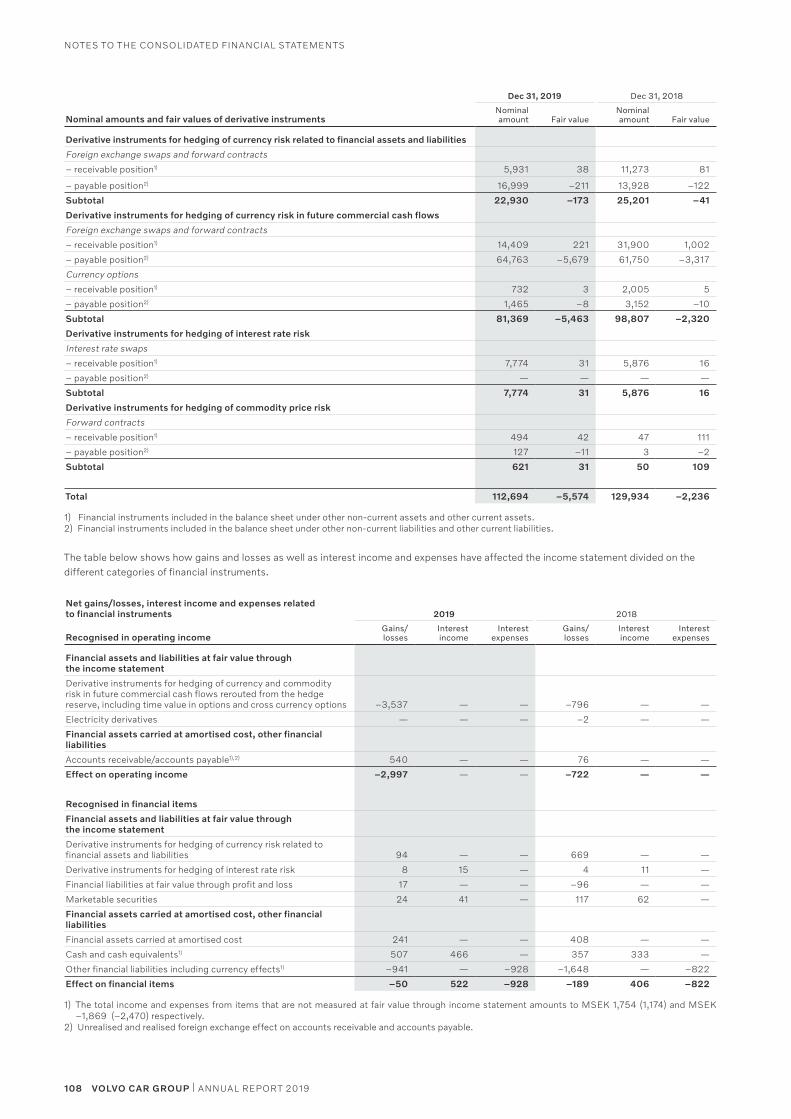
108 VOLVO CAR GROUP | ANNUAL REPORT 2019
NOTES TO THE CONSOLIDATED FINANCIAL STATEMENTS
Dec 31, 2019 Dec 31, 2018
Nominal amounts and fair values of derivative instrumentsNominal amount Fair value
Nominal amount Fair value
Derivative instruments for hedging of currency risk related to financial assets and liabilities
Foreign exchange swaps and forward contracts
– receivable position1) 5,931 38 11,273 81
– payable position2) 16,999 –211 13,928 –122
Subtotal 22,930 –173 25,201 –41
Derivative instruments for hedging of currency risk in future commercial cash flows
Foreign exchange swaps and forward contracts
– receivable position1) 14,409 221 31,900 1,002
– payable position2) 64,763 –5,679 61,750 –3,317
Currency options
– receivable position1) 732 3 2,005 5
– payable position2) 1,465 –8 3,152 –10
Subtotal 81,369 –5,463 98,807 –2,320
Derivative instruments for hedging of interest rate risk
Interest rate swaps
– receivable position1) 7,774 31 5,876 16
– payable position2) — — — —
Subtotal 7,774 31 5,876 16
Derivative instruments for hedging of commodity price risk
Forward contracts
– receivable position1) 494 42 47 111
– payable position2) 127 –11 3 –2
Subtotal 621 31 50 109
Total 112,694 –5,574 129,934 –2,236
1) Financial instruments included in the balance sheet under other non-current assets and other current assets.2) Financial instruments included in the balance sheet under other non-current liabilities and other current liabilities.
The table below shows how gains and losses as well as interest income and expenses have affected the income statement divided on the different categories of financial instruments.
Net gains/losses, interest income and expenses related to financial instruments 2019 2018
Recognised in operating income Gains/ losses
Interest income
Interest expenses
Gains/ losses
Interest income
Interest expenses
Financial assets and liabilities at fair value through the income statement
Derivative instruments for hedging of currency and commodity risk in future commercial cash flows rerouted from the hedge reserve, including time value in options and cross currency options –3,537 — — –796 — —
Electricity derivatives — — — –2 — —
Financial assets carried at amortised cost, other financial liabilities
Accounts receivable/accounts payable1),2) 540 — — 76 — —
Effect on operating income –2,997 — — –722 — —
Recognised in financial items
Financial assets and liabilities at fair value through the income statement
Derivative instruments for hedging of currency risk related to financial assets and liabilities 94 — — 669 — —
Derivative instruments for hedging of interest rate risk 8 15 — 4 11 —
Financial liabilities at fair value through profit and loss 17 — — –96 — —
Marketable securities 24 41 — 117 62 —
Financial assets carried at amortised cost, other financial liabilities
Financial assets carried at amortised cost 241 — — 408 — —
Cash and cash equivalents1) 507 466 — 357 333 —
Other financial liabilities including currency effects1) –941 — –928 –1,648 — –822
Effect on financial items –50 522 –928 –189 406 –822
1) The total income and expenses from items that are not measured at fair value through income statement amounts to MSEK 1,754 (1,174) and MSEK –1,869 (–2,470) respectively.
2) Unrealised and realised foreign exchange effect on accounts receivable and accounts payable.
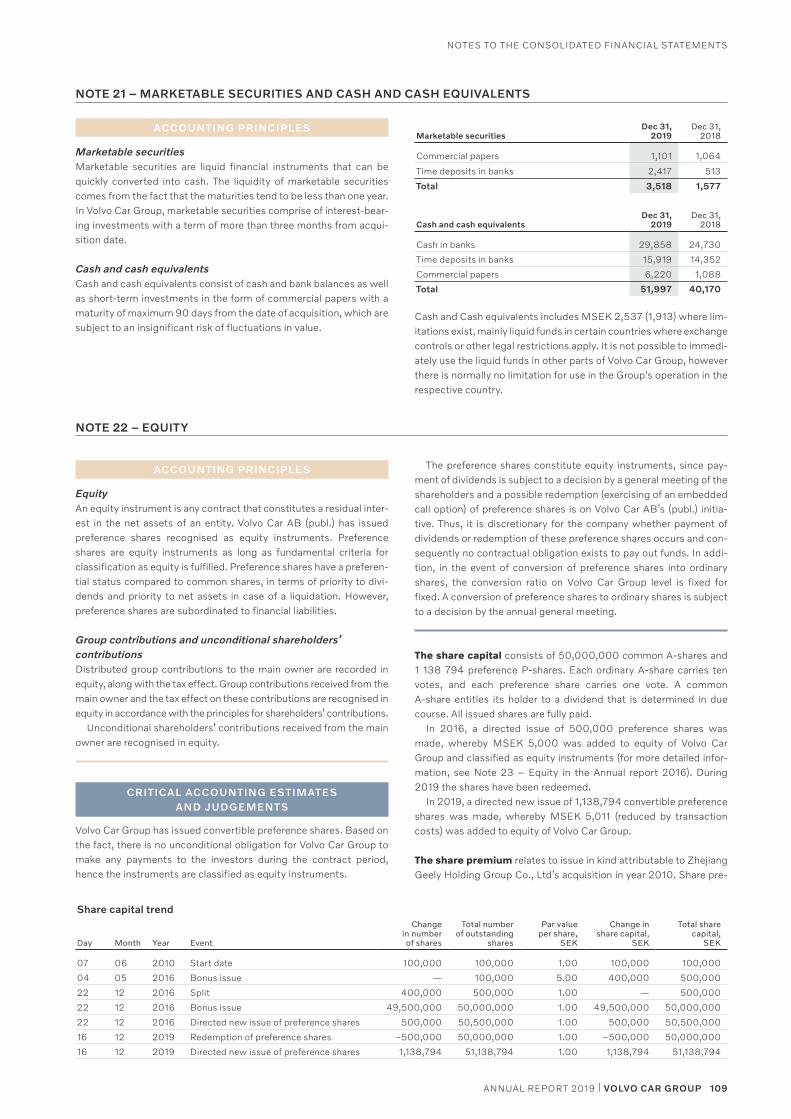
ACCOUNTING PRINCIPLES
Marketable securitiesMarketable securities are liquid financial instruments that can be quickly converted into cash. The liquidity of marketable securities comes from the fact that the maturities tend to be less than one year. In Volvo Car Group, marketable securities comprise of interest-bear-ing investments with a term of more than three months from acqui-sition date.
Cash and cash equivalentsCash and cash equivalents consist of cash and bank balances as well as short-term investments in the form of commercial papers with a maturity of maximum 90 days from the date of acquisition, which are subject to an insignificant risk of fluctuations in value.
ACCOUNTING PRINCIPLES
EquityAn equity instrument is any contract that constitutes a residual inter-est in the net assets of an entity. Volvo Car AB (publ.) has issued preference shares recognised as equity instruments. Preference shares are equity instruments as long as fundamental criteria for classification as equity is fulfilled. Preference shares have a preferen-tial status compared to common shares, in terms of priority to divi-dends and priority to net assets in case of a liquidation. However, preference shares are subordinated to financial liabilities.
Group contributions and unconditional shareholders’ contributionsDistributed group contributions to the main owner are recorded in equity, along with the tax effect. Group contributions received from the main owner and the tax effect on these contributions are recognised in equity in accordance with the principles for shareholders’ contributions.
Unconditional shareholders’ contributions received from the main owner are recognised in equity.
CRITICAL ACCOUNTING ESTIMATES AND JUDGEMENTS
Volvo Car Group has issued convertible preference shares. Based on the fact, there is no unconditional obligation for Volvo Car Group to make any payments to the investors during the contract period, hence the instruments are classified as equity instruments.
Share capital trend
Day Month Year Event
Change in number of shares
Total number of outstanding
shares
Par value per share,
SEK
Change in share capital,
SEK
Total share capital,
SEK
07 06 2010 Start date 100,000 100,000 1.00 100,000 100,000
04 05 2016 Bonus issue — 100,000 5.00 400,000 500,000
22 12 2016 Split 400,000 500,000 1.00 — 500,000
22 12 2016 Bonus issue 49,500,000 50,000,000 1.00 49,500,000 50,000,000
22 12 2016 Directed new issue of preference shares 500,000 50,500,000 1.00 500,000 50,500,000
16 12 2019 Redemption of preference shares –500,000 50,000,000 1.00 –500,000 50,000,000
16 12 2019 Directed new issue of preference shares 1,138,794 51,138,794 1.00 1,138,794 51,138,794
Marketable securitiesDec 31,
2019Dec 31,
2018
Commercial papers 1,101 1,064
Time deposits in banks 2,417 513
Total 3,518 1,577
Cash and cash equivalentsDec 31,
2019Dec 31,
2018
Cash in banks 29,858 24,730
Time deposits in banks 15,919 14,352
Commercial papers 6,220 1,088
Total 51,997 40,170
Cash and Cash equivalents includes MSEK 2,537 (1,913) where lim-itations exist, mainly liquid funds in certain countries where exchange controls or other legal restrictions apply. It is not possible to immedi-ately use the liquid funds in other parts of Volvo Car Group, however there is normally no limitation for use in the Group's operation in the respective country.
NOTE 21 – MARKETABLE SECURITIES AND CASH AND CASH EQUIVALENTS
NOTE 22 – EQUITY
The preference shares constitute equity instruments, since pay-ment of dividends is subject to a decision by a general meeting of the shareholders and a possible redemption (exercising of an embedded call option) of preference shares is on Volvo Car AB’s (publ.) initia-tive. Thus, it is discretionary for the company whether payment of dividends or redemption of these preference shares occurs and con-sequently no contractual obligation exists to pay out funds. In addi-tion, in the event of conversion of preference shares into ordinary shares, the conversion ratio on Volvo Car Group level is fixed for fixed. A conversion of preference shares to ordinary shares is subject to a decision by the annual general meeting.
The share capital consists of 50,000,000 common A-shares and 1 138 794 preference P-shares. Each ordinary A-share carries ten votes, and each preference share carries one vote. A common A-share entitles its holder to a dividend that is determined in due course. All issued shares are fully paid.
In 2016, a directed issue of 500,000 preference shares was made, whereby MSEK 5,000 was added to equity of Volvo Car Group and classified as equity instruments (for more detailed infor-mation, see Note 23 – Equity in the Annual report 2016). During 2019 the shares have been redeemed.
In 2019, a directed new issue of 1,138,794 convertible preference shares was made, whereby MSEK 5,011 (reduced by transaction costs) was added to equity of Volvo Car Group.
The share premium relates to issue in kind attributable to Zhejiang Geely Holding Group Co., Ltd’s acquisition in year 2010. Share pre-
109ANNUAL REPORT 2019 | VOLVO CAR GROUP
NOTES TO THE CONSOLIDATED FINANCIAL STATEMENTS
NOTE 23 – POST EMPLOYMENT BENEFITS
ACCOUNTING PRINCIPLES
Pension benefitsVolvo Car Group has various schemes for post-employment bene-fits, mainly relating to pension plans. Other benefits can in some locations include disability, life insurance and health benefits. Pen-sion plans are classified either as defined contribution plans or defined benefit plans. Volvo Car Group has both defined contribution plans and defined benefit plans for qualifying employees in some subsidiaries and the largest plans are in Sweden and Belgium.
Under a defined contribution plan, Volvo Car Group pays fixed contributions into a separate external legal entity and will have no legal obligation to pay further contributions if the fund does not hold sufficient assets to pay all employee benefits. The contributions are recognised as employee benefit expenses in the income statement when earned by the employee. Some defined contribution plans combine the promise to make periodic payments with a promise of a guaranteed minimum return on investments. Such plans are accounted for as defined benefit plans.
A defined benefit plan is a pension plan that defines the amount of post-employment benefits an employee will receive upon retire-ment, usually dependent on one or more factors such as age, years of service and compensation. For funded defined benefits plans, plan assets have been separated, with the majority invested in pension foundations. The net pension provision or asset recognised in the balance sheet in respect of defined benefit pension plans is the pres-ent value of the defined benefit obligation at the balance sheet date less the fair value of plan assets.
The calculation of the present value of defined benefit pension obligations is performed according to the Projected Unit Credit method, which also considers future earnings. The calculation is per-formed by independent actuaries. The present value of the defined benefit obligation is determined by discounting the estimated future cash outflows using interest rates of high-quality corporate, or when data is not available, government bonds that are denominated in the currency in which the benefits will be paid, and that have terms to maturity approximating to the terms of the related pension liability. The discount rate for the Swedish pension obligation is determined by reference to mortgage bonds. The most important actuarial assumptions are stated below.
Actuarial gains and losses arising from changes in actuarial assumptions and adjustments based on experience are charged or credited to other consolidated comprehensive income in the period in which they arise. Past service costs are recognised immediately in the income statement when the settlement occurs.
The net interest cost is calculated by applying the discount rate to the net balance of the defined benefit obligation and the fair value of plan assets.
Termination benefitsTermination benefits are payable when employment is terminated by the Group before the normal retirement date, or whenever an employee accepts voluntary redundancy in exchange for these bene-fits. The Group recognises termination benefits at the earlier of the following dates: (a) when the Group can no longer withdraw the offer of those benefits and (b) when the entity recognises costs for a restructuring that involves payment of termination benefits.
mium also includes capital received (reduced by transaction costs) in excess of par value of issued capital.
Other contributed capital consists of Group contributions from Geely Sweden Holding Group and unconditional shareholders’ con-tribution from Shanghai Geely Zhaoyuan International Investment Co., Ltd.
The currency translation reserve comprises exchange rate differ-ences of hedge instruments of net investments in foreign operations and exchange rate differences resulting from the translation of finan-cial reports of foreign operations that have prepared their financial reports in a currency other than Volvo Car Group’s reporting currency. The parent company and Volvo Car Group present their financial reports in SEK.
The other reserve consists of the change in fair value of cash flow hedging instruments in cases where hedge accounting is applied.
Retained earnings comprises net income for the year and preced-ing years as well as remeasurements of post-employment benefits. Retained earnings also include the effects of business combinations under common control within the Geely Group and dividend to shareholders.
Non-controlling interests mainly refers to the share of equity that belongs to Zhejiang Geely Holding Group Co., Ltd without a con-trolling influence. Volvo Car Group holds 50 per cent of the equity in the following companies; Daqing Volvo Car Manufacturing Co., Ltd, Zhangjiakou Volvo Car Engine Manufacturing Co., Ltd, Shanghai Volvo Car Research and Development Co., Ltd and up until July 2018 Polestar New Energy Vehicle Co., Ltd and has the decision-making power over the operation. In the consolidated financial statements, these companies are classified as subsidiaries and fully consolidated with a non-controlling interest of 50 per cent. The non-controlling interest decreased during the year 2019 due to a dividend paid of MSEK 1,381 (—) from Daqing Volvo Car Manufacturing Co., Ltd to its shareholder Zhejiang Geely Holding Group Co., Ltd. In year 2018 the non-controlling interest increased through a capital contribution to Polestar New Energy Vehicle Co., Ltd with MSEK — (662).
In July 2018, the wholly owned subsidiary Polestar Automotive (Shanghai) Co., Ltd acquired the 50 per cent non-controlling interest in Polestar New Energy Vehicle Co., Ltd, resulting in a divestment of non-controlling interests of MSEK –1,271. See Note 8 – Participa-tion in subsidiaries (Parent company) for further information.
At year end 2019, non-controlling interests amounted to MSEK 9,765 (8,378).
Total equity consists of the equity attributable to the owners of the parent company and non-controlling interests. At year end 2019, the Volvo Car Group's total equity amounted to MSEK 63,648 (61,251 ).
110 VOLVO CAR GROUP | ANNUAL REPORT 2019
NOTES TO THE CONSOLIDATED FINANCIAL STATEMENTS
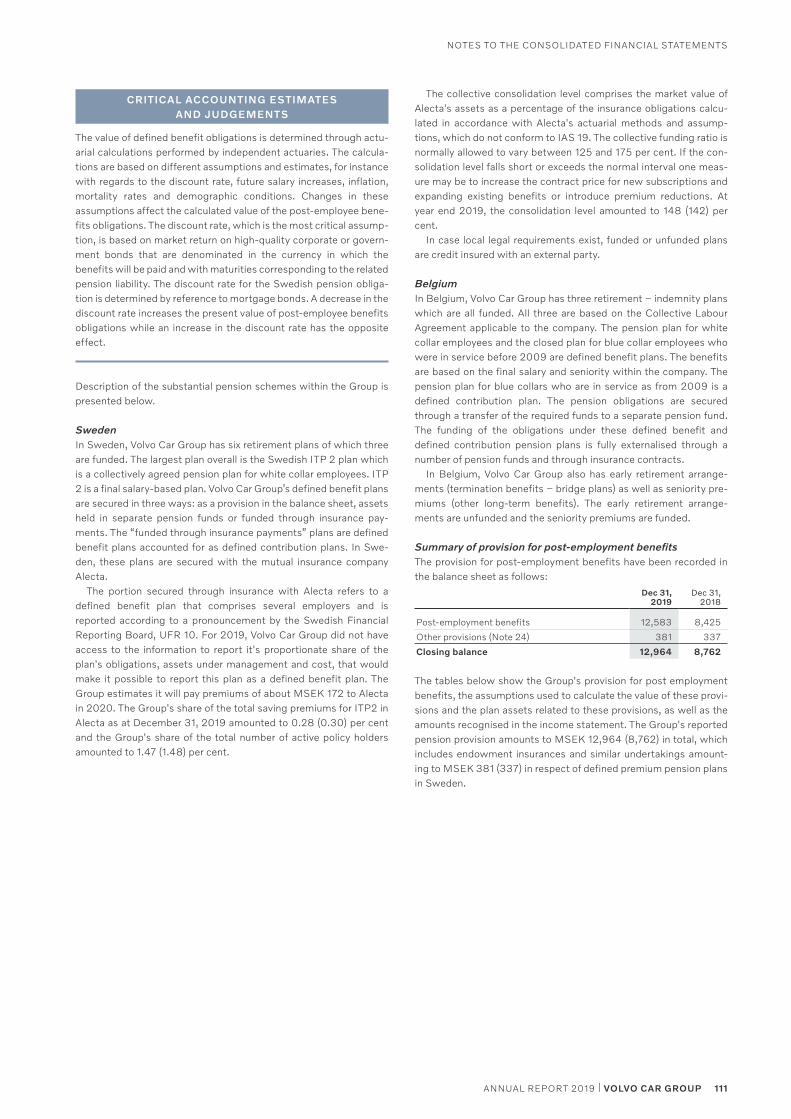
CRITICAL ACCOUNTING ESTIMATES AND JUDGEMENTS
The value of defined benefit obligations is determined through actu-arial calculations performed by independent actuaries. The calcula-tions are based on different assumptions and estimates, for instance with regards to the discount rate, future salary increases, inflation, mortality rates and demographic conditions. Changes in these assumptions affect the calculated value of the post-employee bene-fits obligations. The discount rate, which is the most critical assump-tion, is based on market return on high-quality corporate or govern-ment bonds that are denominated in the currency in which the benefits will be paid and with maturities corresponding to the related pension liability. The discount rate for the Swedish pension obliga-tion is determined by reference to mortgage bonds. A decrease in the discount rate increases the present value of post-employee benefits obligations while an increase in the discount rate has the opposite effect.
Description of the substantial pension schemes within the Group is presented below.
SwedenIn Sweden, Volvo Car Group has six retirement plans of which three are funded. The largest plan overall is the Swedish ITP 2 plan which is a collectively agreed pension plan for white collar employees. ITP 2 is a final salary-based plan. Volvo Car Group’s defined benefit plans are secured in three ways: as a provision in the balance sheet, assets held in separate pension funds or funded through insurance pay-ments. The “funded through insurance payments” plans are defined benefit plans accounted for as defined contribution plans. In Swe-den, these plans are secured with the mutual insurance company Alecta.
The portion secured through insurance with Alecta refers to a defined benefit plan that comprises several employers and is reported according to a pronouncement by the Swedish Financial Reporting Board, UFR 10. For 2019, Volvo Car Group did not have access to the information to report it's proportionate share of the plan's obligations, assets under management and cost, that would make it possible to report this plan as a defined benefit plan. The Group estimates it will pay premiums of about MSEK 172 to Alecta in 2020. The Group's share of the total saving premiums for ITP2 in Alecta as at December 31, 2019 amounted to 0.28 (0.30) per cent and the Group's share of the total number of active policy holders amounted to 1.47 (1.48) per cent.
The collective consolidation level comprises the market value of Alecta's assets as a percentage of the insurance obligations calcu-lated in accordance with Alecta's actuarial methods and assump-tions, which do not conform to IAS 19. The collective funding ratio is normally allowed to vary between 125 and 175 per cent. If the con-solidation level falls short or exceeds the normal interval one meas-ure may be to increase the contract price for new subscriptions and expanding existing benefits or introduce premium reductions. At year end 2019, the consolidation level amounted to 148 (142) per cent.
In case local legal requirements exist, funded or unfunded plans are credit insured with an external party. BelgiumIn Belgium, Volvo Car Group has three retirement − indemnity plans which are all funded. All three are based on the Collective Labour Agreement applicable to the company. The pension plan for white collar employees and the closed plan for blue collar employees who were in service before 2009 are defined benefit plans. The benefits are based on the final salary and seniority within the company. The pension plan for blue collars who are in service as from 2009 is a defined contribution plan. The pension obligations are secured through a transfer of the required funds to a separate pension fund. The funding of the obligations under these defined benefit and defined contribution pension plans is fully externalised through a number of pension funds and through insurance contracts.
In Belgium, Volvo Car Group also has early retirement arrange-ments (termination benefits − bridge plans) as well as seniority pre-miums (other long-term benefits). The early retirement arrange-ments are unfunded and the seniority premiums are funded.
Summary of provision for post-employment benefitsThe provision for post-employment benefits have been recorded in the balance sheet as follows:
Dec 31, 2019
Dec 31, 2018
Post-employment benefits 12,583 8,425
Other provisions (Note 24) 381 337
Closing balance 12,964 8,762
The tables below show the Group's provision for post employment benefits, the assumptions used to calculate the value of these provi-sions and the plan assets related to these provisions, as well as the amounts recognised in the income statement. The Group's reported pension provision amounts to MSEK 12,964 (8,762) in total, which includes endowment insurances and similar undertakings amount-ing to MSEK 381 (337) in respect of defined premium pension plans in Sweden.
111ANNUAL REPORT 2019 | VOLVO CAR GROUP
NOTES TO THE CONSOLIDATED FINANCIAL STATEMENTS
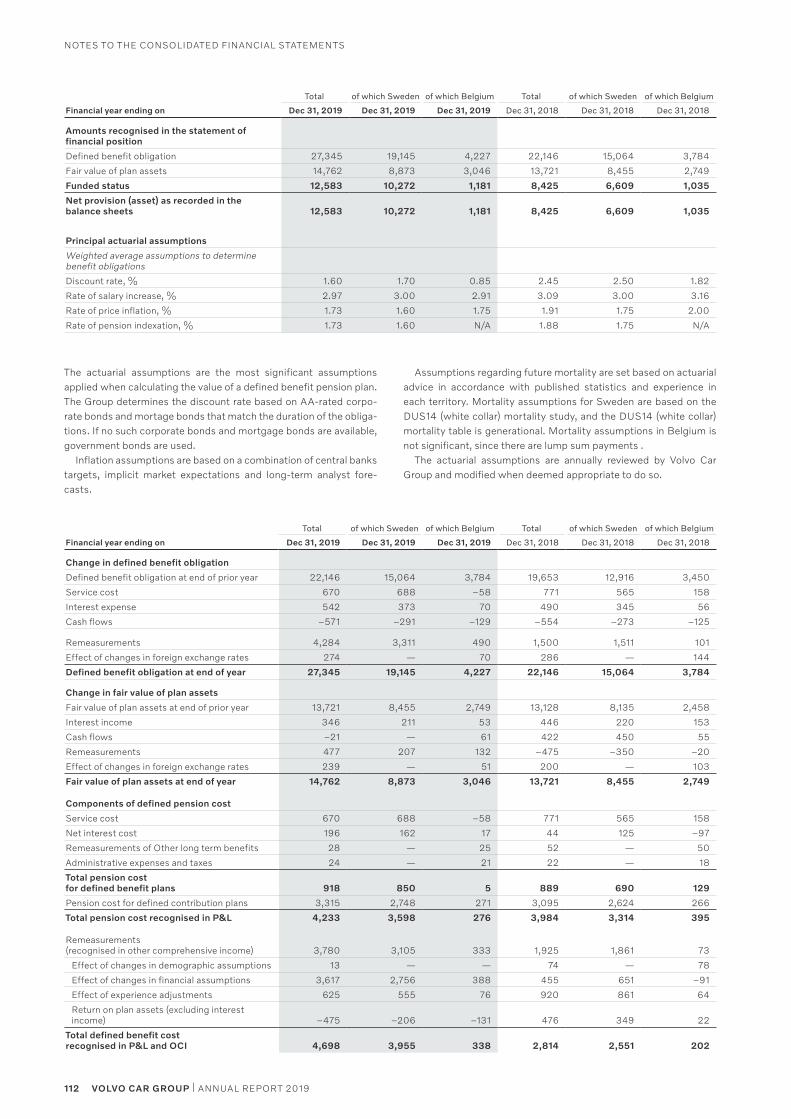
The actuarial assumptions are the most significant assumptions applied when calculating the value of a defined benefit pension plan. The Group determines the discount rate based on AA-rated corpo-rate bonds and mortage bonds that match the duration of the obliga-tions. If no such corporate bonds and mortgage bonds are available, government bonds are used.
Inflation assumptions are based on a combination of central banks targets, implicit market expectations and long-term analyst fore-casts.
Assumptions regarding future mortality are set based on actuarial advice in accordance with published statistics and experience in each territory. Mortality assumptions for Sweden are based on the DUS14 (white collar) mortality study, and the DUS14 (white collar) mortality table is generational. Mortality assumptions in Belgium is not significant, since there are lump sum payments .
The actuarial assumptions are annually reviewed by Volvo Car Group and modified when deemed appropriate to do so.
Total of which Sweden of which Belgium Total of which Sweden of which Belgium
Financial year ending on Dec 31, 2019 Dec 31, 2019 Dec 31, 2019 Dec 31, 2018 Dec 31, 2018 Dec 31, 2018
Amounts recognised in the statement of financial position
Defined benefit obligation 27,345 19,145 4,227 22,146 15,064 3,784
Fair value of plan assets 14,762 8,873 3,046 13,721 8,455 2,749
Funded status 12,583 10,272 1,181 8,425 6,609 1,035
Net provision (asset) as recorded in the balance sheets 12,583 10,272 1,181 8,425 6,609 1,035
Principal actuarial assumptions
Weighted average assumptions to determine benefit obligations
Discount rate, % 1.60 1.70 0.85 2.45 2.50 1.82
Rate of salary increase, % 2.97 3.00 2.91 3.09 3.00 3.16
Rate of price inflation, % 1.73 1.60 1.75 1.91 1.75 2.00
Rate of pension indexation, % 1.73 1.60 N/A 1.88 1.75 N/A
Total of which Sweden of which Belgium Total of which Sweden of which Belgium
Financial year ending on Dec 31, 2019 Dec 31, 2019 Dec 31, 2019 Dec 31, 2018 Dec 31, 2018 Dec 31, 2018
Change in defined benefit obligation
Defined benefit obligation at end of prior year 22,146 15,064 3,784 19,653 12,916 3,450
Service cost 670 688 –58 771 565 158
Interest expense 542 373 70 490 345 56
Cash flows –571 –291 –129 –554 –273 –125
Remeasurements 4,284 3,311 490 1,500 1,511 101
Effect of changes in foreign exchange rates 274 — 70 286 — 144
Defined benefit obligation at end of year 27,345 19,145 4,227 22,146 15,064 3,784
Change in fair value of plan assets
Fair value of plan assets at end of prior year 13,721 8,455 2,749 13,128 8,135 2,458
Interest income 346 211 53 446 220 153
Cash flows –21 — 61 422 450 55
Remeasurements 477 207 132 –475 –350 –20
Effect of changes in foreign exchange rates 239 — 51 200 — 103
Fair value of plan assets at end of year 14,762 8,873 3,046 13,721 8,455 2,749
Components of defined pension cost
Service cost 670 688 –58 771 565 158
Net interest cost 196 162 17 44 125 –97
Remeasurements of Other long term benefits 28 — 25 52 — 50
Administrative expenses and taxes 24 — 21 22 — 18
Total pension cost for defined benefit plans 918 850 5 889 690 129
Pension cost for defined contribution plans 3,315 2,748 271 3,095 2,624 266
Total pension cost recognised in P&L 4,233 3,598 276 3,984 3,314 395
Remeasurements (recognised in other comprehensive income) 3,780 3,105 333 1,925 1,861 73
Effect of changes in demographic assumptions 13 — — 74 — 78
Effect of changes in financial assumptions 3,617 2,756 388 455 651 –91
Effect of experience adjustments 625 555 76 920 861 64
Return on plan assets (excluding interest income) –475 –206 –131 476 349 22
Total defined benefit cost recognised in P&L and OCI 4,698 3,955 338 2,814 2,551 202
112 VOLVO CAR GROUP | ANNUAL REPORT 2019
NOTES TO THE CONSOLIDATED FINANCIAL STATEMENTS
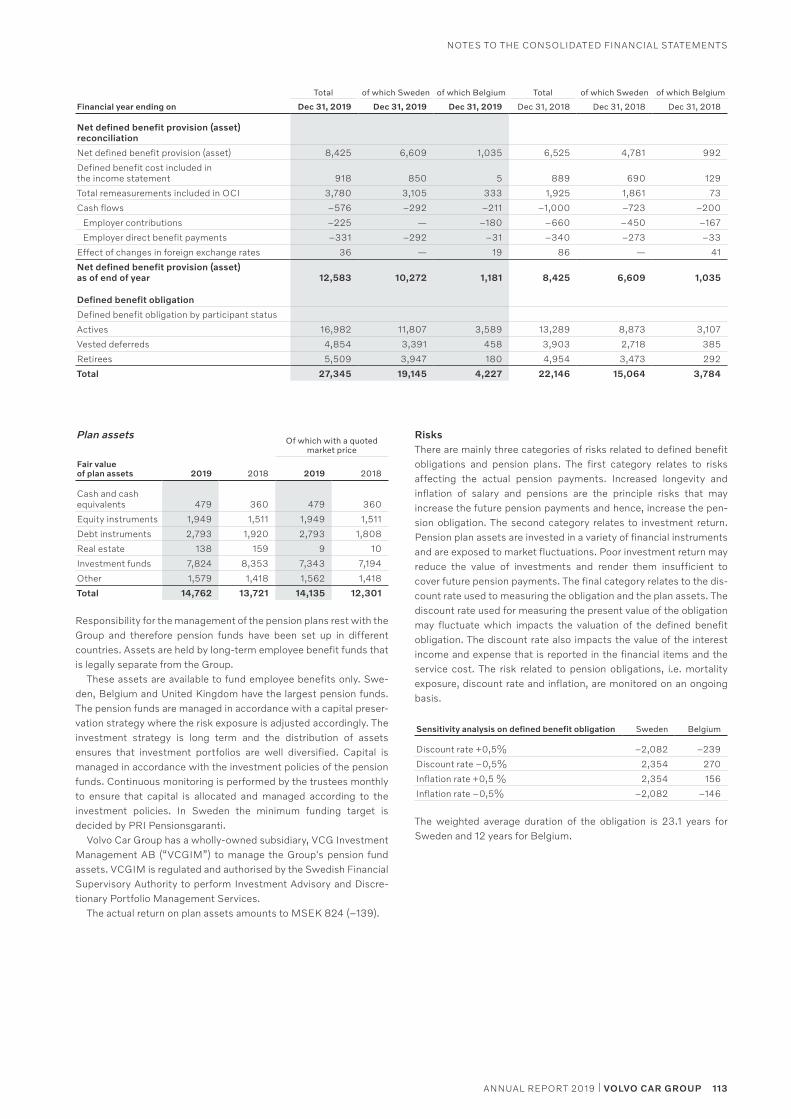
Plan assetsOf which with a quoted
market price
Fair value of plan assets 2019 2018 2019 2018
Cash and cash equivalents 479 360 479 360
Equity instruments 1,949 1,511 1,949 1,511
Debt instruments 2,793 1,920 2,793 1,808
Real estate 138 159 9 10
Investment funds 7,824 8,353 7,343 7,194
Other 1,579 1,418 1,562 1,418
Total 14,762 13,721 14,135 12,301
Responsibility for the management of the pension plans rest with the Group and therefore pension funds have been set up in different countries. Assets are held by long-term employee benefit funds that is legally separate from the Group.
These assets are available to fund employee benefits only. Swe-den, Belgium and United Kingdom have the largest pension funds. The pension funds are managed in accordance with a capital preser-vation strategy where the risk exposure is adjusted accordingly. The investment strategy is long term and the distribution of assets ensures that investment portfolios are well diversified. Capital is managed in accordance with the investment policies of the pension funds. Continuous monitoring is performed by the trustees monthly to ensure that capital is allocated and managed according to the investment policies. In Sweden the minimum funding target is decided by PRI Pensionsgaranti.
Volvo Car Group has a wholly-owned subsidiary, VCG Investment Management AB (“VCGIM”) to manage the Group's pension fund assets. VCGIM is regulated and authorised by the Swedish Financial Supervisory Authority to perform Investment Advisory and Discre-tionary Portfolio Management Services.
The actual return on plan assets amounts to MSEK 824 (–139).
Total of which Sweden of which Belgium Total of which Sweden of which Belgium
Financial year ending on Dec 31, 2019 Dec 31, 2019 Dec 31, 2019 Dec 31, 2018 Dec 31, 2018 Dec 31, 2018
Net defined benefit provision (asset) reconciliation
Net defined benefit provision (asset) 8,425 6,609 1,035 6,525 4,781 992
Defined benefit cost included in the income statement 918 850 5 889 690 129
Total remeasurements included in OCI 3,780 3,105 333 1,925 1,861 73
Cash flows –576 –292 –211 –1,000 –723 –200
Employer contributions –225 — –180 –660 –450 –167
Employer direct benefit payments –331 –292 –31 –340 –273 –33
Effect of changes in foreign exchange rates 36 — 19 86 — 41
Net defined benefit provision (asset) as of end of year 12,583 10,272 1,181 8,425 6,609 1,035
Defined benefit obligation
Defined benefit obligation by participant status
Actives 16,982 11,807 3,589 13,289 8,873 3,107
Vested deferreds 4,854 3,391 458 3,903 2,718 385
Retirees 5,509 3,947 180 4,954 3,473 292
Total 27,345 19,145 4,227 22,146 15,064 3,784
Risks There are mainly three categories of risks related to defined benefit obligations and pension plans. The first category relates to risks affecting the actual pension payments. Increased longevity and inflation of salary and pensions are the principle risks that may increase the future pension payments and hence, increase the pen-sion obligation. The second category relates to investment return. Pension plan assets are invested in a variety of financial instruments and are exposed to market fluctuations. Poor investment return may reduce the value of investments and render them insufficient to cover future pension payments. The final category relates to the dis-count rate used to measuring the obligation and the plan assets. The discount rate used for measuring the present value of the obligation may fluctuate which impacts the valuation of the defined benefit obligation. The discount rate also impacts the value of the interest income and expense that is reported in the financial items and the service cost. The risk related to pension obligations, i.e. mortality exposure, discount rate and inflation, are monitored on an ongoing basis.
Sensitivity analysis on defined benefit obligation Sweden Belgium
Discount rate +0,5% –2,082 –239
Discount rate –0,5% 2,354 270
Inflation rate +0,5 % 2,354 156
Inflation rate –0,5% –2,082 –146
The weighted average duration of the obligation is 23.1 years for Sweden and 12 years for Belgium.
113ANNUAL REPORT 2019 | VOLVO CAR GROUP
NOTES TO THE CONSOLIDATED FINANCIAL STATEMENTS
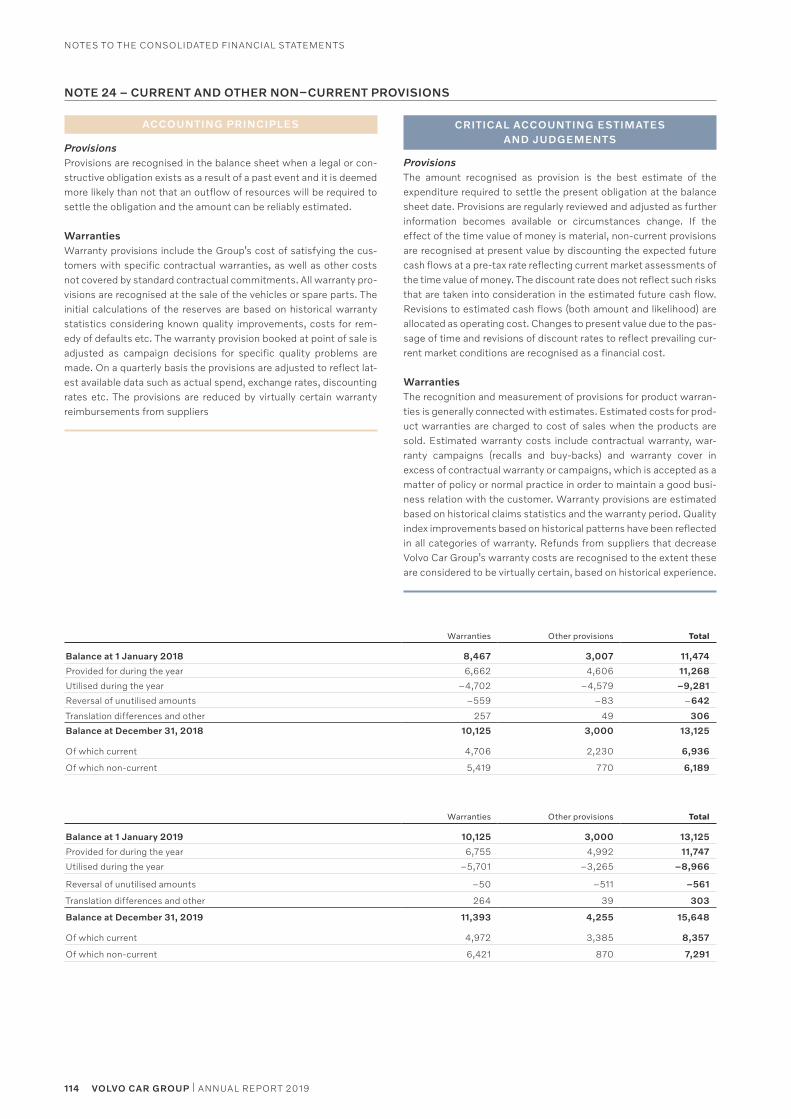
NOTE 24 – CURRENT AND OTHER NON–CURRENT PROVISIONS
ACCOUNTING PRINCIPLES
ProvisionsProvisions are recognised in the balance sheet when a legal or con-structive obligation exists as a result of a past event and it is deemed more likely than not that an outflow of resources will be required to settle the obligation and the amount can be reliably estimated.
WarrantiesWarranty provisions include the Group’s cost of satisfying the cus-tomers with specific contractual warranties, as well as other costs not covered by standard contractual commitments. All warranty pro-visions are recognised at the sale of the vehicles or spare parts. The initial calculations of the reserves are based on historical warranty statistics considering known quality improvements, costs for rem-edy of defaults etc. The warranty provision booked at point of sale is adjusted as campaign decisions for specific quality problems are made. On a quarterly basis the provisions are adjusted to reflect lat-est available data such as actual spend, exchange rates, discounting rates etc. The provisions are reduced by virtually certain warranty reimbursements from suppliers
CRITICAL ACCOUNTING ESTIMATES AND JUDGEMENTS
ProvisionsThe amount recognised as provision is the best estimate of the expenditure required to settle the present obligation at the balance sheet date. Provisions are regularly reviewed and adjusted as further information becomes available or circumstances change. If the effect of the time value of money is material, non-current provisions are recognised at present value by discounting the expected future cash flows at a pre-tax rate reflecting current market assessments of the time value of money. The discount rate does not reflect such risks that are taken into consideration in the estimated future cash flow. Revisions to estimated cash flows (both amount and likelihood) are allocated as operating cost. Changes to present value due to the pas-sage of time and revisions of discount rates to reflect prevailing cur-rent market conditions are recognised as a financial cost.
Warranties The recognition and measurement of provisions for product warran-ties is generally connected with estimates. Estimated costs for prod-uct warranties are charged to cost of sales when the products are sold. Estimated warranty costs include contractual warranty, war-ranty campaigns (recalls and buy-backs) and warranty cover in excess of contractual warranty or campaigns, which is accepted as a matter of policy or normal practice in order to maintain a good busi-ness relation with the customer. Warranty provisions are estimated based on historical claims statistics and the warranty period. Quality index improvements based on historical patterns have been reflected in all categories of warranty. Refunds from suppliers that decrease Volvo Car Group’s warranty costs are recognised to the extent these are considered to be virtually certain, based on historical experience.
Warranties Other provisions Total
Balance at 1 January 2018 8,467 3,007 11,474
Provided for during the year 6,662 4,606 11,268
Utilised during the year –4,702 –4,579 –9,281
Reversal of unutilised amounts –559 –83 –642
Translation differences and other 257 49 306
Balance at December 31, 2018 10,125 3,000 13,125
Of which current 4,706 2,230 6,936
Of which non-current 5,419 770 6,189
Warranties Other provisions Total
Balance at 1 January 2019 10,125 3,000 13,125
Provided for during the year 6,755 4,992 11,747
Utilised during the year –5,701 –3,265 –8,966
Reversal of unutilised amounts –50 –511 –561
Translation differences and other 264 39 303
Balance at December 31, 2019 11,393 4,255 15,648
Of which current 4,972 3,385 8,357
Of which non-current 6,421 870 7,291
114 VOLVO CAR GROUP | ANNUAL REPORT 2019
NOTES TO THE CONSOLIDATED FINANCIAL STATEMENTS
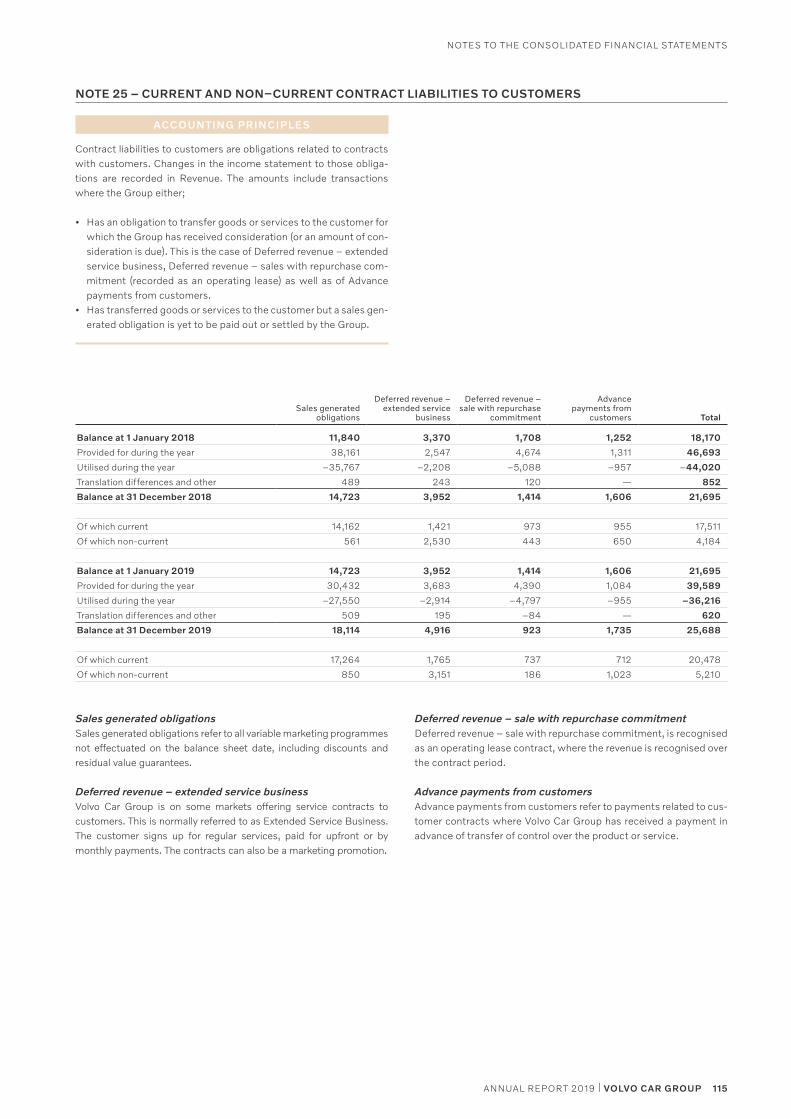
NOTE 25 – CURRENT AND NON–CURRENT CONTRACT LIABILITIES TO CUSTOMERS
Sales generated obligations
Deferred revenue – extended service
business
Deferred revenue – sale with repurchase
commitment
Advance payments from
customers Total
Balance at 1 January 2018 11,840 3,370 1,708 1,252 18,170
Provided for during the year 38,161 2,547 4,674 1,311 46,693
Utilised during the year –35,767 –2,208 –5,088 –957 –44,020
Translation differences and other 489 243 120 — 852
Balance at 31 December 2018 14,723 3,952 1,414 1,606 21,695
Of which current 14,162 1,421 973 955 17,511
Of which non-current 561 2,530 443 650 4,184
Balance at 1 January 2019 14,723 3,952 1,414 1,606 21,695
Provided for during the year 30,432 3,683 4,390 1,084 39,589
Utilised during the year –27,550 –2,914 –4,797 –955 –36,216
Translation differences and other 509 195 –84 — 620
Balance at 31 December 2019 18,114 4,916 923 1,735 25,688
Of which current 17,264 1,765 737 712 20,478
Of which non-current 850 3,151 186 1,023 5,210
ACCOUNTING PRINCIPLES
Contract liabilities to customers are obligations related to contracts with customers. Changes in the income statement to those obliga-tions are recorded in Revenue. The amounts include transactions where the Group either;
• Has an obligation to transfer goods or services to the customer for which the Group has received consideration (or an amount of con-sideration is due). This is the case of Deferred revenue – extended service business, Deferred revenue – sales with repurchase com-mitment (recorded as an operating lease) as well as of Advance payments from customers.
• Has transferred goods or services to the customer but a sales gen-erated obligation is yet to be paid out or settled by the Group.
Sales generated obligationsSales generated obligations refer to all variable marketing programmes not effectuated on the balance sheet date, including discounts and residual value guarantees.
Deferred revenue – extended service business Volvo Car Group is on some markets offering service contracts to customers. This is normally referred to as Extended Service Business. The customer signs up for regular services, paid for upfront or by monthly payments. The contracts can also be a marketing promotion.
Deferred revenue – sale with repurchase commitmentDeferred revenue – sale with repurchase commitment, is recognised as an operating lease contract, where the revenue is recognised over the contract period.
Advance payments from customersAdvance payments from customers refer to payments related to cus-tomer contracts where Volvo Car Group has received a payment in advance of transfer of control over the product or service.
115ANNUAL REPORT 2019 | VOLVO CAR GROUP
NOTES TO THE CONSOLIDATED FINANCIAL STATEMENTS
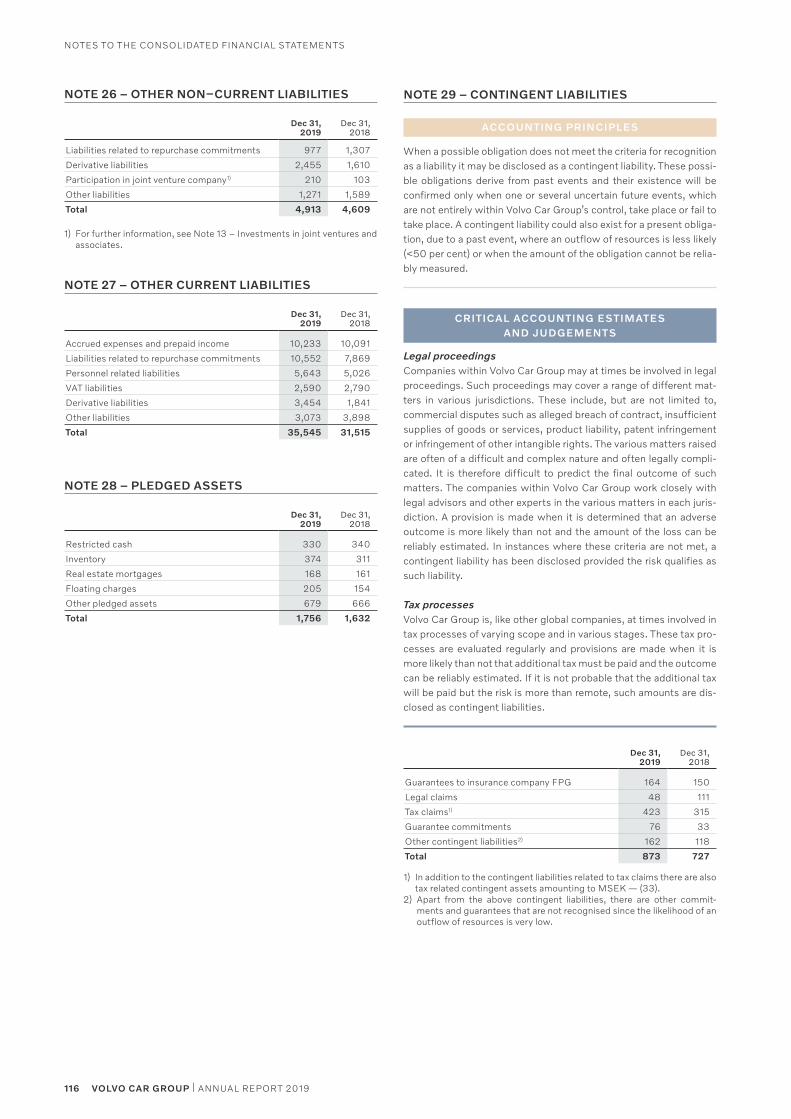
116 VOLVO CAR GROUP | ANNUAL REPORT 2019
NOTES TO THE CONSOLIDATED FINANCIAL STATEMENTS
NOTE 26 – OTHER NON–CURRENT LIABILITIES
Dec 31,2019
Dec 31,2018
Liabilities related to repurchase commitments 977 1,307
Derivative liabilities 2,455 1,610
Participation in joint venture company1) 210 103
Other liabilities 1,271 1,589
Total 4,913 4,609
1) For further information, see Note 13 – Investments in joint ventures and associates.
NOTE 27 – OTHER CURRENT LIABILITIES
Dec 31, 2019
Dec 31, 2018
Accrued expenses and prepaid income 10,233 10,091
Liabilities related to repurchase commitments 10,552 7,869
Personnel related liabilities 5,643 5,026
VAT liabilities 2,590 2,790
Derivative liabilities 3,454 1,841
Other liabilities 3,073 3,898
Total 35,545 31,515
NOTE 28 – PLEDGED ASSETS
Dec 31, 2019
Dec 31, 2018
Restricted cash 330 340
Inventory 374 311
Real estate mortgages 168 161
Floating charges 205 154
Other pledged assets 679 666
Total 1,756 1,632
NOTE 29 – CONTINGENT LIABILITIES
ACCOUNTING PRINCIPLES
When a possible obligation does not meet the criteria for recognition as a liability it may be disclosed as a contingent liability. These possi-ble obligations derive from past events and their existence will be confirmed only when one or several uncertain future events, which are not entirely within Volvo Car Group’s control, take place or fail to take place. A contingent liability could also exist for a present obliga-tion, due to a past event, where an outflow of resources is less likely (<50 per cent) or when the amount of the obligation cannot be relia-bly measured.
CRITICAL ACCOUNTING ESTIMATES AND JUDGEMENTS
Legal proceedingsCompanies within Volvo Car Group may at times be involved in legal proceedings. Such proceedings may cover a range of different mat-ters in various jurisdictions. These include, but are not limited to, commercial disputes such as alleged breach of contract, insufficient supplies of goods or services, product liability, patent infringement or infringement of other intangible rights. The various matters raised are often of a difficult and complex nature and often legally compli-cated. It is therefore difficult to predict the final outcome of such matters. The companies within Volvo Car Group work closely with legal advisors and other experts in the various matters in each juris-diction. A provision is made when it is determined that an adverse outcome is more likely than not and the amount of the loss can be reliably estimated. In instances where these criteria are not met, a contingent liability has been disclosed provided the risk qualifies as such liability.
Tax processes Volvo Car Group is, like other global companies, at times involved in tax processes of varying scope and in various stages. These tax pro-cesses are evaluated regularly and provisions are made when it is more likely than not that additional tax must be paid and the outcome can be reliably estimated. If it is not probable that the additional tax will be paid but the risk is more than remote, such amounts are dis-closed as contingent liabilities.
Dec 31, 2019
Dec 31, 2018
Guarantees to insurance company FPG 164 150
Legal claims 48 111
Tax claims1) 423 315
Guarantee commitments 76 33
Other contingent liabilities2) 162 118
Total 873 727
1) In addition to the contingent liabilities related to tax claims there are also tax related contingent assets amounting to MSEK — (33).
2) Apart from the above contingent liabilities, there are other commit-ments and guarantees that are not recognised since the likelihood of an outflow of resources is very low.
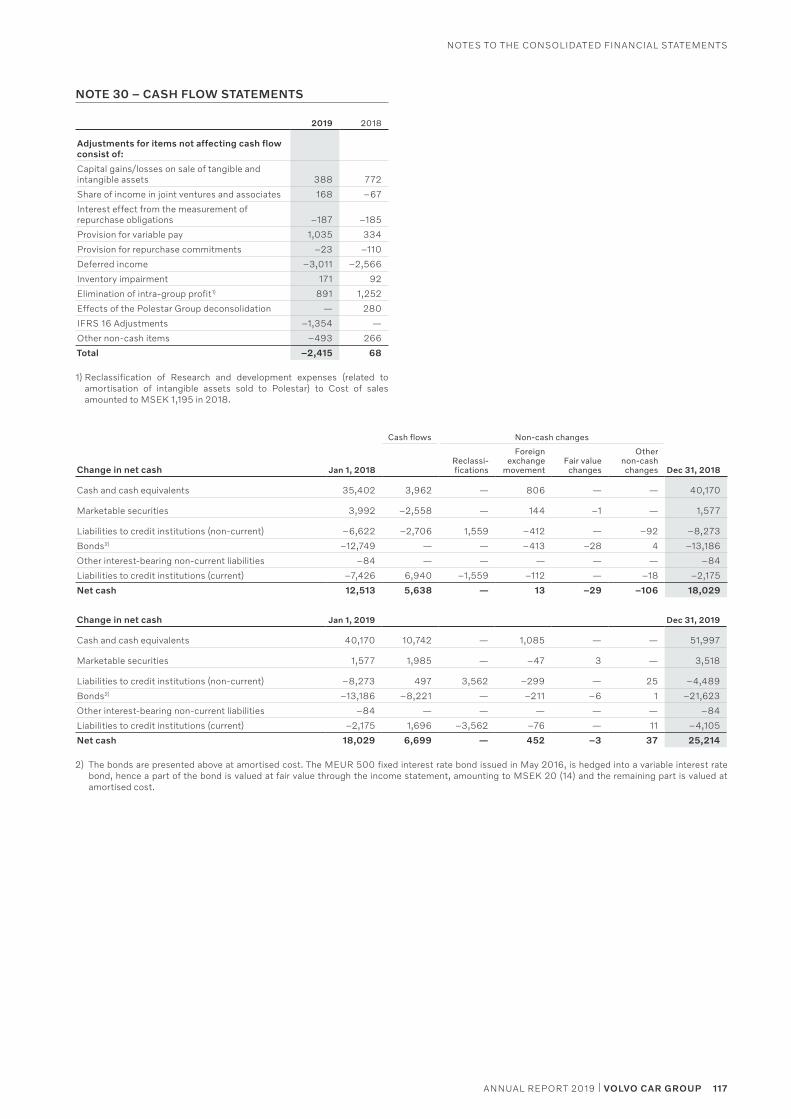
117ANNUAL REPORT 2019 | VOLVO CAR GROUP
NOTES TO THE CONSOLIDATED FINANCIAL STATEMENTS
Cash flows Non-cash changes
Change in net cash Jan 1, 2018Reclassi-fications
Foreign exchange
movementFair value
changes
Other non-cash changes Dec 31, 2018
Cash and cash equivalents 35,402 3,962 — 806 — — 40,170
Marketable securities 3,992 –2,558 — 144 –1 — 1,577
Liabilities to credit institutions (non-current) –6,622 –2,706 1,559 –412 — –92 –8,273
Bonds2) –12,749 — — –413 –28 4 –13,186
Other interest-bearing non-current liabilities –84 — — — — — –84
Liabilities to credit institutions (current) –7,426 6,940 –1,559 –112 — –18 –2,175
Net cash 12,513 5,638 — 13 –29 –106 18,029
Change in net cash Jan 1, 2019 Dec 31, 2019
Cash and cash equivalents 40,170 10,742 — 1,085 — — 51,997
Marketable securities 1,577 1,985 — –47 3 — 3,518
Liabilities to credit institutions (non-current) –8,273 497 3,562 –299 — 25 –4,489
Bonds2) –13,186 –8,221 — –211 –6 1 –21,623
Other interest-bearing non-current liabilities –84 — — — — — –84
Liabilities to credit institutions (current) –2,175 1,696 –3,562 –76 — 11 –4,105
Net cash 18,029 6,699 — 452 –3 37 25,214
2) The bonds are presented above at amortised cost. The MEUR 500 fixed interest rate bond issued in May 2016, is hedged into a variable interest rate bond, hence a part of the bond is valued at fair value through the income statement, amounting to MSEK 20 (14) and the remaining part is valued at amortised cost.
NOTE 30 – CASH FLOW STATEMENTS
2019 2018
Adjustments for items not affecting cash flow consist of:
Capital gains/losses on sale of tangible and intangible assets 388 772
Share of income in joint ventures and associates 168 –67
Interest effect from the measurement of repurchase obligations –187 –185
Provision for variable pay 1,035 334
Provision for repurchase commitments –23 –110
Deferred income –3,011 –2,566
Inventory impairment 171 92
Elimination of intra-group profit1) 891 1,252
Effects of the Polestar Group deconsolidation — 280
IFRS 16 Adjustments –1,354 —
Other non-cash items –493 266
Total –2,415 68
1) Reclassification of Research and development expenses (related to amortisation of intangible assets sold to Polestar) to Cost of sales amounted to MSEK 1,195 in 2018.
118 VOLVO CAR GROUP | ANNUAL REPORT 2019
NOTES TO THE CONSOLIDATED FINANCIAL STATEMENTS
The remeasured value at the date control was lost, is regarded as the cost on initial recognition of the investment in the joint venture.
In 2018 and 2019, subsequent to initial recognition of the invest-ment in the joint venture, Geely Group injected capital into Polestar Automotive (Shanghai) Co., Ltd. As these capital injections were an integrated part of above common control transaction, the capital injection by Geely Group increased Volvo Car Group’s investment in the joint venture, and increased equity in Volvo Car Group, reflected as transaction with the owner.
Adoption of preliminary acquistion analysisAn acquistion analysis is preliminary until adopted which must take place within twelve months from the acquisition.
The preliminary acquisition analysis previously recognised for Fas-tighetsbolag Sörred 8:9 AB and Volvo Car Real Estate and Assets 3 AB was adopted in 2019.
NOTE 32 – SEGMENT REPORTING
ACCOUNTING PRINCIPLES
Operating segments are defined as parts of the Group for which sep-arate financial information is available and is evaluated regularly by the Chief operating decision-making body how to allocate resources and in assessing performance.
The automotive business includes all activities related to develop-ment, design, manufacturing, assembly and sale of vehicles, as well as sale of related parts and accessories from which the Group derives its revenues. Volvo Car Group is managed by the Executive management team (EMT) with 12 members, led by the CEO and overseen by the Board of Directors. EMT takes all significant operat-ing decisions and members of EMT have the responsibility for imple-mentation of decisions in their respective areas. The operating deci-sion-making is at EMT level as a whole and Volvo Car Group consider the EMT to be the Chief operating decision-making body. All sub-stantial decisions regarding allocation of resources as well as the assessment of the performance is based on the Group as a whole.
CRITICAL ACCOUNTING ESTIMATES AND JUDGEMENTS
The regional organisation is not considered to constitute reporting segments. The main purpose of the regional organisation is to emphasise the responsibility for the regional market from a sales per-spective, with an increased focus on sales with more direct involve-ment from Group Management. All substantial decisions regarding allocation of resources as well as the assessment of the performance is based on the group as a whole. The allocation of resourses is not done by regions, but rather directly to individual markets. Therefore Volvo Car Group is considered to have only one operating segment.
For further information of the geographic spread of revenue, see Note 2 – Revenue. The geographic spread of non-current assets is disclosed below.
Sweden ChinaRest of
the World
Dec 31, 2019
Non-current assets 65% 15% 20%
Dec 31, 2018
Non-current assets 66% 15% 19%
NOTE 31 – BUSINESS COMBINATIONS
ACCOUNTING PRINCIPLES
In a business combination Volvo Car Group measures all acquired identifiable assets and liabilities at fair value. Any surplus amount from the purchase price, possible non-controlling interest and fair value of previously held equity interests at the acquisition date com-pared to Volvo Car Group’s share of acquired net assets is recognised as goodwill. Any deficit amount (bargain purchase), so called nega-tive goodwill, is directly recognised as income in the income state-ment. In step acquisitions, a business combination occurs only on the date control is achieved. Transactions with the non-controlling interest are recognised within equity as long as control of the subsid-iary is retained.
All acquisition-related transaction costs are expensed. Companies acquired are consolidated as of the date of acquisition. Companies that have been divested are included in the consolidated financial statements up to and including the date of the divestment. All busi-ness combinations are recognised in accordance with the acquisi-tion method.
CRITICAL ACCOUNTING ESTIMATES AND JUDGEMENTS
One area of critical judgement, relevant to Volvo Car Group is the one of common control, a situation where there is an acquisition between parties under common control. This means the acquired company has the same ultimate parent as the acquiring company. The stand-ard is silent on the subject and Volvo Car Group has therefore made a policy choice when it comes to handle common control transac-tions. Volvo Car Group has elected to apply predecessor accounting, meaning that the acquirer consolidates the predecessors respective carrying values for assets and liabilities. These are the carrying val-ues that are related to the acquired entity from the consolidated financial statements of the highest entity that has common control and for which consolidated financial statements are prepared. When applying predecessor accounting, Volvo Car Group has chosen to include acquired entities under common control for the entire period and not only from the transaction date. Adjustment is also made for the comparative period. Hence, the consolidated financial state-ments include the acquired entity’s results as if both entities (acquirer and acquire) have always been combined. These consolidated finan-cial statements will reflect both entities’ full year’s results. The corre-sponding amounts for the previous years also reflect the combined results of both entities, even though the transaction did not occur until the current year. The effect in the opening balance of the com-parative period is accounted for directly in equity.
In 2018, Volvo Car Group derecognised the Polestar business, i.e. Polestar Automotive (Shanghai) Co., Ltd and its wholly-owned sub-sidiaries. Derecognition was made from the date that control of these subsidiaries ceased, subsequent to an assessment of level of ownership and contractual arrangements between the owners. In the case of Polestar control ceased as an effect of the Geely Group subscribing for 50 per cent of the equity in Polestar Automotive (Shanghai) Co., Ltd, the parent company in the Polestar Group, com-bined with joint control contractual arrangements. In the consoli-dated balance sheets, Polestar Group´s assets and liabilities have been derecognised, and replaced by an investment in joint venture.
The investment retained in Polestar Group were recognised at its fair value at the date when control were lost. The difference between fair value and carring value was recognised directly in equity, as this was a transaction with the owner, a common control transaction.
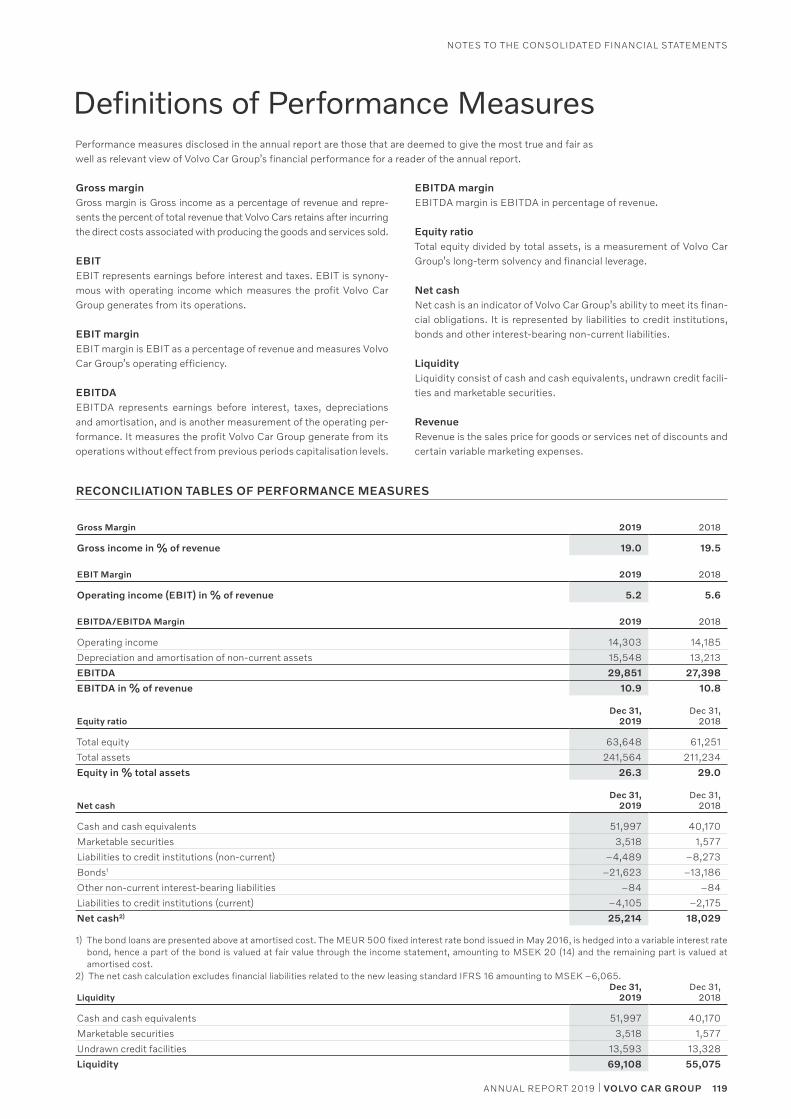
119ANNUAL REPORT 2019 | VOLVO CAR GROUP
NOTES TO THE CONSOLIDATED FINANCIAL STATEMENTS
Gross marginGross margin is Gross income as a percentage of revenue and repre-sents the percent of total revenue that Volvo Cars retains after incurring the direct costs associated with producing the goods and services sold.
EBITEBIT represents earnings before interest and taxes. EBIT is synony-mous with operating income which measures the profit Volvo Car Group generates from its operations.
EBIT marginEBIT margin is EBIT as a percentage of revenue and measures Volvo Car Group’s operating efficiency.
EBITDAEBITDA represents earnings before interest, taxes, depreciations and amortisation, and is another measurement of the operating per-formance. It measures the profit Volvo Car Group generate from its opera tions without effect from previous periods capitalisation levels.
EBITDA marginEBITDA margin is EBITDA in percentage of revenue.
Equity ratioTotal equity divided by total assets, is a measurement of Volvo Car Group’s long-term solvency and financial leverage.
Net cashNet cash is an indicator of Volvo Car Group’s ability to meet its finan-cial obligations. It is represented by liabilities to credit institutions, bonds and other interest-bearing non- current liabilities.
LiquidityLiquidity consist of cash and cash equivalents, undrawn credit facili-ties and marketable securities.
RevenueRevenue is the sales price for goods or services net of discounts and certain variable marketing expenses.
Performance measures disclosed in the annual report are those that are deemed to give the most true and fair as well as relevant view of Volvo Car Group’s financial performance for a reader of the annual report.
Definitions of Performance Measures
RECONCILIATION TABLES OF PERFORMANCE MEASURES
Gross Margin
2019
2018
Gross income in % of revenue 19.0 19.5
EBIT Margin 2019 2018
Operating income (EBIT) in % of revenue 5.2 5.6
EBITDA/EBITDA Margin 2019 2018
Operating income 14,303 14,185
Depreciation and amortisation of non-current assets 15,548 13,213
EBITDA 29,851 27,398
EBITDA in % of revenue 10.9 10.8
Equity ratioDec 31,
2019Dec 31,
2018
Total equity 63,648 61,251
Total assets 241,564 211,234
Equity in % total assets 26.3 29.0
Net cashDec 31,
2019Dec 31,
2018
Cash and cash equivalents 51,997 40,170
Marketable securities 3,518 1,577
Liabilities to credit institutions (non-current) –4,489 –8,273
Bonds1 –21,623 –13,186
Other non-current interest-bearing liabilities –84 –84
Liabilities to credit institutions (current) –4,105 –2,175
Net cash2) 25,214 18,029
1) The bond loans are presented above at amortised cost. The MEUR 500 fixed interest rate bond issued in May 2016, is hedged into a variable interest rate bond, hence a part of the bond is valued at fair value through the income statement, amounting to MSEK 20 (14) and the remaining part is valued at amortised cost.
2) The net cash calculation excludes financial liabilities related to the new leasing standard IFRS 16 amounting to MSEK –6,065.
LiquidityDec 31,
2019Dec 31,
2018
Cash and cash equivalents 51,997 40,170
Marketable securities 3,518 1,577
Undrawn credit facilities 13,593 13,328
Liquidity 69,108 55,075
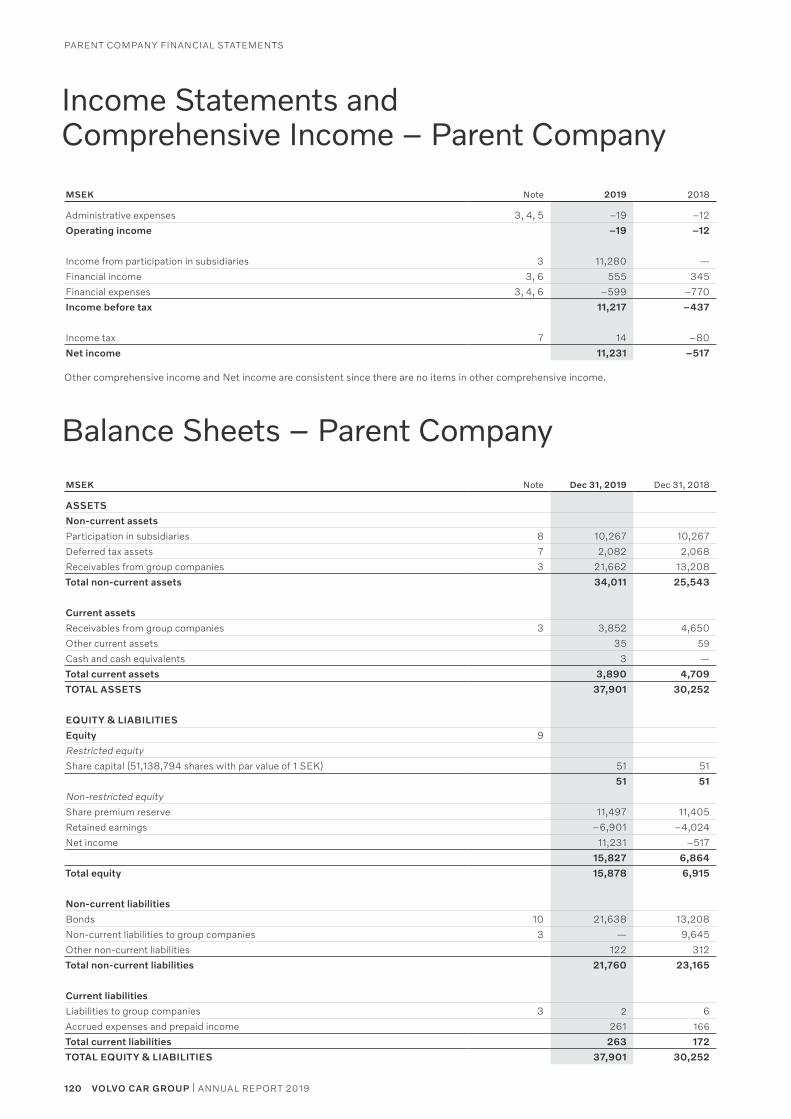
120 VOLVO CAR GROUP | ANNUAL REPORT 2019
PARENT COMPANy FINANCIAL STATEMENTS
MSEK Note Dec 31, 2019 Dec 31, 2018
ASSETS
Non-current assets
Participation in subsidiaries 8 10,267 10,267
Deferred tax assets 7 2,082 2,068
Receivables from group companies 3 21,662 13,208
Total non-current assets 34,011 25,543
Current assets
Receivables from group companies 3 3,852 4,650
Other current assets 35 59
Cash and cash equivalents 3 —
Total current assets 3,890 4,709
TOTAL ASSETS 37,901 30,252
EQUITY & LIABILITIES
Equity 9
Restricted equity
Share capital (51,138,794 shares with par value of 1 SEK) 51 51
51 51
Non-restricted equity
Share premium reserve 11,497 11,405
Retained earnings –6,901 –4,024
Net income 11,231 –517
15,827 6,864
Total equity 15,878 6,915
Non-current liabilities
Bonds 10 21,638 13,208
Non-current liabilities to group companies 3 — 9,645
Other non-current liabilities 122 312
Total non-current liabilities 21,760 23,165
Current liabilities
Liabilities to group companies 3 2 6
Accrued expenses and prepaid income 261 166
Total current liabilities 263 172
TOTAL EQUITY & LIABILITIES 37,901 30,252
Balance Sheets – Parent Company
MSEK Note 2019 2018
Administrative expenses 3, 4, 5 –19 –12
Operating income –19 –12
Income from participation in subsidiaries 3 11,280 —
Financial income 3, 6 555 345
Financial expenses 3, 4, 6 –599 –770
Income before tax 11,217 –437
Income tax 7 14 –80
Net income 11,231 –517
Other comprehensive income and Net income are consistent since there are no items in other comprehensive income.
Income Statements and Comprehensive Income – Parent Company
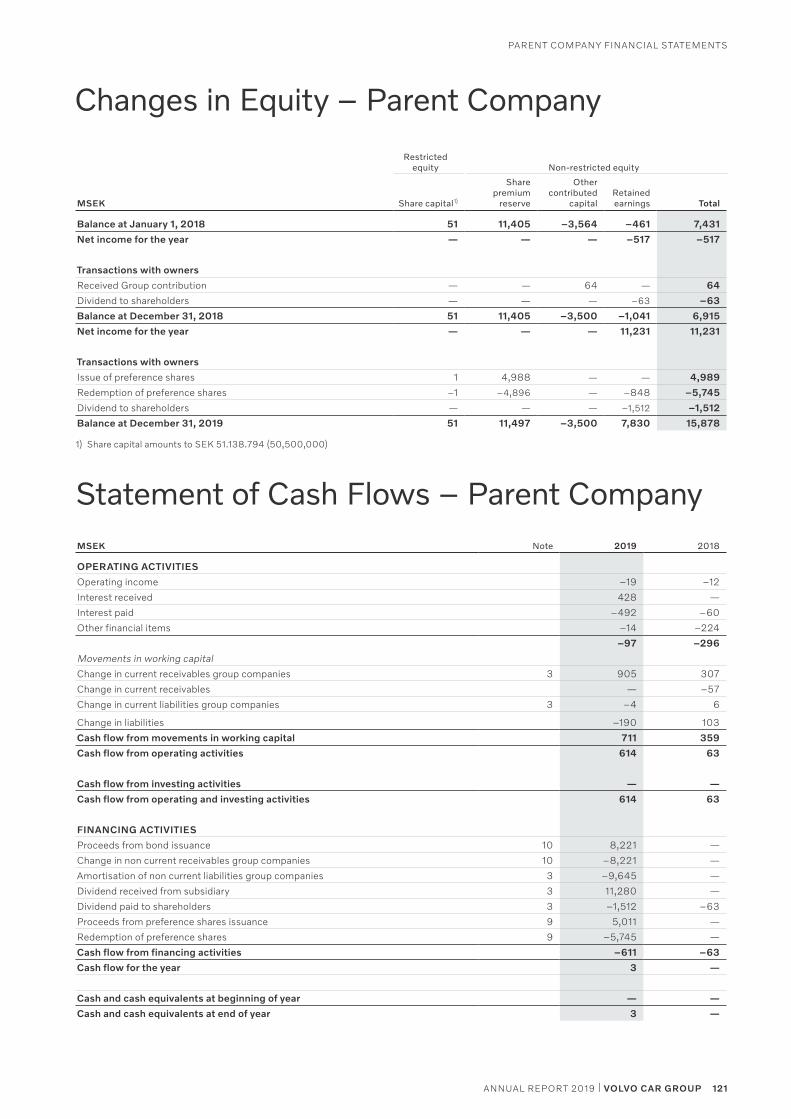
121ANNUAL REPORT 2019 | VOLVO CAR GROUP
PARENT COMPANy FINANCIAL STATEMENTS
Restricted equity Non-restricted equity
MSEK Share capital1)
Share premium
reserve
Other contributed
capitalRetained earnings Total
Balance at January 1, 2018 51 11,405 –3,564 –461 7,431
Net income for the year — — — –517 –517
Transactions with owners
Received Group contribution — — 64 — 64
Dividend to shareholders — — — –63 –63
Balance at December 31, 2018 51 11,405 –3,500 –1,041 6,915
Net income for the year — — — 11,231 11,231
Transactions with owners
Issue of preference shares 1 4,988 — — 4,989
Redemption of preference shares –1 –4,896 — –848 –5,745
Dividend to shareholders — — — –1,512 –1,512
Balance at December 31, 2019 51 11,497 –3,500 7,830 15,878
1) Share capital amounts to SEK 51.138.794 (50,500,000)
Changes in Equity – Parent Company
Statement of Cash Flows – Parent CompanyMSEK Note 2019 2018
OPERATING ACTIVITIES
Operating income –19 –12
Interest received 428 —
Interest paid –492 –60
Other financial items –14 –224
–97 –296
Movements in working capital
Change in current receivables group companies 3 905 307
Change in current receivables — –57
Change in current liabilities group companies 3 –4 6
Change in liabilities –190 103
Cash flow from movements in working capital 711 359
Cash flow from operating activities 614 63
Cash flow from investing activities — —
Cash flow from operating and investing activities 614 63
FINANCING ACTIVITIES
Proceeds from bond issuance 10 8,221 —
Change in non current receivables group companies 10 –8,221 —
Amortisation of non current liabilities group companies 3 –9,645 —
Dividend received from subsidiary 3 11,280 —
Dividend paid to shareholders 3 –1,512 –63
Proceeds from preference shares issuance 9 5,011 —
Redemption of preference shares 9 –5,745 —
Cash flow from financing activities –611 –63
Cash flow for the year 3 —
Cash and cash equivalents at beginning of year — —
Cash and cash equivalents at end of year 3 —
122 VOLVO CAR GROUP | ANNUAL REPORT 2019
notes to the Parent comPany financial statements
NOTE 1 – SIGNIFICANT ACCOUNTING PRINCIPLES
Basis of preparationthe Parent company has prepared its financial statements in accord-ance with the swedish annual accounts act (1995:1554) and rfr 2, accounting for legal entities. according to rfr 2, the Parent company shall apply all the international financial reporting stand-ards endorsed by the eU as far as this is possible within the frame-work of the swedish annual accounts act. changes in rfr 2 appli-cable to the fiscal year beginning January 1, 2019, have had no material impact on the financial statements of the Parent company.
all specific accounting principles considered material to Volvo car Group is described in conjunction with each presented note in the consolidated financial statements. the main deviations between the accounting policies applied by the Volvo car Group and the Parent company are described below.
Shares and participations in Group companies shares and participations in Group companies are recognised at cost in the Parent company’s balance sheet and test for impairment is performed annually. Dividends are recognised in the income state-ment. all shares and participations are related to business opera-tions and profit and loss from these are reported within operating income.
transaction costs directly attributable to acquisitions of shares and participations in Group companies are accounted for as an increase in the carrying amount.
Group contributions made to subsidiaries are reported as an increase of investments in these subsidiaries. a review is at the same time made to conclude whether or not there is an impairment risk with regards to the same shares of the subsidiaries having received the group contribution. tax effect of these group contributions are recgonised in the income statement. Group contributions made to parent company are recgonised in equity, along with the tax effect. received group contributions from subsidiaries are recgonised as financial income. tax effect on received group contributions are recgonised in the income statement. received group contributions from parent company are recorded in equity, along with the tax effect.
made shareholders’ contributions are recognised in shares in sub-sidiaries and as such they are subject to impairment testing.
Income taxesDeferred tax liability on untaxed reserves are included in untaxed reserves in the parent company.
Equityin accordance with the swedish annual accounts act, equity is split between restricted and non-restricted equity.
Notes to The Parent Company Financial Statements all amounts are in mseK unless otherwise stated. amounts in brackets refer to the preceding year.
NOTE 2 – CRITICAL ACCOUNTING ESTIMATES AND JUDGEMENTS
Preparation of the financial statements in accordance with the swedish annual accounts act (1995:1554) and rfr 2 requires the company’s executive management and Board of Directors to make estimates and judgements as well as to make assumptions that affect application of the accounting policies and the reported assets, liabilities, income and expenses. critical accounting estimates and judgements applied by the Volvo car Group are described in con-junction with applicable note in the consolidated financial state-ments. none of these critical accounting estimates are applicable to the parent company. shares and participations in Group companies recognised at cost in the Parent company are being tested for impairment annually or if an indication of impairment exists.
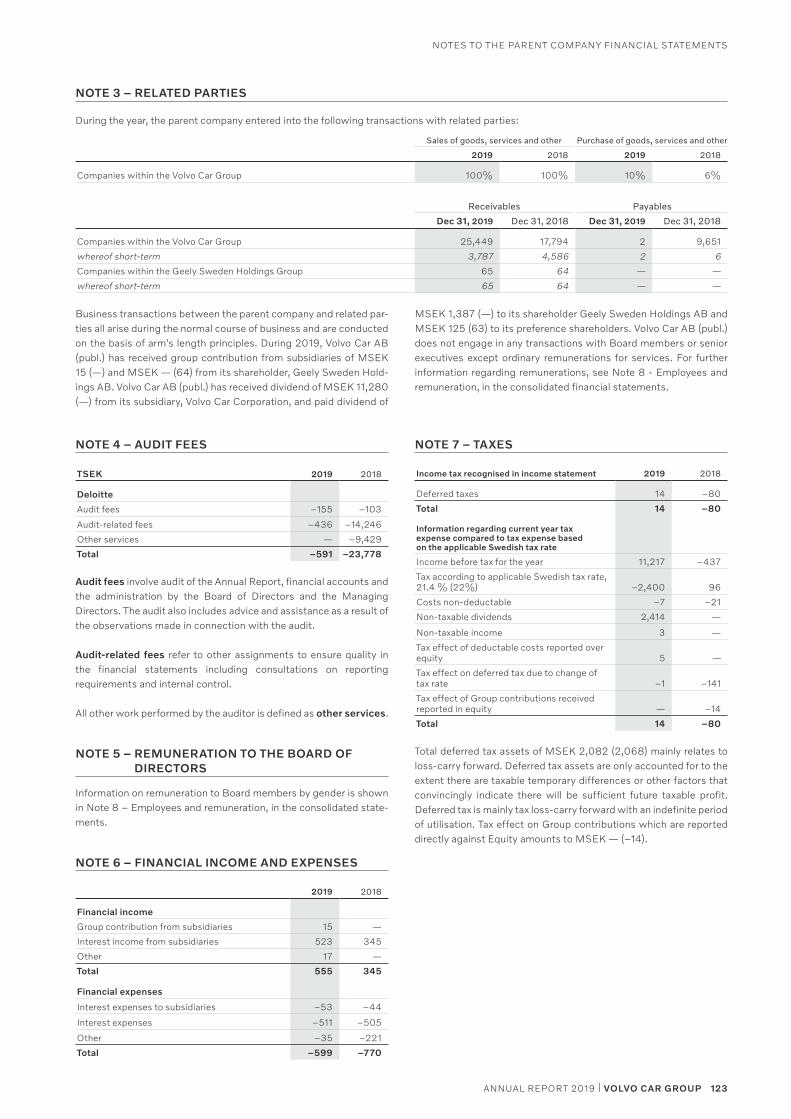
123ANNUAL REPORT 2019 | VOLVO CAR GROUP
notes to the Parent comPany financial statements
NOTE 4 – AUDIT FEES
TSEK 2019 2018
Deloitte
audit fees –155 –103
audit-related fees –436 –14,246
other services — –9,429
Total –591 –23,778
Audit fees involve audit of the annual report, financial accounts and the administration by the Board of Directors and the managing Directors. the audit also includes advice and assistance as a result of the observations made in connection with the audit.
Audit-related fees refer to other assignments to ensure quality in the financial statements including consultations on reporting requirements and internal control.
all other work performed by the auditor is defined as other services.
NOTE 5 – REMUNERATION TO THE BOARD OF DIRECTORS
information on remuneration to Board members by gender is shown in note 8 – employees and remuneration, in the consolidated state-ments.
NOTE 6 – FINANCIAL INCOME AND EXPENSES
2019 2018
Financial income
Group contribution from subsidiaries 15 —
interest income from subsidiaries 523 345
other 17 —
Total 555 345
Financial expenses
interest expenses to subsidiaries –53 –44
interest expenses –511 –505
other –35 –221
Total –599 –770
NOTE 7 – TAXES
Income tax recognised in income statement 2019 2018
Deferred taxes 14 –80
Total 14 –80
Information regarding current year tax expense compared to tax expense based on the applicable Swedish tax rate
income before tax for the year 11,217 –437
tax according to applicable swedish tax rate, 21.4 % (22%) –2,400 96
costs non-deductable –7 –21
non-taxable dividends 2,414 —
non-taxable income 3 —
tax effect of deductable costs reported over equity 5 —
tax effect on deferred tax due to change of tax rate –1 –141
tax effect of Group contributions received reported in equity — –14
Total 14 –80
total deferred tax assets of mseK 2,082 (2,068) mainly relates to loss-carry forward. Deferred tax assets are only accounted for to the extent there are taxable temporary differences or other factors that convincingly indicate there will be sufficient future taxable profit. Deferred tax is mainly tax loss-carry forward with an indefinite period of utilisation. tax effect on Group contributions which are reported directly against equity amounts to mseK — (–14).
NOTE 3 – RELATED PARTIES
During the year, the parent company entered into the following transactions with related parties:
Sales of goods, services and other Purchase of goods, services and other
2019 2018 2019 2018
companies within the Volvo car Group 100% 100% 10% 6%
Receivables Payables
Dec 31, 2019 Dec 31, 2018 Dec 31, 2019 Dec 31, 2018
companies within the Volvo car Group 25,449 17,794 2 9,651
whereof short-term 3,787 4,586 2 6
companies within the Geely sweden holdings Group 65 64 — —
whereof short-term 65 64 — —
Business transactions between the parent company and related par-ties all arise during the normal course of business and are conducted on the basis of arm's length principles. During 2019, Volvo car aB (publ.) has received group contribution from subsidiaries of mseK 15 (—) and mseK — (64) from its shareholder, Geely sweden hold-ings aB. Volvo car aB (publ.) has received dividend of mseK 11,280 (—) from its subsidiary, Volvo car corporation, and paid dividend of
mseK 1,387 (—) to its shareholder Geely sweden holdings aB and mseK 125 (63) to its preference shareholders. Volvo car aB (publ.) does not engage in any transactions with Board members or senior executives except ordinary remunerations for services. for further information regarding remunerations, see note 8 - employees and remuneration, in the consolidated financial statements.
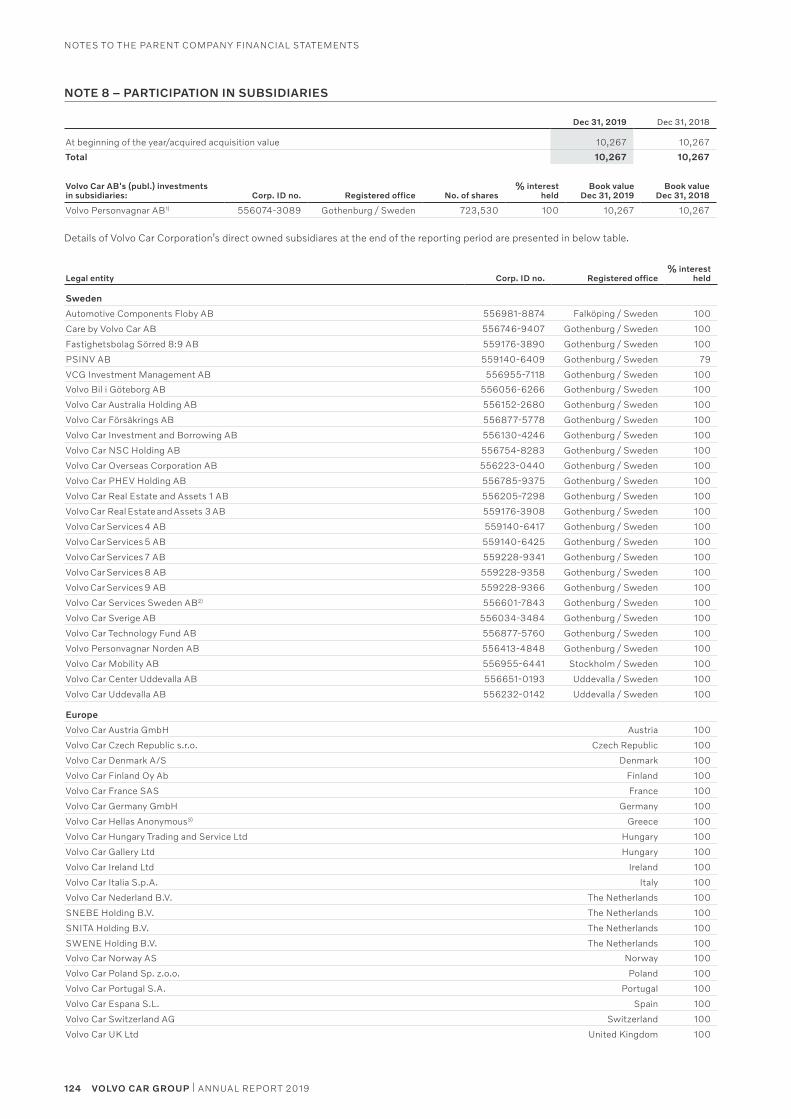
124 VOLVO CAR GROUP | ANNUAL REPORT 2019
notes to the Parent comPany financial statements
NOTE 8 – PARTICIPATION IN SUBSIDIARIES
Dec 31, 2019 Dec 31, 2018
at beginning of the year/acquired acquisition value 10,267 10,267
Total 10,267 10,267
Volvo Car AB's (publ.) investments in subsidiaries: Corp. ID no. Registered office No. of shares
% interest held
Book value Dec 31, 2019
Book value Dec 31, 2018
Volvo Personvagnar aB1) 556074-3089 Gothenburg / sweden 723,530 100 10,267 10,267
Details of Volvo car corporation’s direct owned subsidiares at the end of the reporting period are presented in below table.
Legal entity Corp. ID no. Registered office% interest
held
Sweden
automotive components floby aB 556981-8874 falköping / sweden 100
care by Volvo car aB 556746-9407 Gothenburg / sweden 100
fastighetsbolag sörred 8:9 aB 559176-3890 Gothenburg / sweden 100
PsinV aB 559140-6409 Gothenburg / sweden 79
VcG investment management aB 556955-7118 Gothenburg / sweden 100
Volvo Bil i Göteborg aB 556056-6266 Gothenburg / sweden 100
Volvo car australia holding aB 556152-2680 Gothenburg / sweden 100
Volvo car försäkrings aB 556877-5778 Gothenburg / sweden 100
Volvo car investment and Borrowing aB 556130-4246 Gothenburg / sweden 100
Volvo car nsc holding aB 556754-8283 Gothenburg / sweden 100
Volvo car overseas corporation aB 556223-0440 Gothenburg / sweden 100
Volvo car PheV holding aB 556785-9375 Gothenburg / sweden 100
Volvo car real estate and assets 1 aB 556205-7298 Gothenburg / sweden 100
Volvo car real estate and assets 3 aB 559176-3908 Gothenburg / sweden 100
Volvo car services 4 aB 559140-6417 Gothenburg / sweden 100
Volvo car services 5 aB 559140-6425 Gothenburg / sweden 100
Volvo car services 7 aB 559228-9341 Gothenburg / sweden 100
Volvo car services 8 aB 559228-9358 Gothenburg / sweden 100
Volvo car services 9 aB 559228-9366 Gothenburg / sweden 100
Volvo car services sweden aB2) 556601-7843 Gothenburg / sweden 100
Volvo car sverige aB 556034-3484 Gothenburg / sweden 100
Volvo car technology fund aB 556877-5760 Gothenburg / sweden 100
Volvo Personvagnar norden aB 556413-4848 Gothenburg / sweden 100
Volvo car mobility aB 556955-6441 stockholm / sweden 100
Volvo car center Uddevalla aB 556651-0193 Uddevalla / sweden 100
Volvo car Uddevalla aB 556232-0142 Uddevalla / sweden 100
Europe
Volvo car austria Gmbh austria 100
Volvo car czech republic s.r.o. czech republic 100
Volvo car Denmark a/s Denmark 100
Volvo car finland oy ab finland 100
Volvo car france sas france 100
Volvo car Germany Gmbh Germany 100
Volvo car hellas anonymous3) Greece 100
Volvo car hungary trading and service ltd hungary 100
Volvo car Gallery ltd hungary 100
Volvo car ireland ltd ireland 100
Volvo car italia s.p.a. italy 100
Volvo car nederland B.V. the netherlands 100
sneBe holding B.V. the netherlands 100
snita holding B.V. the netherlands 100
sWene holding B.V. the netherlands 100
Volvo car norway as norway 100
Volvo car Poland sp. z.o.o. Poland 100
Volvo car Portugal s.a. Portugal 100
Volvo car espana s.l. spain 100
Volvo car switzerland aG switzerland 100
Volvo car UK ltd United Kingdom 100
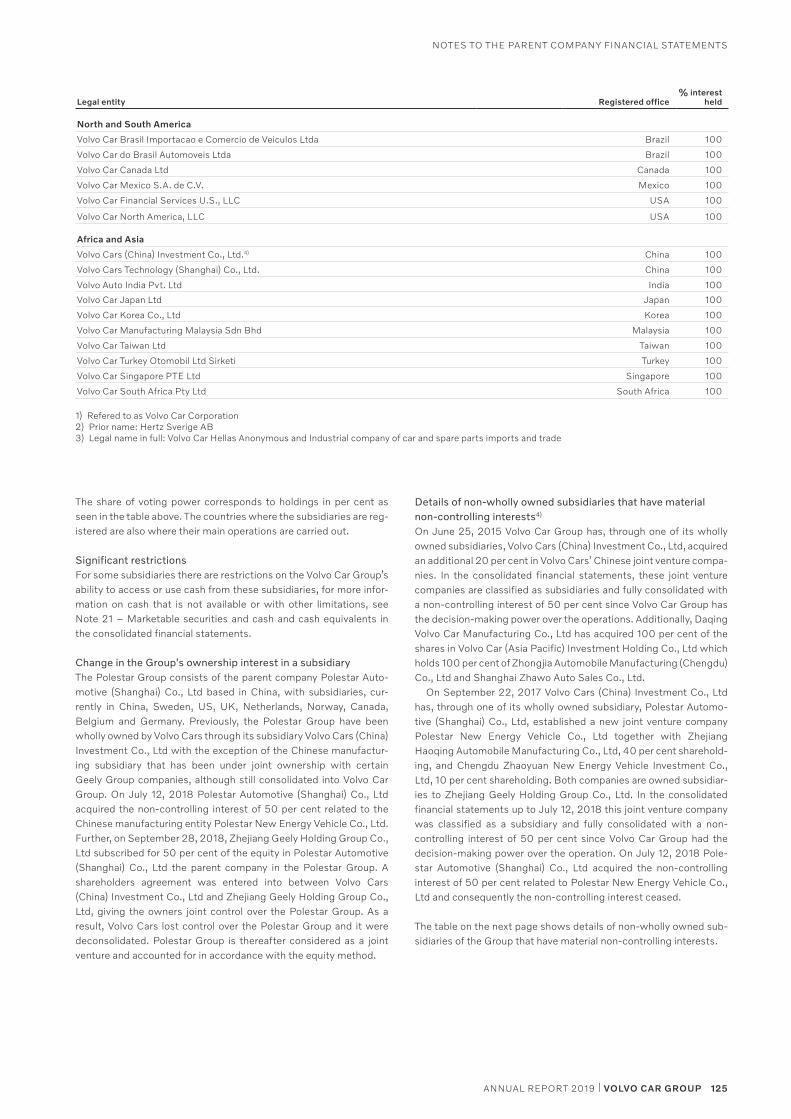
125ANNUAL REPORT 2019 | VOLVO CAR GROUP
notes to the Parent comPany financial statements
the share of voting power corresponds to holdings in per cent as seen in the table above. the countries where the subsidiaries are reg-istered are also where their main operations are carried out.
Significant restrictionsfor some subsidiaries there are restrictions on the Volvo car Group’s ability to access or use cash from these subsidiaries, for more infor-mation on cash that is not available or with other limitations, see note 21 – marketable securities and cash and cash equivalents in the consolidated financial statements.
Change in the Group's ownership interest in a subsidiarythe Polestar Group consists of the parent company Polestar auto-motive (shanghai) co., ltd based in china, with subsidiaries, cur-rently in china, sweden, Us, UK, netherlands, norway, canada, Belgium and Germany. Previously, the Polestar Group have been wholly owned by Volvo cars through its subsidiary Volvo cars (china) investment co., ltd with the exception of the chinese manufactur-ing subsidiary that has been under joint ownership with certain Geely Group companies, although still consolidated into Volvo car Group. on July 12, 2018 Polestar automotive (shanghai) co., ltd acquired the non-controlling interest of 50 per cent related to the chinese manufacturing entity Polestar new energy Vehicle co., ltd. further, on september 28, 2018, Zhejiang Geely holding Group co., ltd subscribed for 50 per cent of the equity in Polestar automotive (shanghai) co., ltd the parent company in the Polestar Group. a shareholders agreement was entered into between Volvo cars (china) investment co., ltd and Zhejiang Geely holding Group co., ltd, giving the owners joint control over the Polestar Group. as a result, Volvo cars lost control over the Polestar Group and it were deconsolidated. Polestar Group is thereafter considered as a joint venture and accounted for in accordance with the equity method.
Legal entity Registered office% interest
held
North and South America
Volvo car Brasil importacao e comercio de Veiculos ltda Brazil 100
Volvo car do Brasil automoveis ltda Brazil 100
Volvo car canada ltd canada 100
Volvo car mexico s.a. de c.V. mexico 100
Volvo car financial services U.s., llc Usa 100
Volvo car north america, llc Usa 100
Africa and Asia
Volvo cars (china) investment co., ltd.4) china 100
Volvo cars technology (shanghai) co., ltd. china 100
Volvo auto india Pvt. ltd india 100
Volvo car Japan ltd Japan 100
Volvo car Korea co., ltd Korea 100
Volvo car manufacturing malaysia sdn Bhd malaysia 100
Volvo car taiwan ltd taiwan 100
Volvo car turkey otomobil ltd sirketi turkey 100
Volvo car singapore Pte ltd singapore 100
Volvo car south africa Pty ltd south africa 100
1) refered to as Volvo car corporation 2) Prior name: hertz sverige aB3) legal name in full: Volvo car hellas anonymous and industrial company of car and spare parts imports and trade
Details of non-wholly owned subsidiaries that have material non-controlling interests4)
on June 25, 2015 Volvo car Group has, through one of its wholly owned subsidiaries, Volvo cars (china) investment co., ltd, acquired an additional 20 per cent in Volvo cars’ chinese joint venture compa-nies. in the consolidated financial statements, these joint venture companies are classified as subsidiaries and fully consolidated with a non-controlling interest of 50 per cent since Volvo car Group has the decision-making power over the operations. additionally, Daqing Volvo car manufacturing co., ltd has acquired 100 per cent of the shares in Volvo car (asia Pacific) investment holding co., ltd which holds 100 per cent of Zhongjia automobile manufacturing (chengdu) co., ltd and shanghai Zhawo auto sales co., ltd.
on september 22, 2017 Volvo cars (china) investment co., ltd has, through one of its wholly owned subsidiary, Polestar automo-tive (shanghai) co., ltd, established a new joint venture company Polestar new energy Vehicle co., ltd together with Zhejiang haoqing automobile manufacturing co., ltd, 40 per cent sharehold-ing, and chengdu Zhaoyuan new energy Vehicle investment co., ltd, 10 per cent shareholding. Both companies are owned subsidiar-ies to Zhejiang Geely holding Group co., ltd. in the consolidated financial statements up to July 12, 2018 this joint venture company was classified as a subsidiary and fully consolidated with a non- controlling interest of 50 per cent since Volvo car Group had the decision-making power over the operation. on July 12, 2018 Pole-star automotive (shanghai) co., ltd acquired the non-controlling interest of 50 per cent related to Polestar new energy Vehicle co., ltd and consequently the non-controlling interest ceased.
the table on the next page shows details of non-wholly owned sub-sidiaries of the Group that have material non-controlling interests.
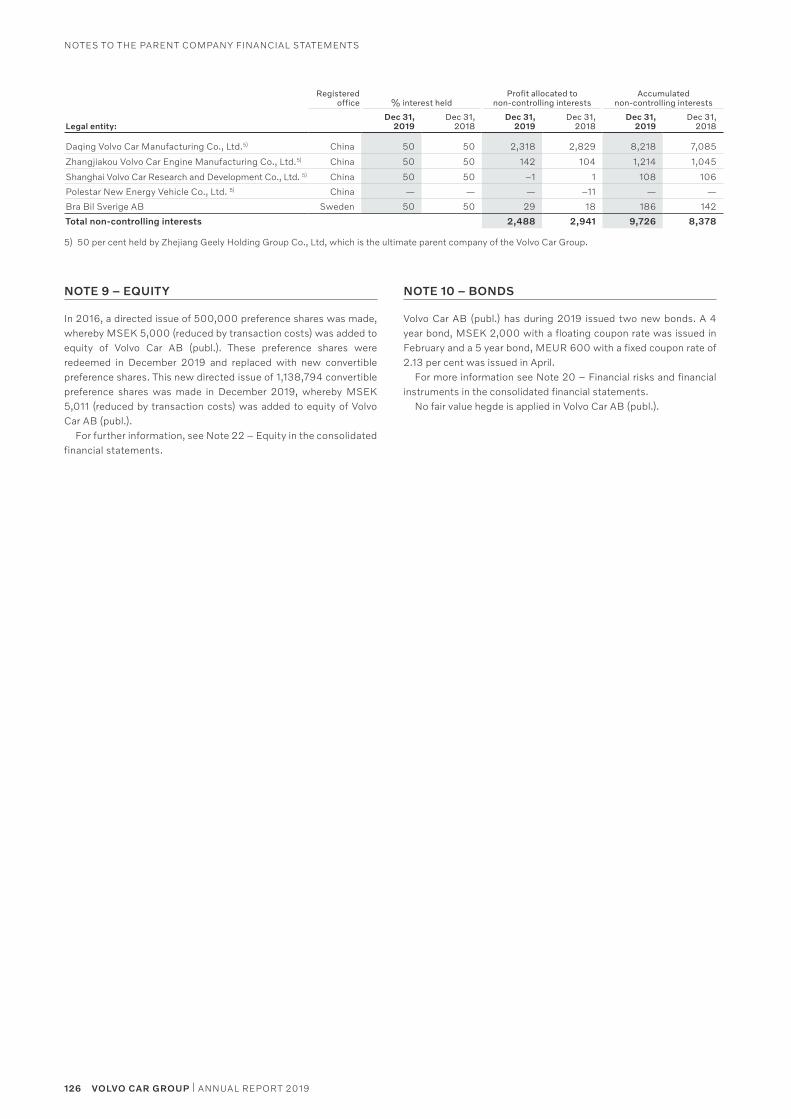
126 VOLVO CAR GROUP | ANNUAL REPORT 2019
notes to the Parent comPany financial statements
NOTE 9 – EQUITY
in 2016, a directed issue of 500,000 preference shares was made, whereby mseK 5,000 (reduced by transaction costs) was added to equity of Volvo car aB (publ.). these preference shares were redeemed in December 2019 and replaced with new convertible preference shares. this new directed issue of 1,138,794 convertible preference shares was made in December 2019, whereby mseK 5,011 (reduced by transaction costs) was added to equity of Volvo car aB (publ.).
for further information, see note 22 – equity in the consolidated financial statements.
NOTE 10 – BONDS
Volvo car aB (publ.) has during 2019 issued two new bonds. a 4 year bond, mseK 2,000 with a floating coupon rate was issued in february and a 5 year bond, meUr 600 with a fixed coupon rate of 2.13 per cent was issued in april.
for more information see note 20 – financial risks and financial instruments in the consolidated financial statements.
no fair value hegde is applied in Volvo car aB (publ.).
Registered office % interest held
Profit allocated to non-controlling interests
Accumulated non-controlling interests
Legal entity:Dec 31,
2019Dec 31,
2018Dec 31,
2019Dec 31,
2018Dec 31,
2019Dec 31,
2018
Daqing Volvo car manufacturing co., ltd.5) china 50 50 2,318 2,829 8,218 7,085
Zhangjiakou Volvo car engine manufacturing co., ltd.5) china 50 50 142 104 1,214 1,045
shanghai Volvo car research and Development co., ltd. 5) china 50 50 –1 1 108 106
Polestar new energy Vehicle co., ltd. 5) china — — — –11 — —
Bra Bil sverige aB sweden 50 50 29 18 186 142
Total non-controlling interests 2,488 2,941 9,726 8,378
5) 50 per cent held by Zhejiang Geely holding Group co., ltd, which is the ultimate parent company of the Volvo car Group.
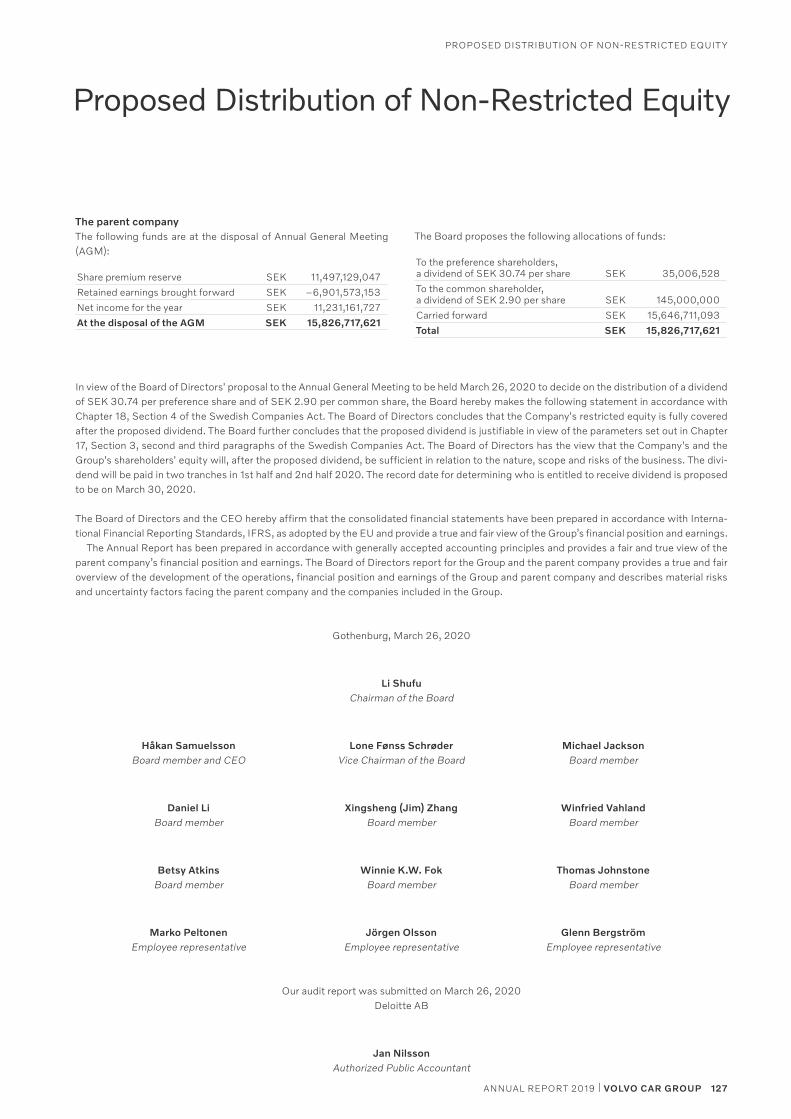
127ANNUAL REPORT 2019 | VOLVO CAR GROUP
ProPoseD DistriBUtion of non-restricteD eqUit y
Proposed Distribution of Non-Restricted Equity
The parent companythe following funds are at the disposal of annual General meeting (aGm):
share premium reserve seK 11,497,129,047
retained earnings brought forward seK –6,901,573,153
net income for the year seK 11,231,161,727
At the disposal of the AGM SEK 15,826,717,621
the Board proposes the following allocations of funds:
to the preference shareholders,a dividend of seK 30.74 per share seK 35,006,528
to the common shareholder,a dividend of seK 2.90 per share seK 145,000,000
carried forward seK 15,646,711,093
Total SEK 15,826,717,621
in view of the Board of Directors' proposal to the annual General meeting to be held march 26, 2020 to decide on the distribution of a dividendof seK 30.74 per preference share and of seK 2.90 per common share, the Board hereby makes the following statement in accordance with chapter 18, section 4 of the swedish companies act. the Board of Directors concludes that the company's restricted equity is fully covered after the proposed dividend. the Board further concludes that the proposed dividend is justifiable in view of the parameters set out in chapter 17, section 3, second and third paragraphs of the swedish companies act. the Board of Directors has the view that the company's and the Group's shareholders' equity will, after the proposed dividend, be sufficient in relation to the nature, scope and risks of the business. the divi-dend will be paid in two tranches in 1st half and 2nd half 2020. the record date for determining who is entitled to receive dividend is proposed to be on march 30, 2020.
the Board of Directors and the ceo hereby affirm that the consolidated financial statements have been prepared in accordance with interna-tional financial reporting standards, ifrs, as adopted by the eU and provide a true and fair view of the Group’s financial position and earnings.
the annual report has been prepared in accordance with generally accepted accounting principles and provides a fair and true view of the parent company’s financial position and earnings. the Board of Directors report for the Group and the parent company provides a true and fair overview of the development of the operations, financial position and earnings of the Group and parent company and describes material risks and uncertainty factors facing the parent company and the companies included in the Group.
Gothenburg, march 26, 2020
Li Shufuchairman of the Board
Håkan Samuelsson Lone Fønss Schrøder Michael Jackson Board member and ceo Vice chairman of the Board Board member
Daniel Li Xingsheng (Jim) Zhang Winfried Vahland Board member Board member Board member
Betsy Atkins Winnie K.W. Fok Thomas Johnstone Board member Board member Board member
Marko Peltonen Jörgen Olsson Glenn Bergström employee representative employee representative employee representative
our audit report was submitted on march 26, 2020 Deloitte aB
Jan Nilssonauthorized Public accountant
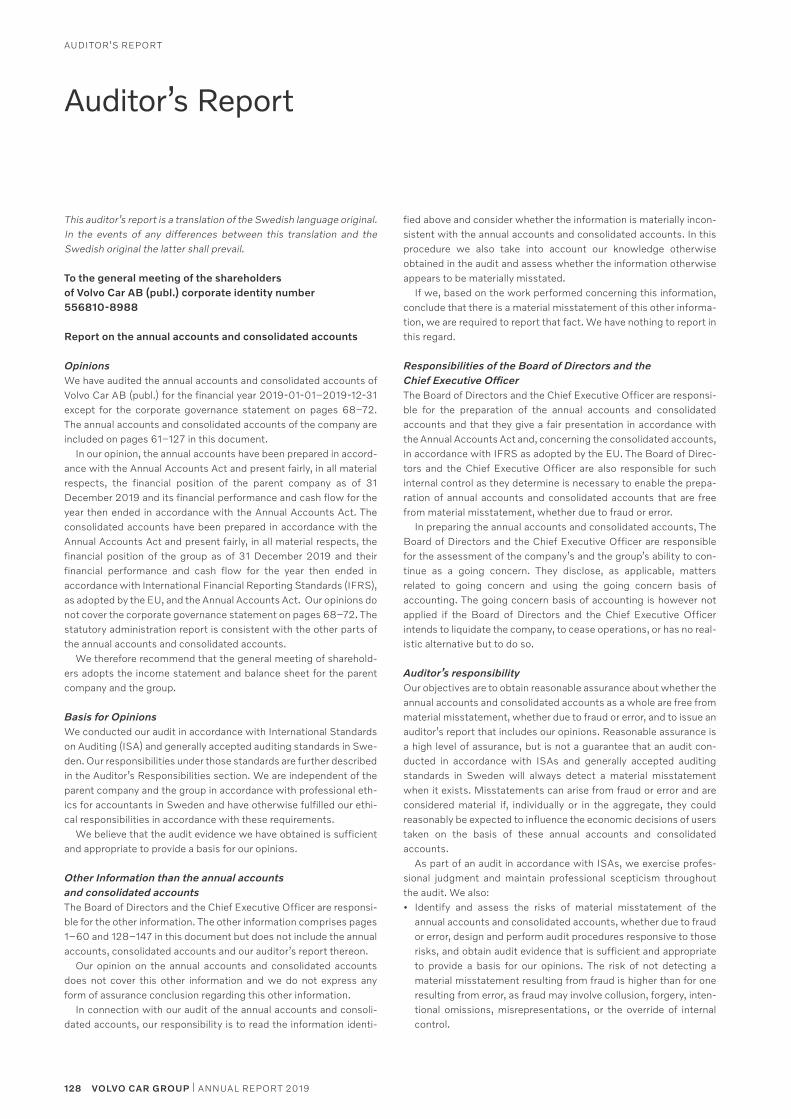
128 VOLVO CAR GROUP | ANNUAL REPORT 2019
AUDITOR’S REPORT
Auditor’s Report
This auditor’s report is a translation of the Swedish language original. In the events of any differences between this translation and the Swedish original the latter shall prevail.
To the general meeting of the shareholders of Volvo Car AB (publ.) corporate identity number 556810-8988
Report on the annual accounts and consolidated accounts
OpinionsWe have audited the annual accounts and consolidated accounts of Volvo Car AB (publ.) for the financial year 2019-01-01–2019-12-31 except for the corporate governance statement on pages 68–72. The annual accounts and consolidated accounts of the company are included on pages 61–127 in this document.
In our opinion, the annual accounts have been prepared in accord-ance with the Annual Accounts Act and present fairly, in all material respects, the financial position of the parent company as of 31 December 2019 and its financial performance and cash flow for the year then ended in accordance with the Annual Accounts Act. The consolidated accounts have been prepared in accordance with the Annual Accounts Act and present fairly, in all material respects, the financial position of the group as of 31 December 2019 and their financial performance and cash flow for the year then ended in accordance with International Financial Reporting Standards (IFRS), as adopted by the EU, and the Annual Accounts Act. Our opinions do not cover the corporate governance statement on pages 68–72. The statutory administration report is consistent with the other parts of the annual accounts and consolidated accounts.
We therefore recommend that the general meeting of sharehold-ers adopts the income statement and balance sheet for the parent company and the group.
Basis for OpinionsWe conducted our audit in accordance with International Standards on Auditing (ISA) and generally accepted auditing standards in Swe-den. Our responsibilities under those standards are further described in the Auditor’s Responsibilities section. We are independent of the parent company and the group in accordance with professional eth-ics for accountants in Sweden and have otherwise fulfilled our ethi-cal responsibilities in accordance with these requirements.
We believe that the audit evidence we have obtained is sufficient and appropriate to provide a basis for our opinions.
Other Information than the annual accounts and consolidated accountsThe Board of Directors and the Chief Executive Officer are responsi-ble for the other information. The other information comprises pages 1–60 and 128–147 in this document but does not include the annual accounts, consolidated accounts and our auditor’s report thereon.
Our opinion on the annual accounts and consolidated accounts does not cover this other information and we do not express any form of assurance conclusion regarding this other information.
In connection with our audit of the annual accounts and consoli-dated accounts, our responsibility is to read the information identi-
fied above and consider whether the information is materially incon-sistent with the annual accounts and consolidated accounts. In this procedure we also take into account our knowledge otherwise obtained in the audit and assess whether the information otherwise appears to be materially misstated.
If we, based on the work performed concerning this information, conclude that there is a material misstatement of this other informa-tion, we are required to report that fact. We have nothing to report in this regard.
Responsibilities of the Board of Directors and the Chief Executive OfficerThe Board of Directors and the Chief Executive Officer are responsi-ble for the preparation of the annual accounts and consolidated accounts and that they give a fair presentation in accordance with the Annual Accounts Act and, concerning the consolidated accounts, in accordance with IFRS as adopted by the EU. The Board of Direc-tors and the Chief Executive Officer are also responsible for such internal control as they determine is necessary to enable the prepa-ration of annual accounts and consolidated accounts that are free from material misstatement, whether due to fraud or error.
In preparing the annual accounts and consolidated accounts, The Board of Directors and the Chief Executive Officer are responsible for the assessment of the company’s and the group’s ability to con-tinue as a going concern. They disclose, as applicable, matters related to going concern and using the going concern basis of accounting. The going concern basis of accounting is however not applied if the Board of Directors and the Chief Executive Officer intends to liquidate the company, to cease operations, or has no real-istic alternative but to do so.
Auditor’s responsibilityOur objectives are to obtain reasonable assurance about whether the annual accounts and consolidated accounts as a whole are free from material misstatement, whether due to fraud or error, and to issue an auditor’s report that includes our opinions. Reasonable assurance is a high level of assurance, but is not a guarantee that an audit con-ducted in accordance with ISAs and generally accepted auditing standards in Sweden will always detect a material misstatement when it exists. Misstatements can arise from fraud or error and are considered material if, individually or in the aggregate, they could reasonably be expected to influence the economic decisions of users taken on the basis of these annual accounts and consolidated accounts.
As part of an audit in accordance with ISAs, we exercise profes-sional judgment and maintain professional scepticism throughout the audit. We also:• Identify and assess the risks of material misstatement of the
annual accounts and consolidated accounts, whether due to fraud or error, design and perform audit procedures responsive to those risks, and obtain audit evidence that is sufficient and appropriate to provide a basis for our opinions. The risk of not detecting a material misstatement resulting from fraud is higher than for one resulting from error, as fraud may involve collusion, forgery, inten-tional omissions, misrepresentations, or the override of internal control.
129ANNUAL REPORT 2019 | VOLVO CAR GROUP
AUDITOR’S REPORT
• Obtain an understanding of the company’s internal control rele-vant to our audit in order to design audit procedures that are appropriate in the circumstances, but not for the purpose of expressing an opinion on the effectiveness of the company’s inter-nal control.
• Evaluate the appropriateness of accounting policies used and the reasonableness of accounting estimates and related disclosures made by the Board of Directors and the Chief Executive Officer.
• Conclude on the appropriateness of the Board of Directors’ and the Chief Executive Officer’s use of the going concern basis of accounting in preparing the annual accounts and consolidated accounts. We also draw a conclusion, based on the audit evidence obtained, as to whether any material uncertainty exists related to events or conditions that may cast significant doubt on the com-pany’s and the group´s ability to continue as a going concern. If we conclude that a material uncertainty exists, we are required to draw attention in our auditor’s report to the related disclosures in the annual accounts and consolidated accounts or, if such disclo-sures are inadequate, to modify our opinion about the annual accounts and consolidated accounts. Our conclusions are based on the audit evidence obtained up to the date of our auditor’s report. However, future events or conditions may cause a com-pany and a group to cease to continue as a going concern.
• Evaluate the overall presentation, structure and content of the annual accounts and consolidated accounts, including the disclo-sures, and whether the annual accounts and consolidated accounts represent the underlying transactions and events in a manner that achieves fair presentation.
• Obtain sufficient and appropriate audit evidence regarding the financial information of the entities or business activities within the group to express an opinion on the consolidated accounts. We are responsible for the direction, supervision and performance of the group audit. We remain solely responsible for our opinions.
We must inform the Board of Directors of, among other matters, the planned scope and timing of the audit. We must also inform of signif-icant audit findings during our audit, including any significant defi-ciencies in internal control that we identified.
Report on other legal and regulatory requirementsOpinionsIn addition to our audit of the annual accounts and consolidated accounts, we have also audited the administration of the Board of Directors and the Chief Executive Officer of Volvo Car AB (publ.) for the financial year 2019-01-01–2019-12-31 and the proposed appro-priations of the company’s profit or loss.
We recommend to the general meeting of shareholders that the profit to be appropriated in accordance with the proposal in the stat-utory administration report and that the members of the Board of Directors and the Chief Executive Officer be discharged from liability for the financial year.
Basis for OpinionsWe conducted the audit in accordance with generally accepted auditing standards in Sweden. Our responsibilities under those standards are further described in the Auditor’s Responsibilities sec-tion. We are independent of the parent company and the group in accordance with professional ethics for accountants in Sweden and have otherwise fulfilled our ethical responsibilities in accordance with these requirements.
We believe that the audit evidence we have obtained is sufficient and appropriate to provide a basis for our opinions.
Responsibilities of the Board of Directors and the Chief Executive OfficerThe Board of Directors is responsible for the proposal for appropria-tions of the company’s profit or loss. At the proposal of a dividend, this includes an assessment of whether the dividend is justifiable consid-ering the requirements which the company’s and the group’s type of operations, size and risks place on the size of the parent company’s and the group’s equity, consolidation requirements, liquidity and posi-tion in general.
The Board of Directors is responsible for the company’s organiza-tion and the administration of the company’s affairs. This includes among other things continuous assessment of the company’s and the group´s financial situation and ensuring that the company's organiza-tion is designed so that the accounting, management of assets and the company’s financial affairs otherwise are controlled in a reassuring manner. The Chief Executive Officer shall manage the ongoing admin-istration according to the Board of Directors’ guidelines and instruc-tions and among other matters take measures that are necessary to fulfill the company’s accounting in accordance with law and handle the management of assets in a reassuring manner.
Auditor’s responsibilityOur objective concerning the audit of the administration, and thereby our opinion about discharge from liability, is to obtain audit evidence to assess with a reasonable degree of assurance whether any member of the Board of Directors or the Chief Executive Officer in any material respect:• has undertaken any action or been guilty of any omission which can
give rise to liability to the company, or• in any other way has acted in contravention of the Companies Act,
the Annual Accounts Act or the Articles of Association.
Our objective concerning the audit of the proposed appropriations of the company’s profit or loss, and thereby our opinion about this, is to assess with reasonable degree of assurance whether the proposal is in accordance with the Companies Act.
Reasonable assurance is a high level of assurance, but is not a guar-antee that an audit conducted in accordance with generally accepted auditing standards in Sweden will always detect actions or omissions that can give rise to liability to the company, or that the proposed appropriations of the company’s profit or loss are not in accordance with the Companies Act.
As part of an audit in accordance with generally accepted auditing standards in Sweden, we exercise professional judgment and maintain professional scepticism throughout the audit. The examination of the administration and the proposed appropriations of the company’s profit or loss is based primarily on the audit of the accounts. Additional audit procedures performed are based on our professional judgment with starting point in risk and materiality. This means that we focus the examination on such actions, areas and relationships that are material for the operations and where deviations and violations would have par-ticular importance for the company’s situation. We examine and test decisions undertaken, support for decisions, actions taken and other circumstances that are relevant to our opinion concerning discharge from liability. As a basis for our opinion on the Board of Directors’ pro-posed appropriations of the company’s profit or loss we examined the Board of Directors’ reasoned statement and a selection of supporting evidence in order to be able to assess whether the proposal is in accordance with the Companies Act.
Gothenburg 26th of March 2020Deloitte AB
Signature on Swedish original
Jan NilssonAuthorized public accountant
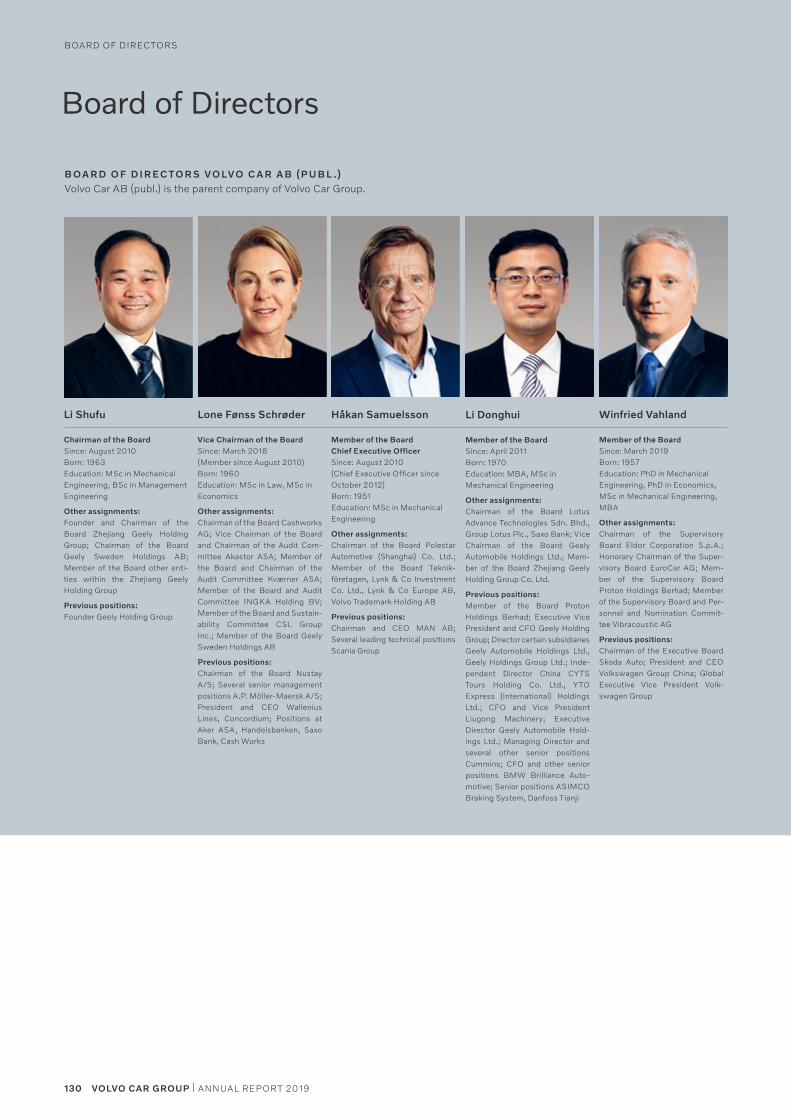
130 VOLVO CAR GROUP | ANNUAL REPORT 2019
Board of Directors
B OA R D O F D I R EC T O R S VO LVO C A R A B (P U B L .)Volvo Car AB (publ.) is the parent company of Volvo Car Group.
Li Donghui
Member of the Board Since: April 2011Born: 1970Education: MBA, MSc in Mechanical Engineering
Other assignments:Chairman of the Board Lotus Advance Technologies Sdn. Bhd., Group Lotus Plc., Saxo Bank; Vice Chairman of the Board Geely Automobile Holdings Ltd.; Mem-ber of the Board Zhejiang Geely Holding Group Co. Ltd.
Previous positions:Member of the Board Proton Holdings Berhad; Executive Vice President and CFO Geely Holding Group; Director certain subsidiaries Geely Automobile Holdings Ltd., Geely Holdings Group Ltd.; Inde-pendent Director China CYTS Tours Holding Co. Ltd., YTO Express (International) Holdings Ltd.; CFO and Vice President Liugong Machinery; Executive Director Geely Automobile Hold-ings Ltd.; Managing Director and several other senior positions Cummins; CFO and other senior positions BMW Brilliance Auto-motive; Senior positions ASIMCO Braking System, Danfoss Tianji
Håkan SamuelssonLone Fønss Schrøder
Member of the Board Since: March 2019 Born: 1957 Education: PhD in Mechanical Engineering, PhD in Economics, MSc in Mechanical Engineering, MBA
Other assignments:Chairman of the Supervisory Board Eldor Corporation S.p.A.; Honorary Chairman of the Super-visory Board EuroCar AG; Mem-ber of the Supervisory Board Proton Holdings Berhad; Member of the Supervisory Board and Per-sonnel and Nomination Commit-tee Vibracoustic AG
Previous positions:Chairman of the Executive Board Skoda Auto; President and CEO Volkswagen Group China; Global Executive Vice President Volk- swagen Group
Winfried VahlandLi Shufu
Member of the Board Chief Executive OfficerSince: August 2010 (Chief Executive Officer since October 2012) Born: 1951 Education: MSc in Mechanical Engineering
Other assignments:Chairman of the Board Polestar Automotive (Shanghai) Co. Ltd.; Member of the Board Teknik-företagen, Lynk & Co Investment Co. Ltd., Lynk & Co Europe AB, Volvo Trademark Holding AB
Previous positions:Chairman and CEO MAN AB; Several leading technical positions Scania Group
Chairman of the Board Since: August 2010Born: 1963Education: MSc in Mechanical Engineering, BSc in Manage ment Engineering
Other assignments: Founder and Chairman of the Board Zhejiang Geely Holding Group; Chairman of the Board Geely Sweden Holdings AB; Member of the Board other enti-ties within the Zhejiang Geely Holding Group
Previous positions: Founder Geely Holding Group
Vice Chairman of the Board Since: March 2018 (Member since August 2010)Born: 1960Education: MSc in Law, MSc in Economics
Other assignments:Chairman of the Board Cashworks AG; Vice Chairman of the Board and Chairman of the Audit Com-mittee Akastor ASA; Member of the Board and Chairman of the Audit Committee Kværner ASA; Member of the Board and Audit Committee INGKA Holding BV; Member of the Board and Sustain-ability Committee CSL Group Inc.; Member of the Board Geely Sweden Holdings AB
Previous positions:Chairman of the Board Nustay A/S; Several senior management positions A.P. Möller-Maersk A/S; President and CEO Wallenius Lines, Concordium; Positions at Aker ASA, Handelsbanken, Saxo Bank, Cash Works
BOARD OF DIRECTORS
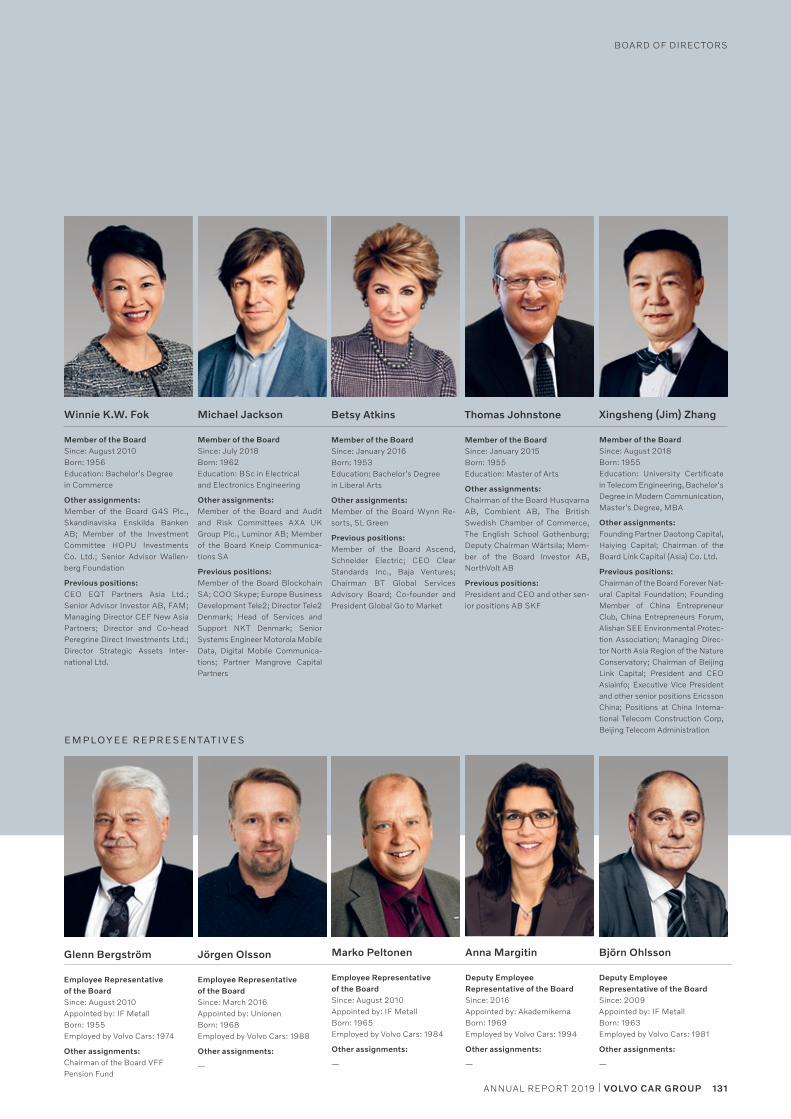
131ANNUAL REPORT 2019 | VOLVO CAR GROUP
BOARD OF DIRECTORS
Member of the Board Since: January 2015Born: 1955Education: Master of Arts
Other assignments:Chairman of the Board Husqvarna AB, Combient AB, The British Swedish Chamber of Commerce, The English School Gothenburg; Deputy Chairman Wärtsila; Mem-ber of the Board Investor AB, NorthVolt AB
Previous positions:President and CEO and other sen-ior positions AB SKF
Thomas Johnstone
Member of the Board Since: January 2016Born: 1953Education: Bachelor's Degree in Liberal Arts
Other assignments: Member of the Board Wynn Re -sorts, SL Green
Previous positions:Member of the Board Ascend, Schneider Electric; CEO Clear Standards Inc., Baja Ventures; Chairman BT Global Services Advisory Board; Co-founder and President Global Go to Market
Betsy Atkins
Employee Representativeof the BoardSince: March 2016Appointed by: UnionenBorn: 1968Employed by Volvo Cars: 1988
Other assignments:
—
Jörgen Olsson
EM P LOY EE R EP R E S EN TAT I V E S
Employee Representativeof the BoardSince: August 2010Appointed by: IF MetallBorn: 1965Employed by Volvo Cars: 1984
Other assignments:
—
Deputy Employee Representative of the BoardSince: 2016Appointed by: AkademikernaBorn: 1969Employed by Volvo Cars: 1994
Other assignments:
—
Deputy Employee Representative of the BoardSince: 2009Appointed by: IF MetallBorn: 1963Employed by Volvo Cars: 1981
Other assignments:
—
Marko Peltonen Anna Margitin Björn Ohlsson
Employee Representativeof the BoardSince: August 2010Appointed by: IF MetallBorn: 1955Employed by Volvo Cars: 1974
Other assignments: Chairman of the Board VFF Pension Fund
Glenn Bergström
Member of the Board Since: August 2018Born: 1955Education: University Certificate in Telecom Engineering, Bachelor's Degree in Modern Communication, Master's Degree, MBA
Other assignments:Founding Partner Daotong Capital, Haiying Capital; Chairman of the Board Link Capital (Asia) Co. Ltd.
Previous positions:Chairman of the Board Forever Nat-ural Capital Foundation; Founding Member of China Entrepreneur Club, China Entrepreneurs Forum, Alishan SEE Environmental Protec-tion Association; Managing Direc-tor North Asia Region of the Nature Conservatory; Chairman of Beijing Link Capital; President and CEO Asiainfo; Executive Vice President and other senior positions Ericsson China; Positions at China Interna-tional Telecom Construction Corp, Beijing Telecom Administration
Xingsheng (Jim) ZhangWinnie K.W. Fok
Member of the Board Since: July 2018Born: 1962Education: BSc in Electrical and Electronics Engineering
Other assignments:Member of the Board and Audit and Risk Committees AXA UK Group Plc., Luminor AB; Member of the Board Kneip Communica-tions SA
Previous positions:Member of the Board Blockchain SA; COO Skype; Europe Business Development Tele2; Director Tele2 Denmark; Head of Services and Support NKT Denmark; Senior Systems Engineer Motorola Mobile Data, Digital Mobile Communica-tions; Partner Mangrove Capital Partners
Michael Jackson
Member of the Board Since: August 2010Born: 1956Education: Bachelor's Degree in Commerce
Other assignments:Member of the Board G4S Plc., Skandinaviska Enskilda Banken AB; Member of the Investment Committee HOPU Investments Co. Ltd.; Senior Advisor Wallen-berg Foundation
Previous positions:CEO EQT Partners Asia Ltd.; Senior Advisor Investor AB, FAM; Managing Director CEF New Asia Partners; Director and Co-head Peregrine Direct Investments Ltd.; Director Strategic Assets In ter-national Ltd.
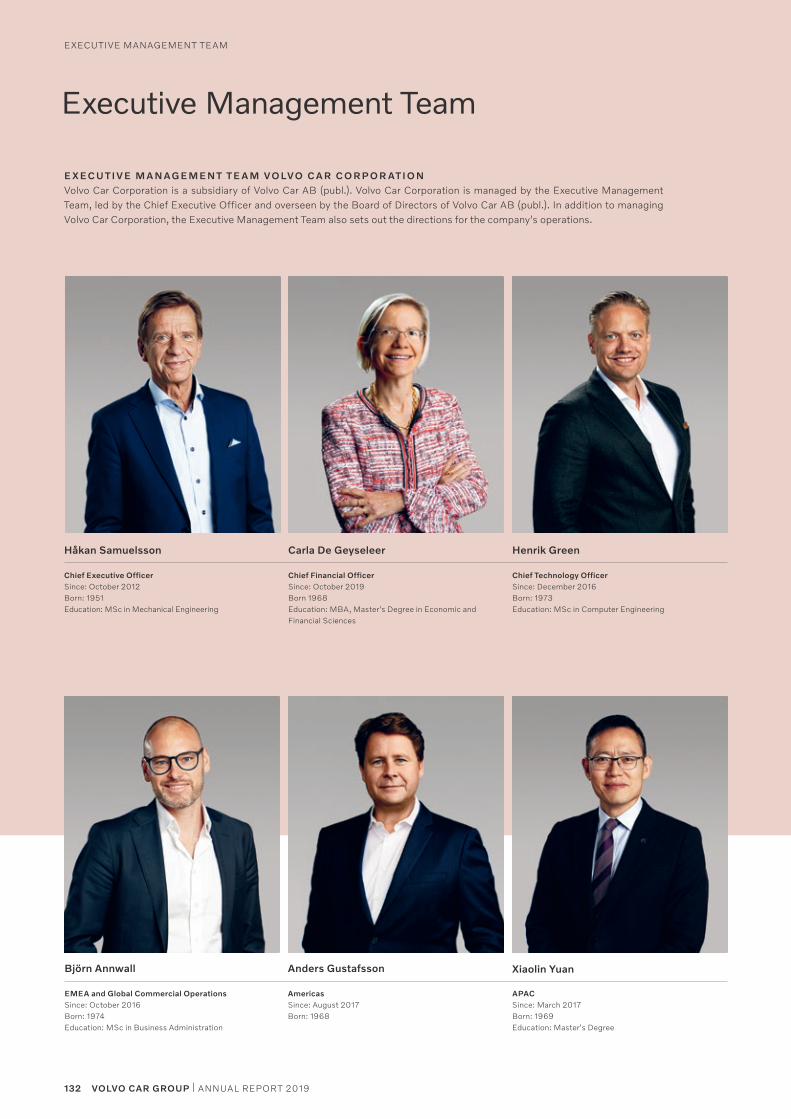
132 VOLVO CAR GROUP | ANNUAL REPORT 2019
Executive Management Team
Chief Executive OfficerSince: October 2012Born: 1951 Education: MSc in Mechanical Engineering
Håkan Samuelsson
Chief Financial OfficerSince: October 2019Born 1968Education: MBA, Master's Degree in Economic and Financial Sciences
Carla De Geyseleer
EMEA and Global Commercial OperationsSince: October 2016 Born: 1974Education: MSc in Business Administration
Björn Annwall
AmericasSince: August 2017 Born: 1968
Anders Gustafsson
Chief Technology OfficerSince: December 2016Born: 1973Education: MSc in Computer Engineering
Henrik Green
APACSince: March 2017Born: 1969 Education: Master's Degree
Xiaolin Yuan
E X EC U T I V E M A N AG E M E N T T E A M VO LVO C A R C O R P O R AT I O NVolvo Car Corporation is a subsidiary of Volvo Car AB (publ.). Volvo Car Corporation is managed by the Executive Management Team, led by the Chief Executive Officer and overseen by the Board of Directors of Volvo Car AB (publ.). In addition to managing Volvo Car Corporation, the Executive Management Team also sets out the directions for the company's operations.
EXECUTIVE MANAGEMENT TEAM
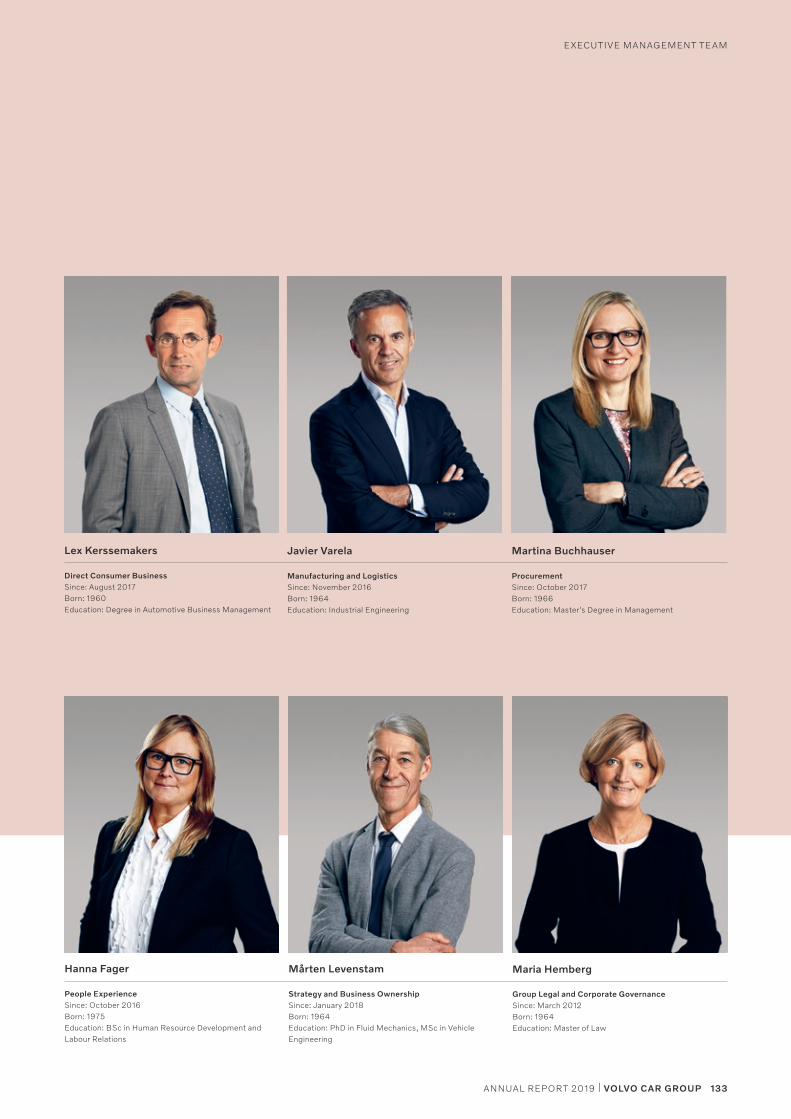
133ANNUAL REPORT 2019 | VOLVO CAR GROUP
EXECUTIVE MANAGEMENT TEAM
Direct Consumer Business Since: August 2017Born: 1960Education: Degree in Automotive Business Management
Lex Kerssemakers
ProcurementSince: October 2017Born: 1966Education: Master's Degree in Management
Martina Buchhauser
People Experience Since: October 2016Born: 1975Education: BSc in Human Resource Development and Labour Relations
Hanna Fager
Strategy and Business OwnershipSince: January 2018 Born: 1964Education: PhD in Fluid Mechanics, MSc in Vehicle Engineering
Mårten Levenstam
Group Legal and Corporate GovernanceSince: March 2012Born: 1964Education: Master of Law
Maria Hemberg
Manufacturing and LogisticsSince: November 2016Born: 1964Education: Industrial Engineering
Javier Varela
EXECUTIVE MANAGEMENT TEAM
134 VOLVO CAR GROUP | ANNUAL REPORT 2019
SuStainabilit y ManageMent and governance
Sustainability Management and Governance
Volvo Cars' approach to sustainability management volvo cars is committed to protecting and improving the envi-ronment and wider society, as well as the lives of our own cus-tomers and employees. volvo cars' sustainability strategy and ambitions guide the strategic and operational decisions. volvo cars has a clear governance structure to ensure that the com-pany is delivering on these ambitions, and takes action in order to improve the performance. volvo cars is always looking to identify new ways to measure sustainability performance and seek out strong external partnerships that will improve the performance. We realise that our existing and potential cus-tomers expect us to deliver on our ambitions. We recognise that a sustainable approach brings environmental and social benefits, as well as enhances the appeal of our products and improves profitability, engages employees and helps attract the best talent.
International commitmentsvolvo cars is proud over the fact that it was a founding mem-ber of the un global compact in 2000. Since then, volvo cars
has endeavoured to observe the ten Principles of the global compact. this includes Principle 7, the adoption of a precau-tionary approach to environmental challenges. Furthermore, volvo cars is committed to supporting the Sustainable devel-opment goals (Sdgs), which guide our sustainability approach. in addition to the un global compact, our own code of con-duct reflects the following international conventions and guidelines:• the eight core conventions of the un agency, the interna-
tional labour organisation (ilo): – child labour (138 and 182) – Forced labour and compulsory labour (29 and 105) – equal remuneration and discrimination (100 and 111) – Freedom of association and collective bargaining
(87 and 98)• the 10 principles of the global compact• the universal declaration of Human rights• un convention on the rights of the child• oecd guidelines for Multinational companies• un guiding Principles on business and Human rights
SUSTAINABILIT Y GOVERNANCEvolvo cars has a clear governance structure to monitor progress against the sustainability ambitions, and to develop the existing programme. Sustainability is centrally governed and coordinated by the global Sustainability office, and includes progress and fol-low-up of the strategic initiatives.
Board of Directors – People and Sustainability Committeethe committee brings a diverse outside-in perspective to sustaina-bility issues for the company. More details are explained on page 69 in this report.
Executive Management Team (EMT)the eMt is updated with information regularly and when relevant. eMt sets the direction for the sustainability strategy, as well as approves and decides on actions to ensure implementation. eMt is the owner of key sustainability KPis and monitors and follows up on the overall progress of the sustainability strategy implementation.
Global Sustainability Committee (GSC)the gSc is chaired by the Head of global Sustainability and consists of members that are authorised line organisation representatives with the mandate to take decisions, provide guidance and support
initiatives. the purpose of the gSc is to improve cross-departmen-tal collaboration, understanding and acts on major sustainability issues and risks. the gSc provides a regular flow of sustainability issues to relevant eMt boards for decision, and takes collective decisions on matters which do not require eMt consideration. it leads the focus on sustainability as a profitability driver, including identifying opportunities. also, the progress of the implementation of the overall strategy, including each strategic initiative, is moni-tored and followed up on by the gSc.
Functional Management TeamsFunctional Management teams are responsible for ensuring that sus-tainability becomes an integrated part of everyone’s daily work. they are sounding boards for the gSc members and can be requested to secure resources and funding for sustainability initiatives.
Global Sustainability Officethe global Sustainability office is centrally responsible for the gov-ernance and coordination of sustainability. it develops the sustaina-bility strategy, leads and supports the strategic initiatives, monitors and controls KPis and is responsible for gathering business intelli-gence on sustainability matters.
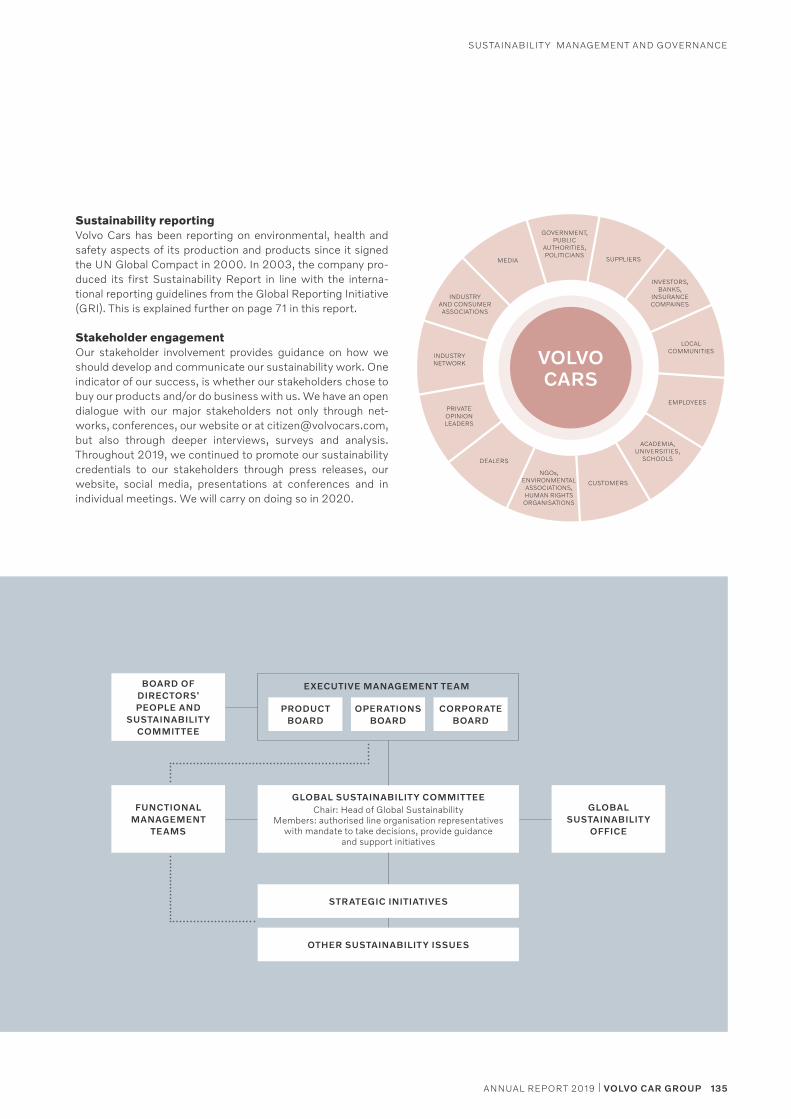
135ANNUAL REPORT 2019 | VOLVO CAR GROUP
SuStainabilit y ManageMent and governance
VOLVO CARS
GOVERNMENT, PUBLIC
AUTHORITIES, POLITICIANS
SUPPLIERSMEDIA
INVESTORS, BANKS,
INSURANCE COMPAINES
INDUSTRY AND CONSUMERASSOCIATIONS
LOCALCOMMUNITIES
INDUSTRYNETWORK
ACADEMIA,UNIVERSITIES,
SCHOOLS
EMPLOYEESPRIVATE OPINIONLEADERS
CUSTOMERS
DEALERS
NGOs,ENVIRONMENTAL
ASSOCIATIONS,HUMAN RIGHTSORGANISATIONS
Sustainability reportingvolvo cars has been reporting on environmental, health and safety aspects of its production and products since it signed the un global compact in 2000. in 2003, the company pro-duced its first Sustainability report in line with the interna-tional reporting guidelines from the global reporting initiative (gri). this is explained further on page 71 in this report.
Stakeholder engagementour stakeholder involvement provides guidance on how we should develop and communicate our sustainability work. one indicator of our success, is whether our stakeholders chose to buy our products and/or do business with us. We have an open dialogue with our major stakeholders not only through net-works, conferences, our website or at [email protected], but also through deeper interviews, surveys and analysis. throughout 2019, we continued to promote our sustainability credentials to our stakeholders through press releases, our website, social media, presentations at conferences and in individual meetings. We will carry on doing so in 2020.
GLOBAL SUSTAINABILITY COMMITTEEchair: Head of global Sustainability
Members: authorised line organisation representatives with mandate to take decisions, provide guidance
and support initiatives
GLOBAL SUSTAINABILITY
OFFICE
BOARD OFDIRECTORS'PEOPLE AND
SUSTAINABILITY COMMITTEE
PRODUCTBOARD
OPERATIONSBOARD
EXECUTIVE MANAGEMENT TEAM
CORPORATEBOARD
STRATEGIC INITIATIVES
OTHER SUSTAINABILITY ISSUES
FUNCTIONALMANAGEMENT
TEAMS
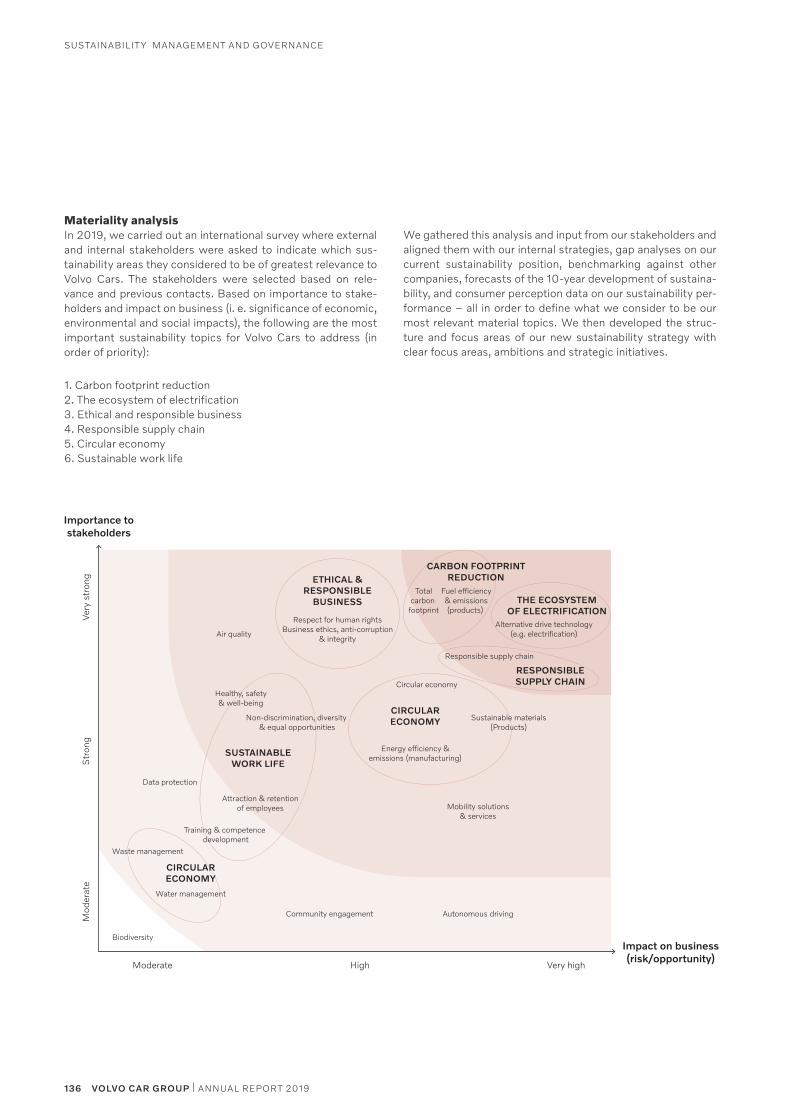
136 VOLVO CAR GROUP | ANNUAL REPORT 2019
SuStainabilit y ManageMent and governance
Moderate High Very high
CIRCULARECONOMY
SUSTAINABLEWORK LIFE
CIRCULARECONOMY
RESPONSIBLESUPPLY CHAIN
THE ECOSYSTEMOF ELECTRIFICATION
CARBON FOOTPRINTREDUCTIONETHICAL &
RESPONSIBLEBUSINESS
Water management
Community engagement Autonomous driving
Waste management
Data protection
Training & competence development
Attraction & retentionof employees
Healthy, safety& well-being
Air quality
Respect for human rightsBusiness ethics, anti-corruption
& integrity
Totalcarbon
footprint
Fuel efficiency& emissions(products)
Non-discrimination, diversity & equal opportunities
Circular economy
Responsible supply chain
Alternative drive technology(e.g. electrification)
Energy efficiency &emissions (manufacturing)
Mobility solutions& services
Sustainable materials(Products)
Biodiversity
Importance tostakeholders
Very
str
ong
Str
ong
Mod
erat
e
Impact on business(risk/opportunity)
Materiality analysisin 2019, we carried out an international survey where external and internal stakeholders were asked to indicate which sus-tainability areas they considered to be of greatest relevance to volvo cars. the stakeholders were selected based on rele-vance and previous contacts. based on importance to stake-holders and impact on business (i. e. significance of economic, environmental and social impacts), the following are the most important sustainability topics for volvo cars to address (in order of priority):
1. carbon footprint reduction2. the ecosystem of electrification3. ethical and responsible business4. responsible supply chain5. circular economy6. Sustainable work life
We gathered this analysis and input from our stakeholders and aligned them with our internal strategies, gap analyses on our current sustainability position, benchmarking against other companies, forecasts of the 10-year development of sustaina-bility, and consumer perception data on our sustainability per-formance – all in order to define what we consider to be our most relevant material topics. We then developed the struc-ture and focus areas of our new sustainability strategy with clear focus areas, ambitions and strategic initiatives.
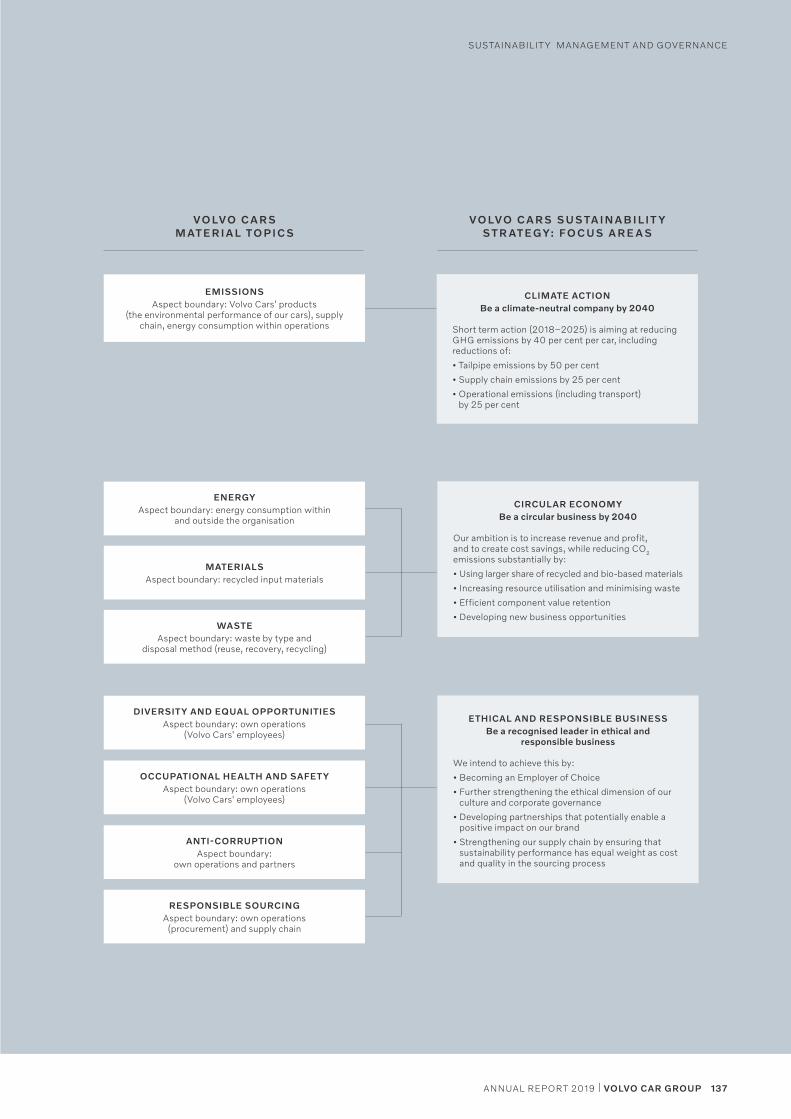
137ANNUAL REPORT 2019 | VOLVO CAR GROUP
ENERGYaspect boundary: energy consumption within
and outside the organisation
MATERIALSaspect boundary: recycled input materials
WASTEaspect boundary: waste by type and
disposal method (reuse, recovery, recycling)
ANTI-CORRUPTIONaspect boundary:
own operations and partners
RESPONSIBLE SOURCINGaspect boundary: own operations (procurement) and supply chain
EMISSIONSaspect boundary: volvo cars' products
(the environmental performance of our cars), supply chain, energy consumption within operations
CLIMATE ACTIONBe a climate-neutral company by 2040
Short term action (2018–2025) is aiming at reducing gHg emissions by 40 per cent per car, including reductions of:
• tailpipe emissions by 50 per cent
• Supply chain emissions by 25 per cent
• operational emissions (including transport) by 25 per cent
CIRCULAR ECONOMYBe a circular business by 2040
our ambition is to increase revenue and profit, and to create cost savings, while reducing co2 emissions substantially by:
• using larger share of recycled and bio-based materials
• increasing resource utilisation and minimising waste
• efficient component value retention
• developing new business opportunities
ETHICAL AND RESPONSIBLE BUSINESSBe a recognised leader in ethical and
responsible business
We intend to achieve this by:
• becoming an employer of choice
• Further strengthening the ethical dimension of our culture and corporate governance
• developing partnerships that potentially enable a positive impact on our brand
• Strengthening our supply chain by ensuring that sustainability performance has equal weight as cost and quality in the sourcing process
OCCUPATIONAL HEALTH AND SAFETYaspect boundary: own operations
(volvo cars' employees)
DIVERSITY AND EQUAL OPPORTUNITIESaspect boundary: own operations
(volvo cars' employees)
VO LVO C A R S M AT E R I A L T O P I C S
VO LVO C A R S SU S TA I N A B I L I T YS T R AT EGY: FO C U S A R E A S
SuStainabilit y ManageMent and governance
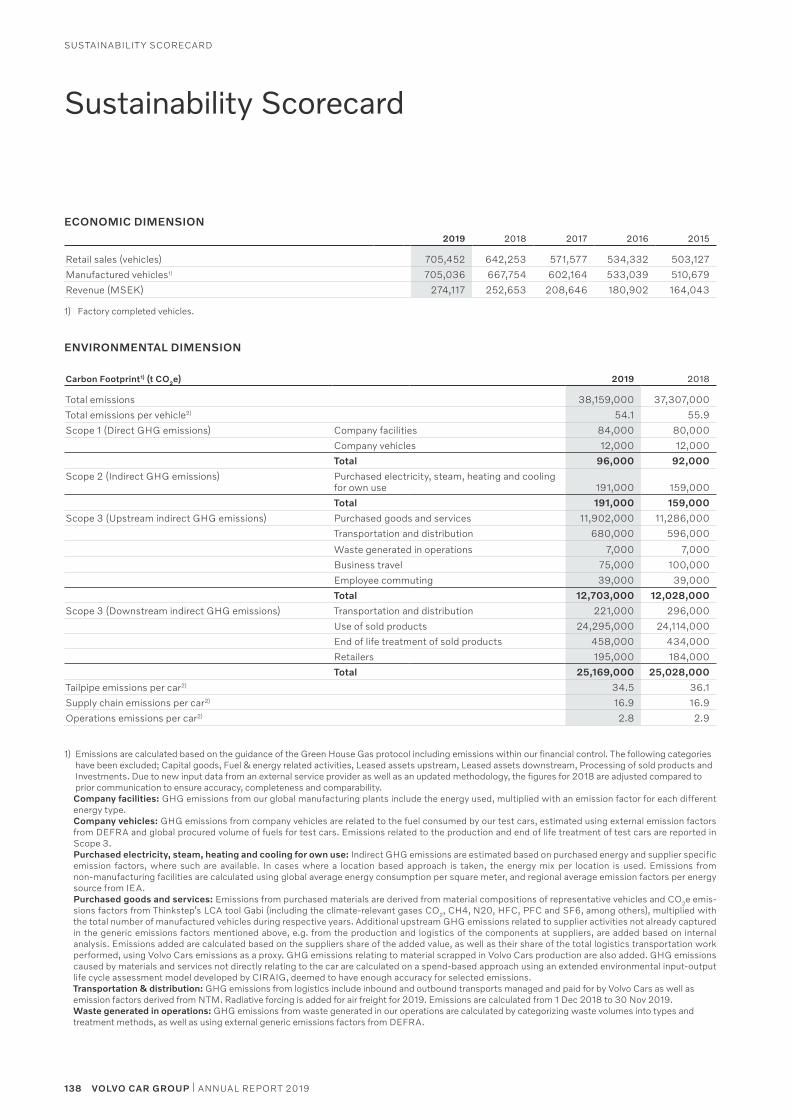
138 VOLVO CAR GROUP | ANNUAL REPORT 2019
SuStainabilit y Scorecard
Sustainability Scorecard
ECONOMIC DIMENSION2019 2018 2017 2016 2015
retail sales (vehicles) 705,452 642,253 571,577 534,332 503,127
Manufactured vehicles1) 705,036 667,754 602,164 533,039 510,679
revenue (MSeK) 274,117 252,653 208,646 180,902 164,043
1) Factory completed vehicles.
ENVIRONMENTAL DIMENSION
Carbon Footprint1) (t CO2e) 2019 2018
total emissions 38,159,000 37,307,000
total emissions per vehicle2) 54.1 55.9
Scope 1 (direct gHg emissions) company facilities 84,000 80,000
company vehicles 12,000 12,000
Total 96,000 92,000
Scope 2 (indirect gHg emissions) Purchased electricity, steam, heating and cooling for own use 191,000 159,000
Total 191,000 159,000
Scope 3 (upstream indirect gHg emissions) Purchased goods and services 11,902,000 11,286,000
transportation and distribution 680,000 596,000
Waste generated in operations 7,000 7,000
business travel 75,000 100,000
employee commuting 39,000 39,000
Total 12,703,000 12,028,000
Scope 3 (downstream indirect gHg emissions) transportation and distribution 221,000 296,000
use of sold products 24,295,000 24,114,000
end of life treatment of sold products 458,000 434,000
retailers 195,000 184,000
Total 25,169,000 25,028,000
tailpipe emissions per car2) 34.5 36.1
Supply chain emissions per car2) 16.9 16.9
operations emissions per car2) 2.8 2.9
1) emissions are calculated based on the guidance of the green House gas protocol including emissions within our financial control. the following categories have been excluded; capital goods, Fuel & energy related activities, leased assets upstream, leased assets downstream, Processing of sold products and investments. due to new input data from an external service provider as well as an updated methodology, the figures for 2018 are adjusted compared to prior communication to ensure accuracy, completeness and comparability.
Company facilities: gHg emissions from our global manufacturing plants include the energy used, multiplied with an emission factor for each different energy type.
Company vehicles: gHg emissions from company vehicles are related to the fuel consumed by our test cars, estimated using external emission factors from deFra and global procured volume of fuels for test cars. emissions related to the production and end of life treatment of test cars are reported in Scope 3.
Purchased electricity, steam, heating and cooling for own use: indirect gHg emissions are estimated based on purchased energy and supplier specific emission factors, where such are available. in cases where a location based approach is taken, the energy mix per location is used. emissions from non-manufacturing facilities are calculated using global average energy consumption per square meter, and regional average emission factors per energy source from iea.
Purchased goods and services: emissions from purchased materials are derived from material compositions of representative vehicles and co2e emis-sions factors from thinkstep’s lca tool gabi (including the climate-relevant gases co2, cH4, n20, HFc, PFc and SF6, among others), multiplied with the total number of manufactured vehicles during respective years. additional upstream gHg emissions related to supplier activities not already captured in the generic emissions factors mentioned above, e.g. from the production and logistics of the components at suppliers, are added based on internal analysis. emissions added are calculated based on the suppliers share of the added value, as well as their share of the total logistics transportation work performed, using volvo cars emissions as a proxy. gHg emissions relating to material scrapped in volvo cars production are also added. gHg emissions caused by materials and services not directly relating to the car are calculated on a spend-based approach using an extended environmental input-output life cycle assessment model developed by ciraig, deemed to have enough accuracy for selected emissions.
Transportation & distribution: gHg emissions from logistics include inbound and outbound transports managed and paid for by volvo cars as well as emission factors derived from ntM. radiative forcing is added for air freight for 2019. emissions are calculated from 1 dec 2018 to 30 nov 2019.
Waste generated in operations: gHg emissions from waste generated in our operations are calculated by categorizing waste volumes into types and treatment methods, as well as using external generic emissions factors from deFra.
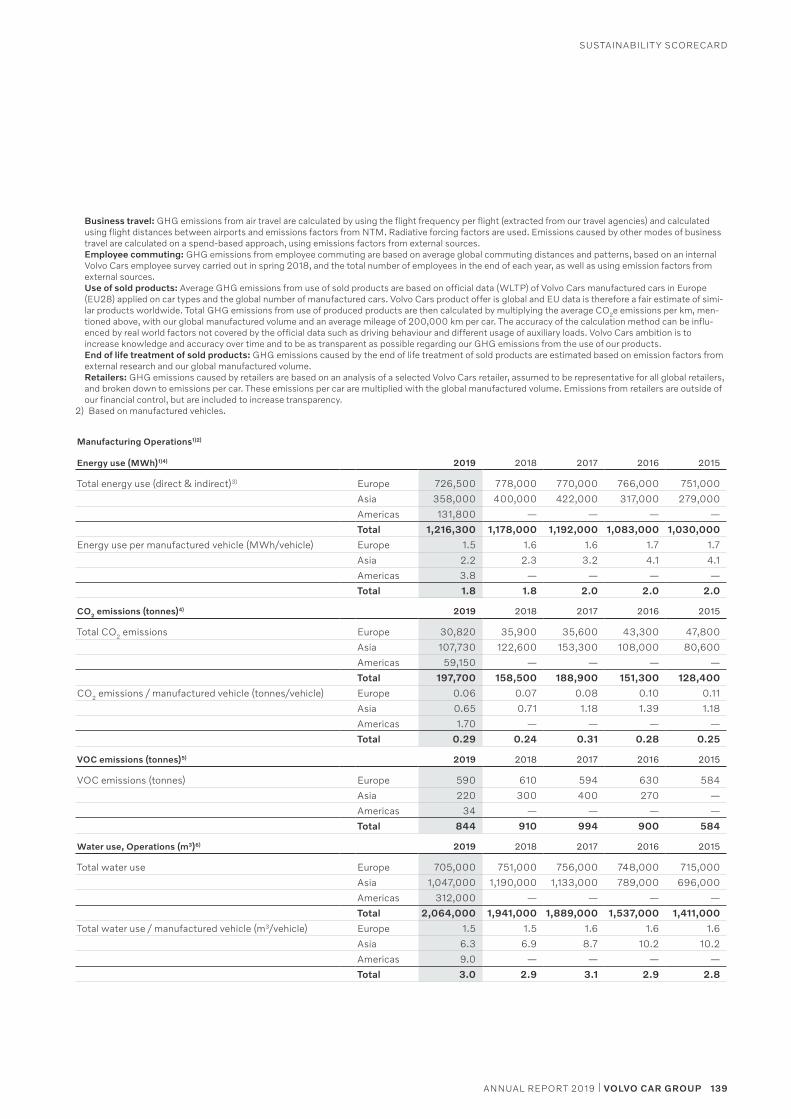
139ANNUAL REPORT 2019 | VOLVO CAR GROUP
SuStainabilit y Scorecard
Business travel: gHg emissions from air travel are calculated by using the flight frequency per flight (extracted from our travel agencies) and calculated using flight distances between airports and emissions factors from ntM. radiative forcing factors are used. emissions caused by other modes of business travel are calculated on a spend-based approach, using emissions factors from external sources.
Employee commuting: gHg emissions from employee commuting are based on average global commuting distances and patterns, based on an internal volvo cars employee survey carried out in spring 2018, and the total number of employees in the end of each year, as well as using emission factors from external sources.
Use of sold products: average gHg emissions from use of sold products are based on official data (WltP) of volvo cars manufactured cars in europe (eu28) applied on car types and the global number of manufactured cars. volvo cars product offer is global and eu data is therefore a fair estimate of simi-lar products worldwide. total gHg emissions from use of produced products are then calculated by multiplying the average co2e emissions per km, men-tioned above, with our global manufactured volume and an average mileage of 200,000 km per car. the accuracy of the calculation method can be influ-enced by real world factors not covered by the official data such as driving behaviour and different usage of auxiliary loads. volvo cars ambition is to increase knowledge and accuracy over time and to be as transparent as possible regarding our gHg emissions from the use of our products.
End of life treatment of sold products: gHg emissions caused by the end of life treatment of sold products are estimated based on emission factors from external research and our global manufactured volume.
Retailers: gHg emissions caused by retailers are based on an analysis of a selected volvo cars retailer, assumed to be representative for all global retailers, and broken down to emissions per car. these emissions per car are multiplied with the global manufactured volume. emissions from retailers are outside of our financial control, but are included to increase transparency.
2) based on manufactured vehicles.
Manufacturing Operations1)2)
Energy use (MWh)1)4) 2019 2018 2017 2016 2015
total energy use (direct & indirect)3) europe 726,500 778,000 770,000 766,000 751,000
asia 358,000 400,000 422,000 317,000 279,000
americas 131,800 — — — —
Total 1,216,300 1,178,000 1,192,000 1,083,000 1,030,000
energy use per manufactured vehicle (MWh/vehicle) europe 1.5 1.6 1.6 1.7 1.7
asia 2.2 2.3 3.2 4.1 4.1
americas 3.8 — — — —
Total 1.8 1.8 2.0 2.0 2.0
CO2 emissions (tonnes)4) 2019 2018 2017 2016 2015
total co2 emissions europe 30,820 35,900 35,600 43,300 47,800
asia 107,730 122,600 153,300 108,000 80,600
americas 59,150 — — — —
Total 197,700 158,500 188,900 151,300 128,400
co2 emissions / manufactured vehicle (tonnes/vehicle) europe 0.06 0.07 0.08 0.10 0.11
asia 0.65 0.71 1.18 1.39 1.18
americas 1.70 — — — —
Total 0.29 0.24 0.31 0.28 0.25
VOC emissions (tonnes)5) 2019 2018 2017 2016 2015
voc emissions (tonnes) europe 590 610 594 630 584
asia 220 300 400 270 —
americas 34 — — — —
Total 844 910 994 900 584
Water use, Operations (m3)6) 2019 2018 2017 2016 2015
total water use europe 705,000 751,000 756,000 748,000 715,000
asia 1,047,000 1,190,000 1,133,000 789,000 696,000
americas 312,000 — — — —
Total 2,064,000 1,941,000 1,889,000 1,537,000 1,411,000
total water use / manufactured vehicle (m3/vehicle) europe 1.5 1.5 1.6 1.6 1.6
asia 6.3 6.9 8.7 10.2 10.2
americas 9.0 — — — —
Total 3.0 2.9 3.1 2.9 2.8
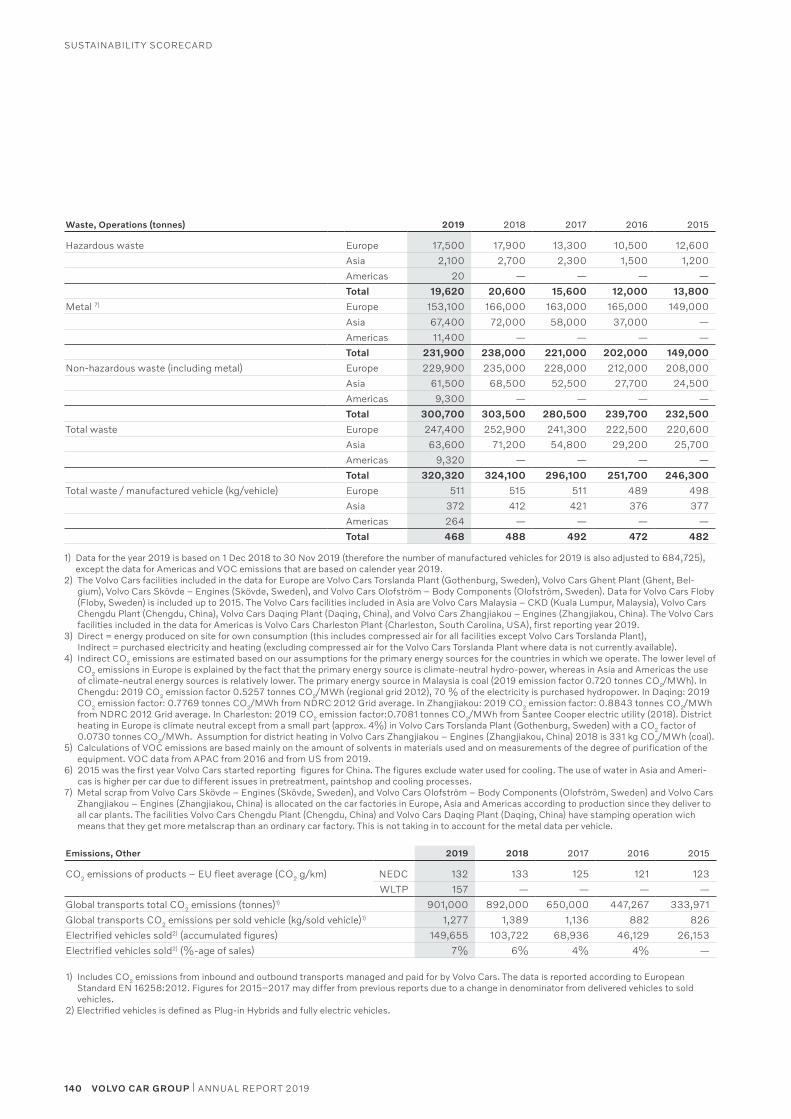
140 VOLVO CAR GROUP | ANNUAL REPORT 2019
SuStainabilit y Scorecard
Waste, Operations (tonnes) 2019 2018 2017 2016 2015
Hazardous waste europe 17,500 17,900 13,300 10,500 12,600
asia 2,100 2,700 2,300 1,500 1,200
americas 20 — — — —
Total 19,620 20,600 15,600 12,000 13,800
Metal 7) europe 153,100 166,000 163,000 165,000 149,000
asia 67,400 72,000 58,000 37,000 —
americas 11,400 — — — —
Total 231,900 238,000 221,000 202,000 149,000
non-hazardous waste (including metal) europe 229,900 235,000 228,000 212,000 208,000
asia 61,500 68,500 52,500 27,700 24,500
americas 9,300 — — — —
Total 300,700 303,500 280,500 239,700 232,500
total waste europe 247,400 252,900 241,300 222,500 220,600
asia 63,600 71,200 54,800 29,200 25,700
americas 9,320 — — — —
Total 320,320 324,100 296,100 251,700 246,300
total waste / manufactured vehicle (kg/vehicle) europe 511 515 511 489 498
asia 372 412 421 376 377
americas 264 — — — —
Total 468 488 492 472 482
1) data for the year 2019 is based on 1 dec 2018 to 30 nov 2019 (therefore the number of manufactured vehicles for 2019 is also adjusted to 684,725), except the data for americas and voc emissions that are based on calender year 2019.
2) the volvo cars facilities included in the data for europe are volvo cars torslanda Plant (gothenburg, Sweden), volvo cars ghent Plant (ghent, bel-gium), volvo cars Skövde – engines (Skövde, Sweden), and volvo cars olofström – body components (olofström, Sweden). data for volvo cars Floby (Floby, Sweden) is included up to 2015. the volvo cars facilities included in asia are volvo cars Malaysia – cKd (Kuala lumpur, Malaysia), volvo cars chengdu Plant (chengdu, china), volvo cars daqing Plant (daqing, china), and volvo cars Zhangjiakou – engines (Zhangjiakou, china). the volvo cars facilities included in the data for americas is volvo cars charleston Plant (charleston, South carolina, uSa), first reporting year 2019.
3) direct = energy produced on site for own consumption (this includes compressed air for all facilities except volvo cars torslanda Plant), indirect = purchased electricity and heating (excluding compressed air for the volvo cars torslanda Plant where data is not currently available).
4) indirect co2 emissions are estimated based on our assumptions for the primary energy sources for the countries in which we operate. the lower level of co2 emissions in europe is explained by the fact that the primary energy source is climate-neutral hydro-power, whereas in asia and americas the use of climate-neutral energy sources is relatively lower. the primary energy source in Malaysia is coal (2019 emission factor 0.720 tonnes co2/MWh). in chengdu: 2019 co2 emission factor 0.5257 tonnes co2/MWh (regional grid 2012), 70 % of the electricity is purchased hydropower. in daqing: 2019 co2 emission factor: 0.7769 tonnes co2/MWh from ndrc 2012 grid average. in Zhangjiakou: 2019 co2 emission factor: 0.8843 tonnes co2/MWh from ndrc 2012 grid average. in charleston: 2019 co2 emission factor:0.7081 tonnes co2/MWh from Santee cooper electric utility (2018). district heating in europe is climate neutral except from a small part (approx. 4%) in volvo cars torslanda Plant (gothenburg, Sweden) with a co2 factor of 0.0730 tonnes co2/MWh. assumption for district heating in volvo cars Zhangjiakou – engines (Zhangjiakou, china) 2018 is 331 kg co2/MWh (coal).
5) calculations of voc emissions are based mainly on the amount of solvents in materials used and on measurements of the degree of purification of the equipment. voc data from aPac from 2016 and from uS from 2019.
6) 2015 was the first year volvo cars started reporting figures for china. the figures exclude water used for cooling. the use of water in asia and ameri-cas is higher per car due to different issues in pretreatment, paintshop and cooling processes.
7) Metal scrap from volvo cars Skövde – engines (Skövde, Sweden), and volvo cars olofström – body components (olofström, Sweden) and volvo cars Zhangjiakou – engines (Zhangjiakou, china) is allocated on the car factories in europe, asia and americas according to production since they deliver to all car plants. the facilities volvo cars chengdu Plant (chengdu, china) and volvo cars daqing Plant (daqing, china) have stamping operation wich means that they get more metalscrap than an ordinary car factory. this is not taking in to account for the metal data per vehicle.
Emissions, Other 2019 2018 2017 2016 2015
co2 emissions of products – eu fleet average (co2 g/km) nedc 132 133 125 121 123
WltP 157 — — — —
global transports total co2 emissions (tonnes)1) 901,000 892,000 650,000 447,267 333,971
global transports co2 emissions per sold vehicle (kg/sold vehicle)1) 1,277 1,389 1,136 882 826
electrified vehicles sold2) (accumulated figures) 149,655 103,722 68,936 46,129 26,153
electrified vehicles sold2) (%-age of sales) 7% 6% 4% 4% —
1) includes co2 emissions from inbound and outbound transports managed and paid for by volvo cars. the data is reported according to european Standard en 16258:2012. Figures for 2015–2017 may differ from previous reports due to a change in denominator from delivered vehicles to sold vehicles.
2) electrified vehicles is defined as Plug-in Hybrids and fully electric vehicles.
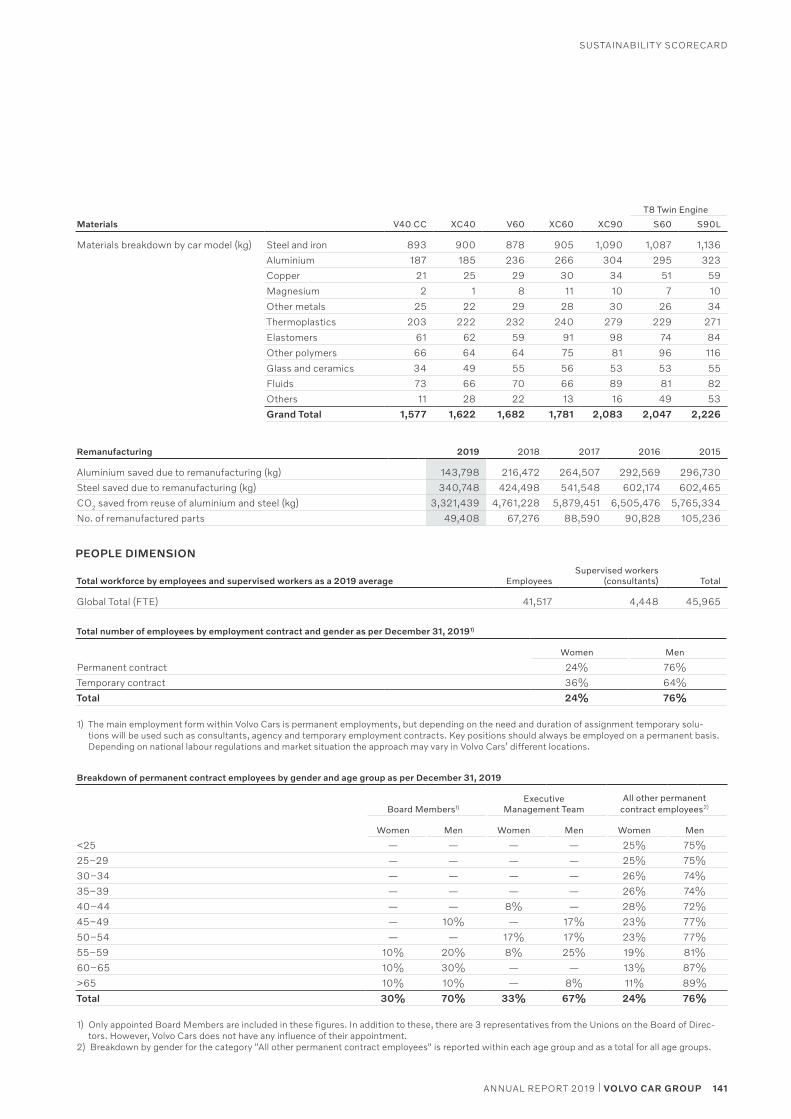
141ANNUAL REPORT 2019 | VOLVO CAR GROUP
SuStainabilit y Scorecard
T8 Twin Engine
Materials V40 CC XC40 V60 XC60 XC90 S60 S90L
Materials breakdown by car model (kg) Steel and iron 893 900 878 905 1,090 1,087 1,136
aluminium 187 185 236 266 304 295 323
copper 21 25 29 30 34 51 59
Magnesium 2 1 8 11 10 7 10
other metals 25 22 29 28 30 26 34
thermoplastics 203 222 232 240 279 229 271
elastomers 61 62 59 91 98 74 84
other polymers 66 64 64 75 81 96 116
glass and ceramics 34 49 55 56 53 53 55
Fluids 73 66 70 66 89 81 82
others 11 28 22 13 16 49 53
Grand Total 1,577 1,622 1,682 1,781 2,083 2,047 2,226
Remanufacturing 2019 2018 2017 2016 2015
aluminium saved due to remanufacturing (kg) 143,798 216,472 264,507 292,569 296,730
Steel saved due to remanufacturing (kg) 340,748 424,498 541,548 602,174 602,465
co2 saved from reuse of aluminium and steel (kg) 3,321,439 4,761,228 5,879,451 6,505,476 5,765,334
no. of remanufactured parts 49,408 67,276 88,590 90,828 105,236
PEOPLE DIMENSION
Total workforce by employees and supervised workers as a 2019 average EmployeesSupervised workers
(consultants) Total
global total (Fte) 41,517 4,448 45,965
Total number of employees by employment contract and gender as per December 31, 20191)
Women Men
Permanent contract 24% 76%
temporary contract 36% 64%
Total 24% 76%
1) the main employment form within volvo cars is permanent employments, but depending on the need and duration of assignment temporary solu-tions will be used such as consultants, agency and temporary employment contracts. Key positions should always be employed on a permanent basis. depending on national labour regulations and market situation the approach may vary in volvo cars’ different locations.
Breakdown of permanent contract employees by gender and age group as per December 31, 2019
Board Members1)Executive
Management TeamAll other permanent
contract employees2)
Women Men Women Men Women Men
<25 — — — — 25% 75%
25–29 — — — — 25% 75%
30–34 — — — — 26% 74%
35–39 — — — — 26% 74%
40–44 — — 8% — 28% 72%
45–49 — 10% — 17% 23% 77%
50–54 — — 17% 17% 23% 77%
55–59 10% 20% 8% 25% 19% 81%
60–65 10% 30% — — 13% 87%
>65 10% 10% — 8% 11% 89%
Total 30% 70% 33% 67% 24% 76%
1) only appointed board Members are included in these figures. in addition to these, there are 3 representatives from the unions on the board of direc-tors. However, volvo cars does not have any influence of their appointment.
2) breakdown by gender for the category "all other permanent contract employees" is reported within each age group and as a total for all age groups.
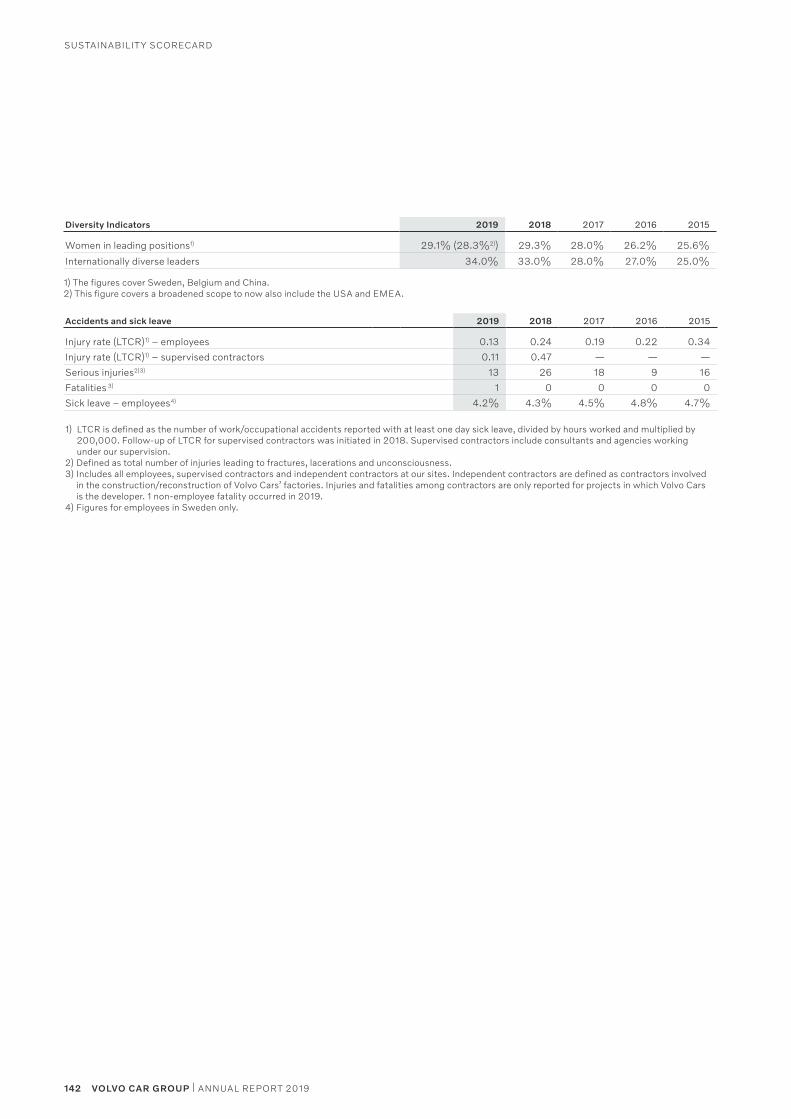
142 VOLVO CAR GROUP | ANNUAL REPORT 2019
SuStainabilit y Scorecard
Diversity Indicators 2019 2018 2017 2016 2015
Women in leading positions1) 29.1% (28.3%2)) 29.3% 28.0% 26.2% 25.6%
internationally diverse leaders 34.0% 33.0% 28.0% 27.0% 25.0%
1) the figures cover Sweden, belgium and china.2) this figure covers a broadened scope to now also include the uSa and eMea.
Accidents and sick leave 2019 2018 2017 2016 2015
injury rate (ltcr)1) – employees 0.13 0.24 0.19 0.22 0.34
injury rate (ltcr)1) – supervised contractors 0.11 0.47 — — —
Serious injuries2)3) 13 26 18 9 16
Fatalities 3) 1 0 0 0 0
Sick leave – employees4) 4.2% 4.3% 4.5% 4.8% 4.7%
1) ltcr is defined as the number of work/occupational accidents reported with at least one day sick leave, divided by hours worked and multiplied by 200,000. Follow-up of ltcr for supervised contractors was initiated in 2018. Supervised contractors include consultants and agencies working under our supervision.
2) defined as total number of injuries leading to fractures, lacerations and unconsciousness.3) includes all employees, supervised contractors and independent contractors at our sites. independent contractors are defined as contractors involved
in the construction/reconstruction of volvo cars’ factories. injuries and fatalities among contractors are only reported for projects in which volvo cars is the developer. 1 non-employee fatality occurred in 2019.
4) Figures for employees in Sweden only.
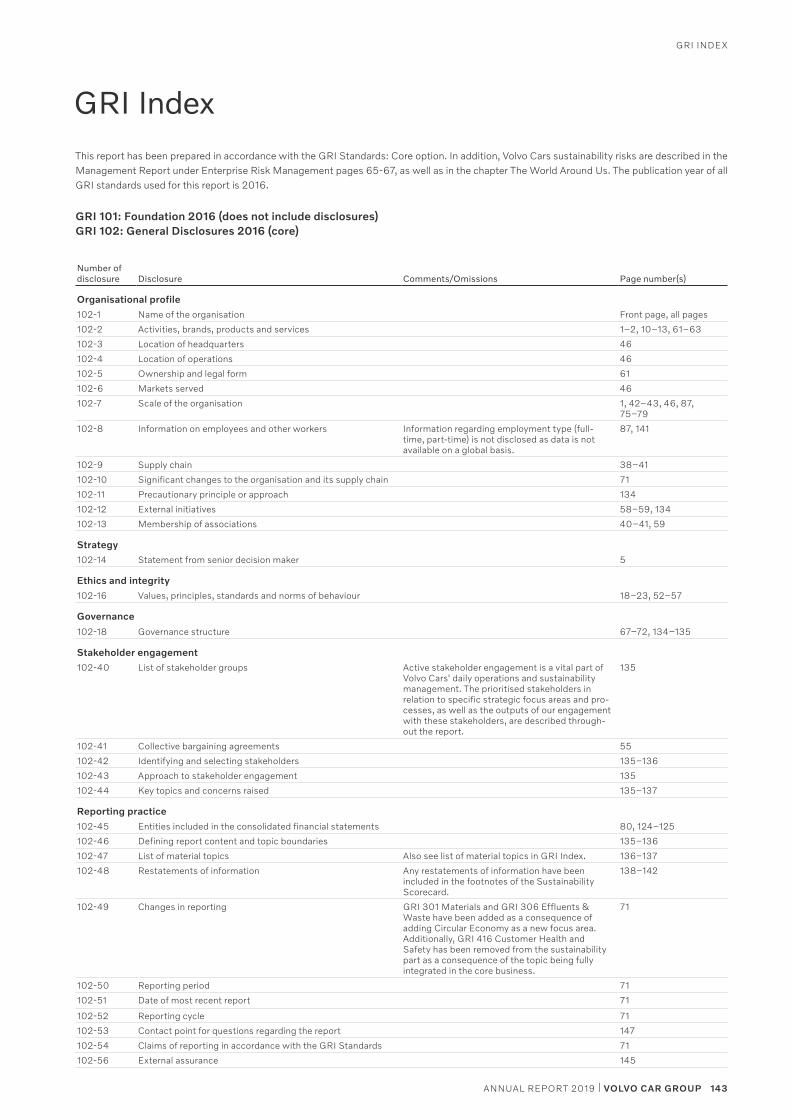
143ANNUAL REPORT 2019 | VOLVO CAR GROUP
gri index
GRI Index
GRI 101: Foundation 2016 (does not include disclosures) GRI 102: General Disclosures 2016 (core)
Number of disclosure Disclosure Comments/Omissions Page number(s)
Organisational profile
102-1 name of the organisation Front page, all pages
102-2 activities, brands, products and services 1–2, 10–13, 61–63
102-3 location of headquarters 46
102-4 location of operations 46
102-5 ownership and legal form 61
102-6 Markets served 46
102-7 Scale of the organisation 1, 42–43, 46, 87, 75–79
102-8 information on employees and other workers information regarding employment type (full- time, part-time) is not disclosed as data is not available on a global basis.
87, 141
102-9 Supply chain 38–41
102-10 Significant changes to the organisation and its supply chain 71
102-11 Precautionary principle or approach 134
102-12 external initiatives 58–59, 134
102-13 Membership of associations 40–41, 59
Strategy
102-14 Statement from senior decision maker 5
Ethics and integrity
102-16 values, principles, standards and norms of behaviour 18–23, 52–57
Governance
102-18 governance structure 67–72, 134–135
Stakeholder engagement
102-40 list of stakeholder groups active stakeholder engagement is a vital part of volvo cars' daily operations and sustainability management. the prioritised stakeholders in relation to specific strategic focus areas and pro-cesses, as well as the outputs of our engagement with these stakeholders, are described through-out the report.
135
102-41 collective bargaining agreements 55
102-42 identifying and selecting stakeholders 135–136
102-43 approach to stakeholder engagement 135
102-44 Key topics and concerns raised 135–137
Reporting practice
102-45 entities included in the consolidated financial statements 80, 124–125
102-46 defining report content and topic boundaries 135–136
102-47 list of material topics also see list of material topics in gri index. 136–137
102-48 restatements of information any restatements of information have been included in the footnotes of the Sustainability Scorecard.
138–142
102-49 changes in reporting gri 301 Materials and gri 306 effluents & Waste have been added as a consequence of adding circular economy as a new focus area. additionally, gri 416 customer Health and Safety has been removed from the sustainability part as a consequence of the topic being fully integrated in the core business.
71
102-50 reporting period 71
102-51 date of most recent report 71
102-52 reporting cycle 71
102-53 contact point for questions regarding the report 147
102-54 claims of reporting in accordance with the gri Standards 71
102-56 external assurance 145
this report has been prepared in accordance with the gri Standards: core option. in addition, volvo cars sustainability risks are described in the Management report under enterprise risk Management pages 65-67, as well as in the chapter the World around us. the publication year of all gri standards used for this report is 2016.
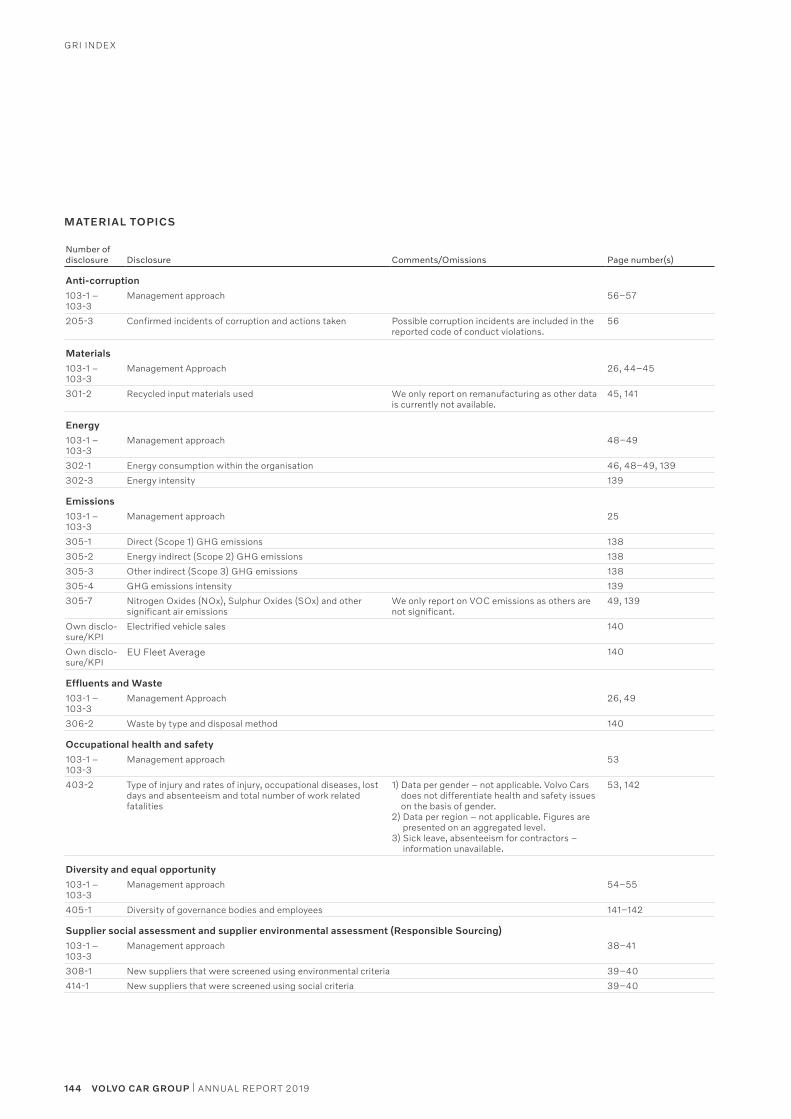
144 VOLVO CAR GROUP | ANNUAL REPORT 2019
gri index
MATERIAL TOPICS
Number of disclosure Disclosure Comments/Omissions Page number(s)
Anti-corruption
103-1 – 103-3
Management approach 56–57
205-3 confirmed incidents of corruption and actions taken Possible corruption incidents are included in the reported code of conduct violations.
56
Materials
103-1 – 103-3
Management approach 26, 44–45
301-2 recycled input materials used We only report on remanufacturing as other data is currently not available.
45, 141
Energy
103-1 – 103-3
Management approach 48–49
302-1 energy consumption within the organisation 46, 48–49, 139
302-3 energy intensity 139
Emissions
103-1 – 103-3
Management approach 25
305-1 direct (Scope 1) gHg emissions 138
305-2 energy indirect (Scope 2) gHg emissions 138
305-3 other indirect (Scope 3) gHg emissions 138
305-4 gHg emissions intensity 139
305-7 nitrogen oxides (nox), Sulphur oxides (Sox) and other significant air emissions
We only report on voc emissions as others are not significant.
49, 139
own disclo-sure/KPi
electrified vehicle sales 140
own disclo-sure/KPi
eu Fleet average 140
Effluents and Waste
103-1 – 103-3
Management approach 26, 49
306-2 Waste by type and disposal method 140
Occupational health and safety
103-1 – 103-3
Management approach 53
403-2 type of injury and rates of injury, occupational diseases, lost days and absenteeism and total number of work related fatalities
1) data per gender – not applicable. volvo cars does not differentiate health and safety issues on the basis of gender.
2) data per region – not applicable. Figures are presented on an aggregated level.
3) Sick leave, absenteeism for contractors – information unavailable.
53, 142
Diversity and equal opportunity
103-1 – 103-3
Management approach 54–55
405-1 diversity of governance bodies and employees 141–142
Supplier social assessment and supplier environmental assessment (Responsible Sourcing)
103-1 – 103-3
Management approach 38–41
308-1 new suppliers that were screened using environmental criteria 39–40
414-1 new suppliers that were screened using social criteria 39–40
145ANNUAL REPORT 2019 | VOLVO CAR GROUP
auditor'S liMited aSSurance rePort on SuStainabilit y
Auditor’s Limited Assurance Report on Volvo Car AB’s Sustainability Report and statement regarding the Statutory Sustainability Reportthis is the translation of the auditor’s report in Swedish.
To Volvo Car AB (publ.), corporate identity number 556810–8988
IntroductionWe have been engaged by the board of directors of volvo car ab to undertake a limited assurance engagement of the volvo car ab’s Sustainability report for the year 2019. the com-pany has defined the scope of the Sustainability report and the Statutory Sustainability report on page 71.
Responsibilities of the Board of Directors and the Executive Managementthe board of directors and the executive Management are responsible for the preparation of the Sustainability report including the Statutory Sustainability report in accordance with the applicable criteria and the annual accounts act respectively. the criteria are defined on page 71 in the Sustain-ability report, and are part of the Sustainability reporting guidelines published by gri (global reporting initiative), which are applicable to the Sustainability report, as well as the accounting and calculation principles that the company has developed. this responsibility also includes the internal control relevant to the preparation of a Sustainability report that is free from material misstatements, whether due to fraud or error.
Responsibilities of the auditor our responsibility is to express a conclusion on the Sustaina-bility report based on the limited assurance procedures we have performed and to express an opinion regarding the Stat-utory Sustainability report. our engagement is limited to his-torical information presented and does therefore not cover future-oriented information.
We conducted our limited assurance engagement in accord-ance with iSae 3000 assurance engagements other than audits or reviews of Historical Financial information. a limited assurance engagement consists of making inquiries, primarily of persons responsible for the preparation of the Sustainability report, and applying analytical and other limited assurance procedures. our examination regarding the Statutory Sustain-ability report has been conducted in accordance with Far’s accounting standard revr 12 the auditor’s opinion regarding the Statutory Sustainability report.
a limited assurance engagement and an examination accord-ing to revr 12 is different and substantially less in scope than an audit conducted in accordance with international Stand-
ards on auditing and generally accepted auditing standards in Sweden.
the firm applies iSQc 1 (international Standard on Quality control) and accordingly maintains a comprehensive system of quality control including documented policies and proce-dures regarding compliance with ethical requirements, profes-sional standards and applicable legal and regulatory require-ments. We are independent of volvo car ab in accordance with professional ethics for accountants in Sweden and have otherwise fulfilled our ethical responsibilities in accordance with these requirements.
the limited assurance procedures performed and the examina-tion according to revr 12 do not enable us to obtain assurance that we would become aware of all significant matters that might be identified in an audit. the conclusion based on a lim-ited assurance engagement and an examination according to revr 12 does not provide the same level of assurance as a conclusion based on an audit.
our procedures are based on the criteria defined by the board of directors and the executive Management as described above. We consider these criteria suitable for the preparation of the Sustainability report.
We believe that the evidence we have obtained is sufficient and appropriate to provide a basis for our conclusion below.
Conclusionbased on the limited assurance procedures we have per-formed, nothing has come to our attention that causes us to believe that the Sustainability report, is not prepared, in all material respects, in accordance with the criteria defined by the board of directors and executive Management.
a Statutory Sustainability report has been prepared.
göteborg 26 March 2020
deloitte ab
Jan nilssonauthorized Public accountant
lennart nordqvist expert Member of Far
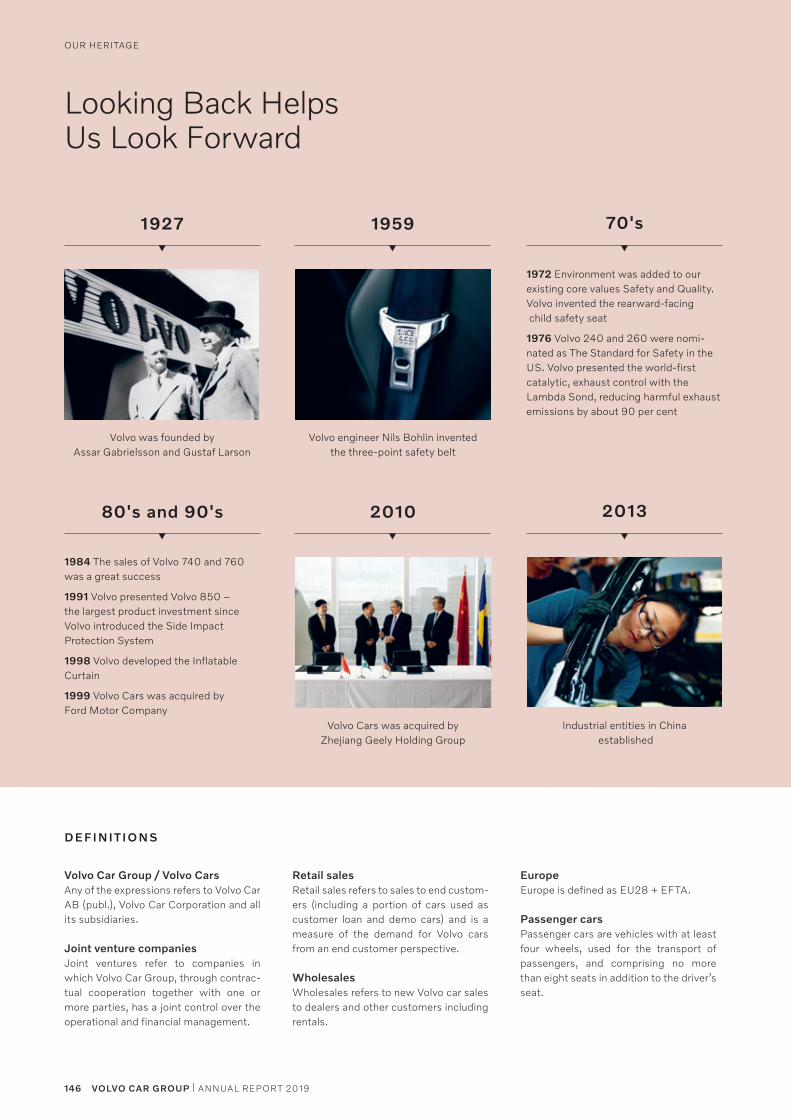
Looking Back Helps Us Look Forward
Volvo Cars was acquired by Zhejiang Geely Holding Group
Volvo engineer Nils Bohlin invented the three-point safety belt
Volvo was founded by Assar Gabrielsson and Gustaf Larson
Industrial entities in China established
1972 Environment was added to our existing core values Safety and Quality. Volvo invented the rearward-facing child safety seat
1976 Volvo 240 and 260 were nomi-nated as The Standard for Safety in the US. Volvo presented the world-first catalytic, exhaust control with the Lambda Sond, reducing harmful exhaust emissions by about 90 per cent
1984 The sales of Volvo 740 and 760 was a great success
1991 Volvo presented Volvo 850 – the largest product investment since Volvo introduced the Side Impact Protection System
1998 Volvo developed the Inflatable Curtain
1999 Volvo Cars was acquired by Ford Motor Company
80's and 90's
1927
2010
1959
2013
70's
D EFI N I T I O N S
Volvo Car Group / Volvo CarsAny of the expressions refers to Volvo Car AB (publ.), Volvo Car Corporation and all its subsidiaries.
Joint venture companiesJoint ventures refer to companies in which Volvo Car Group, through contrac-tual cooperation together with one or more parties, has a joint control over the operational and financial management.
Retail salesRetail sales refers to sales to end custom-ers (including a portion of cars used as customer loan and demo cars) and is a measure of the demand for Volvo cars from an end customer perspective. WholesalesWholesales refers to new Volvo car sales to dealers and other customers including rentals.
EuropeEurope is defined as EU28 + EFTA. Passenger carsPassenger cars are vehicles with at least four wheels, used for the transport of passengers, and comprising no more than eight seats in addition to the driver’s seat.
146 VOLVO CAR GROUP | ANNUAL REPORT 2019
OUR HERITAGE
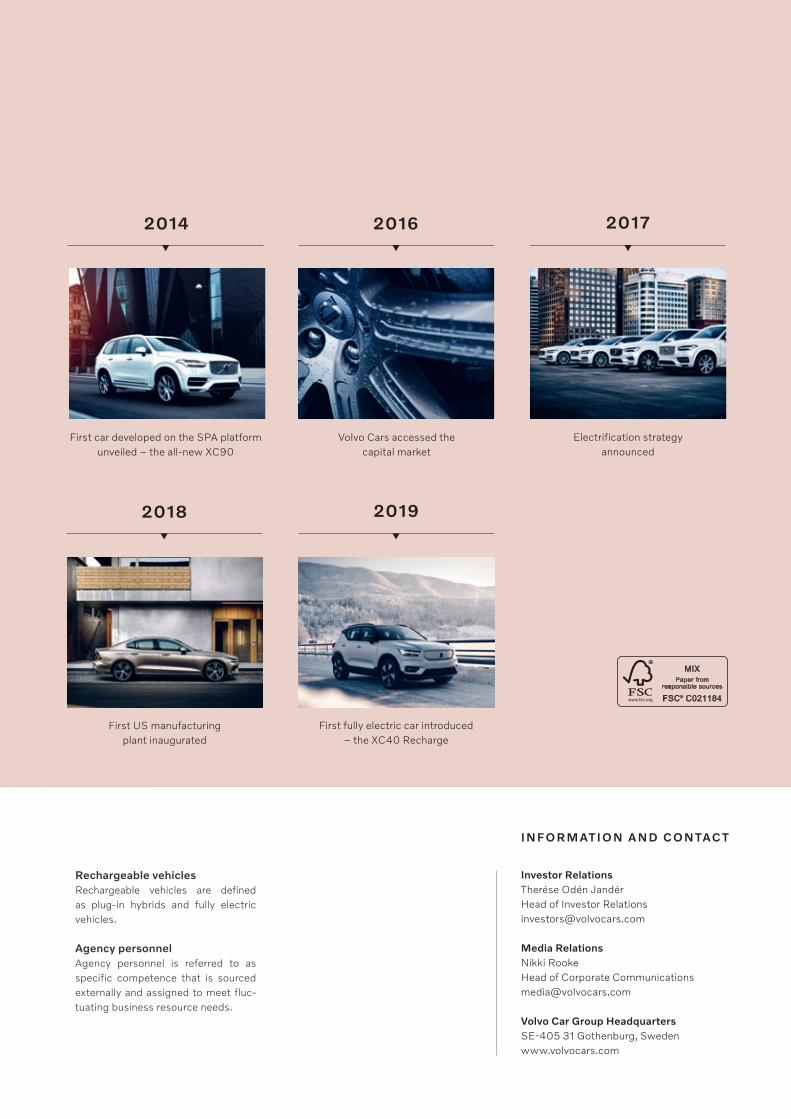
First US manufacturing plant inaugurated
Volvo Cars accessed the capital market
First car developed on the SPA platform unveiled – the all-new XC90
First fully electric car introduced – the XC40 Recharge
Electrification strategy announced
2014
2018
2016
2019
2017
Investor RelationsTherése Odén Jandér Head of Investor Relations [email protected]
Media RelationsNikki RookeHead of Corporate [email protected]
Volvo Car Group HeadquartersSE-405 31 Gothenburg, Swedenwww.volvocars.com
I N FO R M AT I O N A N D C O N TAC T
Rechargeable vehiclesRechargeable vehicles are defined as plug-in hybrids and fully electric vehicles. Agency personnelAgency personnel is referred to as specific competence that is sourced externally and assigned to meet fluc-tuating business resource needs.
VO
LV
O C
AR
GR
OU
P A
NN
UA
L R
EP
OR
T 20
19
Copyright © 2022 FDOKUMEN