pelatihan tata boga /tata rias - Pemerintah Kota Tasikmalaya
Upload
khangminh22Category
view
1download
0
CUSTOMERS BRAND AWARENESS TOWARDS TATA CARS
Dr. E. Jogeshwar Rao, Associate Professor,
Horizon Institute of Technology,Hyderabad. Abstract Brand awareness model for experience products that overcomes the limitations of consumer choice models, especially when it is not easy to consider some qualitative attributes of a product or when there are too many attributes relative to the available amount of preference date, by capturing the effects of unobserved product attributes with the residuals of reference consumers for the same product. They decompose the deterministic component of product utility into two parts: that accounted for by observed attributes and that due to non observed attributes. By estimating the unobserved component by relating it to the corresponding residuals of virtual experts representing homogeneous groups of people who experienced the product earlier and evaluated it. Using Bayesian estimation methods and Markov chain Monte Carlo simulation inference, applying two types of consumer preference data: 1) online consumer ratings (stated preferences) data for Internet recommendation services and 2) offline consumer viewership (revealed preferences) data for movies. The results empirically show that this new approach outperforms several alternative collaborative filtering and attribute-based preference models with both in and out of sample fits. The model is applicable to both Internet recommendation services and consumer choice studies. Keywords: Brand Awareness, Consumer Preferences.
Introduction to Brand Awareness With the opening of the market or the post liberalization period has resulted in many companies entering the markets with offerings of their goods and services. In the earlier stages of economic revolution consumer had to accept what the manufacturer has produced. But today’s consumers are much more educated, demanding, expect lot more to suit their ever changing life styles. There by their quality expectations have been elevated from time to time in order to rebuild it-self around its customer. The manufacturer should be able to satisfy, with the type of product and services to match the ever-changing customer requirements. In developing a marketing strategy for products, the sellers have to confront the branding decision. Brand is a major issue in product. Customers have strong preference for particular versions and brands of basic goods and services. The manufactures eventually learn that market power lies with the brand name companies. Consumers buying decisions are influenced by the brand. In this competitive world, the “Brand plays an important role and a brand is very prominent asset owned by an organization. Brand is endowed with awareness, perceived quality, associations and brand loyalty. Brand is presented as creative idea. A brand is a promise of the seller to deliver a specific set of benefits or attributes or services to the buyer. Brand represents a level of quality.
International Journal of Advanced in Management, Technology and Engineering Sciences
Volume 8, Issue IV, APRIL/2018
ISSN NO : 2249-7455
http://ijamtes.org/117

Objectives of the Study The study has been conducted with the following objectives: 1. To know how consumer welfare made customer to purchase product Tata Motors 2. What factors and variables of brand awareness influence them to purchase. 3. To know what position does the brand has in the minds of customers. 4. To know how they became aware of the brand Tata Motors four wheelers. 5. To know level of satisfaction about the consumer welfare offered by Tata Motors. 6. To find out the market potential for Tata Motors four wheelers. 7. To know how maintain and improve brand awareness build brand loyalty Need for the Study The motive of any company is to generally acquire larger market share high percentage of sales the Industry; this could be only achieved by building a higher percentage of brand loyal customers. Any company can survive through there is a stiff computational the market if it has brand loyal customers. Today many major companies in the market try to maintain and improve their branded equity. Without creating proper brand awareness they cannot build brand image. Strong brands help build the corporate image and also by making it easier for the companies launch new brands. Today brands are treated as major enduring assets of a company – more over brand equity are major contributor to customer equity. This all can happen only there is proper brand awareness. The lights four wheeler industries have been expanding rapidly are gone the day when possessing a small and mix-size cars were seen as a luxury. Now days it is viewed as a mere necessity. Customer relationship management and data mining are critical differentials that enable competitive edge for firms focused on increasing customer market share. Though investment in marketing, sales and service innovation can be constrained due to economic and cultural considerations, the initial analysis of the study indicates common European consumer apparel sites enable higher content depth, navigational context and help, consumer communication, and commerce efficiency. However, the study concurrently indicates lower customer customization and mining, lifestyle connection and marketing, and consumer, Community interaction, on the sites. Research Methodology: The data has been collected from both primary and secondary sources, to get information regarding the organization and products Primary Data: Primary data has been collected through questionnaires. The questionnaire was mostly related to the brand awareness towards TATA Motors Products of the customers on different features such as the model, price, effectiveness of the brand etc. Secondary Data: Secondary data has been taken from below sources: 1. Reports 2. Pamphlets 3. Advertisement 4. Customer database 5. News papers 6. Internet Sampling: Out of few lakes of Tata Motors customers spread all over India, the customers of Tata Motors Ltd., Hyderabad city only are taken as target population for the study. Sample Size:
International Journal of Advanced in Management, Technology and Engineering Sciences
Volume 8, Issue IV, APRIL/2018
ISSN NO : 2249-7455
http://ijamtes.org/118

The sample size of 100 is selected from the database of the company. The study requires on in depth survey and keen observation in a collecting data regarding the brand awareness levels of Tata Motors customers. Sampling Technique: Only simple random sampling technique is adopted in selection the sample. In this technique, each and every unit of the population has on equal opportunity of being selected in the sample. Data Collection Process:
Based on needs and objectives, types of data required for study and other of data are identified. Data was collected with the help of questionnaires. Scope of the Study The study plays a very important role in market research. It also helps to understand and identify the human action towards brand. The information thus gathered by conducting a systematic market research would help to finding out the brand Image of the consumers. This study was mainly focused towards people of Hyderabad who belong to different age group and reside in different localities, in order to find out their preference given to particular brand. Limitations of Study Even though the project has been done with outmost care, it suffers from the following limitations.
Due to lack of time, customers could not be contacted. The study has been restricted to Hyderabad city only. As the project is a simple sample study and is confined to 100 customers only, if May
or may not pictures the entire customer feelings. The awareness levels of the customers may change from time to time and so there is a
possibility of changes in the research results. Few customers refused to respond or could not respond appropriately due to:
Lack of time
Secondary Data
Data
Questionnaire
Primary Data Observation
News letters Inside organization Outside the Organization
Documents
Libraries
International Journal of Advanced in Management, Technology and Engineering Sciences
Volume 8, Issue IV, APRIL/2018
ISSN NO : 2249-7455
http://ijamtes.org/119
Ignorance etc.,
Literature Review In the word of Philip Kotler “A brand is a name, term, sign, symbol or design or combination of them. Intended to identify the goods or services of one seller or group of sellers and to differentiate them from those of competitors Role of Branding In today’s world brand names come to create identify to distinguish one product from another. The following points to pin down its precise role.
Brand is a massive asset: Brand is an intangible asset, because it is impossible to duplicate brand name.
Brand is promotional tool: The product differentiation is done by a brand through sales promotion.
Brand is a weapon to protect Market: A consumer has tried and liked a product, the brand enables him to identify the product and repeat the purchase.
Brand is antidote for middle men’s survival: The class of middle man always tends to go for a successful brand.
Brand is a means of identifications of customers: Brand is the easiest way of
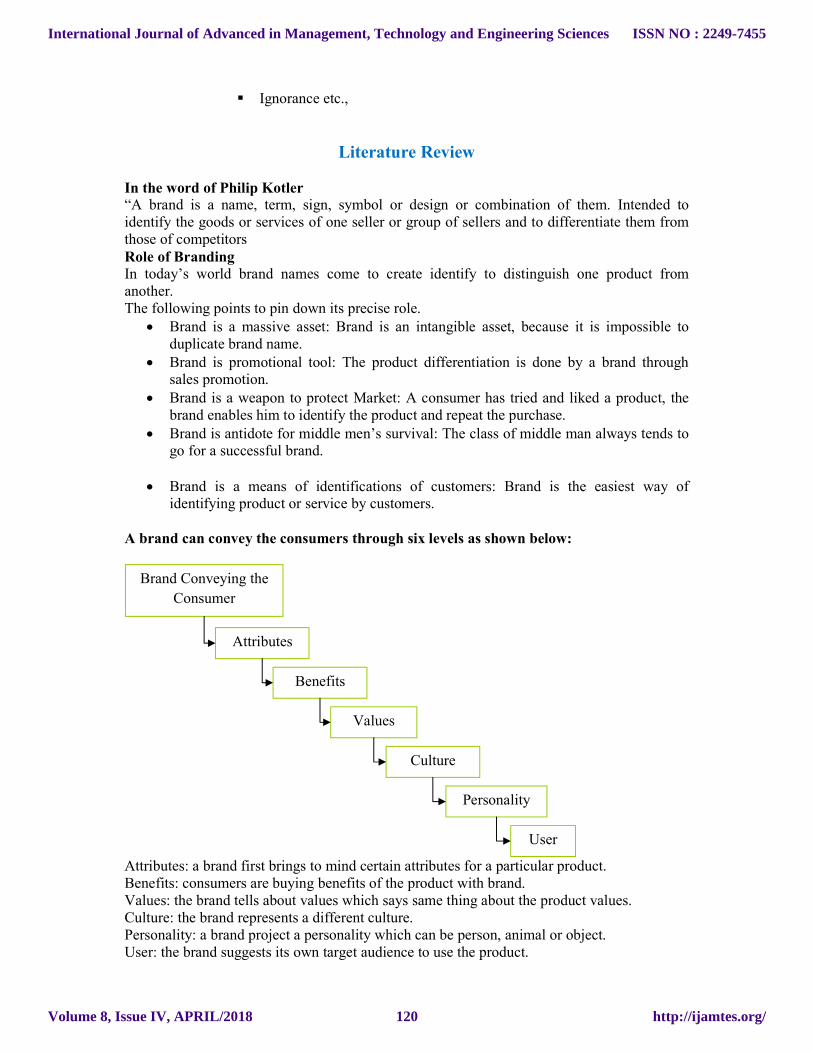
identifying product or service by customers. A brand can convey the consumers through six levels as shown below:
Attributes: a brand first brings to mind certain attributes for a particular product. Benefits: consumers are buying benefits of the product with brand. Values: the brand tells about values which says same thing about the product values. Culture: the brand represents a different culture. Personality: a brand project a personality which can be person, animal or object. User: the brand suggests its own target audience to use the product.
Attributes
Benefits
Values
Culture
Personality
User
Brand Conveying the
Consumer
International Journal of Advanced in Management, Technology and Engineering Sciences
Volume 8, Issue IV, APRIL/2018
ISSN NO : 2249-7455
http://ijamtes.org/120

Types of Brands
Brand Awareness of the Product The level of awareness can range from mere recognition to recall to top of mind to dominant. The company is spending money to keep brand in consumer’s memory. A strong Brand awareness means easy acceptance of new products. Brand with strong awareness can brought and sold to create brand name with enduring strength. An organization can put its customer awareness, identify and develop it further to build strong brand. It is enhanced by creating a brand loyalty and establishing brand identity of a product. Brand awareness is asset which brand managers create and enhance to build brand equity. It is related to the nature and features of product. It leads to brand strength which is constituted by measuring the variable like leadership, stability, Market, geographic, trend, support and protection etc… Creating brand awareness with the use of advertising, promotion event management etc… a different brand has different kind of awareness which retains recognition. Brand awareness satisfies a need of the consumer. A consumer as aims, ambitions, motivation drives and desire. Consumer feels more powerful when he uses the brand. Satisfactions or preference for a brand shows how loyal the consumer is likely to be brand. Now a day’s consumers are experience with brand awareness for different product, where the consumers’ expectations levels are increased towards brand, product etc… Perhaps the most distinctive skill of professional marketers is their ability to create, maintain, protect and enhance brands. Branding is the art and cornerstone of marketing. The American Marketing Association defines a brand as a name, term, sign, symbol or design, or a combination of them, intended to identify the goods or services of one seller or group of sellers and to differentiate them from those of competitors. Thus a brand identifies the seller or maker. “What distinguishes a brand from its unbranded commodity counterparts is the consumer’s perceptions and feelings about the product’s attributes and how they perform. Ultimately, a brand resides in the minds of consumers. A brand can be better positioned by associating its name with desirable benefits. A brand is much more than a name, logo, colors, a tagline, or symbol. These are marketing tools tactics. A brand is essentially a marketer’s promise to deliver a specific set of feature, benefits and services consistently to the buyers. The marketer must establish a mission for the brand and a vision of what the brand must be and do. Brand bonding occurs when customers experience the company as delivering on its benefit promise. The fact is that brands are not built by advertising but by the brand experience. Brands vary in the amount of power and value they have in the market place. At one extreme are brands that are not known by most buyers. Then there are brands for which
Manufacturer
Brand
National
Brand
Multiple
Brand
Private
Brand
Single
Brand
Family
Brand
Brand
International Journal of Advanced in Management, Technology and Engineering Sciences
Volume 8, Issue IV, APRIL/2018
ISSN NO : 2249-7455
http://ijamtes.org/121

buyers have a fairly high degree of brand awareness. Beyond this are brands with a high degree of brand acceptability. We define brand equity as the positive differential effect that knowing the brand name has on customer response to the product or service. Brand equity results in customers showing a preference for one product over another when they are basically identical. The extent to which customers are willing to pay more for the particular brand is a measure of brand equity. A brand needs to be carefully managed so that its equity does not depreciate. This requires maintaining or improving brand awareness, perceived quality and functionality and positive associations. These tasks require continuous R & D investment, skilful advertising and excellent trade and consumer service. Data Analysis Q1. What is your Occupation? Sample Business Professional Employee Student 100 31 21 27 21
Interpretation:-
From the above table and graphs observe that100 respondents reveals that 31% of them are employees, 21% are businessman, 27% are professional and 21% are students. So many employees are using these cars Q2. How long do you using the car? Sample Before 1 year Before 2 year Before 3 year Till now 100 33 27 10 30
Interpretation:- From the above graphical representation among 100respondents reveals that 30% of the customer till now using, 33% of them are before 1 yrs usage, 27% are before 2 yrs, 10% are before 3yrs. Usage of the products.
Business
Professional
Employee
Student
Before 1 year
Before 2 year
Before 3 year
Till now
Omni
International Journal of Advanced in Management, Technology and Engineering Sciences
Volume 8, Issue IV, APRIL/2018
ISSN NO : 2249-7455
http://ijamtes.org/122

Q3. Who influenced you to purchase a car? Sample Adds Sales persons Friends Some other 100 11 38 30 21
Interpretation:- From the above table and graphs representing that 100 respondents reveals that 30%,of them are friends , 38% of them are sales persons , 21% are some other ‘s and finally 11% are adds . Q4. How is their complaints handling? Sample Excellent Good Average Poor 100 35 30 20 15
Interpretations:- In the above table and graph representation among 100 responds reveals 35% of Excellent 30% good in handling the complaints, 20% are the average and remaining 15% are poor in complaint handling.
Adds
Sales persons
Friends
Some ot her
Excellent
Good
Average
Poor
International Journal of Advanced in Management, Technology and Engineering Sciences
Volume 8, Issue IV, APRIL/2018
ISSN NO : 2249-7455
http://ijamtes.org/123

Q5. How is Tata Motor delivery system? Sample Excellent Good Average Poor 100 27 27 33 13
Interpretation:- From the above table and graphs observe that among 100 responding reveals 27% are excellent 27% are good, 33% are average, and finally 13% are Poor, opinion of them Tata motors services are good.
Q6. What is overall satisfaction level with Tata Motor people? Sample Excellent Good Average Poor 100 32 38 17 13
Interpretation:- From the above table and graphs observe that among 100 responding reveals 32% are excellent 38% are good , 17% are average , 13% are poor opinion of them Tata motors services . 7. How is their response towards you entering in to the office? Overall satisfied No of customers Percentage Excellent 24 24 Good 48 48 Satisfied 28 28 Poor --- ---
Excellent
Good
Average
Poor
Excellent
Good
Average
Poor
International Journal of Advanced in Management, Technology and Engineering Sciences
Volume 8, Issue IV, APRIL/2018
ISSN NO : 2249-7455
http://ijamtes.org/124

Interpretation:- From the above table and graphs observe that among 100 responding reveals 24% are excellent 48% are good , 28% are average , opinion of them TATA motors services are good. 8. What is overall satisfaction level with Tata Motor people? Longue facility No of customers Percentage Excellent 12 12 Good 24 24 Average 64 64 Poor --- ---
Interpretation:- From the above table and graphs observe that among 100 responding Reveals 12% are excellent 24% are good, 64% are average totally the Longue facility is average Q9. How is their lounge facility? Sample Excellent Good Average Poor 100 15 23 30 32
1st Qtr2nd Qtr3rd Qtr
No of cust omers
Excellent
Good
Average
Excellent
Good
Average
Poor
International Journal of Advanced in Management, Technology and Engineering Sciences
Volume 8, Issue IV, APRIL/2018
ISSN NO : 2249-7455
http://ijamtes.org/125

Interpretation:- From the above table and graphs observe that among 100 responding reveals 15% are excellent 23% are good, 30% are average and 32%totally the longue facility is poor. Q10. What do you rate the following features:Features Sample
Transaction 100
Repair ability 100
Spare parts 100
Time bounding 100
Interpretation:- Transaction From the above table and graphs observe that among 100 responding reveals 15% are excellent 30% are good , 38% are average , and finally 17% are poor , opinion of them Motors services are good. Reparability facility From the above table and graphs excellent 30% are good, 20% are average and 27% are poor in reparability facility is to be good. Spare parts facility From the above table and graphs observe that among 100 responding reveals 17% are excellent 30% are good , 27% are average and 26% are poor in this spare parts facility may be satisfied. Time bounding facility From the above table and graphs observe that among 100 responding reveals 36% are excellent 17% are good, 30% are average, and finallyfacility may be good Findings The following details can be inferred after analysis with a simple size of 100, which included customers, by questionnaire method to find out the brand awareness towards Tata Motors.1. Most of the customers relating to
they occupy 30% of the entire customers. The next to them industrialists will come as they occupy 24% of the customers.
2. Most of the customers have bought the car 2 ye3. The promotional strategy of T
and by press is playing a vital role.
0
10
20
30
40
transaction repair ability
From the above table and graphs observe that among 100 responding reveals 15% are excellent 23% are good, 30% are average and 32%totally the longue facility is poor.
the following features: Sample Poor Moderate Satisfactory
100 17 38 30
100 27 20 30
100 26 27 30
100 17 30 17
From the above table and graphs observe that among 100 responding reveals 15% are excellent 30% are good , 38% are average , and finally 17% are poor , opinion of them
From the above table and graphs observe that among 100 responding reveals 23% are excellent 30% are good, 20% are average and 27% are poor in reparability facility is to be
From the above table and graphs observe that among 100 responding reveals 17% are ent 30% are good , 27% are average and 26% are poor in this spare parts facility may
From the above table and graphs observe that among 100 responding reveals 36% are excellent 17% are good, 30% are average, and finally 17% are poor overall time bounding
The following details can be inferred after analysis with a simple size of 100, which included customers, by questionnaire method to find out the brand awareness towards Tata Motors.
Most of the customers relating to Tata Motors belong to the category of employees as they occupy 30% of the entire customers. The next to them industrialists will come as they occupy 24% of the customers. Most of the customers have bought the car 2 years back. The promotional strategy of Tata Motors is advertisements of which electronic media and by press is playing a vital role.
repair ability spare parts time building
poor
moderate
satisfactory
excellent
From the above table and graphs observe that among 100 responding reveals 15% are excellent 23% are good, 30% are average and 32%totally the longue facility is poor.
Satisfactory Excellent
15
23
17
36
From the above table and graphs observe that among 100 responding reveals 15% are excellent 30% are good , 38% are average , and finally 17% are poor , opinion of them Tata
observe that among 100 responding reveals 23% are excellent 30% are good, 20% are average and 27% are poor in reparability facility is to be
From the above table and graphs observe that among 100 responding reveals 17% are ent 30% are good , 27% are average and 26% are poor in this spare parts facility may
From the above table and graphs observe that among 100 responding reveals 36% are 17% are poor overall time bounding
The following details can be inferred after analysis with a simple size of 100, which included customers, by questionnaire method to find out the brand awareness towards Tata Motors.
Motors belong to the category of employees as they occupy 30% of the entire customers. The next to them industrialists will come
Motors is advertisements of which electronic media
poor
moderate
satisfactory
excellent
International Journal of Advanced in Management, Technology and Engineering Sciences
Volume 8, Issue IV, APRIL/2018
ISSN NO : 2249-7455
http://ijamtes.org/126

4. Out of the models of Tata Motors the most popular brand is Indica because it is possessed by 45% of the customers.
5. Most of the customers are aware of educational programs that are being conducted by Tata Motors to the maintenance of the car.
Suggestions Tata Motors Pvt. Ltd. may maintain the stock of spares of all brands of Tata
Motors Four Wheelers so that it does not cause any inconvenience to the Customers.
The charges for servicing the Four Wheelers may be slightly reduced Some of the people are facing problems with mileage which should be rectified As a promotional measure of Tata Motors Pvt. Ltd. may increase free services
camps. This will increase Customer’s loyalty. A few more service stations smaller in size may be set up in areas where there is
more demand which will satisfy more customers of all areas. As per the study after sales service, cleaning and servicing vehicles should be
given importance and improved.
Conclusion Though the customers are having good awareness levels regarding the programs being
conducted by Tata Motors they are not attending the programs because of various reasons.
The customers find some problems regarding the mileage of Indica while comparing with the remaining models.
Care should be taken to see that delivery of new cars as well as serviced car should be in time.
Customers are expecting some complaints during the delivery of car. Hence, such items may be given to improve to Customers Satisfaction.
References: Marketing Management - Philip Kotler Marketing Research : Gc Beri Principles Of Marketing : Philip Kotler
Magazines & Journals
Business World (Magazine) Information from Brochures Leading newspapers International Journal of Electronic Customer Relationship International Journal of Business and Social Science. Vol. 2 No. 10 Journal of the Academy of Marketing Science, 28 (1) International Journal of Customer Relationship Marketing and Management
(IJCRMM): 1947-9247, 1947-9255: Business IS&T Journals.
International Journal of Advanced in Management, Technology and Engineering Sciences
Volume 8, Issue IV, APRIL/2018
ISSN NO : 2249-7455
http://ijamtes.org/127
Copyright © 2022 FDOKUMEN