Town of Falmouth Climate Change Vulnerability Assessment ...
64
Town of Falmouth Climate Change Vulnerability Assessment and Adaptation Planning Public Presentation October 29, 2019 Town of Falmouth Primary Contact: Jennifer McKay Conservation Agent Conservation Department Project Manager: Elise Leduc Coastal Scientist Woods Hole Group Project Team: Brittany Hoffnagle Environmental Scientist Woods Hole Group
-
Upload
khangminh22 -
Category
Documents
-
view
2 -
download
0
Transcript of Town of Falmouth Climate Change Vulnerability Assessment ...

Town of Falmouth Climate Change Vulnerability Assessment
and Adaptation Planning
Public Presentation
October 29, 2019
Town of Falmouth Primary Contact: Jennifer McKay Conservation Agent Conservation Department
Project Manager: Elise Leduc Coastal Scientist Woods Hole Group
Project Team: Brittany Hoffnagle Environmental Scientist Woods Hole Group

Vulnerability Assessment and Adaptation Planning
• Project Background and Need
• Analysis Methods
• Vulnerability Assessment Results 1. Municipal Asset Results
2. Natural Resources Impacts
• Recommended Actions
Presentation Outline
2

Project Background and Need
• Increasing concentrations of heat-trapping greenhouse gases, such as CO2, are primarily responsible for the climate changes observed in the industrial era, especially over the last seven decades
3
Climate Change – What’s happening and why?
290 ppm CO2
Ind
ust
rial
Rev
olu
tio
n
18
50
CO2 concentration > 400ppm (9/23/19 from Mauna Loa Station)
10
00
12
00
14
00
16
00
18
00
20
00

• Thousands of studies by researchers worldwide have documented temperature increases at the Earth’s surface and in the ocean
• Seas are warming and rising, and flooding is becoming more frequent along the U.S. coastline.
Project Background and Need
4
Climate Change – What’s happening and why?

Project Background and Need
• Warmer oceans and melting ice caps will continue to contribute to sea-level rise in the future
5
Climate Change – What’s happening and why?
Statewide hydrodynamic modeling uses “High” Scenario

Climate Change Flood Vulnerability Assessment Project Goals and Objectives
6
• Provide data on likely future flooding scenarios
• Identify potential flooding impacts to municipally-owned infrastructure
• Identify potential sea-level rise impacts to natural resources
• Identify and prioritize potential adaptation strategies to reduce risk

Climate Change Flood Vulnerability Assessment
• Assess risk for each asset ◦ Risk (R) = Probability of Flooding (P) x Consequence of Flooding (C)
• 5 step process: 1. Determine critical assets
2. Determine consequence of flooding score
3. Determine critical elevations
4. Obtain probability of exceedance data
5. Calculate risk scores and rankings
Project Methods
7

The following municipally owned assets within the model grid were included in the analysis:
◦ Buildings
◦ Above ground utilities (e.g., wastewater lift stations)
◦ Roads and bridges
◦ Parking lots
◦ Recreational facilities (e.g., baseballs fields, tennis courts, etc.)
◦ Shining Sea Bike Path
◦ Trunk River sewer main
◦ Boat ramps
◦ Coastal infrastructure (e.g., seawalls, jetties, groins, etc.)
8
8 meters (26.2 feet) NAVD88
Step 1: Determine critical assets

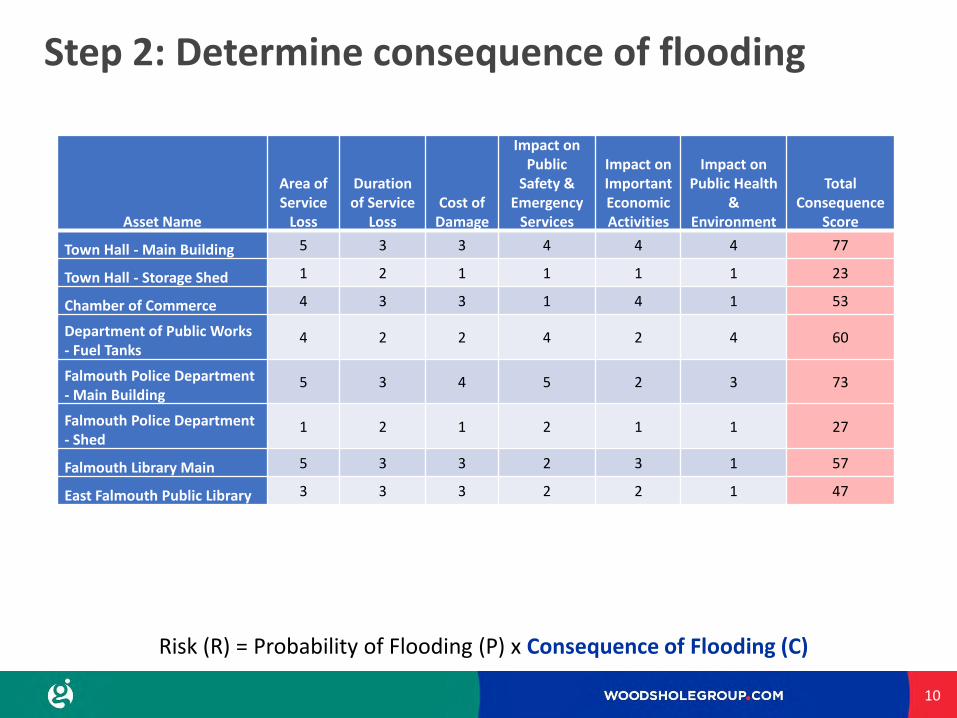
Step 2: Determine consequence of flooding
9
8 meters (26.2 feet) NAVD88
Rating Area of
Service Loss
Duration of
Service Loss
Cost of
Damage
Impact on
Public Safety
& Emergency
Services
Impact on
Important
Economic
Activities
Impact on
Public Health
&
Environment
5 Whole
town/city > 30 days > $10m Very high Very high Very high
4 Multiple
neighborhoods 14 - 30 days $1m - $10m High High High
3 Neighborhood 7 - 14 days $100k - $1m Moderate Moderate Moderate
2 Locality 1 - 7 days $10k - $100k Low Low Low
1 Property < 1 day < $10k None None None
Risk (R) = Probability of Flooding (P) x Consequence of Flooding (C)
10
Risk (R) = Probability of Flooding (P) x Consequence of Flooding (C)
Asset Name
Area of Service
Loss
Duration of Service
Loss Cost of
Damage
Impact on Public
Safety & Emergency
Services
Impact on Important Economic Activities
Impact on Public Health
& Environment
Total Consequence
Score
Town Hall - Main Building 5 3 3 4 4 4 77
Town Hall - Storage Shed 1 2 1 1 1 1 23
Chamber of Commerce 4 3 3 1 4 1 53
Department of Public Works - Fuel Tanks
4 2 2 4 2 4 60
Falmouth Police Department - Main Building
5 3 4 5 2 3 73
Falmouth Police Department - Shed
1 2 1 2 1 1 27
Falmouth Library Main 5 3 3 2 3 1 57
East Falmouth Public Library 3 3 3 2 2 1 47
Step 2: Determine consequence of flooding

Step 3: Determine critical elevations
11
Door threshold/ 1st Floor Outdoor equipment
Indoor equipment
Opening to basement
Threshold for significant damage?
Elevation above which asset would fail to function

Step 4: Obtain Probability of Exceedance Data

13
Step 4: Obtain Probability of Exceedance Data

14
Step 4: Obtain Probability of Exceedance Data

15
Step 4: Obtain Probability of Exceedance Data
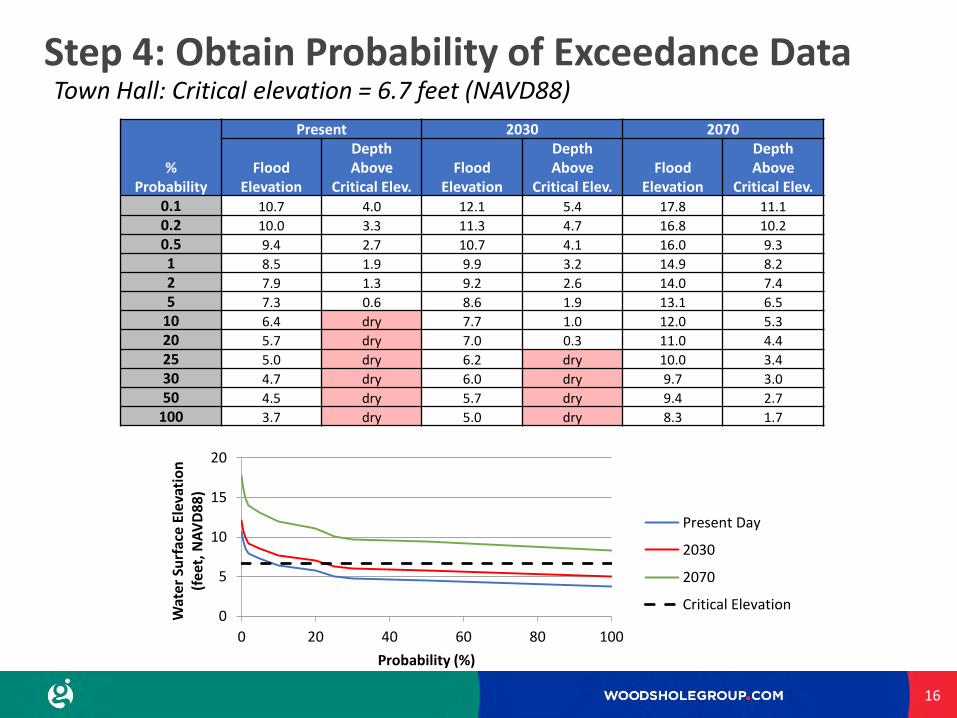
16
0
5
10
15
20
0 20 40 60 80 100
Wat
er
Surf
ace
Ele
vati
on
(f
eet
, NA
VD
88
)
Probability (%)
Present Day
2030
2070
Critical Elevation
% Probability
Present 2030 2070
Flood Elevation
Depth Above
Critical Elev. Flood
Elevation
Depth Above
Critical Elev. Flood
Elevation
Depth Above
Critical Elev. 0.1 10.7 4.0 12.1 5.4 17.8 11.1
0.2 10.0 3.3 11.3 4.7 16.8 10.2
0.5 9.4 2.7 10.7 4.1 16.0 9.3
1 8.5 1.9 9.9 3.2 14.9 8.2
2 7.9 1.3 9.2 2.6 14.0 7.4
5 7.3 0.6 8.6 1.9 13.1 6.5
10 6.4 dry 7.7 1.0 12.0 5.3
20 5.7 dry 7.0 0.3 11.0 4.4
25 5.0 dry 6.2 dry 10.0 3.4
30 4.7 dry 6.0 dry 9.7 3.0
50 4.5 dry 5.7 dry 9.4 2.7
100 3.7 dry 5.0 dry 8.3 1.7
Step 4: Obtain Probability of Exceedance Data Town Hall: Critical elevation = 6.7 feet (NAVD88)

17
Rcomp = (Rpresent x Wpresent) + (R2030 x W2030) + (R2070 x W2070)
Time horizon
Probability of Exceedance
Consequence Score Risk Score Weight
Composite Risk Score
Present 5 77 383 0.5 2185 2030 20 77 1533 0.3
2070 100 77 7667 0.2
Step 5: Calculate Risk Scores and Rankings

18
Top 20 ranked buildings and structures
Rank Asset Name Asset Type Consequence Score Present
Probability (%) 2030 Probability
(%) 2070 Probability
(%) Composite Risk
Score
1 Park Road Sewer Lift Station Sewer 37 100 100 100 3667
2 Old Dock Road Pier Upwellers Marine 40 50 100 100 3000
3 Woods Hole Draw Bridge Hut Marine 57 25 50 100 2692
4 Old Dock Road Pier Shed Marine 33 50 100 100 2500
5 Old Silver Beach (South) Pedestrian Ramp
Rec 33 50 100 100 2500
6 Town Hall - Main Building Admin 77 5 20 100 2185
7 Mitchell Bathhouse Rec 43 20 50 100 1950
8 Inner Harbor Upwellers Marine 40 10 50 100 1600
9 Woods Hole Sewer Lift Station Sewer 53 5 10 100 1360
10 Surf Drive Sewer Lift Station Sewer 43 10 20 100 1343
11 Woods Hole Community Building
Admin 37 10 20 100 1137
12 Inner Harbor - Electrical Shed Marine 50 1 5 100 1100
13 Inner Harbor - Charter Boat Shed
Marine 33 10 25 100 1083
14 Woods Hole Draw Bridge Hut Generator
Marine 43 5 5 100 1040
15 Town Hall - Storage Shed Admin 23 5 20 100 665
16 Woods Hole Sewer Lift Station Wet Well
Sewer 47 1 5 50 560
17 Inner Harbor - Garage Marine 40 0.5 2 50 434
18 Inner Harbor Sewer Lift Station Sewer 57 0.2 1 30 363
19 Old Silver Beach (North) Bathhouse
Rec 43 1 2 25 264
20 Mullen Hall School - Main Building
School 63 0 0 20 253
Step 5: Calculate Risk Scores and Rankings

19
Top 20 ranked roads
Rank Asset Name Consequence
Score Present
Probability (%) 2030 Probability
(%) 2070 Probability
(%) Composite Risk
Score
1 Water St (Luscombe Ave to Drawbridge) 67 99 99 100 6635
2 Chapoquoit Rd (Little Neck Bars Rd to Bridge) 57 95 100 100 5546
3 Clinton Ave (Swing Lane to Scranton) 67 73 83 100 5464
4 Scranton Ave (Lowry Road to Clinton) 67 69 83 100 5312
5 Waquoit Hwy (Waquoit Landing Rd to Childs River)
53 100 100 100 5300
6 Menauhant Rd (Grand to Maravista) 53 100 100 100 5300
7 Surf Dr (Mill Rd to Bywater Ct) 53 95 97 100 5115
8 Clinton Ave (Swing Ln to Sheridan Ave) 63 68 77 100 4859
9 Surf Dr (Elm Rd to Mill Rd) 57 77 87 100 4805
10 Menauhant Rd (Foster Rd to Central) 57 73 91 100 4768
11 West Ave 53 86 90 100 4766
12 Nashawena St (Lummis Ln to Pine Island Cir) 47 100 100 100 4700
13 Nashawena St (Cordwood Landing Rd to Swift St) 60 66 78 99 4579
14 Old Dock Rd (Bowline Rd to Chapoquoit Rd) 60 68 75 97 4568
15 Quissett Harbor Rd 53 79 83 100 4455
16 Mill Rd (Hedge Ln to Seagull Ln) 57 66 78 100 4363
17 Mill Rd (Seagull Ln to Surf Dr) 57 64 75 100 4260
18 Menauhant Rd (Acapesket Rd to Green Harbor Rd)
43 98 98 100 4234
19 Nashawena St (Pine Island Cir to Cordwood Landing Road)
60 61 73 89 4206
20 Chapoquoit Rd (Little Neck Bars Rd to Chapoquoit Rd)
57 67 70 96 4189
Step 5: Calculate Risk Scores and Rankings

20
Top 20 ranked assets (overall)
Rank Asset Name Asset Type Consequence
Score Present
Probability (%) 2030
Probability (%) 2070
Probability (%) Composite Risk
Score
1 Water St (Luscombe Ave to Drawbridge) Road 67 99 99 100 6635
2 Chapoquoit Rd (Little Neck Bars Rd to Bridge)
Road 57 95 100 100 5546
3 Clinton Ave (Swing Ln to Scranton Ave) Road 67 73 83 100 5464
4 Menauhant Road (At Bristol Beach/Little Pond)
Bridge 53 100 100 100 5333
5 Scranton Ave (Lowry Rd to Clinton Ave) Road 67 69 83 100 5312
6 Waquoit Hwy (Waquoit Landing Rd to Childs River)
Road 53 100 100 100 5300
7 Surf Dr (Mill Rd to Bywater Ct) Road 53 95 97 100 5115
8 Trunk River Sewer Main Sewer Main 50 100 100 100 5000
9 Clinton Ave (Swing Ln to Sheridan Ave) Road 63 68 77 100 4859
10 Surf Dr (Elm Rd to Mill Rd) Road 57 77 87 100 4805
11 Nashawena St (Lummis Ln to Pine Island Cir)
Road 47 100 100 100 4700
12 Falmouth Harbor Dock (6) Docks & Piers 47 100 100 100 4667
13 Nashawena St (Cordwood Landing Rd to Swift St)
Road 60 66 78 99 4579
14 Old Dock Rd (Bowline Rd to Chapoquoit Rd)
Road 60 68 75 97 4568
15 Mill Rd (Hedge Ln to Seagull Ln) Road 57 66 78 100 4363
16 Falmouth Harbor Clinton Ave Wharf Docks & Piers 43 100 100 100 4333
17 Falmouth Harbor Dock (1) Docks & Piers 43 100 100 100 4333
18 Falmouth Harbor Dock (2) Docks & Piers 43 100 100 100 4333
19 Falmouth Harbor Dock (3) Docks & Piers 43 100 100 100 4333
20 Falmouth Harbor Dock (4) Docks & Piers 43 100 100 100 4333
Step 5: Calculate Risk Scores and Rankings

• Asset Specific Visualizations ◦ Mitchell Bathhouse
◦ Green Pond Bridge
◦ Water Street
21
Asset Specific Visualizations Vulnerability Assessment – Other Deliverables

22
Mitchell Bathhouse

23
2019 100-year event

24
2030 100-year event

25
2070 100-year event

26
Green Pond Bridge

27
2019 100-year event

28
2030 100-year event

29
2070 100-year event

30

31
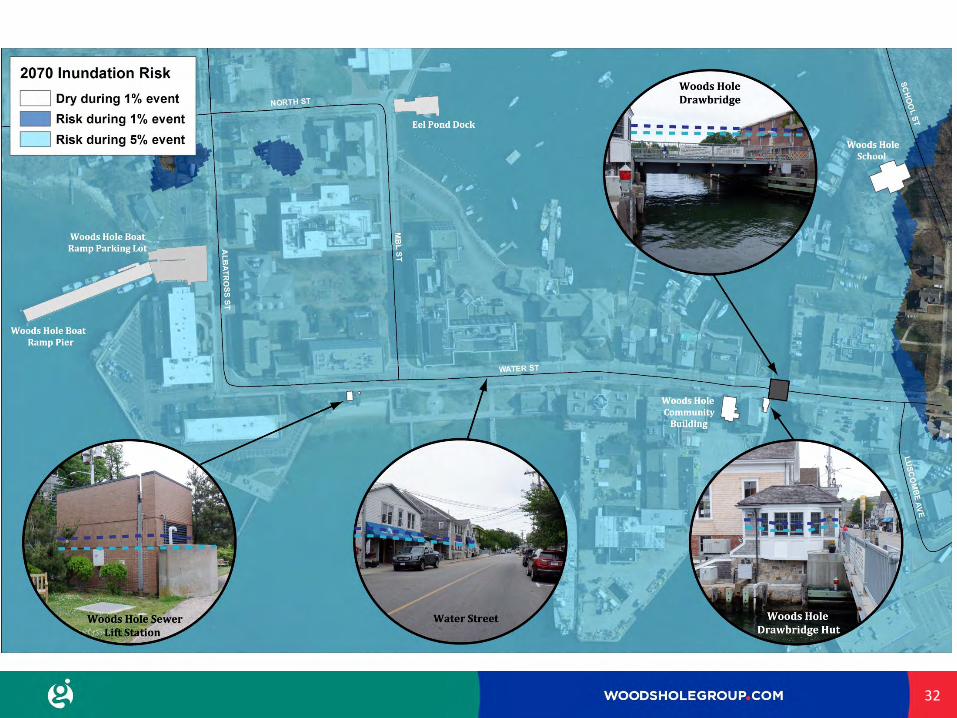
32
Vulnerability Assessment
33
Assessment of Impacts to Natural Resources: SLAMM Results

Vulnerability Assessment
34
SLAMM Results – Present Day

Vulnerability Assessment
35
SLAMM Results – 2030

Vulnerability Assessment
36
SLAMM Results – 2070

Vulnerability Assessment
37
SLAMM Results – Townwide Changes
Area (acres)
Present Day
2030 2070
Upland 16,689.6 16,640.3 16,134.5
Nontidal Swamp 327.4 326.5 302.7
Inland Fresh Marsh 209.1 206.6 192.2
Tidal Fresh Marsh 23.0 17.4 6.1
Transitional Marsh/Scrub-Shrub 17.7 20.6 80.5
Regularly Flooded Marsh 102.6 184.5 115.7
Estuarine Beach/Tidal Flat 273.8 226.5 336.5
Ocean Beach 274.7 228.4 368.0
Ocean Flat 206.1 30.6 0.9
Inland Open Water 952.5 948.9 895.9
Estuarine Open Water 2,099.2 2,225.1 2,737.9
Open Ocean 2,989.1 3,227.5 3,389.3
Irregularly Flooded Marsh 363.6 267.8 38.8
Tidal Swamp 89.2 67.1 18.8
0
50
100
150
200
250
300
350
400
450
500
Present Day 2030 2070
Are
a (A
cre
s)
Irregularly FloodedMarsh
Regularly FloodedMarsh
0
1,000
2,000
3,000
4,000
5,000
6,000
7,000
8,000
9,000
Present Day 2030 2070
Are
a (A
cre
s)
Total Open Water
Total Wetland
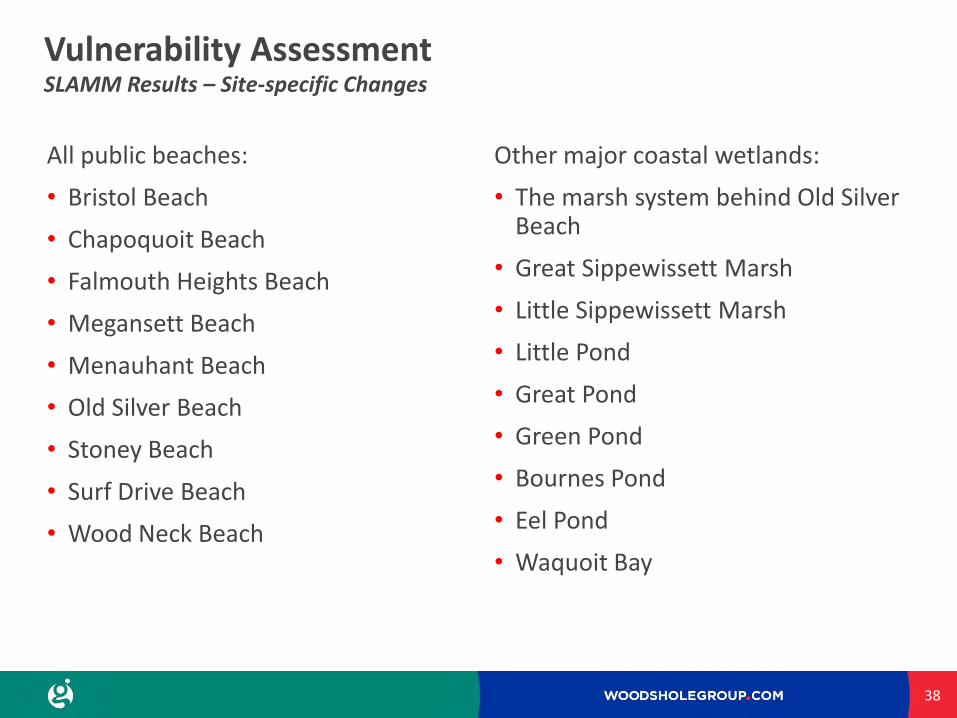
Vulnerability Assessment
All public beaches:
• Bristol Beach
• Chapoquoit Beach
• Falmouth Heights Beach
• Megansett Beach
• Menauhant Beach
• Old Silver Beach
• Stoney Beach
• Surf Drive Beach
• Wood Neck Beach
Other major coastal wetlands:
• The marsh system behind Old Silver Beach
• Great Sippewissett Marsh
• Little Sippewissett Marsh
• Little Pond
• Great Pond
• Green Pond
• Bournes Pond
• Eel Pond
• Waquoit Bay
38
SLAMM Results – Site-specific Changes

Vulnerability Assessment
39
SLAMM Results – Site-specific Changes

Vulnerability Assessment
40
SLAMM Results – Site-specific Changes

Develop Adaptation Strategies
1. Park Road Sewer Lift Station
2. Old Dock Road Dock, Upwellers and Shed
3. Woods Hole Drawbridge Hut
4. Town Hall
5. Old Silver Beach Parking Lot
6. Falmouth Harbor Docks (1-12)
7. Green Pond Dock (2)
8. Taft Park – Baseball Field, Tennis Courts, and Playground
9. Shining Sea Bike Path (Chapoquoit Road Bumblebee Hill Road)
10. Chapoquoit Road
11. Corner of Clinton Ave and Scranton Ave
12. Waquoit Highway/Rt 28 Bridge (@ Childs River)
13. Menauhant Road Bridge (at Bristol Beach/Little Pond)
Recommendations for site specific, asset-based adaptations:
41

Develop Adaptation Strategies
42
Old Dock Road Pier Assets Recommendations: Present - Wet floodproof the shed; ensuring that nothing inside is damaged during a flood event. Present - Properly secure upwellers so they cannot be dislodged. Present - Assess the pier to ensure it is structurally robust enough to withstand storm conditions. 2050/2070 - By 2050, daily MHW will overtop the pier, as well as impact Old Dock Road. In the long-term, this area will have to be redesigned. • Raising the structure in its current
location would require raising Old Dock Road and the water main.
• A portion of Old Dock Road could be abandoned, creating a dead end road that terminates at the relocated pier and associated boat ramp.

Develop Adaptation Strategies
43
Woods Hole Drawbridge Hut Recommendations: Present - Dry floodproof the bulkhead to protect the interior mechanics of the drawbridge hut. Present - Determine whether the submersible pump in the metal box to the right of the bulkhead is still necessary. If so, raise this component. 2030 - Dry floodproof the upper room of the drawbridge hut to protect the vital electrical equipment that’s inside. 2030/2050 - Evaluate the viability and necessity of the Woods Hole Drawbridge and Drawbridge Hut in the long-term. (See the regional adaptation discussion for the Woods Hole area.)

Develop Adaptation Strategies
44
Town Hall
Recommendations: Present - Dry floodproof the lower floor of Town Hall to protect the interior spaces Present/2030 - A berm-like landscaping feature (~1000 feet) could be constructed to reduce the likelihood of flooding (co-benefits for a number of local businesses).
2070 - Consider relocating the Town Hall. This could involve purchasing land or utilizing a vacant lot already owned by the Town and constructing a new building. Alternatively, a suitable existing building elsewhere could be acquired/repurposed.
(If the berm is constructed, the current building could potentially last up to or beyond 2070; the Town could monitor how SLR has been evolving before making a decision.)

Develop Adaptation Strategies
45
Taft Park – Woods Hole Recommendations: Present - No action. Although costly improvements should not be made to the baseball field. 2050/2070 - Consider looking for alternate locations to relocate these recreational assets. 2050/2070 - Consider transitioning Taft Park into a natural wetland area. Walking trails and/or boardwalks could be added to maintain the open space and recreational use.

Develop Adaptation Strategies
46
Chapoquoit Road Recommendations: Present - Due to the likelihood of roadway inundation during storms, and the disruption in transportation and emergency access this would cause, mandatory evacuations should be considered for the Chapoquoit neighborhood prior to a major storm. 2070 - Daily tidal inundation of the road by 2070 will require intervention to maintain regular access to the Chapoquoit peninsula in the future. Raising the road would require elevating the roadway from Old Dock Road to the Chapoquoit Beach parking lot (a 2,000–foot length of road).
Develop Adaptation Strategies
47
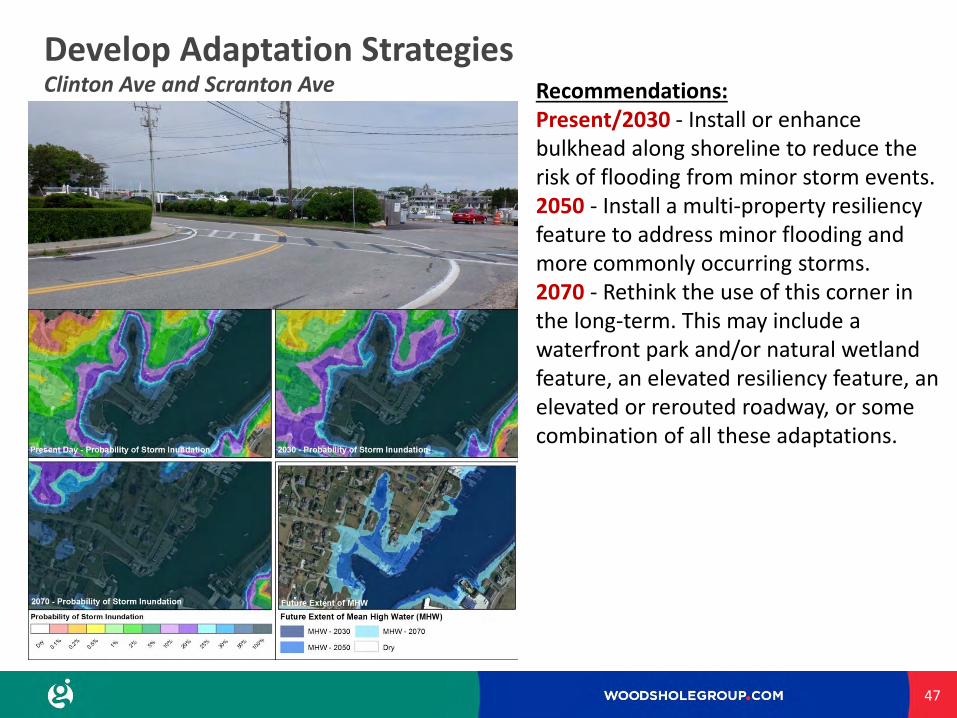
Clinton Ave and Scranton Ave Recommendations: Present/2030 - Install or enhance bulkhead along shoreline to reduce the risk of flooding from minor storm events. 2050 - Install a multi-property resiliency feature to address minor flooding and more commonly occurring storms. 2070 - Rethink the use of this corner in the long-term. This may include a waterfront park and/or natural wetland feature, an elevated resiliency feature, an elevated or rerouted roadway, or some combination of all these adaptations.

Develop Adaptation Strategies
48
Menauhant Road Bridge (at Little Pond) Recommendations: Present/2030 - Inspect bridge to ensure it is structurally sound and able to withstand floodwaters and daily tidal impacts; make repairs as necessary. 2030 - Construct a temporary berm on the Little Pond side of Menauhant Road, west of the bridge, to protect the roadway from daily tidal inundation (this could be designed to function through 2050 conditions). 2070 - Elevate 0.5 miles of road, replacing this existing undersized bridge with a wider crossing OR develop a long-term plan for abandonment of this roadway and bridge.

Develop Adaptation Strategies
Recommendations for regional adaptations:
1. Main Street/Top of Falmouth Inner Harbor
2. Woods Hole/Water Street
3. Top of Little Pond/Falmouth Mall
Recommendations for natural resources adaptations:
1. Washburn Island
2. Great Sippewissett Marsh
3. Chapoquoit Road Barrier
49

Develop Adaptation Strategies
50
Regional Strategy – Falmouth Harbor/Main Street

Develop Adaptation Strategies
51
Regional Strategy – Falmouth Harbor/Main Street

Develop Adaptation Strategies
52
Regional Strategy – Falmouth Harbor/Main Street

Develop Adaptation Strategies
53
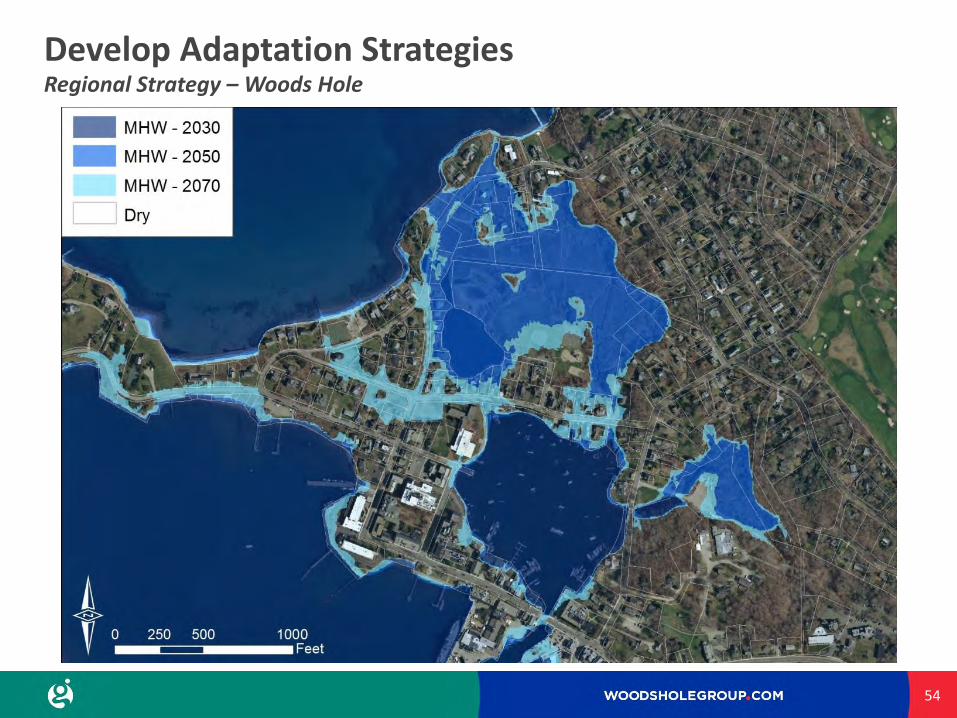
Regional Strategy – Woods Hole
Develop Adaptation Strategies
54
Regional Strategy – Woods Hole

Develop Adaptation Strategies
55
Regional Strategy – Woods Hole

Develop Adaptation Strategies
56
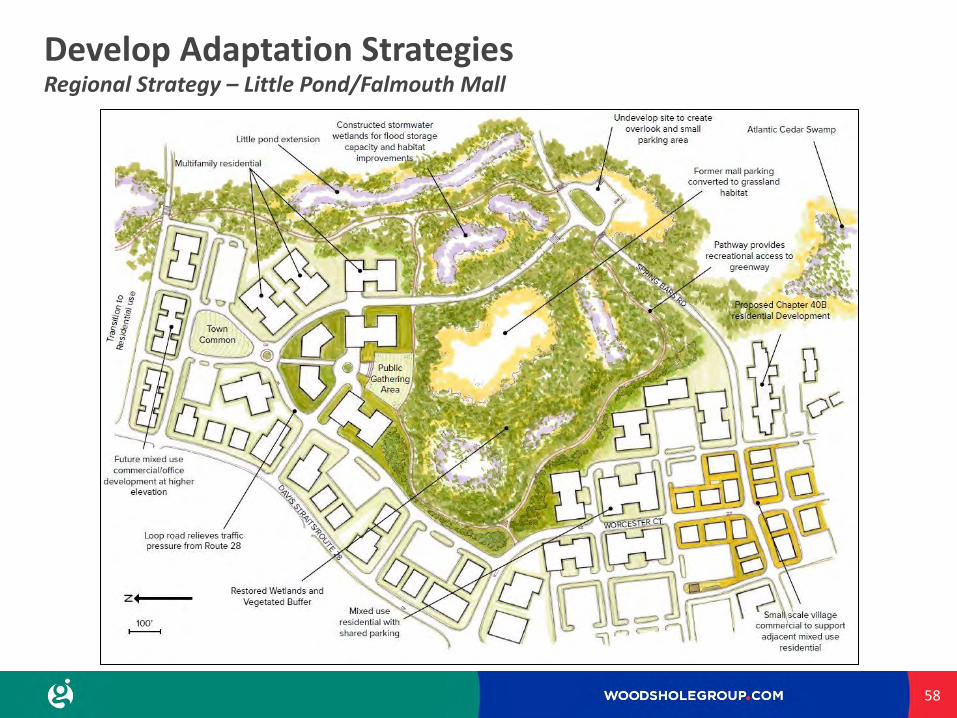
Regional Strategy – Little Pond/Falmouth Mall

Develop Adaptation Strategies
57
Regional Strategy – Little Pond/Falmouth Mall
Develop Adaptation Strategies
58
Regional Strategy – Little Pond/Falmouth Mall

Develop Adaptation Strategies
59
Regional Strategy – Little Pond/Falmouth Mall

Develop Adaptation Strategies
Recommendations for regional adaptations:
1. Main Street/Top of Falmouth Inner Harbor
2. Woods Hole/Water Street
3. Top of Little Pond/Falmouth Mall
Recommendations for natural resources adaptations:
1. Washburn Island
2. Great Sippewissett Marsh
3. Chapoquoit Road Barrier
60

Develop Adaptation Strategies
61
Washburn Island Goal: Reinforce and increase the coastal resiliency of the barrier beach, thus ensuring a stable Waquoit Bay system Recommendations: • Short term: the Town should engage
the state, WBNERR, the Town of Mashpee, the Menauhant Yacht Club, Waquoit Bay Yacht Club, and other relevant stakeholders about this issue, to develop a long-term plan to manage Waquoit Bay and Washburn Island
• Long term: Dune and/or beach nourishment program on the south facing shoreline of Washburn Island.

Develop Adaptation Strategies
62
Great Sippewissett Marsh Goal: Maximize health of the salt marsh Recommendations: • Enhance and increase the coastal
resilience of the main salt marsh area. Elevation enhancement (e.g., thin layer deposition) will be necessary to maintain suitable salt marsh elevations.
• Expansion of salt marsh east of the bike path. Prior to 2070, portions of the bike path to be replaced with elevated pile-supported path.

Develop Adaptation Strategies
63
Chapoquoit Road Wetlands Goal: Reinforce and enhance coastal resiliency for the barrier beach system and salt marsh enhancement. Recommendations: • Beach nourishment on the outer coast
should be pursued if possible, but need to look at barrier holistically.
• Address salt marsh loss and erosion on the West Falmouth Harbor side as well. • Consider living shoreline designs,
salt marsh restoration and/or enhancement; establishment of oyster beds
• Elevation enhancement • Expansion of salt marsh into existing
tidal swamp. Prior to 2050, evaluate the tidal creek and repair/replace any existing culverts as necessary to ensure that daily tides can enter.

64
Questions?