Climate Variability, Climate Change and Social Vulnerability in the Semi-arid Tropics
190
Transcript of Climate Variability, Climate Change and Social Vulnerability in the Semi-arid Tropics


Climate fluctuations can trigger events that lead to mass migration, hunger and famine.Rather than attributing the blame to nature, the authors look at the underlying causes ofsocial vulnerability, such as social processes and organization. Past and presentsusceptibility to destitution, hunger, and famine in the face of climate variability canteach us about the potential future consequences of climate change. By understandingwhy individuals, households, nations and regions are vulnerable, and how they havebuffered themselves against climatic and environmental fluctuations, present and futurevulnerability can be redressed. Through case studies from around the globe, the authorsexplore past experiences with climate variability, as well as the likely effects of, and thepossible policy responses to, the types of climatic events that global warming mightbring.


Climate Variability, Climate Change and Social Vulnerability in the Semi-arid Tropics


Climate Variability, Climate Change andSocial Vulnerability in the Semi-aridTropics
Edited by
Jesse C. RibotMacArthur Fellow,Center for Population and Development Studies,Harvard University, Cambridge, Massachusetts, USA
Antonio Rocha MagalhaesExecutive Secretary,Secretariat of Planning,The Presidency of the Federated Republic of Brazil, Brasilia, Brazil
Stahis S. PanagidesVice President,Esquel Group Foundation, Bethesda, Maryland, USA
CAMBRIDGEUNIVERSITY PRESS

CAMBRIDGE UNIVERSITY PRESSCambridge, New York, Melbourne, Madrid, Cape Town, Singapore, Sao Paulo
Cambridge University Press
The Edinburgh Building, Cambridge CB2 2RU, UK
Published in the United States of America by Cambridge University Press, New York
www. Cambridge. orgInformation on this title: www.cambridge.org/9780521480741© Cambridge University Press 1996
This publication is in copyright. Subject to statutory exceptionand to the provisions of relevant collective licensing agreements,no reproduction of any part may take place withoutthe written permission of Cambridge University Press.
First published 1996
This digitally printed first paperback version 2005
A catalogue record for this publication is available from the British Library
Library of Congress Cataloguing in Publication data
Climate variability, climate change, and social vulnerability in thesemi-arid tropics / edited by Jesse C. Ribot, Antonio RochaMagalhaes, Stahis S. Panagides.
p. cm.ISBN 0 521 48074 41. Climatic changes-Social aspects-Tropics-Congresses. 2. Aridregions-Climate-Social aspects-Congresses. 3. Sustainabledevelopment-Tropics-Congresses. I. Ribot, Jesse Craig. II. Magalhaes,Antonio Rocha. III. Panagides, Stahis Solomon, 1937— .QC981.8.C5C62 1996304.2'5'0913-dc20 95-1625 CIP
ISBN-13 978-0-521-48074-1 hardbackISBN-10 0-521-48074-4 hardback
ISBN-13 978-0-521-01947-7 paperbackISBN-10 0-521-01947-8 paperback

Contents
List of contributors
Foreword by Tom Downing
Preface
List of abbreviations
viii 5. Settlement Advance and Retreat: A Century of
ix Experience on the Eyre Peninsula of South
xi Australia
xiii R. Les Heathcote
109
Introduction. Climate Variability, Climate 1
Change and Vulnerability: Moving Forward
by Looking Back
Jesse C. Ribot
PART I: OVERVIEW
1. Climate Variation, Vulnerability and 13
Sustainable Development in the Semi-arid
Tropics
Jesse C. Ribot, Adil Najam and Gabrielle
Watson
PART II: CLIMATE VARIATION,CLIMATE CHANGE AND SOCIETY
2. Climate Change and Variability in Mexico 55
Karen O 'Brien and Diana Liverman
3. The Impact of Climate Variation and 71
Sustainable Development in the Sudano-
Sahelian Region
Fredrick Joshua Wang ati
4. Climate Change and Sustainable Development 92
in China's Semi-arid Regions
Zong-ci Zhao
PART III: CLIMATE VARIABILITYAND VULNERABILITY: CAUSALITYAND RESPONSE
6. Drought Follows the Plow: Cultivating 125
Marginal Areas
Michael H. Giantz
7. Amazonia and the Northeast: The Brazilian 129
Tropics and Sustainable Development
Jan Bitoun, Leonardo Guimaraes Neto and
Tania Bacelar de Araujo
8. Reducing the Impacts of Drought: Progress 147
Toward Risk Management
Donald A. Wilhite
PART IV: THE INTERNATIONALCONFERENCE ON THE IMPACTSOF CLIMATIC VARIATIONS ANDSUSTAINABLE DEVELOPMENT INSEMI-ARID REGIONS (ICID)
9. Declaration of Fortaleza 167
10. Highlights of Working Group Discussions and 170
Recommendations
vn

Contributors
Tania Bacelar de Araujo
Jan Bitoun
Michael H. Glantz
Leonardo Guimaraes Neto
R. Les Heathcote
Diana Liverman
Adil Najam
Karen O'Brien
Jesse C. Ribot
Fredrick J. Wang'ati
Gabrielle WatsonDonald A. Wilhite
Zing-ci Zhao
Economist, Social Research Institute of the JoaquimNabuco Foundation, Recife, BrazilProfessor of Geography, Department of GeographicalScience, Federal University of Pernambuco, Recife, BrazilSenior Scientist and Director, Environmental and Socie-tal Impacts Group, National Center for AtmosphericResearch (NCAR), Boulder, Colorado, USAEconomist, Social Research Institute of the JoaquimNabuco Foundation, Recife, BrazilProfessor of Geography, Flinders University, Adelaide,South AustraliaAssociate Professor of Geography and Earth SystemsScience, Pennsylvania State University, University Park,USADoctoral Candidate, Department of Urban Studies andPlanning, Massachusetts Institute of Technology, Massa-chusetts, USAPhD Candidate in Geography, Pennsylvania StateUniversity, University Park, Pennsylvania, USAMacArthur Fellow, Center for Population and Develop-ment Studies, Harvard University, Cambridge, Massa-chusetts, USATechnical Coordinator, United Nations EnvironmentProgram, Desertification Control Program ActivityCenter, National Land Degradation and Assessment andMapping in Kenya, Nairobi, KenyaConsultant, World Bank, Washington, DC, USAProfessor of Agricultural Climatology, Director of Inter-national Drought Information Center, Department ofAgricultural Meteorology, University of Nebraska, Lin-coln, Nebraska, USA
Professor, Chinese Academy of Meteorological Sciences,Beijing, People's Republic of China
vni

Foreword
The threat of climate change has united scholars, practi-tioners, policy-makers and many publics to challenge thefoundations of wasteful economic systems and, now overtwo years ago, to forge an unprecedented treaty: the Frame-work Convention on Climate Change. What is the contribu-tion of the academic community to meet this challenge?Obviously, understanding of climate systems and their inter-actions with the biogeosphere brought the issue to theworld's attention, garners the majority of funding, and,indeed, continues as an urgent need.
Yet, an equal contribution, in my view, is required fromsocial scientists. The many disciplines are replete with frame-works (for example, political ecology, sustainable develop-ment, and risk assessment), concepts and methods (fromstructuration to contingent valuation and participatory ruralappraisal), and prescriptions for action (such as communityself-help and empowerment embodied in the slogan 'Thinkglobal, act local'). Across this diverse landscape, three focishould be prominent.
First, vulnerable populations and social equity must befirmly embedded in the science and politics of global change.Impact assessments, economic evaluations and internationalnegotiations must be cognizant of the great disparities inlivelihoods. Those who have contributed the most to climatechange are able to bear the consequences more readily thanthose whose livelihoods are under threat at present and canleast afford to either prevent climate change or survivepotentially adverse consequences.
Second, the nuances of local vulnerability and capabilitymust be clearly understood. In the near term, research on thehuman ecology of production, access to markets, and thepolitics of empowerment must be conducted at a local level.Regional and global patterns will only emerge from careful,consistent case studies of individuals, households andcommunities.
Third, local studies must be placed in the context of globalchange. Such transitions as from self-provisioning to mixedeconomies, from authoritarian to democratic government,
from individual to collective responsibility imply a spatialconnectedness that spans the world. At the same time, thedynamics of present resource use, social conditions, econ-omic systems and political societies must be projected for-ward to match the time scale of climate change. Forecastingthe evolution of vulnerable groups and regions remains oneof the most perplexing issues in understanding the potentialimpacts of global change. For example, will famine continueto plague Africa in the next century? Will famine continuedespite international agreements to end famine by the end ofthe 1990s and despite projections of economic growth suchthat developing countries in 2100 will be as rich then as theOECD countries are now?
This volume brings fresh insight to these issues. It firmlyfocuses attention on the conjuncture of the driving forces ofglobal change, resource use in the climatically marginal semi-arid regions of Africa, Asia and Latin America, and thesocial geography of vulnerability. The commitment of theauthors and editors provides a contribution to the literatureon sustainable development and natural disasters. Further-more, it looks beyond current approaches of climate changeimpact assessment toward fresh ways to identify vulnerableplaces, link the local and the global, and address the urgentneeds of present vulnerable populations with the long-termneed to enhance their capacity to respond to the effects ofclimate change. This latter objective should provide valuableinsight for efforts to draft and adopt a protocol on adap-tation for the Framework Convention on Climate Change.
It was a pleasure to have contributed to the InternationalConference on Impacts of Climatic Variations and Sustain-able Development in Semi-Arid Regions in Fortaleza in1992. It is an equal pleasure to recommend this book to awide audience.
Thomas E. DowningProgramme Leader for Climate Impacts and Responses
Environmental Change UnitOxford
IX


Preface
It is with great satisfaction that we present this editedvolume. It draws from the rich and timely presentations atthe International Conference on Impacts of Climatic Varia-tions and Sustainable Development in Semi-Arid Regions(ICID) held in Fortaleza, State of Ceara, Brazil, 27 Januaryto 1 February 1992. ICID was a concerted effort on the partof social scientists, climatologists, policy analysts and policymakers to examine, find solutions for and bring attention tothe common problems faced by the peoples of semi-aridlands - the most profound of which are associated withclimatic phenomena. Conference participants were asked toexamine the past consequences of and responses to climatevariability, and given these past experiences, to reflect on thelikely effects of and possible proactive policy responses to thetypes of climatic events that global warming might bring.Nations and peoples of the semi-arid regions of the worldhave had long histories of planning for, coping with, rebuild-ing after, and responding to variations inherent in theirclimates. The papers in this volume recount some of thesehistories and reflect on the future of the semi-arid lands of theleast-developed countries.
ICID preceded the United Nations Conference onEnvironment and Development (UNCED), held in Rio deJaneiro in June 1992, in order to give voice at UNCED to theplight and needs of peoples of these semi-arid lands. Thesemi-arid regions of the world contain a large portion of theleast-developed countries on earth. It is in these poorer semi-arid lands - the semi-arid tropics - where populations eke outtheir livings squeezed against a fluctuating and at timesdeclining natural resource base. The ultimate need for deve-lopment - throught entitlement and empowerment - tomoderate the relation between people and their environmentis manifest here. UNCED promised to address the problemsof this very relationship between people and the land in theunderdeveloped world. But, in the international arena ofUNCED, world attention was focused on global-level ormacro aspects of issues such as climate change, biodiversityand deforestation. Concerns about the living relationbetween local peoples and their natural resource base wereovershadowed by these global concerns. The most underde-
veloped regions, where the majority's livelihoods are caughtbetween the limits of environment and development, weremarginalized in the very context in which their concernsshould have been center stage. ICID helped to bring theseconcerns back into the debate by introducing the conferencedeclaration, the Declaration of Fortaleza (this volume), intothe last preparatory session leading up to UNCED. But thereal results of this effort will unfold in the years to come asAgenda 21 (UNCED's global plan of action) and otherinternational environment agreements and institutions, suchas the recent convention on desertification, take shape aspolicies on the ground. It is our hope that this volume cancontribute to the debates that shape such policies.
The authors and editors of this volume are grateful to thesponsors, organizers and supporters of ICID. The Confer-ence was convened by the government of Ceara and orga-nized by Esquel Group Foundation Brazil (Fundacao GrupoEsquel Brasil). Initial and generous support for this eventwas rendered by the Bank of the Northeast of Brazil and theCeara Federation of Industries. Contributions were receivedfrom other Brazilian institutions, among them the NationalScience Council (CNPq), the Brazilian AgriculturalResearch Corporation (EMBRAPA) through its ResearchCenter on the Semi-Arid Tropics (CPATSA), and the J.Macedo Group. An indication of the increasing awarenessby the international community regarding the importance ofsemi-arid lands was the assistance received from sourcesoutside Brazil. The Inter-American Development Bank(IDB), the Government of the Netherlands and the John D.and Catherine T. MacArthur Foundation were our mostgenerous external financial supporters. Additional inter-national support was received from the United NationsEnvironment Program (UNEP), the French Institute forUltramarine Research (ORSTOM), and the World Bank.From its very beginning, ICID has received encouragementand guidance from Mr Maurice Strong, Secretary General ofUNCED.
Special appreciation is due to the former Governor of theState of Ceara, Mr Ciro Gomes, and to the present Gover-nor, Mr Tasso Jereissati. It was their belief that science,
XI

Xll PREFACE
international awareness, and political commitment mustmove together that made this event possible. Special thanksare due to Esquel Group Foundation for its continuoussupport and leadership role in ICID. Esquel Group Founda-tion USA, and the Esquel Group Foundation Brazil, aremembers of the eight country Grupo Esquel network thatassisted ICID throughout its lengthy and laborious prepara-tory process. The Massachusetts Institute of Technology(MIT), through its Department of Urban Studies and Plan-ning, provided us invaluable guidance and professionalsupport.
The cooperation among the teams in Fortaleza, Brasilia,Cambridge and Washington in preparing this volume, aswell as in convening and organizing ICID, is a vivid exampleof how civil society, the scientific community and govern-ment can cooperate across borders and disciplines to focusattention on problems that influence the destiny of us all.
A. R. M.S. S. P.J. C. R.

Abbreviations
BCE Before the common era, referring to the time often called BCBP Before present, present is 1950CFC Chlorofluorocarbon: a gas known to destroy the earth's ozone layerCILSS Comite Inter-etat pour la lutte Contre la Sacheresse au Sahel (Inter-State
Committee for the Fight Against Drought in the Sahel)ENSO El Nino Southern Oscillation: a weather pattern that is an important
determinant of global climatic patternsFAO Food and Agriculture Organization of the United NationsGCM General Circulation Model: models used by climatologists to forecast
weather patternsGHG Greenhouse gases: gases that contribute to global warming by trapping the
sun's heat in the earth's atmosphereICID International Conference on Impacts of Climatic Variations and Sustain-
able Development in Semi-Arid RegionsICRISAT International Crops Research Institute for the Semi-arid TropicsIGADD Inter-Governmental Authority on Drought and Development, East AfricaIPCC Inter-Governmental Panel on Climate Change of the United NationsMNCs Multi-National CorporationsNEB Northeast BrazilP/ETP Precipitation to potential evapotranspiration ratio: a measure of aridityPDSI Palmer drought severity indexSDS Sustainable development strategySUDENE Superintendencia do Desenvolvimento do Nordeste (Northeast Brazil
Development Agency)UCAR University Corporation for Atmospheric Research, USAUNCDF United Nations Capital Development FundUNCED United Nations Conference on Environment and Development (June 1992,
Rio de Janeiro)UNDP United Nations Development ProgramUNEP United Nations Environment ProgramWCED World Commission on Environment and Development (Brundtland Com-
mission)WFP World Food Program of the United NationsWMO World Meteorological Organization
xni


Introduction. Climate Variability, Climate Changeand Vulnerability: Moving Forward by LookingBack
JESSE C. RIBOT
... Somos muitos Severinosiguais em tudo e na sina:a de abrandar estas pedrassuando-se muito em cima,a de tentar despertarterra sempre mais extinta,a de querer arrancaralgum rocado da cinza.Mas, para que me conhecammelhor Vossas Senhoriase melhor possam seguira historia de minha vida,passo a ser o Severinoque em vossa presenca emigra.
Joao Cabral de Melo Neto, Morte e Vida Severina, 1966
Severina is a common name in the dry Northeast of Brazil - itis a name akin to the word for severity, reflecting rural life inthese drylands. The experience of severe deprivation iswidespread in the semi-arid tropics. Indeed, there are manySeverinos living lives of constant vulnerability to hunger,famine, dislocation and material loss. Extreme climaticevents, such as droughts, simply unveil this underlyingchronic state. Such vulnerability is not caused by climatevariability or climate change alone (Sen 1981; Watts 1983a).It is a result of the configuration of forces that shape theability of farm and pastoral populations to produce, repro-duce and develop. Climate extremes are an expected charac-teristic of semi-arid lands. Most populations know fromlocal history the frequency and likely consequences ofextreme climatic events. And most populations in highlyvariable or extreme climatic zones shape their livelihoodsystems to buffer against potential catastrophes. Theyprepare with the means at their disposal for these expected,yet unpredictable, threats. But why are some livelihoodsystems, some populations, some regions and some socioeco-nomic groups less able to prepare for or recover from naturalextremes? What shapes their exposure to and ability to
rebound from these expected events? What shapes theirvulnerability in the face of climate variability and change?
This volume explores the relation between climate varia-bility or climate change and the wellbeing of rural agricul-tural and pastoral populations in the semi-arid tropics. Wefocus on climate-related vulnerabilities because climaticevents in these lands, particularly droughts, trigger frequentsubsistence crises - sharply increasing crop failures, disloca-tion, hunger and famine. The cycle of drought also, throughthe dislocation process and impoverishment of some andthrough speculative profits and concentration by others,increases stratification and the social inequities that helpshape chronic deprivation and vulnerability (Watts 1983a).This volume focuses on the semi-arid tropics - those semi-arid lands in the developing world - because it is here that thecrisis is most acute and where the need for change is mostimmediate. While there is vulnerability to material loss in thetemperate semi-arid lands - such as the southwest UnitedStates, no one starves when drought strikes. But drought ofthe same magnitude in the semi-arid tropics of NortheastBrazil or the Sahel is likely to result in hunger or famine, andwould certainly result in widespread human misery. Indeed,
1

INTRODUCTION
it is in the semi-arid tropics where drought and povertycollide. It is here that the processes of underdevelopmentundermine the coping abilities and resilience of entire popu-lations. This introduction focuses on how the contributingauthors understand the causes of vulnerability, because it isthrough understanding these causes that the impacts asso-ciated with climate can ultimately be reduced.
The chapters of this volume were drawn from the morethan 70 papers presented at the International Conference onthe Impacts of Climate Variability and Sustainable Develop-ment in Semi-Arid Regions (see Preface). The papers werechosen for their broad historical perspectives on vulner-ability and social response as well as for a wide geographicalrepresentation. The conference was an effort on the part ofsocial scientists, climatologists, policy analysts and policymakers to examine, find solutions for and bring attention tothe common problems faced by the peoples of semi-aridlands - the most dramatic of which are associated withclimatic phenomena. Conference participants were asked toexamine the past consequences of and responses to climatevariability and, given these past experiences, to reflect on thelikely effects of and possible proactive policy responses to thetypes of climatic events that global warming might bring.Nations and peoples of the semi-arid regions of the worldhave long histories of planning for, coping with, rebuildingafter, and responding to variations inherent in their climates.The chapters in this volume recount some of these historiesand reflect on the future of the semi-arid lands of the least-developed countries.
The stories in this volume follow different Severinosthrough different places and times - the Tlaltizapan region ofMexico, Machakos district of Kenya, Northwest China,Australia's Eyre Peninsula, Northeast Brazil and Amazonia,and the Midwest United States - to better know the variousaspects of vulnerability and responses to it. These casestudies address our questions by examining past experienceso that we can respond now to reduce the vulnerability ofcurrent and future generations.
THE CAUSAL STRUCTURE OFVULNERABILITY
Climate impact analysis is a way of looking at the range ofconsequences of a given climatic event or change (Rosenz-weig and Parry 1994; Rosenberg and Crosson 1992). Forinstance, drought, however defined, is associated with anumber of outcomes. Impact assessments begin by mappingout direct physical consequences of a climatic event orchange, such as: reduced crop yields; livestock losses; reser-voir depletion; hydroelectric interruptions; drinking-watershortages or quality changes; dryland degradation; or forest
dieback. These direct outcomes can then be traced to socialconsequences, such as: forced sales of household assets orland; further ecological losses such as soil erosion anddeforestation from people trying to cope with the other lossesby drawing more heavily on their remaining naturalresources, speculative price rises driving food prices out ofthe range of the poorest households, dislocations resulting inout-migration to shanty towns and farther frontiers, desti-tution or servitude; disease outbreaks; hunger; or famine.
But it is misleading to designate these outcomes as'impacts' of climate variability or change. This type of impactanalysis implicitly attributes to nature causality that can bedirectly and more productively traced to social organization.'Vulnerability' analysis (see Downing 1991, 1992; Ribot,Najam and Watson, this volume) provides a basis for tracingout social causality. Vulnerability analysis turns impactanalysis on its head by examining the multiple causes ofcritical outcomes - dislocation, hunger, famine - rather thanthe multiple outcomes of a single event (Downing 1991,1992). It traces outward from each instance of vulnerabilitythe multiple physical, social and political-economic causalagents and processes. In doing so, it places climatic eventsamong the social and political-economic relations and pro-cesses that shape the negative consequences with which weare concerned. By linking climate-associated 'impacts' (oroutcomes) to causality, vulnerability analysis can alsoprovide a sound basis for policy, since it is through respond-ing to its causes that vulnerability can be redressed.
The methods for analysis of vulnerability - developedfrom the work of Amartya Sen (1981) - lay the groundworkfor examining causality in a systematic way. Sen (1981,1987), examining vulnerability to hunger and famine, beginsat the household level with what he calls entitlements. Ahousehold's food entitlement consists of the food that thehousehold can obtain through production, exchange, orextra-legal legitimate conventions such as reciprocal rela-tions or kinship obligations (Dreze and Sen 1989). A house-hold's assets, or endowment (cf. Dreze and Sen 1989),include investments in productive assets, stores of food orcash, and claims on other households, patrons, chiefs,government or on the international community that a house-hold can make (Swift 1989:11). 'Assets create a bufferbetween production, exchange and consumption' (Swift1989:11). They form the basis of a household's entitlements.In turn, assets depend on the ability of the household toproduce a surplus that they can store, invest in productivecapacity and markets, and in the maintenance of socialrelations (cf. Scott 1976; Berry 1993).
Vulnerability in this framework is the risk that the house-hold's entitlements will fail to buffer against hunger, famine,dislocation or other losses. It is a relative measure of thehousehold's proneness to crisis (Downing 1991).1 The power

MOVING FORWARD BY LOOKING BACK
of this analytic framework is that from each instance ofentitlement failure - i.e. each instance in which a household'sproduction, investments, stores and claims are insufficient tosustain them - chains of causality can be traced out. From anunderstanding of causality, we can move toward policies toreduce the vulnerability which is located at the confluence ofthese causal chains (cf. Jessop 1990:13).
Through a household perspective on vulnerability,climatic and other environmental phenomena can be under-stood socially. By focusing on the household, Sen (1981),concerned with entitlement failure, and Blaikie (1985), con-cerned with environmental change, have replaced ecocentricmodels of natural hazards and environmental change withsocial models in which environmental fluctuations andchanges - in climate, forests or soils - are located among theother material and social conditions shaping and shaped byhousehold wellbeing (see Watts 1983&). By incorporatingenvironment (including climate) into a social framework, theenvironment may appear to become marginalized - set as oneamong many factors affecting and affected by production,reproduction and development. But this does not diminishthe importance of environmental variability and change.Indeed, it strengthens environmental arguments by making itclear how important, in degree and manner, the quality ofnatural resources is to social wellbeing. These household-based social models also illustrate how important it is thatassets match or can cope with or vary with (as in bufferagainst) these environmental variations and changes so thatthe activities of production and reproduction on the land arenot undermined by and do not undermine the naturalresources on which they depend.2
Watts and Bohle (1993), extending Dreze and Sen's (1989)analysis of entitlements, argue that vulnerability is con-figured by the mutually constituted triad of entitlements,empowerment and political economy. Here, empowerment isthe ability to shape the political economy that in turn shapesentitlements. Dreze and Sen (1989:263) have empiricallyobserved the role of certain types of political enfranchise-ment in reducing vulnerability, particularly the role mediacan play in creating a legitimation crisis in liberal democra-cies. Watts and Bohle have situated Dreze and Sen's analysisin a broader theoretical framework, allowing for a moresystematic analysis of the political economy of the produc-tion and reproduction of vulnerability. Their analysis illumi-nates the role of empowerment through enfranchisement inredressing the inequities ongoing political-economic pro-cesses produce.
The chapters in this volume, by examining the causes ofvulnerability in their historical context, place vulnerability inits broader social and political-economic context. While theydo not use the terminology of vulnerability (e.g. entitlements,enfranchisement, empowerment, capabilities), they show
causal relations in the historical and contemporary produc-tion and reproduction of vulnerability at the level of the state,region, community and household. They show drought,floods, commodity price fluctuations and conflict as trigger-ing crises, while locating the causes of vulnerability in theface of these events in the longer-term production of vulnera-bility through state policies, class relations, and demographicshifts. The chapters by O'Brien and Liverman, Wang'ati,Zhao, Glantz, Heathcote, and Bitoun, Guimaraes andAraujo show how state policies - ranging from spatial andclass inequalities in colonial and contemporary develop-ment, land-tenure and economic arrangements, to supportsfor the occupation of marginal lands - have played majorroles in both security and vulnerability through their effectson resource access and population movements. They touchon the ways in which state development policies and pro-cesses have relegated some regions or classes to highervulnerability while aiding others. In their cases, vulnerabilityhas been shaped through the allocation of state funds andthrough the structuring of class-differentiated access toalternative income-generating opportunities and access toproductive resources such as land, irrigation, credit, fertilizerand improved seed. O'Brien and Liverman, Glantz, andHeathcote also discuss the production of vulnerabilitythrough forces pushing and pulling people of particularclasses down the rainfall gradient into more and moremarginal lands, while Wang'ati cites population growth (inthe absence of alternative employment opportunities - cf.Dreze and Sen 1989), in addition to population movements,as contributing to vulnerability. But, while state action andinaction, in addition to broader forces of differentiation andmarginalization, may be responsible for producing much ofthe vulnerability faced by marginal populations, Ribot,Najam and Watson, Wang'ati, Zhao, Glantz, Heathcote,and Wilhite also argue that it is through state interventionthat vulnerability can ultimately be reduced.
Taking crises that are often construed as impacts ofclimate extremes and tracing their causes, through vulnerabi-lity, to the social and political-economic system in whichagricultural and pastoral households are located is a first stepin moving toward durable policy responses. The chapters ofthis volume, outlined below, take a major step in the direc-tion of linking climate-associated crises to social cause, andhence, potential response.
ORGANIZATION AND CONTENTS
The volume is divided into four parts. Part I is an overview,outlining the issues facing the populations of semi-arid lands.Part II consists of four country case studies examining thepast responses to climate variability and potential conse-

INTRODUCTION
quences of climate change. Part III includes three chapterswith diverse objectives but all exploring the historical devel-opment - that is the causes - of climate-related vulnera-bilities, or strategies for reducing the vulnerability to andimpacts of extreme climatic events. Part IV contains theDeclaration of Fortaleza, hammered out by the participantsof the International Conference on the Impacts of ClimateVariability and Sustainable Development in Semi-AridRegions (ICID), and the working group summaries thatserved as a starting point for conference-wide discussions.The volume and the papers within it are outlined brieflybelow.
Part I is a synthesis chapter, 'Climate variation, vulnera-bility and sustainable development in the semi-arid tropics,'in which Jesse C. Ribot, Adil Najam and Gabrielle Watsontease out some overarching themes from the 76 papers andpresentations at ICID. The authors focus on the relationbetween impacts and vulnerability and on the policy ramifi-cations of vulnerability analysis. Impact assessment canindicate the types, distribution and magnitude of conse-quences of climatic events. It does not, however, automati-cally lead to relevant policy recommendations unless it iscoupled with an analysis of the social causes of climate-related vulnerability. The object of vulnerability analysis is tobridge the gap between impact analysis and policy formula-tion by directing policy attention to the root causes ofvulnerability rather than to its symptom - the negativeoutcomes, 'impacts', that follow triggering events such asdroughts. This chapter also reviews and discusses definitionsof drought, dryland degradation, desertification, climatevariability and climate change, as well as the main problemsinvolved in projecting climate change and its implications. Inaddition, the chapter sketches the main technical and institu-tional policy options that appear in the papers from theconference.
Part II, 'Climate variation, climate change and society,'consists of case studies of past responses to climate variabi-lity and potential consequences of climate change in Mexico,the countries of the African Sahel, China and Australia. Inthis section's first chapter 'Climate change and variability inMexico,' Karen O'Brien and Diana Liverman discuss theincrease in vulnerability to the consequences of droughtunder colonial rule, and its persistence in present agriculturalarrangements. They examine the probable consequences ofglobal warming with attention to the social underpinnings ofclimate-related vulnerability.
O'Brien and Liverman provide evidence linking pastfamines with drought, social unrest, speculative price rises,colonial economic and land-tenure arrangements, and thecolonial political economy. They then show that currentvulnerability is a function of the different agricultural prac-tices associated with farm size - a relationship rooted in the
colonial land-tenure system - hence linking vulnerabilitywith political economy. They point out that the worst effectsof drought have been observed in the rainfed agriculturalareas cultivated by the poorest ejidatarios and campesinos,who have limited access to credit, irrigation, fertilizers andimproved seeds. Hence, past and present vulnerability isclosely linked with the political-economic circumstancesfaced by different classes of farmers in different geoclimaticregions, and small farmers tend to be the most vulnerablegroup.
O'Brien and Overman's research also shows that drought-related crop losses have increased over the past four decades.This increase is only partly due to the mere extension ofcultivated area, since the percentage of losses has alsoincreased with time. The increased percentage probablyreflects the expansion of agriculture onto more marginalland, since these losses have not been associated with anyincrease in the intensity of weather extremes. Thus, theseincreased losses probably reflect increased vulnerability for aparticular class of small farmers on marginal lands (cf.Glantz, this volume; Heathcote, this volume).
The authors also compare the five most prominent climatechange projections for Mexico and systematically examinetheir limitations and implications. They apply the climatemodel results to a more detailed study of the Tlaltizapanregion, and find that 'in spite of differences between theclimate model results, the general direction of changes inMexican maize rainfed and irrigated yields with globalwarming is a decrease, whatever the model. Sensitivityanalysis indicates that decreases in crop yields will be severeunder global warming unless irrigation expands, fertilizer useincreases, or new varieties are developed.' The ramificationsare clear. If we expect the climate to warm and if we havereasonable confidence in the climate models, the 'unless'must be taken seriously. But, even without climate change, asthe authors demonstrate through historical analysis, imple-menting such measures to reduce vulnerability is alreadyneeded.
Fredrick J. Wang'ati's chapter, 'The impact of climatevariation and sustainable development in the Sudano-Sahe-lian Region,' examines past climate-related trends and exper-iences, the evolution of socioeconomic indicators in theregion, and proposes a strategy to increase ecological sus-tainability and reduce subsistence vulnerability throughlocally based organization and innovation. In the Sudano-Sahelian region, the dry and highly variable climate is amajor factor shaping ecological and socioeconomic pro-cesses. Wang'ati locates the causes of climate-related vulner-ability in population growth, reduced mobility of pastoralgroups, international conflict and changes in land-tenureregimes. He also cites inadequate traditional technologies, alow level of economic development and the lack of alterna-

MOVING FORWARD BY LOOKING BACK
tive income-generating opportunities as contributingfactors. These factors have conspired to push permanentsettlements onto previously only intermittently usedmarginal land.
According to Wang'ati the trends in Kenya's 'key vari-ables' show that rainfall is declining, forest resources, foodproduction and economic indicators are on the decline, andimport dependence is increasing. But in the midst of theseominous macro trends, Wang'ati examines the very success-ful case of development in Machakos district of Kenya.Local-level analysis reveals that productivity and ecologicalmanagement have evolved favorably over the past 60 years.In Machakos in the 1930s colonial officials doubted whetherthe district could feed itself. Since then the growing popula-tion has evolved a complex farming system which appears tobe sustainable and even produces enough to export someproducts. Wang'ati attributes these positive outcomes to theslow and systematic evolution and development of locallybased farming and pastoral systems along with the emer-gence of farmers' organizations. The case demonstrates thecapacity for some semi-arid lands to support greater popula-tions, increase productivity and contribute to the nationaleconomy. It also could support the hypothesis that popula-tion pressure can lead to innovation and development, ratherthan ecological collapse (Boserup 1988). It is interesting tonote how macro-level variables were unable to capture thelocal-level diversity and dynamics that might contain theseeds for success on a broader scale. The inconsistency in thiscase illustrates how important it is to choose the scale ofanalysis, as well as intervention, with great care. Relying onoverly general indicators alone can mask both problems andpotentials.
From this and other cases, Wang'ati draws some recom-mendations for what he calls a 'sustainable developmentstrategy' (SDS). His strategy follows from the simple tenetsthat sustainable development must build on existing success-ful resource management strategies, and that developmentshould proceed by progressive improvements on provencoping strategies. He argues that wholesale changes in landuse and large-scale projects should be avoided in favor ofgradual, or 'stepwise' community-based improvements.While Wang'ati does not use the language of vulnerability -entitlements, political economy and empowerment - thesestepwise, locally based, locally organized improvementsreflect the importance and role of empowerment. The peopleof Machakos are enfranchised to proceed as they see fit. Theyhave been able to use this freedom to shape the institutionsand activities that underpin their wellbeing.
On a national scale, Wang'ati asserts that SDS shouldinclude the creation of urban income-generating opportuni-ties so that rural-urban migration can be a positive way tohelp relieve excessive pressures on semi-arid lands. In addi-
tion, development of alternative agricultural and non-agri-cultural rural livelihood systems, research on drought-resist-ant crops, improvements in marketing and transportinfrastructure, increased interstate trade, greater rural reten-tion of added value, and increased diversity of crop andeconomic activities are all part of Wang'ati's sustainabledevelopment recommendations. Again, these are all movesto support from the state's side the enfranchisement of ruralpopulations - by providing access to resources and liveli-hood options. Through these opportunities, and withincreased savings, local populations can build their entitle-ments, ultimately reducing their vulnerability.
In 'Climate change and sustainable development in Chi-na's semi-arid regions' Zong-ci Zhao characterizes theclimatic conditions, natural resources, economic producti-vity and populations of China's semi-arid northwest. Zhaoalso outlines some major changes in these variables andclimate-related problems facing development of the region.This chapter is unusual in that Zhao has at her disposaltemperature measures dating back 500 years and infor-mation on drought and floods for more than 2000 years. Herrecent data show that in the last 40 years the local climate haswarmed between 0.5 and 1.8°C. Regional climate modellingexercises show that warming will continue; however, as inother chapters, the uncertainties are too great to drawconclusions.
Zhao demonstrates that China's semi-arid lands are harsh.She leaves us with the somewhat pessimistic regional adage:'Eat your fill in summer, grow fat in autumn, get thin inwinter, and die in spring.' But, she also leaves us with thesense that the region has enormous potential for develop-ment. China's semi-arid regions have been a target fordevelopment as the central government regards them as apopulation pressure valve for the overpopulated South andSoutheast (quite the contrary of the role of Brazil's semi-aridNortheast: see Bitoun, Guimaraes and Araujo, this volume).As such, government policies have encouraged migrationinto this region. Zhao points out that not only are there solar,wind, hydro and mineral resources, but there are enormousexpanses of uncultivated land into which she suggests farm-ing could be expanded. There are also great expanses ofgrazing land. But to use them sustainably could be riskywithout appropriate measures. Indeed, deterioration of cur-rently utilized grasslands of Northwest China still must beturned around through water and soil development andconservation.
This chapter compels us to ask how vulnerability to cropfailures, hunger and famine are different in a centrallyplanned nation where land is presumably already equitablydistributed (cf. Przeworski 1990). How does the social struc-ture of vulnerability differ from non-centrally planned Mex-ico, the African Sahel and Brazil's Northeast? Whose

INTRODUCTION
decisions shape the relative vulnerability of different socialgroups and livelihoods within semi-arid China, and how?Zhao's comments also indicate how critical governmentdecisions are in making these 'marginal' lands more pro-ductive in marked contrast to the examples given by Heath-cote and by Glantz in their chapters. Here is a clear exampleof the critical nature of state political economy, throughpolicy decisions, in shaping vulnerability or security in theselands. In the language of vulnerability, a centralized statecontrol over political-economic relations of access and de-velopment would be inversely related to the degree of localempowerment and enfranchisement in shaping localentitlements.
R. Les Heathcote, in his chapter 'Settlement advance andretreat: a century of experience on the Eyre Peninsula ofSouth Australia,' tells the story of the clearing and occupa-tion of South Australia's semi-arid Eyre Peninsula, and ofresponses to and perceptions of climate-related land use andland quality changes. By carefully reviewing the past 100years of public records and evaluating data available onclimatic, ecological and economic conditions, he brings outthe primary variables involved in sustaining the region'sagricultural viability. In this region, periodic droughts asso-ciated with the fluctuating economic fortunes of a regionproducing grains and livestock for an international markethave created stresses which have led, in part, to conditionsthat exacerbate the desertification process. Governmentshave played various roles, ranging from that of real-estatebroker through to steward of the national environment. Thegeneral trend has been toward increased and more central-ized government control over land use. These state policieshave generally supported the family farm, which remains theregion's basic form of productive unit. Heathcote argues,however, that growing costs of production and diminishingreal income have pushed producers to gamble increasinglywith the seasons and with the ability of the environment torecover from drought-related deterioration.
Heathcote's study shows that farm households are vulner-able to ecological decline - that is the undermining of theirproductive entitlements, of which the ecological base is one -in the face of economic as well as climatic fluctuations.Farmers on the Eyre Peninsula had to increase the areafarmed or intensify farming during periods of low farm-product prices. Here, farm viability is a function of the cropyield per hectare necessary to break even. When prices dropso low that yields must exceed the sustainable productivecapacity of the land, debts are incurred, forcing farmers tointensify farming and 'mine' the land.
This chapter locates the causes of farmers' vulnerabilityand related land degradation - which occur in the face offluctuations of factor markets and climate - somewherebetween state policies supporting settlement on these landsand the risk-taking these policies facilitate. Contrary to the
notion that state support and development initiatives reducevulnerability, Heathcote's case study implies that state sup-port encouraged farmers to settle these marginal lands -supporting Glantz's arguments (this volume). The assump-tion of part of the risk by government reduced risk to thefarmer while increasing the potential economic losses tosociety, or the nation as a whole. While some types ofvulnerability may have increased, it is possible that vulner-ability to hunger, famine and dislocation were reduced.Whether the economic losses associated with farm failures inthis region were worth the broader economic and socialbenefits of producing on these lands appears still to be anopen question. It is also an open question as to why govern-ment intervened here in the first place. Is this an instance of arelatively empowered and enfranchised population beingable to make claims on government, shifting risk fromthemselves and their bodies - as in risk of hunger or famine -to a more economic form of risk shared by governmentinstitutions?
Part III of this volume, 'Climate variability and vulner-ability: causality and response,' includes chapters exploringthe causes of climate-related vulnerabilities, as well as pastand potential policy responses. The first of these chapters,'Drought follows the plow: cultivating marginal areas,' byMichael Glantz, argues that contrary to beliefs of the pastthat rain would come to those areas brought under cultiva-tion, new lands brought under the plow are drought-prone.Glantz argues that this is because all the world's best rainfedagricultural land is already in use. Hence, the only new landsavailable for farming are, by necessity, lower quality andhigher risk. Putting forth this hypothesis, Glantz thendescribes conditions, illustrated by cases in Africa, Brazil andAustralia, under which populations end up in the precariousposition of farming drought-prone lands. The conditionsGlantz describes include 'push' and 'pull' factors. Populationgrowth, environmental degradation and particular govern-ment policies constitute pushes into more marginal, dryerlands, while the attraction of good growing conditionsduring unusually wet periods constitutes the pull.
As do O'Brien and Liverman and Heathcote in theirchapters, Glantz is challenging the relative importance ofchanging climate as a causal factor in increased incidence ofdrought and its associated consequences. He is exploring therelative importance of social effects in shaping the negativeoutcomes usually associated with climate. Glantz is effec-tively posing the following hypothesis: What is being read asincreased frequency and intensity of droughts is really anindicator of greater numbers of people farming moremarginal lands - that is, the location of human populationswith respect to climate resources helps explain the increasedfrequency and magnitude of negative climate-related out-comes better than do characteristics of climate variability orchange. This formulation directs us to examine more care-

MOVING FORWARD BY LOOKING BACK
fully why populations move into these lands, rather than whythese lands are dry. In short, he is proposing a chain ofcausality of increased vulnerability to climate-relateddisasters that begins with social forces pushing or pullingpopulations into marginal lands and ends with exposure tothe pre-existing conditions of those lands. Hence, to under-stand the increased vulnerability of these populations wemust understand the roots of their need to eke out a living atthis particular margin.
Glantz's formulation begs an additional question, partlyaddressed by Heathcote's exploration here of the effects ofstate policies in Australia and also provoked by Zhao'sassertion in her chapter that agriculture should be expandedonto currently uncultivated lands. The questions are: Whatconditions are necessary to farm and raise livestock in thesedryer, and hence more drought-prone, regions with less risk?What kinds of investments are necessary? What kinds ofsocial security are needed? These questions must be asked,since movement into these areas is under way, and this is oneplace where productive action can be taken. Does Zhao'srecommendation have to increase vulnerability, as in Heath-cote's and Glantz's cases, or can measures be taken thatassure low levels of vulnerability in these dryer lands. Withproper state interventions, or local initiatives, as shown byWang'ati's case study, secure and sustainable farming couldperhaps be integrated into these regions. This latter questionlinks the causes of vulnerability to the lack of action - stateand local - and the social and political-economic conditionsthat systematically bias against or prevent investment, andproducer organization and innovation, in marginal landsoccupied by marginalized populations. That is, what shapesstate or private investment in these lands and what preventsor facilitates those living there using their resources, knowl-edge and capabilities to reduce their own vulnerabilitythrough adaptation and innovation (see Deere and de Janvry1984; Blaikie 1985)?
In essence, Glantz's formulation points out that margina-lity and drought-proneness are partly inherent characteris-tics of place, with the social forces and causes of vulnerabilitybeing linked to the reasons people arrive in these places. Yetthe types of social organization - such as the cooperativefarming in Machakos described by Wang'ati - or the avail-ability of infrastructure, ranging from irrigation and exten-sion services to marketing facilities, social security systems orcredit, are also essential determinants of whether these'marginal' lands can be productively and securely farmed (cf.Zhao, this volume; Wilhite, this volume). Perhaps, onceagain, this is a function of how well the populations of theselands can retain their income locally, or make claims on stateinstitutions - both of which are issues of economic andpolitical enfranchisement.
Jan Bitoun, Leonardo Guimaraes Neto and Tania Bacelarde Araujo's chapter, 'Amazonia and the Northeast: the
Brazilian tropics and sustainable development,' examinesthe history of the relation between Brazil's semi-arid North-east and humid Amazonia - two regions linked more by theirgeographical, economic and social marginality within Brazilthan by their physical characteristics. The authors argue thatBrazil's more economically developed Southern and south-eastern region shaped development in the Northeast andAmazonia, as well as the relation between them, throughsystematic biases in the perception of the national role of,and hence the policies toward, these regions. The authorslocate the causes of environmentally unsustainable relationsbetween peasants and the land in the inequitable develop-ment policies resulting from these political, economic andideological biases.
The authors make four critical points in their analysis.First, sustainability of the Amazon cannot be consideredseparately from the broader geographical, social and politi-cal-economic context in which the Amazon is located; part ofthis context is Amazonia's close relation to the semi-aridNortheast from which much of Amazonia's population hasmigrated. Second, the Amazon and Northeast Brazil areintegrally linked, since without proper development in theNortheast - capable of curbing out-migration - the flow ofcolonizers from the Northeast into the Amazon will continueto undermine the Amazonian economy and ecology eitherdirectly or via the South and Southeast. Third, unequalnational-level development policies have supported inequi-table relations of production in these two regions and haveundermined, rather than supported, ecologically sustainablepractices. Last, the conjuncture of recent developments inawareness of the importance of locally rooted development,national and international attention to ecological concernsin the development process, and recent media focus onAmazonia, has created an opening in which to examinedevelopment strategies suitable to the Amazon and North-east and compatible with the national development agenda.But the authors warn that development in the region will notbe sustainable until it addresses land distribution and laborissues, and challenges the deeply rooted agrarian structuresthat remove surpluses from local producers, thus precludingthe reinvestment of resources into the maintenance anddevelopment of ecologically sound agricultural practices. Inaddition, they point out that ecologically sound developmentproposals 'will not be viable if political and interregionalconsiderations are not analyzed, along with the economicand technological criteria.'
These authors locate the causes of and responsibility forenvironmental decline and human vulnerability at the levelof national political economy. They also show that the lackof development in one region - which they attribute togeographically inequitable national development policies -can have profound social and environmental repercussionson other regions. This implies that social vulnerability and

INTRODUCTION
environmental decline must be addressed on the geographi-cal and political-economic scales that shapes them. It alsoimplies that the vulnerability of regions is interconnected:those interested in preserving the Amazon will have to attendto the development of surrounding regions if they are to stemthe influx of landless farmers.
Donald A. Wilhite's chapter, 'Reducing the impacts ofdrought: progress toward risk management' documents animportant transition taking place in government response todrought from one of crisis management to one of riskreduction. After illustrating this transition with cases fromthe United States of America, South Africa and Australia, herecommends a procedure for developing and implementingintegrated drought policies and plans. The chapter demon-strates the importance of proactive planning for reducingdrought impacts, and the relatively low cost of planningcompared with the high economic, human and environmen-tal costs of a late or inadequate response. Wilhite's proactiveprogram develops an approach to crisis planning andtouches on the notion of vulnerability reduction. This is anappropriate chapter to close this section, since it is aboutwhere to go from here. It is about points of entry intoreducing both vulnerability to and impacts of the expectedbut unpredictable normal variations of our climatic resource.
Part IV of this volume, The International Conference onthe Impacts of Climatic Variations and Sustainable Develop-ment in Semi-Arid Regions,' presents the collective efforts ofover 600 social scientists, physical scientists, politicians anddiplomats from 46 countries to state clearly the commonproblems, needs and prospects of the semi-arid regions of theworld. These efforts are embodied in the 'Declaration ofFortaleza' and the findings of the ICID Working Groupsinto which conference participants divided and from whichthe first draft of the Declaration was formulated. TheDeclaration was circulated and a final draft hammered out inan animated set of debates in the final plenary meeting. Thecontents of these documents are too varied to flesh out here,but they speak for themselves, and the participants of ICIDhope they also speak to the concerns of the peoples who livetheir lives in semi-arid regions around the world.
USES OF HISTORY: PUTTINGVULNERABILITY IN THE PAST
Vulnerability to hunger, famine, dislocation or material lossresults from the dynamics of the social system in whichagricultural and pastoral households are located. Vulner-ability is shaped by ongoing processes of social differentia-tion and marginalization, within a specific social history ofaccess to productive resources, formal and informal socialsecurity arrangements, state development policies, conflicts,etc. The resulting distribution of material stocks and of
access to income opportunities, land and other materialresources, as well as access to formal and informal socialsecurity arrangements, spells out the material and socialconditions circumscribing vulnerability for some householdsand security for others. Climate extremes may trigger subsis-tence crises, but these crises come at the confluence ofhistorical processes, as well as actions and events that makeindividuals, households, enterprises or regions vulnerable.
Vulnerability must be examined with an eye to vulner-ability reduction. First and foremost, vulnerability must beunderstood by examining its historical antecedents - this isan essential part of the switch from impact analysis tovulnerability analysis (Downing 1991; also see Ribot, Najamand Watson, this volume). In examining historical antece-dents we must ask: What types of processes and events causevulnerability? What can be done to reverse deleteriousprocesses and buffer against crisis-triggering events? Whichprocesses are reversible, and which are not? We must alsoask: Which processes can, both technically and politically, bemodified and which cannot? Historical analysis reveals theunderlying causes of vulnerability, but not all these causesare tractable. Here we need to reflect on the uses of history,rather than just retreating into proximate analyses thatignore history, or falling into paralysis by insisting onredressing all of the deepest causal relations at once. Forexample, early warning of the onset of hunger and faminedoes not have to focus on the moments before bodies begin todrop. Relief does not have to come in to avert only the mostacute and horrifying crises. Identifying vulnerability gives uswarnings of acute crisis even years in advance. Understand-ing vulnerability should thus be used to produce moredurable and earlier, proactive responses. The uses of historyin developing these understandings and in formulating res-ponses needs further exploration.
Enfranchisement and empowerment must be part of anypathway for ushering vulnerability into the past. Security isabout having the material resources - entitlements - to bufferagainst contingencies. However, as Dreze and Sen (1989)argue, it is more about the capability21 to achieve foodsecurity and other valued 'functionings,' such as attainingsufficient entitlements. Capabilities are partly predicated onthe rights that allow the pursuit of such wellbeing. Theconcept of capabilities, as Watts and Bohle (1993) state,'approaches the totality of rights by which individuals,groups and classes command endowments and commoditybundles.' It is this formulation of capabilities that links thematerial with the political-economic aspects of vulnerabilityand security. Capabilities, through their basis in freedomsand rights, link entitlements with enfranchisement. In thismanner, enfranchisement becomes a means by which mater-ial wellbeing can be pursued and maintained through inter-vention in political-economic relations and processes.
The entitlement approach complemented by empower-

MOVING FORWARD BY LOOKING BACK
ment and political economy reveals two complementarydirections for vulnerability reduction: (1) redistribution (ofownership and access) and development in the materialrealm, relating to the material basis for entitlements; and (2)enfranchisement in the political-economic domain, relatingto the ability to shape political economy. The political-economic relations that produce vulnerability by structuringaccess to resources and affecting maldistribution throughprocesses of social differentiation and marginalization, couldbe directly confronted by legal reforms over access andredistribution of material wealth. But, because the processesof differentiation, stratification and marginalization areongoing, there needs to be a countervailing set of processes,not just one-time moves to shift access control or redistributeassets. The process of overlapping spatial and social mar-ginalization - marginalizing particular classes of people ontomarginal lands - is, for example, a theme that runs throughthe chapters of this volume. In response, there needs to be aconstant process in which those being marginalized arethemselves constantly able - capable, that is - to reincorpor-ate themselves and make claims that redress the constantproduction of their disadvantaged position. Enfranchise-ment and empowerment provide such ongoing countervail-ing forces. Enfranchisement and empowerment, along withother countervailing mechanisms and forces, are areas stillwide open for theoretical development and empiricalresearch - if vulnerability, rather than the people of the semi-arid tropics, is to be denied a future.
While this introduction focuses on the causes of vulner-ability as they impinge upon the household, other units ofsocial aggregation, such as the community, enterprises, civilorganizations, markets, the state, or regions, can also bevulnerable, and can also be subject to a similar analysis of thecauses of their vulnerability. Vulnerability exists at all levelsof society. In addition, vulnerability of one segment ofsociety influences vulnerability of others. Vulnerable house-holds can render the state vulnerable to a legitimacy crisis, orto a costly set of state emergency interventions. Indeed, astate vulnerable to legitimacy crisis may provide a receptiveforum for households to press the state for vulnerability-reducing goods and services. Each institution must be under-stood in the set of relations in which it is embedded; thisincludes its relation to the vulnerability and security of othergroups within society. This relation among institutions orregions (see Bitoun, Guimaraes and Araujo, this volume),and the interdependence of their security, is another import-ant area for further study.
Vulnerability analysis is a good starting place for rethink-ing rural development.4 It is local by definition: it buildsoutward from the household or whatever specific institutionit focuses on (cf. Vayda 1983; Blaikie 1985; Watts 1987;Schmink 1992). Yet, while both the building and failure ofentitlements occur concretely at this local level, a focus on
vulnerability systematically includes the multiple temporal,spatial and social scales that impinge on the production andreproduction of everyday life. In this manner the local is notconceptually isolated from the global, and the analysis ofvulnerability at each level is constantly referenced back to thesecurity and wellbeing of those at risk. It is this multilayeredanalysis that traces causality outward, through space,through social relations and through history, from which anunderstanding of the conditions for secure and productivedevelopment can grow.
The semi-arid tropics are rilled with Severinos whose livesare harsh even when there are no extreme droughts or floodsand no changes in natural conditions. It is this chroniccondition of deprivation that must ultimately be addressed.Climate variations and extremes are not new - and they maynot even be changing. But, as Glantz argues in this volume,disasters associated with them will be more frequent andmore intense as more people occupy more marginal lands.O'Brien and Overman also point out in their chapter thatthese disasters will increase as the conditions of marginalizedpopulations already occupying semi-arid lands for gener-ations deteriorate - unless development of productive capa-cities proceeds in a timely manner. Those interested inanalyzing or mitigating the 'impacts' of climate in semi-aridlands must begin through attention to causes of and res-ponses to deprivation, underdevelopment, poverty and otheraspects of vulnerability. Underdevelopment, poverty andvulnerability are also not new. There has been much schol-arly thinking on these subjects. It is time to take advantage ofwhat is already well understood and apply it to the crises ofthe present.
Ironically, this volume was launched by concerns articu-lated by those focusing on future climate change. Projectingclimate change into the future, to a time distant enough to befree of commitment to immediate action or change, hasbrought to world attention a chronic tragedy taking place inthe semi-arid tropics today. But hunger, famine, dislocationand material loss can still best be understood and redressedby learning from the past. By enabling current populations tobuffer themselves against today's climatic variations, theywill be better able to cope with future contingencies. Ratherthan focusing on the distant future, we must use the oppor-tunity that the specter of climate change brings to slide backdown the projection lines to point to and address the crisis athand.
ACKNOWLEDGMENTS
I would like to express my gratitude to Alayne Adams, JeanDreze, Michael Glantz and Michael Watts for theircomments on drafts of this Introduction.

10 INTRODUCTION
ENDNOTES
1. Downing (1991, 1992) develops the concept of vulnerability (for asummary see Ribot et al, this volume). Watts and Bohle (1993:46),who take the concept further, define vulnerability as follows: 'Vulner-ability is a multi-layered and multi-dimensional social space whichcenters on the determinate political, economic and institutionalcapabilities of people in specific places at specific times. In this sense atheory of vulnerability should be capable of mapping the historicallyand socially specific realms of choice and constraint - the degrees offreedom as it were - which determine exposure, capacity and poten-tiality. In a narrow sense this is about individual command over basicnecessities; in a still broader sense it also speaks to the structuralproperties of the political economy itself.' Also see Chambers(1989:1), who defines vulnerability as follows: 'Vulnerability refers toexposure to contingencies and stress, and difficulty in coping withthem. Vulnerability has two sides: an external side of risks, shocks,and stress to which an individual or household is subject; and aninternal side which is defenselessness, meaning a lack of means tocope without damaging loss.'
2. Household models are often limited by their failure to account forintra-household dynamics of production and reproduction, but theydo not have to be (see, for example, Guyer 1981; Guyer and Peters1987; Carney 1988; Hart 1992; Agarwal 1993; Schroeder 1992).
3. Capabilities are defined by Dreze and Sen (1989:12ff) as 'a set offunctioning bundles, representing the various alternative "beings anddoings" that a person can achieve with his or her economic, social andpersonal characteristics.' 'While the entitlement of a person is a set ofalternative commodity bundles, the capability of a person is a set ofalternative functioning bundles' (13ff). 'The focus here is on humanlife as it can be led, rather than on commodities as such, which aremeans to human life, and are contingently related to need fulfillmentrather than being valued for themselves' (13). They go on to definecapabilities as 'the extent of the freedom that people have in pursuingvaluable activities or functionings' (42).
4. Also compare with farm systems theory as used by Blaikie (1985).
REFERENCES
Agarwal, B. 1993. Social security and the family: coping with seasonalityand calamity in rural India. Agriculture and Human Values [Winter-Spring] 156-65.
Bernstein, H. 1979. African peasantries: a theoretical framework. Jour-nal of Peasant Studies 6(4): 420-43.
Berry, S. 1993. No Condition is Permanent: The Social Dynamics ofAgrarian Change in Sub-Saharan Africa. Madison: The University ofWisconsin Press.
Blaikie, P. 1985. The Political Economy of Soil Erosion in DevelopingCountries. London: Longman.
Boserup, E. 1988. Environment, population, and technology in primi-tive societies. In The Ends of the Earth: Perspectives on ModernEnvironmental History, ed. D. Worster, pp. 23-38. Cambridge:Cambridge University Press.
Carney, J. 1988. Struggles over land and crops in an irrigated ricescheme. In Agriculture, Women and Land: The African Experience, ed.J. Davidson, pp. 59-78. Boulder: Westview Press.
Chambers, R. 1989. Editorial/Introduction. Vulnerability, coping andpolicy. IDS Bulletin 20(2). Sussex: Institute for Development Studies.
Deere, C. D. and de Janvry, A. 1984. A conceptual framework for theempirical analysis of peasants. Giannini Foundation Paper No. 543,pp. 601-11.
Downing, T. E. 1991. Assessing socioeconomic vulnerability to famine:
frameworks, concepts, and applications. Final Report to the USAgency for International Development, Famine Early WarningSystem Project, 30 January 1991.
Downing, T. E. 1992. Vulnerability and global environmental change inthe semi-arid tropics: modelling regional and household agriculturalimpacts and responses. Presented at ICID, Fortaleza-Ceara, Brazil,27 January to 1 February 1992.
Dreze, J. and Sen, A. 1989. Hunger and Public Action. Oxford: Claren-don Press.
Guyer, J. 1981. Household and community in African studies. AfricanStudies Review 24(2,3): 87-137.
Guyer, J. and Peters, P. 1987. Introduction. Special issue on households.Development and Change 18: 197-214.
Hart, G. 1992. Household production reconsidered: gender, laborconflict, and technological change in Malaysia's Muda region. WorldDevelopment 20(6): 809-23.
Jessop, B. 1990. State Theory: Putting the Capitalist States in TheirPlace. University Park: The Pennsylvania State University Press.
Joao Cabral de Melo Neto. 1966. 'Morte e vida Severina,' in Morte eVida Severina, e otros poemas em voz alta, 32nd edn. Rio de Janeiro:Jose Olympio Press.
Przeworski, A. 1990. Could we feed everyone? Politics and Society 19(1):1-38.
Rosenberg, N. J. and Crosson, P. R. 1992. Understanding regional scaleimpacts of climate change and climate variability: application to aregion in North America with climate ranging from semi-arid tohumid. Presented at ICID, Fortaleza-Ceara, Brazil, 27 January to 1February 1992.
Rosenzweig, S. and Parry, M. 1994. Potential impacts of climate changeon world food supply. Nature 367: 133-8.
Schmink, M. 1992. The socioeconomic matrix of deforestation. Paperpresented at the Workshop on Population and Environment, spon-sored by Development Alternatives with Women for a New Era,International Social Science Council, and Social Science ResearchCouncil, Hacienda Cocoyoc, Morelos, Mexico, 28 January to 1February.
Schroeder, R. A. 1992. Shady practice: gendered tenure in the Gambia'sgarden/orchards. Paper prepared for the 88th annual meeting of theAssociation of American Geographers, San Diego, CA, 18-20 April.
Scott, J. 1976. The Moral Economy of the Peasant. New Haven: YaleUniversity Press.
Sen, A. 1981. Poverty and Famines: An Essay on Entitlement andDeprivation. Oxford: Oxford University Press.
Sen, A. 1987. Research for action: hunger and entitlements. WorldInstitute for Development Economics Research, United NationsUniversity.
Swift, J. 1989. Why are rural people vulnerable to famine? IDS Bulletin20(2): 8-15.
Vayda, A. P. 1983. Progressive contextualization: methods for researchin human ecology. Human Ecology 11(3): 265-81.
Watts, M. J. 1983a. Silent Violence: Food, Famine and Peasantry inNorthern Nigeria, pp. 231-62. Berkeley: University of CaliforniaPress.
Watts, M. J. 19836. On the poverty of theory: natural hazards research incontext. In Interpretations of Calamity, ed. K. Hewitt, pp. 171-212.London: George Allen & Unwin.
Watts, M. J. 1987. Drought, environment and food security: somereflections on peasants, pastoralists and commoditization in drylandWest Africa. In Drought and Hunger in Africa, ed. M. H. Glantz.Cambridge: Cambridge University Press.
Watts, M. J. and Bohle, H. 1993. The space of vulnerability: the causalstructure of hunger and famine. Progress in Human Geography 17(1):43-68.
Wisner, B. 1976. Man-Made Famine in Eastern Kenya: The Interrelation-ship of Environment and Development. Discussion paper No. 96.Brighton: Institute of Development Studies, University of Sussex.

Overview


1: Climate Variation, Vulnerability and SustainableDevelopment in the Semi-arid Tropics
JESSE C. RIBOT, ADIL NAJAM and GABRIELLE WATSON
INTRODUCTION
This chapter aims to capture the central issues that emergedfrom the papers, presentations and discussions at the Inter-national Conference on the Impacts of Climatic Variationsand Sustainable Development in Semi-arid Regions (ICID),held in Fortaleza-Ceara, Brazil from 27 January through 1February 1992 (see Preface). But, given the breadth anddepth of the 76 papers and the wide-ranging discussionsduring the conference, this chapter could cover only a smallsubset of the issues that arose. We chose to focus on the plightof socially, politically, economically and spatially marginalpopulations in semi-arid lands, and the urgent need forenvironmentally sound and equitable development efforts.These themes recurred throughout the papers, presentationsand discussions at the conference.
This chapter draws from the materials and informationpresented at the conference, as well as the broader literaturewhere relevant. While the themes within this chapter arederived largely from the conference, the arguments areshaped - as could not have been otherwise - by the exper-iences and perspectives of the authors. We did not try torepresent the scope nor the depth of the issues covered at theconference, but rather, to characterize the problems andopportunities, and to explore what we felt were the mostpressing concerns within the semi-arid regions of the world.
Climate variability, natural resources and development insemi-arid regions
Vulnerability to dislocation, hunger and famine are the mostcritical problems facing the inhabitants of semi-arid lands.These regions are subject to extreme variations in theirrelatively scant seasonal and inter-annual precipitation,resulting in recurrent droughts and floods. Natural resourcesof semi-arid zones, such as timely water supplies, fertile soils,
vegetation and wildlife, tend to be scarce, and the existingresources are easily damaged by changes in precipitationpatterns and by human action. Many of the semi-arid regionsof the world, particularly the semi-arid tropics, are alsocharacterized by subsistence vulnerability and insecurity forthe large majority of their rural populations in the face ofland degradation and climate variation. Vulnerability, socialand geographic marginality, environmental change and dry-land degradation are central, interlinked and chronicproblems.
Semi-arid regions cover between 13% and 16% of theearth's land area, and are home to approximately 10% of theglobal population (Heathcote, this volume).1 They exist intropical, sub-tropical and temperate zones and fall within orencompass both developed and underdeveloped nations (seeFig. 1). In developed areas, the southwestern United States,and parts of the Western Plains of Canada and the peripheryof the Australian desert are semi-arid (see, for example,Cohen et al. 1992; Rosenberg and Crosson 1992; Schmandtand Ward 1992; Heathcote, this volume). The semi-aridtropics encompass large portions of the least-developedregions on earth. Of the 22 countries of Africa's Sudano-Sahelian region 18 are among the world's least-developednations (Wang'ati, this volume). Brazil's semi-arid North-east is its most economically deprived region (Magalhaes andGlantz 1992). Semi-arid tropics also include Mexico'sCentral Plateau, parts of Argentina, Chile and Uruguay,Central and South India, western China (22% of thecountry), and northern Mongolia (Sen 1987; Dreze and Sen1989; Tie Sheng et al 1992; Zhao, this volume). Many ofthese regions are highly prone to anthropogenic andclimatically related environmental deterioration, while theirpopulations are prone to hunger and famine. Indeed, it is atthis conjunction of climatic variability and underdevelop-ment that human vulnerability and calamitous social dislo-cations are most likely to occur.
13

14 I OVERVIEW
150 120
Arid Region Climates
H B Hyperarid
30 60 90 l i o 150
Figure 1: Arid and semi-arid regions of the world. (Source: Campos-Lopez and Anderson 1983:54.)
While rainfall, droughts and floods are physical pheno-mena, associated socioeconomic consequences (economicfailure, food shortages and outmigration) are linked to theability of affected populations to anticipate, prepare for andrespond to these events. The most striking characteristic ofthe vast majority of the populations inhabiting the semi-aridtropics is their lack of adequate human and financialresources to cope with expected - even at times (with early-warning systems) predictable - variability in their climaticregimes (on early-warning systems, see Nobre et ah 1992;Servain et al. 1992; Wang'ati, this volume). Because of poorhuman, natural-resource and infrastructural development inthese regions, large portions of the population of semi-aridtropics are vulnerable to hunger, famine, dislocation and theloss of both property and livelihood in the face of climatic,social, political or economic shocks. For the most part, theirlives are shaped by chronic job and food insecurity, inade-quate, and in many cases non-existent, health care, lowwages, unemployment, under-employment and illiteracy, allof which tend to amplify the social consequences of naturalphenomena.
Marginality and a low level of economic developmentboth exacerbate and are exacerbated by environmentalchanges such as dryland degradation and deforestation.2
Exploited or marginalized populations are often excludedfrom or bypassed by benefits of the development process,and are pushed against their resource base, further erodingits productive capacity. Mining the land (e.g. using landresources in a manner that reduces productivity in the long
run) often becomes a necessity for those whose immediatesurvival depends on these lands (Bernstein 1979; de Janvry1981; Blaikie 1985; Blaikie and Brookfleld 1987). Those whoare marginalized by the economic process onto the mosteconomically and ecologically marginal lands are the mostvulnerable populations. Under some conditions their mar-ginality intensifies as they, and the marginal lands on whichthey subsist, are exploited beyond their productive capacity.The important question with respect to vulnerability in theface of climate variability and change is why and how thesepopulations are marginalized and, hence, vulnerable. It isthis question that guides our attention to the social determi-nants of vulnerability.
Antonio Rocha Magalhaes (1991:1) brings into focus bothwho is vulnerable and why, when he characterizes the criticalnature of society's relation to the natural environment inNortheast Brazil:
Over the course of history, the economic, social andenvironmental impacts of adverse climatic events,especially droughts, have been calamitous. It is, however,the social dimension that accentuates the climaticproblem in Northeast Brazil, as in many other developingregions. Here it represents a menace for the survival of amajor part of the population because, unlike developedregions, the social agents are not equipped to face theconsequences of adverse climatic events.
This chapter examines problems of the less-developedsemi-arid regions, because these regions are in most urgent

1 CLIMATIC VARIATION, VULNERABILITY AND SUSTAINABLE DEVELOPMENT 15
need of attention. Likewise, we focus on development as thepath toward an environmentally secure and productivefuture.
Climate change
The regional consequences of anthropogenically enhancedglobal warming cannot yet be predicted with confidence. Butsome impacts are probable. Increases in temperature willresult in an increase in evapotranspiration. This increase willbe particularly significant in places where the climate is hotunder current conditions. Whether rainfall in these regionswill increase or decrease remains highly uncertain. But, theInter-governmental Panel on Climate Change (IPCC1990:iii, 12-13, and 20 ff.) indicates that semi-arid regions areamong those areas most likely to experience increasedclimatic stress. Further, climatic change will have as yetunpredictable and perhaps unexpectedly extreme conse-quences with respect to frequency and intensity of precipi-tation and temperature variability for semi-arid regions.
Several regional climate-change scenarios designed toidentify possible implications of global warming for semi-arid lands were generated by climatologists and social scien-tists and presented at the ICID conference. The tremendousuncertainty involved in projecting regional climate change iscompounded by uncertainties in future productive capaci-ties, demographic changes and socioeconomic developmentin these regions (see under Climate Variability and Change,below, for a discussion of these factors). There are nonethe-less lessons that can be derived from climate change simula-tions and scenarios. For Mexico, O'Brien and Liverman (thisvolume) found decreasing soil moisture predicted by allclimate-change models applied to Mexico. If soil moisturedecreases in semi-arid regions, as can be derived from somegeneral circulation models (GCMs) and is assumed in mostof these scenarios, then productivity in these regions willmost certainly decrease in the absence of considerable de-velopment efforts (Magalhaes 1991; Downing 1992; El-Shahawy 1992; Schmandt and Ward 1992; Santibanez 1992;Selvarajan and Sinha 1992; Cohen et al 1992; O'Brien andLiverman, this volume). Most of the scenarios project wor-sening climatic conditions, in the form of more frequentdroughts and shorter growing seasons. Some point to thepossibility of a higher degree of inter-annual climate varia-bility and of unexpected extreme meteorological events suchas cool periods or more frequent floods (Izrael 1992:2-5).For these regions in which planning productive activities isalready difficult due to the high climatic variability, climatechange introduces even greater uncertainties and, thus,greater risks. A better regional understanding of climatechange will help in planning for its consequences. But this isan insufficient policy response to the needs of semi-aridregions. To help cope with future regional uncertainties
generated by climate warming, policy makers must alsoaddress issues associated with current climate variability.Policies to address problems of populations living undercurrent variability will be an invaluable basis for coping andadapting should climate change increase variability ordrought.
Even assuming continued current climatic conditions,semi-arid regions may well be worse off in 10, 20 or 30 yearsdue to the declining productivity of the land and increasingpopulations without access to alternative income-generatingoptions (see, for example, Wang'ati, this volume). Indeed,the magnitude of natural hazard losses has increased in thepast even where meteorological records do not show increas-ing severity of weather events (see chapters by Glantz, byO'Brien and Liverman, and by Heathcote, this volume).Simply projecting dryland degradation, for example, high-lights the need for long-term strategies to stop or reversethese trends in order to improve the productive capacity andsecurity of populations in semi-arid regions. Each year largeareas are being at least temporarily worked to the point ofdeclining productivity (Ocana 1991:3; WRI 1991, 1992).
Today, in the semi-arid regions, vulnerability to the conse-quences of existing climate variation is already a majorproblem. Dryland degradation is widespread and progress-ive, while semi-arid populations are growing. These trendsonly compound the vulnerability of people and of socialsystems. Without addressing current problems, future vul-nerability can only get worse, exacerbated or not by climatechange, making the magnitude of future crises even greater.By addressing today's vulnerability we can increase theability of semi-arid regions to adapt to and cope with the asyet unknown characteristics of a future climate change.Actions taken today to reduce vulnerability - actions whichhave been justified for a long time - will increase resilienceand security by providing a buffer against vulnerability tofuture consequences of climate change. These are called 'no-regrets policies,' since they are valuable actions regardless ofclimate change probabilities.
From impacts to vulnerability and beyond
Climate impact assessment addresses the magnitude anddistribution of the consequences of climate variability andchange. Vulnerability assessment extends impact assessmentby highlighting who (as in what geographic or socioeconomicgroups) is susceptible, how susceptible they are, and why.Clearly these assessments are overlapping and interlinked.For informed policy-making purposes, both are necessaryand neither is sufficient. Vulnerability analysis ensures thatthe assessment of impacts will be extended into the realm ofsocial, political and economic causality that shapes suscepti-bility to impacts. Understanding causality, facilitates appro-priate policy design.

16 I OVERVIEW
Climate impact analysis often focuses on the range ofconsequences of a given climate event. Examining impacts isa way of looking at the range of consequences of a givenstimulus. For instance, drought is associated with a numberof outcomes including reduced crop yield, reservoir deple-tion, hydroelectric interruptions, dryland degradation, andsome second-order effects such as economic loss, hunger,famine or dislocation. This type of analysis helps to focusattention on the range of outcomes associated with climatevariability or change. But it is somewhat misleading todesignate these as climate impacts, since they are usually theresult of a multitude of causal agents. These may include levelof development, market organization and prices, entitlementstructures, access to productive resources, distribution, statepolicies, and local or regional conflicts (Blaikie 1985; Watts1987a; Dreze and Sen 1989; Downing 1991, 1992; Schmink1992). It is some combination of these factors, not thesingular result of drought, that makes a family, household,enterprise, nation or region vulnerable. Vulnerability occursat a conjuncture of physical, social and political-economicprocesses and events. Hence, complete climate impactanalyses must include this multi-causal perspective, placingclimate as one causal agent among many.
Downing (1992) presents a method for analyzing vulner-ability in which he lays the groundwork for examining thisconjuncture in a systematic way. In Downing's framework,vulnerability focuses on consequences such as dislocation,that is, vulnerability to having to migrate to the city or tosome other frontier. Drought might be considered a cause,even a trigger of outmigration. But, outmigration is alsoexamined as a function of such factors as exploitation, thelack of local alternative income opportunities or high foodprices. So, this analysis aims to reveal the range of causes ofthis outcome - which is of particular social concern - ratherthan focusing on the impacts of one of many causes ortriggering events.
Analysis of vulnerability focuses on the relative likelihoodof different socioeconomic groups of geographic regions toexperiencing each outcome. Hence, relative levels of vulner-ability to hunger can be mapped out spatially (see, forexample, Box 3, p. 30), temporally and socially. Spatialfactors might include location on the rainfall gradient or on ageopolitical map, location with respect to transport ormarketing systems, or vis-a-vis soil types and other geo-climatological factors. Temporal factors might include coin-cidence with an economic recession or depression, or perhapsthe particular moment in political or development history ofa region or country. And socioeconomic factors wouldinclude the level of economic development, type of liveli-hood, level of education, political party or socioeconomicgroup (gender, class, ethnic group, caste or religion).
By understanding socioeconomic and political factors
associated with vulnerability, one can begin to trace out thechains of causal forces and relations that impinge on a giveninstance of environmentally related vulnerability, chronicdeprivation or crisis. In the same way that human vulner-ability is shaped by a multitude of causal agents, landdegradation, deforestation and other forms of resourcedegradation are also located within a nested set of causalagents. They too can be evaluated in a similar way (seeBlaikie 1985; Blaikie and Brookfield 1987; Schmink 1992).With an understanding of causality, appropriate policyresponses can be developed to redress the causes of vulnera-bility, rather than just responding to its symptoms.
To address each of the causes of vulnerability or environ-mental decline might require policy interventions at differentlevels. Political-economic and geographical analysis of vul-nerability's causes can be specific enough to allow policies tobe tailored for a specific population, place and problem. Andfinally, since causality can be traced to international,national, household and individual levels, policies can betargeted at the appropriate level if the causes are understood.
In short, the object of vulnerability analysis is to linkimpact analysis to an understanding of the causes of vulner-ability in order to facilitate a meaningful policy process. But,in carrying out such an analysis, one must be extremelycareful not to mix correlation with causality. To map out theproximate vulnerability factors, such as location, livelihood,education and income level, tells only part of the story.Without looking at structural causes, such as the way inwhich the farm economy is embedded within a larger extrac-tive economy, it is difficult to target extractive mechanisms,such as rent structures, sharecropping contracts, usuriouscredit arrangements, terms of trade and tax structures ascauses of vulnerability and environmental decline (de Janvryand Kramer 1979; Deere and de Janvry 1984; Bitoun et ai,this volume). Hence, to reduce vulnerability, policy analystsmust go beyond identifying its proximate causes to evalu-ating the multiple causal structures and processes at theindividual, household, national and international levels.
We highlight this aspect of climate impact analysis since it(1) allows for a multi-level, multi-sectoral policy analysis,and (2) facilitates the analysis of both proximate causalfactors and the broader political-economic forces that shapevulnerability.
Toward ecologically sound development
Access to education, employment, credit, licenses, markets, ahealthy environment, land and labor are integral for devel-opment. Those on the social and geographical margins needto be able to diversify their income-generating activities inorder to reduce their vulnerability. They need an incomesufficient to invest in the maintenance of their land and in the'

1 CLIMATIC VARIATION, VULNERABILITY AND SUSTAINABLE DEVELOPMENT 17
stocking of buffers against adverse climatic events, as well asin non-climate-dependent production and survival strate-gies. The inability of peasant farmers to save and obtainnecessary productive resources is a primary structural con-straint on their ability to maintain and improve marginalagricultural land. Hence, poor access to infrastructure,inputs, markets, land and credit must be redressed in order toreduce or reverse the rural ecological decline currently underway in much of the semi-arid tropics around the globe. But,given that the processes of differentiation and marginaliza-tion that produce the current distribution of assets andpatterns of access are ongoing, changes in access must beaccompanied by political access to assure that resourceaccess is maintained. They must be accompanied by enfran-chisement and inclusion in the political processes (see Drezeand Sen 1989; Watts and Bohle 1993).
An important strategy for relieving a population's pres-sures on the land and raising rural and urban incomes is tosupport the development of diverse income-generatingopportunities. Diversification of local economies also buffersagainst severe climatic events. In some regions this may meanfostering existing local productive activities or small-scaleenterprises, and in others, encouraging regional pockets ofindustrialization. Such development is aimed at relieving thelocal pressures on the resource base and building a bufferagainst the inherent climatic variability of these regions. Butdiversification and development will accomplish little if theprofits they generate are extracted from the regions and/orconcentrated in the hands of a few.
International assistance may be needed for some types ofdevelopment programs, as well as for avoiding potentialecological problems stemming from development in theseregions. In addition, rising greenhouse gas emissions in theseregions may need to be offset by reduced emissions or byforest-augmented sequestering elsewhere, such as in theindustrial nations of the world. Given the severity of theexisting problems the inhabitants and governments of theseregions face, they will only be able to address these second-ary, less immediate problems of industrial pollution and theemission of greenhouse gases by developing industries withoutside assistance. With increased levels of development, thecapacity to treat and prevent environmental problems andsocial vulnerability will increase, and these regions may thenmove in the direction of more environmentally sound econ-omic-development strategies.
Conclusion
It is important to reduce the emission of gases that areprojected to change the world's climate. It is also importantto evaluate how that climate change will affect future popula-tions and the future sustainability of the productive natural-
Table 1. Land area within arid and semi-arid zones indeveloping regions (%)
Arid andsemi-aridlands
Semi-aridlands
Africa
66
16
CentralAmerica
60
22
SouthAmerica
31
17
SEAsia
33
21
SW Asia,Middle East
80
12
Source: Adapted from WRI (1990:287).
resource base. But it is equally, if not more important toexamine the current environmental degradation and thelivelihood insecurity of the vast majority of people living inthe world's semi-arid lands. For today's environmentaldecline will increase tomorrow's vulnerability. Today's vul-nerability will reduce tomorrow's resilience. Today's under-development will undermine the potential for increasingfuture resilience, productivity and development.
There is an old solution to the problems these regions face,and that is development. But this new development effortmust occur within the ecological constraints. These con-straints are integrally linked to the wellbeing of the mostmarginal people in these lands. There are numerous technicaland institutional measures that can be taken to amelioratecurrent problems, most of which are worth while evenwithout the specter of global warming - these are the 'no-regrets' strategies. But ultimately, addressing the struggles ofthe most vulnerable populations in semi-arid areas is whatwill help them move beyond 'no regrets' to more far-reachingenvironment and development policies.
The remainder of this chapter is organized into foursections. The first is Semi-arid Regions, in which the charac-teristics and problems of semi-arid lands are discussed. Thesecond is Climate Variability and Change, which outlines themodels and their limitations. The third is Responses, inwhich some approaches and options for development insemi-arid lands are discussed. A brief conclusion follows.
SEMI-ARID REGIONS
Characteristics
Semi-arid regions are characterized by dry, warm-to-hotextensions of land with low and erratic rainfall, thin andnutrient-poor soils which are prone to salinization, andlimited or discontinuous natural vegetation cover (see Fig. 1,depicting the semi-arid regions of the world, and Table 1,showing the proportions of the developing world's land areas

18 I OVERVIEW
Sub-Saharan rainfall index
I
1940 1950 1960 1970 1980
Figure 2: Twenty-year precipitation phases in the Sahel. (Source: Glantz 1989:49.)
that are arid and semi-arid). Drought events, or periods ofprolonged dry spells, are inherent characteristics of semi-aridregions. While some semi-arid regions experience season-to-season dry spells, in other semi-arid regions, the dry and wetcycles are much longer, with dry periods extending over anumber of years (see, for example, Fig. 2, showing 20-yearwet and dry phases in the Sahel). While the vegetationgrowing in semi-arid regions is well adapted to extremeconditions, the ecosystems are vulnerable to environmentaldegradation from climatic events and human interventions.
Water is the most precious and limiting factor in agricul-tural, industrial and urban development in semi-arid lands.Limited water, along with nutrient-poor soils, overgrazing,intensive agricultural practices and mineral extraction, easilysurpass the regenerative capacity of the semi-arid ecosystem.They can strip semi-arid ecosystems of their protectivevegetation, leading to a process of soil erosion and desic-cation, reduced water retention, and ultimately at timesdesertification (Swindale 1992; Zhao, this volume; Rodri-gues et al 1992; UCAR 1991). The term 'desertification' isusually reserved for permanent land degradation. There is,however, considerable debate over the permanence of mostland degradation (see the discussion below under DrylandDegradation and Desertification).
Semi-arid regions encompass some of the least-developedareas of the world. Although there is great developmentaldisparity among the semi-arid regions of the world, they are
generally characterized as having a large portion of theirpopulation engaged in subsistence agriculture, with asmaller, more economically dynamic sector engaged in large-scale commercial agriculture or industry. The frequent dryperiods lead to a high level of uncertainty in production.Those who rely primarily on subsistence plots are particu-larly susceptible to these variations. Subsistence and pastoralproducers frequently migrate within semi-arid regions tomore favorable areas, or out of the region altogether, whenconditions are sufficiently adverse.
At the regional level, semi-arid regions are on the one handhighly dependent on inputs from and trade with otherregions, and on the other are marginalized geo-climatologi-cally, economically, politically and socially. Water resources(as in river headwaters and groundwater recharge sources),agricultural inputs and markets for agricultural products areoften centered outside these regions, introducing dependenceon the outside, and vulnerability in the face of distributiondisruption and market fluctuations. Yet because semi-aridregions have low market-oriented productivity rates (hencecontributing relatively little to the gross domestic product),have low population densities, and are typically located farfrom industrial and urban centers where development poli-cies are generated, they receive low priority in developmentstrategies (Magalhaes 1989).
This lack of priority is significant because subsistence andproduction hardships and opportunities are not based on the

1 CLIMATIC VARIATION, VULNERABILITY AND SUSTAINABLE DEVELOPMENT 19
physical characteristics of the climate and environmentalone. Political, social and economic structures mediatepeople's ability to cope with extreme climate events andadapt to changing conditions. For example, access to credit,irrigation water, distribution networks, agricultural exten-sion assistance, education and health care are all shaped bypeople's social, economic and political position in society,and determine their ability to withstand periods of lowrainfall (Blaikie 1985; Berry 1989; UCAR 1991:15; Downing1992). This is particularly significant for the poorest pro-ducers, who have limited savings of their own to cushionagainst failed crops or reduced employment during badyears.
In order to develop policies that can help sustain humanactivities in semi-arid regions, it is important to examinesome of the unique characteristics which have made theseregions what they are today: poorly developed economieslargely reliant on outside influences and support, susceptibleto the effects of their highly variable climates, and at risk oflarge-scale physical degradation through misuse or overuse.The rest of this section presents a brief discussion of thenature, problems and potentials of semi-arid regions aroundthe world.
Definitions
There are numerous definitions of what comprises a semi-arid region, some more sophisticated than others, but allflawed. The United Nations, for example, has defined semi-arid regions in climatic terms as those areas where the ratiobetween precipitation and potential evapotranspiration isbetween 0.21 and 0.50 (P/PET = 0.21-0.50). Semi-arid zonescan also be defined as areas where rainfall is between 200 and800 millimeters per year, and the year-to-year variability isrelatively large, at ± 20-30% from the annual mean (Ras-musson 1987). These narrowly technical definitions, how-ever, are problematic on a number of grounds.
First, non-climatic factors such as topography, soil typeand cover, and vegetation cover strongly influence local andregional water runoff and retention, affecting the availabilityof water resources for biological activities, and thereforemust be considered in any discussion of semi-arid regions(Yair 1992). The duration and intensity of rainfall havesignificant effects on whether moisture is absorbed by soils oris lost as surface runoff (Downing 1992). Second, rainfallaverages and local hydraulic balances naturally change overtime. As a consequence, the physical area that is technicallyconsidered semi-arid will tend to shift around, while thereality of a variable climate and a vulnerable ecosystem willremain constant. For example, Sahelian isohyets havemigrated 400 kilometers southward since the beginning ofthe drought in 1968 (Le Houerou 1989:70-4; also see Tucker
et al. 1991). This type of effect is particularly salient where thehistorical record is short, and there is little basis for determin-ing what is 'normal'. And finally, any discussion of semi-aridity that does not include social components is missing akey set of variables that shape people's ability to produce andthrive in these lands. As Rodrigues et al. (1992) points out,the lack of rainfall in an uninhabited region is an uninterest-ing fact. More comprehensive definitions and approachescan help illuminate the complex environmental and socialinteractions that shape survival and opportunity in semi-aridregions.
Drought
Drought implies an extended and significant negativedeparture in rainfall, relative to the regime around whichsociety has stabilized. (Rasmusson 1987:8)
Oscillating periods of dry and wet weather are a naturalfeature of semi-arid lands. Some semi-arid regions, such asthe Sahel, experience extended dry periods, while others havedry spells during the growing season, or from year to year, asin Canada's Great Plains areas (Glantz 1987; Swindale1992).
Definitions of droughts, their causes and frequency trendsare widely debated (see Box 1, which details some defini-tional difficulties). Some researchers believe that the severityand longevity of dry episodes witnessed over the past twodecades in semi-arid regions around the world representlong-term trends towards greater aridity (Huss-Ashmore1989:10; IPCC 1990; Zhao, this volume). Some believe thatthis trend is a natural occurrence, while others attribute it toanthropogenic causes. This latter group points to both globalclimate change from greenhouse gas buildup, and locallyreduced rainfall due to changes in surface reflectance(albedo) and changes in evapotranspiration rates from theclearing or changing vegetation cover (Huss-Ashmore 1989).Other analysts argue that while dryland degradation andglobal climate change may be occurring, extended droughtepisodes are in fact the norm in semi-arid regions. Erroneousexpectations for consistent wet periods lead to the perceptionof drought as an anomaly, or as an indicator of worseningconditions (Glantz 1987).
Drought has often been blamed for hardships and lack ofdevelopment in dry regions. Yet, as Rodrigues et al (1992)points out, 'due to the particular characteristics of semi-aridclimates, drought - although not always predictable - willalways be a probable phenomenon and thus it should neverbe considered as a factor of social commotion.' The devas-tation triggered by drought results from people's vulnerabi-lity in the face of climatic events, and not the fact of theclimatic event itself. As Magalhaes (1989:2.27) points out,'droughts do not cause poverty, they just reveal it, exposing a

20 I OVERVIEW
Box 1. On defining droughts
11982 Droughts (January - Decsmberl E5Q3 19B3 Droughts Mortuary • August)
E#%j 1982 - 1983 Droughts
1972 Drought* IMaich - December) f ? ^ l 1 973 Droughts (January • August}
1972 • 1973 Droughts
Figure A: Drought in semi-arid regions. (Source: Glantz 1989.)
For the semi-arid regions of the world the single mostimportant, and least welcomed, climatic event is thedrought. Drought is an expected phenomenon in thesemi-arid regions (see Fig. A). Periods of insufficient rain-fall frequently occur within the growing season as well asover entire seasons, making agriculture a risk-proneactivity.
The definitional debate on what exactly constitutes adrought is long and as yet unresolved: what may bewelcomed as 'abundant' rainfall on the fringes of Africa'sSahel would be accounted as a dry year in North Ameri-ca's corn belt (Hare 1987:4). Yet the debate has led to anin-depth analysis of the concept of droughts and animproved understanding of the climatic as well as socio-economic importance of the phenomenon.
Drought is frequently defined according to disciplinaryperspectives, with differing meteorological, climatologi-cal, atmospheric, agricultural, hydrologic, water-management, economic and socioeconomic derivatives(Rasmusson 1987; Wilhite and Glantz 1987:14^19;Heathcote, this volume).1 In discussing the drought phe-nomenon Wilhite and Glantz (1987) acknowledge that thelack of a precise (and objective) definition of drought in aspecific situation has been an obstacle to understandingthe concept and has led to indecision and/or inaction on
the part of managers, policy makers and others. Yet theystress that there cannot (and should not) be a universaldefinition of drought, since definitions should reflectregional specificity. While the available definitionsdemonstrate a multidisciplinary interest in drought, thisinterest has not yet translated into a multidisciplinarydefinition of the phenomenon.
Even though it is recognized that drought is a complexphenomenon with pervasive social ramifications, mostscientific research has emphasized its physical, rather thansocietal aspects. Vulnerability occurs at the conjunctureof drought and a whole host of other physical, social andpolitical-economic processes. Not only are the social andecological consequences of meteorological drought oftencaused and aggravated by social and political-economicfactors, but these consequences often linger for manyyears after the event and the secondary and tertiary effectsare felt even beyond the spatially denned borders of thedrought (Wilhite and Glantz 1987).
The Palmer Drought Severity Index (PDSI), developed in 1965 byW. C. Palmer, is one of the best known and most used definitions ofdrought. Primarily a meteorological description, it relates droughtseverity to the accumulated weighted differences between actualprecipitation and the precipitation requirement of evapotranspi-ration (Wilhite and Glantz 1987).
plethora of social and economic problems that remainhidden during normal rainy seasons. When droughts occur,they disturb the tenuous production and survival system ofthe poor and destroy what little progress in their station wasachieved since the previous dry spell.'
Semi-arid regions in developing countries have highlyunequal asset distribution patterns resulting from economicand social processes, and government interventions. It isoften the result of historical processes, associated withcolonization (when previously accessible lands were closed
off through new land-tenure structures) or land 'reforms' inwhich the most marginal lands were distributed to thepoorest producers (Box 2). Government policies, the expan-sion of large-scale agriculture or livestock production, andpopulation pressures have pushed small farmers into dryerand dryer regions. Where resources are scarce, a period ofwet weather can lead farmers to move into marginal regions,made more fertile by the increased rains. When the dryperiod returns, they are unable to maintain production (seeGlantz, this volume).

1 CLIMATIC VARIATION, VULNERABILITY AND SUSTAINABLE DEVELOPMENT 21
Box 2. Marginality and drought in Northeast Brazil
Agriculture in the semi-arid areas in Northeast Brazil ispredominantly based on small producers, landowners ortenants, and waged workers who produce for their ownsubsistence, scarcely participating in the market econ-omy. In their paper 'Effects of drought on agriculturalsector of Northeast Brazil,' Khan and Campos (1992)focus on these most marginalized groups.
The 1987 'Green Drought' in the Northeastern state ofCeara resulted in a 7% reduction in the area undercultivation. More alarming, however, was the finding thatfor subsistence crops the difference between harvestedproduction and expected production reached 80% forrice, 75% for beans, and 79% for maize. The earlier 5-yeardrought (1979-83) had similarly dramatic impacts withthe agricultural production diminishing by 83% in rela-tion to 1978, a year with normal rainfall. In each case thescars of drought ran markedly deeper for subsistencefarmers, who emerged as the most vulnerable to disaster.
The social result of drought is the formation of virtualclusters of misery and poverty, composed basically ofsmall rural producers who migrate from the country-side to the cities, where they embark upon a futile searchfor dwindling employment and basic services, adding tothe already unmanageable numbers of the displaced.According to a 1984 Northeast Development Super-intendency (SUDENE) estimate, the migration balancein Brazil's Northeast for 1980 stood at —5.5 millionpeople.
A study of the 1979 drought showed that the plight ofthe small landowners and landless producers became allthe more miserable because even in times of normal rains
their meager resource reserves are barely enough to meettheir subsistence needs. Under these conditions, droughtacts as an 'aggravating agent' which further depletes theiralready marginal productivity, leaving them unable orbarely able to subsist. It concluded that 'food and debtpayment' constituted nearly 80.5% of the 'drought-stricken' worker's expenditure. Debt payment impliedgoods supplied (primarily foodstuff, plus some otheritems including kerosene, soap and Pharmaceuticals) inadvance by the landlord to the workers, sharecroppersand wage earners.
Sometimes, however, these workers succeed in gettingtemporary jobs at the 'work-fronts' created by the govern-ment to provide relief to drought victims by offeringemployment in government civil works. This also benefitsthe medium-sized and large landowners by relieving themof having to sustain labor during the drought period. Inorder to prevent a massive exodus during the droughtsoccurring between 1979 and 1983, the work-fronts had tocreate nearly 500000 jobs in 1979 (9% of the ruraleconomically active population), 720000 in 1980 (13%),1.2 million in 1981 (21%), 747000 in 1982 (13%) and 3.1million in 1983 (55% of the rural economically activepopulation in 1980). These numbers, however, may beexaggerated primarily because the work-fronts have yet toadopt efficient criteria of hiring, and a large proportion ofthe unemployed urban populace is also attracted to them.However, the figures highlight both the magnitude of theproblem created by labor displacement and an approachtowards its solution (Kahn and Campos 1992).
The cycle of drought exacerbates the social inequalitiesthat make dry spells into crises. In times of drought, pro-ducers who already exist in precarious conditions are the firstto be affected (Watts 1983; Demo 1989; Magalhaes 1989,1992; Khan and Campos 1992; Rodrigues 1992; O'Brien andLiverman, this volume). Pre-existing social inequalities areexacerbated in times of drought, often leading to increasedpoverty on the one hand and land concentration on the other(Watts 1983; Lemos and Mera 1992:4; Magalhaes 1992).Marginal subsistence producers and smallholders have fewerassets to buffer them against poor harvests, and are morelikely to resort to selling off assets, eating seeds for survival,intensifying their cultivation practices (thus degrading theirsoil assets) or abandoning their cultivation altogether andmigrating out of the region. Large producers tend to havemultiple and diverse assets which they can afford to sell off orutilize more intensively before actually suffering from theeffects of droughts. Large cattle ranchers in Northeast Brazil,
for example, who rent land to tenant farmers, will often putthat land in forage cultivation to insure that their cattlesurvive the drought. The tenant farmers are then left with nomeans of livelihood, and must sell their labor to large farmers- who themselves are cutting their hired labor to reduceoperating costs - or migrate to urban centers (Magalhaes1989).
Hence, regardless of the causes of climate variation orchange, people's vulnerability in the face of drought issocially shaped. The devastation wrought by recent droughtscannot be attributed solely to climatological events. It occurslargely because nomadic and settled land-use patterns, alongwith low levels of technical and economic development, havebecome or been made incompatible with the inherentclimatic variability of semi-arid zones. It is clear from thisdiscussion that the effects of drought, and their implicationsfor regional development within semi-arid zones, are sociallymediated. Land-holding structures, geographic distribution

22 I OVERVIEW
of holdings, the level of technology, access to resources andmarkets, and ability to command policy attention are allfunctions of socioeconomic standing. To address the conse-quences of drought, people's differentiated vulnerability toits effects must be examined.
Dryland degradation and desertification
Human interventions can increase the productive capacity ofsemi-arid regions by introducing resources such as water andsoil nutrients, thus increasing the intensity of biotic produc-tion the system can maintain. This is the ideal. Humaninterventions can also decrease the productive capacity byreducing soil fertility, water retention capacity and protec-tive ground cover, and causing soil erosion, compaction andsalinization. Soils in semi-arid regions, and particularly thosein the tropics, suffer significant declines under the pressure ofexcessive cultivation, livestock herds, and polluting indus-trial processes. Climatic events such as heavy rains, windsand prolonged dry periods interact with the effects of humanactions, exacerbating degradation. If these processes aresevere enough, desert-like conditions can result.
Desertification refers to a severe form of dryland degrada-tion. It goes beyond other forms of degradation because itseffects may be irreversible. The World Commission onEnvironment and Development reported that: 'the processof desertification affects almost every region of the globe, butit is most destructive in the drylands of South America, Asia,and Africa . . . Land permanently degraded to desert-likeconditions continues to grow . . . Each year, 6 millionadditional hectares provide no economic return because ofthe spread of desertification. These trends are expected tocontinue despite some local improvements' (WCED1987:127-8). But, like climate change, much remains to belearned about the process of desertification. Indeed, there isno unanimity on the extent or meaning of desertification.Some scientists question the idea of desertification arguingthat it has often been based on poor data, research conductedat the end of an exceptionally dry period, and extrapolationof data far beyond the regional specificity of the observedphenomenon (Rhodes 1991; Stevens 1994; Little 1994:1). AsRhodes points out, technical definitions and regional genera-lizations may do more harm than the attention they focus onthe issue does good. But, he continues, 'this assessmentshould not lead to the conclusion that desertification is not anenvironmental issue; rather, it should lead to an awareness ofthe necessity to distinguish between and among drylanddegradation processes in order to identify appropriate res-ponses and management strategies' (Rhodes 1991:1141). Itcan take soils a generation to regenerate, if they can beregenerated at all (Swindale 1992). Thus, whether the crea-tion of desert-like conditions through excessive cultivation
and industrial activities should be called 'desertification' ornot, the impact of these activities merits concern.
As Demo (1989:1.14) points out, 'dealing with droughtbecomes a lost cause for technicians who perceive, sometimesquite competently, the physical restrictions and the reason-able chances of reversing them, but who do not know how toaddress the political problems.' As with other consequencesassociated with drought, dryland degradation results from amix of climatic, social, political and economic conditions andevents. The conjuncture of these factors and their humanconsequences are discussed in the section From Impacts toVulnerability and Beyond, below.
Regional specificity
No discussion about semi-arid regions can do justice to theconditions - ecological, geological, hydrological, social,economic, or political - that shape development withoutexamining each region in its particular context. Each semi-arid region has its particular characteristics, history,problems and potential. Specific policy recommendationsmust be founded on the regional and local conditions of eacharea. As discussed in the following section, general circula-tion model (GCM) projections, even if accurate, are of littleuse without a detailed understanding of the local dynamics(see O'Brien and Liverman, this volume; Wang'ati, thisvolume). This is equally true of the policies that are guided byGCM projections. Indeed, semi-arid zones around the worldare quite different, with some highly productive regions inNorth America and famine-prone regions in Africa. Differ-ences are also reflected in different population densities,production mixes, land distribution, available hydrologicalresources, technological level, etc. The obstacles and oppor-tunities for development in each region are shaped by thesecharacteristics. Policies to bring about sustainable develop-ment must therefore reflect the unique cultural, political,economic and environmental nature of each region.
Diversity in semi-arid lands
The discussion to this point has treated the common charac-teristics of semi-arid regions, and pointed to some differencesamong them. There is also tremendous diversity within semi-arid regions. One of the natural development potentials ofsemi-arid regions is, in fact, the presence of sub-areas withinthem that have greater natural-resource endowments (Nettoet al. 1992; also see Albergel 1992; Cadier et al 1992;Castellanet 1992; Chevallier et al 1992; Reyniers 1992;Serpantie 1992). Another resource for development is adjac-ent resource-rich regions that can help sustain developmentwithin the semi-arid regions by providing access to missinginputs such as water for irrigation and domestic use. But such

1 CLIMATIC VARIATION, VULNERABILITY AND SUSTAINABLE DEVELOPMENT 23
transfers can also be quite dangerous if poorly managed(Zhao, this volume).
Development potential also comes from the diversifi-cation of activities within semi-arid zones. While semi-aridregions are largely developed for agriculture and livestock,portions of them may be suited to other activities, such asindustry, mining and forestry. Some regional needs can bemet using alternative technologies that take advantage ofabundant resources in semi-arid zones, such as solar, wind,and sometimes geothermal energy, as is found along EastAfrica's Rift Valley (Milukas et al. 1984). Another way tofoster development is to base it on activities that are notvulnerable to the natural climate variations of these regions.Semi-arid regions suffer from structural limitations becauseof their relative dependence on drought-susceptible agricul-ture and outside regions for inputs and markets. Industrial,manufacturing, and service-sector growth within theseregions would not only reduce climate and market depen-dence but also increase regional development. Industries thatare not dependent on agricultural resources are least vulner-able to climate variation and change. Indeed, there is evi-dence that industrial growth outstrips agricultural growth insemi-arid zones (World Bank 1990; Magalhaes 1992; Zhao,this volume). Diversification of the production mix withinsemi-arid regions has clear benefits, not only for the develop-ment of these regions but also for their ability to withstandthe climate variability inherent in them.
In the following section, issues surrounding the modellingand projection of climate change and its impacts arediscussed.
CLIMATE VARIABILITY AND CHANGE —
Introduction
Climate has always been a dynamic entity. It varies across allterrestrial scales of time and space. Large areas of the earthexperience wide uncertainty as part of normal climate. This isespecially true of the arid and semi-arid areas, where precipi-tation varies greatly. Change over longer periods of time isalso a 'normal' climatic phenomenon (Riebsame 1989:6).
What makes the current concern for climatic changedifferent from past interest in its perturbations and anoma-lies is the unprecedented pace and magnitude of the predictedchange and the attendant dangers to human and environ-mental systems. While the global mean surface air tempera-ture has increased by 0.3-0.6 °C over the last 100 years, itsaverage rate of increase during the next century is predictedat 0.3 °C per decade (IPCC 1990:2-3).3
This dramatic change is the projected result of increasingatmospheric concentrations of carbon dioxide (CO2) andother greenhouse gases such as methane, nitrous oxide and
chlorofluorocarbons (CFCs). The greenhouse effect is anestablished physical principle that has enabled life on thisplanet. It is the accelerated accumulation of these anthropo-genic greenhouse gases, however, that threatens to causerapid climate change (IPCC 1990).
The findings of the Intergovernmental Panel on ClimateChange (IPCC 1990:3) mark an emerging, but unsure,consensus amongst experts about the effects of such agreenhouse gas buildup. Attempting to model for the radia-tive equivalent of a doubling of CO2 concentration, themajor global climate models predict a global-average warm-ing of between 1 and 5 °C (Downing 1992:1). This is not muchdifferent from the first such estimate made nearly a centuryago, in 1896, by the Swedish scientist Arrhenius. While theapparent similarity of these estimates makes the possibility ofglobal warming appear more likely, the inherent uncertain-ties of climate modelling science and inadequacies of themodelling tools leave all predictions open to challenge (Stone1992:34).
In this section we begin by outlining the concept of climatevariability and change in semi-arid lands. We then proceed todiscuss the limitations of the tools now available for project-ing climate change and its consequences. Finally we highlightthe urgency of acting within, and despite, the uncertainty ofclimate-change predictions.
Climate variability
There are two aspects of climate variability that are ofconcern: its effects on the present populations of semi-aridlands, and the projection of its magnitude and consequencesinto the future.
Hare (1985:41) defines climatic 'variability' as theobserved year-to-year differences in values of specificclimatic variables within an averaging period (typically 30years), and climatic change as longer-term changes betweenaveraging periods, either in the mean values of climaticvariables or in their variability.4 The distinction betweenshort-term climatic variability and long-term climatic changeis critical. 'One affects the range and frequency of shocks thatsociety absorbs or to which it adjusts, the other alters theresource base' (Parry and Carter 1985:95).
Drought is the most common consequence of currentclimate variability in semi-arid lands (Wilhite, this volume).And the most vulnerable to its effects are the most marginal-ized populations: those deprived of the mechanisms and/orresources to prepare for and adapt to climate variation, letalone to climate change (Nobre et al. 1992). Ironically, whilemany recent models and analyses (including the majoritypresented at ICID) are focusing on the impacts of futureclimate change, the problems of climate variability, whichmay indeed get worse under conditions of climate change, are

24 I OVERVIEW
here today. The consequences are not hypothetical, but arealready real and known.
Scientific investigations of global climate change havefocused on projecting net or average change, rather than thechanged variabilities within it. This focus is due to limitationsof the available forecasting tools. Projecting variability is,nonetheless, a major concern in its own right. As an intrinsiccharacteristic of climate regimes in semi-arid regions, varia-bility defines the many decisions made by those who inhabitthese areas (Burton and Cohen 1992). Traditional practicesof crop and income diversification, as well as spatialmobility, are a few examples (see Wisner 1976; Parry andCarter 1988; Huss-Ashmore 1989; Watts 1987a). This is anarea of research that deserves considerable attention.
Projecting climate change and impacts
Projecting climate change is an important first step in evalu-ating the consequences associated with global warming.Modelling climate change is inherently difficult. It involvessimulating the behavior of intricately linked and complexoceanic and atmospheric processes, some of which are notfully understood. In fact, major scientific uncertainties andknowledge gaps persist at every level from predicting justhow fast greenhouse gases might build up to forecasting eventhe simplest climatic variable of temperature (Stone1992:34-7).1
Any effort to predict climate changes assumes that climateis predictable - but this is not guaranteed. Forecasts of theefforts of a rise in greenhouse gasses are really justpredictions of what will happen in the absence of theunpredictable. (Stone 1992:37)
Working within these uncertainties, and acknowledgingthem, climate-change projections by the IntergovernmentalPanel on Climate Change (IPCC), and others, have usedvarious methods to arrive at best estimates within theavailable scientific knowledge and tools. Amongst them isthe use of historical and paleoclimatic data (IPCC 1990),spatial and temporal analogs (Burton and Cohen 1992) anduse of the convenient increment approach (Riebsame 1989).While these have their specific strengths and uses, the mosthighly developed tool to project climate change is the generalcirculation model or GCM (IPCC 1990).
Working according to the laws of physics, GCMs simulatepossible change by using simplified equations (or 'parame-terizations') based in part on current climate conditions andin part on approximations of future factors (IPCC 1990). Theprojections are, therefore, only as good as the parameteriza-tions. The strength of a parameterization, however, is res-tricted by two factors: (1) the major gaps in our knowledgeand understanding of complex climatic process and systems,and (2) the capacity and speed inadequacies of even the most
modern computers that force all climate models to maketrade-offs between the number of locations they simulate, thenumber of climate processes they calculate, and the accuracyof the results (Stone 1992:37).
These general limitations translate into a number of majorproblems associated with relying too heavily on GCMclimate-change projections. The more important include thefollowing:
(1) Different models produce similar trends but differ suffi-ciently that impact projections can vary with choice ofmodel (Riebsame 1989:66).
(2) Variations in grid sizes5 and low spatial representationmake for coarse resolution of GCMs, and hence localspecificity is difficult to obtain (Cohen et al 1992:11).
(3) Complex topographical features are represented differentlyin different models with high uncertainty as to how tohandle these factors (Cohen et al 1992; O'Brien andLiverman, this volume).
(4) Sub-grid-scale weather patterns, which can be importantdeterminants of precipitation, are ignored (O'Brien andLiverman, this volume).
(5) Inadequate understanding of and assumptions about cloudformation could result in major errors in GCM results(Stone 1992).
(6) Lack of coupling of GCMs with dynamic ocean andbiosphere models reduces accuracy (Downing 1992:2-3).
These problems highlight the dangers of interpolating globalprojections from GCMs to arrive at regional forecasts. Ingeneral, the confidence in regional estimates of criticalclimatic factors, especially precipitation and soil moisture, islow (see Cohen 1990; IPCC 1990:4; Downing 1992:2; Yair1992:2; Schmandt and Ward 1992:3; Wang'ati, this volume;O'Brien and Liverman, this volume).
Long-term regional precipitation estimates are even moreuncertain than regional temperature projections. This isparticularly disturbing in semi-arid areas, where rainfallamounts and patterns are the key variable (Parry and Carter1988:11). For example, using five major GCMs for project-ing climate changes in Mexico, O'Brien and Liverman (thisvolume) found that the projected changes in annual averageprecipitation varied from a 23% decline to a 3% increase.
As summarized by Cohen (Fig. 3), the state of understand-ing in climate-change projections provides credible certaintyin the trends in atmospheric compositions; fair certainty inthe magnitude of global warming and the regional distribu-tion of its causes; uncertain estimations of the role of globalwarming, large-scale shifts in precipitation and the magni-tude of regional warming; and very uncertain projections onregional water resources. Furthermore, consensus amongstexperts is that these uncertainties are not likely to narrow inthe immediate future (IPCC 1990) (see Fig. 4 on time scalesfor narrowing uncertainties).

1 CLIMATIC VARIATION, VULNERABILITY AND SUSTAINABLE DEVELOPMENT 25
\Certain Uncertain
Global Trends In atmospheric^ composition
r Magnitude ofglobal warming
Regional
Causes ofatmospheric
change
Magnitudeof regionalwarming
w Role of global^ warming
Large-scaleshifts in
precipitation
W Regionalwater resources
Figure 3: State of understanding of global warming and its consequences. (Source: Cohen 1992).
1990
PREDICTIONS OF RATE OF CHANGE OF CLIMATE(as a result of coupled atmos-ocean modelsand better understanding of the ocean)
PREDICTIONS OF REGIONAL DIFFERENCES INCLIMATE INCLUDING WATER RESOURCES (asa result of higher resolution models and abetter understanding of the water cycle)
IMPROVED RELIABILITY OF PREDICTIONS &DEFINITION OF RANGE OF POSSIBLE CLIMATEVARIATION (as a result of modelscontaining better representations ofclouds, oceans, ice-shoots, chemistry &biosphere)
Figure 4: Time scale for narrowing uncertainties. (Source: IPCC 1990).
1995
2000
2005
In the light of all these uncertainties, over-reliance oninitial GCM results for projecting impacts and consequencesof climate change can often compound issues. This canhappen by:
(1) Imposing the climate of the future abruptly on the world oftoday, without allowing for adjustment and feedback.
(2) Imposing uniform climate changes derived from GCM gridcells onto large regions, thereby eliminating the naturalvariability in time and space that characterizes realclimates.
(3) Dealing with individual economic sectors but not address-ing inter-sectoral linkages within the region and/or thelinkages between the region and the rest of the world.
(4) Failing to consider how technology and policy may facili-tate adaptation to climate change.
(5) Forecasting productivity on incomplete understanding ofexisting baseline and uncertain projections for changing thetechnical, social and economic baseline.
(6) Opting for simplistic, and sometimes misleading, carrying-capacity definitions.
(7) Ignoring the role of the socioeconomic structure in affect-ing vulnerability to climatic change (Rosenberg and Cros-son 1992; Downing 1992; Cohen et al 1992; Wang'ati, thisvolume).
As better computers become available, understanding ofphysical climatic processes is enhanced, and more developedmethods become operational (e.g. fine-resolution, limited-area models) our ability to simulate climate change, and itsconsequences, is likely to increase, but the ingredient of

26 I OVERVIEW
uncertainty will remain important, at least in the foreseeablefuture (Cohen 1990, Stone 1992).
Acting in the face of uncertainty
Despite their limitations GCMs are valuable tools for stu-dents of climate change. Like any tool, they are most effectivewhen used with care and with understanding of their capabi-lities and limitations. Climate models are only as good as ourunderstanding of the processes which they describe, and thisis far from perfect (IPCC 1990:19).
Despite their many problems GCMs provide basicscenarios against which to explore various climate-changepossibilities. Even if we had more refined tools, three crucialproblems would arise in projecting future impacts:
First, of course, no one knows how future climate mightevolve; climate forecasting is an uncertain science.Second, any impact projection is only as reliable as theunderstanding, validity and strength of the assumedrelationships between climate and the resource or humanactivity in question. Finally, even with a good under-standing of past and current climate-society linkages,changes in technology and society may exacerbate ormitigate future impacts; and projecting social change is atleast as difficult as predicting climate change. (Riebsame1989:68)
While uncertainty in climate studies needs to be recog-nized, it must not be allowed to become an excuse forinaction. We should not allow uncertainty to obscure thevery real need for policy analysis. Rather, that uncertaintyshould be incorporated in a credible manner into contempor-ary policy discussions (Riebsame 1989:68; Burton andCohen 1992:10).
Many facets of the climate issue, like those of climatevariability, are here now. They justify immediate action. TheIPCC Working Group on the Formulation of ResponseStrategies reminds policy makers that amongst the mosteffective response strategies (especially in the short-run), arethe 'no-regrets' strategies - those which are beneficial evenwithout climate change and justifiable in their own right(IPCC 1990:11). Riebsame (1989: 67) articulates the senti-ment with much more urgency, pointing out that:
the large uncertainty surrounding predictions of climatechange may not be reduced to levels at which policymakers would be comfortable taking preventive or adap-tive actions until the effects themselves become obvious.By then we may be on the verge of unpreventable andirreversible changes in the environment. Uncertaintymakes planners adopt a 'wait and see' attitude to accountfor climate change in their decisions. It can be argued,however, that the changes which might accompany green-house warming are sufficiently large and sufficiently immi-
nent (i.e., they will occur in the next few decades) thatplanners making decisions affecting long-term resourceactivities such as water development, agriculture, andsettlements should consider their implications now.
This general question of action, or response, is discussed indetail in the next section below. While there may be greatuncertainties in future climate projections, vulnerability inthe face of current climate conditions necessitates and justi-fies action now.
RESPONSES
Introduction
Current knowledge about climate change is insufficient forplanners and policy makers to use models as precise predic-tive tools. Great uncertainty remains as to the actual mecha-nisms and potential effects of global warming. While enoughis known to argue convincingly that greenhouse gases willresult in general climate warming, the specific effects at theregional and local levels are sketchy at best. But it is notnecessary to wait for tangible proof of climate change beforeacting. Climatic variability is currently a major problem insemi-arid regions. In conjunction with other physical, socialand political-economic factors, climate variability contri-butes to vulnerability to economic loss, hunger, famine anddislocation. Reducing this vulnerability by increasingpeople's ability to cope is an immediate need. This will notonly buffer them against the existing climatic variability butwould increase their resilience to possible future climatechange.
Adaptation is our natural response to the environment. AsBurton and Cohen (1992) argue, when and what we plant,how and where we build structures, and what infrastructurewe develop, are all contingent responses to environmentalconstraints. Adaptation is based on immediate observationof our surroundings, our knowledge of environment varia-tion from the past, and on projections of future needs andevents. Adaptation is what makes extreme events within thenormal climate variation survivable, rather than cata-strophic. In highly variable climates such as semi-aridregions adaptive responses mean the difference between a dryspell with some economic losses, and a deadly famine.
No regrets
Climate change introduces the possibility of climatic con-ditions not previously experienced in a given region. Plannersand policy makers are naturally reluctant to invest in adjust-ments to an uncertain future scenario that may decreaseproductivity in the short run, or require difficult negotiationwith other countries and regions. Yet much adaptation,

1 CLIMATIC VARIATION, VULNERABILITY AND SUSTAINABLE DEVELOPMENT 27
unlike multilateral agreements about greenhouse gas reduc-tion, is not dependent on cooperation with other nations, canbe implemented locally, and can include measures that haveimmediate benefit, in and of themselves (Burton and Cohen1992). They are worth doing even if climate does not change.For example, developing drought-resistant crops for semi-arid regions can both help farmers hedge against increasinglyarid conditions, and decrease water consumption needed forirrigation (O'Brien and Liverman, this volume). As semi-aridregions become dryer, water conservation will be increas-ingly important. Using less water is also beneficial because itreduces the likelihood of soil salinization, waterlogging ofroot areas, and overdraft of the water-table. In regions wherewater is purchased from sources outside the region, using lesswater means less expenditure, with resources remaining forreinvestment within the region.
As Wang'ati (this volume) argues, 'sustainable develop-ment is achievable provided that development policies putless emphasis on 'change' in favor of 'progressive improve-ment' on those strategies and technologies which haveenabled the populations to cope in the past.' Purposefuladaptation to climate variation will save costs and 'buy time'needed to develop and implement greenhouse gas reductionstrategies (Burton and Cohen 1992). The real opportunity inadaptive strategies, however, lies in their coincidence withlong-term development aims. Sustainable development doesnot have to mean sacrificing increased wellbeing in order topreserve resources. Rather, it can mean insuring wellbeingthrough measures that conserve and improve productivecapacity.
Long-term adaptation versus short-term crisis response
as droughts come and go, left behind are . . . the usualdebates over the efficacy of ad hoc relief efforts and at bestinadequate or incomplete plans for dealing with futuredroughts. With the first rains comes a new sense ofsecurity, relief efforts are dismantled, plans for the nextdrought forgotten, and society resumes its so-called har-mony with climate until the rains fail and the cycle beginsanew. (Easterling 1987, as quoted by Farago 1992)
Just as policy makers are reluctant to act on uncertaininformation about future climate change, investments toreduce vulnerability to current climate variability have beeninsufficient. Crisis-induced responses far outweigh preven-tive measures (Wilhite, this volume). Famine relief, emerg-ency food and seed distribution during droughts, and publicworks projects to employ affected rural workers are all partof the crisis response mode. With the possible exception ofpublic works projects, crisis responses tend to have imme-diate palliative results but no lasting effects on the resilient
capacity of the population. In fact, short-term crisis-inducedresponses can have perverse effects on regional resilience tosevere events by making governments and the populationcomplacent in the face of repeated crisis events (Downing1992; Wilhite, this volume; Glantz, this volume). Rather thana strategy for change, the crisis management approach can bea recipe for maintaining, or worsening, the status quo. Forexample, providing food and input supports to farmers whoare trying to cultivate extremely marginal lands may allowthem to weather the current crisis but leaves them susceptibleto future events and without incentive to buttress theirdefenses against vulnerability (Wilhite, this volume).
Wilhite (this volume) argues that agriculturalists musteither be equipped to adapt to the natural variability of thelands they are on, or should relocate to more viable areas.Glantz (this volume), however, argues that all viable agricul-tural tracts are already under cultivation, suggesting thatadaptation is the more promising policy response.
Planning for sustainable development
As will be discussed in the following section, the vulnerabilityof agriculturalists and pastoralists is not solely due toclimatic events, but instead comes at the intersection ofsocial, economic, political and cultural factors. Anyapproach to developing adaptive responses must include allof these spheres. Our discussion is necessarily incomplete,because the specific responses in any area will vary with localconditions and needs, something that would be impossible todo justice to here. Nevertheless, there are a number of general'design criteria' to guide policy makers, engineers, localentities and the local population in their attempts to respondto the needs of people living in semi-arid regions.
First, responses to climate variability must be adaptive. Byadaptive, we refer not only to the spontaneous adaptiveresponses of local populations, which generate a certaindegree of innovation and locally appropriate responses, butalso to purposefully adaptive responses on the part ofpopulation and government. Many of these responses willneed to be corrective measures to increase people's access toproductive resources. They will also need to include forward-looking strategies that aim to increase the availability, stabi-lity and resilience of infrastructure, markets, institutions,and productive processes.
Second, adaptive responses must be integrative. Exper-ience shows that strictly technical solutions are insufficient toaddress the vulnerability of people living in semi-aridregions. Economic approaches can address only part of theproblem. 'Getting the prices right' cannot protect the pooragainst volatile prices and declining terms of trade (Bernstein1979; Sen 1987). Policy measures must not only include amulti-sectoral analysis, but should be formulated through an

28 I OVERVIEW
inclusive process that involves the entire affected population,from small producers to the business community to donors.This will help assure that technologies and policies match theresources and needs of the people concerned.
Third, responses must be incremental and iterative, guid-ing existing institutional, technical, and socioeconomicstructures to a more flexible and appropriate coexistencewith semi-arid conditions. The comprehensive projectapproach can rarely encompass and project the multiplerepercussions of policy interventions, not to mention unfore-seen future events. An incremental, iterative approach thatincorporates active feedback mechanisms to monitor andadjust to emerging events can help overcome these problems.
Finally, there must be active participation of all the partiesconcerned. Policy formulation, however 'comprehensive'and 'interdisciplinary,' is useless unless it responds to localneeds and conditions. Policy interventions include economicand social measures which shape people's participation ineconomic development by effecting their access to productiveresources. These policies, such as how to structure agricul-tural subsidies, credit systems, technical assistance, etc., haveinherent distributional implications, and are therefore politi-cal decisions (Demo 1989; Rodrigues et al. 1992; de Almeida1992; O'Brien and Liverman, this volume).
Demo (1989), Rodrigues et al (1992), Vallianatos (1992),Wang'ati (this volume) and others argue that mechanisms toinclude community organizations, small-scale producers,and other marginalized populations must be developed if theeffects of unequal development within semi-arid regions areto be redressed. Pressure from the affected communities,such as rural labor unions, organized community groups,producer cooperatives, etc., is a key element for transformingunequal social and economic arrangements. Together withpurposeful policies aimed at increasing producer access toproductive resources, this local pressure may be capable ofreducing development imbalances within semi-arid regions.Approaches that recognize these groups as legitimate stake-holders, and provide some means for including them in thedecision-making process, is critical in redressing marginali-zation (Demo 1989).
The following discussion provides an analysis of people'svulnerability to the consequences of climate variability, andthe technical, governmental, and international responsesthat this analysis suggests. Again, though this discussion isnecessarily incomplete, the aim is to sketch out some of themore important factors that might help shape policydecisions that are compatible with the development aims ofsemi-arid regions.
From impacts to vulnerability and beyond
The primary problem of semi-arid regions is not climatevariability, drought, soil erosion or floods, but more cen-
trally, people's vulnerability to the effects of these events.While droughts, floods and the ecological character of theland are natural phenomena, vulnerability to the effects ofenvironmental change or natural hazards is a social matter.It is not so much the droughts or floods that are alarming, butpeople's vulnerability to the consequences associated withthem: hunger, famine, dislocation from land or livelihood,economic loss, and the loss of ecological assets. Vulnerabilitycomes at the confluence of underdevelopment, social andeconomic marginality, and the inability to garner sufficientresources to maintain the natural-resource base and to copewith the climatological and ecological instabilities of semi-arid zones.
When we write of vulnerability we are not implying that itis a thing of the future or of mere potentiality. Vulnerabilityto hunger does not mean that people are not hungry yet. Itsimply is a way of identifying the populations most likely tobe hungry. The word may imply potential problems that arenot yet here, but in the semi-arid regions, hunger andfrequent crisis are pervasive. We therefore use this term withcaution, emphasizing that many vulnerable populationssuffer chronic or frequent crises.
Vulnerability is a function of a number of interlinkingfactors. Neither chronic nor periodic crises emerge from anysingle agent. Rather, they occur at the conjuncture of many.Famine, for instance, occurs at the intersection of phenom-ena such as drought, human need, grain prices, wars orfrontier settlement policies. It is not a singular result ofdrought. One aim of this section is to sketch out these forcesin order to help develop their policy implications and point topolicy responses.
Because the purpose of this chapter is to cover the climate-related issues most pressing in the semi-arid regions of theworld, we focus on those groups within these regions whoselivelihoods and lives are most at risk. These include thelandless and smallholder farmers, pastoralists, and smallranchers in the less-developed regions whose physical well-being is tied to the rains and the land. Risk of economic loss -which in this case is rarely life threatening - is the primaryconcern within more-developed semi-arid regions. We alsoexamine the linkages between the most vulnerable popula-tions and the population at large, because without a broadand integrated economic development of these lands, chronicunderdevelopment and frequent crises will continue.
This section is devoted to defining and discussing theconcept of vulnerability.
A formal definition of vulnerabilityHere, we adopt Thomas E. Downing's method for evaluatingvulnerability when assessing the potential consequences ofclimate variability and change. Downing's (1992:3-4) meth-odology consists of:

1 CLIMATIC VARIATION, VULNERABILITY AND SUSTAINABLE DEVELOPMENT 29
identifying the multiple dimensions of vulnerability... [toa specific consequence such as hunger]; determiningsocioeconomic groups with similar patterns of vulner-ability; assessing their location and degree of vulnerabi-lity; delineating pathways by which their vulnerabilitymay be altered by trends in resources (including climate),population, and economy; judging the risk of futureclimate change, in the context of other expected risks tosustainable agricultural development; and, finally review-ing potential responses that reduce the risk of adverseclimate change and enhance the prospects of food [or forour purposes food, job or economic] security. (Downing1992:3)
Focusing on food insecurity, Downing describes vulner-ability as 'an aggregate measure, for a given population orregion, for the underlying factors that influence exposure tofood shortage and predisposition to its consequences'(Downing 1992:4). Below we discuss the principal character-istics of the concept of vulnerability.
Adverse, specific consequencesThe concept of vulnerability is linked to adverse conse-quence. Hence, the concept has an ethical basis - in focusingon the adverse outcomes - which distinguishes it from moreneutral terms such as 'sensitivity,' 'consequences' or'impacts.' Indeed, the concept is designed to help identifythose groups within society most likely to experience negativeoutcomes. While crop yield may be sensitive to drought,different households may be more or less vulnerable in theface of the same low-rainfall event. For example, those whohave excess grain to sell at a high price during drought-triggered food scarcity will benefit from a drought. Thosewho have water resources on their private property can sellaccess or use it to produce goods that are otherwise madescarce by drought. In addition, those with capital can buyland and equipment at low prices from those who are forcedto sell out of desperation (see, for example, Demo 1989;Magalhaes 1992; Rodrigues et al. 1992). While these house-holds are affected by drought, they are not as vulnerable to itsconsequences as are others in the same community (Downing1992:5).
Vulnerability is specific in that it is concerned with aparticular consequence, such as famine, hunger or economicloss. Vulnerability to famine, or to these consequences, canthen be evaluated with respect to multiple events such asdrought, access to resources, market fluctuations, state poli-cies, or regional conflicts. This is a fundamentally differentformulation from previous analyses which link a single causeto an outcome, such as drought to crop yields. Rather thanfocusing on the consequences of a single event, vulnerabilityanalysis traces out the multiple causes of a single conse-quence.
The several specific negative consequences that are dis-
cussed in the climate variability and climate-change litera-ture include vulnerability to dislocations, hunger, famine andeconomic loss. These can easily be extended to include thevulnerability to loss (or degradation) of assets, which in turncan be broken down into natural assets such as land, forestsand water resources, and human-made capital such as farmmachinery or other infrastructure. While these consequencesare often discussed together, vulnerability to them must beevaluated separately, for each may have different causes.6
Vulnerability is relativeVulnerability is a scale of the relative likelihood of differentsocioeconomic groups and geographic regions experiencingnegative consequences, such as hunger, famine, economicloss or the loss of productive assets. While everyone issusceptible to all of these adversities, some socioeconomicgroups and some areas are more susceptible than others.Clearly the semi-arid rain-fed agricultural regions at the tailend of the rainfall gradient are more likely to experiencefamines than are cities (see for example, Box 3, and Gasqueset al. 1992:38).7 In the same regions, the poor are more likelyto experience hunger than are the rich. While all are vulner-able to food shortages, some groups and regions are morevulnerable than others. And, as Downing (1992:4) states,'ultimately, the analysts must assign the thresholds forconcern and action.'8
Vulnerability and socioeconomic statusVulnerability is a function of the relative status of socioeco-nomic groups. As we will see below, vulnerability is afunction of income as well as class, caste, clan, religion,political party, livelihood, race, ethnicity, family, gender andage. Different socioeconomic groups have differing assets aswell as differing levels of access to productive resources.Their assets and access are critical aspects of theirvulnerability.
Vulnerability is also a function of the degree of develop-ment. As Wilhite et al (1987:558) point out:
In developed countries the proportion of commercialagricultural producers who can withstand a short-termoccurrence of drought is high, in terms of both businessresilience and human welfare. The impact of short-termdrought is significantly reduced because of irrigation andthe availability of sufficient forage (fodder) and water forlivestock. Even in the case of longer-term drought, the useof irrigation coupled with sufficient grain and foragestorage facilities and a fully developed infrastructure cansignificantly lessen the impact on society and livestock.For example, in Australia, 40% of the farming commun-ity is not greatly affected by a drought.
For subsistence farmers, even a short-term drought can bedisastrous, especially for the peasant farmer whose onlysecurity is a small piece of land on which to grow food and

30 I OVERVIEW
Box 3. Climate change and vulnerability in Kenya
Table A. Estimated prevalence of food poverty in 1984 and sensitivity to climatic variations in Kenya
PastoralistsNomadicAgro-pastoralMigrant farm
LandlessPoorSkilled
Rural LandholdersLarge farm squattersSmallholderGap farmsLarge farms
UrbanNairobiOther
Total 1984
Central Coast Eastern Nyanza
Estimated prevalence of food poverty
010
1590
53555
00
09
777
3740
880
62179
00
026
396
773
14
1550
61637
00
013
960
000
1390
68705
00
014
926
Rift Valley Western
in 1984 (in 1000s)
71329
128
3100
36377
00
016
1609
000
450
49511
00
07
612
NE
2681148
30
0500
01
336
Nairobi
000
00
0000
320
32
Total
109548
190
8990
3292969
00
3286
5648
%
1913
160
65300
12
100
Current agroclimatic zonesuitable for maize (km2 x 103) 13.2
Decrease with a 10% reductionin length of growing period (%) 0 21
Decrease with a 20% reductionin length of growing period (%) 0 29
Sensitivity to climatic variations
44.7 51.2 14.2 104.7
11
20
21
28
9.1 7.8 0.7 245.6 42
0 16 0 16 35
0 20 0 23 32
Source: Downing (1992).
The first step in analyzing vulnerability to hunger andfamine is to identify the socioeconomic groups expectedto have different patterns of food security or differentlevels of food poverty. Given these different patterns,different socioeconomic groups would be expected tohave different levels of risk in the face of climate change orother resource, social and economic perturbations. Inmost instances vulnerability to hunger and famine can becorrelated with principal means of livelihood, skill level,reliability of income (perhaps as related to tenure),wealth, land-holding size and geographic location (this isa function of natural resources, distance from transpor-tation and marketing infrastructure, as well as otherpolitical-economic factors that structure developmentassistance, and so forth). Rates of food poverty - theproportion of people with insufficient incomes to procurethe recommended minimum level of food - were esti-
mated by Hunt for 11 socioeconomic groups in eightregions of Kenya (see Table A). Though pastoralists showa higher rate of food poverty, the largest vulnerable group- over half of the food-poor population - consists ofsmallholder agriculturalists (Downing 1992.)
To examine some potential consequences of climatechange, Downing uses a scenario in which the length ofthe growing period is altered through a combination oftemperature and precipitation changes. In Kenya, a 10%decrease in the length of the growing period could resultfrom either an increase in temperature of approximately1°C or a decrease in the precipitation of around 10%.Assuming a 10% decrease in growing period, there aremajor shifts in Kenya's agricultural zones. Growing sea-son changes are shown in Figs. B and C. The threshold ofreliable agriculture (60-90 days for maize) would movewell into Kenya's highlands as the total area suitable for

1 CLIMATIC VARIATION, VULNERABILITY AND SUSTAINABLE DEVELOPMENT 31
Box 3. (cont.)
< 1 day
1- 30 days
30- 60
60- 90
90-120
120-150
150-180
180-210
210-240
240-270
270-300
300-330
330-360
> 360
•1 I
Hill
BUI
Figure B: Length of the growing period in Kenya (days). (Source: Downing 1992.)
n< 1 day d]
1- 30 days CH
30- 60 E H
60- 90 [HI
90-120 ISSSH
120-150 m
150-180 I I
180-210 ftttffll
210-240 fHHi
240-270 ^ H
270-300 | B 1
300-330 Hfljfl
330-360 | B
> 360 \~]
SOURCE: DOWNING 1992.
Figure C: Length of the growing period in Kenya (days) reduced by 10%. (Source: Downing: 1992.)

32 I OVERVIEW
Box 3. (cont)
maize shrinks about 15% compared with present con-ditions. While the lowland ranching zone would expand,the tea-dairy zone may disappear, becoming more suit-able for coffee.1
Downing has estimated the impacts of this climate-change scenario on the socioeconomic groups defined byHunt; the results are presented in the bottom half of TableA. Clearly, the most direct effects will be felt by groupswho rely on their own agricultural production for a majorshare of their food consumption: pastoralists and small-holder agriculturalists. Reductions of 15-30% in the areasuitable for maize cultivation in the sub-humid and semi-arid areas would significantly increase the number of
people with climatic resources inadequate to sustainagriculture. The shortening of the growing season wouldfurther increase vulnerability as the probability of achiev-ing yields is reduced.
While other socioeconomic groups will also be affectedthrough changes in the agricultural ecoomy, they may bebetter able to adapt or adjust to the change. It is those whoare already the most vulnerable and most marginalizedwho stand to lose the most.
1 A 2 °C reduction, or a 15% drying, or a combination of an increaseof 1 °C and a 10% reduction in precipitation, would correspond to a20% reduction in the length of the growing season, and even moredramatic contractions in the length of the growing season.
some cash crops. If seasonal rains fail, no alternative supplyof water is available to sustain growth. The result is criticalshortages of food, inadequacy of grazing land, suffering andpossibly loss of life for both human beings and livestock. Thelack of adequate infrastructure (related to the lack of proac-tive government programs) and the high price of grain fromexternal markets impede governmental ability to rescueinhabitants of such distressed areas.
While China and India used to be thought of as lands ofdrought and famine, they appear to have reduced theirvulnerability by bringing these problems under control - atleast temporarily. It is now Africa that is plagued by famines.While the climate variability in India and China has not beenaltered, critical political, social and economic factors havechanged over time. 'Although there were major droughts andclimate-induced food shortages around the globe - in variousparts of Africa, India, China, Indonesia, Brazil - faminesoccurred only in Africa' (Glantz 1989:46) (also see Sen 1987;Dreze and Sen 1989). At the same time, droughts in thesouthwestern United States, central Canada and Australiahave led primarily to economic loss (Wilhite and Glantz1987:20-3; Rosenberg and Crosson 1992; Cohen et al.1992:7-11). Here again there is a critical difference in vulner-ability to hunger, famine and economic loss from place toplace. Climate variability alone cannot account for vulner-ability or outcomes. Both the magnitude and the type ofvulnerability are different in different regions of the world, atdifferent times, under different social and political-economicconditions, and different levels of development.
Developing countries are more vulnerable than developedones. Not only does the level of vulnerability differ, but thetype of vulnerability experienced in developing regionsdiffers from that experienced in the industrial countries of theworld. Magalhaes (1991:7) point out that 'while in developedareas the impacts are mainly of an economic and environ-mental nature, in developing areas they are mostly social.'
Clearly, vulnerability is a strong function of the level ofregional development.
Vulnerability, causality and policyAnalysis of vulnerability has several ramifications in thepolicy sphere. In giving a relative indication of the level ofvulnerability, policies can be aimed at the most vulnerablepopulations. Policy priorities can be established according toneed. And, since vulnerability analysis focuses on the multi-ple causes of a single consequence, it allows policies to bedesigned for the range of causes that make climate events intoeconomic and social crises. In addition, given the specificityof this type of analysis, policies can be tailored for a specificpopulation in a specific place. And lastly, since causalityhappens at international, national, household and individuallevels, policies can be targeted at the appropriate level //thecauses are understood.
Knowing that vulnerability to dislocation, hunger orfamine is a function of geographic location and income is afirst step in evaluating vulnerability. But this does not tell uswhy people end up on submarginal lands or how and whythey are impoverished. The causes of such spatial andeconomic marginality, and hence vulnerability, must usuallybe understood historically. Such marginality could be partlya function of land concentration, as is the case in Brazil'sNortheast (Demo 1989; Magalhaes and Glantz 1992; Rodri-gues et al. 1992). It could be due to state policies encouragingcultivation on marginal lands as in parts of West Africa, or asin Australia it could be a result of people moving onto theselands not knowing that they are making this move during anunusually wet period (Glantz, this volume; Wilhite, thisvolume). It could also be due to the inability of a farmhousehold to accumulate sufficient capital to invest in themaintenance of the land, or to have sufficient assets to bufferagainst the consequences of a drought (Sen 1981; Blaikie1985; Downing 1991; Watts and Bohle 1993). Where these

1 CLIMATIC VARIATION, VULNERABILITY AND SUSTAINABLE DEVELOPMENT 33
vulnerabilities are a function of class or other forms of socialstatus, they may be results of lack of access to inputs to theproductive process. Alternatively, vulnerability may be dueto market instabilities or to the classic case of decliningproducer prices with increasing input and consumption-good prices, as in a 'simple-reproduction squeeze' (Bernstein1979; Blaikie 1985; Sen 1987; Swift 1989).
The focus on different socioeconomic groups and onspecific kinds of vulnerability or threats, such as famine oreconomic loss, facilitates the policy-analysis process. First, itallows policy makers to identify those groups and regionsmost at risk. And second, it can illuminate the causalvariables, and hence the links to appropriate policy interven-tions for each group vis-a-vis specific kinds of vulnerability(Downing 1992:4).
For example, the analysis of vulnerability to specificoutcomes also often reveals different causal factors fordifferent groups. Herders and farmers may be vulnerable tohunger for different reasons. For the pastoralist it may be afunction of access to dry season pastures, while for a farmervulnerability may be due to a low savings rate and a lack offall-back income opportunities or inability to diversifyassets. It is in response to these types of causal factors, andthe political-economic forces that shape them, that specificand appropriate policy options can be chosen and applied.
Climate variability affects rich as well as poor sectors ofsociety. But, while hunger, famine and dislocation tend tothreaten the poor, economic losses threaten the better off.Those who are well off may experience great material losseswithout ever going hungry. Thus, policies targeting bothfood security and economic security may be in order. Butaccumulation on the part of the wealthy, and policies justify-ing or structurally disposed to economic growth in alreadymore economically productive regions or on larger farms,have often been part and parcel of the problem of marginali-zation - marginalization being a flip side of concentration.Hence, special attention must be focused on intervening inways that do not exacerbate marginalization and vulner-ability by reinforcing ongoing differentiation processes. Thatis, policies must acknowledge the role of accumulation andthe lack of it (e.g. differentiation processes) in creating andmaintaining vulnerability.
In short, the object of vulnerability analysis is to linkimpact analysis to the causes of vulnerability in order tofacilitate the policy process. But analysts must go beyond theproximate causes of vulnerability to root causes. Correlationdoes not explain causality. To map out the vulnerabilityfactors or indicators, such as location, livelihood, educationand income level, is an incomplete analysis. Without address-ing structural causes, such as the political economy ofresource access and control - that is, the politics of accumu-lation and marginalization or the ongoing processes of
differentiation - it is difficult to target the root causes ofmarginality, poverty and the resultant vulnerability tohunger and famine.
It is in response to these non-climatic causes of vulner-ability that policies to reduce vulnerability can be made.Because these causes are usually multiple, interlinked andhistorically contingent, it is all the more important to under-stand their roots. It is identifying causal links that facilitates ameaningful and effective policy process, for it is in addressingthe root causes of vulnerability that vulnerability can bereduced.
Levels of analysis and vulnerabilityCauses of vulnerability and environmental decline, and theopportunities for their alleviation, reside at a multitude oflevels within the social and political-economic context thatshapes the options of individuals, enterprises and farmhouseholds. Schmink (1992) uses what she calls a 'socioeco-nomic matrix' when evaluating the causes of deforestation,and the policy handles by which deforestation can beaddressed. This matrix can be adapted to the issues ofvulnerability and dryland degradation, as has been done inTable 2. In this schematic, the various forces that bear onvulnerability at different levels are sketched out.
In brief, access to and control over resources necessary forproduction and reproduction at the local level are shaped byforces at a multitude of levels. Because vulnerability is partlya function of access and control over productive resources,vulnerability itself is shaped by all of these factors. Whiledifferent levels of the system will exert differing degrees ofinfluence on the local dynamic, all of these levels are relevant.The activities and options of a resource user must be exam-ined from all these levels if a complete understanding of thatuser's vulnerability is to be achieved.
ConclusionClimate events, although they can trigger catastrophes orcontribute to chronic poverty, do not cause vulnerability.Rather, vulnerability is the product of international,national, household and individual level socioeconomicforces shaping people's livelihood options and choices.Catastrophe, as well as chronic underdevelopment, in thesemi-arid zones comes at the intersection of nature andsociety. It comes at the conjunction of ecological limits,climatological events, the social organization of alternativesavailable to those pressed by exploitation, market prices,state policies and environmental change against fallingproductivity.
The most acute problems in semi-arid lands are productsof a chronic lack of development, that is, a lack of theresources necessary to hedge against extreme, but expected,events: events that would surprise only a stranger to these

34 I OVERVIEW
Table 2. The socioeconomic matrix of vulnerability
GLOBAL CONTEXTInternational aid policiesDevelopment lendingStructural adjustmentEnvironmental conditionality
MarketsDemand for natural
resources (mineral, forest,and agricultural goods)
Foreign investment
International agreements andcooperation
Inter-regional cooperationTechnology transferTrade agreements
NATIONAL CONTEXTMarkets PolicyTransportation Roads and infrastructurePrices Price supports and subsidiesFinancial markets Extension services
MigrationPopulation pressuresFrontier expansion
Land tenureLand distributionProperty regimes
REGIONALILOCAL CONTEXTSettlement patterns Interest groupsLocalized population Conflicts over resources
pressures Coalition and alliancesResource distribution
HOUSEHOLD/COMMUNITY CONTEXTGender relationsDivision of labor and
resource access controlFamily size and compositionControl over fertility
Family/community strategiesAccess to resourcesIncome sources and
employmentTemporary migration
Source: Adapted from Schmink (1992).
regions, but which most local farmers know present a risk. Itis not that the risk is unknown nor that the methods forcoping do not exist, for people have been coping with climatevariability for millennia. Rather, inability to cope is due tothe lack of - or the systematic alienation from - resourcesneeded to guard against these events.
The central issue of semi-arid regions is one of develop-ment and its distribution. Subsistence farmers need a marginof security and a level of savings sufficient to invest inmaintaining, upgrading and developing their assets. Theyneed access to infrastructure and to research commensuratewith their needs and relevant to their goals. They also needaccess to alternative income-generating opportunities so asto increase their security in times of drought and to comple-ment their agricultural activities.
In the final analysis, it is accumulation and concentration
that marginalize, and it is marginality that makes peoplevulnerable in the face of environmental change. Marginalitycan also push people to 'mine' their natural resources, whichonly increases their vulnerability. But, so too do accumu-lation and concentration contribute directly to the ecologicaldecline that makes marginal populations more vulnerable.Certainly, concentration and the drive for accumulation areimportant causes of widespread ecological insults. Pesticideand fertilizer overuse, uncontrolled effluents and speculativedeforestation are all associated with concentration andwealth. These insults all increase vulnerability of marginalpopulations. They too must be taken into account in evalu-ating both environmental decline and vulnerability. Indeed,marginality of the environment, just as the marginality of thepoor, results in higher vulnerability of both.
Development with a focus on equity and access is part ofthe solution to this set of problems. Productive security andenvironmental quality depend on development, access andinclusion - indeed, empowerment and enfranchisement.However, that development must be a conscientious devel-opment that accounts for the need to maintain a healthynatural-resource base and a secure population.
Governmental, institutional, and policy responses
IntroductionThe problems facing semi-arid regions are multiple andoverlapping; so too are the opportunities. There are nopurely economic strategies that will reduce regional vulner-ability or increase security, just as there are no purelytechnical strategies that will increase production, reducepoverty and reverse dryland degradation. The papers pre-sented at ICID were unanimous in their call for adopting amultidisciplinary approach to development in semi-aridlands. Any environmentally sound development policyrequires an integrated approach that allows for iterativeresponses to multiple, interrelated spheres - social, econ-omic, technological, biological, political, cultural, etc. -through which policies reverberate and by which policies arereshaped.
The need to reduce and, it is hoped, reverse, the possibilityof climate change cannot be overemphasized. Althoughthese responses rightly fall into the government (domesticand international) arena, policies that aim at reducing green-house-gas emissions are beyond the scope of this chapter.Rather, we limit ourselves here to governmental, institutio-nal and policy responses that may help enable the inhabitantsof semi-arid regions to overcome their vulnerability in theface of current climate variations and possible future climatechange. We highlight some of the important ingredientsnecessary for reducing vulnerability, and increasing resili-ence to climate variability and change.

1 CLIMATIC VARIATION, VULNERABILITY AND SUSTAINABLE DEVELOPMENT 35
Economic developmentEnvironment and development are tightly linked. Unlesssemi-arid regions are developed, smallholders and landlesspeasants will continue to exert pressure on the natural-resource base in their attempts to eke out a subsistence living.Due to the lack of access to resources and minimal locallyretained surplus, they often cannot buffer against the effectsof drought; they are forced to 'mine' the land, simply tosurvive. Without the resources to invest in the maintenanceand development of the land, productivity declines. Asalternatives diminish, they are forced to migrate into thecities or onto increasingly marginal lands and new frontiers.Without addressing the lack of adequate farm incomes andalternative income-generating activities, preparing fordrought and maintaining the resource base seem to have littlechance.
A major question in development debates concernswhether to focus on large-scale and commercial agricultureand industrialization, or to support the small subsistencefarmers and pastoralists. The first method has been themode. The plight of small farmers and the landless has beenseen as an inevitable cost of development, as their traditionalforms of cultivation become 'outmoded.' It has often beenargued that the transient inequities caused by the develop-ment process would be offset by the development to come. Itwould be better, the proponents of this strategy argue, to getthe peasant farmers to 'modernize' or to get off the land, intothe cities and the non-agricultural sector, or off to theopening of new frontiers. In short, it is better to make roomfor modern agriculture and industry rather than to support a'backward' form of subsistence. While there may be truth inthe notion that mechanization and modernization of agricul-ture is inevitable, and in many cases desirable, the dislocationof rural peasants has additional and persistent problems.Cities are overburdened with unemployed, while 'frontier'areas, typically more marginal and fragile environments thanthose left behind, are stressed by the influx of new migrants.In both places, the rural out-migrants often find themselvesin exploitative circumstances similar to those they sufferedpreviously.
Poverty did not disappear with agricultural mechaniza-tion. Rather, it increased during the 1960s, 1970s and the'lost decade' of the 1980s (World Bank 1990), leading to a callfor basic needs guarantees. Later, policy makers recognizedthe environmental ramifications of poverty (Eckholm 1979).Poverty leads smallholders to overuse their resource base,thus increasing their vulnerability in the face of climatevariation (Blaikie 1985; Downing 1992). Hence it is inalleviating poverty that people's basic needs can be met, andthe resource base maintained. But basic needs remain unmetand the poverty experienced by the majority of the develop-ing world's rural populations persists.
It now seems clear that neither the modernization nor thebasic needs development approach is sufficient. Develop-ment requires supporting both large commercial agricultureand small subsistence farmers. Dynamic economic regionaldevelopment relies on well-integrated markets whereincreased production leads to increased savings, investmentand consumption at the local and regional levels. Becausesemi-arid regions are so dependent on the primary produc-tion sector relative to other regions, the cycle of impoverish-ment of small rural producers and resource depletion des-cribed in the previous section signals a structural weakness inthe economy (World Bank 1990; Goldsmith and Wilson1991). This structural weakness is especially significant insemi-arid regions because agriculture there is highly suscept-ible to wide output variations with small changes in climatevariability (UCAR 1991). Unless the pattern can be reversed,it is unlikely that integrated rural development can take root(Goldsmith and Wilson 1991; Bitoun et al., this volume).
Unfortunately, reactive famine relief has long been theonly form of policy attention the semi-arid areas havereceived. These short-term relief measures cannot, however,solve these regions' chronic problems. While responding toemergencies will always be a part of government responsi-bility, policy makers must focus on developing long-termstrategies that reduce semi-arid regions' vulnerability to theconsequences of climatic events (Wilhite, this volume).Resilient and dynamic economic development, unlike emerg-ency, stop-gap measures, holds more hope for semi-aridregions' economies, their ecosystems, and the people inthem.
Regional development strategies for semi-arid regionsoften focus on diversifying regional production, particularlythrough industrialization (Goldsmith and Wilson 1991;Magalhaes and Glantz 1992). The hope is that a dynamiceconomic process will set in, where local businesses and firmswill develop to meet industrial input needs, generating anintegrated and thriving economy. This strategy is particu-larly attractive in areas where agriculture is susceptible towide output variations associated with periodic droughts.Focusing on industries, manufacturing, and product pro-cessing industries that are not directly dependent on rain oragricultural inputs can buffer the economy from the vagariesof weather. This strategy, however, is frustrated by thestructural limitations of semi-arid regions. The relativedominance of agricultural production, and the dominance ofsubsistence agriculture in terms of the economically activepopulation, lead to demand structures in semi-arid regionswhich are highly variable, coinciding with drought events. Asa consequence, the expected local multiplier effect of indus-trial development is hampered, local marketing and repairshop networks do not develop, and it becomes easier forindustries and manufacturers to obtain inputs and market

36 I OVERVIEW
products outside the region from more stable sources in moredeveloped areas (Goldsmith and Wilson 1991). The result iswell-developed economic linkages with industrial areas andmarkets outside the semi-arid region, and a disarticulatedand stagnant economy within. For the countries of the Sahel,where the entire national territory is often within the semi-arid region, reliance on outside markets for non-agriculturaldevelopment places them at the mercy of the fluctuations andgenerally unfavorable terms of international productmarkets, resulting in large deficits and continual dependenceon foreign aid (Watts 1987a; Mackintosh 1990).
This analysis demonstrates the importance of developing aviable local demand structure within semi-arid regions.Without sufficient local demand, no amount of local productdiversification will lead to an economic dynamism necessaryto absorb labor from the rural sector. At best, a small sectorof well-off industries will develop that are less vulnerable toclimatic events than the rest of the local economy.
Development strategies must increase agricultural outputand income, and absorb labor. Increasing farm output andincomes provides the basis for increased demand structure,and labor-intensive activities absorb under- and unemployedlabor (Perrings 1991; Lemos and Mera 1992). As farmincomes increase, consumer demand at the local levelincreases. Increased demand for consumer products causeslocal businesses to expand and new ones to form. Part-timeworkers are employed full-time, and new workers are takenon. As the regional economy diversifies it becomes lesssusceptible to climatic events. Increased incomes and secur-ity allow producers to invest in improving their farm man-agement practices such as mechanization, irrigation and useof improved seeds. These measures often increase thenumber of crops possible each year, thus increasing year-round agricultural employment and the need for local distri-butors, repair shops, etc. Hence, the multiplier effect ofincreased farm output and increased incomes can contributeto integrated and sustainable rural economic development(Ranis and Stewart 1987; Storper 1991; Timmer 1992).
As argued in the section on technological responses inagriculture, government interventions to increase agricul-tural productivity must be focused on technologies, institu-tions and infrastructure that are compatible with producers'needs, present knowledge and adaptive capacities. Buildingon established coping strategies, strategies must be step-wiseimprovements that increase producers' resilience to climatevariation while increasing their ability to produce and save(Rodrigues et al 1992; Wang'ati, this volume). Clearly,increases in agricultural production and incomes must beaccompanied by opportunities to leave the agriculturalsector. Income-earning alternatives such as commerce,service, and small-scale or household manufacturing at thelocal level provide an exit response that can reduce out-migration to major urban centers where industrial and
service sectors are insufficient to absorb all the excess rurallabor (Perrings 1991; Gomes et al. 1992).
Farm income increases in a highly stratified economy tendto accrue predominantly to the already better-off becauseaccess to inputs such as credit, irrigation technologies andwater, new seed varieties, etc., is shaped by socioeconomicstanding and politics (Demo 1989; Lemos and Mera 1992;O'Brien and Liverman, this volume). Larger producers tendto spend more of their increased income outside the localarea, in large cities, while small producers, who are lessmobile, consume more locally, contributing more to the localeconomy. Inputs and markets for commercial agriculturealso tend to be located outside the region, particularly in adisarticulated, subsistence economy. A context of skewedland holdings, therefore, will tend to retard any multipliereffects of increased incomes in the rural sector.
These observations lead to two conclusions. The first isthat land distribution is a critical issue. The second is thatparticular emphasis must be placed on increasing small-holder output and incomes (including the creation of jobopportunities in other sectors). Large agricultural produc-tion and industrial sectors already receive significant govern-ment attention and support relative to smallholdings, andgenerally experience dynamic growth relative to the small-holder agricultural sector. The task is not to focus on poorpeasant farmers at the expense of large, and typically moredynamic agriculture and industry. Rather, it is to provide thenecessary opportunities to smallholders and landlesspeasants so that they can enter into a process of dynamiceconomic growth.
Below we discuss several important factors that need to beconsidered when structuring policies that will foster dynamicagricultural growth.
InfrastructureWater storage and irrigation are the first interventions thatpolicy makers think of when trying to improve agriculturaloutput and reduce vulnerability to the consequences ofclimate variation. Yet building reservoirs is not sufficient.Careful attention must be paid to the ecological ramifi-cations of this approach, to who is going to have access toirrigation water, and to how this access will be controlled.(See the discussion of technological responses, below, for amore detailed discussion of irrigation technologies.) This isparticularly important when water infrastructure projectsare managed by the private sector, where market-baseddistribution of benefits will tend to exclude those most inneed. Alternative water storage and distribution technolo-gies may be more appropriate to local management practicesand social networks (Moench \99lb; Courcier and Sabourin1992) (see Box 4). Policy makers must assess the viability ofmultiple-scale and technology alternatives.
In general, irrigated agriculture involves a higher level of
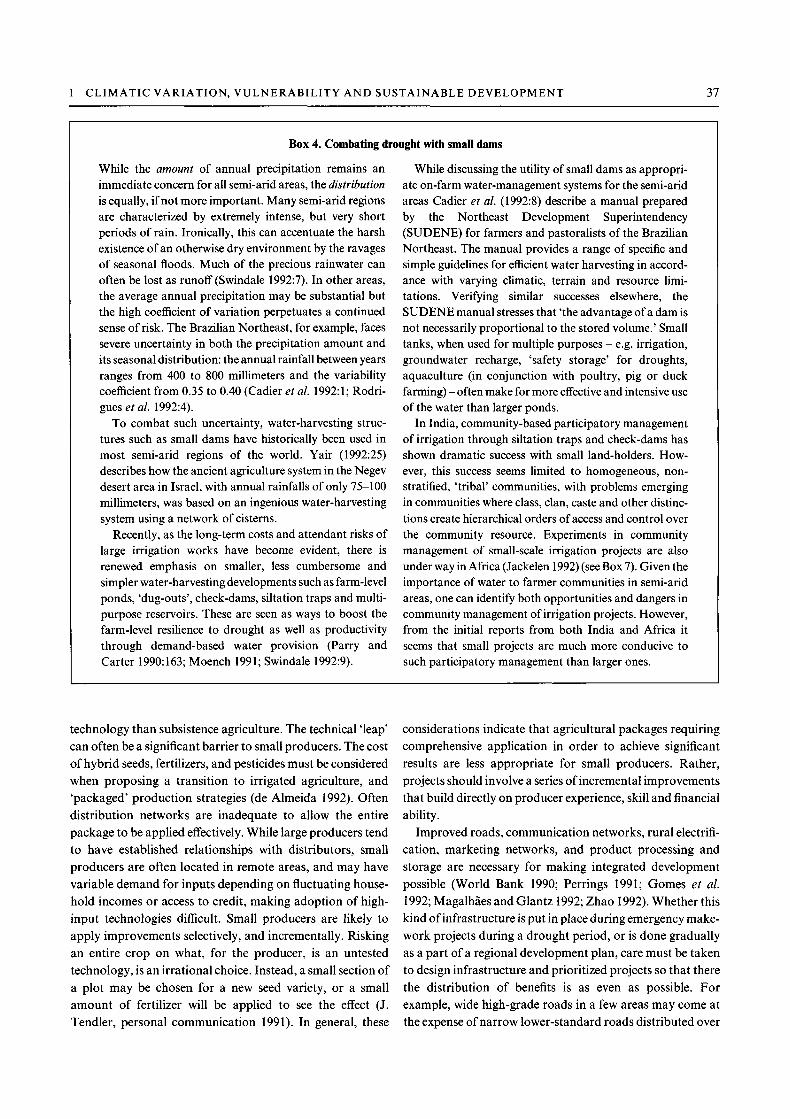
1 CLIMATIC VARIATION, VULNERABILITY AND SUSTAINABLE DEVELOPMENT 37
Box 4. Combating drought with small dams
While the amount of annual precipitation remains animmediate concern for all semi-arid areas, the distributionis equally, if not more important. Many semi-arid regionsare characterized by extremely intense, but very shortperiods of rain. Ironically, this can accentuate the harshexistence of an otherwise dry environment by the ravagesof seasonal floods. Much of the precious rainwater canoften be lost as runoff (Swindale 1992:7). In other areas,the average annual precipitation may be substantial butthe high coefficient of variation perpetuates a continuedsense of risk. The Brazilian Northeast, for example, facessevere uncertainty in both the precipitation amount andits seasonal distribution: the annual rainfall between yearsranges from 400 to 800 millimeters and the variabilitycoefficient from 0.35 to 0.40 (Cadier et al. 1992:1; Rodri-gues et al. 1992:4).
To combat such uncertainty, water-harvesting struc-tures such as small dams have historically been used inmost semi-arid regions of the world. Yair (1992:25)describes how the ancient agriculture system in the Negevdesert area in Israel, with annual rainfalls of only 75-100millimeters, was based on an ingenious water-harvestingsystem using a network of cisterns.
Recently, as the long-term costs and attendant risks oflarge irrigation works have become evident, there isrenewed emphasis on smaller, less cumbersome andsimpler water-harvesting developments such as farm-levelponds, 'dug-outs', check-dams, siltation traps and multi-purpose reservoirs. These are seen as ways to boost thefarm-level resilience to drought as well as productivitythrough demand-based water provision (Parry andCarter 1990:163; Moench 1991; Swindale 1992:9).
While discussing the utility of small dams as appropri-ate on-farm water-management systems for the semi-aridareas Cadier et al. (1992:8) describe a manual preparedby the Northeast Development Superintendency(SUDENE) for farmers and pastoralists of the BrazilianNortheast. The manual provides a range of specific andsimple guidelines for efficient water harvesting in accord-ance with varying climatic, terrain and resource limi-tations. Verifying similar successes elsewhere, theSUDENE manual stresses that 'the advantage of a dam isnot necessarily proportional to the stored volume.' Smalltanks, when used for multiple purposes - e.g. irrigation,groundwater recharge, 'safety storage' for droughts,aquaculture (in conjunction with poultry, pig or duckfarming) - often make for more effective and intensive useof the water than larger ponds.
In India, community-based participatory managementof irrigation through siltation traps and check-dams hasshown dramatic success with small land-holders. How-ever, this success seems limited to homogeneous, non-stratified, 'tribal' communities, with problems emergingin communities where class, clan, caste and other distinc-tions create hierarchical orders of access and control overthe community resource. Experiments in communitymanagement of small-scale irrigation projects are alsounder way in Africa (Jackelen 1992) (see Box 7). Given theimportance of water to farmer communities in semi-aridareas, one can identify both opportunities and dangers incommunity management of irrigation projects. However,from the initial reports from both India and Africa itseems that small projects are much more conducive tosuch participatory management than larger ones.
technology than subsistence agriculture. The technical 'leap'can often be a significant barrier to small producers. The costof hybrid seeds, fertilizers, and pesticides must be consideredwhen proposing a transition to irrigated agriculture, and'packaged' production strategies (de Almeida 1992). Oftendistribution networks are inadequate to allow the entirepackage to be applied effectively. While large producers tendto have established relationships with distributors, smallproducers are often located in remote areas, and may havevariable demand for inputs depending on fluctuating house-hold incomes or access to credit, making adoption of high-input technologies difficult. Small producers are likely toapply improvements selectively, and incrementally. Riskingan entire crop on what, for the producer, is an untestedtechnology, is an irrational choice. Instead, a small section ofa plot may be chosen for a new seed variety, or a smallamount of fertilizer will be applied to see the effect (J.Tendler, personal communication 1991). In general, these
considerations indicate that agricultural packages requiringcomprehensive application in order to achieve significantresults are less appropriate for small producers. Rather,projects should involve a series of incremental improvementsthat build directly on producer experience, skill and financialability.
Improved roads, communication networks, rural electrifi-cation, marketing networks, and product processing andstorage are necessary for making integrated developmentpossible (World Bank 1990; Perrings 1991; Gomes et al.1992; Magalhaes and Glantz 1992; Zhao 1992). Whether thiskind of infrastructure is put in place during emergency make-work projects during a drought period, or is done graduallyas a part of a regional development plan, care must be takento design infrastructure and prioritized projects so that therethe distribution of benefits is as even as possible. Forexample, wide high-grade roads in a few areas may come atthe expense of narrow lower-standard roads distributed over

38 I OVERVIEW
a larger region. Narrower roads will go further, having amore extensive positive effect on the region. These kinds oftrade-offs are present in nearly every kind of infrastructureproject. A policy that is directed at improving the conditionsof the most vulnerable, and fostering an integrated economy,implies that the decision must benefit the greatest number ofpeople possible.
Semi-arid zones are seen as largely lacking in resources(water, soil nutrients, etc.), but they are rich in certainresources. Developing semi-arid regions must take fulladvantage of these resources. Solar, wind and geothermalenergy may provide viable alternatives to dependence onwater-based or non-renewable resource-based electricitygeneration (Wang'ati, this volume; Zhao, this volume).Development of both centralized and decentralized technol-ogies should be pursued, aiming at developing technologiesthat are easily implemented and not dependent on outsideinputs.
Credit, marketing and inputsSmall producers tend to go from season to season with a verylimited safety margin because nearly all their earnings andproduction are used for subsistence or extracted from thelocal economy. Savings are limited, or non-existent. Lack ofsavings limits their ability to diversify into alternativeincome-generating activities, or to invest in increasing theproductive capacity of their farms. This does not mean thatsmallholders are ill equipped to adopt improved manage-ment practices and technologies, or to diversify their econ-omic activities. On the contrary, subsistence agriculturalistsare by necessity diversifiers, adapters and survivors. Theirlack of investment capital is a significant barrier for theiradoption of more productive activities. Yet, as we argue,improving the productive capacity of smallholdings and thediversification of local economies within semi-arid regions isa basic requirement for regional development and economicgrowth. Credit is one possible solution to this barrier. Smallproducers, however, have less access to formal credit systemsthan better-off producers. Some have proposed alternativecredit institutions that are more accessible to small producers(Caron and Da Silva 1992) (see Box 5). These types of flexiblestrategies demonstrate how government policies can beformulated to address the needs of small producers, and tostructure projects that are responsive to them.
Problems of access to markets and productive inputs canconstitute a more significant barrier to economic growththan lack of credit. Government interventions through 'vari-able' incentives, such as product and input prices, taxes,subsidies, and 'user' charges are one way for governments tointervene in facilitating small-producer access to viable com-mercialization of their products (Perrings 1991). Prices andfinancial incentives represent only part of the access equa-
tion, however. Institutional barriers also block small-pro-ducer access to productive resources. Perrings (1991) calls foruser-enabling measures to correct these problems.These measures might include small grain storage facilities,small-producer product processing and marketing coopera-tives, and management structures for common propertyresources such as grazing areas, water and forests.
Human resource developmentEducation, health care, safe water supplies and sanitation,and vocational training all fall within the area of humanresource development. Projects and programs of these sortscan be grouped into two categories, based on the policyintent. On the one hand, developing human resources meansinsuring a basic level of wellbeing, related to life expectancy,health, literacy, etc. On the other hand, it means creating thecapacity for people to increase their own wellbeing throughdiversification into more profitable activities, or improvingcurrent techniques. The two concepts are clearly related.Without the first, the second is impossible. However, thedistinction is helpful in structuring government investmentpolicies. Training that provides skills needed in growingsectors will enable people to move readily into economicallyviable activities while also contributing to the dynamicgrowth of the region. Conversely, training for activitieswhich are needed outside of the region can facilitate out-migration when better opportunities are available elsewhere(Wang'ati, this volume).
Agricultural extension and training play a significant rolein disseminating new technologies and inputs, responding toproducer emergency needs, and developing adapted technol-ogies that reflect the specific soil, water and landholding sizeagriculturalists are working within. Projects and programsdealing with agricultural research and extension must beoriented towards the needs of small producers, and beappropriate to cultivation limitations inherent in semi-aridregions. Ideally, these programs should develop institutionallinks with entities at the local level to broaden the dissemina-tion of new adaptive technologies and techniques, and tomake local decision makers aware of the need for sustainableand appropriate development policies (Rodrigues et al.1992).
Alternative income opportunitiesMuch analysis of semi-arid regions focuses on the pressuresof a growing population. This observation is useful only tothe extent that it signals a shortage of opportunities availableto people living in semi-arid regions. Rather than focusingsolely on fertility controls - which are politically charged,difficult to implement, and of questionable efficacy - policiesshould also focus on improving the options available topeople. As mentioned earlier, efforts to equip semi-aridpopulations with skills that are useful outside agriculture, or

1 CLIMATIC VARIATION, VULNERABILITY AND SUSTAINABLE DEVELOPMENT 39
Box 5. Credit for small producers
Small producers, though often viewed as a liability toregional development, can be an engine for growth.Caron and Da Silva (1992) note that by diversifying theirproduction mix, small producers hedge against theimpacts of drought, floods and frost. They argue thatencouraging this kind of diversification can not only pullsmall producers out of a cycle of poverty, but stimulaterural growth. By making small-scale commercial activitiespossible for the rural poor, development programs canhelp buffer farmers against climate variability and changewhile stimulating rural dynamism and development withminimum external resources (Caron and Da Silva1992:8).
Rural families often 'place' family members in alterna-tive activities in order to insure a minimum family incomeat all times. This may involve: sending a family member tothe city to earn wages, raising livestock, introducingtechnological improvements, wage work on others farms,or producing commercial products for supplementalincome in case crops fail. Increasing rural incomesprovides a foundation for development of local servicesector employment through increased consumer expendi-tures by farm households. Focusing on small-scale pro-ducers is a key element in this growth strategy becausesmallholders, unlike large rural producers, tend to uselabor-intensive technologies, rely on local materials andlocal craft people for repairs, and spend the majority oftheir incomes on local goods and services (Ranis andStewart 1987). Yet small producers are often unable todiversify into profitable activities because they lack capi-tal for investment.
Not only do small producers have little surplus toreinvest, but the formal credit system rarely reaches them(Caron and Da Silva 1992). With no credit history, andlittle or no collateral, few banks want to lend to smallfarmers. Further, the small size of the loan, the timeneeded to process each loan, and the difficulty of lendingto often first-time borrowers who may need assistancereading and filling out the forms, all lead lending institu-tions to shy away from small rural loans (Tendler 1989).Lending institutions that broker small loans for largerbanks, such as the Grameen Bank of Bangladesh, can takeon these 'difficult' tasks. They provide an example of howcredit can work for small rural producers (Caron and DaSilva 1992). By processing loan applications, providingtechnical assistance for new production activities, these'banks' have had a significant measure of success wherethey have been implemented. Because the lending institu-tion works closely with the borrowers, it is able to assessborrowers' ability to repay, independent of collateral andcredit history information. The lenders insure repaymentby setting up borrowers' groups mutually to enforce
repayment among members. Group members only benefitif previous group loans are repaid, thus creating strongsocial pressure against default.
The alternative credit schemes, however, are not with-out their problems. One significant issue is the timerequired for borrowers. The 'solidarity' borrowing groupmust work cooperatively, or at minimum monitor eachother's repayments. This can be a time-consumingactivity. People who are excluded from traditional lendinginstitutions also tend to be quite poor. They spend nearlyall their time in subsistence activities, and are hardly ableto afford this 'extra' time (Boviniv 1986). These programshave been difficult to replicate and expand (Biggs et al.1990). Much of their success depends on the direct face-to-face contact between the loan broker and the borrower toestablish a basis of trust and security that the loan willindeed be repaid. This relationship takes time to develop,or local residents must be discovered who can fill this role.Support for income diversification into small-scale enter-prises can also serve simply to 'diversify subsistence'without increasing people's standard of living. The proli-feration of similar micro-enterprises increases horizontalcompetition, reduces profits, and increases labor exploi-tation (Biggs etal. 1990).
Further, credit is not always the key bottleneck todeveloping a commercial activity. Often lack of access tomarkets, inputs and technical training prevents peoplefrom starting small enterprises. If these obstacles are notovercome, the chance of default is high (Kilby 1979;Schmitz 1982; Tendler 1989). Policies must therefore bedesigned with all of these considerations in mind.Research shows that diversifying income generatingactivities into small-scale enterprises works best whenthey are located in an agglomeration of complementaryfirms. The backward and forward linkages among smallfirms help insure access to inputs and markets, and enablethe smaller firms to achieve economies of scale andinvestment jumps in new technologies that each firm on itsown could not manage (Kilby 1979; Peattie 1979; Chen1986; Schmitz 1990; Storper 1991).
A number of policy interventions emerge from theabove discussion. The first involves finding the bottle-neck, or missing piece in an otherwise thriving environ-ment of firms within a larger agglomeration of firmsproviding related goods and services (Kilby 1979; Chen1986; Tendler 1989). For rural semi-arid regions, thismeans activities that are tied to the dynamic portions ofthe economy, typically the non-farm sector (World Bank1990). Credit is the most common form that the 'missingpiece' strategy takes, though technical assistance, market-ing and input provision are other examples. Ideally, policyinterventions should link services or assist the flow of

40 I OVERVIEW
Box 5. (cont.)
inputs and products among existing local firms, allowingidle capacity to be brought into use, rather than trying tocreate new skills and activities (Kilby 1979). Interventionsthat permit workers in small-scale enterprises to engage in
multiple tasks - whether various income-earning activi-ties, or a combination of income-earning and householdactivities - allows the enterprise activity to fit into thebeneficiaries' multiple needs.
even outside the semi-arid regions, is one way to enablepeople to rise above their bare subsistence condition and toreduce pressures on the land (see, for example, Santibaiiez1992:41). Unless there are income-earning opportunitieswaiting for them elsewhere, however, there is little hope forsuch a strategy. It must therefore be linked to deliberateefforts to create new jobs and income-earning activities insemi-arid regions, and to foster the growth of alternativeactivities such as marketing, intermediary goods productionand services. Directing credit for these activities, providingsubsidies for start-up enterprises, and creating physical andfinancial infrastructure will facilitate their emergence.
Emergency responsesThere will always be a need for emergency responses toclimate events in semi-arid regions (see Wilhite, this volume).No matter how well adapted we are to climate variations,there will always be events which exceed adaptive structures.There are, however, ways to reduce the likelihood that wewill be caught by surprise by climate events, or that whensevere events occur we are completely unprepared to respond(Wang'ati, this volume). Significant advances have alreadybeen made in developing forecasting and early-warningmechanisms (Downing 1992). The task at this point is toincrease the link between institutions that have forecastingcapabilities and local agencies responsible for responding toemerging crises (Servain et al 1992; Cochonneau and Sechet1992; Soares et al. 1992). Gomes, et al. (1992) argue, forexample, that the lack of coordination and communicationamong institutions within the Brazilian semi-arid regionleads to ineffectual responses to crisis. This situation must beaddressed. While much of the large-scale early-warninginformation is international in scope, there must be well-established links to the regional and local levels. In this way,not only will semi-arid regions be more prepared to deal withsevere climatic events, but scientists and policy makers willlearn more about the interrelationships between climate andenvironment.
ConclusionThis discussion is a cursory review of strategies andapproaches that can foster adaptive strategies to the severeclimate variability of semi-arid regions. It has not been an
exhaustive discussion, but rather an indication of the kind ofanalytical orientation that is needed in order to address themultifaceted problems facing policy makers at the national,regional and local levels in semi-arid regions. Like anyadaptive strategy, policy approaches will themselves evolveas we learn more about the interrelationships between cli-mate and environment, and among the multiple spheres ofsociety - economics, politics, technology, environment andculture. Each region and country must find those strategiesthat are most suited to its own particular conditions, limi-tations and capabilities. None of the strategies discussed hereare panaceas for the triple burden of underdevelopment,marginalization and climate variation. Instead, they attemptto point to a more hopeful future for these regions, which willonly come about through significant effort by policy makers,local entities and the local population.
Technological responses in agriculture
IntroductionTrying to respond to the natural fragility of semi-arid areasby applying unidimensional technical fixes without consider-ing the socioeconomic and cultural context within which theyare applied can often lead to disastrous results (Glantz1989:63). The challenge to policy makers is to show that theyare able to develop technical responses to climate variabilityand change that are sensitive to the social context in whichthey are to be applied. Fortunately, there is ample reason tobelieve this can be done. In this section we investigate some ofthe dominant technological responses that have been appliedin response to climate variability in semi-arid areas. Each hasstrengths as well as limitations, opportunities as well aspitfalls. The difference between understanding or ignoringthese is often the difference between success and failure.
Technology has many faces. It ranges from the newestinputs and the most 'high technology' practices, to tra-ditional methods of cultivation. The objective of modern,high technology systems is to maximize profit or yield, usingimproved crop varieties and livestock breeds, along withfertilizers, herbicides, pesticides and mechanization. The aimof many traditional systems is to minimize year-to-yearvariation in productivity and, especially, to minimize the riskof total loss (Scott 1976; Popkin 1979; Hyden 1980). The

1 CLIMATIC VARIATION, VULNERABILITY AND SUSTAINABLE DEVELOPMENT 41
price of this stability is often foregone potential yield. Theprice of modern, high-yield systems is the lack of a safety net,should the crop fail. Before any technological response canbe introduced a thorough understanding of the existingsystems, and their internal interactions and dynamics, isnecessary. Equally, while estimation of risk levels is anessential component of agriculture analysis, the level of'riskacceptance' and 'risk affordability' must also be taken intoaccount (Nix 1985:107). Policy makers can learn from tra-ditional coping strategies used by indigenous communities inthe search for appropriate technological responses to climatevariability.
Below we discuss soil and crop management, water man-agement, high-input agriculture and pastoralism. This isneither an exhaustive list nor an exhaustive critique of theavailable technological options. The aim is to lay out a broadspectrum of major issues and discuss their relation to climatevariability and change, particularly the latter as projected bymajor general circulation models. In general, any response isonly as good as its compatibility with the context - physical,climatological, socioeconomic and cultural - to which it isapplied. Its viability depends not on the technology alone,but on how it is managed and where it is used.
Soil and crop managementSoil degradation is probably the most significant threat tosustainable agriculture. Attempts to extend agriculture byexpanding agriculture onto marginal soils accelerates theprocess. Soil erosion, deterioration of soil structure, loss ofnutrients or nutrient holding capacity, build-up of salts andtoxic elements, waterlogging, acidification, etc., remain con-stant threats to cultivated tracts in the semi-arid regions. Soilerosion is particularly disturbing due to its high replacementcosts.
Soil degradation is largely a function of poor crop man-agement. Yet, even on poor soils (like those often found insemi-arid areas) it can be brought under control. For exam-ple, inter-cropping, crop-pasture association, using cropswith different root distribution patterns, crop rotations, alleycropping, ridging, terracing, mulching, and zero or minimumtillage check soil degradation while also promoting moistureretention (Watts 19876:179; Huss-Ashmore 1989:27; Swin-dale 1992:7). Good soil management is the key to haltingdryland degradation, or desertification.
Traditional cropping strategies have evolved sophisticatedmanagement practices to maintain soil quality (Huss-Ash-more 1989:28; GOP/IUCN 1991). Increasingly, however, theability of marginalized farmers and pastoralists to maintaintraditional soil and farm management practices is beingthreatened. For example, the beneficial effects of soil organicmatter in both improving soil quality and preventing surfacedegradation is well known to farmers. As access to the
commons decreases or when market prices increase, compet-ing demands for dung and crop residues can trap farmersinto practices that they know are not sustainable. Dung, forexample, may be burned rather than plowed into the soil asfirewood supplies grow scarce or too expensive.
Since plant cover is often sparse in semi-arid regions,evaporation from the soil surface can be a significant portionof the total evapotranspiration. With climate change somemodels project increased rates of evaporation due toincreased temperatures (Rosenberg and Crosson 1992;Cohen et al 1992; Schmandt and Ward 1992; Downing 1992;O'Brien and Liverman, this volume). Increasing low-water-demand plant cover, either in the form of food and cash cropsor in fodder crops and grasses, is an obvious and importantresponse, especially since a simultaneous increase in netprecipitation is also projected.
Salinity is a problem for semi-arid lands, especially underwarmer climate regimes. But it can be turned to advantagethrough better management practices if the existing infor-mation and experience about saline agriculture is utilized.Headway is already being made in employing salt-tolerantcrop and grass species. Fodder crops, in particular, can begrown on fairly poor soils with highly saline water to supportlivestock (GOP/IUCN 1991).
Water managementSemi-arid areas are characterized by rainfall variabilitiesboth in quantity and in spatial and temporal distribution.Wherever more regular and abundant sources of water areavailable nearby or where erratic or insufficient rains meritthe creation of artificial water reservoirs, irrigation hashistorically been seen as an ideal response to climate varia-bility. Many irrigation systems have a long record of success;from once being considered famine-prone, the dry plains ofChina and India are major food producers today. Mexico,Pakistan and Egypt have been equally successful in enhanc-ing their agricultural production through intensive irrigation(GOP/IUCN 1991).
Yet the success of many irrigation systems has not comewithout its economic, ecological and social price (Swindale1992:12; Selvarajan and Sinha 1992:2). Salinity, drainagedeficiencies, waterlogging, compaction and siltation are justa few of the attendant problems which, if severe enough,become the precursors of desertification. With the expansionof intensive, high-input agriculture - often on soils unpre-pared for the burden - the problems are compounded (see thesection on High-input Agriculture below). While agriculturaloperations can cause salinity problems even in rainfed areas,salinity is most chronic in irrigated soils. Use of unlinedcanals, sinking of tube-wells into salt-bearing strata, inade-quate drainage and poor water and crop management com-bine in irrigated tracts to reduce water and soil quality. This

42 I OVERVIEW
can substantially decrease land productivity and seriouslyaffect the quality of drinking water (Swindale 1992:6).
Where irrigation systems or their management aredivorced from local social realities they can increase, ratherthan reduce, vulnerability to the impacts of climatic varia-tions and change (O'Brien and Liverman, this volume). Theinformation in Box 6, which deals with irrigation, shows thatit is not irrigation itself, but how and where it is used thataggravates soil degradation. Access and distributional issuesof irrigation are germane to all technological interventions.The section on Governmental, Institutional and Policy Res-ponses above, discusses these issues in more detail.
More emphasis and attention has now turned to smaller-scale developments such as farm ponds, 'dug outs,' siltationtraps and small multi-purpose reservoirs (Parry and Carter1990:163; Swindale 1992:9; Wang'ati, this volume) (see Box4). The aim is to retain the precious rainfall that is so oftenlost in semi-arid areas due to high runoffs, while improvingwater-use efficiency. Many of the crop management practicesdiscussed earlier serve the same purposes.
More effective use of groundwater can reduce risk of cropfailure in uncertain climates, while also circumventing theneed for large and cumbersome water distribution systems(Zhao, this volume). For example, in Mali a pilot project forhigh-input agriculture with water-pumps is already underway (see Box 7) (Jackelen 1992). The use of dug-wells byIndian farmers for preventing crop losses when temporaryrainfall deficits occur, or to recharge soil moisture storagebefore planting a dry season crop, has contributed substan-tially to improved farm livelihoods. The use of tube-wells inirrigated plains of Pakistan has similarly given the farmer asolution to waterlogging as well as a source of demand-basedwater provision. In many desert areas there are vast fossilwater supplies which can be exploited for agricultural use(Swindale 1992:9). Groundwater depletion is a risk whererecharge rates are slow. Therefore, it is essential to use wateras efficiently as possible, employing sprinkler or drip irriga-tion technologies, or other labor-intensive technologies thatachieve the same level of efficiency (GOP/IUCN 1991).
High-input agricultureThe thrust toward intensive agriculture stems not just fromtechnological advances in irrigation systems, fertilizers, seedvarieties and hybrid development, but as much, if not more,from population and government policy pressures. Withprojected change and uncertainty in climatic regimes com-pounding the already strenuous pressures on the semi-aridzones, high-input agriculture may become a necessarymeasure for combating vulnerability in some areas (see, forexample, Box 7).
Improved cultivars are capable of delivering bumper cropsin good years. Examples of the success of high-input agricul-
ture in comparatively well endowed (particularly irrigated)semi-arid lands provides optimism (Selvarajan and Sinha1992). Yet the need for caution must be emphasized (GOP/IUCN 1991). High-input, mono-crop agriculture lacks the'safety net' built into traditional systems which use multiplenative varieties and rarely experience complete systemfailure. Further, reliable water supplies, nutrient-rich soilsand high technological investments are just a few of theprerequisites for the sustained success of intensive, high-input agriculture. On the more risk-prone rainfed tracts,mounting pressures of production and increasing climateuncertainty could force farmers to adopt intensive agricul-ture with unsustainable, if not disastrous, results (GOP/IUCN 1991; O'Brien and Liverman, this volume).
Experience points toward homogeneity and the loss ofsustainability being conspicuously and directly related. Pestsand diseases will always reduce crop yields to some extent,but their effects are more devastating when mixed cropping isreplaced by mono-cropping and varieties are replaced byhybrids. The technological response to this technology-driven problem is chemical control (Swindale 1992:3). Whilepests quickly become immune to pesticides, the latteraccumulate and contaminate food and water systems. Theuse of integrated pest management techniques shows signifi-cant potential in resolving this problem (Swindale 1992).Some stability of crop production may be achieved byvarying fertilizer applications to offset anomalous climaticconditions (Parry and Carter 1990:161). Since many semi-arid soils are deficient in organic matter and are furtherdegraded by soil erosion, increased fertilizer application islikely to be an important response strategy.
In general, it is now being acknowledged that excessivecrop specialization should be avoided, despite the short-termeconomic benefits it provides. Increasing environmentalawareness has stimulated research into alternative agricul-tural practices, with particular emphasis on learning not onlyfrom past follies of intensive agriculture but also from theresilience of traditional systems. The value of crop rotation,multi-cropping, mixed farming, use of cover crops andrecycling of agricultural wastes is being recognized (Richards1985). Most importantly, it is finally being recognized thatbuilding upon traditional wisdom and grounding strategiesin the realities of specific socioeconomic and natural systemscan lead to increased and more stable production potentials(Huss-Ashmore 1989:28; Swindale 1992).
PastoralismLe Houerou (1985:155) defines pastoralism as the 'unsettledand non-commercial husbandry of domestic animals' andestimates a pastoralist population of 60 to 70 million people(in 1985), mainly in Africa and Asia. He points out thatpastoralism is 'essentially - but not solely - a form of

1 CLIMATIC VARIATION, VULNERABILITY AND SUSTAINABLE DEVELOPMENT 43
Box 6. Irrigating semi-arid lands
Buffering farmers in the semi-arid regions from the effectsof recurrent droughts and erratic rainfall patterns iscrucial to achieving agricultural sustainability (Swindale1992:10). From historic to contemporary times, irrigationhas been a favored response for providing such a buffer.From 137 million hectares (Mha) in 1961, the globalirrigated area has increased to 219.7 Mha in 1988 -predominantly in Asia; two-thirds in developing coun-tries; and 91 % concentrated in 30 countries. In Asia, 30%of the farms are irrigated; in Africa, the share is less than2%, although the country with the greatest dependenceon irrigation is Egypt (Nemec 1988:217).
Large-scale irrigation works have been the mainstay ofdrought policy in many semi-arid areas in recent decades(Parry and Carter 1990:163). Irrigation has dramaticallyincreased crop production in many countries (notablyIndia, Pakistan, Mexico, Egypt). Yet it is equally wellestablished that irrigation, when managed improperlyand/or when incompatible with the area's ecological,social and economic characteristics, can become a disasterfor semi-arid areas and a major anthropogenic cause ofdesertification (Glantz 1989:66; Rodrigues et al 1992:7).
Large-scale irrigation works being one of the mostintense forms of human interference in the hydrologicalcycle, can sometimes leave deep scars. Native vegetationand fauna are often the first victims of the huge civilstructures required for massive irrigation initiatives.Creation of 'irrigation refugees' (those displaced by thestructures of irrigation as well as those whose small landparcels fall prey to the requirements of larger holdings forintensive irrigated agriculture) follows soon after. Asdenudation and mono-culture result in vermin and pestinvasions the immediate use of pesticides accelerates.Mismanaged irrigation works can also lead to a wholehost of technical problems pertaining to drainage, water-logging, loss of water quality, siltation, compaction andsalinization. In addition, there are the socioeconomicproblems that may arise from subsidized water pricing,unfair access to and control of the resource, marginaliza-tion of smallholders, inequities in distribution of benefits,and proliferation of water-borne diseases (Horowitz1991; Rodrigues et al 1992:7-9).
Valdemar Rodrigues et al (1992:9) reports that in theBrazilian Northeast a target of bringing 600000 ha ofsemi-arid lands under irrigation (from 261000 ha in 1980)is now under way in the expectation that irrigated agricul-ture will provide 20 times the yield of dryland cultivation.However, he quotes the department of drought reliefworks as reporting that 20% of the area already irrigatedis facing problems of salinization, compaction or flood-ing. J. C. Silva (1988, quoted in Rodrigues et al 1992:6)estimates this figure to be 30%, reaching 50% in certain
areas. As Rodrigues puts it, profits originating fromirrigation correspond to the losses from salinization;however, while the profits are whisked away to outsidemarkets, the losses accumulate on the land.
Yet, by balancing these problems, there have been largeincreases in production of staples such as rice and wheatthat have been crucial to reducing food deficits in manydeveloping countries (often in the semi-arid zones) sincethe early 1970s. In large part, these increases are derivedfrom technological improvements in irrigated agriculture.This has directly reduced vulnerability in the face ofdrought. The argument, then, is not so much againstirrigation, as against the mismanagement of large and/orincompatible irrigation systems (Swindale 1992:12).
This realization, coupled with an increasing acknow-ledgment of the long-term economic and ecological costsof extensive irrigation works, has already set in; after apeak in the 1970s there is now a marked decrease in theexpansion of large irrigation networks (Nemec 1988:218;Swindale 1992:8). The same realization has spurred theneed for a renewed emphasis on efforts to improve theefficiency of existing schemes through reduction in see-page and other losses; control of salinization, waterlog-ging and siltation; improved management of watersheds,water distribution and water use; and greater involvementof farmers and end-users for more equitable and efficientmanagement of systems (Swindale 1992:12).
Fortunately, effective research programs are alreadyunder way in several developing countries with dry cli-mates, including India, Pakistan and Egypt (Swindale1992:8). Substantial information exists on issues such assaline agriculture, groundwater utilization, salt-tolerantspecies, drainage and no-tillage agriculture. This infor-mation promises to lead toward better utilization ofexisting systems as well as development of more efficient,site-appropriate irrigation technologies for the future.
A recent report on recommendations for drylandsresearch (UCAR 1991:13) points out that although irriga-tion does reduce the susceptibility of agriculture to thevagaries of climate, in the longer run, irrigated agricultureis limited by the physical environment. Technologicaladvances have not changed these limitations dramati-cally. In 1878, at the start of scientific management of aridlands, it was reported that less than 3% of Utah (USA)was suitable for irrigation. A 1954 study stated, 'Nobodyhas corrected that notably since; in 1945 the cultivatedarea of the state, including dry farms, was 3%' (UCAR1992:13).
It is in acknowledging and respecting the limitations ofthe physical, climatological and social environments -and of technological frontiers - that the future and successof irrigation in semi-arid areas depends.

44 I OVERVIEW
Box 7. Financing pumped irrigation along the Upper Niger River
Located in the Sahel, Mali is one of the poorest countriesin the world, with a per capita income of US$ 185 perannum (1988). The Timbuktu region in Northern Mali ischaracterized by desert and semi-arid terrain, food defi-ciency, and poor means of transport and communication.Here, along the floodplain of the Upper Niger Riverwhere the rural settlements are concentrated, a uniquevariety of 'floating' rice has been the traditional staplecrop; one which has provided predominantly subsistencecommunities with the ability to cope with their harshenvironment.
Sown prior to the flood season, using broadcast meth-ods, this remarkable variety grows with the rising floodtides and is harvested on small boats after the stalks arebetween 2 to 3 meters high. With yields of between 0.50and 0.75 tonnes per hectare the indigenous variety doesnot compare well with other rice species that can produce4-6 tonnes per hectare in the same area. However, this ismore than compensated for by the fact that floating ricerequires little labor, no inputs and is grown on extensivefloodplains, where land supply is not a constraint.
With the average rainfall decreasing by nearly a thirdfrom 215 millimeters (1950-1967) to 145 millimeters(1968-1985), the risk to the system increased as droughtsintensified, triggering population dislocations and famineconditions during the late 1970s and 1980s. In his paper'Economic interventions in the changing environment ofa semi-arid zone' Jackelen (1992) describes one approachtaken to mitigate the situation.
While the floods were still reliable enough to justify thecontinued planting of traditional varieties, the decrease intheir level from historic averages and the increasinginfrequency of the humid surfaces required for plantingand seed germination constituted an emergency situationrequiring an immediately applicable solution. The UnitedNations Capital Development Fund (UNCDF) con-sidered that the introduction of small pumps (2-5 horse-power) and sprinkler systems to maintain the use of thefloodplain for growing traditional varieties was toountried, complex and cost-ineffective a solution. Insteadthey decided to intervene by encouraging land- andcapital-intensive agriculture using 25 horsepower motorpumps for small-scale (20 hectares) irrigated perimetersand introducing high-input rice varieties.
The choice was based primarily on the known successesof the technology and the fact the enhanced productivity(8-10 times the normal yield) would allow for carryingrecurrent costs (both inputs and amortization of pumps)at 20-30% of total production. However, it was recog-nized that the communities - characterized by low educa-tion, stark poverty, hierarchical social structures and littleexperience in land intensive cultivation - would require
adaptation to high-input agriculture; technical upkeep ofmotor pumps; financial management for procuring diesel,oil, phosphate, urea and seeds from season to season(amounting in cash and stocks totalling US$ 20000-40000) and amortizing the cost of motor pumps (US$20000) over their working life of eight seasons; success-fully marketing considerable quantities of paddy; andensuring a high level of social cooperation, managementand participation.
Between 1983 and 1985 eight communities constitutingsome 2000 families (total population approximately14000) were targeted. Intensive negotiations resulted inthe creation of informal but functional Village Associa-tions in each community, with elected Executive Com-mittees entrusted with all financial and managementresponsibilities. On average, each community wasrequired to organize and provide a work force of 400-500workers for 3-4 days a week during the period of 4months. Thus, for the overall project, 250000 work-dayswere mobilized, two-thirds paid in food from the WorldFood Program and one-third voluntary.
With all eight communities having had 5 or more yearsof production, technical assessments indicate that despitethe harsh environment, minimal government support andlow maintenance facilities (for motor pumps), the intro-duced technology and practices proved appropriate to theneeds and capacities of the communities. The target yieldfor the project was set at 4 tonnes per hectare to allow allrecurring costs to be covered with less than 30% ofproduction. In 1990, only two of the eight communitiesfailed to achieve this target (3.1 and 3.5 tonnes perhectare), two produced substantially above it (6.1 and 5.3tonnes per hectare), while the remaining four producedaround the target (5.0,4.7,4.3 and 4.0 tonnes per hectare).
The management of revolving funds by the communityhas, however, produced mixed results, with half thecommunities in a poor position to amortize the motorpump costs. Even though inputs for the first 2 years wereincluded in the project cost, the relative magnitude of cashand stocks to be replenished and managed yearly (up toUS$ 40 000) was itself a significant factor. In addition,each season required US$ 2500 per motor pump to beplaced aside for future replacement (a pro rata calculationper household reveals that the amortizement is roughlyequivalent to 125 kilograms of paddy per season). Whilethe communities demonstrated an appreciable under-standing of the need to replenish inputs each season, thecomplex mechanisms for calculation and recovery of themotor pump amortization resulted in an understandablereticence on the part of the members to deliver.
As its most valuable lesson the project highlighted theimportance of a simplified, easily understood and easily

1 CLIMATIC VARIATION, VULNERABILITY AND SUSTAINABLE DEVELOPMENT 45
Box 7. (cont.)
operable system for the management of communityfinances. While affordability was not the only factor in thelack of repayment, it is noted that since production doesnot represent commercial surpluses and requires a deduc-tion of 20-30% each year, an alternative to straightrepayments could be envisioned in the form of loanrepayments. This highlights the criticality of focusing oncredit financing activities, which could range from handi-crafts or livestock forming the basis of micro-lendingprograms to use of small pumps for traditional agricul-ture or replacement of motor pumps through creditschemes. Communities that have demonstrated strongsocial structures for managing and honoring their finan-
cial commitments are, in effect, self-selected candidatesfor becoming the nucleus of 'community banking' onwhich to base more complex activities for upgradingsocial infrastructure and diversifying production.
In addition, it is still unclear whether this type ofscheme increases or decreases subsistence vulnerability,since these interventions create dependence on externalsources (markets and state agencies) for seed, fertilizer,equipment and fuel. The supply of such inputs is particu-larly precarious in remote regions, and their affordabilitycan easily be affected by fluctuating prices of either inputsor the resulting crops, while their availability can bedisrupted by state policies, conflicts or other events.
adaptation of human societies to hazards and hardshipsinduced, and imposed on them, by climatic constraints.'
Recent famines in the Sahel and the subsequent plight ofthe pastoralists have focused attention on pastoralism, par-ticularly in the context of projected climate change. Thepresent state of crisis is often attributed to anthropogenicimpacts such as overstocking, wood-cutting, bush-fires,'wild' water development, and expansion of intensive culti-vation. Le Houerou (1985:173) and Watts (1987a:295), how-ever, describe how herders in Africa utilize complex socialrelationships as insurance against drought and point out thatit is in the strangulation of these social relationships, and notjust in the vagaries of climate and population pressures, thatthe present crisis needs to be understood.
Traditionally, pastoralists have combated the high varia-bility in primary production of rangelands by relying onsturdy drought-resistant breeds, by the mix of livestock held,a sophisticated ethno-scientific understanding of localranges, and by various sociocultural relationships in addi-tion to the basic nomadic movement (Le Houerou 1985;Watts 1987&). Increasingly, the options to exercise thesestrategies are being severely curtailed by policies that encour-age farm encroachment on pastoral lands, settlement pro-grams and blockages in nomadic routes (Wang'ati, thisvolume). Even those who simplistically blame overgrazingand overpopulation as the culprits, and feel that de-stockingand resettlement of people is the most viable solution,acknowledge that issues of property rights, access tocommon property and efficacy of human institutions willframe the success, or failure, of any biological or physical'fix' to these problems (Swindale 1992:14).
Sedentary pastoralism with particular focus on agro-pastoral systems provides one response to realizing theproduction potential of semi-arid areas, providing sustain-
able livelihoods and reducing the need for periodic droughtand famine relief (Swindale 1992:15). Such systems wouldneed to integrate traditional knowledge about adaptation ofstocking rates, livestock mix and grazing patterns with theintroduction of suitable fodder crops, trees and shrubs(including saline-tolerant varieties) and improved techniquessuch as ripping, subsoiling, scarifying, pitting, contourbenching and water spreading (Le Houerou 1985:169; Swin-dale 1992:15). The viability of such programs would, how-ever, be dependent upon policy changes that support thedevelopment of local infrastructure and institutions, andcommunity involvement in projects with particular focus onthe displaced nomadic pastoralists.
International responses
Introduction
The global interest accorded to the Brundtland Commission(WCED 1987) and the Intergovernmental Panel on ClimateChange (IPCC 1990) testify to the new wave of internationalconcern for the global environment. The expectations sur-rounding the United Nations Conference on Environmentand Development (UNCED) reflect not just the twentiethanniversary of the Stockholm Conference, but more impor-tantly the arrival of environmental issues - particularlyglobal climate change - on the international agenda.
In this section we look briefly at the international concernsfor climate change, and what expectations are being asso-ciated with the UNCED process. We then discuss why it isimportant to give priority to the semi-arid regions in inter-national discussions and actions regarding global climatechange. We then outline some major facets of requiredinternational responses. Finally, we discuss why restructur-ing international economic interventions is of concern.

46 I OVERVIEW
International cooperationThe global nature of climate change has triggered globalinterest and global fears. It has even initiated some fledglingefforts toward global response initiatives; these, however,have been far from satisfactory. Whereas verbal consensuson the need for international response strategies exists, thesevere distributional disparities, both in causes and in effectsof climate change have made any such effort politicallycharged. While the overwhelming bulk of additions to thegreenhouse gas flux results from the wasteful practices in theNorth, the countries most vulnerable to global climatechange are in the South (Agarwal and Narain 1991). Thedebate is being framed by the North, for Northern interests,yet the South is more vulnerable, and the North is better ableto cope with climate-change impacts. Not only will the Southhave to bear the effects of climate change, increased climatevariability and a sea level rise, and pay part of the price ofmitigating effects largely of the North's making (e.g. preserv-ing forests, foregoing CFC use and paying higher energyprices) but there is a real danger of ignoring the North'swasteful consumption habits while placing the blame on theSouth's population (see Agarwal and Narain 1991).
Global networks and institutionsDespite the pressures for action generated by UNCED,meaningful international agreements to reduce greenhousegas emissions are still a long way off. There have, however,been a number of important international landmarks in thisdirection. The Montreal Protocol of 1987 to stop the produc-tion of chemicals implicated in stratospheric ozone depletionmarked one such landmark - even if limited in scope andcoming after a protracted, and somewhat painful, processrequiring 'long and difficult negotiations and substantialcompromise [on] goals' (Harris 1991:112).
More specifically, no major international policy initiativeexists to address the problems of the semi-arid areas in thelight of the projected climate change. The need for such aninitiative seems obvious. But given the inherent diversitybetween and within semi-arid regions it must emerge from,and build upon, regional networks. Although institutionssuch as UNEP or the Food and Agriculture Organization(FAO) have larger mandates, their particular interest in thesemi-arid zones can be a potential asset. The Inter-govern-mental Committee for the Fight Against Drought in theSahel (Comite Inter-Etat pour la Lutte contre la Secheresseau Sahel; CILSS) and the Inter-Governmental Authority onDrought and Development (IGADD) in the Sudano-Sahe-lian region and the International Crops Research Institutefor the Semi-Arid Tropics (ICRISAT) are a few examples ofinstitutions focused on issues of semi-arid lands (Swindale1992; Wang'ati, this volume).
Such global and regional networks can provide a forumfor evaluating the vulnerability of populations in semi-aridregions facing climate variability and change, exchangingsuccessful development strategies, and sharing informationon climate trends and early-warning techniques. Given thelack of funds and facilities in many semi-arid regions, suchnetworks and institutions have a major responsibility forlong-term research at the regional and local levels, withparticular focus on forecasting, early-warning, and controlor mitigation strategies.
The need for networks also stems as much from the factthat semi-arid regions often encompass many nations - theSahel spans 22 countries - as it does from the importance ofsharing and learning from each other's experiences. At thesame time, the need to communicate between the regionaland local levels requires a cadre of local experts who under-stand local as well as regional and international issues andneeds. Educating and training a cadre of experts and decisionmakers may best be accomplished by regional and inter-national networks and institutions.
International economic interventionsInternational trade imbalances, foreign debt constraints,international commodity markets and pricing structures, thenature of foreign loans and assistance, and the nature andlevel of investments by multi-national corporations (MNCs)all help shape the internal policies of developing nations.Such influences can often outweigh attempts at environmen-tal and resource management, regardless of how much'political will' a government has (O'Brien and Liverman, thisvolume). The era since the Second World War has seen theinternationalization of production, finance and services.This often defines policy and policy implications at local, andeven village, levels (Watts 1987^:292). Glantz (this volume)points out that international pressures can force countries toshift from food crops to export crops, sometimes causinghunger even where there is no drought.
In response to mounting public concern for the environ-ment, some progress has been made. Efforts to restructure'assistance' criteria, environmental impact assessments andnatural-resource accounting in cost-benefit analysis are a fewexamples (Meredith 1992a). While all these initiatives are yettoo new or untried for a meaningful assessment to be made,their potential merits attention.
Balanced inclusion in the international economy is ofparticular relevance for the destiny of the developing worldand of the semi-arid regions within them. The relativeposition of weakness vis-a-vis MNC investments, inter-national terms of trade and price structures can often forcedeveloping countries into decisions to exploit resources.Passed on from the international to the local stage through

1 CLIMATIC VARIATION, VULNERABILITY AND SUSTAINABLE DEVELOPMENT 47
national policy, such decisions (e.g. growing groundnut forexport rather than food crops for domestic use) force thepace of degradation and deprivation on the semi-arid lands.
Why focus on semi-arid lands?In addressing the threats of global climate change, inter-national attention has, until now, been focused on the issuesof coastal and island settlements and on tropical forests. Thefirst (such as the Maldives and Bangladesh) have receivedattention because they are at great risk of total inundation byrising sea level, the latter because forest management canboth reduce the problem and contribute to its solution.9
Semi-arid tropics deserve more international attention forthese same reasons.
Like coastal and island settlements, the semi-arid tropicsare at extreme risk in the face of projected global climatechange. Rather than inundation by the sea, semi-arid landsrisk inundation from increased rains, and desiccation fromwarming.10 It is no mistake that the semi-arid southern edgeof the Sahara desert is called the Sahel, from the Arabic wordfor shore or coastline, for the Sahel is the tidal zone betweenthe desert and the humid forests to the south. Here exagger-ating or shifting rainfall patterns could make these regionsuninhabitable. Increasing desiccation drives the northernlimit of cultivation southward, as has happened with pastand current droughts, taking vast farming and pastoralregions out of cultivation and pasture, and dislocating thepopulations who depend on these lands.
In general, the ecosystems in semi-arid regions tend tohave poor soils, problematic groundwater resources, anddepend heavily on already scant and erratic rainfall; inaddition, the spatial marginality of their populations is oftencompounded by chronic poverty and underdevelopment.This combination makes them extremely vulnerable to thenegative outcomes associated with climate change. The semi-arid tropics are in real danger of severe and widespreadhuman and environmental catastrophe (famine, desertifica-tion, etc.), and the need for action is urgent.
Degradation of the resource base not only jeopardizes thelivelihoods of a region's inhabitants, but the resulting depri-vation results in 'spillover' of dislocated populations ontoother, often equally fragile, ecosystems. The dislocation of'ecological refugees' is not a concept unique to Africa. A casein point is the relationship between the Brazilian Northeastand the Amazon, with more than 51 % of those migratinginto the Amazon reported to originate from the semi-aridNortheast (Bitoun et al.9 this volume). The emerging patternis clear: degradation and deprivation in one area can trans-late into increased pressures on others.
Semi-arid regions are among the least developed regions ofthe world. Consequently, they are also the most vulnerable to
the current consequences of climate variability and thepotential consequences of climate change. While mitigationstrategies applied to the forest and energy sectors will reducethe potential for future aggravation of an already precarioussituation, actions to reduce current vulnerability in semi-aridlands will do the same. Indeed, the object is to reduce or averthuman suffering while upgrading productivity from thenatural-resource base. Balanced development in these areashas the potential to do both. Equitable development canreduce local and migration-triggered environmental de-terioration, as well as vulnerability to hunger, famine anddislocation, by providing the resources necessary to invest inmaintenance and improvement of the land while providingjobs to prevent migration into other fragile regions. Clearly,we do not have to look to the future to find risk or need.Development in semi-arid regions will help meet these needsand reduce both current and future vulnerability.
There are opportunities in these regions. These opportuni-ties serve not only development aims, but environmentalaims as well. Not only do they stop the exploitative 'mining'of the most marginal lands by the most exploited andmarginalized populations, but they also reduce pressure onother regions by reducing outmigration or by encouragingmigration into more productive (agricultural and non-agri-cultural) regions and activities. But most importantly, de-velopment measures in these most marginal lands increasethe wellbeing and security of those who are chronicallyexposed to the risk of hunger, famine and loss.
CONCLUSION
It is ironic that we must look into the future, to a time distantenough to be free of commitment to immediate action orchange, just to discuss the tragedy taking place before us. Weproject future climate change and future vulnerability todislocation, hunger and famine, while vulnerability and crisisare already chronic and widespread. Today, future scenariosallow us to discuss these (otherwise too politically charged)development, environment and equity issues in a publicforum. Indeed, they have brought these 'future' issues to thecenter of international attention. But we must use thisopportunity to slide back down the projection lines and pointto the crisis at hand.
As illustrated in this chapter, and in the chapters thatfollow, the semi-arid regions of the world are currentlyexperiencing the insecurity and disruptions that climate-change impact analyses indicate could become more wide-spread. Addressing the current problems in the semi-aridtropics will diminish the future vulnerability that climatechange may exacerbate. Clearly, the long-term future of

48 I OVERVIEW
these and other regions of the world depends on today'squality of life and the sustainability of current practices andsocial relations within these regions. While it is important tolook to the future, it is much more important to act today onwhat we already know from direct and repeated experience.It is critical to begin investing in the future today, byinvesting in social changes that can support equitable andecologically sound development.
ACKNOWLEDGMENTS
We would like to express our appreciation to Thomas E.Downing, Michael H. Glantz, Gustavo Maia Gomes,Oswaldo Massambani, Karen O'Brien, Hermino Ramos deSousa, Henrique Rattner, Jurgen Schmandt, Bruce Sted-man, Judith Tendler and Matthew Turner for the criticalinsights and feedback they provided in discussions, and theirconstructive comments on the drafts of this paper. We wouldalso like to thank the staff of the Esquel Brazil Foundation,particularly Elizabeth M. Duarte, Francisco Silveira andPaula Pini, for providing immeasurable support. Our thanksare especially extended to Antonio Rocha Magalhaes forinviting us to take on this challenge and for the inspirationthat he provided throughout. This work was supported byEsquel Group Foundation.
ENDNOTES
1. Heathcote (1983:16) cites P. Meigs' estimate that semi-arid landsmake up approximately 15.8% of the world's land area and theUnited Nations estimates that these lands cover 13.3% of theworld's land. The Meigs estimate is based on those areas in whichthe ratio of precipitation to evapotranspiration falls between — 20and — 40. This corresponds, according to Meigs (published in 1953),approximately to the lands falling between the 200 and 500 milli-meter isohyets. The basis of the UN estimate (published in 1977) isnot explained. It should be noted that the first estimate might beconsidered conservative since some definitions currently in usecorrespond to the lands falling between 200 and 800 millimeterisohyets (Rasmusson 1987). For further discussion of the problemsof defining semi-arid regions, see the section on semi-arid regions.The population of semi-arid areas derived from Heathcote's(1983:20-1) figures is approximately 11.25% of the world's total.Heathcote (1983:21) also presents a UN figure (published in 1977) of10.1 % of the world's population living in these regions. The figuresfor the land areas, and hence the proportion of the world's popula-tion living in these areas, are subject to uncertainty and definitionaldispute. The figures presented here, given the conservative rainfallrange, are probably therefore underestimated.
2. Marginality is a fact, marginalization a process. While the fact ofmarginality can lead to environmental decline, the process ofmarginalization should be identified as the cause. Marginality is theresult of this process. The consequences of marginality are thereforethe consequences of the marginalization process. It is this processthat should be examined if marginality and its consequences are tobe understood and redressed.
3. The uncertainty range is 0.2-0.5 °C per decade.4. Emphasis added.5. The highest-resolution climate GCMs specify the state of the
atmosphere at the intersections of a three-dimensional grid. Eachgrid is divided into sections that are approximately 250 miles on aside and about a mile thick (Stone 1992:37).
6. For an excellent evaluation of the multiple causes of soil erosion seeBlaikie (1985) and Blaikie and Brookfield (1987). For a similaranalysis of the causes of deforestation see Schmink (1992).
7. Gasques et al. (1992:38), for example, argue that in Brazil's North-east, 'basic food production is concentrated in areas of extremevulnerability where reduced production from climatic variations isnot just an economic question, of reduced output, but rather aquestion of survival' (translated from the Portuguese by theauthors).
8. The analyst, in the authors' opinion, must be thought of as includingnot only the expert adviser or policy maker, but also the populationsbeing analyzed. Participation and participatory research are dis-cussed in the introduction of the section on Responses.
9. Saving the tropical forests would reduce the release of greenhousegases (through reduced burning and decay) as well as provide a sinkfor CO2 (through forest planting and growth) from other sources,particularly energy.
10. This is not an either/or proposition, but, if rains remain unevenlydistributed and drying is intensified, alternating floods and droughtcould be the mode.
REFERENCES
Agarwal, A. and Narain, S. 1991. Global Warming in an Unequal World.New Delhi: Center for Science and the Environment.
Akong'a, J., Downing, T. E., Konjin, N. T., Mungai, D. N., Muturi, H.R. and Potter, H. L. 1988. The effects of climatic variations onagriculture in Central and Eastern Kenya. In The Impact of ClimaticVariations on Agriculture, Vol. 2, Assessments in Semi-Arid Regions,ed. M. Parry, T. Carter and N. T. Konjin, pp. 123-270. Dordrecht:Kluwer.
Albergel, J. 1992. 'Bas-Fonds Programme: suitable technologies forsustained development in a semi-arid zone of West Africa. The case ofsubterranean dam of Kambo in Mali. Presented ICID, Fortaleza-Ceara, Brazil, 27 January to 1 February 1992.
Bates, R. H. 1981. Markets and States in Tropical Africa. Berkeley:University of California Press.
Bates, R. H. 1983. Essays on the Political Economy of Rural Africa.Berkeley: University of California Press.
Bernstein, H. 1979. African peasantries: a theoretical framework. Jour-nal of Peasant Studies 6:4.
Berry, S. 1989. Social institutions and access to resources. Africa 59:1.Biggs, T. S., Snodgrass, D. R. and Srivastave, P. 1990. On Minimalist
Credit Programs. Development Discussion Paper No. 331. HarvardInstitute for International Development.
Blaikie, P. 1985. The Political Economy of Soil Erosion in DevelopingCountries. London: Longman.
Blaikie, P. and Brookfield, H. C. 1987. Land Degradation and Society.London: Methuen.
Boviniv, M. 1986. Projects for women in the Third World: explainingtheir misbehavior. World Development 14:653-64.
Burton, I. and Cohen, S. S. 1992. Adapting to global warming: regionaloptions. Presented at ICID, Fortaleza-Ceara, Brazil, 27 January to 1February 1992.
Cadier, E., Seraphim, B. and Molle, F. 1992. The small dam: a way tocombat drought. Presented at ICID, Fortaleza-Ceara, Brazil, 27January to 1 February 1992.
Campos-Lopez, E. and Anderson, R. J., (eds.) 1983. Natural Resourcesand Development in Arid Regions. Boulder: Westview Press.
Caron, P. and Da Silva, P. C. G. 1992. Small production and sustaineddevelopment in the semi-arid tropics: the necessity of a sustainablecredit system. Presented at ICID, Fortaleza-Ceara, Brazil, 27 Januaryto 1 February 1992.
Castellanet, C. 1992. Rehabilitation of irrigated perimeters. Presented atICID, Fortaleza-Ceara, Brazil, 27 January to 1 February 1992.
Chen, M. 1986. Overview of women's program 1980-1986, India andBangladesh. Oxfam America, October 1986.
Chen, R. S. and Parry, M. L. (eds.) 1987. Policy-Oriented ImpactAssessment of Climate Variations, RR-87-7. Luxembourg: IIASA.

1 C L I M A T I C V A R I A T I O N , V U L N E R A B I L I T Y A N D S U S T A I N A B L E D E V E L O P M E N T 49
Chevalier, P., Jacques, C , Grouzis, M. and Milleville, P. 1992. Cas d'unespace Sahelien Africain: La mare d'Oursi, Burkina Faso. Presentedat ICID, Fortaleza-Ceara, Brazil, 27 January to 1 February 1992.
Cochonneau, G. and Sechet, P. 1992. Trying to synthesize the annualrainfall measurement of the semi-arid zone of the Brazilian NortheastRegion. Presented at ICID, Fortaleza-Ceara, Brazil, 27 January to 1February 1992.
Cohen, S. J. 1990. Bringing the global warming issue closer to home: thechallenge of regional impact studies. Bulletin of the AmericanMeteorological Society 71[April]:4.
Cohen, S. S., Masterton, J. and Wheaton, E. E. 1992. Impacts of climatescenarios in the prairie provinces: a case study from Canada. Pre-sented at ICID, Fortaleza-Ceara, Brazil, 27 January to 1 February1992.
Courcier, R. and Sabourin, E. 1992. Handling of surface waters for thesmall agriculture in the semi-arid tropics of the Brazilian Northeast.Presented at ICID, Fortaleza-Ceara, Brazil, 27 January to 1 February1992.
de Almeida, M. G. 1992. Irrigation policy: promises of prosperity in thebacklands - the semi-arid region of the state of Sergipe, Brazil.Presented at ICID, Fortaleza-Ceara, Brazil, 27 January to 1 February1992.
Deere, C. D. and de Janvry, A. 1984. A conceptual framework for theempirical analysis of peasants, pp. 601-611, Giannini FoundationPaper No. 543.
de Janvry, A. 1981. The Agrarian Question and Reformism in LatinAmerica. Baltimore: Johns Hopkins University Press.
de Janvry, A. and Kramer, F. 1979. The limits of unequal exchange.Review of Radical Political Economics ll[winter]:4.
Demo, P. 1989. Methodological contributions towards societaldrought-management practices. In Socioeconomic Impacts of ClimaticVariations and Policy Responses in Brazil, ed. A. R. Magalhaes.Fortaleza-Ceara, Brazil: UNEP.
Downing, T. E. 1991. Assessing Socioeconomic Vulnerability to Famine:Frameworks, Concepts, and Applications. FEWS Working Paper, AIDFamine Early Warning System.
Downing, T. E. 1992. Vulnerability and global environmental change inthe semi-arid tropics: modelling regional and household agriculturalimpacts and responses. Presented at ICID, Fortaleza-Ceara, Brazil,27 January to 1 February 1992.
Dreze, J. and Sen, A. 1989, Hunger and Public Action. Oxford: Claren-don Press.
Eckholm, E. P. 1975. The other energy crisis: firewood. WorldwatchPaper 1.
Eckholm, E. P. 1979. The Dispossessed of the Earth: Land Reform andSustainable Development. Washington, DC: Worldwatch Institute.
El-Shahawy, M. A. 1992. Some impacts of regional warming. Presentedat ICID, Fortaleza-Ceara, Brazil, 27 January to 1 February 1992.
Farago, T. 1992. Climatic variability, impacts and sustainability: gener-alization from regional climate impact studies. Presented at ICID,Fortaleza-Ceara, Brazil, 27 January to 1 February 1992.
Gasques, J. G., (coordinator), C. H. Motta Coelho, M. Bosco deAlmeida, F. A. Soares, L. A. C. da Silva, M. J. Nogueira, R. C. Lins,J. G. B. Oliveira, C. J. C. Lins and F. Barreto. 1992. A case study:overall scenario. Presented at ICID, Fortaleza-Ceara, Brazil, 27January to 1 February 1992.
Glantz, M. H. 1987. Drought and Hunger in Africa. Cambridge:Cambridge University Press.
Glantz, M. H. 1989. Drought, famine, and the seasons in sub-SaharanAfrica. In African Food Systems in Crisis, part 1, ed. R. Huss-Ashmoreand S. H. Katz, pp. 45-71. New York: Gordon and Breach.
Goldemberg, J. 1992. The road to UNCED: environment and develop-ment. Keynote Address at ICID, Fortaleza-Ceara, Brazil, 27 Januaryto 1 February 1992.
Goldsmith, W. W. and Wilson, R. 1991. Poverty and distorted indust-rialization in the Brazilian Northeast. World Development 19:435-55.
Gomes, E., Da Silva, J. E. and Brandao, M. H. M. 1992. The integratedinstitutional aspect, basic element of sustainable development: theexamples of the semi-arid of the Northeast of Brazil. Presented atICID, Fortaleza-Ceara, Brazil, 27 January to 1 February 1992.
GOP/IUCN 1991. Pakistan National Conservation Strategy. Govern-ment of Pakistan/International Union for the Conservation of Natureand Natural Resources.
Hare, F. K. 1985. Climatic variability and change. In Climate ImpactAssessment: Studies of the Interaction of Climate and Society, ed. R.
W. Kates, J. H. Ausubel and M. Berberian, pp. 37-68. Chichester:Wiley Press.
Hare, F. K. 1987. Drought and desiccation: twin hazards of a variableclimate. In Planning for Drought: Toward a Reduction of SocialVulnerability, ed. D. A. Wilhite and W. E. Easterling with D. A.Wood. pp. 3-9. Boulder: Westview Press.
Harris, J. M. 1991. Global institutions and ecological crisis. WorldDevelopment 19:1.
Heathcote, R. L. 1983. The Arid Lands: Their Use and Abuse. London:Longman.
Horowitz, M. M. 1991. Victims upstream and down. Journal of RefugeeStudies 4:2.
Huss-Ashmore, R. 1989. Perspectives on the African food crisis. InAfrican Food Systems in Crisis, ed. R. Huss-Ashmore and S. H. Katz,pp. 3^2 . New York: Gordon and Breach.
Hyden, G. 1980. Beyond Ujamma in Tanzania: Underdevelopment and anUncaptured Peasantry. Berkeley: University of California Press.
IPCC. 1990. Report of the Intergovernmental Panel on Climate Change.Geneva and Nairobi: WMO/UNEP.
Izrael, J. A. 1992. Climatic variability and climatic change and therelated social, economic and environmental impacts. Presented atICID, Fortaleza-Ceara, Brazil, 27 January to 1 February 1992.
Jackelen, H. R. 1992. Economic interventions in the changing environ-ment of a semi-arid zone: introducing small-scale irrigation in theTimbuktu region of the north of Mali and assessing communityparticipation based of financial and production indicators. Presentedat ICID, Fortaleza-Ceara, Brazil, 27 January to 1 February 1992.
Khan, A. S. and Campos, R. T. 1992. Effects of drought on agriculturalsector of Northeast Brazil. Presented at ICID, Fortaleza-Ceara,Brazil, 27 January to 1 February 1992.
Kilby, P. 1979. Evaluating technical assistance. World Development7:309-23.
Le Houerou, H. N. 1985. Biological impacts: pastoralism. In ClimateImpact Assessment: Studies of the Interaction of Climate and Society,ed. R. W. Kates, J. H. Ausubel and M. Berberian, pp. 155-85.Chichester: Wiley.
Le Houerou, H. N. 1989. The Grazing Land Ecosystems of the AfricanSahel. Berlin: Springer-Verlag.
Lemos, J. de J. S. and Mera, R. D. M. 1992. Rural poverty andsustainable development for the state of Ceara. Presented at ICID,Fortaleza-Ceara, Brazil, 27 January to 1 February 1992.
Little, P. D. 1994. The social context of land degradation (desertifica-tion) in dry regions. In Population and Environment: Rethinking theDebate, ed. L. Arizpe, A. Palloni and P. Stone. London: Boulder,Colorado: Westview Press.
Mackintosh, M. 1990. Abstract markets and real needs. In The FoodQuestion: Profits Versus People?, ed. H. Bernstein, B. Crow, M.Mackintosh and C. Martin, pp. 43-53. New York: Monthly ReviewPress.
Magalhaes, A. R. 1989. Understanding the implications of globalwarming in developing regions: the case of Northeast Brazil. SQ315-Bl. A-Apt. 104, 70384^Brasilia, DF, Brazil.
Magalhaes, A. R. 1992. Understanding the implications of globalwarming in developing regions: the case of Northeast Brazil. In TheRegions and Global Warming: Impacts and Response Strategies, ed. J.Schmandt and J. Clarkson, pp. 237-56. New York: Oxford UniversityPress.
Magalhaes, A. R. and Glantz, M. H. 1992. Socioeconomic Impacts ofClimate Variations and Policy Responses in Brazil. Brasilia: UNEP/SEPLAN/Esquel.
Martine, G. 1992. Social development and liberalism: relevant issues forthe Brazilian semi-arid region. Presented at ICID, Fortaleza-Ceara,Brazil, 27 January to 1 February 1992.
Meredith, T. \992a. Adjusting to environmental change impact assess-ment as a cultural adaptation process. Presented at ICID, Fortaleza-Ceara, Brazil, 27 January to 1 February 1992.
Meredith, T. 19926. Environmental impact assessment, cultural diver-sity and sustainable rural development. Environment Impact Assess-ment Review 12:1-2.
Milukas, M., Ribot, J. and Maxson, P. 1984. Djibouti Energy Initiatives:National Energy Assessment, VITA/USAID. Project no. 603-0013.
Moench, M. 1991a. Sustainability, Efficiency, and Equity in GroundwaterDevelopment: Issues in India and Comparisons with the Western U.S.Pacific Institute for Studies in Development, Environment, andSecurity.

50 I OVERVIEW
Moench, M. 19916. Drawing Down the Buffer: Upcoming Ground WaterManagement Issues in India. Pacific Institute for Studies in Develop-ment, Environment, and Security.
Nemec, J. 1988. Implications of a changing atmosphere on waterresources. Theme paper in Conference Proceedings of the ChangingAtmosphere: Implications for Global Security. Toronto, Canada, 27-30 June 1988.
Netto. A. V. de Mello, Lins, R. C. and Coutinho, S. F. S. 1992.Exception areas, humid and subhumid, seated in the Brazilian North-eastern semi-arid. Presented at ICID, 27 January to 1 February 1992.
Nix, H. A. 1985. Biological impacts: agriculture. In Climate ImpactAssessment: Studies of the Interaction of Climate and Society, ed. R.W. Kates, J. H. Ausubel and M. Berberian, pp. 105-30. Chichester:Wiley.
Nobre, C. A., Massambani, O. and Liu, W. T.-H. 1992. Climaticvariability in the semi-arid region of Brazil and drought monitoringfrom satellite. Presented at ICID, Fortaleza-Ceara, Brazil, 27 Januaryto 1 February 1992.
Ocana, C. L. 1991. Assessing the Risk of Dryland Degradation: A Guidefor National and Regional Planners. World Resources Institute.
Parry, M. L. and Carter, T. R. 1985. The effect of climatic variations onagricultural risk. In The Sensitivity of Natural Ecosystems and Agricul-ture to Climate Change, ed. M. L. Parry, pp. 95-110. Dordrecht:Kluwer.
Parry, M. L. and Carter, T. R. 1988. An assessment of effects of climaticvariations on agriculture. In The Impact of Climatic Variations onAgriculture, Vol. 2, Assessments in Semi-arid Regions, ed. M. L. Parry,T. R. Carter and N. T. Konijn. Dordrecht: Kluwer.
Parry, M. L. and Carter, T. R. 1990. Some strategies of response inagriculture to changes of climate. In Climate and Development, ed. H.J. Karpe, D. Otten and S. C. Trindade, pp. 152-72. Berlin:Springer-Verlag.
Peattie, L. 1979. The organization of marginals. Comparative UrbanResearch 7:2.
Perrings, C. 1991. Incentives for the ecologically sustainable use ofhuman and natural resources in the drylands of sub-Saharan Africa: areview. Working paper presented at Technology and EmploymentProgramme, World Employment Programme Research, Inter-national Labor Organization.
Popkin, S. L. 1979. The Rational Peasant: The Political Economy ofRural Society in Vietnam. Berkeley: University of California Press.
Ranis, G. and Stewart, F. 1987. Rural linkages in the Philippines andTaiwan. In Macro-Policies for Appropriate Technology, ed. F. Stew-art, pp. 140-91. Boulder: Westview Press.
Rasmusson, E. M. 1987. Global climate change and variability: effectson drought and desertification in Africa. In Drought and Hunger inAfrica, ed. M. H. Glantz, pp. 3-22. Cambridge: Cambridge UniversityPress.
Reyniers, F. N. 1992. Sketch of the Sudano-Sahelian grain water systemthat optimizes rainfalls. Presented at ICID, Fortaleza-Ceara, Brazil,27 January to 1 February 1992.
Rhodes, S. L. 1991. Rethinking desertification: what do we know andwhat have we learnt? World Development 19:9.
Richards, P. 1985. Indigenous Agricultural Revolution: Ecology and FoodProduction in West Africa. Boulder: Westview Press.
Riebsame, W. E. 1989. Assessing the Social Implications of ClimateFluctuations: A Guide to Climate Impact Studies. Nairobi: UnitedNations Environment Programme.
Rodrigues, V. with H. Matallo jr., M. C. Linhares, A. L. Costa deOliveira Galvao and A. de Souza Gorgonio. 1992. Evaluation ofdesertification scene in the Northeast of Brazil: diagnoses and pros-pects. Presented at ICID, Fortaleza-Ceara, Brazil, 27 January to 1February 1992.
Rosenberg, N. J. and Crosson, P. R. 1992. Understanding regional scaleimpacts of climate change and climate variability: application to aregion in North America with climates ranging from semi-arid tohumid. Presented at ICID, Fortaleza-Ceara, Brazil, 27 January to 1February 1992.
Santibanez, F. 1992. Impact on agriculture due to climatic change andvariability in South America. Presented at ICID, Fortaleza-Ceara,Brazil, 27 January to 1 February 1992.
Schmandt, J. and Ward, G. H. 1992. Climate change and waterresources in Texas. Presented at ICID, Fortaleza-Ceara, Brazil, 27January to 1 February 1992.
Schmink, M. 1992. The socioeconomic matrix of deforestation. Paper
presented at the Workshop on Population and Environment, spon-sored by Development Alternatives with Women for a New Era,International Social Science Council, and Social Science ResearchCouncil, Hacienda Cocoyoc, Morelos, Mexico, 28 January to 1February.
Schmink, M. and Wood, C. 1987. The political ecology of Amazonia. InLands at Risk in the Third World, ed. P. Little and M. Horowitz.Boulder: Westview Press.
Schmitz, H. 1982. Growth constraints on small-scale manufacturing indeveloping countries: a critical review. World Development 10:6.
Schmitz, H. 1990. Small firms and flexible specialization in developingcountries. Labour and Society 15:3.
Schulze, R. E. and Lynch, S. D. 1992. Distributions and variability ofprimary productivity over southern Africa as an index of environmen-tal and agricultural resource determination. Presented at ICID,Fortaleza-Ceara, Brazil, 27 January to 1 February 1992.
Scott, J. C. 1976. The Moral Economy of the Peasant: Rebellion andSubsistence in Southeast Asia. New Haven: Yale University Press.
Selvarajan, S. and Sinha, S. K. 1992. Weather variability and food grainsproduction sustainability in India. Presented at ICID, Fortaleza-Ceara, Brazil, 27 January to 1 February 1992.
Sen, A. 1981. Poverty and Famines: An Essay on Entitlement andDeprivation. Oxford: Oxford University Press.
Sen, A. 1987. Hunger and Entitlements. World Institute for Develop-ment Economics Research of the United Nations University.
Serpantie, G. 1992. Should the small areas of'Bas-Fonds' in the Sudano-Sahelian region be considered within the strategy of agriculturalhousehold production. Presented at ICID, Fortaleza-Ceara, Brazil,27 January to 1 February 1992.
Servain, J., Merle, J. and Morliere, A. 1992. The influence of the tropicalAtlantic Ocean on the hydroclimates of the Sahel and the Northeast.Presented at ICID, Fortaleza-Ceara, Brazil, 27 January to 1 February1992.
Soares, A. M. L., Leite, F. R. B. Leite, Lemos, J. de J. S., et al. 1992.Degraded areas susceptible to desertification processes in the state ofCeara-Brazil. Presented at ICID, Fortaleza-Ceara, Brazil, 27 Januaryto 1 February 1992.
Stevens, W. K. 1994. Threat of encroaching deserts may be more myththan fact. New York Times, 18 January, pp. Cl, C10.
Stone, P. H. 1992. Forecast cloudy: the limits of global warming models.Technology Review, MIT, February/March.
Storper, M. 1991. Regional development policy 2: the global industrialeconomy and local industrial strategies. In Industrialization, Econ-omic Development and the Regional Question in the Third World: FromImport Substitution to Flexible Production. London: Pion Press.
Swift, J. 1989. Why are rural people vulnerable to famine? IDS Bulletin,20(2), 8-15.
Swindale, L. D. 1992. A research agenda for sustainable agriculture.Presented at ICID, Fortaleza-Ceara, Brazil, 27 January to 1 February1992.
Tendler, J. 1989. Whatever happened to poverty alleviation? In Mic-roenterprises in Developing Countries, ed. J. Levitsky. London: Inter-mediate Technology Publications.
Tie Sheng, Li, Liu Zhong Lin, Xie Qinyun, Wang Shide and MaLanzhong. 1992. The situation, problems, countermeasures of arid,semi-arid regions in Inner Mongolia. Presented at ICID, Fortaleza-Ceara, Brazil, 27 January to 1 February 1992.
Timmer, C. P. 1992. Agriculture and the State. Ithaca: Cornell UniversityPress.
Tucker, C. J., Dregne, H. E. and Newcomb, W. W. 1991. Expansion andcontraction of the Sahara Desert 1980-1990. Science 253. 299-301.
UCAR 1992. Arid Ecosystems Interactions: Recommendations for Dry-lands Research in the Global Research Program. Boulder: UniversityCorporation for Atmospheric Research.
Vallianatos, E. G. 1992. Sustainable development theory. Presented atICID, Fortaleza-Ceara, Brazil, 27 January to 1 February 1992.
Watts, M. J. 1983. Silent Violence: Food, Famine and Peasantry inNorthern Nigeria. Berkeley: University of California Press.
Watts, M. J. 1987a. Conjunctures and crisis: food, ecology and popula-tion, and the internationalization of capital.' Journal of Geography[Nov/Dec].
Watts, M. J. 19876. Drought, environment and food security: somereflections on peasants, pastoralists and commoditization in drylandWest Africa. In Drought and Hunger in Africa, ed. M. H. Glantz, pp.171-211. Cambridge: Cambridge University Press.

1 CLIMATIC VARIATION, VULNERABILITY AND SUSTAINABLE DEVELOPMENT 51
Watts, M. J. and Bohle, H. 1993. The space of vulnerability: the causalstructure of hunger and famine. Progress in Human Geography 17(1),43-68.
WCED 1987. Our Common Future: Report of the World Commission onEnvironment and Development. London: Oxford University Press.
Wilhite, D. A. and Glantz, M. H. 1987. Understanding the droughtphenomenon: the role of definitions. In Planning for Drought: Towarda Reduction of Social Vulnerability, ed. D. A. Wilhite and W. E.Easterling with D. A. Wood, pp. 11-30. Boulder: Westview Press.
Wilhite, D. A. and Easterling, W. E. with Wood, D. A. (eds.) 1987.Planning for Drought: Toward a Reduction of Social Vulnerability.Boulder: Westview Press.
Wisner, B. 1976. Man-Made Famine in Eastern Kenya: The Interrelation-ship of Environment and Development. Discussion Paper No. 96.
Brighton: Institute of Development Studies at the University ofSussex.
World Bank 1990. World Development Report 1990. Washington: WorldBank.
WRI 1990. World Resources 1990-91. New York: Oxford UniversityPress.
WRI 1991. World Resources 1991-92. New York: Oxford UniversityPress.
WRI. 1992. World Resources 1992-93: A Guide to the Global Environ-ment. A report by the World Resources Institute in collaboration withUNEP and UNDP. New York: Oxford University Press.
Yair, A. 1992. The ambiguous impact of climate change at a desertfringe: Northern Negev, Israel. Presented at ICID, Fortaleza-Ceara,Brazil, 27 January to 1 February 1992.


II
Climate Variation, Climate Change and Society


2: Climate Change and Variability in Mexico*
KAREN O'BRIEN AND DIANA LIVERMAN
INTRODUCTION
Mexico, located between latitudes 15° and 32°N, spans arange of climates from arid desert to the humid tropics (Fig.1). There is a significant geographic mismatch between waterand human occupancy in Mexico. Seven percent of the land,lying in the extreme southeast of the country, receives 40% ofthe rainfall. Only 12% of the nation's water is on the centralplateau where 60% of the population - including the 18million people who live in Mexico City - and 51 % of thecropland are located. Of Mexico's 195 million hectares (mha) of land, only 15% is classified as humid or very humid;the remaining 85% is semi-arid, arid, or very arid (Table 1).Thus, in most parts of Mexico, human activity relies on thelow, seasonal and variable rainfall that characterizes the aridand semi-arid regions of the world.
The dry climates, together with steep topography, are themain reasons why only 16% of Mexico's land area isconsidered suitable for crop production (Table 2). In con-trast, 38% is considered appropriate for pasture. More thanone-third of Mexico's rapidly growing population works inagriculture, a sector whose prosperity is critical to thenation's debt-burdened economy and to national self-suf-ficiency in food.
One-fifth of Mexico's cropland is irrigated and this areaaccounts for half of the value of the country's agriculturalproduction, including many export crops. Many irrigationdistricts rely on small reservoirs and wells which depleterapidly in dry years. The remaining rainfed cropland sup-ports many subsistence farmers and provides much of thedomestic food supply.
Mexico presently generates about one-fifth of its electricityfrom hydroelectric schemes and has developed less than aquarter of its potential (World Resources Institute 1990).Water supply infrastructure has not been able to keep up
* Several sections of this paper are drawn from Liverman 1992a.
with rapid urban and industrial development. These othersectors compete with the agricultural sector, which consumesmore than 80% of total water supplies.
Mexico, and the Mexican people, are extremely vulnerableto droughts and other climatic variations. In this chapter wereview some of the literature on climate change and varia-bility in Mexico, and present some of our own work ondrought in twentieth-century Mexico and on the possibleimpacts of global warming. Our focus is on the impacts ofpast and future droughts on the Mexican agricultural system.
MEXICAN CLIMATE
The mountainous terrain and dissected topography of Mex-ico result in tremendous climate variability over short spatialdistances, with variations corresponding as much to altitudeas to latitude. Other permanent controls influencing theclimate include land-sea distributions, the influence of off-shore ocean currents, and the location of tropical stormtracks. Despite large variations, the climate of Mexico can bedivided into three broad categories. The first category con-sists of the wet, tropical climates that are generally found insouthern Mexico and on the Pacific and Gulf coasts, south oflatitude 24° N. The second type includes temperate, season-ally moist climates typical of the mountainous areas andcentral plains. Finally, the third category consists of the dryclimates generally found in the northern part of the country,including the Baja California Peninsula and the Pacificcoastal plains north of latitude 25° N.
In terms of atmospheric circulation dynamics, the climateof Mexico is strongly influenced by the seasonal shifting ofsubtropical high-pressure cells and the intertropical conver-gence zone. The subtropical high-pressure belt creates stable,dry conditions over most of Mexico in winter, when it hasshifted to its southernmost position. During this time in thenorthwestern region of Mexico, westerly winds penetrate
55

56 II CLIMATE VARIATION, CLIMATE CHANGE AND SOCIETY
72° 60°
MESOTHERMAL HIGHLAND CLIMATES(Koeppen's Cw, Cwi, Cfi)
MESOTHERMAL SUBTROPICAL CLIMATESI I I I I Humid Subtropical type (Koeppen's Cfa)
11 Sl'i'i"
Summer Dry Subtropicol type(Koeppen's Cs)
H2°
TROPICAL WET CLIMATESflflH Tropical Rain Forest typeTTZ. (Koeppen's Af)Illllllll'llllill Tropical Monsoon type (Koeppen's Am)
TROPICAL WET AND ORY CLIMATE| | (Koeppen's Aw)
DRY CLIMATESp g x p j Semi-Arid (Steppe) type (Koeppen's BS)
|;;;i;;;;;l Arid (Desert) type (Koeppen's BW)
108° 96° 84°
Figure 1: Climatic areas of Mexico. (Source: West and Augelli 1990.)
and bring some winter rainfall. In the summer, as thesubtropical high-pressure belt shifts northward, the north-west region experiences hot, dry conditions. Convection andthe moist, steady trade winds bring heavier rainfall to easternand central Mexico and the Yucatan peninsula. Precipitationreaches a maximum in the summer, as the intertropicalconvergence zone moves north. Heavy rainfall is also asso-ciated with hurricanes, which tend to form in late summerand early fall. In winter, cold polar air, or nortes, can surgesouthward into Mexico, bringing rain, on the Gulf Coast,and frost in the highlands. In midsummer, high pressuresometimes develops over the central plateau, disrupting theeasterly flow and causing a period of drought known as thecanicula. The mountainous regions along the spine of thecountry and the central plateaus tend to be cooler, withhigher precipitation on the windward side (Mosino andGarcia 1973; Mosino 1975; Metcalfe 1987).
Meteorological records are available for some parts ofMexico since the nineteenth century, and 30-year normalsare available for over 300 climate stations (Servicio Meteoro-logico 1976). The lowland regions of Mexico experienceannual average temperatures of around 20 °C. The highlandsand the north have larger daily and annual temperatureranges, with annual averages decreasing with increasingaltitude. Annual rainfall totals vary widely, from below 100millimeters (mm) a year in the desert northwest to over 2000mm a year in the south and east.
With the exception of the southern and Gulf Coastregions, much of Mexico experiences arid and semi-aridconditions, characterized by sparse and highly variable rain-fall. Coefficients of variation of annual rainfall are higher
than 30% over much of the country. The vegetation of thearid and semi-arid zones of Mexico is characteristic of desertand grassland, with great diversity relative to other aridregions of the world (Fig. 2).
HISTORY OF DROUGHT IN MEXICO
Paleoclimatic and instrumental records indicate that therehave been significant shifts in the climate of Mexico through-out history, including long periods of drought (Metcalfe1987). Fossil evidence suggests that the arid zones of north-ern Mexico expanded and contracted during past glacial andinterglacial periods, occupying smaller areas in the past thanat present (Ezcurra and Montana 1990). Marine and pollenrecords support this, showing that relatively arid periodsoccurred from 2000 to 1800 BP (Before Present, defined1950), and from 1000 BP to the present. The increasingappearance of maize pollen between 6500 and 4500 BP,following a transition from moist to dry conditions (Brown1985), has led some scientists to believe that the domestica-tion of plants for agricultural use was tied to climate change.
Together with changes in social organization, climatechanges have been implicated in both the rise and thecollapse of powerful pre-Hispanic civilizations, such as thosein the Yucatan and in the valley of Mexico. Past and presentMexican society has adapted to the constraints of the aridand semi-arid regions. Indigenous groups, such as the Yaquiand Papago of the Sonoran desert, grew crops adapted to thedesert environment, and used water-harvesting techniques(Dunbier 1968). In other parts of Mexico, many different

2 MEXICO 57
Table 1. Classification of Mexican land area by generalclimate type
Climate Area (ha)
Very humidHumidSemi-aridAridVery arid
490126213740725422636988
Source: Reyes Castaneda (1981).
213382819
Table 2. Land use potential in Mexico
Use
ArablePastureForestUncultivatedNon-agricultural
Area (ha)
3035075850441701061036410
%
15.637.922.55.5
18.5
Source: Reyes Castaneda (1981).
agricultural technologies - such as the chinampa system andterracing - have been developed to conserve water andreduce drought risks (Wilken 1987).
With Spanish colonization there was a tremendous expan-sion of irrigation in Mexico, which extended the range andreliability of crop production while increasing competitionfor limited water supplies in some regions. Historians haveblamed climate for famine and social unrest during thecolonial period. Between 1521 and 1821, 88 droughts wererecorded, with the worst in 1749, 1771 and 1785. Florescano(1969) has linked variations in the price of maize in thesixteenth and seventeenth centuries to droughts and otherclimatic events. Florescano claims that the majority of pricerises were preceded by a severe drought, but he also notes therole of speculation and economic arrangements in triggeringprice rises and associated famines. He suggests that theeconomic and land-tenure relations imposed by the Spanishcrown and church created a tremendous vulnerability todrought among the poorer and indigenous campesino popu-lations. The colonial political economy allowed the largerland-holders and merchants to manipulate the price ofstaples in drought years to the disadvantage of poor con-sumers and small producers.
The Spanish introduced cattle into arid northern Mexico(Fig. 3), beginning the process of desertification from over-grazing which continues to the present day. Widespreaddeforestation and desiccation were also associated with thedevelopment of colonial mining settlements in regions suchas Durango and Zacatecas (West and Augelli 1990).
DROUGHT IN TWENTIETH-CENTURYMEXICO
Since independence and the Mexican Revolution, a steadyand unvarying expansion of Mexican agricultural produc-tion has been necessary to meet the demands of a rapidlygrowing population and agricultural export market. In thedrive to modernize and expand production, the Mexican
agricultural system has incorporated techniques which mayreduce vulnerability to climate variations, such as irrigation,fetilizers, pesticides and improved seed varieties.
However, some believe that the large regions of high-yielding monocultures established through Green Revolu-tion technologies are much more vulnerable to pests anddiseases than traditional mixed cropping (Pearse 1980). It isalso argued that the new techniques have replaced sometraditional hazard prevention strategies, such as mixed crop-ping and microclimate modification (Wilken 1987), and haveenabled agriculture to expand into areas of high hazard risksuch as deserts, mountains, coastal regions, and the disease-susceptible humid tropics.
In the debate concerning the redistribution of land thatfollowed the revolution, the performance of the ejido sector,consisting of communally held plots, has been a particularpoint of contention. More than 50% of Mexico's cultivatedland is held in ejidos. Although some authors suggest that theejidos are inefficient and unproductive (Wellhausen 1976),others claim that, in terms of input use, they are relativelyefficient and produce yields equal to the private sector(Dovring 1970; Nguyen 1979). The problems associated withthe ejido sector have been attributed to their lack of politicalpower, difficulties in obtaining access to credit and inputs,poor management, and low-quality land resource endow-ments (Hewitt de Alcantara 1976; Coll-Hurtado 1982).
Mexican agricultural practices vary from small, tra-ditional farms to large, high-input corporate farms. Asso-ciated with these, and inherited from the colonial land-tenuresystems, are differential vulnerabilities to drought. Flores-cano (1980) suggests that, as in earlier times, the mostdisastrous effects of drought are concentrated in the rainfedagriculture practiced by the poorest ejidatarios and campesi-nos, who lack credit, irrigation, fertilizers and improvedseeds.
Our research has shown widespread and severe vulnerabi-lity to drought and other hazards in the twentieth century,such as floods and frosts, which are associated with climatevariability (Liverman 1992a). The natural hazard losses in

58 II CLIMATE VARIATION, CLIMATE CHANGE AND SOCIETY
7 2 TEMPERATE VEGETATIONI. Highlond Forest (Deciduous and evergreenbroadleaf trees and evergreen coniferous trees).
2. Lowlond Forests of Southeastern United States(Mixed deciduous ond evergreen deciduous andconiferous trees).
3. Chaparral Scrub Forest (California-typeevergreen shrubs and low trees).
4. Humid Prairie Grasslond ond Coastal 2 4 "Marsh of southeastern United Stotes.
5. Semi-Arid Grassland (Short grass covewith scattered shrubs ond cacti).
1 | 6. Desert Scrub.
TROPICAL VEGETATION
7. Tropical Rain Forest(Broodleof evergreen trees).
12° Pjr^3tii a Tropical Deciduous ond Semi-deciduous Forest(Deciduous and evergreen broadleaf trees).
T] 9. Tropical Savonno (Toll grass cover with scattered deciduous ond*J evergreen broadleaf trees ond shrubs; palms; and sometimes pines)
10. Tropical Scrub (Low deciduous trees and shrubs with cocti).
——""* Southern limit of North American pines Vinus, sp.)
108° 96°
Figure 2: Natural vegetation of Mexico. (Source: West and Augelli 1990.)
Direction of spread oflivestock industry
Figure 3: The spread of livestock economy in Mexico and Central America during the colonial era. (Source: West and Augelli 1990.)

2 MEXICO 59
Loss as % planted
0 to 5
Figure 4: Drought loss (%) in Mexico 1970.
agriculture from 1930 to 1980 at the national level in Mexicohave been analyzed using data from the agricultural census.On average, more than 90% of hazard losses in Mexicanagriculture are from drought. Furthermore, the area of totalhazard losses increased in Mexico from 1930 to 1970, and thetotal drought losses increased from 1950 to 1960 to 1970.This partly reflects an increase in the total crop area, from 7.8m ha in 1930 to 11.8 m ha in 1960. Relative (percentage)losses also increased, indicating that some of the land expan-sion may have included more hazard-vulnerable land. How-ever, both absolute and percentage hazard losses increaseddramatically in 1970 when land area dropped to 10.2 m ha.The meteorological record does not indicate an increasingseverity of weather events in the census years, or from 1960 to1970. The increase may, therefore, support a hypothesis thathazard losses have been increasing irrespective of weatherseverity, because of increases in social vulnerability tonatural disasters.
High drought losses tend to occur in the northern region ofMexico, where precipitation is low and highly variable. Fig. 4shows that parts of northern Mexico lost more than 35% ofthe area planted to drought in the summer of 1970. In manyregions of local rainfed agriculture, drought destroys morethan 50% of the crops that are planted, and farmers riskharvest failure 1 in every 3 years.
One of the major buffers against drought in arid and semi-arid regions is irrigation. However, if water supplies are
limited, or climate changes, reliance on irrigation can berisky. Is there any evidence that irrigation buffers agricultureagainst drought at the national level? States with high levelsof irrigation, such as Sonora and Sinaloa, do have muchlower drought losses than many of the states with smallerproportions of irrigated land. However, in 1970, Aguasca-lientes and San Luis Potosi, with about 20% of their landirrigated, reported drought losses of 70% and 50%, respecti-vely, indicating that irrigation may not always buffer Mexi-can states against drought.
As noted earlier, some people suggest that the use ofimproved seeds, such as those produced at CIMMYT (Cen-tro Internacional de Mejoramiento de Maiz y Trigo), may beassociated with changes in natural hazard vulnerability. Wehave found a correlation between expenditure on improvedseeds and drought losses to be negative but weak ( — 0.18 in1970), suggesting that higher expenditures on improvedseeds may be associated with lower drought losses.
As noted earlier, the relative economic vulnerability of theejidos has become a matter of considerable academic andpolitical interest. Fig. 5 shows the average losses, at the statelevel, for the two main land-tenure sectors in Mexico. Inevery census year the average losses in the private sector areless than those in the ejido sector. In 1950, losses were doubleon ejido lands. Differences between private and ejido lossesare significant for each hazard, with ejidos generally report-ing higher drought, flood, and frost losses.

60 II CLIMATE VARIATION, CLIMATE CHANGE AND SOCIETY
30
25
20
15
10
0
Total ] Private land t 1 Ejido land
H
•I•:==•:::::::::::::::::::
illiiiiiliiiiiiiiilliiifI!!!!!!!!!!!•I::::::::::I::::::::::• : : : = : : : : : :
; ; • • ; ; : : ; : : ;
=====1=1=111
1930 1940 1950
Figure 5: Average losses for the two main land-tenure sectors in Mexico.
1960 1970 1980
These results seem to confirm the ideas of Florescano
about the relative vulnerability of the ejido sector to drought
and to support the findings of a previous study of drought
losses at the municipio level in Sonora and Puebla in 1970
(Liverman 1990). Explanations of this increased vulnerabi-
lity are that more biophysically marginal land was given to
ejidos in the land reform, and that ejidos are socially vulner-
able because they cannot get access to irrigation, credit,
improved seeds or other resources.
GLOBAL WARMING
It is clear that Mexico is already severely affected by climaticvariability, and is particularly vulnerable to drought con-ditions. Many scientists believe that an increase in carbondioxide (atmospheric CO2) is likely to result in warmerglobal temperatures and altered precipitation patterns -scenarios which could have serious implications for the aridand semi-arid climates of Mexico. The majority of globalwarming experiments with climate models have simulatedcurrent climate using a CO2 concentration of about 300 partsper million (ppm) and have compared the results with asimulation based on a doubling of CO2 levels to about 600ppm. Scientists estimate that this doubling of CO2, which islikely to occur in the first half of the next century, may raisethe global mean temperature by 1.3-5.1 °C (IPCC 1990). Themagnitude of temperature changes will vary across regions ofthe globe and will be accompanied by changes in rainfall andother climatic variables. The poles, for example, are expected
to warm more than the equator, and precipitation willincrease in some places and decrease in others.
What do the models project for the climate of Mexico? Weobtained the 1 x CO2 and 2 x CO2 results for the grid pointscorresponding to the Mexican landmass from five majorgeneral circulation models (GCMs) (Liverman and O'Brien1991). The resolution of the models is represented on gridssuperimposed on a map of Mexico in Fig. 6. The models werefer to are:
(1) The Geophysical Fluid Dynamics Laboratory (GFDL)model developed at Princeton and described by Manabeand Wetherald (1987). The results used in the Mexico studyare from the 'Q' run which includes variable clouds and hasa 7.5° x 4.44° geographic grid.
(2) The Goddard Institute for Space Studies (GISS) modeldescribed by Hansen et al (1988). We use the 'Model 1'equilibrium run result for a 10° x 7.83° grid.
(3) The National Center for Atmospheric Research (NCAR)model described by Washington and Meehl (1986). We usethe mixed layer ocean version and seasonal rather thanmonthly results on a 7.5° by 4.44° grid.
(4) The Oregon State University (OSU) model discussed bySchlesinger and Zhao (1989) with a mixed layer ocean and a5° x 4° grid.
(5) The United Kingdom Meteorological Office (UKMO)model described by Wilson and Mitchell (1987) with a grid7.5° x 5°.
These models vary in their assumptions about cloud cover,ice feedbacks and the representation of oceans, and in theircharacterization of topography, geography and soil depth,

2 MEXICO 61
1 GFDL(IO)
GISS (4)
: NCAR(6)• • • • « v y
l
f n' 1 I
Mexico GCM gridsDBAS V GEOGRAPHICS LAB
Figure 6: Mexico GCM grids. For details of models see text. The numbers in parentheses are the number of grid squares that coverMexico in each model. (Source: Deasy Geographies Lab.)
among other factors. In spite of these differences, there aremany similarities in the structure and parameterizationsamong the models (Bach et al 1985; Schlesinger and Mitchell1987).
GLOBAL WARMING PROJECTIONS ANDMEXICAN CLIMATE
The models project annual average temperature increasesranging from 2.38 °C to 5.44 °C (Table 3). The version of theUKMO model used in this study produces greater tempera-ture increases than the other models due to differences incloud feedback mechanisms, which result in higher netradiation and lower soil moisture (Wilson and Mitchell1987). These temperature increases are much greater than thevariations estimated to have occurred in Mexico over the lastseveral thousand years. They are similar in magnitude to thewarming forecast for much of the mid-latitudes, including
the United States and Europe. The temperature changesprojected by the models are much more consistent than thosefor precipitation. The model results for precipitation varywidely, from a 23% decline in Mexican annual averageprecipitation projected by the NCAR model to a 3% increaseprojected by the GISS model.
Fig. 7 shows current and projected changes in climate at anumber of semi-arid and arid meteorological stations inMexico. Temperatures under global warming have beenestimated by taking the temperature change projected by themodels for the grid square in which the station is located, andadding the increment to the observed 30-year mean. Precipi-tation estimates are based on the percentage change from the1 x CO2 to 2 x CO2 simulations, multiplied by the observedmonthly precipitation.
For all of the stations, all five of the models projectincreases in temperature for every month of the year, result-ing in more months of extremely high summer temperatures.The changes are greater for locations in northern Mexico,

62 II CLIMATE VARIATION, CLIMATE CHANGE AND SOCIETY
Table 3. Annual average temperature changes predicted byfive GCM models
Model
GFDLGISSNCAROSUUKMO
Temperature (°C)
3.113.922.383.155.44
Precipitation (%)
-1.752.74
-23.01-1.05-0.09
Notes:GFDL, Geophysical Fluid Dynamics Laboratory model;GISS, Goddard Institute for Space Studies model; NCAR,National Center for Atmospheric Research model; OSU,Oregon State University model; UKMO, UK MeteorologicalOffice model.
where monthly increases of up to 7°C would result inmonthly temperatures greater than 30 °C during summermonths at stations such as La Paz, Ciudad Obregon andMonterrey. For example, mean monthly summer tempera-tures of about 25 °C in Chihuahua could increase to almost30 °C (Fig. 8). In Ciudad Obregon, which already experiencessummer temperatures near 30 °C, temperatures in severalmonths could approach 35 °C (Fig. 9). These increases in thealready hot summers of northern Mexico are likely to bringgreat stress to humans, flora and fauna, particularly if thesemonthly means imply even higher daily temperatureextremes. On the other hand, warmer temperatures mayextend the growing season at higher elevations, such asChihuahua, which sometimes experiences cold temperaturesand frosts during winter months. Temperature increases arenot quite as high in central Mexico as in the north. MexicoCity's current winter temperatures of around 12°C couldincrease to as high as 18 °C. In the highland agriculturalregions around Mexico City, such as Puebla, warmer temper-atures could be beneficial by reducing the risk of frost.
The range of projected precipitation changes is muchgreater than that for temperature, with increases shown forsome models and some months and decreases for others. Inthe arid northern cities of La Paz, Tijuana, Ciudad Obregonand Chihuahua, several models project higher summer rain-fall, but others suggest an overall decline in annual rainfallwith global warming. For example, in Ciudad Obregon,which is located in one of the most important irrigatedagricultural regions of Mexico, the GISS and UKMOmodels indicate that rainfall may increase in July andAugust, whereas other models show lower rainfall through-out the year (Fig. 10). Scenarios for Chihuahua's climatefollow similar patterns, but with significant drops in OSU
and GFDL estimates for summer rainfall. In Monterrey,most models indicate a decline in summer and total rainfall.Although at least one model predicts a dramatic increases inrainfall in some summer and fall months in the moistsouthern climates of Jalapa, San Cristobal and Merida, othermodels suggest significant decreases in total rainfall at manystations, especially during the summer rainy season.
LIMITATIONS OF USING MODELPROJECTIONS
There are several criticisms and limitations associated withthe use of GCMs in assessing the regional impacts of globalwarming. Although most model results show an overallincrease in temperatures, they differ in their regional projec-tions of the magnitude of the warming, and often show littleagreement on the direction and magnitude of precipitationchanges. Many key processes and components, such ascloudiness and ocean circulation, are inadequately repre-sented by the models. The coarse scale of the model gridsmakes it difficult to allocate climate changes to specificlocations and tends to neglect some of the important sub-gridscale weather patterns that can be important determinants ofprecipitation. Several studies have shown that in many casesthe models are unable to replicate current climate andclimate variability (Grotch 1988; Kellogg and Zhao 1988;IPCC 1990).
ABILITY OF THE MODELS TOREPRODUCE OBSERVED MEXICANCLIMATE
The models perform rather poorly in simulating the currentclimate of Mexico. Comparisons between model results for'current' or '1 x CO2' levels of carbon dioxide (approxima-tely 300 ppm) and observed climates are complicated bydifferences in, and the large size of, the spatial grids of themodels (Fig. 7), as well as the uneven distribution ofmeteorological stations. One of our methods of comparisonis based on individual meteorological stations, comparingthe most recent climatic normals (e.g. 1951-1980 averagetemperature and total precipitation) with the average tem-perature and precipitation produced by the 1 x CO2 simula-tion of the models for the grid square in which the station islocated. Figs. 11 and 12 show the results of such a compari-son for Chihuahua, located in the arid north of Mexico. Inwarm, arid Chihuahua, the models estimate annual averagetemperatures ranging from - 2°C to + 6°C of the observed,with the UKMO model coming closest to observed con-ditions. The UKMO model also comes the closest to replicat-ing observed total annual rainfall at Chihuahua, in contrast

2 MEXICO 63
lammmGuadalajara
DEASYGEQGRAPHICS
• k Zacatecas
UsRisss&4:mmmmm::m *;
Mexico City
Puebla
Oaxaca
M m\ mSan Cristobal
Figure 7: Current and projected climate changes in Mexico. (Source: Deasy Geographies Lab.)
35
30
D 25GR 20EE 15S
c 10
5
0
CHIHUAHUA TEMPERATUREOBSERVED AND DOUBLED CO2
* +
" * A i I *- | A
A
+ A
_..£ *»
Li
"P * t— " • • $
-A f-e
—
JAN FEB MAR APR MAY JUN JUL AUG SEP OCT NOV DEC
1 CURRENT (51-80) D GFDL * GISS
A NCAR x OSU + UKMO
Figure 8: Mean monthly temperatures in Chihuahua: current andprojected with 2 x CO2.
CIUDAD OBREGON TEMPERATUREOBSERVED AND DOUBLED CO2
- j i i - HK
AT
1
A
JAN FEB MAR APR MAY JUN JUL AUG SEP OCT NOV DEC
E Z I OBSERVED
A NCAR
GFDL
OSU
* GISS
+ UKMO
Figure 9: Mean monthly temperatures in Ciudad Obregon: cur-rent and projected with 2 x CO2.
to the GFDL and NCAR models, which seriously over-estimate it (Fig. 12).
The inability of the models to reproduce the seasonality ofrainfall in northern Mexico represents a serious problem. Allmodels, except GFDL, show a winter maximum of rainfall inChihuahua, whereas observed maximum rainfall occurs inthe summer. Possible explanations for this discrepancy
include: (1) the models are generating the westerlies (whichbring winter rainfall only in the far northwest of Mexico)much further south than actually occurs; or (2) the lack oftopography in the models is obscuring the observed rainsha-dow effect of the Sierra mountains in winter.
Individual meteorological station conditions may not berepresentative of the regional climates which correspond to

64 II CLIMATE VARIATION, CLIMATE CHANGE AND SOCIETY
CIUDAD OBREGON PRECIPITATIONOBSERVED AND DOUBLED CO2
JAN FEB MAR APR MAY JUN JUL AUG SEP OCT NOV DEC
OBSERVED
NCAR
GFDL
OSU
GISS
UKMO
Figure 10: Precipitation in Ciudad Obregon: current and pro-jected with 2 x CO2.
CHIHUAHUA PRECIPITATIONOBSERVED AND 1 x CO2
100
m l + l _HLJAN FEB MAR APR MAY JUN JUL AUG SEP OCT NOV DEC
d H OBSERVED
A NCAR
GFDL
OSU
* GISS
+ UKMO
Figure 12: Precipitation in Chihuahua: observed and projectedwith 1 xCO2.
CHIHUAHUA TEMPERATUREOBSERVED AND 1 x CO2
" I *"•
JAN FEB MAR APR MAY JUN JUL AUG SEP OCT NOV DEC
CZH OBSERVED
A NCAR
° GFDL
x OSU
* GISS
+ UKMO
RAND OBSERVED COMPARED TO MODELS (1XCO2)JANUARY TEMPERATURE AT 30N LAT
"qcKDaaoaoaaaoDDD
DGDDDDDDOQDQOOd
90 92.5 95 97.5 100 102.5 105 107.5 110 112.5 115 117.5
E LONGITUDE W
RAND
- * • • UKMO
OSU
GFDL
• • + - NCAR
* GISS
Figure 11: Temperature in Chihuahua: observed and projectedwith 1 xCO7.
the scale of the GCM grids. The heterogeneity of theMexican environment means that meteorological obser-vations within a model grid square may vary widely. Toinvestigate this, we have used regional averages of observedclimates developed by the RAND Corporation, in whichtemperature and precipitation values are averaged formeteorological stations within a 5° x 4° geographic grid. TheRAND dataset is that being used by the United StatesEnvironmental Protection Agency (USEPA) to compareGCM control runs with observed data (USEPA 1991).
Fig. 13 shows model results compared with RAND clima-tology for January temperatures and annual precipitation,across an east-west transect at latitude 30° N. Observedconditions in January show a general increase in tempera-
RAND OBSERVED COMPARED TO MODELS (1XCO2)AVERAGE PRECIPITATION 30N LAT (MM/DAY)
Vxxxxxxxxxxxxxn
90 92.5 95
RAND
UKMO
97.5 100 102.5 105 107.5 110 112.5 115 117.5
E LONGITUDE W
OSU
GFDL
NCAR
GISS
Figure 13: Model results compared with RAND climatology forJanuary temperature and precipitation at latitude 30° N.

2 MEXICO 65
tures from east to west, but with a decline around 105°longitude which represents the cooling influence of higherelevation stations. The NCAR and OSU models follow thisclimatology most closely; the UKMO and GFDL modelsproduce temperatures that are too low, even in the highlandregion. The RAND annual rainfall declines from east to westacross northern Mexico, from the more humid Gulf Coast tothe deserts along the Pacific. There is a slight increase inobserved rainfall as air starts to rise over the highlands atlongitude 110° W. The GISS and GFDL models showrainfall decreasing from east to west, but the OSU modelproduces an opposite trend. The UKMO model seems toreplicate best the orographic rainfall increase over north-central Mexico.
These results demonstrate some of the inadequacies in theability of climate models to reproduce observed climates, andcan lead to distrust in the changes projected by the models,particularly those for precipitation. Although the 1 x CO2
simulations do not always correspond with the regionallyaveraged observed climates, the agreement is generally closerthan with the individual station values. It may, therefore, beappropriate to compare GCM results for the current climatewith such spatial averages of observed conditions. Overall,the UKMO model seems to provide the best representationof contemporary Mexican climate.
SOIL MOISTURE AND WATERAVAILABILITY
Table 4. Changes in potential evaporation and wateravailability
Assessing changes in moisture availability, particularly inlocations where both temperature and rainfall are projectedto increase, requires the analysis of evaporation. We need toknow how any increase in rainfall or growing season length islikely to interact with the increased evaporation associatedwith higher temperatures. Potential evaporation is theamount of water that would be evaporated into the atmos-phere from a completely wet surface and depends on factorssuch as temperature, solar radiation, humidity and wind.Most of the models calculate evaporation and soil moistureinternally, but the surface energy and water budgets of themodels tend to be rather simple. For example, all but theGISS model represent soil water using a 15 centimeters deep'bucket,' which when full produces runoff. Moisture is lostthrough evaporation, at slower rates as the bucket empties(Kellogg and Zhao 1988). A problem arises in dry regionswhere the 1 x CO2 simulation of soil moisture is low. Even ifpotential evaporation in the model rises under the highertemperatures of 2 x CO2 there is little or no water to evapor-ate in the bucket and, as a result, the estimated change in soilmoisture will be very small. In reality, deeper soils can often
Observed
Ciudad ObregonPE 2437 mmP-PE -2181mm
MeridaPEP-PE
2483 mm-1496 mm
Mexico CityPE 1782 mmP-PE -966 mm
Monterre>PEP-PE
OaxacaPEP-PE
PueblaPEP-PE
2106 mm-1515 mm
2123 mm- 1516 mm
1528 mm- 694 mm
GFDL
19%- 2 1 %
9%- 3%
7%-23%
18%-29%
5%- 2 %
14%-45%
GISS
20%-16%
9%- 5 %
10%-23%
19%-28%
12%-19%
12%-33%
Model
NCAR
8%-12%
6%- 7 %
6%- 1 1 %
13%-33%
3%- 6 %
7%-23%
OSU
13%-15%
8%- 2 %
8%-14%
17%-23%
8%0
10%-18%
UKMO
27%-23%
12%24%
10%-15%
31%-47%
16%-22%
16%-30%
Notes:PE, potential evaporation (Penman); P - PE, Precipitation minuspotential evaporation; models as in Table 3.
contain more water, and soil moisture could decline signifi-cantly as temperatures rise.
The water balance results of the GISS and OSU modelsproject that potential evaporation will increase in all monthsbecause higher air temperatures increase the atmosphericdemand for moisture in air that is relatively dry. The GISSmodel internally estimates a 15% increase in potential eva-poration for the Chihuahua grid square. The OSU model, onthe other hand, projects a 12% decrease in potentialevaporation.
Because of the limitations of modelling soil moisture in theGCMs, we have used model projections for precipitation,temperature and solar radiation changes to estimate evap-oration and moisture availability exogenously using theThornthwaite and Penman methods. The Thornthwaitemethod uses temperature, whereas the Penman procedurealso includes radiation, humidity and wind speed. Table 4shows changes in Penman potential evaporation projectedby the different models for a selection of Mexican locations.For these particular analyses, no change in wind, relativehumidity or cloudiness was assumed.
Potential evaporation is projected to increase at all thestations because higher air temperatures increase the atmos-pheric demand for moisture in air that is relatively dry. Forexample, at Ciudad Obregon, in the arid northwest, currentpotential evaporation is estimated at almost 2500 mm per

66 II CLIMATE VARIATION, CLIMATE CHANGE AND SOCIETY
annum. Depending on the model, this is projected to increaseby 8-27%. Monterrey also has large projected increases.These stations in northern Mexico are adjacent to importantirrigation districts where increased potential evaporationwould increase losses from surface water supplies and irri-gated crops. Similar increases in potential evaporation arepossible in central Mexico, where demand in locations suchas Mexico City, Puebla and Oaxaca could increase by5-15%.
The relationship between increased potential evaporationand changes in precipitation can be simply approximatedover a year by subtracting total annual potential evaporationfrom annual precipitation to produce an estimate of mois-ture surplus or deficit. Under current climate, such a calcula-tion for Ciudad Obregon results in a moisture deficit of 2181mm. Although the GISS and UKMO models projectincreases in precipitation in northwest Mexico, these arecounteracted by the increased potential evaporation asso-ciated with higher temperatures, especially in the UKMOcase. The moisture deficit increases by 16% with the GISSmodel, and by 23% for the UKMO model. Similar decreasesin water availability are indicated for Monterrey, where themoisture deficit increases from 23% to 47%.
These results suggest that dry regions of northern Mexicomay become even drier with global warming, at least asaveraged over the year. The consequences for rainfed agri-culture, urban and industrial water supplies, and naturalecosystems would be serious. In northwest Mexico, theeconomy and livelihoods depend on adequate supplies ofwater to cities and irrigated agriculture. Northern Mexico isexperiencing dramatic industrialization and urbanizationwith ever-increasing demands for water. Three-quarters ofthe water needs in this region depend on limited suppliesfrom reservoirs and rivers. In 1987, a severe drought year inmuch of Mexico, reservoir levels in the northwest dropped onaverage to only 30% of their capacity with a correspondingdrop in production of wheat and other important crops. Thenorthwest is also a region where international conflicts overwater from the Colorado River could be exacerbated byincreases in potential evaporation (Gleick 1988).
Rainfed agriculture and economic development arealready limited by annual water deficits in central Mexico.Harvests often fail through a combination of high tempera-tures and lower than expected rainfall. The Puebla region,where an 18-45% decline in water might occur, is animportant region of agricultural employment and supplier offood to Mexico City. Mexico City has a growing demand forwater, which is currently met by bringing in water from thesurrounding area. If water supplies shrink by 11-23% in thebasin of Mexico, there will probably be serious implicationsfor health and economic growth in Mexico City.
In Oaxaca, where many peasant farmers have to deal with
recurring droughts, some optimism is offered by the GFDLmodel, where the moisture deficit is estimated to be reducedby 2% compared with current conditions. In this case, theprojected increase in precipitation in the Oaxaca grid squareseems to compensate for the higher potential evaporationproduced by increased temperatures. However, the GISSand UKMO models, which project precipitation decreases inOaxaca, produce 19% and 22% increases in water deficits,respectively.
The implications of possible errors in the model pro-jections for precipitation and solar radiation have beeninvestigated through a sensitivity analysis of the Penmancalculations. For example, in the cases of Puebla and CiudadObregon we find that it would require significant decreases inwind speeds or solar radiation to prevent an increase inpotential evaporation with higher temperatures. In Puebla,the effects of global warming under the GFDL scenariowould be offset by a 25% decrease in solar radiation, a 50%decrease in wind speed, or a 25% increase in relative humi-dity. Moisture deficits could only be reduced by much largerincreases in rainfall than currently projected by the models.For example, to increase water availability under the GFDLscenario, precipitation would need to increase by 25%. Onlyif the climate models are greatly overestimating temperatureincreases, or if they are very wrong regarding rainfall andsolar radiation, does the future seem optimistic for wateravailability if global warming occurs in Mexico.
IMPLICATIONS FOR MEXICANAGRICULTURE
We have also assessed the possible impacts of global warm-ing on Mexican crop production using the CERES-MAIZEcrop yield model. The CERES model uses daily weather datato estimate the effects of climate on yields of rainfed orirrigated maize. The model is physiologically based, simulat-ing the influence of solar radiation, degree-days, nutrientsand water availability on the development of maize throughmajor phenological stages (Jones and Kiniry 1986; Adams etal 1990).
It has been suggested that many crops will benefit fromhigher level of atmospheric CO2 and that higher yields mayresult. The CERES model can also include the direct physio-logical effects of elevated CO2 levels on crop growth andwater use efficiency. However, the model does not accountfor changes in pests and diseases and possible yield losses,and may therefore overestimate yields.
The results from one semi-arid agricultural region in thehighlands of Mexico will be discussed here. This site, Tlalti-zapan, is located to the south of Mexico City in the state ofMorelos, at latitude 18°41' N, longitude 99°08' W, and at an

2 MEXICO 67
Table 5. Maize yields and climate change at Tlaltizapan
Scenario
Rainfed yield (tons/ha) Irrigated yield (tons/ha)
330 ppm CO2 555 ppm CO2 330 ppm CO2 555 ppm CO2
BaselineGISSGFDLUKMO
Notes:Models as in Table 3.
4.023.112.742.34
3.813.073.201.56
3.743.103.382.17
2.792.842.982.02
altitude of 940 meters. Average annual precipitation inTlaltizapan is 103 mm, and average temperature is 24 °C. Thesite has clay-silt soils of average depth. Because soils inMexico tend to be nutrient-poor, as well as extremely dry atthe beginning of the growing season, we modified initial soilconditions to represent low soil nitrogen and soil water. Wealso reduced the organic content of the soil by reducing theamount of crop residue in the initial conditions. We used aplanting density of three plants per square meter, and chose atypical planting date of 20 May. In cases where we appliedirrigation we assumed a 0.5 meter irrigation depth at 50%efficiency.
Our baseline results for 16 years at Tlaltizapan producedan average rainfed yield of 4022 kg/ha, and an averageirrigated yield of 3740 kg/ha. Irrigated yields are lowerbecause the added water flushes some of the limited nutrientsout of the soil and the higher nitrogen stress outweighs thelower drought stress (Table 5). Average observed farm yieldsin the region of Morelos are about 1500 kg/ha.
Climate-change scenarios were generated using results ofthe GFDL, GISS and UKMO climate models for changes intemperature, precipitation and solar radiation underdoubled CO2 conditions. Rainfed and irrigated yields arethen simulated under these changed climates with higherlevels of CO2 (555 ppm), and compared with the yieldsestimated for the years of observed weather. The results ofthese experiments, which initially assumed no alterations inplanting dates or other input conditions as the climatechanges, are shown in Table 5.
At the Tlaltizapan site, average yields of rainfed maize forthe period 1974-89 are estimated at 4022 kg/ha. All rainfedclimate-change scenarios (at 555 ppm) result in reductions inmaize yields, ranging from a 20% drop for the GFDL modelto a 61 % drop for the UKMO model. These low yields occurbecause higher temperatures accelerate the phenology andthe crop matures faster with less time for grain filling. Thereis also high drought stress early in the growing season. In the
Table 6. Maize yields and climate change at Tlaltizapan:GISS transient scenario
Scenario
BaselineGISS 2010, 440 ppm CO2
GISS 2030, 550 ppm CO2
GISS 2050, 660 ppm CO2
Rainfed yield(tons/ha)
4.023.673.322.95
Irrigated yield(tons/ha)
3.743.422.992.22
Note: GISS, Goddard Institute for Space Studies model.
UKMO scenario, yields drop dramatically because anincrease in rainfall leaches nutrients out of the soil.
Irrigated yields for the period 1974-89 at Tlaltizapanaverage 3740 kg/ha, with 129 mm of irrigation water appliedduring the growing season. Irrigated yields also fall underchanged climates by 20% for GFDL, 24% for GISS and65% for UKMO. Irrigation water needs do not necessarilyincrease with a warmer climate because of shorter growingseasons. For the GISS and UKMO models, irrigationdecreases to 126 mm and 101 mm, respectively; for GFDL,irrigation increases slightly to 134 mm.
Yields of rainfed and irrigated maize have also beensimulated at Tlaltizapan for the transient scenario of theGISS model. This provides 'snapshots' of climate and CO2
levels at three time periods: 2010, 2030 and 2050. The resultsof these simulations are shown in Table 6. Rainfed andirrigated yields decrease consistently as the climate changesand CO2 levels increase at Tlaltizapan.
Sensitivity analyses and adaptation experiments indicatethe importance of some of the current uncertainties inestimating the impacts of future climatic changes. The resultsreported above assume no change in the average date ofplanting or in the varieties. Clearly, as climate changes,farmers and governments will try to adapt to the changes. We

68 II CLIMATE VARIATION, CLIMATE CHANGE AND SOCIETY
Table 7.
Scenario
BaselineGISSGFDLUKMO
Maize yields and climate change atTlaltizapan: no nutrient limitations
Rainfed yield (tons/ha)
330 ppm CO2
4.493.493.073.92
555 ppm CO2
4.603.773.473.93
Irrigated
330 ppm CO2
4.723.853.973.93
yield (tonnes/ha)
555 ppm CO2
4.723.853.973.93
Notes:Models as in Table 3.
have examined whether earlier and later sowing dates mayoffset the negative impacts of a warmer climate. We have alsotried changing the crop variety to see whether differentvarieties may adapt better to global warming. It is alsopossible to design hypothetical genetic coefficients within theCERES model that maintain high yields under global warm-ing, but it is not clear that these coefficients are biologicallypossible. The sensitivity of the model results to these factorswill indicate possibilities for adjustment to global warmingthrough altering the dates of planting and the genetic type orcharacteristics of the seed.
The amount of fertilizer and irrigation are criticallyimportant to the maize yields predicted by the CERESmodels. The experiments above all assume relatively lowfertilizer use because many Mexican producers can afford touse only 50-100 kg/ha of nitrogen fertilizer at planting. Ifmore fertilizer becomes available to more farmers as theclimate changes, then some of the yield reductions might beoffset. Only with adequate water and fertilization can thedirect effects of CO2 be of significant advantage to plantssuch as maize.
When we run observed and model scenarios with no wateror nutrient limitations we find that the baseline scenarioproduces 4720 kg/ha in Tlaltizapan compared with 3740 kg/ha for the nutrient-limited, irrigated, baseline case (Table 7).The full nutrient scenario of GISS (at 555 ppm) yields 3850kg/ha, GFDL 3970 kg/ha and the UKMO model 3930 kg/ha.The lack of nutrient limitations is particularly important forthe UKMO case, where higher rainfall in the base scenarioheavily leaches nutrients from the soil.
However, given the environmental and economic con-straints and trends in agricultural inputs in Mexico, unli-mited water and nutrients are extremely unlikely. Theexperiment illustrates, however, the sensitivity of maizeyields to assumptions about future resource availability andthat yield declines caused by global warming might bemitigated by the increased availability of water and fertilizer.
Table 8. Rainfed maize yield and climate change:Tlaltizapan planting date and variety adaptations
TlaltizapanScenario (tonnes/ha)
GISS 555 ppmPlanting date +10Planting date -10Variety PioneerVariety Suwan
3.071.052.563.533.53
The dates of sowing might also be an adaptation to globalwarming. Table 8 shows the effects on rainfed yields ofhastening or delaying planting by 10 days and reveals thatchanging the planting date does not seem to help adapt toclimate change. Changing the variety or genetic characteris-tics of the plant might also assist in adapting to globalwarming. Planting the unmodified Suwan or a Pioneervariety produces slightly higher yields with the GISS scenariothan when using the modified variety at Tlaltizapan.
In this study we found that, in spite of differences betweenthe climate model results, the general direction of changes inMexican maize rainfed and irrigated yields with globalwarming is a decrease, whatever the model. Sensitivityanalysis indicates that decreases in crop yields will be severeunder global warming unless irrigation expands, fertilizer useincreases, or new varieties are developed.
MEXICO'S CONTRIBUTION ANDRESPONSE TO GLOBAL WARMING
Increases in the concentration of three major gases arecurrently thought to be changing the radiative properties of

2 MEXICO 69
MEXICO'S CO2 CONTRIBUTIONS1000 Metric Tons of Carbon
GAS FLARING1 %
LAND USE CHANGE28%
MEXICOPETROLEUM PRODUCTION
1200Million barrels
Figure 14: Mexico's CO2 contributions (1000 tonnes of carbon).
o1929 1934 1939 1944 1949 1954 1959 1964 1969 1974 1979 1984
Figure 15: Petroleum production in Mexico.
the atmosphere in such a way that global temperatures willincrease. According to the somewhat controversial WorldResources Greenhouse Gas Index, Mexico is the world'sthirteenth most significant greenhouse gas emitter (WorldResources Institute 1990).
Most of Mexico's global warming contribution is in theform of CO2 from fossil fuel combustion and land-usechanges such as deforestation (Fig. 14). Methane is alsosignificant. Of the fossil fuels, oil production is by far thegreatest CO2 contributor. The most significant methanesources are pipeline leaks and livestock. This snapshot ofcontemporary activities that produce greenhouse gasesprovides little insight into the history and possible future ofgreenhouse gas emissions.
Graphs based on historical statistics show some alarmingtrends. Petroleum production has grown dramatically intwentieth-century Mexico (Fig. 15). Wood production hasalso increased -just one indicator of the pressures that havecaused widespread deforestation in Mexico. The dramaticgrowth of the livestock herd sets the context for contempor-ary methane emissions. Although most trends show a slow-ing of growth in the 1980s, it is unlikely that these trends willlevel off, or reverse, in the near future because of theeconomic and demographic pressures on Mexican resources.
Mexican population is still growing despite lower fertilityrates, and at current rates may double in 35 years. Per capitaconsumption has also increased, with a slight fallback duringthe economic crisis in the early 1980s. Export growth, such aspetroleum exports, is also driving resource consumption andagricultural expansion.
The forces and activities driving Mexico's greenhouse gascontributions are often seen as integral to industrial andagricultural development in Mexico. Slowing industrialgrowth, deforestation, and resource use in Mexico are diffi-
cult for a government burdened with debt, and for peoplestriving for an improved standard of living.
And, of course, global warming may be seen as a lowpriority for a country facing more immediate economic,social and environmental crises. In the summer of 1991 weundertook a study of concern about global warming inMexico, interviewing scientists, government officials andenvironmentalists. For most people in Mexico, local air andwater pollution and deforestation are the priority issues.However, there is a long history of scientific and governmentinterest in climate change in Mexico. For example, themeteorologists at the National University have their ownclimate model, and we found mention of global warming inthe technical literature as far back as 1971.
The Mexican government demonstrated its commitmentto reducing the risk of global change in 1987 when Mexicobecame the first country to sign the Montreal Protocol on theelimination of CFCs and the protection of the ozone layer.Mexico now intends to eliminate CFC use by 1997 and isactively negotiating for substitute technology. We were alsotold that the government views its tree planting and airpollution control policies as a response to the threat of globalwarming.
However, most people we interviewed were adamantabout the unequal responsibility for the global warmingproblem. When the United States and other industrializednations are disproportionately to blame for greenhouseemissions - the United States may produce 17% of theworld's total according to the World Resources Institute(1990) - how can a less wealthy country like Mexico, trying todevelop its economy and resources, be expected to reducegrowth or really contribute very much to solving the globalwarming problem?

70 II CLIMATE VARIATION, CLIMATE CHANGE AND SOCIETY
C O N C L U S I O N
What are the policy options and sustainable developmentstrategies for Mexico in the context of drought and futureglobal warming? This chapter has established that climatevariability and global warming have many serious impactson Mexican agriculture and water resources. Mexico hasbeen vulnerable to drought for centuries and the generaldirection of global change in Mexico is towards hotter, drierconditions. Global warming has significant implications fora wide range of agricultural, energy and conservation poli-cies in Mexico and for many development projects plannedor already under way. Any future hydroelectric or irrigationproject should probably take account of possible declines inwater supply and increased conflicts over access to waterwhich may occur with global warming. The results also lendsupport to the calls for sustainable development, with lessdeforestation, greater care of soil and water resources, andstewardship of biodiversity.
R E F E R E N C E S
Adams, R. M., Rosenzweig, C , Peart, R. M., Ritchie, J. T. et al. 1990.Global climate change and US agriculture. Nature 345:219-24.
Bach, W., Jung, H. J. and Knottenburg, H. 1985. Modeling the Influenceof Carbon Dioxide on the Global and Regional Climate: Methodologyand Results. Paderborn: Ferdinand Schoeningh.
Brown, B. 1985. A summary of late-quaternary pollen records fromMexico west of the isthmus of Tehuantepec. In Pollen Records of Late-Quaternary North American Sediments, ed. V. M. Bryant and R. J.Holloway.
Coll-Hurtado, A. 1982. Es Mexico un pais agricola?: Un analisisgeografico. Mexico D. F. Siglo Veintiuno.
Dovring, F. 1970. Land reform and productivity in Mexico. LandEconomics 46:264-74.
Dunbier, R. 1968. The Sonoran Desert: Its Geography, Economy andPeople. Tucson: University of Arizona Press.
Ezcurra, E. and Montana, C. 1990. Los recursos naturales renovables enel norte arido de Mexico. In Medio Ambiente y Desarrollo en Mexico,ed. E. Leff, pp. 297-327. Mexico: Porrua.
Florescano, E. 1969. Precios del maiz y crisis agricolas en Mexico 1708-1810. Mexico DF: Ediciones Era.
Florescano, E. 1980. Una historia olvidada: La sequia en Mexico. Nexos32:9-18.
Gleick, P. H. 1988. The effects of future climatic changes on inter-national water resources: the Colorado River, the United States, andMexico. Policy Sciences 21:23-39.
Grotch, S. 1988. Regional Inter comparison of GCM Predictions andHistorical Climate Data. Washington, DC: Department of Energy.
Hansen J., Fung, I., Lacis, A., et al. 1988. Global climate changes asforecast by the GISS three-dimensional climate model. Journal ofGeophysical Research 93:9341-64.
Hewitt de Alcantara, C. 1976. Modernizing Mexican Agriculture.Geneva: United Nations Institute for Research on Society andDevelopment (UNIRSD).
IPCC 1990. Intergovernmental Panel on Climate Change. ClimateChange: The Scientific Assessment. Cambridge: Cambridge Univer-sity Press.
Jones, C. A. and Kiniry, J. R. 1986. CERES-Maize: A Simulation Modelof Maize Growth and Development. College Station, Texas: A&MPress.
Kellogg, W. W. and Zhao, Z. 1988. Sensitivity of soil moisture todoubling of carbon dioxide in climate experiments. I: North America.Journal of Climate 1:348-66.
Liverman, D. M. 1990. Vulnerability to drought in Mexico: the cases ofSonora and Puebla in 1970. Annals of the Association of AmericanGeographers 80(l):49-72.
Liverman, D. M. 1992a. The regional impacts of global warming inMexico: uncertainty, vulnerability and response. In The Regions andGlobal Warming, ed. J. Schmandt and J. Clarkson, pp. 44—68. NewYork: Oxford University Press.
Liverman, D. M. \992b. Global change and Mexico. Earth and MineralSciences 60(4):71-6.
Liverman, D. M. and O'Brien, K. 1991. Global warming and climatechange in Mexico. Global Environmental Change 1:351-64.
Manabe, S. and Wetherald, R. T. 1986. Reduction in summer soilwetness induced by an increase in atmospheric carbon dioxide.Science 232:626-8.
Manabe, S. and Wetherald, R. T. 1987. Large scale changes in soilwetness induced by an increase in atmospheric carbon dioxide.Journal of the Atmospheric Sciences 44:1211-35.
Meehl, G. A. and Washington, W. H. 1988. A comparison of soilmoisture sensitivity in two global climate models. Journal of theAtmospheric Sciences 45:1476-92.
Metcalfe, S. E. 1987. Historical data and climate change in Mexico: areview. Geographical Journal 153:211-22.
Mosino, P. A. 1975. Los climas de la Republica Mexicana. In Elescenario geografico, ed. Z. Cserna, pp. 57-171. Mexico: UNAM.
Mosino, P. A. and Garcia. E. 1973. The climate of Mexico. In TheClimates of North America, ed. A. Bryson and F. K. Hare, pp. 345-90.New York: Elsevier.
Nguyen, D. T. 1979. The effects of land reform on agricultural produc-tion, employment and income distribution: a statistical study ofMexican states 1959-1969. Economic Journal 89:624-35.
Pearse, A. 1980. Seeds of Plenty, Seeds of Change. Oxford: ClarendonPress.
Reyes Castaneda, P. R. 1981. Historia de la Agricultura: Informacion ySintesis. Mexico: AGT Editor, SA.
Schlesinger, M. E. and Mitchell, J. F. B. 1987. Model projections of theequilibrium response to increased carbon dioxide. Review of Geophy-sics 25:760-98.
Schlesinger, M. E. and Zhao, Z. 1989. Seasonal climatic changes inducedby doubled CO2 as simulated by the OSU atmospheric GCM/mixed-layer ocean model. Journal of Climate 2:459-95.
Servicio Meteorologico. 1976. Normales Climatologicas. Mexico: Servi-cio Meteorologico.
USEPA 1989. The Potential Effects of Global Climate Change on theUnited States. Washington, DC: USEPA (United States Environmen-tal Protection Agency).
USEPA 1991. Global Comparisons of Selected GCM Control Runs andObserved Climate Data. Washington, DC: USEPA (United StatesEnvironmental Protection Agency).
Washington, W. M. and Meehl, G. A. 1986. Climate sensitivity due toincreased CO2: experiments with a coupled atmosphere and oceanGCM. Climate Dynamics 4:1-38.
Wellhausen, E. 1976. The agriculture of Mexico. Scientific American235:128-50.
West, R. C. and Augelli, J. P. 1990. Middle America. Englewood Cliffs,NJ: Prentice-Hall.
Wilken, G. C. 1987. The Good Farmers: Traditional AgriculturalResource Management in Mexico and Central America. Berkeley:University of California Press.
Wilson, C. A. and Mitchell, J. F. B. 1987. A doubled CO2 climatesensitivity experiment with a global climate model including a simpleocean. Journal of Geophysical Research 92(D11): 13315^43.
World Resources Institute 1990. World Resources 1990-91. Oxford:Oxford University Press.

3: The Impact of Climate Variation and SustainableDevelopment in the Sudano-Sahelian Region
FREDRICK JOSHUA WANG'ATI*
INTRODUCTION
The Sudano-Sahelian region is the strip of land south of theSahara Desert extending across Africa from the Atlanticcoast on the west to the Red Sea and the Indian Ocean to theeast. The region becomes broader in the east to include thedrier parts of Ethiopia, northern Uganda, Kenya and Tanza-nia (Fig. 1). The region embraces three ecological zones: theSaharo-Sahelian transition (arid), the Sahel (semi-arid) andthe Sahelo-Sudanian (sub-humid).
The Saharo-Sahelian transition (arid) zone is character-ized by low annual rainfall of 100-200 millimeters (mm)which also shows high inter-annual variability (50-100%).Climatologically, the humidity index, which is defined as theratio of annual precipitation to potential evapotranspiration(P/ETP), is in the range 0.03-0.2. The vegetation is sparseand includes bushes and small woody, thorny or leaflessscrub. In this zone, rainfed agriculture is not viable except ina few isolated flood-plain microenvironments. The mainproduction enterprise is pastoralism.
The Sahel (semi-arid) and Sahelo-Sudanian (sub-humid)zones have better but still highly variable rainfall regimes(Fig. 2). The mean annual rainfall is in the range of 200-400mm and 400-800 mm, respectively, with 25-50% inter-annual variability. The humidity index is in the range0.2-0.5.
Rainfall distribution over most of the region is monomo-dal, occurring during the months of June, July and August,but the arid and semi-arid areas of Eastern Africa have tworainfall peaks, one in March and the other in May. It is thisconcentration of rainfall which supports crop production in
This report was prepared under the auspices of the United NationsSahelian Organization (UNSO) by Fredrick Wang'ati (Consultant onAgriculture, Research and Development, Kenya) with contributions fromDr Gideon-Cyrus Makau Mutiso (Socio-Economist, Kenya) and KalibaKonare (Director of Meteorological Services, Mali).
spite of the high evaporation rates. The most common soilsare red or gray ferruginous leached soils with low naturalfertility.
Climate variability, which affects mainly rainfall, has beena permanent feature in this region for hundreds of years.Recurrent droughts have had major impacts on the popula-tions and their evolution of traditional survival mechanisms.These traditional strategies have not prevented major lossesof life during particularly dry times, but numbers of peopleand livestock have built up again during the wetter periods.
Climate variation has therefore been one of the majorfactors contributing to environmental degradation and thesocioeconomic process in the Sudano-Sahelian regions. It isthus imperative that patterns of climate variation are wellunderstood as a basis for the formulation of more sustain-able developmental policies and strategies, taking into con-sideration the changing socioeconomic circumstances whichface the populations in the region.
Population and migration
The population of the 22 countries of the Sudano-Sahelianregion is estimated to be 347 million and is increasing at a rateof 2.7-2.8% per annum (Hammond and Paden 1990). Therehas been considerable internal and external migration ofpeople, especially from rural to urban areas, but also to otherAfrican countries, mainly as a result of pressures caused byclimatic variations, environmental degradation and popula-tion increases.
Economic activities
Of the 22 countries in the region, 18 are designated among theworld's poorest. Apart from a few mining activities,especially in the western parts (Mali, Mauritania and Niger),there are few major industrial enterprises in the region and
71

72 II C L I M A T E V A R I A T I O N , C L I M A T E C H A N G E A N D SOCIETY
1. Cape Verde Islands2. Mauritania3. Senegal4. Gambia5. Guinea-Bissau6. Guinea7. Mali8. Burkina Faso9. Ghana
10. Togo11. Benin12. Niger13. Nigeria14. Cameroon15. Chad16. Sudani17. Ethiopia18. Djibouti19. Somalia20. Uganda21. Kenya22. The United Republic of Tanzania
Figure 1: Countries of the Sudano-Sahelian region.
the population is dependent mainly on subsistence agricul-ture and pastoralism. However, intensive crop production ispracticed in the Nile, Niger and Senegal river valleys whichproduce food as well as industrial crops such as cotton.
Economic, social and environmental sustainability
As a result of the poor economic base, education and healthfacilities are still very limited and the region suffers from asevere shortage of trained manpower. The region also iscomposed of a fragile ecosystem where a delicate balance hasto be maintained between conservation and exploitation ofthe vegetation, water and soil resources. Sustainability ofboth the environment and socioeconomic developmentactivities should therefore be a major concern of the nationalgovernments, donors and other development agencies.
The problem of sustainability was clearly demonstratedduring the severe drought which greatly affected the coun-tries of Mauritania, Senegal, Mali, Chad, Burkina Faso,Sudan, Ethiopia and Somalia during the 1970s and early1980s. The local systems were clearly unable to cope and even
massive external assistance in the form of emergency faminerelief and health support could not prevent huge losses of life.
Potentialities and problems
In spite of their present economic situation, most countries ofthe Sudano-Sahelian region have a large reservoir ofuntapped resources of land, water, sunshine, wind andgeothermal energy, unexplored mineral resources, andhuman labor. Many problems relating to social organizationand stability, availability of capital, priority setting in plan-ning, and availability of appropriate technology have, how-ever, prevented the optimum development of these resources.
TRENDS IN KEY VARIABLES
Natural resources
ClimateRainfall is the most variable and critical climatic parameterin the Sudano-Sahelian region. According to the World

3 THE SUDANO-SAHELIAN REGION 73
Arid
III!!!! Semi-arid
Dry sub-humid
Sub-humid
1500
Figure 2: Climatic zones of the Sudano-Sahelian region.
i l , i , i i . l I J I J . I I , h M i l l I I , i
1.0
1.0
I I I I I I I I I I I I I I I I I
1900 1910 1920 1930 1940 1950 1960 1970 1980
Figure 3: Normalized precipitation anomalies in the Sahel, West
Africa. (Source: WMO/UNEP (1991).)
Meteorological Organization/World Climate Program(WMO/WCP) publication on the global climate system, oneof the striking features of the rainfall pattern in Sub-SaharanAfrica since the early 1960s is that each dry episode has beenmore extreme than the previous one, giving the impression ofa general downward trend in rainfall (Fig. 3).
There is, therefore, historical evidence that severedroughts have been part of climatic variations in the past.These droughts occur on two time scales - short term, lasting
km
only 1 or 2 years, and long term, lasting over 4 years - butthere is no clear pattern which can be used for their predic-tion. There is also mounting evidence that such droughts arenot caused by local human activity but are most likely ofglobal origin linked to large-scale oceanographic and atmos-pheric phenomena (e.g. El Nino Southern Oscillation:ENSO). It is, however, possible that droughts in this regioncould be accentuated to some extent due to rapid defores-tation and desiccation of the vegetation and the resultantchanges in energy balance. It has therefore been difficult tostate categorically the extent to which the current downwardtrend will persist or recur in the future (Nicholson 1989), orthe long-term effects it would have on the ecology.
A good example of the trend in climatic variation is thebehavior of the rainfall regime in the Sudan. Analysis of thisparameter (Hulme 1989) shows that during the period 1965—85, rainfall declined by 20% throughout Sudan, resulting incontraction of the wet season in the semi-arid central Sudanby about 3 weeks and a southward displacement of rainfallzones by 50-100 kilometers (km). Similar shifts in isohyets(Fig. 4) have been observed in the Gambia-Senegal-Mauri-tania region (Republic of Senegal 1991).
Although large quantities of climatological data have beenrecorded and in some cases stored in computerized formatswithin the region (e.g. AGRHYMET Centre, Niamey), thesedata have not been adequately analyzed due to the lack of

74 II CLIMATE VARIATION, CLIMATE CHANGE AND SOCIETY
10°
100 Isohyets 1931-60100 Isohyets 1968-84
200I
km
Figure 4: Movement of isohyets in the Mauritania-Senegal-Gambia region, 1968-84. (Source: Republic of Senegal 1991.)
financial and trained human resources. It is therefore diffi-cult at present to make detailed inferences on long-termregional climate trends, except for the general picture emerg-ing from studies of global climate change. One such analysishas been carried out by Downing and Parry (1991). Theirfindings (Fig. 5) suggest that countries such as Djibouti,Somalia and Ethiopia will have a higher probability ofreduction of rainfall during the months of June, July andAugust (which constitute the rainy season within the region)compared with their counterparts in the western part of theregion.
The full impact of global warming, which is associatedwith build up of greenhouse gases in the upper atmosphere, isstill difficult to predict. If, as currently estimated, the surfacetemperatures rise by 1 °C in the next 30 years, increases inpotential evapotranspiration and unknown changes in rain-fall regimes are bound to occur. These changes may or maynot compensate one another.
Water resourcesThe major water systems in the region are the rivers Nile,Niger, Senegal, Gambia and Chari, and lakes Chad andTurkana. Groundwater is also tapped extensively, but it isoften of low quality due to the high concentration ofdissolved salts. Variations in rainfall have a direct influence
Figure 5: Probability of a decrease in precipitation in June, Julyand August in the Sudano-Sahelian region.
on these water resources, resulting in severe floods such asthose which occurred on the Nile recently, and drying oflakes as has been observed in Lake Chad and Lake Turkana.Trends in these resources are, however, difficult to quantifydue to the low level of physical monitoring.
Land resourcesLand degradation is believed to have increased during thepast 20 years due to climatic variations and increasingpressure from both human and livestock populations, whichtends to reduce the regenerative capacity of the naturalvegetation. Few systematic and comprehensive surveys ofland degradation, usually covering only limited areas ofdevelopmental interest, have been carried out in the region.The data in Tables 1 and 2, derived from Global Assessmentof Soil Degradation (GLASOD) data (UNEP 1991), providesome indication of the extent of the problems.
Causative factors for soil degradation are indicated as:agriculture, 24.6%; overexploitation, 12.7%; deforestation,13.5%; overgrazing, 49.2%; bio-industrial activities, 0%(UNEP 1991). The influence of climate variations is implicitin these factors.
Although these figures refer to the whole of Africa, there isno doubt that the majority of the badly degraded lands arelocated in the Sudano-Sahelian region. Prolonged droughtwill have the effect of delayed or reduced re-establishment ofvegetation cover, thus reducing livestock populations andincreasing soil degradation due to depletion of organicmatter. These data should, however, be treated with caution,

3 THE SUDANO-SAHELIAN REGION 75
Table 1. Degree of soil degradation in various bioclimaticzones in Africa (millions of hectares)
Degree
NoneLightModerateStrongExtreme
Total
Bioclimatic zone
Dry sub-humid Semi-arid
231.413.811.411.30.7
268.6
404.323.746.238.1
1.5
513.8
Arid
331.080.569.621.3
1.2
503.6
: UNEP (1991).
Table 2. Types of soil degradation in various bioclimaticzones in Africa (millions of hectares)
Type
NoneWaterWindChemicalPhysical
Total
Bioclimatic zone
Dry sub-humid Semi-arid
231.425.1
1.67.72.9
268.7
404.359.230.711.38.4
513.8
Arid
331.034.8
127.57.62.6
503.5
Source: UNEP (1991).
both since they are based on informed opinion rather thanscientific measurements and because of the broad scale onwhich generalizations have been made (UNSO 1992).
The term 'desertification' has been defined by The UnitedNations Environment Programme (UNEP) as land degrada-tion in arid, semi-arid and sub-humid areas resulting mainlyfrom human impact. This process is therefore not confined tothe Sudano-Sahel region but is taking place in areas wherethe ecological balance has been badly damaged or destroyed.
Desertification in the Sudano-Sahelian region hasattracted more attention since it has appeared as a non-reversible expansion of the Sahara Desert southward. Lam-prey (1988), for example, concluded that the southernboundary of desert vegetation in western Sudan had movedsouthward by 60-100 km between 1958 and 1975, an alarm-ing rate of 5J km per year. However, field studies by Hellden(1984) in the same area found no evidence of such a change.The theory of 'advancing Sahara' has been shown to befaulty; it would be more correct to consider such changes as
oscillations of the Sahara boundary which are dependent onperiodic fluctuations in rainfall.
It is nevertheless important to point out that althoughsome of the badly degraded areas may appear to be recover-ing, these gains may well be reversed if adequate measures arenot taken to restore reasonable ecological balance.
Forest and energy resourcesInformation on status and trends in forest and energyresources is scanty, but some of the data available indicate asteady decline in forest resources by approximately 0.5-3%per annum during the 1980s. The main reasons for defores-tation are expansion of cultivation, fuel wood and grazing. Itwould appear that unless new and renewable sources ofenergy can be found (e.g. through increased development ofgeothermal energy), deforestation will increase and the forestresources in the region may be largely depleted within thenext 50 years.
Land use
Traditional land use in the Sudano-Sahelian region is com-prised of shifting cultivation, smallholder agriculture andnomadic pastoralism. Although no major changes in landuse are expected to occur in the foreseeable future, there arealready signs that sedentary agriculture will increase as aresult of population pressure. Some large-scale mechanizedfarming has been tried on marginal lands, especially in theSudan. But it may be too early to predict future trends inthese activities, since there are already signs that such devel-opments may be abandoned if the cost of inputs relative tocommodity prices in the world market makes the enterprisesunprofitable. If lower rainfall persists, major changes in landuse are inevitable as previously cropped land is abandonedand taken over by pastoralists. Even the latter is dependenton surface water reservoirs which are replenished by seasonalrainfall. Land tenure is another largely unresolved andhighly political issue which will influence trends in land use.
Food production and balance
One way of showing trends in food production and balance isto use an index representing the average annual quantity offood produced per capita in relation to that produced in theindexed year, and the ratio of food imports to the foodavailable for internal distribution. Table 3 shows theseparameters for a number of countries in the region.
These data indicate a stagnation or a decline in foodproduction per capita and an increasing dependency on foodimports during the 1980s. The figures do not reveal, however,the well-known inequities in access to food among various

76 II CLIMATE VARIATION, CLIMATE CHANGE AND SOCIETY
Table 3. Trends in food production and import dependency in
some Sudano-SakeHan countriesTable 4. Economic trends in some Sudano-Sahelian
countries
SenegalEthiopiaSudanSomaliaChadBurkina FasoNigerMali
GambiaAverage
Food productionindex per capita
(1979/81-100)
1986-8
106.089.089.0
100.0103.0116.083.097.0AC A
95.097.5
Food import(dependency
ratio (%)
1969-71 1986-8
31.7—
9.813.13.83.72.06.0
iA n
19.511.2
30.2—14.523.74.59.67.49.6
CCA
55.419.4
SenegalEthiopiaSudanSomaliaChadBurkina FasoNigerMali
Annual %
1965-85
0.370.060.100.020.030.210.450.07
Source: UNDP (1991).
increase
1975-85
1.30.13.70.72.52.83.71.2
Annual %growth rate in
GNP per capita
1965-80
-0 .50.40.8
-0 .1-1 .9
1.7-2 .5
2.1
1980-8
- 0 . 3- 1 . 4-4 .2- 2 . 2
—
2.4- 4 . 2
0.4
Source: UNDP (1991).
social sectors of the populations, which are bound to worsenwith increases in food import dependency.
Economic output
Table 4 shows trends in the national economies of some ofthe countries in the region. The figures indicate that theeconomies are in decline.
Population and migration
Table 5 illustrates trends in population growth in some of thecountries most affected by climate variation in the region.These figures are projections based on the 'medium variant'derived from geometric calculations, which are consideredmore reasonable than the 'high variant' projections derivedfrom exponential calculations. According to these projec-tions, the population is expected to double between the years2000 and 2050, which will impose even greater pressure onthe environment.
Seasonal migration has been a traditional feature of theSahel region for hundreds of years as a means of escaping thehazards of the harsh environment and a search for employ-ment. This practice has, however, intensified in recent yearsdue to persistent drought and ecological degradation. Animportant feature of this migration is that it involves mainlyyoung males, thus reducing the capacity of the remainingpopulation to work on the land. Although accurate data aredifficult to obtain, it has been estimated that the rate ofmigration from destitute regions of the Sahel is among thehighest in the world (David and Myers 1991). There are
indications that this trend will continue with the encourage-ment of the governments as a means of generating foreignexchange income through remittances.
A disturbing trend in migration is the movement of entiresections of populations as a result of prolonged drought.This type of migration is on the increase and has created anew problem of'environmental refugees' in the region. In theabsence of suitable areas for new settlement, large numbersof such people are now to be found camping on the peripher-ies of major towns and other urban areas, where they seekrelief and employment. Many of these people hope to returnto their original homes in the future and therefore do nothave a long-term interest in the new environment. Thesesettlements are therefore likely to accelerate the rate of landdegradation in the region.
Urbanization
The proportion of the population living in urban areas isincreasing and is expected to double during the period from2000 to 2025 (Table 6). While some of this increase will befrom natural growth, the majority of the new urban dwellerswill be immigrants from rural areas. Indications are that thehigh rate of rural-urban migration will continue, or evenaccelerate if rural incomes continue to fall as a result ofenvironmental degradation, unemployment and lack ofsocial amenities commensurate with improved literacy.
Education and health
Social progress within a community can be measured by thedegree to which the three problems of underdevelopment, i.e.

3 THE SUDANO-SAHELIAN REGION 77
Table 5. Population
DjiboutiSomaliaChadSudanMaliNigerSenegalBurkina FasoEthiopia
trends (medium
1950
602423265891903 520240025003 654
19573
variant)
1960
8029353064
111654375302831874452
24191
in some Sudano-Sahelian countries
1970
16836683652
138595484416541585 550
30623
1980
30453454477
1868168635 58655386957
38750
(thousands)
1990
40974975678
252039214773173278996
49240
2000
55297367337
3362512685107529716
1209266364
2025
109418701132455960524774214821698823710
126618
Source: UNFPA (1991).
Table 6. Percentage growth of the population in urban areasof some Sudano-Sahelian countries
Table 7. Percentages of school-age children enrolled inschools in some Sudano-Sahelian countries
DjiboutiEthiopiaSomaliaChadSudanMaliNigerBurkina FasoSenegal
1950
41.04.6
12.74.36.38.54.93.8
30.5
1960
49.66.4
17.37.0
10.311.15.84.7
31.9
1970
62.08.6
22.711.316.414.38.55.7
33.4
1980
73.710.528.920.219.717.310.37.0
34.9
1990
80.712.936.429.522.019.213.29.0
38.4
2000
84.316.844.338.826.523.219.512.444.5
2025
89.733.862.557.945.541.726.827.362.6
Source: UNFPA (1991).
poverty, lack of education and poor health, have beenalleviated. It is, however, difficult to measure these para-meters directly and a common solution is to use indicatorssuch as income per capita and its distribution, the number ofschool-age children enrolled in schools, access to food andhealth care and ultimately the average life expectancy atbirth. Trends in these parameters are summarized in Tables 7and 8 for some of the countries in the heart of the Sudano-Sahelian region. It is, however, important to point out thataccurate censuses are rare in the region and the figurespresented should be regarded as estimates.
It is very encouraging to see the progress achieved ineducation in all the countries of the region since they attainedindependence. This progress is, however, seriously threat-ened by the deteriorating economic trends, which are causedto a large extent by recent droughts, heavy external debt andpolitical instability. One area which is already affected isaccess to health services, which does not keep up withpopulation increases.
EthiopiaChadSomaliaBurkina FasoMaliNigerSudanSenegal
Percentage age-group enrolled in schools
1965
1134101224112940
Primary
1987
3751153223294960
Secondary
1965
21214147
1987
1569666
2015
Source: World Bank (1990).
Table 8. Access to health care and life expectancy in someSudano-Sahelian countries
SenegalEthiopiaSudanSomaliaChadBurkina FasoNigerMali
Population perphysician
1965
19490701902350036840724807396065 54051510
1984
1306078970101001608038360572203973025390
Av. lifeexpectancy (yrs)
1977
4239464343424242
1988
4847504746474547
Source: World Bank (1989, 1990).

78 II CLIMATE VARIATION, CLIMATE CHANGE AND SOCIETY
Sustainability
It is evident from the foregoing trends that there is a seriousproblem of sustainability of the ecological balance, thenatural resources and the development and welfare of thenations and populations of the Sudano-Sahelian region.While climate variations are a natural feature of the region, agreat deal could be done to reduce their negative impacts onthe environment and to enable the populations to cope betterwith the inevitable short-term and long-term climaticchanges. Some of the options available and strategies whichcould be adopted are discussed below.
CLIMATE AND SOCIETY
Past and present impacts of climatic variability andsocietal responses
Impacts of climatic variability are felt most at the nationallevel. Societal responses have therefore been most intense atthe national level, but cooperation and assistance has alsodeveloped at regional and global levels. Each of these levelswill therefore be discussed separately.
Impacts and responses at global levelClimatic variations have stimulated considerable activities atthe global level. The most notable are the World Meteoro-logical Organization (WMO) World Climate Program,WMO/UNEP Intergovernmental Panel on Climate Change(IPCC) and the other numerous international activitiesleading to UNCED. The United Nations Sudano-SahelianOffice (UNSO) was also established by the UN SecretaryGeneral in 1973 following the disastrous drought that struckthe Western Sahel in the late 1960s and early 1970s, to assistin the rehabilitation of the drought-stricken countries of thisregion. Through these activities, a large effort has beendeployed to gain a better understanding of climatic varia-tions and their impacts on the ecology and the extent towhich such variations can be predicted. As a result of thesestudies, the low level of economic and technological develop-ment and international imbalances are emerging as signifi-cant factors in the ability of developing countries to copewith climatic variability. The influence of past and presentglobal response on the actual capacity of the region to copewith climatic variations is, however, yet to be felt, and onlytime will tell whether a more meaningful and sustainableglobal response will emerge from these efforts.
Impact and responses at regional levelThe most visible impact of climate variability at the regionallevel has been the huge interstate migrations of destitutepopulations in search of famine relief. This problem affects
most of the countries in the region, especially those borderingthe Sahara Desert, and has been accentuated in several casesby internal political instabilities. Such migrants have causedconsiderable political tension between countries and econ-omic hardship to the host countries.
At regional levels, countries have responded by establish-ing regional organizations, in particular the PermanentInter-State Committee for Drought Control in the Sahel(CILSS) and the Intergovernmental Authority on Droughtand Development (IGADD), whose mandates includedrought and development.
CILSS was established in 1973 and its membership com-prises nine countries: Burkina Faso, Cape Verde, Gambia,Guinea-Bissau, Mali, Mauritania, Niger, Senegal and Chad.The main aspects of the work of CILSS are:
• the promotion of programs for food self-sufficiency in theregion;
• the promotion and coordination of development programswithin the region;
• an attempt to sensitize donors to the priority needs of theregion.
The major programs undertaken by CILSS include:
• establishment of the Sahelian Network of Documentation;• pest and disease control unit;• establishment of two regional programs: Centre d'Agrome-
teorologie et d'Hydrologie (AGRHYMET) and Institut duSahel (INSAH) and nine national projects;
• a permanent Diagnostics Project (DIAPER);• a plant breeding program (millet and sorghum);• an energy program (gas and solar).
The international response to these programs was theestablishment of a liaison body (Club du Sahel) to coordinatedonor assistance.
The main impact of these programs has been to increasethe numbers of trained specialists in various fields of develop-ment and the implementation of over 600 developmentprojects in the member countries.
IGADD was established in 1986 and its membership iscomprised of Djibouti, Ethiopia, Kenya, Somalia, Sudanand Uganda. The chief aim of IGADD is to enable memberstates to pool and coordinate their developmental efforts incombating drought and its effects on the environment, food,security and socioeconomic development in the region in asustainable manner. Long-term programs have thereforebeen focused on:
• Problems of food security including food policy manage-ment, protection and increase in food production andefficiency of marketing. An early-warning system for foodsecurity was launched in 1989.
• Desertification control. This involves use of assessmenttechniques including remote sensing, optimal and sustain-

3 THE SUDANO-SAHELIAN REGION 79
able use of natural resources, rehabilitation and conser-vation of the environment.
IGADD is, however, a relatively young organization andis still in the process of formulating its programs. It hasnevertheless stimulated the harmonization of environmen-tally related development activities in the region and has,through donor-assisted projects, collected much useful infor-mation on ecological characteristics and changes in thesubregion.
A regional Drought Monitoring Center (DMC) for eas-tern and southern Africa was also established in 1989. TheDMC is a UNDP project implemented by WMO and hasoperational bases in Nairobi and Harare. The DMC isalready issuing monthly bulletins one month in advance ondrought severity, rainfall anomalies and weather outlook.
Establishment of these organizations has also been stimu-lated by the hope and expectation that they will be in a betterposition to attract technical and development assistancefrom the developed countries and United Nations agencies.This is already happening, but not at the level of originalexpectations.
Impacts and responses at national levelIt would appear that in most countries of the Sudano-Sahelregion the major impacts of climate variations have beendroughts, land degradation and desertification. Societal res-ponse has been to evolve various strategies for adapting,including migration as a last resort. According to the report'Assessment of desertification and drought in the Sudano-Sahelian Region 1985-1991' prepared by UNSO forUNCED, and a number of other national reports preparedfor UNCED, governments have responded with programs toincrease the level of public awareness of causes and dangersof land degradation. Success is being achieved throughmobilization of populations to counteract drought anddesertification through various programs and projects.National early-warning systems and environmental moni-toring systems have been established in a number of coun-tries of the region and integrated development projects nowinclude participation by meteorological services. At thecommunity level, response strategies include increased use ofwater-harvesting techniques to safeguard both crop andlivestock production, and initiation of small-scale irrigationprojects. Other activities include dryland agriculture, rangemanagement, deforestation control, soil protection andsand-dune fixation, water resource management anddevelopment.
Impacts of climatic variability and societal responses atthe national level do, however, vary from country to countryand it is difficult to provide detailed accounts of impacts andresponses for all countries of the region. However, a briefaccount of some characteristics, including history and exper-
Table 9. Area by agro-ecological zones in Kenya
Zone IVZoneVZone VIZone VII
Total
Semi-humidSemi-aridAridVery arid
% R/Eo
40-5025-4015-20
15
Area (km2)
2700087000
126000226000
506000
% countryarea
5152246
88
Note: R/Eo, ratio of annual rainfall (R) to evapotranspiration(Eo).Source: Jaetzold and Schmidt (1983).
iences with impacts of climate variations, migration, settle-ment and development, in the arid and semi-arid lands(ASALs) of Kenya, which are similar to many parts of theSudano-Sahelian region, could provide useful insights.
Permanent migration and settlement in drylands:experiences in the ASALs of Kenya
Historical. Over the past 90 years, many farmers havemoved from the more humid zones to the less humid zones.As illustrated in Table 9, zones IV and V account for 20% ofthe country and are significant for crops and livestockproduction. Zone VI forms 22% and zone VII accounts for46% of the country. Therefore, 88% of Kenya has less than800 mm annual rainfall. The development and reclamationof land in these zones is a clear national priority because ofthe exploding population and the need to feed that propor-tion of the population that resides in the ASALs with foodproduced there.
Historically, zones IV, V and VI have received a migratingpopulation from the more humid zones. In the perspective ofcenturies, it is doubtful whether there were permanent settle-ments outside zones II and III until the early eighteenthcentury, as most oral traditions attest. It has been learnedfrom oral traditions that ASAL production was integratedinto the hill/mountain-based homesteads through huntingand livestock keeping in syengo (cattle camps) in the dryplains. The issue of continuous use of the fragile ASALecosystem did not arise for the syengo because of theconstant relocation of the bases; thus there was intermittentuse of range resources.
The syengo was not only for herding. From it came majorsocial institutions for deployment of labor, the distributionsystem of livestock and grain consumables, the scattering oflivestock resources so as to escape drought and disease, andthe then dominant land-holding form which assured thatevery family owned both mountain and plain land, as is

80 II CLIMATE VARIATION, CLIMATE CHANGE AND SOCIETY
Table 10. Livestock population in Kenya, 1987 (thousands)
Beef Dairycattle cattle Sheep Goats Camels Donkeys
Total ASAL 5761 715 4144 7283 956 249Total
non-ASAL 3310 2287 2300 1245ASAL as %
of total 64 24 64 85 100 100
Source: GOK (1989).
Table 11. Average land-holding (hectares per person) inselected ASAL districts of Kenya
District
NarokLamuLaikipiaKituiKwaleEmbuKilifiTaitaMachakos
1969
7.323.362.090.890.790.580.530.450.40
1979
4.301.761.030.660.570.350.380.340.28
1989
2.660.980.550.500.420.280.280.260.20
Source: Livingstone (1989), quoted in GOK (1990).
found in the traditions of many Kenyan peoples. Theseeconomic and ecological adaptation mechanisms, encapsu-lated in the institution of the syengo, have been marginalizedby the population growth of the past ninety years mainly as aresult of permanent migration from the more humid areas.
ASAL production. The ASALs produce the bulk of themeat products in Kenya (Table 10). Although ASALsproduce subsistence crops for their population, nationalfood statistics do not provide a coherent picture of thecontribution of ASALs to crop production. However, thebulk of the bean, cowpeas, pigeon peas, simsim, millet andsorghum, crops which form a major pillar of national foodconsumption, are produced in the ASALs (GOK 1990).However, yields per hectare are generally low and varybetween years, seasons and inter-cropping situations.
ASAL land-holding. The fact that land is becoming short inthe ASALs is well demonstrated in Table 11, which showsaverage land-holdings in selected districts.
This land shrinkage presents tremendous challenges forsustainable development and intensification of ASAL pro-duction. The key issues in any intensification are main-tenance of soil fertility, labor-saving tillage and handling
equipment and water-harvesting for production and,perhaps most complex, the integration of crops and livestockproduction so as to enrich the land.
The objectives of the ASAL programs were ranked by thegovernment of Kenya in 1979 as:
(1) Development of human resources.(2) Exploitation of productive potential.(3) Resource conservation.(4) Integration with the national economy.
The effect of the proclamation of the 1979 ASAL Strategyat the meta-policy level was to create a framework forchannelling resources to areas which would not receive themunder normal economic policy concerns. In particular, theproject selected criteria which preferred projects with thehighest rates of return in the short term. The government ofKenya was sending a clear message to the donors that theareas deserved development in their own right.
Under the 1979 ASAL Strategy, the main programapproach was to be integrated development, which by impli-cation was to be area based. The level of government whichwas relevant, therefore, was the district, but this logicalframework did not always work because some donors haveoperated in ASAL districts at levels lower than that of thedistrict.
This ASAL district based approach to developmentadhered precisely to notions of decentralization of govern-ment operations (project identification and planning, bud-geting and finance operations) which were initiated in 1966within the civil service, but which did not get clear backingfrom the political arena until much later. It was, however,from the political arena that the momentum for the DistrictFocus Strategy for Rural Development (DF) was eventuallygenerated.
In recognition of the potential importance of ASALs, andthe complexity of development processes in these areas, theKenyan government created, in May 1989, the Ministry ofReclamation and Development of Arid and Semi-arid andWastelands (MRDASW). The new Ministry is expected toprovide enhanced capability within the Kenyan governmentto address the special constraints and development possibili-ties of ASALs.
The primary objectives of the 'second-generation' strategyfor arid and semi-arid lands reclamation and development,as set forth in a document under consideration, are to:
• develop ASAL capacity for income generation, employ-ment creation, and the attainment of food security;
• reclaim and protect the fragile ASAL ecologies;• improve the quality of life for the present and future
generations of ASAL inhabitants on a sustainable basis.
The key programs of this strategy are crop development,livestock development, water development, natural-resourceconservation, infrastructure, off-farm employment including

3 THE SUDANO-SAHELIAN REGION 81
enterprise development, and health and social servicesdevelopment.
The Kenyan lesson. The Kenyan ASAL experience is that ofpopulation moving into and within ASALs as a result ofpopulation pressure. Although migrants faced many initialdifficulties and conflicts of interest, they have been able tosettle and evolve a form of existence which appears to besustainable, at least in the short to medium term. A majorfactor in this success has been the recognition by the govern-ment of the special needs of such regions and a constantreview of development policies and strategies for their appli-cability and sustainability. While these strategies have helpedthe population to cope, it is recognized that there is a limit tothe size of the population that the ASALs can carry on thebasis of the land resources. Future responses will thereforedepend on the availability of new technologies for increasingland productivity, success of the family planning programsnow under way and migrations out of the ASALs.
Possible future impacts of climatic variability andcapacities to cope
Climatic variability is likely to remain a major feature of theSudano-Sahelian environment, and there is clearly very littleman can do to change this situation. The future impacts ofthese variations will, however, depend on the capacities ofthe population to cope, especially the state of preparedness atnational and individual community levels.
Impacts assuming present climate variabilityThe Sudano-Sahelian region is a fragile ecosystem, thecapacity of which to withstand the normal climatic varia-tions is critically dependent on the pressures exerted on theland and vegetation resources by both human and livestockpopulations. The trends emerging for these parameters,however, suggest that pressure on the environment (environ-mental stress) will increase rather than decrease in theforeseeable future, even if one assumes no change in thenature, frequency and magnitude of climate variations. Twoof the main causes of this pressure are rapid populationincrease and reduced mobility across borders within theregion.
Before the countries of the region attained independence,the largely nomadic populations were able to move theirlivestock freely over long distances in 'transhumance'systems following the seasonal distribution of rainfall andthe resulting pastures. The 'transhumance' system practicedbetween the Gourma and the seasonally flooded Niger deltain Mali, and similar systems operating between Senegal andMauritania, are examples of this movement. These pastor-alists were also able to depend on traditional and culturalagreements between themselves and the farmers in the more
fertile regions for exchange of grain and fodder for livestockproducts, thus avoiding the necessity to cultivate marginallands. Similar arrangements enabled the farmers in thefertile, but more crowded regions to put their livestock underthe care of the nomadic pastoralists such as the Fulani.
These systems have, however, come under severe stress dueto prolonged droughts, imposition of state boundaries,interstate conflicts and land-tenure restrictions. As a result,large numbers of nomadic pastoralists have lost their liveli-hood and are being compelled by circumstances to adopt asedentary life in marginal lands. Under these circumstnces,the land will be unable to recover from even mild climaticvariations. Intense rainstorms falling on ground with scanty,if any vegetation cover will result in flash floods and soilerosion which will reduce even further the carrying capacityof the land. The already serious problem of environmentalrefugees and rural-urban migration will accelerate, increas-ing pressure on the already inadequate infrastructures andsocial services. Interstate migration of destitute populationswill also increase, thus aggravating economic, social andenvironmental stress in host countries.
Impacts assuming climate changeA major global climate change could have an even moreprofound impact on the region. The IPCC (1991) studyshowed that if global emission of greenhouse gases continuesat the current levels, the earth will warm up by 1-3 °C by theyear 2030. Such a rise in temperature is expected to causemore intensive weather activity, resulting in more severe andfrequent floods and droughts. Some regions of the world arealso expected to dry out, while others could become too wetto allow farming activities. Present predictions of futurechanges in precipitation and regional distributions of climatechange are hardly trustworthy. They must be verified againstthe changes that are taking place, and will take place in thenext decade (Bolin 1989). In either case, climate change couldbe expected to have an impact on the range of crop, vege-tation and other wildlife species which will thrive in the newenvironment.
The IPCC (1991) impacts assessment also predicts a sealevel rise of 0.3-0.5 meters by the year 2050 and about 1 meterby the year 2100. Although most of the countries of theregion are far from coastlines, such changes could haveserious effects on beaches and tourism, especially on theIndian Ocean Coast. In addition, there could be huge lossesof farming land in countries such as Gambia, Guinea Bissauand Senegal.
There are bound to be time lags of uncertain durationbetween changes in the physical (climatic) and ecologicaleffects, and the resultant socioeconomic consequences.Changes will not necessarily come at a steady pace, andsurprises cannot be ruled out (Tegart et al. 1990). Dependingon the time scale in which such changes occur, they could

82 II CLIMATE VARIATION, CLIMATE CHANGE AND SOCIETY
Table 12. Population carrying capacity (millions) of someSudano-SakeHan countries under different levels of inputs
Country
Burkina FasoChadEthiopiaMaliNigerSenegalSomaliaSudan
Projectedpopulation
year 2000
11.88.0
55.311.69.79.76.3
31.3
Population potentialand levels of inputs
Low
6.014.220.110.51.47.62.1
80.6
Medium
26.770.170.837.33.1
22.33.2
259.4
High
135.2306.4280.4171.343.4
105.87.7
1054.7
Source: FAO/ UNFPA/IIASA (1984).
significantly reduce the capacity of the majority of thepopulations to adapt. The shorter the time lag, the lower theability to cope and the greater the impacts will be.
ENVIRONMENTAL STRESS ANDDESERTIFICATION IN THE FUTURE
Environmental stress may be viewed in three distinct pro-cesses - drought, desiccation and degradation (desertifica-tion) - the effects of which are to reduce sustainability of theecosystem and capacity of the environment to supporthuman activities. Climate has a direct influence on all theseprocesses which could take place with or without humanintervention. Prospects for the future therefore dependmainly on trends in climate, but also to a significant extent onthe degree to which human activities affect the naturalcapacity of the ecosystem to withstand climate variability.
Land carrying capacity, however, is a function of naturalresources, mainly soil and water, and the level of inputs oftechnologies, labor, capital, etc., available to optimize out-puts in a sustainable way. Although such information iscrucial for overall planning and assessment of environmentalstress and its impacts, such studies are extremely complexand comprehensive data on a large scale are difficult toobtain. Data available (Table 12) suggest that carryingcapacity will be exceeded, in some cases by over 100%, iflevels of inputs remain low. A wide range of parameters andassumptions have been used in arriving at the projections,and more information is available through the source.
The main inputs considered are those relating to theenhancement of the agricultural base, namely soil fertility,crop varieties and farming technology. In drier zones, therate of mineralization of organic matter exceeds the rate of
decomposition, and the humus content falls over the longterm. The effects of long-term climate change on crop yieldsmay therefore be quite different from those of inter-annualclimate variations of similar magnitude (Parry et al. 1988).Indications are, however, that with the worsening terms oftrade and decreasing per capita incomes, prospects forraising the level of inputs are poor. Land degradation anddesertification are therefore bound to increase as soils are'mined' beyond their capacity to regenerate fertility natur-ally, and the region will continue to experience increasingfood deficits and economic hardship. Carrying capacityshould, however, not be based entirely on primary produc-tion. Market economic systems have a major influence andthere is a need to maintain up-to-date information on thesetrends.
Another serious environmental problem which influencesareas of the Sahel bordering the desert is the encroachment ofsand on pastures, arable land and human settlements. Thisproblem has affected large areas of pastoral land in Maurita-nia and is threatening the western boundary of the Gezirairrigation scheme which is the lifeline of the Sudan. Sandencroachment is bound to worsen with increased sedentari-zation of nomadic pastoralists and reduction of the vege-tative cover. Control measures involve establishment ofwindbreaks and shelterbelts, a process which will becomeeven more difficult if the rainfall decreases.
Environmental stress therefore makes prospects for life inmany parts of the Sudano-Sahelian region uncertain unlessurgent and coordinated efforts are made at national, regionaland international levels to improve the economic status ofthe populations concerned.
SUSTAINABLE DEVELOPMENTSTRATEGIES (SDS)
Increasing capacity to cope with extreme events
Capacity to cope has global, regional, national and indivi-dual perspectives. At the global level, the impact of rapidcommunications and the electronic media is such that it is nolonger possible for any country to insulate itself against theeconomic and moral implications of calamities befallingmankind. This was demonstrated during the serious droughtand subsequent famine which affected the Sahel during theearly 1980s. The world responded belatedly, but enthusiasti-cally, with emergency supplies of food and other life-savingamenities. A number of development projects and programssuch as the United Nations Program of Action for AfricanEconomic Recovery and Development (UNPAAERD) andnumerous bilateral donor projects have also been initiated.In addition, studies have been focused on the world climateand possible causes of extreme events such as droughts and

3 THE SUDANO-SAHELIAN REGION 83
floods, and there is increasing interest in the monitoring ofthe ecological systems bordering the Sahara in an effort toestablish the long-term trends and their possible implicationsfor the economies and social lives of the populations. It ishoped that through such initiatives the world will evolve amore useful capacity to cope with extreme events whereverthey occur in the future.
Extreme climatic variations are bound to affect entireregions irrespective of national boundaries. It is thereforeencouraging to see a strong concern emerging regarding theneed for regional collaboration between nations in variousparts of Africa. It is hoped that this spirit will lead to variousdegrees of regional integration and improved capacity forjoint or coordinated actions in safeguarding populationsfrom hazards of extreme climatic events. The AGRHYMETCenter and DMC have an important role in the developmentof SDS by providing a better understanding of the climatecharacteristics and early warning of severe climatic varia-tions at the regional level.
Whatever projects and programs are deemed necessary atglobal and regional levels, the responsibility for their imple-mentation rests with national governments. At this level, thegeneral statements have to be translated into policies, plansand programs with the attendant allocation of resources. It isat this level that the issues of sustainability should berigorously addressed, since the governments will have to findthe resources required and deal with any repercussionsarising from the strategies adopted. The question of tech-nology needs to be discussed in this respect. Experience hasrepeatedly shown that large-scale irrigation projects areexpensive to install and to maintain, and may not eventuallybe sustainable on a long-term basis. It is therefore necessaryfor governments to reconsider the wisdom of such majorinvestments and to encourage greater utilization and step-wise improvements of the time-tested traditionaltechnologies.
Finally, sustainability of development strategies willdepend on the communities affected and their perception ofdevelopment itself, which may not always coincide with thatof the government planners. In this respect, the future ofnomadic pastoralism is an important issue for the Sudano-Sahelian region and requires more attention from ecological,economic and sociological viewpoints. Climatologically, themost important parameter in the region is rainfall, which ismarkedly erratic and seasonal. Nomadic pastoralism hasevolved over centuries as the most sustainable, low-technol-ogy, land-based economic system. It has evolved complexland rights which ensure equitable access to the land andwater resources as well as controls which enhance the regene-ration of vegetation. This system has in the past providedemployment through division of labor and community-based food and social security. Although these areas could
not be expected to carry large populations, populationgrowth was not a problem for nomadic pastoralists.
It is unlikely that the region or even the world will findsustainable alternative economic activities in the foreseeablefuture for over 30 million nomadic pastoralists who occupythe Sudano-Sahelian region, yet their survival is now increas-ingly threatened by the introduction of agriculture and to acertain extent tourism through demarcation of gamereserves. Nomadic pastoralism is also bound to decrease inthe long run as the younger generations gain education andopt out of the system. It is therefore necessary to re-define'development' in the context of this group of people and toorient future development strategies toward meeting theirchanging needs within the context of their natural ecosys-tems. Such strategies should exclude massive translocationof populations, change of land tenure and encouragement ofsedentary agriculture as options in development.
This strategy does not provide answers to the problem ofthe arid areas in the long term, or those of settlement andemployment of the large populations being generated inthese and other parts of the region. A certain number ofpeople can certainly be accommodated in parts of the semi-arid areas where there is a good potential for irrigation, orwhere rainfall is distributed in such a way that successful andeconomic crop production is possible at least three years infive. Others will, however, have to find accommodation andalternative livelihood systems. SDS for the Sudano-Sahelianregion must therefore include policies, plans and projectsdesigned to generate employment and alternative livelihoodsystems within the densely populated rural and urban areas.Rural-urban migration will then cease to be seen as aproblem. Rather it will be a welcome, even if inevitable,strategy for alleviating excessive pressure on the pastoral andarable lands. An example of this strategy is the encourage-ment of the informal sector in a number of African countries.The informal sector activities will, however, not be sustain-able unless they are integrated with the other productionsectors of the economy. Such integration would improve thequality and hence the markets for goods and services gener-ated by the informal sector.
Implications for planning and financing the developmentprocess
Change of land use
At the national level it should be recognized and acceptedthat most of the land in the Sudano-Sahelian zone is too dryfor arable agriculture. Attempts to change the economic baseto crops may look attractive on a short-term basis, but arebound to fail eventually as the yields fall and productionbecomes risky and uneconomical. The end result of this issevere soil degradation where such cultivated rangelands are

84 II CLIMATE VARIATION, CLIMATE CHANGE AND SOCIETY
abandoned. This has happened in some parts of the Sudan.The future of these lands is therefore strongly bound, at leastin the short and medium term, to livestock production inrange systems. Development plans and projects shouldtherefore be geared primarily to the prevention of over-stocking and overpopulation through incentives rather thancoercion.
DiversificationAt the individual or family level, climatic variability willcertainly increase uncertainties regarding the already meagersources of food and income. Capacity to cope will thereforeentail development of a broader range of skills, greatermobility and adaptation to a wider range of staple foods.
However, all countries in the region do have areas ofhigher potential, where under good management the rainfallis adequate to grow a crop. It is these areas which will have toprovide food security and sources of income and employ-ment for the majority of the population.
Alternative livelihood systems and the problem ofenvironmental refugeesWhile the immediate problems of environmental refugeescan be alleviated by emergency relief and food for workprograms, certain measures need to be taken in order toreduce the problem in the short term and medium term.These include:
• increase value added by processing primary products suchas hides and skins, gum arabica and honey within thedrylands where they are produced;
• put more effort into the development of drought-resistantcrops;
• improve the infrastructure, especially those aspects affect-ing marketing or livestock;
• encourage inter-state trade in order to retain value addedon commodities within the region;
• encourage free movement of labor;• improve prediction of climatic trends.
The problem of getting whole communities of destitutepeople to settle in new environments or even to go back totheir original habitats should not be underestimated. This isparticularly important where such people have stayed intemporary settlements for long periods. Societal organiza-tion and values may then have changed irreversibly andoriginal skills for coping with climatic uncertainties mayalready be forgotten. Long-term SDS will therefore requirecareful documentation of case studies on various technolo-gies and experiences in specific areas. Global or regional dataare of little value in such exercises.
It is therefore clear that planning and financing of thedevelopment programs in the region must take into account
sociological, environmental and economic factors. Thesocial factors include:
• impact of development on the cohesion within family andcommunity systems;
• alleviation of poverty and inequalities within thepopulation;
• interference with fundamental human rights of the indivi-dual, including freedom of movement and personal devel-opment: popular participation based on the concept ofpartnership.
The environmental factors include:
• impact of development on the sustainability of ecologicalbalance;
• possible contribution to regional and global climatechange;
• degradation of the soil;• loss of biodiversity of flora and fauna;• deterioration of water resources.
The economic measures include:
• development of rural alternative livelihood systems, includ-ing infrastructure;
• efficiency of marketing systems;• increasing value added on local products.
Flexibility of development plans and processesSDS must also take into account the uncertainty of time lagsbetween various changes and their consequences. Develop-mental efforts should therefore be backed by a sustainedresearch effort and a move away from ad hoc measures ofdrought relief toward a more systematic effort to increaseresilience to drought. The latter requires improved agrocli-matic information services performed by competent interdis-ciplinary teams of scientists.
Effects on climate change could also be alleviated throughadjustments at the national level of development plans, andof the planning process itself, with greater emphasis onsustainability and a shorter response time. At present,national development plans in most countries are formulatedfor 5- to 10-year periods. Furthermore, formulation of theattendant programs and projects, allocation of the necessaryresources and the start of implementation may be delayed forseveral years or even abandoned as political priorities andavailability of resources change. The impact of developmentprojects is therefore felt at least 10-15 years from the timeideas were formulated. Plans and programs which take sucha long time to implement could easily be rendered irrelevantby climate change, with consequent loss of valuable time andresources. Development planning should, however, incor-porate a high degree of flexibility so that adjustments can bemade.

3 THE SUDANO-SAHELIAN REGION 85
Table 13. Mean seasonal rainfall in selected areas of Machakos district, Kenya
Long rains Short rains
KabaaKangundoKatumaniK. MaweKibwezi
1957-71
312.86362.94304.39318.83*263.90
1972-90
354.39365.60307.41290.48238.61
% change
13.30.71.0
-8 .9-9 .6
1957-71
341.77321.26308.83301.89428.45
1972-90
357.77316.31263.72349.53398.56
% change
4.7- 1 . 5
-14.415.817.0
Note:* Period 1962-71.Source: ODI/MRDASW/UON (1991).
Table 14. Population density in Kenya by agro-ecologicalzones, 1932-69
Table 15. Actual net population flows in Kenya to variousagro-ecological zones
Zone
IIIIVVVI
Total
Area (km2)
1104215850694247
12578
1932
1.112.12
22.7080.30
5.50
Hectares/person
1948
0.721.60
12.9033.30
3.70
1963
0.511.116.38
16.10
2.43
1969
0.470.872.938.52
184
Zone
IIIIVVVI
Total
Source:
1932-48
-17250+ 11940+ 6772+ 5119
0
Lynam (1978).
1948-63
-28363+ 9736
+ 19973+ 7036
0
1963-9
+ 17170+ 75326+ 17385
+ 47175
Source: Lynam (1978).
Prospects for economic, social and environmentalsustainability
Future prospects for the region in terms of sustainabledevelopment will depend on the adoption of SDS whichbuild on accumulated experience through participatoryplanning, and integrated development which avoids over-reliance on a few commodities, and extension of technologi-cal information to the lowest units of development. This isillustrated by the following case studies.
Experience with evolution of participatory planning andintegrated development in Machakos district, Kenya
Introduction. Only about one-third of the Machakos dis-trict receives the 750 mm of rainfall that is the minimum forcropping in a bimodal regime (ODI/MRDASW/UON1991). There are no clear data on long-term cycles, but inter-annual variability of rainfall is a dominant climatic factor.Only a small part of the district is able to receive 250 mm eachseason for 6 out of 10 years (Table 13). Yet it is in this system
that farming techniques have evolved to support an increas-ing population.
Population. The historical population and intra-districtmigration data for Machakos in the past 60 years are shownin Tables 14-16. According to the 1979 census, the popula-tion was distributed as follows: zones II and III, 22%; zoneIV, 37%; and zones V and VI, 35%. Six percent of thepopulation was in the urban areas of the district (ODI/MRDASW/UON 1991).
The deteriorating per capita land-holding in all zonesshould be noted. In addition, there has been a dramaticincrease in the population of the less humid zones as a resultof migration from the more humid areas. Finally, there was adramatic jump in the population of zones V and VI in the1960s as a result of abolishing the colonial land movementstructures.
Soil erosion. As early as the 1930s, the Machakos districtwas considered one of the most eroded areas of the country.The situation continued to deteriorate through the 1940s, butfrom the 1950s to date, the farming systems which emergedbegan to manage the cultivated land, and deterioration was

II CLIMATE VARIATION, CLIMATE CHANGE AND SOCIETY
Table 16. Percentage population growth rates in Kenya byagro-ecological zones, 1932-69
Table 17. Livestock distribution in Kenya by agro-ecologicalzones, 1944, 1956 and 1981
Zone 1932-49 1948-63 1963-9
IIIIVVVI
Total
2.801.753.505.60
2.50
2.302.504.805.00
2.80
1.602.25
13.7011.00
4.80
Source: Lynam (1978).
mainly in the communal grazing areas and lands opened forcultivation in drier areas (ODI/MRDASW/UON 1991). Soilerosion was not a problem in areas affected by tsetse fliessince no agriculture could take place there, but some of theseareas have been claimed for agriculture and the situationmay change. Satellite imagery and studies on the groundhave established definitively that the rate of erosion hasslowed down where land was put under smallholder cultiva-tion and controlled grazing. It should be noted, though, thatgrazing land is generally more eroded since the techniquespracticed on crop land are not used on grazing land.
Crop production. There was doubt in the 1930s as towhether the district could feed itself in the 1930s. However,recent studies of the district show that it has not onlyproduced enough food, but has evolved a complex farmingsystem which appears sustainable. Abolition of the colonialeconomy which restricted some cash crops to the colonizerhas led to a significant growing of such crops. The recentdevelopment of export horticultural crops has created aniche to be exploited under irrigation which was unknown in1963. However, of more significance is the continuing inten-sification of food crops for subsistence and the nationalmarket (ODI/MRDASW/UON 1991).
The growing population has increased the cropped area tosupport the production of basic foodstuffs (mainly maize andpulses) and has diversified between crops, in terms of foodand cash crops and horticultural crops (ODI/MRDASW/UON 1991).
Livestock. As with food crops, not only has livestockproduction increased, but it has done so under a complexproduction system which has differentiated into stall feeding,tethering and range use under pressure of the shrinking landresource. Relative to 60 years ago there are more cattle in thedistrict, but the per capita holdings have remained relativelystable (ODI/MRDASW/UON 1991).
Over the past 60 years the production areas for livestockhave changed, with very little livestock in the more humid
ZoneSU1944
SU1956
ha/SU SU1944 1981
ha/SU1981
Zones II and III 49200 79425 2.11 12477 6.06% 23 22 4
Zone IV 151400 143190 1.56 125073 3.13% 71 40 37
Zones V and VI 13450 133 513 3.18 196324 4.30% 6 37 59
Total 214050 356128 1.79 333874 4.38
Note: SU, Stock unit (livestock unit).Source: ODI/MRDASW/UON (1991).
zones and more and more livestock moving into the drierzones (Table 17).
During the colonial period, the goat was the worst culpritof land degradation. It received such a bad press that verylittle veterinary and production research was performed onit. Yet from the data available (ODI/MRDASW/UON1991), it is clear that the goat is an important component ofthe livestock farming system of the people, and the ratio ofgoats to cattle has essentially remained stable over a verylong period. This has major implications for Sudano-Sahe-lian development strategies which ignore small stock. Smallstock are preferred for their immediate conversion inexchanges and in meat production. They are also ecologi-cally more viable in the less humid areas. Their productionsuggests a non-ranch strategy which maximizes productionof grass, herbs and shrubs, and even trees to produce shoat(sheep and goat) fodder.
The livestock marketing data show clear adjustment todrought pressure. This is in direct contrast to many studiesfrom the Sahelian region which suggest that the primordialattachment to livestock is still operative and producers waituntil droughts wipe them out (ODI/MRDASW/UON 1991).
Land use and conservation. The increase in production hasbeen accomplished under a complex land use system in whichmanagement of vegetation for production and conservationreasons is practiced so systematically that the fears ofdegradation expressed in the 1930s have been reversed (ODI/MRDASW/UON 1991). The premier soil and water conser-vation technique has been terracing of crop land, which wasintroduced in the 1950s. This is usually done by work groups,as project-related tools-for-work or food-for-work, familylabor or hired labor. Contour bunds were introduced in the1930s, but farmers know they are not as effective as terracing.Other techniques are reforestation or management of natural

3 THE SUDANO-SAHELIAN REGION 87
biomass in grazing areas which do not get as much conser-vation attention as cropland.
Conservation of the natural vegetation has improved inthe range areas in spite of fears in the 1930s that it would beabandoned. These areas, which are essentially in zones V andVI, produce most of the livestock in the district (ODI/MRDASW/UON 1991). It should be emphasized that theproduction system does not assume the classical ranchingsystem so preferred by development specialists. The emer-gent system is essentially an indigenous system with mixedlivestock which does not strive to maximize grass at theexpense of herb and shrub species.
Farmers' organizations. To cope with the evolving system,farmers have modified traditional organizational systems toaccomplish new and modern tasks. One example is a farm inzone V which has gone from traditional communal grazing inthe early 1900s to world-standard dairy farming by 1990.Through modification of traditional institutions, Machakosfarmers have organized cooperatives extensively. In 1987,138452 farmers were members of 54 primary cooperativesorganized into a District Cooperative Union. Given theaverage family size of eight, benefits from this movementwere reaching approximately 90% of the district population.The 54 cooperatives had a subscribed share capital of Ksh.18m (US$ lm) and a turnover of Ksh. 465651776 (US$25869543) (Mutiso 1988).
The Machakos lesson. The Machakos study suggests thatsociety can, within limits, evolve farming systems whichproduce efficiently, even in drier regions. This suggests that aclimatic change which leads to less humid conditions neednot be a disaster if SDS are in place. This case study showsfurther that semi-arid areas can be self-sufficient in food andcontribute to national development given sufficient politicalwill, appropriate developmental strategies and programswhich originate and are implemented at community levels,and a reasonable level of available resources to initiatedevelopment.
Adaptation to drought: experiences in Danbatta district ofKano state in NigeriaIt is interesting to compare experience in the Machakosdistrict with that of the Danbatta district in Nigeria asdescribed by Mortimore (1989). Unlike Machakos, Dan-batta started off in relative prosperity. The onset of theSahelian drought, however, found the district unpreparedfor an extended emergency, resulting in famine, loss oflivelihood and reduction of the ecosystem carrying capacity.Traditional coping systems were tested to their limit, but theyfailed to produce solutions which could sustain the popula-tion through prolonged drought. The population has there-
fore been forced to evolve new strategies for coping, but theirimpact is unlikely to be felt beyond mere survival.
The environment and traditional practices. The Danbattadistrict occupies an area in the dry zone of northern Nigeriawhich continues into adjacent areas of the Niger Republic.The southern boundary experiences 1000 mm rainfall in a 40-day growing season, but rainfall decreases to 500 mm in a 60-day season in the north. The region experienced relativelystable conditions, culminating during the 1960s in the highestlevels of agricultural productivity based on export crops,especially groundnuts. This stability was taken for grantedand no measures were taken to anticipate a possible dramaticchange of fortune. The ecological stability was maintainedwithin acceptable limits by use of manure, rotational bushfallows and by migration to less densely populated areas.Domestic energy requirements were met from wood fuelsderived by cutting living trees in the bush and on farmland.These resources were supplemented with crop residue andcharcoal. Nomadic cattle herds were managed in a predomi-nantly north-south 'transhumance' system which suppliedmost of the meat consumed in the country. Only a few cattleremained in the same location throughout the year, depend-ing on availability of water and fodder, and most animalswere sold when fully grown.
Climatic change and impacts. Rainfall amounts in theregion began to fall around 1968, and by the end of 1972 avast area of West Africa was in the grasp of drought and cropfailures reached 50-90%. Most households in the Danbattadistrict consumed all their subsistence grain, and livestocklosses were estimated at 4400 cattle, 5000 goats, 500 donkeysand most of the poultry. Groundwater levels fell, leaving drywells and necessitating repeated deepening of the wells. Foodprices increased by over 40% and grain supplied by thegovernment made little impact due to the large population.Hunger and sickness increased.
Societal responses. Societal response took many forms,mainly derived from social relationships and improvedmobility. Alternative foods were sought in the market, andemployment opportunities, selling of manure and selling ofpersonal property decreased. There was, however, anincrease in selling of livestock, wood and mats, in dry seasonmigration, and in selling of land and begging. The popula-tion tried to extend the area cultivated to compensate for lowyields, but these efforts were limited by shortage of seed.There was a reduction in fertilizer use, changes in cropmixtures and a shift away from guinea corn, groundnuts andcowpeas, which were considered risky investments.
In general, the population seemed to accept their fate andto adapt to poverty by finding alternative opportunities in

II CLIMATE VARIATION, CLIMATE CHANGE AND SOCIETY
petty trade (e.g. in fuel wood), liquidation of assets, mobiliza-tion of traditional social support systems and migration toKano city.
Sustainability. It appears that although the traditionalcoping system based on subsistence seemed to break downduring the first few years of drought, it was resilient and wasalready showing signs of recovery by 1974. Time will tell theextent to which these strategies will be sustainable, especiallyas the inevitable changes in social and economic needs andaspirations of the population take place. The test for sus-tainability cannot be done from global data alone. Detailedcase studies to assist governments to evolve adequate policiesand strategies are needed.
Integration of agroclimatic information in agriculturalproduction: the Mali experience
Introduction. The climate of the Sudano-Sahelian region ischaracterized by marked seasonality, spatial and temporalvariability of rainfall, and high evapotranspiration rates.Droughts are therefore part of, rather than anomalies in, theMalian climate, and a drought is experienced twice every 3-5years (Konare 1989). The mainstay of the Malian economy isagriculture, and 85% of the cereal crop is produced underrainfed conditions. Agroclimatic information should there-fore be able to play a crucial role in minimizing productionrisks which result in losses of seed and crop yield. A great dealof agroclimatic data has been collected and research hasdemonstrated the potential benefits of such data in agricul-tural production. This knowledge, however, has not had asignificant impact on the traditional farming practices and aninnovative approach was developed to make meteorologicalinformation available to farmers.
The Pilot Project in Agrometeorology. The traditionalknowledge of the Sahelian farmer has proved inadequate tocope with current disturbances in the traditional crop calen-dar as a result of climatic variations. An experimental projectentitled the Pilot Project in Agrometeorology was thereforedesigned and has operated in Mali since 1982 (Konare 1989).The project is located southwest of Bamako in a sector ofBancoumana which is part of the agricultural extensionorganization - Operation Haute Vallee (OHV). The projectis managed by a multidisciplinary team of agronomists,meteorologists, crop protection and functional literacyspecialists. The team was responsible for analysis of agro-meteorological and other relevant information and fordeciding on the appropriate advice and warning to be givento farmers. This information forms part of the technologicalpackage designed to improve agronomic operations such astime of planting, ploughing, weeding and crop protection. It
is derived from rainfall statistics, meteorological forecasts,10-day estimates of water balance and crop water require-ments. A group of farmers identified by the team participatedin the project by setting up two plots in their farms. Theparticipating farmer was required to manage the two plots inthe same way except that agrometeorological advice from theteam would be applied to the 'test' plot. The farmer and theteam are then able to compare the yields from the two plots atthe end of the season. From the results, the farmer is free tochoose whether to adopt the recommended practices on therest of the farm while the team is able to identify aspectswhich need improvement.
Outcome. Feedback obtained during field trips to assess theproject indicated that farmers were convinced of the value ofthe agroclimatic information they applied. Data analysisshowed that yield increases of 26% for sorghum and 46% formillet were achieved in the test plots managed according tothe team's advice (Traore and Konare 1989). The experimenthas succeeded in convincing the team of the value of anintegrated approach in extending new technologies tofarmers, and the potential for application of agroclimaticinformation for sustainable agricultural production. Thefarmers have also become increasingly confident, and theyadopt the recommended practices as indicated by the largeincrease in the number participating. The results from thisexperiment have other implications as follows:
• the benefits of application of agrometeorological infor-mation increase as climate variability increases from semi-humid through semi-arid to arid regions;
• yield increases reduce the necessity for farmers to expandcultivated land with the attendant risks of landdegradation;
• use of meteorological information enables optimum use ofagro-chemicals thus reducing their harmful effects on theenvironment;
• these experiments help in the establishment of a data basefor research on the environment.
CONCLUSIONS ANDRECOMMENDATIONS
Regional prospects for sustainable development withoutclimate change
The Sudano-Sahelian region is not homogeneous environ-mentally, socially, economically or politically. The region is,however, characterized by climate limitations and variability(mainly low and erratic rainfall) which recurrently threatenthe very existence of human and livestock populations. Inspite of these handicaps, the region has sustained a growingpopulation for thousands of years, even though at a rela-

3 THE SUDANO-SAHELIAN REGION 89
tively low level of socioeconomic development. The region is,however, now considered to be at high risk as a result ofpopulation increase, and political and socioeconomic devel-opments which have disrupted traditional coping strategieswithout offering viable alternatives. The result has beenvarying degrees of degradation of the environment, reducedland carrying capacity and increasing frequency of humansuffering.
Sustainable development in the region requires a morecomplete understanding of climate variability, as well asrecognition and strengthening of the traditional complemen-tarity of the various ecological zones. The new phenomenonof urbanization will also have to be accepted and incorpor-ated within national development policies, plans, strategiesand programs. This chapter argues that prospects for sus-tainable development under prevailing climatic conditionsare good, provided development policies put less emphasison 'change' in favor of 'progressive improvement' in thosestrategies and technologies which have enabled the popula-tions to cope in the past.
(1) The key to environmental conservation in the arid andeven parts of semi-arid areas which are most prone to climatevariation is maintenance of vegetation cover. The mixturesof grass and woody species which have evolved in these areasare adapted to seasonal variations in rainfall and bush fires,which are used in traditional pasture management bynomadic pastoralists. Changes of land use from nomadicpastoralism to grazing blocks, group ranching and evenarable agriculture, are bound to fail with resultant landdegradation. The populations in these ecozones shouldtherefore be assisted to cope with their natural environmentthrough:
• health and educational services which do not requiresedentarization;
• socioeconomic and livestock marketing opportunitieswhich encourage pastoralists to keep only the productiveanimals and a better balance between cattle, camels, sheepand goats;
• improvements in traditional production systems in agricul-ture and livestock production;
• encouragement and facilitation of migration of excesspopulation to better opportunities within or outside thecountry, by providing training in skills which are in demandelsewhere. Such migrants could provide valuable financialsupport to their families through remittances, which isalready happening.
(2) Sub-humid and some parts of semi-arid areas, whilestill fragile, offer better opportunities for increased foodproduction and agro-based industries. It is in these areas thatinvestments in soil and water conservation can be translatedinto more intensive agriculture and livestock production,providing internal food security and employment opportuni-
ties for the bulk of the population- as has been demonstratedin the case study on the Machakos district of Kenya. Themain challenge is to ensure sustainability of developmentefforts. This can be achieved through:
• ensuring that development programs are community basedin both origin and implementation;
• ensuring that development programs build on, rather thansupersede, the traditional systems of land tenure, divisionof labor, food preferences, etc.;
• diversification of crops and economic activities.
(3) A major potential threat to the environment andsustainability in these regions is not climatic variability perse, but the combined effects of an increasing population, theinadequacy of traditional technologies, a low level of econ-omic development and lack of alternative employmentopportunities, which lead to an overutilization of landresources. Under these conditions, soil fertility is bound todeteriorate as rest periods in shifting cultivation becomeshorter, and crop rotations become more and more difficult.The result is reduced carrying capacity as yields decreasebelow subsistence levels. Strategies to cope with this situationinclude:
• in the short term, establishment of labor-intensive indus-tries and small-scale irrigation schemes;
• in the long-term, reducing the rate of population growththrough education and appropriate economic incentives;
• promotion of alternative livelihood systems which wouldcreate employment opportunities in both rural and urbanareas in order to reduce pressure on the productive landresources.
Potential for climate change to undermine sustainabledevelopment
If the climate does change dramatically in the future, anddepending on the speed and direction in which such changesoccur, it is possible that sustainability of a number ofdevelopmental strategies and programs could be under-mined with considerable losses to both national economiesand individuals. If, for example, the region dries out on along-term basis, the present ecozones VI and VII wouldbecome uninhabitable deserts. Some of the consequenceswould be:
• massive migration of the pastoralists and their herds to theremaining agricultural lands;
• all plans based on complementarity between ecozoneswould collapse, and the resulting land pressure couldprecipitate major social and economic hardships;
• the irrigation schemes would also go out of production forlack of water, undermining strategies for food security andcreation of employment.

90 II CLIMATE VARIATION, CLIMATE CHANGE AND SOCIETYII
The effects of a major increase in rainfall could alsoundermine sustainable development by:
• destroying dams and flooding agricultural land in the fertileriver valleys;
• disrupting surface transport and communication systems.
Rapid changes in climate would also undermine sustain-able development by forcing frequent changes in develop-ment plans, including strategies and programs.
Adjustments to enhance sustainability
Although there are speculations that major climatic changescould occur in the region as a result of global warming, thereis no clear consensus on whether the rainfall regime willimprove or deteriorate. It may, therefore, be more appropri-ate to assume that both long-term and short-term variabilityin rainfall will continue, and that the future of the popula-tions will depend on measures which can be put in placeimmediately to arrest and possibly reverse environmentaldegradation in a sustainable manner. This is not impossibleto achieve, but much more emphasis will have to be put onthe issue of sustainability. As observed at the FAO/Nether-lands Conference on Agriculture and Environment (FAO1991), the traditional extensive production system with a lowcapital/labor ratio appears to be the most rational andeconomically viable in a high-risk agricultural economy suchas the Sudano-Sahelian region. Sustainability will beenhanced by:
• intensification of climatic and ecological monitoringsystems at national, regional and global levels in order toprovide early warning of dangerous trends;
• establishment at the national level of plans and strategies todeal with emergencies caused by floods and intensivedroughts;
• improvement of information on climate, and ecologicalchanges, and integration of the roles of information, tech-nology and public interventions;
• diagnostic studies and research to investigate global aspectsof droughts that can facilitate their prediction;
• provision of meteorological advisory and informationservices to end users in order to increase agriculturalproduction;
• better water management, including water harvesting anddevelopment of small-scale irrigation schemes.
In national planning and financing processes, adjustmentsare also required to shorten the lead time in both planningand implementation of projects. Short-term plans will alsohave to concentrate on optimal utilization of resources inorder to establish economic buffering systems, while long-term plans should emphasize the role of research and deve-lopment of a wide range of technological skills. A key issue inall these strategies is the source of energy. The region has
large resources of solar and geothermal energy which are stilluntapped. Programs to develop the use of these resourcescould facilitate industrial development and reduce the rate ofdeforestation and land degradation.
REFERENCES
Bolin, B. 1989. Statement at Ministerial Conference on AtmosphericPollution and Climate Change. Noordwijk.
Brown, L. H. 1963. The development of the semi-arid areas of Kenya.Unpublished paper.(Mimeographed.)
David, R. and Myers, M. 1991. Nature's nurturers hit by male exodus.Panascope 26:17.
FAO 1991. Sustainable agriculture and rural development in sub-Saharan Africa: Regional Document 1: the Den Bosch Declarationand agenda for action on sustainable agriculture and rural develop-ment. FAO/Netherlands Conference on Agriculture andEnvironment.
FAO/UNFPA/IIASA 1984. Technical report FPA/INT/513.GOK 1979. Arid and Semi-arid Land Development in Kenya: The
Framework for Implementation, Program Planning and Evaluation.Government of Kenya.
GOK 1983. District Focus for Rural Development. Government ofKenya.
GOK 1989. Agriculture and Livestock Data. MOPND Long RangePlanning. Govrenment of Kenya.
GOK 1990. ASAL Development Policy Paper Draft 3. Government ofKenya.
Hammond, A. L. and Paden, M. E. (eds.) 1990. World Resources 1990-91. New York: Oxford University Press.
Hare, F. K. 1985. Climate Variations, Drought and Desertification.WMO no. 653. World Meteorological Organization.
Hellden, U. 1984. Drought Impact Monitoring. Lund University Natur-geografiska Institut, Sweden.
Hulme, N. 1989. The changing rainfall resources of Sudan. Transactionsof the Institute of Geography, New Series 15:21-34.
Jaetzold, R. and Schmidt, H. 1983. Farm Management Handbook ofKenya: Natural Conditions and Farm Management Information.Nairobi: Ministry of Agriculture.
Konare, K. 1989. Applied meteorology in the Sahel: the Malianexperience. Weather 44(2):64-70.
Lamprey, H. F. 1988. Report on the desert encroachment reconnaissancein Northern Sudan. UNESCO IUNEP Desertification Control Bulletin17:1.
Lynam, J. K. 1978. An analysis of population growth, technical changeand risk in peasant, semi-arid farming systems: a case study ofMachakos District Kenya. PhD Thesis, Stanford University.
Mortimore, M. 1989. Adapting to Drought: Farmers, Famines andDesertification in West Africa.
Mutiso, G.-C. M. 1991. ASAL Institutions Files. Muticon Ltd.Mutiso, G.-C. M. and Mutiso, S. M. 1991. Kambiti Farm: Water in
Capitalising ASALs. Muticon Ltd.Mutiso, G.-C. M. ASAL Institutions Files. Muticon Ltd.Nicholson, S. E. 1989. Long-term changes in African rainfall. Weather
44(2):46-56.Nicholson, S. E., Jeeyoung, K. and Hoopingarner, J. 1988. Atlas of
African Rainfall and its Inter-annual Variability. Florida State Univer-sity, USA: Department of Meteorology.
ODI/MRDASW/UON. 1991. Environmental change and dryland man-agement in Machakos District, Kenya, 1930-1990. Draft WorkingPapers, September 1991: 1. Conservation profile, F. N. Gichuki; 2.Crop production, S. G. Mbogoh; 3. Land use profile, R. S. Rostom,M. Mortimore and J. Yego; 4. Livestock production, C. Ackello-Ogutu; 5. Natural vegetation, K. O. Farah; 6. Population profile, M.Tiffen; 7. Rainfall, S. K. Nutiso; 8. Soil erosion, D. Thomas; 9. Soilfertility, J. Mbuvi.
Parry, M. L., Carter, T. R. and Konijn, N. T. (eds.) 1988. The Impact ofClimatic Variations on Agriculture, vol. 2, Assessments in Semi-Aridregions. UNEP/IIASA.
Republic of Senegal 1991. Vers un Developpement Durable. National

3 THE SUDANO-SAHELIAN REGION 91
Report for UNCED.Tegart, W. J. McG., Sheldon, G. W. and Griffiths, D. C. (eds.) 1990.
Climate Change: The IPCC Impacts Assessment. WMO/UNEP.Traore, K. and Konare, M. 1989. Operational agroclimatic assistance to
agriculture in sub-Saharan Africa: a case study. In Climate and FoodSecurity, pp. 193-202. Manila: International Rice Research Institute.
UNDP 1991. Human Development Report.UNEP 1991. Global Assessment of Desertification. UNEP.UNFPA 1991. World Population Prospects. UN Population Studies
1990. New York: United Nations.
UNSO 1991. Drought and Desertification in the Context ofUNPAAERD1986-1990. UNSO.
UNSO 1992. Assessment of the Drought and Desertification in theSudano-Sahelian Region 1985-1991. UNSO.
WMO/UNEP 1990. 1990 Climate Change: The IPCC Response Strate-gies. World Bank 1990. World Development Report.
WMO/UNEP 1991. The Global Climate System: Climate System Moni-toring, p. 21.
World Bank 1989. World Development Report.World Bank 1990. World Development Report.

4: Climate Change and Sustainable Development inChina's Semi-arid Regions
ZONG-CIZHAO
INTRODUCTION
This chapter sketches the historical and current characteris-tics of West China's semi-arid lands, designated herein asIMJSHNG, an acronym for the five provinces affected. Dataon the frequency of droughts and floods go back as far as the1400s and as early as 180 BCE (Before the Common Era) forsome major climatic events. The temperature data for thisregion seems to show a trend toward warming of between 0.5and 1.8 °C. The chapter also discusses some major climate-and population-related problems facing the IMJSHNGregion in recent years. General circulation models (GCMs)have been used to simulate future climate change for theseregions, and while models clearly project warming, as is thecase with other semi-arid regions of the world, generalizedpredictions are difficult to make. Because approximately21.7% of the total area of China consists of semi-arid land,studies of the ecosystem, the environment, climate changes,and the society of this area are vital. Sustainable develop-ment and policy strategies relating to this area are also keyissues for study.
BASIC CHARACTERISTICS
Location
The semi-arid regions of China are generally located in thewest and northwest of the country. About 70% of the semi-arid regions consist of hills, plateaus above 1000 meters (m),and mountains. Approximately a quarter of these semi-aridlands are located in Inner Mongolia autonomous region, inthe Shanxi, Shaanxi, Ningxia and Gansu Provinces or auton-omous regions and in parts of the Qinghai, Xinjiang, Xizangand Yunnan Provinces or autonomous regions (Fig. 1).Located between the arid and semi-humid regions of China,
Arid Regions
Semi-arid Regions
Figure 1: Distribution of the arid and semi-arid regions in China.(Note: Some Chinese islands are not shown.)
these semi-arid lands are subject to strong winds, blowingdust, sandstorms and shifting dunes.
Because of the economic importance of their agricultureand animal husbandry, the semi-arid regions have long beenthe focus of Chinese scientists and policy makers (Song Shi-da et al 1980; Lu Yu-rong and Gao Guo-dong 1985; ZhaoSong-san et al. 1985; Geng Kuan-hong 1986; Lin Zhi-guangand Zhang Jia-cheng 1986; Chinese Natural ResourceResearch Committee et al. 1988; Li Jiang-feng et al. 1990;Zhao Zong-ci and Zang Xuejun 1991).
92

4 CHINA'S SEMI-ARID REGIONS 93
Figure 2: Location of the 12 stations in the semi-arid regions. 1,Wulanhoute; 2, Lindong; 3, Xilinhoute; 4, Wenduermiao; 5,Dulun; 6, Zhangjiakou; 7, Huhehoute; 8, Baotou; 9, Taiyuan; 11,Yulin; 11, Zhongning; 12, Lanzhou.
Climatic characteristics
The climate in most parts of Inner Mongolia, Shanxi,Shaanxi, Ningxia and Gansu Provinces is very similar(abbreviated to IMJSHNG). This region has the climaticcharacteristics of the monsoon, with cold, dry winters andwarm humid summers. The annual mean temperature rangesfrom 5 to 10°C. The annual total precipitation ranges from250 to 500 millimeters (mm), and the annual total evapor-ation rate ranges from 250 to 400 mm. The months of July,August and September are characterized by heavy rain.Rainfall is scant the rest of the year.
Twelve meteorological stations in the IMJSHNG areahave been chosen for study here. The locations of these areshown in Fig. 2.
Comparisons of various climatic characteristics of thesemi-arid regions of China (IMJSHNG) with other regionsof the country are presented in Figs. 3 and 4. These compari-sons include statistics on: (a) annual total precipitation, (b)annual total evaporation, (c) annual runoff and (d) desertareas in the region.
Fig. 4(a)-(d) are regional maps showing yearly statistics on(a) the number of days per year the area is subject to winds inexcess of 17 meters per second (m/s), (b) the annual meanwind speed, (c) the number of days per year during which
sandstorms occur and (d) the number of days of flowingsand. As noted in the figures, there is less annual precipi-tation, evaporation and runoff in the semi-arid regions thanin the rest of the country: precipitation is 250-500 mm,evaporation 200-400 mm and runoff 25-100 mm.
In the IMJSHNG area the number of days of mean strongwind (wind speed more than 17 m/s) ranges between 25 and75 per year. In other parts of China the statistics show strongwind on from 5 to 20 days per year. Again, in IMJSHNG theannual mean wind speed is 2.5-5 m/s while in most otherparts of China it is 1-2 m/s. There are deserts in this area.
The number of days per year that sandstorms occur (withvisibility less than 1000 m) in IMJSHNG varies from 5 to 20.Only the arid regions exceed these statistics. By comparison,in most of China the annual mean occurrence of sandstormsvaries between 0 and 5 days.
In IMJSHNG the average number of days per year offlowing sand (with visibility between 1 and 10 kilometers)varies from 15 to 60. By comparison, in most of China there isflowing sand on fewer than 10 days per year.
Population and economics in the Northwestern semi-aridregions
The main semi-arid region of China is located in parts ofShanxi, Shaanxi, Ningxia and Gansu (JSHNG). This arealies between Northwest China and the central part of China.It covers approximately 882300 square kilometers, whichcomprises roughly 9% of the total area of China.
The area contains approximately 8% of the total popula-tion of China, or approximately 83 570000 people. Between1955 and 1970 the population of this semi-arid regionincreased very quickly due to immigration from East Chinato West China.
Table 1 illustrates the total population, the urban popula-tion, the mean natural population growth rate and the meanincome per person for Shanxi, Shaanxi, Inner Mongolia andGansu. Comparisons of this region with the whole of Chinaare shown in parentheses in the table, which illustrates thepopulation increase between the 1950s and the 1970s. Themean income per person in this area was lower than theaverage income of the rest of China.
Table 2 illustrates the mean natural increasing rate anddensity of population in five cities of this region (Datong,Huhehaute, Xining, Baotou and Linfen). The mean naturalincreasing rate in the cities during the 1950s and 1960s was adirect result of immigration from East China to West China.The mean density of population in the same five cities alsogreatly increased during this period.
A total of 158200000 mu of JSHNG is cultivated cropland (mu is a Chinese unit of area; 1 mu equals 1/15 hectare).

94 II CLIMATE VARIATION, CLIMATE CHANGE AND SOCIETY
Figure 3: (a) Annual total precipitation (mm), (b) annual total evaporation (mm), (c) annual runoff (mm) (d) desert region. (Note: SomeChinese islands are not shown.)

4 CHINA'S SEMI-ARID REGIONS 95
Figure 4: (a) Number of days annually of strong wind (> 17 m/s), (b) annual mean wind speed (m/s), (c) number of days annually ofsandstorms and (d) number of days annually of flowing sand.
This is approximately 9.5% of the total land area of China.Crop production (23 320000 tonnes) accounts for approxi-mately 6% of the total production in China. Mean cropproduction is about 279 kilogram (kg) per person, whichtranslates to approximately 294 yuan per person. In compar-ison, industrial work yields a mean value of 901 yuan perperson. Production values per person in JSHNG compareunfavorably with the rest of China.
Natural resources in the Northwest semi-arid region
Major factors that influence life in the Northwest semi-aridregion of China include agriculture, animal husbandry,indigenous animals, water and mineral resources.
Agriculture. Relatively small areas of IMJSHNG are usedfor agricultural purposes. The primary crops are wheat, cornand Chinese sorghum. Some industrial crops are cultivatedas well, including cotton, peanuts, soybeans, tobacco andsugar-beets. Shifting cultivation is also practiced.
Animal husbandry. Poultry production plays an importantrole in IMJSHNG. In addition, animals such as cattle, goats,sheep and horses graze the abundant grasslands in InnerMongolia and Qinghai. There are few woodlands in thisregion. Fig. 5 shows the distribution of vegetation inIMJSHNG.

96 II CLIMATE VARIATION, CLIMATE CHANGE AND SOCIETY
Table 1. The total population, urban population and mean natural population growth rate in Shanxi, Shaanxi, Inner
Mongolia and Gansu
Years
194919551965197519851989
Totalpopulation(io4)
4174(7.7%)5223(8.5%)6657(9.2%)8574(9.3%)9686(9.2%)
10265(9.2%)
Urbanpopulation(io4)
686 (8.3%)1011(7.8%)1365(8.5%)2253 (5.9%)2614(4.6%)
Growthrate
(%)
2.15(2.03)2.72 (2.84)1.49(1.57)1.14(1.12)1.50(1.43)
Income perperson(yuan0)
133 (129)183 (194)239 (273)559 (672)935(1189)
Notes:The figures in parentheses are the percentages this region represents of the whole of China (in second and third columns) andthose values in all of China (in the fourth and fifth columns).a Yuan: Chinese unit of money (exchange rate in 1989: 1 US$ = 3.7 yuan).
Table 2. Mean natural increasing rate (MNIR) and density(D) of population of five cities in the semi-arid region(Datong, Huhehaute, Xining, Baotou and Linfen)
Year
1949 1957 1965 1978 1985 1988
MNIR(%) 1.25 2.99 2.54 1.03 0.87 1.12D (persons/km2) 104 317 386 600 689 733
Indigenous animals. Native wildlife such as musk deer,marten and Mongolian gazelle is plentiful.
Water resources. Water resources are a very importantissue in North China, especially in the arid and semi-aridregions. Water resources include rainfall, snowmelt, ground-water, rivers and lakes. The second largest river in China, theYellow River, flows through the region. In addition there areboth fresh-water and salt-water lakes, as well as smallerrivers. Fig. 6 shows the major lakes and rivers in the region.Table 3 shows the deposits and possible development ofwater in the semi-arid areas (data from Zhang Chuen-yuan etal. 1983; Yang De-qin et al. 1989).
Mineral resources. There is an abundance of coal in thesemi-arid regions, especially in Shanxi province. Iron, petro-leum and nonferrous metals can also be found.
Difficulties of development in the semi-arid regions
Significant problems in the semi-arid regions of Chinainclude such factors as desertification, desiccation, strong
Table 3. Deposits and possible development of water in the
semi-arid regions
Provinces orautonomousregions
ShanxiInner MongoliaShaanxiGansuQinghaiNingxia
Deposits ofwater
108 cubicmeter/year
448.0435.9
1116.81249.51886.6
181.6
(%)
(0.8)(0.7)(1.9)(2.1)(3.2)(0.3)
Possibledevelopment
of water
108 cubicmeter/year
106.9883.50
217.04424.44772.0831.62
(%)
(0.6)(0.4)(1.1)(2.2)(4.0)(0.2)
Note: The figures in parentheses are the percentages eachregion represents of the whole of China.
winds, sandstorms, inadequate water supplies, salinization
of cultivated lands, water loss and soil erosion.
VARIATIONS OF CLIMATE,ENVIRONMENT AND SOCIETY
Climate changes
Temperature
Over the last 100 years in China temperature data have beenmeasured and recorded. Table 4 shows the frequency bydecade of cold and warm years over this period in the semi-arid (Northwest China) and semi-arid/semi-humid (Huabei)regions (data from National Meteorological Center 1985).

4 CHINA'S SEMI-ARID REGIONS 97
I Temperate desertII Temperate steppeIII Warm temperate zone
and deciduous forestIV Temperate mixed conifer and
deciduous forest zone
# Temperate grasslandand sand (conifer)
= ) Crops
Figure 5: Distribution of vegetation in the semi-arid regions.
Quinghai r \Lakedl
/
/
r-/^—>^Wei River
— 7 ^ \^/
> ^ v 2 Jr) 4 # ^ y ^ \
(PenRiverL. . \
r9 /^P \~& \ \
Figure 6: The major lakes and rivers in the semi-arid regions.
The cold years were defined as 0.5-1.5 °C colder and thewarm years as 0.5-1.5 °C warmer than the mean climate. Itcan be seen from Table 4 that during the decades from 1920to 1950 the Huabei region and Northwest China experienceda warm period, while between 1950 and 1970 the sameregions experienced a cold period. However, since 1980 thetemperature in these regions has been rising.
The linear trends of annual and seasonal temperature inthe semi-arid regions for the last 40 years have beenmeasured, using methods similar to those of Zhao (1991).These calculations show an increase in temperature over thelast 40 years in IMJSHNG, most noticeably in winter andspring. Calculations from the 12 stations in IMJSHNG show
a linear trend of the annual mean temperatures from 0.5 to1.8 °C. Fig. l(a) shows the linear trends of annual meantemperature in the semi-arid region for the last 40 years.
PrecipitationMeteorological records regarding floods and droughts havebeen maintained in China for the last 500 years (see Academyof Meteorological Science, 1985; Shao-wu Wang and ZhaoZong-ci, 1981). The frequency of floods and droughts overthis period measured in 50-year increments, is compared inTable 5, which shows the results from several stations inIMJSHNG, such as Taiyuan, Yulin, Huhehaute and Lanz-hou (stations 7, 9, 10 and 12: see Fig. 2). Except forHuhehaute, these stations have maintained records for 500years. At Huhehaute data were available only for 1720through 1989. Several major characteristics in IMJSHNGover the last 500 years are noted in Table 5:
(1) Especially in Yulin and Lanzhou, the frequency of droughtwas noticeably higher than that of floods.
(2) During the years 1470-1519,1570-1619 and 1770-1819 theclimate in IMJSHNG was obviously dry, but from 1720 to1769 the frequency of floods was higher than that ofdrought.
(3) Since 1970 the region has been getting dryer (see Table 5).
The linear trends of annual and seasonal precipitation inthe semi-arid regions for the last 40 years have also beencalculated. These show that over this period it has beengetting drier in IMJSHNG, especially during the summers.The calculations from the 12 stations in IMJSHNG showthat the linear trend of annual precipitation for the last 40years is 30-70 mm (Fig. 7b).

98 II CLIMATE VARIATION, CLIMATE CHANGE AND SOCIETYi
Table 4. Frequency (F) of the decadal cold and warm climate in the semi-arid region (Northwest China) and the semi-arid/semi-humid region (Huabei) for the last 100 years
Regions
Huabei
Northwest
Summary
Characters
F of warmF of coldF of warmF of cold
1911-20
3503
Cold
1921-30
6031
Warm
1931-40
5131
Warm
1941-50
8280
Warm
1951-60
0413
Cold
1961-70
1306
Cold
1971-80
2503
Cold
1981-90
4251
Warm
Notes: Five stations were chosen in Huabei: Beijing, Taiyuan (9 in Fig. 2), Jinan, Zhengzhou and Xuzhou. Five stations werechosen in Northwest China: Yanan, Xian, Lanzhou (12 in Fig. 2), Xining and Jiouquan.
Figure 7: Linear trends 1951-89 for (a) temperature (°C) and (b) precipitation (mm).
Relationships between temperature and precipitationThe relationships between the annual and seasonal tempera-ture and precipitation in IMJSHNG for the last 40 years havealso been calculated. A negative correlation between theannual and summer temperature, and precipitation in thesemi-arid regions has been noted, especially in the summer.(See Fig. 8, which shows the distribution of the significantcorrelation coefficients in summer.) The figures indicate thatthe warm climate corresponds to dry conditions inIM JSHNG in the summer. As mentioned above, from 1951to 1990 IM JSHNG experienced warm dry conditions.
WindFig. 9 shows the annual mean wind speed and the number ofdays of strong wind (> 17 m/s) during the last 40 years inIMJSHNG (data from National Meteorological Center,
1985). This illustrates that both the annual mean wind speedand the number of days of strong wind per year decreasedover the period between the 1950s and the 1970s in most ofIMJSHNG. Wind speed decreased by about 0.2-2 m/s andthe number of days of strong wind decreased by approxima-tely 5-35 during the same period. The noticeable decreasemight be explained by natural climate changes, the buildingof shelter belts, and urbanization in this area.
Climate disasters
Statistics obtained from historical data in China (Academyof Meteorological Science, 1985) indicate that significant andserious disasters occurred in IMJSHNG and Quinghai Pro-vince 24 times during the period from 180 B.C.E. to 1949.

4 CHINA'S SEMI-ARID REGIONS 99
Table 5. Frequency (F) of floods and droughts per 50 years in the semi-arid region of China over the last 500 years
Stations1470- 1520- 1570- 1620- 1670- 1720- 1770- 1820- 1870- 1920- 1970-
Characters 1519 1569 1619 1669 1719 1769 1819 1869 1919 1969 1989 Total
Taiyuan
Yulin
Huhehaute*
Lanzhou
Summary
FoffloodsF of droughtsFoffloodsF of droughtsF offloodsF of droughtsF of floodsF of droughts
829
731
314
Dry
18201021
89
1222
921
715
Dry
1921
921
813
19161012
420
211416125
141412
Wet
18199
241022
813
Dry
2517141720181117
2113162317196
11
1623172119151417
983
10597
11
Dry
177194117212
718883
141
Note:a Not enough data are available for Huhehaute before 1720.
/I-0.32 L ^
**~y *i I \ /f
*T \^^-V-0.32 \
Figure 8: Correlation coefficients between temperature and preci-pitation in summer.
Droughts occurred 15 times, floods eight times, famine threetimes and epidemic disease once during this period.
Changes in population and urbanization
From 1949 to 1988 the population of IMJSHNG increasedby a factor of 2-3.5. Table 6 shows the population increase inthe 12 selected stations over this period. Immigration fromEast China to West China and from the rural areas to thecity, as well as the high birth rate, accounts for the increasedurban population of IMJSHNG over these 40 years. Thepopulation density of cities in the semi-arid regions clearly
increased, as illustrated by data from Baotou (station 8),which indicated an increase from 64 persons per squarekilometer (km2) in 1949 to 533 persons per km2 in 1990(National Statistical Bureau of China 1990). In 1949, six ofthe selected stations had populations of less than 10000, andno station had a population larger than 500000. But in 1988,five stations had populations of more than 500000 and nonehad a population of less than 10000 people.
Environmental changes
Shrinking lakes. The drier climate, heavy industrial use ofwater, and increased agricultural and human demands on thewater supply, including water dammed for cultivation, haveresulted in a reduction in the lake areas in this arid and semi-arid region of China by approximately 6400 km2 over the last40 years. In the 1970s, Luobubo Lake in Xinjiang auton-omous region (Northwest China) dried up. Qinghai Lake inQinghai Province (Northwest China), one of the largestlakes, and the largest salt-water lake in China, decreased insize from 4980 km2 in 1908 to 4304 km2 in 1986. Data on thelarger lakes in Xinjiang, Inner Mongolia and Qinghai arepresented in Table 7, which shows the changes in lake areabetween 1950 and 1980 (Northwest Normal University 1983;Zhao Song-qiau, 1985; Li Jiang-feng, 1990; MCEC, 1991).
Soil erosion. Soil erosion in the Yellow River Valley isincreasing. For example, the annual volume of soil loss inYulin county near the Yellow River was 439390000 tonnesin 1979, but in 1985 the silt loss totalled 523000000 tonnes.
Sand storms. Strong winds blow in the semi-arid regions inboth winter and spring, especially in those areas located close

100 II CLIMATE VARIATION, CLIMATE CHANGE AND SOCIETY
Table 6. Change of grade of population0 between 1949 and1988 in 12 cities oflMJSHNG
Figure 9: Changes 1950-79 in (a) annual mean wind speed and (b)number of days annually of strong wind.
to the arid and desert regions. Sandstorms and shifting duneshave occurred in the semi-arid areas.
Salinization. Salinization of cultivated lands in the semi-arid region is becoming a serious problem. Due to thedecreasing precipitation, increasing evaporation and lack of
Year
19491988
1
43
2
54
3
54
4
54
5
54
Number
6
32
7
32
of city*
8
42
>
9
31
10
54
11
31
12
54
Notes:a Grade of population: 1, population > 1000000; 2, populationbetween 500000 and 1000000; 3, population between 100000and 500000; 4, population between 10000 and 100 000; 5population < 10000.h See Fig. 2.
drainage control, the problem of salinization of land in thesemi-arid regions must be addressed.
Shortage of water resources. The shortage of waterresources in the semi-arid regions and the diminishing watertable in cities in IMJSHNG is a significant problem.
STRATEGIES FOR THE FUTURE ANDSUSTAINABLE DEVELOPMENT
The 'greenhouse effect' could affect the future of the planet.Several of the general circulation model (GCM) studies ofclimate changes in the semi-arid regions in China are referredto in this chapter (Zhao 1989: GFDL; Manabe and Wether-ald 1987: GISS; Hansen et al 1984: NCAR; Washington andMeehl 1984: OSU; Schlesinger and Zhao 1989: UKMO;Wilson and Mitchell 1987). The results of these studiesindicate a 3.5-5 °C rise in the temperature in the semi-aridregions, in both winter and summer, resulting from thedoubling of carbon dioxide (CO2) levels. In addition, mostparts of IMJSHNG might experience an increase in precipi-tation of 0.2 mm per day during the winter and a decrease inprecipitation of 0.1-0.3 mm per day in the Yellow RiverValley. But increased precipitation is expectd for the remain-der of the semi-arid regions. Fig. 10 summarizes simulationsinduced by doubled CO2 as simulated by the five GCMs. Anassessment of GCM simulations of the greenhouse effect inChina has also been tested (Zhao Zong-ci and Ding Yihui1990).
In an attempt to predict the future climate the paleo-climate in the semi-arid regions in China has been investi-gated. Data obtained from paleo-geological studies andresults as simulated by the GCMs have been analyzed and arepresented in Figs. 11 and 12 for the year 18000 B.C.E. (Ice

4 CHINA'S SEMI-ARID REGIONS
Table 7. Changes
Regions
XinjiangInner MongoliaQinghai (Qinghai
in lake area between 1950 and 1989
Character of lakes
AridSemi-arid/arid
Lake) Semi-arid
in the arid and semi-arid regions of China (km2
No. of lakes
1661
1950-9
8832.13970.74568.0
1960-9
6424.5
1970-9
4116.53133.9
101
1980-9
2681.54322.0
(a)
AT winter
(b)
AT summer
(c)
APr winter
id)
APr summer
Figure 10: Changes as simulated by five GCMs in (a) winter temperature (°C), (b) summer temperature (°C), (c) winter precipitation(mm/day) and (d) summer precipitation (mm/day).
Age) and 6000-9000 B.C.E. (Holocene warm period) (OSU,Gates 1983; GFDL, Manabe and Kahn 1981; UKMO,Mitchell et al 1990: UW, Kutzbach and Gallimore 1989).Figs. 11 and 12 illustrate a 5-10 °C drop in temperature and adrying of approximately 2-2.5 mm per day in the semi-aridregions of China at the time of the Ice Age. During theHolocene warm period the temperature increased by 2-7 °C
and precipitation in the same region increased by 0.1-0.8 mmper day. Over a long period of time, for anomalous cold andwarm periods, the warm and wet or cold and dry climatesappeared in the semi-arid regions.
From records kept in China over a 500-year period,precipitation records from 16 cold and 16 warm winters havebeen chosen for study. These statistics are illustrated in Fig.

102 II CLIMATE VARIATION, CLIMATE CHANGE AND SOCIETY
(a)
/
LU
1 —.f^_^?ii
12 J
f— -
__̂
(™r if-
B.C. 18 000-present
\
7^ \
V \AT
ICE AGE CLIMATE.
Large Numbers: Paleo-geological study (annual value)
Curves: Simulation by GCMs
/ —/
/
^ — — — .
3.0
^
B.C 6000 - present
/ (2-3) /• l / \ p
r\V?) \
(1.5) _ ^ ^- ^ ^ • —
AI
HOLOCENE CLIMATE.
Large Numbers: Paleo-geological study (annual value)
Curves: Simulation by GCMs
Figure 11: Changes in temperature (a) B.C.E. 18000 to present and (b) B.C.E. 6000 to present. Large numbers, paleogeological study(annual value); curves, simulation by GCMs.
Figure 12: Changes in precipitation (a) B.C.E. 18000 to present and (b) B.C.E. 6000 to present. Large numbers, paleogeological study;curves, simulation by GCMs.

4 CHINA'S SEMI-ARID REGIONS 103
rJ
/ v 12
///
-̂ S 4«
I
1 \I \1 \0
c/
• 5
1^.2 \
^.4/(-0.2 \
/ \ \/ \ \
Figure 13: Differences in grades of floods and droughts over 16warm and cold winters during a 500-year period.
13. The records over the last 500 years indicate a weatherpattern in IM JSHNG of warm winters and wet summers.
Summaries of data obtained through GCM simulation,paleo-climate analyses and 500-year analyses show thatclimatic predictions are difficult. It might get warmer andwetter in the eastern and western IMJSHNG in the future,but warmer and wetter or drier in the central part ofIMJSHNG (Hetau area). Of course, the patterns of precipi-tation and temperature in IMJSHNG might be very differentover a shorter time scale.
Population and urbanization
Urbanization and immigration have helped to sustain deve-lopment and progress in the semi-arid regions of China.During the last 30 years the Chinese government has relo-cated factories, colleges, institutions and people from theindustrialized high-density regions to developing low-density regions. Fig. 14(a) illustrates this relocation into thesemi-arid and arid regions from eastern and central China.Immigrants to this area totalled approximately 25-30 mil-lion. Fig. 14(Z?) and (c) illustrate the change in density ofpopulation and the population growth rate between 1949and 1985.
Family planning has been a policy in China since the1970s. According to forecasts made by the Division ofEconomic Prediction, Center of National Information, bythe year 2000 the population of China might total 1.255billion. Over the last 30 years the population in the semi-arid
regions has accounted for 9.2% of the total population.Therefore, the population in the semi-arid regions mighttotal 115460000 by the year 2000. According to the samestatistics, by the year 2050 the population of China mightapproach 1.5 billion, with a corresponding increase in thepopulation of the semi-arid region of approximately135000000 to 138 120000.
China is urbanizing rapidly. Table 8 compares urban andrural populations for the last 40 years (data from NationalStatistical Bureau of China 1990; Yang De-qing et al 1990).As shown in Table 1, the population of cities in the semi-aridregions increased very rapidly during that period. Urbaniza-tion in China is helpful to family planning and to raisingeducational levels. Table 9 shows that, in addition, thenumber of new cities has increased (data from NationalStatistical Bureau of China 1990).
Education
Sustainable development of the semi-arid regions is depen-dent upon increasing the educational and cultural level of thepopulation. At present, the educational level of the people inthe semi-arid regions is lower than that of East China. Table10 illustrates percentages of the population attaining speci-fied educational levels from the age of 6 years onwards in thisarea as compared with the whole of China.
Government at both national and local levels encouragedthe more highly educated people in the developed regions toemigrate to the semi-arid regions. At the same time, expertswere sent to these regions to teach and to raise the educa-tional level of the local inhabitants. Many young studentsand workers were sent to the developed regions for study.
Health
Endemic diseases in IMJSHNG include hypertrophy, Kas-chin-Beck disease, and fluorine and selenium disorders.Health care networks and health care centers for women andchildren have long been available in this area to control theoutbreak and spread of these diseases, and to improve healthconditions in general.
Industry
The semi-arid regions of China are rich in natural resourcessuch as oil, coal and nonferrous metals. The coal reserve inShanxi Province amounts to about one-third of China'stotal. In addition, coal deposits in Inner Mongolia andShaanxi account for one-fourth of the total. Xinjian andGansu abound in oil deposits. Utilization of these resourcesis essential for sustainable development.
One of the major coal industries and energy resource bases

104 II CLIMATE VARIATION, CLIMATE CHANGE AND SOCIETY
(a)
Direction of relocation fromdense areas of population
(b)
Figure 14: (a) Shifts in population, (b) rate of population increase 1949-85 and (c) changes in population density 1949-85.
in China is in Shanxi province. Three oil and natural gasplants are located in Xingiang, Qinghai and Gansu. Thelargest hydroelectric power station is also located in Gansu,on the upper reaches of the Yellow River. Two iron and steelplants are located in Shanxi and Inner Mongolia. In addi-tion, the semi-arid region has a metallurgical industry,woollen mills and a sugar-refining industry; these industrieswill be targeted for development in the future. Fig. 15 showsthe locations of some of the industrial bases in the semi-aridregions.
Reforestation
Reforestation has been practiced in the semi-arid regions ofChina since the 1960s. A forestry plan exists for NorthwestChina. Shelter belts, windbreak forests, sand-breaks, andshelter belts specifically to protect farmland and river head-waters are already in place, and more are planned for thesemi-arid and arid regions. The planting of these shelter beltsis a controversial matter, because some scientists argue thatthe ecosystem balance might be destroyed. Fig. 16 pinpointsthe locations of the main shelter belts in the semi-aridregions.

4 CHINA'S SEMI-ARID REGIONS 105
Table 8. Percentage of urban and rural populations in China
Year
195019801987
Urban
10.619.441.4
% of population
Rural
89.471.658.6
Table 9. The changes in numbers of cities in the semi-aridregions and the whole of China
Semi-arid regions
Shanxi Inner Mongolia Shaanxi Gansu China
194919551965197519851988
1988/1949
2547
1012
x6
6699
1616
x2.6
44458
11
x2.7
1554
1213
x l 3
132164168185324434
x3.3
Table 10. Percentages of the population attaining specified
educational levels from the age of 6 years onwards in the
semi-arid regions compared with the whole of China
Region
ShanxiInner MongoliaShaanxiGansuQinghaiNingxia
ShanghaiBeijing
>Highschool
% No.
9.1 109.2 99.8 77.6 166.9 217.1 19
25.8 124.5 2
> Middleschool
% No.
33.7 631.2 831.5 721.3 2323.3 2025.5 19
56.2 156.2 1
> Primaryschool
% No.
77.4 568.5 1435.2 2852.5 2553.3 2455.9 22
83.5 284.8 1
Irrigation and water conservation
Drought in the semi-arid regions of China is an importantissue. Rainfall distribution is uneven, most of the annualrainfall occuring in July and August. Therefore, irrigationand water conservation are very important. Drought-resist-ant crops have been planted, and irrigation systems havebeen developed. In addition, groundwater resources havebeen tapped.
iindustry - , ,
Q Iron and steel industry
Petroleum industry
Figure 15: Distribution of the petroleum, coal and steel industriesin Northwest China.
Sustainable development of 'green delta9 (oasis)
There are oases ('green deltas') in the semi-arid and aridregions in China. By developing these and building shelterbelts, water resources have been exploited.
Land improvement, water and soil conservation
Soil management is necessary in the semi-arid regions ofChina. The salinity and alkalinity of the soil are high for anumber of reasons, among which are their high levels inunderground water, the dry climate, high evaporation andpoor drainage. Improved drainage, irrigation to wash awaythe salt and alkali, as well as fertilization could reclaim theland.
Most of the semi-arid regions of China are covered byloess. In order to conserve the soil, reforestation, the seedingof grasses, improved irrigation and terracing are beingpracticed. Engineering surveys have been made.
Desert control and dune stabilization
The semi-arid regions of China are contiguous with desertareas. Deserts, dunes and shifting dunes lie within the semi-arid regions. Shifting dunes have been measured to bemoving at between 5 and 20 meters per year in most areas,and 40 meters per year in the flat areas. Towns are in dangerof being submerged by sand, farms could be eroded andtransportation threatened. In order to sustain developmentin these semi-arid regions, sand must be controlled. Controlof the dunes is important in controlling the desert. Control ofdunes, forestation, planting grasses, windbreaks and sand-breaks are all being utilized in desert control. For example,for many years strong winds and blowing sand havedamaged farms and taken lives in Minqin, Gansu Province.

106 II CLIMATE VARIATION, CLIMATE CHANGE AND SOCIETY
Before 1949
Figure 16: Distribution of forests in North China.(Note: Some Chinese islands are not shown.)
Over the last 20 years the residents have planted shelter belts,windbreaks and sand breaks totalling 830 km2, and builtsand dunes and planted grass on 20 million mu (about 1.3million hectares).
Use of climatic resources
Climatic resources are plentiful in the semi-arid regions ofChina. These include solar radiation, winds and plentifulsunshine. Sunlight in Northwest Gansu Province totalsapproximately 3000 hours per year. Solar power and windpower should be harnessed for the development of energy.The hours of available sunlight should also be utilized for theproduction of crops.
Transportation and communication
Economic and social development are dependent on trans-portation and communication. A serious lack of both in thearid and semi-arid regions is one of the reasons this area haslagged in progress and development. The area has beenisolated for too long, and therefore the development oftransportation and communications systems in China is avery important issue. The main form of transportation andcommunication in the country is the railway, especially forlong distances. Other systems include roads, highways, watertransport and air transport.
Table 11 shows the development of transport and commu-nications systems in China between 1949 and 1984. Asillustrated by Table 11, development took place quickly overthis period. It is apparent that development has lagged in
comparison with more developed countries, but it must beremembered that China has a large area and a huge popula-tion. The development of semi-arid regions of China tookplace at a more rapid rate than in the eastern part of thecountry. There were no railways in Xinjiang, Qinghai andNinxia before 1949. It is noteworthy that since 1949 thelength of railroad tracks increased by 14.32% in NorthwestChina. Fig. 17 illustrates this, as well as the development ininland waterway and air transport in Northwest China from1949 to 1985. There are many roads and highways in andbetween the Provinces, although they are not high-speedhighways.
Comprehensive utilization
Opinions vary concerning sustainable development in thesemi-arid regions, but focus on efficient and improved use ofhuman and natural resources. Table 12 illustrates landutilization in four provinces and autonomous regions in thesemi-arid region.
According to an old saying in this region, 'Eat your fill insummer, grow fat in autumn, get thin in winter, and die inspring.' The semi-arid regions contain vast grasslands andgrazing lands. Therefore, animal husbandry is significantand plays an important role in this area. But the practice ofanimal husbandry is weather dependent. Natural grazinglands are unstable, and respond directly to changes in theclimate. Excessive grazing and degenerating grasslands posea serious problem. In order to overcome this problem,natural and artificial grazing lands must be developed forsustainable development. Water resources must be pre-served, and a search made for underground water tables. It isimportant that water conservation projects be established inthe semi-arid regions, such as well drilling, the building ofdams and reservoirs, and improved irrigation systems. Pro-tecting and reseeding overused grazing lands, and the prac-tice of crop and grazing rotation, are necessary in this area.
There are many hills in the semi-arid regions where fruitcould grow. Pomiculture should be developed.
The semi-arid regions of China contain a great deal ofarable but uncultivated land. Xinjiang contains 160 millionmu, Inner Mongolia 89 million mu and Gansu and Ningxiacontain 10 million mu. Farming could be expanded into theseareas.
A C K N O W L E D G M E N T S
This work was supported by the Chinese Science Committee.I would also like to thank Kui Zhao and Xuejun Zang forcollecting data and information.

4 CHINA'S SEMI-ARID REGIONS 107
Table 11. Development of transportation and communication Table 12. Land use in some semi-arid regions of China, 1980
in China (%)
Transportation 1949 (km) 1984 (km) Regions Farmland Forestry Grassland Desert Other
RailwayRoads and highwaysInland waterwaysAir
218008070073600
51700926700109300260200
ShaanxiGansuNingxiaQinghai
19.067.83
13.490.81
22.287.222.110.27
12.6430.1139.6956.13
6.4814.688.36
11.88
39.5340.1636.3430.91
(a)
• • •
Inland water transportAir transport
(ft)
Built before 1949Built rffer 1949
Figure 17: Northwest China's (a) inland water transport and airlines and (b) railways.
REFERENCES
Academy of Meteorological Science. 1982. Atlas of Floods and Droughtsin China for the last 500 years. China: Chinese Map Press. (InChinese.)
China Statistical Information and Consultancy Service Center andInternational Center for the Advancement of Science & TechnologyLimited. 1990. China, Forty Years of Urban Development. Compiledby the Urban Social and Economic Survey Organization of the StateStatistical Bureau. People's Republic of China. (In English andChinese.)
Chinese Natural Resource Research Committee et al. 1988. Investi-gations on Natural Resources in the Arid and Semi-arid Regions inChina. China: Science Press. (In Chinese.)
Gates, W. L. 1983. Ice Age Simulations. Climate Research InstituteReport no. 33. Oregon State University.
Geng Kuan-hong. 1986. Climate in Desert Areas in China. China:Science Press. (In Chinese.)
Hansen, J., Lacis, A., Rind, D., Russell, G., Stone, P., Fung I., Ruedy,R. and Lerner, J. 1984. Climate Sensitivity: analysis of feedbackmechanisms. In Climate Processes and Climate Sensitivity, ed. J. E.Hansen and T. Takahashi, pp. 130-63. Maurice Ewing Series 5. AGU.
Investigative Committee of National Natural Resources of China. 1988.Investigation on Natural Resources in the Arid and Semi-arid Regions ofChina. China: Meteorology Press. (In Chinese.)
Kutzbach, J. E. and Gallimore, R. G. 1989. Pangaean climates: mega-monsoons of the megacontinent. Journal of Geographical Research94:3341-58.
Li Jiang-feng et al. (eds.) 1990. Investigation on Climate, Environment,and Regional Development in the Arid and Semi-arid Regions in China.China: Meteorology Press. (In Chinese.)
Lin Zhi-guang and Zhang Jia-cheng. 1988. Climate of China. China:Shanxi Press. (In Chinese.)
Lu Yu-rong and Gao Guo-dong. 1985. Atlas on Hydrology and Climatein China. China: Meteorology Press. (In Chinese.)
Manabe, S. and Kahn, D. G. 1981. Simulation of atmospheric varia-bility. Monthly Weather Review, 109:2260-86.
Manabe, S. and Wetherald, R. T. 1987. Large-scale changes of soilwetness induced by an increase in atmospheric carbon dioxide.Journal of Atmospheric Science 44:1211-35.
Mitchell, J. F. B, Manabe, S., Meleshko, V. and Tokioka, T. 1990.Equilibrium climate change and its implications for the future. InClimate Change: The IPCC Scientific Assessment, ed. J. T. Houghton,G. T. Jenkins and J. J. Ephraums. Cambridge: Cambridge UniversityPress.
National Meteorological Center. 1985. Atlas of Grade of Temperature inChina for 1910-1980. China: Meteorology Press. (In Chinese.)
National Statistical Bureau of China. 1990. Historical Statistical Datafor the Provinces, Autonomous Regions, Cities (1949-1989). China:National Statistical Press. (In Chinese.)
Northwest Normal University. 1983. Atlas of Chinese Nature andGeology. China: Chinese Map Press. (In Chinese.)
Schlesinger, M. E. and Zhao, Zong-ci. 1989. Seasonal climate changesinduced by doubled CO2 as simulated by the OSU atmospheric GCMmixed layer ocean model. Journal of Climate 2:459-95.
Shao-wu Wang and Zhao Zong-ci. 1981. Droughts and Floods in China,1470-1979, Climate and History, ed. T. Wigley et al. Cambridge:Cambridge University Press.
Song Shi-da et al. 1980. Investigation on Droughts in China. China:Chinese Science Press. (In Chinese.)
Washington, W. M. and Meehl, G. A. 1984. Seasonal cycle experimenton the climate sensitivity due to a doubling of CO2 with an atmos-pheric general circulation model coupled to a simple mixed-layerocean model. Journal of Geophysical Research 89:9475-503.
Wilson, C. A. and Mitchell, J. F. B. 1987. A doubled CO2 climatesensitivity experiment with a global climate model including a simpleocean. Journal of Geophysical Research 92:13315^3.

108 II C L I M A T E V A R I A T I O N , C L I M A T E C H A N G E A N D SOCIETY
Yang De-qin et al. 1989. Desertification in China. Journal of Geography{China) 5:7-14. (In Chinese.)
Yang De-qing et al. 1990. Paleoclimate in China. Journal of Geography(China) 6:22-30. (In Chinese.)
Zhang Chuen-yuan et al. 1983. Changes of lakes in the arid regions.Journal of Lakes (China) 2:9-15. (In Chinese.)
Zhao Song-qiau, Ed. 1985. Nature and Geology in the Arid Regions inChina. China: Science Press. (In Chinese.)
Zhao Song-qiau, Ed. 1985. Natural Geography in the Semi-arid Regionsin China. China: Science Press. (In Chinese.)
Zhao Song-san et al. 1985. Resources in China. Journal of NaturalResources (China) 4:1-8. (In Chinese.)
Zhao Zong-ci. 1991. Changes of Temperature in China for the Last 40Years and Urbanization. Journal of Meteor 17:4-10. (In Chinese.)
Zhao Zong-ci. 1989. Impacts of climatic change in China induced bygreenhouse effect as simulated by the GCMs. (In Chinese.) Journal ofMeteorology (China) 15:1-5 (In Chinese.)
Zhao Zong-ci and Zang Xuejun. 1991. Desiccation in China. Abstractsof IUGG XXI, Vienna, Austria, 11 August 1991.
Zhao Zong-ci and Ding Yihui. 1990. Assessment of climate change inChina induced by greenhouse effect as simulated by the GCMs.Journal of Environmental Science. (China) 2:74-84.
Zhu Zhen-da, Wu Zhen, Liu Shu et al. 1980. Introduction to Desert inChina. China: Science Press. (In Chinese.)

5: Settlement Advance and Retreat: A Century ofExperience on the Eyre Peninsula of South Australia
R. LESHEATHCOTE
INTRODUCTION
This chapter presents ongoing research into the Eyre Penin-sula of South Australia, where there appears to have been atleast a century of relatively well-documented intensificationof land use paralleled by fluctuating socioeconomic fortunesand locally devastating impact upon the ecosystems of thearea.
Among the current scenarios of future climate change forAustralia are forecasts of the reduction of winter rainfall ofup to 20% and increases in summer rainfall of similarproportions. Associated with these changes are increases inannual average temperatures of 1-3 °C (Pittock and Hen-nessy 1991). Such forecasts have caused concern among ruralplanners in the cereal grain producing areas of southernAustralia, especially where current economic constraints arereinforcing the marginality of much rural production andrural life-styles.
What follows is a preliminary account of research focusingupon the characteristics of the Eyre Peninsula (Fig. 1), thesources available for its study, and suggestions of somepreliminary findings and general questions.
THE EYRE PENINSULA STUDY SITE
Sources
In terms of the last 100 years of human occupation, the EyrePeninsula offers both abundant and spatially detailed datasources. The process of European occupation of the BritishColony of South Australia, from 1836 onwards, was under-taken by a civilian government concerned with providing anorderly framework for the occupation and exploitation ofthe natural resources by the application of capital and labor.The intention here, as elsewhere in Australia, was the encour-agement of private development within a broad framework
of official land survey but private land ownership (Williams1974).
The result was a survey system where individual farmholdings were defined and statistics collected within a frame-work of standard spatial units. 'Hundreds' (approximately100 square miles or 259 square kilometers) and 'Counties'(combinations of Hundreds) were surveyed in advance ofagricultural occupation. Statistics on actual areas occupiedand the production are therefore available for most of thelast 100 years on a constant spatial grid which lends itself wellto GIS (geographical information system) analysis. In addi-tion, the existence of the parliamentary democracy and apropensity to appoint special committees of enquiry orRoyal Commissions to investigate societal problems as andwhen they occurred, has provided a rich archive of thedebates and philosophical contexts for resource manage-ment over the last century.
Physical characteristics
The Eyre Peninsula (almost 49000 square kilometers) is aclimatic transition zone from a 'Mediterranean' type climatewith winter rainfall averaging approximately 500 millimeters(Humid Mesothermal Dry Summer, 'Csa') to semi-aridsteppe climate with highly variable rainfall averagingapproximately 250 millimeters (Dry Steppe, 'Bsh') (Trew-artha 1964). Extensive plains with quaternary linear sand-dune systems are broken by granite inselbergs and relict saltlakes over sparse and often brackish aquifers, contained inlimestones partly covering the Pre-Cambrian and locallylateralized and deep weathered basement rock complex(Parker et al. 1985). At the time of first European contact thearea was covered by a range of vegetation, from woodlandsincluding Red Gum {Eucalyptus camaldulensis) and Pepper-mint Box (E. odorata) in the south, through dense scrubs ofMallee (E. socialis, E. diversifolia and many variants) with
109

110 II CLIMATE VARIATION, CLIMATE CHANGE AND SOCIETY
Figure 1: The Eyre Peninsula, South Australia. 1, agricultural land (cropland and improved grazing land); 2, pastoral land (unim-proved grazing land); 3, reserved land (national parks and scientific reserves); 4, railways. (Source: Map of'South Australia GeneralReference 1:500000', Department of Lands, Adelaide, October 1990.)
Pines {Callitris spp.) and Tea Tree {Melaleuca spp.) dominat-ing the center, to low woodlands of Mulga {Acacia aneura)and Western Myall {A. sowdenii) merging into Saltbush{Atriplex spp.) and Blue Bush {Maireana spp.) shrubland onthe northern fringes of the desert interior (Lange and Lang1985).
Land settlement history
Prior to European intrusion in the early nineteenth century,the area was supporting approximately 2000 semi-nomadicAborigines relying upon hunting, fishing and food collec-tion. While there was some evidence of inter-group conflicts,the main conflict came with the European invasion, whichreduced the cultures to a minority role as the result of acombination of physical conflicts, disease and social disrup-
tion (Berndt 1985). By 1986 the population claiming Aborigi-nal descent was 1232 from a total population of 33 644.
Originally considered as a possible main base for Euro-pean colonization of the new British Colony of SouthAustralia in 1836, Port Lincoln was rejected because of anuncertain water supply and indifferent soils, in favor of thepresent State capital, Adelaide. Those two factors havecontinued to plague European settlement on the Eyre Penin-sula ever since.
Initial European settlement favored the open woodlandson the limestone plains of the western peninsula and hills ofthe northeast, where natural grasses and some access tosurface water or shallow wells provided support for sheepand cattle raising upon land held under terminating pastoralleases. By 1888 when most of the leases expired, the colonialgovernment was pressured to open the land for agriculture,

5 THE EYRE PENINSULA OF SOUTH AUSTRALIA 111
1r*—i 1—r "T" ~r ~ i
. ™ n
-H j i-
V^U /Figure 2: The spread of agricultural settlement on the Eyre Peninsula. The key indicates the dates of official opening of the Hundredsurvey units for agricultural occupation. While the land was not always immediately occupied, the sequence does indicate the broadhistorical trends of agricultural advance.
as techniques for clearing the relatively untouched malleeareas had been developed elsewhere in the colony and settlersretreating from the northern, more arid frontier were clamor-ing for new lands to develop (Meinig 1962). The resultantstory is outlined in Figs. 2 and 3 and the following discussionis intended as commentary upon those figures.
The agricultural occupation of the pastoral leases andadjacent mallee areas began in the 1890s, but had to relyupon uncertain water supplies for domestic and livestock useand had to get produce to the coast for transport to theAdelaide or expanding overseas markets. Effective occupa-tion of the mallee interiors had to await two infrastructuredevelopments. First was the construction of a narrow-gaugerailway along the axis of the peninsula, begun in 1905 (PortLincoln to Cummins) and completed to Ceduna by 1915,Penong by 1924 and Buckelboo by 1926. The second was theconstruction of a water pipeline reticulation system from acatchment in the south along the railway axis to the northand west, begun in 1916 and basically completed by 1929 toCeduna. This complemented the earlier rainfall runoff catch-
ments around most of the granite inselbergs and the corru-gated iron roof catchments built by the government upon thefarm blocks prior to occupation.
The advancing wave of agricultural settlement paralleledthe railway and water pipeline construction from south tonorth (see Fig. 2). The mallee was rolled down and thenburned, with the first grain crops sown into the ashes, usingthe locally developed stump-jump ploughs and reapers tohelp sow and bring home the harvest. Land clearance foragriculture increased rapidly through the period of the 1910sto the 1930s and revived in the western areas in the 1950s tothe 1960s. By the 1970s, 63% of the original vegetation hadbeen removed and, although cereal and livestock productionwas impressive, there was evidence of accelerated soil erosionand long periods of economic stresses had led to farmamalgamations.
Currently the low wheat and wool prices together withdroughts are reviving conditions similar to previous periodsof stress and there are fears for the future viability of ruralsettlement in the area. Fears of further reduction of the

112 II CLIMATE VARIATION, CLIMATE CHANGE AND SOCIETY
1816-1
V/~TTI i rrrt f rnTTTTTTTI rn 11 n rrrrrrrnr ITTTTVJ n nrn ITITTI I M I I I
1910 1920 1930 1940 1950 1960 1970 1980 1990Dates
Occupied Area(ha)
Wheat prodn(t)
Sheep
Woolclip(kgs)
SheepEquivUnits
AvgFertlzr(kg/ha)
Figure 3: Eyre Peninsula production 1910-90. Occupied area (ha), annual totals of land in private ownership; Sheep, annual totals ofsheep grazed on the peninsula; SEUs, annual total of sheep-equivalent units (sheep + cattle x 8); Wheat prodn (t), annual wheatproduction in tonnes; Woolclip (kg), annual woolclip in kilograms; Av. fertilizer (kg/ha), annual total of superphosphates applied.(Sources: South Australia Statistical Registers and Australian Bureau of Statistics Data.)
winter rainfall as part of the 'Greenhouse effect' have intensi-fied local, regional and eventually national concerns and ledto the first attempt in Australia to bring together local settlersand administrators, academics, conservationists and stateand federal governments in a cooperative approach toregional planning: the Eyre Peninsula Project. To dateimplementation of the project has been slow but someprogress has been made (Smailes and Heathcote 1992). Oneof the problems facing the project is the measurement of theextent of desertification occurring on the peninsula.
DESERTIFICATION: THE PROBLEM OFDEFINITIONS
That desertification was occurring on the Eyre Peninsula wassuggested by the United Nations World Map of Desertifica-
tion on which the peninsula was identified as an area with ahigh risk of desertification and the surface subject to saliniza-tion or alkalinization (UN 1977). Although subsequentlycriticized in terms of its methodology (Carder 1981), the mapbasically reinforced the evidence accumulated as part of thenational soil conservation survey of 1978 (RDDEHCD1978). These were rather general measures. What, however,was meant by desertification and what was the more detailedevidence?
Desertification
A recent review of the evolution of meanings associated withthe term 'desertification' has been provided by Odingo andhis final suggested definition is close to that accepted by theAd hoc Committee on Assessment of Global Desertificationon 16 February 1990 in Nairobi (UN 1990:28):

5 THE EYRE PENINSULA OF SOUTH AUSTRALIA 113
Desertification, or land degradation, is the process of landdegradation characteristic of the arid, semi-arid and sub-humid areas of the world. The process, which is largelyhuman-induced, is normally exacerbated by adverseclimatic conditions such as prolonged drought or desic-cation, which enables it to strike at the land resource baseby weakening the physical, biological and economicpotential of the land, thereby severely reducing or curtail-ing overall productivity. (Odingo 1990:47)
Documentation of this process, so defined, therefore requiresevidence of the adverse climatic conditions (prolongeddrought or desiccations) and the reduced or curtailed overallproductivity to be measured in some way.
Drought
The problems of defining drought have been identifiedpreviously (Heathcote 1969, 1988) and for the purposes ofthis chapter, only the evidence for meteorological droughts(using the Commonwealth Bureau of Meteorology defini-tions) and agricultural droughts (using agronomic defini-tions oriented to cereal cropping) will be considered.
Desiccation
In his discussion of desertification Odingo suggested thatHare's (1987:6) concept of 'true desiccation - a prolongedperiod in which drought slowly and intermittently intensifies'over a period of decades, was a useful component in theanalysis of possible linkages between drought and desertifi-cation (Odingo 1990). The cumulative deviation of rainfallsfrom the long-term mean may be one way of identifying suchperiods.
DOCUMENTING DROUGHT ON EYREPENINSULA
Table 1. Meteorological drought on Eyre Peninsula
Two measures of drought appear to be relevant here, namelymeteorological drought (as defined by the Bureau of Meteor-ology using rainfall deciles) and agricultural drought definedin terms of rainfall inadequate for crops to mature.
Meteorological drought: patterns in time
Using the annual maps of rainfalls in the first and seconddeciles available in Gibbs and Maher (1967) and subse-quently in the Commonwealth Bureau of MeteorologyMonthly Rainfall Reviews, the percentages of the EyrePeninsula (defined as the area within the counties) so affectedwere tabulated and the years with droughts were rankedaccording to area affected (Table 1). Finally, the percentages
Area in 1stdecile (%)
100
90787064
N o otheryears over5 0 % in 1stdecile
Years
1928,19821897196719141965
Areas in lst +2nd decile (%)
100
87797876736661555452
Years
1888, 1897, 1928,1929, 1957, 19821967196519141918196119771988189118941943
Sources: Gibbs and Maher (1967); Comm. Bur. Met. MonthlyRainfall Reviews 1967-90.
Table 2. Drought decade rankings for Eyre Peninsula1890s-1980s
Rank
1234567891011
Cumulative areain 1st
1960s1920s1890s1980s1940s1910s1950s1880s1970s1900s1930s
decile
(169)(124)(110)(100)(73)(70)(59)(28)(8)(3)(0)
Cumulative areain lst + 2nd decile
1920s1960s1890s
1910s+1980s1940s1950s1880s1970s1930s1990s
(254)(239)(219)(161 each)(159)(133)(122)(94)(61)(42)
Sources: Gibbs and Maher (1967); Comm. Bur. Met. MonthlyRainfall Reviews 1967-90.
in both first and second deciles were summed for each decadeand the decades ranked according to apparent extent ofdrought occurrence (Table 2).
Table 1 shows that the whole peninsula was droughtaffected (rainfalls in the first decile) on only two years (1928and 1982) between 1885 and 1990, but if rainfalls in thesecond decile are included, the total moves to six years (1888,1897, 1928, 1929, 1957 and 1982). The table also shows thatover half the peninsula experienced rainfalls in the first decilein six years over the period, while if the areas affected byrainfalls in the second decile are added, the peninsula had 16years so affected.

114 II CLIMATE VARIATION, CLIMATE CHANGE AND SOCIETY
40 km
Figure 4: Agricultural drought frequency on Eyre Peninsula. 20-60, isolines of the percentage of years with continuously effectiverainfall (for cereal crops) for fewer than 5 consecutive months. (Source: Trumble 1948.)
Table 2 shows that for first decile rainfalls, the worst fourdecades were the 1960s, 1920s, 1890s and 1980s respectively,while for combined first and second decile rainfalls the worstfour decades were the 1920s, 1960s, 1890s, and 1910s and1980s respectively. Finally, summing the combined percent-ages for 11-year sequences, the periods 1957-67 with a scoreof 372 and 1888-98 with a score of 319 stand out as times ofextensive and persistent meteorological droughts.
While these are admittedly crude measures, they doprovide the general background against which to examineother evidence of droughts and their impacts, and if a causallink between drought and desertification is postulated, wemight look particularly closely at these periods for evidenceof desertification processes at work.
Agricultural drought: a spatial gradient
The meteorological drought data above assumed an evenpotential for drought occurrence across the peninsula, but if
agricultural drought is considered then a gradient of vulner-ability from north-northeast to south-southwest across thepeninsula can be shown. In 1948 Trumble published maps ofdrought frequency for South Australia showing 'the numberof years in a hundred in which the season of continuouslyeffective rainfall [for cereal grains] is less than five months[the critical limit for grain to mature]' (Trumble 1948:58).
For the Eyre Peninsula the pattern showed a gradient fromover 60% frequency/probability in the north-northeast toless than 20% frequency/probability in the south (Fig. 4).This same basic trend is evident in the map of the index ofdrought incidence (using percentiles) in the Year Book ofAustralia (1984:34). Thus it would appear that the increasedfrequency and liability to agricultural drought as one movesnorth through the peninsula would be a factor in thepotential for desertification. Indeed, if productivity were tobe a criterion, Trumble had already identified 'marginalwheat-growing areas, including such centers as . . . Cowell,Ceduna . . . Kimba . . . there are, on the general average, in

5 THE EYRE PENINSULA OF SOUTH AUSTRALIA 115
these areas, about two drought years in three' (Trumble1948:58-9).
In such areas crop failure might be one indicator ofpotential desertification.
DOCUMENTING DESICCATION ON EYREPENINSULA
the 1920s would seem to be high. How does the evidence ofdesertification measure up?
DOCUMENTING DESERTIFICATION ONEYRE PENINSULA
While the above data identify years and decades as droughty,there is little sense of any trend over time - the vital ingredientof Hare's concept of desiccation. Prior studies, however, doprovide evidence of rainfall trends over the last 100 years andthe relevant information for the Eyre Peninsula is summar-ized below.
Using the residual-mass concept for monthly rainfalls,Foley (1957) showed that the South Australian agriculturalareas of the 1950s experienced an upward trend in rainfallfrom 1900 to the mid-1920s before a long decline to the mid-19408 and generally stable figures in the 1950s. The peninsulaappeared to be relatively unaffected by the shift in climaticbelts 1881-1910 to 1911-40 as depicted by Gentilli(1971:206), but both Pittock (1981) and Russell (1981)suggested that there were observable trends in rainfall overthe peninsula. Pittock suggested that there was an increase of0-50 millimeters in mean annual rainfall between 1913-45and 1946-74, and Russell suggested that the period 1925-50had winter rainfalls generally below the long-term means andthat there seemed to be significant discontinuities in theresidual-mass curves in 1903-5, 1927 and 1950-51.
More recently Hobbs suggested for the period from 1891to 1982 in South Australia: The overall period to the mid-19208 can be characterized as relatively wet, the period fromthe mid-1920s to the late 1940s as relatively dry, and theperiod since then as one of greater variability with shorterwet and dry spells' (Hobbs 1988:295). In terms of the cerealgrain growing season rainfall, Hill (1987) showed a divisionbetween the northern and southern halves of the peninsula,with rainfall decreases from the 1930s-1940s in the south andincreases in the north. This trend was generally confirmed byBurrows (1989) for the period 1937-87, with decreases of upto 10% from long-term means observed.
In summary, it would appear that:
(1) There have been observably different trends in rainfall overthe Eyre Peninsula since the last decade of the nineteenthcentury.
(2) Those trends seem to have taken the form of gradualincreases over the period from the 1880s to 1920s; followedby decreases from 1920s to the 1940s; with separation of thedecreases in the south from increases in the north there-after. The potential, therefore, for the processes of desic-cation and desertification to be identified in the area after
Given the general definition of desertification adopted here,any attempt to provide documentation must consider avariety of potential indicators. Briefly, these might includeevidence of:
(1) changes in available biomass over time;(2) accelerated soil erosion;(3) increased soil salinity;(4) declining agricultural productivity (however measured);(5) declining population carrying capacities.
A sample of the evidence for each will be provided toillustrate the potentials and some of the questions they posefor an understanding of cause and effect.
Changing biomass
As mentioned earlier, European settlement from the 1880sonwards has been accompanied by the widespread removalof the original sclerophyll woodland, mallee scrub andsaltbush and their replacement by annual grain crops or longrotations of pastures and grains. By 1975, 62.8% of thatoriginal vegetation had been removed within the countiesand, although it was claimed at the time that the mostsuitable agricultural lands had already been cleared, clear-ance of vegetation continued, until by 1988, 71.5% had beenremoved (SAICVC 1976; EPCSA 1988).
As noted earlier, the periods of most rapid clearanceappear to have been the 1910s to the 1930s and the 1950s tothe 1960s, periods of the rapid increase of farmland underofficial financial incentives (Boeree 1963; Williams 1974).Both these periods were times of declining annual rainfalls,and extensive meteorological droughts. Comparing the bio-mass of the original vegetation with that of the cultivatedpaddocks under drought conditions there would be nodispute about reduction in biomass, but good seasons mightencourage a debate as to which was the larger per unit area.
Accelerated soil erosion
Evidence of accelerated soil erosion on the peninsula over thelast 100 years is of varying quality but there is no doubt thataccelerated erosion did take place at identifiable times andlocations. The evidence, however, must be set in the contextthat approximately 56% of the surface comprises dunes andswales formed some 3000 to 6000 years ago in a previouslymore arid climate, and that these areas were naturally

116 II CLIMATE VARIATION, CLIMATE CHANGE AND SOCIETY
Key:1-No drift.2—Some drift.3— Moderately bad drift.4—Serious drift.5—Salt lakes.
Figure 5: Soil erosion on Eyre Peninsula 1938. (Source: SAPP 1938.)
vulnerable to erosion once the protective original vegetationwas removed. Both Crocker (1946:91) and Laut et al.(1977:3-4) commented on the vulnerability of the dunes toreactivation once cultivated.
Official concern for accelerated soil erosion in SouthAustralia as a whole had been evident as early as 1867, and by1899 the Minister of Agriculture was suggesting tree plantingfor soil control and contemplating 'legislation to penalizeowners of drifting land' (Williams 1974:303).
For the Eyre Peninsula, however, the first official inquiryreported in 1938 as part of a state-wide survey (SAPP 1938).The map with the report showed that the peninsula was notthe worst affected area, although it did have a band of smalleroding areas from northwest to southeast across the centerof the peninsula (Fig. 5), which broadly coincided with thedune areas identified by Crocker (1946) and the calcenitedunes and plains of Laut et al. (1977). While most of theeroding areas had only 'some drift' - 'small patches still bareof growth and drifting with every wind,' the naturallyvulnerable nature of the sandy soils was noted by theCommittee and, recognizing that 'in many cases' erosion was'a measure of mismanagement in the past as much as the
natural liability,' they noted that 'Some of this unclearedland is so very sandy that it is to be hoped that theGovernment will never be tempted to open it for [agricul-tural] selection but will retain the areas as fauna and florareserves' (SAPP 1938:16). As we have seen, however, this wasa vain hope.
Reports of erosion continued through the 1940s (SAPP1946:No. 62) but were surprisingly relatively muted throughthe 1950s and 1960s. The 1959 'major drought' brought 'veryfew wind erosion problems in upper Eyre Peninsula,' but the1967 dry season brought reports of soil drift in the centralnorth of the peninsula. Much of this was 'associated withextensive areas of newly cleared land' (Wetherby et al.1983:11).
The next major official concern came in 1978 when acombination of drought and reduced production occurredafter a series of years of low prices and farmers attempted thetraditional strategy of'cropping themselves out of a drought'- i.e. sowing a larger area to provide a larger financial return.The results are set out in Fig. 6 and Table 3.
Once again, as in 1938, the definitions of the types oferosion were less than precise, but the area of accelerated

5 THE EYRE PENINSULA OF SOUTH AUSTRALIA 117
Figure 6: Soil erosion on Eyre Peninsula 1978. 1, active drift; 2, serious active drift; 3, sweeping drift; 4, serious sweeping drift. Notethat rehabilitation of areas keyed 1 and 2 is estimated to take 4 years; rehabilitation of areas keyed 3 and 4 is estimated to take 1'normal' year. (Source: Wetherby et al. 1983.)
erosion so defined extended from northwest to southeastacross the center of the peninsula, again coinciding well withthe dune systems identified in Crocker and Laut et al. Dryseasons in 1975-6 and 1976-7 together with drought in 1977-8 were blamed, together with 'an ill-defined start to the 1977season, water repellence on non-calcareous sandy soils,overstocking, excessive cultivation associated with the use ofpre-emergent herbicides and unsuitable cereal cultivars forthe sandier soils' (Wetherby et al. 1983:1). More specifically,'The situation in 1977 was aggravated by a large increase inarea sown to crop as farmers sought to recoup losses from theprevious dry seasons. In addition farmers were reluctant toquit stock until absolutely necessary because very high priceswere likely to follow the end of the drought' (Wetherby et al.1983:2). In-drought prices of $1 per head were comparedwith post-drought prices of $25 per head.
By 1980, however, it was claimed that there was 'littleevidence of the effects of the prolonged drought' as a result ofmore favorable seasons and extensive government droughtrelief (Wetherby et al. 1983:40). The economic costs of
rehabilitation were nonetheless significant. Some 937(42.3%) of the 2187 total rural landholders on the peninsulahad applied for drought relief, of which 858 were given loanstotalling $13.4 million - some 64% of the state's DroughtRelief payments for the period September 1976 to June 1978(Ellis and Porter n.d.:50-l).
In a more general study of wind erosion in Australia 1960-84, Burgess et al. (1989) provided a map of excess winderosion (i.e. that considered to be above the climate winderosion potential). On the Eyre Peninsula, the Cedunadistrict showed excessive dust storm frequency in the moder-ate to high class compared with the remainder of the penin-sula. They explained this localized occurrence as 'associatedwith the destabilization of calcareous coastal sand dunes byrabbits, overgrazing and recreational activities,' andexplained the contrast between the Ceduna area and StreakyBay to the south as 'a function of the wind erodibility of thesoils' (Burgess et al. 1989:106). Probably a more significantfactor was the rapid expansion of the cultivated area in theCounty Hopetoun, west of Ceduna, in the period. For

118 II CLIMATE VARIATION, CLIMATE CHANGE AND SOCIETY
Table 3. Desertification in 1978 on Eyre Peninsula
Production trends 1974/5 1975/6 1976/7 1978/9 1978/80
Cereal productionCrop area (000 ha) 697 582 633 781 880Yield (0001) 779 621 434 219 1299Yield (t/ha) 1.1 1.1 0.7 0.3 1.5
Sheep-equivalentunits (000) 2907 2858 2243 1777 1886
Drifting areas Dec. 1975 May 1978 Aug. 1978 Mar. 1979
Active (ha) 500Sweeping (ha) 10100Total (ha) 10600
27500 6000 2000138000 50000 5000165000 56000 7000
Source: Wetherby et al (1983).
example, in 1955 some 1836 hectares had been cultivated, by1965 this had risen to 3936 hectares, by 1975 to 4006 hectaresand by 1985 to 10 294 hectares. New land clearance may havedestabilized the local sandy soils.
Local government records offer evidence on a variety ofmatters relevant to drought, desiccation and desertification.Some of the district clerks or chief executive officers includeda summary of seasonal conditions in their end-of-year state-ments and these provide a 'grass roots' view of the weatherpatterns over the past year and their significance to the localcommunity. These may help identify critical thresholds ofstress for the communities. Accelerated erosion shows up inthe concern for the condition of the local roads, particularlywhen blocked by soil drift or water erosion. Such referencesare frequent, not only because of the local governmentresponsibility for road maintenance, but also because of theuse of road maintenance as public relief work as part oftraditional drought relief measures. The references may beplotted over time and give some indication of relative fre-quency of concerns (Fig. 7).
Briefly, relief funds could be used to employ farmers onroad maintenance, and the councils often allowed farmerswho were behind with their rates to work off their debtsimilarly. The tasks were usually described as either grubbing(i.e. clearing vegetation off the surveyed road alignment),scooping (i.e. the removal of drifted soil which was blockingthe roads) or rubbling (i.e. the laying down of road metalover irregular or soft sandy road surfaces to provideimproved all-weather access). Interestingly the incidence ofgrubbing, high in the 1920s on the peninsula, declined overtime and was replaced by scooping and rubbling through the1930s and 1940s as the incidence of drift increased.
In addition, the minutes of local government administ-ration give clues to the actions which may have exacerbated
the erosion problem. To cope with drift on to roads, forexample, some councils encouraged and even required theremoval of existing natural vegetation to keep the soilmoving on: 'That [name] be written suggesting that heremove all timber on both sides of the road near his section toallow sand drift which is coming from his land to blow awaynaturally as this sand is making the road nearly impassable'(Kimba District Council Minutes, 11 February 1927).
Such strategies were relatively common into the 1940s.The same council in 1984 had a more positive attitude tosome of its continuing drift problems: 'That BuckelbooFootball Club be given permission to remove the drift soilfrom the road reserve adjacent to sections 13, 14 and 16 Hd[Hundred] of Pinkawillinie to top dress the Buckleboo Oval'(Kimba District Council Minutes, 12 June 1984). Consider-ing that the soil probably contained fertilizers from theadjoining paddocks, it was probably a good investment.
Salinization of land
Laut et al. commented upon the naturally saline nature ofparts of the peninsula:
Salt accumulation commonly occurs in low lying areas,especially where there is no through-going drainage, andthere are many salt lakes in the province. The main sourceof salt is sea spray blown inland, deposited on soil orvegetation, and carried to these low-lying areas by surfacerun-off or sub-surface drainage. (Laut et al. 1977:4)
In 1982 the map 'Salting of non-irrigated land in Australia'showed portions of the southern and eastern peninsulaaffected by induced saline seepages (the result of the effects ofcultivation) and 20000 hectares were estimated to be affec-ted, with implications of reduced water quality for domesticuse (WPDSA 1982:64). Some scalding was also noted for theCeduna-Streaky Bay areas. In addition Australian Bureauof Statistics data showed that 53 148 hectares of land wassaline and had been lost to cultivation by 1984-5 (ABS 1986-7:Cat. 7113.4).
Sampling of the local government sources so far has notfound much direct evidence of salinity problems, but oneexception would be a request for reduction of rates on thegrounds that 'This land is not freehold, there are about 500acres of granite outcrop on it which is valueless and about100 acres of salt rises which are increasing' (Kimba DistrictCouncil Minutes, 9 October 1931).
Decreasing productivity
Lack of space and the incomplete nature of the researchprevent anything other than a brief review of some measureshere. Fig. 3 illustrates some livestock and wheat production

5 THE EYRE PENINSULA OF SOUTH AUSTRALIA 119
12-r— r300
CD>
Z5C
Qd
COc
1921 1931 1941 1951 1961 1971 1981 19911926 1936 1946 1956 1966 1976 1986
E
m><D
C
coCOCOCD
CDC
1
Soil drift mentions Rain deviations
Figure 7: Soil drift and cumulative rainfall deviations for Kimba, Buxton County, Eyre Peninsula. Soil drift mentions, soil erosionproblems noted in the monthly District Council meetings and totalled annually; Rain deviations, cumulative deviations of annualgrowing season rainfalls (April-October) from the long-term mean. (Source: Minutes of the Kimba District Council 1925-91 andCommonwealth Bureau of Meteorology records for Kimba.)
trends which show increases through time, but at differingrates and with periodic reversals. From 1910 onwards theexpansion of the sheep flock was halted in 1915, 1929, 1946,1960, 1971 and 1978, mainly by droughts but more recentlyby a switch to cattle in the 1970s as a result of improved beefprices. The woolclip has generally followed the sheep trendsas might be expected. Wheat production has increased butbecome more variable since the 1960s despite increasedapplication of fertilizers.
Decreased rural population carrying capacity
The rural population on Eyre Peninsula has reflected the sizeand number of agricultural holdings over the years. These inturn have reflected first the process of intensification of landuse over the last 100 years - being the change from extensivepastoral properties to smaller grain-livestock farms; andsecond the process of farm amalgamations and restructuringto achieve economies of scale, when the best lands had beendeveloped and expansion into poorer lands began to beshown to be risky. This restructuring was partly market-
driven, but also partly officially blessed, as through theMarginal Lands Scheme of the 1940s to 1960s and thevarious Rural Assistance Schemes in operation since.
On the peninsula the number of rural holdings peaked in1938 at 4015 and by 1990 had fallen to 1731; the area in farmshad, interestingly, also diminished from a peak in 1961 of7.5 million hectares to the current 6.9 million, reflecting theabandonment of some farming lands and the conversion ofothers to public reserves (Fig. 8). The total population on thepeninsula, as we have seen, however, had risen from approxi-mately 2000 in 1836 to 33644 at the 1986 census. Thisincrease in overall population has been urban in nature, andspecifically in the larger towns, as has been the picture forrural Australia generally.
This picture of rural population increase followed bydecline, alongside overall population increase, is paralleledin the local government sources by evidence of the creation ofnew local government areas, the growth in number of ratepayers and the clearing of new roads, followed by evidence ofthe closure of unused road reserves, reduction in size ofsurveyed townships, reduction in number of rate payers,

120 II CLIMATE VARIATION, CLIMATE CHANGE AND SOCIETY
iso
xma.DOoO
CO
o
O f I I I 11 I I 1 1 'I' 'f T 'I'Y I 'i' V 'I' Y Y V V 'I'T Y Y ' i T f T t i ' I 'l' Y 'I' 'I' 'I' 'I' 'l"l' T 'I' Y V'!' V 'f T 'f V 'f'!' 'i'T Y 'I'T Y 'I' V V V 'I' 'f T 'f 'I' 'I'T 'f Y 'I' TT V T Y'
1910 1920 1930 1940 1950 1960 1970 1980 1990
Occupied Area(ha)
Wool(dls)c/kg
Holdings
Bankruptcies
Wheat(dis)$/t
Figure 8: Eyre Peninsula production contexts 1910-90. Occupied area (ha), annual totals of area in private ownership; Holdings,annual totals of agricultural holdings; 3, Wheat (dis) $/t, discounted wheat price in Australian dollars per tonne; Wool (dis)c/kg, discounted wool price in Australian cents per kilogram; Bankruptcies, registered bankruptcies and insolvencies in South Australia(both rural and urban enterprises). (Sources: South Australian Statistical Registers and Year Books.)
followed by attempts to increase rate payers by enlarging thelocal government areas, to sell lands and town lots to repayarrears of rates, down to the symbolic removal of the laststreet light at Buckleboo (Kimba District Council Minute, 13November 1990).
The economic dimension
Changing productivity and rural population carrying capa-cities, however, need to be set in the changing economiccontext, and this can be best encapsulated in two sets ofstatistics. First, in Fig. 8, are provided the trends of actualand discounted prices for wheat and wool - the two mainrural land products. The disastrous fall of the discountedvalue of the produce through the 1980s has exacerbated theplight of farmers trying to cope with heavy debt burdens andwith interest rates on their debts which have doubled to over20% during the decade.
A second series of statistics are the estimates of the volumeof production of wheat needed per hectare to cover the costs
of its production (i.e. before a profit on the production couldbe achieved). In the 1880s this break-even point was thoughtto be approximately 0.2 tonnes per hectare; by the 1930s itwas 0.4 tonnes per hectare; by the 1960s it was 0.6 tonnes perhectare; by the 1980s it was 0.8 tonnes per hectare; andcurrently it is close to 1 tonne per hectare. However, in thedecade of the 1980s, of the 148 Hundreds on the peninsulaproducing wheat for over half the period, one-third hadyields of less than 0.8 tonnes per hectare.
Given the pressures reflected in these two sets of statistics,it is questionable whether much of the farming activity issustainable without some improvement in the economicclimate.
SUMMARY AND QUESTIONS FORFURTHER CONSIDERATION
This survey of the documentation of drought and desertifica-tion on the Eyre Peninsula has only hinted at the array of

5 THE EYRE PENINSULA OF SOUTH AUSTRALIA 121
potential sources and the scope they offer for analysis notonly of some of the physical causes, but also of the humanactivities which affect the desertification processes and thequestion of sustainable resource management. The physicalprocesses of desertification have been shown to reflectdrought, the incidence of desiccation, and the existing soilcharacteristics, but also farm management practices, con-temporary economic conditions, government policies andcontemporary perceptions of what was happening to thelandscape in times of physical, economic and social stress.
Despite the early stage of the research, several questionshave been raised in collaboration with a colleague (PeterSmailes) from the University of Adelaide with whom theauthor is collaborating on the Eyre Peninsula Project, and weoffer these observations in conclusion:
(1) We agree with the findings of Lowrence et al (1986)that the question of sustainability needs to be addressed atvarious levels, each of which is linked to the adjacent levels ofactivity. Thus the 'macro-economic sustainability of anentirely agriculturally based region', such as the Eyre Penin-sula, can only be achieved if 'the constituent farming/land-use decision makers within it have achieved ecologicalsustainability in the natural resource base; this in turn isdependent upon micro-economic sustainability or long-termeconomic viability of the individual farm units.' Finally,sustainability at the farm unit level depends upon agronomicsustainability or the ability of the farm's field system tomaintain its level of production over a long period of time'(Smailes and Heathcote 1992).
(2) A further dimension, the question of social sustainabi-lity, needs to be added since the economic and ecologicalviability of a region is reflected in the social condition of itspopulation. In the quest for economies of scale in agricul-tural production for a commercial market, the reduction ofnumber of holdings is associated with a reduction of socialcontact and service provision which cannot be compensatedfor, despite Australia's innovative approaches to serviceprovision over large areas (Royal Flying Doctor Service,School of the Air and Distance Education programs) andsatellite television/communication systems.
(3) Politically there has been a long tradition in Australiaof official support for the concept of the family farm, butrecent studies have suggested that current circumstances areundermining the viability of the implicit small-scale andindependent nature of such a production system (Lawrence1987). This raises the question as to whether society wishes itsagriculture to be managed by corporate or family-scaleownership and what the implications are of each for thesustainability considerations noted above?
(4) Finally, the research so far has illustrated the changingrole of government in resource management on the EyrePeninsula. Broadly, the trend has been from a role as 'real
estate agent,' through that of 'developer's friend' and'welfare agent' to that of 'steward of the nation's environ-ment.' Associated with this trend has been a tendency for theincreased centralization of official decision-making and areduction of local control over local destinies. This tendencyis probably global but will pose serious problems if sustain-ability joins the other policy issues in appearing to beimposed from the center upon the local peripheral societies.
REFERENCES
ABS 1986-7. Australian Bureau of Statistics, catalogue numberindicated.
Berndt, R. M. 1985. Traditional aborigines. In Natural History of theEyre Peninsula, ed. C. R. Twidale, M. J. Tyler and M. Davies, pp. 127—38. Adelaide: Royal Society of South Australia.
Boeree, R. M. 1963. Land settlement on Eyre Peninsula South Australia:an enquiry into the future of an essentially rural area based on thefurther development of its agricultural resources. PhD thesis inGeography, University of Adelaide.
Burgess, R. C , McTainsh, G. H. and Pitblado, J. R. 1989. An index ofwind erosion in Australia. Australian Geographical Studies27(l):98-110.
Burrows, K. 1989. Interpretation of South Australian rainfall data. InGreenhouse '88: Planning for Climate Change, ed. T. Dendy, pp. 34-9.Adelaide: Department of Environment and Planning.
Carder, A. 1981. Desertification in Australia: a muddled concept. Search12:217-21.
Crocker, R. L. 1946. An introduction to the soils and vegetation of theEyre Peninsula, South Australia. Transactions of the Royal Society ofSouth Australia 70(2):83-107.
Ellis, S. and Porter, S. (n.d.) Administration of the 1976/77/78 droughtin South Australia. Department of Agriculture, South Australia.
EPCSA. 1988. The State of the Environment Report for South Australia.Adelaide: Environmental Protection Council of South Australia,Department of Environment and Planning.
EPRCC. 1991. Interim Report to the Minister of Agriculture. Adelaide:Eyre Peninsula Regional Co-ordinating Committee.
Foley, J. C. 1957. Droughts in Australia; review of records from theearliest years of settlement to 1955. Commonwealth Bureau of Meteor-ology Bulletin 43.
Gentilli, J. 1971. Climates of Australia. World Survey of Climatology13:35-211.
Gibbs, W. J. and Maher, J. V. 1967. Rainfall deciles as droughtindicators. Commonwealth Bureau of Meteorology Bulletin 48.
Hare, K. 1987. Drought and desiccation, twin hazards of a variableclimate. In Planning for Droughts: Towards a Reduction of SocietalVulnerability, ed. D. A. Wilhite et al. Boulder: Westview Press.
Heathcote, R. L. 1969. Drought in Australia: a problem of perception.Geographical Review 592:175-194.
Heathcote, R. L. 1988. Drought in Australia: still a problem ofperception? GeoJoumal 164:387-97.
Hill, R. 1987. Clear rainfall division between north and south. TheAdvertiser, Adelaide, 15 December.
Hobbs, J. E. 1988. Recent climatic change in Australia. In RecentClimatic Change, ed. S. Gregory. London: Belhaven Press.
Kimba District Council Minutes. Various dates. Kimba, SouthAustralia.
Lange, R. T. and Lang, P. J. 1985. Vegetation. In Natural History of theEyre Peninsula, ed. C. R. Twidale, M. J. Tyler and M. Davies, pp. 105-18. Adelaide: Royal Society of South Australia.
Laut, P., et al. 1977. Environments of South Australia Province 4: Eyreand York Peninsulas. Canberra: CSIRO Division of Land UseResearch.
Lawrence, G. 1987. Capitalism and the Countryside: The Rural Crisis inAustralia. Sydney: Pluto Press.
Lowrence, R., Hendrix, P. F. and Odum, E. P. 1986. An hierarchicalapproach to sustainable agriculture. American Journal of Alternate

122 II CLIMATE VARIATION, CLIMATE CHANGE AND SOCIETY
Agriculture 14:169-73.Meinig, D. W. 1962. On the Margins of the Good Earth. Chicago: Rand
McNally.Odingo, R. S. 1990. The definition of desertification and its programma-
tic consequences for UNEP and the international community. Deser-tification Control Bulletin 18:31-70.
Parker, A. J., Fanning, C. M. and Flint, R. B. 1985. Geology. In NaturalHistory of the Eyre Peninsula, ed. C. R. Twidale, M. J. Tyler and M.Davies, pp. 21-46. Adelaide: Royal Society of South Australia.
Pittock, B. and Hennessy, K. 1991. Enhanced greenhouse climatescenarios. Climate Change Newsletter 32:4-5.
RDDEHCD 1978. A Basis for Soil Conservation Policy in Australia.Report No. 1. Canberra: Research Directorate, Department ofEnvironment, Housing and Community Development.
Russell, J. S. 1981. Geographic variation in seasonal rainfall in Austra-lia: an analysis of the 80-year period 1895-1974. Journal of theAustralian Institute of Agricultural Science 47:59-66.
SAICVC 1976. Vegetation Clearance in South Australia. Adelaide:Report of the Interdepartmental Committee on VegetationClearance.
SAPP 1938. Report of the Soil Conservation Committee. Adelaide:Government Printer.
SAPP 1946. Annual Report of the Department of Lands and Survey for1946. Adelaide: Government Printer.
Smailes, P. and Heathcote, R. L. 1992. Holding the line or chasing therainbow? The quest for sustainability on Eyre Peninsula SouthAustralia. Progress in Rural Policy and Planning 2:234-46.
Trewartha, G. T. 1964. Climates of the Earth. In Goode's World Atlas,ed. E. B. Espenshade Jr, pp. 8-9. Chicago: Rand McNally.
Trumble, H. C. 1948. Rainfall, evaporation and drought-frequency inSouth Australia. Journal of Agriculture 52:55-64 and Suppl. 1-15.
UN 1977. World Map of Desertification (1:25000000). Paris: FAO andUNESCO.
UN 1990. A working concept of desertification for the purpose of itsassessment. Desertification Control Bulletin 18:28.
Wetherby, K. G., Davies, W. J. and Mathieson, W. E. 1983. Winderosion on Eyre Peninsula 1975-1979. South Australia Department ofAgriculture Technical Report 31.
Williams, M. 1974. The Making of the South Australian Landscape.London: Academic Press.
WPDSA 1982. Salting of non-irrigated land in Australia. WorkingPaper on dryland salting in Australia. Victoria: Soil ConservationAuthority.

Ill
Climate Variability and Vulnerability: Causality andResponse


6: Drought Follows the Plow: Cultivating MarginalAreas*
MICHAEL H. GLANTZ
Almost a century ago the belief that 'rain follows the plow'was a popular one that accelerated population movementsinto the region now known as the American Great Plains.Until the mid-1800s, this region was considered a wasteland,useless for agriculture and human settlement, an inhospi-table obstacle to settlers in search of the promised land in thewestern part of the North American continent.
At the same time that settlements crept westward after theCivil War in the 1860s, rainfall became more prevalent.Suddenly, what had previously been considered a barrenwaste was seen as a potential garden and a breadbasket forthe eastern part of the country. Many attributed theincreased rainfall to the effects of human settling activities,which included plowing fields, creating ponds, irrigating dryareas, and planting trees on what essentially had been atreeless grassland. The railroad companies and land specula-tors seized on this explanation to convince Easterners tomove to the Midwest. The advertising campaigns success-fully produced waves of immigrants who came to thesparsely populated plains seeking their fortunes (Webb1931).
During the 1890s a severe, multi-year drought dispelledthe rain follows the plow theory. Thousands of settlersabandoned their homesteads to seek livelihoods elsewhere. Itseemed that much of the support for the assumption of acausal relationship between rain and population was simplyexaggeration by the railroads and other land speculators,intent on selling land at higher prices than it was worth.Before long, people realized that dry and wet periods com-monly alternated and that the region's first surge of settlershad accidentally coincided with the onset of a lengthy wetspell. With the return of a prolonged drought, the credibility
* This article appeared in the April 1988 issue of The World &I,a publicationof The Washington Times Corporation. © 1988. Reprinted withpermission.
surrounding the rain follows the plow theory itselfevaporated.
The scientific reasoning behind the belief is that a region'satmospheric circulation is positively affected by increasedsources of evaporation. These derive from breaking theground with the plow, creating open bodies of water (pondsand tanks) and planting trees whose roots suck the scarcemoisture from the ground and whose leaves allow the waterto evaporate into the atmosphere, which ultimately returnsthe moisture as rain.
Today the scientific literature is still filled with articles andstudies on how land use has either brought about or elimi-nated rainfall in a region. The belief in a rain follows the plowconcept still lives, although the number of its supportersappears to be small. The latest resurgence of interest in thisidea resulted from the 17-year drought that began in 1968 inthe West African Sahel. It was argued that the reverseprocess, the removal of vegetation, could create a desert-likeenvironment (Charney et al. 1977). The overgrazing bylivestock on vegetation and the collecting of firewood as theonly available fuel ensured these conditions in the Sahel.Responding to the plow-rain theory, the United Nations andALESCO (the Arab League Economic, Scientific and Cul-tural Organization) suggested that tree belts be built alongthe northern and southern edges of the Sahara Desert toarrest their encroachment, put moisture back into the air,and bring rainfall to desiccated areas.
It is my contention, however, that as agriculture movesinto increasingly marginal areas, drought, not rain, is follow-ing the plow. Most of the world's best rainfed agriculturalland is already in production or unavailable to productionfor political or other reasons. Increasing the amount of landfor agricultural use requires the destruction of forests, the useof irrigation in arid areas, or the movement of people intomarginal agricultural areas (Glantz 1994).
Recall that only 40 years ago, Nikita Khrushchev, then
125
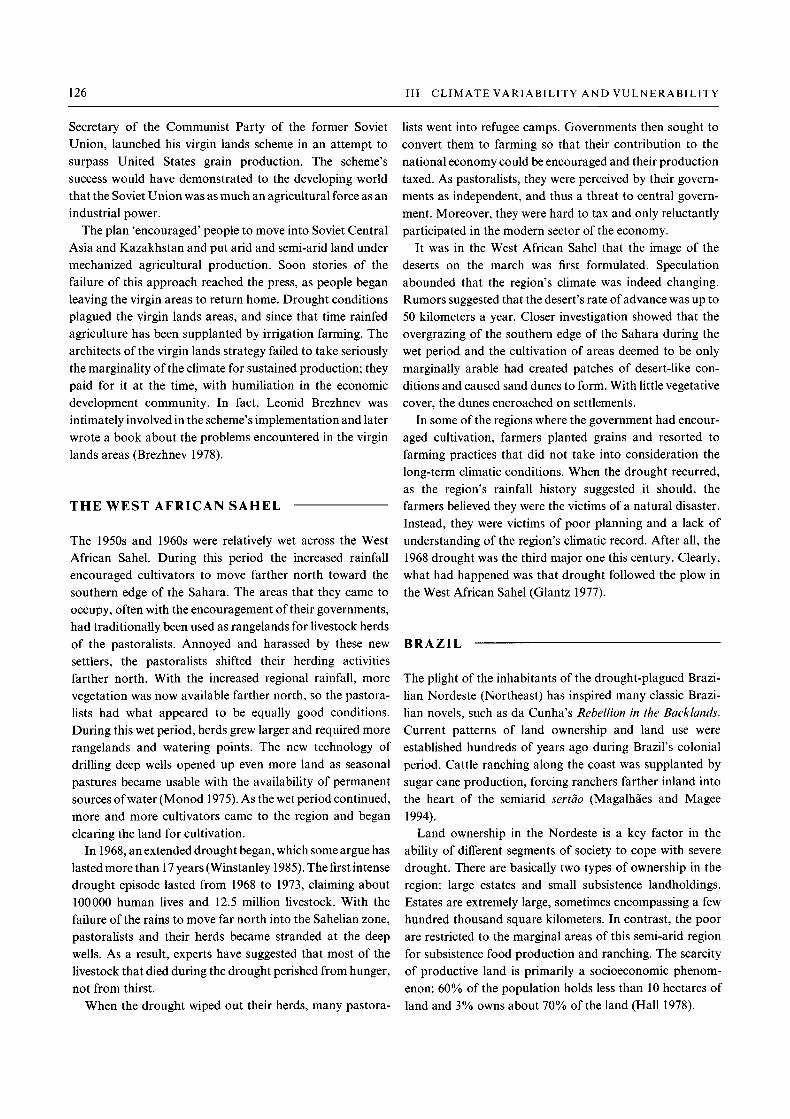
126 III CLIMATE VARIABILITY AND VULNERABILITY
Secretary of the Communist Party of the former SovietUnion, launched his virgin lands scheme in an attempt tosurpass United States grain production. The scheme'ssuccess would have demonstrated to the developing worldthat the Soviet Union was as much an agricultural force as anindustrial power.
The plan 'encouraged' people to move into Soviet CentralAsia and Kazakhstan and put arid and semi-arid land undermechanized agricultural production. Soon stories of thefailure of this approach reached the press, as people beganleaving the virgin areas to return home. Drought conditionsplagued the virgin lands areas, and since that time rainfedagriculture has been supplanted by irrigation farming. Thearchitects of the virgin lands strategy failed to take seriouslythe marginality of the climate for sustained production; theypaid for it at the time, with humiliation in the economicdevelopment community. In fact, Leonid Brezhnev wasintimately involved in the scheme's implementation and laterwrote a book about the problems encountered in the virginlands areas (Brezhnev 1978).
THE WEST AFRICAN SAHEL
The 1950s and 1960s were relatively wet across the WestAfrican Sahel. During this period the increased rainfallencouraged cultivators to move farther north toward thesouthern edge of the Sahara. The areas that they came tooccupy, often with the encouragement of their governments,had traditionally been used as rangelands for livestock herdsof the pastoralists. Annoyed and harassed by these newsettlers, the pastoralists shifted their herding activitiesfarther north. With the increased regional rainfall, morevegetation was now available farther north, so the pastora-lists had what appeared to be equally good conditions.During this wet period, herds grew larger and required morerangelands and watering points. The new technology ofdrilling deep wells opened up even more land as seasonalpastures became usable with the availability of permanentsources of water (Monod 1975). As the wet period continued,more and more cultivators came to the region and beganclearing the land for cultivation.
In 1968, an extended drought began, which some argue haslasted more than 17 years (Winstanley 1985). The first intensedrought episode lasted from 1968 to 1973, claiming about100000 human lives and 12.5 million livestock. With thefailure of the rains to move far north into the Sahelian zone,pastoralists and their herds became stranded at the deepwells. As a result, experts have suggested that most of thelivestock that died during the drought perished from hunger,not from thirst.
When the drought wiped out their herds, many pastora-
lists went into refugee camps. Governments then sought toconvert them to farming so that their contribution to thenational economy could be encouraged and their productiontaxed. As pastoralists, they were perceived by their govern-ments as independent, and thus a threat to central govern-ment. Moreover, they were hard to tax and only reluctantlyparticipated in the modern sector of the economy.
It was in the West African Sahel that the image of thedeserts on the march was first formulated. Speculationabounded that the region's climate was indeed changing.Rumors suggested that the desert's rate of advance was up to50 kilometers a year. Closer investigation showed that theovergrazing of the southern edge of the Sahara during thewet period and the cultivation of areas deemed to be onlymarginally arable had created patches of desert-like con-ditions and caused sand dunes to form. With little vegetativecover, the dunes encroached on settlements.
In some of the regions where the government had encour-aged cultivation, farmers planted grains and resorted tofarming practices that did not take into consideration thelong-term climatic conditions. When the drought recurred,as the region's rainfall history suggested it should, thefarmers believed they were the victims of a natural disaster.Instead, they were victims of poor planning and a lack ofunderstanding of the region's climatic record. After all, the1968 drought was the third major one this century. Clearly,what had happened was that drought followed the plow inthe West African Sahel (Glantz 1977).
BRAZIL
The plight of the inhabitants of the drought-plagued Brazi-lian Nordeste (Northeast) has inspired many classic Brazi-lian novels, such as da Cunha's Rebellion in the Backlands.Current patterns of land ownership and land use wereestablished hundreds of years ago during Brazil's colonialperiod. Cattle ranching along the coast was supplanted bysugar cane production, forcing ranchers farther inland intothe heart of the semiarid sertao (Magalhaes and Magee1994).
Land ownership in the Nordeste is a key factor in theability of different segments of society to cope with severedrought. There are basically two types of ownership in theregion: large estates and small subsistence landholdings.Estates are extremely large, sometimes encompassing a fewhundred thousand square kilometers. In contrast, the poorare restricted to the marginal areas of this semi-arid regionfor subsistence food production and ranching. The scarcityof productive land is primarily a socioeconomic phenom-enon: 60% of the population holds less than 10 hectares ofland and 3% owns about 70% of the land (Hall 1978).

6 DROUGHT FOLLOWS THE PLOW 127
Subsistence farming takes place on small landholdings oron land leased to poor famers on the large estates. Evenduring years of good rainfall, the small farmer population isin danger because of low agricultural productivity. Thegrowth of the population and of livestock herds in the regionhas forced farmers into increasingly marginal areas and hasheightened the region's dependence on food produced onthese lands. The soils and existing vegetation in these areashave thus become extremely vulnerable to climatic varia-bility, explaining their persistently low and ever-declininglevels of productivity.
The region is known to be plagued by recurrent short-termdrought, as well as devastating multi-year dry spells. Thepoor farmers are the first to be hurt by drought, since theygrow barely enough food for their own consumption. Theymust also find work to supplement their income, which theyoften do by working on the large estates as laborers. Duringextreme drought, however, the latifundistas (large land-owners) lay off their workers as a temporary cost-savingmeasure, making the workers' plight even worse. While thefederal and state governments implement work programs toconstruct roads and dams for minimal wages, many menabandon their homes in search of work in other parts ofBrazil.
The basic problem in the Nordeste appears to be one ofland ownership: an expanding population trying to sustainitself on a dwindling resource base. More and more, we hearabout the frequency and intensity of droughts, which is oftencorrelated with the discussions of changing climate. Thequestion remains open, however: Are we not witnessing theeffects of a change in land use rather than in the climate, asituation in which drought once again has followed the plow?
AUSTRALIA
Australia has a long history of drought. In 1982-83 itwitnessed its worst drought in more than a hundred years,with property and other losses estimated in the hundreds ofmillions of dollars. Brush-fires were rampant, consuminghomes as well as vegetation. One might wonder why adeveloped country such as Australia is still so vulnerable tothe impacts of drought.
Since the onset of European settlement in southeasternAustralia, regional industry has shifted from sheep ranchingto growing cereals and dairying. These early changes in landuse, often driven by market demands and prices, began aprocess of climatic vulnerability, which advanced with thesettling movement from the humid southern and easterncoasts toward the semi-arid and arid interior. In other words,human settlements were working their way down the rainfallgradients to regions where the climate was only barely
supportive. Population pressures mounted to put rangelandsunder the plow. As the wheat farmers moved down therainfall gradient, they encountered increasing likelihood ofdrought (Heathcote 1994). The influx of farmers was even-tually reversed, as many abandoned their land when theintermittent dry conditions, characteristic of the region,returned.
While government programs, which bought out farmerson the edge of bankruptcy, alleviated some of the pressureson the land, new technologies encouraged them to plantwheat. This reliance on wheat production further increasedtheir vulnerability in a region known to be drought-prone(Heathcote 1986).
The severity of drought-induced crises in New SouthWales can be attributed to the fact that farmers have movedinto such a region and have thus put themselves at risk. Thesame is true for livestock owners who overstock their rangesand make themselves equally vulnerable.
A variable climate in that area caused prospective farmersto believe the climate had changed in favor of sustainedagricultural or livestock production. Once drawn there,however, they were surprised by what they should haveexpected: a return to drier conditions. Yet, invariably, wetperiods in the arid and semi-arid interior of New SouthWales have lulled people into a false security, and whendrought returns, farmers believe themselves to be the victimsof a natural disaster.
CONCLUSION
The attempt to cultivate borderlands tends to marginalizeboth land and people. Most often, either a push or a pull intothese areas initiates the process. Tush' factors include popu-lation pressure, environmental degradation, and govern-ment policies. As populations continue to grow in developingcountries and especially in sub-Saharan Africa, the naturalper capita resource base decreases. If the best land is alreadyin production, new farmers must move into previouslyfarmed areas, which become further impoverished by over-use and misuse. Clearly, future generations will find it moreand more difficult to support themselves from the land at all.
The 'pull' factors are relatively few. As mentioned earlier,climates fluctuate, sometimes with long wet or dry spellsalternating. During wet periods in arid and semi-arid areas,the normally dry areas appear to be capable of sustainingagricultural production. Thus encouraged to move there,farmers often displace pastoral herders who have tradi-tionally used these areas as rangelands.
The idea that drought follows the plow is based on thebelief that increased pressures on currently used agriculturalareas cause population movement into less productive, oftenmarginal, areas. Consequently, we can expect to hear more in

128 III CLIMATE VARIABILITY AND VULNERABILITY
the future than we have in the past about droughts and theirimpacts on humankind (e.g. Glantz 1994).
R E F E R E N C E S
Brezhnev, L. 1978. The Virgin Lands. Moscow: Progress Publishers.Charney, W. J., Quick, S. H. and Kornfeld, J. 1977. A comparative study
of the effects of albedo change on drought in semiarid regions. Journalof Atmospheric Science 34:1366-85.
Glantz, M. H. (ed.) 1977. Politics of Natural Disaster: The Case of theSahel Drought. New York: Praeger.
Glantz, M. H. (ed.) 1994. Drought Follows the Plow: Cultivating
Marginal Areas. Cambridge: Cambridge University Press.Hall, A. 1978. Drought and Irrigation in North-East Brazil. Cambridge:
Cambridge University Press.Heathcote, R. L. 1986. Drought mitigation in Australia: reducing the
losses but not removing the hazard. Great Plains Quarterly 6:225-37.Heathcote, R. L. 1994. Australia. In Drought Follows the Plow: Cultivat-
ing Marginal Areas, ed. M. H. Glantz, pp. 91-102. Cambridge:Cambridge University Press.
Magalhaes, A. and Magee, P. 1994. The Brazilian Nordeste (Northeast).In Drought Follows the Plow: Cultivating Marginal Areas, ed. M. H.Glantz, pp. 59-76. Cambridge: Cambridge University Press.
Monod, T. (ed.) 1975. Pastoralism in Tropical Africa. London: OxfordUniversity Press.
Webb, W. P. 1931. The Great Plains. New York: Grosset & Dunlap.Winstanley, D. 1985. Africa in drought: A change of climate? Weather-
wise 38:75-81.

7: Amazonia and the Northeast: The Brazilian Tropicsand Sustainable Development
JAN BITOUN, LEONARDO GUIMARAES NETO and TANIABACELAR DE ARAUJO
INTRODUCTION
This paper examines the history of the relationship betweenBrazil's semi-arid Northeast and the tropical North, com-monly known as the Amazon region.* The comparisonprovides a basis for a broader discussion of the possibilitiesfor and constraints on sustainable development in the Ama-zon. The impetus for this study came from two sources. First,there is increasing international attention on development inthe Amazon, and second, the Amazon and Northeast regionsof tropical Brazil are becoming progressively more interde-pendent. Hence, it is time to question whether the scope ofthe present deliberations on the Amazon should be widenedand placed within the context of the region's relations withneighboring states as well as the political economy ofnational development policy.
This study examines the roles played by the Northeast andthe Amazon in the recent history of national development,and investigates the repercussions of changes in Braziliansociety on people's perceptions of these geographic regionsand of space in general. In particular, the chapter looks at thesocial and environmental impacts of changing developmentpolicies and associated demographics in the AmazonRegion. The analysis focuses on the last 30 years withreferences to earlier periods.
In the first section of the chapter, we discuss the historicalbackground of the perception that the two regions areperipheral to national development. Next the Northeast andthe Amazon are placed within their national context, focus-ing particularly on the economic and social processes defin-ing them as distinct regions. In the third section we explore
* The Amazon region, sometimes referred to as the North or the Northernregion, includes the states of Amazonas, Para, Amapa, Rondonia, Acre,Roraima and Tocantins. The term Northeast refers to the states ofMaranhao, Piaui, Ceara, Rio Grande do Norte, Paraiba, Pernambuco,Alagoas, Sergipe and Bahia.
the social and environmental impacts resulting from thesedistinctions. And in the final section we explore the signifi-cance of these historical interactions for the design of sustain-able development policy today.
The history of the relationship between the Northeast, theAmazon, and other regions of Brazil
Modernization as EuropeanizationThe Northeast and the Amazon regions of Brazil areofficially distinct political and administrative units. Until theearly twentieth century, however, they were viewed by manyBrazilians as a single region - indeed, they were groupedtogether as the vast wild 'North' in contrast to the smaller,more civilized 'South.' Although they share the commoncharacteristic of being frontier territories, there are distinctdifferences between the two regions. These differences havegrown in importance in recent decades.
This immense region did not undergo the systematicdevelopment which occurred in the Central West, the South-east and the South of Brazil. The latter areas, where the Stateset guidelines for infrastructure development and moderni-zation, were subject to intense European immigration.Instead, the 'North' was considered alien, in part because ofits distinct non-white population, but also because of itstropical climate and forests.
Race has been an important defining characteristic of theNorthern regions. According to the official commentator forthe 1920 census, Oliveira Vianna, Brazil's future dependedon the expansion of the white race - the only group capable ofguaranteeing the ultimate victory of civilization over nature.In a study entitled 'Evolution of the Race,' appended to the1920 census, he remarked that the process of'arianization' inthe North and Center was slow, but would ultimately becompleted given 'greater fertility of the White element,compared to that of the Negro, the Indian, and the Mestizo'
129

130 III CLIMATE VARIABILITY AND VULNERABILITY
He proclaimed that The population that emerges from theracial melting pot to which the Northeast was being sub-jected, shall be an Aryan dressed in our tropical attire; thesame being the case with the rest of the country' (OliveiraVianna 1922:344). Vianna ascribed to the Blacks and Indianswhat he called an 'ethnic chaos' which inhibited progress.Hence, with respect to the formation of a Brazilian nationalidentity, the elites considered the historical 'North' as infer-ior, in large part due to its undesirable concentration ofpopulations of non-European descent. With time, this racialdistinction was overcome.
Nature and development of the NorthIn addition to its ethnic characteristics, the 'North' was alsodistinguished by its natural features. The 1920 census dividedthe Brazilian territory into three climatic zones: (I) subtropi-cal (the region between the tenth parallel and the Tropic ofCapricorn); (II) temperate (south of the Tropic of Capri-corn); and (III) tropical (north of the tenth parallel).
The tropical zone included the Northeastern states locatednorth of the state of Bahia, and the states and territories ofAmazonia. Both regions were difficult to settle. From thepoint of view of the state, the main problem was how to settlepopulations permanently in tropical settings considerednaturally hostile to man. Since the Great Drought of 1877-9in the Northeastern sertdo (or 'hinterlands'), large out-migrations have placed pressure on neighboring regions. Theendless forests of the Amazon Basin were considered alogical destination for Northeastern outmigrants.
In practice, however, the settlers were unable to transformthe Amazonian environment into the stable and productivearea they sought. While describing the flow of Northeasterncolonizers moving into Acre in the Amazon region, OliveiraVianna wrote:
The Great Drought of 1877 caused the rugged cowhandsfrom Ceara to begin invading the Amazonian forests.Each fierce climatic cycle casts into these solitary forestscrowds of colonizers bearing prodigious physical resis-tance. The new environment in which they settle is entirelydifferent from that of their homeland: they trade a dry,warm and healthy climate and come to settle in a humid,unhealthy one; a landscape of bushes and xerophytes forone of forests and water and overwhelming vastness. Theintrepid people conquer this harsh land, establish commu-nities and turn Amazonia, for a brief moment, into acenter of wealth as active and important as the coffee-producing cultures established by the incomparable effortof the farmers of the South ...
There is, however, in the midst of this rapidly growingsociety, an inevitable instability inherent in the nature oftheir economic base - rubber tapping. This settler is notthere to become rooted to that land, but rather as a
transitory exploiter of the land's wealth, moving on as theyields of the rubber trees cease. (Oliveira Vianna1922:306)
In short, retaining as well as Europeanizing populationswithin these 'hostile' regions was of great concern to the statefrom early on.
Development and regionalizationAs the capacity of the state expanded and technologyimproved, a more precise knowledge of the Brazilian terri-tory emerged. When the authoritarian Getulio Vargasgovernment assumed power in 1937, it created the InstitutoBrasileiro de Geografia e Estatistica (the Brazilian Institutefor Geography and Statistics, IBGE) to organize economicplanning data and activities. The first major activity con-ducted by the IBGE in the late 1930s and the 1940s sought todevelop a stable statistical data base and cartographic surveyfor use by the government to help identify the nationalterritorial potential. The second major initiative undertakenby IBGE, at the end of the 1960s, was designed to provideguidelines for regional development policies and nationalintegration through the creation of a unified market.
In 'The regional repartition of Brazil' Guimaraes pro-posed that the concept of natural regions be used to divideBrazil for statistical and didactical purposes. This methodrelied on natural resource surveys to identify the definingcharacteristics of each region (Guimaraes 1941). Guimaraessuggested that the semi-arid climate be a decisive factor indelimiting the Northeast, and that the rain forests delimit theNorth, or Amazon region. In reality, this may not be themost accurate method for establishing regions as, for exam-ple, transitional rain forests are present in the western part ofthe Northeast, specifically in the states of Piaui and Maran-hao. Nevertheless, this characterization defined the primarydevelopment problems of each region. In the Northeast, thelack of water associated with the expanding population andincreased pressure on the land was viewed as the principalcause of poverty. In the Amazon region, the lack of transpor-tation and communication infrastructure was considered themajor restriction on the exploitation of 'inexhaustible'natural resources.
Subsequently, the state identified differences between theNorthern regions and the South other than simply physicalgeography, and a new approach to regional definition anddevelopment was sought. Studies of the national urbannetwork during the early 1970s classified the Northeast andthe Amazon as 'peripheral zones,' in contrast to the moredeveloped 'Center,' hence, industrialization and the fasterdistribution of goods determined the new contours of Brazi-lian geography. Urban transportation networks were envi-sioned as the vector for this diffusion of innovation andmanufactured commodities (Faissol 1973).

7 AMAZONIA AND NORTHEAST BRAZIL 131
Faissol, in his article entitled 'The Brazilian urbansystem,' placed the central development nucleus around SaoPaulo and relegated the relatively underdeveloped areas ofthe interior of the Northeast, the Great Amazonian Regionand the Center-West to the periphery. Faissol was concernedwith the problems of national integration. The structure ofthe sub-system in peripheral areas is characterized by lowrates of urbanization and the diffuse power of mid-sized andsmall cities; this was the target of the urban developmentpolicy - to establish relations of greater reciprocity betweenthe two great areas [of northern and southern Brazil]'(Faissol 1973).
The Northeast and Amazon regions continued to beregarded as an aggregate in spite of sharp differences in theformation of their social and physical settings. A policy thatconsidered the Northeast and the North as a single unit couldnot possibly take into account the complex social andenvironmental conditions of these regions. It is in examiningtheir differences, however, that the characterization of theNortheastern and the Amazon regions and regional policiesmust be sought.
The emerging regional vision and development institutionThe Northeast was defined and integrated into the nationalidentity much earlier than the Amazon. Freyre, in his'Regional Manifesto,' and subsequent works, clearly dis-cussed the basis of Northeastern social formation and itsimportance in defining Brazilian identity (Freyre 1937). Thegeographer, de Andrade, observed in his text The Land andMan in the Northeast that it was the organizational rules ofthe great sugar-producing plantations of the Northeast thatdecisively characterized land use and social relations in theregion (Andrade 1963). In the late 1950s, the rural socialmovement for agrarian reform shifted the debate on regionalproblems from a theoretical to a political concern. In 1959the Superintendencia do Desenvolvimento do Nordeste(Superintendency for the Development of the Northeast,SUDENE) was created to direct development in the regionby orienting investments which supported national goalswith fiscal incentives.
The Superintendencia para o Desenvolvimento da Ama-zonia (Superintendency for the Development of Amazonia,SUDAM), the parallel organization for Amazonia, wasfounded 10 years later. Urban development, which wasconsidered strategically important for national economicdevelopment, was to be facilitated by these organizations.Industrial poles were created in the larger cities of theNortheast and a Free Trade Zone was established inManaus, aimed at making that city an urban pole forWestern Amazonia.
The emphasis on urban development integrated the pre-vious perceptions of each region. In the Northeast, irrigation
projects in the Great Sao Francisco Valley were of primeconcern; in the Amazon region, infrastructure constructionwas considered the key to opening the new 'frontier,' wherepeople, lured by easy access to land, would become the laborforce with which to exploit the unlimited natural resources.In the 1970 National Integration Plan, the two regions wereviewed as complementary: the Northeast would supply laborand the Amazon region would supply land and naturalresources. The linkage was made between Amazonian devel-opment and the poverty problems of the Northeast (Pana-gides and Magalhaes 1974).
THE NORTHEAST AND THE AMAZONREGION WITHIN THE NATIONALECONOMY
Recent economic processes
Although the Northeast and the Amazon Regions have beenregarded as a single region in Brazilian history, they haveplayed different roles. Beginning in the sixteenth century, atthe zenith of colonial Brazil, the Northeast was the firstregion to experience economic development. This develop-ment was centered on the sugarcane industry, which stillplays an important role in the economies of the Northeasternstates of Alagoas, Pernambuco, Paraiba and Rio Grande doNorte. The Amazon region developed later with the adventof rubber tapping, which prospered in the late nineteenthcentury. The rubber boom lasted less than half a century(1870 to 1920), but prompted the first surge of migrationfrom the Northeast to the Amazon. During that period,Manaus, the capital of the province of Amazonas, grew froma village of 300 to a 'metropolis' of 75000 people, becomingone of the ten largest cities in Brazil (Lacerda de Melo andMoura 1990:33). The flow of population between the tworegions, which began at this time, still persists.
In the late 1950s, Brazil sought to integrate into the worldeconomy by becoming a major world power. Under theslogan 'Brasil Grande Potencia' (Brazil Great Power), thegovernment initiated major industrialization and develop-ment efforts, launching Brazil into the category of a newlyindustrialized country (NIC). This economic and technologi-cal surge was accomplished with significant support from themultinational and international financial community. The 20years between 1955 and 1975 were marked by great economicexpansion and the intense modernization of Brazil. TheBrazilian government took an active role in investments,subsidies, market protection and regulation. This develop-ment was accompanied by rapid urbanization as well asgreater concentration of wealth and power.
During this rapid economic transformation, the variousregions became increasingly interdependent, and local and

132 III CLIMATE VARIABILITY AND VULNERABILITY
regional economies were integrated, although regional pro-ductive structures remained relatively distinct. Thus, theNortheast and Amazon regions have been affected in recentyears by the overall changes imposed by urban-industrialeconomic consolidation, which is dominated by oligopolisticfirms. A study of the Brazilian national economy in recentdecades concluded that regional development in Brazil hasbeen denned by the industrialization projects developed inBrazil after 1955 and the oligopolistic economic concent-ration characteristic of this development (FUNDAJ 1990).
Guimaraes Neto's regional economic analysis identifiedfour processes, listed below, that have had significant effectson economic life in each of the Brazilian regions (GuimaraesNeto 1990a: 131-164).
1. Market expansionIn the 1950s and 1960s, industries based in Sao Paulobroadened their commercial base by seeking markets in otherregions. These regions were unable to accumulate enoughlocal capital to foster any inter-regional competition withSao Paulo's industry. The Brazilian government intervened,whenever possible, to stimulate the modernization of localindustries. For example, SUDENE successfully stimulatedthe traditional textile industry of the Northeast. By the end ofthe 1950s, however, regional industries were faced with adilemma: modernize and 'de-regionalize,' or become extinct.The North experienced a similar situation: the industrializedurban centers of the region and their peripheral markets weresaturated by industrial production from Rio de Janeiro andSao Paulo.
2. Economic integrationThe integration of production, which predominated in the1970s, was based on the regionalization of the large publicand private oligopolies. This process did not eliminate thebroadening of the commercial base, but rather overlappedand even reinforced the flow of commodities among thevarious Brazilian regions. The State boosted the productiveintegration of these regions through fiscal and financialincentives, particularly in the case of the Amazon and theNortheast (Araujo 1982).
With the flow of large capital investments, the less-indus-trialized regions experienced important changes. First, typi-cal capitalist relations of production were introduced into theregions. Second, because the growth and modernization ofthe economies of the North, the Northeast and the Center-West were based on outside capital which exceeded theresources available to local agents, these areas experiencedrapid and intense change. Finally, the dynamic economies ofthe so-called 'peripheral regions' were tied, during expansionand crisis, to the overall dynamism of the Brazilian economywhich was dominated by the Southeast. Therefore, instead of
the 'traditional' model of regional economies dominated byagrarian export production, Brazil developed into a 'region-ally localized national economy' (Oliveira 1977), whosegrowth, stagnation or recession affected multiple regions inunified waves.
3. Physical and territorial integrationThe importance of physical and territorial integration for therelationship between the North and the Northeast will bediscussed in detail below. It is worth noting, however, thatthe desire for consolidation of the internal market in con-junction with strategic military interests, propelled the devel-opment of the national transportation and communicationsystems linking remote regions of the country. This integ-ration made possible the opening of resource frontiers andintensified migration, with significant consequences in theNorth and the Northeast.
4. Inclusion in the world economyBrazil's determination to be included in the world economy,characteristic of the period known as 'the Brazilian economicmiracle', was in part a result of the need to generate surplusesto service the external debt. Public enterprises and thegovernment actively encouraged exports, reinforcing the'regionalization' of capital, prompted first by the internalmarket growth. Evidence of this regional process includes themodernization and re-orientation of agriculture in the stateof Parana; expansion of grain agriculture within the Center-West; and the exploitation of mineral resources in the North,particularly in the state of Para, and in the Northeastern stateof Maranhao.
In conclusion, the processes described above and Brazil'sdynamic economy changed the regional productive struc-tures of both the North and the Northeast, as well as otherregions of Brazil. The modernization and consolidation ofindustry expanded tertiary activities which in turn increasedthe rate of urbanization and created successive waves ofmigration from the Northeast and South into the AmazonRegion, as illustrated in Table 1.
Economic decentralization
Both early twentieth century industrialization and the devel-opment of heavy industry in 1955-75 were focused in theSoutheast. During the recent cycle of economic expansion(1955-75), and the subsequent economic slow-down andcrisis, there were strong counter-tendencies to this geo-graphic concentration. The Northeast and the Amazon wereparticipants in this decentralization process.
IBGE figures show that, between 1970 and 1985, theSoutheastern share of the Gross Domestic Product dec-

7 AMAZONIA AND NORTHEAST BRAZIL 133
Table 1. Brazil, the Northeast and the Amazon: population and production ratios, 1960-85 (%)
1960
20.727.751.644.755.3
Brazil
1970
11.230.458.456.044.057.7
1980
9.737.250.667.632.470.1
1985
10.135.557.572.028.074.1
1960
24.617.058.437.462.6
Northeast
1970
18.715.366.045.154.943.0
1980
16.137.246.751.748.356.8
1985
——53.546.5
1960
40.214.445.433.966.1
Amazon
1970
19.415.165.441.858.237.5
1980
16.330.353.450.549.550.1
1985
16.230.153.445.454.656.4
Agricultural product/total GDPIndustrial product/total GDPTertiary product/total GDPUrban population/total populationRural population/total populationUrban EAP/total EAP
Note: GDP, gross domestic product; EAP, economically active population.Sources: FGV/IBGE, National Accounts (up to 1980) for the regions and every year for Brazil; SUDENE for the Northeastsince 1985; IBGE, Demographic Census; PNAB 1985; Annual Statistics for 1987.
reased from 65% to 58%, while increases were registered inthe Amazon (2.2% to 4.3%), the Northeast (12% to 13.5%)and the Center-West (3.7% to 6.3%). The South maintainedits share at about 17%. Geographic concentration of indus-trial activity is still an important aspect of the Brazilianeconomy, however. An IBGE study, based on 1980 censusfigures (IBGE 1990), showed that only 12 urban centers inBrazil have an Industrial Value Added (IVA) tax thatexceeds 1 % of the national total. Together, these centerscomprise nearly two-thirds of the country's industry, withthe Sao Paulo metropolitan region alone generating one-third of the national IVA. Among these 12 centers, two arelocated in the Northeast (Salvador and Recife) and one in theAmazon (Manaus) (Fig. 1).
Examples of recent decentralization in these regionsinclude:
(1) Establishment of a chemical industry zone in the Northeast,between Salvador and Maceio. This zone includes Bahia'spetrochemical growth pole, the integrated base complex inSergipe, and the chloro-chemical pole in Alagoas. In 1980,Salvador accounted for 12% of the national chemicalindustry's IVA, exceeded only by Sao Paulo whichaccounted for 21%.
(2) Establishment, in Manaus, of an important pole for themanufacture of durable consumer goods. With 13% of thenational output of electric and communication materials,Manaus ranks second only to the Sao Paulo metropolitanregion (which produces 51%).
(3) Development of Recife's plastics products industry (3.7%of total IVA), ranking fifth in the country. For electric andcommunications materials, Recife accounts for 1.7% of thenational IVA, ranking eighth.
(4) Establishment of the mining and metallurgical complex atCarajas in the Amazon, with another center in the North-east, in the state of Maranhao.
(5) Beverage production in Recife (fourth-ranked producer
holding 4% of the national IVA) and Salvador, in theNortheast, and in Belem in the Amazon (sixth-rankedproducer with 3.2% of the IVA).
(6) The mining industry in the Amazon (Amazonas and Parastates) and the growing timber industry in the region.
For decades the Southeast has been losing its relativeimportance in agriculture and livestock production. In the1950s, the South accounted for 55% of the country's outputof agriculture and livestock. In the 1980s, however, this sharefell to one-third of the Brazilian total. By contrast, the South,the Central-West and the Amazon region have becomeprogressively more important producers, together account-ing for nearly half of the national output. The Northeast'sshare of the national output in agriculture and livestock hasnot changed significantly. Agricultural output in the Ama-zon has recently increased, however, due to the incorpora-tion of new agricultural areas in the Amazon Basin and in theCerrado. In the 1970s alone, nearly 71 million hectares ofnew agricultural area were brought into production. Theseareas were located mainly in the Central-West and in thenorth and west of the states of Maranhao and Bahia.
Finally, it is worth noting that these trends in the decentra-lization of industry may not continue in the near future(Cano 1989). In the manufacturing sector, for instance, newtechnologies aimed at saving labor, energy and conventionalraw materials (especially in the steel, aluminum, paper, andcellulose industries) may affect the Amazon and the North-east, whose comparative advantage has been cheap labor. Onthe other hand, it is likely that new sectors, such as infor-mation technology and micro-electronics, will concentrate inthe Southeast where the physical infrastructure and level ofeducation are considerably higher than in the Amazon andthe Northeast.
In summary, the Amazon and the Northeast have exper-ienced the following trends in recent years:

134 III CLIMATE VARIABILITY AND VULNERABILITY
Fortaleza
Passoa
Manau*
•NORTH
/SOD-RIO GRANDE
DO SUL
V /(
V?/w
SANTA \rARINA \
FH •)
/) /Porto
/
Fiorianopolis
Alegre
125
1 :25.000.
0km 2^0
000
5pO 750
Figure 1: Regions and states of Brazil.
(1) Growth, diversification, and modernization of their pro-ductive base; and increases in their share of the country'seconomic output from 14% to 18% of total product.
(2) An inflow of public investments and private capital fromnational and foreign sources (Fig. 2). In the Amazon, theseinvestments were directed at the extractive and manufactur-ing industries. The Northeast received investment in theseareas, as well as in transportation and storage services.
(3) Greater 'outward' integration of their regional spaces, asa result of strong efforts to consolidate the national internalBrazilian market. These efforts have increased consumptionof consumer goods. Integration has also been strengthenedby the 'regionalization' of large-scale capital investments.Figures available for inter-regional trade in 1980 show, for
instance, that the Northeast exported mainly to the South-east and South, which bought 83% and 10%, respectively, ofgoods produced in the Northeast. Of all commoditiesimported by the Northeast, 85% originated in the Southeastand 11% in the South. By comparison only 5.4% of theNortheast's output was exported to the Amazon, and thisregion supplied only 2.2% of Northeastern imports(SUDENE 1985).
As illustrated, the Northeast had a surplus domestic tradebalance with the Amazon. In 1980, the region sold 48% morethan it purchased from its neighbor. Northeast exports to theAmazon included: plastic, tobacco, sugar, machinery andelectrical equipment, mechanical instruments, clothing andtextile accessories. Northeast imports from this region

7 AMAZONIA AND NORTHEAST BRAZIL 135
800 - |
600 -
400 _
200 -
NORTH NORTHEAST SOUTHEAST SOUTH MID-WEST
11977 1987
Figure 2: Location of the 1000 largest companies in Brazil, 1977and 1987.
included: wood and wooden products, tobacco, machineryand electronic equipment, textile articles, ceramic products,vegetable textile fibers and cereals. The most dynamic devel-opment poles in the Northeast are increasingly integrated tothe Southeast's economy, however. Examples include thechloro-chemical and petro-chemical complexes, the metal-mechanical industries, the clothing and textile operations,the mining-metallurgical complexes, and agro-industrial andgrain operations (Duarte 1990). The strong backwardlinkage of the new intermediate products industries to thenatural resource base in the Northeast is important tohighlight (Souza 1986:60-3).
In the Amazon, the agricultural, cattle-ranching, mining,and extractive forestry industries likewise are anchored in theregional resource base. Nevertheless, the modern and dyna-mic production of durable consumption goods, localized inManaus, demonstrates a very fragile articulation, regardingthe creation of income and the generation of employment,with the lecal economic base.
(4) Economic integration among states and the developmentof complementary activities. Examples of these cases are: themining-metallurgical complex of Carajas which encom-passes the states of Para and Maranhao, the expansion oflarge subsidized agricultural and cattle-ranching projects(located in the western part of the Northeast and in theeastern part of the Amazon), and the growth of timberexploitation, the furniture industry and construction within
these two regions. The development of energy generationoperations in the Amazon, primarily for the purposes ofindustrial consumption in the Northeast, constitutes anotherexample of the linkage between these two areas.
In the 1960s and 1970s, small farmers from the Amazonand the Northeast shared in the production of grains,especially low-quality rice. The southern parts of Para andMaranhao ranked fifth in national rice production. Accord-ing to the Superintendencia Nacional do Abastecimento(National Supply Superintendency, SUNAB), this rice wasdestined for consumption by the low-income strata of bothregions; but it also reached the markets in the Southeast(according to Cibrazem's figures, it provided 10% of Rio deJaneiro's consumption), as cited by Guilherme Velho(1972:123).
Migration, facilitated in large part by improvements intransportation, has been the most intense and significantlinkage between the Amazon and the Northeast. The causesand consequences of this migration will be analyzed in thefollowing sections.
Physical and territorial integration
The process of migration between the Northeast and theAmazon preceded the development of a viable road network.Improved infrastructure, however, has secured the linkbetween the two regions and has increased the volume andfrequency of these migrations. In addition, migration hasalso tended to concentrate in particular areas of the Amazon,exerting more pressure on them (Fig. 3).
Migration from the Northeast to the Amazon region washistorically facilitated by two 'natural' means of transpor-tation. Seafarers arriving in Belem proceeded upstream anddispersed throughout the Amazon river basin in search oflatex and other extractive forest products. This migratorypattern played a major role in the deforestation and agricul-tural exploitation of the region of Bragantina, located to theeast of Belem. Further to the east, in Maranhao, colonies ofsettlers formed within the forested areas along rivers such asthe Mearim and the Pindare. Within Maranhao, Andradeidentified a second migration route established by cattleranchers heading south in the direction of the cerrados (asparse type of dryland vegetation), between the Parnaiba andTocantins rivers. Large ranches were established along thetrails linking Floriano (Piaui) and Carolina (Maranhao)(Andrade 1977).
Reaching the Tocantins, this 'cattle front' became thesecond link between the Northeast and the Amazon. It drewmigrants who settled throughout the forested areas northand west of Carolina. The opening of a trail which followedthe telegraph line between the Pindare and Tocantins basins

136 III CLIMATE VARIABILITY AND VULNERABILITY
vO ^ \ REOIAO
; BRAOAHTINA• * • • • • • • • • • • .
-̂— \ « " • • •
«. . MARITIME NAVIGATION
,*_ -*_ CATTLE ADVANCE FROM THE SEMI-ARID NORTHEAST TOWARDS TOCANTINS
BIG HIGHWAY AXES
H I | | | RAILWAY CARAJAS- ITAQUI AND NORTH-SOUTH
DAMS AND ENERGY TRANSPORTATION LINES
• BIG INDUSTRIAL ENTERPRISES
INTERNATIONAL FRONTIERSSTATE LIMITS
Figure 3: The physicoterritorial integration of Amazonia and the Northeast.
(linking the cities of Grajau and Imperatriz) strengthenedthis migratory trend.
The more recent changes in migration patterns, and in thephysical and territorial integration of these two regions, werecaused by the construction of major highways under the 1944National Highway Plan. This plan was designed in responseto strategic concerns regarding national security and was
implemented in the Amazon under the military government.The newly opened highway corridors directed and concen-trated the flow of migrants, beginning in the 1960s. Inaddition, the construction projects attracted laborers, manyof whom remained in the region after the conclusion of theprojects.
In this context, it is worth noting the roles played by the

7 AMAZONIA AND NORTHEAST BRAZIL 137
Para-Maranhao and the Belem-Brasilia highways. ThePara-Maranhao road linked the Bragantina region of Parato the Pindare valley in Maranhao, thereby replacing the searoute between these two states. The Amazonian segment ofthe Belem-Brasilia highway offers an alternative route to theold river axis of the Tocantins, which linked Estreito to theoutskirts of Belem. The Transamazonian highway, imple-mented by the National Integration Plan of the early 1970s,constituted, in its northeastern segment (from Cabedelo toEstreito), the second link between the two regions. In stretch-ing as far westward as Altamira and Itaituba, it transformedthe region around Estreito-Imperatriz into a base for thesettlement of the Belem-Brasilia highway (paved in 1973)and provided further consolidation of the region with theopening of the Santa Ines-Acailandia highway, paved duringthe 1980s.
Migration was also fostered by large hydro projects aimedat harnessing the power of the Amazon basin rivers andsupporting the mining resources of Carajas. These projectsdrew mostly on labor from the middle Tocantins, as well aslabor moving along the Belem-Brasilia axis. Major projectsin the Amazon region include the Tucurui dam and thetransmission lines linking Boa Esperanca (CHESF), Tucurui(ELETRONORTE) and Barcarena-Belem; iron mining inCarajas; and the construction of the Carajas-Itaqui/SaoLuis do Maranhao railway (via Acailandia).
The large influx of migrants has given rise to frequentdisputes regarding access to land in the area, which haveoften turned violent. The pressures bringing migrants intothe Amazon region have resulted in a range of social,economic and environmental problems, many of which raisepolitically sensitive issues. This process was epitomized bythe gold panning at Serra Pelada; now that Serra Pelada isclosed, other areas are creating the same problems.
The development of large highways and large public worksprojects has progressively transformed the Eastern Amazoninto a region where Northeastern migrants are providinglabor and settling alongside the highways, under the powertransmission lines, and around large state-owned projects.This physical and territorial integration of the region has not,however, been met with commensurate economic and socialdevelopment. As mentioned previously, the two regionsdeveloped a greater outward integration rather than aninward one. The Belem-Brasilia highway, the North-Southrailway project and the export-oriented nature of the Itaquiand Barcarena ports, contribute more to national and inter-national linkages than inter-regional relations between theNortheast and the Amazon.
Inter-regional relations and public investment in infra-structure have made migration to the Amazon from theNortheast and the South possible. They have also created aterritory from which resources of national and international
value have been drained. Access to the tremendous resourcesof the Amazon and the use of Northeastern labor for theirexploitation have not generally benefited the population ofthese two regions despite the integration of these regions intothe national and global economy.
Patterns of migration
The intense migration to the Amazon from the Northeast inrecent years is only the most recent manifestation of a long-standing pattern. Furtado, in his Formaqao Economica doBrasil (Economic Formation of Brazil), related migration tolabor history, and compared the flow of people from theNortheast to the Amazon in the late 1800s to the simulta-neous patterns of migration from Europe to Brazil. Theintense demand for rubber, associated with the production ofthe internal combustion engine, focused attention on theeconomic potential of the Amazonian region and boostedthe demand for labor for rubber extraction and processing.Rubber prices increased ten-fold and generated a significantincrease in production from 6 thousand tons during the1870s, to 11 thousand in the 1880s, and to 35 thousand tonsin the first decade of the twentieth century. The authorestimated that, between the beginning of the boom and thefirst decades of the twentieth century, approximately 500000people from the Northeast migrated to the Amazon.
The reservoir of labor existing in the interior of theNortheast proved invaluable in meeting this intensive labordemand in the Amazon. This migration was not only inresponse to an intense demand for labor. The prolonged1877-80 drought, which destroyed almost all of the cattleand subsistence agriculture, was, as noted by Furtado,cleverly utilized to direct migrants, who were offered orga-nized support services, subsidies for transportation andpropaganda to attract them into the Amazon. Even at thepeak of the demand for labor, however, the condition of themigrants, who generally arrived indebted and indentured,can only be considered a form of serfdom. During thedrought crisis, misery was generalized and the migrant's lifewas degraded to the most primitive subsistence conditions(Furtado 1977).
Since that time, the factors determining migration to theAmazon have been, on the one hand, the physical andterritorial integration of the region with the rest of Brazil andthe expansion of the agricultural and industrial frontiers,and, on the other hand, recurring drought and chronicunderdevelopment that actively pushed people into theregion.
Origins of migration to the AmazonA superficial analysis shows that migration from severalregions in Brazil toward the Amazon is relatively small in

138 III CLIMATE VARIABILITY AND VULNERABILITY
relation to the flows moving to regions such as the Southeast.These flows, however, are growing steadily with each 10-yearcensus period. There were 487200 Northeast immigrantsliving in the Amazon in 1980; in the Southeast, which hasbeen the traditional destination of immigrants from theNortheast, the number in the same year was 4.3 million, outof which 2.9 million alone resided in the state of Sao Paulo.
It is estimated that migration to the Amazon and itsfrontier grew significantly during the 1980s as a result of therecession and deepening social crisis (the so-called 'lostdecade') that hit Brazil, particularly the urban economy ofthe Southeast. Unfortunately, 1991 census figures are not yetavailable to show the extent of this flow. Migration towardthe Southeast has declined and many of the migrants in thisdirection are ending up in the Amazon frontier region.Figures from the Ministry of Labor used as indicators forformal urban employment show that the employment levelsstagnated during the period 1979-88 in Sao Paulo and Rio deJaneiro. Rio experienced an employment decline of 2.3%during this period while Sao Paulo experienced a negligibleincrease of 6.8% (Guimaraes Neto 19906).
Preliminary figures from the Agricultural Census of 1985,when compared with the 1980 census figures, show that theexpansion of rural employment and of small agriculturalestablishments were still significant. The number of peopleemployed in the Amazon increased from 1.78 million in 1980to 2.23 million in 1985, a yearly increase of 4.6%. Between1970 and 1980 the increase averaged 6.2%. The number ofrural establishments smaller than 100 hectares increasedfrom 336300 to 414000 between 1980 and 1985, a yearlyincrease of 4.2%. The area occupied by these establishments,however, increased from 7.3 million to 9.9 million hectares, ayearly increase of 6.3%.
The preliminary figures from the 1991 Demographic Cen-sus show significant population increases in the Amazon, incontrast to a decrease in the national population growth ratefrom 2.5% for the period 1970-80, to 1.9% for 1980-91. Thepopulation of the state of Rondonia, for instance, increasedat a yearly rate of 7.9% between 1980 and 1991, Roraima9.6%, Amazonas 3.5%, Para 3.7%, Amapa 4.7%, and Acre3% (Table 2).
There are several complex processes that explain themigration patterns to the Amazon. Migration from theNortheast can be explained by a number of factors whichinclude drought, the land-tenure structure, the changes ineconomic activity which resulted in reduction in the rurallabor demand, and the need for employment outside theregion.
During the 1970s, three long periods of drought hadsignificant impact on production and population of the semi-arid (sertdo) Northeast (Fig. 4). The drought in 1970 forced500000 people to join public works projects; drought was
Table 2. Amazon region: recent population growth, 1980-1
Northern regionRondoniaAcreAmazonasRoraimaParaAmapa
Brazil
Population
1980
5 800491301
143079
3403175
119003
(1000)
1991
92261130417
2089216
5084298
146154
Annualrate(%)
4834
1045
2
Source: IBGE, Demographic Census.
repeated in 1976 and in the early 1980s (1979-83). The latter
forced the enlistment of 2.7 million people at government
work projects, representing nearly one-third of the economi-
cally active rural population of the semi-arid zones. This
triple climate-induced disruption of the rural economy
within a decade, which affected half the region's population
(17.9 million people), surely accelerated outmigration from
both the rural and urban areas of the Northeast (Carvalho
1988).
The second critical factor contributing to underdevelop-
ment and the relatively low labor absorption in the North-
east is the pattern of land ownership. It is important to
consider questions related to land use not in isolation but in
conjunction with the concentration of capital and economic
power brought about by the structure of land tenure in the
region (Andrade 1963; Figueroa 1977; Carvalho 1988; Pes-
soa 1990). The lack of access to official financial resources,
the low levels of education, the absence of effective associa-
tions or cooperatives to strengthen their bargaining power,
the barriers to access to land, and the general weakness of
civil society keep the small farmer in a permanently tenuous
condition, particularly in the face of adverse climatic con-
ditions and the existing structure of production in the region.
This prevailing structure of concentrated ownership and
economic power stifles opportunity for change and provides
the large landowner, the merchant and the financial agent
with conditions to appropriate significant shares of small-
farm production. The proletarianization of the sugarcane
workers and the spread of cattle ranching activities in areas
traditionally under subsistence agriculture precipitated the
expulsion of workers from these rural zones (Lacerda de
Melo 1976).
The construction of the major highways facilitated the
exodus from the Northeast. Beginning in the 1950s, and
continuing throughout the height of highway construction in

7 AMAZONIA AND NORTHEAST BRAZIL 139
48° 46° 44° 42° 4CP 38° 36° 34°
MHO NORTH
SERTAO
A6RESTE
MATA
FORTALEZA
[ NATAL
-2°
-.4°
6°
10°
-12°
- 14°
I6C
1:12.000.000
75 Ohm 150 300
AZIMUTAL CONFORM.
SOURCE ANDRADE, MANUEL CORREIA DE A TERRA E 0 HOMEM NO NORDESTE
Figure 4: Geographic zones of the Northeast of Brazil.

140 III CLIMATE VARIABILITY AND VULNERABILITY
the 1970s, the settling of the transverse axis of the Transama-zonian highway and of the Perimetral Norte, and the intra-regional axis such as the Cuiaba-Santarem and Porto Velho-Manaus highways, was a key objective of the NationalIntegration Program (PIN) (Becker 1990).
The accelerated transformation of other Brazilian regions,particularly the South and the Southeast, further affectedmigration patterns from the Northeast. The 1970s 'economicmiracle,' and the concentration of industrial activities in theSouth, brought about radical transformations in productiveprocesses and in labor relations, especially in rural areas. Inconjunction with these changes came a further concentrationof land ownership, and the substitution of labor-intensivecrops for capital-intensive crops such as soya. As a result, therural exodus was accelerated and small farmers who couldnot afford to modernize, migrated to the urban centers of theSouth and the Southeast, and the dynamic rural zones of theCentral-West and the Amazon (Martine and Camargo 1984;Taschner and Bogus 1986).
Despite the growth of migration to the Amazon from theBrazilian South, Northeasterners constituted the mostnumerous group emigrating to the Amazon. Moura andSantos (1990) studied the intensity of emigration from themicro-regions of the Northeast during the 1970s. The areasof highest intensity are: (1) the eastern frontier of Maranhao;(2) the state of Ceara and the micro-regions of Campo Maiorand Valenca in Piaui, and Paraiba (Sertao da Cajazeira andDepressao do Alto Piranha); (3) 'in the part of the agreste (anintermediary type of ecological region found between sertaoand the tropical coastal forests) located in the state ofPernambuco... extending as far as the state of Alagoas,' and(4) the southern part of the interior of Bahia (Moura andSantos 1990). Those Northeasterners who headed to theAmazon went first to the state of Para and secondly toRondonia. Immigrants originating in the South and South-east generally went to Rondonia or Para. Those from theCenter-West followed a similar pattern to that of theNortheasterners.
There were three major migrations to the Amazon: onefrom the Northeast to the state of Para (73% of the total);one from the South and Southeast to the state of Rondonia(58% from the Southeast and 74% from the South), and onefrom the Center-West to the state of Para (62%). Para wasthe most attractive destination, receiving 56% of this total,followed by Rondonia with 33%. Preliminary data for the1980s indicate that Rondonia emerged as the preferreddestination in that period (Fig. 5).
Maranhao and Ceara contributed more than two-thirds ofthe emigrants arriving in the Amazon region during recentdecades. Maranhao had until recently itself been a destina-tion of intense migration originating in the semi-arid zones,where the concentrated land-owning structure of the North-
Figure 5: Migration flows for the northern region of Brazil, 1990.ths., thousand. (Source: Historical Statistics of Brazil, IBGE1987.)
east was reproduced and further contributed to the expulsionof people toward the Amazon.
In summary, the factors that precipitated migration to the'frontier' of the Amazon were (1) the opening and consoli-dation of the highway network; (2) failure to develop andimprove living conditions in the semi-arid regions of theNortheast, and to offset the devastating impact of therecurring droughts; (3) the inability to solve the problems ofagrarian organization and concentration of land ownership;and (4) the inability of urban centers in the Northeast andother regions to absorb the growing labor force whichincluded those who were expelled from the rural zones andthose who already lived in urban centers who could not findemployment in industry or services. In brief, the persistentvulnerability to climatic variations and chronic underdevel-opment of the Northeast region, together with the overalldeterioration of Brazil's economic situation, made the Ama-zon an attractive destination to those 'expelled' from theNortheast and other regions.
THE SOCIAL AND ENVIRONMENTALIMPACTS OF THE INTEGRATION OF THENORTHEAST AND THE AMAZON
In earlier sections of this chapter, we argued that the indus-trialization of the Brazilian economy and consolidation of amore unified domestic market brought about the regional

7 AMAZONIA AND NORTHEAST BRAZIL 141
integration of Brazil. This transformation reinforced thelinks among the Amazon, Northeast, the rest of the country,and the world economy. It resulted, as well, in the develop-ment of economic complexes and large enterprises in theAmazon and Northeast. The physical and territorial integ-ration brought about by highway construction and theimplementation of large development projects in the Ama-zon and Northeast, facilitated migration into the Amazon.This migration had considerable impact on social and envir-onmental conditions in both regions; the following sectionsof this study will examine these impacts.
It is not possible to isolate the social and environmentalimpacts related to any single emigration episode. Nonethe-less, by looking at the destinations chosen by a particulargroup of emigrants and the prevailing type of occupationfound within the new communities, some important infer-ences will be drawn out here about who migrates from theNortheast, their living conditions, and their relationship withthe Amazonian physical and biological environment.
Social impacts
Some preliminary considerations must be taken into accountbefore a specific analysis of the social impact of migration tothe Amazon from the Northeast can be made. First, mig-ration in past decades took place in what were considereddemographically empty spaces. In recent decades, this hasnot been the case. Regardless of their origin, migrants to theAmazon will confront a set of established interests, includinga pattern of land ownership and concentration of wealtheven more accentuated than in the places they left behind.This process has important implications for the kind of laborrelations and opportunities migrants face. According to the1985 Agricultural Census in the Amazon region in 1980, 577rural establishments larger than 5000 hectares (0.1% of thetotal number in the region) covered 31% of the total areaoccupied by all regional establishments (nearly 14 millionhectares). Twenty-two establishments larger than 100000hectares totalled 6 million hectares. In contrast, 229600establishments smaller than 20 hectares, 46% of the agricul-tural establishments in the region, occupied a mere 3.3% ofthe total area surveyed by the census.
To a large extent this extremely unequal distribution ofland is a consequence of the inability of the Brazilian State toexert even minimal control over the direction and organiza-tion of settlements in the Amazon. This lack of state manage-ment of migration in the region has led to growing conflictsover land in the states of Maranhao, Para, Mato Grosso andRondonia, involving 82000 families and an area of about 5.7million hectares (Becker 1990:40). At the heart of theseconflicts lies the appropriation of land by agricultural and
cattle ranching enterprises, farmers, Indians, tenants, col-onizers and former farmers, together with the agents of thelarge landowners, speculators and opportunists. These con-flicts are over Indian lands, unoccupied government-ownedlands, and lands destined for official settlement programs.Timber interests seeking to access lands belonging toIndians, tenants, settlers and rubber tappers have also aggra-vated these conflicts (Becker 1990:41, 42).
Agriculture and cattle ranching in the region, in thecontext of an extremely unequal agrarian structure, relies onthe appropriation of land rather than on improvements intechniques to increase productivity (Kageyama 1986:181).The capital-poor migrants from the Northeast - the greatmajority of settlers - sought to establish small family produc-tion units, either by accessing land directly on the expandingAmazonian frontier, or through a landowner. Most migrantsalso work for wages. Jobs are usually temporary and mayabsorb small farmers who seek them as a complementarysource of income. The wage market, however, consists of arecruitment chain involving agents (known as gatos orgateiros) who act as team leaders and price their middlemanservices at half the wages of each worker. These wage jobsusually consist of field mowing for individual farms andcompanies, and rice harvesting.
In a 1990 study, Becker found that the majority ofmigrants in the Eastern Amazon were from the rural North-east. She pointed out that though the mobility of theNortheast migrants allowed a more efficient use of capital,from the point of view of the migrant such migrationgenerally implied instability and exploitation. In her words,mobility creates 'difficulties in organizing political action andtrade unions. Nevertheless, mobility also represents a survi-val strategy of the peasant family, a process of socialconsciousness and aspirations' (Becker 1990:51). It isunquestionably a painful path to social awareness.
Employment and income conditions in the Amazon regionare not significantly better than those in the Northeast. Aftermaking adjustments for the underemployed, about one-thirdof the rural labor force in the region was estimated to beunemployed in 1980 - one of the highest rates in the country.In the same year, average income of the region's economi-cally active population was 1.38 times the minimum wage,while the figure for the Northeast was 0.79 times the mini-mum wage. The average income in the Amazon between1970 and 1980 was one the lowest in the country; only theNortheast was lower. Forty-nine percent of the workersemployed in cattle ranching and agriculture received wagesequal to or below the minimum wage (Kageyama 1986).According to Kageyama, the poorest 0.5% of the economi-cally active rural population in the Amazon region exper-ienced a decrease in their share of the total income from30.2% in 1970, to 23.85% in 1980. This decrease occurred

142 III CLIMATE VARIABILITY AND VULNERABILITY
despite significant expansion in the region's agriculturalproduction during this same period.
In addition to agricultural and ranching activities, many ofthe migrants to the Amazon turned to gold panning. Untilthe 1960s, panning for gold was carried out by approximately10000 workers. Today, Becker estimates nearly 240000workers are panning in the region - 80% of the activepanners in the country. Gold panning is subject to some ofthe same exploitative relations and conflicts that are charac-teristic of the agricultural sector. Intense disputes involvingterritorial and mining claims take place not only betweenminers and state-owned, national and multi-national compa-nies, Indian nations and gold panners, but among goldpanners as well.
Some points must be highlighted with reference to gold-mining migrants and their condition: (1) the majority of goldpanners are migrants from the Northeast; (2) workers receiveeither daily allowances or a minimum percentage share of theboss's income (normally the boss is the representative of theowner of the mine); (3) the worker's income is hardlysufficient to meet basic needs for subsistence, mainly due tothe fact that the worker depends on suppliers who appropri-ate a significant part of the economic surpluses generated intheir activity.
The itinerant nature of small-scale mining, involving con-stant relocation of workers, is another source of conflict overresources in the Amazon region. Conflicts between thepanners and the mining companies are compounded byconflicts with the Indian nations. Currently, nearly 14% ofthe Amazon region has been granted as government con-cessions for prospecting and mining activities. Five hundredand sixty of these concessions are located within Indianterritories. The 1700 gold prospecting concessions pendinginclude 33% of the total Indian areas in the region, particu-larly those in Para and Rondonia (Becker 1990:79).
While settlement in rural areas is still the dominant patternof Amazonian migration, the process of urbanization hasintensified. As the agrarian structure is consolidated, and thecontrol over land and natural resources, including minerals,is strengthened, migrants are left with fewer and feweropportunities for creating a livelihood. Migration to theurban centers becomes one of the few alternatives left tothem. The crisis and stagnation of the national economy inthe 1980s had the same socioeconomic impact on the urbaneconomy in the Amazon as in the rest of the country:increased underemployment and declining incomes.
We may conclude that, thus far, the living conditions ofmigrants to the Amazon, both urban and rural, are betterthan in the Northeast. Migration, however, has resulted inthe exchange of one marginal survival strategy for another.For most families, their first residence is but the beginning ofa long journey. The itinerant character of much of theagricultural and mining activity demonstrates this phenom-
enon. The pervasive instability of settlements is perpetuatedby the changing economic bases of the regional urban centerswhich depend on easily disrupted and depleted resourcessuch as panning, agriculture, cattle ranching or large devel-opment projects (state-owned or not).
Environmental impacts caused by the occupation of theAmazon
In this section we identify some of the causes and conse-quences of environmental degradation in the Amazon regionof Brazil, in particular in eastern Amazonia where most ofthe migrants from the Northeast have concentrated. We tryfirst to identify those factors which affected the developmentof settlement policies in the region. We then relate thesepolicies to the environmental degradation taking place, andanalyze how they have given rise to the national and inter-national controversy about the destruction of the rain forest.
The first factor that needs to be understood is the officialperception of the Amazon region as a simple supplier ofspace and resources for Brazilian development. Characteris-tic of this perception was the National Integration Plan of1970, whose motto was 4a land without people for peoplewithout land.' The soil was regarded as an inexhaustibleresource capable of sustaining growing populations in thevast Amazon, especially to those from the Northeast whowere in need of better land and water. The Amazonian soils,however, have not assured success for the agriculturalsettlements.
Two to three percent of the total land area of the Amazonis considered good quality agricultural land. The soils knownas 'terrafirrne' (poorly drained lands) represent the majorityof the Amazonian soils. Gourou wrote: The major portionof the Amazonian terra firme soils are unquestionablymediocre, though not necessarily useless for agriculturalpurposes. In spite of their apparent uniformity, these soilspresent a certain variety which should influence their use'(Gourou 1982:193). The agronomist Falesi illustrated themediocrity of the soils and their variability in a detailed mapcalled 'Edaphic Environment of the Great Carajas Project' -an area of 895265 square kilometers comprising 40% of thestate of Para, 95% of the state of Maranhao and the northernarea of the state of Tocantins. He states that half of the area iscomprised of highly leached, nutrient-poor, lateritic (7%)and podzolic soils (12.34%) lying on varied topographyranging from flat to moderately sloped. These soil conditionsresult either from the paleoclimatic history of the region orfrom the prehistoric and historic deforestation. Less than10% of the area is covered by fertile, humus-rich soils (Falesi1989).
These recent studies reveal an Amazonia that is for themost part mediocre for agriculture but still largely unknown,concealed under an exuberant forest cover. The traditional

7 AMAZONIA AND NORTHEAST BRAZIL 143
uses of these terra firrne environments were modest andextensive, oriented to extractive production rather than tosettled intensive agriculture. The shifting cultivation systemof indigenous peoples, based on manioc and supplementedby fishing, hunting, forest resources extraction and rubbertapping, was dispersed throughout the vastness of the forest.One region has been moderately successful at adopting aproductive agriculture, however: the Bragantina region andits northern extensions located on the southern part of theGuama river. In this region deforestation was very intensedue to the consumption market for firewood, charcoal andmanioc flour in Belem. In the forested areas located to thesouth of the strip stretching from Belem to Braganca, whichexhibits relatively high rural densities, the cultivation ofmalva, an antiseptic medicinal plant, has had some success(Sawyer 1979); there have also been some thriving blackpepper plantations that use techniques resembling thoseadopted by the Japanese colonies in Tome-Acu (Monteiro1987).
The random pattern of recent occupation, the lack of priorfamiliarity with the complexity of the soil distribution, thelack of interest in evaluating the modest experiences men-tioned above, as well as the tendency of the migrant from theNortheast to equate exuberant forest cover with good soils,have all led to the degradation of the areas of terra firmewithout any economic return or, at least, any of a sustainablenature. Environmental deterioration is particularly evidentalong highways which have been built invariably betweenriverbeds to avoid costly engineering constructions. Thesehighways have been the vectors of the occupation of the terrafirme environments along the Para-Maranhao, Belem-Bra-silia, Transamazonian, Cuiaba-Porto Velho, Cuiaba-San-tarem, and Porto Velho-Manaus routes.
The government programs for settling rural workers interra firme areas, whether undertaken with or without theNational Integration Plan (PIN) guidelines, have all resultedin failure. The reasons for this failure are: impossibility ofkeeping the colonizers concentrated in the agro-villageswhich, in spite of being equipped with a minimum ofnecessary services, were distant from their plots of land;difficulties in marketing products due to the distances to thecommercial centers and poor road conditions; rapid im-poverishment of the soils once the forest cover was burned; aswell as the presence of malaria, which reduced the workingcapacity of the settlers.
Following the construction of the roads, there was aspontaneous settlement of small farmers who had beenprogressively driven from better lands by the expansion oflarge landholdings in the region. One concentration of smallfarmers was confined to an area suggestively called TrechoSeco (Dry Stretch) which was entirely inappropriate forsmall-scale agriculture. The confinement of these farmers tosuch areas along the Belem-Brasilia highway has forced
them to search for alternative means of survival by panning,working at construction camps, and migrating to cities(Bitoun 1980). The undefined legal status of the landsprevented successful settlement by these small farmers,which could only have been achieved if these lands had easyaccess to markets and were located in the rare areas withgood or moderate agricultural potential.
By the early and mid 1970s, it was widely recognized thatthis form of resettlement as a model of development wouldnot be successful. This gave rise to an exploration of alterna-tive models for the terra firme areas. One such model hasbeen the attempt to promote colonization through enter-prises, i.e. allocating plots and colonizers in a similar initia-tive as that in the north of Para, where coffee production hadbeen expanded. The region of Alta Floresta (in MatoGrosso) is also an example of this model. To what extenthave these enterprises effectively taken a technical andcommercial lead? Or have they limited their actions simply tonegotiating the plots or taking advantage of cheap labor inorder to prepare their pastures? The answers given to eachcase entail success as well as failure, in settlements located inareas distant from the consumption markets.
Throughout these development efforts, soil continued tobe regarded as a resource capable of generating significantsurpluses for the national and international markets. Hence,rice production in areas recently settled in small family unitshas achieved temporary significance in supplying citymarkets outside the region. Production has progressivelydeclined, however, due to losses in soil fertility and thedisruption of the small family units by the expansion of thelarge properties.
The state initiated financing and credit schemes for largecattle-ranching enterprises with the idea of transforming theAmazon into a major meat-producing center for nationaland international markets. Large ranch holdings beganexpanding in 1973, succeeding the deforestation and soildisruption caused by the small rice growers. The majority ofthese large projects have not proven to be economicallyviable, as a result of: sanitation problems; effects of theseasonal droughts - which become progressively moreintense with distance from the equator; and impoverishmentof the pasture soils which then require capital intensivemanagement which is uneconomic. According to Gourou:'Instead of chopping down large forested areas, it wouldhave been wiser to cultivate small tracts using intensivetechniques and thus provide forage for semi-confined live-stock' (Gourou 1982:231). This author suggests the use ofsoya and manioc (with its leaves and roots), and regardssemi-confinement as a means of better monitoring animalhealth. Obviously, this form of cattle ranching would supplyregional markets rather than transform the Amazon into ameat exporting center.
Although soils of the terra firme terrains proved difficult to

144 III CLIMATE VARIABILITY AND VULNERABILITY
manage, the wealth of their forest cover rewarded those who,after the rubber tappers and the owners of nut-producingareas, have appropriated them. The accumulated experienceof the traditional groups engaged in forest activities has onlyrecently drawn the public interest: their knowledge of thespecies has not been utilized as yet. The fact that Bertholletiaexcelsa produces autotoxins that prevent concentration ofthe species in small areas has long been known. But howmuch of such knowledge has been applied to practicalsilvicultural attempts? Small enterprises and small-farmcommunities can invest in biodiversity, with the assistance oftraditional knowledge. Examples of attempts to increaselocal biodiversity through cultivation include the introduc-tion of fruit and cocoa cultivation in Tome-Acu, where blackpepper previously constituted the sole product. There havealso been promising attempts, in the municipality of SaoJoao do Araguaia, at cultivating the cupuaqu (a local vege-table) in association with the maintenance of the nut trees(Monteiro 1987; Souza 1991). Despite this new awareness ofthe productiveness of minor forest products, the predatoryexploitation of the forest assets of the Amazon by the timberand cattle industries continues.
Lower wetlands have been particularly vulnerable. Theyoccupy only a small part of the Amazon - about 12%, ofwhich only 2% are considered fertile (Falesi 1989). Gourouestimates that wetlands cover 60 000 of the 3.5 million squarekilometers of the Brazilian Amazon (Gourou 1982:196). Alarge proportion of the fertile alluvial soils are not accessible,however, as they are either located near small riverbeds or aresusceptible to floods whose control would require enormousdams. The majority of the soils of the wetland forest (igapo)are poor and the wealth of the flora derives mostly from theecological exchanges conducted with the trees of the floodedforest. Once more, the vitality of the vegetation conceals themodesty of the valuation potentials. It is in these wetlands,however, that the most varied types of living creatures arefound. While in the terra firme areas economic exploitationhas been extensive, the traditional productive activities in thewetlands, although 'primitive and rugged' have illustrated astriking human adaptation to the limits of the environment(Lacerda de Melo and Moura 1990:151).
Historically, the wetland areas of the Amazon region havegiven us the best insight into sustainable development prac-tices. The outstanding character of land management inthese areas lies in the complementarities among aquatic,forest and agricultural environments. Fishing provides thefundamental nourishment for the rural and urban popula-tions. The forests provide game and fruits for consumptionor trade, such as the aqai (a fruit used for its juice), as well aslatex from the rubber trees. The flood plain soils are exploitedaccording to a complex agricultural calendar and localmicro-zonation, producing manioc, banana, fruits and vege-tables, as well as industrial crops such as jute and malva. As
the distances to the consumer markets decrease, cattle ranch-ing on the flood plain grasslands increases in significance(Gentil 1983).
These production systems have been inadequately studied,not least for their value as a 'conservation' of techniques forthe exploitation of the Amazonian environment. The percep-tion that traditional methods of land use are outdated andstagnant has inhibited greater investment in wetlands. On thecontrary, they merit significantly more study, for they couldbecome the basis for a more rational, although perhaps lessambitious, development of the wetland areas. In fact, theforms of occupation developed in these areas since the 1960shave totally ignored environmental rationality: the greathydroelectric projects drown these environments, while pan-ning activities on the riversides ruin their fishing wealth bydischarging mercury. The long-range destructiveness ofthese two forms of resource use must be included in anymanagement accounting, just as the localized and limitednature of wetlands is considered.
In conclusion, the limited attempt to reconcile traditionaland modern land uses in wetland areas as well as in the vastterra firme areas, reinforces the opinion expressed by MarioLacerda de Melo in his writings:
In the face of wildly optimistic assessments of the con-ditions and natural resources of Amazonia, voiced in thesixteenth century by Pero Vaz de Caminha in Brazil, andlater by Humboldt, or on the other hand, exceedinglypessimistic views questioning the viability of the wholevast region, there is one position that can be perceived asrealistic. Such a realistic position acknowledges, in thevastness of Amazonia, the existence of severely limitingfactors but, at the same time, recognizes that the environ-mental adversities can be progressively overcome,through broad-based and persistent efforts (Lacerda deMelo and Moura 1990:123-4)
Lacerda de Melo's position is supported by Gourou, whowrote:
The effort and capital spent in the economic developmentof Amazonia have not been in vain, even if they have notproduced the expected returns. There has been a dash ofmegalomania in some projects. The destiny of the Indiansand the Brazilians in Amazonia has not been given thedeserved attention. The large cattle ranches, perhaps, arenot a good way of utilizing Amazonia. The errors can becorrected: instead of dreaming about millions and mil-lions of hectares we should be realistic in carefully assess-ing the value of the tens of thousands of hectares wheretiny and prudent clearings will be opened in the Amazo-nian jungle. (Gourou 1982:238-9)

7 AMAZONIA AND NORTHEAST BRAZIL 145
C O N C L U S I O N S
In brief, the analysis shows that, in recent decades, a model ofdevelopment that concentrates wealth and excludes certainsocial groups has prevailed in the Northeast and in theAmazon. These two regions, regarded as peripheral in thisprocess, have endured and participated in an economic andsocial evolution characterized by its predatory nature inrelation to both the human population and the naturalenvironment. Though this common experience has served tounify these areas, the resulting social and economic transfor-mations have brought few improvements in the living con-ditions of their populations. Furthermore, the economicprocesses taking place have failed to acknowledge the dis-tinct environmental reality of the semi-arid Northeast andthe Amazon.
It has also become evident that recent Brazilian develop-ment efforts, following an industrialization and urbanizationmodel, have favored certain areas of Brazil. In particular,center-periphery relationships have been established thathave imposed conditions on the Northeast and the Amazonwhich have not always met the specific interests of theirpopulations. The efforts at decentralization in the pastdecades have not been effective and have reinforced theperipheral character of these two regions. Additionally, incases where sub-regions have participated more actively inthe economic development and industrialization process,this participation has linked them more closely with theextra-regional economy than with the pre-existing regionalproductive base.
Recent economic development, particularly the 1950s,1960s and 1970s, has not addressed the agrarian problem,nor has it encouraged a search for new forms of organizationof the agricultural economy. In the Northeast and theAmazon, where large portions of the population are depen-dent on agriculture, these questions are of utmost import-ance. Economic development policies have failed to addressthe concentration of agrarian landholdings, the exploitationof rural labor, or the appropriation of the economic surplusgenerated by farmers or landless by large landowners orother elites. Without a direct attack on the existing produc-tion and labor relations, which have their roots in theconcentration of rural property, a whole range of interme-diate relations are maintained by mercantile capital in orderto appropriate the income of the unassisted and non-orga-nized farmer. This has denied communities the resources thatcould enable them to improve their living conditions anddevelop their productive capacity.
The agrarian structure described is rooted in the economic,social and political history of the Northeast and reproducedin the Amazon, sometimes in a more dramatic fashion.There, the degree of land concentration is greater and the
conflicts, in the absence of a strong state, have tended tobecome generalized - involving immigrants, large lan-downers, speculators, indigenous peoples, lumber compa-nies, small miners, and the Government through large, state-owned enterprises.
Sustainable development in this context has been difficultto achieve. Neither in the semi-arid tropics nor in the humidtropics have we been able to bring about development whichrespects the environment while systematically providingimprovements in the living conditions of local populations.This is precisely the focus of the most recent debates oneconomic development, which have given rise to the explor-ation of sustainable development. As a consequence of thenational and international concern regarding the future ofthe rain forests, proposals that address sustainability issuesin the Amazon have been gaining strength. These proposalswill not be viable if political and inter-regional consider-ations are not analyzed, along with economic and technolo-gical criteria.
Broad preconceptions shape interpretations of the deve-lopment needs of the Amazon and Northeast. In the case ofthe Amazon, it is the vision of a vast open land and a resourcefrontier in need of a communication network. In the North-east, the limiting factor is water, and the solution is seen to liein the development of irrigation. New proposals, however,must address the social and environmental heterogeneity ofthe two regions. While the integration between these tworegions and other areas has increased, a number of differ-ences between the regions exist. These differences have notbeen adequately addressed by those presenting new develop-ment proposals.
The present study challenges us to apply the world'stechnological advances to support rather than supplant theknowledge and experience of local populations. This combi-nation of knowledge and experience constitutes an invalu-able asset that can generate more productive solutions,compatible with the existing social and natural environ-ments. In particular, the wetlands areas in the Amazon andthose of dry agriculture in the Northeast should be objects ofsystematic and long-term research by those studying sustain-able development, as they are areas where human popula-tions have developed a long-term productive interaction withnature.
In the political arena we must attack outdated agrarianstructures and the exploitative nature of production andlabor relations. We must also make the prevailing commer-cial and financial systems accountable. These structures andsystems prevent farmers from appropriating a significantpart of the economic surplus generated by their own work,and results in the impoverishment of millions of people(World Bank 1990:67,74).
Finally, it is clear that any proposal for sustainabledevelopment for the Amazon and the Northeast must take

146 III CLIMATE VARIABILITY AND VULNERABILITY
into account the important inter-regional links between thesetwo areas. We have attempted to demonstrate that theeconomic links between the semi-arid tropics and the humidtropics have increased in the last decades. It is clear now thatthese links have prompted the development of new areas suchas the Eastern Amazon, where labor from the semi-aridNortheast is used to produce commodities that are shippedpredominantly to foreign markets and to the Southeast ofBrazil.
Expansion of the transportation and communicationinfrastructure in the region has supported migration fromthe Northeast to the Amazon, and the transport of goodsfrom each of these regions to the rest of Brazil. Models aimedat relieving the demographic and social pressure on semi-aridareas through the occupation of tropical humid regions haveresulted in negative social and environmental impacts in thelatter regions, and have not solved the problems of the semi-arid areas, particularly their vulnerability to recurrentdroughts.
We therefore conclude that sustainable development poli-cies for the semi-arid areas of the Northeast that do notrespect the environmental diversity and the accumulatedlocal experience, and do not seek to change long-standingstructural agrarian inequities, will continue to increase thepressure on the Amazon's space and resources. Because ofthe dramatic increase in accessibility between the two tropicsover the last decades, any policy aimed at sustainable devel-opment in the Amazon is doomed to failure unless a comple-mentary proposal is adopted in the Brazilian semi-arid tropicof the Northeast.
ACKNOWLEDGMENTS
This study was sponsored by the National Council forScientific and Technological Development (CNPq). Transla-tion from Portuguese was done by Norma Gerjoy.
REFERENCES
Andrade, M. C. de 1963. A Terra e o Homem no Nordeste. Sao Paulo:Brasiliense.
Andrade, M. C. de 1977. Paisagens e Problemas do Brasil. Sao Paulo:Brasiliense.
Araujo, T. B. de 1982. Estado e industrializacao do Nordeste. RevistaEconomia e Desenvolvimento. Rio de Janeiro: Campus.
Becker, B. K. 1990. Amazonia-Sdo Paulo. Sao Paulo: Atica.Bitoun, J. 1980. Ville et developpement regional dans une region pionniere
du Bresil: Imperatriz-Maranhdo. Thesis, University of Paris.Cano, W. 1989. Reestruturaqdo Internacional e Repercussoes Inter-
regionais nos Paises Subdesenvolvidos. Reflexoes sobre o Caso Brasi-leiro. Campinas. (Mimeo.)
Carvalho, O. de 1988. A Economia Politica do Nordeste (Seca, Irrigacdoe Desenvolvimento). Rio de Janeiro: Campus.
Duarte, R. 1990. Dinamica e transformacao da economia Nordestina nadecada de 70 e anos 80. O desenvolvimento desigual da economia no
espaqo brasileiro. FUNDAJ. Recife. (Mimeo.)Faissol, S. 1973. O sistema urbano Brasileiro: uma analise e interpreta-
C.ao para fins de planejamento. Revista Brasileira de Geografia35(4):3-34.
Falesi, I. C. 1989. O ambiente edafico da regiao do programa GrandeCarajas. Revista Brasileira de Geografia 50(4):7-29.
Figueroa, M. 1977. O Problema Agrdrio no Nordeste do Brasil. Recife:HUCITEC/SUDENE.
Freyre, G. 1937. Nordeste: Aspectos da Influencia da Cana Sobre a Vida ea Paisagem do Nordeste do Brasil. Rio de Janeiro: Published by theauthor.
FUNDAJ/INPSO/Departamento de Economia. 1990. O desenvolvi-mento desigual da economia no espaqo brasileiro: decada de 70 e anos80. Recife. (Relatorio de Pesquisa, mimeo.)
Furtado, Al-o. 1977. Formaqdo Economica do Brasil. Sao Paolo: Ed.Nacional.
Gentil, J.M.L. 1983. A juta na agricultura de varzea da area deSantarem. Dissertation, Federal University of Pernambuco.
Gourou, P. 1982. Terres de Bonne Esperance. Paris: Le Monde TropicalPlon.
Guilherme Velho, O. 1972. Frentes de Expansdo e Estrutura Agrdria. Riode Janeiro: Ed. Zahar.
Guimaraes, F.M.S. 1941. Divisao Regional do Brasil. Revista Brasileirade Geografia 3(2):318-73.
Guimaraes Neto, L. 1990a. Questao regional no Brasil: reflexoes sobreprocessos recentes. Cadernos de Estudos Sociais 6(1):8
Guimaraes Neto, L. 1990&. Mercado de trabalho na decada perdida.Sao Paulo em Perspectiva 4(3/4): 131.
IBGE 1990. Brasil: Uma Visdo Geogrdfica dos Anos 80. Rio de Janeiro:IBGE.
Kageyama, A. 1986. Modernizaqdo, Produtividade e Emprego na Agri-cultura. Uma Analise Regional. IE/UNICAMP.
Lacerda de Melo, M. 1976. Proletarizaqdo e Emigraqdo nas RegioesCanavieiras e Agrestinas. Departamento de Ciencias do Homem daUFPE. Recife. (Mimeo.)
Lacerda de Melo, M. and Moura, H. A. de 1990. Migraqoes paraManaus. FUNDAJ. Recife: Massangana.
Martine, G. and Camargo, L. 1984. Crescimento e distribuicao dapopulacao Brasileira: tendencias recentes. Revista Brasileira de Estu-dos de Populaqdo. 1(1/2).
Monteiro, A. A. A. 1987. Permanencia da pequena produqdo em Tome-Aqu: dapimenta do reino ao cacau. Dissertation, Federal University ofPernambuco.
Moura, H. A. de 1972. Variacaes Migratorias do Nordeste 1940/1970.Revista Economica do Nordeste. 14(Oct-Dec):35.
Moura, H. A. de and Santos, T. de F. (eds.) 1990. Proteqdo da Populaqdodo Nordeste por Microregioes 1980-2000. FUNDAJ. Recife:Massangana.
Oliveira, F. de 1977. Elegiapara uma Re(li)gido. Rio de Janeiro: Paz eTerra.
Oliveira Vianna, F. J. 1922. Recenseamento do Brasil, vol. 1. Ministerioda Agricultura, Industria e Comercio. Diretoria Geral de Estatistica.Rio de Janeiro: Typ. da Estatistica.
Panagides, S. and Magalhaes, V.L. 1974. Amazon Economic Policy andProspects. Florida: University of Florida Press.
Pessoa, D. 1990. Espaqo Rurale Pobreza no Nordeste. FUNDAJ. Recife:Massangana.
Sawyer, D. 1979. Colonizacao da Amazonia: Migracjio de nordestinospara uma frente agricola no Para. Revista Economica do Nordeste10(3):773-812.
Souza, A. do V. 1986. Politica de Industrializaqdo, Emprego e IntegraqdoRegional. O Caso do Nordeste do Brasil. Dissertation, CME/PIMES/UFPE, Recife. (Mimeo.)
Souza, C. H. L. 1991. A Produqdo do Espaqo e a Organizaqdo doTerritorio em Ubd e Araras, PA. Dissertation, Federal University ofPernambuco.
SUDENE. 1985. Nordeste: Exportaqdes e Importaqdes, 1974—1980.Recife.
Taschner, S. P. and Bogus, L. M. M. 1986. Mobilidade espacial dapopulac.ao Brasileira: aspectos e tendencias. Revista Brasileira deEstudos de Populaqdo. 3(2).
Tocantins, L. 1961. O Rio Comanda a Vida. Rio de Janeiro. CivilizacaoBrasileira.
World Bank. 1990. World Development Report: Poverty, French edn.New York: Oxford University Press.

8: Reducing the Impacts of Drought: Progress TowardRisk Management
DONALD A. WILHITE
INTRODUCTION
Images of malnutrition, famine and a degraded Africanlandscape were commonplace during the 1980s and appearlikely to continue well into the 1990s and beyond. Glantz(1987) has shown that drought has hindered the ability ofmuch of sub-Saharan Africa to achieve a sustained level ofagricultural production and, as a result, has retardedprogress toward economic development. Linkages betweendrought and economic development, although most obviousin Africa, exist throughout much of the developing world.
The impacts of drought in developed countries differsubstantially from those experienced in much of the develop-ing world. Absent are the widespread occurrences of foodshortages, which may lead to malnutrition and famine, andlarge-scale evidence of land degradation. However, econ-omic costs, particularly in the agricultural, energy andtransportation sectors, are substantial. The recent droughtsin the United States and Canada have been stark remindersof the vulnerability of all nations to this extreme climaticevent. This increased awareness of the economic, social andenvironmental costs of drought is leading a growing numberof nations, both developed and developing, to seek a moreproactive approach to drought management. These nationsnow realize that they can no longer afford to divert scarcefinancial resources to drought relief programs that do little toreduce, and may actually increase, vulnerability to subse-quent periods of water shortage.
The purpose of this chapter is to present a case study of therecent progress that has been made by some countries inreducing their vulnerability to drought. Progress towarddrought preparedness will be discussed for the United Statesof America, South Africa, and Australia. Although manycountries have made significant progress in this area in recentyears, these countries were chosen because of what is con-sidered dramatic philosophical changes in the way drought
and its management are perceived by government. The intentis for other drought-prone regions to examine theseapproaches and consider adapting them to their particularsocial, political and environmental setting.
The chapter is divided into three parts. The first willpresent an overview of drought and drought planning thatwill serve as background information for later discussions ofrecent drought policy and program changes in the UnitedStates, Australia and South Africa, all discussed in thesecond section. The final section provides a brief descriptionof a generic planning process that is being promoted as onemethod of developing comprehensive preparedness plans fordealing with future episodes of drought.
DROUGHT OVERVIEW
Drought as a natural hazard
Drought differs from other natural hazards (such as floods,hurricanes and earthquakes) in several ways. First, since theeffects of drought accumulate slowly over a considerableperiod of time, and may linger for years after the terminationof the event, a drought's onset and end are difficult todetermine. Because of this, drought is often referred to as a'creeping phenomenon.' Second, the absence of a precise anduniversally accepted definition of drought adds to the confu-sion about whether or not a drought exists and, if it does, itsseverity. Third, drought impacts are less obvious and arespread over a larger geographical area than is damage thatresults from other natural hazards. Drought seldom resultsin structural damage. For these reasons the quantification ofimpacts and the provision of disaster relief are far moredifficult tasks for drought than they are for other naturalhazards.
Although drought represents a considerable climatic riskin semi-arid regions, it is a normal part of the climate for
147

148 III CLIMATE VARIABILITY AND VULNERABILITY
virtually all climatic regimes. Drought differs from ariditysince the latter is restricted to low-rainfall regions and is apermanent feature of climate. The character of drought isdistinctly regional, reflecting unique meteorological, hydro-logical and socioeconomic characteristics. Many peopleassociate the occurrence of drought with the Great Plains ofNorth America, Africa's Sahelian region, India or Australia;they may have difficulty visualizing drought in SoutheastAsia, Brazil, Western Europe or the eastern United States,regions perceived by many to have a surplus of water.
Drought should be considered relative to some long-termaverage condition of balance between precipitation andevapotranspiration in a particular area, a condition oftenperceived as 'normal' (Wilhite and Glantz 1985). It is theconsequence of a natural reduction in the amount of precipi-tation received over an extended period of time, usually aseason or more in length, although other climatic factors(such as high temperatures, high winds and low relativehumidity) are often associated with it in many regions of theworld and can significantly aggravate the severity of theevent. Drought is also related to the timing (i.e. principalseason of occurrence, delays in the start of the rainy season,occurrence of rains in relation to principal crop growthstages) and the effectiveness of the rains (i.e. rainfall inten-sity, number of rainfall events).
Responding to drought: a historical perspective
Governments have traditionally relied on a wide range ofpotential actions to deal with the impacts of water shortageson people and various economic sectors. In the UnitedStates, agencies of the federal government and both housesof Congress typically respond by making massive amounts ofrelief available to the affected areas. This generally takes theform of short-term emergency measures to agricultural pro-ducers, such as feed assistance for livestock, drilling of newwells and low-interest farm operating loans. In the sectionbelow, the primary features of drought policy in the UnitedStates and Australia are compared. In addition, theapproaches taken historically by Brazil and India are des-cribed briefly.
United States and AustraliaWilhite (1986) compared drought policy in the United Statesand Australia to learn more about the approaches taken bytwo drought-prone nations to deal with the effects ofdrought. For that study, the principal features of droughtpolicy were grouped into three categories: organizational,response and evaluation (see Table 1).
Organizational features are planning activities thatprovide timely and reliable assessments, such as a droughtearly-warning system, and procedures for a coordinated and
efficient response, such as drought declaration and revo-cation. These characteristics would be the foundation of aprovincial, regional or national drought plan. Responsefeatures refer to assistance measures and associated adminis-trative procedures that are in place to assist individualcitizens or businesses experiencing economic and physicalhardship because of drought.
Numerous assistance measures are available in the UnitedStates but few are intended specifically for drought. Table 2lists the federal assistance programs used in the United Statesduring the 1976-7 drought. Until recently, relief arrange-ments in Australia were included, for the most part, underthe Natural Disaster Relief Arrangement agreements. Theseare now in the process of being discontinued as part of aproposed new national drought policy that will be discussedin a later section of this paper. Relief measures, by state, usedduring the 1982-3 severe drought in Australia are illustratedin Table 3.
Evaluation of organizational procedures and droughtassistance measures in the post-drought recovery period isthe third category of drought policy features. It is critical thatgovernmental response efforts be evaluated during the post-drought period in order to avoid repeating the same mistakesduring subsequent droughts. This evaluation is best accom-plished by a nongovernmental organization, such as auniversity or private research group, that will be unbiased inits assessment. In Australia, governments have been moreconscientious in their evaluation of drought response efforts.In the United States, the federal government has not routi-nely evaluated the performance of response-related pro-cedures or drought assistance measures. Aspects of the 1976—7 drought were evaluated by the General Accounting Office(1979) and Wilhite et al (1986). Responses to the 1987-9droughts were examined by Riebsame et al. (1990).
BrazilThe most drought-prone region of Brazil is in the Northeast,often referred to as the 'drought polygon.' This region has along history of drought, and the government has followed avariety of approaches to the problem, dating back to theImperial Inquiry Commission that responded to the droughtof 1877-9. One of the positive steps taken early to deal withthe problem was the creation of the Department of Works toOvercome Drought (DNOCS) in 1909 (Pessoa 1987). Itspurpose was to collect basic information about the region,including technical-scientific studies and maps, and to estab-lish a meteorological and hydrological network for monitor-ing climate and water resources. In the 1960s, the Superinten-dency for Northeast Development (SUDENE) was createdto expand existing monitoring networks, conduct hydrogeo-logical research and integrated studies of potential naturalresources, and map soil and mineral resources.

8 REDUCING THE IMPACTS OF DROUGHT 149
Table 1. Comparison of drought policy features as of 1984: United States and Australia
Features United States Australia
OrganizationNational drought planState drought plansNational drought early-warning systemAgricultural impact assessment
techniquesResponsibility for drought declarationGeographic unit of designationDeclaration procedures
ResponseState fiscal responsibility for assistance
measuresState administrative responsibility for
assistance measuresEligibility requirements and provisions
of drought assistance measures
National crop insurance program
EvaluationPost-drought documentation and
evaluation of procedures andmeasures
NoneIn selected statesJoint USD A/NO AA Weather FacilityAvailable, but generally unreliable
FederalCountyStandard for all states; varies by
program/agency
Negligible, if any
No responsibility for federal measures
Standard within programs for alldesignated counties
All-risk federal program
No routine evaluation by government
Study in progessThrough NDRA agreementsBureau of MeteorologyNot available
StateUnit varies between statesVaries between states; standard within
states
Defined by NDRA agreements up tobase amounts; varies by state
Defined by NDRA agreements and byfederal measures
Varies by state for NDRA coremeasures; standard for federalprograms
Rainfall insurance feasibility study inprogress
Routine evaluation by federal and stategovernments
Source: NDRA, National Disaster Relief Arrangements; USDA/NOAA, US Department of Agriculture/National Oceanic andAtmospheric Administration.
In spite of the long history of actions taken to respond todrought in Northeast Brazil, the severe drought of 1979-83found the region even more vulnerable to water shortages(Pessoa 1987). As a result, in 1985 the Civil Defense Plan wasdeveloped under the leadership of SUDENE to address bothdrought and flood problems. The purpose of the plan was toreduce the risks and impacts to the population and provideaid as necessary. The plan also triggers a drought watchsystem that produces more detailed climatological analysesand advisories.
Assistance programs have been of two types (Pessoa 1987).First, rural credit, water supply and food distribution pro-grams are expanded to meet the needs of the distressed area.Second, public works projects are initiated to employ ruralrefugees in a variety of tasks, including:
building water structures;transporting water supplies via tank trucks;providing reasonably priced staple food items;distributing food to ease social tension;planting trees;
distributing fodder;supplying seeds;supporting small irrigation operations;distributing construction equipment;supporting literacy programs.
As a result of continuing problems in responding effecti-vely to drought in the region, the government supported theconduct of a regional training seminar on drought manage-ment and preparedness in which the University of Nebras-ka's International Drought Information Center was one ofthe organizers and participants. As a result of this seminar,FUCEME (the State Meteorological Foundation of Ceara)is leading an effort aimed at enhancing regional coordinationon drought planning.
IndiaDrought and famine mitigation efforts have had a longhistory in India, beginning with the adoption of 'faminecodes' by several provincial governments in 1883 (Sinha et al.1987). In 1975, the 'Drought Code' and 'Good Weather

150 III CLIMATE VARIABILITY AND VULNERABILITY
Table 2. Drought-related federal assistance programs used to respond to the 1976-7 drought in the United States, by agency
Agency Program name
Department of AgricultureFarmers Home Administration (FmHA]
Agricultural Stabilization and Conservation Service (ASCS)
Federal Crop Insurance Corp (FCIC)
Forest Service (FS)
Soil Conservation Service (SCS)
Department of the InteriorBureau of Reclamation (BuRec)
Bureau of Land Management (BLM)
Fish and Wildlife Service (FWS)
Southwest Power Administration
Economic Development Administration (EDA), Department ofCommerce
Small Business Administration (SBA)
Federal Disaster Assistance Administation (FDAA),Department of Housing and Urban Development
Federal Power Commission/Federal Energy Administration(FPC/FEA)
Employment and Training Administation (ETA), Departmentof Labor
General Services Administration (GSA)
Defense Civil Preparedness Agency (DCPA)Department of Defense
Emergency Loans0
Emergency Livestock LoansFarm Operating LoansFarm Ownership LoansSoil and Water LoansIrrigation and Drainage LoansCommunity Program Loans
Emergency Conservation MeasuresEmergency Livestock FeedAgricultural Conservation"Disaster Payments
Federal Crop Insurance*
Cooperative Forest Fire ControlCooperative Forest Insect and Disease ManagementRural Community Fire ProtectionDrought-Related Stewardship
Great Plains ConservationResource Development and ConservationConservation Technical AssistanceWatershed Protection and Flood Prevention
Emergency FundDrought Emergency"Drought-Related Technical Assistance
Grazing PrivilegeDrought-Related Stewardship
Drought-Related Stewardship
Emergency Electric Service"
Community Emergency Drought ReliefEconomic AdjustmentPublic Works Impact Projects
Emergency Drought Disaster Loans"Physical Disaster LoansEconomic Injury Disaster Loans
Disaster Assistance (Hay Transportation, CattleTransportation, Emergency Livestock Feed, Forest FireSuppression)
Drought-Related Services and Activities
Unemployment Insurance Grants to StatesFarm WorkersComprehensive Employment and Training Programs (CETA)Employment Services
Donation of Federal Surplus Personal PropertySale of Federal Surplus Personal Property
Civil Defense-Federal Surplus Personal Property Donations
Note:" Programs in the White House drought package.Source: WESTPO (1977).

8 REDUCING THE IMPACTS OF DROUGHT 151
Table 3. Drought relief measures available in Australia under the Natural Disaster ReliefArrangements, by state, as ofMarch 1983
Measure
NewSouth South Western NorthernWales Victoria Queensland Australia Australia Tasmania Territory
Concessional loansCarry-on loans to primary producers
Restocking loans to primary producers
Loans for purchase of fodder
Loans for supply of water
Carry-on loans for small business
Loans to cereal growers
Freight concessionsStock movement
Fodder
Water to primary producers
Water to state, local or semigovernmentauthorities
Machinery and equipment
Stock slaughter subsidy for primary producers
Stock disposal subsidy to local, state andsemigovernment authorities
Other subsidiesWater
Agistment
Other
(Maximum amount ranges from $20000 to $40000, with interest at 4%.Repayment period generally 7 years with discretional repayment holiday of 1-3years in some cases.)
(1) * (1) (2) (1) NA(Maximum amount ranges from $20000 to $30000, repayable over 7-10 years,at 4-5% interest rate.)
* NA NA NA NA NA NA(Loans to dairy companies, repayable over 5 years, at 4% interest rate.)
NA NA (2) NA NA NA NA(80% of cost to local authorities for augmentation of town water supplies.Repayable over 7-9 years at 3-4% interest rate.)
NA * (2) * * NA NA(Maximum amount of $40000, repayable over 7-10 years at 4% interest rate.)
(2) NA NA NA (2) NA NA
* * * * * NA(Applies to rail and road at 75%.)* * * * NA(Applies to rail and road, generally at 50-75% concession.)
* * * * NA NA(Applies to private vehicle, generally at 75% concession.)
NA * * * * NA
NA NA (2) NA NA NA
(2) NA (2) (2) (2) (2)(Generally $10-15 per head for cattle and $1-3 per head for sheep.)
NA
NA
NA
(2)
* * * * * NA NA
(Generally $1 per head for cattle and 15 cents per head for sheep.)
* * (2) * (2) NA NA(Generally applies to drilling wells for towns or stock water at 75-100%concession.)
NA (2) (2) NA (2) (2) NA(Rate of $1.00-1.75 per head of cattle and 10-12.5 cents per head for sheep and/or 50-75% of cost of adjustment.)
NA (2) (2) NA (2) NA NA
Notes:*, included in core measures; NA, not available; (1), included in carry-on loans; (2), available but not part of core measures.

152 III CLIMATE VARIABILITY AND VULNERABILITY
Code' were adopted. The Drought Code is anticipatory,providing a list of alternative cropping strategies that shouldbe adopted when there is evidence of drought. These includeanticipating conditions of food scarcity early in the season,maximizing production and alternating cropping patterns inirrigated areas, making mid-season corrections in crop plant-ing in unirrigated areas, and building up seed and fertilizerbuffers to implement the drought coping strategy. The GoodWeather Code outlines the scientific, administrative andplanning steps necessary to take full advantage of a goodmonsoon season to increase production of food grains. TheDrought Watch group exists at the national level, made up ofrepresentatives of the Ministry of Agriculture, MeteorologyDepartment, Indian Council of Agricultural Research, andMinistry of Information and Broadcasting, to monitorweather conditions throughout the country. This groupreceives regular reports from similar groups at the state anddistrict levels.
The strategies currently being used by the Indian govern-ment to reduce vulnerability are a combination of emergencyand long-term programs. These tactics include early mon-soon forecasts; improved communication systems; provisionof resources such as credit, fertilizers, pesticides, and powerfor increasing production; assistance to farmers in poormonsoon years; maintenance of adequate prices; mainten-ance of reasonable buffer stocks of food grains in strategiclocations; and improved transportation systems (Sinha et al.1987). The government has also undertaken a nationwidesatellite monitoring program to provide early warning of thepotential impacts of drought on agricultural production(Thiruvengadachari 1991). Evidence would seem to indicatethat the drought-prone areas of India are less vulnerable todrought today than they were several decades ago because ofthe country's maintenance of buffer stocks of food fordistribution during times of shortage (A. R. Subbiah,personal communication).
The Agro-Meteorology Service of India is striving toimprove weather predictions, prepare climatological infor-mation for agricultural decision making, develop deliverysystems to provide timely collection and distribution of dataand information to users, and develop advisories on agricul-tural operations for contingency cropping practices duringdrought.
RECENT PROGRESS IN DROUGHTPREPAREDNESS
Governments worldwide have shown increased interest indrought planning since the early 1980s. Several factors havecontributed to this interest. First, the widespread occurrenceof severe drought over the past several decades and, specifi-cally, the years during and following the extreme ENSO
event of 1982-3 focused attention on the vulnerability of allnations to drought. Second, the costs associated withdrought are now better understood by some governments.These costs include not only the direct impacts of droughtbut also the indirect costs (i.e. personal hardship, the costs ofresponse programs, retardation of economic developmentand accelerated environmental degradation). Nations can nolonger afford to allocate scarce financial resources to short-sighted response programs that do nothing to mitigate theeffects of future droughts. Finally, the intensity and fre-quency of extreme meteorological events such as droughtmay increase, given projected changes in climate associatedwith increasing concentrations of carbon dioxide and otheratmospheric trace gases. Droughts are a climatic certaintyand recent events worldwide have highlighted the import-ance of preparing now for future episodes. From an institu-tional point of view, learning today to deal more effectivelywith climatic events such as drought may serve us well inpreparing proper response strategies to long-term climate-related issues.
Global concern exists within the scientific and policycommunities about the inability of governments to respondto drought in an effective and timely manner. In the pastdecade, numerous 'calls for action' for improved droughtplanning and management have been issued by nationalgovernments, professional organizations, internationalorganizations, and others. The challenge of changing theperception of policy makers and scientists worldwide aboutdrought is a formidable one. The typical mode of operationfor government in dealing with natural hazards is crisismanagement. It is indeed a difficult task for government toengage in long-range planning. However, the progress cur-rently being made in planning for future drought demon-strates a new awareness and improved understanding ofdrought and its economic, social and environmental impacts.
United States
In the past decade, droughts have been a prevalent feature ofthe American landscape. These droughts have resulted insignificant impacts in a myriad of sectors, including agricul-ture, transportation, energy, recreation and health; they havealso had adverse environmental consequences. In society'sattempt to cope with the effects of these extended periods ofwater shortage in recent years, the inadequacy of federalcontingency planning efforts has been confirmed once again.The inability of the United States government to respondeffectively has also illustrated the inflexibility of existingwater management systems and policies as well as the lack ofcoordination between and within levels of government.
Previous studies have demonstrated that the impacts ofboth short-term and multi-year drought in the United Stateshave been aggravated by poorly conceived or nonexistent

8 REDUCING THE IMPACTS OF DROUGHT 153
assessment and response efforts by governments. Theseefforts have been characterized as largely ineffective, poorlycoordinated, and untimely (General Accounting Office 1979;Wilhite et al 1986; Wilhite and Easterling 1987). As a result,there have been numerous 'calls for action' by regional andnational organizations for the development of a nationaldrought policy to coordinate federal response to drought.These calls include recommendations from the WesternGovernors' Policy Office (1978), General Accounting Office(1979), National Academy of Sciences (1986), InterstateConference on Water Policy (1987), Environmental Protec-tion Agency (Smith and Tirpak 1989), Great Lakes Commis-sion (1990), and the American Meteorological Society(Orville 1990). The call from the Environmental ProtectionAgency (EPA) has come about as a result of the concern thatexists about a possible increase in the frequency and severityof extreme events in association with projected changes inclimate because of increasing concentrations of atmospherictrace gases.
Despite the numerous calls for the development of anational drought policy and plan, the federal governmenthas not acted on these recommendations. The primaryreason for the lack of progress by federal agencies seems to bethe unique character and multidisciplinary nature of droughtand the cross-cutting responsibilities of federal agencies fordrought assessment and response programs. Clearly, a singlefederal agency must take the lead in coordinating the devel-opment of a national plan. It is less clear which federalagency should assume this responsibility. In the final analy-sis, it may take an executive order to initiate the process atthis level. In the meantime, progress in drought managementat the federal level has been sluggish and agency-specific (e.g.Corps of Engineers, Bureau of Reclamation).
Because of the factors mentioned above and an apparentlack of appreciation by federal agencies of the complexityand seriousness of drought management issues faced bystates, it became clear to many states during the mid-1980sthat progress toward a higher level of preparedness would beachieved only if they took the lead. Historically, state govern-ments have played a passive role in governmental efforts toassess and respond to drought. During the widespread andsevere drought of 1976-7, for example, no state had prepareda formal drought response strategy. In 1982, only three stateshad developed plans: South Dakota, New York and Color-ado. Generally speaking, states have relied on the federalgovernment to come to their rescue when water shortagesreach near-disaster proportions by providing relief todrought victims.
At present, 23 states have prepared some type of formaldrought contingency plan (Wilhite 1991a). The pattern ofstates with drought plans is illustrated in Fig. 1. This patternis complex and can be only partially explained on the basis ofthe climatology of drought. Impediments to plan develop-
ment were discussed earlier in the chapter. However, eachstate's decision to develop (or not to develop) a drought planis based on specific climatological, political, economic anddemographic factors. An analysis of the relative importanceof these factors has been completed but will not be discussedhere (Wilhite and Rhodes 1994). For those states that havedeveloped plans, planning efforts have often been conductedin conjunction with an overall water management planninginitiative. Clearly, states can now be labelled policy innova-tors in drought planning.
An examination of existing state drought plans revealsthat they have certain key elements in common. Administra-tively, a task force is responsible for the operation of thesystem and is directly accountable to the governor. The taskforce keeps the governor advised of water availability andpotential problem areas; it also recommends policy optionsfor consideration. Operationally, drought plans have threefeatures in common. First, a water availability committeecontinuously monitors water conditions and prepares out-looks a month or season in advance. Since most of theinformation necessary to monitor water conditions compre-hensively (i.e. precipitation and temperature, streamflow,groundwater levels, snowpack, soil moisture, meteorologicalforecasts) is available from state or federal agencies, theprimary role of the committee is to coordinate the collectionand analysis of this information and the delivery of productsto decision makers on a timely basis. The committee assimi-lates this information and issues timely reports and recom-mendations. Second, a formal mechanism usually exists toassess the potential impacts of water shortages on the mostimportant economic sectors. In some states this task isaccomplished by a single committee or, more commonly,separate working groups are established to address eachsector. Third, a committee or the task force referred topreviously considers current and potential impacts andrecommends response options to the governor.
Although many of the mitigative programs implementedby states during recent droughts can be characterized asemergency actions taken to alleviate the crisis at hand, theseactions were often quite successful. As states gain moreexperience assessing and responding to drought, futureactions will undoubtedly become more timely and effective.State drought preparedness plans will become broader inscope, addressing a wider range of potential mitigativeactions, including more meaningful levels of intergovern-mental coordination. In time this will help states avoid orreduce the impacts, conflicts and personal hardships asso-ciated with drought. To be successful, these plans should beintegrated with local, regional and national plans, if theyexist.
Fortunately, many resources are now available to assistgovernments in the drought planning process. The existenceof model plans (Western States Water Council 1987; Wilhite

154 III CLIMATE VARIABILITY AND VULNERABILITY
! l § | | | States with plans
States developing plans
Figure 1: States in the contiguous United States with drought plans, as of 1991. (Alaska and Hawaii have not prepared drought plans.)
1990) and 23 state plans provide a critical reference for statesdesiring to develop a plan or revise an existing plan. Inaddition, several regional organizations have considerableexperience in drought planning and can assist states in plandevelopment (e.g. Delaware River Basin Commission, GreatLakes Commission, Western Governors' Association).
South Africa
Actions taken by the South African government in responseto droughts have typically been poorly coordinated andassistance programs have been largely ineffective (C. R.Baard, personal communication 1985). According to Baard,the government has had difficulty assessing drought impactand making subsequent declarations, and no routine com-prehensive evaluation of government drought policy andresponse efforts has been completed.
For many decades, drought assistance programs in SouthAfrica concentrated mainly on providing relief to the live-stock industry, with little attention to crop farming, either
dryland or irrigated (Wilhite 1987). The rationale behind thisemphasis on the livestock industry in South Africa has beenthat 85% of all agricultural land in the country remainsunder native pastures, most of which lie in the dry zones ofthe western and northwestern part of the country. Theincidence of drought in these drier zones is about one year inthree. Only 15% of South Africa receives precipitation inexcess of 500 millimeters per year. A serious drought thatbegan in 1978 and affected, to varying degrees, 75% of SouthAfrica resulted in significant expenditures by the governmentfor drought relief. For example, during the 1984-5 fiscal yearthe government spent approximately R447 million in sup-port of various relief programs (C. R. Baard, personalcommunication 1985). During the years 1987-9 the govern-ment allocated R1300 million to drought and flood reliefschemes (Bruwer 1990). Expenditures of this magnituderepresent a significant expenditure of funds and illustrate theserious threats that natural disasters pose to the country.
In the decades immediately preceding the 1980s, droughtrelief was provided through a phased approach, but only to

8 REDUCING THE IMPACTS OF DROUGHT 155
farmers in those areas officially designated by the govern-ment (Wilhite 1987). The principal purpose of these assist-ance programs was to help livestock farmers preserve theirherds until dry conditions eased. This assistance wasintended to apply only to extended or disaster droughts,although it was often difficult to distinguish between theseand 'normal' droughts. Assistance provided was generally inthe form of rebates (phase 1) for transportation costsincurred in importing livestock feed to the affected area or inshipping animals to areas where grass was available. Ifdrought conditions continued to deteriorate, loans to pur-chase livestock feed (phase 2) were then made through theAgricultural Credit Board. A continuation of drought con-ditions brought about the availability of subsidies from thegovernment to farmers to help pay for feed (phase 3). One ofthe principal difficulties with this phased approach was that itdid not encourage farmers to adopt production strategiesthat favored a minimization of risk to the agriculturalresource base (soil, water and vegetation), an approach morein harmony with environmental constraints (Bruwer 1990).Indeed, farmers prefer to strive for maximum production,regardless of the potential effects on the resource base.
After 1980, the drought relief scheme was modified, plac-ing greater emphasis on the preservation of the agriculturalresource base and the self-sufficiency of livestock farmers toendure droughts of other than disaster proportions (Bruwer1990). The current approach requires a reduction in stocknumbers as a prerequisite for eligibility for the forms of reliefavailable during a 'disaster' drought. In order to facilitatethis approach, the country was divided into grazing capacityzones. Grazing capacity is defined as the number of hectaresper livestock unit which can be kept and maintained on thenatural veld or grassland, as well as planted pastures, cropresidues and any other fodder produced on the farm. Thisnew relief scheme provided for rebates on the transportationcosts of livestock feed, incentives for stock reduction, loansand subsidies for the cost of livestock feeds in order tomaintain the herd nucleus, and subsidies for finishing stockin feedlots. Incentives were in the form of monthly paymentsto farmers and were calculated on a per livestock unit basis.Consideration was given to the type of stock (i.e. large versussmall) in the calculation of incentives. Other types of assist-ance now available to farmers during droughts include awater quota subsidy for irrigators and incentives for convert-ing marginal cultivated lands to perennial pasture crops inboth summer and winter rainfall zones.
To administer the new drought policy and relief scheme aninstitutional structure was established. This structureincluded a National Drought Committee (NDC), withmultiagency representation, to advise the Minister of Agri-culture on drought assistance matters and to scrutinizeapplications for assistance from affected areas (Bruwer
1989). District Drought Committees (DDC) were also estab-lished at the local level to consider all applications for thedesignation or revocation of disaster drought areas accord-ing to the criteria specified by the NDC. The NDC isresponsible for approving or rejecting these applications.The DDC is composed of the magistrate (chair) and rep-resentatives of the District Farmers' Union, AgriculturalCredit Committee, Soil Conservation Committee, and theDepartment of Agriculture and Water Supply.
On the basis of experiences with the new droughtpolicy during the 1980s, the government of South Africa isconvinced that the new relief scheme has contributed sig-nificantly to sustained agricultural production and develop-ment, helped to maintain rural communities and infrastruc-ture, counteracted unemployment, reduced politicalpressure, and increased cooperation between agriculturalgroups and government, thus promoting mutual acceptanceof responsibility for coping with disasters (Bruwer 1990).However, Bruwer has noted some deficiencies and shortcom-ings of the current system. These include the lack of adequateindices to identify disaster droughts, lack of suitable assess-ment procedures and inadequate monitoring techniques(including an improved weather station network). A con-siderable amount of drought-related research also needs tobe undertaken, including post-drought audits of past reliefefforts.
To assist the DDCs with the evaluation of drought inten-sity and the determination of eligibility for drought relief, thegovernment recently implemented a scheme that provides forgreater uniformity, objectivity and accuracy in the assess-ment of drought impact. The main elements evaluated by theprocedure are climate, veld, pastures and crops, livestockand water (Roux 1991).
The process of developing a better approach to droughtmanagement in South Africa is not complete. The govern-ment continues to strive for better ways to reduce the risk ofdrought through proactive measures. According to Bruwer,'society is demanding a more rational, cost effective andproactive approach' for future drought relief schemes. It isessential that this approach reduce the taxpayer's burden andprovide incentives for diminishing natural resourcedegradation.
Australia
The Australian constitution does not delegate specificpowers covering natural disaster relief to the federal govern-ment. These powers belong primarily to the states, which, asa result, have taken a more active role in drought responsethan state governments in the United States and elsewhere.
Before 1971, natural disaster relief and restoration wasprovided at a state's request by joint federal/state financing

156 III CLIMATE VARIABILITY AND VULNERABILITY
Table 4. Expenditures in Australian states under Natural Disaster Relief Arrangements, by type of disaster, 1970-1 to 1983-
4 (A$ thousands)
NewSouthWales Victoria Queensland
156233143
—
278551652208
227689608
5198263300
SouthAustralia
—
—
1358092572225
——
273804600
WesternAustralia
—
—
3023179998070
1256020142
50811265322100
Tasmania
596—
—
————
29512821900
NorthernTerritory
—
—
——————
Total
194583601
987160
5769382122692716993
10972046002
181738121 500
1970-11971-21972-31 9 7 3 ^1974-51975-61976-71977-81978-91979-801980-11981-21982-31983—4(estimate)
Total
3239458—
987160—
112026203013
—
66810310185364521500
184570
——————
162612281422
———
347968100
47172 176582 57042 101628 4073 — 571067
Source: National Drought Consultative Committee (1984).
on a one-to-one cost-sharing basis. No limit was set on thelevel of funding that could be provided by the federalgovernment. In 1971 the Natural Disaster Relief Arrange-ments (NDRA) were established, whereby states wereexpected to meet a certain base level or threshold of expendi-tures for disaster relief from their own resources (Depart-ment of Primary Industry 1984). Disasters provided for inthis arrangement are droughts, cyclones, storms, floods andbush fires. These expenditure thresholds were set accordingto 1969-70 state budget receipts and therefore variedbetween states. The base levels were raised in 1978 and 1984(National Drought Consultative Committee 1984; Keating1984). Under the NDRA system, the federal governmentagreed to provide full reimbursement of eligible expendituresafter the thresholds for state expenditures on naturaldisasters were reached. The NDRA formalized, for the firsttime, joint federal-state natural disaster relief arrangements.
At the time of the establishment of NDRA, a special set ofcore measures (i.e. federal government-approved droughtassistance measures) had evolved in each state on the basis of30 years of government involvement in disaster relief. Thesemeasures were particularity relevant to the needs of eachstate because they had been designed by state government inresponse to its own disaster-related experiences.
Tables 4 and 5 provide data on state and federal expendi-tures for drought aid from 1970-1 to 1983-4 under theNDRA. The magnitude of state expenditures is significant,
especially when compared with the limited financial respon-sibility of states in the United States. The total for all stateswas just over AS570 million. Of this total, approximatelyA$180 million was expended during 1982-3 and A$120million during 1983—4. Federal expenditures to the states fordrought aid under the NDRA arrangements (Table 5) werejust under A$370 million, or about A$200 million less thanthe total state expenditures. The largest share of the assist-ance was provided to Queensland and New South Wales.
In addition to the cost-sharing measures described above,two federal drought assistance schemes were availableduring the 1982-3 drought. These were the Drought ReliefFodder Subsidy Scheme and the Drought Relief InterestSubsidy Scheme (National Drought Consultative Com-mittee 1984). The Fodder Subsidy Scheme provided a pay-ment to drought-declared primary producers to help defraythe cost of fodder for sheep and cattle. The administrativecosts of this program were covered by the states. The amountof the subsidy was based on 50% of the price of feed wheatand the nutritive value of the fodder relative to wheat;Commonwealth expenditures under this program wereabout A$104 million during 1982-3 and A$18 millionthrough February 1984.
The Drought Relief Interest Subsidy Scheme providedpayments to eligible primary producers to cover all interestpayments exceeding 12% per year. To be eligible, producershad to have been drought declared and could not have

8 REDUCING THE IMPACTS OF DROUGHT 157
Table 5. Commonwealth of Australia payments under Natural Disaster Relief Arrangements, estimated by type of disaster,1970-1 to 1983-4 (A$ thousands)
NewSouthWales Victoria Queensland
SouthAustralia
WesternAustralia Tasmania
NorthernTerritory Total
1970-11971-21972-31973-41974^51975-61976-71977-81978-91979-801980-11981-21982-31983-4(estimate)
Total
450——38
114—
7791458
743—
42447145543255711800
104940
——————
716399173
-229——
226954600
28354
136321502
46————
309129421224
147805162
3729745300
124976
———————
123505430-270-737
—183684300
39441
——————
21341526960366922
1352322397731
15300
69154
16——————————
267—
600
833
— 14098— 1502— 46— 38— 114
— 3629— 32567— 15 324— 7647— 70013— 22222— 118648— 81900
— 367748
Source: National Drought Consultative Committee (1984).
available financial assets in excess of 12% of the total farmdebt. Expenditures for the program, not including adminis-trative costs, were about A$3 million in 1982-3 and A$23million through February 1984.
The Livestock and Grain Producers Association (LGPA)of New South Wales strongly commended the state andfederal governments of Australia for their drought assistancemeasures. LGPA based its conclusions on the achievement ofwhat it considers to be the first priority of drought aid inAustralia - the preservation of the national sheep and cattleherd. Through the preservation of these resources, farm andnon-farm income was able to recover more quickly than afterprevious episodes of severe drought. LGPA estimated that,had government not intervened in 1982-3, some 15-20million sheep would have been slaughtered. As a result, post-drought recovery would have been delayed, at a cost to thenational economy of A$500 million over a 5-year period(Anonymous 1983). However, the Australian AgriculturalCouncil (1983) concluded, 'With the exception of conces-sional finance and information, existing policy measures,including those introduced during the current (1982-83)drought, do not perform well in achieving the objectives ofdrought policy which it considered important. In summary,the nearly $300 million of expenditures was not costeffective.'
These contrasting views of the cost effectiveness of recentdrought measures in Australia reflect the recent controversy
over state and federal involvement in drought aid. Severalother studies have been completed (National Farmers' Fede-ration 1982; South Australian Department of Agriculture1983; Stott 1983), each providing recommendations forfuture drought policy. A National Drought ConsultativeCommittee (NDCC) was appointed by the Minister forPrimary Industry in 1984 to review Australian droughtpolicy.
In April 1989 the Commonwealth government decided toremove drought from the NDRA scheme described pre-viously. Following this action, a drought policy review wasrecommended by the Commonwealth in May 1989 under theleadership of the Minister for Primary Industries andEnergy. The objectives of this review (Drought PolicyReview Task Force 1990) were to (1) identify policy optionsthat encourage primary producers and other segments ofrural Australia to adopt self-reliant approaches to the man-agement of drought; (2) consider the integration of droughtpolicy with other relevant policy issues; and (3) advise onpriorities for Commonwealth government action in minimiz-ing the effects of drought in the rural sector. An importantaspect of this policy review was to examine the extent towhich the policies of the Commonwealth government pro-mote more effective farm management given the seasonalityof climates and climatic variability. The task force concludedthat the relief measures that have been used in the past havenot provided a positive incentive for effective farm manage-

158 III CLIMATE VARIABILITY AND VULNERABILITY
ment or responsible land management. On the contrary, itwas determined that common misperceptions of droughthave guided past policies by government, leading to a processof crisis management or 'gambling on the weather' by theagricultural community (Drought Policy Review Task Force1990).
Several objectives of a newly defined national droughtpolicy emerged from the task force review. These objectivesare to (1) encourage primary producers and other segmentsof rural Australia to adopt self-reliant approaches in manag-ing for climatic variability; (2) facilitate the maintenance andprotection of Australia's agricultural and environmentalresource base during periods of increasing climate stress; and(3) facilitate the early recovery of agricultural and ruralindustries consistent with long-term sustainable levels.Within this framework, numerous more specific objectives ofthese policies were stated. The primary thrust of this changein national policy is from one of crisis management to one ofrisk management. The intent of the task force was to applythis approach at two management levels: farm and govern-ment policy. This integrated approach is the foundation ofthe proposed changes in national policy, changes that havemet with some resistance. The proposed changes are pre-sently under review.
ADVANCING DROUGHT PREPAREDNESSIN THE 1990s
Drought policy versus planning objectives
Drought planning is defined as actions taken by individualcitizens, industry, government, and others in advance ofdrought for the purpose of mitigating some of the impactsand conflicts associated with its occurrence (Wilhite 19916).From an institutional perspective, a drought preparednessplan should include, but is not limited to, the followingelements:
(1) A comprehensive, integrated monitoring/early warningsystem to provide decision makers at all levels with infor-mation about the onset, continuation and termination ofdrought conditions and their severity.
(2) Operational impact assessment programs to determinereliably the likely effects of drought in a timely manner.
(3) An institutional structure for coordinating governmentalactions, including information flow within and betweenlevels of government, and drought declaration and revo-cation criteria and procedures.
(4) Appropriate drought assistance programs (both technicaland relief) with predetermined eligibility and implemen-tation criteria.
(5) Financial resources to maintain operational programs andto initiate research required to support drought assessmentand response activities.
(6) Educational and public awareness programs designed topromote an understanding and adoption of appropriatedrought mitigation and water conservation strategiesamong the various economic sectors most affected bydrought.
To be successful, drought planning must be integratedbetween levels of government, involving the private sector,where appropriate, early in the planning process. As we haveseen from the discussion presented in the previous section,progress has been made by some governments in taking amore proactive approach to drought management. For themajority of nations, however, much needs to be done. Thisfinal section of this chapter presents some key factors thatshould be considered by governments attempting to adoptthe risk management approach in future drought responseefforts.
Prior to the development of a drought preparedness plan,government officials should formulate a drought policy todefine what they hope to achieve with that plan (Wilhite19916). The objectives of a drought policy differ from thoseof a drought plan. There must be a clear distinction of thesedifferences at the outset of the planning process. A droughtpolicy will be broadly stated and should express the purposeof government involvement in drought assessment, mitiga-tion and assistance programs. Drought plan objectives aremore specific and action oriented. Typically, the objectives ofdrought policy have not been stated explicitly by govern-ment. What generally exists in many countries, including theUnited States, is a de facto policy, one defined by the mostpressing needs of the moment. Ironically, under these cir-cumstances it is the specific instruments of that policy (suchas assistance measures, including grants and low-interestloans, and so forth), particularly at the federal level, thatdefine the objectives of the policy. Without clearly stateddrought policy objectives, the effectiveness of assessment andresponse activities is difficult to evaluate.
The objectives of drought policy should encourage orprovide incentives for agricultural producers, municipalities,and other water-dependent sectors or groups to adopt appro-priate and efficient management practices that help to alle-viate the effects of drought. Past relief measures have, attimes, discouraged the adoption of appropriate managementtechniques. Assistance should also be provided in an equi-table, consistent and predictable manner to all withoutregard to economic circumstances, industry or geographicregion. Assistance can be provided in the form of technicalaid or relief measures. Whatever the form, those at riskwould know what to expect from government duringdrought and thus would be better prepared to manage risks.At least one objective should also seek to protect the naturaland agricultural resource base. Degradation of these

8 REDUCING THE IMPACTS OF DROUGHT 159
resources can result in spiralling economic, environmentaland social costs.
The objectives of drought policy can be achieved only ifthey are formulated at the initiation of the planning process.The entire planning process can then be structured aroundthese basic themes. One question that government officialsmust address is the purpose and role of government involve-ment in drought mitigation efforts. Other questions shouldaddress the scope of the plan; identification of geographicareas, economic sectors and population groups that are mostat risk; principal environmental concerns; and potentialhuman and financial resources to invest in the planningprocess. Answers to these and other questions should help todetermine the objectives of drought policy and thereforeprovide a focus for the drought planning process.
Constraints to drought planning
Institutional, political, budgetary and human resources con-straints often make drought planning difficult (Wilhite andEasterling 1987, 1991). One major constraint that existsworldwide is a lack of understanding of drought by politi-cians, policy makers, technical staff and the general public.Lack of communication and cooperation among scientists,and inadequate communication between scientists andpolicy makers, on the significance of drought planning, alsocomplicate efforts to initiate drought planning. Becausedrought occurs infrequently in some regions, governmentsmay ignore the problem or give it low priority. Inadequatefinancial resources to provide assistance and competinginstitutional jurisdictions between and within levels ofgovernment may also serve to discourage governments fromundertaking drought planning. Other constraints includetechnological limits such as difficulties in predicting anddetecting drought, insufficient data bases, and inappropriatemitigation technologies.
Policy makers and bureaucrats should understand thatdroughts, like floods, are a normal feature of climate. Theirrecurrence is inevitable. Drought manifests itself in ways thatspan the jurisdiction of numerous bureaucratic organiza-tions (e.g. agricultural, water resources, health) and levels ofgovernment (e.g. federal, state and local). Competing inter-ests, institutional rivalry and 'turf protection' impede thedevelopment of concise drought assessment and responseinitiatives. To solve these problems, policy makers andbureaucrats, as well as the general public, must be educatedabout the consequences of drought and the advantages ofpreparedness. Drought planning requires input by severaldisciplines, and decision makers must play an integral role inthis process.
The development of a drought plan is a positive step thatdemonstrates governmental concern about the effects of a
potentially hazardous and recurring phenomenon. Planning,if undertaken properly and implemented during non-drought periods, can improve governmental ability torespond in a timely and effective manner during periods ofcrisis. Thus, planning can mitigate and, in some cases,prevent some impacts while reducing physical and emotionalhardship. Planning is a dynamic process that must incorpor-ate new technologies and take into consideration socioeco-nomic, agricultural and political trends.
It is sometimes difficult to determine the benefits ofdrought planning versus the costs of drought. There is littledoubt that drought preparedness requires financial andhuman resources that are, at times, scarce. This cost has beenand will continue to be an impediment to the development ofdrought plans. Preparedness costs are fixed and occur nowwhile drought costs are uncertain and will occur later.Further complicating this issue is the fact that the costs ofdrought are not solely economic. They must also be stated interms of human suffering and the degradation of the physicalenvironment, items whose values are inherently difficult toestimate.
Post-drought evaluations have shown assessment andresponse efforts of state and federal governments with a lowlevel of preparedness to be largely ineffective, poorly coordi-nated, untimely and economically inefficient. Unanticipatedexpenditures for drought relief programs are devastating togovernment budgets. For example, during the droughts ofthe mid-1970s in the United States, specifically 1974, 1976and 1977, the federal government spent more than $7 billionon drought relief programs. As a result of the drought of1988, the federal government spent $3.9 billion on droughtrelief programs and $2.5 billion on farm credit programs. Adisaster relief package was also passed by the US Congress inAugust 1989 in response to a continuation of droughtconditions. Between 1970 and 1984, state and federal govern-ment in Australia expended more than A$925 million ondrought relief under the Natural Disaster Relief Arrange-ments. The Republic of South Africa has spent R2.5 billionon drought relief in the past decade. When compared withthese expenditures, a small investment in mitigation pro-grams in advance of drought would seem to be a soundeconomic decision. In developing countries, droughts devas-tate regional and national economies and significantly hinderthe development process.
It is important to remind decision makers and policyofficials that, in most instances, drought planning efforts willuse existing political and institutional structures at appropri-ate levels of government, thus minimizing start-up andmaintenance costs. It is also quite likely that some savingsmay be realized as a result of improved coordination and theelimination of some duplication of effort. Also, droughtplans should be incorporated into general natural disaster

160 III CLIMATE VARIABILITY AND VULNERABILITY
and/or water management plans wherever possible. Thiswould reduce the cost of drought preparedness substantially.Politicians and many other decision makers must simply bebetter informed about drought, its impacts, and alternativemanagement approaches and how existing information andtechnology can be used more effectively to reduce the impactof drought at a relatively modest cost.
The development of a drought policy and plan: the ten-step process
A planning process was developed recently in the UnitedStates in order to facilitate the preparation of droughtcontingency plans by state government decision makers(Wilhite 1990, 1991). The proposed process is intended toassist government decision makers in improving droughtmitigation efforts through more timely, effective and efficientassessment and response activities. The framework belowpresents the principal steps in the planning process in orderfor government to address its drought-related concerns.However, the process is intended to be flexible (i.e. govern-ments can add, delete or modify steps as necessary).
The intent here is not to present a detailed discussion ofeach of these steps. What is included is a very brief descrip-tion of the purpose and elements of each step as these relateto the overall planning process. This process must be modi-fied or adapted to each region, adding or deleting steps asappropriate.
Step 1. Appointment of national I state drought task force orcommitteeThe drought task force (DTF) or committee should beappointed by the president, governor or designated govern-ment official and include representatives from all relevantagencies of government. This task force will be composed ofsenior policy makers.
The DTF has two purposes. First, during plan develop-ment, the DTF will supervise and coordinate the develop-ment of the plan. Second, after the plan is implemented andduring times of drought when the plan is activated, the DTFwill assume the role of policy coordinator - reviewing andrecommending alternative policy response options to theappropriate policy official. The makeup of the DTF shouldrecognize the multidisciplinary nature of drought and itsimpacts and include representatives of both state and federalgovernment. The DTF should consider including a represen-tative of the media or a public information specialist in anadvisory capacity so that the proper mechanisms are incor-porated into the plan to ensure public awareness of droughtseverity and the actions implemented by government.
Environmental and public interest groups may also be
included on the DTF, or they may serve in an advisorycapacity. The actual makeup of the task force is expected tobe highly variable between states or countries, reflecting thevariety of economic sectors affected and political infrastruc-ture. Membership should be kept relatively small so that sizedoes not become an impediment to the planning process.What is envisioned is the development of an infrastructurethat can not only assess and respond to short-term reduc-tions in water supply due to drought, but also can addressquestions of changes in vulnerability in the long term.
Step 2. Statement of drought policy and planning objectivesThe first official action of the DTF will be the determinationof a drought policy. This policy will lead to the developmentof a general statement of purpose for the drought plan.
A general statement of purpose for a drought plan couldbe to provide an effective and systematic means of assessingand responding to drought conditions. The DTF then mustidentify specific objectives of the plan. Drought plan objec-tives and their applications will vary between countries orstates, reflecting the unique physical, environmental, socio-economic and political characteristics of each location. Someobjectives that might be considered include:
(1) To provide timely and systematic data collection, analysisand dissemination of drought-related information.
(2) To establish proper criteria to identify and designatedrought-affected areas of the state and to trigger theinitiation and termination of various assessment and res-ponse activities by governmental agencies during droughtemergencies.
(3) To provide an organizational structure that assures infor-mation flow between and within levels of government anddefines the duties and responsibilities of all agencies withrespect to drought. To ensure adequate coordinationbetween the federal and state governments, this structureshould be integrated with national drought policies (if theyexist).
(4) To maintain a current inventory of assistance programsused in assessing and responding to drought emergenciesand provide a set of appropriate action recommendations.
(5) To provide a mechanism to assure the timely and accurateassessment of drought impact on agriculture, industry,municipalities, wildlife, health, and other areas asappropriate.
(6) To provide accurate and timely information to the media inorder to keep the public informed of current conditions andresponse actions.
(7) To establish and pursue a strategy to remove obstacles tothe equitable allocation of water during shortages and toprovide incentives to encourage water conservation.
(8) To establish a set of procedures to evaluate and revise theplan on a continuous basis in order to keep the planresponsive to the needs of the state.

8 REDUCING THE IMPACTS OF DROUGHT 161
Step 3. Resolving conflict between environmental andeconomic sectorsPolitical, social and economic values often clash duringdrought conditions as competition for scarce water resourcesintensifies, and it may be difficult to achieve compromises. Toreduce the risk of conflict between water users during periodsof shortage, it is essential for the public to receive a balancedinterpretation of changing conditions through the media.The DTF should ensure that frequent, thorough and accur-ate news releases are issued to explain changing conditionsand complex problem areas. To lessen conflict and developsatisfactory solutions, it is essential that the views of citizensand public and environmental interest groups be consideredin the drought planning process at an early stage. Althoughthe level of involvement of these groups will no doubt varynotably, the power of public interest groups in policy makingis considerable. Public interest organizations have initiatedand participated in the development of natural resourcepolicies and plans for some time and have considerableexperience with this process. The involvement of thesegroups in determining appropriate policy goals strengthensthe overall policy and plan. Moreover, this involvementassures that the diverse values of society are adequatelyrepresented in the policy and plan.
Step 4. Inventory of natural, biological, and human resourcesand financial and legal constraintsThe DTF should undertake an inventory of natural, biologi-cal and human resources, including the identification offinancial and legal constraints. Resources include, for exam-ple, natural and biological resources, human expertise,infrastructure, and capital available to government. Finan-cial constraints include costs of hauling water or hay, newprogram or data collection costs, and so forth; legal con-straints include user water rights, existing public trust laws,methods available to control usage, requirements for con-tingency plans for water suppliers, and emergency and otherpowers of the government during water shortages. An inven-tory of these resources would reveal assets and liabilities thatmight have an effect on the planning process; in addition, acomprehensive assessment of available resources wouldprovide the information necessary for further action by thetask force.
Step 5. Development of the drought planThe DTF will be the coordinating body for the developmentof a drought plan. The plan is envisioned to follow a stepwiseor phased approach as water conditions deteriorate andmore stringent actions are needed. Thresholds must beestablished such that, when exceeded, certain actions aretriggered within government agencies, as defined by the
FederalGovernment
Policy Responses ,
Situation ReportsDisaster Requests
Governor
Situation ReportsLegislation ^
Legislature
DroughtTaskForce Conflict Resolution
StateDroughtAdvisory
Committee(DAC) (optional)
Figure 2: Linkages and suggested organizational components ofthe drought plan.
structure of the plan. A flow chart illustrating these linkagesand the suggested components of the drought plan is shownin Fig. 2.
A drought plan possesses three essential elements: moni-toring, impact assessment and response. These elements arethe basis for three committees: (1) Water Availability andOutlook Committee (WAOC); (2) Impact Assessment Com-mittee (IAC); and (3) Drought Response Committee orDrought Task Force (DTF). Although each committee hasits own distinct activities, formal linkages will need to beincorporated in the plan for the committees to functionproperly and be responsive to state needs and changingconditions. The WAOC's activities would include definingdrought and developing triggers, identifying drought man-agement areas, developing a monitoring system for drought,completing an inventory of observation networks, determin-ing primary users and their needs, and developing data andinformation delivery systems. Membership of the committeeshould include representatives from agencies with responsi-bilities for forecasting and monitoring the principal indi-cators of the water balance.
During periods of drought, impacts will be far-reachingand cut across economic sectors and the responsibilities ofgovernment agencies. The IAC will represent those economicsectors most likely to be affected by drought. The IACchairperson should be a permanent member of the DTF; therest of the committee should consist of an interagency team

162 III CLIMATE VARIABILITY AND VULNERABILITY
of agency heads or their representatives. The I AC shouldconsider both direct and indirect losses resulting fromdrought, since its effects ripple through the economy.Because of the obvious dependency of the IAC on theWAOC, frequent communication is essential. What isrecommended is a series of working groups responsible foranticipating and identifying drought-related impacts in eacheconomic sector. The responsibility of the IAC is to coordi-nate the activities of each of the working groups and makepolicy response recommendations to the DTF.
A drought response committee comprising senior-levelofficials will act on the information and recommendations ofthe IAC and evaluate the state and federal programs avail-able to assist agricultural producers, municipalities, andothers during times of emergency. The makeup of thiscommittee is envisioned to be roughly the same as that of theDTF. Therefore, for maximum efficiency the DTF canassume this function once the plan has been developed andfully implemented. The DTF will present its recommenda-tions to the governor.
During the plan development process, the DTF shouldmake an inventory of all forms of assistance available fromgovernment during severe drought and evaluate these pro-grams for their ability to address short-term emergencysituations and as long-term mitigation programs to reducevulnerability to drought. The DTF should also be aware ofthe proper protocol for requesting federal assistance.
Step 6. Identification of research needs and institutional gapsThe purpose of this step is to identify research needed insupport of the objectives of the drought plan and to recom-mend research necessary to remove deficiencies that mayexist. The research needs and institutional gaps will beidentified by the monitoring, impact assessment and res-ponse committees. These committees will make recommen-dations to the national/state drought committee for furtheraction.
Step 7. Synthesis of scientific and policy issuesDirect and extensive contact is required between scientistsand policy makers to distinguish what is feasible from what isdesirable. Typically little contact occurs between these twogroups. The purpose of this step is to identify ways to breakdown the barriers that exist between disciplines and betweenscientists and policy makers.
Step 8. Implementation of the drought planThe drought plan should be implemented by the DTF to givemaximum visibility to the program and credit to the agenciesand organizations that have a leadership or supporting rolein its operation. The plan should be tested under simulateddrought conditions before it is implemented, and simulation
exercises should be carried out periodically following imple-mentation. It is also suggested that announcement andimplementation occur just before the most drought-sensitiveseason to take advantage of inherent public interest.
Step 9. Development of multilevel educational and trainingprogramsEducational and training programs must be long term indesign, concentrating on a broad audience ranging frompolicy makers to extension personnel to individual citizens.
Educational and training programs should emphasizeseveral points. First, a greater level of understanding must beestablished to heighten public awareness of drought andwater conservation and the ways in which individual citizens,industry and government can help to mitigate impacts in theshort run. This educational process might begin with thedevelopment of a media awareness program. Second, theDTF should initiate an information program aimed ateducating the general population about drought anddrought management and what they can do as individuals toconserve water in the short run. Educational programs mustbe long term in design, concentrating on achieving a betterunderstanding of water conservation issues among elemen-tary school children. If such programs are not developed,governmental and public interest in and support for droughtplanning will wane during periods of non-drought con-ditions.
Step 10. Development of drought plan evaluation proceduresThe drought plan must be evaluated and revised periodicallyto remain responsive to the needs of each country. Twomodes of evaluation are recommended. The first is a contin-uous (every 1-2 years) evaluation and revision to adjust theplan in light of political, economic, technological and socialchanges. This mode of evaluation is intended to expressdrought planning as a dynamic process, rather than adiscrete event. The evaluation process is proposed to keep thedrought assessment and response system current and respon-sive to the needs of society. Following the initial establish-ment of the plan, it should be monitored routinely to ensurethat societal changes that may affect water supply and/ordemand or regulatory practices are considered for incor-poration.
The second mode of evaluation follows an episode ofsevere drought in which the plan was activated. A post-drought evaluation of the plan should be undertaken by anon-governmental organization to assure an unbiasedappraisal of the assessment and response actions. Institu-tional memory fades quickly following drought as a result ofchanges in political administration, natural attrition ofpersons in primary leadership positions, and the destructionof critical documentation of events and actions taken.

8 REDUCING THE IMPACTS OF DROUGHT 163
CONCLUSION
Post-drought audits of government response to droughthave demonstrated that the reactive or crisis managementapproach has led to ineffective, poorly coordinated anduntimely responses. Also, the magnitude of economic, socialand environmental losses in recent years has illustrated thevulnerability of all nations, developed and developing, toextended episodes of severe drought. Increased awarenessand understanding of drought have led many governments totake a more proactive approach toward drought manage-ment, thus attempting to reduce impacts in the short termand vulnerability in the long term. This approach promotesthe concept of increased harmony between governmentpolicy, land management practices and environmental con-straints, leading to more sustainable agricultural production.
This chapter documents some of the recent progress thathas been made in the United States, South Africa andAustralia in drought mitigation. In each case, this progress isthe direct result of a fundamental philosophical change bygovernment. The development of drought policies that pro-mote risk management rather than crisis management andthe preparation of contingency plans represent a proactivestep toward risk minimization and vulnerability reduction.Drought contingency plans promote greater coordinationwithin and between levels of government, improve pro-cedures for monitoring, assessing and responding to severewater shortages, and facilitate more efficient utilization ofnatural, financial and human resources.
REFERENCES
Anonymous. 1983. LGPA submits priorities for government assistancein future drought situations. Livestock and Grain Producer 6:1-3.
Australian Agricultural Council. 1983. An evaluation of existingdrought policies given the current drought experience. Report byStanding Committee on Agriculture Working Group, Canberra,Australia.
Bruwer, J. J. 1989. Drought Policy in the Republic of South Africa.Proceedings of the SARCCUS Workshop on Drought, Alpha Train-ing Center, June 1989.
Department of Primary Industry. 1984. Review of the Natural DisasterRelief Arrangements. Prepared for the National Drought Consulta-tive Committee, Canberra, Australia.
Drought Policy Review Task Force. 1990. National Drought Policy FinalReport. Canberra: Australian Government Publishing Service.
General Accounting Office. 1979. Federal Response to the 1976-77Drought: What Should Be Done Next? Report to the ComptrollerGeneral, Washington, DC.
Glantz, M. H. 1987. Drought and economic development in sub-Saharan Africa. In Planning for Drought: Toward a Reduction ofSocietal Vulnerability, ed. D. A. Wilhite and W. E. Easterling.Boulder: Westview Press.
Great Lakes Commission. 1990. A Guidebook to Drought Planning,Management and Water Level Changes in the Great Lakes. GreatLakes Commission.
Interstate Conference on Water Policy. 1987. Statement of Policy 1986-87. Interstate Conference on Water Policy, Washington, DC.
Keating, P. J. 1984. Payments to or for the states, the Northern Territoryand local government authorities, 1984-5. Treasurer of the Common-wealth of Australia, 1984-5. Budget Paper No. 7. Canberra, Australia.
National Academy of Sciences. 1986. The National Climate Program:Early Achievements and Future Directions. Washington, DC.
National Drought Consultative Committee. 1984. Drought assistance:financial arrangements. Notes from Meeting, March 28, 1984. Can-berra, Australia.
National Farmers' Federation. 1982. Drought Policy. Canberra, Austra-lia: National Farmers' Federation.
Orville, H. D. 1990. AMS Statement on Meteorological Drought.Bulletin of the American Meteorological Society 71:1021-3.
Pessoa, D. M. 1987. Drought in Northeast Brazil: impact and govern-ment response. In Planning for Drought: Toward a Reduction ofSocietal Vulnerability, ed. D. A. Wilhite and W. E. Easterling.Boulder: Westview Press.
Riebsame, W. E., Changnon, S. A. Jr and Karl, T. R. 1990. Drought andNatural Resources Management in the United States: Impacts andImplications of the 1987-89 Drought. Boulder: Westview Press.
Roux, P. W. 1991. South Africa devises a scheme to evaluate droughtintensity. Drought Network News 3(3): 18-23. Lincoln, Nebraska:International Drought Information Center, University of Nebraska.
Sinha, S. K., Kailasanathan, K. and Vasistha, A. K. 1987. Droughtmanagement in India: steps toward eliminating famines. In Planningfor Drought: Toward a Reduction of Societal Vulnerability, ed. D. A.Wilhite and W. E. Easterling. Boulder: Westview Press.
Smith, J. B. and D. Tirpak (eds.) 1989. The Potential Effects of GlobalClimate Change on the United States. Environmental ProtectionAgency (EPA-230-05-89-050).
South Australian Department of Agriculture. 1983. Rural adjustment:interim report on drought relief measures. Submission to IndustriesAssistance Commission Inquiry. South Australian Treasury Depart-ment, Adelaide, Australia.
Stott, K. J. 1983. An economic assessment of assistance measures for the1982-3 drought and for future droughts. Internal Report Series.Department of Agriculture, Victoria, Australia.
Thiruvengadachari, S. 1991. Satellite surveillance system for monitoringagricultural conditions in India. Paper presented at the DroughtManagement and Preparedness Training Seminar, Bangkok, Thai-land, March. Sponsored by International Drought InformationCenter, University of Nebraska, Lincoln, Nebraska, UNEP andNOAA.
Western Governors' Policy Office (WESTPO). 1978. ManagingResource Scarcity: Lessons from the Mid-Seventies Drought. Institutefor Policy Research.
Western States Water Council. 1987. A Modelfor Western State DroughtResponse and Planning. Western States Water Council.
WESTPO. 1977. Director of Federal Drought Assistance, 1977. Preparedby the Institute for Policy Research, WESTPO, for the WesternRegion Drought Action Task Force. Washington, DC: USDA.
Wilhite, D.A. 1986. Drought policy in the US and Australia: a compara-tive analysis. Water Resources Bulletin 22:425-38.
Wilhite, D. A. 1987. The role of government in planning for drought:where do we go from here? In Planning for Drought: Toward aReduction of Societal Vulnerability, ed. D. A. Wilhite and W. E.Easterling. Boulder: Westview Press.
Wilhite, D. A. 1990. Planning for Drought: A Process for State Govern-ment. IDIC Technical Report Series 90-1.
Wilhite, D. A. 1991a. Drought planning and state government: currentstatus. Bulletin of the American Meterological Society 72:1531-6.
Wilhite, D. A. 19916. Drought planning: a process for state government.Water Resources Bulletin 27(l):29-38.
Wilhite, D. A. and Easterling, W. E. (eds.) 1987. Planning for Drought:Toward a Reduction of Societal Vulnerability. Boulder: WestviewPress.
Wilhite, D. A. and Easterling, W. E. 1991. Drought Management andPreparedness Training Seminar for Asia and Pacific Regions. FinalReport, March. Lincoln, Nebraska: International Drought Infor-mation Center, University of Nebraska.
Wilhite, D. A. and Glantz, M. H. 1985. Understanding the droughtphenomenon: the role of definitions. Water International 10:111-20.
Wilhite, D. A. and Rhodes, S. L. 1994. State drought contingencyplanning: factors influencing plan development. Water International19:15-24.
Wilhite, D. A., Rosenberg, N. J. and Glantz, M. H. 1986. Improving

164 III CLIMATE VARIABILITY AND VULNERABILITY
federal response to drought. Journal of Climate and Applied Meteor-ology. 25:332-42.
World Meteorological Organization. 1986. Model Drought ResponsePlan. Memo to Permanent Representatives of Members of WMO, 14May. Geneva, Switzerland.

IV
The International Conference on the Impacts ofClimatic Variations and Sustainable Development inSemi-arid Regions (ICID)


9: Declaration of Fortaleza
International Conference on Impacts of Climatic Variations and SustainableDevelopment in Semi-arid Regions (ICID)
Fortaleza, Ceara, Brazil, 27 January to 1 February 1992
A contribution to the United Nations Conference on the Environment and Development(UNCED)
Sponsorship
Government of the State of Cearain conjunction withCeara State Federation of Industries (FIEC-CNI)Bank of the Northeast of Brazil (BNB)Esquel Group Foundation, Brazil (FGEB)
Organization
Esquel Group Foundation, Brazil
Support
National Research Council of Brazil (CNPq)Interamerican Development Bank (IDB)Institut Francais de Recherche Scientiflque pour leDeveloppement en Cooperation (ORSTOM)The Government of the NetherlandsJohn D. and Catherine T. MacArthur FoundationUnited Nations Development Program (UNDP)United Nations Environment Program (UNEP)World Bank (IBRD)Brazilian Institute for the Environment and RenewableNatural Resources (IBAMA)Federal University of CearaSecretariat for Science and Technology, Presidency of theRepublic (SCT)Brazilian Agricultural Research Company (EMBRAPA),Ministry of Agriculture
J. Macedo GroupWorld Meteorological Organization (WMO)United Nations Sudano-Sahelian Office (UNSO)
Site
Convention Center Edson Queiroz, Fortaleza, Ceara, Brazil
ICID
President of the ConferenceCiro Ferreira Gomes, former Governor of Ceara State
President of the International Advisory CommitteeTasso Ribeiro Jereissati, Governor of Ceara State
President of the National Advisory CommitteeFabio Feldman, Federal Deputy, President of the Environ-ment Commission
President of the Organizing CommitteeAntonio Rocha Magalhaes, Director of ICID
Presentation
The International Conference on Impacts of Climatic Varia-tions and Sustainable Development in Semi-arid Regions(ICID) brought together 800 participants including scien-tists, technicians, representatives of international and
167

168 IV ICID
national public and private sector organizations, decisionmakers, and politicians from 45 different countries in theworld. The event became an important opportunity for the 4-exchange of experiences and information among many coun-tries and regions.
During the Conference 63 papers were presented through-out 17 panel sessions, while 10 working groups met to carryout specific discussions. The outputs of the event include apolitical document - the Declaration of Fortaleza -approved in plenary session, and a summary of the discus-sions and recommendations of the 10 working groups. Bothdocuments were delivered to the UNCED Secretariat as anattempt to include relevant issues concerning semi-aridregions in the UNCED agenda.
This chapter presents the Declaration of Fortaleza.
THE DECLARATION OF FORTALEZA
Whereas:many semi-arid regions are economically marginal, thereforehighly vulnerable to any changes in the global climate, andoften lack the financial and technical resources required toinitiate major adaptations to environmental changes;there is a growing recognition of the need for internationalaction on the issues of global change, environmental degrada-tion and equity; and
there is great need for urgency arising out of current con-ditions in the semi-arid regions of dveloping areas:
1. We, women and men of the civil society, have met inFortaleza, State of Ceara, Brazil, from 27 January to 1February 1992, convened by the Government of the Stateof Ceara and Fundacao Grupo Esquel Brasil, with thesupport of several other national and international organi-zations. We are a multidisciplinary group of scientists,academics, government officers, social workers, environ-mentalists, politicians, religious leaders and other personsconcerned with the interactions between human beings andtheir natural and social environment, and have manydecades of study, research and practical experience in thedevelopment of semi-arid regions worldwide.
2. We address all women and men concerned with equitabledevelopment and a decent life for everyone in harmony withnature, and also the women and men empowered by societyto take the crucial decisions related to the welfare of presentand future generations.
3. We issue this Declaration at a particularly importantmoment, since in June 1992 the United Nations Conferenceon the Environment and Development (UNCED) will meetin Rio de Janeiro, Brazil. The determination, energies andresources of all countries of the world will be mobilized in agreat effort to stop the processes of environmental de-terioration that threaten our future. It would be a great lossto humanity if, on this occasion, the plight of semi-arid
regions and their environmental degradation are not recog-nized and discussed by the nations attending UNCED.Although semi-arid zones in all regions of the world are atrisk, our primary concern is the present and future con-ditions of people and their environment in the semi-aridregions of developing countries. These regions are charac-terized by their extreme vulnerability to highly variablerainfall regimes and inadequate human activities, and theyare places where great human suffering occurs: abjectpoverty, recurring famines and outmigration, uncertaintyof agricultural production from one year to the next, andconsequently uncertainty about the continuity of humansettlements and their rich cultures and civilizations.Though semi-arid regions have common problems, theyhave not sought sufficiently to strengthen each other bysharing experiences and knowledge.The deterioration of the environmental and human con-ditions in these regions, which in many cases includesignificant desertification processes, has widespread socio-economic consequences which affect directly and indirectlyall the regions of the world. In addition, as semi-aridecosystems are fragile they are highly susceptible to effectsof global warming and other environmental changesbrought about by unsound industrial and agriculturalactivities and unwise, unsustainable development practices.The specific recommendations widely discussed and sup-ported by the participants in ICID may be summarized inthe following basic principles, which should guide efforts todevelop semi-arid regions:
i. The origin of poverty and environmental degradationin these areas is basically socioeconomic and political.Any serious effort to develop those regions should bebased on socioeconomic strategies that include theparticipation of civil society and political commit-ment, structural reforms, land-tenure reform, access towater adequately managed and improved agriculturalpolicies at national and regional levels. The overallimprovement of education and skills is a preconditionfor the achievement of the development goals of thesestrategies.
ii. The environmentally sustainable economic and socialdevelopment of semi-arid regions must be pursued asthe ultimate goal. Sustainable development must beunderstood as including equitable distribution ofwealth and access to resources, respect for local diver-sity, an adaptation of the scale of human activities tothose which are compatible with the ecological regimetaking into account the needs of present and futuregenerations, and maintenance and increase of longterm productivity.
iii. Past and present mistakes and ill-conceived policieshave produced a situation in those regions where mostof them have reached the limits of their productivecapacity, a situation which can not be reversed withoutlarge national and international financial efforts. Afair approach to this problem indicates that some costs

9 THE DECLARATION OF FORTALEZA 169
will have to be borne by the national economies butthat others are clearly the responsibility of the inter-national community. Efforts to define the scope ofeach one's financial responsibility must be associatedwith the increase in the capacity of developing coun-tries to finance their own sustainable development,including the appropriate resolution of the externaldebt burden of indebted developing countries. Tradediscrimination particularly hurts the semi-aridregions, and should be removed. It is also essential thatsemi-arid regions be assured access to new technolo-gies, and international rules to promote the transfer oftechnologies should be implemented as soon as poss-ible. In addition, it is emphasized that measures aimedat the restoration of degraded areas and prevention offurther environmental deterioration are urgentlyneeded.
iv. Efforts to redress the present impoverished situationmust be based on rigorous research and study but cannot neglect the knowledge of the traditional popula-tions, who for centuries sustained life in those regions.These efforts will not reach their objectives if civilsociety and 'grass roots' movements are not involvedin the national and regional decision making process.
v. Biodiversity has an actual and potential economicimportance. The development of these regions shouldtake into account the sustainable use and conservationof this resource. Adequate national legislation and
international conventions should prevent abusiveexploitation. The countries, cultures and regions fromwhich each particular genetic resource or its natural orsynthetic derivates originate must be fairly compen-sated by those who acquire or transform them foreconomic gain.
vi. Semi-arid regions must learn from each other.Networks should be created and existing onesstrengthened. They would serve two needs: at theresearch level they would be used to exchange infor-mation, discuss methodologies, report research find-ings and develop joint activities; at the level of plan-ning for sustainable development, they will provide aforum for dialogue and exchange of experience amongexperts, decision makers and organized segments ofcivil society.
vii. History shows, and modern science confirms, thatsemi-arid regions have the natural resources requiredfor the development of human settlements where it ispossible to establish adequate production systems,equitable forms of social organization and rich andprosperous cultures. We are not facing hopeless situa-tions but a set of environmental and socioeconomiccircumstances which require special attention andpriority treatment to allow for the full development ofthe potentialities of semi-arid regions and theirpeoples.

10: Highlights of Working Group Discussions andRecommendations
This chapter summarizes the discussions and recommendations of 10 Working Groupsconvened as part of the International Conference on the Impacts of Climatic Variationsand Sustainable Development in Semi-arid Regions (ICID) in Fortaleza, Brazil, 27January to 1 February 1992.
CRITICAL ISSUES AND NEEDS OF SEMI-ARID REGIONS
Climate variability and climate change
Semi-arid regions exist in the tropical, sub tropical andtemperate zones of the earth. Their most prominent commoncharacteristic is a lack of sufficient, reliable and timelyrainfall. They experience wide variations in seasonal andannual precipitation. Droughts occur periodically. In recentyears, scientists have made encouraging progress in predict-ing seasonal to inter-annual variability of precipitation inthese critical zones, particularly in the tropics. At othertimes, extreme climatic variability may result in flooding.Under past and current conditions semi-arid regions havebeen climatic risk zones. A number of factors compound thisnatural vulnerability.
An increase in population and more intensive humanactivities, as has been experienced in many semi-arid regions,leads to increased stress on fragile or scarce resources, such aswater, soil and wildlife. In many areas the population is inexcess of the ecological carrying capacity under the currentsystems of economic production and resource use.
Many semi-arid regions are in developing countries andsuffer from a high incidence of poverty, underemployment,poor health and illiteracy. Public infrastructure is oftendeficient, including roads, water resources, industry andhousing. Economically and politically, rural populationsoften are powerless. The combination of climatic and socialstress increases the vulnerability of the natural and humansystems of semi-arid regions.
The regional consequences of global warming cannot yetbe predicted with precision and confidence. But someimpacts are probable. Increases in temperature will lead toincreased evapotranspiration. This will be an importantfactor in places where the climate is hot under current
conditions. Whether rainfall in these regions will increase ordecrease is not known. The International Panel on ClimateChange (IPCC) lists semi-arid regions among those areaslikely to experience increased climatic stress. Semi-aridregions commonly exhibit steep gradients of precipitation.The spatial shifts of these zones should be examined now,because adverse effects may occur long before man-madeclimate change can be reliably detected. It is also possiblethat climatic change will have unexpected consequences forsemi-arid regions.
The problems that climate poses today may become morefrequent and more severe with global warming. Research onand responses to climate variability and climate change sharemany common features. Understanding how societies, in thepast and now, cope with climate variability in semi-aridregions can provide a first approximation of how to preparefor climate change in future decades.
Social impacts
Climate-society interactions need to be better understood.This is particularly important for regions with extremeclimates. In the case of the semi-arid regions we must identifythose human activities that increase vulnerability to climaticvariability and change. Historically, small populations havemaintained subsistence agriculture in semi-arid regions overlong periods of time. But they cannot provide sustainablelivelihoods because they are highly vulnerable to extremeclimatic events and cannot support large populations. Popu-lation growth, as well as out-migration during droughts, willincrease the vulnerability of natural and social systems insemi-arid regions as well as in the areas that surround them.The exodus of people from these marginal areas to shantytowns, urban slums and to the forests is vivid proof of thelack of sustainability. This cycle of poverty is maintained as
170

10 WORKING GROUP DISCUSSIONS AND RECOMMENDATIONS 171
people do not gain enough education and training toimprove their condition permanently.
Economic impacts
Semi-arid regions produce subsistence crops, as well as rawmaterials that are sought after by other nations. There is littlevalue added in the region, due to a lack of expertise and localfirms. Economic power is often concentrated among a fewlarge landholders or companies with headquarters else-where. The people living in the region often do not own land,may have limited access to water, and lack access to knowl-edge and technology that would allow them to work the landusing improved practices. At the same time, semi-aridregions face economic disadvantages: transportation andproduction costs (fertilizer, pesticides) are high due to theirremote locations, cold storage is lacking, crop choice islimited, and access to export markets is difficult or non-existent. For some commodities, protectionist trade barriersof importing countries restrict the export potential of semi-arid regions.
Investment for development of infrastructure (transpor-tation, communication, water, electricity) is often insuf-ficient. In many cases, national governments lack the necess-ary resources, especially those of developing countries withlarge foreign debts.
These characteristics make the economy of semi-aridregions highly vulnerable to climate variations. Frequentdroughts affect mainly the agricultural sector, causing heavyproduction and productivity losses. Consequently, agricul-tural employment drops sharply during droughts. Subsis-tence agriculture and small farms are affected more than cashcrops and large landholdings, including livestock, but theseare also greatly affected by extreme climatic events.
Environmental impacts
Natural ecosystems in semi-arid regions are fragile. Eachdegraded component of the ecosystem also degrades otherparts of the environment. Desertification and other forms ofland degradation, resulting from natural or human causes,may be an irreversible process leaving behind land that ispermanently lost to productive use. Many factors contributeto land degradation and must be considered in efforts to stopfurther degradation: soil erosion, sedimentation, saliniza-tion, waterlogging, deforestation, overgrazing, soil compac-tion and crusting, unsuitable patterns of land tenure, inap-propriate use of water resources, urbanization and poor landmanagement. Each of these factors is highly sensitive toclimatic variations, and most probably to climate change.Strategies to deal with land degradation exist, requiring theintegration of research, technology and policy. Failure onthis front will preclude the attainment of sustainable devel-
opment in semi-arid regions. The key to success is a muchimproved and timely integration of knowledge with action.
Sustainable adaptation strategies
Human adaptation to semi-arid conditions provides usefullessons for how societies might cope with climate-relatedenvironmental changes in the future. The most generallesson, perhaps, is that the success or failure of humanresponses is determined by the interplay between climatic,socioeconomic and political factors. A second lesson is thatthe experience of people who have long lived under semi-aridconditions needs to be understood, evaluated and used indeveloping appropriate response strategies. This has rarelybeen done in a systematic and sustained fashion. Anotherimportant lesson is that researchers from outside the regionmust be careful not to impose inappropriate research frame-works. This suggests a greater need for local participation inresearch, planning and implementation of policy. The oldparadigm of development by heavy capital investment andfollowing the path of 'northern' industrialization is notsustainable in the long term. The new paradigm for sustain-able development, while still largely a goal toward which toaim, must be adopted.
Key components of sustainable development include anew system of social and economic accounting, increased useof appropriate technologies, a more equitable distribution ofincome and quality of life, increased political participationand decentralization of planning and decision making. Whilesustainable development is difficult to implement in anyecological setting, this is even more the case in resource-stressed and poor environments. Yet though the difficultiesare larger, the potential benefits are important. Sustainabledevelopment in semi-arid regions may provide the onlyanswer to survival.
The example of land reform illustrates the special need forsustainable development in semi-arid regions. In manyplaces it is not so much the absolute lack of water or food butaccess to and distribution of available resources that is theproblem. Without equitable access to water, food and landthe region, and all of its people, will not have a sustainablefuture. A method to implement land reform, and otheractions to create a more favorable environment for sustain-able development, may involve a new system of negotiatingand bargaining between social, political and economic inter-ests. Solutions will be difficult to reach unless all partners tothe bargain perceive an advantage. Land reform, using sucha social consensus, may provide the opportunity for thelandless to own land and to move from subsistence toproduction agriculture, while the large landowners mayfocus on value-added production and thereby createimproved conditions for exporting their goods.

172 IV ICID
Linkage to atmospheric pollution
Semi-arid regions, on the whole, do not contribute largeamounts of pollutants to the atmosphere. Even so, increasingpopulation and industrialization in these regions leads toemissions of conventional pollutants as well as greenhousegases. Biomass burning, cattle raising, the burning of fossilfuels, industrial production, mining and urbanization are theprincipal causes. Such pollution poses risks to human health,and may change local and global climates. Developmentplans for semi-arid regions must consider these effects.
Financing sustainable development
Neither national governments nor international organiza-tions have to date given high priority to investments in semi-arid regions. The funding that was received has often beenpoorly used and has done little to improve social, economicor environmental conditions in the recipient regions.Increased investment is needed, and it should be provided ina timely fashion. Semi-arid regions, in order to avoid furtherdegradation, must receive increased support from inter-national agencies and from their national governments. It isequally important that funding be made available in asustained and predictable fashion.
Funding criteria need to be redefined in order to meet theobjectives of sustainable development. This requires a betterassessment of all costs and benefits involved in new pro-grams. Environmental and ecological costs need to be expli-citly included. Ecologically sound investments must befinanced, even though they will be more expensive thantraditional programs. Such investments are entirely justifiedas long as they are cost effective.
Multinational development agencies should createspecialized funding mechanisms for the needs of semi-aridregions, which would take timely action in response torequests by national governments. The system for identify-ing, designing, appraising, implementing and monitoring forinternational financing of projects must become moreefficient and timely, and must provide opportunities for morelocal participation and feedback.
Research needs
Studies of societal impacts of and response strategies toextreme climatic events in semi-arid regions (droughts,storms, floods, frosts, etc.) are needed. The process of policymaking and institutional development in semi-arid regionsshould be addressed. Water and agricultural policies andmanagement practices should receive particular attention.Emissions of pollutants and greenhouse gases originatingfrom these regions need to be studied. The effectiveness of
ongoing national and international research and assistanceprograms for semi-arid regions must be evaluated. Agricul-tural, biological and genetic research addressed to the speci-fic needs of semi-arid regions should receive high priorityfrom sponsoring agencies. Finally, a better understanding ofsociety-climate interaction is needed. This is the basis forchanging behavior, and is not well understood.
Networking and cooperation
Semi-arid regions around the globe share many commonproblems despite differences in local conditions. They canlearn from each other and can develop joint activities. Forthis purpose, we recommend that networks be created andexisting ones strengthened to address problems that arecommon to them. This would serve at least two needs: At theresearch level, experts from different disciplines couldexchange information, discuss methodologies, reportresearch results, and develop joint activities; at the level ofplanning for sustainable development, they could provide aforum for dialogue and exchange of experience amongexperts and decision makers. They could also provide oppor-tunities for education, training and exchanges. Networksmay be organized internationally or among those regionshaving similar characteristics. One possibility would be tocreate a multinational network for semi-arid regions withspecialized components for tropical, sub-tropical and tem-perate zones.
Networks should meet the following criteria:
• participation should be based on a bottom-up strategy,with strong participation by local and regionalorganizations;
• a wide range of public and private organizations shouldparticipate, including farmers, women, labor, business andenvironmental groups;
• South-South networking should receive priority attention;• maximum use should be made of existing mechanisms and
new organizations created only if existing ones cannotperform the necessary tasks;
• one-to-one partnerships should be created between semi-arid regions in the more prosperous countries and develop-ing countries.
Within each semi-arid region a concerted effort must bemade to plan for a sustainable future. Measures to cope withthe problems of semi-arid regions need to be coordinated byorganizations and people within the regions. This requirescooperation among experts from different fields of research,government agencies and the civil society.
A consortium or roundtable, operating within a semi-aridregion, should be convened and staffed by a governmentagency, a university or a non-governmental organization. Itis important that such an effort be sustained over time, so

10 WORKING GROUP DISCUSSIONS AND RECOMMENDATIONS 173
that studies can be undertaken and the results used forplanning and implementation of sustainable developmentpractices. Each semi-arid region should develop plans forsuch a consortium to be convened at the earliest possibletime. Financial support for these consortia could beprovided, for example, by national and provincial govern-ments, as well as regional development agencies. In the caseof developing countries, additional support should beprovided by international and regional financial institutions.
High-level policy discussions should focus on theproblems and prospects of semi-arid regions. For this, theUnited Nations should convene a standing committee. Thisgroup could be made up of government officials, experts andrepresentatives of non-governmental organizations. It wouldbe charged with two primary tasks: (1) to assist with thedevelopment of an international action program for semi-arid regions, consulting with a wide range of organizationsabout its goals; and (2) to give support to development plansprepared by the individual semi-arid regions.
SUMMARY OF RECOMMENDATIONS
Within a context of limited resources, widespread poverty,environmental degradation and changing climate, the basicchallenge in the semi-arid regions is to find a path forsustainable development that guarantees to their popula-tions that basic material needs are meet, income is distributedmore equitably, and natural resources of these regions arepreserved.
To achieve this goal a concerted effort is necessary atnational and international levels, along the following lines ofaction:
I. Improvement of the capacity of people, particularly inrural areas, to influence and control their future,through the ownership or usufruct of assets, broadlydefined to include also human assets. Investments ineducation, training, health, sanitation and research,on the one hand, and agrarian reform and financing ofproductive activities, on the other, are the most rele-vant segments of this strategy.
II. Empowerment of the population, through greaterparticipation and decentralization in the planning anddecision-making process. Planning agencies shouldadopt procedures for integrated impact assessmentsin order to identify problems, collect data, andprovide opportunities for public discussion and parti-cipation. Projects should be conceived and developedusing a bottom up, rather than a top-down approach.
III. Mobilization of resources from internal and externalsources (bilateral and multilateral) at levels suffi-
ciently high to generate an impact in terms of allevia-tion of poverty in semi-arid regions.
A. Multilateral development agencies should createa specialized financial and technical facilitydesigned to respond to the specific needs of semi-arid zones which would react effectively and intimely fashion to concepts and initiatives pre-sented by national governments.
IV. Improvement in the efficiency of the management ofnatural resources and in the use of capital funds,existing or newly mobilized.
A. Limited resources in semi-arid regions should beassessed and managed with special care. Produc-tion processes designed for other regions are notalways appropriate.
B. The management strategy should combine grassroots knowledge with current scientific and tech-nological contributions. Policies should includeboth formal and informal education, whichinvolves learning from and advising and support-ing local groups.
C. Government in semi-arid regions should establish'extension services' to educate practitioners inagriculture, industry and other activities aboutnew available technologies and practices.
D. All interventions must be proven to be sustain-able in terms of use and availability of naturalresources and must be ecologically sound.
E. A radically different approach to the identifica-tion, design, appraisal, implementation, monitor-ing and follow-up of projects shall be established,focusing on:
• efficient, flexible and timely response to needsidentified in conjunction with participatingcommunities;
• procedures which provide effective monitoringof interventions allowing for feedback andappropriate adjustment as required;
• decentralization of decision making and imple-mentation which incorporates to the maximumextent the capabilities of the communitiesaffected as well as non-governmental organiza-tions.
F. In project identification and design, a more pre-cise definition of the intended target groups aswell as their own participation is required.

174 IV ICID
G. Continued integrated monitoring, observationand multi-disciplinary analysis of historical andcontemporary responses to climate variabilityshould be undertaken to determine which sub-groups or sectors of society are most sensitive toclimatic variation. Improved awareness of theuniqueness and fragility of those areas is criticalfor a strategy of sustainable development.
V. Lack of scientific information on natural and socio-economic systems in semi-arid regions is consideredone of the most serious threats to sustainable develop-ment. Therefore a comprehensive and intensiveresearch program should be developed along thefollowing agenda:
A. The origins, consequences of and response strate-gies to the extreme phenomena related to climaticvariability in semi-arid regions (e.g. droughts,storms, floods, frosts).
B. Effectiveness of current national and inter-national cooperation programs in semi-aridregions, to provide reliable identification of thedeficiencies existing today and to improve infor-mation gathering, retrieval and exchange as wellas technology transfer and transfer of researchfacilities and personnel among industrialized anddeveloping nations. Emphasis should be given tocomparative studies with special reference to thedamage provoked by climatic variations, andrisks they pose to particular countries.
C. Policy-making and management systems.
VI. To understand the complex interactions betweenenvironmental and human systems the followingactions are proposed:
A. Integrated regional impact assessments arerequired. These should be collaborative effortsinvolving regional experts and internationalresearch and funding organizations. Cooperativeresearch institutes should be established in speci-fied semi-arid regions with long-term support ofinternational organizations.
B. To improve knowledge of air quality and emis-sions in semi-arid regions, a permanent networkof monitoring stations should be established andintegrated with the WMO-GAW (Global Atmos-phere Watch) network.
C. Emissions from the industrial, energy and trans-portation sectors must be reduced and controlledthrough the establishment of air qualitystandards.
D. There should be additional international andnational investment in the development ofefficient decentralized small energy productionsystems for rural semi-arid regions, with specificemphasis on renewable energy technologies.
To implement this program the following actions are mosturgently needed: funding for research, cooperation ofnational institutions at the international level, technologytransfer and education.
VII. Cooperation among and within semi-arid regionsshould be improved. The following actions are recom-mended:
A. Organization of networks, internationally orbetween regions with similar characteristics, forjoint research and exchange of experience amongexperts and decision-makers.
B. Creation of consortia or roundtables within semi-arid regions to plan and coordinate actions forsustainable development. The consortia wouldintegrate the efforts of governmental agencies,universities, research centers and non-govern-mental organizations.
C. Organization of a standing committee at theUnited Nations to focus high-level discussion onthe problems and prospects of semi-arid regions.
VIII. The issue of population growth in semi-arid regionsshould be addressed taking into account:
A. An agro-ecological mapping to identify areaswhere pressure upon natural resources poses athreat to the survival of the population.
B. The need to plan the development of those areasby harmonizing the economic interventions withthe natural resource base and by combining pro-ductive and social investments, particularly envir-onmental education.
C. The urgency to alleviate poverty throughincreased investments and employment, financedby income transfer from more developed areas, atthe national and international levels.
D. The search for local solutions of economic andtechnological problems since transfers of popula-tions can result only in the transfer of pressures toother environments.

10 WORKING GROUP DISCUSSIONS AND RECOMMENDATIONS 175
COMMITTEES
International Committee
Taso Ribeiro Jereissati, Ceara State GovernorAlbano Franco, President of CNIAlfredo Costa Filho, CEPAL/ILPESDonald Wilhite, IDIC, University of NebraskaGeorge Woodwell, Woods Hole Research Center, MAHoward Ferguson, SWCC, GenevaJean-Pierre Raison, Universite Nanterre-XJorge Hardoy, Esquel Group ArgentinaJorge Lins Freire, President of the Bank of Northeast ofBrazilJuan Felipe Yriart, President of Esquel Group FoundationJudith Tendler, MIT, Cambridge, MAJurgen Schmandt, HARC, The Woodlands, TXKilaparti Ramakrisna, Woods Hole Research Center, MALes Heathcote, Flinders University, AustraliaMartin Parry, AIR Group, Oxford University, UKMichael Glantz, NCAR/ESIG, Boulder, CONancy Birdsall, World Bank, Washington, DCNorman Rosenberg, Resources for the Future, Washington,DCN. S. Jodha, ICIMOD, Kathmandu, NepalPeter Usher, UNEP, Nairobi, KenyaPhyllis Pomerantz, World Bank, Washington, DCRoberto Mizrahi, President of Esquel Group, New York,NYSeverino de Melo Araujo, FAO, Santiago, ChileStahis S. Panagides, Esquel Group, Washington, DCThomas Downing, AIR Group, Oxford, UKWilliam Riebsame, Natural Hazards Center, Boulder, CO
National Committee
Fabio Feldman, Federal Deputy, BrasiliaAntonio Albuquerque de Sousa Filho, Rector, FederalUniversity of CearaAntonio Carlos do Prado, IBAMA, BrasiliaAntonio Divino Moura, INPE, Sao PauloAugusto Pires, University of BrasiliaCarlos Afonso Nobre, INPE, Sao Paulo
Eneas Salati, President of INPA, ManausEustaquio Reis, IPEA, Rio de JaneiroFlora Cerqueira, UNDP, BrasiliaGustavo Maia Gomes, Federal University of PernambucoHelio Barros, Secretariat of Science and Technology - PR,BrasiliaJorge Santana, SUDENE, RecifeJose Vieira do Nascimento, CNI, Rio de JaneiroManuel Tourinho, EMBRAPA, BrasiliaMauro Benevides Filho, Secretary of Planning, FortalezaNilson Holanda, University of BrasiliaOsmundo E. Reboucas, former Federal DeputyOswaldo Massambani, University of Sao PauloRubens Vaz da Costa, former Secretary of Energy of Brazil
Organizing Committee
Antonio Rocha Magalhaes, Esquel Group, BrasiliaMarflsa Aguiar, Secretary of Urban Development andEnvironment, FortalezaAdolfo de Marinho Pontes, Secretary of Social Action,FortalezaAgostinho Fernandes Bezerra, Esquel Group, BrasiliaEduardo de Castro Bezerra Neto, UECE, Historical Insti-tute, FortalezaBenito Moreira de Azevedo, ICID, FortalezaElizabeth Machado Duarte, Esquel Group, BrasiliaAdriana Moura, Esquel Group, BrasiliaFrancisco Jose da Silveira, Esquel Group, BrasiliaFaustino de Albuquerque Sobrinho, UFC, FortalezaFrancisco Lopes Viana, FUNCEME, FortalezaHermano Frank, FIEC, FortalezaLincoln Coutinho de Aguiar, BNB-ETENE, FortalezaLuiz Carlos Tavares, CNPq, BrasiliaLuiz Esteves Neto, President of FIEC, FortalezaJoao Fontenele, FIEC, FortalezaJesse Claudio Fontes de Alencar, CNI, Rio de JaneiroMarie-Madeleine Mailleux Sant'Ana, Esquel Group,Brasilia
Paula Dias Pini, Esquel Group, Sao PauloPedro Albuquerque, Equatorial Institute, FortalezaSilvio Rocha Sant'Ana, Esquel Group, Brasilia