Volume 10 Number 11 November 2019 - ARID
265
Volume 10 Number 11 November 2019 till date.
-
Upload
khangminh22 -
Category
Documents
-
view
0 -
download
0
Transcript of Volume 10 Number 11 November 2019 - ARID

Volume 10 Number 11 November 2019
till date.

Indian Journal of Public Health Research & DevelopmentEXECUTIVE EDITOR
Vidya SurwadeAssociate Professor, Dr Baba Saheb Ambedkar, Medical College & Hospital, Rohinee, Delhi
INTERNATIONAL EDITORIAL ADVISORY BOARD1. Dr. Abdul Rashid Khan B. Md Jagar Din, (Associate Professor) Department of Public Health Medicine, Penang Medical College, Penang, Malaysia2. Dr. V Kumar (Consulting Physician) Mount View Hospital, Las Vegas, USA3. Basheer A. Al-Sum, Botany and Microbiology Deptt, College of Science, King Saud University,
Riyadh, Saudi Arabia4. Dr. Ch Vijay Kumar (Associate Professor) Public Health and Community Medicine, University of Buraimi, Oman5. Dr. VMC Ramaswamy (Senior Lecturer)
Department of Pathology, International Medical University, Bukit Jalil, Kuala Lumpur6. Kartavya J. Vyas (Clinical Researcher)
Department of Deployment Health Research, Naval Health Research Center, San Diego, CA (USA)
7. Prof. PK Pokharel (Community Medicine) BP Koirala Institute of Health Sciences, Nepal
NATIONAL SCIENTIFIC COMMITTEE1. Dr. Anju D Ade (Professor)
Community Medicine Department, SVIMS, Sri Padamavati Medical College,Tirupati, Andhra Pradesh.
2. Dr. E. Venkata Rao (Associate Professor) Community Medicine, Institute of Medical Sciences & SUM Hospital, Bhubaneswar, Orissa.
3. Dr. Amit K. Singh (Associate Professor) Community Medicine, VCSG Govt. Medical College, Srinagar – Garhwal, Uttarakhand
4. Dr. R G Viveki (Associate Professor) Community Medicine, Belgaum Institute of Medical Sciences, Belgaum, Karnataka
5. Dr. Santosh Kumar Mulage (Assistant Professor) Anatomy, Raichur Institute of Medical Sciences Raichur(RIMS), Karnataka
6. Dr. Gouri Ku. Padhy (Associate Professor) Community and Family Medicine, AII India Institute of Medical Sciences, Raipur
7. Dr. Ritu Goyal (Associate Professor) Anaesthesia, Sarswathi Institute of Medical Sciences, Panchsheel Nagar
8. Dr. Anand Kalaskar (Associate Professor) Microbiology, Prathima Institute of Medical Sciences, AP
9. Dr. Md. Amirul Hassan (Associate Professor) Community Medicine, Government Medical College, Ambedkar Nagar, UP
10. Dr. N. Girish (Associate Professor) Microbiology, VIMS&RC, Bangalore11. Dr. BR Hungund (Associate Professor) Pathology, JNMC, Belgaum.12. Dr Sartaj Ahmad, PhD Medical Sociology, Associate Professor,
Swami Vivekananda Subharti University Meerut UP India13. Dr Sumeeta Soni (Associate Professor)
Microbiology Department, B.J. Medical College, Ahmedabad, Gujarat,India
NATIONAL EDITORIAL ADVISORY BOARD1. Prof. Sushanta Kumar Mishra (Community Medicine)
GSL Medical College – Rajahmundry, Karnataka2. Prof. D.K. Srivastava (Medical Biochemistry)
Jamia Hamdard Medical College, New Delhi3. Prof. M Sriharibabu (General Medicine) GSL Medical College, Rajahmundry,
Andhra Pradesh4. Prof. Pankaj Datta (Principal & Prosthodentist)
Indraprastha Dental College, Ghaziabad
NATIONAL EDITORIAL ADVISORY BOARD5. Prof. Samarendra Mahapatro (Pediatrician)
Hi-Tech Medical College, Bhubaneswar, Orissa6. Dr. Abhiruchi Galhotra (Additional Professor) Community and Family
Medicine, AII India Institute of Medical Sciences, Raipur7. Prof. Deepti Pruthvi (Pathologist) SS Institute of Medical Sciences &
Research Center, Davangere, Karnataka8. Prof. G S Meena (Director Professor)
Maulana Azad Medical College, New Delhi9. Prof. Pradeep Khanna (Community Medicine)
Post Graduate Institute of Medical Sciences, Rohtak, Haryana10. Dr. Sunil Mehra (Paediatrician & Executive Director)
MAMTA Health Institute of Mother & Child, New Delhi
11. Dr Shailendra Handu, Associate Professor, Phrma, DM (Pharma, PGI Chandigarh)
12. Dr. A.C. Dhariwal: Directorate of National Vector Borne Disease Control Programme, Dte. DGHS, Ministry of Health Services, Govt. of India, Delhi
Print-ISSN: 0976-0245-Electronic-ISSN: 0976-5506, Frequency: Quarterly (Four issues per volume)Indian Journal of Public Health Research & Development is a double blind peer reviewed international journal. It deals with all aspects of Public Health including Community Medicine, Public Health, Epidemiology, Occupational Health, Environmental Hazards, Clinical Research, and Public Health Laws and covers all medical specialties concerned with research and development for the masses. The journal strongly encourages reports of research carried out within Indian continent and South East Asia.
The journal has been assigned International Standards Serial Number (ISSN) and is indexed with Index Copernicus (Poland). It is also brought to notice that the journal is being covered by many international databases. The journal is covered by EBSCO (USA), Embase, EMCare & Scopus database. The journal is now part of DST, CSIR, and UGC consortia.
Website : www.ijphrd.com©All right reserved. The views and opinions expressed are of the authors and not of the Indian Journal of Public Health Research & Development. The journal does not guarantee directly or indirectly the quality or efcacy of any product or service featured in the advertisement in the journal, which are purely commercial.
EditorDr. R.K. Sharma
Institute of Medico-legal PublicationsLogix Office Tower, Unit No. 1704, Logix City Centre Mall,
Sector- 32, Noida - 201 301 (Uttar Pradesh)
Printed, published and owned byDr. R.K. Sharma
Institute of Medico-legal PublicationsLogix Office Tower, Unit No. 1704, Logix City Centre Mall,
Sector- 32, Noida - 201 301 (Uttar Pradesh)
Published atInstitute of Medico-legal Publications
Logix Office Tower, Unit No. 1704, Logix City Centre Mall, Sector- 32, Noida - 201 301 (Uttar Pradesh)

Indian Journal of Public Health Research & Development
www.ijphrd.com
Contents
Volume 10, Number 11 November 2019
I

Correlated Levels of Anti-Inflammatory Interleukins ( IL-4 and IL-10) with Allergic Conjunctivitis (AC) in Iraqi patients
Nihad Khalawe Tektook1, Osamah Jihad Abdul Qader2
1Department of Medical laboratory techniques, College of Health and Medical Technics, MiddleTechnical University, Baghdad; 2Assist. Professor ,M.B.Ch.B. – F.I.B.Ms.OPHTH.-F.ICO, College of Medicine,Tikrit
University,Iraq
Abstract
Background Allergic conjunctivitis (AC) is caused by an allergic reaction, most common form was hypersensitivity reaction ( type 1), that caused to perennial or seasonal AC. Current study was done in the Hospital of Ibn-AL-Hythem for eyes infections in Baghdad from September- August of 2018, one hundred and thirty-two serum were collected from allergic conjunctivitis patients after diagnostic by a specialist ophthalmologist according to have symptoms, who included 60 male and 72 female, with range age ( 15-51) years. Used the enzyme-linked immunosorbent assay ( ELISA kit) from (Pepro-Tech Company , UK) for estimating levels of both Interleukins ( IL-4 and IL- 10) in patients serum Results current study showed higher significant in age group (≥ 35 years ) as percentage (57.6% ) compare to age group (25- 35) as (28.1%) , also significantly higher in females ( 54.5% ) than males ( 45.5%) , also level of IL – 4 in allergic conjunctivitis patients was (23.91± 2.09) compare to control (21.02± 2.99) ,so significantly increased levels of IL-10 in allergic conjunctivitis patients (14.99 ± 2.30) than control (11.10± 1.99).conclusions current study were concluded higher significant of allergic conjunctivitis Iraqi patients in age group (≥ 35 years), and the AC in females higher than males, as well as level of IL – 4 in allergic conjunctivitis patients were significant with control, and significantly increased levels of IL-10 in allergic conjunctivitis patients compare to control .
Keywords : interleukins( IL-4; IL-10) ; allergic conjunctivitis(AC) ; Iraqi patients
Introduction
Allergic conjunctivitis(AC) ( or name as “allergic rhinoconjunctivitis,” was most commonest allergic eye disorder, in the last decades in Iraqi patients , so allergic diseases were increased dramatically (1) Allergic eye usually are associated with others allergic conditions, such as dermatitis ( atopic eczema ) and allergic rhinitis (hay fever ) , so th causing of eye allergies are similar to the allergic rhinitis (hay fever ) and allergic asthma (2) .
Allergic conjunctivitis is type of IgE-mediated hypersensitivity a wide term that recognised as 6 types including perennial allergic conjunctivitis (PAC); seasonal allergic conjunctivitis (SAC), contact lens-induced; atopic keratoconjunctivitis (AKC) drug-induced, and vernal keratoconjunctivitis (VKC)( 3), However, both (VKC ) and (AND ) have pathophysiological and clinical pathophysiological
characteristics completely different from (PAC) and (SAC), although some common markers of allergy( 4). AC common manifests as itchy, red eyes, or watering which included the symptoms of ocular symptom scores(5).
Cosmetics and Medication can play important role in causing of eye allergies , Any types of irritant, whether infectious, environmental, or manmade, can cause symptoms that consistent with an allergic of an eye , AC is caused by allergen-induced inflammatory response(AIIR), that allergen (such as animal dander ; pollen; and other environmental antigens(6)will be interacting with antibody ( IgE bound to sensitized mast cells) causing clinical ocular allergic expression(COA). The pathogenesis of (AC) is predominantly an IgE-mediated hypersensitivity reaction. Activation of mast cells WHICH induces enhanced tear levels of the histamine; leukotrienes ;prostaglandins and tryptase, and this early response lasts clinically( 20 minutes

Indian Journal of Public Health Research & Development, November 2019, Vol. 10, No. 11 1753
–30 minutes) ( 2). also, the degranulation of Mast cell to induces activated the vascular endothelial cells, that turn the expresses chemokines and adhesion molecules such as vascular cell adhesion molecules (VCAM) and intercellular adhesion molecules (ICAM) , so the other chemokines secreted ( 2) .
Many cytokines that derived from Th1, such as IL(2, 3 ) and IFN-γ, that mediates recruitment of the macrophages, while the cytokine that derived from Th2, such as IL (4 and 5), that participates in both chemotaxis and activation of the eosinophils( 7), therefore aim of current study to assess levels of cytokine interleukin 10 (IL-10) and IL-4 in allergic conjunctivitis(AC) patients.
Material and Method
Sample collected :
Current study was done in the Hospital of Ibn-AL-Hythem for eyes infections in Baghdad from September - August of 2018. One hundred and thirty-two serum were collected from allergic conjunctivitis patients after diagnostic by a specialist ophthalmologist according to have symptoms such as Redness in inner eyelid or white of eye ; Itchy eyes; Blurred vision; Increased amount of tears ; and Swelling of the eyelid (fig.1) , who include 60 male and 72 female, with range age ( 15-51) years.
Figure (1): Symptoms of allergic conjunctivitis
Estimation levels of Interleukins ( IL-4 and IL- 10) in patients serum
Used the enzyme-linked immunosorbent assay ( ELISA kit) from (Pepro-Tech Company , UK) for estimating levels of both Interleukins ( IL-4 and IL- 10) in patients serum according to the manufacturer’s instructions.
Findings
Table (1): Distribution of allergic conjunctivitis patients according to age groups and gender
Age groups ( years)
Patients Control
No. = 132
% No.= 50 %
≤ 25 19 14.3 12 24
25- 35 37 28.1 20 40
≥ 35 76 57.6 18 36
Total 132 100 50 100
Gender
Male 60 45.5 25 50
Female 72 54.5 25 50
Total 132 100 50 100

1754 Indian Journal of Public Health Research & Development, November 2019, Vol. 10, No. 11
Results in table (1) showed the range age of allergic conjunctivitis patients was ( 15-51) years, also Majority of allergic conjunctivitis patients within age groups of ( ≥ 35 )years as percentage (57.6% ) compare to age
group (25- 35) as (28.1%) , also significantly higher in females ( 54.5% ) than males ( 45.5%) . These results are shown in Figure(2 &3).
Figure (2): Allergic conjunctivitis patients according to age groups
Figure (3): Allergic conjunctivitis patients according to gender
Table (2): comparative of interleukins Level (IL – 4 and IL – 10) in patients ( Study group) and healthy (Control).
Levels of interleukins ( pg/ ml)
Study group ( M± S.D)
Control ( M± S.D)
IL - 4 23.91± 2.09 21.02± 2.99 No significant
IL - 10 14.99 ± 2.30 11.10± 1.99 significant

Indian Journal of Public Health Research & Development, November 2019, Vol. 10, No. 11 1755
Results in table (2) showed the level of IL – 4 in allergic conjunctivitis patients was (23.91± 2.09) compare to control (21.02± 2.99) , so significantly increased levels of IL-10 in allergic conjunctivitis patients (14.99 ± 2.30) than control (11.10± 1.99),these results were shown in Fig.4.
Figure (4): Comparative levels of interleukins (IL – 4 and 10) in allergic conjunctivitis patients and healthy.
Discussion
Current study showed more prevalence of allergic conjunctivitis patients in age group ( ≥ 35 years ) as percentage (57.6%) compare to age group (25- 35) as (28.1%) , this similar results with Fasasi etal., 2014 who showed more prevalence of AC in age groups (17 -33) years as (43.6%), followed by ≥16 years as (42.3%)(8). Ocular allergy is a higher prevalence in the western countries comparing to Africa and Asia( 9). Allergic conjunctivitis(AC) in ( 12–13) year old schoolchildren, was(19%)(10) , about (6–30) % of general population, who diagnoses with Allergic conjunctivitis(11), who represents ≥ 90% of all ocular allergies( 12).
The current study showed the allergic conjunctivitis are commoner in females (54.5%) than males ( 45.5%). These results are consistent with the results of previous studies as( 13;14;8) ,whilst differ with the results of researcher Hall and Shilio, 2005, who showed males more predominate than females( 15)..
Both Interleukin ( 4 and 10) are anti-inflammatory cytokines which mainly functions via suppressing the pro-inflammatory( 16) .
During active the inflammatory of allergic eye diseases, the cytokines of T-helper cell ( Th1 and Th2) were secretion and over expressed( 17).cytokines of Th2 as interleukins (IL- 4; IL-5 ; IL- 9 ; IL -10 and IL-13) will promoting different elements of allergic inflammation as (isotype-switching from IgG1 ; propagation of the Th2 phenotype ) to mobilization eosinophil ; maturation and activation mast cell and synthesis immunoglobulin (IgE), that important for allergy( 18)
Interleukin (IL)-4 plays a very important role in inflammatory and fibrotic events in many human diseases( 19), In Inflammation, such as post-cataract surgical or non-allergic cause slightly increased in production level of IL-4, but high produced level from IL-4 were related to allergic reactions(20), and increased level in the serum of allergic individuals(21), so IL-10 an anti-inflammatory cytokine (Th2-type cytokine) is secreting by different cell types as ( B-cells ; T cells ;

1756 Indian Journal of Public Health Research & Development, November 2019, Vol. 10, No. 11
macrophages and monocytes under various conditions of immune activation(22) .although IL-10 is been shown to suppress a broad range of inflammatory responses and is known to be an important factor in maintaining a balance of overall immune responses( 23).Thus, used IL-10 in developed novel therapy for many human diseases such as autoimmune diseases and allergic responses(24) .
Conclusions
1. Significantly higher of allergic conjunctivitis patients in age group (≥ 35 years ) , also significantly higher in females than males.
2. High level of IL – 4 in allergic conjunctivitis patients was (23.91± 2.09) compare to control ,so significantly increased levels of IL-10 in allergic conjunctivitis patients compare to control .
Conflict of Interest : None
Source of Funding : Self
Ethical Clearance : The sample taken after patient approval.
References
(1) Rigoli L, Briuglia S, Caimmi S, Ferrau’ V, Gallizzi R, Leonardi S, La Rosa M, Salpietro C. Gene-environment interactions in childhood asthma. Int J Immunopathol Pharmacol. 2011;24:41–47.
(2) Mario La Rosa, Elena Lionetti, Michele Reibaldi, Andrea Russo, Antonio Longo, Salvatore Leonardi, Stefania Tomarchio, Teresio Avitabile, and Alfredo Reibald. Allergic conjunctivitis: a comprehensive review of the literature. Ital J Pediatr. 2013; 39: 18.
(3) Bernard Yu-Hor Thong.Allergic conjunctivitis in Asia. Asia Pac Allergy. 2017 Apr; 7(2): 57–64.
(4) Andrea L. Allergy and allergic mediators in tears. Experimental Eye Research 117 (2013) 106e117.
(5) Neffen H, Mello JF, Sole D, Naspitz CK, Dodero AE, Garza HL. et al.Nasal allergies in the Latin American population: results from the allergies in Latin America survey. Allergy Asthma Proc. 2010;6(Supp1):S9–S27.
(6) Bielory BP, O’Brien TP, Bielory L. Management of seasonal allergic conjunctivitis: guide to therapy. Acta Ophthalmol 2012;90:399–407.
(7) Guillermo,A.D. and Albert ,D.Macrophage Cytokines: Involvement in Immunity and Infectious Diseases. Front Immunol. 2014; 5: 491.
(8) Fasasi MK1, Abdul Kabir AA2, Hamza BA3, Richard AI4, Sadiat SE5, Abdulfattah , Allergic conjunctivitis in a tertiary eye hospital, Nigeria. Journal of Kathmandu Medical College, 2014.Vol. 3, No. 4, Issue 10.
(9) Hussain A, Awan H, Khan MD. Prevalence of nonvision impairing conditions in a village in Chakwal district, Punjab, Pakistan. Ophthalmic Epidemiol.2004;11(5):413–426
(10) Hesselmar B, Aberg B, Eriksson B, Aberg N. Allergic rhinoconjunctivitis, eczema, and sensitization in two areas with differing climates. Pediatr Allergy Immunol. 2001 Aug;12(4):208–15.
(11) Leonardi A, Castegnaro A, Valerio AL, et al. Epidemiology of allergic conjunctivitis: clinical appearance and treatment patterns in a population-based study. Curr Opin Allergy Clin Immunol2015;15:482–8.
(12) Wong AH, Barg SS, Leung AK. Seasonal and perennial allergic conjunctivitis. Recent Pat Inflamm Allergy Drug Discov 2014;8:139–53.
(13) Wade PD, Iwuora AN, Lopez L, Muhammad MA.Allergic conjunctivitis at sheikh zayed regional eye care center, Gambia. J Ophthalmic Vis Res.2012;7:24–28.
(14) Keziah N. Malu. Allergic conjunctivitis in Jos-Nigeria.Niger Med J. 2014 May-Septmber; 55(2):166-170
(15) Hall A, Shilio B. Vernal keratoconjunctivitis.Community Eye Health J. 2005;18:76–78.
(16) Gregory GD, Raju SS, Winandy S, Brown MA. Mast cell IL-4 expression is regulated by Ikaros and influences encephalitogenic Th1 responses in EAE. J Clin Invest (2006) 116(5):1327–36.
(17) Irkec MT, Bozkurt B. Molecular immunology of allergic conjunctivitis. Curr Opin Allergy Clin Immunol. 2012; 12: 534-539.
(18) Kelly D. Stone, MD, PhD, Calman Prussin, MD, and Dean D. Metcalfe, MD.IgE, Mast Cells, Basophils, and Eosinophils. J Allergy Clin Immunol. 2010 ; 125(2 Suppl 2): S73–S80.

Indian Journal of Public Health Research & Development, November 2019, Vol. 10, No. 11 1757
(19) Mohammed S. Razzaque; Babar S. Ahmed; C. Stephen Foster; A. Razzaque Ahmed. Effects of IL-4 on Conjunctival Fibroblasts: Possible Role in Ocular Cicatricial Pemphigoid,In vestigative Ophthalmology & Visual Science , 2003, Vol.44,
(20) Mosmann TR, Cherwinski H. Bond MW, Giedlin MA. Coffman RL. Two types of murine helper T-cell clone, I. Definition according to profiles of lympbokine activities and secreted proteins. J Immunol.1986: 136:2348-57.
(21) Daher S, Santos LM, Sole D, De Lima MG, Naspitz CK, Musatti CC: Interleukin-4 and soluble CD23 serum levels in asthmatic atopic children. J Invest Allergol Clin Immunol. 1995, 5: 251-254.
(22) Sabat R, Grütz G, Warszawska K, et al. Biology of interleukin-10. Cytokine and Growth Factor Reviews. 2010;21(5):331–344.
(23) Villalta SA, Rinaldi C, Deng B, Liu G, Fedor B, Tidball JG. Interleukin-10 reduces the pathology of mdx muscular dystrophy by deactivating M1 macrophages and modulating macrophage phenotype. Human Molecular Genetics. 2011;20(4):790–805.
(24) Sharma S, Yang B, Xi X, Grotta JC, Aronowski J, Savitz SI. IL-10 directly protects cortical neurons by activating PI-3 kinase and STAT-3 pathways. Brain Research. 2010;1373:189–194.

The Role of Zinc Sulfate in Subchronic Cadmium Chloride Toxicosis in Male Mice
Ahmed D. Khudhair1, Duraid A. Abass2
1Baghdad University- Collage of Veterinary medicine –Department of Physiology, 2Pharmacology and Biochemistry, Baghdad, Iraq
Abstract
Aim: study sort of interaction between zinc sulfate and cadmium chloride. Method: sixty albino male mice divided equally into four groups as follows (Toxic dose of cadmium chloride 5mg/kg B.W (T1); Zinc sulfate 10mg/kg B.W (T2); their combined dosing (T3) and control group. (C) given D.W. At the end of the experiment, all the animal sacrified and their liver is dissected and prepared for histopathology also, another part of same liver submitted to homogenization process to determine the level of metallothionein 2 (MTII) and malondialdehyde (MDA). Result: histopathology of liver section revealed in the cadmium dosed group, a necrosis in hypatocyte, vascular degeneration, diffusion of mononuclear cell and neutrophill infiltration around dilated blood vessels, congestion of blood vessels around portal area and parenchyma, apoptosis of hepatocyte characterize by fragmented nuclei with irregular cytoplasm. While no lesion were recorded in liver section of zinc sulfate dosed group. In combined dosed group, liver section showed either no lesion or less severe lesion consisting of local aggregation of active macrophage and lymphocyte.Result of MTII in liver homogenate recorded highly significant increase in all treated group especially in combined dosed one that showed increase up to 3.3 times; while cadmium and zinc alone dosed group recorded increase 2.1 and 1.9 than control one. The result of MDA in liver homogenate showed highly significant increase level in cadmium toxic dosed group up to 17.8 times, while zinc sulfate group showed only 1.6 time increase than control and combined dosed group that showed no level differences. Conclusion: result of liver histopathology and MTII / MDA levels were indicative the protective role of zinc administration to overcome sub chronic cadmium toxicosis by increase their MTII binding protein that reduce the toxic effect or levels of cadmium induce cellular lipid peroxydation damage.
Key Ward: MTII, MDA, Histopathology and liver homogenate.
Introduction
Cadmium (Cd) is one of the most dangerous heavy metals, known to produce severe and multi-organ toxicity in humans (1,2). It is released into the environment by mining, smelting operations, fuel combustion and other industrial process (3) Humans can be exposed to Cd and it can stimulate free radical production, resulting in oxidative deterioration of lipids, proteins, and DNA, manifesting as gross pathology of the liver, brain, and other organs in humans and animals (4). The extremely long biological half life of cadmium essentially makes it a cumulative toxin, so long past exposures could still result in direct toxic effects of the residual metal (5) The body has limited capacity to respond to cadmium exposure, as the metal cannot undergo metabolic degradation to
less toxic species and is only poorly excreted, making long-term storage a viable option for dealing with this toxic element. The long residence time of cadmium is in part attributable to metallothionein (MT), a metal-binding protein that is induced by cadmium and tightly binds the metal. Cadmium accumulates primarily in the liver and kidney where it is bound to MT, and it is felt that cadmium bound to MT is essentially detoxicated, at least temporarily, through this high affinity sequestration (6, 7). Major detoxification mechanisms protecting the cell from Cd-induced damage is the direct binding of Cd2+ to metal chelators like Metallothionein (MT) is a ubiquitous low molecular weight (usually <10 kDa) protein with high cysteine content and has strong affinity for heavy metals (8).

Indian Journal of Public Health Research & Development, November 2019, Vol. 10, No. 11 1759
The other way to induction (MT) is giving zinc which is an essential trace element play important roles in structure and function of proteins, metabolism of RNA and DNA, signal transduction, gene expression, and regulation of apoptosis (9). It is required for the action of more than 200 metalloenzymes and more than 2000 Zn dependent transcription factors have been recognized (10). Zinc has antioxidant properties and plays an important role in scavenging reactive oxygen species, and they also hypothesized that in the absence of zinc, the possibility of increased oxidative damage exists (11). Several research showed that treatment with Zn during Cd exposure prevented or decreased the harmful effects of Cd (12). Zn might reduce uptake of Cd by competing for a common transporter (13).
Moreover, zinc induced the synthesis of metallothionein in the liver, which caused Cd accumulation in the liver and delayed its transfer to the kidney. The zinc is a well-established antioxidants and it can protect against Cd-induced oxidative stress (14)
Method
In this study we used sixty adult albino mice weighted (30–32 g) that were divided into four groups of 15 for each group. They were administered the dosage
daily orally at morning with overnight fasting by using gavages needle lasted for 45 days.
The first group of mice was (T1) administered cadmium chloride once a day at (5mg /kg B.W). The second group (T2) administered dose in the NOAEL range of zinc sulfate (10 mg/kg B.W) orally. The third group(T3) administered combination of both zinc sulfate (10 mg/kg B.W) and after four hours administered cadmium chloride( 5mg /kg B.W) (1, 15). The forth group act as a control (C) and administered distilled water orally. At the end of sub chronic study all groups of animal sacrified surgically under anesthesia and their liver submitted to homogenization process to determine metallothionein 2 (MTII) and malon dialdehyde MDA level in liver, while another part of liver used for histopathological examination.
Findings
The table (1) showed a significant (P<0.01) increase in MTII level in liver homogenate of all treated groups after sub chronic dosing. The cadmium chloride group level increased by 2.17 times from the control group; while the zinc sulfate increase by 1.9 times that control one. The combined group showed the largest increase between all treated groups by triplicate level 3.3 times above the control level.
Table (1) Metallothionen II (MTII) level (ng/ml) in liver homogenate of mice groups dosed sub chronically with cadmium chloride and zinc sulfate and their combined:
Group n:15 MT2 In liver Mean ± SE
(T1)Cadmium Cloride5mg/kg
8.17 ± 0.10 b
(T2)Zinc Sulfate 10mg/kg
7.32 ± 0.08 c
(T3)Cadmium and Zinc 5mg/kg+10mg/kg
12.74 ± 0.28a
(C)ControlDistilled water
3.85 ± 0.12 d
LSD value 0.356 **
Means having different letters in same column differed significantly. ** (P<0.01).
Table (2) listed that the level of MDA in liver homogenate showed higher significant increase (p>0.01) in cadmium chloride group with lowest increase but still significant in the zinc sulfate group while the MDA in liver seem to return to normal in the combined dosed group without significant difference from the control group.

1760 Indian Journal of Public Health Research & Development, November 2019, Vol. 10, No. 11
Table (2) Malondialdehyde (MDA) level (nmol/g ) in the liver of mice groups dosed sub chronically for 45 days with cadmium chloride , zinc sulfate and their combination :
Group n:15 MDA In liver Mean ± SE
(T1)Cadmium Chloride5mg/kg
47.58 ± 0.19 a
(T2)Zinc Sulfate 10mg/kg
4.30 ± 0.18 b
(T3)Cadmium and Zinc 5mg/kg+10mg/kg
2.68 ± 0.24 c
(C)ControlDistilled water
2.67 ± 0.19 c
LSD value 0.615 **
Means having different letters in same column differed significantly. ** (P<0.01).
The result of histopathology showed in the control group normal liver section with no lesion in (fig.1 Section A)., while in cadmium group liver section showed infiltration of neutrophils and mononuclear cell around dilated and congested blood vessels (fig.1 Section B). There was a diffuse of mononuclear cells infiltration in liver parenchyma(fig.1 Section C) and in portal area(fig.1 Section D). A congested blood vessels and necrosis of hepatocytes seen in(fig.1 Section E).
Granulomatous inflammation were seen in the liver parenchyma in(fig.1 Section F). Also there were apoptotosis of hepatocytes characterized by dense nuclei chromatin with irregular cytoplasm in addition to fragmented nuclei (fig.1 Section G). Vacuolar degeneration and necrosis of hepatocytes also seen(fig.1 Section H). The zinc group showed normal liver section with no clear lesion at NOEAL dose (figure 9). The combined group showed normal liver cell with no clear lesion (fig.1 Section J)., while other tissue appeared with some granuloma consististing from local aggregation of active macrophages and lymphocytes (fig.1 Section D).
A- Section in the liver of control shows no clear lesions (H& E stain 40X)
B- Section in the liver of cadmium chloride group (T1) shows neutrophils and mononuclear infiltration around dilated blood vessels (H& E stain 40X)
C- Section in the liver of cadmium chloride group (T1)shows diffuse mononuclear infiltration in liver parenchyma (H& E stain 40X)
D- Section in the liver of cadmium chloride group (T1) shows diffuse mononuclear infiltration in portal area (H& E stain 40X)
E- Section in the liver of cadmium chloride group (T1) shows congested blood vessels with necrosis of hepatocytes (H& E stain 40X)
F- Section in the liver of cadmium chloride group (T1) shows granulomatous inflammation in the liver parenchyma (H& E stain 40X)
G- Section in the liver of cadmium chloride group (T1)shows apoptotosis of hepatocytes characterized by dense nuclei chromatin of irregular cytoplasmic of hepatocytes in addition to fragments of nuclei (H& E stain 40X)
H- Section in the liver of cadmium chloride group (T1) shows vacuolar degeneration and necrosis of hepatocytes (H * E stain 40X)
I- Section in the liver of the zinc sulfate group (T2) shows no clear lesions (H& E stain 40X)
J- Section in the liver of the combined dosing group (T3) shows no clear lesions (H& E stain 40X)
K- Section in the liver of combined group (T3) shows granuloma consisting from the local aggregation of active macrophages and lymphocytes (H& E stain 40X)

Indian Journal of Public Health Research & Development, November 2019, Vol. 10, No. 11 1761
5
J- Section in the liver of the combined dosing group (T3) shows no clear lesions (H& E stain 40X)
K- Section in the liver of combined group (T3) shows granuloma consisting from the local aggregation of active macrophages and lymphocytes (H& E stain
40X)
Figure ( 1) Section in the liver Discussion:
The present study was designed and performed to study the interaction between zinc and cadmium and their combined dosing by performing dosing of them sub chronically for 45 days.
The hypothesis that Zn can protect tissue against Cd-induced tissue damage in adult mice and rats was established by our and several other previous studies (4, 16, and 17). It is well known that many toxic effects of cadmium (Cd) action result from interactions with essential elements including zinc (Zn). These interactions can take place at different stages of absorption, distribution in the organism and excretion of both metals and at the stage of Zn biological functions. Exposure to Cd leads to disturbance in Zn level in the organism on the one hand, while dietary Zn intake has an important effect on Cd absorption, accumulation and toxicity on the other. The Zn status of the body is important in relation to development of Cd toxicity. Numerous data showed that increased Zn supply may reduce Cd absorption and accumulation and prevent or reduce the adverse actions of Cd, whereas Zn deficiency can intensify Cd accumulation and toxicity (18).
This is in accordance with the fact that the majority of Cd uptake occurs by a process associated with Zn transport, competing for common binding sites and membrane carriers like divalent metal transporter1 (DMT1) or luminal Zn transporter1 (ZTL1). Also, as oral treatment with Zn induces enhanced metallothionein (MT) synthesis in the liver (19).
Metallothionein is efficient intracellular small protein scavenger involved in intracellular detoxification via binding to cadmium. There was a significant increase of metallothionein concentration in all treated groups. The result of MT in sub chronic study indicate that MT level in liver homogenate increase by 2.12 times for Cd and two times for zinc alone group in comparison with control one but MT level in liver of the combined administered group showed higher increase of MT 3.3 times than control.
This could be attributed to the long time of exposure (45 day) that give opportunity for each metal to highly induce synthesis of MT in liver which possibly cause complete protection in Zn alone group while still in Cd a lone group which showed toxicity signs that increase with increase of administration period indicating that the induced MT were not enough to overcome the toxicity signs. And that in agreement with (19,20). Binding and induction of metallothionein appears to play an
4
Granulomatous inflammation were seen in the liver parenchyma in(fig.1 Section F). Also there were apoptotosis of hepatocytes characterized by dense nuclei chromatin with irregular cytoplasm in addition to fragmented nuclei (fig.1 Section G). Vacuolar degeneration and necrosis of hepatocytes also seen(fig.1 Section H). The zinc group showed normal liver section with no clear lesion at NOEAL dose (figure 9). The combined group showed normal liver cell with no clear lesion (fig.1 Section J)., while other tissue appeared with some granuloma consististing from local aggregation of active macrophages and lymphocytes (fig.1 Section D).
A- Section in the liver of control shows no clear lesions (H& E stain 40X)
B- Section in the liver of cadmium chloride group (T1) shows neutrophils and mononuclear infiltration around dilated blood vessels (H& E stain 40X)
C- Section in the liver of cadmium chloride group (T1)shows diffuse mononuclear infiltration in liver parenchyma (H& E stain 40X)
D- Section in the liver of cadmium chloride group (T1) shows diffuse mononuclear infiltration in portal area (H& E stain 40X)
E- Section in the liver of cadmium chloride group (T1) shows congested blood vessels with necrosis of hepatocytes (H& E stain 40X)
F- Section in the liver of cadmium chloride group (T1) shows granulomatous inflammation in the liver parenchyma (H& E stain 40X)
G- Section in the liver of cadmium chloride group (T1)shows apoptotosis of hepatocytes characterized by dense nuclei chromatin of irregular cytoplasmic of hepatocytes in addition to fragments of nuclei (H& E stain 40X)
H- Section in the liver of cadmium chloride group (T1) shows vacuolar degeneration and necrosis of hepatocytes (H * E stain 40X)
I- Section in the liver of the zinc sulfate group (T2) shows no clear lesions (H& E stain 40X)
Figure ( 1) Section in the liver

1762 Indian Journal of Public Health Research & Development, November 2019, Vol. 10, No. 11
Discussion
The present study was designed and performed to study the interaction between zinc and cadmium and their combined dosing by performing dosing of them sub chronically for 45 days.
The hypothesis that Zn can protect tissue against Cd-induced tissue damage in adult mice and rats was established by our and several other previous studies (4, 16,
and 17). It is well known that many toxic effects of cadmium (Cd) action result from interactions with essential elements including zinc (Zn). These interactions can take place at different stages of absorption, distribution in the organism and excretion of both metals and at the stage of Zn biological functions. Exposure to Cd leads to disturbance in Zn level in the organism on the one hand, while dietary Zn intake has an important effect on Cd absorption, accumulation and toxicity on the other. The Zn status of the body is important in relation to development of Cd toxicity. Numerous data showed that increased Zn supply may reduce Cd absorption and accumulation and prevent or reduce the adverse actions of Cd, whereas Zn deficiency can intensify Cd accumulation and toxicity (18).
This is in accordance with the fact that the majority of Cd uptake occurs by a process associated with Zn transport, competing for common binding sites and membrane carriers like divalent metal transporter1 (DMT1) or luminal Zn transporter1 (ZTL1). Also, as oral treatment with Zn induces enhanced metallothionein (MT) synthesis in the liver (19).
Metallothionein is efficient intracellular small protein scavenger involved in intracellular detoxification via binding to cadmium. There was a significant increase of metallothionein concentration in all treated groups. The result of MT in sub chronic study indicate that MT level in liver homogenate increase by 2.12 times for Cd and two times for zinc alone group in comparison with control one but MT level in liver of the combined administered group showed higher increase of MT 3.3 times than control.
This could be attributed to the long time of exposure (45 day) that give opportunity for each metal to highly induce synthesis of MT in liver which possibly cause complete protection in Zn alone group while still in Cd a lone group which showed toxicity signs that increase with increase of administration period indicating that
the induced MT were not enough to overcome the toxicity signs. And that in agreement with (19,20). Binding and induction of metallothionein appears to play an important role in the physiologic regulation of zinc levels and, possibly, its reactivity to other legends (21).
The significant increase of the MDA level in sub chronic dosing in cadmium group might be due to increase of the oxidative stress and generation of the free radicals by cadmium. The cadmium group caused an increase of MDA level by 17.6 fold above control group while the combination group, the value of MDA returns to normal one. The reason of that was due to the role of zinc as antioxidant agent. It is well known that Zn is an essential component of the oxidant defense system with participation at multiple cellular levels and improved activity of antioxidant enzymes and as a result minimized oxidative damage (22).
Oxidative stress is considered an important mechanism of cadmium induced toxicity which might be due to the depletion and changes in the activity of antioxidant enzymes or reduced of glutathione (GSH) (23). Another study recorded that the cadmium caused decreases in the activity and level of antioxidants system elements as well as vitamin C, E and glutathione content and leads to the production of oxygen reactive forms. Also by other route the cadmium toxicity generates free radicals by stimulating the synthesis of inflammatory mediators which in turn stimulates the generation and subsequent oxidative stress (24).
The liver is the primary target organ following systemic Cd exposure. The uptake of Cd into the liver is critical for the development of overall toxicity induced by heavy metal. Approximately half of Cd absorbed systemically is rapidly accumulated in the liver, which resulted in the reduced availability of Cd to such organs as the kidneys and testes, which are more sensitive to its toxic actions (25).
The hypatotoxicity involves two pathways, one for an initial injury produced from direct effects of the metal and the other for the subsequent injury produced by inflammation. Primary injury is produced by the binding of Cd to sulfhydryl groups on critical molecules in mitochondria, causing oxidative stress, the mitochondrial permeability transition, and decreased mitochondrial respiration.

Indian Journal of Public Health Research & Development, November 2019, Vol. 10, No. 11 1763
Hepatocellular injury occurs because damage to endothelial cells disrupts the microcirculation and causes ischemia. Secondary injury from acute cadmium exposure is thought to occur from the activation kupffer cells and a complex series of interactive events with a large number of inflammatory and cytotoxic mediators(24).
The histopathological studies of the liver section in cadmium group showed mononuclear inflammatory cells infiltration of in the portal area, infiltration of neutrophils and mononuclear cell around dilated and congested blood vessels, congested blood vessels and necrosis of hepatocytes, which is a damage to membranes by severe, lysosomal enzymes enter the cytoplasm and digest the cell, and cellular contents leak out. That might happen due to oxidative stress and increase the tension on cells membrane lead to lake out of lysosomla content (26).
Histological alterations in liver tissues like degeneration of hepatocytes, vacuolization, congestion of hepatic tissues, subcapsular vacuolization, necrosis, were observed in the liver of mice exposed to Cd.
The initial lesion in the liver during the present study might be due to physiological changes that took place in the liver tissue in the process of trying to homeostatistically regulating and detoxifying the Cd metal during continuous exposure.
In hepatic tissue, the histological alterations noted during the sub chronic Cd exposure as focal necrosis, increased condense and fragment nucleus, cellular necrosis and ruptured hepatic tissue in Cd group. These findings are consistent with cadmium inducing greater hepatic alteration. Further, in this study identified alterations of the liver cells may be the result of diverse biochemical alteration in liver following the Cd toxicity that act as a signal of degenerative processes that suggests metabolic damage also (27).
In addition to above chances vacuolation of hepatocytes is also noted which is suggested to be associated with the inhibition of protein synthesis, energy depletion or a shift in Cd as a poisonous metal that promotes early oxidative stress and later contributes to the development of serious biochemical and pathological conditions because of its long retention in some tissues.
In the present work, the administration of Cd resulted in severe hepatocyte necrosis, fatty changes, degeneration signs and inflammatory cell infiltrations.
These results are similar to those reported previously in the literature (28).
Conclusion
Zinc sulfate at low dose might act as antidote in case of cadmium toxicosis this was supported by the result of clinical physiological as well as the level of zinc and cadmium in liver.
Conflict of Interest: There was no conflict with this paper
Funding: Self
Ethical Clearness: This work done under the rule of ethics for management laboratory animals submitted by university of Baghdad - college of veterinary medicine.
Reference
1. ATSDR (Agency for Toxic Substances and Disease Registry). Toxicological profile for Cadmium. Atlanta: ATSDR/US department of Health and Human Services. 2013.
2. Singh P, Chaudhary S, Patni A, et al. Effect of cadmium chloride induced genotoxicity in bone marrow chromosomes of swiss albino mice and subsequent protective effects of Emblica officinalis and vitamin C. Journal of Herbal Medicine and Toxicology. 2007; 1(2): 67–71.
3. Chen Z, Wang K, Ai YW, et al. The effects of railway transportation on the enrichment of heavy metals in the artificial soil on railway cut slopes. Environmental Monitoring and Assessment. 2014;86(2): 1039–1049.
4. Manca D, Ricard AC, Trottier B, et al. Studies on lipid peroxidation in rat tissues following administration of low and moderate doses of cadmium chloride. Toxicology. 1991;67(3): 303–323.
5. Goering P.L., M.P. Waalkes, C.D. Klaassen. Toxicology of Cadmium, in: R.A. Goyer, M.G. Cherian (Eds.), Handbook of Experimental Pharmacology: Toxicology of Metals, Biochemical Effects. Springer-Verlag, New York. 1995;115:189–214.
6. Klaassen C.D., J. Liu, S. Choudhuri. Metallothionein: an intracllular protein to protect against cadmium toxicity, Annu. Rev. Pharmacol. Toxicol. 1999; 39

1764 Indian Journal of Public Health Research & Development, November 2019, Vol. 10, No. 11
267–294.
7. Waalkes, MP; Pérez-Ollé, R. Tole of metallothionein in the metabolism, transport and toxicity of metals. In: Molecular Biology and Toxicology of Metals, Zalups, RK; Koropatnick, J; Ed. Taylr Fancis, London. 2000; 414-459.
8. Klaassen C. D., and Diwan, B. A. Metallothionein protection of cadmium toxicity. Toxicology and Applied Pharmacology. 2009; 238, 215–220.
9. Michael K. Hambidge and Nancy F. Krebs. Zinc Deficiency: A Special Challenge . The Journal of Nutrition. 2007.
10. Cai L, Li XK, Song Y, Cherian MG. Essentiality, toxicology and chelation therapy of zinc and copper. Curr Med Chem. 2005; 12 (23): 2753–2763.
11. Colagar AH, Marzony ET and ChaichiMJ. Zinc levels in seminal plasma are associated with spermquality in fertile and infertile men. Nutrition Research. 2009;29(2): 82–88.
12. Kamil Pabis, Claudia Gundacker, Robertina Giacconi, Andrea Basso, Laura Costarelli , Francesco Piacenza, et al. Zinc supplementation can reduce accumulation of cadmium in aged metallothionein transgenic mice. Chemosphere. 2018;211, 855- 860
13. El Heni Jihen a, Messaoudi Imed b, Hamouda Fatima a, Kerkeni Abdelhamid. Protective effects of selenium (Se) and zinc (Zn) on cadmium (Cd) toxicity in the liver and kidney of the rat: Histology and Cd accumulation. Food and Chemical Toxicology. 2008; 46 , 3522–3527.
14. Brzóska MM, Rogalska J, Galażyn-Sidorczuk M, Jurczuk M, Roszczenko A, Kulikowska - Karpińska E, et al. Effect of zinc supplementation on bone metabolism in male rats chronically exposed to cadmium. Toxicology. 2007;237(1):89-103.
15. ATSDR (Agency for Toxic Substances and Disease Registry). Toxicological profile for Zinc. Atlanta: ATSDR/US department of Health and Human Services. 2005.
16. Blanco A, Moyano R, Vivo J, Flores-Acuña R, Molina A, Blanco C, Agüera E, Monterde JG. Quantitative changes in the testicular structure in mice exposed to low doses of cadmium. Environ
Toxicol Pharmacol. 2007;23(1):96-101.
17. Zhai Q, Wang G, Zhao J, et al. Protective effects of Lactobacillus plantarum CCFM8610 against chronic cadmium toxicity in mice indicate routes of protection besides intestinal sequestration. Appl Environ Microbiol. 2014;80:4063–4071.
18. Brzóska MM, Moniuszko-Jakoniuk J . Interaction between cadmium and zinc in the organism. Food Chem. Toxicol. 2001;39(10): 967- 980.
19. Marouane Chemek , Safa Ben Mimouna , Sana Boughammoura , Géraldine Delbès , and Imed Messaoudi. Protective role of zinc against the toxicity induced by exposure to cadmium during gestation and lactation on testis development. Reproductive Toxicology. 2016; 63 :151-160.
20. Zorica Plamenac Bulat , Danijela Djukić-Ćosić , Živorad Maličević , Petar Bulat and Vesna Matović. Zinc or Magnesium Supplementation Modulates Cd Intoxication in Blood, Kidney, Spleen, and Bone of Rabbits . Biol Trace Elem Res. 2008; 124:110–117
21. Kelly, EJ; Quaife, CJ; Froelick, GJ; Palmiter, RD. Metallothionein I and II protect against zinc deficiency and zinc toxicity in mice. J Nutr. 1996; 126:1782-1790.
22. Matovic , V. ; Plamenac , B.Z.; Djukic , C.D. and Soldatovic , D.. Antagonsium between cadmium and magnesium : apossible role of magnesium in therapy of cadmium intoxication . Magnesium Res. 2010; 23: 19- 26.
23. Liu, J., Qu, W., and Kadiiska, M. B. Role of oxidative stress in cadmium toxicity and carcinogenesis. Toxicology and Applied Pharmacology. 2009; 238, 209–214
24. Yamano , T.; Decicco, L.A. and Rikans , L.E. Attenuation of cadmium induced liver injury in senescent male fischer 344 rats: role of kupffer cells and inflammatory cytokines., Toxicol Appl Pharmacol. 2000; 162: 68-75.
25. Djukic, C.D. Curcic, J.M. Plamenac, B.Z. Ninkovic, M. and Malicevic, Z. Relation between lipid peroxidation and iron concentration in mouse liver after acute and subacute cadmium intoxication . J. Trace Elem .Med. Biol. 2008; 22: 66-72.

Indian Journal of Public Health Research & Development, November 2019, Vol. 10, No. 11 1765
26. Amal Ibrahim El-Refaiy, Fawzy Eissa. Protective effects of ascorbic acid and zinc against cadmium-inducedhistopathological, histochemical and cytogenetic changes in rats. Comunicata Scientiae. 2012; 3(3): 162-180.
27. Renugadevi, J., Prabu, S.M. Naringenin protects against cadmium-induced renal dysfunction in rats. Toxicology. 2009; 256(1-2): 128–134.
28. Borges, L.P., Brandão, R., Godi, B., Nogueira, C.W., Zeni, G. Oral administration of diphenyl diselenide protects against cadmium-induced liver damage in rats. Chemico- Biological interaction. 2008; 171(1): 15-25.

Correlation Between Glugometer and Laboratory Methods in Measuring Capillary and Venous Blood Glucose Levels in Type
2 Diabetic Patients
Ahmed Mohammed Alwan1, Hamza Ali Saleh1
1Department of Medical Laboratory Techniques, Al-Yarmouk University College , Baghdad
Abstract
Objectives: The aim of the study was to investigate the correlation between levels of blood glucose in samples taken from patients with type 2 diabetes mellitus measured by instrument for self-monitoring of blood glucose (glucometer) and by laboratory methods (photometric method or enzymatic colorimetric method).Method: One hundred patients with type 2 diabetes mellitus (T2DM) who were attending a privet medical laboratory during the period December 2017 to March 2018 were participated in the present study. Among the participants, 46 were female with an age range of 40-80 years and a age mean of 53.10± 10.61 years .The male patients were 54 with an age range of 40-79 years and a age mean of 51.17± 9.74 years. Venous and capillary blood glucose levels were determined by laboratory methods and glucometer for each participant.Finding : The mean of photometric venous blood glucose (PVBG) was 163.88 ±107.06, Glucometric Venous Blood Glucose (GVBG) was 190.95 ±123.96 mg/dl, Photometric Capillary Blood Glucose (PCBG) was 171.53±116.52 mg/dl, and Glucometric Capillary Blood Glucose (GCBG) was 193.69±123.21 mg/dl. The obtained data was analyzed by Lin’s concordance correlation coefficient. Concordance correlation coefficients (rc) were 0.94 for PVBG vs GVBG and 0.97 for PCBG vs GCBG.Conclusion:
The results obtained in this study showed that the values of blood glucose level determined by glucometer are close to the values determined by laboratory methods. Moreover, a positive correlation coefficient showed strong association between capillary and venous glucose measurements.
Keywords: glugometer; laboratory methods ; capillary ; venous; blood glucose ; type 2 diabetic patients
Introduction
In a global report on diabetes, WHO has noticed an increase in both the prevalence of diabetes and the number of diabetic people. The report has emphasized the need of sufficient lifelong management and regular follow-up for diabetic patients so they can have healthier lives [1].
It is well known that diabetes is associated with complications such as blindness, cardiovascular disorders, limb amputation and nephropathy [2].
Reaching a reasonable glucose control in patients with diabetes depends on the availability of blood glucose (BG) level knowledge. To get this knowledge, patients may check their BG level at hospitals or privet medical laboratories where biochemical methods are applied to measure BG levels [3].
Regular self-monitoring of blood glucose (SMBG) by diabetic patients was recommended by clinical guidelines as a tool for self-management [4]. Self-monitoring of blood glucose has been considered as a fundamental part of self – management and diabetes care as it has many benefits .These benefits include the use of SMBG for the detection of serious hyperglycemia and as an advance notice to detect hypoglycemia. Moreover, real-time data can indicate the effects of life style, such as diet and physical activity, on blood glucose levels[5]
Rapid blood glucose determination has become a requirement for treatments and dose adjustments. Laboratory methods to measure plasma glucose levels are time consuming. Therefore, the use of glucometers has greatly increased [6].

Indian Journal of Public Health Research & Development, November 2019, Vol. 10, No. 11 1767
Using glucometer device in SMBG makes it a process where Blood Glucose (BG) is checked by the patient himself. As an out-come of using glucometers, the patients are participating in the therapy process and hence they would have a better life quality [2]
Beside better glycemic management, the benefits of using glucometers include simple usage and operation and the need of one drop of blood. These benefits are not reduced by doubts regarding the precision and accuracy of the devices [2].
According to the international organization for standardization (ISO) acceptable error for a glucometer be within ± 15 mg/dl when laboratory glucose levels are <100 mg/dl; and the acceptable error should be within 15% for laboratory values ≥100mg/dl[6]
The present study was conducted to investigate the correlation between blood glucose concentrations determined by a glucometer and blood glucose levels obtained by laboratory method.
Materials and Method
Measurements were based on two types of blood samplings, venous blood sampling and finger-prick blood sampling. Blood glucose levels of samples collected by the later method of sampling were determined by glucometer and capillary laboratory method.
For the laboratory (photometric) blood glucose level measurements, a 3.5 ml of venous blood samples were collected from participants by applying the blood drawing at the median cubital vein, whenever possible,
following normal protocol. A small portion of each sample was used to measure glucose concentration with glucometer. Sodium fluoride was used as glycolysis inhibitor. Blood samples were kept in an appropriate conditions and environments for subsequent analysis.
Capillary sampling from a finger was performed for each and every participant. The entry site was disinfected; the skin was punctured with a lancet. The first drop of blood was wiped away then a blood sample was collected with a capillary tube. A micro hematocrit centrifuge was used at 12000 rpm to separate serum.
The blood glucose levels were determined using an enzymatic colorimetric method according to the kit’s protocol using a spectrophotometer .The kit type Linear (LINEAR CHEMICALS, SPAIN) was purchased from local markets.
Glucometric measurements of blood glucose level were performed using a Glucometer (ACCU-CHEK Active Mannheim, Germany). Glucometric measurements were applied for capillary blood glucose (GCBG) and for venous blood samples (GVBG).
Photometric measurements of blood glucose level were performed using a Uv/Visible Spectrophotometer (Type Apel – china). Photometric measurements were applied for capillary blood glucose (PCBG) and for venous blood samples (PVBG).
Finding
One hundred diabetic patients were participated in this study. In table 1 the statistical data of the participant are presented.
Table 1-Statistical data of the participant patients
Female Male Total
Sample size 46 54 100
Age range, Years 40-80 40-79 40-80
Mean ± s.d*., years 53.10 ± 10.61 51.17 ± 9.74 ± 10.16
*standard deviation
The experimentally obtained blood glucose levels that were measured by glucometric and photometric techniques are summarized in table 2. The mean value of venous blood glucose level and capillary blood glucose level along side with standard deviation are given in table 2.

1768 Indian Journal of Public Health Research & Development, November 2019, Vol. 10, No. 11
Table 2. Comparison of different glucose level determination methods. methods and the corresponding correlation coefficients
Venous blood Capillary blood
Glucometer Photometric Glucometer Photometric
Mean Glucose level± s.d. mg/dl
190.95 ±123.96163.88±107.06
193.69± 123.21
171.53±116.52
Correlation coefficient ,R2GVBG vs PVBG GCBG vs PCBG
0.95 0.992
Concordance correlation coefficient, rc
0.94 0.97
To assess the strength of association between the glucose levels obtained by the two measurements methods, the linear correlation coefficient R2 were determined from the linear plots of GVBG vs PVBG and GCBG vs PCBG which are shown in figure 1-a and figure 1-b respectively.
Figure 1- linear correlation plots of : a –PVBG vs GVBG and . b- PCBG vs GCBG
The values of the square of the correlation coefficient, R2 are given in table 2 These values indicate a high association between glucometric and photometric methods used for blood glucose level measurements. The case of PCBG vs GCBG showed higher association, as the corresponding R2 has a value of 0.992, in compression
to PVBG vs GVBG case where R2 has a value of 0.95.
The obtained data were further analyzed by the procedure which calculates Lin’s Concordance correlation coefficient [7]. The procedure assumes that n observations Yk and Xk are selected from a bivariate population. Here Y represents a measure from a candidate method and X represents the corresponding measure of the standard test or method, in the present study it is the photometric method. The degree of concordance (agreement) between the two measures is represented by the value of rc which can be estimated from the formula :
The statistic, rc , is an index of how well a new test or measurement (Y) reproduces a standard test or measurement (X). It quantifies the agreement between these two measures of the same variable. The values of a correlation, rc ranges from -1 to 1, with perfect positive agreement at 1[7].
Concordance correlation coefficient (rc) analyses values are presented in table-2. Those values showed moderate agreement between GVBG and PVBG with rc value of 0.94. A strong agreement was observed for the correlation between GCBG and PCBG as the corresponding rc values was 0.97.

Indian Journal of Public Health Research & Development, November 2019, Vol. 10, No. 11 1769
Conclusion
The results obtained in this study showed that the level of blood glucose determined by glucometer is close to the blood glucose level measured by laboratory methods. Moreover, a positive correlation coefficient showed strong association between glucometric and photometric methods.
The concordance correlation coefficient (rc) showed a high agreement between laboratory methods and the use of glucometer.
Hence, from the obtained results of the current study it may be concluded that use of glucometer is benefiter for glucose self monitoring to asses the control of blood glucose level for diabetic patients.
Acknowledgment: We would like to express our gratitude to the administration of the department of medical laboratory techniques at Al-Yarmouk University College who sponsored the present study.
Conflict of Interest : Non conflict of interest with any side
Source of Funding : Self source
Ethical Clearance: Nil
References
1. World Health Organization, Global report on diabetes. (NLM classification: WK 810), 2016.
2. ShadiK hakpour Kermani, Alireza Khatony, RostamJalali , Mansur Rezaei and Alireza Abdi. Accuracy and precision of measured blood sugar values by three glucometers compared to the standard technique. Journal of Clinical and Diagnostic Research. 2017 Apr, Vol-11(4): OC05-OC08
3. Kyung-Soo Kim; Self-Monitoring of Blood Glucose in Patients with Insulin Treated Type 2 Diabetes Mellitus .Diabetes Metab J 2018;42:26-27 .
4. Dawn Cameron, Fiona Harris, and Josie M M Evans. Self-monitoring of blood glucose in insulin-treated diabetes: a multicase study. BMJ Open Diab Res Care 2018 ,Volume 6, Issue 1 ,1-8
5. William T. Cefalu Self-Monitoring of Blood Glucose in Noninsulin-Using Type 2 Diabetic Patients . Diabetes Care, , January 2013, Volume 36, 76-178,
6. Muhammad Adnana, Fakhar Imamb, Iffat Shabbira, Zahra Alia,and Tayyaba Rahata .Correlation between capillary and venous blood glucose levels in diabetic patients. Asian Biomedicine, February 2015; Vol. 9 No. 1, 55 – 59.
7. Lawrence I-Kuei Lin . A concordance correlation coefficient to evaluate reproducibility. Biometrics. International Biometric Society.1989. 45 (1): 255–268.

Effect of Toxoplasma gondii Infection on DNA Sequence among patients with Testicular Cancer
Ammer Abd. Mohammed1 Rana S. Nasir2
1College of Health and Medical Technics, MiddleTechnical University, Baghdad, Iraq
Abstract
This study was conducted on 20 testicular cancer patients who visited the Al-Barraa privet Laboratory and Al- Sharika Labratory / Baghdad, with mean age of (27.77 ± 6.01) years. The ELISA technique was used to detect toxoplasmosis, and tumor biopsies were taken from 6 patients. The PCR amplifications of the “PIK3CA” gene were performed. The primers were used for exon 9 amplification. During the exon 9 PIK3CA gene amplification process, the first pair of the used primers included PIK3CA-9F-1, “5′- GTATTTGCTTTTTCTGTAAATCATCTG-3” and “PIK3CA-9R-1, 5′ CATGCTGAGATCAGCCAAATTC-3′′. The determination of PIK3CA genome was done by nested polymerase Chain Reaction using primers of PIK3CA gene with amplicon size 161bp. The “oligonucleotide” was tested at 0.05, 0.075 and 0.10 μmol/L concentrations, while “”LNA oligonucleotide” was tested at 0.075 and 0.0375 μmol/L concentrations for PIK3CA exon 9”, which showed optimal detection for the PIK3CA exon 9 LNA mutation.
Key word: Toxoplasma gondii, Testicular Cancer, DNA sequence.
Introduction
Toxoplasmosis is a serious condition in which individuals are infected and may then suffer from cancer [1,2]. Toxoplasmosis can reach to most organs of the human body and the latest genetic change in some of these organs may result in carcinoma [3].Testicular cancer is the heterogeneous disorder which was historically shown to be challenge for classification [4]. High levels of their heterogeneity is explained by the emergence of pluripotent germ cell lines, and by long time interval when the oncogenic mutations assemble prior to the quickly invasion growth during or post puberty stage [5]. “TGCT originates from the aberrant arrested fetal gonocyte”, which does not progress into “spermatogonium appropriately after birth”. During puberty and childhood, this arrested gonocyte shows oncogenic adaptation, which then become germ cell neoplasia in situ (GCNIS) during childhood and adulthood, which then emerges as an invasive TGCT during young adulthood. During the early childhood, GCNIS can be identified histologically, but during the young childhood, it is challenging and difficult to be differentiated from the normal germ cells [6]. In general, histologic classification shows two subtypes of “TGCT”, the “Seminoma and “Non-Seminoma”
TGCTs. The seminoma is a homogenous cancer similar to the undifferentiated gonocytes, and accounts for about (55%) of the TGCTs, and its peak incidence occurs at the age group (35-39) year, while a “non-seminomatous germ cell tumor “(NSGCT)” constitutes about “(44%)” of the “TGCTs” and in general, they are more aggressive than seminomas, and diagnosed at younger ages “(25-29)” years. The heterogeneity of “NSGCT” composition reflects its dysregulation in differentiation into embryonic cancers, “choriocarcinomas, teratatomas and yolk sac tumors” [7]. The combined or mixed tumors are the tumors which contain both NSGCT and seminoma and classified as a NSGCT subtype. TGCT is usually defined as the curable model of cancer, which is has an exquisite susceptibility to chemotherapy, and has more than (95%) survival rate. Chemotherapeutical treatment of TGCT is usually associated with the morbidity and complications such as infertility, metabolic syndromes or cardiovascular diseases [8].
Materials and Method
In the current study, 20 testicular cancer patients were enrolled. The tumor biopsy specimens were taken from 6 patients, and the other 14 patients were analyzed

Indian Journal of Public Health Research & Development, November 2019, Vol. 10, No. 11 1771
for “PIK3CA” mutations using PCR. Elisa technique was used for detection of toxoplasmosis. In the exon “9 PIK3CA” gene, the “prescreening for mutation detection was done by using direct DNA sequencing”, as previously described. Further analysis was conducted on specimens with mobility shifts by the direct DNA sequencing on automated sequencing systems from (“ABI PRISMTM 3100 Genetic Analyzer, Applied Biosystems, Hitachi, Japan”) using the “ABI PRISM Big Dye” Terminator version 1.1 Cycle Sequencing Ready Reaction Kit from (Applied Biosystems, Branchburg, NJ, USA).
Statistical analysis:
The Microsoft Office Excel 2007 and SPSS version 16 programs were used for data analysis. The numeric data were expressed as mean ± SEM (standard error of means). The P value (< 0.05) was considered as significant.
Results
Table (1) shows the distribution of testicular cancer according the age groups and residency of patients.
Table (1): Distribution of patients according to age groups and residency
Age groups No=20)) 100 %
(45-49) 5 25.0
(50-59) 5 25.0
(60-69) 6 30.0
(70-75) 4 20.0
Residency
Rural 12 60.0
Urban 8 40.0
Table (2) “shows the mean toxoplasma (IgG) and (IgM) antibodies detected by ELISA technique”.
Table (2): Mean toxoplasma (IgG) and (IgM) antibodies detected by ELISA technique
Disease Mean IgM Mean IgG
Toxoplasmosis (0.48 ± 0.23) (0.38± 0.20)
During the “exon” “9 PIK3CA” gene” amplification process, the first pair of the used primers included “PIK3CA-9F-1”, “5′-GTATTTGCTTTT-TCTGTAAATCATCTG”-3′ and “PIK3CA-9R-1, 5′ CATGCTGAGATCAGCCAAATTC-3′” as shown in figure (1).
Figure (1): Determine of PIK3CA genome by nested polymerase Chain Reaction using primers of PIK3CA gene.
M: 100 bp DNA ladder (M). Lanes: (1-8) positive isolates (161 bp). At 2.5% agarose gel.
The Electrical current is equal to 60 volte at 30minutes.
Analysis of PIK3CA gene
The “oligonucleotid”e was tested at “0.05, 0.075” and “0.10 μmol/L” concentrations, while “LNA oligonucleotide” was tested at “0.075” and “0.0375” μmol/L concentrations for “PIK3CA exon 9”, which showed optimal detection for mutation as seen in table (3).
Table (3): Polymerase Chain Reaction of PIK3CA Exon 9
“PIK3C4 Exon”
“Mutation” “Nucleic acid”
“Sensitivity with” “LNA probe”
9“E545K”
“GAC > AAG”
1.0%
“E545D”“GAG > GAT”
2.5%

1772 Indian Journal of Public Health Research & Development, November 2019, Vol. 10, No. 11
Discussion
Testicular cancer is one of the most common condition observed in the elderly age. Involvement of Toxoplasmosis with this testicular histological change is controversial. Our study revealed that the (45-75) years age group is more infected with this disease. Epidemiology is one of the common conditions in Iraq and people suffering from this disease may suffer from other physical complications. This finding agreed with Jenna E. Boyd who found that there are many complications that may take place following the treatment of this malignant tumor [9].
Toxoplasmosis is an age-problem disease that affects most body parts causing apparent damages, and can be very serious causing malignant tumors [3]. Several body organs develop multiple impairments due to the migration of toxoplasma tachyzoites [10]. Thus, cancerous tumors can affect different parts in the body because of toxoplasmosis [11]. Several genetic mutations may take place due to the relationship between toxoplasmosis and various body organs and tissues accompanied by tissue alteration, which matches with the report of Ramakrishnan, Ch. et al, 2019, who demonstrated that Toxoplasma happens at the site of occupation to the body as a result of its interaction with the body tissues [12]. In our study, the genetic mutations were found in the gene E545K in Nucleic acid GAC > AAG and E545D gene in Nucleic acid GAG > GAT, in PIK3C4 Exon 9, where this genetic mutation occurred in this site of the genetic sequence of the DNA of the testicular tissue. Existence of Toxoplasma gondii at the affected site reinforced the genetic mutation in the testicular tissue. These findings agreed with Jun Zheng et al, 2019 who showed that A TCTP-like gene was detected in the genome of Toxoplasma [Toxoplasma gondiiTCTP (TgTCTP)], despite its unknown unknown function [13]. This means that the alteration in the epidermal tissue’s genetic sequence is due to the existence of toxic toxoplasmosis precisely at the injury site, which can be attributed to the weak immune system of the infected individual, and thus leading to that malignant tumor.
Ethical Clearance: Taken from patients
Source of Funding : Self
Conflict of Interest : Non
References
1. Jeffrey L. Jones, Monica E. Parise, and Anthony E. Fiore, Neglected Parasitic Infections in the United States: Toxoplasmosis, Am J Trop Med Hyg. 2014 May 7; 90(5): 794–799.doi: 10.4269/ajtmh.13-0722.
2. Sarman Singh, Congenital toxoplasmosis: Clinical features, outcomes, treatment, and prevention, Trop Parasitol. 2016 Jul-Dec; 6(2): 113–122. doi: 10.4103/2229-5070.190813.
3. Mohammed Nazar Sh. The effect of Toxoplasma gondii on DNA sequence Alteration among Breast cancer Patients, J. of Nursing science 2017.
4. Amy Lee Fowler, A. L. Hayes, D. B. and Feher, E., Testicular torsion in a patient with Ehlers-Danlos syndrome, doi.org/10.1136/bcr-2017-222679.
5. J. Gillis, Ad J. M. and Jerónimo, C. et al, Human Germ Cell Tumors are Developmental Cancers: Impact of Epigenetics on Pathobiology and Clinic, Int. J. Mol. Sci. 2019, 20(2), 258; doi:10.3390/ijms20020258.
6. Dorssers, L. C. J. Gillis, Ad J. M. Stoop, H. and Marion, R. V. Molecular heterogeneity and early metastatic clone selection in testicular germ cell cancer development, British Journal of Cancer v. 120, pages444–452 (2019).
7. Rajpert-De Meyts, E. MD, DMSc, Skakkebaek, N. E. et al, Testicular Cancer Pathogenesis, Diagnosis and Endocrine Aspects, U.S. National Library of Medicine ID: NBK278992PMID: 25905224: 2017.
8. Pyle, L. C. MD, and Nathanson, K. L. Genetic Changes Associated with Testicular Cancer Susceptibility, Semin Oncol. 2016; 43(5): 575–581.
9. Jenna E. Boyd, Ruth A. Lanius, and Margaret C. McKinnon, Mindfulness-based treatments for posttraumatic stress disorder: a review of the treatment literature and neurobiological evidence, J Psychiatry Neurosci. 2018 Jan; 43(1): 7–25.
10. Ranju Kharel(Sitaula), Sagun Narayan Joshi, and Ranjit Sah, et al, Toxoplasma gondii bradyzoites and tachyzoites isolation from vitreous of atypical necrotizing retinitis, J Ophthalmic Inflamm Infect. 2018; 8: 8.

Indian Journal of Public Health Research & Development, November 2019, Vol. 10, No. 11 1773
11. Hatter JA, Kouche YM, Melchor SJ, Ng K, Bouley DM, Boothroyd JC and, Ewald SE. Toxoplasma gondii infection triggers chronic cachexia and sustained commensal dysbiosis in mice. PLoS 31;13 (10): 10.1371/2018.
12. Ramakrishnan, Ch. Maier, S. and Robert A. Walker, et al,.An experimental genetically attenuated live vaccine to prevent transmission
of Toxoplasma gondii by cats, Nature research J. 1474-9 (2019).
13. Zheng, J. Chen, Y. and Li, Z. et al, Translationally controlled tumor protein is required for the fast growth of Toxoplasma gondii and maintenance of its intracellular development, The FASEB pp. 906-919: 2019.

Correlated level of interleukin (IL_10 ) with Allergic Rhinitis and Effect Study of Steroid in its Levels
Anas Ahmed Saleh1, Inas Abd Al Majed Rasheed2
1Department of surgery / College of Medicine/Tikrit University, 2Department of Lab.Scienses / College of pharmacy /Tikrit University/ Salah Aldin /Iraq
Abstract
Background: the allergic rhinitis or hay fever, is the most common diseases or type of allergic, often associated with runny nose ; nasal congestion; sneezing ; sinus pressure and eye problems, that similar to cold, so in recent years allergic rhinitis increased in Iraqi population, because many important factors. The aims of the current study were to assessment (IL_10 ) in Patients serum and study the effect of Steroid in Its Levels.Patients and method: Patients’ serums were collected form Salah Aldin General Hospital during period ( November ,2018 - March, 2019) a total of 44 patients Suffering from Allergic rhinitis after diagnosis by physician ENT Specialist and control group included 32 (healthy person ), the serum IL_10 levels that measured by theELISA (Beckmancompany, USA) according to the manufacturer’s protocols (IL_10 ELISA kits), All samples are detected in duplicate. Findings: Mean of age ± Standard division was ( 29.17 ± 7.65 ) compare to control 30.23 ± 8.90 , high incidence allergic rhinitis in males 29(65.9%) than females 15( 34.1%) , also in control group ;males18 ( 56.3 %)more than females14 (43.7 %); P<0.01.Also Results in of current study showed significant decreased levels of interleukin(10) in serum of Patients with allergic rhinitis as ( 8.21 ± 0.25 ), compare to control group ( healthy persons ) as(11.67 ± 0.33 ) differed significantly (P<0.01 ), but significant increased level of IL_10 (10.06 ± 0.23 ) in serum of Patients with allergic rhinitis who received gluococorticoid ( steroid ) Patients compare to Patients before received gluococorticoid ( steroid ), a differed significantly (P<0.01 ). Conclusion: high incidence Allergic Rhinitis in males than females. decreased level of (IL_10 ) in serum with allergic rhinitis but increased levels of IL -10 in Patients serum with allergic rhinitis who received gluococorticoid ( steroid ) Patients compare to Patients before received gluococorticoid ( steroid ).
Key words: Patients ; Allergic Rhinitis ; Steroid ; IL10 Levels
Introduction
The allergic rhinitis (AR), is a common disorder which is linked as strongly to conjunctivitis and asthma, nearly 500 million people in worldwide suffering from AR(1), so AR is I.g.E-mediated chronic inflammatory, which is considered a classic Th2-mediated disease(2). the symptoms of allergic rhinitis asnasal obstruction ; nasal itching;sneezing as well as rhinorrhea.
Also the nasal and ocular symptoms directly related to the allergic process, as well as leads to sleepiness during the day and less the quality of live because of symptoms(3) .
Allergic rhinitis to development requires an interaction between: immune system ;environment
factor as well asgenetic susceptibility. the Allergen inducing proliferation of Th-2 lymphocyte in patients with allergies with releasing of their characteristic combination of cytokines including interleukins IL( 3; 4; 5 ; 9; and 13). These substances promoting producing the I.g.E and mast cell. Mucosal mast cells which producing the IL ( 4 ; 5 and 6 ) and tryptase proliferate in the allergic epithelium(4)
The importance of the Th2-type cells, (Th2) cytokines in both pathologies of allergic inflammation and the development the allergic sensitization and well established(5).The inflammatory response in the nasal mucosa in patients with allergic rhinitis, that challenging intranasally with the allergen including“immediate I.g.E-mediated mast cell response” and late-phase

Indian Journal of Public Health Research & Development, November 2019, Vol. 10, No. 11 1775
response characterized by recruitment of basophiles; eosinophils(6).
Corticosteroids, one important type of steroid hormones, which taken as topical creams; nasal sprays ; pills as well as long-lasting injections. Glucocorticosteroids exert anti-inflammatory effects via at two pathways: transrepression pathway and transactivation pathway, so glucocorticosteroids exert regulatory functions by inducing regulatory cytokines and for khead box P3 (FoxP3 ) regulatory T-lymphocyte(7,8) .
Patients and methods:
Sample collection: Patients’ serums were collected form Salah Aldin General Hospital during period (November ,2018- March, 2019) a total of 44 patients Suffering from Allergic rhinitis (A.R), with average age (29)years after diagnosis by physician ENT Specialist and control group included 32 healthy person who don’t suffering from any infections( healthy persons ) with average age (30) years.
Detection level of interleukin -10: levels of (L-10) were measuring by the ELISA (Beckman_USA) according to manufacturer’s protocols (IL_10 ELISA kits), by pre-coated microtiter plate with an antibody specific to IL_10 , after then added the samples and standard to appropriate wells, then added to each wells in microtiter plate the biotin conjugated antibody and avidin conjugated to Horseradish peroxidase(HRP) and incubation, then adding TMBsubstrate solution for wells. terminated enzyme substrate reaction by adding sulphuric acid solution and by spectrophotometrically measure the colour change at a wavelength ( 450 nm).concentration of Interleukin-10 in serum of patients determine by compare O.D of samples with standard curve. All samples are detected in duplicate.
Data Analysis
The Statistical Analysis System- SAS (2012) (9) program was used to effect of difference groups in serum IL_10 in allergic rhinitis patients and effect of steroid in its levels. y.
Findings
Table 1: Demographic of the study groups ( patients) and control group ( healthy ).
Variable Patients Control p.value
Age (M ±S.D)year 29.17 ± 7.65 30.23 ± 8.90 P<0.01
Gender
Males 29 ( 65.9 %) 18 ( 56.3 %)P<0.01
Females 15 (34.1 %) 14 (43.7 %)
Total 44 ( 100 %) 32 (100 %)
Table (1) showed the mean of age ± Standard division was ( 29.17 ± 7.65 ) compare to control (30.23 ± 8.90), as well as results in this table showed high incidence allergic rhinitis in males 29(65.9%) than females 15( 34.1%) ,also in control group the males18 ( 56.3 %) and the females14 (43.7 %) ; P<0.01.
Table 2. levels of IL_10 in serum of patients with control group .
Study groups Level of IL_10 Mean of concentration ± SE (pg/ml)
patients with allergic rhinitis 8.21 ± 0.25
Control (healthy) 11.67 ± 0.33
P-value 0.0001
** (P<0.01)

1776 Indian Journal of Public Health Research & Development, November 2019, Vol. 10, No. 11
Results in table (2) showed significant level decreased of IL(10) in serum patients who have allergic rhinitis as ( 8.21 ± 0.25 ) , compare to control group ( healthy persons ) as(11.67 ± 0.33 ) differed significantly (P<0.01 ) (fig.1).
Table 3. Levels of ( IL_10) in serum of patients with allergic rhinitis before and after received steroid
Study groups Level of IL_10 Mean of concentration ± SE (pg/ml)
Patients before received steroid 8.21 ± 0.25
Patients after received steroid 10.06 ± 0.23
LSD value 0.761 **
P-value0.0001
** (P<0.01)
Results in table (3) showed significant increased level of IL_10 (10.06 ± 0.23 ) in serum of Patients with allergic rhinitis who received gluococorticoid ( steroid ) Patients compare to Patients before received gluococorticoid ( steroid ), a differed significantly (P<0.01) (fig.1).
Discussion
Rhinitis is a common disorder is broadly defined as inflammation nasal mucosa. Current study showed high incidence Allergic Rhinitis in males than females,It affects more than 40% of the population of world(10). The high incidence of new-onset AR was the youngest age group (20-29) years(11) .
Results in of current study showed significant decreased levels of IL_10 in patients serum with allergic rhinitis as ( 8.21 ± 0.25 ) , compare to control group ( healthy persons ) as(11.67 ± 0.33 ) differed significantly (P<0.01 ), but significant increased level of IL_10 (10.06 ± 0.23 ) in serum Patients who received gluococorticoid ( steroid ) Patients compare to Patients before received gluococorticoid (steroid ), a differed significantly (P<0.01 ).
Whilst other studies, showed no significant difference was detected in Patients with allergic rhinitis and the control(12) .The efficacy of immune
therapy for seasonal allergy rhinitis is confirmed but still not in perennial allergy rhinitis in UK, Immune therapy indicated: Evidence of I.g.E mediated disease ; Inability to avoid allergies ; Failure of drug therapy ; Compliance(13).IL10 decrease in Allergic rhinitis so there’s reverse relation between IL10and I.g.E. IL10inhibits IL2 and IL5 production by TH1and TH2
, so it act as immune suppresser, and the IL10increase in patient received Glucocorticoid therapy (both act as immune suppressor), short course of oral prednisolone (20 mg) for (5) days are very effective for seasonal symptoms(13), administration of IL10 during allergic attack significantly reduced eosinophils and Mast cells as well as type2 cell helper that leading to decrease the inflammatory process, so it will reduced allergic rhinitis(13), as well as many previous studies showed significant increase in IL10 after immunotherapy (14)
The sodium cromoglycate or Cromolyn have the ability for educing sneezing; rhinorrhea and nasal itching , therefore a reasonable therapeutic option for patients, also anti-I.g.E antibody omalizumab has effective for asthma and seasonal allergic rhinitis(10).So many studies appearance the relationship between cytokines with AR as IL-4 and IL-13(15).Corticosteroids are worked by decrease inflammation and suppress immune response(16) .
As well as therapy by glucocorticoid caused inducing the T-lymphocytes apoptosis in peripheral lymphoid organs and down-regulated adhesion molecules, and causing reduce the migrated T cells to the site of inflammation(17).
Conclusion
High incidence Allergic Rhinitis in males than females.
Decreased level of (IL_10) in serum of AR patients as but significant increased level of (IL_10) in serum of AR patients who received gluococorticoid ( steroid ) Patients compare to Patients before received gluococorticoid ( steroid ).
Recommendation :future study about consider IL_10 as a part of immunotherapy for patients with allergic rhinitis.
Ethical Clearance: from research ethic committee in Tikrit university/college of medicine

Indian Journal of Public Health Research & Development, November 2019, Vol. 10, No. 11 1777
Source of Funding : Self
Conflict of Interest : None
References
1. Bousquet J, Khaltaev N, Cruz AA . Allergic rhinitis and its impact on asthma (ARIA) 2008 update. Allergy 2008; 63 . 86:8–160.
2. Scadding G.Cytokine profiles in allergic rhinitis. Curr Allergy Asthma Rep. 2014 ;14(5):435.
3. Flavia C. L. Hoyte, Harold S. Nelson.Recent advances in allergic rhinitis. Version 1. F1000Res. 2018; 7: F1000 Faculty Rev-1333.
4. Baraniuk JN.Pathogenesis of allergic rhinitis. J Allergy Clin Immunol. 1997;99(2):S763-72.
5. Maes, G. F. Joos, and G. G. Brusselle, “Targeting interleukin-4 in asthma: lost in translation,” American Journal of Respiratory Cell and Molecular Biology, 2012,47, 3,:261–270, 2012.
6. Broide DH. allergic rhinitis: Pathophysiology.Allergy Asthma Proc.2010;31(5):370-4.
7. Ashwell J.D., Lu F.W., Vacchio M.S. Glucocorticoids in T cell development and function. Ann. Rev. Immunol. 2000;18:309–345.
8. Okano, M. Mechanisms and clinical implications of glucocorticosteroids in the treatment of allergic rhinitis.British Society for Immunology, Clinical and Experimental Immunology, 2009.158: 164–173
9. SAS. Statistical Analysis System, User’s Guide. Statistical. Version 9.1th ed. SAS. Inst. Inc. Cary. N.C. USA2012.
10. Small P, Frenkiel S, Becker A, Boisvert P, Bouchard J, Carr S, Cockcroft D, Denburg J, Desrosiers M, Gall R, Hamid Q, Hébert J, Javer A, Keith P, Kim H, Lavigne F, Lemièr C, Massoud E, Payton K, Schellenberg B, Sussman G, Tannenbaum D, Watson W, Witterick I, Wright E, The Canadian Rhinitis Working Group: Rhinitis: A practical and comprehensive approach to assessment and therapy. J Otolaryngol. 2007, 36 ;1: S5-S27.
11. Nihlén U, Greiff L, Montnémery P, et al. : Incidence and remission of self-reported allergic rhinitis
symptoms in adults. Allergy. 2006;61(11):1299–304.
12. Qiu Q., Lu H., Lu C., Chen S., Han H. Variations in TGF-beta, IL_10 , and IL-17 after specific immunotherapy and correlations with symptoms in patients with allergic rhinitis. Journal of Investigational Allergology & Clinical Immunology. 2012;22(4):311–312).
13. Michael D. Seidman, ; Richard K. Gurgel, ; Sandra Y. Lin; Seth R. Schwartz; Fuad M. Baroody; James R. Bonner; Douglas E. Dawson; Mark S. Dykewicz; Jesse M. Hackell; Joseph K. Han;, Stacey L. Ishman; Helene J. Krouse ; Sonya Maleskzadeh; James (Whit) W. Mims ; Folashade S. Omole; William D. Reddy; LAc, DiplAc; Dana V. Wallace; Sandra A. Walsh; Barbara E. Warren; PsyD, Med; Meghan N. Wilson ; Lorraine C. Nnacheta . Clinical Practice Guideline: Allergic Rhinitis.2015.152(1):1-43.
14. Ciprandi G;, De Amici M; Tosca MA; Pistorio A and Marseglia GL.Sublingual immunotherapy affects specific antibody and TGF-beta serum levels in patients with allergic rhinitis.Int J Immunopathol Pharmacol. 2009;22(4):1089-96.
15. Bayrak P.girmenci; S. Aksun; Z. Altin; F. Bilgir; I.B. Arslan. H.Colak. B. Ural., D. Solakoglu Kahraman. G. Diniz B. Ozdemir and C.Kırmaz.. Allergic Rhinitis and Its Relationship with IL_10 , IL-17, TGF-β, IFN-γ, IL 22, and IL-35. Disease Markers, 2018, ID 9131432,6.
16. Agnes E. Coutinho and Karen E. Chapman. The anti-inflammatory and immunosuppressive effects of glucocorticoids, recent developments and mechanistic insights.Mol Cell Endocrinol. 2011 Mar 15; 335(1): 2–13.
17. Wust S., van den Brandt J., Tischner D., Kleiman A., Tuckermann J.P., Gold R., Luhder F., Reichardt H.M. Peripheral T cells are the therapeutic targets of glucocorticoids in experimental autoimmune encephalomyelitis. J. Immunol. 2008;180:8434–8443.

Association of Hyperuricemia with Knee Osteoarthritis and Generalized Osteoarthritis in Iraqi Patients
Abbas Hamza Zainel1, Sundus Awni Wahab1, Yahya Abdel Aziz Mohammed2
1M.B.Ch.B.-H.D.R.MR. Azadi Teaching Hospital, Kirkuk health directorate, Kirkuk City, Iraq, 3 M.B.Ch.B.-H.D.R.MR. Kirkuk Genenal Hospital, Kirkuk health directorate, Kirkuk City, Iraq
Abstract
A number of 288 osteoarthritis patients involved in this study, their ages, sex, BMI .serum uric acid levels are recorded, knee joints x ray done for them, and classified into 5 grades (grade 0-grade4).serum uric acid level classified into 3 classes (low2.5.normal 2.5-6, high more than 6 mg\dl) establishing the diagnosis of knee degenerative arthritis according to criteria of ACR (American college of rheumatology. The aim of the stud was to find relation between serum uric acid level with knee osteoarthritis and generalized osteoarthritis in Iraqi patients . in this cross-sectional study, 288 patients involved their ages ranged from 45-90 years old mean age 67.5 years; female patients were 216 (75%). Mean age of females 62.5 years. Male patients 72 (25%). Mean age of males 67.5 years. The study shows highest rate of knee OA patients and generalized OA (76.21%,63.16 respectively) have normal level of uric acid ,while only low rate of knee OA patients and generalized OA(21.93%,31.58 respectively)have high level of uric acid which was NS (P=0.547) This cross sectional study conclude that there was no association between hyperurecemia and knee osteoarthritis nor generalized osteoarthritis
Key words: hyperurecemia, knee OA, Generalized OA.
Introduction
The risk of mobility and disability attributable to osteoarthritis (OA) alone is greater than any other medical condition among elderly (1). The prevalence of OA that are symptomatic varies between 7 and 26% dependent on the site and definition of OA (2). The burden of OA has been increasing in the past two decades worldwide and its prevalence is projected to be nearly double in the next decade (3). Current treatment paradigms are limited to palliative measures broadly focused on analgesia and joint replacement for end stage disease. Gout is a crystal-induced arthritis caused by deposition of the monosodium uric acid crystal (MSU) related to long standing hyperuricemia. It is also a common inflammatory arthritis affecting around 5% of the middle-aged and elderly population worldwide (1). The association of uric acid and OA has long been observed, and a pathological link between gout and OA has been hypothesized (4). Aging and obesity are significant risk factors shared by both OA and gout, and may confound the association between both conditions(5-7). Degenerative arthritis is the most well
known joint arthritis worldwide(1). The link with age, weight, gender and metabolic parts has been studied.
(3). These investigations demonstrated a relationship of degenerative arthritis with increase in body weight. A portion of these examinations represented serum uric acid and found no relationship among it and OA (5). Davis et al explored a significant relationship among knee degenerative arthritis and uric acid yet a little one not achieving noteworthy level(2). Sun Ye et al particularly explored serum uric acid association with osteoarthritis and presumed that albeit uric acid was related with generalized degenerative arthritis in patients experiencing hip substitution, there have been no relationship with knee degenerative arthritis or respective hip or knee degenerative arthritis(8). Others revealed a relationship with degenerative of different joints(9). While a study done in Saudi Arabia found a conceivable relationship among hyperurecemia and knee and generalized OA(11). Suad A et al found a relationship between uric acid dimension and knee OA(12). The aim of he current study was to explore the connection among serum uric acid and knee and generalized degenerative arthritis in Iraqi population.

Indian Journal of Public Health Research & Development, November 2019, Vol. 10, No. 11 1779
Methodology
The present investigation included 288 patients seeing by rheumatologists in two noteworthy healing centers (Azadi Teaching Hospital and Kirkuk General Hospital) in Kirkuk city in the north of Iraq. Their age, sex, weight index (body mass index) (weight in kg separated by the square of length in meters), serum uric acid were recorded. Body mass index grouped by World health organization into following classes: Table 1.
Establishing a patient suffering from knee OA were according to ‘The American College of Rheumatology criteria for diagnosis of rheumatic diseases’ and these are:
• Knee pain.
• Osteophytes on X-ray.
• Crepitus on knee range of motion.
• Morning stiffness of short duration (<30 min).
Inclusion Criteria
Patients within the age group of 45-90 years of both sexes, who were suffering from primary Knee OA, were included in the study.
Exclusion Criteria
Patients aged less than 41 years and more than 90 years,
Pregnant women and those suffering from secondary OA,
Rheumatoid arthritis, Diabetes Mellitus, Renal insufficiency, Hepatic disease, gout or with any other systematic disease were excluded from the study.
Blood samples along with the radiographs of the knee joints were also taken. The presence of degenerative arthritis was defined as having stage 2 or more of the Kellgren-Lawrence grading system1957):13. Radiographic appearance of knee joints, the patients was categorized into four stages according to KL staging system (Kellgren and Lawrence.
Kellgren and Lawrence grading system for OA:
1-stage 0- Normal
2-Stage 1-Doubtful narrowing of the joint space and
possible
Osteophytic lipping
3-Stage 2-absolute osteophytes and possible decreasing in joint space.
4-Stage 3-Moderate multiple osteophytes, definite narrowing of the joint space, some sclerosis and possible deformity of the bone contour
5-Stage 4- Large osteophytes with marked narrowing of the joint space, severe sclerosis and definite deformity of the bone contour.
Generalized degenerative arthritis was outlined as the coincidental presence of radiographic changes of knee and hand degenerative arthritis.
Laboratory investigations
Blood tests were permitted to cluster and after that centrifuged at3000 rpm for 30 minutes to get serum uric acid levels were evaluated by spectrophotometer strategy
The serum uric acid qualities were arranged into tertiles (low, normal. Abnormal states), (2, 5-6) mg\dl. Low less than 2.5 mg\dl while abnormal state more than 6 mg\dl.
Also, balanced for age, sex, knee OA and generalized OA, utilizing the Q square investigation strategy.
Findings
A number of 288 patients involved in this cross sectional study their ages ranged from (45-90) mean age 67.5 years; female patients were 216 (75%). Mean age of females 62.5. Male patients 72 (25%), mean age of males 67.5. the study shows highest rate of knee OA patients and generalized OA (76.21%,63.16 respectively)have normal level of uric acid ,while only low rate of knee OA patients and generalized OA(21.93%,31.58 respectively)have high level of uric acid which was NS (P=0.547), Table:2.
In this study we found that 6 female patients (2.78%) has low level of uric acid and 180 female patients (83.33%) have normal level .and 30 female patients (51.39) have high uric acid level. while 35 patients (48.61%) of male have an high level of uric acid and 35 male patients (48.61) have high level of uric and no

1780 Indian Journal of Public Health Research & Development, November 2019, Vol. 10, No. 11
one of the have decreased level. The result was highly significant (P: 0.0001)(Table-3)
The study shows that the highest mean level of uric acid was observed in male patients comparing with females (6.087±0.190 V.S 4.577±0.81 mg/dl) with highly significant relation(Table-4).
In Table 5, there was no significant relation between knee O A and generalized O A regarding the sex and 94.44% of males have knee O A and 93.05% of female have knee O A. BMI ≤30was observed in 101 Knee OA (91.1%) and 9generalized OA (8.9%). BMI>30was in 178 knee OA (95.2%) and 9generalized OA (4.8%).P value=0.17 NS .table 6.
Table 1: Classification of body mass index (BMI) by WHO.
BMI Classification
<18.5 underweight
18.5-24.9 normal
25.0-29.9 overweight
30.0-34.5 Obesity(class I)
35.0-39.9 Obesity(class II)
>40 Extreme obesity (class III)
Table 2. Relation of knee O A and generalized O A with uric acid level.
Sex No.
Uric acid level (mg /dl)
P. valueLow Normal High
No. % No. % No. %
Knee O A 269 5 1.86 205 76.21 59 21.93
0.547(non significant)
Generalized O A 19 1 5.26 12 63.16 6 31.58
Table 3: Distribution of uric acid level in O A patients according to their sex.
SexNo.
Uric acid level (mg /dl)
P. valuelow Normal High
No. % No. % No. %
Male 72 0 0 37 51.39 35 48.61 0.0001Highly significant(HS)Female 216 6 2.78 180 83.33 30 13.89

Indian Journal of Public Health Research & Development, November 2019, Vol. 10, No. 11 1781
Table 4: Relation of uric acid mean level with sex
Sex
P. valueMale Female
No. Mean ± S.D No. Mean ± S.D
Uric acid level (mg/dl) 72 6.087±0.190 216 4.577±0.810.001(HS)
Table 5: Relation of O A status with sex
Sex No.Knee O A Generalized O A
P. valueNo. % No. %
Male 72 68 94.44 4 5.56 0.918Non significant
Female 216 201 93.05 15 6.95
Table 6: shows the relation between BMI with knee OA and generalized OA.
BMI (kg/m2) No.Knee O A Generalized O A
P. valueNo. % No. %
≤ 30 101 92 91.1 9 8.90.17(NS)
>30 187 178 95.2 9 4.8
Discussion
In this cross sectional study we found no relationship among hyperurecemia and knee O A or generalized O A as reported before hand (3,5). Additionally Palazzo al (6) discovered that the elements, including: diabetes mellitus, ischemic coronary illness, hypertension, physical action, conjugal status, serum uric acid, triglycerides, cholesterol and blood glucose levels) did not correspond to radiographic O A , Howard (10) inferred that (serum uric acid dimension not related with OA of knee in men). Iqbal et al (11) found in study (In all classes of knee OA serum uric acid was no significantly increased). We believed this no relationship between uric acid dimension and knee OA could be because of high serum uric corrosive in patient will prompt arrangement of uric acid crystals in the joint along these lines quicken the advancement of gouty joint inflammation which is an inflammatory arthritis, while knee OA is the most well-known type of non inflammatory joint diseases.
Different studies found a conceivable relationship among hyperurecemia and knee OA. Al-Arfaj et al (13), Anderson et al (14), Ding et al (15), in their studies presumed that serum uric focus and predominance of hyperurecemia are emphatically connected with OA of the knee in the female population. We additionally found a relationship between knee OA and obesity as announced already by Srikanth et al (16) noted positive associations of uric acid concentration with OA, but these associations became insignificant when body mass index (BMI) was controlled as confounder. On the other hand, uric acid levels at the highest tertile may be associated with OA. In a cross-sectional study, the highest serum uric acid tertile were associated with generalized OA in subjects who had undergone arthroplasty for hip OA, but not with those who had undergone arthroplasty for knee OA (1-2). We found higher rate of knee OA among female patients as revealed beforehand by Srikanth et al (16) indicated that there is more serious hazard in females for common and episode knee and hand. There

1782 Indian Journal of Public Health Research & Development, November 2019, Vol. 10, No. 11
was no connection between radiological evaluations of knee OA and serum uric acid dimension. Another cross-sectional study involving over 4,000 participants in China has shown that women with the highest tertile of uric acid showed the highest degree of radiographic features suggestive of knee OA after adjusted for various confounding risk factors including BMI (17). Bevis et al (17) sowed in a multivariable logistic analysis model was applied to test the target associations after adjusting a number of potential confounding factors. Ma et al (18) he prevalence of OST was increased in the highest tertile of uric acid compared to the lowest in female subjects
Conclusion
This cross sectional study conclude that there was no association between hyperurecemia and knee degenerative arthritis nor generalized degenerative arthritis ,our suggestion for more studies to found a correlation of presence of uric acid crystals in synovial fluid of knee joints with degenerative arthritis .
Conflict of Interest: Non
Source of Findings: Self findings.
Ethical Clearance: This research was carried out with the help of my colleagues mentioned with me. The oral and paper approval of the patients in this study, which included the withdrawal of blood samples from them and laboratory tests.
References
1- Kapoor M, Mahomed NN, editors. Osteoarthritis: Pathogenesis, diagnosis, available treatments, drug safety, regenerative and precision medicine. Springer; 2015 Jul 20.
2- Westendorf JJ, Van Wijnen AJ, editors. Osteoporosis and osteoarthritis. Humana Press; 2015.
3- Azar FM, Canale ST, Beaty JH. Campbell’s operative orthopaedics e-book. Elsevier Health Sciences; 2016 Nov 1.
4- Hegadi RS, Pawar TD, Navale DI. Classification of Osteoarthritis-Affected Images Based on Edge Curvature Analysis. InData Analytics and Learning 2019 (pp. 111-119). Springer, Singapore.
5- Schouten JS, Van den Ouweland FA, Valkenburg HA. A 12 year follow up study in the general population on prognostic factors of cartilage loss in osteoarthritis of the knee. Annals of the rheumatic diseases. 1992 Aug 1;51(8):932-7.
6- Palazzo C, Nguyen C, Lefevre-Colau MM, Rannou F, Poiraudeau S. Risk factors and burden of osteoarthritis. Annals of physical and rehabilitation medicine. 2016 Jun 1;59(3):134-8.
7- Hart DJ, Doyle DV, Spector TD. Association between metabolic factors and knee osteoarthritis in women: the Chingford Study. The Journal of rheumatology. 1995 Jun;22(6):1118-23.
8- Sun Y, Brenner H, Sauerland S, Günther KP, Puhl W, Stürmer T. Serum Uric acid and patterns of radiographic osteoarthritis-the Ulm osteoarthritis study. Scandinavian journal of rheumatology. 2000 Jan 1;29(6):380-6.
9- Acheson RM, Collart AB. New Haven survey of joint diseases. XVII. Relationship between some systemic characteristics and osteoarthrosis in a general population. Annals of the Rheumatic Diseases. 1975 Oct 1;34(5):379-87.
10- Howard RG, Samuels J, Gyftopoulos S, Krasnokutsky S, Leung J, Swearingen CJ, Pillinger MH. Presence of gout is associated with increased prevalence and severity of knee osteoarthritis: among older men: results of a pilot study. Journal of clinical rheumatology: practical reports on rheumatic & musculoskeletal diseases. 2015 Mar;21(2):63.
11- Iqbal MN, Haidri FR, Motiani B, Mannan A. Frequency of factors associated with knee osteoarthritis. JPMA-Journal of the Pakistan Medical Association. 2011 Aug 1;61(8):786.
12- Rahman SA, Rasool MT. Association of serum uric acid level with osteoarthritis of knee joint. Duhok Medical Journal. 2011;5(1):24-8.
13- Al-Arfaj A, Al-Boukai AA. Prevalence of radiographic knee osteoarthritis in Saudi Arabia. Clinical rheumatology. 2002 May 1;21(2):142-5.
14- Anderson JJ, Felson DT. Factors associated with osteoarthritis of the knee in the first national

Indian Journal of Public Health Research & Development, November 2019, Vol. 10, No. 11 1783
Health and Nutrition Examination Survey (HANES I) evidence for an association with overweight, race, and physical demands of work. American journal of epidemiology. 1988 Jul 1;128(1):179-89.
15- Ding X, Zeng C, Wei J, Li H, Yang T, Zhang Y, Xiong YL, Gao SG, Li YS, Lei GH. The associations of serum uric acid level and hyperuricemia with knee osteoarthritis. Rheumatology international. 2016 Apr 1;36(4):567-73.
16- Srikanth VK, Fryer JL, Zhai G, Winzenberg TM, Hosmer D, Jones G. A meta-analysis of sex differences prevalence, incidence and severity of osteoarthritis. Osteoarthritis and cartilage. 2005 Sep 1;13(9):769-81.
17- Antón FM, García Puig J, Ramos T, González P, Ordás JSex differences in uric acid metabolism in adults: evidence for a lack of influence of estradiol-17 beta (E2) on the renal handling of urate.: Metabolism. 1986 Apr;35(4):343-8
18- Bevis M, Marshall M, Rathod T, Roddy E. The association between gout and radiographic hand, knee and foot osteoarthritis: a cross-sectional study. BMC Musculoskelet Disord (2016) 17:169.
19- Ma CA, Leung YY. Exploring the link between uric acid and osteoarthritis. Frontiers in medicine. 2017 Dec 13;4:225.

Relationship Serum Thyroid Stimulating Hormone with Body Mass Index in Patients with Thyroid Disorder
Athraa Fouad Kadhuim
Middle Technical University, Institute of Medical Technology/Baghdad/ Nursing Department, Iraq
Abstract
Hypothyroidism and hyperthyroidism have clear effects on body weight. In this study, we aimed to find the possible association between the serum thyroid stimulating hormone (TSH) and the body mass index (BMI). The weight, height and (TSH) were estimated for a total of (150) subjects whose ages ranged between (30-60) years during the period from March 2018 to July 2018. Participants were divided into three groups according to the BMI values: Normal weight (18.5-24.9Km/m2), overweight (25-29.9Km/m2) and obese (BMI ≥ 30Km/m2). The normal value for TSH was (0.25-5µIU/ml). Levels of serum thyroid hormones were assayed by Chemiluminescence immunoassay at the laboratory of Baghdad teaching hospital/Baghdad. A significant difference (P<0.001) was found in our study between TSH value and increased BMI. Subjects with higher (BMI) had also higher TSH, and this trend continued from normal weight to obese individuals. The mean (TSH) for normal subjects was (0.7093±0.384 mIU\L), for overweight was (0.7316±0.7309 mIU\L) and for obese was (1.2752±0.8258 mIU\L). The mean serum (TSH) concentrations demonstrated a significant increasing trend with the increasing (BMI) (p<0.01). It can be concluded from these findings that mean serum TSH levels increased with increased BMI values. To confirm the relationship between thyroid hormone levels and BMI, further large scale studies are required.
Key words: Body mass index (BMI),Overweight; Obesity, Thyroid stimulating hormone (TSH).
Corresponding author: Athraa Fouad KadhuimE-mail: drnihadkhalawe@ gmail.com
Introduction
Obesity has been increasingly identified as a main global raising health problem. Several previous studies were performed regarding the association between body mass measures including (BMI) and thyroid profile, but they were not fully understood. There was a continuous conflict between the majorities of studies on the results of this association. The BMI profile can be influenced by even a small alteration in the TSH values [1]. In euthyroid individuals, significant positive correlations are found between BMI and TSH values [2,3]. However, no findings were revealed by other studies to confirm the relationship between BMI and thyroid status [4]. The question that jumps into our minds is how to demonstrate the TSH level of people in regard to their BMI , and how to support and prove this association on scientific basis
among our studied population. The major aim of our study is to show the relationship between BMI and TSH levels among healthy adult people whose TSH range between 0.4 mlIU and 10 mIU.
Thyroid gland is stimulated by a pituitary hormone called thyroid stimulating hormone, which is also known as (thyrotropin or thyrotropic hormone or TSH) to form thyrotoxin or (T4) and then triiodothyronine or (T3) that, in turn, stimulates most body tissue metabolisms [5]. TSH is a glycoprotein hormone, which is made and released by thyrotrope cells of the anterior pituitary gland to regulate thyroid’s functions.
Thyroxin or (T4) is converted into triiodothyronine or (T3), the active hormone that plays a key role in stimulating metabolism. Nearly (80%) of T4 is converted into T3 in the liver and other organs, while (20%) is converted in thyroid gland itself [5]. There is a continuous secretion of TSH throughout the life, but it reaches its highest levels during the times of rapid development and growth. The thyrotropin releasing hormone or (THR) is

Indian Journal of Public Health Research & Development, November 2019, Vol. 10, No. 11 1785
produced by the hypothalamus, which is located in the brain base, and the pituitary gland, in turn, is stimulated by THR to produce TSH.
The hypothalamus also produces somatostatin hormone, which has an inverse effect on the production of TSH by pituitary gland, leading to a decrease or a reduction of its release.
The levels of serum T4 and T3 control and adjust the TSH production and release by the pituitary gland. When the levels of T4 and T3 are low, there is an increase in TSH production, whereas when the levels of T4 and T3 are high, there is a decrease in TSH production, which represents a negative feedback loop [6].
Tertiary or central disease or TSH to THR pathology may be indicated by any improper measuring of thyroid values e.g (low to normal TSH together with low to normal T4). Euthyroid sick syndrome is indicated by high reverse values of T3 (RT3) along with normal TSH and low and normal T4 and T3 levels, which may also be investigated for chronic sub-acute thyroiditis.
With a previous diagnosis of an auto immune thyroid disease, this may always be suspected to develop into SAT even when normal TSH exists, as no recovery has been yet found from autoimmune diseases.
It is necessary to state that the secretion of TSH is based on a pulsatile manner, in order to interpret the clinical laboratory results [6][7][8], leading to both ultradian and circadian rhythm of their serum levels [9].
[10] Showed that fine tuning between energy intake and consumption regulates the body weight. The factors which determine energy consumption involve: resting energy expenditure, no activity of exercise as well as the voluntary physical activity. T3 is responsible for about 30% of resting energy expenditure, and plays a key role in the homeostasis of temperature of human beings. The resting energy expenditure may also be affected by T3 via spontaneous motor activity regulation.
Subjects and methods
Our study was conducted on 150 adult subjects (59 males and 91 females). The study was performed in Baghdad teaching hospital / Baghdad city, during the period from March 2018 to July 2018. Serum thyroid stimulating hormone (TSH) was used to assess their thyroid disorders, and BMI was used to measure
their body weights. Being an Iraqi adult was the only inclusion criteria for an individual to be enrolled, while exclusion criteria included any present or previous thyroid disorder, cigarette smoking, and chronic renal or hepatic diseases, taking drugs that change serum TSH levels such as metformin in addition to pregnancy. A data collection form was prepared including age, gender, height, weight as well as the laboratory results of TSH estimation. Before enrollment in the study, all participants were informed about its methods and objective. Written informed consents were taken from all persons who were told that their participation in the study is entirely voluntary. The weights in Kilograms) and the heights in meters were measured, while the participants were barefooted and putting on light clothing. The body mass index (BMI) was calculated by dividing the body weights in Kilograms by the heights in meters, and the grouping of the participants was done according to their BMI in the following form: Normal weight (18.5-24.9Km/m2),overweight (25-29.9Km/m2) and obese (BMI ≥ 30Km/m2) [11].
Serum samples were analyzed immediately by Chemiluminescence immunoassay at the laboratory of Baghdad teaching hospital. Results of serum thyroid hormones of the participants were compared with their BMI grades. For data entry and statistical analysis of results, the statistical package of social science (SPSS version-22) program was applied, and the appropriateness of significance (ANOVA or chi square) were used for the descriptive statistics.
Findings
The current studied showed the correlation between the mean body mass index (BMI) and the mean serum (TSH) among the studied group. Table (1) indicated the distribution of gender percentage according to (BMI) among participants as follows: In the normal weight whose (BMI) ranged between (18.5-24.9Kg\m2), the result of gender distribution was 11 males (18.64%) and 18 females (19.78%) , while in the overweight whose (BMI) ranged between (25-29.9 Kg\m2), the result of gender distribution was 20 males (33.89%) and 23 females (25.27%), whereas in the obese group whose ( BMI 30 kg/m2), the result of gender distribution was 28 males (47.45%) and 50 females (54.94%). It was shown that the obesity was significantly higher among females than male participants.

1786 Indian Journal of Public Health Research & Development, November 2019, Vol. 10, No. 11
Table (2) and figure (1) showed the mean (TSH) values and the standard deviation ( SD) for every (BMI) group. The mean serum (TSH) for the normal weight group was , while for overweight group was and for obese group was . The mean serum (TSH) concentrations revealed a significant increasing trend with the increasing (BMI) values (𝑝 < 0.01).
Table (1): Distribution of body mass index (BMI) according to gender
BMIMale (59) Female (91)
Total %N % N %
Normal weight (BMI: 18.5-24.9 kg/m2)
11 18.64 18 19.78 29 19.33
Over weight (BMI: 25-29.9 kg/m2)
20 33.89 23 25.27 43 28.66
obese
(BMI 30 kg/m2).28 47.45 50 54.94 78 52
Table (2): Distribution of (TSH) according to (BMI)
BMI NTSH mean
Standard Deviation±SD
P-value
Normal weight 29 0.7093 ± 0.3842 0.15 NS
Over weight 43 0.8612 ± 0.3709 0.005 *
obese 78 1.2752 ± 0.8258 0.001 **
Total 150
NS:- non significant, *:-significant ≤ 0.05 , **:- highly significant ≤ 0.01.
A great deal of attention was given by medical researchers to the relationship between BMI and thyroid hormones in euthyroid adult people [12]. Thus, the aim of the current study was to measure serum thyroid hormone levels in Iraqi adults and correlates them with their (BMI). In this study, the results showed that the majority of participants fall within overweight (28.66%) and obese (52%) categories, and there was a highly significant obesity conditions in females than males.
These results were in agreement with the study of [13] who found a significant correlation between mean TSH levels and BMI. Our results demonstrated that serum TSH levels of the studied individuals recorded a highly significant trend with the increasing (BMI).
Other researchers such as [14] found no relationship between serum TSH levels and free thyroxin levels
within the normal BMI range when they studied the effect of thyroid hormones on BMI. In contrast, other researchers such as [1] reported that thyroid function may be among those factors which function in conformity for body weight determination.
Chan et al [15] clarified the TSH-BMI relationship to be under the adipose tissue signal impacts, and they also indicated the possible significant effect of leptin on the central regulation of thyroid function via TRH. [16] Hypothesized that the positive association between serum TSH and leptin levels is also positively associated with the TSH-BMI relationship.
High triglyceride (TG) and low high density lipoprotein (HDL) levels were detected in subclinical hypothyroidism patients by [17].

Indian Journal of Public Health Research & Development, November 2019, Vol. 10, No. 11 1787
Furthermore, [18] showed the presence of a positive relationship between (TSH) and (BMI), assuming the possibility of presence of other subclinical hypothyroidism condition, i.e elevated (TSH) concentrations, although the serum concentrations of the hormone are normal.
However, whether the verification of elevated serum TSH to be the cause of the influence is certainly confirmed or not, A. The [19, 20] observed that thyroid function disorders could be the primary and BMI alterations could be the secondary cause and vice versa.
The well-established receptor expression and the message transfer inside the adipocytes affirm the biological significance of the positive association between obesity and serum TSH levels. The possible existence of ‘’Hypothalamus-Pituitary-Adipocyte axis’’ is proven when the expression of multiple pituitary hormone receptors is considered. In regard to downward regulation, the association between obesity and TSH levels may be stable. In addition, a system of feedback regulations may be necessary for this axis, therefore, the positive relationship between obesity and TSH may be reversely interpreted [21]. There is an association between weight gain and thyroid gland as thyroid gland releases hormones which help in metabolism regulation. This process controls the body utilizing of energy, when an individual may feel cold, tired or stagnant. Human’s body is clogged by salt and water due to hypothyroidism, which in turn leads to body swelling [22, 23].
Conclusion
It can be concluded from this study that there was an elevation in the levels of mean serum TSH when the BMI increased. Additional large scale studies are recommended to confirm the correlation between thyroid hormone concentrations and BMI values in euthyroid adults.
Source of Funding: - Self
Ethical Clearance: Formal administrative approval was obtained from laboratory of Baghdad teaching hospital.
Conflict of Interest:-Non
Reference
1. Knudsen N, Laurberg P, Rasmussen LB, Bullow
I, Perrild H, Ovesen L. Small differences in thyroid function may be important for body mass index and the occurrence of obesity in the population. J Clinical Endocrinal Metabolism.2005.90:4019-24.
2. Nyrnes A, Jorde R, Sundsfjord J. Serum TSH is positively associated with BMI. International Journal of Obesity. 2006.30:100-5.
3. Asvold BO, Bjero T, Vatten LJ. Association of serum TSH with high body mass differs between smokers and never-smokers. Journal of Clinical Endocrinal Metabolism. 2009.94.5023-7.
4. Manji N, Boelaert K, Sheppard MC, Holder RL, Gough SC, Franklyn JA.Lack of association between serums TSH or free T4 and body mass index in euthyroid subjects. Clinical Endocrinal. 2006. 64:125-8.
5. The American Heritage Dictionary of the English; Language,4 th ed. Houghton Mifflin Company.
6. Sacher R, Richard A. McPherson .Widmann,s Clinical Interpretation of Laboratory Tests, 1 lth ed. F.A. Davis Company.
7. Estrada JM, Soldin D, Buckey TM, Burman KD, Soldin OP .Thyrotropin isoforms: implications for thyrotropin analysis and clinical practice. Thyroid 2014.24 (3):411-23.
8. Hassan M. Al-Musa .Impact of obesity on serum level of thyroid hormones among Euthyroid Saudi adult. The Journal of Thyroid Research.2017,5.
9. Tarim. O. Thyroid hormone and growth in health and diseases. Journal of Clinical research in pediatric Endocrinology.2011.3 (2). 51-55.
10. Santini, P. Marzullo, M. Rotondi. Mechanisms in endocrinology: the crosstalk between thyroid gland and adipose tissue: signal integration in health and disease, European Journal of Endocrinology. 2014.171: R137-R152.
11. Denicola,O.S.Aburizazia,A. Siddique, H. Khwaja, and D.O. Carpenter. Obesity and Public Health in the kingdom of Saudi Arabia. Reviews on Environmental Health. 2015.30(3).191-205. Milionis and C. Milionis. Correlation between body mass index and thyroid function in euthyroid individuals in Greece. 2013. 7.
12. Solanki, S. Bansal, S. Jindal, V. Saxena, and U.
1788 Indian Journal of Public Health Research & Development, November 2019, Vol. 10, No. 11
Shukla. Relationship of serum thyroid stimulating hormone with body mass index in healthy adults,” Indian Journal of Endocrinology and Metabolism. 2013.(7). 167-169.
13. Manji N, Boelaert K, Sheppard MC, Holdert RL, Gough SC, Franklyn JA.Lack of association between serums TSH or free T4 and body mass index in euthyroid subjects. Clinical Endocrinal.2006. 64(2):125–128.
14. Chan, K. Heist, A. M. DePaoli, J. D. Veldhuis, and C. S. Mantzoros.The role of falling leptin levels in the neuroendocrine and metabolic adaptation to short-term starvation in healthy men,” The Journal of Clinical Investigation.2003.111(9). 1409–1421.
15. Zimmermann-Belsing, G. Brabant, J. J. Holst, and U. Feldt Rasmussen.Circulating leptin and thyroid dysfunction,” European Journal of Endocrinology. 2003.149(4). 257–271.
16. Hueston WJ and Pearson WS. Subclinical hypothyroidism and the risk of hypercholesterolemia. Ann Fam Med.2004 2(4):351–355.
17. Knudsen, P. Laurberg, L. B. Rasmussen. Small differences in thyroid function may be important for body mass index and the occurrence of obesity in the population. The Journal of Clinical Endocrinology
and Metabolism. 2005.90(7). 4019– 4024.
18. Milionis and C. Milionis. Correlation between body mass index and thyroid function in euthyroid individuals in Greece. 2013.651494, 7 pages.
19. Sorisky, A. Bell, and A. Gagnon. TSH receptor in adipose cells Hormone and Metabolic Research. 200.32 (11-12). 468–474.
20. 21. Valyasevi, D. A. Harteneck, C. M. Dutton, and R. S. Bahn. Stimulation of adipogenesis, peroxisome proliferator-activated receptor-γ (PPARγ), and thyrotropin receptor by PPARγ agonist in human orbital preadipocyte fibroblasts. Journal of Clinical Endocrinology and Metabolism.2000. 87 (5). 2352–2358.
21. 22. Laurberg P, Stig Andersen S, Pedersen IB, Carl A. Hypothyroidism in the elderly, pathophysiology, diagnosis and treatment. Drugs Aging.2005. 22(1):23–38.
22. 23.Roos, S. J. L. Bakker, T. P. Links, R. O. B. Gans, and B. H. R. Wolffen buttel, “Thyroid function is associated with components of the metabolic syndrome in euthyroid subjects,” Journal of Clinical Endocrinology and Metabolism, 2007. 92, 2: 491–496.

The Long Term Outcome of Graft Urethroplasty by Buccal Mucosa in Penile and Bulbar Stricture
AzzawiM.Hadi1, Yassir Ismael Abbass2, Mazin Anwar Yadgar3
1M.B.Ch.B. FIBMS. Urology. Department of Surgery, Tikrit Medical College
Abstract
Background Urethral stricture is widely prevalent disease and its management is a challenging surgery. Nosoleideal surgical procedure appropriate inevery situation. The Grafting by Buccal Mucosa (BMGurethroplasty) represents the most appropriate and widely used procedure torepairstricture of urethra. We disclosedtheextended followup thecasesof stricture of urethrathat managed by (BMG urethroplasty) aiming to determine the success rate, recurrence and complications rate. Patients and Method A study was orchestrated to prospectively followup a 39 patients with bulbar and proximal penile urethral stricture disease repaired by BMG urethroplasty. Retrograde urethrography done to confirm the diagnosis , measure the length and locate urethral strictures. Patient demographics, stricture aetiology and anatomy all were recorded. Follow up data in term of success and failure rate, and complication. Results thirty-nine patients ( the mean age was 35.4 years) with urethral strictures disease diagnosed by urethrography of more than 3 cm in length(the mean ofstricture length was 5.34cm). 23, 7, and 9 patients had bulbar, penile and long combined (bulbar and penile) strictures respectively. Early peri- and post-operative complications occurred in 35% it was almost minor complications included scrotal swelling, minor hematoma, urinary infections, and urgency. 4 patients only developed re-stricture 2 of them had a failure. The most frequent major complications were a urethrocutaneousfistula. Conclusion Buccal mucosal graft urethroplasty appear to be a rightful and durable treatmentchoice for cases with urethral strictures, moreover it has a fewer major complications.
Keywords: Buccal mucosal graft (BMGurethroplasty) Urethra, spongiofibrosis, stricture.
Introduction
Urethral stricture is a most prevailing cause of snag of lower urinary tract in the males between 3rd and 5thdecade, carrying an evaluated overall prevalence of 0.5%. Stricture of urethra is an aberrantdiminished diameter of the urethra, that due to a varying degrees of spongiofibrosis, with 50% confined to the bulbar urethra, and 20% penile part(1). We can broadly categorize the causes of strictures in urethra into trauma, infection and inflammation(1). Sexually-transmitted diseases ( mostly gonorrhea), result in chronic bacterial urethritis and responsible for up to 20% of cases, while 30% of urethral strictures are considered idiopathic (2)
The presenting features tend to be related to obstructive voiding symptoms, with a poor urinary stream, post void dripling and a perceivean incomplete evacuation of bladder, or symptoms of recurrent urinary
tract infections (3). Non-invasive investigative methods such as uroflowmetry, the results of which produces a pathognomonic curve with a prolonged voiding time and low-level flow, and ultrasound post-void residual measurements will demonstrate reduced bladder emptying.
Endoscopic visualisation via cystourethroscopy can identify the location of the stricture but provides minimal information on stricture length. Ultrasonography is useful in demonstrating depth of spongiofibrosis, whilst contrast studies such as retrograde urethrography and voiding cystourethrography accurately demonstrate the anatomical location and length of the stricture, which guides further treatment(4)
The Traditional management of urethral stricture was by direct visual urethrotomy, however the reported recurrence rates are as high as 60%.(5) Poor long-term

1790 Indian Journal of Public Health Research & Development, November 2019, Vol. 10, No. 11
outcomes from these endoscopic methods have presented an opportunity for open reconstruction ( urethroplasty) to develop(6)
Urethroplasty is a surgical operation that aimed to reconstruct or repair the urethra. Many surgical techniques used nowadays, but the most commonly practiced are anastomotic and augmentation urethroplasty, the latter using either buccal or lingual mucosal grafts (7)Differing types of autograft tissues have been described, with buccal or sublingual mucosal grafts (OMG),penile and scrotal skin (8), bladder mucosa, colonic mucosa(9) and tissue engineering of grafts (10).
First described by Humby in 1941(11), BMG urethroplasty is now widely used in contemporary practice. The donator area left for healing by the mean of secondary healing, whichmends successfully (12), but we don’t achieve that an improvement in postoperative pain and oral intake that can be seen with primary closure (13).
Postoperative complications of urethroplasty include swelling and bruising around the wound, numbness or discomfort around the buccal mucosal graft donor site or spraying of urine (all up to 50% of patients). Less common complications include wound infection, erectile dysfunction (up to 10%), anastomotic leak and urinary fistula (around 2%).Stricture recurrence is a major complication, with reported rates of up to 14% for anastomotic and 42% for augmentation / substitution urethroplasty, after long-term (more than 10 years) follow-up (14). However, through comparison with stricture recurrence rates in other treatments (up to 60% in urethrotomy(5)), it is apparent that urethroplasty offers superior results in terms of restricture.
Patients and Method
With this prospective study we aimed to follow 39 casesofproximal and bulbar penile stricture disease of urethra and to determine the long term result of their repair by using BMG urethroplasty which was conducted at Tikrit city from April 2007 to December 2018 with a followup duration mean of 28 months.
Pre-operative evaluation includes a detailed medical and surgical history as well asclinical examination aimed at detecting the etiological factors such as instrumentation, prostatectomy, urethral catheterization, TURP, trauma, and urethritis. Pre-operative evalution also include culture of urine, postvoiding residual
volume of urine measured by ultrasonography, as well uroflowmeter to evaluate urine flow rate. Patients evaluated with a combined retrograde urethrography and micturatingcystourethrography. This helps the determine of the site, length, and multiplicity of the stricture (although thechoice of the surgical technique do not influenced by stricture causenor length).
The procedure done under general anesthesiathrough a midline perineal incision. Division of bulbocavernosus muscle through the midline exposes theanterior urethral corpus spongiosum, which is the part affected by spongiofibrosisand lead to narrowing of the urethra. The identification of the stricturedpartbegins at the tip of the catheterincerted within the urethra,whichincised dorsally. The incision then extended proximally distal to the end of the stricture until healthy spongiosal tissue is experienced. An adequate lengthgraft of buccal mucosa obtained from the interiorcheek just below the duct of Stensen’s. Up to 10 cm in length and 3.5 width can be obtained, the extra length gained by extending the dissection into the tonsillar fossa posteriorly and to the lower lips anteriorly. Infusion of the buccal area with (1% lidocaine with 1:100,000 epinephrine to a volume of 5 to 10 cc) may help to reduce the hemorrhage as well as the graft will be elevated and adissection plane will be provided.
Tailoring of the graft to a proper size is done after defatting. The lumen of distal andproximal urethraare assessed. The graft fixed to the dorsum using few 4-0 vicryl sutures forsupport and reinforcement as well toocclude the dead space. Insertion of 18F silicone, or silicone coated Foley catheter through the urethra into the urinary bladder as a cast of healing and for drainage. Urethra is then rotated back to its position and the mucosal margin of the urethra sutured to the free margin of the graft. Drainage by suprapubic catheter is obsolete. Cover with antibioticsare continued until the catheter is removed usually after3-4 weeks. Three months later, after removal of catheter, flow rate and retrograde urethrography is done. Uroflowmetery with normal flow rate is regarded as a successful resultswhilecases with lowflow rate are referred to ( Direct Visual Internal Urethrotomy(DVIU)), accepted voiding rate after onetrial of DVIU is regarded as a succeeded procedure . A recurrent weak stream after even this single trial of DVIU will be considered as failed treatment.

Indian Journal of Public Health Research & Development, November 2019, Vol. 10, No. 11 1791
Results
A thirty ninecases of different age groups( the mean 35.4 years) with urethral strictures disease diagnosed by urethrography. Single session dorsal reconstruction of urethra usingBMG was performed toevery one of these cases with indwelling silicone Foley’s catheter removed after 3-4 weeks with a mean followup time for themwas 28months( Fig. 1).
Figure (1): Single stage dorsal BMG reconstruction of urethral stricture. A) urethrography shows narrowing of the anterior part of urethra. B) Penoscrotal incision. C) Dissection of corpus spongiosum and fixation of graft.
5
A-
B-
C-
Figure (1): Single stage dorsal BMG reconstruction of urethral stricture. A)
urethrography shows narrowing of the anterior part of urethra. B) Penoscrotal incision.
C) Dissection of corpus spongiosum and fixation of graft.
Complication at the donator site occurred only in one of the cases with infection and
ulcer that took up to one month to heal completely. Although swelling of the face,
numbness and limitationofthe opening movement of the mouth are uncommon, though
they are fade uneventfully. Early peri- and post-operative complications occurred in 35%
it was almost minor complications included scrotal swelling, minor haematoma, urinary
infections and urgency. 4 patients only developed stricture again at the site of operation
Complication at the donator site occurred only in one of the cases with infection and ulcer that took up to one month to heal completely. Although swelling of the face, numbness and limitationofthe opening movement of the mouth are uncommon, though they are fade uneventfully. Early peri- and post-operative complications occurred in 35% it was almost minor complications included scrotal swelling, minor haematoma, urinary infections
and urgency. 4 patients only developed stricture again at the site of operation 2 of them got good stream after a trial of DVIU, the other 2 patients did not responded and required another urethroplasty and regarded as a failure of the technique (failure rate 5.1%). The most frequent major complications were urethrocutaneous fistula that occur in 6 patients(15%) mainly those with involvement of penile urethra. Urinary infection

1792 Indian Journal of Public Health Research & Development, November 2019, Vol. 10, No. 11
happened in 10 patients and responded well with good antibiotics directed by the results of urine culture. Erectile dysfunction and mild chordee noted in few patients. Improvement in the Peak urinary flow rates was dramatically noted postoperatively (range 18.2 to 24 ml/sec) as compared with preoperative data base of a range 0 to 9.3 ml/sec( see table 1 and 2 ) .
Table( 1 ): complication of BMG
Complications No.
Long term Recurrence2
Urethrocutaneous fistula 6
Wound of infection 4
Chordee 2
Erectile dysfunction 2
Facial Swelling 9
Numbness 7
Limitation in mouth opening 7
Table 2: Etiology behind strictured urethra.
Etiology No.
Urethritis (infection) 9
Iatrogenic 8
Idiopathic 15
Injury (blunt) 5
Shell injury 2
Mean of the extent of the stricture, as spanned by preoperatively done RGU was 5.34 cm (all of it was more than 3 cm). Twenty three of cases sustained bulbar stricture, while only seven had proximal part of the penile urethra affected,meantime theinvolvement both areas synonymously was faced in 9 patients( table 3).
Table 3: the location of the strictured part of urethra.
Location Number
bulbar 23
Bulbar-penile 9
penile 7
Discussion
Humby in 1941 was the first described graft urethroplasty using buccal mucosa.(15) Due to itsglowingfeatures that made it typical urethral deputy, as iteasilygleaned, easily handledsurgically , glabrous, moist environmentaccordance, and paramountearly ingrowth and uptake(16) , However, adisputation raised whether the graftpositionmust be ventrally or to the dorsum. The dorsal place is preferred by most of experts, however many trials shown that the dorsal place of grafthas a generous blood supply and back brace as theventralonlayplaced one. The rateof succeeds was of no significant difference according to Barbagli et al, who involved a fifty cases in their study and the graft was placed ventrally, dorsally or laterally on the urethral surface. The dorsal BMG on-layannounced a 85 and 100 %prosper rate(17).
In our present series, Dorsal BMG urethroplasty has a flourished succeed rate of 94.9 % with followupmeantime of 28months. Elliott SP et alseries published in the 2003 (18) who escortedsixtycases of buccal graft reconstruction with mean followup of forty seven months, announced a 97% prosper rate after single attempt of internal visual optical urethrotomy. These results underpinned by Kane CJ et al. (19) who reported disclose a 94.3 % successful results in their series with a mean followup of twenty five months postoperatively. Iselin & Webster published a study at1999 in which they accomplished29 dorsal on-lay graft urethroplasty, and describe a soaring early successfulresults reaches up to 97%, at a median followup of 19months, but they emphasize that a long time of followup is required as the succeeded urethroplasty operation is spaned in decades(20).
In general, complications of BMG urethroplasty are uncommon . Pitfalls occurred as a postoperative complications can happened in 2 areas, the donor area and the repair site in the strictured urethra.(21) Potentially buccal mucosal pick up site complications encompassed facial swelling, bleeding, discomfort and pain, numbness and paresthesia, limitationof movement in mouth opening and damage to the duct ofStensen. Facial edema and limitation in mouth opening are frequent, though they are selflimiting and usually resolved within a couple of months after operation(22). Wood et al, reported that closure of the donator site was followed by awful complains and nasty pain, this

Indian Journal of Public Health Research & Development, November 2019, Vol. 10, No. 11 1793
make him to suggest that this may be ameliorated by left open.(22)In contrast Dublin et al. announced that a preponderance of casesshowed a good responce with the primary suturing of the pickup site, and they disclose that restriction in mouth openingwas the most frequent long-term complaint, and occurred in 32% of cases, and half of this number hadnumbness. In general, the interior cheek pickup site for BMG appears to heal without long-term pitfallsregardless of management(21).
Complications of implantation site at perinium are asuncommon as donor site complications. Urethro-cutaneous fistula, re-stricture, local infections of perineal wounds or urethral anastomosis site , hematomas, and paresthesia of the skin, do sometimes occur. Fichtneretal., (23) found in their study that an all-inclusiverate of complications was 25%. In general the complication rate in other study(24)was found to be 5.4%, of them 5.7% had a re-stricture rate while in our case series we faced ageneral complication rate of about 18.6 % which include urethrocutaneous fistulae, re-stricture, urinary tract and local wound infection.
Conclusion
Regardless of the etiology, length and site of urethral stricture disease, BMG urethroplasty seems to be the prime surgical procedure referred to its high rate succeed, low recurrence rate, as well as infrequent and short standing complications if compared with other techniques. It is picked up easily and unchallenging to be handled. It also resist infections and withstand the moist environment. We used graft urethroplasty with buccal mucosa victoriously for managinglong strictures in urethra, with fewer complications and few donator placerate of morbidity.
Acknowledgment: We would like to express our great appreciation all those who participated in this study, patients and hospital staff.
Ethical Clearance: from research ethic committee in Tikrit university/college of medicine
Source of Funding : self
Conflict of Interest: None
References
1. Open urethroplasty versus endoscopic urethrotomy - clarifying the management of men with recurrent
urethral stricture (the OPEN trial): study protocol for a randomised controlled trial. https://www.opentrial.co.uk. Accessed 02/10/2017.
2. Santucci RA, McAninch JW. Urethral reconstruction of strictures resulting from treatment of benign prostatic hypertrophy and prostate cancer. UrolClin North Am 2002;29:417-27.
3. Tonkin JB, Jordan GH. Management of distal anterior urethral strictures. Nat Rev Urol 2009;6(10):533-8.
4. Bayne D, Gaither T, Awad M, et al. Guidelines of guidelines: a review of urethral stricture evaluation, management, and follow-up. Translational Andrology and Urology 2017;6(2):288-94.
5. Verges J, Desgrez JP, Claude JM, Cabane H. Internal urethrotomy. Resection of urethral stricture (over 5 years follow-up). Ann Urol 1990;24:73-5.
6. Eltahawy EA, Virasoro R, Schlossberg SM, et al. Long-term follow up for excision and primary anastomosis for anterior urethral strictures. J Urol 2007;177:1803-6.
7. Tinaut-Ranera J, Arrabal-Polo MA, Merino-Salas S, et al. Outcome of urethral strictures treated by endoscopic urethrotomy and urethroplasty. Can UrolAssoc J 2014;8(1-2):E16-E19.
8. Jordan GH. Scrotal and perineal flaps for anterior urethral reconstruction. UrolClin North Am 2002;29:411-16.
9. Xu YM, Qiao Y, Sa YL, et al. Urethral reconstruction using colonic mucosa graft for complex strictures. J Urol2009;182(3):1040-3.
10. El-Kassaby A, Aboushwareb T, Atala A. Randomized comparative study between buccal mucosal and acellular bladder matrix grafts in complex anterior urethral strictures. J Urol 2008;179(4):1432-6.
11. Zimmerman WB, Santucci RA. Buccal mucosa urethroplasty for adult urethral strictures. Indian J Urol 2011;27(3):364-70.
12. Wong E, Fernando A, Alhasso A, Stewart L. Does closure of the buccal mucosal graft bed matter? Results from a randomized controlled trial. Urology 2014;84(5):1223-7.
13. Barbagli G``, Morgia G, Lazzeri M. Dorsal onlay skin graft bulbar urethroplasty: long-term follow-up. EurUrol 2008;53:628-33.
14. Pisapati VL, Paturi S, Bethu S, et al. Dorsal

1794 Indian Journal of Public Health Research & Development, November 2019, Vol. 10, No. 11
buccal mucosal graft urethroplasty for anterior urethral stricture by Asopa technique. EurUrol 2009;56:201-5. 15. Blandy JP. Urethral stricture. Postgraduate Med J. 1980;56:383-418.
16- Dubey D, Kumar A, Bansal P, Srivastava A, Kapoor R, Mandhani A, et al. Substitution urethroplasty for anterior urethral strictures: a critical appraisal of various techniques. BJU Int. 2003;91:215-8.
17. Kulkarni S, Barbagli G, Kirpekar D, Mirri F, Lazzeri M. Lichen sclerosus of the male genitalia and urethra: surgical options and results in a multicenter international experience with 215 patients. Eur Urol. 2009;55:945-54.
18. Elliott SP, Metro MJ, McAninch JW. Long-term follow-up of the ventrally placed buccal mucosa onlay graft in bulbar urethral reconstruction. J Urol. 2003;169(5):1754-7.
19. Kane CJ, Tarman GJ, Summerton DJ, Buchmann CE, Ward JF, O’Reilly KJ, et al. Multi-institutional experience with buccal mucosa onlayurethroplasty for bulbar urethral reconstruction. J Urol.
2002;167(3):1314-7.
20. Iselin CE, Webster GD. Dorsal onlay graft urethroplasty for repair of bulbar urethral stricture. J Urol. 1999;161:815-8.
21. Dublin N, Stewart LH. Oral complications after buccal mucosal graft harvest for urethroplasty. BJU Int. 2004;94:867-9.
22. Wood DN, Allen SE, Andrich DE, Greenwell TJ, Mundy AR. The morbidity of buccal mucosal graft harvest for urethroplasty and the effect of nonclosure of the graft harvest site on postoperative pain. J Urol. 2004;172:580-3.
23. Fichtner J, Filipas D, Fisch M, Hohenfellner R, Thüroff JW. Long-term outcome of ventral buccal mucosa onlay graft urethroplasty for urethral stricture repair. Urol. 2004;64:648-50.
24. Kane CJ, Tarman GJ, Summerton DJ, Buchmann CE, Ward JF, O’Reilly KJ, et al. Multi-institutional experience with buccal mucosa onlayurethroplasty for bulbar urethral reconstruction. J Urol. 2002;167(3):1314-7.

Hardness and Roughness of Flexible Denture Base at Different Injection Time and Different Temperature
Amal Abdul Latif Rashid
(B.D.S ,M.Sc Preventive Dentistry) Middle Technical University / College of Health and Medical Technology /Dental Technologies Department
Abstract
Most problems with heat cured acrylic are difficult to address, in recent time flexible dentures have become more popular, although the search for the ideal option is still on, so this study was conducted to study the effect of different temperature and different injection time to study the effect on the hardness and roughness of flexible denture. 60 specimens from metal pattern were prepared with dimension (60mm, 10mm, 3mm) length, width and thickness respectively. Specimens were allocated into two group;30 specimens for surface roughness measure(groupI)and 30 specimens for hardness measure(group II),these two group subdivided into three subgroups according to time of injection and temperature (10 specimens for each subgroup), group A: injection at (270◦C) in (14 min.) (control). group B: injection at(300◦C) in (10 min.) and group C: injection at (250◦C) in (24 min.). For hardness measure all specimens were tested by (shore D device DINISO electrometer). All specimens were tested for roughness measure by surface roughness tester (profilometer , digital) the result expressed in micrometer. Result showed there were no significant differences in hardness and roughness measures between both group B and group C with control group (A) P0.05. The max. mean value of roughness was recorded by group(A)which was the control group and group (B) recorded the min. mean value of roughness. While for the hardness the min. mean value was recorded by group(B),while group(C) recorded the max. mean value of hardness, however there were no significant different( P0.05) between three groups A, B and C both in hardness and roughness measures.
Key Words :flexible acrylic hardness roughness injection temperatures
Introduction
One of the most important needs for patients attending clinics to restore esthetics and/or function is the replacement of missing teeth, for replacing missing teeth many treatment modalities are available.
The choice between many treatment options is influenced by clinical, dentist and patient immanent factors[1].Excellent alternatives to conventionally methyl- methacrylate dentures are flexible denture, which not only provides excellent aesthetics and comfort, but also adapt to the constant movement in partially edentulous patients [2]. adapt well in the undercut areas and not cause sore spots. They also have almost no porosity and lower elastic modulus [3]. Furthermore, the aesthetic of removable partial denture with heat cured acrylic, may be compromised by the visibility of metal clasps
[4], however, reported cases of intolerance to monomers present in acrylic materials among patients and medical staff have been increased[5,6].
The increase in processing temperature under pressure during polymerization of acrylic materials could result in a more complete polymerization reaction and thus producing a harder polymer network[7,8and9]. but no study concerning the effect of increase temperature on flexible acrylic material
Since the surface roughness is an important factor because rough denture surfaces can cause biofilm formation, fungus and bacteria have more propensity to adhere to rough surface so accumulation of microorganisms affect oral health [10] and the hardness test has been used for characteristic of the mechanical quality of polymer [11], so this study was performed to

1796 Indian Journal of Public Health Research & Development, November 2019, Vol. 10, No. 11
evaluate the hardness and surface roughness of flexible denture material at different injection time and different temperature.
Material and Method
Flexible denture base material
The material was available in the form of granules in cartridges (Lingchen dental /china)as seen in(Fig.1) the cartridges contain thermoplastic grains are heated to plasticize the resin. All material were suited for the thermoplastic process (injection thermo press machine / china) by injection molding technique the resin material were injected under very high pressure.
Fig. (1) sample of cartridges
Preparation of mould:
Total sample were 60 specimens all sample were prepared in the form rectangular metal shaped pattern according to ADA Specification NO.12(1999) [12] the dimension (65mm*10mm*2.5±0.1mm) length, width, thickness as seen in (Fig.2) were constructed to be used (30 samples) for indentation hardness and (30 samples) for surface roughness.
The preparation of mould was done by conventional procedures and the wax elimination was done by using boiling water, , after that flask was opened for cooling (at room temperature),the flexible denture base material was injected in the electrical furnace (injection thermo press machine Lingchen dental /china)according to manufacture instruction and study design ,then left to cool at room temperature. The conventional flasking, packing procedures were followed in the preparation of the specimens [13].
Fig(2) Flexible acrylic resin samples: A-Metal sample in the flask B-Wax sample in the flask C-Flexible acrylic sample
Distribution of the sample
60 specimens divided into two groups according to measuring test (30 specimens for each group), group I for surface roughness and group II for indentation hardness, both groups were subdivided into 3subgroups A, B and C(10 samples for each subgroup)according to injection time and temperature.
Group A: injection 10 samples at (270◦c) in (14min) (control that inject according to manifuctural instructions).
Group B: injection 10 samples at (300◦c) in (9 min).
Group C: injection 10 samples at (250◦c) in (24 min) Finishing and Polishing: Take the specimen of flexible and remove grass of excess resin from the border by large acrylic burs until make specimen smoothing is. The polishing done by pumice with water and store it in the plastic container of water until needed.
Measurement of surface roughness:
The surface of the test specimen was analyzed with surface roughness tester (Profilometer-Digital, China, TR200)(Fig3) to study the micro geometry of the test surface. The diamond stylus of the profilometer was moved about 4mm across the surface of the acrylic specimen. According to the manufacture instructions of the device, the vertical displacement of the stylus is measured as the surface variations, usually measuring from 10 nm to 1mm ,the height position of diamond stylus is converted to a digital signal ,which is stored and displayed a(2mm) distance separated each reading and all measures were carried out by same researcher. three readings were recorded for each specimen and the mean value for each specimen was the average of three readings, all the specimens were examined after finishing & polishing. The results were expressed in micrometer.
Figure (3) Profilometer device for measuring surface roughness Measurement of indentation hardness:
A B C

Indian Journal of Public Health Research & Development, November 2019, Vol. 10, No. 11 1797
set period between the specimen and the indentor was 6 seconds. For each specimen, 5 points were marked with 6 mm distance between each other, the hardness value was calculated and the average of these five reading After the measurements were taken directly from the scale reading was calculated.
Figure(4): (A)Shore D hardness test device,(B) specimen placed under the device
Shore hardness tester was use in this study for measuring the indentation or measuring the hardness of the specimens (DINISO 7619electrometer/Germany)(Fig4){according to ASTM D2240-03 standard}[14]. The Shore D hardness device was vertically placed over flat sample supported by flat, rigid base. The readings were taken after three second of stable contact over specimen, when indenter was pressed down quickly and firmly on, to record the maximum reading. The reading was taken directly from the reading scale The contact surface of the shore hardness tester must be parallel to the specimen support of the test stand to prevent error in measurements. The distance between the specimen surface and the indentor of the hardness tester to be 5-12 mm. During carrying out the test the contact was
(A) (B)
Findings
Surface Roughness Test (groupI)
Table (1): Descriptive data of groups of the surface roughness test
N MeanStd.Deviation
Std. Error
95% Confidence Interval for Mean
Minimum MaximumLower Bound Upper Bound
Group (A) (control) 10 1.4582 .24401 .08627 1.2542 1.6622 1.08 1.65
Group (B) 10 1.3589 .67422 .23837 .7952 1.9225 .74 2.31
Group (C) 10 1.3686 .26251 .09281 1.1491 1.5881 1.13 1.74
Total 30 1.3952 .42371 .08649 1.2163 1.5741 .74 2.31
Table (1) show the descriptive of groups: mean, S.D,S.E, min., and max., values of the surface roughness of all groups. The max. mean value was (1.4582) recorded by group(A)which was the control group and group (B) recorded the min. mean value of surface roughness which was (1.3589)
Table (2) ; ANOVA test between groups of the surface roughness test
Sum of Squares Df Mean Square F Sig.
Between Groups .048 2 .024 .123 .885
Within 4.081 21 .194
Groups Total 4.129 23
In Table (2) shows the ANOVA test between groups, there were no significant differences between groups (n-sig) p>0.05.

1798 Indian Journal of Public Health Research & Development, November 2019, Vol. 10, No. 11
Hardness Test (groupII) Table(3) ; Descriptive data of groups of the hardness test
N Mean
Std.
Deviation
Std.
Error
95% Confidence Interval for Mean
Minimum MaximumLower
Bound
Upper
Bound
Group (A) (control) 10 66.5000 .97395 .34434 65.6858 67.3142 65.20 68.20
Group (B) 10 66.4375 3.48299 1.23142 63.5256 69.3494 58.00 69.00
Group (C) 10 67.8000 .71714 .25355 67.2005 68.3995 66.60 68.60
Total 30 66.9125 2.13283 .43536 66.0119 67.8131 58.00 69.00
Table (3) show the descriptive of groups mean, S.D, S.E, max., and min. values of the hardness groups ..The min. mean value was (66.4375) recorded by group(B),while group(C) recorded the max. mean value of hardness which was (67.8000).
Table(4) : ANOVA test between groups of hardness test
Sum of square Squares DfMeanSquare
F Sig.
Between groups 9.468 2 4.734 1.045 .369
Within groups 95.159 21 4.531
Total 104.626 23
Table(4) show the ANOVA test between groups ,there were no significant differences between groups (n-sig) p>0.05
Discussion
Using flexible denture has increased drastically in the late decade. The excellent tissue friendly and good mechanical properties had open up a new clinical application in dentistry and since heat cured acrylic are hard material so they may be disturbing patients during use and an increasing rate of intolerance to monomers present in acrylic materials among medical staff and patients has been reported [5,6]. Furthermore, the aesthetic appearance of removable partial dentures with heat cured acrylic bases may be compromised by
the visibility of metal clasps [4,15].While the flexibility of flexible allows retentive elements that match the color of the gums or teeth. Despite the sore formation in heat cured acrylic in comparison to flexible that not cause sore spot [16,17],the flexible denture appears to have a greater role to play in futures. Material (without chemical changes) is softened by heat and injected afterwards and partial dentures might be pressed in one piece including clasps, minor and major connectors, and denture bases [15]. The surface roughness is an important factor because many studies have shown there was a direct link between surface roughness, color stability and accumulation of

Indian Journal of Public Health Research & Development, November 2019, Vol. 10, No. 11 1799
dental plaque as well as adherence of candida albicans [18,19]. Furthermore the irregularities of the surface act as a nucleation sites for corrosion[20]
Hardness has been widely used as a method of investigation factors that influence the degree of conversion of resin and for characterization of the mechanical quality of acrylic [21,22]. In this study both hardness and surface roughness measures of flexible denture base material were tested at different temperature and different injection time.
The result show that the all groups that injection at different temperature (300◦C), (250◦C) and different injection time (9min), (24min) respectively ,there were no significant difference between them (p>0.05) both in hardness and roughness measures when compared with control group that injection at (14min) in(270◦c) .
In this study, the injection molding system was used, its advantages that the resin is delivered in a cartridge that eliminates dosage errors, to ensure long term stability of the shape, reduced contraction, and mechanical resistance with aging. In addition, superior physical properties, more esthetic and comfortable for the patient[23] the increasing in surface roughness may be related to injection process, melted material during the injection will roll into sprue (smaller tube) until it reaches the mold cavities and during this flow movement a small nucleus will form and cause increase in the surface roughness.
For hardness the max. mean value recorded by the group(C). this might be due to higher crystallization of resin material at this time and temperature (the higher crystallinity in a flexible, the harder material will be) [24].
In acrylic material the increase in processing temperature under pressure during polymerization reaction produced a harder polymer network[9], this may related to complete polymerization reaction that occur in high temperature for optimum time which support the result in this study, in flexible material increased time with decreasing temperature lead to result that gave more hardness material as result by group C [that injected with increased time of injection and decreasing temperature (24min. in 250◦c)] and because of increase time of exposure to heat which produce greater degree of polymerization, however ,there were no significant differences between group C and group B(300◦c-9min.)this might be due to increasing the polymerization
temperature lead to harder network that result in a hard material[9].
There were no previous studies found related on the properties of flexible material with changing in temperature and injection time ,in order to compare with this study. Search for ideal properties for flexible material is still on.
Conclusion
This study show hardness and surface roughness measures of flexible denture base material when tested at different temperature and different injection time(300◦c in 9 min, and 250◦c 24 min.),there were no significant differences P0.05 with control group that inject according to manifuctural instructions(270◦c in 14min).
Conflict of Interest: Non
Source of Funding: Self
Ethical Clearance: Non
References
1. Sharma A. and Shashidhara H.S. ;A Review: Flexible Removable Partial Dentures Journal of Dental and Medical Sciences . (Dec. 2014)Volume 13. Issue 12 Ver. VI. pp58-62..
2. Singh JP. Dhiman RK. Bedi RPS. Girish SH; Flexible denture base material. A viable alternative to conventional acrylic denture base material. Contemp. Clin. Dent. (2011)Dec.2(4): 313–317.
3. Shamnur SN. Jagadeesh KN. Kalavathi SD. Kashinath KR. “Flexible dentures” an alternate for rigid dentures?, J. of Dental Sciences & Res. (2010).Feb; 1(1): 74 – 79
4. J. P. Singh, R. K. Dhiman, R. P. Bedi, and S. H. Girish, “Flexible denture base material: a viable alternative to conventional acrylic denture base material,” Contemporary Clinical Dentistry ,( 2011) Vol. 2. No. 4, pp. 313–317.
5. A. M. Seppal¨ ainen and R. Rajaniemi, ;Local neurotoxicity of methyl methacrylate among dental technicians,American Journal of Industrial Medicine,(1984) Vol. 5, No. 6, pp. 471–477.
6. R. Gautam, R. D. Singh, V. P. Sharma, R. Siddhartha, P. Chand, and R. Kumar, “Biocompatibility of polymethylmethacrylate resins used in dentistry,” Journal of Biomedical

1800 Indian Journal of Public Health Research & Development, November 2019, Vol. 10, No. 11
Materials Research B, ,( 2012)Vol. 100, No. 5, pp. 1444–1450.
7. AL- Neami Z.: Effect of different water temperature during polymerization on some physical and mechanical properties of self- cured acrylic resin materials .Master’s Thesis; Medical and Health technology(2005) p:70-90
8. Ouda L.and Rashid A.: Effect of The Elevated Temperature on the Tensile Strength of Cold Cured Acrylic Denture Base in Comparison to Heat Cure Acrylic .Journal of Kerbala University, (2011).Vol. 9 No.3 Scientific . p126-133
9. Odian C.: Principle of polymerization. 3rd ed. .New York.p: 277-280(1991).
10. Yamauchi M, Yamamoto K, Wakabayashi M, Kawano J. In vitro adherence of microorganisms to denture base resin with different surface texture. Dent Mater J.; (1990).9. 19-24
11. Graig. R.G. and Powers. J.M. ;Restorative Dental Materials. 11th Edition, St. Mosby.Louis, (2002). 636-689
12. American Dental Association Specification(ADA) No. 12 for denture base polymer guide to dental materials and devices, (1999)7th edition, Chicago:.
13. Graig . R.G. Restorative dental material .The Mosby Co. St. Lo. (1997)10th edition .pp:127-136.500-540
14. ASTM standard Specification,D2240-3.Test for Rubber Property-Durometer hardness. Barr Harbor, Unite State of America. (2003).
15. P. Kaplan; Flexible removable partial dentures: design and clasp concepts, Dentistry Today, (2008).Vol. 27, No. 12, pp. 122–123,
16. Singh K. Aeran H. Kumar N and Gupta N; Flexible Thermoplastic Denture Base Materials for Aesthetical Removable Partial Denture Framework. J Clin. Diagn .Res. (2013).7(10): 2372–2373
17. Rudd. K.D., Morrow. R.M. and Eissmann. H.F.; Flasking, Processing, Deflasking, and Finishing. In: Dental Laboratory Procedures, (1981).vol. 3, Mosby, St. Louis, 394-397
18. Radford D.R. Sweet SP. Challacombe S.J. and Walter J.D.; Adherence of candida albicans to denturebase materials with different surface finishes. J. Dent . (1998).26.: 577-583
19. Rahal J.S. Mesquita M. F. Henriques G. and Nobilo M.A. Surface roughness of acrylic resins submitted to mechanical and chemical polishing. J. Oral. Rehab. (2004).31 1075-9
20. Hanaor D., Gan Y. and Einav. I, Static friction at fractal interfaces. Tribol. Int, (2016).93: 229-238
21. Dunn. W.J and Bus., A.C A ;Comparison of Polymerization by Light-Emitting Diode and Halogen-Based Light-Curing Units. Journal of the American Dental Association. (2002).133. 335-341
22. Rueggeberg. F.A.,and Craig. R.G; Correlation of Parameters Used to Estimate Monomer Conversion in a Light-Cured Composite. Journal of Dental Research. (1988). 67. 932-937
23. Ardelean L. Bortun C. Motoc M; Metal-free removable partial dentures made of a thermoplastic resin and two polyamide resin. Matriale Plastice; (2007).44(4): 345-8
24. Fitton JS. Davies EH. Howlett JA. Pearson GJ; The physical properties of a polyacetal denture resin. Clin. Mater; (1994).17:125-9.
Prophylactic Antiepileptic Drugs for Intraparanchymal Hemorrhage Patients in Salah Al-Den General Hospital
Ayied Mutob Turki1, Mohamed Ghalib Zakari2, Abdulsattar Hussein abdullah3
1Assistant Professor, 2Lecturer, Tikrit University College of Medicine/ Department of Medicine
Abstract
Background: Intraparenchymal hemorrhage considers the most severe form of stroke and has a significant cause of death. There are many cases associated with seizures development. Risk factors for post-hemorrhagic stroke seizure are cortical involvement, large lesion (involving more than one lobe), lobar hemorrhage, and male sex. The post- hemorrhagic stroke seizures affect inversely on fatality rate, recovery period and neurological outcomes.the aim of the research is to assess the effect of depakin to prevent the incidence of seizure in patient with spontaneous non-traumatic, non-aneurysmal intraparenchymal hemorrhage (NTNA-IPH) and to evaluate the effect of depakine on the fatality rate. Patients and method the study involved 100 patients with a definite diagnosis of NTNA-IPH. Type of the study was prospective comparative, which done in Salah-Al-den general hospital. The duration period was 10 months. The cases were classified into two groups A and B, each one consist of 50 patients. Depakine in a dose of 400mg per day for 30 days was given for group A while group B didn’t be given the drug, and this is a control group. The cases of each group were followed up for 6 months from the starting of attack and during follow up, patients were monitored for development of seizure. Results The study result represent 14.28% of patients taking depakine had been developed seizure (6 patients from total 42 patients) and about 34.10% of patients not taking depakine had been developed seizure (13 patients from total 38 patients) with a significant difference between the two groups. Partial seizures were represent about 13.75% of post-hemorrhagic stroke seizures, myoclonic seizures 5% and tonic clonic seizure 5% in total of both groups.The overall incidence of post-hemorrhagic stroke seizure in the total 80 patients was 23.75%. The study showed that fatality rate in patients receiving depakine was 12% while fatality rate in patients not receiving depakine was 24% with a significant difference between patients with depakine and patients without depakine. Conclusion of this study shows that NTNA-IPH founds most commonly between 45-71 years old. The incidence of seizures can be decreased by two-folds by using of depakine as a prophylactic drug in a patients with IPH and the use of depakine in the prophylaxis against post-hemorrhagic stroke seizure have a significant role in reducing the fatality rate and improving survival.
Keywords : Prophylactic Antiepileptic Drugs ; Intraparanchymal Hemorrhage; Patients ; Salah Al-Den General Hospital.
Introduction
Non traumatic intraparenchymal hemorrhage (IPH) is bleeding into the parenchyma of the brain that may extend into the ventricles and, in rare cases, the subarachnoid space (1). Each year, about 37,000 to 52,400 people in the United States have an IPH (2).IPH represent 10-15% of stroke and is associated with the highest fatality rate, about 38% of patients surviving the 12 months(3). The majority of surviving patients to
hospital presentation, the prognosis remains poor, with 35% of patients dead was dying in the first seven days and 50% within thirty days.
The prevalence of seizures after ICH varies widely from less than 10% (4,5) to more than 20% (6). The prevalence of seizures after IPH depends on study design, diagnostic criteria, duration of follow-up, and the patient studied. Risk factors for post-hemorrhagic seizure were found to be IPH , SAH, cortical involvement , large

1802 Indian Journal of Public Health Research & Development, November 2019, Vol. 10, No. 11
lesion (involving more than one lobe) and male sex(7). Stroke is the commonest cause of seizures in the old patients (8).
IPH-related seizures classified as early and late-onset. Usually most of the early- seizures found in the first two weeks (9).Patients who had frontal lobe hemorrhage were high incidence to develop early as well as late onset seizures due to the presence of motor phenomena, early seizures may be result from cellular biochemical dysfunction and structural disruption, late seizures may be caused by gliosis and the development of meningocerebral cicatrices (10).
Patients and methods
Prospective study was done in salah-Alden general hospital through the period from beginning of December 2016 to end of July 2017. The patients were selected randomly from those who admitted to medical ward with IPH in all age groups and both sexes. The sample consist from100 patients with IPH. The patients involved in this study were divided into 2 part as follows:-
Group A consist of 50 patients with IPH who prescribed depakine in a dose of 400mg once daily for 30 days as a prophylactic drug and was follow up for 6 months to see whether seizure occurred or not during or after the attack of IPH and the follow up was by re-examination or by telephone number of the patient if he can’t get coming to hospital.
Group B include 50 patients with IPH , who didn’t be given depakine as control group, were follow up for 6 months to show whether seizure present or not. If the patient developed fit in this group, was treated by anti-epileptic drugs(AED).
(Questionnaires): Full and detailed history from the patient or witness (if consciousness is impaired) was taken regarding age, sex, address, past medical history, previous attack of IPH, drugs , previous attack of seizure or family history of seizure and whether seizure found or not before admitted to the hospital. If the patient had seizure, detailed history was taken about the seizure including time, single or recurrent, description of seizure (partial or generalized seizure) and how many times found.
Clinical examination: Patient with intraparanchymal hemorrhage through the period of
study was admitted in the medical ward, neurological examination was done for every patients involved in this study. The examination included consciousness level, motor examination of upper and lower limbs, sensory examination, cranial nerve examination and examination of cerebellar signs.
Imaging study : Every patient admitted to the hospital with acute neurological features like focal signs, disturbances in the consciousness , new onset of epilepsy, etc, was sent for taking urgent native (CT) of the brain and the radiology report was made by the radiologist. The magnetic resonant angiography (MRA) was done in selected patients in whom SAH was very suggestive clinically. This was helped the study to identify and exclude aneurysmal hemorrhage or A-V malformations. According to the result of the CT study and MRA (if needed), the patient will be included in the study if the inclusion criteria met while those with exclusion criteria were excluded from the study.
Blood tests: Blood samples were taken from every case. Routine investigations were perform include complete blood count, renal and liver function tests, blood sugar and electrolytes to exclude metabolic causes of the neurological deficits in addition to bleeding time, prothrombin time and INR to exclude bleeding tendency as a cause.
Patient group & follow up: The number of patients involved in this study was 100 patients. The study started from the first of December 2016 until the end of July 2017 and every case was follow up for 6 months, so the patients selected at Decemer 2016 ,their follow up stopped at May 2017and so on. The cases were classified into two groups , group A and group B, in which group A patients were given depakine for 30 days and group B patients didn’t be given the drug and each group were follow up for 6 months.
Statistical analysis and data management: The Statistical Package for Social Sciences (SPSS, version 18) was used for data entry and analysis. The associations between categorical variables and seizure occurrence during the study period were analyzed using Paired Student t test. The differences in seizure occurrence were compared between groups using Paired Student’s t-test to compare means of numerical variables. P value of ≤ 0.05 was regarded as statistically significant.

Indian Journal of Public Health Research & Development, November 2019, Vol. 10, No. 11 1803
Funding
Table (1) Age distribution in 100 patients with IPH.
Percentage (%)Mean(years)Number ofPatients
Age/years
20%38.520<45
80%62.480≥45
One hundred cases were participated in the study. 56 patients were male and 44 patients were female.
Table ( 2) the frequency of seizures in group A and B.
P valueIncidence of fitPatients not develop
Patients develop fits
Number of patientsGroup
14.28%36642A
34.10%251338B
23.75%611980A+B
Eighty patients were aged over 45 years and the remainder 20 was under 45 years. Mean for aged group less than 45 was 38.5 years .The range of age was 33-45 years , while mean for aged group more than 45 was 62.4, the range is 52-78 years.
Group A : The number of patients was 42(after subtracting the dead number of patients and loss of them during follow up in this group) 6 patients (14.28%) from total 42 developed seizure in spite of taking a depakine . The patients in group A who didn’t developed fits throughout the period were 36 cases (85.72%) and they
are taking the treatment in regular period in its dose 400mg daily.
Group B: This group included 38 patients (after subtracting the dead number of patients in this group), the result show that 13 patients (34.10%)from 38 patients had developed seizures . The other remaining 25 cases (65.78%) didn’t get seizures throughout the follow up. The incidence of seizures in both aged group were 23.75%, while the remainder 61 cases (76.25%) not develop seizures.

1804 Indian Journal of Public Health Research & Development, November 2019, Vol. 10, No. 11
Table( 3) Types of seizure seen in group A and group B
%Tonic clonic seizure%Myoclonic
seizure%Partial seizure%
Number of patientsWith fits
Total number of cases
Groups
2.3812.3819.52414.28642Group A
7.8937.89318.42734.211338Group B
545413.751123.751980
Total sample sizeA+B
The study result show that the most common type of fits in the acute stage of IPH was partial type, which was characterized by a focal movements in limbs or face which was described by the patients or the witness.
Group A Sixth patients (14.28%) from the 42 patients developed fits. four patient (9.52%) was partial seizure and one patient was myoclonic seizure (2.38%), and another one had tonic-clonic (2.38%).
Group B This group involved 38 patients, 13 patients (34.21%) had been developed fits. 7 patients (18.42%) developed partial fits and three patients (7.89%) developed myoclonic fits and another three patients (7.89%) were developed tonic clonic type. The incidence of partial seizures in the total number of both sample size was (13.75%), while incidence of myoclonic type was (5%) and tonic clonic type was (5%).
Table (4) Time of seizure incidence in groupA and group B.
%Number of fit cases>14
days%Number of fit cas-
es<14 days%Number of fit
patients
Total numberGroup
4.7629.52414.28642Group A
13.15521.05834.211338Group B
8.757151223.751980Total
Chi square =0.046; Correlation=0.049; P-value=0.08;Significant association
The result of this study show the following: the early seizure was defined as any seizure found in the first two weeks after the time of IPH, while late seizures was determined after 2 weeks, the result show as follow; the patients who take depakine developed early fits in a low
incidence (9.52%) than those who didn’t take the drug ( 21.05%). There was a significant difference in incidence of early and late seizure in group A and B.

Indian Journal of Public Health Research & Development, November 2019, Vol. 10, No. 11 1805
Table ( 5 )Distribution of death causes in group A and group B.
fatality rate %Total number cases Group B(50)Fatality rate %
Total number cases Group A(50)Causes of death
2412126Overall
8463Deep coma
2142Multiple bleeds
6321complications
42--Past attack(s)
42--Others eg.drugs
Group A consist from50 patients participate in the study, 6 patients died (12%) (4 during hospitalization and 2 after discharge) and another 2 patients(3%) were missed during follow up period of the study, the remaining was 42 patients. The died patients were those who were in deep coma ( 6%), who have multiple sites of bleeding on CT of brain (4%) and those who got complications e.g. aspiration pneumonia or bed sores is (2%).
Group B ( 50 )patients included in this study, 12 patients died (24%) 7 during hospitalization and 5 after discharge. The died cases were those who have coma (8%) and those who have multiple sites of bleeding on CT of brain(2%) and those who got complications e.g. aspiration pneumonia or bed sores (6%), while those who have past attack and drugs history were (4%) for each one. The overall incidence fatality rate of both group were 18%. The study show that there is a significant difference in fatality rate between two groups {P value= -1,402(<0.05)S}.
Discussion
This study is used to prevent or decrease the attack of early and late post IPH seizures by using depakine. The results show, 80% of the IPH were above 45 years, this finding was approximately similar to the other studies (11) which showed 77.3% were between 50-79 years and this study utilized the same criteria of our study.
Our study represent 14.28% of those received prophylactic depakine developed seizures, this finding
relatively agreement with study used same criteria and give prophylactic antiepileptic agent , showed that the frequency of post stroke seizures has been reported from 5-10% in the far West(12). A slightly higher frequency i.e. 13% is reported from India (13).
Regarding time of fits,4 patient 9.52% (of total 6 patients with fits in group A) developed early seizure less than two weeks in IPH , who treated with depakine, when performed comparison with patients not received depakine in which 8 patients 21.05% (of total 13 patients with fits in this group) associated early seizure less than 2 weeks. Theirs is a significant difference between the two groups.
This result is agreement with study (13) which was show that prophylactic depakine used in IPH was associated with reduced early seizures (<two weeks) to 8.7%, as well as improved neurological deficits at 30 days. Whereas in a retrospective study (14, 15) of patients with IPH, prophylactic used of phenytoin was associated with an independent poor outcome at three months increased incidence of early and late seizures as compared with depakine, the reasons could be due to the high risk for adverse reactions of phenytoin such as sedation, intolerability and high risk of toxicity. moreover ,Phenytoin had a high incidence of cognitive disturbance (16) as compared with depakine and for these reasons present study didn’t choice phenytoin.
Other study (17) result show the majority (92% n=90) of post IPH seizures were late type and only 9% were early seizures in cases using depakine.

1806 Indian Journal of Public Health Research & Development, November 2019, Vol. 10, No. 11
Our study result show that in group A, 9.52% (4) patient from (6) patient were partial seizure , the other one patient (2.38%) was myoclonic and one (2.38% ) had tonic clonic , while in control group patients the types as follows; 18.42% (7 patients) are partial, 7.89% (3 patients) were myoclonic and 7.89% (3 patient) were tonic clonic in type.
Our study result show a better outcome in IPH in states of giving prophylactic depakine regarding post-stroke seizure incidence and consistent results obtained by Passero et al.(18) reported that the administration of prophylactic anticonvulsants reduce the risk of acute seizures.
But in certain retrospective study (19) to assess the effect of prophylactic AED on outcomes, found that prophylactic AED use was associated with poor outcome, independent of other established predictors.
The analysis in this difference in two studies result from used type of drug, regarding our study , the drug used is depakine as a AED which is a good popular AED, free of major neurological side effects, low toxicity rates and good tolerability except for pregnancies, while the other study had been used the phenytoin that is known to be full of side effects like CNS depression, drug-induced toxicity especially elderly are highly susceptible to this effect and other effects and there is a study emphasized that phenytoin prophylaxis was also associated with poor outcome (20).
According the fatality rate, our study observed a low fatality rate in IPH patients taking depakine 12% than patients without depakine treatment 24% and the positive effect of prophylactic AED on fatality rate, these finding approximately similar to the study (21) that assessed the fatality rate of IPH in general without giving prophylactic AED, show result that the fatality rate six months after spontaneous intracerebral hemorrhage ranges from 23- 58%.
Conclusion
The non-traumatic non-aneurismal intraparanchymal hemorrhage occurs most commonly between 45-78 years.
The overall incidence of seizure is 23.75%.
The incidence of seizures can be reduced by administration of depakine as a prophylactic
anticonvulsant in a patients with IPH.
Partial seizures are more common than other seizure types occurring.
The fatality rate after IPH is 24%.
The use of depakine as prophylaxis drug for IPH fits had a significant role in reducing the fatality rate and in improving survival.
Conflict of Interest: Nil
Source of Funding : Self
Ethical Clearance: Informed consent was obtained from all patient that participate in the study
References
1- Taylor TN, Davis PH, TornerJC.In: Projected number of strokes by subtype in the year 2015 in the United States. Stroke. 1998;29(Abstract)322.
2. Broderick JP, Adams HP, Barsan W, et al. Guidelines for the management of spontaneous intracerebralhemorrhage.Stroke. 1999;30(Abstract)905-15.
3- Dennis MS, Burn JP, Sandercock PA, Bamford JM, Wade DT, Warlow CP. Long-term survival after first-ever stroke: the Oxford shire Community Stroke Project. Stroke 1993;24(Abstract)796-800.
4- Passero S, Rocchi R, Rossi S, Ulivelli M, Vatti G. Seizures after spontaneous supratentorialintracerebral hemorrhage. Epilepsia Journal. 2002;43(part2): 1175-1180.
5. Sung C, Chu N. Epileptic seizures in intracerebralhaemorrhage. Journal NeurolNeurosurg Psychiatry. 1989;52(part2):1273-1276.
6- Vespa PM, O’Phelan K, Shah M, Mirabelli J, Starkman S, Kidwell C,etal. Acute seizures after intracerebralhemorrhage:a factor in progressive midline shift and outcome. Neurology Journal. 2003;60:1441-1446.
7- Giroud M, Gras P, Fayolle H, Andre N, Soichot P, Dumas R .Early seizures after acute stroke: a study of 1,640 cases. Epilepsia Journal. 1994 35(part12):959-964.
8- Schold C, Yarneli PR, Earnest MP. Origin of seizures in elderly patients. JAMA Journal.
Indian Journal of Public Health Research & Development, November 2019, Vol. 10, No. 11 1807
2003;238(11):1177-8.
9- Berger AR, Lipton RB, Lesser ML, Lantos G, Portenoy RK. Early seizures following intracerebralhaemorrhage: Implications for therapy. Neurology Journal.1988;38(13):1363-5.
10- Szafl arski JP, Rackley AY, Kleindorfer DO. Incidence of seizures in the acute phase of stroke: a population-based study. Epilepsia Journal. 2008; 49: 974-81.
11- Wolfe CDA, Giroud M, Kolominsky-Rabas P. Variations in stroke incidence and survival in three areas of Europe. Stroke Journal . 2000; 31(11): 2074-2079.
12- Burn J, Dennis M, Bamford J, Sandercock P, Wade D, Warlow C. Epileptic seizures after a first stroke: the Oxfordshire Community Stroke Project. BM Journal. 1997(12); 315:1582-87.
13- Dhanuka AK, Misra UK, Kalita J. Seizures After Stroke: A Prospective Clinical Study. Neurology India Journal. 2001; 49(5): 33-36.
14- Gilad R, Boaz M, Dabby R, Sadeh M, Lampl Y. Are post- intracerebral hemorrhage seizures prevented by anti-epileptic treatment? Epilepsy Research Journal. 2011;95(33):227-31.
15- Messe SR, Sansing LH, Cucchiara BL, Herman ST,
Lyden PD, Kasner SE. Prophylactic antiepileptic drug use is associated with poor outcome following ICH. Neurocritical Care Journal. 2009;11:38-44.
16- Taylor S, Heinrichs RJ, Janzen JM, Ehtisham A.intracranial hemorrhage seizure prophylaxis. Stroke Journal 2011 Aug;15(1):80-4.
17- Bhojo A. Khealani1, Sajjad Ali2, Shahid M. Baig3.Post Stroke Seizures: Descriptive Study From A Tertiary Care Centre In Pakistan. Neurology research.2008 July;(58):364-5.
18- Passero S, Rocchi R, Rossi S, Ulivelli M, Vatti G : Seizures after spontaneous supratentorialintracerebral hemorrhage. EpilepsiaJournal.2002;43:1175-1180.
19- Messe SR, Sansing LH, Cucchiara BL, Herman ST, Lyden PD, Kasner SE. Prophylactic antiepileptic drug use is associated with poor outcome following ICH. Neurocritical Care article. 2009; 11:38-44.
20- Naidech AM, Garg RK, LieblingS.Anticonvulsant use and outcomes after intracerebral hemorrhage. Stroke Journal. 2009; 40:3810-15.
21- Broderick JP, Brott TG, Duldner JE, Tomsick T, Huster G. Volume of intracerebral hemorrhage: a powerful and easy-to-use predictor of 30-day mortality. Stroke Journal.1993;24(part 3):987-93.

Comparison of Prophylactic Effect of (Metoclopramide Plus Dexamethasone) And (Ondansetron) in Female Patients
Underwent Laparoscopic Gynecological Surgeries
Enas Ibrahim Mehdi1 , Abdulrahman E. Abdulsattar2
1Department of Anesthesia, College of Health And Medical Technology, Middle Technical University, Baghdad, Iraq, 2Department of Anesthesia, Ibn-Sina Training Hospital, Baghdad, Iraq
Abstract
Post-operative nausea and vomiting were common complicationsin laparoscopic gynecological surgeries.The study was done to evaluate the effectiveness ofondansetron againstcombination of metoclopramide plus dexamethasone in preventionof postoperative nausea and vomiting (PONV) in laparoscopicgynecological surgeries. Fifty ASAI and II consenting patients aged 20–50 years scheduled for laparoscopic gynecological surgeries wererandomlyallocated into two groups ; each group was received either intravenous ondansetron (4 mg) or intravenous metoclopramide (10 mg) plus dexamethasone (8 mg )before inductionof anesthesia.post operativenausea and vomiting then monitoredin period of 4 hours before discharging the patients. Nausea was seen in10 (40%) of patients of ondansetron groups as compared with 16 (64%) in metoclopramide plus dexamethasone .Nausea with blenching developed in 1 (4%) patients of ondansetron group as compared with 8 (32%) patients ofmetoclopramide group. The post operative nausea and vomiting in the ondansetron group was significantly minimum as compared with metoclopramide plus dexamethasone group as p value was 0.01, only 1 (4%) patient of metoclopramide plus dexamethasone group was develops less than 3 times vomiting and non of both groups were develop more than 3 times .Ondansetron was superior to metoclopramide plus dexamethasone in prophylaxis of post operative nausea and vomiting in patients undergoing gynecological laparoscopic surgeries.
Keywords: Metoclopramide, nausea, ondansetron, vomiting
Introduction
Postoperative nausea and vomiting, defined as nausea and/or vomiting that occurs within 24 hour after surgery, affects 20%-30% of patients [1][2], the etiology of PONV is thought to be multifactorial, involving individual, anesthetic, and surgical risk factors [3]
Nausea and vomiting are under control of the vomiting center which is found in the medulla. This center takes its stimulations from five primary afferent pathways which include:[4] The chemoreceptor triggering zone , The vagal mucosal pathway in the gastrointestinal tract ,Neuronal pathways from the vestibular system, Reflex afferent pathways from the cerebral cortex c2,3 and Midbrain afferents.
The activation of the vomiting center is done by stimulation of the muscarinic, dopaminergic,
histaminergic or serotonergic receptors[5]
The Risk Factors for PONVare either patients , anesthetic or surgical causes; the Patient-specific factor which increase the risk of PONV are female gender [6]; no smoking habit[6]; history of previous PONV or history of motion sickness.[7] while Anesthetic factors aredue to use of volatile anesthetics[8]; nitrous oxide[9]; or postoperative opioids[10].
Surgical factorsincludes type of surgery and duration of surgery, where there is an increase in the PONV in 60 % of patients with each 30minute increase in the duration of the surgery .[7]
Aim of Study
Compare the effectiveness of prophylactic dose of Ondansetron versus (Metoclopramide plus

Indian Journal of Public Health Research & Development, November 2019, Vol. 10, No. 11 1809
Dexamethasone)dose in prevention of postoperative nausea and vomiting in female patients undergoing Laparoscopic Gynecological Surgeries.
Material and Method
From September 2017 to September 2018 in the post anesthesia care unit (PACU) and surgical ward at the Baghdad Teaching Hospital, 50 female patients had (American Society of Anesthesiology (ASA) Grade I and II), aged (20-50) years old, weights (65-85)kg were undergoing gynecological laparoscopic surgery (diagnosed and therapeutic ) that not exceeded 1hour.
The studied sampleswere divided in to two groups (group A and group B), 25 cases for each group. Group A was received ondansetron (4mg/2ml) I.Vwhile group B was receive dexamethasone (8mg/2ml) plus Metoclopramide (10mg/2ml) I.V.before induction of anesthesia.
Same standard anesthesia technique was used in all cases. Patients were monitored during anesthesia by continued noninvasive blood pressure (NIBP), electrocardiogram (ECG), and peripheral oxygen saturation (SpO2). General anesthesia was induced with Propofol (1.5-2)mg/kg, Ketamine 0.5mg/kg I.V and Rocuronium 0.6mg/kg was given to facilitate tracheal intubation which was done with an appropriate-sized endotracheal tube Midazolam 0.15 mg/kg I.V, and tramadol up to 100mg I.V. was given to patients ,Anesthesia was maintained with (0.7%) (inspired concentration) of halothane in oxygen.
At the end of the surgery, residual neuromuscular block was reversed by neostigmine (0.05 mg/kg) with atropine (0.02 mg/kg) I.V. Extubation was done and after achieving adequate recovery, then patients were transferred to the post-anesthesia care unit (PACU).
The first 4 hours post-operatively nausea and vomiting were assessed by trained nursing staff and the resident doctors, as a routine work in PACU and surgical ward.
The nausea and vomiting were assessed at 0.5 hour ,0.5 hour -1 hour,2 hours ,3 hours and 4 hours . and the intensity of vomiting was assessed by less than 3 times or more than 3 times vomiting
Findings
Table (1): Number and percent of patient with PONV in each group within first 4hr post-operatively.
Time PONV Group A Group B
First 30 mints
Nausea 1 (4%) 2 (8%)
Nausea and Belching 0 (0%) 0 (0%)
Vomiting <3 time 0 (0%) 0 (0%)
Vomiting >3 time 0 (0%) 0 (0%)
0.5-1hr
Nausea 5 (20%) 8 (32%)
Nausea and Belching 1 (4%) 4 (16%)
Vomiting <3 time 0 (0%) 0 (0%)
Vomiting >3 time 0 (0%) 0 (0%)
After 2hrs
Nausea 4 (16%) 5 (20%)
Nausea and Belching 0 (0%) 3 (13%)
Vomiting <3 time 0 (0%) 0 (0%)
Vomiting >3 time 0 (0%) 0 (0%)
After 3hrs
Nausea 0 (0%) 0 (0%)
Nausea and Belching 0 (0%) 1 (4%)
Vomiting <3 time 0 (0%) 0 (0%)
Vomiting >3 time 0 (0%) 0 (0%)
After 4hrs
Nausea 0 (0%) 0 (0%)
Nausea and Belching 0 (0%) 1 (4%)
Vomiting <3 time 0 (0%) 1 (4%)
Vomiting >3 time 0 (0%) 0 (0%)
Total 11 (44%) 25 (100%)
Group A :ondansetrone I.V.

1810 Indian Journal of Public Health Research & Development, November 2019, Vol. 10, No. 11
Group B : Metoclopramide plus dexamethasone I.V.
Table (2) : Numbers and percent of patients with post-operative nausea and vomiting and need of antiemetic drug for each group.
GroupNo.of Patient
Post-operative Nausea and Vomiting
Null Nausea Nausea and Belching
Need of anti-emetic drugPost-op.
No. of patient with complication
Group A 25 14 (56%) 10 (40%) 1 (4%) 0 (0%) 11 (44%)
Group B 25 0 (0%) 16 (64%) 8 (32%) 1 (4%) 25 (100%)
P-Value MCP<0.01 (HS)
Group A :ondansetrone I.V.
Group B : Metoclopramide plus dexamethasone I.V.
Table (3) Numbers and percent of patients that not develop PONVand those needed to anti-emetic drug post-operatively in each group.
Type of Group Patient without PONV Need for anti-emetic drug post-op.
Group A 14 (56%) 0 (0%)
Group B 0 (0%) 1 (4%)
Figure (1): Numbers and percent of patients with PONV in ondansetrone and (metoclopramide and dexamethasone combination)

Indian Journal of Public Health Research & Development, November 2019, Vol. 10, No. 11 1811
Figure(2): Numbers and percent of patients with PONV in ondansetrone and (metoclopramide and dexamethasone combination)
Discussion
In this clinical study, there were no significant differences between the two groups regarding the age and duration of surgery. during 4 hours period PONV was significantly minimum in ondansetron group as compared with metoclopramide plus dexamethasone combination group, p value was 0.01ondansetron group 11(44%) patients were developed PONV as compared with metoclopramide plus dexamethasone combination group in which all patients 25 (100%) were developed PONV . This high number of PONV was due to gender of patients (female) ,undergoing laparoscopic surgery and due to uses of volatile and opioid during operation.The patients with no PONV were 16 (56%) in ondansetron group while all patient with metoclopramide plus dexamethasone group had PONV.Patients with nausea only develops in 10 (40%) in ondansetron groups as compared with 16 (64%) in metoclopramide with dexamethasone combination .Nausea and blenching were developed in 1 (4%) patient in ondansetron group as compared with 8 (32%) in metoclopramide with dexamethasone combination group.The majority of patients were develop nausea with or without blenching in both groups , Only 1 patient (4%) develop vomiting after 4 hour of extubation of less than 3 times and treated with antiemetic .
The other studies that were compatible with our study :Tabari M et al.(Iran ,2014) in which they compare the ondansetron , metoclopramide and dexamethasone and shows that the ondansetron had the minimum incidances of PONV as compared with other groups [11]. When compare the Ondansetron with metoclopramide ,granisetron and dexamethasone and they showed that the Ondansetron had the minimum incidances of PONV as compared with metoclopramide but the granisetron had minimum as compared with ondansetron[12]. In Nigeria study conclude that ondansetron was more effective than metoclopramide in the prevention of nausea in patients undergoing elective day‑case gynaecologicallaparoscopic procedures. Both metoclopramide and ondansetron were effective in the prevention of vomiting but ondansetron still offered superior prophylaxis. There were no significant side effects for both metoclopramide and ondansetron when used as prophylaxis.[13]. So results of Waqas etal., they conclude that Ondansetron was more effective as compared to combined metoclopramide and dexamethasone, in the prevention of post-laparoscopic surgery nausea and vomiting[14]
Conclusion
We conclude that the ondansetron had better prophylactic antiemetic action than metoclopramide

1812 Indian Journal of Public Health Research & Development, November 2019, Vol. 10, No. 11
Conflict of Interest: Nil
Source of Funding : Self
Ethical Clearance: Informed consent was obtained from all patient that participate in the study
References
1. McCracken G, Houston P, Lefebvre G. Guideline for the Management of Postoperative Nausea and Vomiting.Society of Obstetricians and Gynaecologists of Canada clinical practice guideline. 2008;209
2. Kovac AL. Prevention and treatment of postoperative nausea and vomiting. Drugs 2000.1;59(2):213–43.
3. Camu F, Lauwers MH, Verbessem D. Incidence and aetiology of postoperative nausea and vomiting. EuropeanJournal ofAnesthesiology 1992; 6:25–31.
4. Singh P, Yoon S, Kuo B .Nausea: a review of pathophysiology and therapeutics. Therapeutic Advances in Gastroenterology . 2016 9(1): 98–112
5. Babic T, Browning KN. The role of vagal neurocircuits in the regulation of nausea and vomiting. European journal of pharmacology. 2014; 5:722:38-47.
6. Apfel CC, Laara E, Koivuranta M, Greim CA, Roewer N. A simplified risk score for predicting postoperative nausea and vomiting. Conclusions from Cross-validations between Two Centers. The Journal of American society of Anesthesiology .1999; 91(3):693–700
7. Sinclair DR, Chung F, Mezei G. Can postoperative nausea and vomiting be predicted? The Journal of American society of Anesthesiology .1999.1;9(1):109–18.
8. Apfel CC, Kranke P, Katz MH, Goepfert C, Papenfuss T, Rauch S, et al. Volatile anaesthetics may be the main cause of early but not delayed
postoperative vomiting: a randomized controlled trial of factorial design. British Journalof Anesthesiology. 2002;88:659–68.
9. Myles PS, Chan MT, Kasza J, Paech MJ .Severe Nausea and Vomiting in the Evaluation of Nitrous Oxide in the Gas Mixture for Anesthesia II Trial.Anesthesiology. 2016;124(5):1032-40.
10. Apfel CC, Kranke P, Eberhart LH, Roos A, Roewer N. Comparison of predictive models for postoperative nausea and vomiting. British Journalof Anesthesiology.2002;88(2) :234–40
11. Tabari M, ShabahangH, TavasoliA et al.Comparative Study of the Effectiveness of Ondansetron, Metoclopramide and Low Dose Dexamethasone to Prevent Postoperative Nausea and Vomiting in Females who Undergo Laparoscopic Cholecystectomy.Womens Health Bullin. 2014; 1(3): e22661
12. Daria U, Kumar V. Qualitative comparison of metoclopramide, ondansetron and granisetron alone and in combination with dexamethasone in the prevention of postoperative nausea and vomiting in day care laparoscopic gynecological surgery under general anesthesia.Asian Journalof Pharmacology Clinical Researches .2012;5(2):165-167
13. Dalhat S, AlhassanD.Comparison of Ondansetron and Metoclopramide for the Prevention of Postoperative Nausea and Vomiting in Daycase Gynaecological Laparoscopic Surgeries. Nigerian Journal of Basic and Clinical Sciences .2018;15(1)
14. Waqas A, Qasmi S, MianM .Ondansetron Versus Combined Dexamethasone and Metoclopramide In Prevention of Nausea and Vomiting After Laparoscopic Cholecystectomy .Journal of Surgery Pakistan .2013;18 (2):59-63
Effect of Silver Nano-Fillers and Aging on Tensile Strength of Heat Cured Acrylic
HawraaKhalid Aziz1Assist. Prof. Prosthetic Dental Technologies Department,College of Health and Medical Technology, Middle
Technical University, Baghdad, Iraq
Abstract
Background: Silver nanoparticles are attracting interest as antibacterial and antimicrobial agents as incorporating materials into PMMA denture resin, but the need for application without side effects on resin properties is essential.This study was oriented to investigate the addition of silver nano-fillers(AgNPs)and aging on tensile strength of acrylic resin polymerized by two techniques water bath and autoclave.
Materials and method: 120specimens made of heat-cured acrylic were divided into two main groups depending on curing methods water-bath and autoclave processing technique, and then each group was subdivided into experimental groups according to the addition of silver nano-fillers in two concentration(0.2% and 2%AgNPs)and control groups(0%AgNPs). Each subgroup was divided into 2groups according to the period of immersion in distilled water(1day and 1month)with(N= 10).The WDW200Esteel tensile strength tester was used for measuring the tensile strength for all groups.Data were statistically analyzed using One-way ANOVA-test and Independent t-test to detect the significant different among tested and control groups at significance level (P≤0.05).
Results: A highly significant decrease in tensile strength was observed with the addition of silver nanofillers to PMMA.According to curing methods, the results showed that there wasnon-significant difference of curing in water-bath and autoclave technique. In addition, by aging specimens for one month period, there was a highly significant decreasein the tensile strength of acrylic in all groups .
Conclusions: The addition of AgNPs to acrylic lead to reduction of its tensile strength.No change in the tensile strength by using autoclave method for acryliccuring. In addition, the prolong storage period was reduced tensile strength of the resin.
Keywords: AgNPs, heat-cured acrylic, aging, autoclave, tensile strength.
Introduction
The poly methyl-methacrylate was introduced by Wright in1937, from this period it considered as the main polymer for fabrication of denture base[1]. It is well-known that acrylic resins may act as a reservoir for microorganisms and contribute to re-infection in denture users;there was a demand for effective widely-spectrum antimicrobial resin materials in dentistry[2].Therefore, more attention has been directed towards the AgNPs as incorporated particles into acrylic to improve its characteristics. The silver in nano-form is used to avoid the contamination or to make better
various physical and mechanical properties of denture[3].There are lot of researches on introducing nano-silver to acrylic. One of these studies allowed to obtain materials which show increased antifungal effectiveness in vitro tests[4],and relevant basic mechanical properties[5].Hamedi-Radetal.,2014compared the conductive thermal,compressive strength, and tensile strength of the resinthat reinforced with nano-silver[6].A research has revealed the incorporation of AgNPs to the polymer powder was higher in thermal conductivity than that of the conventional polymer[7].Other study investigated there was improvement in viscoelastic properties of acrylic denture reinforced with AgNPs[8].Ghaaffari

1814 Indian Journal of Public Health Research & Development, November 2019, Vol. 10, No. 11
and Hamadi Rad,2015studied the effect ofAgNPs on the tensile strength of PMMA[9].Furthermore, over the years, curing procedures have been modified with a view to improve the physical and mechanical properties of resin materials, the water bath processing technique has been the most conventional polymerization technique[10].In spite of the advantages provided by this technique like the ease, simplicity and cost-effectiveness, a major disadvantage has been long processing time need[11].The use of pressure cooker for denture polymerization was first reported in1976.The investigation by Indian researchers of the pressure cooker for curing resin was done and they revealed that itrequires less than 1hour for curing and utilizes conventional equipment[12].
On the other hands,variousstudies in which distilled water was used for aging[13,14].The flexural strength and bond strength of denture base and relined resins wereobserved after water immersion[15,16].AlsoJagger etal.,2000 studied the effect of 6months of storage in water at 37°C on heat polymerizing acrylic[17].
So this study was aimed to evaluate the effect of:
1.Incorporating 2% and 0.2%AgNPs into heat-cured acrylic denture-based material on the tensile strength of resins.
2.Two processing techniques: water-bath and autoclave on the tensile strength of heat-cured resins.
3.Immersion in distilled water in two periods(1day and 1month)on the tensile strength of heat-cured resins.
Materials and Method
A total of 120 specimens were prepared from heat-cured denture base resin,(Superacryl`plus, Modern Medical equipment, Czech Republic)which were divided into two groups according to processing technique:water bath and autoclave. Each onedivided into three groups according to AgNPs concentration:0%AgNPs,0.2%AgNPs,and2%AgNPs.The samples for each group were subdivided depending on the period of immersion in distilled waterfor 1day and 30days(N=10).The AgNPs(Silver Nano-powderproduct no.MKN-Ag-090,MK Nano,MKImpexCorp.,Lot no. 0729,Canada),silvernano-powderof 90nm particle size according to manufacturer instruction(Fig.1).
Sample preparation
The wax patterns(Polywax, Bilkim chemical
company, Turkey)were constructed in form ofFlat dumbbell-shaped with dimensions(80mm,9mm,3mm)length,width,thickness respectively[18](Fig.2).
The mould preparation was utilized by placing the wax pattern after coating with separating medium in the lower portion of the flask within dental stone typeIV(Elite stone, Zhermack, Germany)that was mixed according to the manufacturer’s instructions.The wax patterns were placed about 1/2 of their thickness.After that,the opening of the flask was carefully done and the patterns were removed from the mould.
Incorporation of silver nanoparticles:
For experimental specimens,AgNPs were added in two percentages(0.2%,2%) to the monomer through the extremely sonication of the fillers which had been well dispersed in the liquid by a probe of sonication equipment (Soniprep150, England)at 120W and 60KHzto split them into nano-crystals for 3minutes individually[19]. The monomer with AgNPs were mixed with acrylic powder immediately to reduce the possibility of particle aggregation and separation.
The proportion of acrylic mixing was 10g: 4.4ml(P/L)according to the manufacturer’s instruction and left to stand until a dough stage was reached. An electronic balance with 0.0001g accuracy (StaroiusBP 30155, Germany)was used to measure the weight of materials of this study.
Packing and Curing
The dough stage of the mixture was packed in the mould after lining with a separating medium and become ready for curing by water-bath technique,the curing was done byplacing theconventional brass metal flask (Broden,Sweden)in water bath (Memmert, Germany) and processed by heating at 74°C for an hour and a half.The temperature was increased to the boiling point for 30 minutes[20].Then, the metal flask was allowed to cool at room temperature for 30minutes, followed by complete cooling of the metal flask for 15 minutes before deflasking. For curing by autoclave processing technique,it was carried out by placing the clamped flask in a fully automatic autoclave(QD, England)and processed by the preprogrammed cycles (121ºC/210KPa,30min). Before placing the clamped flask inside the autoclave, the autoclave must be leveled and filled with distilled water. Then, the clamped flask

Indian Journal of Public Health Research & Development, November 2019, Vol. 10, No. 11 1815
placed in the tray and pushed inside the chamber, then closed and secured the door. The autoclave operated and started heating the water, then the temperature and pressure were raised till its reached(121ºC and 210KPa) respectively. When the temperature reached(121ºC), temperature and pressure held automatically at(121ºC and 210KPa) respectively for 30min[21], then automatically exhausted the steam and the programmed cycle was finished, then removed the clamped flask.Then the flask was opened and the specimens were removed from the stone mould, smoothing and polishing in conventional way with continuously cooled with water to avoid overheating which may lead to the distortion of the specimens[20].
Half of the specimenswere soaked indistilled waterfor 1day.While other half immersed in distilled water 30days in incubator(Gallenbamp, England)at 37±1ºC and the water changed daily within the mentioned period[13].
Testing Procedures
The acrylic specimens were utilized to measure the tensile strength(Fig.3),that was achieved by using(WDW200E steel tensile strength tester with tensile strength testing machine)(Fig.4). Each specimen was positioned on bending fixture, consisting of 2 parallel supports(50mm)apart, the full scale load was(50g),and the load applied with cross head speed 5mm/min by rod placed centrally making deflection until fracture occurred and the force were recorded in Newton.
The tensile strength values were calculated by following equation:
Tensile strength=F/A[18].
F =force at failure(Newton).
A=Minimum cross sectional area(mm).
Data was analyzed by Statistical Package for Social Science (SPSS) version #21(SPSS, Chicago, Illinois, USA).Descriptive statisticsand inferential statistics: One-way ANOVA-test and Independent t-test were used to detect significant differences between tested and control groups at a significance level(P≤0.05).
Results
Descriptive statistics of tensile strength values of the groups without the addition of AgNPs group showed higher mean values than the experimental groups with addition of 0.2%, 2% AgNPs.The tensile strength for those ofone day immersion in distilled water showed higher mean values thanthose immersed for thirty days (Table1, Fig.5).
For comparing the effect of silver nano-filler addition on the tensile strength of the heat cured acrylic, One-way ANOVA-test showed there was a highly significant different between the tested groups(Table2).Further analysis by LSD-test was showed there was a highly significant different between the control group and experimental groups(Table3).
In comparison, the effect of curing technique the Independent t-test was showed there were non-significant differences in the tensile strength between the water bath groups and autoclave groups(Table4).
Furthermore, the means values of the tensile strength of the acrylic resin depending on the time of immersion in distilled water were compared using the Independent t-test which showed that there were highly significant differences among the study groups(Table5).

1816 Indian Journal of Public Health Research & Development, November 2019, Vol. 10, No. 11
Table1: Descriptive statistics of tensile strength(N/mm2)for all study groups.
Study Groups N Mean SD Minimum Maximum
Wat
er b
ath 0%AgNPs
1day 10 48.112 2.5578 42.325 50.567
30days 10 44.365 1.2853 42.520 45.932
0.2%AgNPs 1day 10 45.820 1.2958 43.976 47.356
30days 10 41.928 1.3539 40.257 44.050
2%AgNPs1day 10 42.722 2.8872 37.268 45.907
30days 10 39.722 1.5263 35.910 41.181
Aut
ocla
ve
0%AgNPs1day 10 46.297 1.1601 44.358 47.184
30days 10 43.122 1.5407 39.520 44.955
0.2%AgNPs 1day 10 44.728 1.0435 43.069 46.499
30days 10 40.981 0.8876 39.296 42.266
2%AgNPs1day 10 40.875 1.2130 38.065 42.156
30days 10 38.638 0.8136 37.332 40.013
Fig. 5:Bar chart showed tensile strength test for all groups.
Table 2:O-way ANOVA-Test comarison the tensile strength between groups according to addition of different concentration of AgNPs.
F-test P-value Sig
Water bath1day 0%AgNPs&0.2%AgNPs&2%AgNPs 13.257 0.000 HS
30days 0%AgNPs&0.2%AgNPs&2%AgNPs 27.827 0.000 HS
Autoclave1day 0%AgNPs&0.2%AgNPs&2%AgNPs 59.448 0.000 HS
30days 0%AgNPs&0.2%AgNPs&2%AgNPs 39.451 0.000 HS
HS: highly significant at P≤0.01.
Table 3: LSD-test for comparison between thegroups according to addition of AgNPs.
P-value Sig
Wat
er b
ath
1day
0%AgNPs&0.2%AgNPs 0.038 S
0%AgNPs&2%AgNPs 0.000 HS
0.2%AgNPs&2%AgNPs 0.007 HS
30days
0%AgNPs&0.2%AgNPs 0.001 HS
0%AgNPs&2%AgNPs 0.000 HS
0.2%AgNPs&2%AgNPs 0.001 HS
Aut
ocla
ve
1day
0%AgNPs&0.2%AgNPs 0.005 HS
0%AgNPs&2%AgNPs 0.000 HS
0.2%AgNPs&2%AgNPs 0.000 HS
30days
0%AgNPs&0.2%AgNPs 0.000 HS
0%AgNPs&2%AgNPs 0.000 HS
0.2%AgNPs&2%AgNPs 0.000 HS
S:significant at P≤0.05,HS:highly significant at P≤0.01

Indian Journal of Public Health Research & Development, November 2019, Vol. 10, No. 11 1817
Table 4:Independent T-Test for compariosn the tensile strength between groups according to curing techniques.
t-test P-value Sig.
0%AgNPs1day Water bath&Autoclave 2.064 0.054 NS
30days Water bath&Autoclave 1.960 0.066 NS
0.2%AgNPs1day Water bath&Autoclave 2.076 0.052 NS
30days Water bath&Autoclave 1.850 0.081 NS
2%AgNPs1day Water bath&Autoclave 1.865 0.079 NS
30days Water bath&Autoclave 1.981 0.063 NS
NS:non-significant at P>0.05
Table 5: Independent T-Test for comparsion the tensile strength between groups according to storagetimein distilled water.
t-test P-value Sig
0%AgNPsWater bath 1day&30days 4.139 0.001 HS
Autoclave 1day&30days 5.177 0.000 HS
0.2%AgNPsWater bath 1day&30days 6.567 0.000 HS
Autoclave 1day&30days 8.648 0.000 HS
2%AgNPsWater bath 1day&30days 2.905 0.009 HS
Autoclave 1day&30days 4.843 0.000 HS
Discussion
Many studies pointed onAgNPseffect when added into acrylic for the treatmentof oral infections like denture stomatitis and other antifungal and antibacterial infections. So, the modification of denture resins by silver additive in nano-form to get the possible positive influence of its addition[3].Silver nanofillers are smaller in size andthey possess physical, chemical, and biological properties that are distinctive from those presented by traditional bulk materials. Finer size and larger surface area provide potent antibacterial impact at a low filler level, so determining AgNPs concentration necessary for its efficacy and avoiding negative effect on mechanical properties[22],so the decision was made to choose two percentages of AgNPs about 0.2% and 2% depending on the previous study that was revealedthe addition of different percentageof silver nanoparticles to acrylic resinabout 0.2 and 2% result in increasein the compressive strength of acrylic[9],other research conducted that the use of 0.2%,2% nano-silver with acrylic resin increases its thermal conductivity[7],the study was showedthere
was decrease in tension properties as a result to addition of5%AgNPs[9].Furthermore, increase the percentage ofsilver nanoparticlesthat leads to adverse effect on properties of resin such as the addition ofsilver nano-filler lead to color change of acrylic because the fillers tend to fill any spaceswithin the polymer,and decrease the amount of transmitted light[23].As well as silver nano-fillers are metal fillers which are changing thecolor of acrylic resin that limits its application inthe esthetic zone that was increase with the use of more amount of nano-filler[7].
The result of effect of silver addition in nano-formon the tensile strength was decrease in this properties when compared with no addition, this was probably attributed to AgNPs acts as impurities and tensile strength would decrease by increasing their content.Anotherexplanation was the reductionof monomers reaction and increases the amount of unreacted monomer, behaving like a plasticizer[24].The plasticization effect of the resultant residual monomer will reduce the molecular binding force, that lead tomultiple micro-fracture in high

1818 Indian Journal of Public Health Research & Development, November 2019, Vol. 10, No. 11
deformation upon stretching that weaken the resin[2].In addition, there was an increase in impurity action of nanofillers which cause a stress concentrated points in the matrix and weakening the resin[25].This result in the brittleness of resin may be attributed to the dysfunctional effect of high percent of AgNPs because the low absorbed energy ion within fracture and Ag+ions being reduced as the concentration of silver increase that was generating atom clusters and smaller particle size during the polymerization process[26].These findings are consistent with previous studies who reported that the mechanical and physical properties of the composite are influenced by silver nanofiller concentration since mechanical properties of composites decreased by increasing silver nanoparticles[27,4].
According to the result of this study, there was no difference between the curing in water bath and autoclave curing. This result in agreement with the findings of previous study that showed that there was non-significant difference between the autoclave and water-bath curing regarding tensile strength[28].This could be explained that “autoclave” utilized the temperature and pressure when water is heated in a sealed vessel such as an autoclaveand the pressure rises due to the constant volume of the container. The boiling point of water is then raised because the amount of energy needed to formssteam against the higher pressure is increased[29,30].Another cause is high heat treating,could be attributed to increase in cross-linking that provides a sufficient number of bridges between linear macromolecules to form three-dimensional network that decreases water sorption, decreases solubility, and increases the strength and rigidity of resin, as well as the most important determinant of resin strength is the degree of polymerization exhibited by the material.As the degree of the polymerization increase, the strength of the resin also increases, the polymerization cycle employed with a heat activated resin[31].
On the other hand, the effect of the aging in distilled water on the tensile strength of the acrylicwas showed the decrease with increase the period of exposure,this result confined with the study that found the prolonged storage in water badly effecton acrylic resin[17], another research showed the aging in water or aqueoussolutions lead to decrease the mechanicalproperties of the resin, they explainedthe reasons by the use of water may affect the mechanical properties of the acrylicand cause a reduction in the denture strength. This could be
attributed to the plasticizer, the materials become softer and tougher, with lower tensile strength[13],this may be due to the gap between polymer chains that wascaused distilled water penetration and resulted the change in the mechanical properties of the polymer[32].
Conclusion
There was weakening in the tensile strength of resin due to 0.2% and 2% silver addition in nano-form. On the other hand, the autoclave polymerization technique can be used as alternative method for processing denture resins, but the prolong storagein water decreased the tensile strength.
Conflict of Interest: non
Source of Finding: self
Ethical Clearness: non
References
1. Tandon R, Gupta S, Agarwal SK. Denture base materials: From past to future. Indian J Dent Sci. 2010;2(2):33-9.
2. Al-Husayni OK, Hatoor NA. Effect of silver nitrate incorporation into heat polymerized acrylic resin on some mechanical properties. J of Baghdad college of dentist 2014;26(4):78-85.
3. Srivastava R, Sharma V, Dave A,Upadhyay M. Silver Nanoparticles in Denture Base Material.Int J PrevClin Dent Res 2016;3(4):1-4.
4. Chladek G, Żmudzki J, Kasperski J. Long-term soft denture lining materials. Materials. 2014;7(8):5816-42.
5. Chladek G, Kasperski J, Barszczewska-Rybarek I, Żmudzki J. Sorption, solubility, bond strength and hardness of denture soft lining incorporated with silver nanoparticles. International journal of molecular sciences 2012;14(1):563-74.
6. Hamedi-Rad F, Ghaffari T, Rezaii F, Ramazani A. Effect of nanosilver on thermal and mechanical properties of acrylic base complete dentures.Journal of dentistry(Tehran,Iran) 2014;11(5):495.
7. Ghafari T, Hamedi Rad F, Ezzati B. Does Addition of Silver Nanoparticles to Denture Base ResinIncrease Its Thermal Conductivity? J Dent Sch 2014; 32(3):139-44.

Indian Journal of Public Health Research & Development, November 2019, Vol. 10, No. 11 1819
8. Mahross HZ, Baroudi K. Effect of silver nanoparticles incorporation on viscoelastic properties of acrylic resin denture base material. European journal of dentistry 2015;9(2):207.
9. Ghaffari T, Hamedi-rad F. Effect of silver nano-particles on tensile strength of acrylic resins. Journal of dental research, dental clinics, dental prospects 2015;9(1):40.
10. Azzari MJ, Cortizo MS, Alessandrini JL. Effect of the curing conditions on the properties of an acrylic denture base resin microwave polymerized. J Dent 2003;31:463-8.
11. Abdulwahhab S, Alnakkash W. The effect of autoclave processing onsome properties of heat cured denture base material. J BaghColl Dentistry 2012;24(3):13-7.
12. Banerjee R, Banerjee S, Prabhudesai PS, Bhide SV. Influence of the processing technique on the flexural fatigue strength of denture base resins: An in vitro investigation. Indian Dent Assoc 2010;21:391-5.
13. Wady AF, Machado AL, Vergani CE, Pavarina AC, Giampaolo ET. Impact strength of denture base and reline acrylic resins subjected to long-term water immersion. Brazilian dental journal 2011;22(1):56-61.
14. Peter D, Pierre-Yves L G, Maelenn L G. Influence of Sea Water Aging on the MechanicalBehavior of Acrylic Matrix Composites. Applied Composite Materials 2017;24(1):97-111.
15. Aydin AK, Terzioğlu H, Akinay AE, Ulubayram K, HasirciN.Bond strength and failure analysis of lining materials to denture resin. Dent Mat 1999;15:211-218.
16. Takahashi Y, Chai J, Kawaguchi M. Effect of water sorption on theresistance to plastic deformation of a denture base material relinedwith four different denture reline materials. Int J Prosthodont1998;11:49-54.
17. Jagger DC, Harrison A, al-Marzoug K. Effect of the addition of poly(methyl methacrylate) beads on some properties of acrylic resin. Int J Prosthodont 2000;13:378-382.
18. ASTM: American society for testing and material, ASTM D, 638-m standard test method for tensile properties of plastics. Philadelphia: American National Standards Institute(1986).
19. AtaiM, Solhi L, Nodehi A, Mirabedini SM, Kasraei S, Akbari K, et al. PMMA-grafted nanoclay asnovel filler for dental adhesives. Dent Mater. 2009;25:339-47.
20. American dental association specification No. 12 for denture base polymer guide to dental materials and devices.7th ed. Chicago Illinois, 1999.
21. Oyawale FA., Olaoye AE. Design and Construction of an Autoclave. Pacific J Science and Technology 2007; 8(2):224-30.
22. Correa JM, Mori M, Sanches HL, Cruz AD, Poiate E, Poiate IA. Silver nanoparticles in dental biomaterials. International journal of biomaterials 2015;2015:1-9.
23. Issa MI, Abdul-Fattah N. Evaluating the effect of silver nanoparticles incorporation on antifungal activity and some properties of soft denture lining material. Journal of baghdad college of dentistry 2015;27(2):17-23.
24. Xia Y, Zhang F, Xie H, Gu N. Nanoparticle-reinforced resin-based dental composites. Journal of dentistry 2008;36(6):450-5.
25. Chatterjee A. Effect of nanoTiO2 addition on poly(methylmethacrylate):an exciting nanocomposite. J ApplPolym Sci. 2010;116:3396407.
26. Fan C, Chu L, Rawls HR, Norling BK, Cardenas HL, Whang K. Development of an antimicrobial resin-A pilot study. Dental Materials.2011;27(4):322-8.
27. Sodagar A, Kassaee MZ, Akhavan A, Javadi N, Arab S, Kharazifard MJ. Effect of silver nano particles on flexural strength of acrylic resins. Journal of prosthodontic research2012;56(2):120-4.
28. Kareem A. Strength and surface roughness of cross linking acrylic resin processed by different heat curing methods. Iraqi Dental Journal 2015; 37(1):13-19.
29. Durkan R, Ozel M, Bagis B, Usanmaz A. In vitro Comparison of Autoclave Polymerization on the Transverse Strength of Denture Base Resins.Dental Materials Journal 2008;27(4):640-42.
30. Brosh T, Ferst N, Cardash H, Baharaw H. Effect of polymerization under pressure on indirect tensile mechanical properties of light polymerized composite. J Prosthet Dent.2002; 88(4):381-7.

1820 Indian Journal of Public Health Research & Development, November 2019, Vol. 10, No. 11
31. Anusavice KJ, Phillips’s sciences of dental materials,11thed.,Saunders Co, Philadelphia, pp.162-9,2007.
32. Khamas AM, Abdul-Sahib AJ. Evaluation of some physical properties of two permanent heat cure silicone soft lining materials. Journal of baghdad college of dentistry 2008;20(2):20-5.

Formulation and Evaluation of Acetic Acid Lotion for the Treatment of Wound Infection
Fitua Al-Saedi1, Ibtihal Abdulkadhim Dakhil2, Adil Hummod3, QabasNather4
1College of Pharmacy, Al- Mustansiriyah University, Iraq
Abstract
Acetic acid has been used as a topical agent for healing wound infections. However, no studies have been done to formulate acetic acid based lotion and investigate its role in wound dressing. Therefore, the current workinvolved study the antibacterial activity of acetic acid against pathogenic bacteria associated with wound infections in vitro. In addition to formulate acetic acid lotion and study its role in the treatment of infected wounds, using mice model.
The results show that acetic acid has antibacterial efficacy at different concentrations against pathogenic bacteria tested; Staphylococcus aureus, Escherichia coli, Pseudomonas aeruginosa, Acinetobacter sp, Proteussp and Salmonella sp.
The application of acetic acid based lotion on wound infected with P. aeruginosatwice a day for 6 days leads to prevent bacterial infection and treat wounds.Herein, we reveal that acetic acid lotion has potent antibacterialefficacy and plays a significant role in wound healing.
Key words: Wound, bacterial infection, Acetic acid, wound healing.
Introduction
Wound infection is a main problem contributing to mortality and morbidity due to the rise in the infections that are caused by multidrug resistant bacteria.To overcome this problem, variety alternatives have been suggested such as bacteriophages, vaccines, antimicrobial peptides, and plant extracts, etc. [1].Organic acids, such as acetic acids, are promising alternatives for infection inhibition [2].
Acetic acid has been used in medicine for thousands years.Many studies address antimicrobial activity of acetic acid against a wide range of pathogens.Acetic acid has been used to inhibit bacterial biofilms of both Gram negative and Gram positive bacteria such as P. aeruginosa, K. pneumoniaeand S. aureus [3].In addition, it has been shown that using 6% acetic acid leads to reduce Mycobacterium tuberculosis after 30 min of exposure [4].
In literature, Acidic acid was used as a topical agent for healing war-wound infections caused by P. aeruginosa [5]. It has been reported that treating
burn wounds with 5% acetic acid result in inhibit P. aeruginosa infection [6].
In addition to antibacterial activity, acetic acid has anti-fungal activity against pathogenic fungi. Recently, it has been found that low concentrations of acetic acid were active against Mucorales species [7].
Antimicrobial activity of acetic acid is attributed to low pH. However, it has been found that using another acids such as HCl does not show same antimicrobial effect as acetic acid even when they wereused at the same pH. Thus, the antimicrobial activity of acetic acid could be result of the acetic acid molecule itself [3].
To date, no study has been done to formulate acetic acid lotionand investigate its role in wound healing.Acetic acid is available, cheap, non-toxic and has antimicrobial activity. We propose suggest that initial application of Acetic acid lotion may represent an effective way to impede bacterial growth, and thus inhibit wound infection.

1822 Indian Journal of Public Health Research & Development, November 2019, Vol. 10, No. 11
Materials and Method
Bacterial strains& Media
Pathogens cause wound infections such as
S. aureus, E. coli, P. aeruginosa, Acinetobacter sp, Proteussp and Salmonella sp. were diagnosed and kindly provided by clinical laboratories at Al- Yarmouk hospital.S. aureus was grown on mannitol salt agar plates. Gram negative pathogens were grown on MacConkey agar plates at 37 °C. Agar well diffusion experiments were performed in Muller- Hinton agar.
In vitro, antibacterial effects of acetic acid.
Agar well diffusion method was used to determine antibacterial activity of the acetic acid. Acetic acid was diluted in sterile distilled water to prepare the following concentrations 5%, 4%, 3%, 2% and 1% (V/V).
Muller-Hinton agar was inoculated with one of the following bacteria (106 cfu/ml, adjusted to 0.5Mcfarlandstandard):S. aureus, E. coli, P. aeruginosa, Acinetobacter sp, Proteussp and Salmonella sp. 100µl from each concentration was added into 6mm diameter wells. Amoxcillin- (30µg/disc) was used as a positive control. Plates were incubated at 37 ºC for 24 hours.
Formulation of acetic acid based lotion
Table (1) materials used in acetic acid lotion formula
Quantity per 100mlIngredients
5 mLAcetic acid
10 gmMineral oil
4 gmTween80+span 60
5 mlPropylene glycol
0.5 gmXanthan gum
0.03 gmMethyl paraben
0.02 gmPropyl paraben
Q.Striethanolamine
Sufficient quantityPerfume
Q.S to 100ml Distilled water
Q.S: quantity sufficient
Preperation of acetic acid lotion
Oil in water emulsion based lotion was formulated .the emulsifier (span60) and other oil soluble components (mineral oil) dissolved together as oil phase and heated to 75 ºC. the prservatives (methyl paraben and propyl paraben and other water soluble(acetic acid, tween80, propylene glycol) dissolved in aqueous phase and heated to 75 ºC, after that aqueous phase added to oil phase in portions with continuous stirring until the lotion formed then put aside until cool. Xanthan gum prepared as asolution by adding 0.5 gm per 100ml then added to formed lotion with continuous stirring to give suitable consistency. triethanolamin added in drops to adjust the lotion pH at 5.5 which mimic to skin Ph and not cause any irritant [8].
Characterization of acetic acid lotion formula:
Visible inspection
Each emulsion was evaluated to detect visible modifications or instabilities such as color, creaming, coalescence, and/or separation of phases.
In vitro characterization of lotion formulation
1- Viscosity: measurement of viscosity was conducted using a Model Brookfield viscometer. A C-61 spindle was employed with a rotation rate of 2.5, 5, 6 rotation per minute (rpm). Temperature was set at 25°C ± 2 and these experiments were conducted in triplicate 2-detrmination of pH: Lotion pH was recorded with a digital pH meter (Mettler& Toledo, Giessen, Germany) by inserting probe into the lotion formulation and allowing it to equilibrate for 1 minute[9] [10].
The viscositiy was measured to determine rheological properties of formulations.
Brookfield Rheometer viscometer at 30˚C with a CPE 61 spindle at 30 rpm was used to
serve this purpose. Results were taken in triplicate and the average was taken in to
consideration.[1]
The viscositiy was measured to determine rheological properties of formulations.
Brookfield Rheometer viscometer at 30˚C with a CPE 61 spindle at 30 rpm was used to
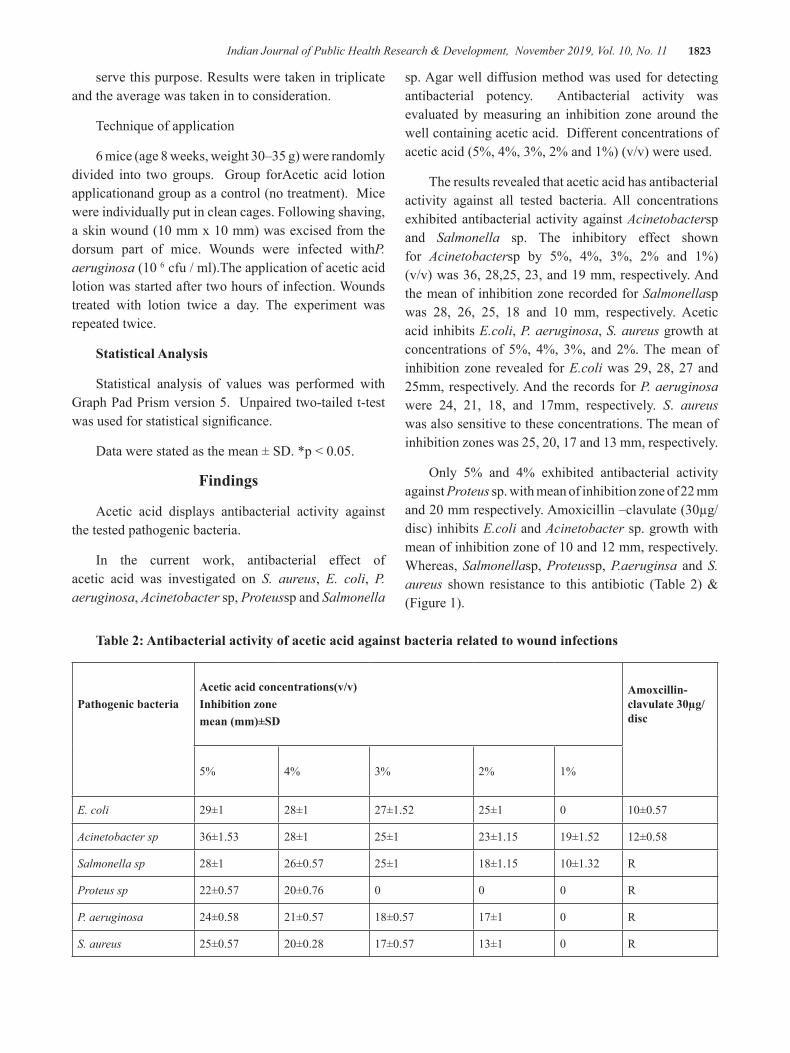
Indian Journal of Public Health Research & Development, November 2019, Vol. 10, No. 11 1823
serve this purpose. Results were taken in triplicate and the average was taken in to consideration.
Technique of application
6 mice (age 8 weeks, weight 30–35 g) were randomly divided into two groups. Group forAcetic acid lotion applicationand group as a control (no treatment). Mice were individually put in clean cages. Following shaving, a skin wound (10 mm x 10 mm) was excised from the dorsum part of mice. Wounds were infected withP. aeruginosa (10 6 cfu / ml).The application of acetic acid lotion was started after two hours of infection. Wounds treated with lotion twice a day. The experiment was repeated twice.
Statistical Analysis
Statistical analysis of values was performed with Graph Pad Prism version 5. Unpaired two-tailed t-test was used for statistical significance.
Data were stated as the mean ± SD. *p < 0.05.
Findings
Acetic acid displays antibacterial activity against the tested pathogenic bacteria.
In the current work, antibacterial effect of acetic acid was investigated on S. aureus, E. coli, P. aeruginosa, Acinetobacter sp, Proteussp and Salmonella
sp. Agar well diffusion method was used for detecting antibacterial potency. Antibacterial activity was evaluated by measuring an inhibition zone around the well containing acetic acid. Different concentrations of acetic acid (5%, 4%, 3%, 2% and 1%) (v/v) were used.
The results revealed that acetic acid has antibacterial activity against all tested bacteria. All concentrations exhibited antibacterial activity against Acinetobactersp and Salmonella sp. The inhibitory effect shown for Acinetobactersp by 5%, 4%, 3%, 2% and 1%)(v/v) was 36, 28,25, 23, and 19 mm, respectively. And the mean of inhibition zone recorded for Salmonellasp was 28, 26, 25, 18 and 10 mm, respectively. Acetic acid inhibits E.coli, P. aeruginosa, S. aureus growth at concentrations of 5%, 4%, 3%, and 2%. The mean of inhibition zone revealed for E.coli was 29, 28, 27 and 25mm, respectively. And the records for P. aeruginosa were 24, 21, 18, and 17mm, respectively. S. aureus was also sensitive to these concentrations. The mean of inhibition zones was 25, 20, 17 and 13 mm, respectively.
Only 5% and 4% exhibited antibacterial activity against Proteus sp. with mean of inhibition zone of 22 mm and 20 mm respectively. Amoxicillin –clavulate (30µg/disc) inhibits E.coli and Acinetobacter sp. growth with mean of inhibition zone of 10 and 12 mm, respectively. Whereas, Salmonellasp, Proteussp, P.aeruginsa and S. aureus shown resistance to this antibiotic (Table 2) & (Figure 1).
Table 2: Antibacterial activity of acetic acid against bacteria related to wound infections
Pathogenic bacteriaAcetic acid concentrations(v/v)Inhibition zonemean (mm)±SD
Amoxcillin-clavulate 30µg/disc
5% 4% 3% 2% 1%
E. coli 29±1 28±1 27±1.52 25±1 0 10±0.57
Acinetobacter sp 36±1.53 28±1 25±1 23±1.15 19±1.52 12±0.58
Salmonella sp 28±1 26±0.57 25±1 18±1.15 10±1.32 R
Proteus sp 22±0.57 20±0.76 0 0 0 R
P. aeruginosa 24±0.58 21±0.57 18±0.57 17±1 0 R
S. aureus 25±0.57 20±0.28 17±0.57 13±1 0 R
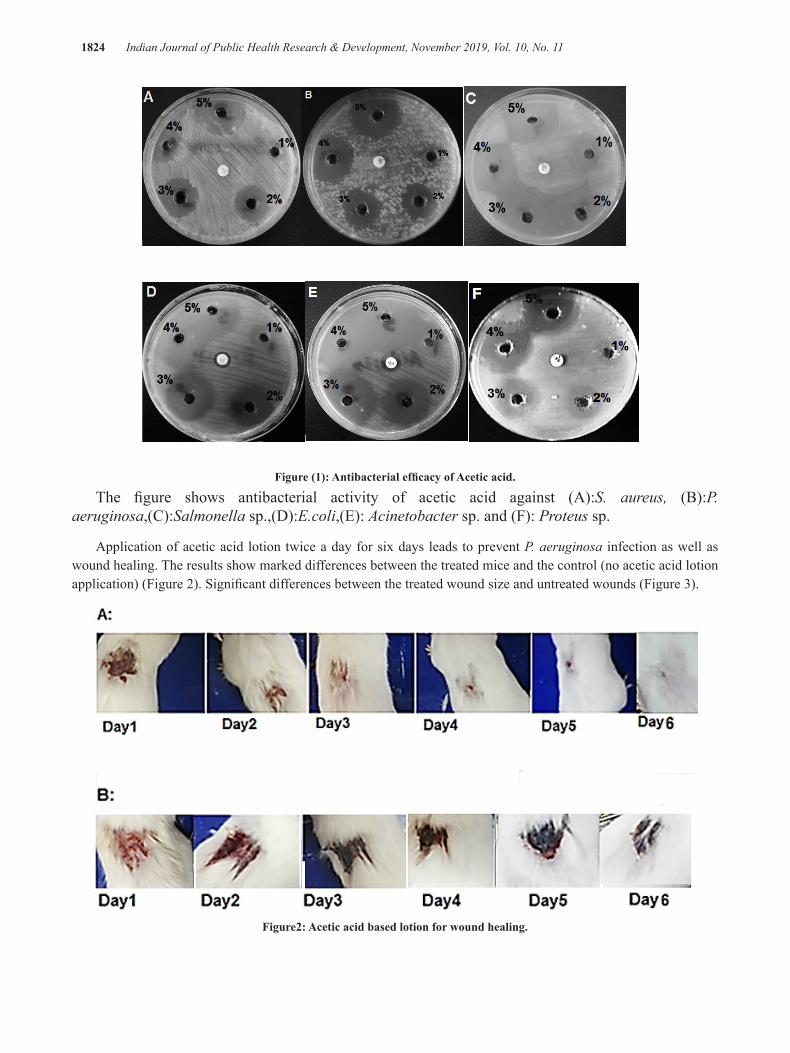
1824 Indian Journal of Public Health Research & Development, November 2019, Vol. 10, No. 11
Figure (1): Antibacterial efficacy of Acetic acid.
The figure shows antibacterial activity of acetic acid against (A):S. aureus, (B):P.aeruginosa,(C):Salmonella sp.,(D):E.coli,(E): Acinetobacter sp. and (F): Proteus sp.
Application of acetic acid lotion twice a day for six days leads to prevent P. aeruginosa infection as well as wound healing. The results show marked differences between the treated mice and the control (no acetic acid lotion application) (Figure 2). Significant differences between the treated wound size and untreated wounds (Figure 3).
Figure2: Acetic acid based lotion for wound healing.
Figure (1): Antibacterial efficacy of Acetic acid.

Indian Journal of Public Health Research & Development, November 2019, Vol. 10, No. 11 1825
: Acetic acid lotion application on wound infected with P. aeruginosa.
: Control mice infected with P. aeruginosa.
Figure 3: The treatment with Acetic acid lotion enhances wound healing.
Discussion
In the current study, the work involved using acetic acid to inhibit bacterial wound infection and formulate an acetic acid lotion to heal wounds. Pathogens infections are a key problem in the curative of chronic wounds. Usually, antibiotics have been used to treat wound infections, but in the majority of chronic wounds, these antibiotics are un useful. In addition to the cost and the resistance to antibiotics.,Acetic acid is available, cheap, non-toxic and has antimicrobial activity. Thus, we chose it to formulate acetic acid lotion and investigate its ability for wound dressing. In the current study the following pathogenic bacteria that cause wound infections were used: S. aureus, E. coli, P. aeruginosa, Acinetobacter sp, Proteussp and Salmonella sp.Herein, different concentrations of acetic acid were used to inhibitbacterial growth.
In the current study, we found that acetic acid is effective againstall tested bacteria. Acetic acid demonstrated antibacterial activity against all pathogens. Many studies demonstrate the antibacterial activity of Acetic acid. Anti- bacterial activity of different concentrations of acetic acid (0.5—2%) was investigated against P. aeruginosa. The results revealed that 2% acetic acid exhibited the highest inhibition zone
[11]. Acetic acid inhibits E. coli growth [14]. This inhibition was due to diffusion ofthe acetic acid molecule leads to lowering the cytoplasmic pH[15]. The pH is one of the crucial factors that affect bacterial growth.
Next step in our study was formulating acetic acid based lotion (5% acetic acid). The prepared oil in water emulsion based lotion was milky color, acceptable odor, homogenized and stable. The viscosity of acetic acid lotion measured in different rotation per minute (R.P.M) was 1344 centipoise at 2.5R.P.M, 1081centipoise at 5R.P.M and 938centipoise at 6R.P.M so it behave as psudoplastic and has viscosity within normal range. The pH of prepared lotion was 5.5.
To evaluate the role of Acetic acid lotion in wound dressing, acetic acid lotion was applied directly to the infected wounded skin. Wounds were infected P. aeruginosa. P. aeruginosa is the most frequent Gram negative pathogen that causes chronic wound infections [12]. The results show that the application of acetic acid lotion into the infected wounded skin twice daily for 6 days result in wound healing. 5% acetic acid is a harsh environment for bacterial growth. Thus, the lotion prevents bacterial growth. It has been shown that application of 1% acetic acid for 10-14 days in burn wounds leads to elimination P. aeruginosa infection [13].

1826 Indian Journal of Public Health Research & Development, November 2019, Vol. 10, No. 11
It is well known that lowering the pH of the wound leads to wound healing. Low pH result in inhibit bacterial protease and decrease bacterial toxicity. In addition, low pH induces host macrophages activity. The pH of the formulated acetic acid lotion in the current work was adjusted to 5.5. This pH does not cause skin irritation since it is close to the pH of skin. In addition, adding Perfume leads to disappear cetic acid smell that makes it acceptable. Antibiotics resistant bacteria are a critical problem in wound healing process. Acetic acid lotion accelerates the treatment of the infected wounds .Thus, no needs to use antibiotics, especially with multidrug resistant bacteria. Since Acetic acid lotion has potential role for wound dressing. We suggest that the application of acetic acid lotion on infected wounds could be a good way to inhibit infections and induce wound healing.
Conclusion
Acetic acid lotion has potent antibacterial efficacy and accelerates the treatment of the infected wounds. Thus, we suggest that initial application of this lotion may represent an effective way to treat wounds especially with multidrug resistant bacteria.
Conflict of Interest: None.
Funding-self or other source: Al mustansiriyah university.
Ethical Clearance: all studies were conducted in accordance with the Ethical Committee of College of pharmacy/Al-Mustansiriyah University.
Acknowledgment: The authors would like to thank Al-Mustansiriyah University (www. uomustansiriyah.iq), Baghdad, Iraq, for its support in the present work.
References
1- Cheng G, Hao H, Xie S, Wang X, Dai M, Huang L. Antibiotic alternatives: the substitution of antibiotics in animal husbandry. Front Microbiol 2014; 5:217
2- Fraise AP, Wilkinson MA, Bradley CR, Oppenheim B, Moiemen N. The antibacterial activity and stability of acetic acid. J Hosp Infect 2013 84:329–331.
3- Bjarnsholt, T et al. 2015.ADVAntibiofilm Properties of Acetic Acid.Ances in wound care, 4(7).
4- Cortesia C, VilchèzeC et.al. Acetic acid, the active component of vinegar, is an effective tuber
culocidal disinfectant 2014; 5(2)5- Nagoba BS, Selkar SP, Wadher BJ, Gandhi RC.
Acetic acid treatment of pseudomonal wound infections—a review. J Infect Public Health 2013; 6: 410–415.
6- Nagoba B, Wadher B, Kulkarni P, Kolhe S. 2008.Acetic acid treatment of pseudomonal wound infections. Eur J Gen Med 2008; 5(2):104-106.
7- Trzaska WJ, Correia JN, Villegas MT, May RC, Voelz K. 2015. pH manipulation as a novel strategy for treating mucormycosis. Antimicrob Age Chemother 2015; 59:6968 –697
8- Magda R, Ferreira A, et.al. 2010.Development and Evaluation of Emulsions from Carapaguianensis(Andiroba) Oil. AAPS PharmSciTech 2010; 11(3): 1383–1390.
9- Shankar R, et al. Formulation and evaluation of nanoemulsion for solubility enhancement of ketoconazole. International Journal of Research in Pharmaceutical and Nano Sciences 2015; 4(6): 365 - 378.
10- Okochi, H. and M. Nakano. Preparation and evaluation of w/o/w type emulsions containing vancomycin. Advanced drug delivery reviews 2000;45(1): p. 5-26
11- Juma IM, Yass HS, Al-Jaberi FS.A comparison between the effect of acetic acid and salicyclic acid in different concentrations on Pseudomonas aeruginosa isolatedfrom burn wound infections 2006
12- Rasamiravaka, T. et.al. 2015. The Formation of Biofilms by Pseudomonas aeruginosa: A Review of the Natural and Synthetic Compounds Interfering with Control Mechanisms. Bio Med Research International 2015; 1:1–17.
13- Al-Ibran E, Khan M.2010.Efficacy of topical application of 1%acetic acid in eradicating pseudomonal infections in burnwounds. Journal of the Dow University of Health Sciences 2010;4:90-3.
14- Roe A J, O’Byrne C, Mclaggan D. and Booth I R. Inhibition of Escherichia Coli growth by acetic acid :a problem with methionine biosynthesis and homocysteine toxicity. Microbiology 2002; 148:2215-2222.
15- Booth I R. Regulation of cytoplasmic PH in Bacteria.MicrobiolRev 1995; 49 :359-378.
Evaluation the Effects of Incorporation of Silver Nitrate on Some Mechanical Properties of Soft Liner Materials
QussayAbdl-Latif Hassan1, Israa Mohammed Hummudi2
1Ministery of Health; 2 Department of Prosthodontic Technologies, College of Health and Medical Technologies-Middle Technical University, Baghdad-Iraq
Abstract
Background:- Soft liners placed in dentures have been used as carrier for antifungal drugs in treating denture stomatitis.The aim of this study is to evaluate the effect of incorporated of silver nitrate in different volume into acrylic soft denture liner and to assessment the effect of these additions on some mechanical properties.
Materials and methods: One hundred and twenty (120) specimens were prepared from heat cure soft liner material and divided into three groups according to the test that carried out. Forty specimens for each (hardnesstest, compressive strength test, water sorption and solubility test) . Then each test subdivided into four subgroups according to the volume of the silver nitrate solutionincorporation. Controlgroup which have ten specimens without incorporation of silver nitrate and experimental groups which have thirty specimens with incorporation of( 0.05ml ,0.1 ml and 0.2 ml) of silver nitrate solution. All specimens were constructed as in conventional method then stored in distilled water for seven days be ready for measurement.
Findings:- The results of this study showed that highly significant increase in the hardness tested groups also compressive strength group at 0.1 ml of silver nitrate incorporation while significant decrease in 0.05 and 0.2 ml groups.Watersorption and solubility showed that highly significant increase in all volumes of silver nitrate incorporation groups.
Conclusions:- Silver nitrate incorporation was significantly increases the hardness of soft lining material while Compressive strength was significantlyincreased after incorporation of 0.1 ml of silver nitrate .The incorporation of 0.05 and 0.2 ml of silver nitrate to soft liner material significantly was decreased. Regarding water sorption and solubility were significantly increased after incorporationof silver nitrate to soft lining material in all experimental groups.
Keyword: silver nitrate, soft lining material, hardness, water sorption and solubility
Introduction
Soft lining materials are able to form an absorbing layer on the part of the denture in contact with oral mucosa and this allow less traumatic transmission of occlusal forces(1).Soft liners are often used for patients who cannot tolerate a conventional denture base (2).Disinfection of denture base materials(3) as well as denture liners was recommended as a methods of reduction in the microbial contamination or growth and reduces oral infection as well as cross contamination(4).Silver is well known for its antimicrobial activity against different positive and Gram- negative fungi and certain
viruses(5), and recently the antimicrobial properties of nanoparticles have drawer attention of researchers(6). Smaller particle size results in greater surface area to volume ratio, which enhances its chemical and biological activity(7). Silver ions have been reported to inactivate important enzymes and affect the application mechanism of the DNA in bacteria .It has been reported to attach to the outer membrane and affect the permeability as well as induce structure changes in the cell –ultimately leading to cell death .In addition ,silver does not cause resistant bacterial strains to develop(8).The incorporation of silver–supported antimicrobial agent into denture base materials to investigate the distribution and to study

1828 Indian Journal of Public Health Research & Development, November 2019, Vol. 10, No. 11
the release mode of silver ions from the base(9).In this study silver nitrate used by three volume (0.05ml,0.1ml and 0.2 ml) were incorporated into acrylic based soft denture liner to evaluate whether this addition would significantly affect some of properties of the soft lining material such as hardness, compressive strength, water sorption and solubility test.
Materials and Method
Preparation of silver nitrate solution, 0.1 N silver nitrate preparations:
_Normality (N) =weight/equivalent weight×1/volume by litter
_Equivalent weight =molecular weight/valance
_Molecular weight of silver nitrate=169, 8731.
_Valance of silver nitrate =1.
_N=16.990/169,8731×1/1=0.10001584=0.1N
Taken (16.990±0.0001 g) silver nitrate is electronic balance. 1litter of purified water is poured into the light –proof glass bottle. The solution is prepared by pouring the pre-scaled silver nitrate into purified water; the solution prepared between 6 to 10 minutes is diluted by mixing(10,11).
Specimens grouping:-
One hundred and twenty (120) specimens were prepared from heat cure soft liner material (Vertex) to be used in this study and divided into three groups according to the test that carried out.Forty specimens for hardness test, forty specimens for compressive strength test and forty specimens for water sorption and solubility. Then each test subdivided into four subgroups according to the volume of the silver nitrate solution incorporation (0, 05 ml, 0.1ml and 0.2 ml) .Each have ten specimens.
Hardness test specimens:
A soft liner disk with the dimension of (30mm diameter, 3mm thickness)(12, 13) was used for hardness test.
Incorporation of silver nitrate with soft liner material :-
The resilient lining liquid was added to the powder and the material was mixed in accordance to
the manufacturer instructions, the volume of the silver nitrate and liquid that had been added to the monomer of soft liner was taking into account and subtracted from soft liner monomer volume to achieve correct P/L ratio.
The soft liner dough was packed as a conventional method. Curing was done as instructed by manufacturer (heating up to 70 Cᴼ and kept for 90 minutes then the temperature was raised up to 100c and kept for 30 minutes)(14). A sharp blade was used to remove all the excess materials, fine grit sand paper and fine grit silicone polishing bur was used to remove the flashes .Then the specimens placed into the distilled water for seven days in the incubator at 37C◦(15).
Testing procedure:-
The shore adurometer was used to measure soft liner hardness specimens .The testing value was taken as an average of different reading that were taken directly from the scale reading of durometer by using pointed dibbing tool.
Compressive strength specimens test:
A metallic molds with thickness of (12.7mm in diameter and 19mm in length was constructed for compressive strength test (16).
Testing procedure:
The specimens were subjected to compressive strength load by using compressive strength test machine. The specimens were subjected to the load with cross head speed of 0.5 mm/minute using load cell with maximum capacity 250N according to the following formula:-
Compressivestrength =F/A=(MPa)
F: Maximum load A: Cross section area
Sorption and solubilityspecimens test:-
A metallic molds of (50±1mm diameter and 0.5±0.05mm thickness) were made for sorption and solubility test (17).
Testing procedure:
After processing and finishing, all disc –shaped specimens were dried in a desiccators containing dried silica gel.The desiccators stored in an incubator at 37 c± 2c for 24 hours, after that the specimens were removed at

Indian Journal of Public Health Research & Development, November 2019, Vol. 10, No. 11 1829
room temperature for one hour, and then weighted with digital electronic balance. This cycle was repeated until constant weight was determined. This was considered to be the initial weight (W1). The specimens were immersed in distilled water for 7 days at 37 0C ±20C .After this period of time ,each disc was removed from the water with tweezers ,wiped with clean, dry hand towel until free from visible moisture ,waved in the air for 15 seconds and weighed one minute after removal from the water .This weighted represents (W2).After that
the specimens dried by the desiccators and they were weighted every 24 hours until a constant weighted (±0.5 mg) wasobtained, this weighted represents (W3). Water sorption and solubility measured as a relative sorption and solubility in (mg/cm2).Calculations were made according to the following formulae:
Sorption (mg/cm2) = w2-w1 /surface area.
Solubility (mg/cm2) = w1-w3/surface area.
Findings
Hardness test:
Table (1) showed that majority mean value are accounted in (0.2 ml) group while low level are recorded in control group,
Table (1): Descriptive statistics for hardness test
Groups No. Mean N/mm S.D. S.E.
95% C.I. for MeanMin. Max.
L.B. U.B.
Control 10 91.590 2.660 0.841 89.687 93.493 88.7 95.1
Silver nitrate 0.05 ml 10 95.200 0.759 0.240 94.657 95.743 93.9 96.2
Silver nitrate 0.10 ml 10 97.680 1.326 0.419 96.732 98.628 95 99.4
Silver nitrate 0.20 ml 10 101.070 2.555 0.808 99.242 102.898 97.8 106
Table(2) Games Howell (GH) test observed that most comparisons are accounted highly significant differences at “P<0.01”, and significant different at” P<0.05” between 0.1 ml, and 0.2ml groups.
Table (2): (Pair wise Comparisons) by “GH” test for hardness test
Group(I)
Group(J)
Statistics
Mean Diff.(I-J)
Sig. (*) critical values
Control
Silver nitrate 0.05 ml -3.610 0.009 2.655
Silver nitrate 0.10 ml -6.090 0.000 2.752
Silver nitrate 0.20 ml -9.480 0.000 3.297
Silver nitrate 0.05 mlSilver nitrate 0.10 ml -2.480 0.001 1.400
Silver nitrate 0.20 ml -5.870 0.000 2.553
Silver nitrate 0.10 ml Silver nitrate 0.20 ml -3.390 0.011 2.657

1830 Indian Journal of Public Health Research & Development, November 2019, Vol. 10, No. 11
Compressive Strength test
Table (3) showed that majority mean value accounted with (0.1ml) group, while low level are recorded with (0.05ml) group.
Table (3): Statistics for compressive strength test
Groups No. Mean S.D. S.E.95% C.I. for Mean
Min. Max.L.B. U.B.
Control 10 1.945 0.054 0.017 1.906 1.983 1.882 2.056
Silver nitrate 0.05 ml 10 1.440 0.104 0.033 1.365 1.514 1.265 1.582
Silver nitrate 0.10 ml 10 1.977 0.140 0.044 1.877 2.077 1.74 2.215
Silver nitrate 0.20 ml 10 1.459 0.085 0.027 1.399 1.520 1.344 1.582
Results of Games Howell test show highly significant differences except comparison between 0.1ml and 0.2ml groups which reported no significant different at” P>0.05” as shown in table(4).
Table (4): Pair wise Comparisons by (GH) test for compressive strength test
Group(I)
Group(J)
Statistics
Mean Diff.(I-J)
Sig. (*) critical values
Control
Silver nitrate 0.05 ml -1.105 0.000 0.352
Silver nitrate 0.10 ml -0.796 0.000 0.354
Silver nitrate 0.20 ml -0.755 0.000 0.375
Silver nitrate 0.05 mlSilver nitrate 0.10 ml 0.308 0.000 0.085
Silver nitrate 0.20 ml 0.349 0.002 0.200
Silver nitrate 0.10 ml Silver nitrate 0.20 ml 0.041 0.932 0.205
Water Sorption & Solubility test
Table (5) shows that high mean value are accounted in group with (0.05 ml) while low level are recorded within controlled group.

Indian Journal of Public Health Research & Development, November 2019, Vol. 10, No. 11 1831
Table (5): statistics for Water Sorption & Solubility test
Groups No. Mean S.D. S.E.95% C.I. for Mean
Min. Max.
L.B. U.B.
Control 10 3.095 0.356 0.113 2.840 3.349 2.4 3.6
0.05 ml 10 4.199 0.040 0.013 4.171 4.228 4.1 4.3
0.10 ml 10 3.891 0.082 0.026 3.832 3.950 3.7 4.0
0.20 ml 10 3.850 0.202 0.064 3.706 3.994 3.6 4.3
Games Howell method shows highly significant differences at P<0.01, except comparison between 0.1ml and 0.2ml groups which reported no significant different at P>0.05 as shown in table (6)
Table (6): Pair wise Comparisons by (GH) test
Group(I)
Group(J)
Statistics
Mean Diff.(I-J)
Sig. (*) critical values
Control
Silver nitrate 0.05 ml -1.105 0.000 0.352
Silver nitrate 0.10 ml -0.796 0.000 0.354
Silver nitrate 0.20 ml -0.755 0.000 0.375
0.05 mlSilver nitrate 0.10 ml 0.308 0.000 0.085
Silver nitrate 0.20 ml 0.349 0.002 0.200
0.10 ml Silver nitrate 0.20 ml 0.041 0.932 0.205
Discussions
Hardnesstest:-
The results of this study showed high significant increase in the mean value of hardness for experimental groupsas shown in table (1), This findings can be explained by the fact that added silver nitrate into soft liner material may effect to the plasticizer ability for softening gel formation and its ability for polymeric chains penetration, it may act fillers that increase soft liner hardness and resistance when bonded inside it, silver nitrate may act fillers that increase or decrease soft liner hardness and resistance when dispersed inside it. And high significant increase mean value of hardness for silver nitrate groups could be the result of insufficient water absorption by these groups during the elongation and higher hardness value for specimens is explained by
the incorporation of silver nitrate into soft liner material which may increase stiffness and reduce the flow of the material under load (14). This explanation is in agreement with the work of others which showed the hardness significant increased as the result of leaching plasticizer with time for soft liner material by antifungal drugs (18).
Compressive strength:-
Denture bases would have a superior cushioning effect during occlusion and mastication .Many of these forces are compressive in nature ,and therefore effect of compression load on the test materials must be evaluated. In the methodology of this research ,determination of the compressive strength of the experimental material in compression with the control material was established ,the material were prepared in a cylindrical discs . During testing compressive load continued to compress

1832 Indian Journal of Public Health Research & Development, November 2019, Vol. 10, No. 11
cylindrical discs, this design of testing is simulating in a degree compressive load during function of occlusion or mastication (12). Statistical analysis showed high significant differences regarding ultimate compressive strength and deflection value .Higher compressive strength value recorded by the experimental material may give an indication of the rigidity in comparison with control material. Silver nitrate that is recorded by the experimental material indicated more rigid properties. By this study, the ultimate compressive strength as will showed that the compressive strength of the experimental material is significant high in (0.1ml) concentration than that of the control group material (table 3).The lower deflection value recorded by the experimental material indicated more rigid properties, this is attributed to the presence of silver nitrate polymer which made the experimental material more rigid. The compressive strength of the experimental material is high significant increase after 0.1ml concentration showed that of control material, but 0.05-0.2ml is high significant decrease with the control group (table 4). Lower compressive strength value recorded by the experimental material give an indication that the silver nitrate reduced water sorption and gave more rigidity to the experimental material in comparison with control material. This study is agreement with others work that showed reduce the molecular binding force between the reactant molecules and allows greater deformation upon stretching or flexion through exhibiting multiple micro fracture that weaken the silver nitrate loaded resin samples(19).
Water sorption and solubility:-
The results of sorption test showed that an increase in the mean value of soft liner material after incorporation with silver nitrate (table 5). This result obviously is due to leaching out of water –soluble ingredients, residualmonomer ,plasticizer and initiators from the soft liner in addition to silver nitrate ,during immersion in distilled water ;as a result there will be more micro porosity which will be eventually filled by water (20). The findings of this study was done by incorporation of silver nitrate into soft liner material result high significant increase in mean value compare with control group( table 6).The chemical interact between soft liner material and silver nitrate explain the high water sorption of soft liner material after addition silver nitrate this is in agreement with the other work who suggested that variation in chemical composition
could create some of structural spaces that might lead to higher water up take(21) .
Conclusions
Silver nitrate incorporation was significantly increases the hardness of soft lining material..
Compressive strength was significantlyincreased after incorporation of 0.1 ml of silver nitrate while incorporation of 0.05 and 0.2 ml of silver nitrate significantly was decreased.
Water sorption and solubility were significantly increased after incorporationof silver nitrate in all experimental groups.
Conflict of Interest: No
Source of Funding: Self
Ethical Clearance: No
References
1- Brozck R,KoczorowskiR,Royulewice R, VoelkelA,CzarnekaB,NicholasonJW.:Effect of denturecleansers on chemical and mechanical behavior of selected soft lining materials .Dent Mater.J 2011;27(3):281-90.
2- Sarac D,Saracys,KurtM,YazbasiogluE.:The effectiveness of denture cleansers of soft liners coloredby food colorant solutions.JProsthodont 2007:16(3):185-91.
3- Rasheed AH.:Disinfection of acrylic resin cured by two different techniques.Master thesis ,Collage of Dentistry.Baghdad University1997.
4- Yilmz H,AydinC,BalBJ,OcakE.:Effect of different disinfectant on physical properties of four temporary soft denture liner materials.Quintessence Int.2004:35(10);826-43.
5- Balazs D.J.,TriandonF.K.,Wood P.,ChevolotY.:”Inhibition of bacterial adhesion on PVC endotracheal tubes by RF-oxgen glow dischange,sodium by droxide and silver nitrate treatments”.Biomaterials.2004;25:213-51.
6- Rai M.K., DeshmukhS.D., IngleA.P.andGadeA.K:”Silver nanoparticles :the powerful nanoweapon against multidrug –resistant bacteria”.J.of Applied Microbiology 2012;112 :841-852.

Indian Journal of Public Health Research & Development, November 2019, Vol. 10, No. 11 1833
7- Pal S.,TakY.K.,SongJ.M.:”Does the antibacterial activity of silver nanoparticles depend on the shape of the nanoparticles –A study of the Gram –negative bacterium Escherichia coli.”Applied and Environmental microbiology .”2007;73:1712-1720.
8- Russell D.M.:”In vitro staining of denture liners and potential for color correction using commonly available denture cleanser”.A master thesis Health Science Center.University of Tennessec.2012.
9- Casemiro L.A.,Gomes Martins G.H.,Panzeri F.C.,Pires-de-Souza,PanzeriH.:”Antimicrobial and mechanical properties of acrylic resin with incorporated silver –zinc zeolit-part one Gerodontology.2008;25:187-194.
10- Kamalak h.,UmerI.,:”The use and effect of silver nitrate in Dentistry “.IOSR Journal of dental and medical science.2014;1:89-91.
11- Al-Husayni O.K “Effect of silver nitrate incorporation into heat polymerized acrylic resin on bacterial activity and some mechanical properties”.A master thesis,Department of prosthodontics .College of Dentistry .University of Baghdad2013.
12- Hussein BMA,Ismail IJ ,Khalaf H A.:”Effect of some disinfectant solutions on the hardness property of selected soft denture liners after certain immersion period”.J.Fac Med Baghdad.2009;51(3):259-264.
13- Safari A.,M.Vojdani ,S. Mogharrabi ,N. IrajiNasrabadi and R.Derafshi:”Effect of beverages on the hardness and tensile bond strength of temporary acrylic oral Rehabil 2012 ;37:194-201.
14- Issa MI,Abdul-Fattah N.:”Evaluating the effect of silver nanoparticles incorporation on antifungual activity and some properties of soft denture linningmaterials.JBagh collage dentistry”.2015;vol 27 (2) pp15-23.
15- OzenAUgurural ,Mehmet Dalkiz,andBedriBeydemir .:”The effect of impregnation methods on the cytotoxicity of a glass and carbon fiber –reinforced acrylic resin denture base material on oral epithelial cells and fibroblasts .J Prosthetic Dentistry”.2006; vol.33,Issue 9 ,PP:666-673.
16- Al_Kadi FKA.:”Effect of thermocycling on some properties of soft denture liners.”Master thesis .Department of prosthodontics .College of Dentistry.University of Baghdad 2004.
17- American National Stanrdard/American Dental Association Specification No.12 for Denture Base Polymers .Chicago:Council on Dental Material and Devices,1999.
18- Vanessa FO,Raphael FS, Claudia HS. “Effect of aging and immersion in different beverage on properties of denture lining materials”JAppl Oral Sci.2010;18(4):372 78.
19- JaggerR.G.:”Effect of curing cycle on some properties of a polymethyl methacrylate denture base material .”J.OralRehabil .1987,5:151-157.
20- Waters M.G.,Jagger R.G. and Winter R.W.:”Water sorption of RTV silicone denture soft lining materials.”J.Dent .1996,24(1-2):105-108.
21- Mavani K. And Shah M.:”Synthesis of silver nanoparticles by using sodium borohydride as a reducing agent .”IJERT 2013;2(3):1-5

Evaluation of Transaminases,Total Bilirubin and Ferritin in Iraqi Thalassemia Patients
KhetamHabeeb Rasool1, NadheemaHammood Hussein1, Butheina M. Taha1
1Department of Biology,College of Science, Mustansiryah University/Baghdad-Iraq
Abstract
Background:Thalassemia is a hereditary disease which characterize by a severe form of anemia occurring early in life associated with splenomegaly and bones changes.
Aim: The aim of this study was to evaluate the serum levels of ALT (Alanine transaminase),AST (Aspartate transaminase),bilirubin and ferritin in Iraqi β-thalassemia patients.
Subjects and Method: Fifty Iraqi patients diagnosed clinically by hematology doctors as β-thalassemia major(TM) were enteredin this study, they conducted to Ibn AL-Baladi hospital/Baghdad during the period from December, 2017 to march, 2018.The age ranges of patients were (6-36) years,twenty healthy age match were used as control group( Cot). Blood samples (3-5) ml, were collected from the two groups under study TM and control group.Serum was separated, drawn in two plane test tubes, and kept frozen (-20 ◦c) till the use. Ferritin levels were measured by using Ferritin (Kit Ref 04491785 of cobas e 411 analyzer) according to the manufacturing company. Total Serum Bilirubin concentration(TSB),Transaminases (GOT&GPT)activity were also measured by colorimetric methods, according to ELITech kit,Ref. BITO-0250 France for Bilirubin,and according to ELITech kit,Ref.ALSL-0455 France, for Transaminases/ France,using flexor 150 apparatus.
Findings: Results indicated that serum GOT and GPT were significantly elevated in TM patients (47.560 ± 30.472) U/L and (58.755± 5.369) U/L respectively in comparisons to their levels in the control group (19.940 ±9.427) U/L and (8.231 ± 3.830) U/L respectively,also a significant increase in serum Ferritin concentration (2668.±1775.436) ng/dl in TM patients in comparison with control group (31.000±4.735) ng/dl,with an elevated levels in mean value of serum TSB in thalassemia patients (34.76 2 ± 18.526) in comparison to control group (8.231 ± 3.830) .
Conclusion:Increase ALT (Alanine transaminase), AST (Aspartate transaminase), bilirubin and ferritin inthalassemiapatients may refer to liver dysfunction.
Keywords: Beta thalassemia major (TM), ALT (Alanine transaminase), AST (Aspartate transaminase), bilirubin and ferritin.
Introduction
Thalassemia is a form of inherited autosomal recessive blood disorder which it characterized by abnormal formation of hemoglobin[1]results in the adequate oxygen transport and the destruction of red blood cells inthe bone marrow (ineffective erythropoiesis) and the peripheral circulation (hemolysis)[2]In normal cases,most of adult hemoglobin (HbA) is consist of 4 protein chains, two α and two β globin chains which
arranged in a hetero- tetramer. Thalassemia patients have defects in either the α or β globin chain, causing production of an abnormal red blood cells[3]due tothe variant or the missing genes that affect hemoglobin(the protein in red blood cells that it carries oxygen) synthesis.The people with thalassemia have less hemoglobin and also have fewer circulating red blood cells than normal which result in mild or sever microcytic anemia[4]. Thalassemia word was derived from the Greek word thalaswhich means sea and emiathat stands for the blood

Indian Journal of Public Health Research & Development, November 2019, Vol. 10, No. 11 1835
anemia, indicating its prevalence in the regions around the Mediterranean Sea[5].For many patients who they were with chronic anemia,regular blood transfusions have affectively extended life suspense in thalassemia major patients [6]Blood transfusions contain red cells that reach the end of their life due to the aging or defects they are broken down, and then hemoglobin molecule broken up and the iron recycled. Humans are unable to eliminate the excess iron and regulate the body iron stores by limiting absorption [7]
Too much iron in the body of human is called iron overload [5]Iron was transported as transferrin to the liver or the spleen where it was stored as ferritin[8].Serum ferritin levels were measured in patients as a part of the iron studies workup for the anemia. Ferritin is also used as a marker for the iron overload disorders, such as hemosiderosis, hemochromatosis and porphyria in which ferritin level may be abnormally raised[9]
Iron accumulation (ferritin) in the liver and the heart worsening of hepatic fibrosis, and development of the cardiac fibrosis [10]
Beta-thalassemia major patients suffer from many problems rather than severe anemia including; increased susceptibility to bacterial infections which plays the major role in the patient’s morbidity and mortality[11]
Degradation of the hemeafter 120 days in the circulation to produce the green pigment biliverdinand the bilirubin. Bilirubin binding to the albumin and enters a hepatocyte then excreted to the bile.Bilirubin can be measured as direct or conjugated. Sometimes, total amount of the bilirubin in the blood measured [12]
Alanine Transaminase (ALT) which called also serum glutamate -pyruvate transaminase (SGPT). Alanine Transaminase is present in high concentration in the liver lesser extent in skeletal muscle, heart and kidney[13], measurement the activity of ALT in serum is used as an indicator of hepatocellular damage [13]
Aspartate Transaminase (AST) enzyme is called also glutamate oxaloacetate transaminase (SGOT), which present in high concentration in the following organs: heart, skeletal muscle, liver, kidney and erythrocytes[14]
The damage to any of these tissues may be result in the increased plasma AST [15].
The study was aimed to determination of serum transaminase (ASOT, GPT), ferritinand the total serum bilirubin levels in β-thalassemia patients receiving
multiple blood transfusions.
Materials and Method
Subjects
Fifty Iraqi patients of both sexes (28 male and 22 female)which were diagnosed clinically with β-thalassemia major were participated in the present study, they conducted to Ibn AL-Baladi hospital during the period extended from December,2017 to March, 2018. Their age ranges were (6-36) years old; all the patients were having chelating therapy (desferrioxamine). Twenty healthy age match were used as a control group.
Samples collection
Blood samples (3-5) ml, were collected from the patient group and healthy control group, left to stand for an hour then centrifuged(2500r pm) for fifteen minutes . Serum was separated, drawn in two plane test tubes, and then kept frozen (-20 ◦c) till the testing day.
Determination of serum ferritin levels
Ferritin levels were measured by using Ferritin Kit Ref 04491785 of cobas e 411 analyzer according to manufacturing company (Roche Diagnostic).
Determination of serum liver function
Total Serum Bilirubin concentration (TSB),Transaminases (GOT&GPT)activity and Creatinine were measured by the colorimetric methods,according to the ELITech kit,Ref. BITO-0250 for Bilirubin,and according to the ELITech kit,Ref. ALSL-0455, for Transaminases, and according to the ELITechkit. Ref, CRCL-0250 France for Creatininedetermination,by using flexor 150 apparatus.
Statistical Analysis
Statistical analyses for this study done by using Microsoft office (SPSS version 10.01). The data were present as mean ±SD. Alsothe t-test for two independent means, P value 0.05 levels or less considered as a significant result.
Finding and discussion
In this study Fifty Iraqi patients were diagnosed clinically with the β-thalassemia major wasparticipated, they conducted to the Ibn AL-Baladi hospital during the period extended from December, 2017 to march, 2018.

1836 Indian Journal of Public Health Research & Development, November 2019, Vol. 10, No. 11
Their age ranges were (6-36) years old; twenty healthy age match persons were used as a control group.
About (3-5)ml of the blood were collected from the two groups,and serum was used for the detections of transaminase [Glutamic Oxaloacetic (GOT),Glutamic Pyruvic Transaminase (GPT)]Total Serum bilirubin and the ferritin levels in both groups.
Table (1) showed findings of Ferritin,total serum bilirubin, and transaminase expressed as mean ±SD in 50 patients with the major thalassemia(TM) and 20 control group(Cot). As seen in Table(1)and figure (1) there was
a significant increase in the serum Ferritinconcentration (2668.±1775.436) ng/dl in TM patients in comparison with the control group(31.000±4.735) ng/dl,(P≤0.05).
TSB titers were elevated in the TM patients(34.76 2 ± 18.526) mm/l compared with the control group(8.231 ± 3.830)mm/l,(P <0.001) table(1)and Figure (2).
Serum GOT and GPT were significantly elevated in the TM patients(47.560 ± 30.472)U/L and (58.755± 5.369)U/L, respectively in comparisons to their levels in the control group(19.940 ±9.427)U/Land (8.231 ± 3.830)U/L respectively,Table (1), Figure (3) and Figure (4).
Table (1):Mean±SD values of serum ferritin,TSB,GPT and GOT in β the thalassemia patients group (TM), and the control group (Cot).
ParametersCot(I)Mean±SD
TM(II)Mean±SD
p-value
Ferritin ng/dL 31.000±4.735 2668.880±1775.436 ˂0.001
TSB mm/L 8.231 ± 3.830 34.76 2 ± 18.526 <0.001
GPT U/L 17.600 ± 4.654 58.755± 5.369 0.0147
GOT U/L 19.940 ±9.427 47.560 ± 30.472 0.0065
TSB=Total serum bilirubin, Glutamic Oxaloacetic (GOT),Glutamic Pyruvic Transaminase (GPT).
From FigureS (1),(2), (3) and (4) we showed that the highly significant differences in TSB,GOT,GPT and serum Ferritin between the β-thalassemia infected group and the control group.
Figure -1: Mean differences of Total serum bilirubin(mm/L)between the thalassemia infected patients and the control .
Figure-2:The mean differences of serum GOT (U/L)in the thalassemia infected patients and the control .

Indian Journal of Public Health Research & Development, November 2019, Vol. 10, No. 11 1837
Figure -3:The differences of GPT value (U/L) in the normal and the thalassemia patients expressed as Mean±SD.
Figure -4: Mean value of serum ferritin level(ng/dl) inthe β-thalassemia patients and the control.
The findings showed significant increase (p<0.05) inthe ferritin levels ofthalassemia patients comparing with the healthy control group. Iron initially stored as ferritin, is deposited in organs as hemosiderinwhich is toxic to the tissue.Most humans avoid iron overload solely by regulating the iron absorption. Those who cannot regulate the absorption well enough get complaints of iron overload. In these diseases, the toxicity of the iron destroyed the body’s ability to bind and store iron. Patients with thalassemia major accumulate body iron over time as a consequence of the continuous red blood cell transfusions which cause endocrine, hepatic and cardiac complications [16,17,18]. all of these studies are associated with the current study results.
The total bilirubin level measured sum of direct bilirubin and indirect bilirubin, when the total bilirubin level increased this indicted that increased both or only one of them [19]. Bilirubin, is the first point that helps tothe recognized jaundice,hemolysis induces deposition of the bilirubin causing intrahepatic cholestasis and the cholelithiasis[20,21]. This study had demonstrated a higher mean value of TSB in the thalassemia patients (34.76 2 ± 18.526) in comparison to its value in the control group(8.231 ± 3.830).These findings were disagreed with another study done by Chakravartiet.al, 2005 [22]. which found that the bilirubin levels were not significantly
altered in these patients. The study findings were similar to the other findings reported by Sarkis, (2000)[23]. who stated that there was a higher mean value of the total serum bilirubin and a highly significant difference between the patients with HCV positive andthe patients with HCV seronegative.
The study results had demonstrated that the mean value of GPT, was (47.560± 30.472)U/L in the thalassemia patients, compared to (19.940 ±9.427)U/L in the control cases,and the difference statistically was significant (P˂0.002). This was compatible with the other studies Wanachiwanawinet.al, 2000 [24]. which reported that the thalassemia patients had significantly abnormal level of the serum GPT.
Shindoet.al,1995 [25]. found that patients of anti-HCV positive who have elevated serum GPT level are more likely to have a significant liver disease than those who have normal level of serum GPT. Serum GPT elevation in anti-HCV positive individuals suggests the presence of the liver damage such as viral replication [25]. and iron overload .The study results have also demonstrated that there was significant difference in the GOT between the patients and the control group this findings was similar to Al Hawsawi,2000 [26] found that there was a highly significant difference in the GOT level between thalassemic patients with HCV seropositive and patients with HCV seronegative.
The thalassemic patients have a greater risk of liver damage (as indicated by the elevated aminotransferase and the serum bilirubin) compared to the control groups [27]. probably resulting from the infection, cholestasis, hemosiderosis or as a result of congestion due to the heart failure.
In addition, seropositive thalassemic patients have significantly higher levels of the aminotransferase enzymes and the serum bilirubin. This can be explained either by direct damage of the hepatocyte by viral invasion or by the development of an immune complex. Consequently it is necessary in these patients to measure the aminotransferase levels monthly for six months; if there is persistent elevation, it should be to considered as chronic hepatitis and liver biopsy is indicated[28].
Conclusion
Our results showed significant increase in the ferritin levels with higher mean value of TSB and GPT of thalassemia patients comparing with the healthy

1838 Indian Journal of Public Health Research & Development, November 2019, Vol. 10, No. 11
control group.
Acknowledgement: The authors would like to thank Mustansiriyah University ( www.uomustansiriyah.edu.iq) Baghdad, Iraq for its support in the present work.
Conflict of Interest: Nil
Source of Funding: Self
Ethical Clearance: All experiments were carried out in accordance with approved guidelines.Experimental protocols were approved under the Biology Department, College of Science, Mustansiriyah University, Iraq and
References
1. Noguchi, C.T.;Butterwoth, J.R.;Karawajew, L.;Kuppers, R.;Favaloro, E. and Jacobsohn, D. Haematologica; 2004. 89: 1281-1283.
2. Lanzkowsky, P. “Pediatrichematolohy and Oncology” 3rd ed. Academic Press,2000. PP.182-193, 305-306.
3. Baig, S. M.; Azhar, A.; Hassan, H.; Baig, J. M.; Aslam, M. and Aminud-Din, M. Prenatal diagnosis of β-thalassemia in Southern Punjab, Pakistan. Prenat Diag. 2006. 26: 903-905.
4. Eleftheriou, A.ABOUT THALASSEMIA. Team up Creations Ltd. Nicosia – Cyprus.2003.
5. Cheema, A. N. and Dilshad. A. K. Detection of hepatotoxicity by non-transferrin bound iron in beta-thalassemia major. Intern J Pathol.2011. 9: 10-14.
6. Hider, R. C. and Kong, X. “Chapter 8. Iron: Effect of Overload and Deficiency”. In Astrid Sigel, Helmut Sigel and Roland K. O. Sigel. Interrelations between Essential Metal Ions and Human Diseases. Metal Ions in Life Sciences. 13. Springer.2013. pp. 229–294.
7. Stefano R. Ineffective erythropoiesis and thalassemias. Curr Opinion Hematol. 2009;16:187- 94.
8. Beutler, E.;Hoffbrand, A. V. and Cook, J. D. “Iron deficiency and overload” Hematology Am Soc. Educ Program.2003. 40-61.
9. El Husseiny, N. M.; Said, E. S.; El Shahat, M. N.; Othman, A. l.Impact of Trace Element Changes on Dehydroepiandroterone Sulfate in Healthy and Diabetic States and Elderly Egyptians” Biol Trace
Elem Res. 2011.
10. Huang, Y. J.; Wu, S. G.; Ou, X. B.; Zhang, L. Changes of iron metabolism indices in children with various genotypes of thalassemia” Zhongguo Dang Dai ErKeZaZhi. 2010. 12(2):85-88.
11. Sadeghian, M. H.; Keramati, M. R.; Ayatollahi, S.; Manavifar, L.; Enaiati, H. and Mahmoudi, M. “Serum immunoglobulins in patients with iron deficiency anemia” India . Indian J Hematol Blood Transfus. 2010. 26(2):45-48.
12. Mik, F.M. “Clinical biochemistry for medical” W.B. Sunders Company Ltd.1996. PP.225-241.
13. Afzal, S.; Ahmad, M.;Roshan, A.;Mubarik, A.;Qureshi, H. andSaleem N. Morphological study of liver biopsy in thalassemia major. J Pak Med Assoc. 2004. 1. 54:415.
14. Hanif, M.;Raza, J.;Qureshi, H. andIsani, Z. Etiology of chronic liver disease in children. J Pak Med Assoc. 2004. 54:119-22.
15. De Sanctis, V.;Eleftheriou, A. andMalaventura, C. Prevalence of endocrine complications and short stature in patients with thalassemia major: a multicentre study by the Thalassemia International Federation (TIF). PediatEndocrinol Rev.2004;2(Suppl 2):249-55.
16. Asif ,M.; Manzoor Z.; Farooq M.S.; Kanwal,A.; Shaheen,U.; Munawar,S.H .et.al.Int J Res Med Sci. 2014.2(3):988-994.
17. Lekawanvijit, S. and Chattipakorn, N. Iron overload thalassemic cardiomyopathy: Iron status assessment and mechanisms of mechanical and electrical disturbance due to iron toxicity. Can J Cardiol.2009. 25(4): 213–218.
18. Galanello, R.;Agus, A.; Campus, S.;Danjou, F.;Giardina, P. J. and Grady, R. W.Combined iron chelation therapy. Ann N Y Acad Sci. 2010. 1202:79-86.
19. Patel S.A;Siddiqui, A.M.and Kareem, I.A Correlative Study of Serum Bilirubin and Liver Enzymes With Serum Ferritin In Beta Thalassaemia Major. IOSR-JDMS.2018.17(01): 62-67
20. Borgna-Pignatti C, Cappellini MD, De Stefano P, Del GC, Vecchio D, Forni GL, et al. Survival and complications in thalassemia. Ann N Y Acad Sci. 2005.1054:40-7.
21. Basim, M. A.;Furqan, M. A.; Amar, M. A.

Indian Journal of Public Health Research & Development, November 2019, Vol. 10, No. 11 1839
and Mansoor, K. A.Study the complications of accumulatediron in the tissue and glands in patients with major β-thalassemia. International Journal of Development Research.2014. 4(8), pp. 1455-1458.
22. Chakravarti, A.; Verma, V.; Kumaria, R.; and Dubey, A.P. Anti- HCV seropositivity among multiple transfused patients with beta thalassemia. Indian. Med. Assoc. 2005. 103(2): 64 6.
23. Sarkis, K.S. Prevalence of hepatitis C virus in patients with hemoglobinopathies in Basrah. Med. J. Basrah. Univ.2000. 18(1): 32 -37.
24. Wanachiwanawin, W.; Luengrojanakul, P.; Sirangkapracha, P.; Leowattana, W. and Fucharoen, S. Prevalence and clinical significance of hepatitis
C virus infection in this patient with thalassemia. Int.J.Hematol. 2003. 78(4): 374-378.
25. Shindo, M.; Arai, K.; SoKawa, Y. and Okuno, T. The viroloand histological status of antihepatitis C virus.1995.
26. Al Hawsawi, Z.M. Prevalence of HCV antibodies. Annals of Saudi. Med. 2000. 20: 5 - 6.
27. Cacopardo, B.; Russ, R.;Fatuzz, O., et al. HCV infection among multitransfusedthalassemic patients. Transfusion Med.; 1992. 2 (1): 69-70.
28. Donohue, S. M.;Wonke, B.;Hoffbrand, A. V., et al. Alfa interferon in the treatment of chronic HCV infection in thalassemia major. Br. J. Hematol.1993. 83: 491-497.

Evaluation the Effect of Black Seed Oil and Taramira Oil on the Hardness and Surface Roughness of Heat Cure Acrylic
Resin Denture base Material
Makarem Abdul-RassolJaber1Assistant Professor, Prosthetic Dental Technology Department, College of Health and Medical Technology,
Middle Technical University (MTU), Baghdad, Iraq
Abstract
Background: Separating medium is a layer of coat which is applied to a mouldsurface to avoidthe adhering the second surface to the first surface. The mould must be coated during acrylic resin processing to inhibit liquid resin from penetrating into the gypsum and water from gypsum leaking to acrylic resin. For several years, tin foil was the most acceptable separating medium, and because it’s challenging to apply a tin-foil substitute, a cold mold seal is utilized.
Objective of this study: The aim of thecurrent study was to assess the effect of black seed oil and taramira oil on surface roughness and hardness of heat acrylic resins.
Materials and Method: Sixty samples were made from the heat acrylic resins and divided into two categories (30 samples in each categories) depended on test; surface roughness and hardness, each categories contain three groups: group 1;(10) samples of heat acrylic resins treated with cold mol seal (control group), group2; (10) samples of heat acrylic resins treated with black seed oil and group3;(10) samples of heat acrylic resins treated with taramira oil. The average of the hardness of the specimens has been determined with using the Shore D hardness device¸ also the average of the surface roughness of the specimens has been determined with using profilometer device.
Findings: The results showed that there was a statistically significant difference in the hardness and non-significant difference in surface roughness of heat acrylic resinsamong the testing groups.
Conclusion: In this study concluded that black seed oil gives more hardness in comparison with cold mold seal and taramira oil; also black seed oil gives more smoothness (less surface roughness) followed by taramiraoil.It is concluded, that black seed oil and taramira oil could beutilized as a separating medium.
Key wards: Denture base,acrylic resin,black seed oil,taramira oil,cold mold seal.
Introduction
Polymethylmethacrylate (PMMA) is the most popular dental material used in the construction of removable prostheses, it is necessary to apply separating medium to the gypsum surface before packing of PMMA[1].
Separating medium is a “coat of layer applied to surface to prevent a second surface from adherence to the first surface”[2]. A layer of gypsum impregnated with polymer remains would be attached to the denture
surface If the mold surface is not separated with a separating material leading to an unaesthetic and poorly fitting denture base [3].Thus; the separating medium must be applied to the surface of the mold [4].
Many materials are used for dental stone separation; cold mold seal is one of commonly used separating medium. The literature indicated thatthe tin foil separating medium is the best, but it istime-consuming and difficult to apply. Consequently, the use of other separating medium has been developed[ 5].

Indian Journal of Public Health Research & Development, November 2019, Vol. 10, No. 11 1841
Wally in 2014[6] used olive oil and found that non-significant difference between cold mold seal and olive oil regarding tensile strength of heat acrylic resins. While Mohammed in 2014[7] studied the influence of glycerin on the hardness of heat cure resin and found that glycerin gives highly hardness than cold mold seal. Altaie et al., in 2015[3]used olive oil, tin foil and cold mold seal as separating medium and found that using olive oil not affect on hardness of heat cure acrylic resin.
The purpose of this study was to evaluate the effect of black seed oil and taramira oil as a separating medium on hardness, and surface roughness of heat cure acrylic resin denture base materials
Material and Method
Samples grouping:
60 samples were made from heat cure acrylic resin (Superacryl Plus, Colombia); Specimens were grouped into: 30 specimens made for hardness testand these where subdivided into:
*(10) samples of heat cure acrylic treated with cold mold seal (control group);
(Switzerland ).
*(10) samples of heat cure acrylic treated with black seed oil, (Kingdom Saudi Arabia),
*(10) samples of heat cure acrylic treated with taramira oil (Pakistan).
30 samplesmade for surface roughness test and these where subdivided into:
*(10) samples of heat cure acrylic treated with cold mold seal (control group).
* (10) samples of heat cure acrylic treated with black seed oil.
*(10) samples of heat cure acrylic treated with taramira oil.
Preparation of the specimens:
Two metal patterns (stainless steel)were customized into desired shape and dimension using aturning machine:
A- Surface hardness test with dimension of (65 mmx10 mm x2.5mm) length, width and thickness respectively [7], figure (1-A).
B- Surface roughness test with dimension of (80mm x 10mm x 2.5mm) length, width and thickness respectively [8],figure (1-B)
A BFigure (1):A-surface hardness test B- surface roughness test
The 2 metal pattern werelayered with separating medium.The lower part of a flask was covered with dental stone(Durguix, Spain). Once complete set of the stone surface, bothmetal patterns and stone were separated withcold mold seal. The upper part of the flask was
positioned over the lower part, andthen filled with stone. The flask was left for 60minutes, after that the upper and lower parts were opened carefully and patterns were removed.A disposable syringewas utilized to measure 2cc of separating media (cold mold seal, black seed oil and taramira oil). The measured separating medium was applied onto the stone surface by a fine brush [9]. This

1842 Indian Journal of Public Health Research & Development, November 2019, Vol. 10, No. 11
calculated.
Figure (3): Shore D hardness tester device.
The surface roughness of each specimen was measured by using profilometer surface roughness device, figure (4). The profilometer was supplied with stylus made of diamond; the specimen’s surfacewas fixed in a flat position to the base of the profilometer by glue. The stylus was moved for a distance of 1.7 mm across thesurface of the specimen in three different directions depending on apparatus design. Three reading was recordingfor each specimen, and the mean value for each specimen was the average of the reading. Then the data was collected and subjected to statistical analysis.
Figure (4): Profilometer surface roughness device
Findings
Surface hardness test:
All values of mean and standard deviation for each group is listed in table (1). The highest mean value is (79.340) for black seed oilgroup, followed by the taramira oil group which is (77.400), while the control group showed the lowest mean value (74.720), figure (5).
Table (1): Descriptive statistics test for surface hardness of studied group
Studied group N Mean SD SE Min. Max.
Control 10 74.720 1.6 80 .495 71.54 79.44
Black seed oil 10 79.340 2.196 .594 74.80 80.67
Taramira oil 10 77.400 1.540 .400 73.90 81.85
technique of applying material (cold mold seal, black seed oil and taramira oil) was repeated with all moulds of the specimens in this study.
Heat cured acrylic resin was mixedandpacked according to manufacturers instruction,and then the flask was positioned under the hydraulic pressand the pressure was applied slowly in order to make sure even flow of the acrylic dough throughout the mould space. Thenthe pressure was released and the flask was opened and the excess material (flash) was taken away. Then the two halves of the flask were finally put in contact and left under the press (1500psi) for 5 minutes. Then the flask was placed in a flask clamp.According to ADA specification, No.12 (1999), short curing cycle was conducted[10]. the flask was left to cool for thirty minutes at room temperature and then with tap water for 15 minutes. All acrylic specimens were then taken from the stone mould.
Acrylic patterns of surface roughness were cut into equal rectangular plates with an acrylic separating disk to obtain the final measurement of 20mmlength x10 mmwidthx2.5 mm thickness. Thethickness of 2.5mm represents the average thickness of acrylic denture base, while the length and width coincides for suitable measurements in the surface roughness tester [8].To remove all flashes of acrylic,the acrylic bur was utilizedfollowed by using sand paper (120 grain size)[9] in order to get smooth surface for the specimens used for hardness test. On the contrast, the specimens for surface roughness test, are not be polished.All specimens were kept in distilled water at 37Cº before testing [10], figure (3).
Figure (2) :( A): Hardness specimen. (B): Surface roughness specimen
Shore D hardness tester device (Italy) was used in this study for measuring procedure, figure5.According to the device instruction the hardness value is determined by the penetration of the Durometer indenter into the specimen. Three reading was done on different areas of each specimen and the mean of the three reading was
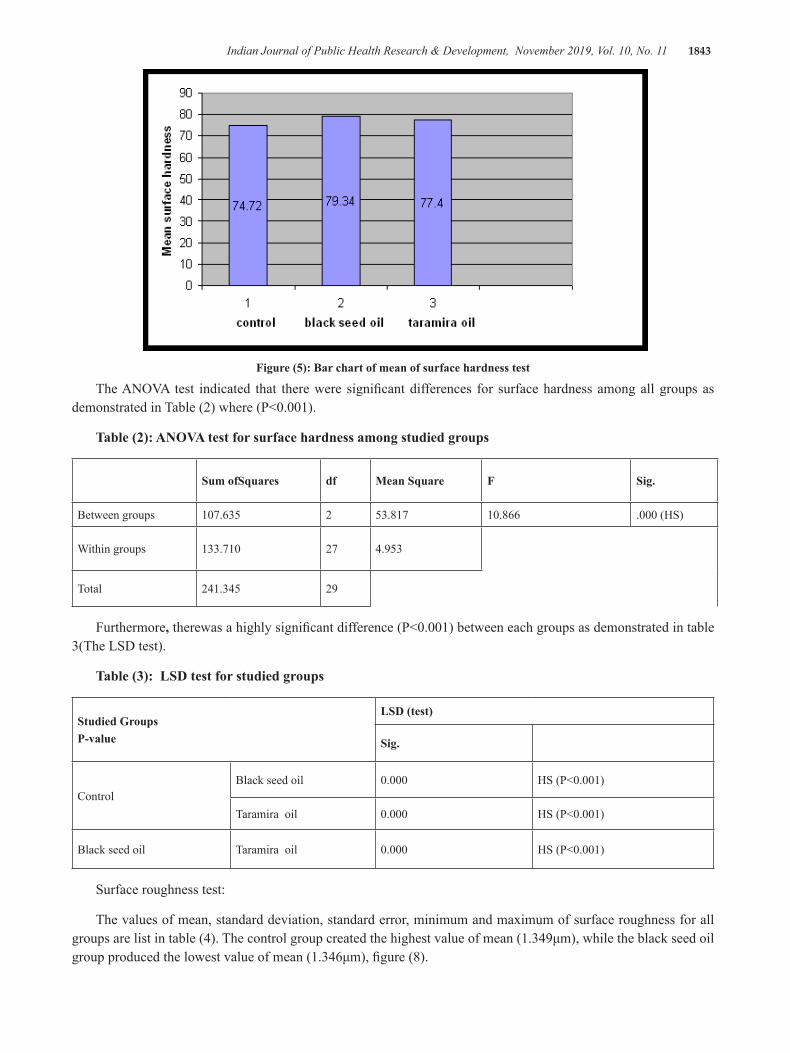
Indian Journal of Public Health Research & Development, November 2019, Vol. 10, No. 11 1843
Figure (5): Bar chart of mean of surface hardness test
The ANOVA test indicated that there were significant differences for surface hardness among all groups as demonstrated in Table (2) where (P<0.001).
Table (2): ANOVA test for surface hardness among studied groups
Sum ofSquares df Mean Square F Sig.
Between groups 107.635 2 53.817 10.866 .000 (HS)
Within groups 133.710 27 4.953
Total 241.345 29
Furthermore, therewas a highly significant difference (P<0.001) between each groups as demonstrated in table 3(The LSD test).
Table (3): LSD test for studied groups
Studied GroupsP-value
LSD (test)
Sig.
ControlBlack seed oil 0.000 HS (P<0.001)
Taramira oil 0.000 HS (P<0.001)
Black seed oil Taramira oil 0.000 HS (P<0.001)
Surface roughness test:
The values of mean, standard deviation, standard error, minimum and maximum of surface roughness for all groups are list in table (4). The control group created the highest value of mean (1.349μm), while the black seed oil group produced the lowest value of mean (1.346μm), figure (8).

1844 Indian Journal of Public Health Research & Development, November 2019, Vol. 10, No. 11
Table (4): Descriptive statistics test for surface roughness of studied group
Studied group N Mean(μm) SD SE Min. Max.
Control 10 1.349 0.241 0.073 1.020 1.610
Black seed oil 10 1.346 0.223 0.071 1.011 1.659
Taramira oil 10 1.347 0.232 0.096 1.077 1.660
Figure (6): Bar chart of mean of surface roughness test
Among all groups , there were no significant differences as demonstrated in Table (5).
Table (5): ANOVA test for surface roughness
Sum of Squares df Mean Square F Sig.
Between groups .000 2 .000 .000 1.000 (NS)
Within groups 1.799 27 .067
Total 1.799 29
1.349 1.346 1.347
0
0.2
0.4
0.6
0.8
1
1.2
1.4
1.6
1 2 3 4control black seed oil taramira oil
mea
n su
rface
roug
hnes
s (
um)
Discussion
Separating medium is considered as the mainfeature which influence thesuccess of dental because of its effect on the mechanical and physical properties of acrylic resin. For dental stone, many substances areutilized such as cold mold seal [11].
In this study, black seed oil and taramira oil used as separating materials with cold mold seal (control group) to evaluate their effect on the hardness and surface
roughness of acrylic denture base material.
Surface hardness test:
The results of the current study revealed thatthe black seed oilgroup created the highest mean value followed by the taramira oil group, while the control group showed the lowest mean value (table 1), also the result showed highly significant difference among them (table 2,3). Black seed oil andtaramira oil improved the hardness of the acrylic resins, this could be explained
Indian Journal of Public Health Research & Development, November 2019, Vol. 10, No. 11 1845
by water sorption phenomenon of methyl methacrylate denture base material that is mean the cold mold seal film is not fully water eliminator and this inhibit complete polymerization of acrylic [12,13]. Black seed oil showed highly significant difference than taramira oil this could be due to chemical composition of the major unsaturated fatty acids were linoleic acid followed by oleic and lignoceric acid in chemical composition of the black seed oil [14]. This result agrees with Hatim et al., [15] who found that addition of black seed and thyme oils improved the transverse strength and hardness of acrylic resins. Altaieet al., [ 3] used olive oil as separating medium, and revealed that therewere no significant differences between olive oil andcold mold seal on hardness of acrylic resin.
Surface roughness test:
Smooth surface of acrylic resin resists the buildup of stain, debris and plaque. Increase surface roughness has a detrimental effect on the aesthetic of the denture and health of oral tissues [4].
The results of the current study indicated that the cold mold seal (control) group hadgreatest mean value of surface roughness followed bytaramiraoil group, while the black seed oil group showed the lowest mean value (table 4), this decrease in the mean value of surface roughness may be due to the nature of oil which makes the surface smooth [3]. Also the result showed that there is a non significant difference among groups (table 5). This could be related to the present of glycerin in the composition of cold mold seal that is similar to the chemical oil nature of black seed and taramira oils [4].
However, there is no previous studies in this field to correlate the results of this study (hardness and surface roughness test) with it.
Conclusion
From the present study the following conclusion can be with drawn:
1-Black seed oil gives more hardness in comparison with cold mold seal, andtaramira oil which is gives more hardness than cold mold seal.
2- Black seed oil gives more smoothness (less surface roughness) in comparison with taramira oil and cold mold seal.
3- Instead of cold mold seal, black seed and taramira oils can be utilized as the separating medium
Conflict of Interest: None
Source of Funding: self
Ethical Clearance: None
Reference
1. Allahyari S., Niakan S., “Processing techniques of acrylic resin in removable and maxillofacialprosthesis: A review “Journal ofCraniomaxillofacialResearch,2018; Vol. (5); No.5:99-104.
2. Mansour N.S.,” Assessment four types of separating medium on surface roughness of self cure acrylic resin processed by two methods: A comparative study”Journal of Kerbala University, 2012;Vol.10; No.2 :33-44.
3. Altaie A. Z., AlNakkash W.D. Salman F.D., “ Evaluation of olive oil as a separating medium and its effect on some physical properties of processed acrylic resin denture base (A comparative study) Part one” Journal of Baghdad Dentistry, 2015; Vol .27; N0. 3:40-49.
4. Craig R G., Powers J.M., Restorative dental materials 11th ed St.Louis:Mosby Co,2002.
5. AaherE.S., Evans J.H., Wright R. F., “ Modification of super sep bottle for point on application of a separating medium used in flasking dentures”J ProstheticDent.,2001; Vol.85 (4): 415-417.
6. Wally z.J.,” The effect of using olive oil as a separating medium on the tensile strength of processed cold and heat cure acrylic denture base materials (A comparative study”Journal of KerbalaUniversity, 2014; Vol.12; No.1:104-107.
7. Mohammed N.H., “The effect of different types of separating medium on the hardness of different types of heat cure acrylic resin materials”Medical Journal of Babylon.2014;Vol.11; No.3: 290 -298.
8. Al-MajeedA.E.,”Evaluation of the effects of porcelanite, black sand and pumice on some properties of acrylic resin”, College of Medical and Health Technology/ M.SC. 2006.
9. Al-JubouriO.,Azari A., “ Evaluation the effect of different types of separating medium on color stability of heat cure acrylic resin (Acomparative

1846 Indian Journal of Public Health Research & Development, November 2019, Vol. 10, No. 11
study) “Journal of Chemical Pharmaceutical Research, 2015; Vol.7(7):1013-1019.
10. ADA specification No.12 American dental associated specificationNo.12 for denture base polymer, Councilor dental material and device 1999.
11. Kim T.H., AhnT.J., EncisoR., Knezevic A., “ Effect of gypsum separating media on the appearance of stone cast surface”J Prosthetic Dent., 2014; Vol.112: 1002-1005.
12. Delbelcury A.A., Rached R.N., Ganzarolli S.M.,
“ Microwave cured acrylic resins and silicone– gypsum moulding technique”. J Oral Rehab.2001; Vol.28: 433–438.
13. Braun K.O., Mello J.A., Rached R.N., Delbelcury A.A., “ Surface texture and some properties of acrylic resins submitted to chemical polishing”. Joral Rehab, 2003; Vol. 30:91–98.
14. Cheikh–Rouhou S., Besbes S., Hentati B., Bleckera C., Deroanne C., Attia H.,” Nigella sativa L: Chemical composition and physicochemical characteristics of lipid fraction. Food Chemistry,2007; Vol.101: 673–681.
15. Hatim N.,Taqa A.A, Abbas W.,Shuker A.M., “The Effect of Thyme and Nigella Oil on Some Properties of Acrylic Resin Denture Base” Al –Rafidain Dent J., 2010; Vol. 10; No.2:205-213.
G- Protein Coupled Receptor Purification from Whole Blood of Iraqi Diabetic and Diabetic Nephropathy Patients
Sulaiman M. Hasan1 , Zeinab M. Al-Rubaei2
1Ph.D, Clinical Biochemistry, Department of Biochemistry, Collage of Dentistry, Al-Farahidi University/Iraq; 2Deptrtment of Chemistry/ Ibn-Al-Haitham College of Education for Pure Science / University of Baghdad /Iraq
Abstract
The study aimed to purified G- Protein Coupled Receptor (GPCR) from the whole blood of control ,G1, diabetic,G2, and diabetic nephropathy ,G3,patients by different chromatography techniques for the first time in world that may be important in early detection and active treatment in these patients.
The GPCR extracted from whole blood by precipitation of proteins with ammonium sulfate,then purified by ion exchange chromatography, as a first step using DEAE-Sepharose .A gel filtration chromatography was applied as a second step of purification using Sepharose 6B.The molecular weight and purity of GPCR was determined by electrophoresis.
Results of ion exchange chromatography for G1 showed two proteins peaks that appeared after elution by the gradient concentration of sodium chloride. Data indicated that GPCR is located in the first protein peak at fraction numbers between (6 and12). Results for G2 showed two proteins peaks that appeared after elution with the gradient concentration of sodium chloride .Then, fractions were collected and concentrated to be applied in gel filtration chromatography.Results showed a single active protein peak after eluted with elution buffer that was identical with the peak that presented GPCR concentrations at fractions number (14)for control group and show of single active protein peak that was identical with the peak that presented GPCR concentrations at fractions number (12)for G2and G3 .
The molecular weight of GPCR that estimated byelectrophoresis that two bands of GPCR appear in G1at (~ 30 KD) and (~ 51 KD) .Results ,also , showed appearance of three bands in G2 related to GPCR in (~ 29 KD) and (~ 47,49 KD) .
The conclusion could be drawn from this studythat GPCR appear in groups is a marker in detection and treatment of diabetic and diabetic nephropathy.This finding could be useful in the early detection and active treatment of diabetic and diabetic nephropathy patients based on type of GPCR that be identified .
Keywords: GPCR Purification, Whole blood , Diabetic , Diabetic Nephropathy.
Introduction
The (GPCRs) are receptors encoded by the human genome.Several GPCRs have been identified as a potential therapeutic targets for the treatment of diabetes and diabetes complications, including retinopathy, nephropathy, and neuropathy (1,2).
Study ,revealed that GPCRs are expressed in the pancreatic islets and may play an important role in the normal glucose homeostasis (3).
Many GPCRs are directly involved in the development of insulin resistance and β-cell dysfunction that can lead to T2DM(4,5) . Sweet taste receptor appear to dominate postprandial glucose-dependent insulin and GLP-1 release (6) .
Glucose-dependent stimulation of insulin secretion is observed withGαsand Gαq-coupled receptors linked to protein kinase C activation and inositol triphosphate which linked to insulin secretion (7,8) .Researches demonstrated that these receptors are expressed in high

1848 Indian Journal of Public Health Research & Development, November 2019, Vol. 10, No. 11
levels in pancreatic β-cells (9) .
Purification is a major challenge in the field of GPCR research because many GPCRs are denatured by detergents (due to the difficulty of purifying GPCRs) (10,11) .So,this study designated to purified GPCR from the whole blood of control, diabetic and diabetic nephropathy patients.
Material and Method
1- Extraction of GPCR from wholeblood :
One hundred fifty individuals with age ranged between (40-65) years were enrolled in this study.They divided into three groups (N=50 per each group) as follows: group 1(G1) represent control group .Group2 (G2) represent diabetic patients andgroup 3 (G3) represent diabetic nephropathy patients.
Blood that obtained from subjects were centrifuged at 2500g for 15 minutes to separate pack cell volumes . Supernatant plasma and buffy coat were discarded . RBCs were washed with (3) volume of normal saline and hemolysis by adding (5) volumes of water . After 20 minutes , hemolysis was centrifuged at 3500g for 20 minutes . Supernatant was collected and filtered through qualitative filter paper (whatmen-1) to remove left out cell debris . It was followed by precipitation of proteins with 50 – 75% ammonium sulfate . For precipitation an equal volume of saturated solution of (NH4)2SO4 was mixed with filtrate and after 15 minutes , it was cooled and centrifuged at 3500g for 10 minutes . Finally , the pellet was dissolved in a minimum volume of (1.5 mM ) of Phosphate Buffer Saline pH 7.3 .The Pellet cells were thawed and suspended in extraction buffer (1.5 mM PBS buffer, pH =7.3, 1 mM AEBSF) and then protease inhibitor cocktail (up 10 ml for 1ml) was added with gentle swirling on ice. The DDM(n-Dodecyl-B-D-Maltoside) (1%) was added to the lysed sample and stirred on ice for 1 hour.The dissolved pellet was dialyzed for 72 hours against 1500 ml of dialysis buffer (1.5 mM PB, pH 7.3) in a cold room .buffer was changed three times during 72 hours.
Protein concentration was estimated according to the Bradford method (1976)(12).
GPCR concentration was estimation by ELISA (13) using kit from Blue Gene Biotechnology, China .
2 - G-protein Coupled Receptor Purification:
GPCR that extracted from blood was purified by using ion exchange chromatography as a first step of purification, and gel filtration chromatography as a second step of purification.
2.1- Ion Exchange Chromatography(14):
Five ml of crude extract was applied on the DEAE-sepharose column (2.5 x 8) cm . The column was equilibrate and washed with an equal volume of 50 mM of phosphate buffer saline contained DDM (pH=7.4) to wash uncharged and positive charged proteins in protein mixture of crude GPCR . The bound proteins were then eluted using NaCl (0.1- 0.5) M . Fraction were collected in 5 ml tube at a flow rate of 0.5 ml/min and eluted with gradient (0.1 – 0.5) of sodium chloride solution .Then GPCR crude was eluted with buffer.The fractions that gave the highest absorbance were collected. Protein and GPCR concentrations were estimated for each fraction .
2.2-Gel filtration chromatography(14) :
Aliquot of five mL of concentrated fraction was injected into sepharose 6B column (65 x 1.5) cm which previously equilibrated with 1.5 mM phosphate buffer saline (pH=7.4) , and eluted with elution buffer PBS pH =7.4 containing (0.5Mm) DDM . Flow rate was (1ml /min) with 5 ml for each fraction that monitored at 280 nm .Protein and GPCR concentration were determined for each fraction.Fractions which gave the highest absorbance and concentration of GPCR were collected.
3- Estimation of GPCR Molecular Weight (15):by SDS-PAGE Electrophoresis .
Findings
Table (1) shows protein and GPCR concentrations for extraction and solubilization steps of lysate . Results show a decrease in protein and GPCR concentrations after extraction and solubilizationsteps .

Indian Journal of Public Health Research & Development, November 2019, Vol. 10, No. 11 1849
Table (1): protein and GPCR concentrations for extraction, solubilization and precipitation steps of lysate
Control
Sample Volume(ml) Protein con.(mg/ml) GPCR con.(ng/ml)
Crude 30 0.89 6.61
Precipitate by (NH4)2SO4
(50-75% )15 0.718 5.34
Diabetic
Sample Volume(ml) Protein con.(mg/ml) GPCR con.(ng/ml)
Crude 30 0.92 6.19
Precipitate by (NH4)2SO4
(50-75% ) 15 0.799 6.052
Diabetic nephropathy
Sample Volume(ml) Protein con.(mg/ml) GPCR con.(ng/ml)
Crude 30 0.94 5.322
precipitate by (NH4)2SO4
(50-75% )14 0.801 4.95
A- Ion Exchange for G1
B- Ion Exchange for G2
0
1
2
3
4
0
0.2
0.4
0.6
0.8
1 3 5 7 9 11 13 15 17 19 21 23 25
Prot
ein
GPCR
0.2 NaCl0.5 NaCl0.4 NaCl
Wash Elution
0
2
4
6
0
0.2
0.4
0.6
0.8
1 3 5 7 9 11 13 15 17 19 21 23 25
Prot
ein
Conc
entr
atio
n (m
g/m
l)
GPCR
activ
ity
(ng/
ml)
0.1 NaCl
0.2 NaCl0.4 NaCl
Wash Elution
Prot
ein
Conc
entr
atio
n (m
g/m
l)
GPCR
activ
ity
(ng/
ml)
0.1 NaCl
0.2 NaCl0.4 NaCl
Wash Elution
Non –ionic detergent ,dodecal-β-D-maltoside (DDM) was used in the extraction and solubilization of GPCR based on previous study(16,17).
Purification of GPCR Extracted fromf blood
Ion Exchange chromatography(18,19):
Results of G1 showed two proteins peaks ,figure (1-A) that appeared after elution by the gradient
concentration of NaCl , while no protein peaks appeared in the washing fractions . The GPCR concentration were measured in the fractions of these two protein peaks . Data indicated that GPCR located in the first protein peak (eluted at 0.1 M of NaCl) at fraction numbers between (6 and12) . The second peaks (eluted at 0.2 M of NaCl) gave a peak between (18-20), thus its neglected .
Figure(1) : Ion Exchange for A- G1 B-G2

1850 Indian Journal of Public Health Research & Development, November 2019, Vol. 10, No. 11
Results for G2 , figure (1-B), showed two proteins peaks that appeared after elution with the gradient concentration of sodium chloride , while no protein peaks appeared in the washing fractions . Data indicated that GPCR located in the first protein peak (eluted at 0.1 M of NaCl) at fraction numbers between (7 and13) . The second peaks (eluted at 0.2 M of NaCl) give peak between (18-20) .
A- Gel -filtration for G1
B- Gel -filtration for G2
0
1
2
3
4
5
0
0.2
0.4
0.6
0.8
1 3 5 7 9 11 13 15 17 19 21 23 25
Prot
ein
GPCR
act
ivity
0
2
4
6
0
0.2
0.4
0.6
1 3 5 7 9 11 13 15 17 19 21 23 25
Prot
ein
Conc
entr
atio
n (m
g/m
l)
GPCR
activ
ity
(ng/
ml)
Results for G3 in figure (2) showed two proteins peaks that appeared after elution by the gradient concentration of NaCl , while no protein peaks appeared in the washing fractions . Data indicated that GPCR located in the first protein peak (eluted at 0.1 M of NaCl) in fraction numbers between (7 and13) . The second peaks (eluted at 0.2 M of NaCl) give peak between (19-21) .
Figure (2) : Ion Exchange for G3
Gel filtration chromatography :
Results displayed in figures (3,4) which showed a single protein peak after eluted with elution buffer that was identical with the peak that presented GPCR concentrations at fractions number (14) for G1 and show of single active protein peak that was identical with the peak that presented GPCR concentrations at fractions number (12) for G2 which show a single active protein peak that was identical with the peak that presented GPCR concentrations at fractions number (12) for G3 .
Figure (3) : Gel -filtration for A-G1 B- G2

Indian Journal of Public Health Research & Development, November 2019, Vol. 10, No. 11 1851
Figure (4) : Gel -filtration for G3
Table (2) : Volume , protein concentration , GPCR concentration , specific activity, purification fold for all purification steps of GPCR for G1,G2 and G3.
G1
StepsVolume (ml)
Protein con.(mg/ml)
GPCR con.(ng/ml)
Specific activity (ng/mg)
Purification fold
Crude 30 0.89 6.61 7.42 1.0
Ion exchange 12 0.718 5.32 7.49 1.1
Gel filtration 8 0.32 3.26 10.18 1.37
G2
Crude 30 0.92 6.19 6.72 1.0
Ion exchange 10 0.713 5.688 7.9 1.17
Gel filtration 8 0.512 4.89 9.55 1.42
G3
Crude GPCR 30 0.94 5.322 5.66 1.0
Ion exchange 9 0.723 4.49 6.21 1.1
Gel filtration 7 0.525 3.52 6.7 1.18
Determination of purity and molecular weight of GPCR by SDS-PAGE:
The molecular weight and purity of GPCR that purified from G1,G2 and G3 were determined by sodium dodecyl sulfate –polyacrylamide gel electrophoresis (SDS-PAGE) ,as shown in figure(5) .

1852 Indian Journal of Public Health Research & Development, November 2019, Vol. 10, No. 11
Figure (5) SDS-PAGE for purified GPCR in G1,G2 and G3
Results indicated the appearance of two bands of GPCR in G1at (~30 KD) and (~51 KD) . This could be due to the isoform of GPCR. As it was reported that the monomeric form is important to activate G-protein for binding , and they stated that further studies are required to understand the function of the dimerization of such receptor for its biological function (20).
Results ,also , showed the appearance of three bands in G2 that related to GPCR in (~ 29 KD) and (~ 47,49 KD) . In G3 the bands appeared similar to that in G2 but with highly clearance related to its highly concentration as show in table (2) .
The glucagon – like peptide -1 receptor (GLP1R)is a class B GPCR with molecular weight of 53 KD, that found in type two diabetes in previous study .According to the previous researches that improved molecular weight of GPCRs about ~30 and ~50 KD , such as GLP-1R (~53 KD), GPCR 40 (31.438), α2- Adregeric receptor (~50 KD) ,β2- Adregeric receptor (47.058KD) (21) . So, in this study may be one or more of the above receptors were purified in diabetic and diabetic nephropathy . further study is important to know amino acid sequences in the purified receptors to know the type of GPCR that purified in these patients exactly.
Conclusion
Conclusion that obtained from this study that 2 bands of GPCR appear in control group while there are three bands appeared in G2 and G3 with different concentrations which may be useful in early detection and active treatment to controlling diabetic and diabetic nephropathy patients .
Conflict of Interest :None
Funding-self or other source :Ibn-Al-Haitham College of Education for Pure Science / University of Baghdad
Ethical Clearance :All studies were conducted in accordance with the ethical committee of Ibn-Al-Haitham College of Education for Pure Science / University of Baghdad.
References
(1) Kolar GR, Elrick MM, Yosten GLC. G protein-coupled receptor signaling: Implications for the treatment of diabetes and its complications. OA Evidence-Based Medicine .2014 ; 18;2(1):2.
(2) Taylor SS, Zhang P, Steichen JM, Keshwani MM, Kornev AP. PKA: lessons learned after twenty years. BiochimBiophysActa. 2013;1834(7):1271-
Indian Journal of Public Health Research & Development, November 2019, Vol. 10, No. 11 1853
8.
(3) Amisten S, Salehi A, Rorsman P, Jones PM, Persaud SJ. An atlas and functional analysis of G-protein coupled receptors in human islets of Langerhans. PharmacolTher. 2013;139(3):359-391.
(4) Darren M.Riddy,PhilippeDelerive,RogerJ.Summers , Patrick M.Sexton and Christopher J.Langmead . G protein coupled receptors targeting insulin resistance , obesity , and type 2 diabetes mellitus .Pharmacological reviews . 2018.70(1) 39-67 .
(5) KimpleME,Neuman JC,Linnemann AK,Casey PJ. Inhibitory G protein and their receptors : emerging therapeutic targets for obesity and diabetes . EXP Mol Med. 2014 ;46:e102.
(6) Ashcroft FM ,Rorsman P. KATP channels and islet hormone secretion : new insights and controversies . Nat Rev Endocrinol . 2013;9:660–669.
(7) McCormick LM, Heck PM, Ring LS, et al. Glucagon-like peptide-1 protects against ischemic left ventricular dysfunction during hyperglycemia in patients with coronary artery disease and type 2 diabetes mellitus. CardiovascDiabetol. 2015;14:102.
(8) Richards P, Parker HE, Adriaenssens AE, et al. Identification and characterization of GLP-1 receptor-expressing cells using a new transgenic mouse model. Diabetes. 2014;63:1224–1233.
(9) Meister J , Le Duc D , Ricken A , Burkhardt R , Thiery J , Pfannkuche H , Polte T , Grosse J , Schöneberg T , Schulz A .The G protein-coupled receptor P2Y14 influences insulin release and smooth muscle function in mice.J Biol Chem. 2014;289(34):23353-66.
(10) SerebryanyE ., Zhu AG. and Yan YE. Artifical membrane-like environments for in vitro Studies of purified G-protein coupled receptors. BiochemicaetBiophysicaActa. 2012; 1818: 225- 233 .
(11) Mohammed Jamshad ,Jack Charlton ,[…],and Mark Wheatly .G-protein coupled receptor
solubilization and purification for biophysical analysis and functional studies, in the total absence of detergent .Biosci Rep.2015; 35(2): e00188.
(12) Berges J.A., Fisher A.E., Harrison P.J. A comparison of Lowry, Bradford and Smith protein assays using different protein standards and protein isolated from the marine diatom Thalassiosirapseudonana. Mar Biol 1993; 115:187-193
(13) Shivanada , N ; Manipal Manual of clinical biochemistry 3rd ed Medical publshers (p) LTD . 2007 .
(14) StellWagen E. “ Gel filtration . In: Methods in Enzymology”. Murray ,E.D. and Dentscher ,P,J. 1990;182:317-328.
(15) Fischer L ,. Gel Filtration Chromatography (Laboratory techniques in biochemistry and molecular biology) 2nd Edition . 1980. ISBN-10: 0444802231.
(16) Dario Mizrachi,YujieChen,MatthewP.Delisa.Making water – soluble integral membrane proteins in vivo using an amphipathic protein fusion strategy . Nat Commun. 2015; 6: 6826.
(17) Abraham O, Bartholomaus D, Annette M,JonathanOB,CarolynV,Sandro K. Solubilization of membrane proteins into functional lipid-bilayer nanodiscs using a diisobutylene/maleic acid copolymer .Chem.Int.2017;56:1919-1924 .
(18) Labrou NE. Protein purification :an overview . Methods Mol Biol. 2014;1129:3-10.
(19) Hanke AT, OttensM . Purifying biopharmaceuticals :knowledge – based chromatographic process development . Trends Biotechnol. 2014;32(4):210-20.
(20) Kamal M., Maurice P. andJockers R. Expanding the Concept of G Protein-Coupled Receptor (GPCR) Dimer Asymmetry towards GPCR-Interacting Proteins. Pharmaceuticals, 2011; 4: 273-284.
(21) Choi YJ, Shin D, Lee JY. G-protein coupled receptor 40 agonists as novel therapeutics for type 2 diabetes. Arch Pharm Res. 2014 ; 37(4):435-9.

The Role of Overexpression of Rab1A in Human Pancreatic Cancer and its Association with Poor Prognosis
Susan Zwyea1Department of Radiological Techniques, College of Health and Medical Technology/Baghdad, Middle
Technical University, Baghdad, Iraq
Abstract
Rab1 is a member of RAS oncogene family,its role ismediating vesicle transport between the endoplasmic reticulum (ER) and Golgi. Rab1A contributed to human prostate cancer,colorectal cancer (CRC), hepatocellular carcinoma(HCC), gliomasand tongue squamous carcinomas(TSCCs) tumor proliferation and migration.Because pancreatic carcinoma is one of the common human cancers with high lethal malignancy rate,we investigated the expression of Rab1A inpancreatic carcinoma.171 samples with normal pancreatic tissues and 176 samples of pancreatic cancer tissues were obtained and prepared atthe Pathology Clinic, Uppsala University Hospital (Uppsala, Sweden).This study was noticedthat Rab1A is overexpressed in pancreatic carcinoma tissues both in mRNA and protein levels. Moreover, survival analysis showed that Rab1Aoverexpression in human pancreatic carcinoma is associated withpoor prognosis (p<0.05). Strikingly,aberrantexpression of Rab1A in pancreatic carcinoma patients is associated with an elevated level of mTORC1 (p-S6K1) signaling. Our results demonstrate that Rab1A may have apotential role in pancreatic cancer progression in anmTORC1 dependent manner, and further emphasizes the role of Rab1A in human malignancies. Together, these results indicate that Rab1A overexpression couldpromote a new prognostic predictor for human pancreatic cancer.Thus, studying the regulation of Rab1A in pancreatic cancer is urgently needed.
Key words: Rab1A, pancreatic cancer, prognostic marker, mTORC1
Introduction
Pancreatic cancer is an aggressive and common leading cause of cancer related death after lung, breast or prostate and colorectal cancer worldwide.(1)
Because the lack of the reliable diagnosis methods, the majority of patients are diagnosed too late with advanced disease. In general, there arefew curative options appreciably can change itsaggressivenessand lethality.(2,3) Thus, Survival rate with pancreatic cancer is fairly low, with one-year relative survival of less than 25%.(1,3) Genetic mutationsdrives pathogenesis in the pancreas with a total of 5%–10% of all pancreatic cancers.(4-6) Chronic pancreatitis seems to be associated with 4% of cancer cases. (7) Aside from mutations or pancreatitis, overexpression of certain oncogenes has been previously reported to promotethe development of human pancreatic cancer.(8) Becauseof the high lethality rate of pancreatic cancer, there is urgent need
to identifynew target genes underlyingpancreatic cancer to improve treatment and survival.Rab1A is a member of RAS oncogene family which is highly conserved in mammals. It is a GTPase predominantly anchored to Golgi membrane and mediates ER to Golgi vesicular trafficking. (9)Beyond Rab1A role in vesicle trafficking, it has been found aberrant level ofRab1A act as anoncogenein colorectal cancer,which is associated with poor prognosis.(10)Overexpression of Rab1A has been linked to multiple human diseases particularlycancer including colorectal cancer (CRC) 10, hepatocellular carcinoma (HCC) (11), glioma(12), prostate cancer (13,14) tongue squamous carcinomas (TSCCs)(15) and cervical cancer.(16)Consistently with the role of ER-Golgi membrane system in cell signaling,Rab1A overexpression has been proposed to promote the pathogenesisof CRC and HCC by activating the mTORC1 signaling pathway.(10)mTORC1 is well known as a central regulator of cell growth and its elevated level

Indian Journal of Public Health Research & Development, November 2019, Vol. 10, No. 11 1855
is associated with multiple human diseases particularly cancer.(10,17)The recent findings (10-16)indicate that Rab1A might be a new therapeutic target for cancer therapy. Despite the contributory role of Rab1A in different types of human malignancies,until now, Rab1A has not been deliberated in the context of pancreatic cancer studies. In this study, we investigated Rab1A expression in human primary tissues from pancreas adenocarcinoma, andassess the relationships between Rab1A expression and patient survival.
Material and Method
Patients and pancreatic tissue samples: 171 samples with normal pancreatic tissues and 176 samples of pancreatic cancer tissues were obtained from October 2015 to November 2018. The pancreatic tissue array was prepared by at the Pathology Clinic, Uppsala University Hospital (Uppsala, Sweden).The overall survival time was calculated from the day of therapyto the end of the follow-up or the date of death because of the recurrence andmetastasis. The median patients’ follow-up was of 33 months (range: 2-80 months). Patients with low Rab1AmRNA expression were all alive while patients with high Rab1AmRNA expression were 84 alive and 92 dead.
Immunohistochemistry (IHC):The standard streptavidin-biotin-peroxidase complex method was used for IHC staining. Tissue sections were incubated with a Rab1A-specific antibody (Antibody HPA039442, Antibody CAB003838, Antibody CAB018346) or S6K1 specific antibody (Antibody HPA056141 andAntibody CAB005331). The intensity of the staining was calculated as follows: no staining (0 positive cells); weak staining (0-10% positive cells); intermediate staining (10-50%positive cells); high stainingin the tissue cells (50-100% positive cells).
Analysis of Rab1A mRNA and protein levels: The genomic data from The Human Protein Atlas databases (https://www.proteinatlas.org) was used to
analyze Rab1A mRNA expression alteration and protein expression level in normal and primary pancreatic cancer tissues. The website (proteinatlas.xml.gz) was utilized to download data including protein expressionand RNA seq data.
RNA seq: The standard RNA-seq protocol was used for measuring mRNAquantity. In short,RNA was extracted from tissue samples using the RNeasy Mini Kit (Qiagen, Hilden, Germany).Samples of high-quality RNA were used in the sequencing.
Statistical Analysis: Survival analyses were carried outby Kaplan-Meier plots and the log-rank test. Results are considered significant when p value is less than 0.05.
Findings
Rab1A is overexpressed in human pancreatic tissues
Genomic findings from previous studies suggest that Rab1A gene acts as an oncogene and is amplified in many cancer cases. (1-4)Therefore this studyinvestigated Rab1A mRNA and protein expression in 176 pancreatic cancer samples and 171 normal pancreatic tissues available in The Human Protein Atlas database (https://www.proteinatlas.org).Analysis of the primary data shows Rab1A mRNA and protein levels are both higher in pancreatic cancer tissues compared to normal pancreatic tissues (Figure 1A, 1B and 1C). Since the increase in Rab1A occurs both at transcriptional and translational levels, this suggests Rab1A mRNA and proteinexpressions are positively correlated and that increased in Rab1A level is due to change in gene expression. Generally, our results indicate that high Rab1A expression level in pancreatic cancer resemble those seen in other studies with particularhuman tumors such as HCC and CRC. (10,11)Therefore,we think that the results of this study are useful for supporting evidence that may explain many of the findings related to the development of pancreatic cancer.

1856 Indian Journal of Public Health Research & Development, November 2019, Vol. 10, No. 11
A
C
Case 2162
Normal
Case 3614
Tumor
Case 4156 Case 3004
B FP
KM
(num
ber F
ragm
ents
Per
Kilo
base
of
exon
per
Mill
ion
read
s)
FPK
M (n
umbe
r Fra
gmen
ts P
erK
iloba
se o
f ex
on p
er M
illio
n re
ads)
Rab
1A
Figure 1: Rab1A is overexpressed in human pancreatic tissuesA.
RNA-seq data has been mapped usingthe number FragmentsPerKilobaseof exon per Million reads (FPKMs). Shown is mRNA level in 171 pancreatic normal tissues in The Human Protein Atlas database. (www.proteinatlas.org/ENSG00000138069-RAB1A/tissue/pancreas#cbox).B.RNA-seq data is proposed as average number Reads PerKilobase genemodel and Million mapped reads (FPKMs). Shown is
mRNA level in pancreatic carcinoma 176 samples.Data is downloaded from The Human Protein Atlas database(www.proteinatlas.org/ENSG00000138069 RAB1A/pathology/tissue/pancreatic+cancer).C.IHC staining for the primary human pancreatic cancer and noncancerous tissuesin the The Human Protein Atlas database (www.proteinatlas.org/ENSG00000138069-RAB1A/tissue/pancreas#img) and (www.proteinatlas.

Indian Journal of Public Health Research & Development, November 2019, Vol. 10, No. 11 1857
org/ENSG00000138069-RAB1A/pathology/tissue/pancreatic+cancer#img). Shown are representative images of Rab1A staining of tumor and non-cancerous tissue sections. Scale bar, 50 μm.
Rab1A overexpression is significantly associated with poor prognosis in pancreatic cancer patients
To evaluate the clinical significance of Rab1A overexpression in pancreatic cancer patients, we analyzed the relationship between Rab1A expression levels and patient survival.Kaplan-Meier survival analysis of pancreatic cancer patients was separated into two groups by the median value for Rab1A-positive staining then validated. Our analysis reveals that overall survival of pancreatic cancer patients with high Rab1A expression is significantly worse than those with low Rab1A expression in pancreatic patients (Figure2A). Thus, Rab1A level can provide predictive value for the outcome of pancreatic cancer patients and our observation resembles those seen in HCC and CRC. (10,11)Our analysis further supports the finding that Rab1A overexpression is significantly associated with an elevated risk of pancreatic cancer related death.These findings demonstrate that Rab1A is an independent prognostic signature of poor survival in pancreatic cancerpatients.
In support the task of high Rab1A expression in signaling pathways and oncogenesis(1-4), we investigated the level of P-S6K1, the effector of mTORC1, in pancreatic cancer patients. To investigate this phenomenon, we checked the P-S6K1protein levels of pancreatic cancer patients by using IHC primary data deposited in The Human Protein Atlas database. Protein primary data analysis reveals that P-S6K1 protein level is generally higher in pancreatic cancer tissues compared to normal pancreatic tissues (Figure 2B and 2C). Our results are useful as supporting evidence that may explain many of the findings related to the development of pancreatic cancer.Altogether these outcomesdemonstrate that enhancingmTORC1 signal may be crucial for Rab1A to advance the pathogenesis of pancreatic cancer and that Rab1A could be new guide for targeted cancer therapy as seen in other malignancies. (18)
C
Cum
ulat
ive
surv
ival
Months
A
B
Case 1647
Tumor
Low
Normal
Medium
Case 374
Case 3233
High
Case 2940
Not detected Low
Case 2032
Medium
Case 3320
Figure 2: Overexpression of Rab1A in pancreatic cancer is associated with poor survivalA.
Kaplan-Meier survival analysis comparing the overall survival time of pancreatic cancer cases separated intotwo groups, low or high mRNA level of Rab1A. The p value was computed by log rank test.B.IHC staining for the primary human pancreatic cancer tissues in The Human Protein Atlas database (www.proteinatlas.org/ENSG00000108443-RPS6KB1/tissue/pancreas#img).Representatives are images of p-S6K1 staining of sections of tumor tissue. Scale bar, 50 μm.
C. IHC staining for the non-cancerous tissues in the The Human Protein Atlas database(www.proteinatlas.org/ENSG00000108443RPS6KB1/pathology/tissue/pancreatic+cancer#img ). Shown are representative images of p-S6K1 staining of normal tissue sections. Scale bar, 50 μm.
Conclusion
Rab1 is aGTPase generally mediate vesicle shuttle betweenthe ER to Golgiapparatus.(19) Moreover, Rab1A involves in stimulating signaling pathways such as mTORC1 pathway.(10) To date, its role in human disease particularly oncogenesis remains unknown. Only until was Rab1Afound to be involved in oncogenic growth in many human cancer types. (1-3)Thepreviously mentioned
1858 Indian Journal of Public Health Research & Development, November 2019, Vol. 10, No. 11
studies suggest that Rab1A could play important role in hyper-proliferative cancer.Sincepancreatic cancer is an aggressive disease, therefore we think that Rab1A could play important role ininitiation and development of pancreatic cancer.The present study finds that Rab1A is highly expressed in pancreatic cancer. These results further support the idea of that abnormal Rab1A expression could be a common phenomenon in certain human cancers.(11,20) Although our findingsdemonstrate that Rab1A is highly expressed in pancreatic tumors, the importance of elevation Rab1 expression in pancreatic cancer remained unclear.
Significantly, human pancreatic cancer patients with elevated Rab1A expression associate with poor survival. Log rank analysis demonstrates that mRNA level of Rab1A is anself-sufficient prognostic marker for pancreatic cancer patients.In contrast,low Rab1A expression associate withbettersurvival. These findings further support that Rab1 A hyperactivation can promote development of pancreatic cancer. (6)
mTORC1 is a principal regulator of signal transduction pathway in reaction to amino acid signals. (10)
Recently, studies show amino acid signalsare capable of phosphorylatingS6K1, final effector target of mTORC1, in a mechanism is dependent on Rab1A.(10,11)Here we show that p-S6K1 is overexpressed in pancreatic cancer. This overexpression is closely correlated with Rab1 overexpression in primary pancreatic tissues. If that is true, these results may explain mechanisms of high Rab1A expression are in the cancer pathobiology.Thus, more studies need to be done to further investigate whether this common phenomenon drive oncogenic growth in pancreatic cancer. In addition, more analysis needs to be done to investigate whether Rab1A overexpression is correlated with pancreatic cancer sensitivity to rapamycin, mTORC1 inhibitor. Further investigation in this field could lead to a predictive marker for enhancing mTORC1-targeted therapy in pancreatic cancer.
Conflict of Interest: The author declares no conflict of interest.
Source of Fund: The author received no specific funding for this work.
Ethical Clearance: Written informed Consent for the Ethical use of The Human Protein Atlasarchived data in our Research was obtainedfromthe administrative coordinator of The Human Protein Atlas research ethics
committee(a Swedish-based program fundedfrom the Knut and Alice Wallenberg foundation).
Acknowledgment: We thank SaifAlmansouri for technical assistance and the staff of the Human Protein Atlas program for valuable contributions.
References
1. Siegel RL, Miller KD, Jemal A. Cancer statistics. CA: a cancer journal for clinicians. 2015;65(1):5–29.
2. Ryan DP, Hong TS, and Bardeesy N. Pancreatic adenocarcinoma. The New England journal of medicine. 2014;371(11):1039–49.
3. Baker LA, Tiriac H, Clevers H, andTuveson DA. Modeling pancreatic cancer with organoids. Trends Cancer. 2016;2:176–190.
4. Risch HA1, McLaughlin JR, Cole DE, Rosen B, Bradley L, Kwan E, Jack E, Vesprini DJ, Kuperstein G, Abrahamson JL, Fan I, Wong B, Narod SA.Prevalence and penetrance of germline BRCA1 and BRCA2 mutations in a population series of 649 women with ovarian cancer.Am J Hum Genet. 2001;68(3):700-10.
5. Schenk M, Schtwartz A G, O Neal E., Kinnard M, and Greenson J K. Familial risk of pancreatic cancer. J Natl cancer inst 2001, 93:640-644.
6. Eser S, Reiff N, Messer M, Seidler B, Gottschalk K, Dobler M, Hieber M, Arbeiter A, Klein S, Kong B, Michalski CW, Schlitter AM, Esposito I, Kind AJ, Rad L, Schnieke AE, Baccarini M, Alessi DR, Rad R, Schmid RM, Schneider G,and Saur D. Selective requirement of PI3K/PDK1 signaling for Kras oncogene-driven pancreatic cell plasticity and cancer. Cancer Cell. 2013;23(3): 406–420.
7. Lowenfels, AB, andMaisonneuve P. pancreatic cancer development of a unifying etiology concept. Ann N Y AcadSci 1999; 880:191-200.
8. lemoine N R,and Hall PA. Growth factors and oncogenes in pancreatic cancer. BaillieresClin Gastroenterol.1990,4(4):815-832.
9. Hutagalung AH, Novick PJ. Role of RabGTPases in membrane traffic and cell physiology. Physiol Rev. 2011;91:119–49.
10. Thomas JD, Zhang YJ, Wei YH, Cho JH, Morris LE, Wang HY, Zheng XF. Rab1A is an mTORC1 activator and a colorectal oncogene. Cancer Cell. 2014;26:754–69.

Indian Journal of Public Health Research & Development, November 2019, Vol. 10, No. 11 1859
11. Xu BH, Li XX, Yang Y, Zhang MY, Rao HL, Wang HY, Zheng XF. Aberrant amino acid signaling promotes growth and metastasis of hepatocellular carcinomas through Rab1A-dependent activation of mTORC1 by Rab1A. Oncotarget. 2015;28;6(25):20813-28.
12. Bao ZS, Li MY, Wang JY, Zhang CB, Wang HJ, Yan W, Liu YW, Zhang W, Chen L, and Jiang T. Prognostic value of a nine-gene signature in glioma patients based on mRNA expression profiling. CNS NeurosciTher. 2014;20:112–18.
13. AbdElmageed ZY, Yang Y, Thomas R, Ranjan M, Mondal D, Moroz K, Fang Z, Rezk BM, Moparty K, Sikka SC, Sartor O,and Abdel-Mageed AB. Neoplastic reprogramming of patient-derived adipose stem cells by prostate cancer cell-associated exosomes. Stem Cells. 2014;32:983–97.
14. Sun T, Wang X, He HH, Sweeney CJ, Liu SX, Brown M, Balk S, Lee GS, and Kantoff PW. MiR-221 promotes the development of androgen independence in prostate cancer cells via downregulation of HECTD2 and RAB1A. Oncogene. 2014;33:2790–800.
15. Shimada K, Uzawa K, Kato M, Endo Y, Shiiba M, Bukawa H, Yokoe H, Seki N, andTanzawa H. Aberrant expression of RAB1A in human tongue cancer. Br J Cancer. 2005;92:1915–21.
16. Nikoshkov A, Broliden K, Attarha S, Sviatoha V, Hellström AC, Mints M, and Andersson S. Expression pattern of the PRDX2, RAB1A, RAB1B, RAB5A and RAB25 genes in normal and cancer cervical tissues. Int J Oncol. 2015;46:107–12.
17. Tsang, C.K., Qi, H., Liu, L.F., and Zheng, X.F. Targeting mammalian target of rapamycin (mTOR) for health and diseases. Drug Discov. Today. 2007;12, 112–124.
18. Meng LH and Zheng XS. ActaPharmacol Sin. 2015; 36:1163‐1169.
19. Tisdale EJ, Bourne JR, Khosravi-Far R, Der CJ and Balch WE. GTP-binding mutants of rab1 and rab2 are potent inhibitors of vesicular transport from the endoplasmic reticulum to the Golgi complex. The Journal of cell biology. 1992; 119:749-761.
20. Uhlén M, Fagerberg L, Hallström BM, Lindskog C, Oksvold P, Mardinoglu A, Sivertsson Å, Kampf C, Sjöstedt E, Asplund A, Olsson I, Edlund K, Lundberg E, Navani S, Szigyarto CA, Odeberg J, Djureinovic D, Takanen JO, Hober S, Alm T, Edqvist PH, Berling H, Tegel H, Mulder J, Rockberg J, Nilsson P, Schwenk JM, Hamsten M, von Feilitzen K, Forsberg M, Persson L, Johansson F, Zwahlen M, von Heijne G, Nielsen J, PonténF.Tissue-based map of the human proteome. Science 2015 347(6220):1260419.

Prevalence of Urinary Tract Infections in Adult and Child Patients
Estabraq A. AL-Sudani1, Sameer A. Alash2
1Middle Technical University /College of Health & Medical techniques/ Medical laboratory techniques dep. 2Baghdad University / Collage of Science / Biology /Microbiology.baghdad/ Iraq
Abstract
Urine Samples collected from three hospitals in Baghdad city from adult and child patients suffering from urinary tract infections for 6 months. The samples get reached 1152 , the patients old were between few days to 80 years after urine cultured isolation and diagnosis of bacteria done with a modern methods Escherichia coli reached the highest ratio reached 36.36% , In adults between . 49.35-50% , In child 42.56% followed by Klebsiella spp. In ratio . 11.08% , 6.06-12.98 in adult and 10.49% in child, followed by Proteus mirabilis 8.86% where they ranged from 6.93-9.09% in adult to 9.91% in child . Also recorded others species from Enterobacteriace in lowest ratio where they ranged from 0.16% to 3.48% Also observed Gram positive bacteria in highest ratio Streptococcus spp. 7.43% followed by Staphylococcus aureus in 5.53% , Enterococcus in 3.48% and in lowest ration . Species from .Staphylococcus between 0.16% -0.79% .Also observed .Candida spp were about 3.32% in adult and child .Proteus mirabilis were Selected because there different complications in UTIs Patients specially Stone formation , obstructed the catheter, and renal damage. These bacteria were diagnosis in API 20 E and Vitek2 , sensitivity test its performed depended on gender and age of patients p .mirabilis the highest percentage in the age groups 31-40, 41-50 .yeras old , 18.75% 25.0% respectively in adult both sexes .while in child the highest percentage in the age groups 10 years old ,55.88% in male than female , also observed highest ratio adult patients with Urinary catheter who are in hospital many significant differences when used different antibiotics. There was a significant impactor effects , for Impenim(IMP) and Meropenemin both sexes in adult and child. Also seen adult samples sensitive for Gentamicin, Cefoxitin,
Aztreonam and Ticracillin highest in male than Female, the same results shown in child samples .In addition sensitivity to others antibiotics such as Levofloxacin, Ceftazidim, Cefepime.Inadult,female samples were sensitive to pipracillin,ceftriaxone and Cefotetan highest than male .Many , significant differences were observed for P. mirabilis resistant to different antibiotics such as Cefepime,Cefotaxime, ceftriaxone, pipracillin, Levofloxacin,nitrofurantion,Cotrimaxz in adult male highest than adult female.While in child samples were resistant to Meropenam , Naldalie acid, Trimethprim . nitrofurantoin ,cifxime, Ticaracillin and ceftriaxone. Highest in male than female and female child resistant to Sulfanethoxazonl , highest than male.
Keywords: UTIs bacteria, Antibiotic , Proteus mirabilis and UTI.
Introduction
Urinary tract is the one of most common area of bacterial infection caused UTI occurring from the neonate to the geriatric age groups encounters in medicals today , especially in females. In men are less common may be occur after 50 years of age [1][2]. UTIs caused by bacterial colonization of the urethra. Bacteria normally colonized the urethral opening then colonize the urine
[3][4].The most prevalent agent for UTI Escherichia coli which caused 80-90% of UTIs in adults[5]Followed by Klebsiella spp. and Proteus mirabilis which frequently contributed with stone disease [6][7], and other different species of Gram positive and negative [8].Urine is normally a sterile fluid,UTIs are two typesUpper UTIs (U-UTIs) and Lower UTIs (L-UTIs) [9][4]. Occurrence of UTIs in adult males aged under 50 years is low, with adult women being 30 times more than men. In most

Indian Journal of Public Health Research & Development, November 2019, Vol. 10, No. 11 1861
cases of UTIs bacteria is the most common causes,while some cases of UTIs by fungi and viruses are rare[2][10]
[11]. In children up to 7% of girls and 2% of boys will have asymptomatic UTI. [12]. The prevalence of urinary tract infection depended on age and sex of children [8].In infants is greater than younger age, and with7% among newborns[13]. Most UTIs in children produced by ascending infections and the hematogenous spread may be more common in the first 12 week of life[14].The most commonest UTIs in children Escherichia coli60-80% of cases Proteus spp. (common in boys and in children with renal stones) Enterococcus , Klebsiella, and Coagulase–negative Staphylococci [15].Risk factors for UTI in children is limited, and it associated with constipation,bladder instability,encopresis[16][17].Bathing and back to front wiping[14].Reflux of urine from the bladder up to the ureter, is common in children with anatomic abnormalities of the urinary tract and may be caused ascending infection and kidney damage [2].In UTIs , sometimes the urethral catheter a closed sterile system that is consist from tube inserted via urethra is used as urinary drainage [18].Many types of bacteria can be colonized this catheter and caused catheter associated urinary tract infections (CAUTIs)[19][20][21]. Microorganism can invade and cause UTI through three major routes: lymphatic pathways , ascending ,and hematogenous[22]
[23].Urinary catheterization and cystoscopy the mean instrument that cause of hospital acquired UTIs in both sexes[22][24]. Hematogenous or blood borne route spread
occurs as a result of bacteremia[22].WHO report that UTI bacteria resistant for antibiotic[25]. Proteus mirabilis bacteria caused many complications such as renal stone , catheter obstruction ,kidney damage[26][27][28]. Objectives of the study investigation bacterial species that caused UTIs , isolation and diagnosis P. mirabilis that caused complicated UTIs, and study P. mirabilis sensitivity for different antibiotics .
Method
Urine samples collection
Urine samples(1152) were collected from three sites, for 6month,from patients suffered from UTIs,mid stream urine samples were collected in sterile containers[29]. sampleswere cultured on blood agar and MacConkey agar plates.Gram negative bacteria isolates were identified byA.Different standard biochemical : 1.API20 E system 2.IMVC test 3.TSI4.Gelatin liquefaction 5.VITEK2 system for Proteus mirabilis B. Oxidase test and pigment production for Pseudomonas spp.
Gram positive isolates were identified by:1. catalase test 2.coagulase test 3.mannitol salt agar S.aureus .Tests were done according to Collee et al and Realonds[30][31].
Antibiotic sensitivity test
56 samples of Proteus mirabilis cultured in Mullar-Hinton agar then different antibiotic disc as shown in Table1were placed on the plates .
Table1: List of antibiotics with its abbreviation
Antibiotics Company Origin AbbreviationCefotetan 30 µg Biotech UK CINGentamicin 30 mcg Biolab Budapest GNAmikacin 30µg Biotech UK AKCefepime 30µg Biotech UK FEPCefoxitin 30µg Biotech UK FOXCefotaxime 30µg Biotech UK CTXCeftraxone 30 mcg Biolab Budapest CTR or CRO Chloramphenicol 30 µg MAST UK CPipracillin 30 mcg Biolab Budapest PIPCeftazidime 30µg Biotech UK CAZCiprofloxacin 5µg Biotech UK CIP
Tetrcycline 30µg Biotech UK T or Te
Aztreonam 30 µg MAST UK ATLevofloxacin 5µg Biotech UK LE or LEV

1862 Indian Journal of Public Health Research & Development, November 2019, Vol. 10, No. 11
Meropenem 10 µg MAST UK MRT or Mem Tobramycin 10µg MAST UK TobNitorfurantoin 100 mcg Biolab Budapest F Impenim 10µg Biotech UK IMPTicaracillin 25 mcg Biolab Budapest TICAmpicillin 25 mcg Biolab Budapest AMPAzithromycin 15µg Biotech UK AZMCefepime 30 µg Biotech UK CFPTrimethoprim Sulfanethoxazol 1.25L23.75µg MAST UK STXNalidixic acid 30 µg MAST UK NANltrofurodontin 100 mcg MAST UK NITCeftazidime 30 mcg Biolab Budapest CAZ Trimethprim 15 mcg Biolab Budapest Tm or TTR Aztreonam 30 µg MAST UK ATM Cifxime 30 µg Biotech UK CFM
Statistic Analysis
The statistic analysis system-SAS (2012) program was used to clarity the effect of difference factors in study parameters .Chi –square test was used to significant compare percentage.
Findings
1152patients suffering from UTIs distributed in both sexes and different age between few days to eighty years old .In the current study, Escherichia coli is the largest causes of UTIs in different olds (46.36%) distributed in Child ,42.56% -50% in adults followed by Klebsiella spp. 11.08% distributed in adults 6.08%_12.08% , and 10.49% in child.Followed by Proteus mirabilis 8.86% ,6.93-9.09% in adult and 9.91%in child .Enterobacter spp.distributed as 3.48-3.90% in adult and 4.08% in child Acinetobacter spp.1.37-3.48 in adult while 5.25% in child Citrobacter spp.,Serratia spp. Was the lowest percentage 0.16% in adult and child respectively all these species from Enterobacteriaceae family.Pseudomonas aeruginosa8.06% distributed 4.54%-8.06% in adult and 8.16% in child while Pseudomonas fluorescens0.16% in child only Morganella ,Burkholdericepeciain 0.16% in adult and child respectively .All these species as Gram negative bacteria also isolated Gram positive bacteria such as Staphylococcus aureus5.53% distributed in 1.51-1.73% in adults and 8.74% in child ,Staphylococcus haemolyticus 0.79% and Staphylococcus xylosus0.32%, Staphylococcus saprophyticus 0.16% all in child , Streptococcus spp. 7.43% as6.06%-8.66% in adult to
Cont... Table1: List of antibiotics with its abbreviation
6.70% in child , Enterococcus spp. 3.48% as 4.08% in child only and the last causes of UTIs Candida spp. 3.32% distributed as 5.19 -7.58% in adult and 1.16% in child only as show in Figure (1,2,3,4) .
Figure (1) Distribution of bacterial specsies in three hospital isolated from UTIs
Figure (2) Distribution of bacterial species in Martyr Ghazi AL-Hriri hospital

Indian Journal of Public Health Research & Development, November 2019, Vol. 10, No. 11 1863
Figure (3) Distribution of bacterial species in Child protection hospital
Figure (4) Distribution of bacterial species in Educational laboratoeries hospital
Proteus mirabilis 8.86% distributed in both sexes,the highest rate in adults age categories with highly significant value(P<0.01) in 31-40 ,41-50 ,18.75% , 25.00% the rate of infection in both sexes was equal , While in child the highest rate in age categories with highly significant value(P<0.01) in 1 year – 10 year 55.88%, the incidence of males was higher than females ,The highest rate with urinary catheter in adult patients than child.There are many significant differences(P<0.01), (P<0.05), when test different antibiotics depended on the gender and age, observed proteus mirabilis sensitive for Impenim, Meropenem. In both sexes to adult and child patients Also noted in adult patients p. mirabilis sensitive for Gentamicin ,Cefoxitin , Aztreonam,and Ticaracillin are higher in males than females . Moreover noted in child with same ratio for Gentamicin and Ticaracillin, Amikacin, Levofloxacin, Ceftazidim ,Ceftraxone ,and Cefepime. Also observed in adult females p. mirabilis sensitive for Pipracillin,Ceftraxone , Cefotetan higher than males.
Discussion
UTIs ,is one of common bacterial infection in adult and child in both sexes particularly in females
than males[2][34]. Results of bacterial types infection in this study agree with WHO report for 2018 that which they pointed to increased the ratio of different types of bacteria to caused UTI complication and mortality vale of patients with UTIs[35].Escherichia coli ,Klebsieella spp , Proteus mirabilis respectively agreement with Ana et al[36]. This study were also agree with adult and with same the results of child and other Enterobacteaceae family members Karen[37].Gram-negative and Gram positive bacteria agreement with Wilson and Gaido[38].The Recurrent UTI in different sexes specially pregnant women with higher percentage of E. coli, P.mirabilis and klebsiella than other women[39][40] . The study showed that child with highest ration UTI from adult specially in male than female in age 1-10 years ,because male uncircumcised infants, anatomical abnormalities in urinary tract , poor toilet habits and hygiene[41] and obstructive anomalies , vesicoureteral reflux[42] .The similarities and differences in the type and distribution of uropathogens show a discrepancy from country to another due to many factors as environmental conditions , health practices , patient conditions, personal hygiene, number of patients examined, and laboratory procedures. Proteus mirabilis samples sensitive to Impenim (IMP) and Meropeneiem (MRT, MEM) in both sexes in adult and child , these results agreement with others study[43]
[44][45][46].P. mirabilis also sensitive indifferent degree to other antibiotic in adult male for Gentamicin , Aztreonam, cefoxitin, Ticracillin , Amikacin and more ever in child also sensitive to Levofloxacin Ceftazidim, Cefepime,In different levels most result agree with AL-Jmaily and Zgaer and Mahmoud et al[46][47].In this study adult female highest sensitive more than male to Pipracillin, Ceftraxone agreement with Mahmoud et al[47]
and Cefotetan.There are many different Significant in adult male resistant for antibiotics in this study Cefepime , Cefotaxime , Ceftriaxone, Pipracillin, Levofloxacin , nitrofurantion, Cotrimaxzol, Chloramphenicol , In child in both sexes Meropenam, Naldalic acid Trimethoprim , nitrofurantoin, Cifxime,Ticaracillin and child female more resistant than male for Sulfamethoxazole .There are many study proved that development of resistant for antibiotics or other drugs from P .mirabilis characterized as plasmid-borne drug resistance.[48]
Conclusion
1.E. coli, Klebsiella, P. mirabilis the highest rate of G-ve bacteria .

1864 Indian Journal of Public Health Research & Development, November 2019, Vol. 10, No. 11
2. P. mirabilis infected both sexes in different age.
3. P. mirabilis resistant to different antibiotics depended in sexes.
Conflict of Interest : Non conflict of interest with any side
Source of Funding : Self source
Ethical Clearance: Oral approval was taken from patients for samples collected
References
1. Raju C,TiwariS .Urinary 14 infection. A suitable approach. Lecture notes. Acad. C lin. Med.2004; 2(4);331-334
2. Goering R, Qockrell H, Zucke M, Ivan M, Roitt M, Peter L.Mims, Medical Microbiology Fifth Edition.
3. Gupta K .Urinary tract infections Diagnostic and Management ELSEVIER saunders,Issues;2014.
4. Valentini N.Swarming Motility in Proteus mirabilis causative Agentof UTIs. Microbe wik,2018
5. Abraham N,Yuxuan M.The nature of immune responses to urinary tract infection Nature Rew Immuno ;2015,15(10); 655-663.
6. Aceves G.Preoperative Antibiotics and prevention of seppsisin Genitourinary surgery, in smith,s Textbook of Endourology, 3rd Edition (2012), p.39 edited 6y Arthur D.smithetal.
7. Goering P, Veldhuizen S,Watson A. Calgary (AB);Mental Health .commission of canada; 2014. National. At Home lchez.Soi-final report. (Internet) cited (2015) sep; Available from http://www.mentalhealth commission.ca Englishldocument (24376) nationalhomechez—oi-final –report.
8. Bailey and Scott’s.Diagnostic Microbiolohy . Thirteenth edition patriciam. Tille,2014.
9. Lane R, Takhar S.Diagnosis and management of UTI and pyelonephritis Emergency medicine of NortLAwerica 2011;29(3);539-52.
10. Tan C, Macieipiotr C.Urinary tract infections in adults .Singapore Med J2016;57(9):485-490/
11. Verneda L, Elizabeth B.Every thing you Need toknow About Urinary Tract infecton Health line media2017.
12. Marilds U.Incidence rate of first–time symptomatic
urinary tract infection in children under year of age. Witey1998 online Library
13. Harper B.Reliablility of the urinalysis for predicting urinary tract infection in young febrile children .ArchpediatrAdolescmed;2001,155:60-5.
14. Donna J, Russell W.Pediatric urinary tract infection Medicine, Med scape.com 2018.
15. Twaij M.Urinary tract infection in children review of it is pathogensis and risk factory JRsoc Health 2000,120:220-6
16. Loening –Baucke V.Urinary incontinence and urinary tract infection and their resolution with treatment of chronic constipation of childhood pediatrics,1997;100:228-32
17. Koff A, Wanger T, Jayanthi R. There relationship among dysfunction .of elimination syndromes primary vesicouretlral reflux and urinaty tract infections .in children .J.Urol. 1998160:1019-22
18. Jacobsen M, Stickler J, . Mobley T, Shirtliff E.Complicated catheter–Associated urinary tract infections Due to Escherichia coli and Proteus mirabilis. Cli Microbiol Rev,2008;21(1),26-59.
19. Mobley T,Warren J .Urease positive Bacteriuria and obstruction of long term urinary catheter S J Clin Microbiol 1987;25:2216-2217.(PMC Freearticle) (Pubmed)
20. Nicolle E. Uncomplicated urinary tract infection adults including uncomplicated pyelonephritis. Urol. Clin North AM,2008;35(1):1-12V.
21. Armbruster E ,Forsyth-DeOrnellasV, Johnson ,Smith N, ZhaoL. W, Mobley T.Genome-wide transposon mutagenesis of Proteus mirabilis: essential genes, fitness factors forcatheter –associated urinary tract infection ,and the impact of polymicrobial infection on fitness requirements .PLospathog ,2017,13 :e1006434 ,doi :10.1371 journal ppat .1006434
22. Till M. Infections of the urinary tract. Bailey and Scott’s Diagnostic Microbiology .13 the editionSt.Louis,Missouri: mos by Elsevier publication 2014.pp.926
23. ElodiJDielubanza, Anthoy J Schaefer, Urinary tract infection in Women. Medical clinics 2011 , 5(1),27-41.
24. AL-MulaAbedo, Trecarten S, Islam S, Dhanas-ekaran K. A prospective audit of urinary tract infection in cadence following the use of
Indian Journal of Public Health Research & Development, November 2019, Vol. 10, No. 11 1865
endosheath for flexible cystoscopy. Journal of EndoluminalEndourology,2018(25)
25. Smothers H .Antibiotic –Resistant UTIs Are on Rise Around .The world .Cosmoploitan,subscribe 2018 .
26. Nzakiwanayo J, Hanin A, Diana R, Alves, Benjamin Mc, Cuttcheon D et al Bacteriophage can prevent Encrustation and Blockage of urinary Catheters by Proteus mirabilis American Society for microbiology,2016
27. Davis S, Kim Z . Proteus mirabilis , Isolating a cause of kidney stones. Clinician Reviews,2014 MD edge.
28. AL-Anii M . Histologic a findings of ascending urinary tract infection in aperimifal vats caused by Proteus mirabilis Biomedical Research,2015, Volume 22, Issue 4 .
29. Lifshits E, Kramer L .Outpatient urine Culture, Does Collection technique matter Arch In tern Med,2000 ; 160: 2537-2540.
30. Collee G, Fraser G, Marmion P, Simmons A.Practical Medical Microbiology “Fourteenth edition .CHURCHILL LSVINGS-TONe , EDIN84RGH.LONDONNSW YORK PHILADELPHIASYDNY TORONTO1996.
31. Reynolds J. Martindale the Extra pharmacopoeia, thirty first ed. Royal pharmaceutical Society of Grat Britain, London,1996.
32. SAS..Statistical Analysis system User’s Guide .Statistical Version 9.1 th ed. SAS. Inst . Cary ,2012 N.C.US.
33. Pincus H.New vitek2 colorimetric GN card for Identification of Gram Negative Non Fermentative Bacilli. Jclin .Microbiol.2007 ; 45(12): 1094-4095.
34. Lohn L. Brusch and Michael Stuart Bronze. Urinary tract infection (UTI) and cystitis (Bladder infection ) in female,2018 (Med scape)
35. Victor D. Rosenthal, Dennis G. Maki, SilomJamalitrate Eduardo A Medeiros. Sub hash.American Journal of infection control 2010,38(2), 95-104.e2.
36. Ana L. Ftores-Mireles, Jennifer N. Walker, Sctt J.H ultgren. Urinary tract infector epidemiology ,Mechanisms of infection and treatment options .Nat Rev Microbiolo,2015;13(5) : 269-284.
37. Gill K .UrinaryTract Infection in children. Health line 2017 .
38. Michael L. Wilson, Loretta Gaido. Laboratory Diagnosis of urinary tract infections in adult patients. Clinical infections Diseases,2004, Volume 38, lssue 8 pages 1150-1158.
39. MattewGlover , Cristiano G. Moreira, Vanessa Sperandio, philippe Zimmern .Recurrent urinary tract infections in healthy and Nonpregmant women. Urological Science. 2014 ,Volume 25, Issue 1 , pages 1-8.
40. Daniel Murrell .Urinary tract infections (UTI ) in older Adults . Medically reviewed, 2018 .
41. John Mersch. Urinary tract infections (UTI) in children .Medically Reviewed 2017.
42. Brett white . Diagnosis and treatment of Urinary tract infection in children Am Fam physician. 2011; 15;83(4) : 409-415.
43. Elena De Vecchi, Simona .Sitia, CarloLuca Rom-ano, Cristian Ricci Roberto Mattina , Lorenzo Drago. Aetiology and antibiotic resistance patters of urinary tract infections in the elderly :ab-month study . Journal of medical microbiology .2013 , 62, 859-863.
44. Ines. Lin .hares ,Teresa Raposo, AutonioRo.Drigues, and Adel aide Almeida . Frequency and antimicrobial resistance patterns of bacteria implicated in community urinary tract infections , a ten–year surveillance . study (2000-2009). Journal list .Biomed central .2013 ,V. 13; 2013.
45. Kakoo N, Kheder A .Isolation , Identification Antibiotic sensitivity pattern of Bacteria from Urin. Samples in Erbil Hospitals. International Journal of science and Research,2015. (IJSR) .ISSN : 2319-7064.
46. AL–Jumaily A, Zgaer S .Multidrug resistant Proteus mirabilis lsolated from urinary tract infection from Different Hospitals in Baghdad city International Journal of .Current Microbiology and Applied Sciences.2016, ISSN:2319-7706 Volume 5 Number 9, PP.390-399.
47. Mahmoud M, Tarig S, Alnour, Osama Mrshakurfo, Mariam M. Aburass. Prevalence and antimicrobial resistance patterngsbacterialstrainsisolatedtrompatients with urinary tract infection in Mess alatasentral Hospital, Libya . Asian pacific. Journal of Tropical Medicine.2016, Volume 9, tssue 8, p. 771-776.

1866 Indian Journal of Public Health Research & Development, November 2019, Vol. 10, No. 11
48. 48.Khan U, Musharraf A.Plasmid-mediated multiple antibiotic resistance in
49. P. mirabilis isolated from patients with urinary
tract infection .International Medical Journal of Experimental and Clinical Research.2004 26,10(11):CR598-602.

Assessment the Health Awareness of Pregnant Women’s Concerning Toxoplasmosis Infection
Hanaa Adel
Assistant Prof, Middle Technical University, Medical Institute of Technology /Baghdad, Iraq
Abstract
A descriptive study was conducted on pregnant women to assess their health awareness concerning toxoplasmosis infection. Randomized samples were selected (100) pregnant women during various trimesters of gestations attending MCHC. Questionnaire from was designed and consist socio-demographic and reproductive data, general information and questions related to samples awareness regarding the toxoplasmosis infection. The data were collected by using interview method and descriptive statistical procedures were analyze the data. The result of the study revealed that the highest percentage of the study sample were in age group 20-29 years, primary school graduate, house wife ,had no previous history to toxoplasmosis infection, had no close contact with cats, in third trimester of gestation, have more than two children and had no history of abortion.Regarding the health awareness of the study sample about their general information ,signs and symptoms, and effects of toxoplasmosis infection were below cutoff point which mean poor awareness while their awareness of concerning methods of transmission and preventive behaviors about toxoplasmosis were above cutoff point which mean good awareness. The study recommended for the importance of health education about toxoplasmosis risk factors to women of child bearing age.
Key words:Pregnant women ;Toxoplasmosis infection ; Awareness
Introduction
Toxoplasma gondii is one of the infectious agents of congenital TORCH infections cause’s severe clinical outcomes in fetus and newborn(1). Toxoplasmosis is a parasitic disease caused by toxoplasma gondii(2).The infection is characterized by non-specific symptoms with the consequent formation of cysts that may remain latent form in many organs(3).
There are four groups of individuals in whom the diagnosis of toxoplasmosis is most critical:-Pregnant woman who acquire their infection during gestation, fetus and new born who are congenitally infected, immune compromised patients, and these with chorioretinitis(3,4).It is one of the most prevalent chronic infections affecting one third of the world’s human population. The prevalence of toxoplasma gondii infection varies among different geographical regions (3).Up to half of the world’s population is infected with toxoplasmosis .In the united states about 23% are affected and in some areas of the world this is up to 95% .about 200,000 cases of congenital
toxoplasmosis occur a year(2).It is most common in Central America and central Africa, and much less common in the US. This variation can be explained partly by climate since temperature and humidity affect how long toxoplasma cysts remain infectious (5,6).
The infection in pregnant woman may cause devastating effects in the fetus. If the infected tissue of an animal being consumed it acts as a transmission mode of infection
(1).Awareness and practice regarding this disease and preventive measures in life style for this parasitic infection should be given to the pregnant woman (1).Therefore, this study aimed to evaluate the level of awareness and practices on toxoplasmosis among pregnant woman who visiting the antenatal clinics or hospitals.
Objectives of the study:- To assess the health awareness of pregnant women’s concerning toxoplasmosis infection.
Materials and Method
Design of the study:A descriptive study was carried
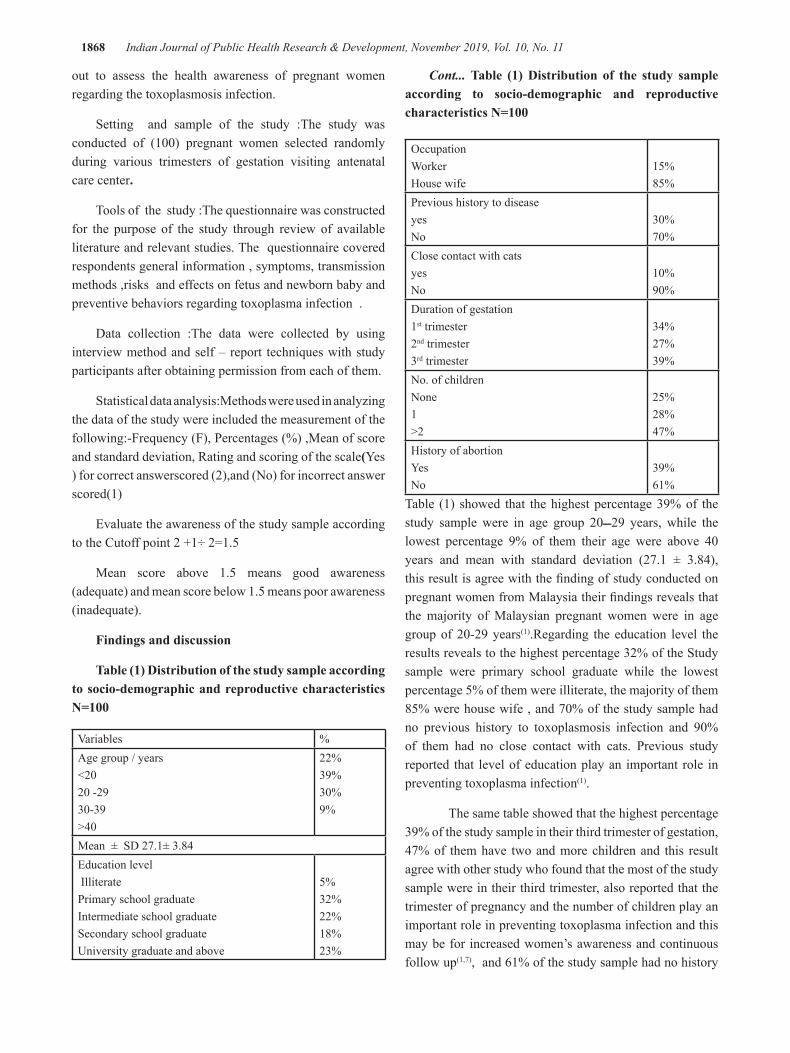
1868 Indian Journal of Public Health Research & Development, November 2019, Vol. 10, No. 11
out to assess the health awareness of pregnant women regarding the toxoplasmosis infection.
Setting and sample of the study :The study was conducted of (100) pregnant women selected randomly during various trimesters of gestation visiting antenatal care center.
Tools of the study :The questionnaire was constructed for the purpose of the study through review of available literature and relevant studies. The questionnaire covered respondents general information , symptoms, transmission methods ,risks and effects on fetus and newborn baby and preventive behaviors regarding toxoplasma infection .
Data collection :The data were collected by using interview method and self – report techniques with study participants after obtaining permission from each of them.
Statistical data analysis:Methods were used in analyzing the data of the study were included the measurement of the following:-Frequency (F), Percentages (%) ,Mean of score and standard deviation, Rating and scoring of the scale(Yes ) for correct answerscored (2),and (No) for incorrect answer scored(1)
Evaluate the awareness of the study sample according to the Cutoff point 2 +1÷ 2=1.5
Mean score above 1.5 means good awareness (adequate) and mean score below 1.5 means poor awareness (inadequate).
Findings and discussion
Table (1) Distribution of the study sample according to socio-demographic and reproductive characteristics N=100
Variables %Age group / years<2020 -2930-39 >40
22%39%30%9%
Mean ± SD 27.1± 3.84Education level Illiterate Primary school graduateIntermediate school graduateSecondary school graduateUniversity graduate and above
5%32%22%18%23%
OccupationWorkerHouse wife
15%85%
Previous history to diseaseyesNo
30%70%
Close contact with catsyesNo
10%90%
Duration of gestation1st trimester2nd trimester3rd trimester
34%27%39%
No. of childrenNone1>2
25%28%47%
History of abortionYesNo
39%61%
Table (1) showed that the highest percentage 39% of the study sample were in age group 2029ـــ years, while the lowest percentage 9% of them their age were above 40 years and mean with standard deviation (27.1 ± 3.84), this result is agree with the finding of study conducted on pregnant women from Malaysia their findings reveals that the majority of Malaysian pregnant women were in age group of 20-29 years(1).Regarding the education level the results reveals to the highest percentage 32% of the Study sample were primary school graduate while the lowest percentage 5% of them were illiterate, the majority of them 85% were house wife , and 70% of the study sample had no previous history to toxoplasmosis infection and 90% of them had no close contact with cats. Previous study reported that level of education play an important role in preventing toxoplasma infection(1).
The same table showed that the highest percentage 39% of the study sample in their third trimester of gestation, 47% of them have two and more children and this result agree with other study who found that the most of the study sample were in their third trimester, also reported that the trimester of pregnancy and the number of children play an important role in preventing toxoplasma infection and this may be for increased women’s awareness and continuous follow up(1,7), and 61% of the study sample had no history
Cont... Table (1) Distribution of the study sample according to socio-demographic and reproductive characteristics N=100

Indian Journal of Public Health Research & Development, November 2019, Vol. 10, No. 11 1869
of abortion ,while 39% of them had history of abortion our finding is supported by a previous study who stated that women who become infected while they are pregnant more exposed to abortion or still birth or the infection could spread to the baby and cause serious complications(8).
Table (2) Distribution of the study sample according to their awareness about general information of toxoplasmosis.
ItemsYes No
Total MS*F % F %
1-Have you read , heard or seen any information about toxoplasmosis 74 74% 26 26% 100 1.74
2-Have you ever been tested for toxoplasmosis? 34 34% 66 66% 100 1.34
3-Is toxoplasmosis caused by anInfection
33 33% 67 67% 100 1.33
4- Is toxoplasmosis caused by a poison? 15 15% 85 85% 100 1.15
5- Is toxoplasmosis caused by parasite? 55 55% 45 45% 100 1.55
Grand mean1.42 (Inadequate)
*MS= Mean of score
Table (2) demonstrated the grand mean of score (1.42) for women’s awareness about the general information of toxoplasmosis were below cutoff point which mean poor awareness (inadequate). this finding is consistent with the previous study who founded that in the respondents answers on the general knowledge of toxoplasmosis ,majority of these pregnant women have no awareness or unsure about this parasitic infection(9).This finding indicates the importance of educating the pregnant women with the preventive measures (1).
Table (3) Distribution of the study sample according to their awareness about signs and symptoms of toxoplasmosis.
ItemsYes No
Total MS*F. % F. %
Can toxoplasmosis in pregnant women cause?1-Fever and fatigue
38 38% 62 62% 100 1.38
2- Feeling like influenza (Headache, sneezing).
46 46% 54 54% 100 1.46
3-loss of appetite41 41% 59 59% 100 1.41
4-Vomiting and diarrhea 44 44% 56 56% 100 1.44
5-Swollen glands37 37% 63 63% 100 1.37
Grand mean 1.41 (Inadequate)
*MS= Mean of score

1870 Indian Journal of Public Health Research & Development, November 2019, Vol. 10, No. 11
Table (3) this table showed that the grand mean of score (1.41) for women’s awareness about signs and symptoms of toxoplasmosis were below cutoff point which mean poor awareness (inadequate). Our finding is supported by a previous study which found that the most of pregnant women 83% were not sure about the risk factors and symptoms of
toxoplasmosis and medical staffs had lack of knowledge on this parasitic infection so an appropriate health education could then be provided to pregnant women and the health care related staff to better understand manifestation of this parasitic infection (1,10).
Table (4) Distribution of the study sample according to their awareness concerning methods of transmission.
ItemsYes No
Total MS*F. % F. %
Can people get toxoplasmosis by
1-direct contact with cats feces 76 76% 22 22% 100 1.76
2-Cats eating infected rodents , birds or other small ani-mals. 74 74% 24 24% 100 1.74
3-Eating under cooked meat. 52 52% 45 45% 100 1.52
4-Receiving blood transfusion 63 63% 35 35% 100 1.63
5-Ingestion of raw or partly cooked meat. 54 54% 46 46% 100 1.54
6-Un washed fruits or vegetables contaminated with in-fected cat feces. 77 77% 23 23% 100 1.77
7-Mouth touch after gardening without gloves. 78 78% 20 20% 100 1.78
8-Changing cat litter box. 82 82% 12 12% 100 1.82
9- Drinking untreated water and milk (un boiled). 33 33% 67 67% 100 1.33
10- Receives a transplanted organ. 35 35% 65 65% 100 1.35
Grand mean 1.62(Adequate)
*MS= Mean of score
Table(4) this table demonstrated the grand mean of score (1.62) for women’s awareness concerning methods of transmission were above the cutoff point which mean good awareness (adequate) ,other study showing that having
a close contact with cats and cleaning their litter may transmit the disease to pregnant women (11),while the results of present study were disagree of the finding of previous study who founded that there was a low level of awareness about methods of transmission(1).

Indian Journal of Public Health Research & Development, November 2019, Vol. 10, No. 11 1871
Table (5) Distribution of the study sample according to their awareness about the effects of toxoplasmosis.
ItemsYes No
Total MS*F. % F. %
1-Can toxoplasmosis passed from mother to fetus through placenta 64 64% 36 36% 100 1.64
2-Can toxoplasmosis cause congenital malformations 33 33% 67 67% 100 1.33
3- Can toxoplasmosis cause damaged the baby’s eyes 38 38% 62 62% 100 1.38
4- Can toxoplasmosis cause brain and nervous system damage (seizures) 44 44% 56 56% 100 1.44
5- Can toxoplasmosis cause fetus death 48 48% 52 52% 100 1.48
6- Can toxoplasmosis cause miscarriage 75 75% 25 25% 100 1.75
7-Can new born baby born with no symptoms but the symptoms developed after that 28 28% 72 72% 100 1.28
8- Can pregnant woman develop serious complications after infection with toxoplasmosis 55 55% 45 45% 100 1.55
Grand mean 1.48(Inadequate)
*MS= Mean of score
Table (5) this table demonstrated the grand mean of score (1.48) for women’s awareness about the effects of toxoplasmosis were below cutoff point which mean poor awareness (inadequate).Some studies have been reports that exposure to infected cats by these women
could lead to severe out comes to her carried fetus (11,12).Other previous studies high light the importance of health education among the pregnant women to reduce the seroprevalence of this disease hence minimizing the adverse effects of infection in the fetus or newborn (10).
Table (6) Distribution of the study sample according to their awareness regarding preventive behaviors.
ItemsYes No
Total MS*F. % F. %
Toxoplasmosis can be prevented by1-Feeding your cat dry or commercial cat food and not letting it kill and eat rodents 75 75% 25 25% 100 1.752-Avoiding stray cats 85 85% 15 15% 100 1.853-Wear disposable gloves in changing cats litter box. 89 89% 11 11% 100 1.894-Making sure the cats litter box is changed daily. 88 88% 12 12% 100 1.885-Wash your hands after gardening 84 84% 16 16% 100 1.846- Washing all fruits and vegetables before eating 93 93% 7 7% 100 1.93

1872 Indian Journal of Public Health Research & Development, November 2019, Vol. 10, No. 11
7-Cleaning all catting boards and utensils thoroughly after each use. 89 89% 11 11% 100 1.89
8-Wash your hands after handling raw meat. 84 84% 16 16% 100 1.849-Cook food to safe temperature. 85 85% 15 15% 100 1.85 Grand mean 1.86(Adequate)
*MS= Mean of score
Table (6) this table demonstrate the grand mean of score (1.86) for women’s awareness regarding preventive behaviors a bout toxoplasmosis were above cutoff point which mean good awareness (adequate). This finding is supported by a previous study in Malaysian and Thailand showed that pregnant women appear to have better precaution or preventive practices toward toxoplasmosis infection(13,14).Awareness about toxoplasmosis and its related preventive knowledge and behaviors may reduce the infection rate and its disease burden in pregnant women(1).
Conclusion
The study has concluded the following:-
The highest percentage of the study sample were in age group 20-29 years , primary school graduate , house wife , had no previous history to toxoplasmosis infection , had no close contact with cats , in third trimester of gestation , have more than two children and had no history of abortion
Regarding the health awareness of the study sample, the findings indicated that inadequate level of awareness about the general information, signs and symptoms, and effects of toxoplasmosis infection, while concerning methods of transmission and preventive behaviors about toxoplasmosis indicated adequate level of awareness.
Source of Funding :Self
Ethical Clearance :The data were collected from participants after obtaining permission from each of them.
References
1. Andiappan H. ,Nissapatorn V. ,Sawangjaroen N. ,Khaing SL. , Knowledge and practice on toxoplasma infection in pregnant women from Malaysia, Frontiers in microbiology,2014 Jun. 11(5)291.
Cont... Table (6) Distribution of the study sample according to their awareness regarding preventive behaviors.
2- Hunter CA. , Sibley LD. , Modulation of innate immunity by toxoplasma gondii virulence effectors ,Nature Reviews Microbiology, 2012,Nov.10(11)266-78.
3- NilgunT. ,Diagnosis of toxoplasmosis in pregnancy, HOAJ biology,2012,Aug.4:1-8 .
4- DupontCD.,Christian DA.,Hunter CA. , Immune response and immunopathology during toxoplasmosis ,SeminImmunopathol,2012Nov. 34(6) 793-813.
5- Cook A. ,Gilbert R.,Buffalano W., Source of Toxoplasma infection in pregnant women –control study, Brit.Med.J.,2000,321:142-147.
6- DubeyJP., Jones JL. , Toxoplasma gondii infection in human and animals in United States, International Journal for parasitology,2008sep.,38(11) 1257-78.
7- Clifton Rd. , Pregnant women with toxoplasmosis infection ,BMS public health ,2015Dec.32(11) 522-528.
8- Doudou Y., Renaud P.,Coralie L., Toxoplasmosis among pregnant women, Asian Pac.J.Trop. Biomed.2014,4,69-74.
9- ElsheikhaHM. , Congenital toxoplasmosis priorities for further health promotion action, public health,2008Apr. 122(11)335-53.
10- AmandaF. ,Reysla S. , BlimaF. , Ana M. , Epidemiologic aspects of toxoplasmosis and evaluation of its seroprevalence in pregnant women ,Rev.Soc.Bras.Med. ,2012 May\June,45(3)ISSN 0037-8682.
11- Torry EF.,Yolken RH. , Toxoplasma oocytes as a public health problem, Trends parasite ,2013Aug29(8)380-4.
12- TorgersonPR.,Mastroiqcovo p.,The global burden of congenital toxoplasmosis, Bull World Health Organ ,2013July1,19(7)501-8.
13- Martens S., parvanovaI. , Zerrahn J., Griffiths,

Indian Journal of Public Health Research & Development, November 2019, Vol. 10, No. 11 1873
G.,Disruption of toxoplasma gondiiparasitophorous vacuoles by the mouse,PLOS pathogens ,2005 Nov. 1(3)e24.
14- Fabianne C., Ana G., Mary L. ,Jose B., Preventive behavior for toxoplasmosis in pregnant adolescents in the state of ceara ,Brazil, BMS public health ,2012Jan 12:73.

Cytotoxic Effect of Vinca rosea Aqueous Extracts on (L20B) Cell Line In Vitro
Hind H. Obaid1, Liqaa H. Saqban2, Lamia Y. Mohammed3
1 Dep. of Biology, College of Science, Baghdad University, Baghdad, 2Dep. of Biology, College of Education Pure Science, Karbala University, Karbala, 3Middle Technical University, Baghdad, Iraq
Abstract
The present study investigated the cytotoxic effects of aqueous crude extracts of Vinca rosea leaves , flowers and seeds on cell line (L20B Cell line)in vitro , by using double dilution series (concentration between 1.95 – 1000 µg/ ml.
The results showed that the cytotoxic effect of extract is dependent on type of extract, amount of dose and exposure time. The concentration 1000 µg/ml gave the highest growth inhibition (IR) (74 and 74%) to leaves and flowers respectively compared with control 100% after 24 hours exposure time, but seeds were (49%) after 48 hours. However, low concentrations of aqueous extracts were found to induced the L20B cells growth and proliferation (PR), which recorded (122, 123) % by treatment with flowers extract in 1.95 µg/ml after 72 hours. Crude aqueous extract of Vinca rosea had hormetic effect (Hormesis), because it also induced the proliferation of cancer cells by using low concentrations of the extract.
KeyWords: L20B, Vinca rosea, cytotoxicity, Inhibitory Rate.
Introduction
Cancer emerged as a leading cause of death in the world. It is a serious disease that kills millions of people every year, and during lifetime, it affects one in two men, one in three women, while it causes death of one in four women[1].Cancer remains a problem for scientists despite the existence of several methods of treatment. There are chemotherapy, physiotherapy and surgical therapies, but all of them were not convincing for doctors or the patient himself. Thus, research centers and researchers turned to find other alternative therapies for the existing treatments and took another approach that may have great hope to eliminate the disease. Commercial drugs cost large amounts to import, and their effectiveness is gradually lost by continuous use due to the resistance of cancer cells to these medicines [2]. Therefore, many countries worldwide paid much attention to their plants as the natural source of drugs [3]. The discovery of anticancer effect of alkaloids of Vinca rosea plant gave it a great medical importance, because these alkaloids are chemotherapeutical agents for different types of human cancers [4,5].
About 75 types of alkaloids have been discovered, some of which have anticancer effects, including vinblastine and vincristine [6], as well as the use of this plant for the treatment of diabetes [7]Several studies were also carried out to use the plant extract in the treatment of microbial diseases such as skin diseases[8].Mitosis inhibitors such as Vinca alkaloids, derived from the Vinca rosea (Cathathanthus roseus) occupy a special place among chemotherapeutical drugs used in the treatment of many types of cancer [4,9].In this sense, and in order to enhance the study of the effect of natural plant extracts found in the Iraqi environment against some cancerous and transformed cell lines as a first step to explore their counter effects, this study was designed (as a part of an extensive study of different cell types) to investigate the effect of crude extracts of the Vinca rosea plant in the local Iraqi environment in inhibiting the growth of the L20B mouse fibroblast cell line.
Materials and Method
• Plant collection: The Vinca rosea was collected as an ornamental plant in the gardens of the College of Education/University of Karbala, and the plant was classified by the Iraqi National Herbarium/

Indian Journal of Public Health Research & Development, November 2019, Vol. 10, No. 11 1875
Public authority for the examination and certification of seeds of the Ministry of agriculture. After the plant was collected and cleaned, it was washed thoroughly by tap water, and the plant parts (leaves, flowers and seeds) were separated and left to dry in the dark and at room temperature in a well ventilated dry environment to prevent damage of the samples. After drying of these three parts, they were finely grinded with an electric mill, then preserved in clean plastic containers away from light, heat and moisture until use.
Preparation of crude aqueous extracts of Vinca rosea: The cold aqueous extract was prepared according to the method used by Harborne et al[10], by taking 50 g of the dry powder for each part of the plant and adding 250 ml of distilled water and left the mixture on the magnetic stirrer at room temperature for 3 days, then the mixture was filtered by gauze then by filter paper (Whatman No.1). After that, the supernatant was dried to get the dry powder from which the required concentrations were prepared.
Indicative chemical detection of effective compounds: The types of secondary chemical metabolites found in the studied plant extracts (alkaloids, terpenes, flavonoids and glycosides) were determined, depending on what is stated in [10].
Study toxic effects of Vinca rosea extracts on the growth of (L20B) cell line
Type of the studied cancer cells: The (L20B) mouse fibroblast cell line was used by passage (18). The cells were grown on tissue culture medium with Minimum Essential Media (MEM), supplied by Sigma (USA) company with 5% (Fetal Calf Serum / FCS) supplied by the company itself.
Cytotoxic effects: Multiple (96) tissue culture microtiter plates, flat bottom were used to perform this experiment, which included three stages:
Cell seeding:
- After the growth and multiplication of cells, the containers with monolayer were taken, then cells were harvested using Trypsin-Versin (T.V) solution.
- Twenty ml of the serum-containing culture medium was added to each container and mixed well. Then, the cells were counted by the (Haemocytometer) using the (1%) trypan blue dye according to what
indicated by Freshney [11].
- By a micro pipette, (0.1) ml from the cell suspension was taken and placed in each well of the plate. Each well contained (1 × 10 4) cell / well. The surface of the plate was then covered with a special sterile transparent adhesive paper for this purpose and the plate was moved gently, after that incubated at (37C0) until the next day to allow (cell attachment).
2- Exposure of cancer cells to the plant extract:
The next day of seeding, serial dilutions were done in sterilized test tubes for each type of plant extract using the MEM-Serum free media, and dilutions from 1/2 to (1/1024) started gradually, which yielded the concentrations from 1000 to 1.95 µg/ml) respectively, taking into account to prepare the dilutions simultaneously at work. The culture media was poured from the wells after lifting the adhesive paper. The column No. (1) was considered as a negative control, as 0.2 ml of the serum free culture medium was added to it, while to the columns from 2 to 12 the dilutions of the extract, which were prepared as (0.2 ml / well / concentration) were added, and then a new layer of adhesive paper was re-placed on the surface of the plate.
The plates were incubated at (37C), while exposure times were (24,48 and 72) per hour.
Cytotoxicity assay:
Crystal violet stain was used to detect the cytotoxic effect of the extracts on cells pursuant to the following:
After the end of each incubation period, the plates were taken and their contents were poured and then washed with Phosphate Buffer Saline (PBS) solution, and 0.1 ml of crystal violet stain.
was added to each well, and left for (20) minutes. The cells were then washed with PBS solution several times until the excess stain disappeared. After the plates were dried completely, the results were read using the ELISA microplate spectrophotometer at a wavelength of 492 nanometers. The mean inhibitory Rate / I.R was measured according to the equation indicated by [12], and the mean proliferation rate / PR was calculated according to[13].
Finding
Indicative detection of active chemical

1876 Indian Journal of Public Health Research & Development, November 2019, Vol. 10, No. 11
compounds: Detection of chemical compounds in the Vinca rosea extract showed that they contained (alkaloids, terpenes, flavonoids and glycosides).
Cytotoxic effect of Vinca rosea extract on (L20B) Cell Line
Cytotoxic effect of the leaf extract:The toxic effect of leaf extract was studied in the L20B cell line by passage (18). The results shown in figure (1), revealed that the inhibitory toxicity effect was on the first day of exposure because it gave the best results, when the highest percentage of inhibitory rate (IR) growth inhibition was 74% at the concentration of 1000 µg/ ml of the extract after the first 24 hours of exposure. After that, the inhibition decreases as the concentration decrease, however, it remains effective. The lowest concentration used of 1.95 µg / ml gave a 41% growth inhibition. It is also noticed that the inhibitory effect 48 to 72 hours after treatment with plant extract was generally similar to the treatment after 24 hours, although it began to decline over time, because the highest rate of growth inhibition was 61% and 40% (with a viability rate of 39% and 60%) at 1000 µg/ml concentration after 48 and 72 hours of treatment respectively.
Figure (1): Effect of aqueous extract of the Vinca rosea leaves on the percentage of inhibitory rate on L20B cell line after different exposure time.
Cytotoxic effect of the flower extract: The results of the treatment of the L20B cell line with the Vinca rosea flower extract revealed that the inhibitory effect was similar for the three periods of time and gave a similar growth inhibition rates (IR) when using the first three high concentrations, reaching (74, 74, 65)% after 24 hours and (74, 73, 58)% after 48 hours and (71,62,56)% after 72 hours at the concentrations (1000, 500 , 250) µg / ml respectively. After that, the inhibition gradually began to decline with decreasing the concentration reaching to
(8.3)% at 1.95 µg/ ml after 24 and 48 hours of exposure respectively as shown in figure (2). While the rate of cell growth was gradually increased beginning from 62.6 µg / ml making the proliferation rate reach to 123% at 1.95 µg / ml after 72 hours of treatment compared with control (100%).
Figure (2): Effect of aqueous extract of the Vinca rosea flowers on the percentage of inhibitory rate onL20B cell line after different exposure time.
Cytotoxic effect of seed extract:There was less inhibition effect of the extract of Vinca rosea seeds on the L20B cell line compared with the two previous extracts (leaves and flowers). The best results were observed after 48 hours of exposure and then the rate of inhibition of growth decreased after 72 hours (increased cell viability). The toxic effect reached to 42% (cell viability 58%) after 24 hours of treatment at the highest used concentration of 1000 µg/ ml. In addition, the growth-stimulating effect appeared after 72 hours of treatment only, ranging from (110-122)%, and began to appear at the concentration of 7.8125 µg/ ml reaching to a minimal concentration of 1.95 µg/ ml respectively. figure (3).
Figure (3): Effect of aqueous extract of the Vinca rosea seeds on the percentage of inhibitory rate onL20B cell line after different exposure time.
Comparison effect of the exposure time on the viability of the L20B cell line of the three studied extracts.
4
Finding Indicative detection of active chemical compounds: Detection of chemical
compounds in the Vinca rosea extract showed that they contained (alkaloids, terpenes, flavonoids and glycosides).
Cytotoxic effect of Vinca rosea extract on (L20B ) Cell Line - Cytotoxic effect of the leaf extract:The toxic effect of leaf extract was
studied in the L20B cell line by passage (18). The results shown in figure (1), revealed that the inhibitory toxicity effect was on the first day of exposure because it gave the best results, when the highest percentage of inhibitory rate (IR) growth inhibition was 74% at the concentration of 1000 µg/ ml of the extract after the first 24 hours of exposure. After that, the inhibition decreases as the concentration decrease, however, it remains effective. The lowest concentration used of 1.95 µg / ml gave a 41% growth inhibition. It is also noticed that the inhibitory effect 48 to 72 hours after treatment with plant extract was generally similar to the treatment after 24 hours, although it began to decline over time, because the highest rate of growth inhibition was 61% and 40% (with a viability rate of 39% and 60%) at 1000 µg/ml concentration after 48 and 72 hours of treatment respectively.
Figure (1): Effect of aqueous extract of the Vinca rosea leaves on the percentage of
inhibitory rate on L20B cell line after different exposure time.
- Cytotoxic effect of the flower extract: The results of the treatment of the L20B cell line with the Vinca rosea flower extract revealed that the inhibitory effect was similar for the three periods of time and gave a similar growth inhibition rates (IR) when using the first three high concentrations, reaching (74, 74, 65)% after 24 hours and (74, 73, 58)% after 48 hours and (71,62,56)%
Concentration leaves extract (μg/ml)
Inhi
bito
ry r
ate
(100
%)
Concentrate of leaf extract: μg / mL
5
after 72 hours at the concentrations (1000, 500 , 250) µg / ml respectively. After that, the inhibition gradually began to decline with decreasing the concentration reaching to (8.3)% at 1.95 µg/ ml after 24 and 48 hours of exposure respectively as shown in figure (2). While the rate of cell growth was gradually increased beginning from 62.6 µg / ml making the proliferation rate reach to 123% at 1.95 µg / ml after 72 hours of treatment compared with control (100%).
Figure (2): Effect of aqueous extract of the Vinca rosea flowers on the percentage of inhibitory rate onL20B cell line after different exposure time.
- Cytotoxic effect of seed extract:There was less inhibition effect of the extract of Vinca rosea seeds on the L20B cell line compared with the two previous extracts (leaves and flowers). The best results were observed after 48 hours of exposure and then the rate of inhibition of growth decreased after 72 hours (increased cell viability). The toxic effect reached to 42% (cell viability 58%) after 24 hours of treatment at the highest used concentration of 1000 µg/ ml. In addition, the growth-stimulating effect appeared after 72 hours of treatment only, ranging from (110-122)%, and began to appear at the concentration of 7.8125 µg/ ml reaching to a minimal concentration of 1.95 µg/ ml respectively. figure (3).
Concentration flowers extract (μg/ml)
Concentrate of leaf extract: μg / mL
Cel
l Res
pons
e( IR
or
PR)%
6
-
Figure (3): Effect of aqueous extract of the Vinca rosea seeds on the percentage of inhibitory rate onL20B cell line after different exposure time.
Comparison effect of the exposure time on the viability of the L20B cell line of the three studied extracts. When a comparison between the viability of the three studied extracts (leaves, flowers and seeds) at each time of exposure, it was found that the first 24 hours of treatment showed the highest growth inhibition rates, as the viability of the cells was (26)%, (growth inhibition rate was 74%) for leaf and flower extracts and at the highest treated concentrations with 1000 µg/ ml (Fig. 4). In addition, results of 48 hour exposure were generally different from the 24 hour exposure, since the inhibition rate of leaves and flowers declined, while the highest rate appeared when the seed extract was used reaching to (49%), (51% viability) at 1000 µg/ ml concentration, and these rates decreased for all used concentrations compared with the exposure time of 24 hours (figure 5). The cell inhibitory rate within 72 hours of exposure was (40%, 71% and 42%) at 1000 µg/ml, (the viability rate was 60%, 29% and 58%) respectively, compared to control 100% (figure 6). It is observed that the viability rate of these cells begin to increase when low concentrations of flower and seed extracts are used to reach the highest viability rate (122 and 123)% respectively at 1.95 µg/ ml concentration. The results obtained showed that L20B cells were more sensitive to leaf and flower extracts and less sensitive to seed extract due to the high rate of cell viability.
Concentration seeds extract (μg/ml)
Concentrate of leaf extract: μg / mL
Cel
l Res
pons
e( IR
or
PR)%

Indian Journal of Public Health Research & Development, November 2019, Vol. 10, No. 11 1877
When a comparison between the viability of the three studied extracts (leaves, flowers and seeds) at each time of exposure, it was found that the first 24 hours of treatment showed the highest growth inhibition rates, as the viability of the cells was (26)%, (growth inhibition rate was 74%) for leaf and flower extracts and at the highest treated concentrations with 1000 µg/ ml (Fig. 4). In addition, results of 48 hour exposure were generally different from the 24 hour exposure, since the inhibition rate of leaves and flowers declined, while the highest rate appeared when the seed extract was used reaching to (49%), (51% viability) at 1000 µg/ ml concentration, and these rates decreased for all used concentrations compared with the exposure time of 24 hours (figure 5). The cell inhibitory rate within 72 hours of exposure was (40%, 71% and 42%) at 1000 µg/ml, (the viability rate was 60%, 29% and 58%) respectively, compared to control 100% (figure 6). It is observed that the viability rate of these cells begin to increase when low concentrations of flower and seed extracts are used to reach the highest viability rate (122 and 123)% respectively at 1.95 µg/ ml concentration. The results obtained showed that L20B cells were more sensitive to leaf and flower extracts and less sensitive to seed extract due to the high rate of cell viability.
Figure (4): Comparison the effect of aqueous extracts of Vinca rosea on L20B cell viability after 24 h. exposure time.
Figure (5): Comparison the effect of aqueous extracts of Vinca rosea on L20B cell viability after 48 h. exposure time.
Figure (6): Comparison the effect of aqueous extracts of Vinca rosea on L20B cell viability after 72 h. exposure time.
Due to the importance of finding effective substances against cancer and finding more types of plants that possess these substances, the Vinca rosea, one of the locally available medicinal plants with different therapeutic properties, was [selected to identify the effects of crud aqueous extracts on L20B cell line] (as part of an extensive study in this field in many cancer cell lines) and the extent to which these extracts can be used as anticancer medical treatment in the future.The extracts of Vinca rosea contain many compounds and, as shown in the indicative chemical detection, the presence of alkaloids, terpenes, flavonoids and glycosides which may contribute to the better killing of cancer cells as a result of synergistic effect between them, which may reduce the toxicity of the used pure compounds.
The results showed that the crud extracts played a role in killing LB20 cells and inhibiting their growth and their division in vitro. The results indicated that the toxic effect of Vinca rosea on L20B cells was based mainly on the concentration used, exposure time and type of extract. The leaves extract had the best effect. On the other hand, it is observed that this type of cell, according to the results of this study, is sensitive to the prepared therapeutic aqueous extracts, as it inhibited the growth of cells, on contrary to the seed extract, which did not exceed the percentage of 49% inhibition after 48 hours of treatment using the high concentration of 1000 µg/ml, then the inhibitory effect is reduced when the exposure time is increased for all types of extracts. These results indicate that the effect of leaves and flower extracts is during the first 24 hours of exposure and at high concentrations, so when its effect is diminished, the living cells begin to reactivate and divide, showing the importance of giving repeated and continuous high doses to ensure the killing of all remaining cancer cells. The same thing occurs with the seed extract, which gives the best results after 48 hours of exposure and then the inhibition decreases and the cells reactivate.
7
Figure (4): Comparison the effect of aqueous extracts of Vinca rosea on L20B cell viability after 24 h. exposure time.
Figure (5): Comparison the effect of aqueous extracts of Vinca rosea on L20B cell viability after 48 h. exposure time.
Concentration of extracts (μg/ml)
Concentration of extracts (μg/ml)
Cel
l Res
pons
e (1
00%
),afte
r 48
h.
C
ell R
espo
nse
(100
%),a
fter
24 h
.
Cel
l Res
pons
e (1
00%
),afte
r 72
h.
1878 Indian Journal of Public Health Research & Development, November 2019, Vol. 10, No. 11
A study performed by Yaseen et al[14]who compared between the two types of alcohol and aqueous extracts, and found that alcohol extracts are more effective than their aqueous counterparts on Hep-2 cells. This may be due to the fact that the ratio of the active substance extracted with ethanol (70% ) is greater when using the aqueous extract, and this is reported by Harborne et al[10]. In two local studies on the same extracts in two cancer cell types - human cervical cancer cells (Hela-cells) [15] and human brain cancer cells (AMAG) [16], the results showed that both types of cancer cell lines were resistant to the aqueous Vinca rosea extracts (Leaves, flowers and seed), where low inhibition rates were recorded (not exceeding 46% in Hela cells and 64% in AMAG cells) using the highest concentrations (1000 µg/ml), while the L20B cells were shown to be sensitive to the same extracts. This is likely due to different receptors and antigenic determinants on the surface of each of the cancer and transformed cells.
The crud extracts of Vinca rosea contain a high percentage of alkaloids, which contain more than 75 types [17], as well as the presence of terpenes, phenols [18] and many mineral elements [19]. The proportion of secondary metabolic products in the plant varies according to the type of plant organ (leaves, flowers or seeds), and this is also affected by surrounding environmental factors[18]. Alkaloids are themost important and most effective substances in these extracts. The mechanism of their action is to inhibit the mitotic division, to keep the cells in the metaphase by inhibiting the polymerization of the protein Tubulin which is responsible for the formation of spindle fibers [9,20]. In addition, alkaloids inhibit the building of nucleic acids in vitro[21]. Several previous studies have also indicated that Vinca rosea alkaloids are effective against cancer cells, including human cervical cancer cells (Hela cells), because low concentrations cause inhibition to spindle fibers action [22,23]. On the other hand, Parekh and Simpkins [24] confirmed that these alkaloids affect on cancerous lymphocyte cells of rat and on human ovarian cancer cell line that are resistant to commonlychemotherapies used such as Cisplatin, as well as its being more effective than Taxol and Adriamycin.
Regarding the effectiveness of phenolic compounds, including flavonoids, which have an antioxidant effect by removing the generated free radicals and they direct the cell to enter apoptosis stage [25].
Many effective compounds effect on opposite directions depending on the concentration used. As noted by the above results, high concentrations inhibited the growth of L20B cells, while the low concentrations stimulated growth of these cells, increasing the viability by (122-123)% compared to the control (100%), indicating that the extract under study has a Biphasic effect [26], or Hormetic effect. There are many chemical therapeutical compounds, antibiotics, and toxins whose action is governed by the Hormesis phenomenon (abiological phenomenon common in toxicology), which act at low concentrations to stimulate, and may be useful to the organism, especially when the immune cells are activated, while high doses cause partial or total inhibition to the cells [27].
It is worth mentioning that the extract used in this study is crud extract, it contains many types of active compounds whose effectiveness was previously indicated or not mentioned, which supports the results of the emergence of antagonism in the influence on L20B cells depending on the concentration used. It is likely that its effect on the genetic material is in two directions, the first causes the inhibition of certain genes, while the other stimulates growth and multiplication.
Conclusion
The results showed that L20B cells were more sensitive to leaf and flower extracts and less sensitive to seed.
Conflict of Interest: Non
Funding: Self
Ethical Clearance: Non
References
1. American Cancer Society . Cancer Facts and Figures 2015 American Cancer Society, Atlanta.2015.
2. Murray RK. Cancer, Cancer Genes, and Growth Factors. In: Harper’s Biochemistry.( 24th Ed). Murray RK, Granner DK,Mayes PA, Rodwell VW (Eds.), Appleton and Lange, Stamford1996 . pp. 757-778.
3. Safarzadeh E, Shotorbani SS, Baradaran B. Herbal Medicine as Inducers of Apoptosis in Cancer Treatment. Adv Pharm Bull 2014;4(1):421-427.
4. Aslam JHK, Sheba HS, Zahid F, Zohra M,Mukthar A. Catharanthus roseus Don. Lan Important Drug

Indian Journal of Public Health Research & Development, November 2019, Vol. 10, No. 11 1879
IT’S Applications and Production, Pharmacie Globale (IJCP) 2010;4:12.
5. Al-Azawee NHI. The cytotoxic effect of some chemotherapti drugs & functional activity of breast cancer patients peripheral blood lymphocytes. International Journal of Advanced Research2015; 3( 1 ): 81-86
6. Almagro L, Fernandez-Perez F, Pedreno MA.Indole Alkaloids from Catharanthus roseus: Bioproduction and Their Effect on Human Health, Molecules2015;20: 2973-3000.
7. Ahmed MF, Kazim SM, Ghori SS, Mehjabeen SS, Ahmed SR, Ali SM, Ibrahim M. Antidiabetic activity of vinca rosea extracts in alloxan – induced diabetic rats.Int. J. Endocrinology 2010;6:81-90.
8. AL-makhzumi AA, AL-dulaimy HH, Jawaad AM.In vivoeffect of Catharanthus roseus crude extracts on pathogenic bacteria isolated from skin infections. Iraqi Journal of Science2015; 56( 1) : 656-664.
9. Mohammed IH. Effect of Vincristine and Vinblastine from Vinca rosea on Microtubules of Tumor H22 Cell line.Diyala Journal of Medicine2012; 3 (1):97–104.
10. Harborne JB. Phytochemical Methods . (2nd ed.) Chapman and Hall, H. p. London 1984;pp193 .
11. Freshney RI. Culture of animal cells: A manual for basic technique. 4th ed. Wiley-Liss, A John Wiley and Sons, Inc. Publication, New York 2000.
12. Gao S, Yu B, Li Y, Dong W, Luo H. Antiproliferative effect of Octreotide on gastric cells mediated by Inhibition of Akt/PKB and telomerase.World J. Gastroenterol, 2003; 9:2362-5.
13. Chumchalova J, Smarda J. Human Tumor Cells are Selectively Inhibited by Colicins. Folia Microbiol. 2003; 48: 111-5.
14. Yaseen Ny, Husan HR, Saqban LH. Study the Effect of Vinca roseaCrud Extracts onMammalian Cancer and Normal Cell Lines Growth In vitro. Journal of Karbala University (A special issues of researchesof the fifth scientific conference of the University of Karbala),2009.
15. Obaid HH, Saqban LH.Al-Darraji MNJ, karim RM,Passat DN, Ahmed DA.Cytotoxicity Effect of Vinca roseaAqueous Extracts onHuman CervixUteri Epitheloid CarcinomaCell Line (Hela) In Vitro. Iraqi Journal of Biotechnology2015;14(2): 388-402.
16. Saqban LH, Obaid HH,Al-Darraji MNJ, karim RM, Ahmed DA. Passat DN.Cytotoxicity Effect of Vinca roseaAqueous Extracts onHuman BrainCarcinomaCell Line (AMAG) In Vitro. Engineering and Technology Journal 2016;34 parte B(3):129-140.
17. Mukherjee AK, Basu S, Sarkar N, Ghosh CA. Advances in cancer therapy with plant based natural products.Current Medicinal Chemistry 2001;8:1467-1486.
18. Vazquez-Flota F, Carrillo-Pech M, Minero-Garcia Y, Mirand-Ham M. Alkaloid metabolism in wounded Catharanthus roseus seedlings . Plant Physiology and Biochemistr2000; 42:623-628.
19. Sahito SR, Kazi TG, Kazi GH, Jakhrani MA, Shaik MS. Trace elements in two varieties of indigenous medicinal plant Cathranthus roseus (Vinca rosea). The Science 2001;74-77.
20. Ngan VK, Bellman K, Hill BT, Wilson L, Jordan MA. Mechanism of mitotic block and inhibitionof cell proliferation by the semisynthetic vinca alkaloids vinorelbine and its new derivative vinflunine. Molecular Pharmacology2001; 60:225-232.
21. Gascoigne KE,Taylor SS. How do anti-mitotic drugs kill cancer cells?. Journal of Cell Science2009; 122: 2579-2585.
22. Becvarova P, Skorp Ikova J, Janisc HR, Novy J. Avinca Alkaloids Effect on Microtubules of HeLa Cells. SCRIPTA MEDICA (BRNO)2006; 79 (1):19–34.
23. Parekh HR, Simpkins H. Cross-resistance and collateral sensitivity to natural product drugs in cisplatin- sensitive and resistant rat lymphoma and human ovarian carcinoma cells. Cancer Chemother. Pharmacol. 1996; 37:457-462 .
24. Sathiya S, Karthikeyan B, Jaleel CA, Azooz MM, Iqbal M. Antibiogram of Catharanthus roseus extracts. Global J. Mol. Sci. 2008; 3(1) : 1-7.
25. Pedra M, Ferreira MM, Cidade H, Kijjoa A, Bronze– da – rocha E, Nascimento M. SJ.Artelastin is a cytotoxic prenylated Flavone that disturbs microtubules and interferes with DNA replication in MCF -7 human breast cancer cells . Life Sciences 2005; 77 : 993 – 311 .
26. Calabrese EJ, Baldwin LA. Hormesis : the dose - response revolution . Annu . Rev .Pharmacol . Toxicol. N2003; 43 : 175 – 197

Detection of Human Papillomavirus in Cervical Mucus of Women with Spontaneous Abortion by Real-Time PCR
Asmaa M. S. Al-Bayati1, Muhannad Abdullah Alazzawy2
1 Ph.D. Medical Microbiology, Department of Medical Lab, University/Technical College, North Technical, Kirkuk City, Iraq, 2 Ph.D. Medical Microbiology, Medical Lab Consultant, Children Hospital, Kirkuk Health
Directorate, Kirkuk City. Iraq
Abstract
The aim of the study was to detect of human papillomavirus (HPV) in cervical mucus of women with spontaneous abortion by real-time PCR. Cervical mucus of 200 women with spontaneous abortion and 100 full term pregnant women were included in this cross-sectional which carried out in Kirkuk city-Iraq from beginning of 1st of October 2018 to the end of December 2018. HPV DNA was detected real-time PCR of genotype 16, 18 and 58 in cervical samples. The study showed that the highest rate of HPV DNA (29.5%) was detected in women with abortion comparing with pregnant women (12%) with highly significant relation of HPV with abortion (P. value: <0.05). The study stated that the highest rate of aborted women was infected with HPV 16 (37.29%) followed by HPV 58 (30.26%) while HPV 18 was found in 12.26% of those women and 13.56% of them was infected with both HPV 16 and HPV 58 genotypes. The study exhibited that 36.37% of aborted women with one time in their marriage age was infected with HPV followed by 28.995 in women with 2-3 time, the study presented that 52.5% of women with abortion was belonged to the age group 27-36 years.
Conclusion: Spontaneous abortion was highly associated with HPV infection specially with HPV 16 genotype.
Keywords: Abortion; HPV; cervical mucus; real-time PCR
Introduction
Recurrent miscarriage (RM) is defined as the occurrence of three or more consecutive losses of pregnancy. According to this definition, it affects about 1% of couples trying to have a baby (1). However, many clinicians define RM as two or more losses; this increases the percentage of RM from 1% to 5% of all couples trying to conceive (2). The role of infectious diseases in recurrent miscarriage is not clarified yet, but proposed an incidence of 0.5–5% (3). There are some candidate infectious diseases such as Listeria monocytogenes, Toxoplasma gondii, rubella, herpes simplex virus (HSV), measles, cytomegalovirus, and coxsackie viruses. Infectious diseases may cause pregnancy loss by the following mechanisms such as direct infection of the uterus, fetus, or placenta, placental insufficiency, chronic endometritis, endocervicitis, amnionitis, or intrauterine miscellaneous infections(4). Human papillomavirus
(HPV) is one of the most prevalent sexually transmitted viral infections in men and women worldwide (5). Human papilloma virus is a group of more than 200 related viruses, some of which are spread through vaginal, anal, or oral sex. Sexually transmitted human papilloma virus types fall into two groups, low risk and high risk(3). Low-risk HPVs mostly cause no disease. However, a few low-risk HPV types can cause warts on or around the genitals, anus, mouth, or throat. In rare cases, they can cause recurrent respiratory papillomatosis, a condition in which benign tumors grow in the respiratory tract(6). High-risk human papilloma virus can cause several types of cancer. There are about 14 high-risk human papilloma virus types. Two of these, HPV16 and HPV18, are responsible for most HPV-related cancers. The existence of more than 180 HPV genotypes has been reported (7). According to the basis of oncogenic potential, HPV can be divided into 2 different groups-high-risk HPV (HR-HPV) and low-risk HPV (LR-HPV).

Indian Journal of Public Health Research & Development, November 2019, Vol. 10, No. 11 1881
Generally, the HR-HPV included HVP16, HPV18, HPV31, HPV33, HPV35, HPV39, HPV45, HPV51, HPV52, HPV56, HPV58, HPV59, HPV66, and HPV68 (8). It is well established that infections with HR-HPV can lead to cervical cancer. Moreover, recent evidence has shown that HPV infection is associated with the risk of colorectal, head, and oropharyngeal carcinomas (9). To date, a succession of studies has been published to show the association between HPV infection and adverse pregnancy outcomes(6). The aim of the study was to detect of human papillomavirus (HPV) in cervical mucus of women with spontaneous abortion
Methodology
A cross-sectional study was carried out in Kirkuk city-Iraq from beginning of 1st of October 2018 to the end of December 2018, including 200 women who attended to Kirkuk general hospital for curettage, and 100 controls (pregnant women at term of delivery) to find out DNA of HPV of HPV 16, 18 and 58 in cervical samples by real-time PCR (using Sacace biotechnology, HPV High Risk Screen Real-TM Quant). Women with positive TORCH serology IgM tests (against T. gondii, CMV, HSV) were excluded from the study. Cases were defined as women experiencing spontaneous abortion up to 20 weeks of gestation, who attended for medical attention and/or a curettage procedure. Controls were defined as women attending for delivery at term, with viable products.
Cervical swabs:
- Remove excess mucus from the cervical os and surrounding ectocervix using a cotton or polyester swab. Discard this swab.
- Insert the Sampling Cervical Brush 1.0-1.5 centimeters into the cervical os until the largest bristles touch the ectocervix. Do not insert brush completely into the cervical canal. Rotate brush 3 full turns in a counterclockwise direction, remove from the canal.
- Insert brush into the nuclease-free 2,0 ml tube with 0,3 mL of Transport medium (Sacace). Vigorously agitate brush in medium for 15-20 sec.
- Snap off shaft at scored line, leaving brush end inside tube, DNA were extracted and PCR was performed on all samples according to manufacture instructions. HPV DNAA is extracted from using RT-amplification
and detected using fluorescent reporter dye probes specific for HPV or HPV IC. The HPV IC is an internal control and represents recombinant RNA-containing-structure which carried through all steps of analysis from nucleic acid extraction to PCR amplification-detection. The total reaction volume was 25 μl, the volume of RNA sample was 12.5 μl.
1. The reagents were thawed, and the tubes were vortexed and centrifuged briefly.
2. Requested quantity of reaction tubes were prepared including 3 extraction controls, negative amplification control and 4 standards.
3. The entire contents of the tube with RT-PCR-mix-2-FRT was added to the tube with DTT, thoroughly vortexed.
4. Tubes for samples, controls and standards were prepared. The results are interpreted by the presence (or absence) of the intercept between the fluorescence curve and the threshold line which determines the presence (or absence) of the Ct values for the sample. Based on the Ct values and on the specified values of the calibrators, QS1 HPV and QS2 HPV, the calibration line will give the values for the number of HCV cDNA copies (JOE channel) and for the number of internal control (FAM channel) in a PCR sample.
Statistical Analysis
Computerized statistically analysis was performed using IBM SPSS V23.0.0 statistic program. Comparison was carried out using; Chi square and T-Test.
Finding
The study showed that the highest rate of HPV DNA (29.5%) was detected in women with abortion comparing with pregnant women (12%) with highly significant relation of HPV with abortion ( P. value: <0.05), Table 1.
Table 1: Detection of HPV DNA in mucus of cervix of aborted and pregnant women
HPV result
Aborted Women
Control group(Full term pregnant women)
No. % No. %HPV +ve 59 29.5 12 12HPV -ve 141 70.5 88 88Total 200 100 100 100
P. value: <0.05.

1882 Indian Journal of Public Health Research & Development, November 2019, Vol. 10, No. 11
The study stated that the highest rate of aborted women was infected with HPV 16 (37.29%) followed by HPV 58 (30.26%) while HPV 18 was found in 12.26% of those women and 13.56% of them was coinfected with both HPV 16 and HPV 58 genotypes, Table 2.
Table 2: Coinfection between HPV genotypes (16,18 and 58) in women with abortion
HPV genotypeAborted Women
No. %
HPV16 22 37.29
HPV 18 9 12.26
HPV 58 18 30.51
HPV 16/18 1 1.69
HPV 16/58 8 13.56
HPV 16/18/58 1 1.69
Total 59 100
The current study exhibited that arte of 36.37% of admitted women who aborted one time in their marriage age was infected with human papilloma virus followed by 28.99% in women with 2-3 time of abortion with infection of human papilloma virus, Table 3.
Table 3: Distribution of HPV infection according to number of abortion
Number of previous abortion
Total No.(200)
Aborted Women
No (59). %
1 88 32 36.37
2-3 69 20 28.99
More than 3 43 7 12.28
The study presented that 52.5% of women with abortion was belonged to the age group 27-36 years
Figure 1: Distribution of women with abortion according to age
Discussion
It is important to study human papilloma virus detection in pregnancy, which represents a special immunological state that may be a risk factor for HPV infection (6). Some studies have shown a higher frequency of human papilloma virus cervical infection in pregnant women compared to non-pregnant controls, possibly because of an effect of elevated estrogens which may affect the viral replication, or due to the altered immunity (7-9).
Human papilloma virus infection is common in the general population, including normal pregnant women. In normal full-term pregnancy, prevalence of HPV was reported to vary be tween 2.2 and 75% in the cervical tissue, with a summary estimate of 17.5% (5). Correspondingly, the preva lence of human papilloma virus was significantly higher in the cervix and placental and aborted tissue of women who underwent spontaneous abortions (8). Although the prevalence of HPV was significantly different in normal pregnancies and the spontaneous abortion group, our results based on 5 cohort studies and 3 case-control studies indicated that there was no significant association between human papilloma virus infec tion and spontaneous abortion. When the included studies reported HR-HPV in fection alone. However, the pooled OR of 4 cohort/case-control studies (9-11) reported that the HR/LR–HPV infection indicated that HPV infection was a risk factor for sponta-neous abortion. It was reported that there are 2 different pathways in the natural history of HPV infections, namely, the infec tious virion producing pathway and the clonal transform ing pathway (10). The infectious virion producing path way can lead to subfertility or early abortion and it is in fectious. Oncogenic (HR) HPV types induce more rapid cell division arrest than LR-HPV or intermediate HR-HPV types. It takes the embryo longer to die after LR-HPV infection, which makes it possible to measure the spontaneous abortion (12).
In China, a 10.2% HPV prevalence was reported, with genotypes 16 and 58 being the most frequent (29% and 19% respectively) (13). In the United States human papilloma virus prevalence reported was 35.6%, (11.6% low risk and 29.5% high risk types) (14). Another study in the United States reported 29% prevalence, the most frequent genotypes being HPV16 (21%), HPV31 (12.7%), HPV18 (9%) and HPV51 (9%) and HPV6/11 (6%) (11). In Spain, HPV prevalence found was 6.5%,

Indian Journal of Public Health Research & Development, November 2019, Vol. 10, No. 11 1883
with HPV16 and HPV6/11 being the most frequent genotypes (15).
Coinfection with multiple HPV types has been associated with a higher risk of cervical abnormalities (16,17). Longitudinal studies are needed in order to determine the risk associated with multiple infections in obstetric patients. Of relevance are the high risk genotypes, which may clear spontaneously after the inmmunological state is restored, or persist and may cause lesions. Also of importance are genotypes 6 and 11 identified in the mothers: if they are transmitted they could represent a risk for the newborn, because of the possible of development of laryngeal and respiratory papillomatosis later in childhood. The most common causes of pregnancy loss in the first trimester are of genetic origin (6). Amongst other important risk factors are maternal age younger than 20 or older than 35 years old, placental inflammation and infection, but the etiology is often uncertain (5). Conde-Ferráez et al (18) demonstrated that spontaneous abortion was associated to a previous pregnancy loss and to women’s age older than 35 years old.
Conclusion
Spontaneous abortion was associated with HPV infection specially with HPV 16 genotype.
Conflict of Interest: non
Source of Findings: Self findings.
Ethical Clearance: This research was carried out with the patient’s verbal and analytical approval before the sample was taken. According to this approval, all the samples were collected and the tests were carried out. A copy of the results of the tests was then given to the patients
References
1- Shaikh MH, McMillan NA, Johnson NW: HPV-associated head and neck cancers in the asia pacific: a critical literature review & meta-analysis. Cancer Epidemiol 2015; 39: 923–938.
2- Souho T, Benlemlih M, Bennani B: Human papillomavirus infection and fertility altera tion: a systematic review. PLoS One 2015; 10:e0126936.
3- Pereira N, Kucharczyk KM, Estes JL, Gerber RS, Lekovich JP, Elias RT, Spandorfer SD: Human
papillomavirus infection, infertility, and assisted reproductive outcomes. J Pathog 2015; 2015: 578423.
4- Depuydt CE, Jonckheere J, Berth M, Salem bier GM, Vereecken AJ, Bogers JJ: Serial type-specific human papillomavirus (HPV) load measurement allows differentiation between regressing cervical lesions and serial virion productive transient infections. Cancer medi cine 2015; 4: 1294–1302.
5- Ambuhl LM, Baandrup U, Dybkaer K, Blaakaer J, Uldbjerg N, Sorensen S: Human papillomavirus infection as a possible cause of spontaneous abortion and spontaneous pre term delivery. Infect Dis Obstet Gynecol 2016; 2016: 3086036.
7- Oborna I, Ondryasova H, Zborilova B, Brezinova J, Vrbkova J: Does presence of hu man papillomavirus (HPV) infection influ ence the results of in vitro fertilization (IVF) treatment? Fertil Steril 2016; 106:e335–e336.
8- Depuydt CE, Verstraete L, Berth M, Beert J, Bogers JP, Salembier G, Vereecken AJ, Bosmans E: Human papillomavirus positiv ity in women undergoing intrauterine in semination has a negative effect on pregnan cy rates. Gynecol Obstet Invest 2016; 81: 41– 46.
9- Verhelst S, Poppe WA, Bogers JJ, Depuydt CE: Serial measurement of type-specific hu-man papillomavirus load enables classifica-tion of cervical intraepithelial neoplasia le sions according to occurring human papillo mavirus-induced pathway. Eur J Cancer Prev 2017; 26: 156–164.
10- McDonnold M, Dunn H, Hester A, Pacheco LD, Hankins GD, Saade GR, Costantine MM: High risk human papillomavirus at entry to prenatal care and risk of preeclampsia. Am J Obstet Gynecol 2014; 210: 138.e1–e5.
11- Perino A, Giovannelli L, Schillaci R, Ruvolo G, Fiorentino FP, Alimondi P, Cefalu E, Am matuna P: Human papillomavirus infection in couples undergoing in vitro fertilization procedures: impact on reproductive out comes. Fertil Steril 2011; 95: 1845–1848.
12- Bennani B, Bennis S, Nejjari C, Ouafik L, Mel-houf MA, El Rhazi K, Znati K, Chaara H, Bou-chikhi C, Amarti Riffi A: Correlates of HPV: a cross-sectional study in women with normal

1884 Indian Journal of Public Health Research & Development, November 2019, Vol. 10, No. 11
cytology in north-central morocco. J Infect Dev Ctries 2012; 6: 543–550.
13- Fife KH, Katz BP, Brizendine EJ, Brow DR. Cervical human papillomavirus deoxyribonucleic acid persists throughout pregnancy and decreases in the postpartum period. Am J Obstet Gynecol 1999;180:1110–4.
14- Smith EM, Ritchie JM, Yankowitz J, Wang D, Turek LP, Haugen TH. HPV prevalence and concordance in the cervix and oral cavity of pregnant women. Infect Dis Obstet Gynecol 2004;12:45–56.
15- Castellsague´ X, Drudis T, Can˜adas MP, et al. Human papillomavirus (HPV) infection in pregnant women and mother-to-child transmission of genital HPV genotypes: a prospective study in
Spain. BMC Infect Dis 2009;9:74.
16- Rousseau MC, Villa LL, Costa MC, Abrahamowicz M, Rohan T, Franco E. Occurrence of cervical infection with multiple human papillomavirus types is associated with age and cytologic abnormalities. Sex Transm Dis 2003;30: 580–7.
17- Trottier H, Mahmud S, Costa MC, et al. Human papillomavirus infections with multiple types and risk of cervical neoplasia. Cancer Epidemiol Biomarkers Prev 2006;15:1274–80.
18- Conde-Ferráez L, May AD, Carrillo-Martínez JR, Ayora-Talavera G, del Refugio González-Losa M. Human papillomavirus infection and spontaneous abortion: a case–control study performed in Mexico. European Journal of Obstetrics & Gynecology and Reproductive Biology. 2013 Oct 1;170(2):468-73.

The Role of Proinfalmatory Cytokines (Interleukin-1 Beta and 6) in Pathogenesis of Breast Cancer
Maad Mohammed Sulaiman1, Khalid Nafi Salih1, Muhannad Abdullah Alazzawy2
1M.B.Ch.B.-FIB.M.S. K, Kirkuk General Hospital, Kirkuk Health Directorate, Kirkuk City, Iraq, 3 Ph.D. Medical Microbiology, Medical Lab Consultant, Children Hospital, Kirkuk Health Directorate,
Kirkuk City. Iraq
Abstract
A cross-sectional study was carried out in Kirkuk city from of November 2017 to March 2018. The number of breast cancer women under study were 55 women whose ages were between 30-70 years old. These patients admitted to Kirkuk oncology center. The control group who were matched to the breast cancer patients studied, included 35 unaffected women and their ages were between 30-75 years old. These women presented Kirkuk General Hospital Four ml of blood was collected by vein puncture using Vacutainer tubes from each patient enrolled in this study for determination the level of IL-6 and IL-10 by using ELISA. The study showed that the highest mean level of IL-1 beta was found in women with breast cancer comparing with healthy control women ( 36.92±11.1 v.s. 10.1±3.7 pg/ml) (P: ≤0.05). The highest mean level of Il-6 was found in BC women comparing with control ( 97.13±14.7v.s. 22.13±6.91 pg/ml) (P: ≤0.05). The study showed that the highest mean level of IL-1 beta was found in women with breast cancer in the first stage of disease (33.2±9.1 pg/ml) and the level was still decreased to be the lowest level in the stage IV of breast cancer (20.18±2.9 pg/ml), the result was significant (P: ≤0.05). The study showed that the highest mean level of IL-6 was found in women with breast cancer in the first stage of disease (92.1±15.8 pg/ml) and the level was still decreased to be the lowest level in the stage IV of breast cancer (67.9±9.81 pg/ml), the result was significant (P: ≤0.05)
It was concluded that there was a highly significant relation of IL-1 beta and IL-6 with breast cancer and especially in first stage of disease
Keyword: breast cancer; interleukin-1, interleukin-6
Introduction
Breast cancer is the malignant tumor in which normal cells in the breast begin to grow without control and no longer die most commonly form the inner lining of milk ducts or the lobules that supply the ducts with milk (1). In Iraq, breast cancer (BC) is the commonest type of female malignancy, accounting for approximately one third of the registered female cancers according to the latest Iraqi Cancer Registry (2). As proposed by the World Health Organization (WHO), early detection and screening, especially when combined with adequate therapy, offer the most immediate hope for a reduction in breast cancer mortality (3).
Breast cancer is a heterogeneous disease witch results from a series of genetic and epigenetic events that
lead to dysregulation of cell growth, circumvention of apoptosis, and development of the ability to invade the underlining tissue through the basement membrane(4). The causes of these events remain largely unknown, although epidemiologic studies have implicated lifestyle, environmental, and germ-line genetic factors in predisposition to this disease. Familial forms comprise approximately 20% of all breast cancers and appear to have a distinctive pathogenesis dependent on the particular susceptibility gene involved(5). Interleukin 6 (IL‐6) is a proinflammatory cytokine, which is produced by a number of immune system cells; fibroblasts, macrophages, T and B Lymphocytes, endothelial cells, keratinocytes and tumor cells (6). Interleukin 6 (IL-6), as major mediator of the inflammatory response, plays a primary role in the patho-physiology of cancer (5). Cancer

1886 Indian Journal of Public Health Research & Development, November 2019, Vol. 10, No. 11
cells exposed to IL-6 or which secrete the cytokine as an autocrine factor, show malignant features, such as an enhanced capacity to invade the extracellular matrix and an increased drug resistance (7). Based on these data, the inhibition of the IL-6/IL-6 receptor interaction with specific antibodies has been proposed as a support cancer therapy (8,9). The cytokines interleukin-6 (IL-6), tumor necrosis factor alpha (TNFalpha) and interleukin-1 beta (IL-1beta) are critical mediators of the inflammatory response. So the aim of the study was to estimate the level of IL-1 beta and IL-6 in women with breast cancer
Material and Method
A cross-sectional study was carried out in Kirkuk city from of November 2017 to March 2018. The number of breast cancer women under study were 55 women whose ages were between 30-70 years old. These patients admitted to Kirkuk oncology center. The control group who were matched to the breast cancer patients studied, included 35 unaffected women and
their ages were between 30-75 years old. These women presented Kirkuk General Hospital Four ml of blood was collected by vein puncture using Vacutainer tubes from each patient enrolled in this study for determination the level of IL-6 and IL-1 beta by using ELISA technique.
Statistical Analysis
Computerized statistically analysis was performed using Mintab ver 18.0 statistic program. Comparison was carried out using Chi-square (X2) for determination of the P. value.
Findings
The study showed that the highest mean level of IL-1 beta was found in women with breast cancer comparing with healthy control women ( 36.92±11.1 v.s. 10.1±3.7 pg/ml) (P: ≤0.05). The highest mean level of Il-6 was found in BC women comparing with control ( 97.13±14.7v.s. 22.13±6.91 pg/ml) (P: ≤0.05), Table 1.
Table 1: Level of IL-1 and IL-6 beta in breast cancer women and the control group.
Interleukins levels( Mean±SD) pg/ml
BC women Control group P. value
IL-1 beta 36.92±11.1 10.1±3.7 ≤ 0.05
IL-6 97.13±14.7 22.13±6.91 ≤ 0.05
The study showed that the highest mean level of IL-1 beta was found in women with breast cancer in the first stage of disease (33.2±9.1 pg/ml) and the level was still decreased to be the lowest level in the stage IV of breast cancer (20.18±2.9 pg/ml), the result was significant (P: ≤0.05). The study showed that the highest mean level of
IL-6 was found in women with breast cancer in the first stage of disease (92.1±15.8 pg/ml) and the level was still decreased to be the lowest level in the stage IV of breast cancer (67.9±9.81 pg/ml), the result was significant (P: ≤0.05), Table 2.
Table 2: Comparison among Level of IL-1 and IL-6 beta levels regarding stage breast cancer
Interleukins levels( Mean±SD) pg/ml
Stage I Stage II Stage II Stage IV P. value
IL-1 beta 33.2±9.1 29.8±3.6 26.8±3.8 20.18±2.9 ≤ 0.05
IL-6 92.1±15.8 80.6±13.2 77.8±10.8 67.9±9.81 ≤ 0.05

Indian Journal of Public Health Research & Development, November 2019, Vol. 10, No. 11 1887
Discussion
The role of other inflammatory cytokines (possibly TAM derived), IL- 1 was also addressed in breast carcinoma (10). The role of the IL-1 system in human breast cancer is conflicting. Initial analyses regarding IL-1 indicated that its levels were significantly higher in invasive carcinoma than in ductal carcinoma in situ or in benign lesions, implying that elevated levels of IL-1 are directly correlated with a more advanced disease (6). In addition, IL-1 has been shown to inhibit growth of breast cancer cells and to promote cellular differentiation in vitro, but it is equally known to stimulate the expression of several proteolytic enzymes in human cancer (11). The consecutive degradation of extracellular matrix is a key element of local invasion and metastasis (12). The mitogenic activity by IL-1 can be explained by induction of growthrelated oncogene (GRO) gene expression or induction of IL-8 expression via activation of the Nuclear factor B (NFκB) and activator protein (AP)-1 signal transduction pathways (13). The robust response of the metastatic- or mesenchymal-appearing breast carcinoma cells to either IL-1 or TNF may be because of elevated expression of transcription factors needed for transcription of the IL-8 gene. TNF- B, a transcription factor, which can be activated by either IL-1, is an example of such a transactivator. Activated NF- B recognizes and binds to a consensus sequence in the promoter region of the IL-8 gene(14). In this study, serum IL-6 level was evaluated in breast cancer patients as compared to healthy controls. Interleukin-6 is found to be elevated in various inflammatory and malignant diseases including metastatic breast cancer and their levels are found to correlate with the extent of the disease (9). It is produced by some types of cancer cells and by normal stromal cells, such as fibroblasts and endothelial cells. By acting as growth factor, IL-6 is able to promote tumor cell proliferation through upregulation of anti-apoptotic and angiogenic proteins in tumor cells. Also IL-6, is a major mediator of the inflammatory response, plays a primary role in the pathophysiology of cancer (15). The study results were in agreement with a recent study in Iraq made by Ayed (16) carried out on 75 breast cancer patients and 15 healthy controls. He found that serum IL-6 level for the patients was significantly higher than normal women and strongly correlated with disease progression. Also in Egypt, Ahmed et al (16) found that serum level of both IL-6 and IL-8 were found to be higher in patients than in healthy volunteers. In addition
Sullivan (17) have mentioned that breast cancer patient serum and tumor IL-6 levels are clinically relevant, and therefore, should be routinely evaluated upon diagnosis . Statistically highly significant differences were seen in the Mean serum (IL-6) concentration of all disease stages as compared to the Mean (IL-6) serum concentration of the control group (p < 0.01). We suggest that higher mean serum (IL-6) level in early disease stage may be due to the high immune response of the body in this stage of the disease. It was reported that IL-6 antitumor activity was enhanced by induction of induction of T cell and B cell differentiation, stimulation of cytotoxic T cells and help in producing lymphokineactivated killer cells (18). We thought that This immune response trigger synthesis and release of this cytokine leading to augmentation of its serum level that might be utilized as a marker of immunity status and immune system activation in prognosis and monitoring of the course of cancer (19). This immune response might be attenuated with the progression of disease stage and cancer overwhelming which reflect decrease in (IL-6) synthesis. Our hypothesis could be supported by some literatures , mentioned that IL-6 and other IL-6-type cytokines are expressed in many primary breast tumors (20). However, IL-6 expression is reduced in invasive breast carcinoma relative to normal mammary tissue and appears to be inversely associated with histological tumor grade (21). The role of IL-6 in cancer progression is dependent on the balance of multiple pathways triggered simultaneously by the cytokine. However, concomitant stimulation of the cells by other endogenous or exogenous factors, even at low concentrations, may tip the balance toward one biological response, e.g., proliferation and antiapoptosis, or another, e.g., growth arrest and differentiation (22). IL-6 has also been shown to influence the proliferation of normal and tumor-derived cells. IL-6 promote proliferation of hematopoietic progenitors, keratinocytes, myeloma/ plastocytoma, and Kaposi’s sarcoma cells, whereas it inhibits the proliferation of M1 myeloid leukemia cells, early-stage melanoma cells, and lung and breast tumor cells. Thus, depending on the target cell, IL-6 induces various and sometimes contrasting biological responses(7-9).
Conclusions: There was a highly significant relation of IL-1 beta and IL-6 with breast cancer and especially in first stage of disease.
Conflict of interest: non

1888 Indian Journal of Public Health Research & Development, November 2019, Vol. 10, No. 11
Source of Findings: Self findings.
Ethical Clearance: This research was carried out with the patient’s verbal and analytical approval before the sample was taken. According to this approval, all the samples were collected and the tests were carried out. A copy of the results of the tests was then given to the patients
References
1- Dabbs DJ. Breast Pathology E-Book. Elsevier Health Sciences; 2016 Nov 4.
2- NA N. Breast cancer: Society shapes an epidemic. Springer; 2016 Sep 23.
3- Jiao X, Rizvanov AA, Cristofanilli M, Miftakhova RR, Pestell RG. Breast cancer stem cell isolation. InBreast Cancer 2016 (pp. 121-135). Humana Press, New York, NY.
4- Holen I, Lefley DV, Francis SE, Rennicks S, Bradbury S, Coleman RE, Ottewell P. IL-1 drives breast cancer growth and bone metastasis in vivo. Oncotarget. 2016 Nov 15;7(46):75571.
5- Mantovani A, Barajon I, Garlanda C. IL‐1 and IL‐1 regulatory pathways in cancer progression and therapy. Immunological reviews. 2018 Jan;281(1):57-61.
6- Bharti R, Dey G, Banerjee I, Dey KK, Parida S, Kumar BP, Das CK, Pal I, Mukherjee M, Misra M, Pradhan AK. Somatostatin receptor targeted liposomes with Diacerein inhibit IL-6 for breast cancer therapy. Cancer letters. 2017 Mar 1;388:292-302.
7- Heo TH, Wahler J, Suh N. Potential therapeutic implications of IL-6/IL-6R/gp130-targeting agents in breast cancer. Oncotarget. 2016 Mar 29;7(13):15460.
8- Ma Y, Ren Y, Dai ZJ, Wu CJ, Ji YH, Xu J. IL-6, IL-8 and TNF-α levels correlate with disease stage in breast cancer patients. Adv Clin Exp Med. 2017 May 1;26(3):421-6.
9- Hsu EC, Kulp SK, Huang HL, Tu HJ, Salunke SB, Sullivan NJ, Sun D, Wicha MS, Shapiro CL, Chen CS. Function of Integrin-Linked Kinase in Modulating the Stemness of IL-6–Abundant Breast Cancer Cells by Regulating γ-Secretase–Mediated Notch1 Activation in Caveolae. Neoplasia. 2015 Jun 1;17(6):497-508.
10- Mendoza-Rodriguez M, Romero HA, Fuentes-Panana EM, Ayala-Sumuano JT, Meza I. IL-1β induces up-regulation of BIRC3, a gene involved in chemoresistance to doxorubicin in breast cancer cells. Cancer letters. 2017 Apr 1;390:39-44.
11- Hefler LA, Grimm C, Lantzsch T, Lampe D, Leodolter S, Koelbl H, Heinze G, Reinthaller A, Tong-Cacsire D, Tempfer C, Zeillinger R. Interleukin-1 and interleukin-6 gene polymorphisms and the risk of breast cancer in caucasian women. Clinical cancer research. 2005 Aug 15;11(16):5718-21.
12- Woodhouse EC, Chuaqui RF, Liotta LA. General mechanisms of metastasis. Cancer (Phila), 1997; 80: 1529-1537.
13- Rangnekar VV, Waheed S, Davies TJ, Toback FG, Rangnekar VM. Antimitogeni and mitogenic actions of IL-1 in diverse cell type are associated with induction of gro gene expression. J Biol Chem 1991; 266: 2415-2422
14- Jung YD, Fan F, McConkey DJ, Jean ME, Liu W, Reinmuth N, Stoeltzing O, Ahmed SA, Parikh AA, Mukaida N, Ellis LM. Role of p38 MAPK, AP-1 and NFkB in IL-1 beta induced IL-8 expression in human vascular smooth muscle cells. Cytokin 2002; 18:206-213.
15- Rodriguez-Barrueco R, Yu J, Saucedo-Cuevas LP, Olivan M, Llobet-Navas D, Putcha P, Castro V, Murga-Penas EM, Collazo-Lorduy A, Castillo-Martin M, Alvarez M. Inhibition of the autocrine IL-6–JAK2–STAT3–calprotectin axis as targeted therapy for HR−/HER2+ breast cancers. Genes & development. 2015 Aug 1;29(15):1631-48.
16- Ahmed OI, Adel AM, Diab DR, Gobran NS: Prognostic value of serum level of interleukin-6 and interleukin-8 in metastatic breast cancerpatients. Egypt J Immunol 2006, 13(2):61.
17- Sullivan ,N. (2009). Interleukin-6 as a Potential Mediator of Breast Cancer Progression and Non-Melanoma Skin Carcinogenesis. PH.D.thesis. Integrated Biomedical Science Graduate Program. The Ohio State University.
18- Ernst B, Anderson KS. Immunotherapy for the treatment of breast cancer. Current oncology reports. 2015 Feb 1;17(2):5.
19- Esquivel-Velázquez M, Ostoa-Saloma P, Palacios-Arreola MI, Nava-Castro KE, Castro JI, Morales-

Indian Journal of Public Health Research & Development, November 2019, Vol. 10, No. 11 1889
Montor J. The role of cytokines in breast cancer development and progression. Journal of Interferon & Cytokine Research. 2015 Jan 1;35(1):1-6.
20. BECKER Y. Molecular immunological approaches to biotherapy of human cancers-a review, hypothesis and implications. Anticancer research. 2006 Mar 1;26(2A):1113-34.
21- Dethlefsen C, Højfeldt G, Hojman P. The role of intratumoral and systemic IL-6 in breast cancer. Breast cancer research and treatment. 2013 Apr 1;138(3):657-64.
22- Börnert K. The influence of Interleukin-6 Receptor antibodies on breast cancer metastases in bone (Doctoral dissertation).

Production of Iodine-125 in Useful Medical Energy Possibilities
ImanTarik Al-Alawy1, RaghadSadoon Mohammed1, WaleedJabbar Mhana1
1Departmentof Physics, College of Science, Mustansiriyah University, Baghdad, Iraq
Abstract
The goal of the present work is to achieve the nuclear data for medically important radioisotope Iodine-125. The Measured data of excitation functions for direct reactionsof particle induced nuclear reactions, which produced 125I, are available in EXFOR library have been evaluated and recommended in this work. This evaluation is used to calculate the integral yield of radioactive Iodine-125. The average values was derived and used to calculate the most useful reaction for the production of Iodine-125which is 124Te(d,n)125Ireaction with no impurity, yield 0.611MBq (0.02mCi)/µAh, and useful energy range 5.5→7.5MeV from cyclotron using high enrichment for 124Te.
Keywords: enrichment, excitation functions, I-125, useful energy, yield
Introduction
Iodine-125 is a medical radioisotope of Iodine.Its half-life is 59.49 days and it decays by electron capture(isomeric transition) with daughter 125Te of spin 5/2+ (stable isotope). This state is not the metastable 125mTe, but rather a lower energy state that decays immediately by gamma decay with a maximum energy of 35keV[1]. Iodine-125 used as nuclear imaging tracers to evaluate the anatomic and physiologic function [2]. Many studies have been developed for using Iodine-125 by Goolden et al. (1968) [3];Venikov et al. (1993)[4]; Bastian et al. (2001) [5]; Hohn et al. (2001) [6]; Audi et al. (2003) [7], Weinreich and Knust (2005) [8]; Gul (2009) [9];Uddin et al. (2011) [10]; Augustine et al. (2013) [11]; Al-Alawy and Mohammed (2016) [12]and Solovev and Merkusheva (2017) [13] for different applications in diagnostic and treatments by studying the excitation functions, enrichments, differential and integral yields, useful energy and impurities levels.Iodine-125 is commonly used by radiation oncologists in low dose rate brachytherapy in the treatment of cancer at sites other than the thyroid (using positron emission tomography (PET)), especially in prostate cancer[14, 15].
Corresponding author :ImanTarik Al-AlawyE-mail [email protected]
Theoretical Basics
In the scope of this work, the stopping powers are programmed and calculated using the Ziegler formulae expressions valid for the energy range as follows [16, 17,
and 18]:
1- Energy range (1-10)×10-3 MeV 211EA
dxdE
(1)
2- Energy range (10-999) ×10-3 MeV 111
HighLow dxdE
dxdE
dxdE
(2)
45.02 EA
dxdE
Low
and
EA
EA
EA
dxdE
High5
43 1ln (3)
3- Energy range (1000-100.000)×10-3 MeV
4
08
22
27
26 ln
1ln
i
ii EA
AAdxdE
(4)
Where: E is the proton or deuteron energy in (MeV), iA are the coefficients given by Ziegler, β is the ratio of incident corpuscle velocity and the velocity of light. Hence, the stopping powers are also programmed and calculated using the Ziegler formulae expressions valid for different energy range of incident alpha as follows[16, 17, and 18]:
1- Energy range 1kev – 10MeV111
HighLow dxdE
dxdE
dxdE
(5)
10001000/1ln
1000/543 EA
EA
EA
dxdE
High
(6)
2- Energy range >10 MeV
Where )1ln( EEE and Ai (i =1 – 9) are the coefficients given by Ziegler [16, 18]: for incident alpha.For any energy E, the Yield of product nuclei (activity in Bq) can be expressed as the function of the cross section as[19]:
1
1
dx
dEEeHnIYieldin
out
E
E
t (8)
Where I is current of projectile in (µA), øis beam flux in (s-1), n is number of atoms per unit volume, N is Avogadro's number, A is the mass number of the target in (amu), H is isotopic abundance (or enrichment) of the target, is decay constant of the product in )( 1h , t is time of irradiation in (h), and )(E is cross section at energy E in (mb).
andEAdxdE A
Low
21
)7(39
2876 EEAEEAEEAA
dxdE

Indian Journal of Public Health Research & Development, November 2019, Vol. 10, No. 11 1891
Data Reduction and Analysis
Table 1 shows the agreement of recommended energy range with the international EXFOR library energy range used in the present work for available measuring data for proton, deuteron and alpha particle induced reactions for the125I production. Table 2 shows the results of the calculated threshold energies and Q-values compared with the experimental values which are taken from National Nuclear Data Center (NNDC) [20]; both are in a very good agreement. The table also provides a natural and enriching abundance of the target material.
Table 1: Energy range recommended for iodine-125 production
Author’s Ref. No.Energy Range (MeV)
ProductReactionTarget Element
Hohn et al. (2001) [6]
(pw)5.5−100.55.5−100.5
125I(p,n)
125Te
Bastian et al. (2001) [5]
(pw)5.8−14.15.8−14.1(d,n)
124Te
Uddin et al. (2011) [10]
(pw)14.8−39.614.8−39.6(α,2n)
123Sb
Table 2: Nuclear properties of the reactions that produce iodine-125
Target MaterialQ-Value(MeV)[20]
Threshold Energy(MeV)[20]
ReactionProcess used Enrichment
%
Natural Abundance% [21]
Isotope
98.3[6]7.07125Te-0.968117(0.06)-1.475403 (pw)
0.975926(0.0605)1.487301(pw)
125Te(p,n)
99.8[5]4.74124Te3.3762842(0.07)2.874795 (pw)
0.0(0.0)0.0(pw)
124Te(d,n)
98.28[10]42.7123Sb-14.11-15.116233 (pw)
14.3415.608386 (pw)
123Sb(α,2n)
Method Used to Obtain the Recommended Cross Section
The interpolations of the nearest data for each energy interval as a function of the sets of experimental cross sections and their corresponding errors for each value (with different energy intervals) are re-arranged according to the energy interval 0.01MeV for each author. The normalization for the statistical distribution of cross sections errors to the corresponding cross section values for each author has been done. The interpolated values are calculated to obtain the recommended cross section which is based on the weighted average method[22]:
Findings and Discussion
Recommended Cross Sections
The experimental results in the International Atomic Energy Agency (IAEA); (EXFOR) library leaves little doubts that the hypothesis of cross section gives an excellent account of many diverse types of nuclear reactions. The features of iodine production nuclear reactions induced by protons, deuteron and alpha mainly on the 52Te and 51Sb target elements have been evaluated. It is important to note that the energy range of the reaction, taken from different authors, is not identical.
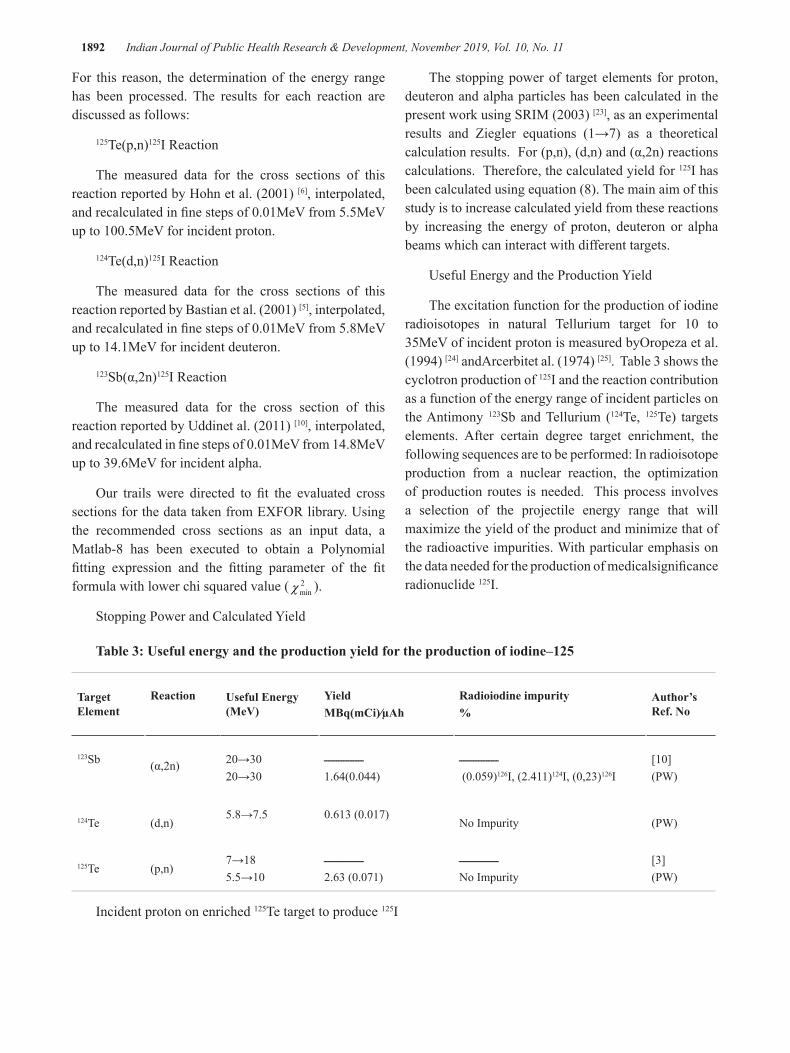
1892 Indian Journal of Public Health Research & Development, November 2019, Vol. 10, No. 11
For this reason, the determination of the energy range has been processed. The results for each reaction are discussed as follows:
125Te(p,n)125I Reaction
The measured data for the cross sections of this reaction reported by Hohn et al. (2001) [6], interpolated, and recalculated in fine steps of 0.01MeV from 5.5MeV up to 100.5MeV for incident proton.
124Te(d,n)125I Reaction
The measured data for the cross sections of this reaction reported by Bastian et al. (2001) [5], interpolated, and recalculated in fine steps of 0.01MeV from 5.8MeV up to 14.1MeV for incident deuteron.
123Sb(α,2n)125I Reaction
The measured data for the cross section of this reaction reported by Uddinet al. (2011) [10], interpolated, and recalculated in fine steps of 0.01MeV from 14.8MeV up to 39.6MeV for incident alpha.
Our trails were directed to fit the evaluated cross sections for the data taken from EXFOR library. Using the recommended cross sections as an input data, a Matlab-8 has been executed to obtain a Polynomial fitting expression and the fitting parameter of the fit formula with lower chi squared value ( 2
minχ ).
Stopping Power and Calculated Yield
The stopping power of target elements for proton, deuteron and alpha particles has been calculated in the present work using SRIM (2003) [23], as an experimental results and Ziegler equations (1→7) as a theoretical calculation results. For (p,n), (d,n) and (α,2n) reactions calculations. Therefore, the calculated yield for 125I has been calculated using equation (8). The main aim of this study is to increase calculated yield from these reactions by increasing the energy of proton, deuteron or alpha beams which can interact with different targets.
Useful Energy and the Production Yield
The excitation function for the production of iodine radioisotopes in natural Tellurium target for 10 to 35MeV of incident proton is measured byOropeza et al. (1994) [24] andArcerbitet al. (1974) [25]. Table 3 shows the cyclotron production of 125I and the reaction contribution as a function of the energy range of incident particles on the Antimony 123Sb and Tellurium (124Te, 125Te) targets elements. After certain degree target enrichment, the following sequences are to be performed: In radioisotope production from a nuclear reaction, the optimization of production routes is needed. This process involves a selection of the projectile energy range that will maximize the yield of the product and minimize that of the radioactive impurities. With particular emphasis on the data needed for the production of medicalsignificance radionuclide 125I.
Table 3: Useful energy and the production yield for the production of iodine–125
Author’s Ref. No
Radioiodine impurity%
Yield MBq(mCi)∕µAh
Useful Energy (MeV)
ReactionTarget Element
[10](PW)
ــــــــــــــــ (0.059)126I, (2.411)124I, (0,23)126I
ــــــــــــــــ1.64(0.044)
20→3020→30
(α,2n)123Sb
(PW)No Impurity0.613 (0.017)5.8→7.5
(d,n)124Te
[3](PW)
ــــــــــــــــNo Impurity
ــــــــــــــــ2.63 (0.071)
7→185.5→10
(p,n)125Te
Incident proton on enriched 125Te target to produce 125I
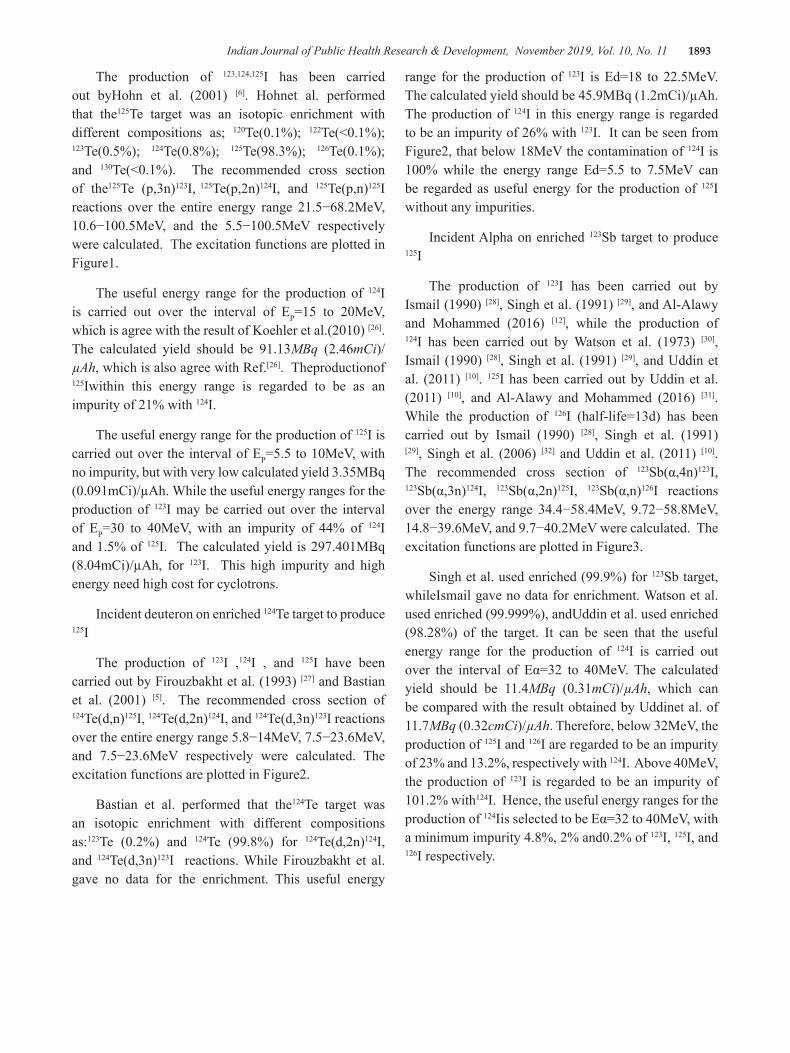
Indian Journal of Public Health Research & Development, November 2019, Vol. 10, No. 11 1893
The production of 123,124,125I has been carried out byHohn et al. (2001) [6]. Hohnet al. performed that the125Te target was an isotopic enrichment with different compositions as; 120Te(0.1%); 122Te(˂0.1%); 123Te(0.5%); 124Te(0.8%); 125Te(98.3%); 126Te(0.1%); and 130Te(˂0.1%). The recommended cross section of the125Te (p,3n)123I, 125Te(p,2n)124I, and 125Te(p,n)125I reactions over the entire energy range 21.5−68.2MeV, 10.6−100.5MeV, and the 5.5−100.5MeV respectively were calculated. The excitation functions are plotted in Figure1.
The useful energy range for the production of 124I is carried out over the interval of EP=15 to 20MeV, which is agree with the result of Koehler et al.(2010) [26]. The calculated yield should be 91.13MBq (2.46mCi)/µAh, which is also agree with Ref.[26]. Theproductionof 125Iwithin this energy range is regarded to be as an impurity of 21% with 124I.
The useful energy range for the production of 125I is carried out over the interval of EP=5.5 to 10MeV, with no impurity, but with very low calculated yield 3.35MBq (0.091mCi)/µAh. While the useful energy ranges for the production of 123I may be carried out over the interval of EP=30 to 40MeV, with an impurity of 44% of 124I and 1.5% of 125I. The calculated yield is 297.401MBq (8.04mCi)/µAh, for 123I. This high impurity and high energy need high cost for cyclotrons.
Incident deuteron on enriched 124Te target to produce 125I
The production of 123I ,124I , and 125I have been carried out by Firouzbakht et al. (1993) [27] and Bastian et al. (2001) [5]. The recommended cross section of 124Te(d,n)125I, 124Te(d,2n)124I, and 124Te(d,3n)123I reactions over the entire energy range 5.8−14MeV, 7.5−23.6MeV, and 7.5−23.6MeV respectively were calculated. The excitation functions are plotted in Figure2.
Bastian et al. performed that the124Te target was an isotopic enrichment with different compositions as:123Te (0.2%) and 124Te (99.8%) for 124Te(d,2n)124I, and 124Te(d,3n)123I reactions. While Firouzbakht et al. gave no data for the enrichment. This useful energy
range for the production of 123I is Ed=18 to 22.5MeV. The calculated yield should be 45.9MBq (1.2mCi)/µAh. The production of 124I in this energy range is regarded to be an impurity of 26% with 123I. It can be seen from Figure2, that below 18MeV the contamination of 124I is 100% while the energy range Ed=5.5 to 7.5MeV can be regarded as useful energy for the production of 125I without any impurities.
Incident Alpha on enriched 123Sb target to produce 125I
The production of 123I has been carried out by Ismail (1990) [28], Singh et al. (1991) [29], and Al-Alawy and Mohammed (2016) [12], while the production of 124I has been carried out by Watson et al. (1973) [30], Ismail (1990) [28], Singh et al. (1991) [29], and Uddin et al. (2011) [10]. 125I has been carried out by Uddin et al. (2011) [10], and Al-Alawy and Mohammed (2016) [31]. While the production of 126I (half-life=13d) has been carried out by Ismail (1990) [28], Singh et al. (1991) [29], Singh et al. (2006) [32] and Uddin et al. (2011) [10]. The recommended cross section of 123Sb(α,4n)123I, 123Sb(α,3n)124I, 123Sb(α,2n)125I, 123Sb(α,n)126I reactions over the energy range 34.4−58.4MeV, 9.72−58.8MeV, 14.8−39.6MeV, and 9.7−40.2MeV were calculated. The excitation functions are plotted in Figure3.
Singh et al. used enriched (99.9%) for 123Sb target, whileIsmail gave no data for enrichment. Watson et al. used enriched (99.999%), andUddin et al. used enriched (98.28%) of the target. It can be seen that the useful energy range for the production of 124I is carried out over the interval of Eα=32 to 40MeV. The calculated yield should be 11.4MBq (0.31mCi)/µAh, which can be compared with the result obtained by Uddinet al. of 11.7MBq (0.32cmCi)/µAh. Therefore, below 32MeV, the production of 125I and 126I are regarded to be an impurity of 23% and 13.2%, respectively with 124I. Above 40MeV, the production of 123I is regarded to be an impurity of 101.2% with124I. Hence, the useful energy ranges for the production of 124Iis selected to be Eα=32 to 40MeV, with a minimum impurity 4.8%, 2% and0.2% of 123I, 125I, and 126I respectively.

1894 Indian Journal of Public Health Research & Development, November 2019, Vol. 10, No. 11
Conclusion
Although higher enrichment of the targets (51Sb,
52Te) has been used, for the production of Iodine isotopes, to reduce the appearance of impurities, this impurity not disappears. So that, the area of the energy range for the cyclotron must be specify to obtain a higher production of radioactive Iodine required with less percentage of impurity.
The characteristic of the diagnosis and treatment radioisotopes is to ensure the access of radiation to the organ for diagnostic or treated without moving to the tissue. Therefore, among three reactions for the production of 125I (125Te (p,n), 124Te(d,n), 123Sb(α,2n)); the most useful reactions are:
For incident deuteron: The 124Te(d,n)125I reaction with no impurity, with yield 0.611MBq (0.02mCi)/µAh and the useful energy range 5.5→7.5MeV.
For incident proton: The 125Te(p,n)125I reaction with no impurity, with yield 3.35MBq (0.091mCi)/µAh and the useful energy range 5.5→10MeV.
Financial Disclosure: There is no financial disclosure.
Conflict of Interest: None to declare.
Ethical Clearance: All experimental protocols were approved under the Department of Physics, College of Science, Mustansiriyah University, Baghdad, Iraq and all experiments were carried out in accordance with approved guidelines.
Figure1 Left side: Recommended cross sections of (p,n), (p,2n), and (p,3n) reactions on 125Te,
versus incident proton energy. Right side: Calculated yield of the incident proton in 125Te.
Figure2 Left side: Recommended cross sections of (d,n), (d,2n), and (d,3n) reactions on 124Te,
versus incident deuteron energy. Right side: Calculated yield of the incident deuteron in 124Te.
Figure3 Left side: Recommended cross sections of (α,4n), (α,3n), (α,2n), and (α,3n) reactions on 123Sb,
versus incident alpha energy. Right side: Calculated yield of the incident alpha in 123Sb.

Indian Journal of Public Health Research & Development, November 2019, Vol. 10, No. 11 1895
References
1. Narra VR, Howell RW, Harapanhalli RS, Sastry KSR, and Ra DV. Radiotoxicity of Some Iodine-123, Iodine-125 and Iodine- 131-Labeled Compounds in Mouse Testes: Implications for Radiopharmaceutical Design. The Journal of Nuclear Medicine.1992; 33(12): 2196-2201.
2. Ragde H, Korb L. Brachytherapy for Clinically Localized Prostate Cancer. Journal of Seminars in Surgical Oncology. 2000; 18: 45-51.
3. Goolden AWG, Glass HL, Silvester DJ. The choice of a radioactive isotope for the investigation of thyroid disordes. British Journal of Radiology.1968; 41(481):20-25.
4. Venikov NL, Novikov VI, Sebiakin AA. Excitation functions of proton-Induced reactions on: impurity in. Journal of Applied Radiation and Isotopes. 1993; 44(4): 751–754.
5. BastianTh, Coenen HH, Qaim SM. Excitation functions of Te-124(d,xn)I-124,125 reactions from threshold up to 14 MeV: comparative evaluation of nuclear routes for the production of. Journal of Applied Radiation and Isotopes. 2001; 55(3): 303–308.
6. Hohn A, Nortier FM, Scholten B, Van der Walt TN, Coenena HH, Qaim SM. Excitation functions of Te-125(p,xn)-reactions from their respective thresholds up to 100 MeV with special reference to the production of I-124. Journal of Applied Radiation and Isotopes. 2001; 55(2): 149–156.
7. Audi G, Wapstra AH, Thibault C, Blachot J, Bersillon O. The NUBASE evaluation of nuclear and decay properties. Nuclear Physics A. 2003; 729: 3-128.
8. Weinreich R, Knust JE. Quality assurance of iodine-124 produced via the nuclear reaction (d,2n). Journal of Radioanalytical and Nuclear Chemistry. 2005; 213(4): 253-261.
9. Gul K. Calculation of induced reactions of 3He-particles on natSb in10–34 MeV energy range. Journal of Applied Radiation and Isotopes. 2009; 67(1): 30–33.
10. Uddin MS, Hermanne A, Sudár S, Aslam MN, Scholten B, Coenen HH, Qaima SM. Excitation functions of α-particle induced reactions on enriched 123Sb and natSb for production of I-124. Journal
of Applied Radiation and Isotopes. 2011; 69(4): 699–704.
11. Augustine G, James TL, Arlen DM. Radioactive Iodine Uptake Testing. Medscape. 2013; 17: 13-20..
12. Al-Alawy IT, Mohammed RS. Direct Production of Radioiodine-123 from Tellurium with Lowest Level of Iodine Impurity-124. International Journal of Scientific Research in Science and Technology. 2016; (2)5: 106-111.
13. Solovev DB, Merkusheva AE. Increase in Efficiency of Use of Pedestrian Radiation Portal Monitors. IOP Conf. Series: Materials Science and Engineering 262, 012200. 2017; 1-6. doi:10.1088/1757-899X/262/1/012200.
14. Rault E, Vandenberghe S, Holen RV,BeenhouwerJDe, Staelens S, Lemahieu I. Comparison of Image Quality of Different Iodine Isotopes (I-123, I-124, and I-131). Cancer Biotherapy and Radiopharmaceuticals. 2007; 22(3): 423-430. doi:10.1089/cbr.2006.323. PMID 17651050.
15. Cyclotron VU. BV. Information on Iodine-124 for PET, Amsterdam. 2016.
16. Ziegler JF.Handbook of Stopping Cross-Sections for Energetic Ions in all Elements. Pergamon Press, Oxford. 1980; Ch. 5: 341.
17. Andersen HH, Ziegler JF.Hydrogen Stooping Powers and Ranges in all Elements. Pergamon Press, Oxford. 1977;Ch. 3: 34-44.
18. Ziegler JF.Stopping and Ranges Elements. Pergamon Press, Oxford. 1977;Ch. 4.
19. Qaim SM. Nuclear data for medical applications: an overview. Radiochim. Acta. Journal. 2001; 89: 189-196.
20. (NNDC) National Nuclear Data Center. Q-value Calculator. Brookhaven National Laboratory. http://www.nndc.bnl.gov/qcalc/.
21. Krane KS.Introductory Nuclear Physics. John Wiley and Sons. 1988; 378-379.
22. Knole GF.Radiation Detection and Measurement. John Wiley Sons. 2000; 90-92.
23. http://SRIM; www. SRIM2003.org.
24. Oropeza M, Sparieri G, Zambelil M. Cyclotron produced iodine isotopes for therapeutical medicinal use. Journal of Med-VLA, Rerista de La Faulted de Medicina. Universidad de Los Andes. 1994; 3(3-4): 53-55.

1896 Indian Journal of Public Health Research & Development, November 2019, Vol. 10, No. 11
25. Arcerbit E, Birattari C, Castglioni M, Resmini F, Sparieri G, Villa G. Production of I-123for medical purposes at the Milan AVF cyclotron 11th European Cyclotron Progress Meeting. Journal of Louvain. 1974; 3: 25.
26. Koehler L, Gagnon K, QuarrieSMc, Wuest F. Iodine-124: A Promising Positron Emitter for Organic PET Chemistry. Journal of Molecules.2010; 15: 2686-2718.
27. Firouzbakht ML, Schlyer DJ, Finn RD, Laguzzi G, Wolf AP. Iodine-124 production: excitation function for the 124Te(d,2n) 124I and 124Te(d,3n)123I reactions from 7 to 24 MeV. Journal of Nuclear Instruments and Methods in Physics Research. Sec. B. 1993; 79: 909.
28. Ismail M. Measurement and analysis of the excitation function for alpha-induced reactions on Ga and Sbisotops. Journal of Physical Review. Part C. Nuclear Physics. 1990; 41: 87.
29. Singh BP, Bhardwaj HD, Prasad R. A Study of Pre-Equilibrium Emission in Alpha-Induced Reactions on 121,123Sb.Journal of Canadian Journal of Physics. 1991; 69: 1376.
30. Watson IA, Waters SL, Silvester DJ. Excitation Functions for the Reactions Production 121-I, 123-I and 124-I from Irradiation of Natural Antimoy with 3-He and 4-He Particles with Energies up to 30MeV. Journal of Inorganic and Nuclear Chemistry. 1973; 35: 3047.
31. Al-Alawy IT, Mohammed RS. Nuclear Data Relevant to the Production of Radioiodine I-123, I-125 byIndirect Route and Medical Applications.International Letters of Chemistry. Physics and Astronomy. 2016; 63: 90-97.doi:10.18052/www.scipress.com/ILCPA.63.90
32. Singh BP, Sharma MK, Musthafa MM, Bhardwaj HD, Prasad R. A study of pre-equilibrium emission in some proton-and alpha-induced reactions.Proceeding of the 7th International Conference on Accelerator Applications AccApp05. Venice, Italy. 2006; 23: 541-1106. Nuclear Instruments and Methods in Physics Research Section A: Accelerators, Spectrometers, Detectors and Associated Equipment. 2006; 562(2): 717-720.

Detection of Mycoplasma Pneumonia Infection in Sinusitis’s Patient
Khadija S. AL-Mizury
Assist. Prof. ( M.Sc.), Collage of Health And Medical Technology/ Baghdad, Middle Technical University, Baghdad, Iraq
Abstract
“This study aims to detecting the probability of M. pneumonia prevalence in sinusitis patients the study in rolled ( 178 ) patients had a history of respiratory infection.Were included (135) patients suffering from sinusitis disease and ( 43 )Control group of patients had no radiological evidence of sinusitis disease.The range age in cases was ( 18-62 ) years with a mean of( 40 ) years , in controls it was 18-51 years witha mean of( 34.5).
Blood samples were examined for M. pneumonia antibodies IgG and IgM by enzyme linked immune sorbent assay (ELISA). Elevated antibody titers were found in ( 124 ) patients (80%),and in 31control (20%). Acute and previous immunities “M. pneumonia IgM and IgG antibodies “ were observed in ( 17% ) and ( 67.7% ) of cases, and ( 2.5%) and ( 12.2% ) of controls, respectively.
Finding demonstrate that the predominant M. pneumonia antibodies type “IgG, IgM” in sinusitis patients and symptoms like headache and fever. The study showed that the positivity rate of M.pneumoniae infection reach peak level in crowding index (+4) and ( 3- 3.9) in both case and control.
Keywords : M. pneumonia, antibodies , IgG, IgM, enzyme linked immune sorbent assay, sinusitis patients, crowding index.
Introduction
“Mycoplasma pneumonia living bacteria which can cause upper respiratory tract infections, including pharyngitis, sinusitis, ear pain are extremely small self-replicating free-rhinorrhea and pneumonia(1)(2). M. pneumoniae is described as atypical and accounts for 1–29% of community-acquired pneumonia cases”(2). “The causative bacteria can be transmitted through aerosols as well as in settings which promote close physical contact, such as homes, schools, military barracks and dormitories”(3). “The post-exposure incubation period is between two to three weeks and infections are more prevalent among children and young adults”(4). “Common risk factors include age (i.e. younger children or older adults), immune status (i.e. immuncompromised individuals with HIV or those undergoing chemotherapy or taking steroids), smoking and pre-existing lung disease”(5).”Sinusitis, also known as rhinosinusitis, is inflammation of the Paranasal sinuses. It can be due to infection, allergy,
or autoimmune problem. Most cases are due to a viral infection and resolve over a course of 10 days. It is a common condition, with over 24 million cases in the unites states” (6).”Evidence of maxillary sinusitis has been found in human archeological specimens discovered in Africa, north America, and Europe”(7).”Reported association between the M. pneumonia and sinusitis a range of various disorder similar in nasal and Paranasal sinuses mucosa inflammation for as long at least 12 consecutive weeks are called chronic rhinosinusitis. M. pneumonia was previously detected in human nasal which implicates M. pneumonia as a causative agent in the etiology of sinusitis”(8).
“Because of our concern about the possibility of unrecognized M. pneumonia infection among different group of population and to determine the etiology of M. pneumonia among these groups the study aimed as following:
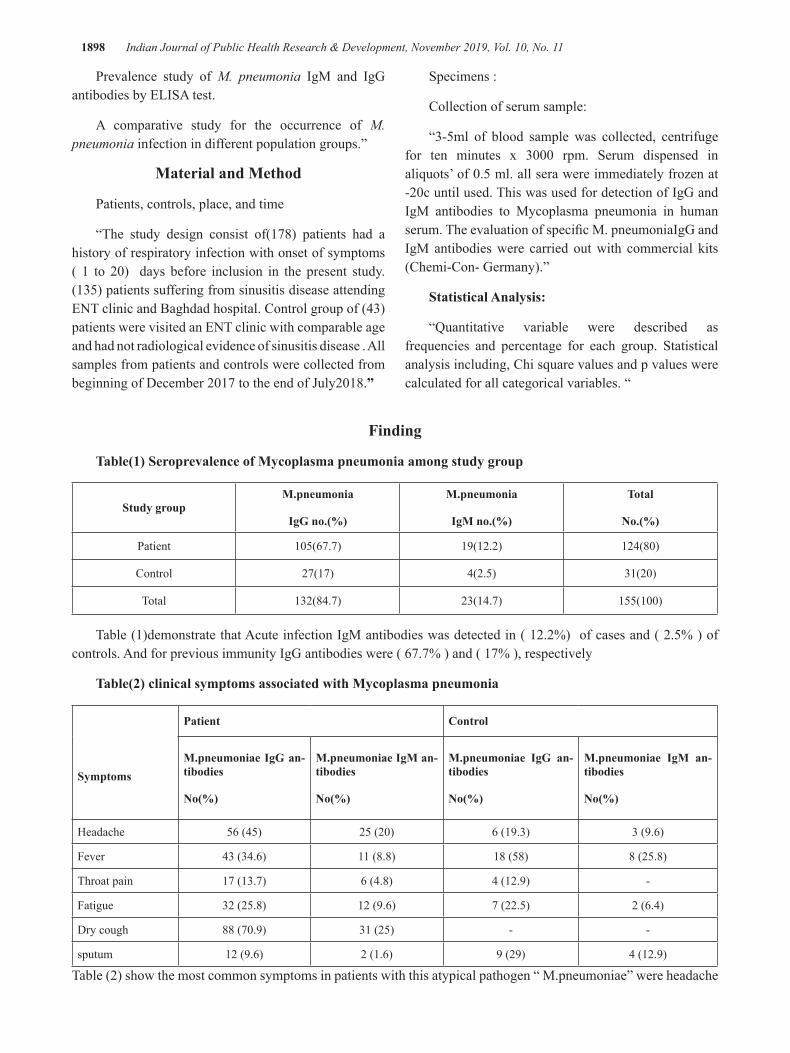
1898 Indian Journal of Public Health Research & Development, November 2019, Vol. 10, No. 11
Prevalence study of M. pneumonia IgM and IgG antibodies by ELISA test.
A comparative study for the occurrence of M. pneumonia infection in different population groups.”
Material and Method
Patients, controls, place, and time
“The study design consist of(178) patients had a history of respiratory infection with onset of symptoms ( 1 to 20) days before inclusion in the present study. (135) patients suffering from sinusitis disease attending ENT clinic and Baghdad hospital. Control group of (43) patients were visited an ENT clinic with comparable age and had not radiological evidence of sinusitis disease . All samples from patients and controls were collected from beginning of December 2017 to the end of July2018.”
Specimens :
Collection of serum sample:
“3-5ml of blood sample was collected, centrifuge for ten minutes x 3000 rpm. Serum dispensed in aliquots’ of 0.5 ml. all sera were immediately frozen at -20c until used. This was used for detection of IgG and IgM antibodies to Mycoplasma pneumonia in human serum. The evaluation of specific M. pneumoniaIgG and IgM antibodies were carried out with commercial kits (Chemi-Con- Germany).”
Statistical Analysis:
“Quantitative variable were described as frequencies and percentage for each group. Statistical analysis including, Chi square values and p values were calculated for all categorical variables. “
Finding
Table(1) Seroprevalence of Mycoplasma pneumonia among study group
Study groupM.pneumonia
IgG no.(%)
M.pneumonia
IgM no.(%)
Total
No.(%)
Patient 105(67.7) 19(12.2) 124(80)
Control 27(17) 4(2.5) 31(20)
Total 132(84.7) 23(14.7) 155(100)
Table (1)demonstrate that Acute infection IgM antibodies was detected in ( 12.2%) of cases and ( 2.5% ) of controls. And for previous immunity IgG antibodies were ( 67.7% ) and ( 17% ), respectively
Table(2) clinical symptoms associated with Mycoplasma pneumonia
Symptoms
Patient Control
M.pneumoniae IgG an-tibodies
No(%)
M.pneumoniae IgM an-tibodies
No(%)
M.pneumoniae IgG an-tibodies
No(%)
M.pneumoniae IgM an-tibodies
No(%)
Headache 56 (45) 25 (20) 6 (19.3) 3 (9.6)
Fever 43 (34.6) 11 (8.8) 18 (58) 8 (25.8)
Throat pain 17 (13.7) 6 (4.8) 4 (12.9) -
Fatigue 32 (25.8) 12 (9.6) 7 (22.5) 2 (6.4)
Dry cough 88 (70.9) 31 (25) - -
sputum 12 (9.6) 2 (1.6) 9 (29) 4 (12.9)
Table (2) show the most common symptoms in patients with this atypical pathogen “ M.pneumoniae” were headache

Indian Journal of Public Health Research & Development, November 2019, Vol. 10, No. 11 1899
and dry cough in both IgG and IgM antibodies. While in control group the most common symptoms were fever and sputum.
Table(3) Distribution study group according to the crowding index
Crowding index
Patient Control
totalPositive M.pnu-monia antibodies
Negative M.pnumo-nia antibodies
Positive M.pnumo-nia antibodies
Negative M.pnumo-nia antibodies
1-1.9 21(16.9) 5 (45.5) 5(16.2) 6(50) 37(20.7)
2-2.9 16 (12.9) 4 (36.3) 3(9.6) 4(33.3) 27(15.2)
3-3.9 42 (33.9) - 12(38.7) 2(16.7) 56(31.5
4+ 45 (36.3) 2 (18.2) 11(35.5) - 58(32.6)
Total 124(100) 11(100) 31(100) 12(100) 178(100)
As shown in table (3) that the high M. pneumoniae infection was seen insinusitis patients and control living with crowded family( 3-3.9 and +4 ) .
Table (4) Respondent study group about practices regarding mycoplasma infection
practices
Patient control
YesNo.(%)
NoNo.(%)
YesNo.(%)
NoNo.(%)
Stay away from people who have symptoms of mycoplasma 29(21.4) 106(78.6) 33(76.7) 10(23.3)
Wash hand before eating 113(83.7) 22(16.3) 40(93.1) 3(6.9)
Cover the nose and mouth when they sneeze or cough 17(12.6) 118(87.4) 29(67.4) 14(32.6)
Eat a balanced diet 98(72.6) 37(27.4) 32(74.4) 11(25.6)
Get 6-8 hrs. Of sleep night 54(40) 81(60) 15(34.8) 28(65.2)
With respect to some practices regarding Mycoplasma pneumoniae infection table (4) show that the Most of the study patients (87.4%) were answered no cover the nose and mouth when they sneeze or cough followed by 106(78.6%) the answered no stay away from people who have symptoms of mycoplasma pneumoniae infection.
Discussion
(80%) of the patients showed a fourfold or greater rise of antibodies to Mycoplasma pneumonia (table 1).
In the control group, a corresponding rise in antibody titer was seen in 20%, acute infection (IgM)was detected in ( 12.2% ) of cases and ( 2.5% ) of controls. These number for previous immunity (IgG) were ( 67.7% ) and ( 17% ), respectively. Antibodies in serum (IgM, IgG) had shown significant difference (p>0.05) between case and control).
“Current study shows that M.pnumonia has a possible etiologic role in development of Sinusitis patients, Our result acceptable agreement with other

1900 Indian Journal of Public Health Research & Development, November 2019, Vol. 10, No. 11
study that suggest the respiratory M. pneumonia may be potential etiological agent in a sinusitis alone or in combination with the common bacterial pathogens of sinusitis”(9).
“Other study finding that no significant difference between case and control”(10).” The incidence rate of mycoplasma antibody in our study is lower than that of other study that detected M. pneumonia in (93%) of sinusitis patients but was seen only in (14%) of the control group this may be due to we use serum instead of DNA- PCR for diagnosis of active M.pnumonia”(11). “M. pneumonia is known to produce a gradual tracheobronchitis with malaise and non-productive cough, which can progress to pneumonia and extra pulmonary manifestations”(12)(13).
“In our study dry cough and headache were the most common symptoms observed for patients with samples positive for M. pneumonia antibody IgM, IgG. However the fever and sputum the most predominant symptom found in control group. our study came in a agreements with other study that found that both cough and fever were the most common symptoms”(14).
“In this study, overcrowding were associated with a history of M. pneumonia infection (table 3), our study finding patients from household with 1 or 2 people per room were less likely to have M. pneumonia infection compared to patients from households with more than 3 people per room. other study found consistent evidence of an association between bed sharing with someone with cough in sever and non-sever pneumoniae”(15).
“This due to M. pneumonia is spread when a person who is sick cough or sneezes while in close contact with others who then breath in the bacteria. Most people who are exposed for a short amount of time do not get sick. However ,it›s common for this illness to spread between family members wholiving together”(1).” Regarding practice of mycoplasma infections, the present study revealed most of studygroup was noStay away from people who have symptoms of mycoplasmaAnd no Cover the nose and mouth when they sneeze or cough,the causative agent can be transmitted through aerosols as well as in setting which promote close physical contact, such as homes, schools, military barracks and dormitories”(2).
Conclusion
“M. pneumonia might be of importance in the
etiology of sinusitis patients. Macrolides potential to reduce the virulence of some bacteria may be an important feature in reducing tissue damage in cases with chronic infection.ؤc”
Conflict of Interest: Non
Source of Funding : Self
Ethical Clearance: Were taken Approval From the specialist doctor and patients.
References
1. Holzman RS, Simberkoff MS. Mycoplasma pneumoniae and atypical pneumonia In: Bennett JE, Dolin R, Blaser MJ, editors. Mandell, Douglas, and Bennett’s Principles and Practice of Infectious Diseases. 8th ed. Philadelphia, Pennsylvania, USA: Saunders; . 2914. 2183–9.
2. Blasi F.Atypical pathogens and respiratory tract infections Eur Respir J.2004.;24:171–81.
3. Waites KB, Talkington DF. Mycoplasma pneumoniae and its role as a human pathogen. Clin Microbiol Rev.2004.17:697–728.
4. Dorigo-Zetsma JW, Wilbrink B, van der Nat H, Bartelds AI, Heijnen ML, Dankert J. Results of molecular detection of Mycoplasma pneumoniae among patients with acute respiratory infection and in their household contacts reveals children as human reservoirs”. J Infect Dis.;2001.183:675–8.
5. Klement E, Talkington DF, Wasserzug O, Kayouf R, Davidovitch N, Dumke R.2006” Identification of risk factors for infection in an outbreak of Mycoplasma pneumoniae respiratory tract disease. Clin Infect Dis;43:1239–45.
6. Rosenfeld, RM; Piccirillo, JF; palmer, JN; patel,ZM; peters, A; Walsh, SA; Corrigan, MD. Clinical practice guideline (update) : adult sinusitis executive summary”. Official journal of American Academy of Otalaryngology- Head and Nech Surgery2015.
7. king, D; Mitchell, B; Williams, CP; Spurling, GK.Saline nasal irrigation for acute upper respiratory tract infection. The cochane database of systemic reviews, 20 ,2015.
8. Bcholtz GA, Salzman SA, Bersaiona FB, Boyle TR, Ejercito VS..PCR analysis of nasal polyps, chronic sinusitis, and hypertrophied turbinates.

Indian Journal of Public Health Research & Development, November 2019, Vol. 10, No. 11 1901
for DNA encoding bacterial 16S RNA. Am J RHINAL. 2002.16:169-173
9. Savolainen H, Jousimies S, Kleemola M, Ylikoski J. Serological evidence of viral or mycoplasma pneumoniae infection in acute maxillary sinusitis. Eur.J.clin. Microbiol. Dis.2008.8;2,131-135.
10. Shima J, Mohammad F, Sahar G, Azardokht T, Ali R, Samileh N. Searching the M. pneumonia in cases with nasal polyp accompanied by chronic rhinosinusitis using polymerase chain reaction in tissue and serology: a case control study Scientific reports.2013. 2:4
11. Gurr PA, Chakraverty A, Callanan V, Gurr SJ..The detection of Mycoplasma pneumoniae in nasal polys. Clinotolaryngol Allied sci .1996. 21 : 269 – 273.
12. Song Q,xu B, Shen K.Effect of bacterial and viral co-infection of mycoplasma pneumoniae. Int. J
Clin Exp.Med.sep.2015. 15;8(9):15666 – 74.
13. Beersma M, Dirven K, van Dam A, Templeton KE, Claas EC, Goossens H, Evaluation of 12 commercialtest and the complement fixation test for Mycoplasma pneumoniae-specific immunoglobulin G(IgG)and IgM antibodies, with PCR used as the gold standard..J Clin Microbiol. may; 2005.43(5):2277-85.
14. Juana del V, Fiorella P, Alvaro R, Monica V, Wilmer C,Miguel L,Pablo W, Veroica O. 2017 “High prevalence of mycoplasma pneumoniae and chlamydia pneumoniae in children with acute respiratory infection.”plos one J. 2017.;10(27).
15. Howie S, Schellenberg J, Chimah O, Mackenzie G.M.pneumoniae and crowding, bed sharing and nutrition: a case control study from the Gambia.Int.J Tuber lung Dis.2016.,20(10):1405-1415.

Immunopathological Study of Brucellaabortus in White Mice Immunize with Killed Antigen
Khalied Yassen Zakair1, Alwan M.J2
1Department of Pathological Analysis, Kut Technical Institute, Middle Technical University, Iraq, 2Department of Pathology, Veterinary Midecine Collage, Baghdad University, Iraq
Abstract
The study was aimed to evaluate the protective efficiency of the formalin killed Brucellaabortusantigen against Brucella infection in mice . Inorder to achieve of thisgoal.Fifty white mice were divided into three groups randomly. The 1st group (20 mice) was immunized 0.3ml of formalin killed Brucellaabortusantigen, two doses, two weeks interval, the 2ndgroup (20 mice) was served as control positive while 3rd group (10 mice) was inoculated with 0.3ml of sterile normal saline and it served as control negative group.At 30 day post immunization, the 1st and 2nd group were inoculated I/P with 0.3ml of bacterial solution containing 1X10⁸cfu/ml, I/P all animals were sacrificed at day 30 post infection,blood samples were collected for measurement IL 4,1L six and TNFa, and small pecies from internal organs were fixed in I0 percentage of formaline for histopathologicalexamination.The results showed that the serum levels of IL-4, IL-6and TNFα were (36.22±3.81),( 29.74±2.79) and (161.214±2.98) respectevlly. The results of histopathological changes showed severe pathological changes including granulomatous lesions in the liver parenchyma and dilated of sinusoids with fibrin networks deposition, neutrophils infiltration in the lung and RBCs in thickness pleura,the spleen showed depletion of white pulp and congested red pulp as well as shownacute cellular degeneration in epithelial cells of kidney, atrophy of glomerula tufts, with dilated of Bomana spaces and hemorrhage in capsular region,while immunized infected animalswere showed mild to moderate cytopathological effect with mononuclear cells aggregation around blood vessels of examined organs particularly liver. we concluded that killed Brucellaabortous antigen can stimulated good cell mediated immune response against Brucellaabortous infection of mice.
Key Words:Brucellaabortus , Immunopathological , Antigen ,Histopathological, Interleukin.
Corresponding author: Khalied Yassen ZakairE-mail: [email protected]
Introduction
The epidemelogy of zoonotic disease brucellosis that caused by Brucellaabout(500,000) people in year[1]. Majar causal agent isBrucellamelitensis, Brucellasuis, and Brucellaabortus. There are different mode of infection method like inhalation of infected aerosols. Many studies concluded that airborne transmission consider major method of infected human with diseasethat result from bovine and porcine slaughterhouses, preparation of vaccines as well as rural places[2–6].B. abortusisis a pathogenic bacteriacan
live in the intracellularenvironment. Inside cells, there exist adverse conditionsincluding acidic pH, proteases, and reactive oxygen species(ROS) and reactive nitrogen species (RNS) [7].This bacterium contain lipopolysaccharide (LPS) in cell wall structure that play important role in pathogenicity [8]. Lipid A protein contain large amount of fatty acidmoleculesthat act on decrese immune response of the human body through serve as a poor TLR4 agonist. O-polysaccharide portion that consider cytotoxic of macrophage is absence in content of lypopolysaccaride.The long chain of fatty acid in lipid A neded more experimntale evidences. Reduce activation of TLR4 led to enhanced uptake observedwith rough Brucellathrough enhanced activity of PI3K[9].
Vaccine play important role in activated two arms of immune response that play crucial role in eradication
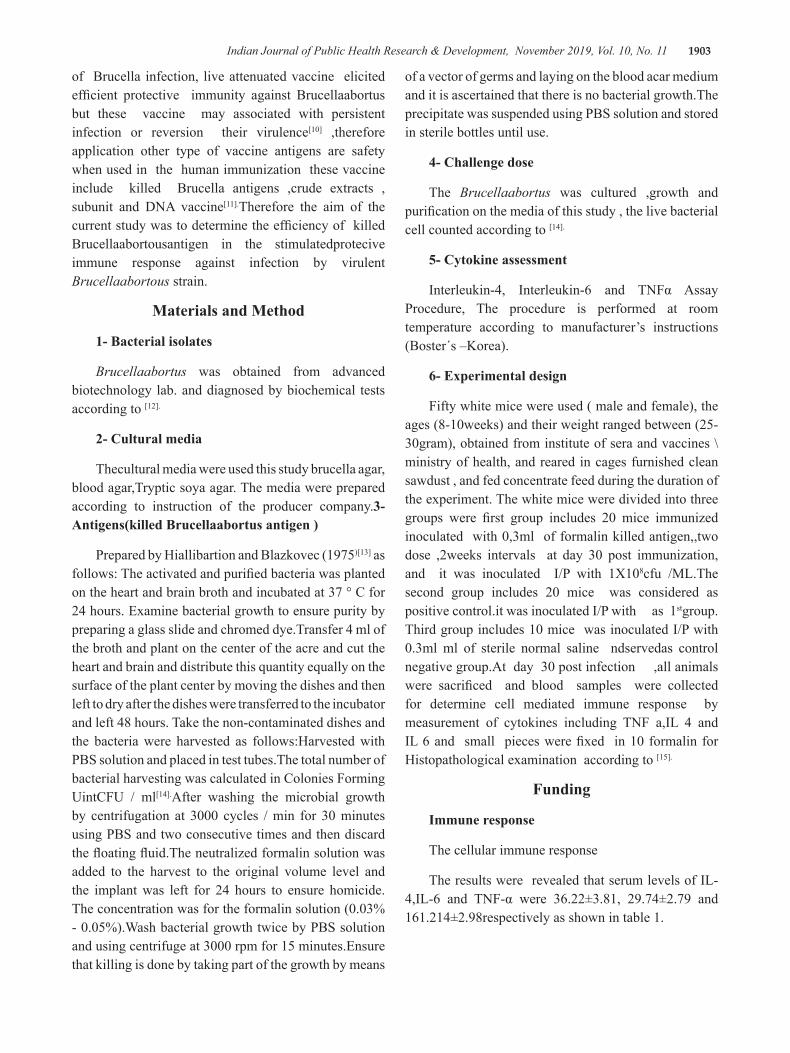
Indian Journal of Public Health Research & Development, November 2019, Vol. 10, No. 11 1903
of Brucella infection, live attenuated vaccine elicited efficient protective immunity against Brucellaabortus but these vaccine may associated with persistent infection or reversion their virulence[10] ,therefore application other type of vaccine antigens are safety when used in the human immunization these vaccine include killed Brucella antigens ,crude extracts , subunit and DNA vaccine[11].Therefore the aim of the current study was to determine the efficiency of killed Brucellaabortousantigen in the stimulatedprotecive immune response against infection by virulent Brucellaabortous strain.
Materials and Method
1- Bacterial isolates
Brucellaabortus was obtained from advanced biotechnology lab. and diagnosed by biochemical tests according to [12].
2- Cultural media
Thecultural media were used this study brucella agar, blood agar,Tryptic soya agar. The media were prepared according to instruction of the producer company.3- Antigens(killed Brucellaabortus antigen )
Prepared by Hiallibartion and Blazkovec (1975)[13] as follows: The activated and purified bacteria was planted on the heart and brain broth and incubated at 37 ° C for 24 hours. Examine bacterial growth to ensure purity by preparing a glass slide and chromed dye.Transfer 4 ml of the broth and plant on the center of the acre and cut the heart and brain and distribute this quantity equally on the surface of the plant center by moving the dishes and then left to dry after the dishes were transferred to the incubator and left 48 hours. Take the non-contaminated dishes and the bacteria were harvested as follows:Harvested with PBS solution and placed in test tubes.The total number of bacterial harvesting was calculated in Colonies Forming UintCFU / ml[14].After washing the microbial growth by centrifugation at 3000 cycles / min for 30 minutes using PBS and two consecutive times and then discard the floating fluid.The neutralized formalin solution was added to the harvest to the original volume level and the implant was left for 24 hours to ensure homicide. The concentration was for the formalin solution (0.03% - 0.05%).Wash bacterial growth twice by PBS solution and using centrifuge at 3000 rpm for 15 minutes.Ensure that killing is done by taking part of the growth by means
of a vector of germs and laying on the blood acar medium and it is ascertained that there is no bacterial growth.The precipitate was suspended using PBS solution and stored in sterile bottles until use.
4- Challenge dose
The Brucellaabortus was cultured ,growth and purification on the media of this study , the live bacterial cell counted according to [14].
5- Cytokine assessment
Interleukin-4, Interleukin-6 and TNFα Assay Procedure, The procedure is performed at room temperature according to manufacturer’s instructions (Boster΄s –Korea).
6- Experimental design
Fifty white mice were used ( male and female), the ages (8-10weeks) and their weight ranged between (25-30gram), obtained from institute of sera and vaccines \ ministry of health, and reared in cages furnished clean sawdust , and fed concentrate feed during the duration of the experiment. The white mice were divided into three groups were first group includes 20 mice immunized inoculated with 0,3ml of formalin killed antigen,,two dose ,2weeks intervals at day 30 post immunization, and it was inoculated I/P with 1X10⁸cfu /ML.The second group includes 20 mice was considered as positive control.it was inoculated I/P with as 1stgroup.Third group includes 10 mice was inoculated I/P with 0.3ml ml of sterile normal saline ndservedas control negative group.At day 30 post infection ,all animals were sacrificed and blood samples were collected for determine cell mediated immune response by measurement of cytokines including TNF a,IL 4 and IL 6 and small pieces were fixed in 10 formalin for Histopathological examination according to [15].
Funding
Immune response
The cellular immune response
The results were revealed that serum levels of IL-4,IL-6 and TNF-α were 36.22±3.81, 29.74±2.79 and 161.214±2.98respectively as shown in table 1.

1904 Indian Journal of Public Health Research & Development, November 2019, Vol. 10, No. 11
Table 1: Cytokine profile ofBrucellaabortus in immunized mice post infection
groupsIL-4(pg/ml)mean±SE
IL-6(pg/ml)mean±SE
TNF-α (pg/ml)mean±SE
G1immunized group 36.22±3.81 29.74±2.79 161.214±2.98
G2 positive group 28.12±2.65 20.61±1.56 113.325±3.172
G3 negative group 4±0.23 2.5±0.31 21.4±0.578
Histopathological examination:
Non-immunized infected animals at day 30 post-infection
Section in the liver of animal at 30 days post infection showed of kupffer cells proliferation , with granulomatous lesions consisting from aggregation of active macrophages and lymphocytes in the liver parenchyma and dilated of sinusoids (Fig.1).
Lung Anatomy
After 30 days of infection, the anatomy of lung showed revealed fibrin networks deposition, neutrophils. infiltration and RBCs in thickness pleura (Fig.2).
Spleen Anatomy
After 30 days of infection, the anatomy of spleen showed depletion of white pulp and congested red pulp with inflammatory cells infiltration (Fig.3).
Kidney Anatomy
In antomy of kidney was clearly acute cellular degeneration of epithelial cells and shownatrophy of glomerula tufts, with dilated of Bomana spaces with hemorrhage in capsular region(Fig.4).
Immunized infected animals
In immunized infected animal, The pathological effect was were mild to moderate with mononuclear cells aggregation around blood vessels of examined organs particularly liver.
5
Figure 1. Anatomy of animal liver after infection that explanedproliferation of kupffer cells and granuloma that result from accumulation of active macrophages and lymphocytes in the liver parenchyma and dilated of sinusoids (H & E stain 400X).
Figure2. Anatomy of animal lungafter infection exhibit fibrin networks deposition, neutrophils infiltration and RBCs in thickness pleura withapeared inflammatory cells in alveolar spaces (H & E stain 400X).

Indian Journal of Public Health Research & Development, November 2019, Vol. 10, No. 11 1905
6
Figure3.Anatomy of animal spleen after infection showed depletion of white pulp and congested red pulp with inflammatory cells infiltration (H & E stain 400X)
Figure4.Anatomy of animal kidneyafter infection interpreted of acute cellular degeneration in epithelial cells, atrophy of glomerular tufts, with dilated of Boman spaces with hemorrhage in capsular region (H & E stain 400X)
Discussion
Brucellaabortus is intracellular zoonotic pathogen cause brucellosis in human and wide
range of animals [16] ,the pathogenesis of Brucella was dependent on its ability intracellular

1906 Indian Journal of Public Health Research & Development, November 2019, Vol. 10, No. 11
Discussion
Brucellaabortus is intracellular zoonotic pathogen cause brucellosis in human and wide range of animals [16] ,the pathogenesis of Brucella was dependent on its ability intracellular survival and replication in the vacuolar phagocytic compartments of macrophages [17], therefore cell mediated immunity play crucial role in eradicated the Brucellainfection. The current study revealed high levels of serum TNFa in immunized animals as comparedwith those levels in non immunized animals post infection,these result may indicated that the killed Brucella antigens may stimulated better cell mediated immune response against Brucellaabortous infection, these idea was agreent with [18] who demonstrated that the TNFa play important role in host defense mechanisms through activated microbicidalactivity of macrophages and neutrophils in addition it act on NK cells with IL 12 to produced INF y.protective immunity against Brucella can mediated by cytokines, INF y which produced by active Th1 cells that mediated by activated NK cells to produce INF y, these cytokine can facilitate differentiated of Tho cells to Th1 that additionally produce INFy, activator macrophages , also TNFa produced from macrophages and NK cells can maximally activated INF y [19].
The present result showed that the serum levels of TNF a in control positive animals were higher than those of control negative group ,these result may indicated these cytokines play role in inflammatory response against B.abortus infection and in clearance of these pathogens , these evidence was agreement with [20] who investigated that the important cytokines play role in scavenge Brucella consist from TNF a,IL six, INFy and IL 12.INF y and the TNF a secreted from NK cells can activated macrophages to kill Brucella . INF y,1L 12 and TNFa play role in control Brucella infection [20]. the role of TNF a was dependent on presence of INF y in early infection in which it activated macrophages during acute and early chronic phase [21]. INFy is rise in serum of infected mice at acute phase but less amount during chronic phase [22]. while IL six reached peak at acute phase and remain high at first 2 weeks of chronic phase [23] also in the immunized animals at middle chronic phase post infection. The present finding revealed high levels of serum IL six in immunized animals as compared with other groups, these result also indicated that formalin killed Brucella.
antigen can elicited IL six that play role in resistance, due to Brucellaabortus is intracellular pathogen in which cell mediated immune response play role in killing these pathogen, the current idea was agreement with Zaitseva et al.[24] who revealed that immunized animals with heat killed B.abortuselicited strong TH1 response against infected by these pathogen,also[25], demonstrated that CD4 Th1 immune response play a major role in the protective host against Brucellaabortus ,however, high levels of IL six in immunized animals in the present study may indicated that activated CD4 Th1 cells stimulated production these cytokines ,these evidence was in consistent with [26].who found that CD4T cells can promote production of IL six.CD 4 T helper play important role in the protective immunity against Brucella infection in addition to cytotoxic T cells [27].
The rseults in current study showed that high levels of serum IL 4 in immunized animals as compared with control positive group but lower than levels of TNF a,, these result may gave indication that IL 4 may play role in immune response against Brucella infection in which both arms of immune responses can play role in protective host against these pathogens ,these idea was agreement with [28] who demonstrated that both type of immune response CMI and antibody play effective role against Brucella but CMI are more efficiency in protective host against intracellular pathogens [28] however, TH1 cells involved in the DTH and in CMT while TH2 cells can promote B cells to proliferation and differentiation into plasma production antibodies ,TH1 cells produced INF y,TNFa,IL 2 that mediated the immune related cytotoxic activity a,local inflammation and assist in antibody production ,also all above idea were agreement with present result due to the IL 4 play role in differentiation of Th0 to Th2 cells which produce additional IL 4.[29] that activated B cell and T cells proliferation and differentiation of B cells into plasma producing antibodies as well as decrease development of Th1 cells [30] also it play role in activated alternative macrophages M2 and inhibit classical macrophages and induced decline in the inflammatory reaction [31]..
We concluded that killed Brucellaabortous antigen can stimulated good cell mediated immune response against Brucellaabortous infection of mice.
Conflict of Interest: Non
Source of Funding : Self

Indian Journal of Public Health Research & Development, November 2019, Vol. 10, No. 11 1907
Ethical Clearance: Non
References
1. Pappas G, Panagopoulou P, Christou L, Akritidis N.Brucellaas a biological weapon. Cell Mol Life Sci.2006.63:2229–36.
2. Kaufmann AF, Fox MD, Boyce JM, Anderson DC, Potter ME, Martone WJ,. .Airborne spread of brucellosis. Ann N Y AcadSci.1980.353:105–14.
3. Hendricks SL, Borts IH, Heeren RH, Hausler WJ, Held JR.Brucellosis outbreak in an Iowa packing house. Am J Public Health Nations Health .1962.52:1166–78.
4. Staszkiewicz J, Lewis CM, Colville J, Zervos M, Band J. Outbreak of Brucellamelitensisamong microbiology laboratory workers in a community hospital. J ClinMicrobiol.1991.29:287–90.
5. Wallach JC, Samartino LE, Efron A, Baldi PC. Human infection by Brucellamelitensis: an outbreak attributed to contact with infected goats. FEMS Immunol Med Microbiol.1997.19:315–21.
6. Yagupsky P, Baron EJ.Laboratory exposures to brucellae and implications for bioterrorism. Emerg Infect Dis .2005.11:1180–5..
7. R.M. Roop II, J.M.Gaines, E. S.Anderson, C. C. Caswell, andD.W.Martin,Survival of the fittest: How Brucellastrains adapt totheir intracellular niche in the host.Medical Microbiology andImmunology, 2009.198(4, ): 221–238..
8. Barquero-Calvo E, Chaves-Olarte E, Weiss DS, Guzmán-VerriC,Chacon-Diaz C, Rucavado A, Moriyón I, Moreno E:.Brucellaabortususes a stealthy strategy to avoid activation of the innate immunesystem during the onset of infection. PLoS One 20072:e631.
9. Qin QM, Pei J, Ancona V, Shaw BD, Ficht TA, de Figueiredo P.RNAi screen of endoplasmic reticulum-associated host factors revealsa role for IRE1alpha in supporting Brucella replication. PLoSPathog.20084:e1000110.
10. Alton G.G., Elberg S.S., Crouch D. Rev. 1 Brucellamelitensis vaccine. The stability of the degree of attenuation. J Comp Pathol. 1967. 77:293–300.
11. Avila-Calderon E.D., Lopez-Merino A., Sriranganathan N., Boyle S.M., Contreras-
Rodriguez A. A history of the development of Brucella vaccines. Biomed Res Int. 2013:743509.
12. Macfaddin,J.E.Biochemical Tests for Identification of Medical Bacteria.3rd .(eds.).Lippincott Williams and Wilking.London,UK.2000.
13. Hiallibarton, B.L. and Blazkovec, A.A. Delayed hypersensitivity and acquired cellular resistance in guinea pigs infected with Listeria monocytogenes. Infect. Immun.: 1975.11: 1-7.
14. Miles, A.A.; Misra, S.S. and Irwin, J.V. The estimation of the bacteriocidal power of blood. J. Hyg., 1938.38: 732-749.
15. Luna, L.G. Manual of histologic staining methods of the armed force institute of pathology. 3rd ed. McGraw-Hill, New York.1968.
16. He, Y. .Analyses of Brucella pathogenesis, host immunity, and vaccine targets using systems biology and bioinformatics. Front Cell Infect Microbiol .2012.2: 2
17. Xiang, Z, Zheng, W, He, Y. BBP.Brucella genome annotation with literature mining and curation. BMC Bioinformatics.2006. 7: 347.
18. Autenrieth IB,Heesemann J. In vivo neutralization of tumor necrosis factor-alpha and interferon-gamma abrogates resistance to Yersinia enterocolitica infection in mice. Med. Microbiol. Immunol. 1992.181:333–338.
19. Doyle A.G., Halliday W.J., Barnett C.J., Dunn T.L., Hume D.A. Effect of recombinant human macrophage colony-stimulating factor 1 on immunopathology of experimental brucellosis in mice. Infect Immun. 1992.60:1465–1472.
20. Enright FM. In: Animal Brucellosis. Nielsen KH, Duncan JR, editor. CRC Press, Boca Raton; . The pathogenesis and pathobiology of Brucella infection in domestic animals; 1990. 301–320.
21. Murphy EA, Sathiyaseelan J, Parent MA, Zou B, Baldwin CL.Interferon-gamma is crucial for surviving a Brucellaabortus infection in both resistant C57BL/6 and susceptible BALB/c mice. Immunology.2001. 103:511–518.
22. Sathiyaseelan J, Goenka R, Parent M, Benson RM, Murphy EA, Fernandes DM, Foulkes AS, Baldwin CL. Cell Immunol.2006. 243:19.
23. Saunders BM, Liu Z, Zhan Y, Cheers
1908 Indian Journal of Public Health Research & Development, November 2019, Vol. 10, No. 11
C..Interleukin-6 production during chronic experimental infection Immunol. Cell Biol. 1993.71:275–280.
24. Zaitseva, MB, Golding, H, Betts, M .Human peripheral blood CD4+ and CD8+ T cells express Th1-like cytokine mRNA and proteins following in vitro stimulation with heat-inactivated Brucellaabortus. Infect Immun .1995.63: 2720–2728.
25. He, Y, Vemulapalli, R, Zeytun, A. Induction of specific cytotoxic lymphocytes in mice vaccinated with Brucellaabortus RB51. Infect Immun 2001; 69: 5502–5508.
26. Hort GM. Delayed type hypersensitivity-associated disruption of splenic periarteriolar lymphatic sheaths coincides with temporary loss of IFN-gamma production and impaired eradication of bacteria in Brucellaabortus-infected mice. Microbes Infect. 2003.5:95–106.
27. Arenas-Gamboa A.M., Rice-Ficht A.C., Fan Y., Kahl-McDonagh M.M., Ficht T.A.Extended
safety and efficacy studies of the attenuated Brucella vaccine candidates 16 M(Delta)vjbR and S19(Delta)vjbR in the immunocompromised IRF-1-/- mouse model. Clin Vaccine Immunol. 2012.19:249–260.
28. Schurig, GG, Sriranganathan, N, Corbel,MJ.Brucellosis vaccines: past, present and future.VetMicrobiol .2002.90: 479–496.
29. Sokol, C.L., Barton, G.M., Farr, A.G. &Medzhitov, R. «A mechanism for the initiation of allergen-induced T helper type 2 responses». Nat Immunol. 2008.9 (3): 310–318.
30. Hershey GK, Friedrich MF, Esswein LA, Thomas ML, Chatila TA. “The association of atopy with a gain-of-function mutation in the alpha subunit of the interleukin-4 receptor”. N. Engl. J. Med. 1997.337 (24): 1720–5.
31. Jon Aster, Vinay Kumar, Abul K. Abbas; Nelson Fausto. Robbins &Cotran Pathologic Basis of Disease (8th ed.). Philadelphia: Sa.2009.

Study of CD69 upon T-cells for SLE Iraqi Patients
Zahraa Saad Aziz Al-Hasan1, Qater Al-nada Ali Kanaem AL-Ibady2, Midean Ali Hussein3
1Department of laboratory, Neurosurgical Teaching Hospital / Iraqi Ministry of Health, 2Department of Medical laboratory, College of Health and Medical Technology; Middle Technical University, Baghdad / Iraq,
3Department of laboratory, Al-Yarmouk Teaching Hospital / Iraqi Ministry of Health
Abstract
Systemic lupus erythematosus (SLE) represented one of the chronic auto-immune multi systemic diseases affecting females more than males especially during childbearing age. A fluctuating nature of SLE disease activity deprive this disease from of any monitoring test, at likewise both of SLE disease activity index (SLEDAI) criteria or even the laboratory analyses do not confirm the disease activity, especially when a patient have normal serological results although during the disease activity (flare). This study done as a case control study, whereas the total sample size included 86 peripheral blood samples, which subdivided into: first the disease group comprised from 68 blood samples voluntary obtained from SLE patients. while the second group included 18 blood samples obtained from healthy individuals (controls) who matched in gender and age with the disease group. however, the disease group were be divided into active group (flare) and inactive group (remission) according to SLE disease activity index criteria by a specialized consultant. This study based on an immunological evaluation of CD69/CD3+ percentages of peripheral blood T-lymphocytes tested as SLE disease activity monitoring marker, owing to that purpose the CD69/CD3+ markers were be isolated from freshly blood T-lymphocytes. moreover in order to getting the best precise for Cluster Differentiation markers percentages CD69therefore were analyzed by Immunophenotyping flow cytometer of multi-color immunofluorescent staining. Whereas the CD69/CD3+ marker ratio can be obtained from data analysis (CY flowsoftware). such ratio set up CD69test as Comparison with SLEDAI criteria, as well as with age and gender factors. whereas CD69% described as early activation marker for T-lymphocytes, so tested for such aim. the results were gave insurance about over expression of CD69T-cells for the active (flare) group. Moreover the most important indicative parameter for disease activity that systemic lupus erythematosus disease activity index whereas CD69/CD3+% has a positive correlation matching with SLEDAI score for SLE disease groups,. Through these results about CD69 which proved as milestoneof SLE monitoring disease activity as independent parameter rather than SLEDAI criteria. Ultimately such results rewarded this study by finding cut off value for SLE disease activity described as CD69/CD3+ SLE activity≥ 21.5000%, within sensitivity71% and specificity 91.7% according to receiver operating characteristic curve. This study proven own aims through of the test named as CD69/CD3+ ratio marker that can be done as more easy, simplest, and accurate singular test instead of various decentralized a huge number of the clinical and laboratory investigations.
Key words: CD69 upon T-cells, SLEDAI, Flowcytometre, CD3, SLE Iraqi patients.
Introduction
Systemic lupus erythematosus defined as one of a complex, chronic, inflammatory autoimmune disease (1). That has fickle manifestations follows a relapsing and remitting course. More than 90% of SLE cases affects females (2), predominantly at child bearing age (3); with ratio 8:1female –per-male (4). Characterized
by impairment within tolerance to the self-antigen and formation of many different auto-antibodies (5),as well as the gender especially womenaffected at child-bearing age (6). The chronic sterile inflammation and tissue destruction all these events occur as a result of auto-antigen responsiveness at (SLE) disease mechanisms (6). Thus, T-lymphocytes have a positive correlation with (SLE) Disease Activity Index (SLEDAI) score (7). The

1910 Indian Journal of Public Health Research & Development, November 2019, Vol. 10, No. 11
T-cell receptor (TCR) is a complex of total membrane proteins essentially contribute in T-cells activation as a response to induced antigen, such antigens presented in the context of the MHC molecule by APCs. The probability of the increasing CD 69% on T-lymphocytes can be as pure reflection of the increasing CD3 popularity in SLEpatients (8).Already CD69 was described as earliest induced marker on the T-lymphocyte surface after TCR/CD3 complex activation, this expression and appearance of CD69 on plasma membrane of the activated lymphocytes (9). The expression of CD69 on T-cells surfaces at peripheral blood may give novel insight indicator about monitoring of early activated T-cells population leading to level of T-cell mediated immune responses can also be expected in the body (10).
Materials and Method
-Study population: Whole samples population of such study were 86 individual samples subdivided into first part Disease group that included Active group and Inactive group their samples obtained from both of In-patients and out-patients whom attended AL-Yarmouk Teaching Hospital. As well as patients who attended Al- Al-Karama teaching hospital. and second part of the study wasHealthy group obtained from selected 18 healthy individuals. During the period between October/2017 to June/2018.
(a) Disease group:it wassubdivided according to SLEDAI into:
(a1) Active group (disease flare): The samples were being obtained from 32 patients; 1male and 31females with aging ranged13-60years systemic lupus erythematosus (SLE) patients diagnosed according to disease activity assessed with SLEDAIby specialized physicians.
(a2) Inactive group (SLE remission): these Samples were obtained from 36 patients; 3 males /33 females with aging ranged 13-60years diagnosed by the specialized physicians as SLE patients within remission status according to (SLEDAI).
(b) Healthy control group: The samples were being obtained from the 18 healthy Individuals 2 males, 16 females their age ranged 13-60years volunteer after take their conceptions.
Samples collection: All samples were be collected
at the same manner from each individual, which described as 2.5ml of whole venous bloodhave been collected under sterile conditions then it was poured into heparin tube for CD3 & CD69 flow cytometric analyses.
The preparedantibodies againstCD3 marker was mouse IgG1 conjugated with FITCwhile suchprepared antibodiesagainst CD69 marker were mouse IgG1 conjugated with R-PE, Ultimately both markers were be diagnosed by BD FACs™ brand flow cytometer.
Flow cytometer: one improved table flow cytometer (Cy Flow) instrument used for detecting and analyzing of T-lymphocytes CD3 and CD69 markers, that must be equipped for appropriate fluorescence laser excitation at 405nm, 488nm, and 635nm with appropriate software (Cy View) software for data acquisition as well as analysis.
Flow- cytometer kits: Ι- CD3(SK7) monoclonal mouse anti-human, Π-PE Mouse Anti-Human CD69Becton, Dickinson and company BD Bioscience, BD Bioscience Pharmingen™/USA.
Procedure:20 µl were used for both of CD3 fluorochrome- conjugated monoclonal- antibody and CD69 fluorochrome-conjugated monoclonal antibody then were added to 100µl of freshly whole blood in 12x75-mm capped polystyrene test tube;at the sametime. The tested sample was thoroughly vortexthenmustbe incubated 15-30 minutes in the dark place at room temperature 20°C-25°C.Anyway about 2µl of 1x BD FACS lysine solution also were added after incubation, then thoroughly vortex and incubated for 10 minutes in the dark place at 20°C-25°C. whereas tested sample was centrifuged at 300g for 5minutes. Washing 3times by adding buffer solution, yet supernatant were discharged. Finally2µl from (FITC) solution were addedto thesample.the samples were tested byPartec Cy Flow® instrument; then the tested results were displayed on data show within a special program named as (Cy View software).
Statistical analysis: Analyses of data were carried out using the available statistical package of SPSS-24. Data were presented in simple measures of frequency, percentage, mean, standard deviation, and range. The Students-t-test was used for difference between two independent means or Paired-t-test for difference of paired observations or ANOVA test for difference among more than two independent means. Statistical significance was considered whenever P value ≤ 0.05(11).

Indian Journal of Public Health Research & Development, November 2019, Vol. 10, No. 11 1911
Findings
Frequency of CD69/CD3+T-cells % Expression among this study groups
The distribution of such study groups displayed on Figure 1 explained the distribution of tested samples within each group according to CD69/CD3+% of peripheral blood.
Figure1: Distribution of CD69/CD3+ ratio means± SD for studied groups within lighting highly significant differences among studied groups.
Comparison ofCD69/CD3+ frequency for the studied groups according to age and gender
Table1 shows the frequency of distributed groups according to age and gender with CD69 T-cells mean ±SD as a monitoring marker for SLE disease activity. the most highly significant means and standard divisions with age group ˂30 years for active group mean ±SD=26.80±0.34, likewise inactive group mean ±SD=11.56±1.83, finally healthy group mean ±SD=1.73±1.47. the tested marker CD69/CD3+ % pointed mean differences between male/female for each studied groups with highly significant differences p value 0.0001, P≤ 0.05.
Table1: CD69/CD3+% frequency among studied groups as comparisons depending on age & gender
ParametersActive (Flares)Mean ±SD (Range)
CD69/CD3+%
Non-Active (Remission) Healthy control
P- value
Mean ±SD (Range) Mean ±SD (Range)
Age (years)
<3026.80±0.34(26.41-27.0)
11.56±1.83(9.86-13.50)
1.73±1.47(0.47-3.34)
0.0001#
30--3925.57±3.91(19.0-30.0)
11.98±3.32(6.95-19.0)
1.31±0.46(0.92-1.82)
0.0001#
40--4920.01±9.84(7.45-32.0)
13.80±5.61(8.39-26.0)
1.52±1.21(0.35-2.91)
0.0001#
=>5025.60±9.36(6.83-31.14)
16.32±6.41(8.36-25.0)
1.52±0.78(0.25-2.38)
0.0001#
GenderMale 25.34±
15.96±5.63(9.89-21.0)
1.63±0.07(1.58-1.68)
0.083
Female23.33±8.39(6.83-32.00)
13.53±5.21(6.95-26.0)
1.50±1.04(0.25-3.34
0.0001#
*Significant difference between two independent means using Students-t-test at 0.05 level.#Significant difference among more than two independent means using ANOVA test at 0.05 level.

1912 Indian Journal of Public Health Research & Development, November 2019, Vol. 10, No. 11
CD69/CD3+T-cells ratio frequency among studied groups according to SLE disease activity index scores
the correlation between CD69/CD3+%T-cells with SLEDAI scores showed no shared points among the studied groups which displayed on Figure 2 follows:
Figure 2 : Linear Regression of CD69/CD3+ depending on SLEDAI scores for each of SLE active group that indicated highly significant positive correlation while SLE in active g group low significant positive correlation.
Speculation sensitivity and specificity for CD69/CD3+T-lymphocytes of peripheral blood ratio marker according to ROC curve
According to Receiver Operating Characteristic (Roc) curve CD69/CD3+ ratio giving sensitivity 71.9%while marked specificity 91.7% both in at SLE flare group CD69/CD3+ ≥ 21.5000 % which considered as cut off SLE disease activity ratio.
Figure 3: Receiver Operating Characteristic (ROC) curve indicating fundamental area under CD69/CD3+ curve.
Discussion
This study detects SLE disease age ranged from 21to 59 years among samples of SLE disease group patients. These results agreed with Al-Haidary was records the peak range of SLE Iraqi patients from20to69 years(12), while the range 14-61 years was recorded by Al-Saady (13), and Noori et al. reported the mean age of Iraqi SLE patients was±SD=27.8± 10.7(14). also, This study results corresponds with Arabic researches about SLE disease
like Al Dhanhani et al. who reported the Arab United Emirates mean age was ±SD=28.6± 12.4 years(15). Moreover Ku et al. referred to range of Chine’s’ women age was 9-40(16). actuallythis results agreed with Noori et al. who reported the percentages of the males 2.0% , and females 98% (14).these results pointed thecut off scorefor diseaseactivity was ≥4score. Whereas inactive group patients pointed at less than or equal 3 score ≤3 according to this study. However Bonelli et al. who reporting that the score of their patients was higher than usual score because they were have lupus nephritis ≥6 score, but also they reported about all previous studies opinions which considered the lower cut off disease activity at ˃3(17). Compagno who reported there was a significant correlation between SLEDAI score and lupus nephritis(18). Furthermore this study provides the percentagesbout some Iraqi SLE patients depending on SLEDAI scores. However there is no Iraqi study matched with SLEDAI scores% results. the current pointed highly significant correlation with SLE disease activity among groups under study depending on CD69/CD3+T-cells ratio as immunological markerthat played an early inducible marker for T-lymphocytes activation and migration according to Radulovic et al. (19). our results approved with Martin et al. who ensured that CD69 considered as early activation receptor within an intrinsic differentiation program where determined immune inflammatory process in SLE patients (20). Whereas the previous researchers results corresponds with the current study, like Su et al. and Syh.Jae et al.(10,21).Finally, the previous researchers supported CD69/CD3+ T-cells % as accurate independent marker for SLE disease activity assessment.Also about American females SLE disease activity age ranged 20-30 years by Weckerle and Niewold (22). Moreover Ku et al.claimed that optimum activity age was 28± 4.96 years(16). Furthermore, although that SLE disease mostly effects females than males, which may be due to immune system differences by Weckerle and Niewold (22),Actually, SLE disease activity index consider as an essential requisite for CD69/CD3+% T-cells evaluation test whereas successfully signify highly correlation with its scores reached to mean ±SD ˃30± % at 9 score. also disease activity was assessed by measuring SLEDAI scores, the weighted average of SLEDI scores>10” by Kakati et al.(23). So according to SLEDAI scores selection process done accordingto the patients of this study within scores lower than average ˃10 score in order to investigate the early activation process prior disease flare.Ultimately the ROC test was

Indian Journal of Public Health Research & Development, November 2019, Vol. 10, No. 11 1913
gave cut off disease activity value ≥ 21.5000% for CD69/CD3+%. This study suggested that CD69/CD3+ratio can be considered as immunological laboratory test for SLE disease activity control as independent monitoring test rather than SLEDAI criteria. this study was deemed as the first study seeking about CD69/CD3+ T-cells of peripheral blood for Iraqi SLE patients by using flow cytometer which detects cut off SLE disease activity. the conclusion: There is highly significant correlation between CD69ratio with age 21-59 years for female gender.this marker CD69/CD3+% T lymphocytes of peripheral blood may be considered as accurate singular independent monitoring test for SLE disease activity (flare) within cut off value ≥ 22.5%.
Conflict of Interest: Non
Source of Finding: Self
Ethical Clearness: Non
References
1- Relle, M. and Schwarting, A. Role of MHC-linked susceptibility genes in the pathogenesis of human and murine lupus. Clinical and Developmental Immunology 2012.
2- Cojocaru M., Cojocaru I. M., Silosi I. and Vrabie C. D. Manifestations of systemic lupus erythematosus. Maedica,2011. 6(4), 330.
3- Ambrose N., Morgan T.A., Galloway J., Ionnoau Y., Beresford M.W. and Isenberg D.A. Differences in disease phenotype and severity in SLE across age groups. Lupus;2016.25(14):1542-50.
4- Chan M.T.L. Serological Biomarkers in Systemic Lupus Erythematosus (Doctoral dissertation, University of Bath.2013.
5- Vitales-Noyola, M., Oceguera-Maldonado, B., Niño-Moreno, P., Baltazar-Benítez, N., Baranda, L., Layseca-Espinosa, E., Abud-Mendoza, C. and González-Amaro, R. Patients with Systemic Lupus Erythematosus Show Increased Levels and Defective Function of CD69. Mediators of inflammation2017.
6- Wigner M., Nilsson Jan and Kaplan Mariana J. Pathogenic immunity in systemic lupus erythematous and atherosclerosis: common mechanisms and possible targets for intervention. J Intern Med. 2015 November;2015. 278(5): 494–
506.
7- Luo, Q., Ye, J., Zeng, L., Li, X., Fang, L., Ju, B., Huang, Z. and Li, J. Elevated expression of TIGIT on CD3+ CD4+ T cells correlates with disease activity in systemic lupus erythematosus. Allergy, Asthma & Clinical Immunology, 2017.13(1):15.
8- Saber Kh,Z. El-Khayat, T. Ramzy and A.N. Hanna. The study of CD69 as an Early Marker of SLE Activity in pediatrics. Journal of medical sciences, 2007.7:74-80.
9- Cibrián D. and Sánchez‐Madrid F. CD69: from activation marker to metabolic gatekeeper. European journal of immunology. 2017.47(6):946-53.
10- Su CC, Shau WY, Wang CR, Chuang CY, Chen CY. CD69 to CD3 ratio of peripheral blood mononuclear cells as a marker to monitor systemic lupus erythematosus disease activity. Lupus. 1997 Jun;6(5):449-54.
11- Daniel WW, Cross CL. Biostatistics: a Foundation for Analysis in the health sciences: a Foundation for Analysis in the health sciences. Wiley Global Education; 2012 Dec 31.
12- Al-Haidary, B.A. “HLA Typing for Rheumatoid Arthritis Iraqi Patients (Familial Profile).” A dissertation submitted to the College of Medicine/ University of Baghdad, in partial fulfillment of PhD degree in Medical Microbiology/ Clinical Immunology.2004.
13- Al-Saady, R.E. “HLA-Class II Genotyping in Systemic Lupus Erythematosus Iraqi Patient in Relation with Toll-Like Receptor 9.” A thesis Submitted to the Institute of Genetic Engineering and Biotechnology for Postgraduate Studies.” University of Baghdad in Partial fulfillment of the requirement for the Degree of Doctor of Philosophy in Genetic Engineering and Biotechnology.2010.
14- Noori A. S., Ali M. Jawad, Jassim N. A., and Gorial F. I. “Prevalence of Antiphospholipid Antibodies in Sample of Iraqi Patients with Systemic Lupus Erythematosus: A Cross Sectional Study.” American Journal of Clinical Medicine Research; 2013.1(4): 61-64.
15- Al Dhanhani A.M., Agarwal M., Othman Y.S. and Bakoush O. Incidence and prevalence of systemic lupus erythematosus among the native Arab

1914 Indian Journal of Public Health Research & Development, November 2019, Vol. 10, No. 11
population in UAE. Lupus, 2017.26(6);664-669.
16- Ku M., Guo S., Shang W., Li Q., Zeng R., Han M., Ge S. and Xu G. Pregnancy outcomes in Chinese patients with systemic lupus erythematosus (SLE): A retrospective study of 109 pregnancies. PloS one, 2016.11(7):e0159364.
17- Bonelli M., Savitskaya A., Von Dalwigk K., Steiner C.W., Aletaha D., Smolen J.S. and Scheinecker C. Quantitative and qualitative deficiencies of regulatory T cells in patients with systemic lupus erythematosus (SLE). International immunology,2008. 20(7):861-868.
18- Compagno M. “Studies on Anti-ds DNA Antibodies and Other Potential Biomarkers in Systemic Lupus Erythematosus.” A thesis submitted for Faculty of Medicine Doctoral Dissertation Series/ Lund University/ Professor Herrmann, Martin, Department of Internal Medicine 3 and Institute of Clinical Immunology. Friedrich Alexander University Erlangen-Nuremberg, Germany, (English language)2015.
19- Radulovic K, Rossini V, Manta C, Holzmann K, Kestler HA, Niess JH . The Early Activation Marker CD69 Regulates the Expression of
Chemokines and CD4 T Cell Accumulation in Intestine. PLoS ONE .2013.8(6): 65413.
20- Martín P., Gómez M., Lamana, A., Marín A.M., Cortés J.R., Ramírez-Huesca M., Barreiro O., López-Romero, P., Gutiérrez-Vázquez C., de la Fuente H. and Cruz-Adalia A. The leukocyte activation antigen CD69 limits allergic asthma and skin contact hypersensitivity. Journal of Allergy and Clinical Immunology;2013. 126(2): 355-365.
21- Syh.Jae L. , Kuo M-L, Hsiao H-S, Lee P-T, Chen J-Y, Huang J-L .Activating and inhibitory receptors on natural killer cells in patients with systemic lupus erythematosis-regulation with interleukin-15. PLoS ONE .2017.12(10): e0186223.
22- Weckerle C. E., and Niewold T. B.The unexplained female predominance of systemic lupus erythematosus: clues from genetic and cytokine studies. Clin. Rev. Aller. Immuno.2011. .42-49 :(1)40
23- Kakati S., Teronpi R., and Barman B.Frequency, pattern and determinants of flare in systemic lupus erythematosus: A study from North East India. The Egyptian Rheumatologist, 2015.37(4): S55-S59.

Effect of Fusariumgraminarum Silver Nanoparticles on IL-10 and IFN-γ cytokines in Mice after Infected by
Leishmaniadonovani
SabaaTaher Mohamed¹, Haydar Hassan Ghadi¹, Nidaa Mohammed Sulaiman¹, Sura Basil Kamal¹, Hassan Ali Aja²
1Department of Biology, College of Science, University of Al-Mustansiriyah, 2Tikirt university
Abstract
Leishmaniasis remains one of the fatal diseases worldwide, and the conventional antileishmanial therapies are toxic and most are expensive. Biological silver nanoparticles possess broad-spectrum antimicrobial activities and could be a future alternative to current antimicrobial agents. In the present study an approach was made to synthesize silver nanoparticles using a Fusariumgraminarum fungus.To investigates the efficiency of silver nanoparticles against Leishmaniadonovanicompared with pentostam drug in vivo by measuring the levels of immune cytokines (IL-10 and IFN-γ) in serum infected mice and treated with AgNPs (0.1 ml / day) and comparisons with pentostam drug (0.01 / day) after 7,14 and 21 days of treatment. The results showed that the level of IFN-γ in grouptreated with AgNPs increased significantly in third weeks, compared withpentostamgroup.While treated the infected mice withpentostam/AgNPs together, gradualdecreaseoccured in the level of IFN-γ in all groups, compared with negative control. Also a significant increaseoccurs in the IL-10 level within 21days when mice were treated with AgNPs compared with pentostam.
Key word: Leishmaniadonovani, pentostam, silver nanoparticles, IL-10, IFN-γ
Introduction
Leishmaniasis is one of the vector-borne diseases caused by obligate protozoan parasites of the genus Leishmania, they are transmitted by different species of sand flies belong the genus of Phlebotomine as extracellular flagellated promastigotes that replicate as an intracellular parasite ( aflagellateamastigotes) in mononuclear cells of mammalian hosts[1]. Visceral leishmaniasis is considered as the second cause of mortality and the fourth cause of morbidity after malaria, schistosomiasis and African trypanosomiasis[2].Pentavalentantimonials are a group of compounds used for the treatment of leishmaniasis. The compounds currently available for clinical use are sodium stibogluconate and meglumineantimonate. The Role of cytokines such as IFN-γ is to activate macrophages and enhance the microbicidal activity of these cells to
Correspondence: [email protected]
kill intracellular pathogens through the generation of reactive oxygen species and reactive nitrogen species.IL-10 promotes intracellular infection, including human visceral leishmaniasis, by disabling Th1 cell type responses and/or deactivating parasitized tissue macrophages[3].
Nanotechnology continues to attract significant attention due to its impact on many currently important areas such as energy, medicine, electronics and the aerospace industry. Nanoparticles that possess one or more dimensions of the order of 100 nm or less continue to attract significant attention due to their unique properties in the realms of chemistry, optics, electronics and magnetism[4].
The use of eukaryotic organisms such as fungi, Fusariumgraminarum and other species offers considerable promise for large-scale metal nanoparticle production since the enzymes that are secreted by the fungi represent an essential ingredient for the biosynthesis of metal silver nanoparticles has attracted high interest

1916 Indian Journal of Public Health Research & Development, November 2019, Vol. 10, No. 11
due to their unique and excellent properties in addition to its therapeutic potential for the treatment of a variety of diseases that includes retinal neovascularization and acquired immunodeficiency syndrome due to human immunodeficiency virus [5].
Materials and Method
Silvernanoparticles (AgNPs) preparation:
Silvernanoparticles (AgNPs) preparation according to Birla et al.,l[6]methode.
Characterizationof nanoparticles
The exact configuration of the, size, concentration, morphology of crystals, aggregation state and even bioconjugation and was measuredby using particle the following techniques:Atomic force microscopy (AFM)( AA‐3000, Angstrom, USA), X-Ray diffraction (XRD)(Shemadzu, Japan), Ultraviolet-visible spectroscopy (UV-VIS)(Shemadzu, Japan)[7].
Parasite strain and culture
Leishmaniadonovani was isolated from the bone marrow of an infected child , the strain was obtained from biotechnology center/ AL- Naharin University, it was cultured and maintained by serial passage in NNN media each 8 days and incubated at 26°C.
Leishmania antigen preparation
One milliliter of promastigote culture in stationary phase washed three times with phosphate buffered saline by centrifuge 4000 rpm in 15 minutes then adjusted to concentration 1× parasite\ml.
Animals
Ninety six Male albino mice aged between 8-12 weeks, weighing 20-28 gm was obtained from The National Center for Drug Control and Research, housed under standard condition in animal house in the biology department in College of Science/AL-Mustansrya university . Seventy eight mice were infected with 1 × 10⁷ parasite/ml L. donovanipromastigotes by injectionintraperitonial[9]. Then the groups were inoculated as a follow:
• Group 1 : inoculated orally by stomach tube (0. 1ml/day) normal saline considers as control positive group.
• Group 2 : inoculated orally by stomach tube AgNPs (0.1ml/day) for 21 days considers as an AgNPs treatment group.
• Group 3: injected with (0.01 ml/day) from Pentostam drug by intramuscular each day for 21 days considers as Pentostam treatment group.
• Group 4 : inoculated orally by stomach tube AgNPs (0.1ml/day) and injected with (0.01ml/day) from Pentostam drug by intramuscular for 21 days consider as AgNPs and Pentostam treatment group.
• Group 5: inoculated orally by stomach tube (0. 1ml/day) normal saline considers asnegative control without infecting by L. donovani parasite..
• Blood collection and animal anatomy
In the days 7th, 14th, 21th the blood samples were collected from all experiment, mice from facial vein collected 2 ml of blood in the sterile plane tube, then left at room temperature, after 35min centrifugation the clotting blood, obtained clear serum and stored at -20°C until the examination for immunologic test.
Determination of cytokine levels
The serum levels of IL-10 and IFN-γwere analyzed by ELISA (human Systems, Germany). The cytokines were quantified usingmanufacturer’s protocol.
Statistical analysis
The Statistical Analysis System- SAS (2012) program was used to effect of different factors in study parameters. Least significant difference –LSD test (ANOVA) was used to significant compare between means in this study[9].
Findings
Detection of the existence of FusariumAgNPs
After adding of silver nitrate (AgNO3) to filtered cell, the color of the mixture changed from colorless to blackish brown compared with negative control remain clear (colorless), the changes in color which confirms the reduction of AgNO3 by F. graminarumindicated the presence of AgNPs[10].

Indian Journal of Public Health Research & Development, November 2019, Vol. 10, No. 11 1917
Morphology ofFusariumsilver nanoparticles by atomic forcemicroscopy Determine Fusarium silver nanoparticles (AgNPs) sizes and surface morphology were measured ,using the software of the AFM , the images of AFM for FusariumAgNPs in fig. (1)represents particle size distribution, where average diameter is
94 nm. While in fig.(2A,B) is AFM picture in three dimensions (3D) and two dimensions (2D), it explains structural shape for grains,found that the average roughness (Ra) is 9.33 nm and Root mean square (Sq) is 11.6 nm.
.
Figure(1):Granularity volume distribution chart of silver nanoparticles produced by F. graminurum
Figure (2): AFM images of silver nanoparticles produced by F. graminurum
(A) three dimensions 3D and (B) two dimensions 2D
Characterization of FusariumAgNPs by X-RayDiffraction
A typical XRD pattern of FusariumAgNPs as shown in fig.(3), the diffraction
peaks at 38.05°, 44.22°, 64.32 and 77.31° were correspond to the (111), (200), (220)
and (311) facets of the face centered cubic crystal structure, therefore the average
crystallite size was 28.225 nm.
AAAAAA
BAAAABA

1918 Indian Journal of Public Health Research & Development, November 2019, Vol. 10, No. 11
Characterization of FusariumAgNPs by X-RayDiffraction
A typical XRD pattern of FusariumAgNPs as shown in fig.(3), the diffraction peaks at 38.05°, 44.22°, 64.32
and 77.31° were correspond to the (111), (200), (220) and (311) facets of the face centered cubic crystal structure, therefore the average crystallite size was 28.225 nm.
Figure (3): X-Ray pattern of silver nanoparticles produced by F. graminurum.
Optical properties ofFusariumAgNPs by UV–Visible Spectral:
This technique confirms the presence of FusariumAgNPs by measuring the absorbance of the bioreduced solution at wavelengths between 300 and 800 nm. Extinction spectroscopy of ultraviolet (UV) and visible (Vis) light (UV–Vis spectrum) allows confirming the presence of FusariumAgNPs because of the characteristic plasmon resonance, which showed an absorbance peak at 420 nm, fig (4)..Figure (4):UV-Visible spectroscopy of silver nanoparticles produced by F. graminurum
Determine sera level of cytokines in mice serum
Serum level of Interferon-γ (INF-γ)
After mice are infected with leishmania parasite, the level of INF-γ was increased in the three weeks
and after treated of these mice with pentostam and FusariumAgNPs observed that the level of INF-γ has increased in all groups compared with the negative control group, shown in table (1) significant differences (P<0.01) between all groups compared with control .In control positive group the level of cytokine was elevated from the first week was (183 ± 13.44pg/ml). While the pentostam group was observed to increase occurredin the first week (305.17 ± 40.76 pg/ml). InAgNPs group the level of INF-γ has increased gradually over the three weeks (284.17 ± 42.97Pg/ml , 303.83 ± 51.98Pg/ml and 410.00 ± 10.52Pg/ml)respectively. In P/AgNPsgroup gradual decrease occurred since the first week (284.17 ± 42.97 pg/ml) ,and gradually continues to declinein second and third weeks (218 ± 36.63 pg/ml and169.50 ± 8.41 pg/ml) respectively .

Indian Journal of Public Health Research & Development, November 2019, Vol. 10, No. 11 1919
Table 1.The serum level of INF-γin the experimental groups after three weeks (Mean ± SD)
The GroupsTime (day)
LSD value7 14 21
Control(–ve) 115.67 ± 4.80 118.33 ± 5.04 123.33 ± 1.63 18.542 NS
Control(+ve) 183 ± 13.44 239.17 ± 4.35 323.17 ± 14.79 31.602 **
Pentostam 305.17 ± 40.76 301.83 ± 49.94 315.67 ± 61.46 26.524 NS
AgNPs 122.50 ± 8.87 303.83 ± 51.98 410.00 ± 10.52 37.277 **
P/AgNPs 284.17 ± 42.97 218.00 ± 36.63 169.50 ± 8.41 31.842 **
LSD value 42.668 ** 47.073 ** 61.905 ** ---
**a significant difference at P<0.01 , NS: Non-Significant.
Means having with the different small letters in same column differed significantly.
Serum level of Interleukin–10 (IL-10)
The serum levels of IL-10 in treated groups of the present study were high level in groupspentostam and FusariumAgNPs infected with leshmaniaparasite were (338 ± 16.07 and 467.83 ± 34.43)respectively in the third week. While the level of IL-10 in control positive group was lower level (320.67 ± 6.37 pg/ml ) in third weeks compared with other control negative group was (97.67 ± 6.62 pg/ml). As well as in the P/AgNPs group also elevated, but less than other treated groups in the third week (336.17 ± 22.06 pg/ml) as illustrated in table (2). There was significantly different (p ≤ 0.01) between all groups compared with positive control.
Table 2.The serum level of IL-10in the experimental groups after three weeks (Mean ± SD)
Groups Time (day) LSD value
7 14 21Control(-ve) 95.17 ± 2.31 96.33 ± 1.97 97.67 ± 6.62 11.547 NS
Control(ve+) 178.50 ± 8.87 232.50 ± 5.89 320.67 ± 6.37 28.761 **
Pentostam 290.83 ± 23.31 451 ±20.53 338.00 ± 16.07 32.804 **
AgNPs 112 ± 8.09 456 ±26.61 467.83 ± 34.43 41.952 **
P/AgNPs 121.83 ± 7.46 141.50 ± 2.88 336.17 ± 22.06 30.776 **
LSD value 27.336 ** 42.602 ** 41.735 ** ---
** mean significant difference at P<0.01 , NS: Non-Significant.
Means having with the different small letters in same column differed significantly.

1920 Indian Journal of Public Health Research & Development, November 2019, Vol. 10, No. 11
Disscusion
The synthesis of silver particles by using Fusariumgraminarumwas observed during change the color of the mixture from colorless to blackish brown, the color change confirmed the formation of nanoparticles,these results corresponding withBawaskaret al.[11], Mahmoud et al,[11] .
This study, the results are near to results of Shafiqet al.[12].showed that, the XRD diffraction measured in Ag-NPs resulted in four intense peaks and this further confirms that the Ag-NPs formed in the extracellular filtrate are present in the form silver nanocrystals.Vijayanetal.[13] observed that AFM topology is very helpful in revealing the exact size and shape of silver nanoparticles.Jebali and Kazemi[14]reported that highest anti-leishmanial drug was observed for Ag NPs, and AuNPs were in the second level, as well as they found that anti-leishmanial activity of metal nanoparticles is higher than metal oxide nanoparticles that may be due to oxidation capacity of metal nanoparticles, leading to moredamage to membranes, enzymes and DNA.
The results of cytokine indicated an increase occurs in serum level of IL-10 and INF-γduring three weeks post-infection as showed by Kamilet al.[15]reported a significantly increased serum level of IFN-γ and IL-10 in VL patients compared to healthy controls, also confirmed by Khoshdelet a.l[17] reported thatthe levels of the serum cytokines, IL-10, IL12, and IFN-γ were higher in patients than in family members and control individuals.
Also, in a previous studydemonstrate the elevation of both IFN-γand IL-10 mRNA levels in the lesional environment of thebone marrow in patients with kala-azar before therapy, findings which may be of importance in understanding how thisorganism is able to avoid immune-mediated destruction by itshost macrophages[17].Inactive visceral leishmaniasis, Al-Autabbiet al.[18]reported that the immune system is highly activated and produce both the macrophage-activating cytokines IFN-γ and the macrophage-deactivating cytokines IL-10.
IL-10 is able to inhibit Th1 cell and macrophage activation; therefore, higher levels in the sera of VL might be expected, IL-10 also plays an important role in regulation of inflammatory response, and is important for the survival and persistence of the parasite inside macrophages [19]. In other reports showed that, the data
favor a role for IL-10 in conditioning the host cells so that they become poorly responsive to even high levels of IFN-γ for intracellular killing [20].
IFN-γ plays an essential role in macrophage-mediated antileishmanial activity, contributing to parasite elimination and the subsequent resolution of infection [21]. Also, IFN-γ cytokine is the main factor in inducing the transcription of inducible nitric oxide synthase (iNOS) and the production of nitric oxide (NO)[22].
Nanoparticles can undergo a series of processes, including binding and reacting with proteins, phagocytosis, deposition, clearance, and translocation. At the same time, nanoparticles can elicit a spectrum of tissue responses, such as cell activation, generation of reactive oxygen species, inflammation, and cell death[23]. A significant increase in the level of IFN‐γ was detected in the serum of patients during treatment with pentostam when compared to its level before treatment, this explains that a successful drug therapy were restored T‐cell proliferation and IL‐2, IFN‐γ production in response to Leishmaniaantigen [24].
Conclusion
Silver nanoparticles synthesis from Fusariumgraminarumis safety, nontoxic andit can be considered as a new antileishmanial agent.AlsoFusariumAgNPslead to induce pro and anti-inflammatory cytokines.
Conflict of Interest: Non
Source of Funding- Self
Ethical Clearance: we have got admission from biotechnology center/ AL- Naharin University and the biology department in College of Science/AL-Mustansryauniversity.
References
1-Bates, P. A. Transmission of Leishmaniametacyclicpromastigotes by phlebotomine sand flies. International journal for parasitology. 2007; 37(10): 1097-1106.
2-World Health Organization. Control of the leishmaniasis.Report of a meeting of the WHO Expert Committee on the Control of Leishmaniases. Geneva (Switzerland): World

Indian Journal of Public Health Research & Development, November 2019, Vol. 10, No. 11 1921
Health Organization. 2010.
3- Singh O. P., Gidwani K., Kumar R., Nylén S., Jones S. L., Boelaert M. et al. Reassessment of immune correlates in human visceral leishmaniasis as defined by cytokine release in whole blood. Clinical and Vaccine Immunology. 2012; 19(6): 961-966.
4- Mohanpuria P., Rana N. K. and Yadav S. K. 2008 Biosynthesis of nanoparticles: technological concepts and future applications. Journal of Nanoparticle Research. 2005; 10(3): 507-517.
5- Sriram M. I., Kanth S. B. M., Kalishwaralal K. and Gurunathan S. Antitumor activity of silver nanoparticles in Dalton’s lymphoma ascites tumor model. International journal of nanomedicine. 2010;5: 753–762.
6- Birla S. S.,Gaikwad S. C., Gade A. K., and Rai M. K. Rapid synthesis of silver nanoparticles from Fusariumoxysporum by optimizing physicocultural conditions. The Scientific World Journal. 2013: 12.
7- Hemath Naveen K. S., Kumar G., Karthik L. and BhaskaraRao K. VExtracellular biosynthesis of silver nanoparticles using the filamentous fungus Penicillium spp. Archives of applied science Research. 2010; 2(6): 161-167.
8- Morimoto A., Omachi S., Osada Y., Chambers J. K., Uchida K., Sanjoba C.et al. Hemophagocytosis in experimental visceral Leishmaniasis by Leishmaniadonovani. PLoS neglected tropical diseases. 2016;10(3): e0004505.
9- Snedcor G.W. and Cochran W.C. Statistical Methods, 7th edition.1980. Iowa State University.
10- Bawaskar M.; Gaikwad S.; Ingle A.; Rathod D.; Gade A.; Duran N. et al. A new report on mycosynthesis of silver nanoparticles by Fusariumculmorum. Current Nanoscience. 2010; 6(4): 376-380.
11- Mahmoud M. A., Al-Sohaibani S. A., Al-Othman M. R., Abd El-Aziz A. M. and Eifan S. A. Synthesis of extracellular silver nanoparticles using Fusariumsemitectum (KSU-4) isolated from Saudi Arabia. Digest Journal of Nanomaterials and Biostructures. 2013; 8(2): 589-96.
12- Shafiq S. A., Al-Shammari R. H. and Majeed H. Z. Study of Biosynthesis silver nanoparticles by
Fusariumgraminaerum and test their antimicrobial activity. International Journal of Innovation and Applied Studies. 2016; 15(1): 43.
13- Vijayan S., Koilaparambil D., George T.K. and ManakulamShaikmoideen J. Antibacterial and Cytotoxicity Studies of Silver Nanoparticles Synthesized by EndophyticFusariumsolani Isolated from Withaniasomnifera (L.). Journal of Water and Environmental Nanotechnology. 2016;1(2): 91-103.
14- Jebali\ A. and Kazemi B. Nano-based antileishmanial agents: atoxicological study on nanoparticles for future treatment of cutaneous leishmaniasis. Toxicology in Vitro. 2013; 27(6): 1896-1904.
15- Kamil M.N., Al-Najar S. and Ghanim N. Evaluation the Levels of IFN-Gamma, IL-10 and Concentration of Zn in Children with Visceral Leishmaniasis. Iraqi postgraduate medical. 2013; 12(4): 504-510.
16- Khoshdel A., Alborzi A., Rosouli, M., Taheri E., Kiany S. and Javadian M.H. Increased levels of IL-10, IL-12, and IFN-γ in patients with visceral leishmaniasis. Brazilian Journal of Infectious Diseases. 2009;13(1): 44-46.
17- Karp, C.L.; El-Safi, S.H.; Wynn, T.A.; Satti, M.M.; Kordofani, A.M.; Hashim, F.A.et al. In vivo cytokine profiles in patients with kala-azar. Marked elevation of both interleukin-10 and interferon-gamma. Journal of Clinical Investigation. 1993; 91(4): 1644.
18- Al-Autabbi, J.R.Z.; Rahi, A.A. and Khamesipour, A. The Role of Interferon-gamma (IFN-γ) and Interleukin-10 (IL-10) in Iraqi Patients with Visceral Leishmaniasis (VL).Donnish Journal of Medicine and Medical Sciences. 2015; 2(3): 032-035.
19- Costa A. S. A., Costa G. C., Aquino D. M. C. D., Mendonça V. R. R. D.,Barral A., Barral-Netto M.et al. Cytokines and visceral leishmaniasis: a comparison of plasma cytokine profiles between the clinical forms of visceral leishmaniasis. Memórias do InstitutoOswaldo Cruz. 2012; 107(6): 735-739.
20- Belkaid, Y.; Hoffmann, K.F.; Mendez, S.; Kamhawi, S.; Udey, M.C.; Wynn, T.A. et al. The role of interleukin (IL)-10 in the persistence of

1922 Indian Journal of Public Health Research & Development, November 2019, Vol. 10, No. 11
Leishmania major in the skin after healing and the therapeutic potential of anti–IL-10 receptor antibody for sterile cure. Journal of Experimental Medicine. 2001, 194(10): 1497-1506.
21- Tripathi P., Singh V. and Naik S. Immune response to leishmania: paradox rather than paradigm. FEMS Immunology and Medical Microbiology.2007;51(2): 229-242.
22- Shio M. T. and Olivier M. Leishmania survival mechanisms: the role of host phosphatases. Journal of leukocyte biology. 2010;88(1): 1-3.
23- Chen H. W., Su S. F., Chien C. T., Lin W. H., Yu S. L., Chou C. C.et al. Titanium dioxide nanoparticles induce emphysema-like lung injury in mice. The the Federation of American Societies for Experimental Biology (FASEB) journal. 2006; 20(13): 2393-2395.
24- Al-Autabbi, J.R.Z.; Rahi, A.A. and Khamesipour, A. The Role of Interferon-gamma (IFN-γ) and Interleukin-10 (IL-10) in Iraqi Patients with Visceral Leishmaniasis (VL).Donnish Journal of Medicine and Medical Sciences. 2015; 2(3):032-035.

Antifungal Activity of Boswellia serrata Gum Extracts on Antifungal Drugs Resistant Aspergillusfumigatus Isolated From
Diyala Patients
OmarD.Abdul Sattar1, Sahar R.Fadhel2, Thuraya Kadhim Ismael2, Anaam Fuad Hussain3
1University of Diyala, College of science, Department of chemistry Baqubah, 2Iraq Ministry of Health and Environment, Diyala Health Department, Baqubah Teaching Hospital, 4University of Diyala College of Science
Department of Biotechnology Baqubah, Iraq
Abstract
This study focused on antifungal activity of alcoholic extracts of Boswellia gum onthe potent antifungal resistant opportunistic pathogen for humans, Aspergillus fumigatus. The antifungals used were: Terbinafine, Nystatin and Clotrimazol.Antimicrobial susceptibility testingof alcoholic gum extracts of Boswellia was done by well diffusion methodagainst the mold. Results showed that Boswellia extracts had the ability to inhibit fungal growth in vitro and the statistics revealed different inhibition zones gradually increased with the increasing in the concentration of theextract and that acetonic extract was more effective than ethanolic. Confirming the presence of saponins,volatile oils,terpensand phenolic compounds in acetonic extract withphenolic compounds in ethanolic extract.
Key words: Aspergillus fumigatus, Antifungal resistance, Boswellia extract
Introduction
Aspergillus is an important pathogen of humans and animals,it is a leading cause of human fungal ailments with A. fumigatus as the main causative agent of invasive fungal diseases. A. fumigatus[1]. Aspergillosis is the name given to a wide variety of diseases caused by infection by this fungus, the majority of cases occur in people with tuberculosisor Chronic Obstructive Pulmonary Disease
[2], but with otherwise healthyimmune systems[3][4].It is estimated that otitis externa make up 9 to 25% are caused by fungi, calledfungal otitis or otomycosis[5][6].However, antifungal resistance occurrence has to be considered independently for each antifungal class, fungal genus and epidemiological data regarding incidence of distributed worldwide [7].Despite improvement of antifungal therapies over the last 30 years, the phenomenon of antifungal resistance is still of major concern in clinical practice[8].Since the thousands of years, people used to take plant originated products and the natural extracts prepared from various species of Boswellia tree for the treatment of several diseases[9][10].Many previous studies indicated itsbiological therapeutic effectssuch as inflammation and antioxidant[11[12][13],anticancer[14] and antimicrobial[15].
Many of studies indicated its significant antifungal properties against toxigenic Aspergillii [16][17].We need the medicinal plants as antifungal agents instead of using artificial drugs which have several toxic and side effects. Therefore, the objective of this study was to estimate antifungal potential of Boswellia against selected mould species.
Materials and Method
Preparation of Plant extract: The gum resinsof B. serratawaspurchased from local market ofBaqubah, Diyala, Iraq. The extraction was prepared according to Matnyet al[18] with slight modifications using Lyophilizing technique. The two extractswere stored in a well-closed containers, protected from light and kept at 4°C until use.
Phytochemical analysis: Screening of most secondary metabolites in the crude extracts ofB. serratawas determined as following:
• Test for alkaloids and terpens was performed according to Njoku and Obi [19].
• Test for saponins, tannins and glycosides was

1924 Indian Journal of Public Health Research & Development, November 2019, Vol. 10, No. 11
performed according toObasi et al[20].
• Test for phenolic compoundswas carried out according to the method described byHarborne[21].
• Test for volatile oilsperformed according to Indian Herbal Pharmacopoeia[22].
Preparation of Plant Extract Concentrations:Stock solutions (200mg ml-1) was prepared by mixing 2 g of the dried extract with 10 ml ethylene glycol50% (solvent used as diluents solution), and then it was sterilized with millipore filter membrane (0.22 µm),then different concentrations of(100,50)mg ml-1were prepared by mixing known volume from the stock solution with ethylene glycol.
Antifungal drugs Preparation: The commercially available samples of antifungal drugswere:Terbinafine, Nystatin, and Clotrimazol. Each antifungal was prepared as an initial concentration ‘’working stock solution’’ of 10 mg ml-1[23]
Preparation of tested microorganism: Twenty samples were collected from patients with Aspergillosis Otomycosis in Baqubah Teaching Hospital (Diyala Governorate). The samples were 8 of sputum, 2 nose swabs and 10 ear swabs. All specimens were collected from January to April 2018. The samples were examined directly under the light microscope objectives to detect fungi and their septate hyphae [24]. Then culturing on the Sabouraud dextrose agar to observe the macroscopic characteristics and the isolates were identified to the species level on the basis of microscopic characteristics[25]
[26][27][28]. Fungal inoculum was prepared by the use of haemocytometer to count fungal conidia[29].
The activity of the antifungal drugs and plant extractsin vitro: Antifungal susceptibility testing was done by agar well diffusion method to detect anti-fungal effect for all A. fumigatus isolates towardantifungals(Nystatin, Terbinafine and Clotrimazol),andthe extractswere performed against only the antifungal drug resistant isolate. All tests were in triplicateusing the solventethylene glycol [30].
Statistical Analysis: The results were analyzed by using one-way variance analysis (ANOVA). All of our analysis were done by SPSS-18. Differences at P < 0.05
were considered statistically significant.
Findings
Physical and PhytochemicalInvestigation: Acetonic extract of B. serrata was viscous to colloidal texture with tan to brown color, not soluble in water and the percentage was14% of crude gum resin. While ethanolic extract was powdery texture with pale yellow in color, less soluble in water and the percentage was 6% of crude gum resin. Phytochemical analysis for active compounds was illustrated in table 1.
Isolation and Identification of A. fumigatus: Cultural and microscopic examination illustrates that the infections belonged to the fungus A. fumigatus in 20 specimens were 13 isolates. Figure (1) show the microscopical and cultural feature of the fungus.
The Sensitivity of A. fumigatus o the antifungal drugsIn Vitro:The isolates were a variable in their sensitivity to drugs (figure 2). However one isolate was resistant to all antifungal drugs.
Antifungal activity of the plant extracts In Vitro: As shown in figure 3, the results of statistical analysis showed significant (P ≤ 0.05) inall concentrations (200,100 and 50 mg ml-1) of the acetonic extract of B. serratagum resin which showed inhibitory activity againstA. fumigatus incomparison to the ethylene glycol (control).While ethanolic extract shows the inhibitory activity at high concentrations (200 and 100 mg ml-
1) only with less efficient incomparison to acetonic extract(Figure 4).
Figure 1: (a) Aspergillus fumigatus grown on SDA at 37°C after 7 days of incubation,(b) Microscopic feature of A. fumigatus stained with Lactophenol cotton blue.

Indian Journal of Public Health Research & Development, November 2019, Vol. 10, No. 11 1925
Terb
inafin
e
Nystat
in
Clotrim
azol
0
5
10
15
20
****
Antifungal ( 10mg/ml)
Num
ber
of is
olat
es
0 50 100
200
0
5
10
15
20Ethanolic extractAcetonic extract
***
******
The concentration (mg/ml)
Isol
ates
Figure 2: Sensitivity of Aspergillus fumigatus to antifungal drugs
Figure 3: Effect of Boswellia serrata gum extracts on Aspergillus fumigatus
Figure 4: Effect of (a) acetonic and (b) ethanolic extract of Boswellia serrata gum on A. fumigatus at the concentrations(200,100, 50)mg ml-1(1,2,3), C: control (ethylene glycol).
Table. (1): Phytochemical analysis tests of Boswellia serrata gum alcoholic extracts
ResultPhytochemical Constituents Ethanolic
extractAcetonic extract
NegativeNegativeAlkaloids
NegativePositiveSaponins
NegativeNegativeTannins
NegativeNegativeGlycosides
NegativePositiveTerpens
Positive PositivePhenolic compounds
NegativePositiveVolatile oils
Discussion
Phytochemical screening of many active materials of B. serrataacetonic extract showed positive. While, ethanolic extract was positive for phenolics only(Table 1).Many of studies were made about the chemical composition of this plant. In 2009,Upaganlawar and Ghule[31]isolated boswellic acid and many of terpenoids. Al-Ogaili et al[15], showed positive results for saponins and negative for phenolic compounds in on aqueous extract. Another studies showed that resins chiefly contain higher terpenoids which are mainly the former of its pharmacological effects [9][32].Methanolic and ethyl acetate extract of this plant showed the presence of tannins, phenols, steroids, flavonoids, and saponins [33].Venkatesh et al[34]extracted the essential oil from this plant. Study the plant extracts by polar solvents such as alcohol (acetone or ethanol) provided more consistent antifungal activity compared to those extracted by water; this might have resulted from the lack of solubility of the active constituents in aqueous solutions[35]. Further trials using solvents of various polarities will explore the effects of solvent composition on extract efficacy. While, alcohol extract showed some degree of antifungal activity. Therefore, Ethylene Glycol used in this study as a solvent, it is chemically colorless, odorless and possessed sweet taste alcohol used as solvent or co-solvent offers wide range of advantages such as; biocompatibility, biodegradable, stable, hygroscopic, non-toxic and more importantly water-solubility, it possess fungistatic properties thus acts as preservative [34]. In the present study, Ethylene glycol solution was used as a solvent for crude alcoholic extracts and to investigate the inhibitory activity of the crude extracts against antifungal drugs resistant A. fumigatus.
Aspergillus fumigatus biofilm associated infections are emerging as life-threatening infection with a very high mortality rate even after antimycotic therapy [36]. In spite of the extensive research dedicated to the
c 1 2
3 1
a b
Cont... Table. (1): Phytochemical analysis tests of Boswellia serrata gum alcoholic extracts

1926 Indian Journal of Public Health Research & Development, November 2019, Vol. 10, No. 11
development of new therapeutic strategies, there are only a limited number of available drugs to fight against invasive fungal infections[37]. In this study, the effect of three antifungal agents (Terbinafine, Nystatin and Clotrimazol) on A. fumigatus was illustrated in (figure 2). Statistical analysis had shown significant difference at a level of probability P (< 0.05) between antifungal drugs and A. fumigatus isolates. This result was agreed with Brinboum [38]who concluded that Terbinafine was characterized by its impact on enzymatic activity of pathogenic fungi.Mechanisms leading to Clotrimazol (azole) resistance may be decrease in azole affinity for their target, increase in azole target copy number, alteration of ergosterol biosynthetic pathway after azoles action, and decrease in intracellular azole accumulation [37]. In this study, by increasing the concentration of alcoholic extract, inhibition zone around the well was increased (Figure 3 and 4). Antifungal activity of B. serrata may be due to the active components which are present in plant gum extracts (Table 1);Sharma et al[33]
found that methanolic and ethyl acetate extract showed good antifungal activity against A. niger with a zone of inhibition 20 to 22 mm.Venkatesh et al[34]showed that the essential oil of B. serrata had fungicide activity against A.fumigatus at MIC (0.15 µg ml-1) and MFC (5 µg ml-1). Cowan[39] showed the mechanism that thought to be responsible for toxicity of plants active materials to microorganisms, he suggested that phenolic compounds mechanism includes enzyme inhibition by the oxidized compoundsthrough reaction with sulfhydryl groups or through more nonspecific interactions with the proteins and there is also evidence for direct inactivation of microorganisms: low tannin concentrations modify the morphology of germ tubes of fungi.
Conclusion
The present study demonstrated that the acetone extract of B. serrata hold an excellent potential as an antifungal agent. Further in vivo studies are necessary. More importantly there is need for detailed scientific studyto investigate other active compound in addition to essential oils of B. serrata that affects in the studied mold.
Conflict of Interest and Authorship Conformation: All authors have participated in analysis and interpretation of the data; they drafting the article or revising it critically for important intellectual content.
And finally, this manuscript has not been submitted to another journal.
Source of Funded: This research is self-funded and the authors have no affiliation with any organization with a direct or indirect financial interest in the subject matter discussed in the manuscript.
Ethical Clearance: We undertake to follow the ethical principles and institutional requirements guiding (Baqubah hospital), this research and ensure that they sign the personal declaration of responsibility prior to their isolates involvement in the research.
References
1. LaurenML. Immunoprotection Versus Immunopathogenesis associated with Aspergillus fumigatus exposure; A disserration Submitted to the graduate faculty of The University of Alabama at Birmingham, Alabama.2013.
2. Denning DW, Pleuvry A, Cole DC. Global burden of chronic pulmonary aspergillosis complicating sarcoidosis. European Respiratory Journal;2013. 41 (3): 621–6.
3. Smith N and Denning DW. Underlying conditions in chronic pulmonary aspergillosis including simple aspergilloma. European Respiratory Journal; 2011. 37 (4): 865–872.
4. RazaAMM, Nahar M, Islam MR and Ahmed Z. Pulmonary Aspergillosis: A Short Review. Journal of Scientific Achievements; 2017.2 (2): 28–30.
5. Stern C, Lucente FE. Otomycosis. Ear Nose Throat J. 1988. 67:804-10.
6. ZéliaBV P, Anna DFS, Edeltrudes L, Márcio G, Neuza MCO, Maria FPC and Felipe SQG.Otomycosis: a retrospective study. Braz J Otorhinolaryngol; 2009.75(3):367-70.
7. PfallerMA, MesserSA, MoetGJ, JonesRNand CastanheiraM.Candida bloodstream infections: comparison of species distribution and resistance to echinocandin and azole antifungal agents in Intensive Care Unit (ICU) and non-ICU settings in the SENTRY Antimicrobial Surveillance Program(2008-2009); 2011. International Journal of Antimicrobial Agents, vol. 38, no. 1, pp. 65–69.

Indian Journal of Public Health Research & Development, November 2019, Vol. 10, No. 11 1927
8. Patrick, Selene Fand Alix TC. Antifungal Resistance and New Strategies to Control Fungal Infections. Review ArticleInternational Journal of Microbiology, Volume 2012, Article ID 713687, 26 pagesdoi:10.1155/2012/713687.
9. Iram F, KhanSA and Husain A. Phytochemistry and potential therapeutic actions of Boswellic acids: A mini-review. Asian Pac J Trop Biomed; 2017. 7(6): 513–523.
10. RajputAPand PatilY.Boswellia Serrata Roxb. A Boon of Nature In The World of Medicines: A Review.ejpmr; 2015. 2(7), 384-390.
11. Gudrum UM, Panek D, Zeitler H, Vetter H and Wagner H. Drug Development from Natural Products: Exploiting Synergistic effects. Indian J. Experimental Biol; 2010; 48: 208-219.
12. SiddiquiMZ. Boswellia Serrata, A Potential Anti-inflammatory Agent: An Overview.Indian Journal of Pharmaceutical Sciences,2011. 73 (3): 255-261.
13. BertocchiM, IsaniG, MediciF, AndreaniG Usca IT, Roncada P, Forni M and Bernardini C. Anti-Inflammatory Activity of Boswellia serrata Extracts: An in vitro Study on Porcine Aortic Endothelial Cells, Oxidative Medicine and Cellular Longevity Volume 2018, Article ID 2504305, 9 pages.
14. YazdanpanahiaN, BehbahanibMand YektaeianA. Effect of Boswellia Thurifera Gum Methanol Extract on Cytotoxicity and P53 Gene Expression in Human Breast Cancer Cell Line .Iranian Journal of Pharmaceutical Research;2014. 13 (2): 719-724.
15. Al-Ogaili NAH, Mohammed, MF Al-Halbosiy, Mahmoud Zayanal Mohammed ,Zainab Al-Hawraa Mohammed and Afyaa Diyaa Rushk.In Vitro Investigation of Antibacterial and Antileishmanial Activities of Gum-Resin of Boswellia Serrata Using (0.5%) DMSO Solution as an Alternative Solvent for Extraction.World Journal of Pharmacy and Pharmaceutical Sciences;2017. Volume 6, Issue 9, 190-199.
16. PrakashB, MishraKP, KediaA, DubeyKN. Antifungal, antiaflatoxin and antioxidant potential of chemically characterized Boswellia carteriBirdw. Essential oil and its in vivo practical applicability in preservation of Piper nigrum L. fruits. LWT – Food Sci. Technol;2014. 56: 240–247.
17. Miloš ČS, Marina Z, Željko DS, Nikola DU, Milica
VL and GRBIĆJB.Succeptibility of Some Fungi to Boswellia Carteri Birdw. Essential Oil Зборник Матице српске за природне науке / Matica Srpska J. Nat. Sci. Novi Sad; 2016. No.130, 19 -27.
18. Matny ON, Abdul-Karim, EK, NaemahRA and Al-Ani RA. Activity of Propolis and Boswellia sp Resins Extract Against Sclerotinia Sclerotiorum Causative Agent of White Rot Disease of Phaseolus Vulgaris and Daucus Carota Under Storage Conditions.Journal of Experimental Biology and Agricultural Sciences; 2014. Volume – 2(1).
19. NjokuVOand ObiC. Phytochemical constituents of some selected medicinal plants. Afri J Pure Appl Chem;2009. 3(11):228–33.
20. Obasi NL, Egbuonu ACC, Ukoha PO, Ejikeme PM. Comparitive phytochemical and antimicrobial screening of some solvent extracts of Samanea sanan pods. African Journal of pure and applied chemistry, 2010; 4(9): 206-212.
21. Harbourne JB. Phytochemical methods: A guide to modern techniques of plant analysis. Ghapman and hall, London;1984 pp: 4-120.
22. Indian Herbal Pharmacopoeia. Ajoint publication of Reagional Research Laboratory, Council of Scientific and Industrial Research. Jammatawi; 1998.Vol.1, P:1-10.
23. McGinnis MR: Laboratory Handbook of Medical Mycology. New York: Academic Press, 1980.
24. Emmons CW, Binford CH, Utz, JP and Kownchung KJ. Medical Mycology. 3rd Ed. Lea and Febiger, Philadelphia;1977.
25. EllisD, DavisS, AlexiouH, HandkeRand Bartley R . Description of Medical Fungi. 2nded. The National Library of Australia Cataloguing –In Publication Entry;2007. University of Adelaide .Adelaide .Australia.
26. Forbes BE, Sahm DF and Weissfeld AS. Bailey &Scott’s Diagnostic Microbiology.12th ed. 2007. Mosby Elsevier. Texas, USA.
27. Kirk PM, Cannon PF, David JC and Stalpers JA. Ainsworth an Biby’s dictionary of the fungi. 9th edition;2008. CABI Bioscience, Oxon, UK. P. 452.
28. ColleeJG, FraserAG, MarmionBPand SimmonsA. Practical Medical Microbiology. 14th ed; 1996. Churchill Livingstone.

1928 Indian Journal of Public Health Research & Development, November 2019, Vol. 10, No. 11
29. Hasan AM.The Effect of Some Antifungals on Fungal Species that Isolated from Leukemia Patients. A thesis of master - college of Science, university of Baghdad. 2014.
30. Magaldi S, Mata-Essayag S, Hartungde CC, Perez C, Colella MT, Olaizola C and Ontiveros Y. Well diffusion for antifungal susceptibility testing,International Journal of Infectious Diseases; 2004. 8, pp: 39 – 45.
31. Upaganlawar1 Aand GhuleB . Pharmacological Activities of Boswellia serrata Roxb. - Mini Review. Ethnobotanical Leaflets;2009. 13: 766-74.
32. Abdel-Tawab M, Werz O and Schubert-Zsilavecz M.Boswellia serrata An Overall Assessment of In Vitro, Preclinical, Pharmacokinetic and Clinical Data Clin Pharmacokinet ; 2011. 50 (6): 349-369.
33. Sharma M,JainA. and Barolia SK .In-Vitro Antimicrobial Screening of Boswellia serrata. Int. J. Adv. Res; 2016, 4(8), 1594-1602.
34. VenkateshHN, SudharshanaTN, AbhishekRU, ThippeswamyS, ManjunathK and MohanaDC. Antifungal and antimycotoxigenic properties of chemically characterized essential oil of Boswellia serrata. Nternational Journal of Food Properties; 2017. Vol. 20, No. S2, S1856–S1868. https://doi.org
/10.1080/10942912.2017.1354882.
35. PadmawarARand BhadoriyaU. Glycol and Glycerin: Pivotal Role in Herbal Industry as Solvent/Co-Solvent.World Journal of Pharmaceutical and Medical Research. Wjpmr; 2018. 4(5), 153-155 SJIF Impact Factor: 4.6395.
36. KaurSand SinghS. Biofilm formation by Aspergillus fumigatus. The International Society for Human and Animal Mycology, Medical Mycology; 2014. 52, pp: 2–9.
37. VandeputteP, Ferrari S and CosteAT. Antifungal Resistance and New Strategies to control fungal infections. International Journal of Microbiology Volume 2012, Article ID 713687, 26 pages. Hindawi Publishing Corporation.
38. Brinboum LS. Workshop on perinatal. Exposure to Dioxin like compound. Environmental Health Perspective, 1995,103: 157-160.
39. Cowan MM. Plant products as antimicrobial agents. Clinical Microbiology Reviews, 1999. 12(4): 564 – 582.

Prevalence of β-lactam ResistantKlebsiellaPneumoniaeIsolates among Clinical Specimensin BaghdadHospitals
Qasim Obaid Bdaiwi 1, Amal Aziz Kareem 2, Sana’a Noori Hussein3, Ali Muhsin Ali4
1Directorate of Education in Babylon, Ministry of Education, 2Faculty of Health and Medical Sciences, Medical Technical University , 3,4Department of Biology, Collage of Science, Mustansiriyah University,
Baghdad, Iraq
Abstract
One hundred forty three of Klebsiellapneumoniae isolates had been collected from some hospitals in Baghdad city. The isolates were taken from different clinical specimens.Antimicrobial susceptibility test was carried out towards fifteen antimicrobial agents by using Vitek2 system with Antimicrobial susceptibility test cards. The results of antibiogram showed that the local isolates were possess highly resistance towards most antimicrobial agents under study. The high resistance wastoAmpicillin while the low resistance was to Imipenem.Two methods were used for detection of Extended Spectrum Beta Lactamases (ESBLs) production; first methods by using of Vitek2 system,thesecondmethods by using of polymerase chain reaction (PCR) technique to discoveryESBL encoding gene blaCTX-M-1-all gene. The results revealed the prevalence of ESβL encoding genes in local isolatesofK. pneumonia(blaCTX-M) 93.1% oftheisolates while 6.99% isolates were not harbored this gen.
Keywords: KlebsiellaPneumoniae, Resistant, β-lactam, ESβL,Cefepime,Imipenem, blaCTX-M, gene.
Introduction
Klebsiellapneumoniae is the most clinically pertinent Klebsiella species and is in charge of over 70% of human contaminations because of this genus(1). In humans, K. pneumoniafrequently colonizes the gastrointestinal tract, skin, and nasopharynx and is an imperative reason for genuine network beginning contaminations, for example, necrotizing pneumonia, pyogenic liver abscesses, and endogenous endophthalmitis(2-3).
The expanding predominanceof antibiotic obstruction and the absence of new antibiotic drug improvement has progressively decreased the treatment choices for bacterial diseases(4-5). Extended-spectrum β-lactamases (ESBLs) keep on being a noteworthy issue in clinical setups the world over,resistant microorganismare developing worldwide as a danger to good result in the treatment of basic diseases in medical clinic settings. Amongst the wide exhibit of antibiotics, β-lactamis the most broadly utilized agents. Creation of β-lactamases is the greatest common cause of resistance to β-lactam antibiotics(6-7). theproduction of β-Lactamase enzymes by the microorganisms hydrolyzedthe β-lactam ring amide bond. In latest years, there has been an growth
in the rate and prevalence of ESBL producing infectious diseases. Two hindered or more types of extended spectrum β- lactamases (ESBLs) have been establish worldwide(8). β-Lactam antibiotics are commonly used in the handling of infections caused by K. pneumonia. Medicinal isolates of this bacterium are disreputable for protecting a widespread range of β-lactamases and are obviously resistant to ampicillin and amoxicillin(9-10).
Material and Method
isolate collection
More than ( 392 ) clinical samples of K. pneumoniae isolates ware collected from some hospitals in Baghdad city from the period between October - December 2017. The isolates were taken from different clinical specimens including: sputum 12(8.39%) isolates, ear swabs 15(10.48%) isolates, burns 27(18.88%) isolates, blood 39(27.27%) isolates and urine 50(34.96%) isolates.Conventional methods (standardized biochemical methods) and Vitek2 system were used to identify the isolates.

1930 Indian Journal of Public Health Research & Development, November 2019, Vol. 10, No. 11
Antibiotic susceptibility testing
The isolates were tested for 15 antimicrobial agents (Imipenem, Levofloxacin, Tazobactam, Ciprofloxacin, Nitrofurantoin, Clavulanic acid,Tobramycin, Gentamicin, sulbactam, Cefepime, Ceftazdime, Ceftriaxone, Sulfamethaxazole, Cefazolin and Ampicillin ) by using of Vitek2 system with antimicrobial susceptibility test (AST 69) cards.Vitek2 system with the using of (AST69) cards was used for phenotypic detection of ESBLs production.
DNA extraction
Genomic DNA was extracted by (Geneaid GBB100) kit. DNA extraction was done according to the company instruction. Nanodrop framework was utilized to assess
DNA fixation and immaculateness . Extraction DNA was stored at -20 ºC for PCR assay(11).
PCR Reaction Condition
MonoplexPCR was performed with GoTaq Green Master Mix. The primer which used to detect ESβL encoding gene was blaCTX-M-1-all (table 1). PCR mixture was set up for amplification of ESβL encoding gene blaCTX-M-1-all in a total volume of 25 µl contained within 12.5µl of Go Taq Green Master Mix, 4 µl of template DNA, 1 µl of the primer (10 picomole/ µl) and7.5 µl sterile nuclease free water.DNA amplification was completed with the accompanying warm cycling (initial denaturation 95 °C for 6 min, 35 cycles of amplification : denaturation 94 °C for 40 s, annealing 57 °C for 40 s, extension 72 °C for 50 s and final extension 72 °C for 6 min)(12).
Table 1: Sequences of the primer.
Primer Sequences(5’……….. 3’) Product (bp) Reference
CTX-M-1-allF-ATGGTTAAAAAATCACTGCGR-TTACAAACCGTCGGTGACGAT
876 12
Finding and Discussion
Isolation and identification of K. pneumoniae
Out of 392 clinical samples only 143 samples were K. pneumoniaedepending on colony morphology, Gram stain, biochemical test and Vitek2 system. Isolates ware collected from some hospitals in Baghdad city from the period between October - December 2017. A recent study by Ali and Sana’a (2019) found that Out of (140) clinical samples only (70) samples were K. pneumonia isolates(13). The isolates were taken from different clinical specimens including: sputum 12(8.39%) isolates, ear swabs 15(10.48%) isolates, burns 27(18.88%) isolates, blood 39(27.27%) isolates and urine 50(34.96%) isolates (figure 1) show distribution of K. pneumoniae isolates in clinical specimens. The higher percentage was in urine while the lower percentage was in sputum.Study byIkedaet al.(14) establishmentof the 130 investigation cases, 68 and 62 cases showed the presence of K. pneumoniae in the sputum and urine, respectively(14).
Figure 1: Percentage of Klebsiellapneumoniae isolates in clinical specimens
Antibiotic susceptibility
Antimicrobial susceptibility test was carried out towards 15 antimicrobial agents using by Vitek2 system with antimicrobial susceptibility test cardsnumber 69 (AST 69). The results showed that the local K. pneumoniae isolates were possess highly resistance towards most antimicrobial agents under

Indian Journal of Public Health Research & Development, November 2019, Vol. 10, No. 11 1931
Figure 3: Gel electrophoresis (1% agarose,7v/cm2 for 60 min) for PCR products blaCTX-M-1-all gene 876 bp lane M 100 bp DNA Ladder, lanes1-26: K.pneumoniae isolates. Detection was done on agarose gel (1.5%) at 5 V/cm for 1 hour, stained with RedSafe dye and visualized on a UV transiluminator documentation system.
Conclusion
From this research, it could be concluded that the higher percentage of K. pneumoniae isolates in urine and the lower percentage was in sputum,the local isolatesofK. pneumoniae were possess a highly resistance towards most antimicrobial agents under this study, all isolates were resistance toward ampicillin while there was low resistance percentage toward imipenem.high presence of blaCTX-M gene in theisolates.
Acknowledgement: The authors would like to thank Mustansiriyah University ( www.uomustansiriyah.edu.iq) Baghdad, Iraq for its support in the present work.
Conflict of Interest: Nil
Source of Funding: Self
Ethical Clearance: All experimental protocols were approved under the Biology Department, College of Science, Mustansiriyah University, Iraq and all experiments were carried out in accordance with approved guidelines.
References
1. Pitout JD, Nordmann, P, Poirel, L. Carbapenemase-producing Klebsiellapneumoniae, a key pathogen set for global nosocomial dominance. Antimicrobial agents and chemotherapy.2015;59(10), 5873-5884.
2. Broberg CA, Palacios M, Miller VL.Klebsiella: a long way to go towards understanding this enigmatic
study. The patterns of resistance were as follows: 16.78% forImipenem, 24.47% for Levofloxacin, 26.57% forTazobactam andCiprofloxacin, 35.66% for Nitrofurantoin, 44.05% for Clavulanic acid, 58.04% for Tobramycin, 65.73% for Gentamicin, 81.11% for sulbactam, 84.61% for Cefepime,86.71% for Ceftazdime, CeftriaxoneandSulfamethaxazole, 88.11% forCefazolin, and 100% resistance for Ampicillin. All isolates were resistance toward ampicillin while the lower resistance percentage was toward imipenem as shown in figure 2.Study by Ali et al. (15) showed that the imipenem resistance was (58.97%) of K.pneumoniaeisolates,the highest resistance rate was (100%)for ampicillin, ciprofloxacin was (10.26%) and levofloxacin reached to (7.69%)(15).
Figure 2: Antibioticssusceptibility for antimicrobial agents (R=Resistance, I= Intermediate and S= Sensitive).
Detection of ESβL encoding gene by amplification of blaCTX-M gene
Monoplex PCR technique was used for the detection of theblaCTX-M gene. The quick and strict diagnosis of the antibiotic resistance gene in the treatment is very important foravoiding the spread of infections. The present study aim was detectionof existence and prevalence of common ESβLs encoding genes(blaCTX-M)amongst143 clinical isolates of K. pneumonia. The results as in (figure 3)displayed the presence of blaCTX-M gene in 133 (93.1%) oftheisolates while 10(6.99%) isolates were not harbored this gen. while a study by Alyousefet al. (16)appear among the 97 K. pneumoniae isolates, 47.4% (n = 46) isolates demonstrated ESBL creation(16). Expandingdevelopments of resistance to antibiotics due tocreation of β-lactamases. ESBL are the most across the board systems recognizable in K. pneumoniae.

1932 Indian Journal of Public Health Research & Development, November 2019, Vol. 10, No. 11
jet-setter. F1000prime reports.2014;6.
3. Nicolas-Chanoine M H, Mayer N, GuyotK, Dumont, E, and Pagès, J M. Interplay between membrane permeability and enzymatic barrier leads to antibiotic-dependent resistance in Klebsiellapneumoniae. Frontiers in microbiology.2018;9.
4. Lee CR, Lee JH, Park KS, Kim YB, Jeong BC, and Lee SH. Global dissemination of carbapenemase-producing Klebsiellapneumoniae: epidemiology, genetic context, treatment options, and detection methods. Frontiers in microbiology. 2016; 7, 895.
5. Nathan C, & Cars O.. Antibiotic resistance—problems, progress, and prospects. New England Journal of Medicine.2014; 371(19), 1761-1763.
6. Agrawal P, Ghosh A N, Kumar S, Basu B, &Kapila K. Prevalence of extended-spectrum β-lactamases among Escherichia coli and Klebsiellapneumoniae isolates in a tertiary care hospital. Indian Journal of Pathology and Microbiology. 2008; 51(1), 139.
7. Hujer A, Long W, Olsen R, Kreiswirth BN, Evans S R, Musser J, &Bonomo, R. Predicting β-Lactam Resistance Using Whole Genome Sequencing (WGS) in Klebsiellapneumoniae: The Challenge of β-Lactam Inhibitors. In Open Forum Infectious Diseases. 2018, November; 2558 (Vol. 5, No. Suppl 1, p. S70). Oxford University Press.
8. Pathak P, Jaishi N, Yadav B K, & Shah PK. Prevalence of Extended Spectrum Beta Lactamases (ESBL) and Metallo Beta Lactamases (MBL) Mediated Resistance inGram Negative Bacterial Pathogens. microbiologytribhuv. 2017; 4(1), 49.
9. Iraz M, ÖzadDüzgün A, Sandallı C, Doymaz M Z, Akkoyunlu Y, Saral A, ... &ÇopurÇiçek, A. Distribution of β-lactamase genes among carbapenem-resistant Klebsiellapneumoniae strains isolated from patients in Turkey. Annals of laboratory medicine. 2015;35(6), 595-601.
10. Ma P, Laibinis HH, Ernst C M, & Hung DT. Carbapenem resistance caused by high-level expression of OXA-663 β-lactamase in an OmpK36-deficient Klebsiellapneumoniae clinical isolate. Antimicrobial agents and chemotherapy. 2018; 62(11), e01281-18.
11. Bdaiwi QO and Hussein SN. Comparison of superantigenic toxins genes between MRSA and MSSA isolated from clinical specimens in Iraq. Pak. J. Biotechnol. 2017; 14(4) 689-695.
12. Adams-Sapper S, AnDiep B, Perdreau-Remington F and Riley LW. Clonal Composition and Community Clustering of Drug-Susceptible and -Resistant Escherichia coli Isolates from Bloodstream Infections. Antimicrobial Agents and Chemotherapy. 2013;57(1): 490–497.
13. Ali AM, & Sana’a N. Virulence factors genotyping of Klebsiellapneumoniae clinical isolates from Baghdad. Reviews in Medical Microbiology. .36-46 ,(1)30;2019
14. Ikeda M, Mizoguchi M, Oshida Y, Tatsuno K, Saito R, Okazaki M., ... & Moriya K. Clinical and microbiological characteristics and occurrence of Klebsiellapneumoniae infection in Japan. International Journal of General Medicine. 2018;11, .293
15. Ali FS, Marjani MF, &Authman SH. Type II Toxin Antitoxin System in Imipenem Resistant Klebsiella pneumonia in Baghdad, Iraq. Indian Journal of Public Health Research & Development. 2018; .1312-1318 ,(12)9
16. Alyousef AA, Khazaal SS, Ali ANM, Hussein NH, & Hussein SMA. Detection of prevalent mechanism of extended spectrum β-lactamases, metallo β-lactamases, and AmpC β lactamases-producing Klebsiellapneumoniae in the tertiary care hospital. Reviews in Medical Microbiology. 2017; 28(4), .133-139

Bond-Strength of Porcelain to Nobel and Non-Nobel Casting Alloys
Sabiha Mahdi Kanaan, BDS, MSc1, Lateef Essa Al-Jorani, BDS, MSc, PhD2
1Assistant Professor, Prosthetic Dental Technology, 2Professor, Prosthetic Dental Technology Department, College of Health and Medical Technology, Middle Technical University (MTU), Baghdad, Iraq
Abstract
Purpose: This study was designed to evaluate the bond strength of porcelain to white gold (Pd-Ag) and Nickel-Chromium (Ni-Cr) alloys. Material and Method: Rectangular-shaped specimens (25×3×0.5) mm were cast with white gold and Ni-Cr alloys and used as adherent materials. The Pd-Ag bonding surfaces were abraded with an airborne-alumina particle of 100 µm while that of Ni-Cr abraded with 250 µm. Specimens were fabricated by applying an opaquer and two dentin layer up to 1.1 mm in thickness at different cycling temperature. Bond strength for each group (n=7) was measured and compared statistically (α=0.05). Results: There were significant differences in bond strength of porcelain to Nobel and non-Nobel experimental alloys.
Conclusion: Based on the study results, it can be stated that the type of metal to ceramic alloys of different element composition may affect the porcelain bond-strength.
Keywords: Bond-strength; porcelain; nobel alloy; non-nobel alloy; white Pd-Ag; and Ni-Cr
Introduction
Metal to ceramic restoration has been widely used in the clinic since the 1950s. It provides a natural aesthetic of veneering porcelain alongside the marginal fit and the durability of metal casting alloy,(1-3).
Metal-ceramic restoration may contain Nobel and non-Nobel alloys. Nobel white gold alloy made up of gold, silver, nickel or palladium and chromium plating. The color is whitish similar to that of platinum and silver. White gold is considered to be an alternative to yellow gold, silver or platinum. It characterized by superior castability, ductility, corrosion, and malleability. Also, it provides easiness in polishing with high biocompatibility affect, (4). On the other hand, Nickel-Chromium (Ni-Cr) considered as one of the non-Nobel alloys. The major component of the Ni-Cr elements by weight is 90% of Ni-Cr (Ni: 70-80%; Cr: 12-20%), 3-6% molybdenum, 2-6% aluminum, 0.5% beryllium and 4-8% silicon and manganese,(5). Generally, the composition of the base alloy plays a major role in influencing on their properties such as surface hardness, Yield strength, and modulus of elasticity, corrosion, color, low weight, elongation and biocompatibility,(2,6-8).
In metal ceramic restoration, the demands for aesthetic restoration were increased,( 9,10). So, an application of porcelain opaque by mixing with the distilled water was used to block or mask the color of metal coping. This is to improve the natural color expression and to reduce the exposure of metal in the cervical area which aesthetically required. Also, it provides strength to marginal fit and limits the fracture in contactor areas,(11-13). Clinically, the application of ceramic restorations have been increased, and the use of tooth-similar color materials made is possible to stimulate the appearance of the fabrication of highly aesthetic restorations,(14,15).
The strong bonding between the metal coping and the veneering porcelain is one of the essential requirements of clinically successful metal-ceramic restorations,(16-17). The metal-ceramic bonding could either be chemically,(18-24), mechanically,(25-28) or due to generated forces such as Van Der Waals(,29,30) or coefficient of linear thermal expansion (CTE) between the metal and porcelain(31-35). Therefore, this study was designed to assess the bond strength of the white gold alloy to porcelain in comparison with that of many Ni-Cr alloys at different casting treatment.

1934 Indian Journal of Public Health Research & Development, November 2019, Vol. 10, No. 11
Material and Method
Material
In this study, the white gold was used as a Nobel alloy (Pd-Ag), while, the Ni-Cr of the different foundation was the non-Nobel alloy. The composition of the study alloys was detailed in table (1)
Table 1: The composition of the study alloys
White Gold Alloy(Pd-Ag)(Degussa, Germany)
Super 11 Ni-Cr(Argen dental, USA)
Bego Ni-Cr(Bego, Germany)
Kera NH Ni-Cr(Kera, Germany)
EX-3 Ni-Cr(Noritake, Japan)
Pd: 53.8% Ni: 61.2% Ni: 61.4% Ni: 58.48% Ni: 62.8%
Ag: 36.3% Cr: 25.89% Cr: 22.9% Cr: 26.85% Cr: 19.1%
Au: 0.7% Mo: 11.09% Mo: 8.8% Mo: 12.73% Mo: 7.1%
Sn: 7% Si: 1.59% Nb: 3.9% Si: 1.72% Ga: 1.9%
Ga: 2% Mn: < 1% Fe: 2.5% Others: <0.1%
Others: <0.2% Fe: >1 % Mn: 0.4%
C: >1 %, Ti: 0.1%
Al: >1%
Method
Sample preparation
A rectangular wax specimen design of (25x 3x 0.5) mm length, width, and thickness in dimension was prepared for bond-strength test,4. The wax patterns were connected to the plastic sprue cones at the middle line which in turn sealed to the plastic ring base that mounted on it to be ready to be invested.
The wax patterns were invested in using plastic rings. The vibrator was used to prevent the air bubbles to be trapped within the phosphate-bonded investment material (Rebi dental, Turkey). The investment was mixed and prepared according to manufacture instruction, then left for one hour for the final set.
After plastic ring removal, the set investment cylinder with wax patterns was placed in the furnace for wax burnout at 900°C and then left for one hour inside the furnace. According to the manufacturer instructions, the white gold and Ni-Cr metal alloys then were melted to be directed into the muffle mould entrance using casting centrifugal machine. After casting, the muffle was left to cool at room
temperature and then the investment material was removed from the metal sample specimens.
The Pd-Ag specimens were finished using the abrasive wheel and the aluminum oxide (AL2O3) airborne-particle abrasion of 100 µm particle sizes. This applied for 20 seconds at air-pressure of 3 bars. To increase the surface area and enhance the porcelain wetting on the surface, the distance was of 20 mm from the metal specimen. On the other hand, the Ni-Cr specimens were abraded using of 250 µm of AL2O3 followed by ultrasonic cleaning in distilled water for 10min.
The Oxidizing layer was created for Pd-Ag group specimens while the degassing layer was performed for Ni-Cr groups as seen in figure (1).
Application of ceramic material
The porcelain was applied in layers (Vita-Germany) after mixing with distilled water (Salsal Company, Albasra, Iraq). An opaque (Op2, Vita-Germany) and two layers of dentin material (3L 2.5, Vita-Germany) were mixed with distilled water and applied using ceramic furnace (Ivoclar, Germany), and following the timetable
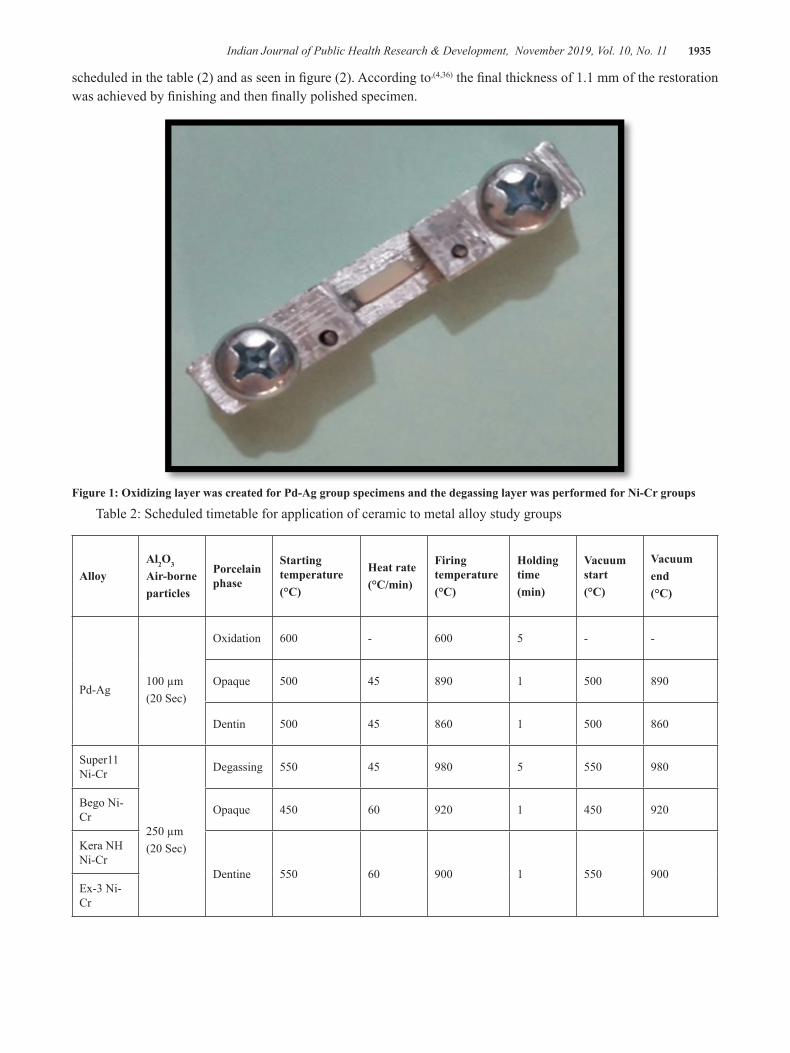
Indian Journal of Public Health Research & Development, November 2019, Vol. 10, No. 11 1935
scheduled in the table (2) and as seen in figure (2). According to,(4,36) the final thickness of 1.1 mm of the restoration was achieved by finishing and then finally polished specimen.
Figure 1: Oxidizing layer was created for Pd-Ag group specimens and the degassing layer was performed for Ni-Cr groups
Table 2: Scheduled timetable for application of ceramic to metal alloy study groups
AlloyAl2O3
Air-borneparticles
Porcelain phase
Starting temperature(°C)
Heat rate(°C/min)
Firing temperature(°C)
Holding time(min)
Vacuum start(°C)
Vacuumend(°C)
Pd-Ag100 µm(20 Sec)
Oxidation 600 - 600 5 - -
Opaque 500 45 890 1 500 890
Dentin 500 45 860 1 500 860
Super11 Ni-Cr
250 µm(20 Sec)
Degassing 550 45 980 5 550 980
Bego Ni-Cr Opaque 450 60 920 1 450 920
Kera NH Ni-Cr
Dentine 550 60 900 1 550 900Ex-3 Ni-Cr

1936 Indian Journal of Public Health Research & Development, November 2019, Vol. 10, No. 11
Figure 2: Firing of ceramic to metal alloys
Testing procedures
The specimens were tested using the computer-controlling universal testing machine (Laryee, China). According to ISO 9693 standards, the bond strength was calculated(,37,38).
Statistical Analysis
One-way analysis of variance (ANOVA) test was applied to analyze the study data using the SPSS (V-20),39. The statistical analysis revealed a significant difference among the means, and post hoc Games-Howell test was applied as seen in the table (3). Study tests were conducted at a confidence level of 95% (P<0.05).
Figure 3: The mean distribution of the bond strength test among study groups
Table 3: Levene’s test for study material
F df1 df2 Sig.
2.795 4 30 .044
Results and Discussion
In this study and as seen in the table (4) and figure (3), the bond-strength of the porcelain to the white gold alloy was statistically significant than that of the Ni-Cr alloys (P<0.01). However, statistically non-significant differences were noticed between the Ni-Cr alloys of Kera NH and that of both Bego and EX-3 (P>0.05).
0
50
100
150
200
250
White Gold Super 11 Bego Kera NH Ex-3
Nobel Alloy (Ni-Cr) Non-Nobel Alloy
Bond-Stength (MPa)
Bond-Strength of Porcelain to Metal Alloy n=7
Table 4: One way ANOVA test for study groups
(I) Groups (J) GroupsMean Difference(I-J)
Std. Error Sig.95% Confidence Interval
Lower Bound Upper Bound
White Gold Alloy
Super 11 Ni-Cr alloy 66.1429* 7.22571 .000 42.7414 89.5443
Bego Ni-Cr alloy 109.4286* 6.18809 .000 87.5884 131.2687
Kera NH Ni-Cr alloy 95.7143* 6.92575 .000 72.9687 118.4599
Ex-3 Ni-Cr alloy 88.8571* 6.43333 .000 66.8627 110.8516
Super 11 Ni-Cr Alloy
Bego Ni-Cr alloy 43.2857* 4.66861 .000 27.3968 59.1747
Kera NH Ni-Cr alloy 29.5714* 5.60976 .002 11.6388 47.5041
Ex-3 Ni-Cr alloy 22.7143* 4.98910 .007 6.3236 39.1050
Bego Ni-Cr AlloyKera NH Ni-Cr alloy -13.7143- 4.18939 .056 -27.7344- .3058
Ex-3 Ni-Cr alloy -20.5714-* 3.31252 .000 -31.2648- -9.8781-
Kera NH Ni-Cr Alloy Ex-3 Ni-Cr alloy -6.8571- 4.54382 .578 -21.5769- 7.8626

Indian Journal of Public Health Research & Development, November 2019, Vol. 10, No. 11 1937
This study was designed to identify the bond strength between porcelain to white gold and Ni-Cr alloys at different heat treatment. Study specimens were prepared by using conventional laboratory techniques, equipment’s, and materials used for construction crown and bridge. A universal testing machine was used to evaluate adhesion durability of metal bonded porcelain. The metal surface treated with porcelain to strength the bonding, this test determines the best bond strength from interface adhesion after surface treatment with porcelain to white gold and Ni-Cr alloys.
According to (29), Chemical connection is one the most important factor among the mechanisms of metal to porcelain bonding rather than the mechanical one,(29). This may influence the metal-ceramic interface by the formation of the oxide layer which in turn affected by the compassion alloy. The chemical bonding of the oxide layer could result from the ionic or covalent bond between the oxides inside the porcelain and those oxides diffused from the metal surface. This may in agreement with,(11,12) as they conducted that effect of bonding by oxides.
Economically, the replacement of gold alloy by an alternative metal-ceramic alloy is on the rise up. A noble Pd-Ag alloy may offer a high biocompatibility alongside physical properties. This could due to less damage or deformity caused by casting. Yet, insufficient studies were introduced for the clinical application of Pd-Ag alloy in the dental restoration. The bond-strength may determine the alloy potential for bonding with porcelain by their oxidation behavior,(20,23,24). According to the researchers, the nature of the metal-porcelain adherence may be indicated by the form of the oxides during the degassing cycle which in turn reflect the quality of the bond to porcelain,(20-22).
The resistance to bonding failure may be enhanced by the metal-ceramic interface of an appropriate oxide layer. The firing of porcelain may help in completely remove of the thin oxide layer. In addition, a weaker bond strength may notice as a result of low cohesive strength to thick oxide layer,(34,35).
Stable oxide layers in white gold alloy incorporating some elements such as tin may increase the bond strength of porcelain to such alloys.
According to,(16,17) the degassing of Ni-Cr alloy at a high firing temperature above 950 °C may
produce excessively thick oxide layer. Regardless the manufacturer standards, alloys may require a different oxidation process instead of the traditional degassing procedure.
In addition, the alloy surface topography may improve the bond strength as well. Metals that treated by airborne-particles could improve the energy at the surface and increase the wettability of the porcelain. However, in the present study reported that the Ni-Cr alloy that sandblasted by 250 µm Al2O3 airborne-particle decreases in bond strength than that of Pd-Ag alloy of 100 µm. This could disagree with(,25) which stated that the highest bond strength could be achieved by using large particle to abrade surfaces.
According to(,4,31) the bond strength of flat interface of metal-ceramic can only measure the forces directly imposed on this boundary. As a result, the present study was performed in accordance with the ISO 9693 standards(,37). The thickness of a metal plate and porcelain layer was clinically acceptable(,36).
Conclusions
Despite the limitation of this study, the results were concluded that the type of metal-ceramic alloys may affect the porcelain bond-strength. Ni-Cr alloy revealed a significantly decreased in bond-strength to porcelain in comparison with white gold alloy.
Conflict of Interest: No
Source of Funding : Self
Ethical Clearance: None
References
1. Roberts HW, Berzins DW, Moore BK, Charlton DG. Metal‐Ceramic Alloys in Dentistry: A Review. Journal of Prosthodontics. 18 (2); 2009:188-94.
2. Anusavice KJ, Shen C, Rawls HR. Phillips’ science of dental materials: Elsevier Health Sciences; 2013.
3. Van Noort R. Introduction to Dental Materials: Elsevier Health Sciences; 2013.
4. Hong J-T, Shin S-Y. A comparative study on the bond strength of porcelain to the millingable Pd-Ag alloy. The Journal of Advanced Prosthodontics. 6 (5); 2014: 372-8.

1938 Indian Journal of Public Health Research & Development, November 2019, Vol. 10, No. 11
5. Sakaguchi R, Powers J. Craig’s restorative dental materials. 2012.
6. Wataha JC. Biocompatibility of dental casting alloys: a review. The Journal of Prosthetic Dentistry. 83 (2); 2000: 223-34.
7. Huang HH. Effect of chemical composition on the corrosion behavior of Ni‐Cr‐Mo dental casting alloys. Journal of Biomedical Materials Research Part A. 60 (3); 2002: 458-65.
8. Ameer M, Khamis E, Al-Motlaq M. Electrochemical behaviour of recasting Ni–Cr and Co–Cr non-precious dental alloys. Corrosion science. 46 (11); 2004: 2825-36.
9. Rosenblum MA, Schulman A. A review of all-ceramic restorations. The Journal of the American Dental Association. 128 (3); 1997: 297-307.
10. Sun T, Shao L, Deng B, Wen N. Shear bond strengths between ceramic cores and veneering ceramics of dental bi-layered ceramic systems and the sensitivity to thermocycling. Ceramics-Silikáty. 56 (3); 2012: 238-44.
11. Knap FJ, Ryge G. Study of bond strength of dental porcelain fused to metal. Journal of Dental Research. 45 (4); 1966: 1047-51.
12. Anusavice KJ, Horner JA, Fairhurst CW. Adherence controlling elements in ceramic-metal systems. I. Precious alloys. Journal of Dental Research. 56 (9); 1977: 1045-52.
13. Hung SH, Hung K-S, Eick JD, Chappell RP. Marginal fit of porcelain-fused-to-metal and two types of ceramic crown. The Journal of Prosthetic Dentistry. 63 (1); 1990: 26-31.
14. Özcan M, Niedermeier W. Clinical study on the reasons for and location of failures of metal-ceramic restorations and survival of repairs. International Journal of Prosthodontics. 15(3); 2002.
15. Almilhatti HJ, Giampaolo ET, Vergani CE, Machado AL, Pavarina AC. Shear bond strength of aesthetic materials bonded to Ni–Cr alloy. Journal of Dentistry. 31(3); 2003: 205-11.
16. Barghi N, McKeehan-Whitmer M, Aranda R. Comparison of fracture strength of porcelain-veneered-to-high noble and base metal alloys. The Journal of Prosthetic Dentistry. 57 (1); 1987 :23-6.
17. Lee EH, Jeon YC, Jeong CM, Lim JS. Effect of degassing condition on ceramic bond strength of Ni-Cr alloys. The Journal of Korean Academy of Prosthodontics. 38(4); 2000: 461-71.
18. HUANG HH, LIN MC, LEE TH, YANG HW, Chen F-l, WU SC, et al. Effect of chemical composition of Ni‐Cr dental casting alloys on the bonding characterization between porcelain and metal. Journal of Oral Rehabilitation. 32 (3); 2005: 206-12.
19. dos Santos JG, Fonseca RG, Adabo GL, dos Santos Cruz CA. Shear bond strength of metal-ceramic repair systems. The Journal of Prosthetic Dentistry. 96 (3); 2006: 165-73.
20. Wu Y-l, Moser J, Jameson L, Malone W. The effect of oxidation heat treatment on porcelain bond strength in selected base metal alloys. The Journal of Prosthetic Dentistry. 66 (4); 1991: 439-44.
21. Fernandes Neto AJ, Panzeri H, Neves FD, Prado RAd, Mendonça G. Bond strength of three dental porcelains to Ni-Cr and Co-Cr-Ti alloys. Brazilian Dental Journal. 17 (1); 2006: 24-8.
22. Zarone F, Russo S, Sorrentino R. From porcelain-fused-to-metal to zirconia: clinical and experimental considerations. Dental Materials. 27(1); 2011: 83-96.
23. Malhotra ML, Maickel LB. Shear bond strength in porcelain-metal restorations. The Journal of Prosthetic Dentistry. 43 (4); 1980: 397-400.
24. Sayed NM. Shear bond strength and failure mode between veneering ceramic and metal cores after multiple firing cycles. Dental Journal. 61 (659); 2015: 666.
25. Jochen D, Caputo A, Matyas J. Effect of metal surface treatment on ceramic bond strength. The Journal of Prosthetic Dentistry. 55 (2); 1986: 186-8.
26. Reyes M, Oshida Y, Andres C, Barco T, Hovijitra S, Brown D. Titanium–porcelain system. Part III: Effects of surface modification on bond strengths. Bio-medical Materials and Engineering. 11 (2); 2001: 117-36.
27. Bieniaś J, Surowska B, Stoch A, Matraszek H, Walczak M. The influence of SiO 2 and SiO 2–TiO 2 intermediate coatings on bond strength of

Indian Journal of Public Health Research & Development, November 2019, Vol. 10, No. 11 1939
titanium and Ti6Al4V alloy to dental porcelain. Dental Materials. 25 (9); 2009: 1128-35.
28. Saito A, Komine F, Blatz MB, Matsumura H. A comparison of bond strength of layered veneering porcelains to zirconia and metal. The Journal of Prosthetic Dentistry. 104 (4); 2010: 247-57.
29. Shell JS, Nielsen JP. Study of the bond between gold alloys and porcelain. Journal of Dental Research. 41 (6); 1962: 1424-37.
30. Choi B-K, Han J-S, Yang J-H, Lee J-B, Kim S-H. Shear bond strength of veneering porcelain to zirconia and metal cores. The Journal of Advanced Prosthodontics. 1 (3); 2009: 129-35.
31. Hammad IA, Talic YF. Designs of bond strength tests for metal-ceramic complexes: review of the literature. The Journal of Prosthetic Dentistry. 75 (6); 1996: 602-8.
32. Low D, Sumii T, Swain M. Thermal expansion coefficient of titanium casting. Journal of Oral Rehabilitation. 28 (3); 2001: 239-42.
33. Lopes SC, Pagnano VO, Rollo JMDdA, Leal MB, Bezzon OL. Correlation between metal-ceramic
bond strength and coefficient of linear thermal expansion difference. Journal of Applied Oral Science. 17 (2); 2009: 122-8.
34. Mackert Jr J, Ringle R, Parry E, Evans A, Fairhurst C. The relationship between oxide adherence and porcelain-metal bonding. Journal of Dental Research. 67 (2); 1988: 474-8.
35. De Melo RM, Travassos AC, Neisser MP. Shear bond strengths of a ceramic system to alternative metal alloys. The Journal of Prosthetic Dentistry. 93 (1);2005: 64-9.
36. Barghi N, Lorenzana RE. Optimum thicknesses of opaque and body porcelain. The Journal of Prosthetic Dentistry. 48 (4); 1982: 429-31.
37. Al Hussaini I, Al Wazzan KA. Effect of surface treatment on bond strength of low-fusing porcelain to commercially pure titanium. The Journal of Prosthetic Dentistry. 94 (4); 2005: 350-6.
38. International Organization for Standardization. ISO 9693: metal-ceramic dental restorative systems. 2012.
39. Indrayan A. Medical Biostatistics: CRC Press; 2012.

Textile Wastewater Treatment by Application of Advance Oxidation (AOPs) Process and Recycling for Industrial Uses
Shyamaa A. Mohammed1, Ahmed Hassan Ali2
1Chemistry Department \ College of Science, Al Muthanna University, Samawa, Iraq, 2Chemical Engineering Department, College of Engineering, Al-Muthanna University, Samawa, Iraq
Abstract
In the present study, the treatment of industrial wastewater and recycling for industrial uses. Photocatalytic degradation of dyes like methylene Blue dye has been used as technique for treatment in a batch reactor under solar light in heterogeneous slurry utilizing various concentrations of commercial powder TiO2as photocatalysts semiconductors. Also the parameters have been studied catalyst type, catalyst concentration, pH of dye solution and dye concentration at the beginning. Therefore the results show that the best dose of TiO2 is 4.5 gm/l , and the optimum pH is 6. But the percentage removal of chemical oxygen demand (COD) of the dye solutions were for higher than that of the degradation of dye for the same conditions of catalyst.
While the water quality of treated wastewater depends on a greatextent of the quality for the industrial water supply, nature of thewastes added during use, and the degree of treatment the wastewater has received. Then wastewater quality data routinely measured andreported at the wastewater treatment plant are mostly for treatedeffluent disposal or discharge requirements in terms of gross pollution parameter.
Keywords: Advance Oxidation Process ; Industrial Wastewater Treatment ; TiO2 Semiconductor
Introduction
Photocatalytic processes to degrade organicpollutantsinwater by utilizing catalysthave been the subject of research recently. Semiconductoroxidessuchas ZnO and TiO2 have been recognized to be preferable materials for photocatalyticprocesses, dueto their high photosensitivity, non-toxicnature, lowcost and chemical stability, so thesemiconductororphotocatalysisis initiated bythesurfacetrappingofphoto-generatedelectrons(e_) and holes(h+), whichinducesinterfacialelectron-transfer reactions withadsorbedsubstrates. However, because of the wide band gap of ZnO and TiO2
(1,3). A considerable problems in treatment plants caused by dyes presents in textile industry wastewaters since those compounds are complex to degrade by biological methods. Some of the effective chemical and physical methods state a high activity of color removals such as coagulation-flocculation, advanced oxidation and electrochemical methods (4,5). All these methods have operational problems such as high sludge formation in chemical ways in addition to that more expensive(6,7). Adsorption can be considered an unattractive method for
degradation objective because of the cost of adsorbent and regeneration requirement. However, recent studies specified the possibility of using some natural or low-cost adsorbents for color removal such as wood, ash and soil(8,9).
In the present paper, the photocatalytic degradation of Methylene Bluedye in aquatic solutions using commercial powder TiO2 as aphotocatalysts has been tested and recycle wastewater has been treated for agricultural uses. The major aims of the study were compared thechange of the following parameters withrespect to the degradation efficiency.Effect of catalyst concentration ;effect of pH ; effect of initial concentration of the dye; kinetic of reaction; and COD removal
Materials and Method
Materials
In present studycommercial TiO2 powder were gained from Merck Co. (Germany Company), Methylene Blue dye was taken up from Merck (Germany Company)

Indian Journal of Public Health Research & Development, November 2019, Vol. 10, No. 11 1941
and was applied without further purification. Distilled water was used fora preparation of different solutions.HCl (0.1 N) and NaOH (0.1 N) were used for change pH of solution.
Instruments
Photochemical degradation was carried out in specially designed insulation walled reaction containers with volume 800 ml under UV-light chamber equipped with 8 UV tubes each of18W (Philips) having a wavelength of 365 nm, so the spectra were taken with UV–vis spectrophotometer (ShimadzuUV-2101 PC) and chemical oxygen demand (COD) was analyzed withCOD meter (HANA HI9146). But constant stirring of the solution was covered by using magnetic stirrers. Then the temperature was kept constant during the reaction time by spreading the water in the photocatalytic reactor vessels.
Irradiation experiments
For 500 ml of the dye solution (25 ppm), photocatalyst was added with different concentration and a suspension was anexhibit to irradiation. While experiments were carried out under UV-light. The aqueous suspension was magnetically stirred over the experiment. At different time periods,an aliquot was taken out with the help of a syringe and then filtered through Millipore syringe filter of 0.45 µm(10,11).
Absorption Measurements
The absorption spectrum was recorded using double beam UV-2101(Shmadzospectrophotometer)compared with distilled water as a reference liquid and the percentage rate of degradation was noticed in terms of change in intensity at λmax of the dyes during irradiation time(12,13). While the degradation efficiency (%) has been calculated as:
% Degradation = [Abs 0– Abs t) / Abs 0] * 100
Where:-
% Degradation is a percentage of dye disappearance.
Abs 0 is initial absorption of dye (at time = 0 min.)
Abs t is absorption of dye (at time = t min.)
Therefore the similar experiments haveused different catalyst concentration (2–5 gm/l), to select
the bestconcentration of catalyst TiO2at the same dye concentration of the solution (25 ppm).
Results and Discussion
Effect of Photocatalyst Concentration
The effect of catalystconcentration on the degradation of Methylene Blue(50 ppm) was investigated using commercialTiO2 from (2 to 5 gm\L ) keeping another parameters like pH , temperature , light intensity and dye concentrationconstant. The results in theFigure 1 showed that the degradation percentage increased with an increase in TiO2 commercial concentration up to (4.5 gm\L for TiO2). This observation can be explained in terms of availability of active sites on the catalyst surface and the permeation of solar light into the suspension. The total active surface area increases with increasing catalyst dosage. At the same time, due to an increase in the turbidity of the suspension, there is a decrease in UV-light permeation as a result of increased scattering effect and hence the photoactivated volume of suspension decreases. Furthermore, at high catalyst loading, it is difficult to maintain the suspension homogenous due to particles agglomeration, which decreases the number of active sites (14,15). Also the results also shows the maximum photodegradation for commercial TiO2 (4.5 gm/L) achieved after 150minute (see Figure 1).
Figure 1 : Effect the catalyst dose of TiO2 on degradation of Methylene Blue dye
Effect of pH on Solution Treatment
The wastewater is produced at different pH values, therefore, study of pH is very important on photodegradation of Methylene Bluedye. So experiments have been done at different values of pH varying from (4 to 12 for 20 mg/L) dye solution concentration and for the best of catalyst concentration (4.5 g/L)of TiO2. But the figure 2 shows the percentage photodegradation
4
Results and Discussion
Effect ofPhotocatalystConcentration
The effect of catalystconcentration on the degradation of Methylene Blue(50
ppm) was investigated using commercialTiO2 from (2 to 5 gm\L ) keeping another
parameters like pH , temperature , light intensity and dye concentrationconstant. The
results in theFigure 1 showed that the degradation percentage increased with an
increase in TiO2 commercial concentration up to (4.5 gm\L for TiO2). This observation
can be explained in terms of availability of active sites on the catalyst surface and the
permeation of solar light into the suspension. The total active surface area increases
with increasing catalyst dosage. At the same time, due to an increase in the turbidity of
the suspension, there is a decrease in UV-light permeation as a result of increased
scattering effect and hence the photoactivated volume of suspension decreases.
Furthermore, at high catalyst loading, it is difficult to maintain the suspension
homogenous due to particles agglomeration, which decreases the number of active
sites (14,15). Also the results also shows the maximum photodegradation for commercial
TiO2 (4.5 gm/L) achieved after 150minute (see Figure 1).
Figure 1 : Effect the catalyst dose of TiO2 on degradation of Methylene Blue dye
0
10
20
30
40
50
60
70
80
90
100
0 20 40 60 80 100 120
% D
gred
atio
n
Time (min)
2 g/l
3 g/l
4 g/l
4.5g/l
5 g/l
4.5 g/l
2 g/l
3 g/l
5 g/l
4 g/l
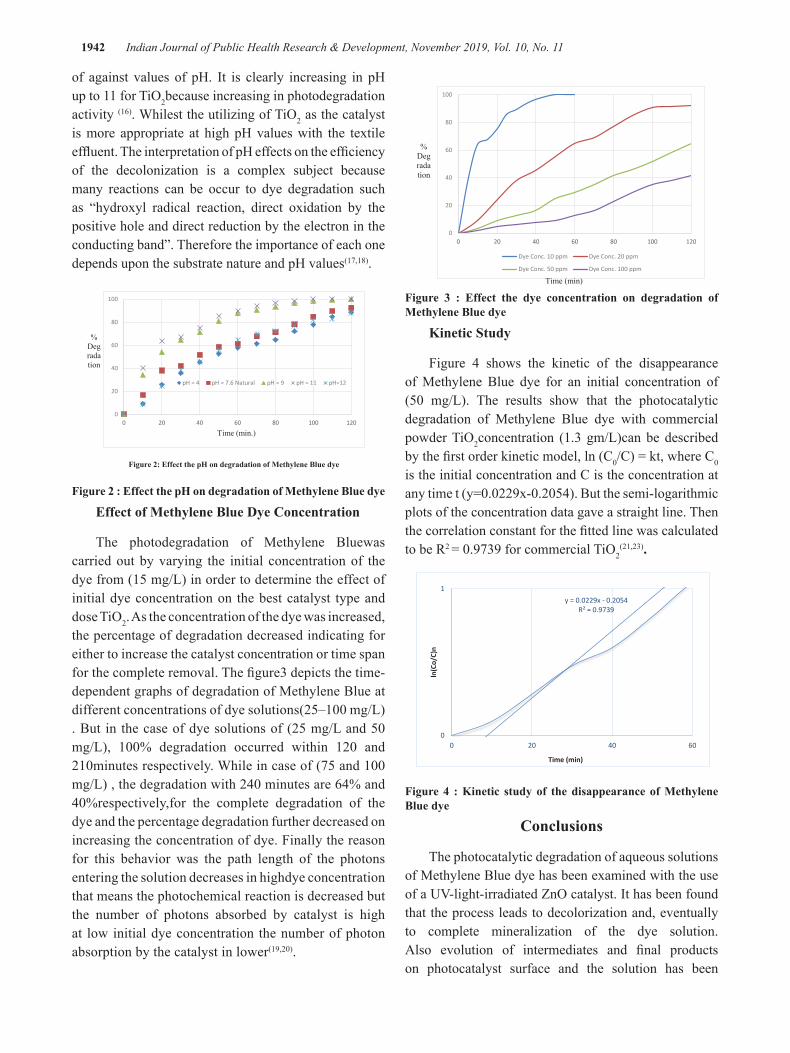
1942 Indian Journal of Public Health Research & Development, November 2019, Vol. 10, No. 11
of against values of pH. It is clearly increasing in pH up to 11 for TiO2because increasing in photodegradation activity (16). Whilest the utilizing of TiO2 as the catalyst is more appropriate at high pH values with the textile effluent. The interpretation of pH effects on the efficiency of the decolonization is a complex subject because many reactions can be occur to dye degradation such as “hydroxyl radical reaction, direct oxidation by the positive hole and direct reduction by the electron in the conducting band”. Therefore the importance of each one depends upon the substrate nature and pH values(17,18).
Figure 2 : Effect the pH on degradation of Methylene Blue dye
Effect of Methylene Blue Dye Concentration
The photodegradation of Methylene Bluewas carried out by varying the initial concentration of the dye from (15 mg/L) in order to determine the effect of initial dye concentration on the best catalyst type and dose TiO2. As the concentration of the dye was increased, the percentage of degradation decreased indicating for either to increase the catalyst concentration or time span for the complete removal. The figure3 depicts the time-dependent graphs of degradation of Methylene Blue at different concentrations of dye solutions(25–100 mg/L) . But in the case of dye solutions of (25 mg/L and 50 mg/L), 100% degradation occurred within 120 and 210minutes respectively. While in case of (75 and 100 mg/L) , the degradation with 240 minutes are 64% and 40%respectively,for the complete degradation of the dye and the percentage degradation further decreased on increasing the concentration of dye. Finally the reason for this behavior was the path length of the photons entering the solution decreases in highdye concentration that means the photochemical reaction is decreased but the number of photons absorbed by catalyst is high at low initial dye concentration the number of photon absorption by the catalyst in lower(19,20).
Figure 3 : Effect the dye concentration on degradation of Methylene Blue dye
Kinetic Study
Figure 4 shows the kinetic of the disappearance of Methylene Blue dye for an initial concentration of (50 mg/L). The results show that the photocatalytic degradation of Methylene Blue dye with commercial powder TiO2concentration (1.3 gm/L)can be described by the first order kinetic model, ln (C0/C) = kt, where C0 is the initial concentration and C is the concentration at any time t (y=0.0229x-0.2054). But the semi-logarithmic plots of the concentration data gave a straight line. Then the correlation constant for the fitted line was calculated to be R2 = 0.9739 for commercial TiO2
(21,23).
Figure 4 : Kinetic study of the disappearance of Methylene Blue dye
Conclusions
The photocatalytic degradation of aqueous solutions of Methylene Blue dye has been examined with the use of a UV-light-irradiated ZnO catalyst. It has been found that the process leads to decolorization and, eventually to complete mineralization of the dye solution. Also evolution of intermediates and final products on photocatalyst surface and the solution has been
5
Effect of pH on Solution Treatment
The wastewater is produced at different pH values, therefore, study of pH is
very important on photodegradation of Methylene Bluedye. So experiments have been
done at different values of pH varying from (4 to 12 for 20 mg/L) dye solution
concentration and for the best of catalyst concentration (4.5 g/L)of TiO2. But the figure
2 shows the percentage photodegradation of against values of pH. It is clearly
increasing in pH up to 11 for TiO2because increasing in photodegradation activity (16).
Whilest the utilizing of TiO2 as the catalyst is more appropriate at high pH values with
the textile effluent. The interpretation of pH effects on the efficiency of the
decolonization is a complex subject because many reactions can be occur to dye
degradation such as “hydroxyl radical reaction, direct oxidation by the positive hole
and direct reduction by the electron in the conducting band”. Therefore the importance
of each one depends upon the substrate nature and pH values(17,18).
Figure 2: Effect the pH on degradation of Methylene Blue dye
Effect of Methylene Blue Dye Concentration
The photodegradation of Methylene Bluewas carried out by varying the initial
concentration of the dye from (15 mg/L) in order to determine the effect of initial dye
concentration on the best catalyst type and dose TiO2. As the concentration of the dye
was increased, the percentage of degradation decreased indicating for either to
increase the catalyst concentration or time span for the complete removal. The
0
20
40
60
80
100
0 20 40 60 80 100 120
pH = 4 pH = 7.6 Natural pH = 9 pH = 11 pH=12
Time (min.)
% Degradation
6
figure3 depicts the time-dependent graphs of degradation of Methylene Blue at
different concentrations of dye solutions(25–100 mg/L) . But in the case of dye
solutions of (25 mg/L and 50 mg/L), 100% degradation occurred within 120 and
210minutes respectively. While in case of (75 and 100 mg/L) , the degradation with
240 minutes are 64% and 40%respectively,for the complete degradation of the dye
and the percentage degradation further decreased on increasing the concentration of
dye. Finally the reason for this behavior was the path length of the photons entering
the solution decreases in highdye concentration that means the photochemical
reaction is decreased but the number of photons absorbed by catalyst is high at low
initial dye concentration the number of photon absorption by the catalyst in
lower(19,20).
Figure 3 : Effect the dye concentration on degradation of Methylene Blue dye
Kinetic Study
Figure 4 shows the kinetic of the disappearance of Methylene Blue dye for an
initial concentration of (50 mg/L). The results show that the photocatalytic degradation
of Methylene Blue dye with commercial powder TiO2concentration (1.3 gm/L)can be
described by the first order kinetic model, ln (C0/C) = kt, where C0 is the initial
0
20
40
60
80
100
0 20 40 60 80 100 120
Dye Conc. 10 ppm Dye Conc. 20 ppm
Dye Conc. 50 ppm Dye Conc. 100 ppm
% Degradation
Time (min)
7
concentration and C is the concentration at any time t (y=0.0229x-0.2054). But the
semi-logarithmic plots of the concentration data gave a straight line. Then the
correlation constant for the fitted line was calculated to be R2 = 0.9739 for commercial
TiO2(21,23).
Figure 4 : Kinetic study of the disappearance of Methylene Blue dye
Conclusions
The photocatalytic degradation of aqueous solutions of Methylene Blue dye has
been examined with the use of a UV-light-irradiated ZnO catalyst. It has been found
that the process leads to decolorization and, eventually to complete mineralization of
the dye solution. Also evolution of intermediates and final products on photocatalyst
surface and the solution has been monitored with a variety of techniques, which enable
the identification of the reaction pathway, from adsorption of the dye molecule on the
photocatalyst surface, to the formation of final products.Finally the photocatalytic
degradation followed pseudo-first order kinetics.
Recommendation: We can develop this subject to covered agriculture uses or irrigation
y = 0.0229x - 0.2054R² = 0.9739
0
1
0 20 40 60
ln(C
o/C)
n
Time (min)

Indian Journal of Public Health Research & Development, November 2019, Vol. 10, No. 11 1943
monitored with a variety of techniques, which enable the identification of the reaction pathway, from adsorption of the dye molecule on the photocatalyst surface, to the formation of final products.Finally the photocatalytic degradation followed pseudo-first order kinetics.
Recommendation: We can develop this subject to covered agriculture uses or irrigation
Conflict of Interest: Non
Source of Funding : Self
Ethical Clearances: Nil
References
(1) Boukhatem H , Khalaf H. ,DjouadiL.Photocatalytic activity of mont-La(6%)-Cu0.6Cd0.4S catalyst for phenol degradation under nearUV visible light irradiation. ApplCatal B Environ. 2017;(211)(114–125).
(2) ThomasB. and AlexanderL.Enhanced synergetic effect of Cr(VI) ion removal and anionicdye degradation with superparamagnetic cobalt ferritemeso–macroporousnanospheres. Applied Nanoscience; 2018. (8)(125–135).
(3) Seo H.O. Influence of humidity on the photo-catalytic degradationof acetaldehyde over TiO2surface under UV light irradiation.Catal Today.2017.295)(102–109).
(4) Stylidi M. ,KondaridesD. and Verykios X. Pathways of solar light-induced photocatalytic degradation of azo dyes in aqueous TiO2suspentions, Appl. Catal. B: Environ.; 2003. (40) (271–286).
(5) Sakthivel S. ,NeppolianB. ,Shankar M. ,Arabindoo B. , PalanichamyM.,Murugesan V. Solar photocatalytic degradation of azo dye comparison of photocatalytic efficiency of ZnO and TiO2. Sol. Energy Mater. Sol. C. ;2003.(77) (65-82).
(6) Ahmed H. A. ,Naser G. F.andAlkaim A. F. Treatment of Textile Industries Wastewater by Advance Oxidation Process. J. Eng Appl. Sci. ; 2018. (13)(1042-1045).
(7) Ahmed H. A. Preparation and Characterization of Nanoparticles TiO2 and Its Application for Methylene Blue Dye Degradation under Solar Light. J. of Glob. Pharma Techno.; 2017. (9)(141-148).
(8) Ahmed H. A ,Naser G. F. and Mohammed S. A. Photocatalytic Degradation of Methyl Orange Dye using Different Photocatalysts under Solar Light. Internat. J. ChemTech Res.; 2017. (9)(10-15).
(9) Hussein A. and Scholz M. Dye wastewater treatment by vertical-flow constructed wetlands. Ecol. Eng. 2017. (101)(28-38).
(10) Hussein A. and Scholz M. Treatment of artificial wastewater containing two azo textile dyes by vertical-flow constructed wetlands. Environ. Sci. and Poll. Res. 2017.;(1)(1-20).
(11) Ahmed H. A., Seema K., Sushil K. K. Studies on the photo catalytic decolonization ofpararosanilne chloride dye and its simulated dye batheffluent. Desalination and Water Treatment. ; 2011. (25)(268–275).
(12) Sushil K.K. ,Ahmed H. A. , Seema K., Detlef W. B. Synthesis of flower likezinc oxide nanostructure and its application as a photocatalyst. Separation and Purification Technology ; 2011. (80)(125–130).
(13) Sushil K.K., Ahmed H. A. , Seema K. ,Detlef W. B. Preparation,Characterization and Photo catalytic Activity of Nanosized ZnO for the Degradation of Rhoda mine B Dye andSimulated Dye bath Effluent. Science of AdvancedMaterials. , 2013. (5)(1–7).
(14) Ahmed S. ,Alaa M.; Nada M. A., OsmanT. A. , Khattab A. Photocatalytic degradation of organic dyes using compositenanofibers under UV irradiation. Applied Nanoscience ; 2018. (8) (155–161).
(15) Zhu C. , Wang L. ,Kong L. ,Yang X.,Wang L.,Zheng S. , ChenF.,Maizhi F.,Zong H. Photocatalytic degradation of azo dyes by supported TiO2 and UV in aqueous solution. Chemosphere ; 2000. (41) (303–309).
(16) KansalS.S , Ahmed H. A. , Seema K. Photocatalytic decolorization of biebrich scarlet dye in aqueous phase using different nanophotocatalysts. Desalination; 2010. (259) (147–155).
(17) Konstantinou I.K. ,Albanis T.A.TiO2-assisted photocatalytic degradation of azo dyes in aqueous solution: kinetic and mechanistic investigation, Appl. Catal. B: Environ.; 2004. (49) (1–14).
(18) Lizama C. , Freer J. ,Baeza J. ;Mansilla H, D.

1944 Indian Journal of Public Health Research & Development, November 2019, Vol. 10, No. 11
Optimized photodegradation of reactive blue 19 on TiO2 and TiO2 suspensions, Catal. Today .2002. (76)(235–246).
(19) Rabindranathan S.Suja, S. Yesodhara A.Photocatalytic degradation of phosphamidon on semiconductor oxides, J. Hazard. Mater. B.;2003.(102)(217–229).
(20) ChanA , Porter J.F. ,BarfordB. and Chan C. K. Effect of thermal treatment on the photocatalytic activity of TiO2 coatings for photocatalytic oxidation of benzoic acid, J. Mater. Res. 2002;(17) (1758–1765).
(21) Chakrabarti S. ,Dutta B. Photocatalytic degradation of model textile dyes in wastewater using TiO2 as semiconductor catalyst, J. Hazard. Mater. ;2004.(112) (269–278).
(22) Wang H. ,Xie C. , Zhang W. ,Cai S, ,Cai Z. , Yang Z , GuiY. Comparison of dye degradation efficiency using TiO2 powders with various size scales, J. Hazard. Mater.2007.(141) (645–652).
(23) Davis R. J. ,Gainer J.L. ,Neal G. O. , Wu I. W. Photocatalytic decolorization of wastewater dyes, Water Environ. Res.1994.(66) (50-56).

Spa gene Typing among Staphylococcus Aureus Isolates in Microbiology Laboratories of Scientific Research Center
Suaad S. Mukhlif*1, Mohammed Taha2, ZainabT.Hussein3, Maha M. Taen4
1,Ministry of Science & Technology/ Environment & Water Directorate
Abstract
This study aimed to S.aureus typing using gene encoding protein A (spa gene typing) in some clinical and environmental samples collected from microbiology laboratories at scientific research center
A total of 50 different environmental and clinical samples were collected from laboratories of ministry of science & technology (25 samples from environmental surfaces (benches, tables, sink,), 10 samples from mobile and 15 clinical samples. during the period from March / 2018 to May / 2018.
Biochemical and morphological characterization tests showed that thirty five isolates were identified as Staphylococcus aureus of it 20 isolates from environmental surfaces, 5 isolates from mobiles, 10 isolates from researcher’s hands.
Antibiotic susceptibility tests of all isolates towards eight antibiotics were carried out and results showed that many isolates (25 %) were multi-resistant, DNA was extracted by wizard DNA extraction kit and it was amplified by specific primer of polymorphic X region of spa, which were determined by Ridom Staph Type software.
spa typing was carried out on all positive isolates. A total of 14 spa types was detected from 35 S. aureus isolates. t008 was the most common spa type (8; 29.6%), followed by t346 (4; 14.8%), t189 (2; 7.4%), t688 (2; 7.4%), t002 (2; 7.4%). All other spa types were less than 1% of S. aureus isolates.
The most common types of spa in our region were t008 (8; 29.6%), which indicate prevalence of community acquired S.aureus(CA-S.aureus) followed by t346 (4; 14.8%) from 27 spa types which were identified in this study.
In conclusion, we have shown that the laboratory environment could be a reservoir contributing to dissemination of virulent S. aureus, and The proposed surveillance protocol successfully allowed the detection of S.aureus contaminating important high-touch surfaces in a representative microbiology Lab. Frequently contaminated surfaces must be targeted for routine cleaning and disinfection.
Key words : spa gene,Staphylococcus aureus, PCR .
Introduction
Staphylococcus aureus is the most common cause of human bacterial infections, it is a major global public health problem causing serious, often life threatening infections in the community and hospital setting that are becoming more difficult to manage with current antibiotics therapy regimens (1), Staphylococcus aureus is a commensal organism that colonizes nasal mucosa in 25-30% of the healthy human population (2), so it
considered an opportunistic pathogenic bacterium due to its ability to take advantage of damaged cutaneous layers (3).
The pathology of a S. aureus infection is often dependent on which toxins are expressed and the virulence factors with which they are associated. It can cause infections ranging from mild skin irritation or a simple rash to severe illness including Toxic Shock Syndrome, abscesses, bone infections, and sepsis (4) .

1946 Indian Journal of Public Health Research & Development, November 2019, Vol. 10, No. 11
The primary cause of lower respiratory tract and surgical site infections and is the second leading cause of bacteremia, pneumonia, and cardiovascular infections.
The severity of infection is often dependent on which toxin genes are present, and the virulence factors associated with them(5).
S. aureus encodes many virulence factors including the surface Ig-binding protein A (spa) whose function is to capture IgG molecules in the inverted orientation and therefore prevent phagocytosis of the bacterial cells by the host immune system(6). Genotypes known as “spa-types”, based on highly variable Xr region sequences of the spa-gene, are frequently used to classify strains.
The purpose of this study was to examine the prevalence of spa gene of S. aureus in microbiology laboratories environment
Materials and Method
Sample Collection
Five microbiological laboratories were selected in ministry of science and technology, each sampling was selected based upon the most common areas touched by hands of staff working in the Lab, 25 samples from environmental surfaces (benches, tables, sink,), 10 samples from mobile and 15 clinical samples. during the period from(March / 2018 to May / 2018)were coded.
Samples Processing
Samples were collected using sterilized Swiffer pads as previously described. was it placed into a Whirl PackTMbag (Nasco, Fort Atkinson, WI), sealed, and added 50 ml peptone water ,then mixing well , after that was added 50 ml Baird Parker broth ( 2 times concentrations ) with tellurite enrichment in 250 ml sterile screw cap jar and incubated for 18-24 hr at 37C. after incubation was inoculated onto Baird Parker agar and manitol salt agar and incubated 24-48 hr at 37C and examined for bacterial growth. Presumptive S.aureus(black colonies with clear halos on BPA) and then confirmed bydoing Gramstain, catalase test, coagulase test. Swabs were inoculated onto Baird Parker agar and manitol salt agar.
Antimicrobial Susceptibility Testing (AST)
S. aureus isolates were tested for susceptibility to benzylpenicillin, tetracycline, erythromycin,
ciprofloxacin, trimethoprim-sulfamethoxazole, gentamicin, vancomycin, and nitrofurantoin using the Kirby-Bauer disk diffusion method on Mueller Hinton agar in accordance with the Clinical Laboratory Standards Institute standards and previously described methods(7).
Molecular Analysis
All isolates positive for S.aureus were selected for molecular testing.16SrRNA gene and nuc gene for the confirmation isolates, PCRwas carried out in a total volume of 25 µL(8). For spa gene mixture to achieve 50 m LPCR products were run on a 1.5% agarose gel using electrophoresis, stained with gel red at 70 volts for 60 min and visualised under UV light using a gel documentation system .
Primers name Sequences for (16SrRNA ) Product size(bp)
16SrRNA-R 5`-AGA CCC GGG AAC GTA TTC AC -3`
~80016SrRNA-F 5`- GTG CCA GCA GCC
GCG GTA A -3`
Primers name Sequences for ( nuc ) gene Product
size(bp)
Primer -R 5′-GCGATTGATGGTGATAC-GGTT-3′
270
Primer -F 5 ′ - A G C C A A G C C T T G A C -GAACTAAAGC-3
Determination of spa type was performed using published methods and primers . Based-Upon Repeat Pattern (BURP) analysis to identify spa cluster complexes (spaCC) was conducted using the RidomStaphType software using default parameters (version 2.2.1; Ridom, GmbH, Wurzburg, Germany).
The sequences of used primer are as follow:
Primers name Sequences for ( spa ) Product
size(bp)
spa-1113f 5’-ATC TGG TGG GGT AAC AACTG-3’
1100spa-1514r 5’-CGC TGC ACC TAA CGC
TAA TG-3’
Findings and Discussion
A total of 50 environmental and clinical samples

Indian Journal of Public Health Research & Development, November 2019, Vol. 10, No. 11 1947
were collected from Five microbiological laboratories were selected in ministry of science and technology, The overall prevalence of S. aureus was 80% ( 20/25) for environmental samples, 50% ( 5/10) for mobile samples, 66.6% ( 10/15) for clinical samples respectively.
The most common places that were contaminated were areas touched showing up at 80% of total samples. This included bench,Sink, keyboards at the Laboratory. As environmental contamination increases, the prevalence of researcher hands carriage also increases (9). This fact clarifies why these areas were the most contaminated(10). The determinants that may have played a role in the areas that were most contaminated are hand hygiene among researcher (11), frequency of these areas being used, level of contamination among surfaces, and the amount of time and interaction that happens with environmental laboratory by researcher working in these areas(12).
There is a limited understanding of the dynamics and determinants of spread in this setting (13)with little research done in microbiology laboratory environments. Dynamics of S.aureus in hospitals have been sought, but the laboratory environment is still poorly understood(14).
Antibiotic susceptibility tests of all isolates towards eight antibiotics were carried out and results showed that many isolates (25 %) were multi-resistant. Overall (n=35), 94.2% ( 33/35 ) of isolates were resistant to penicillin, 65.7 % (23/35) were resistant to erythromycin, 60% ( 21/35) of isolates were resistant to meth prim, 48.5 % (17/35) were resistant to clindamycin , 40% ( 14/35 ) of isolates were resistant to tetracycline, 34.2% (12/35) of isolates were resistant to gentamicin, 22.8% (8/35) of isolates were resistant to chloramphenicol, 5.71% (2/35) of isolates were resistant to vancomycin. and 34.2.4% (12/35) were Multi-Drug Resistance (MDR) .
Figure-1- resistant isolates
Molecular characterization
Molecular characterization of all isolates were conducted by amplification of spa typing. The spa genewasamplifiedbyPCR forconfirmed S . a u r e u s isolates . The control showed only one band of spa gene of 1100 bp ( figure-4-)
14 spa types was detected from 35 S. aureus isolates. t008 was the most common spa type (8; 29.6%), followed by t346 (4; 14.8%), t189 (2; 7.4%), t688 (2; 7.4%), t002 (2; 7.4%). All other spa types were less than
1% of S. aureus isolates.
The most common types of spa in our region were t008 (8; 29.6%), which indicate prevalence of community acquired S.aureus (CA-S.aureus) followed by t346 (4; 14.8%) from 27 spa types which were identified in this study. (CA-S.aureus) appears to be more virulent than (HA-S.aureus). the clinical infections associated with it include severe skin and soft tissue infections and necrotizing pneumonia.

1948 Indian Journal of Public Health Research & Development, November 2019, Vol. 10, No. 11
The concept of biosafety in laboratory practice is one that is of most important; and as such it must be given top priority at all times, and There is the need for biosafety to be placed in the first stage of issues in laboratory practice in over respective facilities (15)There must be a continuous concerted effort on the part of
laboratories to ensure that their testing procedures are safe and in line with international best practices both for the safety of staff and patients and also to safeguard the immediate environment from potentially hazardous pathogens(16), The absence of appropriate biosafety policies and practices is one of the challenges facing researcher in laboratory
Table-1- spa gene typing
Spa typing item No.of isolates % of isolates with valid values
t008 8 29.6%t346 4 14.8%t189 2 7.4%t688 2 7.4%t002 2 7.4%t045 1 2.8%t065 1 2.8%t067 1 2.8%t1149 1 2.8%t1578 1 2.8%t024 1 2.8%t216 1 2.8%t209 1 2.8%t091 1 2.8%t012 1 2.8%t030 1 2.8%t037 1 2.8%t160 1 2.8%t021 1 2.8%t258 1 2.8%t330 1 2.8%t660 1 2.8%

Indian Journal of Public Health Research & Development, November 2019, Vol. 10, No. 11 1949
Figure – 3 - Agarose (1.5%) gel electrophoresis image of the nuc gene (270 bp). Lane M is a 50- bp DNA ladder, lanes 1 to 10 are test samples, lane 11 is a positive control and lane 12 is a negative control.
Figure – 4- Three percent agarose gel electrophoresis analysis of PCR amplificationproductsof spa gene of 1100bp, extracted from S. aureus PCR products for spa gene for positive MRSA samples. Lane L: DNA molecular size marker (100 bp ladder),
Recommendation and Conclusion
1- Rapid and accurate determination of the different spa gene prevalence of Staphylococcus aureus isolated microbiological laboratories are a great help in understanding the epidemiology of this bacteria in workplace area.
2- detection of bacterial contamination source in microbiology laboratories of all scientific research center using molecular typing.
3- comparison between microbiology and chemical Laboratory related bacterial contamination.
Conflict of Interest : None.
Source of Funding: Self funding .
Ethical Clearance: Scientific research projects of Ministry of Science of Technology.
References
1. Brea D, Duval AM, Sarah WS, William MS. Altered Growth, Pigmentation, and Antimicrobial Susceptibility Properties of Staphylococcus aureus Due to Loss of the Major Cold Shock Gene cspBAntimicrob. Agents Chemother. .2010;54:2283-2290.
2. MahmutovicVS, Puskar M. Staphylococcus aureus carriage among medical students. Med GlasLjekkomoreZenicko-dobojkantona. 2012;9(2):325–329.
3. Licitra G. Etymologia: Staphylococcus. Emerg

1950 Indian Journal of Public Health Research & Development, November 2019, Vol. 10, No. 11
Infect Dis. 2013;19(9). doi:10.3201/eid1909.ET1909.
4. Abdalrahman L, Fakhr M. Incidence, antimicrobial susceptibility, and toxin genes possession screening of Staphylococcus aureus in retail chicken livers and gizzards. Foods. 2015;4(2):115-129. doi:10.3390/foods4020115.
5. Kuehnert MJ, Kruszon‐Moran D, Hill HA, et al. Prevalence of Staphylococcus aureus nasal colonization in the United States, 2001–2002. J Infect Dis. 2006;193(2):172-179. doi:10.1086/499632.
6. Fournier B, Philpott DJ. Recognition of Staphylococcus aureus by the innate immune system. ClinMicrobiol Rev. 2005;18(3):521–540.
7. CLSI. Clinical Laboratory Standards Institute performance standards for antimicrobial susceptibility testing; eighteenth informational supplement. document M100-S22E. Wayne, PA: Clinical Laboratory Standards Institute; 2012.
8. Brakstad, OG, Aasbakk K , Maeland, JA., ‘Detection of Staphylococcus aureus by polymerase chain reaction amplification of the nuc gene’. Journal of Clinical Microbiology.1992;30, 1654–1660.
9. Dettenkofer M, Ammon A, Astagneau P, Dancer SJ, Gastmeier P, Harbarth S, Humphreys H, Kern WV, Lyytikäinen O, Sax H, Voss A, Widmer AF. Infection control-a European research perspective for the next decade. J Hosp Infect. 2011; 77:7–10.
10. Lee BY, Bartsch SM, Wong KF, Singh A, Avery TR, Kim DS, et al. The importance of nursing homes in
the spread of methicillin-resistant Staphylococcus aureus (MRSA) among hospitals. Med Care. 2013;51:205–15.
11. Batina1 NG, Crnich CJ, Anderson DJ, Döpfer D.Identifying conditions for elimination and epidemic potential of methicillin-resistant Staphylococcus aureus in nursing homes. Antimicrobial Resistance and Infection Control.2016;5:32.
12. Cimolai N. MRSA and the environment: implications for comprehensive control measures. Eur J ClinMicrobiol Infect Dis. 2008 ;27(7):481-93. doi: 10.1007/s10096-008-0471-0.
13. Huang H, Flynn NM, King JH, Monchaud C, Morita M, Cohen SH. Comparisons of community-associated methicillin-resistant Staphylococcus aureus (MRSA) and hospital-associated MSRA infections in Sacramento, California. J ClinMicrobiol. 2006;44:2423–7.
14. Tattevin P, Diep BA, Jula M, Perdreau-Remington F. Methicillin-resistant Staphylococcus aureus USA300 clone in long-term care facility. Emerg Infect Dis. 2009;15:953–5.
15. Nasim S, Shahid A, Mustafa MA, Arain GM, Ali G, et al. Biosafety perspectives of Clinical Laboratory workers: A profile of Pakistan. J of Infection in Developing Countries.2012; 6: 611-619.
16. EAB Emmert . Biosafety guidelines for handling micro-organism in the teaching Laboratory: Development and Rationale. J of Microbiology Education 2003;14:1-5.

Nutritional Knowledge and Practices amongpregnant Women attending Primary Health Care Center in Baghdad City
Suhair M. Hassoon1, Muna A. Zeidan2
1Assist. Prof. (M.Sc), Collage of Health and Medical Technology/ Baghdad, Middle Technical University, Baghdad, Iraq
Abstract
Objective: To estimate the grade of knowledge and practice of nutrition among women of pregnancy. Method:-A cross-sectional study carried out in at al- Kadmayha& Bab-almoadham primary health care. The sample was selected by (non probability convenient sampling) and sample size was (100). Data was collected done by interview to take out demographic information. Results:- The result display that the multitude of cases were (45%) through age group (20-29) years. As for education (3%) were illiterate As for occupation (61%) were workers and about (39%) housewife. and this research explore that (67%) of gravid female had kindly knowing and about (56%) of gravid women had good practice on feeding pending pregnancy. Conclusions: This project displays the factors that found significant combination with nutrition knowledge.Consist of standard of awareness and nourishment acquaintance through conception and significant convenient relevance between the age group and nutrition habit during pregnancy.
Key words: knowledge, practice, factors, nutrition, pregnancy, Baghdad
Introduction
Nutrition during preconception as long as throughout pregnancy has a central influence on the impactof pregnancy [1]. Balanced and adequate maternal assimilation of macro nutrition and micronutrients guaranty not only the health situation of the pregnant mum, the luxury of the foetus and the newborn but future soundness status of herself (safeguard of life) and her three descent (protection of progeny) [2, 3] .Besides, pauper and extravagant alimentation of gravid women may leading to maternal harm and death[4, 5]. Nutritional imponderables causes fail of the embryo to extent its full development prospect recognized as embryonic growth limitation, which is combined with child together little and long duration complications, mortality and mortality[6, 7].
On the inversion women who are suffering from malnutrition previous and throughout pregnancy are probable to experiment inverse pregnancy consequence. Before pregnancy the woman needs nutrients for growth and maintenance of her body. Good nutrition keeps her healthy. During pregnancy additional requirement for all nutrients occurs to enable the fetus to grow normally in
the uterus [8].
Healthy eating behavior in pregnancy support to inhibit pregnancy complications, aids reform from childbirth, efficiently tolerate breastfeeding and also prevents the manifestation of diseases in maturity [9, 10]. The incidence of dietary supplement impairment as an outcome of dietary attitude and modality in pregnancy is major than during pregnancy than at any other juncture of the life period, It was shown that, nutrition knowing was oracular of alteration in dietary habits and health exhortation motivate expecting women to amelioration their food assimilation [11].
It was usually reasonable that the fetus was feed adequately at the expenditure of maternal storage and needs; however, it is becoming clear that this may not always be the case, and that fetal expansion can be less than optimal if certain nutrients are not obtainable during intrauterine life [12]. Therefore the advancement of female validity and other preventive health auspices practice should onset before birth, during intrauterine life and expand by means of various phases of their lives in order to incur their general as well as their reproductive health [13].

1952 Indian Journal of Public Health Research & Development, November 2019, Vol. 10, No. 11
Method
Design of the Study:A cross sectional study design (convenient sampling) for pregnant women was conducted starting from (1st September 2018 to 1st of March 2019).
Setting of the Study: The study is conducted atal-Kadmayha& Bab-almoadham PHC centers.
The sample of the study: A convenient sampling, purposive sample of 100 female.The fact was collected by direct interview using special questionnaire to acquired socio-demographic information. (Age, education, occupation………..ect
Scales and scoring:
The items have rated and scored accord to the following patterns:
1. Knowledge scale: three points likert scales are applied for rating the knowing of study sample items as score of three for (correct answer), 2 for (don’t know) and score 1 for (false answer).
2. Practice scales: three points are used for rating items as score of three for (always), 2 for (sometimes) and score one for (never).
3. Determination of a grades of the samples knowledge was Divide into three faces (poor, fair , and good)
4.
• Poor knowledge score : 1-1.66 (<55%)
• Fair knowledge score : 1-67-2.33 (56-78%)
• Good knowledge score :2.34-3 (>78%).
• Determination of a grades of the samples practice was be included three grades (poor, fair , and good):-
• Poor practice e score : 1-1.66 (<55%)
• Fair practice score : 1-67-2.33 (56-78%)
• Good practice score :2.34-3 (>78%).
Data analysis by SPSS version 18, x2 test was appliedfor significance of p value of <0.05 was considered significant.
Findings
Table 1:- Distribution of sample according to age, education level occupation, Receiving information and exporter of input and nutritional habits.
Variables No 100. %Age <20 17 17.0
20-29 45 45.030-39 38 38.0
Education level
Illiterate 3 3.0Read and write 4 4.0Primary 15 15.0Intermediate 11 11.0Secondary 18 18.0College and above 49 49.0
Occupation workers 61 61.0housewife 39 39.0
Receiving information
Yes 94 94.0no 6 6.0
Sources of information
Health staff 47 47.0Pregnant women 11 11.0Friends 15 15.0Family and relative 14 14.0Media 13 13.0Total 100 100.0
*Nutritional habits
Using salt to cook meal 22 22
Eat fresh fruit 25 25Taking dark tea 11 11Snack food 10 10Drinking milk 55 55Eating milk product 56 56
Eating meat 44 44Iron supply 77 77Folic acid supply 78 78
*nutritional habit collect answer range from all pregnant women
Table (1) shows that of the (100) pregnant women there were (45%) in age group (20-29) years. As for education (3%) were illiterate while (49%) had higher education. As for occupation (61%) were workers and about (39%) housewife . Receiving information on nutrition about (94%) were yes, as for Sources of
3
Setting of the Study: The study is conducted atal-Kadmayha& Bab-almoadham PHC centers. The sample of the study: A convenient sampling, purposive sample of 100 female.The fact was collected by direct interview using special questionnaire to acquired socio-demographic information. (Age, education, occupation………..ect
Scales and scoring: The items have rated
and scored accord to the following patterns: 1- Knowledge scale: three points likert scales are applied for rating the knowing
of study sample items as score of three for (correct answer), 2 for (don’t know) and score 1 for (false answer).
2- Practice scales: three points are used for rating items as score of three for (always), 2 for (sometimes) and score one for (never).
3- Determination of a grades of the samples knowledge was Divide into three faces (poor, fair , and good)
4-
Poor knowledge score : 1-1.66 (<55%) Fair knowledge score : 1-67-2.33 (56-78%) Good knowledge score :2.34-3 (>78%). 5- Determination of a grades of the samples practice was be included three grades (poor, fair ,
and good):- Poor practice e score : 1-1.66 (<55%) Fair practice score : 1-67-2.33 (56-78%) Good practice score :2.34-3 (>78%).
Data analysis by SPSS version 18, x2 test was appliedfor significance of p value of <0.05 was considered significant.
Findings:
Table 1:- Distribution of sample according to age, education level occupation, Receiving information and exporter of input and nutritional habits.
Variables No 100. %
Max-Min 3-1 Range of score=----------------- = ------------- = 0.66
Rating 3

Indian Journal of Public Health Research & Development, November 2019, Vol. 10, No. 11 1953
information (47%) were health staff, ( 78%) folic acid supply (10%) was drinking dark tea.
Table 2:- summary of nutritional knowledge and practice score
Knowledge score Frequency percent
good 67 67.0
poor 33 33.0
Total 100 100.0
Practice score Frequency percent
good 56 56.0
poor 44 44.0
Total 100 100.0
Table (2) shows that (67%) of pregnant female have good knowledge regarding appropriate nutrition according pregnancy. While (56%) of pregnant women have good practice regarding appropriate nutrition during pregnancy..
Table(3): relation between Knowing Level and age of pregnant women, education and occupation
Variables KNOWLEDGE SCORE
good poor Total
No % No % No % p-value
Age <20 10 14.9 7 21.2 17 17.0
0.11620-29 35 52.2 10 30.3 45 45.0
30-39 22 32.8 16 48.5 38 38.0
Total 67 100.0 33 100.0 100 100.0
Education Illiterate 1 1.5 2 6.1 3 3.0
0.0016
Read and write 3 4.5 1 3.0 4 4.0
Primary 9 13.4 6 18.2 15 15.0
intermediate 9 13.4 2 6.1 11 11.0
Secondary 12 17.9 6 18.2 18 18.0
college 33 49.3 16 48.5 49 49.0
Occupation workers 41 61.2 20 60.6 61 61.00.955
Housewife’s 26 38.8 13 39.4 39 39.0

1954 Indian Journal of Public Health Research & Development, November 2019, Vol. 10, No. 11
Table (3) shows that good knowledge of pregnant women who were 20-29 years old is greater than those who were lower than 20 years and more than 29 years old. There. As for education that poor knowing of pregnant women whose education was illiteracy, There was statistically significant relationship between them with p-value <0.00. As for occupation shows that good knowledge who were workers was greater than those who were their housewife’s.
Table(4): Relation between Knowledge Level and Receiving information
Variables KNO WLEGE SCOR
good poor Total
No % No % No %
Receiving information
Yes 66 98.5 28 84.8 94 94.0
0.007No 1 1.5 5 15.2 6 6.0
Sources of information
Health staff 32 47.8 15 45.5 47 47.0
0.745
Pregnant women 7 10.4 4 12.1 11 11.0
friends 10 14.9 5 15.2 15 15.0
Family and relative 11 16.4 3 9.1 14 14.0
media 7 10.4 6 18.2 13 13.0
Table (4) presentation that gravid women whose receiving information on nutrition had good knowledge about (98.5%).High statistically significant relevance between them with p-value <0.00.As for sources of information that good knowledge of gravid women who were health staff.
Table (5): Relationship between practice Level and age of pregnant women, education and occupation
PRACTICE SCORE
good poor Total
No % No % No % p.v
Age
<20 8 14.3 9 20.5 17 17.0
0.06320-29 31 55.4 14 31.8 45 45.0
30-39 17 30.4 21 47.7 38 38.0
Total 56 100 44 100 100 100.0
Education level
illiterate 3 5.4 0 .0 3 3.0
0.021
Read and write 2 3.6 2 4.5 4 4.0
Primary 8 14.3 7 15.9 15 15.0
Intermediate 6 10.7 5 11.4 11 11.0
Secondary 9 16.1 9 20.5 18 18.0
college 28 50.0 21 47.7 49 49.0
Occupation Workers 37 66.1 24 54.5 61 61.0
0.241Housewife’s 19 33.9 20 45.5 39 39.0

Indian Journal of Public Health Research & Development, November 2019, Vol. 10, No. 11 1955
Table (5) shows that good practice of pregnant women who were 20-29 years old is great than those who were less than 20 years and more than 29 years old. As for education that good practice of pregnant women whose education was higher, As for occupation shows that good practice who were workers was higher than those who were their housewife’s.
Table(6): Relations ofpractice Level
PRACTICE SCORE
good poor Total
No % No % No % p.v
Receiving information
yes 54 96.4 40 90.9 94 94.00249
no 2 3.6 4 9.1 6 6.0
Sources of information
Health staff 29 51.8 18 40.9 47 47.0
0.383
Pregnant women 6 10.7 5 11.4 11 11.0
friends 5 8.9 10 22.7 15 15.0
family 9 16.1 5 11.4 14 14.0
media 7 12.5 6 13.6 13 13.0
Table (6) display that pregnant women whose receiving information on nutrition had good practice about (96.4%).As for sources of information that good practice of pregnant female who were health staff.
Discussion
The period of pregnancy is remarkable by enormous physiological variation that demands healthy dietary lifestyle option in arrangement to enhance the physical and psychological development of the unborn child [4]. The nutritional state of pregnant woman remains critical in determining healthy pregnancy outcomes. In this study, most of the pregnant women belongs to the age 20-29 years the finding of the current study is agreement with findings reported in Ethiopia [ 14], and in Nigeria [ 15], this may be because the extreme ages of reproductive years are well know about nutrition during pregnancy.
And almost about (49%) of them were collage education the finding of the attend study is agreement with findings reported in Nigeria [ 15],found a highest knowledge score were obtained by women of higher education. Health staff in this study was the source of information for 47% of the pregnant women. The outcome of this research was more than the study proceed in Gambia [ 16], that showed the provenance of acquaintance for the study participants were 35%
being informed on nutrition and feed by their antenatal nutrition care providers .
Although the outcome of this research was additional than the study conducted in Gambia much effort was consequence needed to get better nutrition teaching to adequately supply the necessary information which is crucial to prevent the Intergenerational effect of malnutrition. The result of this study also present that the ratio of mothers who have appropriate knowledge on maternal nutrition during pregnancy was found to be 67%.
As a consequence of this study is similar with the study proceed in Ethiopia [ 14 ], in which great than semi of the women in the study had the basic and essential knowledge concerning prominence of nutrition during pregnancy . This result also similar the study completed in Malaysia[ 17], 65.7 % and Swaziland [ 18], 67% of mothers had compatible knowledge across maternal nutrition .
Whereas the finding of this research is more than the study finished in Ethiopia[ 19], 52.5% of mums had

1956 Indian Journal of Public Health Research & Development, November 2019, Vol. 10, No. 11
compatible knowledge related maternal nutrition . A this discrepancy might be regarding to socioeconomic factors and cultural difference of the study participants. The peak level of nutrition knowledge demonstrated in our study maybe due to high educational level of the participants .
The finding of this study was also reveal that the proportion of gravid women with good pregnancy specific nutrition practice was set up to be 56%. Similarly the study conducted in Swaziland [18], reported that 51% pregnant women had good practice regarding nourishment during gravid . On the other hand a higher proportion of gravid women with good nutrition workout were notify from another study conducted in Malaysia 74% and Pakistan 65.5% [17, 20].
The potential reasons for these variation might be regarding to the diversity in socioeconomic status, cultural believes, access to nutrition and health services among the study participants. This study shows the age was not important predictor of knowledge of graved female in the research area. The results of the discuss are not comparable with the results from Ghana [21], where women aged 25 to 35 years had the elevated ratio of dietary knowledge, compared with those younger than 25 and older .The probable reason for observed discrepancy may be the difference in socio-cultural of the two-study population with respect to food and exposure to nutrition information during pregnancy.
Educational level, Nutrition information has been specified during pregnancy and the importance of women’s knowledge of nutria during pregnancy among the study is similar to the one in Malaysia [ 22], demonstrated that women with preferable nutritional knowledge are significantly higher in educational level, nutritional formation .
The finding of the research stated that individuals with a higher educational standard had best nutrition knowledge in study may be explained by more access to internet, books and magazines as source of information in work area [22]. This study shows that there was statistically significant company between dietary practices of mothers and age the finding of the present discuss is disagreement with findings reported in Ethiopia [23],found that age had no combination with dietary practices of mothers. This could be explained by different in time and place of the study.
Conclusions
The finding of the study fixed that (67%) of pregnant women had good knowledge on nutrition during pregnancy. The results of the study particular that (56%) of pregnant women had good practice on nurture during pregnancy.
There was a correlation between you and a statistical indication between the level of education, information and nutrition there was significant positive relation between the age and nutrition practice during pregnancy.
Source of Funding: Self funding.
Ethical Clearance: Non
Conflict of Interest : None.
References
1. World Bank: Repositioning Nutrition as central to development: A strategy for large scale action, The International Bank for Reconstruction and Development, World Bank, Washington DC, USA, 2006.
2. David JPB, Kent LT. The obstetric origins of health for a lifetime. Clinical obstetrics and gynecology 2013; 56(3):511-519.
3. Gemeda D, Fekadu B, Wondu G, et al. Assessment of Knowledge of Pregnant Mothers on Maternal Nutrition and Associated Factors in GutoGidaWoreda, East Wollega Zone, Ethiopia. Journal of Nutrition & Food Sciences 2013; 2(3):105-113.
4. Anna L. Maternal and child nutrition in SubSaharan Africa: challenges and interventions. Proceedings of the Nutrition Society 2008; 67 (1):105-108 .
5. Leontine W, Karin AMK, Annabelle C, et al. Aboriginal teenage pregnancies compared with non aboriginal in south Australia 1995– 1999. Australian and New Zealand Journal of Obstetrics and Gynaecology 2002; 42(2):187192.
6. Gemeda D, Fekadu B, Wondu G, et al. Assessment of Nutritional Practices of Pregnant Mothers on Maternal Nutrition and Associated Factors in GutoGidaWoreda, East Wollega Zone, Ethiopia. Science. Technology and Arts Research Journal 2013; 2(3):105-113.
Indian Journal of Public Health Research & Development, November 2019, Vol. 10, No. 11 1957
7. Gary M. Normal fetal growth and development. In: Obstetrics by Ten Teachers. London: Arnold, 2011:38.
8. L MKW. Aboriginal teenage pregnancies compared with non-aboriginal in South Australia. JObstet Gynecol. 2003; 42(2) 187-92.
9. Arkkola, T., Uusitalo, U., Kronberg-Kippilä, C., Männistö, S., Virtanen, M., Kenward, M.G. & et al. Seven distinct dietary patterns identified among pregnant Finnish women: associations with nutrient intake and sociodemographic factors. Public Health Nutrition, 2008;11(2), 176-182.
10. Hoffmann J.F., Nunes M.A.A., Schmidt M.I., Olinto, M.T.A., Melere, C., Ozcariz, S.G.I., Buss, C. et al. Dietary patterns during pregnancy and the association with sociodemographic characteristics among women attending general practices in southern Brazil: the ECCAGe Study. Cadernos de Saude Public, 2013; 29(5), 970-980.
11. O’Brien G, Davies M . Nutrition knowledge and body mass index. Health Educ Res. 2007; 22: 571-575.
12. Daba G, Beyene F, Fekadu H, Garoma W: Assessment of Knowledge of Pregnant Mothers on Maternal Nutrition and Associated Factors in GutoGidaWoreda, East Wollega Zone, Ethiopia. J Nutr Food Sci.2013;3: 235.
13. Latifa MF, Manal HA, Nihal SS: Nutritional Awareness of Women during Pregnancy. J American Sci 8, 2012.
14. AshenafiZelalem, MulualemEndeshaw, MamaruAyenew, Solomon Shiferaw and RobelYirgu. Effect of Nutrition Education on Pregnancy Specific Nutrition Knowledge and Healthy Dietary Practice among Pregnant Women in Addis Abab. Clinics Mother Child Health, an open access journal, 2017; Volume 14 • Issue 3 • 1000265.
15. Anyasor Chiamaka Ogechi, Olowu Olayinka Hamdalat. Factors Influencing the Nutritional Practice of Pregnant Women Living in a Semi-Urban Region of Ogun State, Nigeria.AnyasorChiamakaOgechi et al.; Saudi J. Med.; Vol-2, Iss-5(Aug-Sep, 2017):114-120.
16. Gambia FF. Evaluation of the mobile health care service in West Kiang district. World Health Stat Q. 1995; 48: 18-22.
17. Zahara A, Nuruljannah J, yee ML, sim YN, Chua K, et al. (2014) Nutritional Status and Nutritional Knowledge of Malay Pregnant Women in Selected Private Hospitals in Klang Valley. Malaysian J Health Sci 12: 53-62.
18. Sakhile K, ShuJ.Nutritional Knowledge, Attitude, and Practices among Pregnant and Lactating Women Living with HIV in the Manzini Region of Swaziland. J Health PopulNutr.2014; 32: 261-269.
19. Daba G, Beyene F, Fekadu H, GaromaW . Assessment of Knowledge of Pregnant Mothers on Maternal Nutrition and Associated Factors in GutoGidaWoreda, East Wollega Zone, Ethiopia. J Nutr Food Sci. 2013; 3: 235.
20. Shahid M, Muhammad F, Atif S, Azhar M, Naira B, et al. Assessment of Nutritional Beliefs and Practices in Pregnant and Lactating Mothers in an Urban and Rural Area of Pakistan.1997; J Pak Med Assoc 47: 60-62.
21. Alice K, Christina A, Richard A.Detary Practices and Nutrient Intakes of Pregnant Women in Accra, Ghana. Current Research Journal Biological Sciences .2012;4: 358-365.
22. Mitra M, Wan A, Manan W, Affizal A, Mohd S (2012) Dietary Knowledge and Behaviors in a Sample of Malay Pregnant Women; UMT 11th International Annual Symposium on Sustainability Science and Management 09th –11th July 2012, Terengganu, Malaysia.
Levels of Calcitonin and Procalcitonin in Different Types of Thyroid Cancer in Kirkuk City-Iraq
Maad Mohammed Sulaiman1, Khalid Nafi Salih2, Noor Falah Raheef3, Muhannad Abdullah Alazzawy4
1,2M.B.Ch.B.-FIB.M.S. K, Kirkuk General Hospital, Kirkuk health directorate, Kirkuk, 3M.B.Ch.B.-M.Sc. Biochemistry, Kirkuk health directorate, Kirkuk, 4Ph.D. Medical Microbiology, Medical Lab Consultant,
Children Hospital, Kirkuk health directorate, Kirkuk. Iraq
Abstract
Thyroid cancer is the most common endocrine malignancy, accounting for 1.9% of all new malignant tumors. Thyroid cancer begins in the follicular cell of the thyroid gland. The aim of the study was to estimate the level of procalcitonin and thyroid tests in patients with different types of thyroid cancer. The number of thyroid cancer women under study were 40 women whose ages were between 25-75 years old were included in this cross-sectional study which carried out in Kirkuk city from the period of September 2016 to March 2017. These patients admitted to Kirkuk oncology center. The control group who were matched to the thyroid cancer patients studied, included 30 heathy individuals (blood donors). Blood was collected from patients and control for estimation of serum total TSH, T3, T4, FT3, FT4, and procalcitonin using immunefluorescent technique. The study showed that that the highest rate of increased PCT level was recorded among thyroid cancer patients comparing with the control group (25% v.s. 10%), the highest mean level of PCT was noticed among medullary thyroid cancer (8.22 ± 3.16 ng/ml) comparing with follicular and papillary thyroid cancer. The highest mean levels of TSH, T3 and T4 were noted among thyroid cancer patients (16.3± 4.22, 2.01 ± 0.55 and 144.1 ± 45.6) respectively comparing with the control group which showed the least means of TSH, T3 and T4 and with highly significant difference between the two groups. The study showed that the lowest mean of TSH was noted among MTC patients (0.88±0.61) comparing with FTC and PTC patients and the high means of FT3 and FT4 were noted among MTC patients (5.89±0.31and 19.25±2.48) respectively. Table 5 demonstrates that the lowest mean levels of FT3 noted among thyroid cancer patients comparing with the controls (2.99±10.91 v.s. 15.91±0.43). It was concluded that there was a highly significant relation procalcitonin and thyroid cancer specially medullary type.
Keyword: Thyroid cancer, MTC, Procalcitonin, Thyroid.
Introduction
Thyroid cancer is the most common endocrine malignancy, accounting for 1.9% of all new malignant tumors. Thyroid cancer begins in the follicular cell of the thyroid gland (1). There are 2 types of cells located within the thyroid parenchyma: the follicular cells and the supporting cells (also called the C cells) (2). Cancers derived from follicular cells are generally differentiated thyroid carcinomas (DTC). Although these cancers are not usually aggressive, they can eventually mutate into more aggressive variants. They have been traditionally classified as well differentiated thyroid carcinoma, including papillary thyroid carcinoma (80%) and follicular thyroid carcinoma (PTC and FTC,
respectively) (10-15%)(3). Medullary thyroid carcinoma (MTC) accounts for up to 5% of thyroid cancers, four in five cases occur as a sporadic and the remaining 20% are part of familial disorders (4). The detection of MTC still represents a challenge and not infrequently MTC is only diagnosed histologically after surgery done for nodular goiter. This is due to several reasons(1). In particular, several technical pitfalls can affect the measurement of serum calcitonin (CT) which represents the main presurgical and postoperative serum marker of MTC; no fixed CT thresholds to diagnose and exclude MTC are available and non-specific increase of CT in several non-thyroidal conditions may exist; MTC with undetectable CT is rarely reported (5). Thus, further markers are

Indian Journal of Public Health Research & Development, November 2019, Vol. 10, No. 11 1959
advocated to better manage MTC cases before and after their initial treatment. Traditionally, MTC patients are treated by thyroidectomy and central (with or without lateral) neck-dissection, and after surgery CT is the pivotal tumor marker(7,8). However, several limits affect CT accuracy. High CT might be observed in C-cell hyperplasia, non-thyroidal neoplasia (neuroendocrine tumors, leukemias, systemic mastocytosis, small cell lung, breast and pancreatic cancer) renal failure, endocrine disfunctions (9). The aim of the study was to estimate the level of procalcitonin and thyroid tests in patients with different types of thyroid cancer
Material and Method
The number of thyroid cancer women under study were 40 women whose ages were between 25-75 years old were included in this cross-sectional study which carried out in Kirkuk city from the period of September 2016 to March 2017. These patients admitted to Kirkuk oncology center. The control group who were matched to the thyroid cancer patients studied, included 30 heathy individuals (blood donors). 5 ml of blood was collected and placed in plane tubes, left for 30 minutes at 37 °C for clotting and centrifuged at 3000 rpm for 15
minutes, the obtained sera was aspirated using automatic micropipette and transferred to Eppendorf tubes and stored in deep freeze at -20°C for for estimation of serum total TSH, T3, T4, FT3, FT4, and procalcitonin using immunoflurescent technique (Minividas Immunofluorescent, France).
2.2. Statistical analysis:Computerized statistically analysis was performed using Mintab ver 18.0 statistic program. Comparison was carried out using Chi-square (X2) for dtermination of The P. value.
Findings
Table 1 showed that the highest rate of increased PCT level was recorded among thyroid cancer patients comparing with the control group (25% v.s. 10%) with highly significant difference between the two groups regarding PCT level. In relation of PCT level with the type of thyroid cancer the study showed that the highest mean level of PCT was noticed among medullary thyroid cancer (8.22 ± 3.16 ng/ml) comparing with follicular and papillary thyroid cancer with significant differences among them(Table 2).
Table 1: Relation of PCT level with thyroid cancer patients and the control group.
Procalcitonin (PCT)*( ng/ml)
Thyroid cancer Control
No. % No. %
increased 10 25 3 10
Normal 30 75 25 90
Total 40 100 30 100
P. value: 0.031
Table 2: Differences of PCT levels among types of thyroid cancer
PCTng/ml
Thyroid cancer (n:52)
Follicular (n:5) Medullary (n:5) Papillary (n:30)
Mean 0.49 8.22 0.93
S.D 0.12 3.16 0.45
P. value: 0.008

1960 Indian Journal of Public Health Research & Development, November 2019, Vol. 10, No. 11
In Table 3, the highest mean levels of TSH, T3 and T4 were noted among thyroid cancer patients (16.3± 4.22, 2.01 ± 0.55 and 144.1 ± 45.6) respectively comparing with the control group which showed the least means of TSH, T3 and T4 and with highly significant difference
between the two groups. The study showed that the lowest mean of TSH was noted among MTC patients (0.88±0.61) comparing with FTC and PTC patients and the high means of FT3 and FT4 were noted among MTC patients (5.89±0.31and 19.25±2.48) respectively, Table 4.
Table 3: Relation of thyroid hormones mean levels with thyroid cancer and the control group.
Parameters Thyroid cancer (n:40)Control(n:30)
P. value
TSHµU/ml
Mean 16.3 1.220.009
S.D 4.22 0.81
T3pg/mL
Mean 2.01 2.4770.035
S.D 0.55 0.41
T4Mean 144.1 108.4
0.09S.D 45.6 33.9
Table 4: Relation of thyroid hormones with cancer type
Parameters(mean ± SD)
Thyroid cancer (n:40)
P. value
Follicular (n:5) Medullary (n:5) Papillary (n:20)
TSH 13.5±6.9 0.88±0.61 18.3±8.2 0.74
T3 2.1±0.8 2.88±0.81 3.88±0.91 0.941
T4 83.5±6.1 144±12.1 128.3±51.7 0.48
FT3 3.44±1.55 5.89±0.31 2.91±1.22 0.37
FT4 7.22±3.18 20.6±2.34 113.2±4.9 0.22
Table 5 demonstrates that the lowest mean levels of FT3 noted among thyroid cancer patients comparing with the controls (2.99±10.91 v.s. 15.91±0.43) with highly significant relation, while FT4 was slightly decreased in thyroid cancer patients comparing with the controls (1.83±6.99 v.s. 2.61) with no significant difference between the two groups regarding FT4 levels.

Indian Journal of Public Health Research & Development, November 2019, Vol. 10, No. 11 1961
Table 5: Relation of FT3 and FT4 mean levels with thyroid cancer and the control group.
Parameters Thyroid cancer (n:40)Control(n:30)
P. value
FT3Mean 2.99 15.91
0.0002S.D 0.91 0.43
FT4Mean 13.83 16.33
0.26S.D 6.99 2.61
Discussion
Procalcitonin is determined by several analytical tests with different immunore active isoforms and fragments which leads to poor comparability of results (7,8). In addition, even if PCT stimulation may improve its reliability, there is high variability of results from different articles in different populations. For all these reasons, the management of MTC in clinical practice may hide some pitfalls. In example, some MTC patients show a persistent biochemical disease (7,8). The studies of D’herbomez et al (10) emphasize the need of PCT assessment every time the results of CT measurement are unclear. The authors noted the interference between CT and PCT detection in the case of the use of a sensitive immunometric assay. Abilities of procalcitonin and calcitonin to distinguish MTC from other conditions, revealed comparable utility (11). In previous studies better performance of PCT in comparison with CT have been recorded. Specifically, when the same antibodies were used, all of the commercial PCT assays yielded similar results(12). One study noticed that the evaluation of PCT as a marker for the initial preoperative detection of MTC(13). Kaczka et al (14) showed that PCT levels were higher in all active MTC patients mean PCT 3.5 ng/ml with active carcinoma which was markedly elevated levels and significantly higher than in the control group.
Antonelli et al (15) demonstrated that TSH, and other thyroid hormones levels were decreased among thyroid cancer patients specially in MTC type. This study supports that serum TSH concentration at presentation is an independent predictor of thyroid malignancy. We demonstrated that the risk of malignancy increased in parallel with serum TSH concentration at presentation which is in agreement with previously published data by Boelaert et al (16) Although our study included fewer patients when compared with Boelaert et al (1500 patients). Fiore et al (17) reported in their study that the serum TSH was significantly higher in PTC than in
patients with benign nodular thyroid disease, whereas serum concentrations of both free T3 and free T4 were not significantly different, this observation is relevant on clinical grounds to define the risk of PTC in patients with nodular thyroid disease. In this regard, Rago et al (18) evaluated possible clinical and biochemical criteria useful to predict the likelihood of thyroid malignancy in patients with thyroid nodules. It stands to reason that if the levels of TSH are elevated in patients with thyroid cancer, it is possible that elevated levels of thyroxine (T4) and triiodothyronine (T3) may also be correlated with malignancy as well. Cho et al has shown that free T4 (fT4) is elevated in patients with thyroid cancer (odd’s ratio (OR) of 1.73) (19). However, the inverse has been shown to be true for total T3 (TT3) by Jonklaas et al(20). Rinaldi et al (21) who non-significantly found high fT3 to be indicative of cancer risk. Given that this study has not found any evidence in support of either group, it is possible that it was not sufficiently powered to find such a correlation, or that no relationship exists between the two.
Conclusions
There was a highly significant relation procalcitonin and thyroid cancer specially medullary type.
Conflict of Interest: Non
Source of Findings: Self findings.
Ethical Clearance: This research was carried out with the patient’s verbal and analytical approval before the sample was taken. According to this approval, all the samples were collected and the tests were carried out. A copy of the results of the tests was then given to the patients
References
1. Bae YJ, Schaab M, Kratzsch J. Calcitonin as biomarker for the medullary thyroid carcinoma.

1962 Indian Journal of Public Health Research & Development, November 2019, Vol. 10, No. 11
InMedullary Thyroid Carcinoma 2015 (pp. 117-137). Springer, Cham.
2. Woliński K, Kaznowski J, Klimowicz A, Maciejewski A, Łapińska-Cwojdzińska D, Gurgul E, Car AD, Fichna M, Gut P, Gryczyńska M, Ruchała M. Diagnostic value of selected biochemical markers in the detection of recurrence of medullary thyroid cancer—comparison of calcitonin, procalcitonin, chromogranin A, and carcinoembryonic antigen. Endokrynologia Polska. 2017;68(4):434-7.
3. Wells SA, Jr, Asa SL, Dralle H, Elisei R, Evans DB, Gagel RF, et al. Revised American Thyroid Association guidelines for the management of medullary thyroid carcinoma. Thyroid. 2015;25:567–610.
4. Trimboli P, Treglia G, Guidobaldi L, Romanelli F, Nigri G, Valabrega S, et al. Detection rate of FNA cytology in medullary thyroid carcinoma: a meta-analysis. Clin Endocrinol (Oxf) 2015;82:280–285.
5. Pusztaszeri MP, Bongiovanni M, Faquin WC. Update on the cytologic and molecular features of medullary thyroid carcinoma. Adv Anat Pathol. 2014;21:26–35.
6. Trimboli P, Giovanella L, Crescenzi A, Romanelli F, Valabrega S, Spriano G, et al. Medullary thyroid cancer diagnosis: an appraisal. Head Neck. 2014;36:1216–1223.
7. Trimboli P, Giovanella L. Serum calcitonin negative medullary thyroid carcinoma: a systematic review of the literature. Clin Chem Lab Med. 2015;53:1507–1514.
8. Trimboli P, Seregni E, Treglia G, Alevizaki M, Giovanella L. Procalcitonin for detecting medullary thyroid carcinoma: a systematic review. Endocr Relat Cancer. 2015;22:R157–R164.
9. Liberati A, Altman DG, Tetzlaff J, Mulrow C, Gotzsche PC, Ioannidis JP, et al. The PRISMA statement for reporting systematic reviews and meta-analyses of studies that evaluate health care interventions: explanation and elaboration. PLoS Med. 2009;6:e1000100.
10. Trimboli P, Lauretta R, Barnabei A, Valabrega S, Romanelli F, Giovanella L, et al. Procalcitonin as a postoperative marker in the follow-up of patients affected by medullary thyroid carcinoma. Int J Biol Markers. 2018;33:156–160.
11. Bae YJ. Calcitonin as biomarker for the medullary thyroid carcinoma./ Bae, Y.J., Schaab, M. Kratzsch, J.// 2015 Springer, Cham – 2015- 177(12)- P 117-137.
12. Trimboli P, Seregni E, Treglia G, Alevizaki M, Giovanella L. Procalcitonin for detecting medullary thyroid carcinoma: a systematic review. Endocr Relat Cancer. 2015 Jun 1;22(3):R157-64.
14. Vita R, Ieni A, Tuccari G, Benvenga S. The increasing prevalence of chronic lymphocytic thyroiditis in papillary microcarcinoma. Reviews in Endocrine and Metabolic Disorders. 2018 Dec 15;19(4):301-9.
15. Antonelli A, Ferri C, Ferrari SM, Di Domenicantonio A, Giuggioli D, Galleri D, Miccoli P, Fallahi P. Increased risk of papillary thyroid cancer in systemic sclerosis associated with autoimmune thyroiditis. Rheumatology. 2015 Sep 30;55(3):480-4.
16. Boelaert K, Horacek J, Holder RL, Watkinson JC, Sheppard MC, Franklyn JA. Serum thyrotropin concentration as a novel predictor of malignancy in thyroid nodules investigated by fine-needle aspiration. The Journal of Clinical Endocrinology & Metabolism. 2006 Nov 1;91(11):4295-301.
17. Fiore E, Vitti P. Serum TSH and risk of papillary thyroid cancer in nodular thyroid disease. The Journal of Clinical Endocrinology & Metabolism. 2012 Apr 1;97(4):1134-45.
18. Rago T, Fiore E, Scutari M, Santini F, Di Coscio G, Romani R, Piaggi P, Ugolini C, Basolo F, Miccoli P, Pinchera A. Male sex, single nodularity, and young age are associated with the risk of finding a papillary thyroid cancer on fine-needle aspiration cytology in a large series of patients with nodular thyroid disease. European Journal of Endocrinology. 2010 Apr 1;162(4):763-70.
19. Cho YA, Kong SY, Shin A, Lee J, Lee EK, Lee YJ, Kim J. Biomarkers of thyroid function and autoimmunity for predicting high-risk groups of thyroid cancer: a nested case–control study. BMC cancer. 2014 Dec;14(1):873.
20. Jonklaas J, Nsouli-Maktabi H, Soldin SJ. Endogenous thyrotropin and triiodothyronine concentrations in individuals with thyroid cancer. Thyroid. 2008 Sep 1;18(9):943-52.

Indian Journal of Public Health Research & Development, November 2019, Vol. 10, No. 11 1963
21. Rinaldi S, Plummer M, Biessy C, Tsilidis KK, Østergaard JN, Overvad K, Tjønneland A, Halkjær J, Boutron-Ruault MC, Clavel-Chapelon F, Dossus L. Thyroid-stimulating hormone,
thyroglobulin, and thyroid hormones and risk of differentiated thyroid carcinoma: the EPIC study. Journal of the National Cancer Institute. 2014 May 13;106(6):dju097.

Detection of Klebicin Gene Cluster from Klebsiella Pneumoniae Isolated from Sputumat Baghdad City
Amal A. Kareem1, Tuqa S. Al-Salmani2, Mustafa S. Al-Salmani3
1,2 Middle Technical University/ College of Health & Medical Technology /Baghdad, Iraq, 3Al-Nahrain University/ College of Biotechnology/ Department of Molecular and Medical Biotechnology/ Baghdad, Iraq
Abstract
Klebicins (bacteriocins) are natural antimicrobial peptides that produced by ribosomes of Klebsiella species.The fatal action of klebicin is directed to closely related bacteria to the producing strains. The present study aims todetect theklebicin genecluster in Klebsiella pneumoniae isolates.Thirty one K. pneumoniaisolates were specified by biochemical and microbiological methods, eventually confirmed by API 20E system and VITEK-2 system.Antibiotic susceptibility test was done five antibiotics (Amikacin, Ampicillin, Augmentin, Azetreonam and Tetracycline). DNA extraction was carried out for 31 K. pneumonia isolates andklebicingene cluster was amplified from extracted DNA by PCR technique. Results of current study were shown that the resistance rate of studied antibiotics was registered as Amikacin 32.26%, Ampicillin 64.52%, Augmentin 51.61%, Azetreonam48.39% and Tetracycline 41.94%.Amplification results revealed that Klebicin gene cluster was isolated from15(48.39%) of K. pneumoniae isolates.
Keywords: Bacteriocin,Klebicin, Antibacterial agents,Klebsiellapneumoniae.
Introduction
K. pneumoniae is Gram-negative, non-motile encapsulated rod-shaped bacterium, facultative anaerobic andlactose-fermenting(1).K. pneumoniais a dangerousopportunistic pathogen due to their role in causing both nosocomial andcommunity acquired infections(2).In healthy human, it can be situatedasymptomatically in the intestine, skin, nose, and throat. On the other side, it can cause a large spectrumof infections including mostly pneumonia, wound, soft tissue, or urinary tract infections(3).Becausethey survive in the environment and require their competition with other microorganisms, whole bacteria yield antimicrobial peptides act as inhibitor or killer for other competing bacteria. These peptides are included two groups, the bacteriocins and the antibiotic peptides(4). Since 1925, the first bacteriocin in Escherichia coli was discovered by Andre Gratia. In 1963, Hamon and Peron were first described bacteriocins of Klebsiella(5).
Klebicins or klebocins (Bacteriocins)are ribosomally synthesized natural antimicrobialpeptides. These peptides are excreted by most bacteria for killing other bacteria(6).They differ from classical antibiotics
in having fatal action against only bacteria which are closely linked to the producing strains(5). The action of Klebicin includes several steps for killing the sensitive bacteria. These steps starting with binding of klebicinto specific receptors, which are outer membrane proteins utilized for the entry of particular nutrients then transport through the outer membrane and pass across the periplasm by either the Tol or TonB systems(7). Klebicins would reach their target and their action would do either by forming a voltage-dependent channel into the inner membrane or by utilizing their endonuclease activity on DNA, rRNA or tRNA(8).Klebicins were proteins encoded chromosomallyand byKlebocinogenic plasmid(9).
The present study aimed to detect klebicin (bacteriocin) genecluster among K. pneumoniaisolated from sputum in Baghdad city.
Materials and Method
Samples Collection:Thirty one isolates of K. pneumoniae were isolated from sputum samples collected from patients suffered from pneumonia admitted at Baghdad Medical City (Baghdad Teaching Hospitaland Gazi Al-Hariri Hospital) during the period

Indian Journal of Public Health Research & Development, November 2019, Vol. 10, No. 11 1965
from January/ 2015 to May/ 2015.
Identification of Isolates: The identification of all K. pneumoniaisolates were carried out by inoculation on blood agar andMacConkey agar for primary identification. They were incubated aerobically at 37˚C for overnight. All K. pneumoniaisolates were specified to genus and species level based on the standard biochemical and microbiological methods(10). API-20 E system wasutilized to affirmthe identification(11).The confirmative testshave been crowned byVITEK-2 System.
Antimicrobial Susceptibility Test:Antimicrobial susceptibility test was achieved against five antibiotics (Amikacin, Ampicillin,Augmentin, Azetreonamand Tetracycline) by using the disk diffusion methodand the outcomes were interpreted in based on the CLSI, 2014(12).
Amplification of klebicingene cluster: DNA extraction was carried out for 31K. pneumoniaisolates by using ZR Fungal/Bacterial DNA MiniPrepTM kit.The klebicingene cluster was amplified from extracted DNA. A 2300bpklebicin gene cluster was amplified using the primer forward (5’-GCTCTGTAACCTTCAAGTTCTC-3’) and reverse (5’-CAAGCAAGATTACGGTCTACTC-3’)(8). The PCR reaction mixture was composed of 12.5µl of green master mix, 3µl of template DNA, 2µl of each forward and reverse primer (10μM), then the volume completed to 25µl by free nuclease water.The PCR
program was applied as the following: 10min at 94˚C (initial denaturation temperature);32 cycles including 1min at 94˚C (denaturation temperature), 40S at 54˚C (annealing temperature) and 2min at 72˚C (extension temperature);and 5min at 72˚C for finalextension.Amplified DNA productswere resolved by electrophoresis on 1% agarose gels containingRedSafeTM Nucleic acid staining.
Findings and Dscussion
K. pneumoniae is classified as most important “Gram negative bacteria”(13), because their pathogenic role in hospital acquired infections(14). In the past decades, thepersistentrising in the incidence of bacterial infections has led to continuous and unlimited utilization of antimicrobial drugs as therapythroughout of the world. Subsequently, this cause increasing the emergence of “multidrug resistance” among K. pneumoniae and other strains of bacteria(15).
Antimicrobial susceptibility testing has givenvariouslevel of resistance against antibiotics as appeared in Table1.There is an evidence for increasing the antibiotic resistance.The higher percentage of resistance was recorded against ampicillin 64.52%,followed by augmentincame in second-step with 51.61%. On the other hand, the percentages of resistance against azetreonam and tetracyclinewere convergent (48.39%and 41.94% respectively), while the percentage was 32.26% for amikacin resistance. K. pneumoniae resistance to various antibiotics as discussed, this is thought to be in relation with Kaye et al(16).
Table 1: Antibiotic ResistanceamongK. pneumoniae isolates (n=31).
AntibioticsResistant K. pneumonia
No. %
Amikacin 10 32.26%
Ampicillin 20 64.52%
Augmentin 16 51.61%
Azetreonam 15 48.39%
Tetracycline 13 41.94%

1966 Indian Journal of Public Health Research & Development, November 2019, Vol. 10, No. 11
Figure (1): Analysis of Klebicin gene cluster of Klebsiellapneomoniae isolates. Lane(M): 100bp DNA Marker. Lane(K1,K2,K11-K13,K18, K20-K22, K24,K27-K31):Klebsiellapneomoniae isolatespositive forKlebicingene cluster. All positive isolates for Klebicingene clusterare generated (2300bp) PCR product.
Amikacinusually act bybinding to 30s ribosome leading to misreading of mRNA, eventually inhibiting of bacterial protein synthesis (17). The study findings showed that ten K. pneumoniae isolates were resistant to amikacin with percentage (32.26%) which is close to the result (28.12%) that reported by Aljanaby and Alhasani, (2016) in Kufa city (18). This result is lower than other studies documented by Bratuet al, 2005 (45%) and Castanheiraet al, 2008 (53.3%) (19,20).Ampicillin belong to one group of “beta-lactam antibiotics” and consider as a member of the amino-penicillin family.The action of ampicillin occursby inhibition of the transpeptidase enzyme, therefore it categorized as cell wall inhibitor for bacteria (21).In present study, most isolates showed high degree of resistance to ampicillin (64.52%). These findings were in agreement with those reported by Alain et al(22), and Kevin et al(23).The study showed that 16(51.61%) of the isolatedK. pneumoniaerecorded resistance againstAmoxicillin/Clavulanic acid. Another result was documented in a study carried out byAljanaby and Alhasani (2016) in Iraq, on the K. pneumoniae isolates showed resistance (93.75%) to this antibiotic (18).K. pneumoniae isolates were showed high resistance to azetreonam. FifteenK. pneumoniaisolates (48.39%) were resistant to azetreonam. This prevalence rate ofazetreonam resistance was higher than these reported from 1998 to 2010 by Sanchez et al(24).
Tetracycline are a broad group of antibiotics that was isolated from different species of the genus Streptomyces. Tetracycline was discovered in 1945 by Benjamin Duggar(25). Tetracycline act as inhibitor for protein synthesis by binding to the rRNA components of 30S ribosomal subunit and leading to inhibit the addition of aminoacyl-tRNAs to the ribosome (26).The study recorded that the tetracycline resistance was 41.94% which was higher than result reported by Aljanaby and Alhasani (2016), who found that the tetracycline resistant K. pneumoniawas 34.37% (18).
The klebicins actionis homologous activity due to lethal action on limited spectrum of bacteria which are closely related to the producing isolates (27), and they have a broad antimicrobial spectrum that not limited by the genus and family (28). Klebicins are divided into two types, A and B, according to cross resistance (29), their action on the goal cell, causing pores in the outer membrane of the target cell making ionic channels in it. The other endonucleases klebicins hydrolyze the nucleic acid of the target cell in the cytoplasm.Just two bacteriocins [klebicins B (30) and CCL (NCBI accession AF190857)] from Klebsiellahave been sequenced(30).Klebicin gene cluster among 31 of K. pneumoniaeisolates were conducted using specific primers.Figure (1) shows the result of PCR amplification. PCR products corresponding to Klebicin gene cluster (2300bps) were appeared in 15 isolates (48.39%).

Indian Journal of Public Health Research & Development, November 2019, Vol. 10, No. 11 1967
Ethical Clearance: Non
Source of Funding : Self
Conflict of Interest : None
References
1. Ryan KJ and Ray CG. Sherris Medical Microbiology (4thed.). McGraw Hill.(2004).
2. Chiu S, Wu T,ChuangY,LinJ,FungC,Lu P,et al. ‟National surveillance study on carbapenem Non-susceptible Klebsiella pneumonia in Taiwan: the emergence and rapid dissemination of KPC-2 carbapenemaseˮPLOS One. (2013);8(7):1-7.
3. Holt KE,Wertheim H, Zadoks RN, Baker S, Whitehouse CA, Dance D, et al. ‟Genomic analysis of diversity, population structure, virulence, andantimicrobial resistance in Klebsiellapneumoniae, an urgent threat to public healthˮ. ProcNatlAcadSci USA. (2015); 112(27):E3574-3581.
4. Gulluce M, Karaday M andBarıs O. ‟Bacteriocins: Promising Natural Antimicrobialsˮ. Science, technology and education. (2013):1016-1027.
5. Riley MA and Wertz JE. ‟Bacteriocins: evolution, ecology, and applicationsˮ. Annual Review of Microbiology. (2002); 56: 117-137.
6. Elayaraja S, Annamalai N, Mayavu P andBalasubramanian T. ‟Production, purification and characterization of bacteriocin from Lactobacillus murinusAU06 and its broad antibacterial spectrumˮ. Asian Pacific Journal of Tropical Biomedicine. (2014); 4(1): S305-311.
7. Lloubès R,Cascales E,Walburger A,Bouveret E,LazdunskiC,Bernadac A, et al. ‟The Tol-Pal proteins of Escherichia coli cell envelope: an energized system required for outer membrane integrity?ˮ.Research inMicrobiology.(2001); 152:523-529.
8. Chavan M, Rafi H, Wertz J, Goldstone C and Riley MA.‟Phage Associated Bacteriocins Reveal a Novel Mechanism for BacteriocinDiversification in Klebsiellaˮ. Journal of Molecular Evolution. (2005); 60:546-556.
9. Cascales E, Buchanan S,Duché D,Kleanthous C,Lloubès R,Postle K,et al. ‟ColicinBiologyˮ. Microbiology and Molecular Biology Reviews.
(2007);71 (1):158-229.
10. Brooks GF, Butel J, Carroll KC and Morse S. Jawetz, Melnick&Adelberg’s medical microbiology. 24th ed., New York: McGraw-Hill; (2007).
11. York MK, Brooks GF and Fiss EH. ‟Evolution of the auto SCANW/A rapid system for Identification and Susceptibility testing of gramnegative fermentative bacilliˮ. Journal ofClinical Microbiology. (1992);30(11):2903-2910.
12. Clinical and Laboratory Standards Institute (CLSI). Performance Standards for Antimicrobial Susceptibility Testing; Ywenty-forth Informational Supplement. CLSI document M100-S24. Clinical and Laboratory Standards Institute, 950 West Valley Road, Suite 2500, Wayne, PA 19087, USA, 2010. (2014); 34(1).
13. Lin WH, Wang MC, Tseng CC, Ko WC, Wu AB, Zheng PX,et al.‟Clinical and microbiological characteristics of Klebsiellapneumoniae isolates causing community-acquired urinarytract infectionsˮ. Infection. (2010); 38: 459-464.
14. Abdel-Wahab F,Ghoneim M, Khashaba M, El-Gilany AH and Abdel-Hady D. ‟Nosocomial infection surveillance in an Egyptianneonatal intensive care unitˮ. Journal of Hospital Infection.(2013); 83: 196-199.
15. Tanwar J, Das S, Fatima Z andHameed S. ‟Multidrug Resistance: An Emerging Crisisˮ. Interdisciplinary Perspectives on Infectious Diseases.(2014);7.
16. KayeKS,FraimowHSand AbrutynE. ‟Pathogens resistant to antimicrobial agent,Epidemiology,and Molecular Mechanisms and Clinical Managementˮ.Infectious Disease Clinics of North America. (2000):14(2):239-319.
17. Ahmed I, Sajed M, Sultan A, Murtaza I, Yousaf S, Maqsood B, et al. ‟ The Erratic Antibiotic Susceptibility Patterns of Bacterial Pathogens Causing Urinary Tract Infections ˮ. EXCLI Journal. (2015);14:916-925.
18. Aljanaby AAJ and Alhasani AHA. ‟Virulence factors and antibiotic susceptibility patterns of multidrug resistance Klebsiellapneumoniae isolated from different clinical infectionsˮ. African Journal of Microbiology Research. (2016); 10(22):829-843.
19. Bratu S, Tolaney P, Karumudi U, Quale J,

1968 Indian Journal of Public Health Research & Development, November 2019, Vol. 10, No. 11
Mooty M, Nichani S,et al. ‟Carbapenemase-producingKlebsiellapneumoniae in Brooklyn, NY: molecular epidemiology andin vitro activity of polymyxin B and other agentsˮ. Journal of AntimicrobialChemotherapy.(2005); 56: 128-132.
20. Castanheira M, Sader HS, Deshpande LM, Fritsche TR and Jones RN. ‟Antimicrobialactivities of tigecycline and other broad-spectrum antimicrobials testedagainst serine carbapenemase- and metallo-b-lactamase-producingEnterobacteriaceae : report from the SENTRY Antimicrobial SurveillanceProgramˮ. Antimicrobial Agents and Chemotherapy.(2008); 52: 570-573.
21. Sharma SK, Singh L and Singh S. ‟Comparative Study between Penicillin and Ampicillinˮ. Scholars Journal of Applied Medical Sciences. (2013); 1(4): 291-294.
22. Philippon A, Arlet G and Jacoby GA.‟Plasmid determindAmpC-type beta-lactamasesˮ.Antimicrobial Agents and Chemotherapy.(2002);46(1):1-11.
23. KevinBL, Seam MB, DaniedBG, Andrew WK, TeryRand Deirdre LC. ‟Community acquried pneumonia in regional Critical Care Systemˮ. Critical Care.2005:9:R60-R65.
24. Sanchez GV, Master RN, Clark RB, Fyyaz M, Duvvuri P, Ekta G, et al. ‟Klebsiellapneumoniae
Antimicrobial Drug Resistance, United States, 1998-2010ˮ. Emerging Infectious Diseases. (2013); 19(1): 133-136.
25. Sanchez AR, Rogers RSand Sheridan PJ. ‟Tetracycline and other tetracycline-derivative staining of the teeth and oral cavityˮ. International Journal of Dermatology. (2004); 43(10):709-715.
26. Hong W, Zeng JandXie J. ‟Antibiotic drugs targeting bacterial RNAsˮ. ActaPharmaceuticaSinica B. (2014); 4(4):258-265.
27. Maresz-Babczyszyn J, Durlakowa I, Lachowicz Z andHamon Y. ‟Characteristics of bacteriocins produced by Klebsiellabacilliˮ. ArchivumImmunologiae etTherapiae Experimentalis.(1967); 15: 530-539.
28. Sharga BM andTurianitsa AI. ‟The antimicrobial spectrum of the action of bacteriocins and bacteriophages from klebsiellastrainsˮ. Microbiology Z (1993); 55(5): 59- 68.
29. Riley M and Chavan M. Bacteriocins ecology and evolution. Springer-Verlag, London, United Kingdom, (2007).
30. Riley M, Pinou T, Wertz J, Tan Y and Valletta C. ‟Molecular characterization of the klebicin B plasmid of Klebsiellapneumoniaeˮ. Plasmid. (2001); 45: 209-221.

The impact of ZnO Fillers on the Tensile Strength of Self-Polymerizing Acrylic Resins Specific for
Orthodontic Appliance
Wael Abdul Alrazzaq
Lecturer, Prosthetic Dentistry department, College of Health & Medical Technology, Baghdad,Middle Technical University, Baghdad, Iraq
Abstract
Background : self-polymerizing acrylic resins are the common materials used for the construction of orthodontic appliances. These materials have to be deficient some mechanical properties. The aim of the present research was to assess the impact of adding zinc oxide fillerstoself-polymerizing acrylic resins on their tensile strength.Materials and method: thirty samples were fabricated in total. They were made from self-polymerizing acrylic resin. 20 specimens were strengthened with zinc oxide powder at 1% and 2% by weight respectively, and the other ten specimens were considered as control. The tensile test was conducted for each specimen. The data were analyzed using SPSS v 20, and comparison between main groups was obtained by ANOVA and Duncan’s test. Results: The results showed that the ZnO enhanced significantly the tensile strength of self-polymerizing acrylic resin compared to the control group. The ZnO 1 experimental group has the highest mean of tensile strength (6.97 N/mm2) followed by ZnO 2(5.91 N/mm2).Conclusion: the incorporating of ZnO powder to self-polymerizing acrylic resins affects significantly the tensile strength. It is suggested to add ZnO fillers with different concentrations to see whether there is any improvement in the mechanical properties of self-polymerizing acrylic resins or not.
Keywords: self-polymerizing, Zinc oxide, tensile strength.
Introduction
In dentistry, self-polymerizing acrylic resins are the most common restorative substances used for fabrication of orthodontic appliances [1, 2]. The advantage of such materials is that usually cheap and easy to be manipulated, and being chemically activated [3, 4]. However, the degree of polymerization of these materials is not perfect as heat polymerizing acrylic resins, results in a high unreacted residual monomer leading to lowering flexural strength of acrylic resin [5]. To overcome such problems, researches have been carried out by adding several reinforcements ( i.e. titanium dioxide) to enhance the mechanical properties of acrylic resins. It was found in the literature that the addition of fillers enhanced the mechanical properties of acrylic resins [6]. However, others found that the addition of fillers has a negative impact on some mechanical properties of acrylic resins[7]. Zinc oxide powder is found as the mineral zincite and can be produced synthetically. It is white in colour
with a formula of ZnO, which can insoluble in water [9]. The zinc is found in pure form as brittle metal and it is a white-blue coloured metal. The zinc, when heated, oxidizes results in a low-density metal oxide [10-11]. In dentistry, Zinc oxide has utilized in wide applications (i.e. root canal sealer) [12-13]. The present research was to assess the influence of incorporating ZnO fillers to self-polymerizing acrylic resins on their tensile strength
Materials and Method
Materials and samples groups:
In the present study, 30 Samples were prepared in total. There are 3 main groups and each group had ten samples. The experimental groups involved the adding the zinc oxide powder (Golchadent, Iran) with a concentration of 1% and 2% respectively. The control group involved fabrication of self-polymerizing acrylic samples (Spofadental, Czech Republic) without the addition of zinc oxide filler. The dental stone (Zhermack,

1970 Indian Journal of Public Health Research & Development, November 2019, Vol. 10, No. 11
Italy) was utilized to fabricate the mould for acrylic samples.
Fabrication of self-polymerizing acrylic samples
A metal pattern with dimension of 65mm length, 12.5mm width and 2.5mm thickness was utilized to construct the acrylic samples for tensile strength test [14]. The specimen’s preparation and procedure were done depending on ADA specification number 12 for denture base resin (1999) [15]. The process of fabrication of stone mould began by lubricating the lower part of the metal flask with a Vaseline to allow removal of stone mould following deflasking. The lower part was then filled with dental stone, and the metal pattern was placed gently into mid of stone surface with taking into consideration half of its thickness was exposed (figure 1).
Fig1.Metal pattern located onto stone mould
The stone surface was left to set for one hour. It was then coated with a separating medium (ISODENT, Spofadental, Czech Republic). The upper half was separated with a Vaseline and filled with dental stone completely; the lower half was inverted over upper half gently and left to set for one hour. Then, the flask was carefully opened; and the pattern was taken away in order to be prepared for packing the acrylic resins.
Mixing and proportioning of acrylic resins:
In the present research, an electronic balance with an accuracy of (0.0001g) was used (fig 2). The amounts of acrylic polymer, monomer and ZnO nano-fillers are shown in table 1.
Table1. Proportioning and Mixing of the Acrylic resin
ZnO Percent-
age
Amount of
ZnO.
Amount of
PMMA.
Amount of
monomer.
1% 0 .22 g 21.78 g 10 ml
2% 0.44 g 21.56 g 10 ml
Fig 2.An electronic balance used in the current study
According to manufacturers’ instructions, the materials were hand -mixed in a clean and dry ceramic jar for 30 seconds. The mix was then left at the room temperature for 6 min. When it reached a dough stage, the acrylic dough was rolled and positioned in the mould. Then,the two halves of the flask were put in contact and positioned under press (up to 20 bar). Then the two halves of flask wereseparated and the excess materials were removed with wax knife. The two halves of the flask were put under pressure till metal to metal contact and left-handed under press for five minutes. The stone bursand sandpapers (120 grain size) were utilized to get a smooth surface. A bristle brush and pumice were used for polishing the acrylic samples. A wool brush and polishing soap were utilized to get a glossy surface. The specimens were conditioned for two weeksat (37°C)in distilled water [15].

Indian Journal of Public Health Research & Development, November 2019, Vol. 10, No. 11 1971
Testing procedure: -
The Instron machine (Instron/ Germany) was used to test Acrylic samples (figure 3).
Fig3. Specimen under tensile strength test.
All acrylic samples were subjected to the force with a crosshead speed of 0.5 mm/min until fracture occurred and the values were recorded in kilograms (Kg) and then converted into Newton (N)[17]. Tensile strength values were then calculated by the formula below [18]:-Tensile strength( T.S) (N/mm2)= force at failure( F) / the area of cross-section at failure (A)
Results
The values of Mean and Standard deviation (SD) are listed in the table (2). The results indicated that the ZnO enhanced significantly the tensile strength of self-polymerizing acrylic resin compared to the control group. The ZnO 1 experimental group has the highest mean of tensile strength (6.97 N/mm2) followed by ZnO 2(5.91 N/mm2).
Table 2. Mean, standard deviation of groups for tensile strength.
Group Number
Subset for alpha = 0.05
1 2 3
Control 10 5.18
ZnO 1 10 5.91
ZnO 2 10 6.97
Sig. 1.000 1.000 1.000
Furthermore, there is significant difference amongall group (P<0.001) as shown in Duncan multiple comparison test (table 3).
Table 3. comparison between the groups
group mean Standard deviation
control 5.18 .51
Experimental group ZnO 1 5.91 .76
Experimental group ZnO 2)
6.97 .12
In addition, there were significant differences among all samples groups(P<0.001)as illustrated in table 4( ANOVA test).
Table 4.ANOVA test.
ANOVA
tensile
Sum of
Squaresdf
Mean
SquareF Sig.
Between
Groups16.183 2 8.092 28.512 .000
Within
Groups7.662 27 .284
Total23.845 29
Discussion
The present study has been conducted to evaluatethe influence of adding ZnO fillers to self-polymerizing acrylic resins ontheir tensile strength. In the literature, there were no published papers about the effect of ZnO fillers on mechanical properties of the self-polymerizing acrylic resins. The present study indicated that the addition of ZnO micro filler enhanced significantly the tensile strength shown in the table (3). The rise in tensile strength values following incorporating 1% and 2% of ZnO powder is because of good distribution of particles enable them to inter between liner macromolecules chains. The segmental motion of the macromolecular chains was restricted and lead to increase strength and rigidity of the resin. Consequently, this enhanced the
1972 Indian Journal of Public Health Research & Development, November 2019, Vol. 10, No. 11
fractural resistance and lead to improve tensile strength [19,20].
Conclusion
From the present study, it is concluded that the incorporation of zinc oxide improves slightly the tensile strength of self- polymerizing acrylic resins. It is suggested to do more research using the ZnO fillers with different concentrations to see if there is any improvement in the mechanical properties of self- polymerizing acrylic resins.
Conflict of Interest: No
Source of Funding : Self
Ethical Clearance : Non
References
1. Powers J.M., Sakaguchi R.L. CRAIG’S Restorative dental materials. 12th ed., St. Louis, Mosby Co.2006.
2. Farhood I, Rafeeq A . Effect of Incorporation of Silver Nitrate on Transverse Strength and Impact Strength of Autopolymerizing Acrylic Resin. Karbala J. Med, 2014; 7(2):1992-1999.
3. Wilson H.J.; Mansfield M.A.; Health J.R.; Spence D. Dental technology and materials for students. 8th. Ed., Oxford, Black Well Scientific Publication; 1987: 372.
4. Anusavice K.J. Phillips science of dental materials.11th ed., Elsevier, 2008; 211-271.
5. Becker C.M.; Smith D.E.; Nicholls J.I. The comparison of denture base processing technique. Part II. Dimensional changes due to processing. J. Prosth. Dent, 1988; 37: 450-459.
6. Kati F, Al-Kaabi A. Part I: Effect of oil paint addition on micro hardness of acrylic ocular prosthesis. Iraqi Dental Journal. 2016; 38(2):87-89.
7. Kati F, Al-Kaabi A.Part II: Effect of oil paint addition on the flexural strength of acrylic ocular prosthesis. 3rd international conference of medical and health speciality. 2016; 4(4):100-104.
8. Kati F. Effect of oil paint addition on impact strength of the scleral part of the acrylic ocular prosthesis. Open Dentistry Journal. 2018; 12:946-951
9. Dahham TB. The effects of modified zinc oxide nanofillers addition on some properties of heat cure acrylic resin denture base material. A master thesis, College of Dentistry, University of Baghdad, 2014.
10. Dickson TR. Introduction to chemistry. 8th ed. John Wiley and Son., USA, 2002.
11. Carig RG, Powers JM. Restorasive dental material. first edition. Louis The cv mosby Inc, 2002.
12. Burn C. Pathways of the pulp. 8th edition. Mosby Co. St. Louis, Missowi. 2002.
13. Pommd L, Abm S. The effect of the powder liquid ratio on the properties of zinc oxide-eugenol based root canal sealers. Dental Material 2004;10:915-923.
14. ISO 527. International organization for standardization. Plastic determination of tensile properties. 1993.
15. ADA, American national standers institute/ American dental association specification No.12 for denture base polymer. 10th Ed.; Chicago: council on dental material and devices, 1999.
16. The glossary of prosthodontic terms. Ninth Edition.The journal of prosthetic dentistry;2017. 117 ( 5S): 86.
17. Abu- Anzeh M.I. Evaluation of tensile bond strength of tooth-denture base resin as a function at different surface treatments and processing regimes. M.Sc. Thesis, College of Dentistry, University of Baghdad.2003.
18. Al-Shammari F.A , Abood A. Z, Yaseen I.N .Tensile strength of repaired acrylic resin influenced by water aging . Muthanna Medical Journal 2015; 2(1):27-33
19. Katsikis N., Franz Z., Anne H., Helmut M. and Andri V.: “Thermal stability of PMMA/Silica nano and micro composites as investigated by dynamic mechanical experiments”. Polymers Degradation and stability, 2007; 22: 1966-1976.
20. Gad MM, Abualsaud R, Rahoma A, Al-Thobity AM, Al-Abidi KS, Akhtar S.Effect of zirconium oxide nanoparticles addition on the optical and tensile properties of polymethyl methacrylate denture base material. International Journal of Nanomedicine. 2017; 13:283-292.

Hormonal Changes in Sodium Fluoride Exposed Female Rats and its Amelioration by Urticadioca Leaf Extract
Zinah Mohammed Al_Shammari1
1Department of Biology, College of Basic Education, University of Wassit, Iraq
Abstract
The present study was carried out to investigate the protective role of Urticadioicaleaf extract on the hormonal profile in sodium fluoride exposed female rats. Thirty two mature female rats were randomly divided to four equal group and treated for 4th weeks as follows: control group administered tap water; group T1 administered tap water containing 100 ppm NaF; group T2 administered tap water containing 100 ppm NaF plus 300 mg/ kg Urticadioicaleaf extract; group T3 administered 300 mg/ kg Urticadioicaleaf extract only. Blood sample were obtained at zero and 28 days of the experiments for estimation of serum progesterone, estrogen, FSH,LHconcentration. The result revealed significant decrease in serum progesterone, estrogen, FSH, LH concentration in group T1 (NaF treated group ). On the other hand, the result showed the beneficial effects of Urticadioica leaf extract to improvement the previous parameters against NaF(T2), through a significantincrease in hormonal profile concentration. Therefore, it could be conclude that Urticadioicaextract has a potent ameliorative effects on hormonal profile in NaF stressed rats .
Keywords: Hormonal profile, sodium fluoride, urticaleaf, rats
Introduction
Fluoride surely exists in water, soil, and nutrition. Ingesting water that have high concentricity of fluoride, mainly from natural origin, is the major source of human environmental exposure throughout the world[1]. Fluoridation is a safe and efficient method for the preventing of dental caries[2,3]. In several countries, water fluoridation is used for this reasons. However, the advantageous will be narrow, and healthiness may be affected adversely if excessive fluoride be absorbed. Fluoride accumulation in soft tissues causes oxidative stress through inhibition of different enzymatic systems and increased generation of reactive oxygen species (ROS)[4]. As the case of the many chronic degenerative disease, increase of ROS and lipid peroxidation (LPO) has been considered to play an important role in the pathogenesis of fluoride toxicity[5]. NaF may have toxic effects on the brains of suckling mice[6], may impair learning and memory in rats[7,8],and may impairment of liver function[9].
Excessive exposure to environmental pollutants and chemicals is a main principle to reproductive health problems[10,11]. Fluoride is a common natural pollutant
with certain toxic effects, and the association between long term fluoride exposure and fertility impairment has be attracted to concern[12,13].
It is well known that folk medicine was assistance in disease prevention and control have been attributed to antioxidant properties of their constituents, broadly termed as polyphenolic compounds. In addition to their role as antioxidants, these compounds have broad spectrum of medical property. It has been known that antioxidants protects the cell directly or indirectly from the damage caused by toxic radicals reactions through different mechanisms[14].Urticadioicabelongs to the Urticaceaeitsthe chemical compounds are Lignans, sterols,flavonoids, polysaccharides, lectins and fatty acids also rich in vitamins A,C and D and such minerals as Magnesium and Calcium.Urticadioicahas an antioxidants, anti inflammatory and anticancer properties, as well as, blood glucose and lipid lower effects[15]. Different effects of it plant have been notified in various worldwide districts. Therefore, the objective of this study was to explore the protective effect of urticadioicaleaf extract on hormonal profile against sodium fluoride in female rats.

1974 Indian Journal of Public Health Research & Development, November 2019, Vol. 10, No. 11
Materials and Method
The leaf were taken from north of Iraq. To prepare70% ethyl alcohol,100 grams of dried leaves which was mixed with 500 ml of alcohol in each extract process by using magnetic stirrer at 40 °C for 24 hours[16,17], the extract have been filtered and the process have been repeated 3 times. The filtrate was concentrated by using incubator at 40 C° for 72 hr to obtained crude plant extract, the result kept at 4 C° in sterile and dark glass container until used.32adult female rats were randomly divided to 4 equal group and handles as follows for 4th weeks: control group were administered tap water; group T1rats of this group were allowed to ad libitum supply of drinking water containing 100 ppm of sodium fluoride;group T2rats of this group were allowed to ad libitum supply of drinking water containing 100 ppm of sodium fluorideplus ethanolic extract ofUrticadioica (300 mg/kg), groupT3rats of this group were receivedEthanolic extract ofUrticadioicaat dose of 300 mg/kgonly;Collected of blood sample were obtained via cardiac puncture from each anesthetized animal at zero and28 days of the experiments then centrifuged at 3000
rpm for 15 minutes, and sera was isolated and frozen at -18C° till analysis of serum estrogen,progesterone,FSH, LH concentrations by using immunoenzymometric assay kits (monobindInc, USA). Statistical analysis of data was performed on the basis of two way analysis of variance (ANOVA)using a significant level at(P<0.05) and using Least Significant Differences (LSD)test for specific group differences[18].
Finding and Discussion
Data pertaining to serum progesterone hormone concentration (table 1) showed a significant(P<0.05)decline in NaF treated group after 4thweeks of experiments comparing to other treated groups.The results also clarified a significant(p<0.05) increment in T2 as compared to T1 treated group. It was also noted highly significant (p<0.05) increase in this parameter in T3 group comparing to other treated groups.
In comparison within time for T2&T3 groups, recorded significant(p<0.05) increment, whereas T1 group registered significant (p<0.05) decrement as compared to pretreated period.
Table 1:effects of alcoholic extract of Urticadioicaon serum progesterone hormone concentration (ng/ml) in adult female rats exposed to sodium fluoride
Time Group
C T1 T2 T3
Zero day 2.50±0.005 A a
2.50±0.00A a
2.48±0.01A b
2.49±0.01A b
4th week 2.49±0.01C a
1.17±0.00D b
3.19±0.00B a
3.29±0.01A a
LSD 0.02 Value are expressed as mean ±SE, n=8 each ;C:control ;T1: administration 100 ppm of NaF;T2: administration 100 ppm of NaF plus300 mg/kgurticadioica extract;T3: administration 300 mg/kgurticadioica extract treated group; capital letters denotes differences between groups,p<0.05 and small letters denotes significant differences within group p<0.05
After 4th weeks of experiments, group T1 showed highly a significant (p<0.05) decrease in estrogen hormone concentration compared to other treated
groups ( table 2). Whereas, the result registered that oral intubation of extract concurrently with NaF normalized estrogen hormone near to control group after 4th weeks of treatment. On the other hand,estrogen hormone concentration in T3 group recorded significantly (p<0.05) elevated after 4th weeksof experimental periods comparing to other treated groups. Time dependent, a significant(p<0.05) increment was observed after 4th weeks of treatment in T3 group, also a significant(p<0.05)decrement in C,T1,T2 treated groups when compared with zero time.

Indian Journal of Public Health Research & Development, November 2019, Vol. 10, No. 11 1975
Table 2:effects of alcoholic extract of Urticadioicaon serum estrogen hormone concentration (ng/ml) in adult female rats exposed to sodium fluoride
Time Group
Control T1 T2 T3
Zero day 27.17±0.33 A a
27.06±0.21A a
27.40±0.25A a
27.14±0.08A b
4th week 25.80±0.68B b
21.52±0.45C b
25.48 ±0.45B b
32.66±0.93A a
LSD 1.1
Note for details show table 1
Table(3)showed a significant(p<0.05) decrement in FSH concentration NaFtreated group comparing to controlgroup.Whereas, highly significant increment in this parameter was observed in T3 group as comparing to other treated groups. Besides, there were a significant(p<0.05) increase in FSH concentration in C,T2,T3 groups, while results showed a significant(p<0.05)decrease in T1 treated group at end of experimentscomparing to zero time.
Table 3: effects of alcoholic extract of Urticadioicaon serum follicular stimulating hormone concentration ( FSH) (ng/ml) in adult female rats exposed to sodium fluoride
Time Group
Control T1 T2 T3
Zero day 12.96±0.24 A b
13.12±0.19A a
13.07±0.19A b
12.94±0.23A b
4th week 13.46±0.38B a
10.41±0.19C b
13.73±0.23B a
16.95±0.19A a
LSD 0.4
Note for details show table 1
Statistical analysis of LH concentration recorded a significant (p<0.05) decrease in groupT1comparing with other treated groups table 4.On the other hand, significant (p<0.05) elevation in same parameter in T3 treated group when comparing with other groups.
Furthermore,there was no significant (p>0.05) differences in LH concentration in control &T2 compared with eachothers.Moreover,with exception of T3(which showed a significant (p<0.05)increase after 4th weeks), the results recorded a significant (p<0.05) decrease in C,T1 and T2 along the experiment period comparing to pretreated period.

1976 Indian Journal of Public Health Research & Development, November 2019, Vol. 10, No. 11
Table 4: effects of alcoholic extract of Urticadioicaon serum luteinizing hormone concentration ( LH) (ng/ml) in adult female rats exposed to sodium fluoride
Time Group
Control T1 T2 T3
Zero day 4.27±0.03A a
4.32±0.02A a
4.36±0.02A a
4.34±0.02A b
4th week 3.73±0.23B b
2.81±0.23C b
3.86±0.27B b
6.15±0.31A a
LSD 0.4
Note for details show table 1
The ovary it is an prominent target organ of many reproductive toxicants. Organ coefficients can better express organ toxicity follow exposure at toxic chemicals. Exposure to NaF is associated with deterioration of reproductive system organs functions specifically the Gonads (ovaries)[19]. The results have exhibit that NaF causes a significant (P<0.05) drop off in estrogen & progesterone concentration (T1) compared with control group, this reduction may produce direct effect of NaF on ovarian tissues specially the granulosa cells that have specialized receptors for FSH hormone, in order that these cells does not response to FSH hormone and the release of estrogen will be decrease[20]. To maintenance of fertility investigations have confirmed that steroid hormones, such as estrogen &progesterone, role in the growth and differentiation of reproductive tissues[21]. Estrogen can increase the sensibility of granulosa cells to FSH and LH, through rising the biosynthesis of progesterone by granulosa cells[22], E2 modulates steroidogenesis, promotes granulosa cell proliferation,and maintains follicular development[23]. Beside, NaF that caused significant(P<0.05) decrease in cholesterol which considered as precursor of steroid hormone may be the second cause of this reduction in estrogen and progesterone concentration[24].
Its well-known that the secretion of reproductive hormones from the ovary is regulated by the release of LH and FSH from the anterior pituitary gland. Based on the reproductive the results obtained in this study, showed that FSH and LH secretion was significantly inhibited in the sodium fluoride-exposed groups[25]. The main function of FSH is to stimulate ovarian growth and promote follicular development. LH participates
in ovarian regulation, plays a critical role in follicular maturation, ovulation, and corpus leutum development, and intervenes in the synthesis of steroid hormones[26]. As well, the present study the prevalent mechanism of action of the harmful effects of NaF occurs at the level of the hypothalamus–pituitary axis may be indicates that NaF inhibits the secretion of FSH and LH from the pituitary gland, thus weakening the promotional activity of FSH and LH on ovarian granular cells.
On the other hand, the result exhibited that the elevation of steroid hormones progesterone and close control group of estrogen hormone after treatment with NaF and Urticadioica(T2) may be due to role of plant extract to reduce the negative effects of toxicity of NaF[27]. Lignans, sterols and beta sitosterol are identified phytoestrogens in Urticadioica[28,29]. They suggested that nettle can be used in diet as an appropriate pharmaceutical alternative for synthetic prescription of estrogen hormone in patients with osteoporosis[29], besides, nettle extract improves levels of such minerals as calcium and magnesium that were decreased in patients with osteoporosis.Calcium plays a major role in reproduction. Deficiency in this macro mineral can affect fertility[30].
Calcium-dependent reproductive mechanisms include steroid biosynthesis in adrenal glands and ovaries. Calcium may also affect delivery of cholesterol or using cholesterol in mitochondria or stimulating conversion of pregnenolone to progesterone in steroidogenesis[31,32].
From results obtained it can be explained that Urticadioica have an important role in elevation of LH and FSH level. This elevation may be due to the active constituents of Urticadioica in activation of synthesis mechanisms of these hormones by stimulation of hypothalamus or pituitary glands to release and secretion

Indian Journal of Public Health Research & Development, November 2019, Vol. 10, No. 11 1977
gonadotropin hormone[27].On the other hand, the increase of LH and FSH hormones may be due to the high constituents of Urticadioicafrom essential nutrients such as flavonoids, sterols, polysaccharides,fattyacid, also rich in vitamins and minerals,theseantioxidant nutrients may stimulate hypothalamus and pituitary gland to increase synthesis and release of these hormones[34].The increase of FSH and LH hormones in(T2) group compared with control group may be increase the follicular growth so that there were increase in the number of Graffian follicles which increase the synthesis and release of estrogen hormone [34]. Also the increase of LH hormone in (T2) group compared with control may be increase the level of estrogen because the high level of LH hormone leads to increase of its binding with the receptors on theca cells[35].
The increase of LH hormone is considered as a principle factor to stimulate the theca interna to elevate production of pregnenolone compound which converted by granulose cells to progesterone[35]. Also the increase of progesterone may be due to the role of LH hormone to stimulate the corpus leutum to production of progesterone[34]. In conclusion Urticadioicaextract has a potent ameliorative effects on hormonal profile in NaF stressed rats.
Acknowledgment: This work was conducted and support from College of basic education -University of Wassit.
Conflict of Interest: There is no conflict of interest.
Funding –Self
Ethical Clearance- With agreement
References
1. Yadav N, Rani K, Yadav S, Yadav DK. Yadav VK, Yadav N. Soil and Water Pollution with Fluoride, Geochemistry, Food Safety Issues and Reclamation-A Review nt.J.Curr.Microbiol.App.Sci.2018;7(5): 1147-1162.
2. Petersen PE, Lennon MA.Effective use of fluorides for the prevention of dental caries in the 21st century: the WHO approach. Community Dent Oral Epidemiol. 2004 ;32(5):319-21.
3. Wong MCM, Clarkson J, Glenny AM, Lo ECM, Marinho VCC, Tsang BWK. Cochrane reviews on the benefits/risks of fluoride toothpastes. J Dent Res.
2011;90(5):573–9.
4. NabaviSM, Nabavi SF, Eslami S,Moghaddam AH. In vivo protective effects of quercetin against sodium fluoride-induced oxidative stress in the hepatic tissue. Food Chem. 2012; 132(2): 931-935.
5. Al-Okaily BN, Ali EH.Role Of Pomegranate Seed Oil (PSO) Against Hepatotoxicity Induced By Sodium Fluoride In Adult Female Rats (Part II). IJVM . 2017;40(1): 61-68.
6. Bouaziz H, Amara IB, Essefi M, Croute F, Zeghal N.Fluoride-induced brain damages in suckling mice. PesticBiochem Phys. 2010; 96(1): 24–29.
7. Basha PM, Rai P, Begum S. Fluoride toxicity and status of serum thyroid hormones, brain histopathology, and learning memory in rats: a multigenerational assessment. Bio Trace Element Res.2011;144:1083–1094.
8. Pereira M, Dombrowski PA, Losso EM, Chioca LR, Da Cunha C, Andreatini R.Memory impairment induced by sodium fluoride is associated with changes in brain monoamine levels. Neur Res.2011; 19(1):55–62.
9. Shashi A, Bhardwaj M. Study on blood biochemical diagnostic indices for hepatic function biomarkers in endemic skeletal fluorosis. Biol Trace Elem Res. 2011; 143(2): 803–814.
10. Akinloye O, Arowojolu AO, Shittu OB, Anetor JI. Cadmium toxicity: apossible cause of male infertility in Nigeria. Reprod Bio . 2006; 6(1): 17–30.
11. Hansen C, Luben TJ, Sacks JD, Olshan A, Jeffay S, Strader L, Perreault SD.(). The effect of ambient air pollution on sperm quality. Environ Health Perspect. 2010; 118(2): 203–209.
12. Long H, Jin Y, Lin M, Sun Y, Zhang L, Clinch C. Fluoride toxicity in the male reproductive system. Fluoride. 2009; 42(4):260–276.
13. Spittle B.Editorial-halting the inertia of indifference: fluoride and fertility revisited. Fluoride.2009; 42:159-161
14. Kahkonen MP,HopiaAI,Vuorela HJ, Rauha JP, Pihlaja K, Kujala TS, HeinonenM.Antioxidant Activity of Plant Extracts Containing PhenolicCompounds. J Agric Food Chem.1999; 47(10):3954-3962.
15. Pashazadeh M, RahbaniM, Zakhireh S. Effect of Nettle oil (Urticadioica) Consumption on levels of Blood Glucose and Lipids in Alloxan-induced

1978 Indian Journal of Public Health Research & Development, November 2019, Vol. 10, No. 11
Diabetic rats . Bull EnvPharmacol Life Sci .2013; 2 (10) : 84-89.
16. HarborneJB.Phytochemical methods: Aguide to modern techniquesof plant analysis. London: Champan and Hall, 1973; Pp: 52-88.
17. Harborne JB. Phytochemical methods. Aguide to modern techniques of plant analysis, 1984; Pp: 55-59.
18. Snedecor GW, Cochran WG. Statistical Methods. 6th the Iowa state University press: 1973: 238-248.
19. Sharma JD, Solanki M,SolankiD.Sodium Fluoride Toxicity on Reproductive Organs of Female Albino Rats Asian J Exp Sci.2007;21(2): 359-364.
20. Simoni M, Gromoll J,Nieschlag E.The follicle-stimulating hormone receptor: biochemistry, molecular biology, physiology, and pathophysiology. Endocr Rev. 1997; 18 (6):739–73.
21. Da Silva Faria T, De BittencourtBrasil F, Sampaio FJB, Da Fonte Ramos C. Effects of maternal under nutrition during lactation on estrogen and androgen receptor expressions in rat ovary at puberty. Nutri.2010; 26(10): 993–999.
22. Welsh JrTH,Zhuang LZ, Hsueh AJ. Estrogen augmentation of gonadotropin-stimulated progestin biosynthesis in cultured rat granulosa cells. Endocrinology.1983; 112(6): 1916–1924.
23. Hu S, Duggavathi R , ZadwornyD. Regulatory Mechanisms Underlying the Expression of Prolactin Receptor in Chicken Granulosa Cells.Plos One.2017;12(1);1-12.
24. Kumar TR, Wang Y, Lu N, Matzuk MM. Follicle stimulating hormone is required for ovarian follicle maturation but not male fertility. Nat Genet.1997;15(2):201–204.
25. Campbell BK, Scaramuzzi RJ, Webb R.. Control of antral follicle development and selection in sheep
and cattle. J ReprodFertil Suppl. 1995;49:335-50.
26. Hunter MG, Robinson RS, Mann GE, Webb R. Endocrine and paracrine control of follicular development and ovulation rate in farm species. AniRepr Sci.2004; 82–83:461–477.
27. Hajhashemi V, Klooshani V.Antinociceptive and anti-inflammatory effects of Urticadioica leaf extract in animal models. Avicenna J Phytomed. 2013; 3(2): 193-200.
28. Gupta R, Singh M, Kumar M, Kumar S, Prakash Singh S. Anti-osteoporotic effect of Urticadioica on ovariectomised rat. IJRPB. 2014;2(1):1015-1019.
29. Luk J, Torrealday S, Neal Perry G, Pal L. Relevance of vitamin D in reproduction. Human Reproduction.2012; 27(10) : 3015– 3027.
30. Bordoloi PK, Sarmah BC, Dutta DS ,Dekka BC. Macro and micro minerals in caprine follicular fluid. Indian J AnimReprod.2001; 22 (6): 23-25.
31. AzadiKohnehshahriV,MoghaddamGh,Pirany N.,Daghigh Kia H. The relationship between some blood elements and metabolites with repeat breeding in dairy cows at Azarnegin dairy farm. AniSci Res.2013; 23(3): 101-112.
32. AsgarpanahJ, Mohajerani R. Phytochemistry and pharmacologic properties of Urticadioica L. J Med Plants Res.2012;6(46): 5714-5719.
33. Ganong WF . Review of Medical Physiology. 22nd
Ed. Large medical Book /McGraw-Hill Boston, Toronto, New Jersey, 2005;Pp: 424-340.
34. Guyton AC, Hall JE.Text Book of Medical Physiology.11thEd.,WB Saunders company. London, 2006;Pp:948-952.
35. Champe PC,Harvey RA Ferrier DR. Lippincottُ s Illustrated Reviews Biochemistry.3rd.ed.Lippincott Williams & Wilkins.2005; pp:217-222,253-238

Application of Silver Nanoparticles (Silver NPs) in Assisted Reproductive Techniques (ART) as a Carrier Vehicles to
Improve the Therapeutic Influence of Doum Extract for Sperm of Asthenozoospermic Patients
Nabaa Al-Nawab
Dentistry Department, Al- Israa Private University College, Baghdad, Iraq
Abstract
Assisted reproductive techniques are a tool practiced worldwide to help couples achieve pregnancy and preserve fertility. However ART reveals several limitations which needs for new alternatives to overcome these limitations. Over recent years, nanotechnology has been applied as a tool to improve strategies to enhance the outcome of ART. This study has investigated for the first time the impact effect of implication of silver NPs to boost therapeutic effect of Doum palm (HyphaeneThebaica) extract on enhancing sperm quality of asthenozoospermic patients. The findings of this study has showed the implication of silver NPs has significantly enhanced theSuperoxide dismutase activity, and reduced Malondialdehyde expression and sperm DND fragmentation percentage. These encouraging results suggest that nanotechnologies could be easily included in the routine procedures of ART to improve sperm quality and thus increase the rate of successful pregnancy and preserve fertility.
Keywords: Asthenozoospermia, Silver nanoparticles, Doum palm (HyphaeneThebaica), Extract.
Introduction
Asthenozoospermia (or asthenospermia) refers to decreases of sperm motility, which is one of the major causes of infertility or reduced fertility in men.Oxidative stress plays important role in causingdecreases of male fertility and has a significant roleon semen quality assessment. Oxidative stress is mainly caused as a result of accumulation of excessively reactive oxygen species (ROS) or reactive nitrogen species (RNS). ROS/RNS results in severe damage of sperm DNA, reduced sperm motility, reduce sperm fertilising ability, and decrease sperm membrane integrity via lipid peroxidation; all of which are underlying mechanisms lead to sperm dysfunction 1.
In reproductive medicine, the application of medicinal herbs has extensively investigatedfor their pharmacological therapeutic activities on improving sperm quality. Many medicinal plants have been reported to have beneficial effects in combination with assisted reproductive technology (ART) to increase the chances of pregnancy rate and reduce the cost
of treatment. Hyphaenethebaica which, belongs to the family Palmae and this plant is commonly known as a Doum palm, has reported to has many medicinal therapeutic activities2, 3. In these studies, fruits of Doum showed antimicrobial, anti- oxidant, hypolipidemic, antidiabetic, and antihypertensive activities, suggesting that the active biological effectsof Doum fruits may ascribed to its active components 3, 4.
In fact, ART has been highly applied and practiced worldwide as a set of methodologies to cases related to infertility. However, ART still has some challenges, which still needparticular focus5.Therefore, it is highly important for identifying new alternatives to overcome these challenges.Recent advances in nanotechnology have encouraged the application of nanoparticles (NPs), which has already been developed for non-human animals, in assisted reproduction in humans5-7. Nanoparticles characterised by various physical and chemical properties that make them more stable, soluble and more biologically effective to employed in the field of drug delivery. In fact, silver NPs are type of metallic NPs and have been frequently used in many

1980 Indian Journal of Public Health Research & Development, November 2019, Vol. 10, No. 11
biomedical application due to their unique physical, chemical, and biological properties8-10. In fact, there is a little information is available about their activity in the reproductive system. Therefore, this study has adapted innovative different strategy to improve male fertility diagnosed with asthenozoospermia, particularly by enhancing sperm cell quality using silverNPs as a carrier vehicles for Doum extract components.
Materials and Method
Preparation dried extract of Doum palm (HyphaeneThebaica)
The Doumpalm fruit was dried and grinded, once it has been obtained from the local market. A 20gm of Doumpalm fruit powder was mixed with 100ml of distilled water and refluxed for 3hours. As the powder was completely dissolved, the mixture was filtrated by using a sheet of gauze in a clean suitable flask. Finally, the filtrated solution transferred to sterile petri dishes (Falcon, USA) and dried on an incubator at 73ºC 11.
Preparation of aqueous Doum palm (HyphaeneThebaica) extract for in vitro sperm activation
Following complete drying of extract of Doum palm, the aqueous working solution of Doum extract was prepared by dissolving 0.5mg of dried Doum extract with 10ml of phosphate buffer solution (PBS) (Sigma-Aldrich, USA) in plastic test tube (Falcon, USA) contained broad spectrum antibiotic. TheDoum aqueous working solution has prepared at 20% concentration by adding 2ml of the aqueous working solution of Doum extract to 8ml of PBS,to be used for the purpose of in vitro sperm activation experiment. The solution was filtered using Millipore (Millipore, USA) 0.45µM. Media was adjusted at pH 7.5-7.8 and stored at 25ºC.
Mixture preparation of silver nitrate nanoparticles with aqueous Doum extract for in vitro sperm activation
The aqueous Doum extract was mixed with silver nitrate nanoparticles by adding 0.58mg of silver nitrate to 50ml distal water. Then 10ml of aqueous Doum extract was added to the 50ml of silver nitrate solution. The final mixture of aqueous Doum extract and silver nitrate nanoparticles kept on magnetic stirrer until the brown colour of mixture changed to the brown red colour.
Experimental design
Semen samples were collected from ten patients diagnosed with asthenozoospermia, following the ethical approval and informed consent from all donors. Each semen sample was divided into three groups. The sperms in first group (i.e. control group) were treated with PBS, sperms in second group were treated Doum extract only (Extr. alone group) and sperms in third group were treated with Doum extract with silver NPs (i.e. Extr. +NPs group). Samples were incubated for 1-2hours at 37ºC in an incubator for further experiments.
Superoxide dismutase (DOS) activity assay
Using the commercially available colorimetric assays (Cohesion Biosciences. LTD. China) and following the methodology provided by the manufacturer DOS was detected in all sample groups. Briefly, sperm samples at 5x 10⁶ were centrifuged. Following centrifugation, the supernatant was discarded and 1 ml of assaybuffer was added. Then, samples were sonicated (with power 20%, sonication 3s and intervention 10s, repeated 30 times) and centrifuged at 8000g 4°C for 10 minutes. Following centrifugation the supernatant was moved into a new centrifuge tube and kept on ice for further processing. 19µl of samples, stander and distilled water as (blank) were added into 96 well plate. Then, 30μl of reaction buffer, 100μlsubstrate, 1μl of enzyme and 50μldye reagent were added to samples, stander and blank. Finally, the plate was incubated at room temperature for 30 minutes and absorbance measured at 560nm.
Malondialdehyde (MDA) measurement assay
Using the commercially available colorimetric assays (Cohesion Biosciences. LTD. China) and following the methodology provided by the manufacturer MDA was detected in all sample groups. Briefly, sperm samples at 5x 10⁶ were centrifuged. Following centrifugation, the supernatant was discarded and 1 ml of assay buffer was added. Samples were sonicated (with power 20%, sonication 3s and intervention 10s, repeated 30 times) and centrifuged at 8000g 4°C for 10 minutes.Following centrifugation the supernatant was placed into a new centrifuge tube and kept on ice for further processing. 100μl of samples were added into new micro centrifuge tubes with 200μl dye reagent and placed into oven with 90ºC for 30 minutes. Then, micro centrifuge tubes were placed on ice for few seconds and centrifuged at 10000g, 25°C for 10 minutes. 200μl of samples supernatant were

Indian Journal of Public Health Research & Development, November 2019, Vol. 10, No. 11 1981
added to 96-well microplate absorbance measured at 532nm or 600nm.
DNA fragmentation assay
The assessment of sperm DNA normality was performed usingthe microscopicacridine orange (AO) test following the protocol described previously in 1984 by Tejada et al. 12. Briefly, Smears of10 semen samples were fixed in Carnoy’s solution (3:1,methanol:glacial acetic acid) at 4°C and left overnight , washed and air-dried. The slides were then immersed in AO working solution (0.19 mg/ml in 0.1 M citric acid and 0.3 Na2HPO4 7H2O, pH 4) for 10 minutes. Smears were assessed on the same day using fluorescent microscope (Zeiss Co., Germany) with a 460nm. Normal DNA (double stranded)emitted green fluorescent when stained with AO,whereas the stain emitted red fluorescent when it bind to fragmented DNA (single stranded).
Statistical analysis
GraphPad Prism 8.0.2 software was used for data analysis. Data of N=10 was tested for normal distribution using three different tests D’Agostino& Pearson test, Shapiro-Wilk test and Kolmogorov-Smirnov test.
Finding
According to The World Health Organization (WHO), couples may classify as infertile couples if they fail to achieve a clinical pregnancy after, at least, 1 year of regular unprotected sexual intercourse13. The application of ART methodologies to cases related to infertility is common and practiced worldwide. However, there are some challenges, which still require special attention5.
Over the recent years, nanotechnology has been considered to help overcome some of challenges in reproductive medicine. NPs are owning unique physical and chemical propertiesmaking them a valuable and useful materials for various applications5, 14. The recent advancing in nanotechnologies have increased their possible applications in ART methodologies.
This study has investigated for the first time the influence of implication of silver NPs on improving the effect of Doum extract for enhancing sperm quality of asthenozoospermic patients. The results obtained by this study have showed that silver NPs have improved sperm motility. Sperm motility was examined using simple layer technique (data not shown).
In recent years, extensive studies have emphasis the role of oxidative stress on causing male infertility. The excessiveaccumulation of ROS or RNS lead to oxidative stress, which in turn has harmful effect on sperm functionality 15-17. Oxidative stress is a keystone cause of sperm dysfunction,since, it underline several mechanisms that lead to sperm dysfunction including; extensive sperm DNA damage, reduced sperm motility, decline in sperm fertilising ability, and defective sperm membrane integrity via lipid peroxidation18-21.In infertile male, major sources of ROS and RNS are produce by mitochondria in the spermatozoa and activated inflammatory leukocytes. In fact the activated leukocytes produce 1000 times more ROS/RNS than the spermatozoa does 1.
This study has estimated the concentration of SOD in sperm following their treatment with Doum extractwith/without silver NPs. Interestingly, the data of this study has showed for the first time the application of silver NPs have boosted the antioxidant effects of Doum extract by increasing SOD concentration. The results showed significant increase in SOD concentration in treated sperms in both Doum extract with NPs group and Doum extract only group compared with control group (****p<0.0001, **p= 0.0032 respectively) (Figure -1). Although, Doum extract with NPs group had slightly higher influence on SOD concentration when compared with Doum extract only group, but this was not significant (p= 0.1229).
Inside human body, oxidative stress occurs due to an imbalance occurs, causing potentially serious health consequences. The body has several defends scavenging mechanisms to maintain normal balance of ROS and RNS. These mechanisms include a number of antioxidant enzymes and antioxidant molecules. SOD provide a very important antioxidant defense mechanism against oxidative stress in the body.There is a strong evidence suggesting that foodstuff has a potential source of antioxidant phytochemicals, which act to prevent or reduce oxidative stress by scavenging free radicals , such as vitamins and, in particular, the flavonoids, coumarins, hydroxycinnamates and lignin component. Many studies have reported that Doum extracts contain significant amounts of flavonoids which have demonstrated antioxidant and antibacterial activities3, 22,
23. Flavonoids possess a significant biochemical property to act as antioxidant. The mechanisms of antioxidant action of flavonoids can include; scavenging ROS and/or

1982 Indian Journal of Public Health Research & Development, November 2019, Vol. 10, No. 11
RNS, upregulating or protection of antioxidant enzymes defenses, or by inhibition of enzymes involved in free radical generation 24-26.
Spermatozoa are susceptible to ROS-induced damagedue to contain large quantities of polyunsaturated fatty acids. Also, it has been suggested that ROS induce membrane lipid peroxidation in sperm27, 28. Since,MDA is one of toxic lipid peroxides that known to cause different impairments of sperm cells,therefore, this study has examined the level of Lipid peroxidation formMDA.
Pathological high level of ROS, which may originated from endogenous sources or exogenous sources can be potentially toxic to sperm, leads to curtail sperm damage and impaired sperm functionality. In fact, sperm dysfunction occursdue to the peroxidation of high polyunsaturated fatty acids found within the plasma membrane of spermatozoa29. This study has measured the level of MDA(as an indicator of lipid peroxidation) in sperm samples following their treatment with Doum extract with/without silver NPs. The results showed that silver NPs have significantly enhanced the uptake of Doum extract and consequently the Doum extract has significantly reduced the level of MDA when compared with the non-treated group (*p= 0.045) (Figure -2). This finding demonstrated the significant role of the implication of silver NPs to amplify Doum extract effect. Also, the finding has emphasised the antioxidant influence of Doum extract, asan antioxidant has an important role in reducing lipid peroxidation.The implication of silver NPs has enhanced the therapeutic effect of Doum extract on reducing MDA.However, the underlying mechanisms of action still uncovered, therefore, further investigation to fully understand the role of silver NPs and medicinal properties of Doum extract is required. This study suggest that the implication of nanotechnology in ART to treat infertile male has a significant impact effect on enhancing sperm quality and increase the chances for pregnancy.
Moreover, oxidative stress has serious effect on the integrity of sperm DNA. One of sperm DNA damage causes,is the presence of unbalanced ROS in semen plasm. Sperm DNA damage is the main cause to infertility, miscarriage and birth defects in the offspring30.
The data obtained by this study has showed significant therapeutic effect of Doum extract on improving and reducing sperm DNA fragmentation. Moreover, the
results showed there was significant higher therapeutic effect on improving and reducing in the percentage of DNA-fragmented spermatozoa when silver NPs was implicated with Doum extract. In fact, both treatment groups (Doum extract only group or Doum extract with NPs group) were significantly enhanced the percentage of DNA-fragmented spermatozoa when compared with non-treated group i.e. control group ***p = 0.0002, ****p <0.0001 respectively (Figure 3).Interestingly, the data of this study has showed for the first time the application of silver NPs with Doum extract have remarkable and significant influence on decreasingthe percentage of DNA-fragmented spermatozoa compared with group treated with Doum extract only **p= 0.0033 (Figure -3).Research has been reported that oxidative stress had a great role in the aetiology of this pathological condition. Based on this finding, the reduction in the percentage of DNA-fragmented spermatozoa may ascribed to the antioxidant activity of Doum extract. Many studies have suggested that the aqueous extract of Doum fruits had an antioxidant activity; this was attributed to the substantial amount of their flavone components. About five flavone glycosides were isolated and identified from Doum fruits these include: viz, luteolin 7-O-β-glucuronoide, apigenin 7-O-β-glucuronoide, luteolin O-β-glycoside, luteolin 7- O-rutinoside and chrysoeriol 7-O rutinoside22. Clearly, there is a need for future studies that could address the fundamental molecular basis of mechanisms of action of biological activities of Doum extract.
Conclusion
The study has demonstrated for the first time the application of nanotechnology for ART to enhance sperm quality has a beneficial impact.The study has proved that enhancing the levels of antioxidant defense mechanisms could improve sperm functionality. Actually, the study has showed that the antioxidant therapeutic activity of Doum extract has improved the level of SOD, reduced MDA and reduced the percentage of DNA-fragmented spermatozoa. It is worthy to mention that this antioxidant activity was significantly higher when silver NPs was implicated with Doum extract. Although, there is still need to understand the mechanisms of action that underlying the biological and therapeutically activities of Doum extract components but,clearly, the findings in this present study has provided an additional set of information and encourage the application of nanoparticles with ART to bridge the gap between traditional uses of medicinal herbs and nanotechnology.

Indian Journal of Public Health Research & Development, November 2019, Vol. 10, No. 11 1983
Figure 1: Silver NPs have significantly upgrade the antioxidant effect of Doum extract by elevating the level of SOD.
The level of SOD was measured using colorimetric assays. The differences between groups were tested for significance using Ordinary one-way ANOVA of One-way ANOVA with Sidak’s multiple comparisons test. Data shown as M±SEM. p values of <0.05 were considered significant. (Extr. Alone= group were treated Doum extract only and Extr. +NPs = group were treated with Doum extract with silver NPs).
Figure 2: Silver NPs have significantly upgrade the antioxidant effect of Doum extract by reducing the level of MDA.
The concentration of MDA was measured using colorimetric assays. The differences between groups were tested for significance using Ordinary one-way ANOVA of One-way ANOVA with Sidak’s multiple comparisons test. Data shown as M±SEM. p values of <0.05 were considered significant. (Extr. Alone= group were treated Doum extract only and Extr. +NPs =group were treated with Doum extract with silver NPs).
Figure 3: Silver NPs have significantly enhanced the effect of Doum extract on improving DNA fragmentation index.
The percentage of sperm DNA fragmentation was reduced when sperms were treated with Doum extract either with or without silver NPs. The differences between groups were tested for significance using Ordinary one-way ANOVA of One-way ANOVA with Sidak’s multiple comparisons test. Data shown as M±SEM. p values of <0.05 were considered significant. (Extr. Alone= group were treated Doum extract only and Extr. +NPs =group were treated with Doum extract with silver NPs).
Conflict of Interest: No
Source of Findings: Self
Ethical Clearance: No
References
1. Huang C, Cao X, Pang D, et al. Is male infertility associated with increased oxidative stress in seminal plasma? A-meta analysis. Oncotarget. 2018; 9: 24494-513.
2. Fletcher R. Listing of useful plants of the world. Australian New Crops. 1997.
3. El-Beltagi HS, Mohamed HI, Yousef HN and Fawzi EM. Biological Activities of the Doum Palm (Hyphaene thebaica L.) Extract and Its Bioactive Components. Antioxidants in Foods and Its Applications. IntechOpen, 2018.
4. Bayad AE. Influences of doum fruit Hyphaene thebaica extract on the reproductive parameters, blood picture, lipid profile and hepato-renal functions in rats. MRJMMS. 2016; 4: 384-91.
5. Remião MH, Segatto NV, Pohlmann A, Guterres SS, Seixas FK and Collares T. The Potential of Nanotechnology in Medically Assisted
SOD concentration U/mg
Control Extr.aloneExtr. + NPs
Control Extr.aloneExtr. + NPs
MDA concentration nmol/ml
DNA fragmentation %
Control Extr.aloneExtr. + NPs

1984 Indian Journal of Public Health Research & Development, November 2019, Vol. 10, No. 11
Reproduction. Frontiers in Pharmacology. 2018; 8.
6. Langbeen A, Bartholomeus E, Leroy JL and Bols PE. Bovine in vitro reproduction models can contribute to the development of (female) fertility preservation strategies. Theriogenology. 2015; 84: 477-89.
7. Barkalina N, Jones C and Coward K. Nanomedicine and mammalian sperm: Lessons from the porcine model. Theriogenology. 2016; 85: 74-82.
8. Sondi I and Salopek-Sondi B. Silver nanoparticles as antimicrobial agent: a case study on E. coli as a model for Gram-negative bacteria. Journal of colloid and interface science. 2004; 275: 177-82.
9. Li WR, Xie XB, Shi QS, Zeng HY, Ou-Yang YS and Chen YB. Antibacterial activity and mechanism of silver nanoparticles on Escherichia coli. Applied microbiology and biotechnology. 2010; 85: 1115-22.
10. Zhang X-F, Liu Z-G, Shen W and Gurunathan S. Silver Nanoparticles: Synthesis, Characterization, Properties, Applications, and Therapeutic Approaches. International journal of molecular sciences. 2016; 17: 1534.
11. Mohamed, A. A, Khalil, A. A, El-Beltagi and S. HE. Antioxidant and antimicrobial properties of kaff maryam (Anastatica hierochuntica) and doum palm (Hyphaene thebaica). Grasas y Aceites. 2010.
12. Tejada RI, Mitchell JC, Norman A, Marik JJ and Friedman S. A test for the practical evaluation of male fertility by acridine orange (AO) fluorescence. Fertility and sterility. 1984; 42: 87-91.
13. Zegers-Hochschild F, Adamson GD, Dyer S, et al. The International Glossary on Infertility and Fertility Care, 2017. Fertility and sterility. 2017; 108: 393-406.
14. Falchi L, Khalil WA, Hassan M and Marei WFA. Perspectives of nanotechnology in male fertility and sperm function. International Journal of Veterinary Science and Medicine. 2018; 6: 265-9.
15. Zini A, Garrels K and Phang D. Antioxidant activity in the semen of fertile and infertile men. Urology. 2000; 55: 922-6.
16. Agarwal A, Nallella KP, Allamaneni SS and Said TM. Role of antioxidants in treatment of male infertility: an overview of the literature. Reproductive biomedicine online. 2004; 8: 616-27.
17. Agarwal A, Prabakaran S and Allamaneni S. What an andrologist/urologist should know about free radicals and why. Urology. 2006; 67: 2-8.
18. Lopes S, Jurisicova A, Sun JG and Casper RF. Reactive oxygen species: potential cause for DNA fragmentation in human spermatozoa. Hum Reprod. 1998; 13: 896-900.
19. Agarwal A, Saleh RA and Bedaiwy MA. Role of reactive oxygen species in the pathophysiology of human reproduction. Fertility and sterility. 2003; 79: 829-43.
20. Kao SH, Chao HT, Chen HW, Hwang TI, Liao TL and Wei YH. Increase of oxidative stress in human sperm with lower motility. Fertility and sterility. 2008; 89: 1183-90.
21. Mostafa T, Rashed LA, Osman I and Marawan M. Seminal plasma oxytocin and oxidative stress levels in infertile men with varicocele. Andrologia. 2015; 47: 209-13.
22. Eldahshan OA, Ayoub NA, Singab A-NB and Al-Azizi MM. Potential Superoxide Anion Radical Scavenging Activity of Doum Palm (Hyphaene thebaica L.) Leaves Extract. Records of Natural Products. 2008; 2.
23. Aboshora W, Lianfu Z, Dahir M, et al. Effect of extraction method and solvent power on polyphenol and flavonoid levels in Hyphaene thebaica L mart (Arecaceae)(Doum) fruit, and its antioxidant and antibacterial activities. Tropical Journal of Pharmaceutical Research. 2014; 13: 2057-63.
24. Cao G, Sofic E and Prior RL. Antioxidant and prooxidant behavior of flavonoids: structure-activity relationships. Free Radical Biology and Medicine. 1997; 22: 749-60.
25. Heim KE, Tagliaferro AR and Bobilya DJ. Flavonoid antioxidants: chemistry, metabolism and structure-activity relationships. The Journal of nutritional biochemistry. 2002; 13: 572-84.
26. Pandey A, Mishra A and Mishra A. Antifungal and antioxidative potential of oil and extracts derived

Indian Journal of Public Health Research & Development, November 2019, Vol. 10, No. 11 1985
from leaves of Indian spice plant Cinnamomum tamala. Cellular and Molecular Biology. 2012; 58: 142-7.
27. Esfandiari N, Sharma RK, Saleh RA, Thomas AJ, Jr. and Agarwal A. Utility of the nitroblue tetrazolium reduction test for assessment of reactive oxygen species production by seminal leukocytes and spermatozoa. J Androl. 2003; 24: 862-70.
28. Sanocka D and Kurpisz M. Reactive oxygen species and sperm cells. Reproductive biology
and endocrinology : RB&E. 2004; 2: 12.
29. Maneesh M and Jayalekshmi H. Role of reactive oxygen species and antioxidants on pathophysiology of male reproduction. Indian journal of clinical biochemistry : IJCB. 2006; 21: 80-9.
30. Aitken RJ, De Iuliis GN and McLachlan RI. Biological and clinical significance of DNA damage in the male germ line. International journal of andrology. 2009; 32: 46-56.

Musculoskeletal Hand Manifestations in Patients with Diabetes Mellitus
Yahya Abdel Aziz Mohammed1, Abbas Hamza Zainel2, Sundus Awni Wahab3
1 M.B.Ch.B.-H.D.R.MR. Kirkuk Genenal Hospital, Kirkuk health directorate, Kirkuk City, Iraq, 2,3 M.B.Ch.B.-H.D.R.MR. Azadi Teaching Hospital, Kirkuk health directorate, Kirkuk City, Iraq
Abstract
A random sample of 505 patients with DM, evaluated in a discriptive study for the evidence of MSK hand manifestations of DM, they were collected attending diabetic centre, in Sulaimani city, from Novembor 2008 to February 2009 . All the patients were interviewed by using questionnaire forms . Comprehensive history, clinical examination, radiological, and laboratory studies performed to role out other causes of musculoskeletal hand manifestations . Chi- square and ANOVA procedure have used for management of statistical data. One hundred ninety six diabetic patients had MSK hand manifestations represents (39.52%), with nearly equal male and female involvement, majority of the patients with DM (84.2%) were type 2, while most of patients with hand manifestations (47.7%) were type 1 DM, (50.3%) of them had DM for less than 5 years, most of them (71.9%) use OHD for treatment of diabetes, and ( 51.1%) of them had uncontrolled glycemic control status. The relation of hand manifestations with gender, duration, type of treatment, and glycemic control status of DM was statistically significant (P value < 0.05) . Our patients got different hand manifestations with significant association with gender, duration, type of treatment and glycemic control status of DM . Majority of the patients with MSK hand manifestations had type 1 DM . MSK hand manifestations were more in patients with uncontrolled blood glucose, with almost equal male and female involvement .
Key words: Musculoskeletal hand; Diabetes mellitus; T2DM; MSK
Introduction
Diabetes mellitus (DM) is a syndrome with disordered metabolism and inappropriate hyperglycemia due to either a deficiency of insulin secretion or to a combination of insulin resistance and inadequate insulin secretion to compensate. Diabetes mellitus is classified on the basis of the pathogenic process that leads to hyperglycemia, as opposed to earlier criteria such as age of onset or type of therapy (1-3). The two broad categories of DM are designated type 1 and type 2. Both types of diabetes are preceded by a phase of abnormal glucose homeostasis as the pathogenic processes progresses. Type 1 diabetes is the result of complete or near-total insulin deficiency(4-6). Type 2 DM is a heterogeneous group of disorders characterized by variable degrees of insulin resistance, impaired insulin secretion, and increased glucose production(8-11). Diabetes mellitus is associated with a wide variety of musculoskeletal problems, some of which are unique to the disease (7)
including Syndromes of limited joint mobility (Diabetic hand syndrome, Adhesive capsulitis, Trigger finger, Dupuytren’s contractures), Osteoporosis, Diffuse idiopathic skeletal hyperostosis, Neuropathies ( Charcot joints, diabetic osteoarthropathy (12-14), Carpal tunnel syndrome, Diabetic amyotrophy, Reflex sympathetic dystrophy,Various other neuropathies), and Diabetic muscle infarction (15-17) . As early as 1957, it was noticed that many people with diabetes complained of stiffness in the hands or stiff joints. This was eventually called limited joint mobility (LJM)(18) . LJM is also known as diabetic cheiroarthopathy (after the Greek word “cheiros” for hand)(19) or diabetic stiff hand syndrome(14,15) . In Dupuytren’s contracture, a thickening and shortening of the palmar fascia occurs(20-23). The aim of the current study was to find out the prevalence of MSK hand manifestations of DM to make early diagnosis, and to identify its relation with type, duration, and type of treatment of DM.

Indian Journal of Public Health Research & Development, November 2019, Vol. 10, No. 11 1987
Materials and Method
Five hundred and five patients with DM were evaluated in this descriptive study The patients recruited consecutively with clinical diagnosis of DM by consultant physicians . They were attending diabetic centre in Sulaimani city, in a period of 4 months from Novembor 2008 to February 2009 .
Patients were interviewed, history taken, examination done for each case by using special questionnaire forms, patients with MSK hand manifestation sent to laboratory tested for (erythrocyte sedimentation rate, C reactive protein, rheumatoid factor, general urine examination, renal function test, liver function test) and conventional radiograph of hands to role out other causes of hand manifestations. The control status of DM assessed according to International Diabetes Federation (IDF)-2005 guidelines which considers that the patient is strictly glycemic controlled if HbA1c is < 6.5% or fasting blood sugar < 110 mg/dl or random blood sugar < 145 mg/dl (glycosylated hemoglobin HbA1c was not available, so we depend on fasting or random blood sugar).
Statistical analysis
Statistical package for social science (spss) program version 15 was used for statistical analysis, the frequency distributions were obtained, after the grouping of data to different variables.
Findings
The sample enrolled 505 patients with DM diagnosed by consultant physician, 175 (34.65%) patients were males and 330 (65.35%) were females (Figure 1), patient’s ages ranged from 13 to 82 years with mean of ages 52.21 years and standard deviation 12.02 (Table 1) .
Figure 1: Sex distribution of DM
34.65%
65.35%Perc
ent
70.0
60.0
50.0
40.0
30.0
20.0
10.0
GenderMale
0.0Female
Table 1: mean age of diabetic patients
Variables Minimum Maximum Mean Std. Deviation
Age (Years) 13 82 52.21 12.02
Majority of diabetic patients was type 2, 452 (84.2%) . 363 (71.9%) of them were on oral hypoglycemic drugs and the others were on insulin, mixed therapy, or diet alone . About half of the patients 254 (50.3%) had diabetes mellitus (DM) for less than 5 years . According to the glycemic control status 247 (49.9%) were controlled while 258 (51.1%) were not . The family history of DM were almost equal, 243 (48.1%) had positive family history of DM, and 262 (51.9%) had negative history (Table 2) .
Table 2: Type, duration, treatment, control status, and family history of DM
Variables Frequencies Percentages
Type of DMType 1Type 2
80425
15.884.2
Duration of DMLess than 5 years6-10 years11-15 years16-20 yearsMore than 20 years
254118593836
50.323.411.77.57.1
Treatment of DMDietOral hypoglycemic drugsInsulinMixed
233637940
4.671.915.67.9
DM control statusUncontrolledControlled
258247
51.148.9
Family history of DMNegativePositive
262243
51.948.1

1988 Indian Journal of Public Health Research & Development, November 2019, Vol. 10, No. 11
The MSK hand manifestations of DM are summarized in (Figure 4-2) which shows that 196 (39.52%) patients had MSK manifestations in the hand which were cheiroarthropathy, flexor tenosynovitis, Dupuytren’s contracture, and CTS { 69 (13.91%), 48 (9.68%), 42 (8.47%), 37 (7.46%) } consecutively, while 309 (60.48%) patients had no MSK hand complications .
Figure 2: MSK hand manifestations of DM
In Table 3, we found a positive relation between MSK hand manifestations and duration of DM which is statistically highly significant (P value = 0.000), with a mean of (2.222 ± 1.304) showing that frequency of hand complications increase with duration of DM, while there is no relation with age (P value = 0.119) .
Table 3: Relation of MSK hand manifestations with age and duration of DM
Hand complains
Age Duration of DM
Mean+ S.D P value Mean+ S.D P
value
No hand compliants
Limited joint mobility
Carpal tunnel syndrome
Flexor tenosynovitisDupuytrens contracture
51.46±12.0153.25±12.5449.76±10.8853.44±11.4555.76±12.73
0.119
1.74±1.102.04±1.292.16±1.402.50±1.292.67±1.44
0.000
Discussion
Diabetes mellitus (DM) is associated with a wide variety of musculoskeletal (MSK) problems, some of which are unique to the disease . The nomenclature of these conditions can be confusing, with some having more than one name in the medical literature. Out of 505 patients we found 196 (39.52%) had one or more types
8.47%9.68%
7.46%
13.91%60.48%
Dupuytrens contractureFlexor tenosynovitisCarpal tunnel syndromeLimitted joint mobilityNo hand compliantsHand complains
of MSK hand manifestations including (LJM in 13.91%, flexor tenosynovitis in 9.68%, Dupuytren’s contracture in 8.47%, and CTS in 7.46%). This result is comparable to that of Sanjeeb et al (28) who recorded the LJM to be the most common MSK hand manifestations followed by flexor tenosynovitis, then Dupuytren’s contracture, and lastly CTS . Sanjeeb et al mentioned the frequency for each hand manifestation but didn’t mention the frequency of total number of MSK hand manifestations in his patients . In the other hand in a study done in Greece by Kim et al (29) found the prevalence of MSK hand manifestations as high as (82.6%) which is higher than ours.
In a recent study done in USA, Rachel P.K. et al.(11) claiming prevalence of LJM among diabetic patients to be (8 - 50%) which is very wide range, while in a study done by Grgic et al (30) the prevalence of LJM was (28.4%) . Triasman HS. et al.(31) reported the prevalence of LJM as (8.4%), while Das et al (32) reported it as high as (30-40%) . In Ardic et al (33) which is a study done in Turkey, found that non of his patients had LJM and this might be due to short duration of DM in patients he chose . The prevalence of flexor tenosynovitis in our study (9.68%) is lower than that of Mackenzie et al (34) in which the prevalence was (11-63%), and higher than that of Ardic F.et al.(33) who shows that (3.8%) of diabetic patients had flexor tenosynovitis . Rachel et al.(11), and Kozak et al (35) reported the frequency of Dupuytren’s contracture continuant to be (16-42%) and (12-32%) consecutively, this figure having a wide range and higher than ours . Regarding the prevalence of CTS, it was (20%) in a study done by Rachel et al (11) which is higher than ours (7.46%), while it is only (1.3%) in that of Ardic et al (33) . The difference in the prevalence of MSK hand manifestations of DM may be belongs to the difference in the duration, type, and glycemic control status of DM between the patients included in each study . We found the relation of MSK hand manifestations with duration of DM is highly significant and shows that MSK hand manifestations increase with duration of DM and this is consistant with the results of Petrulewicz-Salamon et al (36), Enrico Cagliero et al (37), Aydeniz et al (38), Sanjeeb et al (28), Starkman et al (39), Rachel et al (11), and Yosipovitch (40) who all reported the MSK hand manifestations to be increased with duration of DM . Regarding gender the occurrence of MSK hand complications were had almost equal males and females with a significant statistical level in our

Indian Journal of Public Health Research & Development, November 2019, Vol. 10, No. 11 1989
study, while other authors like Enrico Cagliero et al.(37) in a study done in USA recorded higher prevalence of hand complications in their female patients . A number of author looked at relation between type of DM and MSK hand complications . Douloumpakas et al (41) found that MSK hand complications is more in type 1 DM, while Petrulewicz-Salamon et al (36) found that it is more in type 2 DM, while in ours the relation of type of DM and MSK hand complications did not reach a significant level. Starkman et al (39) recorded that hand complications were more common among diabetic patients on insulin therapy. Glycemic control is being the key treatment of DM, according to our results there is a significant relation between MSK hand manifestations and glycemic control status (P value = 0.027) and shows that MSK hand manifestations were more common in patients with uncontrolled glycemic status .This result is comparable with that of Petrulewicz-Salamon I. et al.(36), a study done in turkey by Aydeniz et al (38), and a study done in India by Sanjeeb et al (28), while it is differ from that of Enrico Cagliero et al (37) which shows that there is no relation between glycemic state and hand manifestations .
Conclusion
Our patients got different hand manifestations with significant association with gender, duration, type of treatment and glycemic control status of DM . MSK hand manifestations were more in patients with uncontrolled blood glucose, with almost equal male and female involvement .
Conflict of Interest: non
Source of Findings: self findings.
Ethical Clearance: This research was carried out with the help of my colleagues mentioned with me. The oral and paper approval of the patients in this study, which included the withdrawal of blood samples from them and laboratory tests.
References
1. Tierney LM, McPhee SJ, Papadakis MA. Current medical diagnosis & treatment.
2. Kasper DL, Fauci AS, Hauser SL, Longo DL, Jameson JL, Loscalzo J. Harrison’s principles of internal medicine. McGraw Hill Education,; 2015.
3. Marton GE, McCullough B, Ramnanan CJ. A review of teaching skills development programmes for medical students. Medical Education. 2015 Feb;49(2):149-60.
4. Lespasio MJ, Piuzzi NS, Husni ME, Muschler GF, Guarino AJ, Mont MA. Knee osteoarthritis: a primer. The Permanente Journal. 2017;21.
5. Salah S, Rekik M, Youssef IB, Boudokhane S, Migaou H, Jellad A, Frih ZB. Musculoskeletal disorders in diabetes mellitus patients in a Physical Medicine and Rehabilitation department. Annals of physical and rehabilitation medicine. 2016 Sep 1;59:e115-6.
6. Louati K, Vidal C, Berenbaum F, Sellam J. Association between diabetes mellitus and osteoarthritis: systematic literature review and meta-analysis. RMD open. 2015 Jun 1;1(1):e000077.
7. Ceceli E, Gümrük S, Kocaoğlu S, Ayhan F. AB0846 Does diabetes Mellitus Cause Problems in Hand Functions and Quality of Life?.
8. Bhat TA, Dhar SA, Dar TA, Naikoo MA, Naqqash MA, Bhat A, Butt MF. The musculoskeletal manifestations of type 2 diabetes mellitus in a Kashmiri population. International journal of health sciences. 2016 Jan;10(1):57.
9. Ahmed AS. Does diabetes mellitus affect tendon healing?. InMetabolic Influences on Risk for Tendon Disorders 2016 (pp. 179-184). Springer, Cham.
10. Zheng Y, Shu B, Fu J, Kafanas A, Veves A. Structural and Functional Changes in Skin of the Diabetic Foot. InThe Diabetic Foot 2018 (pp. 189-198). Humana Press, Cham.
11. Rwegerera GM, Moshomo T, Gaenamong M, Oyewo TA, Gollakota S, Rivera YP, Masaka A, Godman B, Shimwela M, Habte D. Health-related quality of life and associated factors among patients with diabetes mellitus in Botswana. Alexandria journal of medicine. 2018 Jun 1;54(2):111-8.
12. Ibrahim AM. Diabetic Foot Ulcer: Synopsis of the Epidemiology and Pathophysiology. International Journal of Diabetes and Endocrinology. 2018 Jun 28;3(2):23.
13. Lam K, Leung MF, Kwan CW, Kwan J. Severe
1990 Indian Journal of Public Health Research & Development, November 2019, Vol. 10, No. 11
Spastic Contractures and Diabetes Mellitus Independently Predict Subsequent Minimal Trauma Fractures Among Long-Term Care Residents. Journal of the American Medical Directors Association. 2016 Nov 1;17(11):1025-30.
14. Yamagishi SI. Diabetes and Advanced Glycation End Products. In: Diabetes and Aging-related Complications 2018 (pp. 201-212). Springer, Singapore.
15. Yamagishi SI. Mechanism for the development of bone disease in diabetes: increased oxidative stress and advanced glycation end products. InMusculoskeletal Disease Associated with Diabetes Mellitus 2016 (pp. 63-79). Springer, Tokyo.
16. Ozen G, Pedro S, Holmqvist ME, Avery M, Wolfe F, Michaud K. Risk of diabetes mellitus associated with disease-modifying antirheumatic drugs and statins in rheumatoid arthritis. Annals of the rheumatic diseases. 2017 May 1;76(5):848-54.
17. Rees J, Gaida JE, Silbernagel KG, Zwerver J, Anthony JS, Scott A. Rehabilitation of tendon problems in patients with diabetes mellitus. InMetabolic Influences on Risk for Tendon Disorders 2016 (pp. 199-208). Springer, Cham.
18. Goto H. Various Kinds of Bone Disease in Diabetes: Rheumatic Conditions. InMusculoskeletal Disease Associated with Diabetes Mellitus 2016 (pp. 11-25). Springer Japan.
19. Neki NS, Singh R, Aloona S, Singh B, Walia SS, Dhanju AS. Rheumatological Manifestations of Diabetes Mellitus─ An Update. Journal of Enam Medical College. 2018 May 30;8(2):94-100.
20. Wamisho BL, Feleke Y. Epidemiology and clinical profile of common musculoskeletal diseases in patients with diabetes mellitus at Tikur Anbessa Specialized Hospital in Addis Ababa, Ethiopia. East and Central African Journal of Surgery. 2017;22(2):49-62.
21. Chen LH, Li CY, Kuo LC, Wang LY, Kuo KN, Jou IM, Hou WH. Risk of hand syndromes in patients with diabetes mellitus: a population-based cohort study in Taiwan. Medicine. 2015 Oct;94(41).
22. Fatemi A, Iraj B, Barzanian J, Maracy M, Smiley
A. Musculoskeletal manifestations in diabetic versus prediabetic patients. International journal of rheumatic diseases. 2015 Sep;18(7):791-9.
23. Burge P, Hoy G, Regan P, Milne R. Smoking, alcohol and the risk of Dupuytren’s contracture. The Journal of bone and joint surgery. British volume. 1997 Mar;79(2):206-10.
24. Frey M. Risks and prevention of Dupuytren’s contracture. The Lancet. 1997 Nov 29;350(9091):1568.
25. Leslie BM. Palmar fasciitis and polyarthritis associated with a malignant neoplasm: a paraneoplastic syndrome. Orthopedics. 1992 Dec 1;15(12):1436-9.
26. L.L.Smith, S.P.Burnet, J.D.McNeil Musculoskeletal manifestations of diabetes mellitus . Br J Sports Med 2003;37:30-35.
27. Gordon LA, Morrison EY, McGrowder DA, Young R, Fraser YT, Zamora EM, Alexander-Lindo RL, Irving RR. Effect of exercise therapy on lipid profile and oxidative stress indicators in patients with type 2 diabetes. BMC complementary and alternative medicine. 2008 Dec;8(1):21.
28. Serban AL, Udrea GF. Rheumatic manifestations in diabetic patients. Journal of medicine and life. 2012 Sep 15;5(3):252.Kim RP. The musculoskeletal complications of diabetes. 2002 Feb;2(1):49-52 .
29. Grgic A,Rosenbloom AL, Weber FT, et al. Joint contracture- common manifestation of childhood diabetes mellitus. J Pediatr 1976; 88 :584-94.
30. Triasman HS, Triasman ES, Marr TJ, et al. Joint contractures in patients with juvenile diabetes and their siblings. Diabetes Care 1978;1:360-1.
31. Das TK. Cheiroparthropathy: a chronic complication of diabetes mellitus. Rheumatology in Practice 1988; 6 :11-2.
32. Ardic F. Soyupek Y. Kahraman R. Yorgancıoglu . The musculoskeletal complications seen in type II diabetics: predominance of hand involvement. Clin Rheumatol (2003) 22: 229–233.
33. Mackenzie AH, Final diagnosis in 63 presenting with multiple palmar flexor tenosynovitis. Arthritis

Indian Journal of Public Health Research & Development, November 2019, Vol. 10, No. 11 1991
Rheum 1975; 18:415 .
34. Kozak GP, Krall LP. Disorders of skin in diabetes. In Joslin’s Diabetes Mellitus. Marble A. Krall LP,Bradley RF,Christileb AR, Soeldner JS(eds). Lea and Febiger, Philadelphia 1985, 769-83.
35. Petrulewicz-Salamon I. The influence of diabetes mellitus on joint mobility. Ortop Traumatol Rehabil. 2006 Oct 31;8(5):555-65.
36. Enrico Cagliero MD, William Apruzze, Gray S.Perlmutter MD, David M. Nathan MD. Musculoskeletal disorders of the hand and shoulder in patients with diabetes mellitus. 10 April 2002.
37. Aydeniz A, Gursoy S, Guney E. Which musculoskeletal complications are most frequently
seen in type 2 diabetes mellitus? J Int Med Res. 2008 May-Jun;36(3):505-11
38. Starkman HS, Gleason RE, Rand LI, Miller DE, Soeldner JS. Limited joint mobility (LJM) of the hand in patients with diabetes mellitus: relation to chronic complications. Annals of the rheumatic diseases. 1986 Feb 1;45(2):130-5.
39. Yosipovitch G, Mukamel M, Karp M. Diabetic hand syndrome in juvenile diabetics . Harefuah. 1990 Aug;119(3-4):63-6.
40. Douloumpakas I, Pyrpasopoulou A, Triantafyllou A, Sampanis Ch, Aslanidis S. Prevalence of musculoskeletal disorders in patients with type 2 diabetes mellitus. H21IP6POKRATIA 2007, 11, 4: 216-218.

Correlation Study between H.pylori Bacteria Qnd Biochemical Tests In Type 2 Of Iraqi Diabetic Patients
Mohammed Flayyih Tareef1, Abdulrazzaq Neamah Zghair1, Nihad Khalawe Tektook1 1Middle Technical University / College of Medical & Health Technology, Medical laboratory
Techniques Dep. Iraq
Abstract
Background/Aims: many important pathogenic bacteria as Helicobacter pylori (H. pylori) can infect diabetic patients and causing inflammation, therefore aimed of the current study was study the Correlated between a demographic characteristic and biochemical tests of H.pylori in type 2 of Iraqi diabetic patients. Materials and Methods: study was carried out on diabetic patients infected or non-infected with H. pylori, during period (February-July)2017,in specialized centre for endocrinology and diabetes, study group ( Patients ) , collected information from all patients by pretested questionnaires , biochemistry testes were done by enzymatic methods. Results: Out of the 185 patients of type 2 diabetes, H. pylori infection was found higher prevalence of H. Pylori infection in diabetics (38.4%) as compared to non diabetic patients (59.4%), as well as significant increase FBG(228 ± 27.9) ; HbAlc(8.1± 1.2 ) ; S.Creatinine(1.3 ± 0.4 ); Cholesterol(303.7± 9.8 ), HDL(40.6± 33.2 ) and LDL (146.4± 26 ) levels in H. pylori seropositive diabetic patients whilst increased level of WBCs (7.1±2.3); HB(13. 23± 0.9 ); S.Albumin(5.3 ± 0.1 ) and triglycerides (164.9 ± 17.4 ) in H. pylori seropositive non-diabetic patients. Conclusion :higher prevalence of H. Pylori infection in diabetics more than no diabetic patients , also high rate of H. pylori infection among age group (35-45) years , and significant increase FBG; HbAlc; S.Creatinine ; Cholesterol, HDL and LDL levels in H. pylori seropositive whilst increased level of WBCs ; Hb; Albumin and triglycerides in H. pylori seropositive non-diabetic patients.
Keywords: H. pylori (Helicobacter pylori);biochemical tests ; type 2 diabetic patients.
Introduction
Helicobacter pylori are considered as worldwide public health problems which more prevalent in the developing countries, mainly acquired in childhood by the oral-oral; fecal-oral; or gastro-oral route (1) .so Helicobacter pylori (H. pylori)- induced gastritis could potentially affect the secretion of important hormones such as ghrelin; leptin ; somatostatin ; gastrin, and somatostatin, that could affect insulin sensitivity and glucose homeostasis, also, other mechanisms may be involved in the possible causative correlated between infected of H. pylori and T2DM(2).
In worldwide, About 3.8 million deaths patients have type 2 diabetes mellitus (3) as well as many previous showed high correlated between H. pylori infection and T2DM(4) .Many important factors are important in the development of H. pylori-associated gastroduodenal
diseases, such as host factor ( as sex; age as well as genetic susceptibility); virulence antigens and environment-related factors(5).
Materials and Method
The study was carried from ( February 201– July) 2018, in specialized centre for Endocrinology and diabetes , Collected 5 ml of blood from diabetic patients infected or non-infected H. pylori and for clotting , left at room temperature for (1) hour , the centrifuged at 3000 rpm for 10 minutes and serum was at – 20C until the used.
Biochemical test : the biochemistry testes were done in morning after fasting overnight (12hours), collected venous blood sample for testing : fasting blood sugar (FBS) level ; glycosylated haemoglobin (HbAlc); Total cholesterol ; HDL (high-density lipoprotein

Indian Journal of Public Health Research & Development, November 2019, Vol. 10, No. 11 1993
cholesterol; Triglyceride; serum creatinine and FBG measured for both study and control group by routine enzymatic methods , used the diagnostic kit ( Biolabo SA.;France ), All testing were done in the laboratory of specialized center for Endocrinology and diabetes in Baghdad. Diagnosis of H.Pylori by used ELISA (IgG, EIA , Trinity Biotech , U.S.A).
data analysis:
Values were expressed as mean ±SD, differences between the mean values were analyzed by chi- square test ,the criterion for significance was (p≤ 0.05) .
Finding :
In table 1 appearance prevalence of H.pylori infections in diabetic patients were (15.6%) in the age group( 35 45) years;(10.2%) in ( 25 – 35 ) years whilst in control group ( non- diabetic patients) was 13% and 21.7 %, respectively which was founded significant (P = 0.5), and showed high percentage in age group ( ≥ 45) years , so in this table the gender high distribution in
male ( 24.4 , 20.5 )% in both groups ( diabetic patients and healthy) compare to female ( 14, 14.7) % with and without diabetes mellitus .
Table (1): distribution of diabetic patients and Control Group(healthy) according to H.pylori infected .
Type Groups
H.pylori Total (No.,%)
( + ) ( - )
No. % No. %
Study Group(diabetic patients)
35 57 92
Control Group 50 34 84
The present study found higher prevalence of H. Pylori infection in diabetics (38.4%) as compared to nondiabetic (59.4%) .
Table (2): Corelationshipe between biochemical test and H.pylori in diabetic and non- diabetic patients .
Biochemical test
Study group( diabetic patients No.= 185)
Control group (healthy voluntary No.= 185)
Normal value( mg/ dl)H.pylori H.pylori
(+) (-) (+) (-)
F.B.G 228 ± 27.9 203.4 ± 22 95.0 ± 12.11 89.9± 12.3 60 -110
W.B.Cs 6.9 ± 1.5 6.5 ± 1.4 7.1±2.3 6.9 ±2.1 4.0 – 11.0
Hb 10.2± 0.7 10.6 ± 0.8 13. 23± 0.9 12.50± 0.12
HbAlc 8.1± 1.2 7.9 ± 0.7 4.96±0.43 4.1±0.43 3.0 – 6.0
S. Albumin 4.5 ± 0.5 4.2± 0.5 5.3 ± 0.1 4.3 ± 0.5 3.5 – 5.3
S. Creatinine 1.3 ± 0.4 0.9 ± 0.3 0.50 ± 0.08 0.61 ± 0.05 0.2 - 1.2
S.Triglycerides 151.9± 3.9 106.7± 13.2 164.9 ± 17.4 130.4± 3.2 < 150
Cholesterol 303.7± 9.8 236.1± 16.5 201.3 ± 5.2 209.7± 5.5 130- 200
HDL 40.6± 33.2 41 ± 18.8 42.9 ± 3.2 40.5 ± 3.0< 40 male < 50 female
LDL 146.4± 26 134.2± 16.8 133.5 ± 20.3 135.6±21.0 < 100

1994 Indian Journal of Public Health Research & Development, November 2019, Vol. 10, No. 11
The ( mean values± S.D ) of FBG ; WBCs ; HB ; HbAlc ; S.Albumin ; S.Creatinine ; triglycerides ; Cholesterol, HDL and LDL for diabetic patients type2 infected with H. pylori(+) and non infected(-) compare to control were illustrated in table(2).
The present results showed significant increase FBG(228 ± 27.9) ; HbAlc(8.1± 1.2 ) ; S.creatinine(1.3 ± 0.4 ); Cholesterol(303.7± 9.8 ), HDL(40.6± 33.2 ) and LDL (146.4± 26 ) levels in H. pylori seropositive diabetic patients whilst increased level of WBCs (7.1±2.3); HB(13. 23± 0.9 ); S.Albumin(5.3 ± 0.1 ) and triglycerides (164.9 ± 17.4 ) in H. pylori seropositive non-diabetic patients.
Chen and Blaser showed that H.pylori play directly or indirectly in increases HBAlc levels in the adults(11), so Chen and Blaser ,2012 elucidate H. pylori regulates leptin and ghrelin, which play important role in energy homeostasis and metabolism(11), so several studies as (12,13) showed elevation or increased level of LDL in H. pylori infection, so (14) found in H. pylori-infected patients have higher serum cholesterol and lower HDL than in negative patients ,However regarding HDL, similar results were previously reported(15, 16, 17 ).
Aarabiet al., 2010 appearance in his study level of triglyceride level was higher in H. pylori infection than in negatives(12). However VolanenI et al.,2005found that serum triglyceride and HDL level can change during acute phase of bacterial infection(18).
Glycated haemoglobin (HbAlc) was correlated to glucose levels measurements obtaining that HbAlc could be used as an objective tool of glycemic control(19) other hands (7)elucidate increased levels of HbAlc associated with H. pylori infection in type 2 diabetes group(7) , As well as HbAlc in H. pylori infection among diabetics were greater than H. Pylori non diabetics(7) ,but (20) founded no correlated between H. pylori infection with HbAlc in men aged40-70 years with or without diabetes , Whilst (21) found that H. pylori eradication in type 1 diabetes does not affect glycemic control in patients as evidenced by HbAlc level and daily insulin requirement.
So Bajaj etal., 2014 study provides evidences that H. Pylori infection was associated with increase in LDL level and triglyceride but no effect on levels of both total cholesterol and HDL(7).
In healthy Korean adults was associated with
lipid profile as increase in LDL ; total cholesterol and triglyceride, but decrease in HDL(22) .
Dursen et al., found no significant in lipid profile in both H. pylori infected in diabetics and non- diabetics(23,24).
Conclusions
H.pylori infections are one of the risk factor may be considered in the evaluation of diabetic patients .
H.pylori infections were higher in diabetic patients compare to healthy controls.
Serum cholesterol, FBG; HbAlc; S. Creatinine ; Cholesterol, HDL and LDL were higher level in H. pylori-positive diabetic group as compared to negative diabetics.
incidence of bacteria in smokers, and who drinking the coffee; tea and water also source of water (natural or minerals ) in both groups (diabetic and non-diabetic), and highly prevalent in low income patients.
Acknowledgment: We acknowledge Dr. Ali Abd Alhusain in Middle Technical University / Collage of Medical &Health Technology, Baghdad, Iraq ,with membrane analysis technique ues for assistance.
Conflict of Interest :None
Source of Funding :Self
Ethical Clearance: All samples taken after the patients’ approval.
References
1. Malaty HM. Epidemiology of Helicobacter pylori infection. Best Pract Res Clin Gastroenterol.2007 ;21:205–214.
2. Cong He, Zhen Yang, and Nong-Hua Lu. Helicobacter pylori infection and diabetes: Is it a myth or fact?World J Gastroenterol, .2014.28; 20(16): 4607–4617.
3. Van Dieren S, Beulens JW, van der Schouw YT, Grobbee DE, Neal B. The global burden of diabetes and its complications: an emerging pandemic. Eur J Cardiovasc Prev Rehabil.;2010.17 Suppl 1:S3–S8.
4. So WY, Tong PC, Ko GT, Ma RC, Ozaki R, Kong AP. .Low plasma adiponectin level, white blood cell count and Helicobacter pylori titre independently predict abnormal pancreatic beta-cell function. Diabetes Res Clin Pract.2009 ;86:89–95.

Indian Journal of Public Health Research & Development, November 2019, Vol. 10, No. 11 1995
5. Atherton JC. The pathogenesis of Helicobacter pylori-induced gastro-duodenal disAtherton JC.Ann Rev Pathol. 2006. 1: 63–96.
6. Hussen ,B.M.; Saleem S. Qader,S.S.; Ahmed,H.F. and Ahmed,S.H. The Prevalence of Helicobacter pylori among University Students in Iraq. Indian Journal of Science and Technology.2013.Vol 6 (8) : 519-23.
7. Bajaj, S. ; Rekwal, L; S.P. Misra ; Misra2, V.; Yadav,R.K. and Srivastava ,A. Association of helicobacter pylori infection with type 2 diabetes. Indian Journal of Endocrinology and Metabolism .2014. 18 , 5: 694 - 699.
8. Begue RE, Mirza A, Compton T, Gomez R, Vargas A. Helicobacter pylori infection and insulin requirement among children with type 1 diabetes mellitus. Pediatrics.1999.103:e83.
9. Goodman K J, and Correa P . The transmission of Helicobacter pylori, a critical review of the evidence, International Journal of Epidemiology.1995. 24(5), 875–887.
10. Nugalieva Z, Malaty H et al. Helicobacter pylori infections in Kazakhstan: effect of water source and household hygiene, The American Journal of Tropical Medicine and Hygiene, 2002.vol 67(2), 201–206.
11. Chen Y. and Blaser M.J. Association between gastric Helicobacter pylori colonization and glycatedhemoglobin levels. J Infect Dis.,2012.205(8):1183-1185.
12. Aarabi M H, Alvani S and Ehteram H. Lipid Profile in Subjects with Helicobacter pylori infection. Iranian Journal of Pathology .2010.5 (4), 199 – 203.
13. Viswanath V, Padmaraj S R, Roy D, Jayapal V and Vijayakumar T. Biochemical and immunological studies in cardiovascular Disease patients with Helicobacter pylori infection .Inter. Jour.of Scientific & Engineering Research.2013. 4(5): 1492-1501.
14. Candelli M, Rigante D, Marietti G, Nista EC, Crea F, BartolozziF. Helicobacter pylori, gastrointestinal symptoms, and metabolic control in young type 1 diabetes mellitus patients. Pediatrics.2003.111:800‑3.
15. Aarabi M H, Alvani S and Ehteram H.Lipid Profile in Subjects with Helicobacter pylori infection. Iranian Journal of Pathology .2010.5 (4), 199 – 203.
16. Tanriverd Ö. Association of Helicobacter pylori infection with micro albumin urea in type 2 diabetic patients. Turk J Gastroentestinal.2011. 22(6): 569-574.
17. Ugwu N C, Ugwuja E I, Ejikeme B N, Obeka N C. Helicobacter pylori seropositivity in Nigerians with type 2 diabetes mellitus. The Internet Journal of Tropical Medicine.2016.,4(2):32–6.
18. Tektook ,N. K .Investigation of some genesresponsi blefor Biofilm Formation in Staph.pidermidis isolated From clinical samples. degree of phdin in immunology;ScienceCollege ;Universityof AL- Mustansiriya, at Baghdad-Iraq.2015.
19. Volanen I., Raitakari O.T., Vainionpaa R. Serum lipid profiles poorly correlate with Chlamydia pneumoniae, Helicobacter pylori, and Cytomegalovirus seropositivity in prospectively followed-up healthy children. ArteriosclerThrombVascBiol .2015.25(4): 827-32.
20. Ruth E.W. ; Catherine, H.S. ; John, F. C. ;Jeri, R.M. .bA1c as a Postmortem Tool to Identify Glycemic Control.Journal of Forensic Sciences.2002. 47(6):1373-9
21. Gillum RF. infection with Helicobacter pylori, coronary heart disease,cardiovascular risk factors, and systemic inflammation: The Third National Health and Nutrition Examination Survey. J Natl Med Assoc.2004.96:1470‑6.
22. Candelli M, Rigante D, Marietti G, Nista EC, Crea F, BartolozziF. Helicobacter pylori, gastrointestinal symptoms, and metabolic control in young type 1 diabetes mellitus patients. Pediatrics.2003.111:800‑3.
23. Sung KC, Rhee EJ, Ryu SH, Beck SH. Prevalence of Helicobacter pylori infection and its association with cardiovascular risk factors in Korean adults. Int J Cardiol.2005.102:411‑7.
24. Dursun M, Bahceci M, Tuzcu A, Yilmaz S, Canoruc F. Insulin sensitivity, cell function and serum lipid levels in Helicobacter pylori positive, non‑obese, young adult males. Turk J Med Sci.2004.;34:103‑7.
25. Tektook.,N.K.Bacteriological and Serological study in Diabetic patients with urinary tract infections and diabetic retinopathy. M.Sc. Thesis of Science in Biology. College of Science, University of AL- Mustansiriya.2005.

Correlation of Serum Amylin Level to Polycystic Ovarian Syndrome
Aied M. Talaq1, Salam S. Ahmed2
1Salah Al-din General Hospital; 2College of Medicine – University of Tikrit
Abstract
Background: Polycystic ovary syndrome (PCOS) is the most common endocrine disorder in women of reproductive age, affecting 6%–10% of women worldwide. Objective: The study aimed to assess the relation of serum amylin level in women with polycystic ovarian syndrome. Materials and Methods: A cross‑sectional study was carried out in Salah Al-din City from 10th of November 2018 , to 20thof May 2019. The number of polycystic ovary syndrome women under study was 51 women whose ages were between 18 and 45 years old. These women admitted to obstetrics and gynecology unit at Salah Al-din Teaching Hospital. The control group who were matched to the patients studied included 37 women.Finding :The study showed that there is the significant difference between PCOS women and the control group concerning serum amylin level and the highest mean of amylin was occurred in PCOS women (183.12 ± 10.021 vs. 23.62 ± 1.97). There was a weak positive correlation between body mass index and amylin level among PCOS women in this study. The highest rate of PCOS women had irregular menstrual cycle. The study showed that most PCOS women included in the study had hirsutism. The high rate of acne recorded among PCOS women. Conclusion: It was concluded that there was a highly significant relation of amylin to PCOS.
Keywords: Hirsutism, menstrual irregularity, polycystic ovary syndrome, amylin.
Introduction
Polycystic ovary syndrome is the most common endocrine disorder in women of reproductive age, affecting 6%–10% of women worldwide.(1) Polycystic ovary syndrome is characterized by chronic anovulation, hyperandrogenism, and multiple small subscapular cystic follicles in the ovary on ultrasonography.(2)
Amylin is a 37 amino acids polypeptide hormone with a molecular weight of 3.9 kDa, was firstly isolated from amyloid deposit in pancreatic islets of type 2 diabetic patients.(3) Amylin is mainly co-secreted with insulin by pancreatic β-cells in response to stimulation of glucose, free fatty acids, and nutrient intake.(4) Amylin inhibits food intake and delays gastric emptying, leading to the reduction of blood glucose levels and body weight. Moreover, pramlintide, an amylin analogue also reduces body weight in humans.(5) However, studies assessing serum amylin levels in PCOS women have yielded inconsistent results(6).
Materials and Method
A cross-sectional study was carried out in Tikrit City from 10th of November 2018 to 20th of May 2019. The number of PCOS women under study was 51 women whose ages were between 18 and 45 years. The diagnosis of PCOS was based on Rotterdam Criteria: oligo and/or anovulation clinical and/or biochemical signs of hyperandrogenism, and polycystic ovaries in ultrasound, meaning presence of 12 or more follicles measuring 2 – 9 mm in diameter in each ovary and/or ovarian volume more than 10 cm3. In addition the control group consisted of 37 apparently healthy volunteer females with regular menstrual cycles aged between 18 and 45 years. A volume of 5 mls of blood sample was taken by vein puncture from each subject enrolled in this study. Blood samples were placed into sterile test tubes, after blood clotting, the samples were centrifuged at 3000 rpm for 15 min then if a clot was developed, then was removed and re-centrifuged at 3000 for 10 min, and the obtained serum were aspirated using mechanical micropipette and transferred into clean plain tubes with

Indian Journal of Public Health Research & Development, November 2019, Vol. 10, No. 11 1997
screw which labeled and stored in deep freeze at - 20 °C for the biochemical measurement of amylin by ELIZA.
Statistical Analysis
The statistical analysis was performed using Statistical Package for the Social Sciences version 23 (SPSS, IBM Company, Chicago, USA).
Finding
This study showed that there was a significant difference between PCOS women and the control group concerning serum amylin level. The mean serum amylin in PCOS women was 183.12 ± 10.021 vs. 23.62 ± 1.97 in control group, as shown in table 1. There was a weak positive correlations between body mass index (BMI) and serum amylin level among PCOS women in this study, figure 1. The highest rate of PCOS women had an irregular menstrual cycle (84.31%) and 15.69% of them had normal menstrual cycle, as shown in figure 2. The study showed that most PCOS women included in the study had hirsutism (66.70%), while only 33.30% were without hirsutism, as shown in figure 3. The high rate of acne recorded among PCOS women was 53% and 47% of PCOS women without acne, as shown in figure 4.
Table (1) : Serum level of amylin in women with PCOS and the control group.
Amylin level (pg/
ml)
PCOS women
Control group
t. test P. value
No. 51 37
Mean 183.12 23.627.28 0.0001
SD 10.021 1.97
Figure (1): Correlation between amylin hormone and BMI of PCOS women.
Figure (2): Distribution of polycystic ovary syndrome women according to irregularity of menstrual cycle.Figure (3): Distribution of PCOS women according to hirsutism.
Figure (4): Distribution of PCOS women according to presence of acne.
Discussion
PCOS is an endocrine disorder with multifactorial etiology and various clinical manifestations. It is the most common cause of menstrual disorder and an ovulatory infertility in women.(7)This study showed that there is the significant difference between PCOS women and the control group concerning amylin level which was found to be significantly higher in women with PCOS comparing with the apparently healthy women at of less than 0.01, suggesting the presence of a hormonal disturbance in women with PCOS, which may reflecting a significant effect of the pancreatic hormones on the ovarian function. These results were in agreement with JAMES et al, (8) who found an increment in serum amylin level in women with PCOS. The precise mechanism of increased serum amylin levels in women with PCOS currently is unknown, PCOS is a complex disorder and carries an important pathophysiological role. Therefor women with PCOS have a higher chance for insulin resistance and compensatory hyperinsulinemia leading to an increased risk of obesity, type-II diabetes mellitus, metabolic syndrome, as well as hyperandrogenemia. Amylin may contribute to their progression of diabetes, and beyond their risk for diabetes, women with PCOS also have higher risk of developing dyslipidemia and

1998 Indian Journal of Public Health Research & Development, November 2019, Vol. 10, No. 11
hypertension.(9)
This study showed that the rate of PCOS women to had an irregular menstrual cycle, hirsutism, and acne were higher in women with PCOS as compared with the control group.some studies report a prevalence of hirsutism in women with PCOS in the range of 50–76%.(10)(11) Hirsuitism is defined as excessive hair growth in area usually associated with male sexual maturity, that is, on the face, chest, lineal alba, lower back, buttocks, and anterior thighs. Hirsuitism results from androgen effects on the pilosebaceous unit and is commonly associated with acne and oily skin. It is usually due to an increase in androgen production from the ovaries or adrenal glands.(12) The results noticed by this study were in agreement with Azziz et al (13) and Ovalle and Azziz, (14) they concluded the source of hyperandrogenism due to the genetic abnormalities in insulin receptor resulting in the thickening of the ovarian theca that increased the androgen production and inhibition of sex hormone binding globulin synthesis. The degree of hirsutism might be influenced by the relative activity of the 5α-reductase enzyme that convert testosterone to the more active metabolic dihydrotestosterone.(15)
(16) The high concentrations of testosterone, one of the factors that contribute to some symptoms of PCOS such as infertility, polycystic ovaries, hirsutism, and acne.(17) Gowri et al (18) showed that the acne was seen in highest percentage (67.5%), followed by hirsutism (62.5%) in women with PCOS compared to healthy women of a comparable age group and fasting insulin levels was the most common hormonal abnormality seen along with both acne and hirsutism. Sharma et al (19) Majumdar and Singh (20) also showed that acne was the most common cutaneous manifestation in PCOS group.
In addition, women with PCOS are frequently obese and obesity is associated with menstrual cycle abnormalities in the general population.(21) The prevalence of these cycle abnormalities may vary in unselected women with PCOS because they reflect the subgroup of PCOS women who have sought medical attention and thus are more likely to demonstrate a more severe phenotype.(22) On the other hand, menstrual cycle irregularity is a relatively accurate surrogate of ovulation and is easily obtained from the medical history.(23) Strowitzki et al (24) reported that in women with PCOS, insulin resistance was significantly lead to an amenorrhea (cycle length > 6 mo) when compared with those with normal cycles.
Conclusion
In conclusion, women with PCOS had a higher serum level of amylin compared to other women without PCOS of a similar age group.
Conflict of Interest: Non
Source of Findings: Self
Ethical Clearance: Nil
References
1. Bozdag G, Mumusoglu S, Zengin D, Karabulut E, Yildiz BO. The prevalence and phenotypic features of polycystic ovary syndrome: a systematic review and meta-analysis. Hum Reprod. 2016;31(12):2841–55.
2. Begum S, Hossain MZ, Rahman MF, Banu LA. Polycystic ovarian syndrome in women with acne. JPAD. 2017 Jan 4;22(1):24-9.
3. Guzel, Saime, Deniz Belenli, and Artun Yibar. “Plasma amylin concentration in suckling goat neonates and its relationship with C-reactive protein, selected biochemical and hormonal indicators.” Acta Veterinaria Brno 84.3 (2015): 237-242.
4. Guzel, S., and N. Gunes. “Correlations between endogen amylin hormone and some hormonal, biochemical and bone parameters in pullets.” Brazilian Journal of Poultry Science 16.4 (2014): 375-380
5. Harris, K.; Boland, C.; Meade, L.; Battise, DAdjunctive therapy for glucose control in patients with type 1 diabetes. Diabetes Metab. Syndr. Obes. 2018, 11, 159–1
6. Hay D, Chen S, Lutz TA et al: Amylin: pharmacology, physiology, and clini-cal potential. Pharmacol Rev, 2015; 67(3): 564–600.
7. Baqer LS, Ahmeid MS, Al-Obaidi AH. Evaluation the effect of metformin on hormo serum leveles in women with polycystic ovary syndrome. Tikrit J Sci. 2017 Oct 30;22(9).
8. JAMES, Summer; MORALEZ, Jennifer; NAGAMANI, Manubai. Increased secretion of amylin in women with polycystic ovary syndrome. Fertility and sterility, 2010, 94.1: 211-215.

Indian Journal of Public Health Research & Development, November 2019, Vol. 10, No. 11 1999
9. Khan, K.A., Stas, S., and Kurukulasuriya, L.A. Polycystic ovarian syndrome. J Cardiometab Syndr. 2006; 1: 125–130.
10. Chang WY, Knochenhauer ES, Bartolucci AA, Azziz R. Phenotypic spectrum of polycystic ovary syndrome: Clinical and biochemical characterization of the three major clinical subgroups. Fertil Steril 2005;83:1717–23.
11. Azziz R, Woods KS, Reyna R, Key TJ, Knochenhauer ES, Yildiz BO. The prevalence and features of the polycystic ovary syndrome in an unselected population. J Clin Endocrinol Metab. 2004;89:2745–9.
12. Crum CP, Nucci MR, Granter SR,et al. Diagnostic Gynecologic and Obstetric Pathology E-Book. Elsevier Health Sciences; 2017 Oct 13.
13. Azziz R, Sanchez LA, Knochenhauer ES, Moran C, Lazenby J, Stephens KC, et al. Androgen excess in women: Experience with over 1000 consecutive patients. J Clin Endocrinol Metab 2004;89:453- 62.
14. Ovalle F, Azziz R. Insulin resistance, polycystic ovary syndrome, and type 2 diabetes mellitus. Fertil Steril 2002;77:1095-105.
15. Pasch L, He SY, Huddleston H, Cedars MI, Beshay A, Zane LT, et al. Clinician vs. self-ratings of hirsutism in patients with polycystic ovarian syndrome: Associations with quality of life and depression. syndrome: Associations with quality of life and depression. JAMA Dermatol 2016;152:783-8.
16. Bajaj DR, Memon AR, Hussain T, Shaikh BF, Iqbal MP. Serum androgen levels and their relationship to pattern and severity of hair growth in hirsute women presenting at private centre in
Hyderabad. J Pak Assoc Dermatol 2016;18:70-7.
17. Trummer C, Schwetz V, Giuliani A, Obermayer-Pietsch B, Lerchbaum E. Impact of elevated thyroid-stimulating hormone levels in polycystic ovary syndrome. Gynecol Endocrinol. 2015 Oct 3;31(10):819-23.
18. Gowri BV, Chandravathi PL, Sindhu PS, Naidu KS. Correlation of skin changes with hormonal changes in polycystic ovarian syndrome: A cross-sectional study clinical study. Indian J dermatol. 2015 Jul;60(4):419.
19. Sharma NL, Mahajan VK, Jindal R, Gupta M, Lath A. Hirsutism: Clinico -investigative profile of 50 Indian patients. Indian J Dermatol 2008;53:111-4.
20. Majumdar A, Singh TA. Comparison of clinical features and health manifestations in lean vs. Obese Indian women with polycystic ovarian syndrome. J Hum Reprod Sci 2009;2:12-7.
21. Palomba S. Infertility in Women with Polycystic Ovary Syndrome: Pathogenesis and Management. Springer; 2018 Feb 2.
22. Ezeh U, Yildiz BO, Azziz R. Referral bias in defining the phenotype and prevalence of obesity in polycystic ovary syndrome. J Clin Endocrinol Metab. 2013;98:1088–1096.
23. Quinn MM, Kao CN, Ahmad AK,et al. Age‐stratified thresholds of anti‐Müllerian hormone improve prediction of polycystic ovary syndrome over a population‐based threshold. Clin endocrinol. 2017 Dec;87(6):733-40.
24. Strowitzki T, Capp E, von Eye Corleta H. The degree of cycle irregularity correlates with the grade of endocrine and metabolic disorders in PCOS patients. Eur J Obstet Gynecol Reprod Biol. 2010;149:178–181.

MMP-13 Gene Polymorphisms Associated with KOA in Iraqi Population
Mustafa Saleam Khalaf1; Estabraq Abdulrasool Kwaeri2 ; Abbas Toma Joda3
1Al-Nahrain University – College of Medicine
Abstract
Knee osteoarthritis (KOA) is disease occur in knee joint characterize by cartilage degradation that mediate via pro-inflammatory marker such as matrix metalloproteinase-13 (MMP-13) . MMP-13 is enzyme expression in chondrocyte ,encoded by MMP-13 gene , act to degraded it and joint degenerative .This study explained association the rs2252070 single nucleotide polymorphisms (SNP) of MMP-13 gene in KOA . The result demonstrate that G alleles have significant association with KOA development . our results are the first ones reporting an association between MMP-13 and KOA in Iraqi populations .
Key words / MMP-13 gene polymorphisms and Knee osteoarthritis (KOA).
Introduction
Knee osteoarthritis (KOA) is the disease occur in the knee joint .It’s degenerative arthritis in cartilage matrix of knee , is a group of overlapping distinct diseases, which may have different etiologies but with similar at biologic, morphologic, and clinical outcomes(1). The most common form of arthritis is KOA , 6%of adults are affected it and the women more affected than men at age more than 45 years .KOA always has many soluble mediators for example prostaglandins and cytokines ,these mediators can stimulat matrix metalloproteinase-13 (MMP-13) in chondrocyte. MMP-13 production is consider the first step in theory of inflammation and degenerative knee joint(2) .
MMP-13 (also called collagenase) is enzymes that break the collagen peptide bonds in cartilage (Collagen, a key component of the extracellular matrix of chondrocyte ) encoded by MMP-13 gene. MMP-13 is a protein of 81 875 Da and 739 amino acid residues as deduced from the DNA sequence analysis (3) . MMP-13 protein is synthesized in precursor form (preprocollagenase), then the signal peptide and pro region are removed and the resulting mature form is secreted. Plays a role in the degradation of extracellular matrix proteins(cartilage degradation) including fibrillar collagen and fibronectin .Cleaves triple helical collagens, including type I, type II and type III collagen, but has the highest activity with soluble type II collagen (4) .
Materials and Method
Study design : This study designed according to approved via Institutional Ethics Committee in Medical College / Al-Nahrain University / Iraq and it done in Rheumatology & Rehabilitation Consultation Unit in Al-Yarmouk Teaching Hospital / Iraq . The consents obtained from all patients and healthy persons that involved in the study . Diagnosis of cases with KOA was according to American College of Rheumatology (ACR) , all the patients are classified as primary KOA will include in this study .The ACR depends on signs and symptoms of KOA that show on patients also depend on clinical examination and X- ray (anteroposterior (AP) view and skyline view ) (5) . This study involved collected 50 primary KOA grade 1 (G1) and 50 grade 4 (G4) cases and 50 controls, age of the cases and controls were more than 40 years . Table 1.
Table 1 : Numbers and age of the KOA cases and controls
Age (years) Number
Mean +SD (48.1+ 5.8)50 KOA (G1) cases
Mean +SD (48.8+ 6.1)50KOA (G4) cases
Mean +SD (49.1+ 6.6)50 Controls
SD/ Standard deviation

Indian Journal of Public Health Research & Development, November 2019, Vol. 10, No. 11 2001
Samples collection : Five ml of blood drawed from cases and controls collected it in EDTA tube .DNA was isolated from blood sample by DNA extraction kit (Zymo company / USA) according to special method at kit . The isolate DNA stored in -20 C until future use
. The DNA sample had purity ratio 1.7 to 2 that used in PCR-RFLP method . The Gene Runner software (Version 3.05) was used to design of MMP-13 gene primer , all primer information in table 2.
Table 2: Data for analysis of SNP in the human MMP-13 gene.
PCR product size (bp)
Tm (C)
Restriction enzymeGC %PrimersSNPGene
name
445
50.4
BsrI
45Forward 5’- GAT ACG TTC TTA CAG AAG GC- 3’
rs2252070MMP-13
48.740Reverse 5’-GAC AAA TCA TCT TCA TCA CC - 3’
PCR used for DNA amplification : Polymerase Chain Reaction (PCR)The extracted used to amplification of DNA . PCR was applied on AURA TM PCR Cabinet (Labnet – Italy). The PCR reaction was consisted of 1.5µl of 110 ng DNA, 1𝜇L of mM dNTPs , 10 pmols/µl (1µl ) of forward and 10 pmols/µl(1µl ) of reverse primer , 0.3 𝜇L of 5U/μl iTaq DNA polymerase , 3 𝜇L of Taq polymerase Buffer A , and 16.5 µl of deionized water . The thermal cycling conditions showed in table 3.
Table 3: The thermal cycling conditions
No. Phase Tm (ᵒC) Time No. of cycle
1- Initial Denaturation 95ᵒC 3 min. 1 cycle
2- Denaturation -2 95ᵒC 45sec
35 cycle3- Annealing 56ᵒC 45sec
4- Extension-1 72ᵒC 45sec
5- Extension -2 72ᵒC 7min. 1 cycle
The production of PCR were separated by use a 2% agarose gel containing 2 𝜇L ethidium bromide. A 100 bp DNA marker was used as a size standard for each gel lane. The UV light used for visualization of gel
Restricted Fragment Length Polymorphism (RFLP) Analysis: The productions of PCR was digested by restriction enzyme , BsrI (Biolab/England). The digested fragments were electrophoresis on 2.5% agarose gel mixed with red stain. The genotype frequencies. found by RFLP analysis .
Statistical Analysis
The GraphPad PRISMstatistical software (version6
.0, San Diego, CA, USA) was used to data analyses . The Chi-square (𝜒 2) test used to find the difference between allelic frequencies and genotype in KOA cases and control. The odds ratio and confidence interval (CI) (95%) was used to calculate association between KOA cases and control’s genotypic and allele frequencies . Odds ratio was used to statistically demonstrate a positive dose response relationship of mutant allels ( G allele ) with KOA .
Finding
A / KOA Patients: This study involved 50 patients with G1 KOA and 50 patients with G4 KOA ,and

2002 Indian Journal of Public Health Research & Development, November 2019, Vol. 10, No. 11
studied Genotype frequencies by using PCR -RFLP to detect the found of SNP of MMP gene (rs2252070).
rs2802292 SNP is characterized by A>G in G1 KOA patients .The AA mutant type (homozygous ) of genotype frequency was high (58.7%) , and GG mutant type was low (2.1%) also AG mutant type (heterozygous ) was (39.1%) . This study calculated the allel frequencies by genotype frequencies and showed that A allele was high (79%) but G was low (21%) in G1 KOA patients .
rs2802292 SNP is characterized by A>G in G4 KOA patients .The AA mutant type (homozygous ) of genotype frequency was (26%) , and GG mutant type was low (20%) also AG mutant type (heterozygous ) was high (54%) . This study calculated the allel frequencies by genotype frequencies and showed that A allele was high (57%) but G was low (43 %) in G4 KOA patients .
B / Controls. This study involved 50 healthy persons and studied Genotype frequencies by using PCR -RFLP to detect the found of SNP of MMP gene (rs2252070) .
rs2802292 SNP is characterized by A>G in controls .The AA mutant type (homozygous ) of
genotype frequency was high (56%) , and GG mutant type was low (0%) also AG mutant type (heterozygous ) was (44%) . This study calculated the allel frequencies by genotype frequencies and showed that A allele was high (78%) but G was low (22%) in controls .
C/ Association Studies : This study included compared between G1 KOA with controls and G4 KOA with controls . The results showed that 𝜒 2 forG1 with controls were non significant but for G4 with controls were significant correlation. The odds ratio and Cl 95% forG1 with controls were non significant but for G4 with controls were significant correlation . As per genotype frequency analyzed data, KOA cases are more likely to have a AG allele as compared to AA and more likely to have a GG allele. These association depend on CI that consider significant when to be above 1.0. If GG allele can be considered as a higher exposure to G as compared to AG , then the above statistics demonstrate a positive dose-response relationship of G allele with KOA . Table 4, 5and 6 .
Table 4: Comparsation of control with G1according to MMP13 alleles polymorphisms
df
OR
C I 95%P-valueSig.X2
Group
P o l y m o r -phism
G1 N=50Control N=50
Perc
enta
ge
Exp
ecte
d
Perc
enta
ge
Obs
erve
d
Perc
enta
ge
Exp
ecte
d
Perc
enta
ge
Obs
erve
d
10.848
0.631 t o 1.356
0.6934NS0.155
43.8322.3658.72844.7222.365628AA
52.7425.8039.132053.826.94422AG
3.4351.902.17421.480.7400GG
10050100501005010050Total
4.1493.055X2
NSNSSignificant
0.12560.2171P-value
Allele fre-quency
0.790.78A
0.210.22G
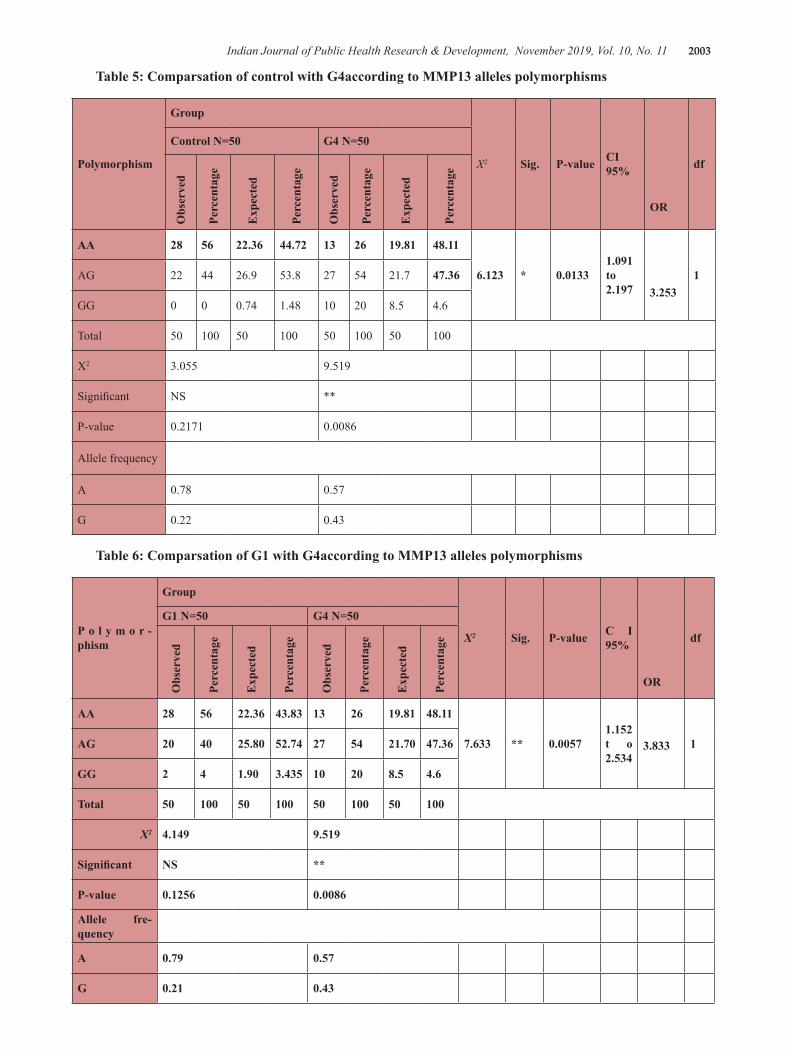
Indian Journal of Public Health Research & Development, November 2019, Vol. 10, No. 11 2003
Table 5: Comparsation of control with G4according to MMP13 alleles polymorphisms
df
OR
CI 95%P-valueSig.X2
Group
Polymorphism
G4 N=50Control N=50
Perc
enta
ge
Exp
ecte
d
Perc
enta
ge
Obs
erve
d
Perc
enta
ge
Exp
ecte
d
Perc
enta
ge
Obs
erve
d
13.253
1.091 to 2.197
0.0133*6.123
48.1119.81261344.7222.365628AA
47.3621.7542753.826.94422AG
4.68.520101.480.7400GG
10050100501005010050Total
9.5193.055X2
**NSSignificant
0.00860.2171P-value
Allele frequency
0.570.78A
0.430.22G
Table 6: Comparsation of G1 with G4according to MMP13 alleles polymorphisms
df
OR
C I 95%P-valueSig.X2
Group
P o l y m o r -phism
G4 N=50G1 N=50
Perc
enta
ge
Exp
ecte
d
Perc
enta
ge
Obs
erve
d
Perc
enta
ge
Exp
ecte
d
Perc
enta
ge
Obs
erve
d
13.8331.152 t o 2.534
0.0057**7.633
48.1119.81261343.8322.365628AA
47.3621.70542752.7425.804020AG
4.68.520103.4351.9042GG
10050100501005010050Total
9.5194.149X2
**NSSignificant
0.00860.1256P-value
Allele fre-quency
0.570.79A
0.430.21G

2004 Indian Journal of Public Health Research & Development, November 2019, Vol. 10, No. 11
Discursion
The KOA is degenerative disease of cartilage in knee joint , it’s inflammatory disease because it occur with inflammatory mediators and the age consider as risk factor to OA development therefore consider as within age related diseases (1).
The chondryocyte with age suffer of high expression of nitric oxide (NO) (high level of NO act as risk factor against survival of cell ) this considered as factor for chondryocyte degredation and OA development due to the NO is one of triggers for MMP-13 in cell (6). MMP-13 are enzymes that break the peptide bonds in collagen (Collagen, a key component of the animal extracellular matrix, is made through cleavage of pro-collagen by collagenase once it has been secreted from the cell) encoded by MMP-13 gene and it’s act as mediator the cartilage degradation (7).
This study showed association between MMP-13 gene polymorphisms with KOA through the mutant of A>G . This association explained when compare control with G4 KOA and G1 with G4 KOA and obtained significant association in this comparisons. This result demonstrate that MMP-13 gene polymorphisms can develop the KOA , This effect occur by NO that mediate the MMP-13 expression.
NO act as 2nd messenger , such as reactive oxygen species , in cell for activation of many biological functions therefore it can activate the Guanylate cyclase (GC) . GC act to convert the GTP to cGMP .cGMP mediate the phosphorlation of protein kinase G (PKG) and activation it (8). PKG also act to phosphorlate the Core-binding factor alpha 1 (Cbfa1) in presence of cGMP exclusively ,this lead to activation of Cbfa-1 . Cbfa-1 is localize in cell nuclei , this lead to it effect on MMP-13 gene and elevate MMP-13 expression (9) . Therefore , the NO cGMP- PKG pathway promot MMP-13 expression .The NO cGMP- PKG pathway might drive Cbfa-1-dependent gene expression in chondryocte by regulating nuclear translocation of Cbfa-1. This can be stimulate and hyperactivation of proinflammatory cytokines (such as MMP-13 ) (10).
Our study for the first time shows that MMP-13 SNP (rs2252070 ) is significantly associated with KOA in Iraqi population . In addition to the highly significant association of MMP-13 and OA , based stratification also indicated that the mutant “G” allele has a much
more pronounced risk rate of OA in Iraqi populations . Increase of G allele have association with elevate MMP-13 activity and KOA development . The our study is first time shows association between KOA and MMP-13 SNP (rs2252070 ) , and some study in China ( Sun G1, Ba CL1 and et al . 2019 ) show same association but different allele , at Chinese population the A allele but in Iraqi G allel is risk factor in KOA development due to it can increase the encoded and activity of MMP-13 (11).
Conclusion
The our study conclude that genotype frequencies of KOA patients and controls were studied using PCR-RFLP technique to detect the presence of SNP of MMP-13 gene (rs2252070). The Chi-square test indicated significant positive relationship between KOA and TG and GG genotypes
Conflict of Interest: Non
Source of Findings: Self
Ethical Clearance: Non
References
1- YANG, Libin; ZHANG, Jun; WANG, Guodong. The effect of sodium hyaluronate treating knee osteoarthritis on synovial fluid interleukin-1β and clinical treatment mechanism. Pakistan journal of pharmaceutical sciences, 2015, 28.
2- ROSSHIRT, Nils, et al. A predominant Th1 polarization is present in synovial fluid of end‐stage osteoarthritic knee joints: analysis of peripheral blood, synovial fluid and synovial membrane. Clinical & Experimental Immunology, .395-406 :195.3 ,2019
.BRÜCHER, Björn LDM; JAMALL, Ijaz S -3Undervalued ubiquitous proteins. 4open, 2019, 2: .7
4- ALI, Vean Sabah, et al. Estimation of Serum Matrix Metalloproteinases-1 Levels in Iraqi Female Patients with Osteoarthritis. Health Sciences, 2018, 7.5: 18-22.
5- TANG, Chenjian, et al. Cerebral mechanism of celecoxib for treating knee pain: study protocol for a randomized controlled parallel trial. Trials, 2019, .58 :20.1
6- BOLDUC, Jesalyn A.; COLLINS, John A.;

Indian Journal of Public Health Research & Development, November 2019, Vol. 10, No. 11 2005
LOESER, Richard F. Reactive oxygen species, aging and articular cartilage homeostasis. Free Radical Biology and Medicine, 2018.
7- HUANG, Tien-Yu, et al. Minocycline attenuates experimental colitis in mice by blocking expression of inducible nitric oxide synthase and matrix metalloproteinases. Toxicology and applied pharmacology, 2009, 237.1: 69-82.
8- BANDAY, Anees A.; LOKHANDWALA, Mustafa F. Oxidative stress impairs cGMP-dependent protein kinase activation and vasodilator-stimulated phosphoprotein serine-phosphorylation. Clinical and Experimental Hypertension, 2019, 41.1: 5-13.
9- AN, Jing, et al. Natural products for treatment of osteoporosis: The effects and mechanisms
on promoting osteoblast-mediated bone formation. Life sciences, 2016, 147: 46-58.
10- MORBIDELLI, Lucia; DONNINI, Sandra; ZICHE, Marina. Therapeutic Implications of the Nitric Oxide Pathway in the Angiogenesis of Tumors and Inflammatory-Related Disorders. In: Therapeutic Application of Nitric Oxide in Cancer and Inflammatory Disorders. Academic Press, 2019. p. 65-91.
11- SUN, Gang, et al. Association of IL-6, IL-8, MMP-13 gene polymorphisms with knee osteoarthritis susceptibility in the Chinese Han population. Bioscience reports, 2019, 39.2: BSR20181346.

Rejuvenation of Under Eye by Nanofat Grafting
Aasem Mohamed Al-Byti1, Abdulrazzaq Abbas Waheeb1, Saygin Abdulkadir Chakmakchy1
1M.B.Ch.B.-FICM (Plastic), Tikrit University, College of medicine, Tikrit, Iraq
Abstract
Over the past decade, we have seen unprecedented growth in the popularity of elective cosmetic surgery. In a prospective study, a total number of 22 female patients under the age of 40 years (range from 20-40 years) all complaining form dark pigmentation involving the lower eyelids in Kirkuk city in north of Iraq ,all patient had been treated by intradermal nanofat injection . Those patients were selected, evaluated and operated during the period from March to November 2018. In all cases the diagnosis confirmed clinically; none of these patients in this study received previous medical or surgical therapy. Their ages were ranging between (20 years to 40 years). All were treated by single stage nanofat injection in the lower eyelids ;Nanofat injected to improve the pigmentation and skin rejuvenation for all patients injected with intradermal nanofat ; all patients injected by nanofat using small sharp needle 27-gauge in repeated fan-shaped patterns intradermally with 1 cc of nanofat in each side followed by Simple digital massage over the lower eyelids ;at the end of the injections erythema and a yellowish discoloration was noticed in whole lower eyelids; this discoloration disappeared within 5 weeks by a gradual lightening of the skin. After an average follow-up of six months (range 3–9 months), Assessment of the results by the surgeon were good in 50%, fair 36.4 and poor 13.6, patients satisfaction were good in 59.1%, fair in 31.8% of cases and only 9.1 were poor as shown in. Only 2 patients (9.1%) in this study had prolong ecchymosis as postoperative complications , all other patient healing pass smoothly and uneventful .
Keyword: Lower Eyelid Skin; Nanofat grafting; fat graft
Introduction
Over the previous decade, unprecedented growth in the popularity of elective cosmetic surgery have been seen. According to the American Society for Aesthetic Plastic Surgery, there has been a approximately 8% elevation in plastic surgery(1). different factors can cause dark circles around the eyes. One cause is excessive pigmentation due to dermal melanocytosis. This can be congenital or occur secondary to such conditions as atopic or allergic contact dermatitis (2). Another common cause of dark circle is a thin, translucent lower eyelid skin overlying the orbicularis oculi muscle. Transparent eyelid skin allows visualiza tion of the underlying subcutaneous vascular plexus or vascula ture within the muscle (3). Shadowing due to skin laxity and tear trough is another cause of infraorbital dark circle (4). This can worsen with time because of age-related loss of subcutaneous fat and hollowness of the periorbital area. Many causative factors of the dark circles include translucent, thin skin with excessive pigmentation of
the lower eyelids skin overlying the orbicularis oculi muscle and shadowing due to laxity of the skin and tear trough deformity, periorbital edema, superficial location of vasculature may also exacerbate the condition (5). Etiologic factors likewise incorporate hereditary/established, post provocative hyperpigmentation ,dermal melanin affidavit, hypersensitive contact dermatitis, optional to sickliness, stress, flawed propensities (5). So this condition may be challenging to treat due to it complex etiopathogenesis, and lacking straightforward and repeatable therapeutic options (6). Many treatment modality had been used like IPL, and Q-switched ruby laser, local creams ,Chemical peels, as well as fillers have all been tried for treatment but none have provided a satisfactory treatment (7). All mentioned treatment option are not effective for patients with dark pigmentation in lower lid due to thin, translucent skin. In this type of dark pigmentation, injection of autologous fat has been reported as a good method (8). A new treatment technique called Nanofat has been introduced by Tonnard et al. In which autologous fat graft harvested manually

Indian Journal of Public Health Research & Development, November 2019, Vol. 10, No. 11 2007
by closed syringe lipoaspiration then it’s emulsified mechanically until a liquid suspension is obtained and then superficially injected in intradermal plain with fine sharp needles (2). Autologous fat grafting firstly reports in the early twentieth century and used clinically after the introduction of liposuction by Illouz in the 1980s as a lipofilling treatment in which fat injected deep subcutaneously (9). Zuke et al determined that stem cells could be isolated from human adipose tissue obtained by suction-assisted lipectomy (liposuction) was processed to obtain a fibroblast-like stem cells (10). In this clinical study, nanofat technique evaluated the reliability of a practical method in which intradermal nanofat injection used to rejuvenate skin and treat dark pigmentation in lower eyelids.
Material and method
2.1. Patients:
In a prospective study, a total number of 22 female patients under the age of 40years(rang from 20-40 years ) all complaining form dark pigmentation involving the
lower eyelids in Kirkuk city in north of Iraq ,all patient had been treated by intradermal nanofat injection. Those patients were selected, evaluated and operated during the period from March to November 2018. In all cases the diagnosis confirmed clinically; none of these patients in this study received previous medical or surgical therapy. Their ages were ranging between (20 years to 40 years).
To evaluate clinically the benefit of Nanofat injection for skin rejuvenation and dark pigmentation of the lower eyelids as an outpatient procedures with short term follow up. Preoperative evaluation in all 22 patients included medical history, a complete physical examination, thorough history and physical examination. Collected information about patient associated illnesses, smoking, drug use and medication history, and family history, preoperative photograph were taken to all patients in frontal view. Liposuction was performed and harvested from the lower abdomen after infiltration with a modified Klein solution, prepared by 1 liter of physiological solution (RL) + lidocaine 800 mg with adrenaline 1mg (1:1000).
Fig 1. Operative procedure: (a)-Lower abdomen draping (b-c)- infiltration with a modified Klein solution (d)-Closed syringe liposuction.

2008 Indian Journal of Public Health Research & Development, November 2019, Vol. 10, No. 11
Fig 3 (a-f) Nanofat injection(a)- Nanofat infused effectively by little needle 27-measure (b)- Emulsification procedure modify fat shading from yellow to light yellow white (c-d)- Intradermal nanofat infusion in both left and right lower covers (e)- Simple computerized back rub to the infused region (f)- post infusion erythema and yellow staining.
2:5 Post-operative measure:
Dressing made with local eye ointment apply to the lower eyelids. Oral Antibiotics with local eye antibiotic ointment were continued for five days postoperatively, usually patients were return to normal life style on the 3th postoperative day. The patients were followed up (3 to 9 months post operatively) for the evaluation.
Findings
Twenty two female patients were included in this study ,there age range from 20 to 40 years as shown Table 1, Patients concern was variable between dark pigmentation alone or pigmentation with rejuvenation as shown in Figure 4; all were treated by single stage nanofat injection in the lower eyelids ;Nanofat injected to improve the pigmentation and skin rejuvenation for all patients who injected with intradermal nanofat ; all patients injected by nanofat using small sharp needle 27-gauge in repeated fan-shaped patterns intradermally with 1 cc of nanofat in each side followed by Simple digital massage over the lower eyelids ;at the end of the injections erythema and a yellowish discoloration was noticed in whole lower eyelids; this discoloration disappeared within 5 weeks by a gradual lightening of the skin. After an average follow-up of six months (range 3–9 months), Assessment of the results by the surgeon were good in 50%, fair 36.4 and poor 13.6, as shown in Table 2; patients satisfaction were good in 70%, fair in
Then the collected fat (Fig.2), in order to reduce any residual local anesthetic solution and red blood cells lipoaspirated fat was rinsed with sterile saline (Fig.2:2b), then by using Tonnard’s technique (8) the lipoaspirate fat is mechanically emulsified this achieved by 30 passes shifting between two 10-cc syringes connected each other by a female-to-female Luer-Lock connector.
Fig 2: Nanofat preparation: (a) - Collected fat (b) - lipoaspirated fat was rinsed with sterile saline (c) - Emulsification of lipoaspirate fat by achieved mechanically by 30 passes shifting between two 10-cc syringes connected each other by a female-to-female Luer-Lock connector
Emulsification process liquefy fat to emulsion and changed it color from yellow to pale yellow white (Fig. 3b), the fat becomes liquid and emulsified so it can be injected easily by small needle 27-gauge intradermally (Fig. 3a) the injection started from medial aspect of the lower eyelids to lateral aspect (Fig. 3c-d) followed by simple digital massage to injected area (Fig. 3e) to prevent skin irregularity due to nanofat localization and also decrease post injection erythema and yellow discoloration

Indian Journal of Public Health Research & Development, November 2019, Vol. 10, No. 11 2009
25% of cases and only 5 were poor as shown in Table 3. There were no significant wound complications, no infections, no cysts, or permanent discolorations, or other side effects were observed right after the treatment and also at the follow up visit. ; Only 2 patients (9.1%) in this study had prolong ecchymosis as postoperative complications , all other patient healing pass smoothly and uneventful .
Table 1: Number and percentage of patients according to their ages
Percentage No. of Cases Age of patient
40 820-30 year
60 1430-40 years
Figure 4: Rate of patients concern.
Assessment of the results by the surgeon as shown in table 3.3:
Table 2: Number and percent of surgeon assessment.
Percentage No. of Cases Result
50 % 11 Good
36.4% 8 Fair
13.6% 3 Poor
Table 3: Number and percent of Patients satisfaction.
Percentage No. of Cases Result
70 14 Good
255 Fair
51 Poor
Discussion
Dark circles under the orbital affect individuals of both sexes, all races, and a wide range of ages. Circumcision factors are known to cause the appearance of dark circles, including excessive pigmentation of the skin, thin, dry, thin skin that rises above the circular eye muscle, and shingles caused by skin laxity and tear pelvis. The most appropriate method of treatment varies according to the main causative factor of the dark circle. Topical skin lightening agents are the mainstay of treatment for hyperpigmentation (10). Factors commonly used in hyperpigmentation include hydroquinone, retinoic acid, meicinol, azylic acid and corticosteroids (11). Various combination therapies of these topical agents have been used to increase their efficacy while reducing side effects (12). Autologous fat injection has been reported as an effective method for treatment dark lower lids pigmentation caused by thin, translucent skin in which many modalities of treatment cannot treat it (13)
.
But fat injection may cause visible lumps of fat, contour irregularities, or fat necrosis or fat loss as it injected subcutaneously (14). Tonnard’s et al change fat particles to semi liquid emulsify by mechanical emulsification process change fat particles to nanofat which completely disrupts the adipose tissue structure so it can be injected by small gauge needle intradermal not subcutaneously in order not to have a volume-adding effect. But the major benefit of nanofat injection is to relate to stem cell activity (8). In the current study, nanofat grafting combined with microfat grafting produced satisfactory results in treating lower eyelid dark circles. Microfat grafting at the nasojugal folds compensated for the lack of volumetric effects of the nanofat grafting technique, and nanofat grafting at the lower eyelids improved the dark circles effectively, without any noticeable irregularity. This technique produces effects that are similar to those achieved by injecting pu rified stromal vascular fraction, but without the complicated tech nique or expensive laboratory equipment required for the latter. As well, the skin rejuvenating effects from stem cell activity are augmented by the fat graft acting as a soft tissue filler, to produce the final effect. In this study we have use nanofat injection by the same steps used by Tonnard’s et al. in which they inject in each lower lids 1.6 cc of nanofat intradermally ;instead we use to inject 1 cc of nanofat in each lower eyelids and use simple digital massage to decrease postoperative erythema and pale yellowish skin discoloration which last for around

2010 Indian Journal of Public Health Research & Development, November 2019, Vol. 10, No. 11
five week in compare to Tonnard’s et al they notice that skin yellowish skin discoloration remained for 1 month postoperatively and eyelid skin erythema for three months after the procedure. In this study the final results was satisfactory, In all patients, healing was uneventful with no significant complications. The postoperative outcomes were satisfactory after an average follow-up of six months assessment of the results by the surgeon were accepted in more than 80% of all of the patients satisfaction also accepted in more than 80% of all the cases (good in 59.1%, fair in 31.8% of cases and only 9.1) and nearly the same results were obtained by other study. Most patients showed Satisfaction ranging from fair to good ,improvement in skin texture the lighting of dark skin color in the lower eyelids and this agreed with both Dong et al and Tonnard’s et al which shows also good improvement and rejuvenation of skin and lighting of dark pigmentation; postoperative complications was minimal ,neither fat lumps nor texture irregularities were notice (14) and Tonnard’s et al (8) also observed no significant complications. Intradermal Nanofat injection shows both rejuvenating affect and skin lighting due its Capability of stem cell production rather than volume build as in fat injection which injected in subcutaneous plain. As Tonnard’s et al shows in there study that a number of good quality mesenchymal stem cells are still present in the nanofat sample (8).
Conclusion
our nanofat grafting technique provided substan-tial improvements.. Nano fat injection is one of the new modality of treatment which may consider an affordable option as an outpatient procedures that can be performed with ease in clinics to relive deep dark pigmentation and skin rejuvenation of the lower eyelids. This simple, cost effective procedure seems to be suitable for the correction of dark circles
Conflict of Interest: non
Source of Findings: self findings.
Ethical Clearance: This research was carried out with the patient’s verbal and analytical approval before the sample was taken. According to this approval, all the samples were collected and the tests were carried out. A copy of the results of the tests was then given to the patients
References
1- Balkrishnan R, McMichael AJ, Camacho FT, et al. Development and validation of a health-related quality of life instrument for women with melasma. Br J Dermatol 2003;149: 572–7.
2- Yaar M, Gilchrest BA. Skin aging: postulated mechanisms and consequent changes in structure and function. Clin Geriatr Med 2001;17:617–30.
3- Lowe NJ, Wieder JM, Shorr N, et al. Infraorbital pigmented skin. Preliminary observations of laser therapy. Dermatol Surg1995;21:767–70.
4- Roh M, Chung K. Infraorbital dark circles: Definition, causes, and treatment options. Dermatol Surg 2009;35:1163-71.
5- Goodman R, Belcher R. Periorbital hyperpigmentation. An overlooked genetic disorder of pigmentation. Arch Dermatol 1969;100:169-74.
6- Roberts WE. Periorbital hyperpigmentation: review of etiology, medical evaluation, and aesthetic treatment. J Drugs Dermatol 2014;13:472-82.
7- Rashmi Sarkar. Idiopathic Cutaneous Hyperchromia at the Orbital Region or Periorbital Hyperpigmentation. J Cutan Aesthet Surg. 2012; 5(3): 183–184.
8- Tonnard P, Verpaele A, Peeters G, et al. Nanofat grafting: basic research and clinical applications. Plast Reconstr Surg. 2013; 132: 1017-1026.
9- Illouz Y. Body contouring by lipolysis: A 5-year experience with over 3000 cases. Plast Reconstr Surg. 1983;72:591–597.
10- Zuk PA, Zhu M, Mizuno H, et al. Multiline age cells from human adipose tissue: Implications for cell-based therapies. Tissue Eng. 2001;7:211–228.
11- Goisis M, Stella E, Di Petrillo A, Rosset L . Nanofat Grafting Compared to Hyaluronic Acid and PRP Treatment of the Lower Lid and Tear Trough: Clinical Outcome. JSM Ophthalmol. 2015;3(1): 1027-37.
12- Mi R,Kee Y.Infraorbital Dark Circles: Definition, Causes, and Treatment Options. Dermatologic Surgery.2009; 35 : 1163–1171.
13- Rho M, Kim T, Chung K. Treatment of infraorbital dark circles by autologous fat transplantation: a pilot study. Br J Dermatol 2009; 160:1022-5.
14- Dong S, Dae H, et al .Correction of Dark Coloration of the Lower Eyelid Skin with Nanofat Grafting. Arch Aesthetic Plast Surg .2014;20(2):92-96.

Send all payment to :Institute of Medico-Legal Publications
Logix Office Tower, Unit No. 1704, Logix City Centre MallSector- 32, Noida - 201 301 (Uttar Pradesh)
Mob: 09971888542, 0120- 429 4015 E-mail: [email protected], Website: www.ijphrd.com

Quarterly
Send all payment to :Institute of Medico-Legal Publications
Logix Office Tower, Unit No. 1704, Logix City Centre MallSector- 32, Noida - 201 301 (Uttar Pradesh)
Mob: 09971888542, 0120- 429 4015 E-mail: [email protected], Website: www.ijphrd.com
Journal Title Print Only
Indian Journal of Public Health Research & Development INR 9000
NOTE FOR SUBSCRIBERS
• Advance payment required by cheque/demand draft in the name of “Institute of Medico-Legal Publications“ payable at New Delhi.
• Cancellation not allowed except for duplicate payment.• Claim must be made within six months from issue date.• A free copy can be forwarded on request.
Bank Details
Name of account : Institute of Medico-Legal Publications Pvt LtdBank: HDFC BankBranch Sector-50, Noida-201 301Account number: 09307630000146Type of Account: Current AccountMICR Code: 110240113RTGS/NEFT/IFSC Code: HDFC0000728
Please quote reference number.