Volume 24 Number 4 • November 2013 - Africa Portal
96
CONTENTS 2 A cost-benefit analysis of concentrator photovoltaic technology use in South Africa: A case study Mario du Preez, Justin Beukes and Ernest van Dyk 12 A possible design and justification for a biogas plant at Nyazura Adventist High School, Rusape, Zimbabwe Patrick Mukumba, Golden Makaka, Sampson Mamphweli and Sherpherd Misi 22 Critical factors to be considered when planning the implementation of environmental improvements and energy saving Juliane Barbosa dos Santos and Charbel José Chiappetta Jabbour 30 Emissions analysis from combustion of eco-fuel briquettes for domestic applications Tsietsi J Pilusa, Robert Huberts and Edison Muzenda 37 Experimental study on natural convection greenhouse drying of papad Mahesh Kumar 44 Dirt analysis on the performance of an engine cooling system Yashvir Singh and Nishant Kr. Singh 51 System and component modelling of a low temperature solar thermal energy conversion cycle Shadreck M Situmbeko and Freddie L Inambao 63 Modelling influence of temperature on daily peak electricity demand in South Africa Delson Chikobvu and Caston Sigauke 71 Performance analysis of an air humidifier integrated gas turbine with film air cooling of turbine blade Alok K Mahapatra and B E Sanjay 82 Details of authors 86 Index to Volume 24: February–November 2013 Volume 24 Number 4 • November 2013 Sponsored by the Department of Science & Technology and GIZ This journal is accredited by the South African Department of Higher Education and Training for university subsidy purposes. It is abstracted and indexed in Environment Abstract, Index to South African Periodicals, and the Nexus Database System. The journal has also been selected into the Science Citation Index Expanded by Thomson Reuters, and coverage begins from Volume 19 No 1. It is also on the Scientific Electronic Library Online (SciELO) SA platform and is managed by the Academy of Science of South Africa (ASSAf). Editor Richard Drummond Editorial board Mr J A Basson Energy consultant Profesor K F Bennett Energy Research Centre, University of Cape Town Professor A A Eberhard Graduate School of Business, University of Cape Town Dr S Lennon Managing Director (Resources & Strategy Division), Eskom Mr P W Schaberg Sasol Technology (Pty) Ltd Administration and subscriptions Ms Fazlin Harribi Annual subscriptions (four issues) Individuals (Africa): R160 (single copy R51) Individuals (beyond Africa): US$109 (single copy US$39) Corporate (Africa): R321 (single copy R103) Corporate (beyond Africa): US$218 (single copy US$77) Cost includes VAT and airmail postage. Cheques should be made payable to the University of Cape Town and sent to the address given below. Enquiries may be directed to: The Editor, Journal of Energy in Southern Africa, Energy Research Centre, University of Cape Town, Private Bag, Rondebosch 7701, South Africa Tel: +27 (021) 650 3894 Fax: +27 (021) 650 2830 E-mail: [email protected] Website: www.erc.uct.ac.za It is the policy of the Journal to publish papers covering the technical, economic, policy, environmental and social aspects of energy research and development carried out in, or relevant to, Southern Africa. Only previously unpublished work will be accepted; conference papers delivered but not published elsewhere are also welcomed. Short comments, not exceeding 500 words, on articles appearing in the Journal are invited. Relevant items of general interest, news, statistics, technical notes, reviews and research results will also be included, as will announcements of recent publications, reviews, conferences, seminars and meetings. Those wishing to submit contributions should refer to the guidelines given on the inside back cover. The Editorial Committee does not accept responsibility for viewpoints or opinions expressed here, or the correctness of facts and figures. © Energy Research Centre ISSN 1021 447X
-
Upload
khangminh22 -
Category
Documents
-
view
1 -
download
0
Transcript of Volume 24 Number 4 • November 2013 - Africa Portal

CONTENTS
2 A cost-benefit analysis of concentratorphotovoltaic technology use in South Africa: Acase study Mario du Preez, Justin Beukes and Ernest vanDyk
12 A possible design and justification for a biogasplant at Nyazura Adventist High School,Rusape, ZimbabwePatrick Mukumba, Golden Makaka, SampsonMamphweli and Sherpherd Misi
22 Critical factors to be considered when planningthe implementation of environmentalimprovements and energy savingJuliane Barbosa dos Santos and Charbel JoséChiappetta Jabbour
30 Emissions analysis from combustion of eco-fuelbriquettes for domestic applicationsTsietsi J Pilusa, Robert Huberts and EdisonMuzenda
37 Experimental study on natural convectiongreenhouse drying of papadMahesh Kumar
44 Dirt analysis on the performance of an engine cooling systemYashvir Singh and Nishant Kr. Singh
51 System and component modelling of a lowtemperature solar thermal energy conversioncycleShadreck M Situmbeko and Freddie L Inambao
63 Modelling influence of temperature on dailypeak electricity demand in South AfricaDelson Chikobvu and Caston Sigauke
71 Performance analysis of an air humidifierintegrated gas turbine with film air cooling ofturbine blade Alok K Mahapatra and B E Sanjay
82 Details of authors86 Index to Volume 24: February–November 2013
Volume 24 Number 4 • November 2013
Sponsored by the
Department of Science
& Technology
and
GIZ
This journal is accredited by the South African Departmentof Higher Education and Training for university subsidypurposes. It is abstracted and indexed in EnvironmentAbstract, Index to South African Periodicals, and the NexusDatabase System.
The journal has also been selected into the ScienceCitation Index Expanded by Thomson Reuters, andcoverage begins from Volume 19 No 1. It is also on theScientific Electronic Library Online (SciELO) SA platformand is managed by the Academy of Science of South Africa(ASSAf).
EditorRichard Drummond
Editorial board Mr J A Basson Energy consultant
Profesor K F Bennett Energy Research Centre, Universityof Cape Town
Professor A A Eberhard Graduate School of Business,University of Cape Town
Dr S Lennon Managing Director (Resources & StrategyDivision), Eskom
Mr P W Schaberg Sasol Technology (Pty) Ltd
Administration and subscriptionsMs Fazlin Harribi
Annual subscriptions (four issues)Individuals (Africa): R160 (single copy R51)Individuals (beyond Africa): US$109 (single copy US$39)Corporate (Africa): R321 (single copy R103)Corporate (beyond Africa): US$218 (single copy US$77)
Cost includes VAT and airmail postage.Cheques should be made payable to the University ofCape Town and sent to the address given below.
Enquiries may be directed to:The Editor, Journal of Energy in Southern Africa, Energy Research Centre, University of Cape Town, Private Bag, Rondebosch 7701, South AfricaTel: +27 (021) 650 3894 Fax: +27 (021) 650 2830E-mail: [email protected]
Website: www.erc.uct.ac.za
It is the policy of the Journal to publish papers covering thetechnical, economic, policy, environmental and socialaspects of energy research and development carried out in,or relevant to, Southern Africa. Only previously unpublishedwork will be accepted; conference papers delivered but notpublished elsewhere are also welcomed. Short comments,not exceeding 500 words, on articles appearing in theJournal are invited. Relevant items of general interest,news, statistics, technical notes, reviews and researchresults will also be included, as will announcements ofrecent publications, reviews, conferences, seminars andmeetings.
Those wishing to submit contributions should refer to theguidelines given on the inside back cover.
The Editorial Committee does not accept responsibility forviewpoints or opinions expressed here, or the correctnessof facts and figures.
© Energy Research Centre ISSN 1021 447X

Abstract
The South African Government currently faces thedual problems of climate change mitigation and therollout of electricity provision to rural, previouslydisadvantaged communities. This paper investigatesthe economic efficiency of the implementation ofconcentrator photovoltaic (CPV) technology in theTyefu area in the Eastern Cape, South Africa, as ameans of addressing these problems. Two cost-ben-efit analyses (CBA) are carried out in the study,namely a private CBA and a social CBA. The pri-vate CBA investigates the desirability of the CPVproject from a private energy investor’s perspective,whilst the social CBA investigates the desirability ofthe CPV project from society’s perspective. Thesocial CBA found that the project was socially viableand was, thus, an efficient allocation of governmentresources. The private CBA, on the other hand,found that investing in a CPV project was not finan-cially viable for a private investor. With respect tothe incentive scheme currently offered to privateenergy investors, it is recommended that the maxi-mum bidding price of R2.85/kWh be increased. Asensitivity analysis of the bidding price showed thatan increase of 300% is required to attract privateinvestors into electricity generation projects.
Keywords: Cost-benefit analysis, concentrator pho-tovoltaic technology, social discount rate
1. Introduction
South Africa relies heavily on fossil fuels, particular-ly coal, to generate electricity (Department ofMinerals and Energy, 2003). The use of fossil fuels,however, contributes to climate change, as it pro-duces greenhouse gases (GHGs). Internationally,South Africa is the 31th highest emitter of CO2emissions with 9.2 metric tons per capita, whereasit is ranked 20th highest emitter of CO2 emissionswith 1.59 metric tons per GDP (World Bank, 2010).Coupled with the environmental consequences offossil fuel use, South Africa has a further responsi-bility of addressing the inherited backlog of electric-ity provision to the mostly rural, previously disad-vantaged communities. In an attempt to addressthese two problems, the government issued theWhite Paper on Renewable Energy. In this paper,renewable energy alternatives are proposed toreplace a portion of traditional electricity generatingmethods.
Concentrator photovoltaic (CPV) energy gener-ation is one such renewable option available to gov-ernment. CPV is a form of active1 solar-basedrenewable technologies that absorb energy from thesun into solar PV panels consisting of cells. The sun-light entering the cell is concentrated2 through theuse of mirrors or lenses that focus or concentratesunlight onto PV material. The concentration ofsunlight increases the intensity of the light, whichallows the generation of more electricity. Owing tothe light being concentrated, the cells in CPV useless semiconductor material, which makes themmore efficient in comparison to conventional pho-tovoltaic (PV) cells. The optical elements (such aslenses) multiply the sunlight intensity by factors thatrange from 2 (low concentration) to more than1000 (high concentration). Figure 1 depicts theprinciple arrangement of a CPV concentrator.
2 Journal of Energy in Southern Africa • Vol 24 No 4 • November 2013
A cost-benefit analysis of concentrator photovoltaic
technology use in South Africa: A case study
Mario du Preez
Justin BeukesDepartment of Economics, Nelson Mandela Metropolitan University
Ernest van DykDepartment of Physics, Nelson Mandela Metropolitan University

Figure 1: Principle arrangement of a CPV
concentrator
Sunlight is concentrated by optical devices likelenses or mirrors thereby reducing the area ofexpensive solar cells and increasing their efficiency(PV Technology Research Advisory Council, 2007).The motive for applying this technology is to gener-ate maximum electrical power with the minimumsolar cell area, which in turn significantly lower thecosts of photovoltaic generation (Daido, 2011a).
Both conventional PV and CPV systems can beused for grid-connected electricity generation andoff-grid (stand-alone) generation. The latter is themost common application and where both photo-voltaic technologies gain their advantage (Winkler,2005). The useful life of a PV cell is a function ofmanufacturing methods and quality of the materialused. Applications based on silicon material areoften given a manufacturer’s warranty of 25 yearsor more, although the expected useful life is muchlonger. CPV requires that the sun’s orbit be trackedby moving the system accordingly, which alsoallows for a longer exposure time of the cells duringthe day (PV Technology Research AdvisoryCouncil, 2006).
CPV is a technology that operates well inregions with high solar radiation, utilising direct nor-mal irradiance. As such, South Africa is particularlywell suited for this technology, with average solarradiation levels ranging from 4.5 to 6.5kWh/m2.CPV is also well suited for off-grid application,which addresses electricity demand in remote ruralareas.
There is, however, a paucity of published stud-ies that establish the economic rationale for the useof solar energy in South Africa. This study aims tofill this gap. To the authors’ knowledge, this is thefirst formal attempt in South Africa to establish theeconomic efficiency of the use of CPV. Theapproach employed to achieve this aim is the costbenefit analysis (CBA) method. Two types of CBAare performed, namely a private CBA and a socialCBA. The private CBA evaluates the CPV projectfrom a private investor’s perspective and the socialCBA evaluates the CPV project from society’s pointof view. In terms of the social CBA, the currentmeans of providing electricity can be viewed as the‘without scenario’, while the CPV project is the ‘with
scenario’. The net benefit arising from the CPV proj-ect will simply be the difference between the ‘with’and ‘without’ scenarios. In order to estimate the netbenefit, an attempt is made to identify and estimate(where possible) the social benefits and social coststhat will occur upon project execution. With respectto the private CBA, the private benefits of the CPVproject are simply compared to the private costs.
The study area chosen for the implementation ofthe CPV project is the Tyefu rural3 settlement locat-ed in the Eastern Cape, South Africa. The settle-ment is called Tyefu and consists of five villages,namely Ndlambe, Ndwayana, Glenmore, Pikoliand Kalikeni (Monde-Gweleta, van Averbeke,Ainslie, Ntshona, Fraser and Belete 1997). Tyefufalls under the Ngqushwa Local Municipality, whichin turn falls under the jurisdiction of the AmatholeDistrict Municipality, Eastern Cape Province(Ngqushwa Local Municipality, 2011). The localcommunities in Tyefu are poor - the majority ofhouseholds (66.8%) in the region earn less thanR1500 per month (Ngqushwa Local Municipality,2011). Most households depend on pensions andsocial grants as their main source of income. Tyefuwas deemed ideal to serve as a case study due tofour characteristics. First, Tyefu is a remote rural set-tlement at the end of the national grid. Second, thecommunity is very poor and previously disadvan-taged. Third, many households are without Eskomgenerated electricity. Last, the study area is locatedin an area with irradiance levels suitable for CPV.CPV technology requires direct normal irradiance(DNI) from the sun to generate electricity. The Tyefuarea experiences annual average DNI levels of5.27kWh/m2 which are ideal for CPV systems(National Renewable Energy Laboratory, 2011).
2. The CPV project
The Ngqushwa Municipality identified 84 house-holds in the Tyefu area as not having electricity.These households formed the sample on which thedemand for electricity, and thus the CPV project, isbased. Traditionally, unelectrified rural, households,such as those found in Tyefu, have obtained theirenergy from several sources, namely paraffin, can-dles, liquefied petroleum gas (LPG), dry-cell batter-ies, car batteries, wood, and diesel and petrol gen-erators (Aitken, 2007). The amount of electricityrequired to replace some of the traditional energysources is calculated below and was established byusing Aitken’s (2007) study results and personalcorrespondence (Purcell, 2011). Figure 2 providesthe basic floor plan of a sample household forwhich a CPV system can provide electricity.
Figure 2 depicts a household which uses fourfluorescent lamps, a television set, a radio andrefrigerator. In order to provide an equivalentamount of energy4 to light four rooms, run a televi-sion set, radio and refrigerator for one year, the typ-
Journal of Energy in Southern Africa • Vol 24 No 4 • November 2013 3

ical Tyefu household requires:• 6.39 litres of paraffin (lighting) at a cost of
R639.24 per annum.• 22 charges for a car battery (TV) at a cost of
R333.44 per annum.• 57 sets (4 batteries per set) of dry cell batteries
(radio) at a cost of R902.26 per annum.• 20.11 kilograms of LPG (fridge) at a cost of
R854.77 per annum (Purcell, 2011).
In order to meet the electricity needs of the sam-ple households identified, a CPV system will beinstalled and operated (‘the CPV project’) with anelectricity generating capacity of 30kWp and anannual output of 30.3MWh per annum. The CPVmodules that will be used are mounted on a dual-axis system in order to track the sun’s movement. Abattery bank will be used to store the energy pro-duced for use at non-generating hours.
Either Eskom or independent power producers(IPPs) could implement the CPV project in theTyefu area. This would align well with Eskom’sattempts to mitigate grid instability issues, by invest-ing in off-grid, distributed generation, co-generationand small-scale renewable projects (Eskom, 2011).If an IPP were to undertake the project, they wouldengage in the bidding process to supply the elec-tricity generated by the system (Norton Rose,2011). If the project were to be undertaken byEskom, it would also be managed by them. On theother hand, if IPPs were to undertake the project,they would outsource management to a servicesengineering and managing company (Pardell,2011). The installation of the CPV system could becarried out by a services engineering and manage-ment company regardless of whether Eskom or anIPP were to undertake the project. Installation of the30kWp system would take approximately 2 months.Maintenance of the system could also be performedby a services engineering and management compa-ny. Basic maintenance can be performed by trainedlocals. However, more advanced technical mainte-nance would have to be undertaken by more high-ly trained individuals within the management com-pany.
3. Cost benefit analysis
Cost benefit analysis (CBA) is a standard techniqueused to assess the desirability of an investment proj-ect (Watkins, 2010). More specifically, the costs andbenefits of a project are determined and compared.The measured costs and benefits are weighed upagainst each other to establish criteria for decision-making. Normally, one or more of the followingthree decision-making criteria are used, namely thenet present value (NPV), the internal rate of return(IRR) and the discounted benefit cost ratio (BCR)(Hanley and Spash, 1993). The NPV determineswhether the sum of discounted benefits (B) exceedsthe sum of discounted costs (C). The NPV can beformally expressed as follows:
If the BCR exceeds unity, then the project may pro-ceed (Hanley and Spash, 1993).
There are four standard elements to CBA: timeconsiderations, costs, benefits, and the discountrate. All of these are discussed below for the privateCBA and the social CBA, respectively.
3.1 Private CBA
The private CBA employs costs and benefits valuedat market prices (i.e. purely financial flows), andomit any potential effects the project may have onsociety.
3.1.1 Time considerationsAll the estimated private cost and private benefitflows used in this analysis are captured in perannum periods and expressed at 2010 price levels.
4 Journal of Energy in Southern Africa • Vol 24 No 4 • November 2013
Figure 2: Sample household

The project period or time horizon of the projectwas set at 25 years.
3.1.2 The private costs of the CPV projectInvestment costsThe investment cost comprises initial capital costson the system (500 times concentration CPV mod-ules, trackers and inverters), the regulator, initialbattery bank, transportation (foreign and local),installation and training. Of all the capital equip-ment, only the system is imported– the regulatorand battery bank are acquired locally. The deriva-tion of the system cost is shown in Table 1.
Local transport consists of a fee of R8 950 percontainer (one container is used) and a fuel sur-charge of 5.3 percent. Insurance and freight cost forthe private analysis includes customs duties (R80306.85) and customs VAT (R93 691.36) amongother charges imposed by both local and foreignports (Emery, 2011). In addition to these costs,costs are also incurred for the installation of the sys-tem and the training of maintenance staff. Table 2below gives the breakdown of the investment costcomponent.
Table 2: Private investment cost derivation
Source: Emery (2011); Pardell (2011)
Cost component Private cost (R)
System 257 305.54
Regulator 40 000
Batteries (96 batteries) 96 000
Insurance and freight 206 915.57
Local transport 9 424.35
Installation 217 675.24
Training 10 000
Total 837 320.69
Operating and maintenance costsAnnual operating and maintenance costs consist ofexpenditures on labour (two unskilled labourers forroutine tasks and one skilled labourer to managethe plant and to perform more advanced tasks),materials (spare parts and lubricants) and water(water cost is assumed to be zero since the amountused is considered negligible). In addition to theannual operating and maintenance costs, everyfour years the cost to replace the battery bank isadded to the annual figure. The operating andmaintenance costs (with battery cost) are displayedin Table 3.
Table 3: Cost components of operating and
maintenance with battery cost
Source: Pardell (2011); Statistics South Africa
(2007)
Operating and maintenance Market price (R)component per annum
Skilled labour 80 478.22
Unskilled labour 47 553.60
Spare parts 41 968.18
Batteries 96 0005
Total 266 000
Decommissioning costsLastly, decommissioning costs (occurring in the finalyear) comprise of costs to dismantle the CPV plant.This cost equals R14 569.96 (Pardell, 2011).
3.1.3 The private benefits of the CPV projectThe private benefits are the revenue earned by theprivate investor who initiates the project. This rev-enue is estimated as the product of the volume ofelectricity output and its unit value. The latter is theupper limit of the submitted price by the privateinvestor during the bidding process (Norton Rose,2011). The electricity output is expected to be 30300kWh per year. Using the current upper limit forCPV in the bidding process of R2.85/kWh (NortonRose, 2011), the expected revenue from the sale ofelectricity is R86 355 per annum.
Income from recycling the plant’s componentsduring decommissioning, and the recycling of thebatteries every four years (Table 4), is also includedin the private analysis. This amounted toR12 084.60.
Table 4: A breakdown of the income from
recycling the CPV plant
Source: Goosen (2011)
Component Weight (kg) R/kg Private in-come (R)
Glass 810 0.22 178.20
Aluminium 600 10.50 6 300
Steel 2190 2.56 5 606.40
Total 12 084.60
3.1.4 The private discount rateThe private discount rate was estimated as the dif-ference between the prime lending rate and theinflation rate. Table 5 shows the data used for thiscalculation.
Journal of Energy in Southern Africa • Vol 24 No 4 • November 2013 5
Table 1: Derivation of the system cost
Cost component Euro/Wp Rand/Euro Rand/Wp System size (Wp) Local cost (R)(a) (b) (c) = (a) x (b) (d) (e) = (c) x (d)
System 0.88 9.71 8.58 30 000 257 305.54
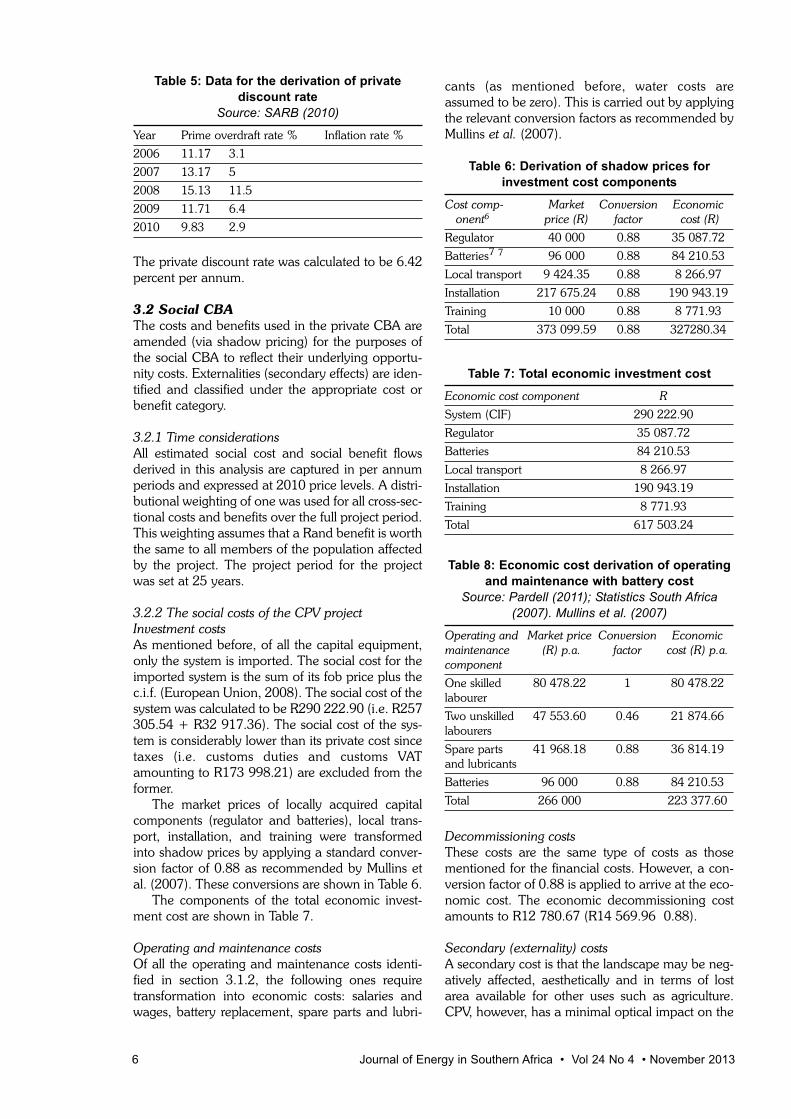
Table 5: Data for the derivation of private
discount rate
Source: SARB (2010)
Year Prime overdraft rate % Inflation rate %
2006 11.17 3.1
2007 13.17 5
2008 15.13 11.5
2009 11.71 6.4
2010 9.83 2.9
The private discount rate was calculated to be 6.42percent per annum.
3.2 Social CBA
The costs and benefits used in the private CBA areamended (via shadow pricing) for the purposes ofthe social CBA to reflect their underlying opportu-nity costs. Externalities (secondary effects) are iden-tified and classified under the appropriate cost orbenefit category.
3.2.1 Time considerationsAll estimated social cost and social benefit flowsderived in this analysis are captured in per annumperiods and expressed at 2010 price levels. A distri-butional weighting of one was used for all cross-sec-tional costs and benefits over the full project period.This weighting assumes that a Rand benefit is worththe same to all members of the population affectedby the project. The project period for the projectwas set at 25 years.
3.2.2 The social costs of the CPV projectInvestment costsAs mentioned before, of all the capital equipment,only the system is imported. The social cost for theimported system is the sum of its fob price plus thec.i.f. (European Union, 2008). The social cost of thesystem was calculated to be R290 222.90 (i.e. R257305.54 + R32 917.36). The social cost of the sys-tem is considerably lower than its private cost sincetaxes (i.e. customs duties and customs VATamounting to R173 998.21) are excluded from theformer.
The market prices of locally acquired capitalcomponents (regulator and batteries), local trans-port, installation, and training were transformedinto shadow prices by applying a standard conver-sion factor of 0.88 as recommended by Mullins etal. (2007). These conversions are shown in Table 6.
The components of the total economic invest-ment cost are shown in Table 7.
Operating and maintenance costsOf all the operating and maintenance costs identi-fied in section 3.1.2, the following ones requiretransformation into economic costs: salaries andwages, battery replacement, spare parts and lubri-
cants (as mentioned before, water costs areassumed to be zero). This is carried out by applyingthe relevant conversion factors as recommended byMullins et al. (2007).
Table 6: Derivation of shadow prices for
investment cost components
Cost comp- Market Conversion Economiconent6 price (R) factor cost (R)
Regulator 40 000 0.88 35 087.72
Batteries7 7 96 000 0.88 84 210.53
Local transport 9 424.35 0.88 8 266.97
Installation 217 675.24 0.88 190 943.19
Training 10 000 0.88 8 771.93
Total 373 099.59 0.88 327280.34
Table 7: Total economic investment cost
Economic cost component R
System (CIF) 290 222.90
Regulator 35 087.72
Batteries 84 210.53
Local transport 8 266.97
Installation 190 943.19
Training 8 771.93
Total 617 503.24
Table 8: Economic cost derivation of operating
and maintenance with battery cost
Source: Pardell (2011); Statistics South Africa
(2007). Mullins et al. (2007)
Operating and Market price Conversion Economicmaintenance (R) p.a. factor cost (R) p.a.component
One skilled 80 478.22 1 80 478.22labourer
Two unskilled 47 553.60 0.46 21 874.66labourers
Spare parts 41 968.18 0.88 36 814.19and lubricants
Batteries 96 000 0.88 84 210.53
Total 266 000 223 377.60
Decommissioning costsThese costs are the same type of costs as thosementioned for the financial costs. However, a con-version factor of 0.88 is applied to arrive at the eco-nomic cost. The economic decommissioning costamounts to R12 780.67 (R14 569.96 0.88).
Secondary (externality) costsA secondary cost is that the landscape may be neg-atively affected, aesthetically and in terms of lostarea available for other uses such as agriculture.CPV, however, has a minimal optical impact on the
6 Journal of Energy in Southern Africa • Vol 24 No 4 • November 2013

ground. The ground beneath the CPV panelreceives enough sunlight so that it may be used foragricultural purposes. The visual impact on the sitelocation is minimal (Daido, 2011b).
3.2.3 The social benefits of the CPV projectPrimary benefitsThe social benefits of CPV are based on the ‘with orwithout’ principle. Without CPV, the Tyefu commu-nity would incur costs in obtaining energy for them-selves. With CPV, the community avoids thesecosts. These avoided costs are the economic bene-fits of CPV in the study.8 The savings of recurringenergy costs relative to the existing situation for 84households amounted to R201 137.04 per annum(Purcell, 2011). The disaggregated cost savings areshown in Table 9.
Table 9: Disaggregated cost savings
Source: Purcell (2011)
Com- Cost per house- No. of Total (R)ponent hold p.a. (R) households
(a) (b) (c) = (a) x (b)
Paraffin 639.24 84 53 696.43
Car battery 333.44 84 28 008.95
Dry cell 902.26 84 75 790.14batteries
LPG 854.77 84 71 800.71
Total 2 729.72 229 296.20
The total cost savings amount was convertedinto an economic benefit by applying the standardconversion factor (R229 296.20 0.88 = R201137).
Income from recycling the plant’s componentsduring decommissioning, and the recycling of thebatteries every four years, is also considered in thesocial analysis. The economic benefit from recyclingthe glass, aluminium and steel of the CPV plant iscalculated to be R10 600.53 (R156.32 +R5 526.32 + R4917.89). The income from therecycling of batteries every four years is R48661.05. Table 10 shows the income from recycling.
Secondary benefitsCPV systems do not emit any GHGs during powergeneration. This benefit is insignificant, given thesize of the study area, and is thus not included in theanalysis (SolFocus, 2011b).
3.2.4 The social discount rateThe social discount rate used is a composite ratemade up of the social opportunity cost of capital(SOCC) and the social time preference rate of con-sumption (STPR).
The composite social discount rate can beestimated as follows:
i = (1 – ƒ)t[(1 – s)(x1 – p) + (s)(x2 – p)] +(1 – ƒ)(1 – t)(x3 – p) + ƒ (x4 – p) (4)
where:ƒ = proportion of foreign funding of total; t = proportion of government expenditure
funded through taxes paid; 1 – t = proportion of government expenditure
funded through borrowing; s = proportion of people’s disposable
ncome that is saved;1 – s = proportion of disposable income con-
sumed; x1 = average of the predominant overdraft rate
on current accounts and the term lending base rate;
x2 = average of dividend yield and the capital growth of all listed shares on the Johannesburg Stock Exchange;
x3 = average of the government loan stock yield and the Eskom bond rate;
x4 = interest rate cost of foreign funding; p = consumer price index (inflation) (DuPreez, 2004).
Data was gathered for these mentioned vari-ables for the period 2006 to 2010. Table 11 showsthe cost of government borrowing, the cost ofhousehold consumption borrowing, the return onsavings and the annual inflation rate for the period(2006 to 2010). Table 12 shows the calculation ofweights t and 1 – t and Table 13 shows the calcula-tion of weights s and 1 – s.
Using the above equation and the data provid-ed in Tables 11, 12 and 13, the real social discountrate was estimated at 5.97 percent per annum.
Journal of Energy in Southern Africa • Vol 24 No 4 • November 2013 7
Table 10: Income from recycling the CPV plant and batteries
Component Weight (kg) R/kg Private income (R) Conversion factor Economic income (R)
Glass 810 0.22 178.20 0.88 156.32
Aluminium 600 10.50 6 300 0.88 5 526.32
Steel 2190 2.56 5 606.40 0.88 4 917.89
Battery 12 192 4.55 55 473.60 0.88 48 661.05

8 Journal of Energy in Southern Africa • Vol 24 No 4 • November 2013
Table 11: Cost of government borrowing, cost of household consumption borrowing, the return on
savings and the annual inflation rate (2006-2010)
Source: SARB (2010)
Table 12: The calculation of discount rate weights t and 1 – t
Source: SARB (2010)
Year Government borrowing Government Total R millions Borrowing proportion Tax revenue requirement revenue (c) = (a) + (b) (a)/(b) proportionR millions (a) R millions (b) (1 – t) (b)/(c) (t)
2006 6 868 402 463 409 331 0.017 0.983
2007 -6 049 470 168 464 119 -0.013 1.013
2008 -16 584 547 977 531 393 -0.031 1.031
2009 13 065 595 972 609 037 0.021 0.979
2010 132 233 570 565 702 798 0.188 0.812
Table 13: The calculation of discount rate weights s and 1 – s
Source: SARB (2010)
Year Final consump- Gross savings Gross national Final consumption Gross savingstionexpenditure R millions disposable income expenditure proportion proportion R millions (a) (b) (c) = (a) + (b) (a)/(b) (1 – s) (b)/(c) (s)
2006 1 116 315 254 196 1 370 511 0.815 0.185
2007 1 264 726 287 680 1 552 406 0.815 0.185
2008 1 398 236 350 846 1 749 082 0.799 0.201
2009 1 456 089 372 826 1 828 915 0.796 0.203
2010 1 575 420 438 094 2 013 514 0.782 0.218
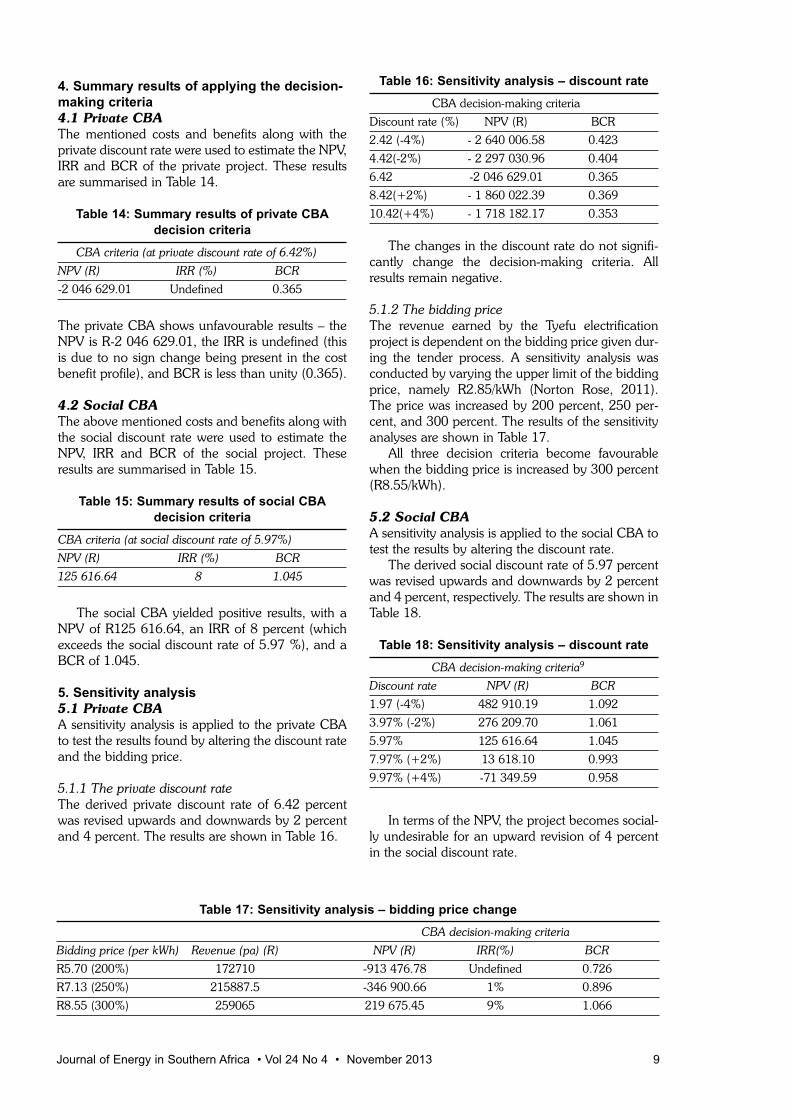
4. Summary results of applying the decision-
making criteria
4.1 Private CBA
The mentioned costs and benefits along with theprivate discount rate were used to estimate the NPV,IRR and BCR of the private project. These resultsare summarised in Table 14.
Table 14: Summary results of private CBA
decision criteria
CBA criteria (at private discount rate of 6.42%)
NPV (R) IRR (%) BCR
-2 046 629.01 Undefined 0.365
The private CBA shows unfavourable results – theNPV is R-2 046 629.01, the IRR is undefined (thisis due to no sign change being present in the costbenefit profile), and BCR is less than unity (0.365).
4.2 Social CBA
The above mentioned costs and benefits along withthe social discount rate were used to estimate theNPV, IRR and BCR of the social project. Theseresults are summarised in Table 15.
Table 15: Summary results of social CBA
decision criteria
CBA criteria (at social discount rate of 5.97%)
NPV (R) IRR (%) BCR
125 616.64 8 1.045
The social CBA yielded positive results, with aNPV of R125 616.64, an IRR of 8 percent (whichexceeds the social discount rate of 5.97 %), and aBCR of 1.045.
5. Sensitivity analysis
5.1 Private CBA
A sensitivity analysis is applied to the private CBAto test the results found by altering the discount rateand the bidding price.
5.1.1 The private discount rateThe derived private discount rate of 6.42 percentwas revised upwards and downwards by 2 percentand 4 percent. The results are shown in Table 16.
Table 16: Sensitivity analysis – discount rate
CBA decision-making criteria
Discount rate (%) NPV (R) BCR
2.42 (-4%) - 2 640 006.58 0.423
4.42(-2%) - 2 297 030.96 0.404
6.42 -2 046 629.01 0.365
8.42(+2%) - 1 860 022.39 0.369
10.42(+4%) - 1 718 182.17 0.353
The changes in the discount rate do not signifi-cantly change the decision-making criteria. Allresults remain negative.
5.1.2 The bidding priceThe revenue earned by the Tyefu electrificationproject is dependent on the bidding price given dur-ing the tender process. A sensitivity analysis wasconducted by varying the upper limit of the biddingprice, namely R2.85/kWh (Norton Rose, 2011).The price was increased by 200 percent, 250 per-cent, and 300 percent. The results of the sensitivityanalyses are shown in Table 17.
All three decision criteria become favourablewhen the bidding price is increased by 300 percent(R8.55/kWh).
5.2 Social CBA
A sensitivity analysis is applied to the social CBA totest the results by altering the discount rate.
The derived social discount rate of 5.97 percentwas revised upwards and downwards by 2 percentand 4 percent, respectively. The results are shown inTable 18.
Table 18: Sensitivity analysis – discount rate
CBA decision-making criteria9
Discount rate NPV (R) BCR
1.97 (-4%) 482 910.19 1.092
3.97% (-2%) 276 209.70 1.061
5.97% 125 616.64 1.045
7.97% (+2%) 13 618.10 0.993
9.97% (+4%) -71 349.59 0.958
In terms of the NPV, the project becomes social-ly undesirable for an upward revision of 4 percentin the social discount rate.
Journal of Energy in Southern Africa • Vol 24 No 4 • November 2013 9
Table 17: Sensitivity analysis – bidding price change
CBA decision-making criteria
Bidding price (per kWh) Revenue (pa) (R) NPV (R) IRR(%) BCR
R5.70 (200%) 172710 -913 476.78 Undefined 0.726
R7.13 (250%) 215887.5 -346 900.66 1% 0.896
R8.55 (300%) 259065 219 675.45 9% 1.066

6. Conclusion and recommendations
The purpose of this study was to evaluate the eco-nomic feasibility of a concentrator photovoltaicproject in a non-electrified, rural, previously disad-vantaged community. The study area chosen for thecase study was a settlement, named Tyefu, consist-ing of five villages in the Eastern Cape province ofSouth Africa. Two cost benefit analyses (CBAs)were carried out: a private CBA to investigate theproject’s feasibility from a private energy investor’spoint of view, and a social CBA to investigate theproject’s desirability from society’s perspective.
The main results were favourable in terms of thesocial CBA, but unfavourable for the private CBA.More specifically, the social CBA yielded a NPV ofR125 616.64, an IRR of 8 percent (which exceedsthe social discount rate of 5.97%) and a BCR of1.045, whereas the private CBA yielded a NPV ofR-2 046 629.01 and a BCR of 0.365 (the IRR couldnot be calculated as there was no sign change in thecost benefit profile – all net benefits were negative).
It can thus be deduced that CPV rollout appearsto be economically efficient on a small scale accord-ing to the social CBA, but not according to the pri-vate CBA. The benefit (income received per kWh)in the private CBA is too small to outweigh the costsof implementing and running a CPV plant in Tyefu.Currently the maximum revenue investors can earnfrom CPV is R2.85/kWh (Norton Rose, 2011). Fora small plant of Tyefu’s size, this amount is not highenough to attract private energy investors intoundertaking a project of this kind. A sensitivityanalysis showed that the current upper limit must beincreased by up to 300% to make a project of thismagnitude financially viable.
Notes
1. Passive solar energy refers to the design of buildingsfor harnessing the sun’s energy.
2. Conventional solar PV systems make use of non-con-centrated sunlight.
3. An anonymous referee made the valid point that nor-mal PV prices have fallen since 2010. Therefore smallscale CPV which is more maintenance intensive, maybe difficult to justify in remote rural areas.
4. These costs were calculated using an energy conver-sion table where the useful energy is determined pertraditional fuel (Purcell, 2011).
5. The battery cost is only incurred every four years.
6. All cost components relate to a system size of 30 000Wp.
7. 96 batteries are required for electricity storage.
8. An anonymous referee made the valid point that ifelectricity was generated for income generation (pro-ductive use), then both the social and private per-spectives would change in a positive direction.
9. The IRR is not reported here, as a change in the dis-count rate does not affect it. The IRR is independentof the discount rate, and remains at 8%.
Acknowledgements
The authors wish to thank two anonymous referees fortheir valuable comments as well as an anonymous refer-ee from the ERSA for additional comments and recom-mendations.
References Aitken, R. (2007). Household Energy Use: A
Comparison of Household Energy Consumption andExpenditure across Three Provinces. Journal ofEnergy in Southern Africa, 18(1): 20-28.
Daido. (2011a). What is CPV and Why It is Important?Online.http://www.daido.co.jp/en/products/cpv/whats.html. (Accessed 16 March 2011).
Daido. (2011b). Double Use of Land. Online.http://www.daido.co.jp/en/products/cpv/space.html. (Accessed 21 May 2011).
Department of Minerals and Energy. (2003). WhitePaper on Renewable Energy. Online.http://www.info.gov.za/view/DownloadFileAction?id=68765. (Accessed 14 October 2009).
Du Preez, M. (2004). The Discount Rate for PublicSector Conservation Projects in South Africa. AfricanDevelopment Review. 16: 456-471.
Emery, J. (2011). Personal Correspondence. DBShenker. Port Elizabeth.
Eskom. (2011). Guide to Independent Power Producer(IPP) Processes. Online.http://www.eskom.co.za/live/content.php?Item_ID=14324. (Accessed 19 May 2011).
Goosen, J. (2011). Personal Correspondence. RECLAM.Port Elizabeth.
Hanley, N. and Spash, C.L. (1993). Cost-BenefitAnalysis and the Environment. Vermont: EdwardElgar.
Monde-Gweleta, N.N., van Averbeke, W., Ainslie, A.,Ntshona, Z.M., Fraser, G.C.G., and Belete, A.(1997). Agriculture and Rural Livelihood in North-West Peddie district. Agrekom.36: 616-625.
Mullins, D., Mosaka, D.D., Green, A.B., Downing, R.and Mapekula, P.G. (2007). A Manual for CostBenefit Analysis in South Africa with SpecificReference to Water Resource Development. WaterResearch Commission, Report No. TT 305.07. 2nded. South Africa: Conningarth Economists.
National Renewable Energy Laboratory. (2011).Climatological Solar Radiation (CSR) Model. Online.http://www.nrel.gov/gis/solar_map_development.html. (Accessed 29 January 2010).
Ngqushwa Local Municipality. (2011). IntegratedDevelopment Plan (IDP). Online.http://www.ngqushwamun.gov.za/INTEGRATED-FEVELOPMENT-PLAN. (Accessed 20 June 2011).
Norton Rose, (2011). South Africa Renewable EnergyIPP Request for Proposals. Online: http://www.nor-tonrose.com/knowledge/publications/54959/south-africa-renewable-energy-ipp-request-for-pro-
10 Journal of Energy in Southern Africa • Vol 24 No 4 • November 2013

posals. (Accessed 15 August 2011). Pardell, R. (2011). Personal Correspondence. Valldoreix
Greenpower. Valldoreix, Spain.Purcell, C. (2011). Personal Correspondence. Energy
and Development Group (EDG). Port Elizabeth.PV Technology Research Advisory Council. (2006). A
Strategic Research Agenda for Photovoltaic SolarEnergy Conversion Technology. Online.http://www.eurec.be/en/. (Accessed 29 January2010).
PV Technology Research Advisory Council. (2007). AStrategic Research Agenda for Photovoltaic SolarEnergy Conversion Technology. Online.http://www.eurec.be/en/. (Accessed 29 January2010).
South African Reserve Bank. (2010). Official Website.Online. http://www.reservebank.co.za. (Accessed4 March 2010).
SolFocus. 2011b. Sustainability. Online.http://www.solfocus.com/en/sustainability/.(Accessed 22 March 2011).
Statistics South Africa. (2007). Labour Force Survey.Online:http://www.statssa.gov.za/publications/P0210/P0210March2007.pdf. (Accessed 23 January 2011).
The World Bank (2010). Database. http://data.world-bank.org/indicator/EN.ATM.CO2E.PC?order=wbapi_data_value_2010+wbapi_data_value+wbapi_data_value-last&sort=desc. (Accessed 31October 2013).
Watkins, T. (2010). An Introduction to Cost BenefitAnalysis. Online.http://www.sjsu.edu/faculty/watkins/cba.htm.(Accessed 22 April 2010).
Winkler, H. (2005). Renewable Energy Policy in SouthAfrica: Policy Options for Renewable Electricity.Energy Policy. 33: 27-38.
Received 3 July 2012; revised 4 November 2013
Journal of Energy in Southern Africa • Vol 24 No 4 • November 2013 11
Abstract
The research study was carried out to assess thebiogas potential at Nyazura Adventist High School,Rusape, Zimbabwe, a co-educational school with atotal enrolment of 700 boarders. The school is con-nected to the national grid electricity. The electricityis in short supply due to long hours of load shed-ding. Firewood to be used for heating and cookingpurposes is in short supply. The main objective ofthe study was to make an assessment of biogaspotential at the school. The energy demand for thewhole school was calculated and it was found to be2 710 kWh per day. The biogas yields for the feed-stocks at the school were estimated. The total bio-gas yield that could be obtained from the feedstockswas 50 m3 per day. The digesters volume for thefeedstocks was estimated and the material require-ments for the digesters were also determined. Thetechno-economic analysis of the proposed projectwas done. The results suggested that the proposedproject was feasible, and it was concluded that theschool is capable of producing enough biogas fromits feedstocks to support a feasible project. The daily50 m3 biogas yield is adequate to supply enoughelectricity for lighting purposes during the loadshedding periods.
Keywords: biogas potential, techno-economic anal-ysis, biogas digesters
1. Introduction
Biogas refers to a gas produced by anaerobic fer-mentation of organic matter in the absence of oxy-gen in airtight containers called biogas digesters(Walekwa et al., 2009; Sibisi and Green, 2005).The composition of biogas varies depending on theraw materials, the organic load applied, the reten-tion period and temperature. The gas consistsmainly of methane, which is generally between55%-80% (Jemmett, 2006). Biogas contains about9 kWh/m3 of available energy (Thouars, 2006).
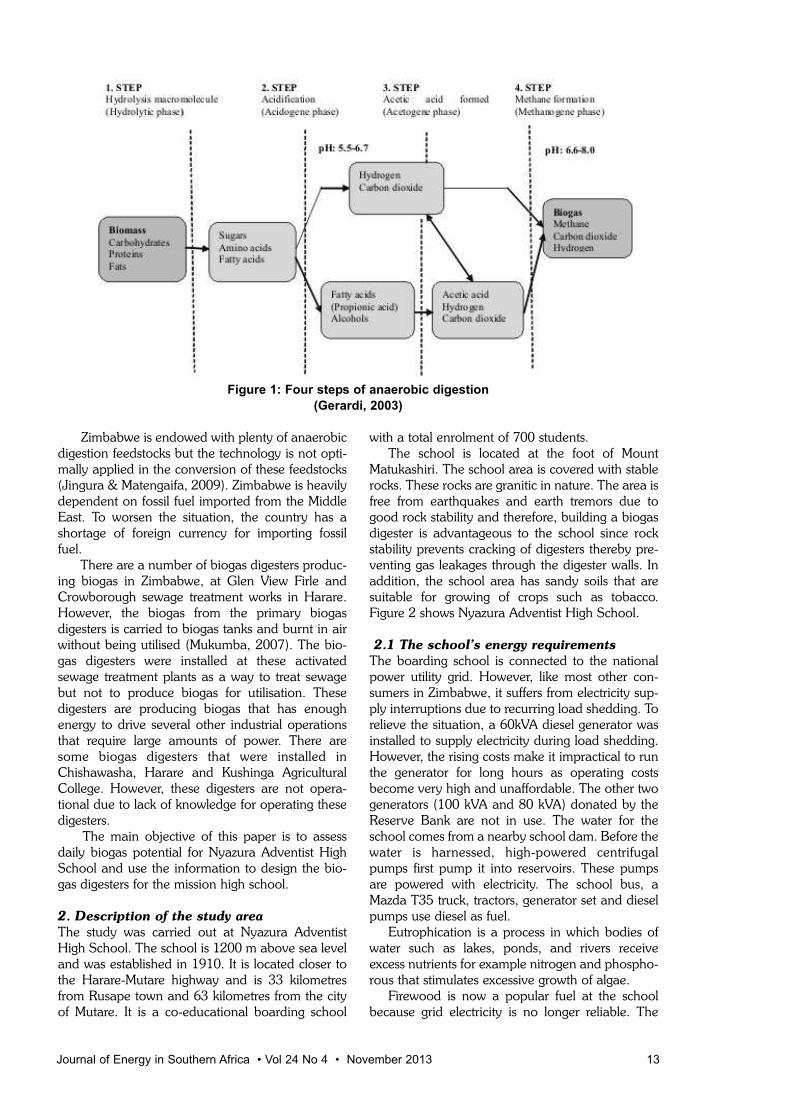
Biogas is about 20% lighter than air and has anignition temperature in the range of 650-750 °C(Deublein & Steinhauser, 2008). It is an odourlessand colourless gas that burns with a blue flame sim-ilar to that of liquid petroleum gas (Sathianathan,1975).The biogas anaerobic process is divided intofour steps as follows: hydrolysis, fermentation (aci-dogenesis), anaerobic oxidation (acetogenesis) andmethanization (Davidsson, 2007; Goswami &Kreith, 2008; Leksell, 2005). Figure 1 shows thedegradation pathways to produce methane.
Biogas technology can be viewed as a vehicleto reduce rural poverty and leads to rural develop-ment. Biogas can be an energy substitute for animalwaste, fire wood, agricultural residues, diesel, paraf-fin, petrol and electricity. In addition, eutrophicationand air pollution are minimized (Lantz et al., 2007).Furthermore, it eliminates the daily task of firewood gathering (Mwakaje, 2007). Biogas can beregarded as an eco-friendly fuel and can be used asa substitute for compressed natural gas.
12 Journal of Energy in Southern Africa • Vol 24 No 4 • November 2013
A possible design and justification for a biogas plant at
Nyazura Adventist High School, Rusape, Zimbabwe
Patrick Mukumba Physics Department, University of Fort Hare, South Africa
Golden MakakaPhysics Department, University of Fort Hare, South Africa
Sampson MamphweliInstitute of Technology, University of Fort Hare, South Africa
Sherpherd MisiDepartment of Civil Engineering, Faculty of Engineering, University of Zimbabwe, Zimbabwe
Zimbabwe is endowed with plenty of anaerobicdigestion feedstocks but the technology is not opti-mally applied in the conversion of these feedstocks(Jingura & Matengaifa, 2009). Zimbabwe is heavilydependent on fossil fuel imported from the MiddleEast. To worsen the situation, the country has ashortage of foreign currency for importing fossilfuel.
There are a number of biogas digesters produc-ing biogas in Zimbabwe, at Glen View Firle andCrowborough sewage treatment works in Harare.However, the biogas from the primary biogasdigesters is carried to biogas tanks and burnt in airwithout being utilised (Mukumba, 2007). The bio-gas digesters were installed at these activatedsewage treatment plants as a way to treat sewagebut not to produce biogas for utilisation. Thesedigesters are producing biogas that has enoughenergy to drive several other industrial operationsthat require large amounts of power. There aresome biogas digesters that were installed inChishawasha, Harare and Kushinga AgriculturalCollege. However, these digesters are not opera-tional due to lack of knowledge for operating thesedigesters.
The main objective of this paper is to assessdaily biogas potential for Nyazura Adventist HighSchool and use the information to design the bio-gas digesters for the mission high school.
2. Description of the study area
The study was carried out at Nyazura AdventistHigh School. The school is 1200 m above sea leveland was established in 1910. It is located closer tothe Harare-Mutare highway and is 33 kilometresfrom Rusape town and 63 kilometres from the cityof Mutare. It is a co-educational boarding school
with a total enrolment of 700 students.The school is located at the foot of Mount
Matukashiri. The school area is covered with stablerocks. These rocks are granitic in nature. The area isfree from earthquakes and earth tremors due togood rock stability and therefore, building a biogasdigester is advantageous to the school since rockstability prevents cracking of digesters thereby pre-venting gas leakages through the digester walls. Inaddition, the school area has sandy soils that aresuitable for growing of crops such as tobacco.Figure 2 shows Nyazura Adventist High School.
2.1 The school’s energy requirements
The boarding school is connected to the nationalpower utility grid. However, like most other con-sumers in Zimbabwe, it suffers from electricity sup-ply interruptions due to recurring load shedding. Torelieve the situation, a 60kVA diesel generator wasinstalled to supply electricity during load shedding.However, the rising costs make it impractical to runthe generator for long hours as operating costsbecome very high and unaffordable. The other twogenerators (100 kVA and 80 kVA) donated by theReserve Bank are not in use. The water for theschool comes from a nearby school dam. Before thewater is harnessed, high-powered centrifugalpumps first pump it into reservoirs. These pumpsare powered with electricity. The school bus, aMazda T35 truck, tractors, generator set and dieselpumps use diesel as fuel.
Eutrophication is a process in which bodies ofwater such as lakes, ponds, and rivers receiveexcess nutrients for example nitrogen and phospho-rous that stimulates excessive growth of algae.
Firewood is now a popular fuel at the schoolbecause grid electricity is no longer reliable. The
Journal of Energy in Southern Africa • Vol 24 No 4 • November 2013 13
Figure 1: Four steps of anaerobic digestion
(Gerardi, 2003)
firewood is used for cooking and heating purposesespecially during load shedding periods that canlast up to 15 hours. This paper seeks to assess bio-gas potential at the school so as to minimise energyproblems at the school by using biogas as an alter-native fuel for mainly lighting the whole school. Thestudy came as result of current energy related prob-lems the school is facing such as shortage of waterdue to long hours of load shedding and shortage offirewood. To worsen the situation, the copper cablessupplying the electricity to the school are often van-dalised. The most recent vandalisation of coppercables was in November, 2011. This adverselyaffected students’ reading hours especially UpperSixth and Form Four students. Due to the currentprice of diesel, the generator set is operated only forfew hours a day.
However, the school has plenty of biogas sub-strates, namely, cow dung, human excreta and veg-etable wastes. The importance of the waste materi-als in meeting the needs of the school is not beingrealised. These substrates when fed into the digesterproduce biogas and the digester sludge is ploughedback into the fields thereby improving soil fertility.The biogas from this waste material can be used bythe school as a source of cheap energy.
3. Methodology
3.1. Biogas feedstocks
The study examined the total gas yield of the fol-lowing feedstocks at the school; human excreta,cow dung, and chicken manure. This involvedphysical counting of learners, teaching and non-teaching staff, chicken and cattle at the school. Totalbiogas for all the feedstocks was then estimated.
3.2. Energy requirements
Premises at Nyazura High School that consumeelectricity were identified and these were: the school
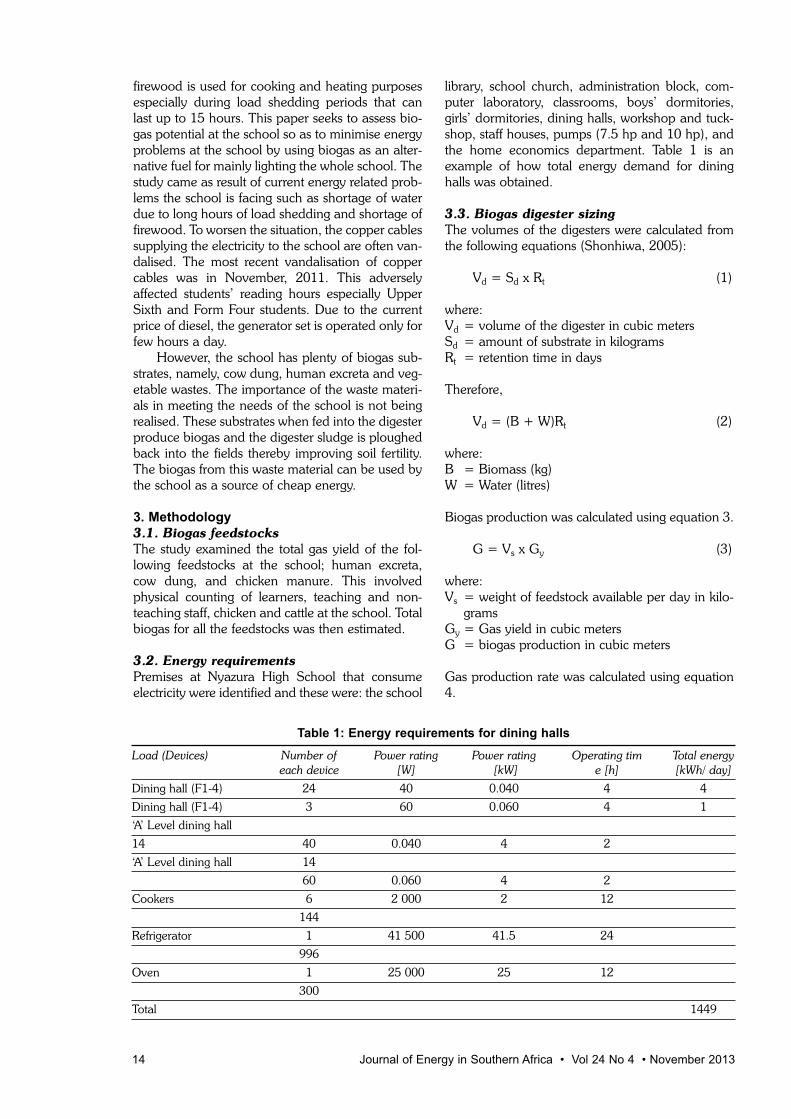
library, school church, administration block, com-puter laboratory, classrooms, boys’ dormitories,girls’ dormitories, dining halls, workshop and tuck-shop, staff houses, pumps (7.5 hp and 10 hp), andthe home economics department. Table 1 is anexample of how total energy demand for dininghalls was obtained.
3.3. Biogas digester sizing
The volumes of the digesters were calculated fromthe following equations (Shonhiwa, 2005):
Vd = Sd x Rt (1)
where:Vd = volume of the digester in cubic metersSd = amount of substrate in kilogramsRt = retention time in days
Therefore,
Vd = (B + W)Rt (2)
where:B = Biomass (kg)W = Water (litres)
Biogas production was calculated using equation 3.
G = Vs x Gy (3)
where:Vs = weight of feedstock available per day in kilo-
gramsGy = Gas yield in cubic metersG = biogas production in cubic meters
Gas production rate was calculated using equation4.
14 Journal of Energy in Southern Africa • Vol 24 No 4 • November 2013
Table 1: Energy requirements for dining halls
Load (Devices) Number of Power rating Power rating Operating tim Total energy each device [W] [kW] e [h] [kWh/ day]
Dining hall (F1-4) 24 40 0.040 4 4
Dining hall (F1-4) 3 60 0.060 4 1
‘A’ Level dining hall
14 40 0.040 4 2
‘A’ Level dining hall 14
60 0.060 4 2
Cookers 6 2 000 2 12
144
Refrigerator 1 41 500 41.5 24
996
Oven 1 25 000 25 12
300
Total 1449

Gp = G/Vd (4)
where:GP = gas production rate in cubic metres per dayG = biogas production in cubic metresVd = digester volume in cubic meters
Recalling equation (3), equation (4) can be writtenas:
Gp = G Vd = VSGY (5)
Figure 2 shows the fixed dome digester designfor the cow dung, chicken manure and human exc-reta. Fixed dome plants were chosen because theycan last for over fifty years and they are easily insu-
lated and scum formation is less due to the digesterslurry that is displaced (pushed out) by incomingfeed (influent). A fixed dome digester is an under-ground biogas digester lined with brick, with adome-shaped cover made from concrete. The coveris fixed and held in place with earth piled over thetop to resist the pressure of the gas inside. A secondpit, the slurry reservoir, is built above and to theside of the digester. As the gas is given off by slurry,it collects in the dome and displaces some of theslurry into the reservoir. As the gas is used, the slur-ry flows back into the digester to replace it.
The digester presented in Figure 2 would bemodified to include a heating system for optimumbiogas production. Figure 3 shows the heating sys-tem proposed. The heating system would involve
Journal of Energy in Southern Africa • Vol 24 No 4 • November 2013 15
Figure 2: Fixed dome digester for the substrates
(Adapted from Fulford, 2001)
Figure 3: Biogas digester with heat exchanger (own design)

the use of the engine cooling water, which would beat 65°C. This water would be transported from theengine to the digester by means of copper tubes.The tubes would be placed at the bottom of thedigester. The heat would flow from the tubes to theslurry thereby maintaining desirable temperaturefor maximum biogas production.
3.4. Material requirements for the digester
The material requirements for the biogas digesterconstruction were estimated, such as cement, steel,wire mesh, paint, aggregate, sand, bricks andlabour costs.
3.5. Economic analysis methods
The techno-economic analysis for the project wasused to evaluate the favourability and profitabilityof the biogas investment project. The economicindicators considered were the investment costs, theliquidation yield, the total operational costs, totalincome and revenues, cost comparison, cost annu-ity comparison, profitability, static Pay Back Period(PBP), Net Present Value (NPV) and Internal Rateof Return (IRR).
3.5.1. Procedure for financial evaluationThe procedure for financial evaluation is deter-mined by Finck and Oelert (1985).
3.5.1.1. Cost annuity comparison, Ak
Cost annuity is the annual total cost of the biogasdigester
AK = K0 + (10 – L) x RF(i,t) + L x i) (6)
where:AK = cost annuity (US $)K0 = the operating costs per unit of time (US $)I0 = investment costs (US $)L = liquidation yield (years)RF = recovery period (years) and is a function of
assumed interest rate and the project durationi = assumed interest rate (%)t = the project duration (years)
3.5.1.2. ProfitabilityProfitability or return on investment (ROI) is theaverage profit per time interval on an investmentproject or the profit of the plant per annum.
ROI = × 100 (7)
where:ROI = return on investment [US $]NP = average net profit per time intervalKA = average capital invested
3.5.1.3. Pay-back periodPay-back period is the time at which the capital
invested in an investment project will be recoveredby the annual returns.
n = (8)
where:n = payback period (years)
3.5.1.4. Net present value Net present value (NPV) of an investment project isthe sum of the present values of all the cash inflowsand outflows linked to the investment.
NPV = -I0 = (R × PF) +LT × q-T (9)
where:NPV = Net present balue (US $)I0 = investment costs (US $) PF = present value factor (years)R = annual returns (US $)LT = liquidation yield at the end of service life
(years)q-T = discount factor (years)
3.5.1.5. Internal rate of return Internal rate of return of an investment project is theachievable interest tied-up in the investment.
(10)
where:IRR = Internal rate of returnNPV1 = Net present value 1NPV2 = Net present value 2i1 and i2 are discount rates
3.5.1.6. Annuity method The annuity is the constant annual payment for aninvestment.
A = NP × RF (iT) (11)
where:A = annuityT = a known planning period in yearsi = discount rate
3.5.1.7. Present value factor
PF = (12)
q = 1 + (13)
where:i* = market interest ratet = time of payment (years)
16 Journal of Energy in Southern Africa • Vol 24 No 4 • November 2013
Np
KA
capital investmentannual return
qt – 1qt (q – 1)
i*100

(14)
where:f = inflation rate
Liquidation yield is the estimated value of aplant at the end of its useful life or fixed service life.
Recovery period is the designated period fordepreciation of a plant.
An annual return (R) from an investment of aproject is the difference between total incomes andoperating costs (Finck & Oelert, 1985).
Present value factor (PF) is a factor used to cal-culate present value of money on a future period.
NPV of an investment project is the sum of pres-ent value of money moving into or out of an invest-ment project.
Market interest rate (i*) is the interest rate forexternal or internal financing (Finck & Oelert,1985).
3.6. Sizing of the electric generators
For the sizing of the electric generators, the follow-ing equation was used:
P(kW) = S (kVA) x Pf (15)
Where; P (kW) = power in kilowattsS (kVA)= generator size in kVAPf = power factor
The power factor (Pf) for each electric biogas gen-erator was assumed to be 0.8 and the average elec-tric efficiency of each biogas generator wasassumed to be 40% due to lower heating of biogas.Furthermore, it was assumed that 1 m3 would pro-duce energy equivalent to 9 kWh.
4. Results and discussions
4.1. Electricity requirements
The total electricity requirements for NyazuraAdventist High School are shown in Table 2.
The highest proportion of energy is consumedby activities in the dining halls. The school has atotal energy requirement of 2 751 kWh/ day. The
total energy requirements for the two dining hallsare 1449 kWh/day. Dining halls are consuming53% of the electricity supplied to the schoolbecause they have the following devices that con-sume large amounts of electricity; cold room (996kWh/day), one oven (300 kWh/day) and six cook-ers (144 kWh/day). The electricity supplied to theboarding school is used mainly for water heating,cooking, lighting, welding and water pumping.
Table 2: Electricity needs for the whole school
Energy demand areas Total energy (kWh/day)
Computer laboratory 32
Classrooms 39
Administration 14
School library 4
Boys’ dormitories 37
Girls’ dormitories 33
Dining halls 1449
Workshop and Tuck-shop 93
Pumps (10 Hp and 7.5 Hp) 403
Staff houses 600
School church 7
Home economics department 40
Total 2 751
4.2. Total gas yield per feedstock
The dung produced by cattle per day per animal is10 kg, and 1 kg dung of cattle produces 0.036 m3
of biogas (Nijaguna, 2002). Since the cattle are notpastured, it was assumed that collectable waste perday was 5 kg. In addition, 1 kg chicken manure and1 kg human waste produce 0.062 m3 and 0.070 m3
per day respectively. Table 3 shows the estimatedgas yield per feedstock available at the school.
It is clear from Table 3 that the total biogas yieldfor the feedstocks is 50 m3/day. Human waste hada total gas potential of 27 m3 /day, chicken manurea total gas yield of 4 m3/day and cow dung a totalgas yield of 18 m3. Assuming that 1m3 of gas pro-duces 9 kWh of energy, the 50 m3 of biogas couldproduce 450 kWh/day of energy. The school iscapable of producing energy of 13 500 kWh fromits waste material per month. The installation of the
Journal of Energy in Southern Africa • Vol 24 No 4 • November 2013 17
Table 3: Total estimated gas yield per feedstock
Feedstock Type Total number Gas yield Manure per animal Gas yield Total gas yieldof animals m3/kg per day (kg) per day (m3) per day (m3)
Cattle dung 100 0.036 5.00 0.18 18
Chicken manure 500 0.062 0.18 0.011 4
Human waste 960 (secondary 0.070 0.40 0.028 27school learners & families)
Human waste 50 [primary school pupils] 0.070 0.10 0.007 1
Total 50
digesters at the school can therefore reduce theenergy shortage in the school. The total daily bio-gas produced at the school would meet 16% of thetotal energy demand. The quantity of daily biogasproduction would be increased by increasing thenumber of cattle and chicken kept at the school.Since the demand for biogas would be low duringschool holidays, the school would pump excess bio-gas by means of biogas pumps into the bio-bags forstorage.
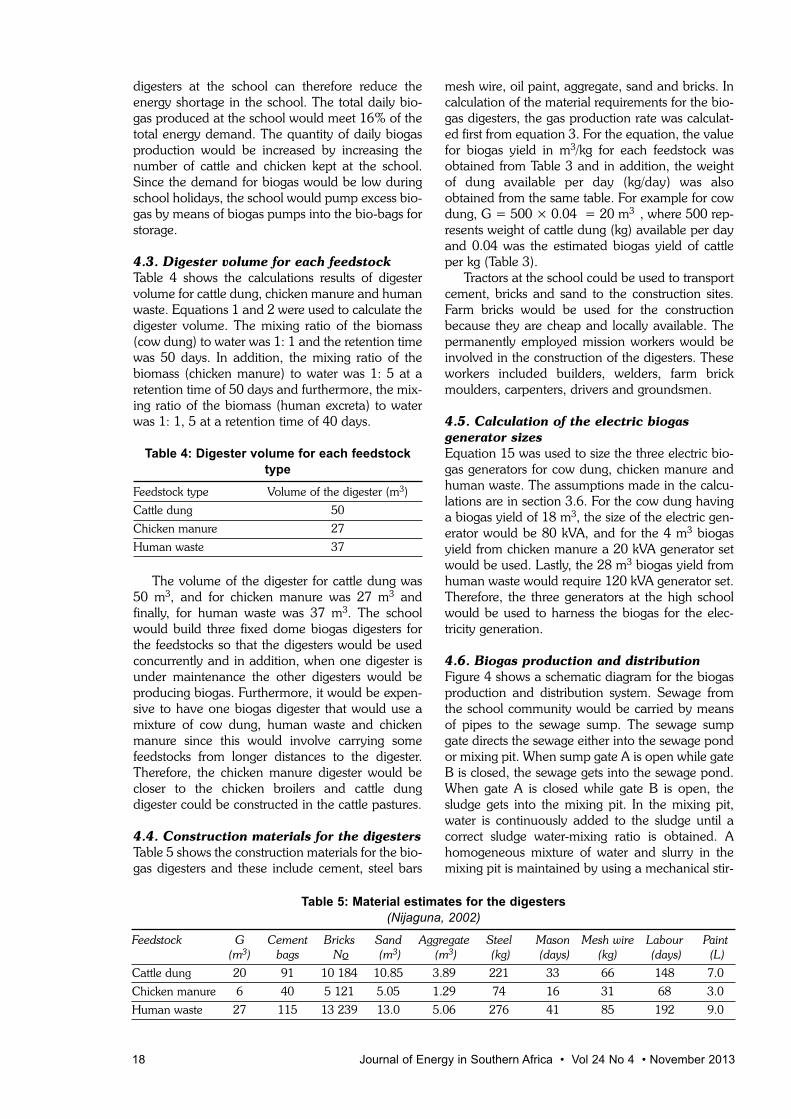
4.3. Digester volume for each feedstock
Table 4 shows the calculations results of digestervolume for cattle dung, chicken manure and humanwaste. Equations 1 and 2 were used to calculate thedigester volume. The mixing ratio of the biomass(cow dung) to water was 1: 1 and the retention timewas 50 days. In addition, the mixing ratio of thebiomass (chicken manure) to water was 1: 5 at aretention time of 50 days and furthermore, the mix-ing ratio of the biomass (human excreta) to waterwas 1: 1, 5 at a retention time of 40 days.
Table 4: Digester volume for each feedstock
type
Feedstock type Volume of the digester (m3)
Cattle dung 50
Chicken manure 27
Human waste 37
The volume of the digester for cattle dung was50 m3, and for chicken manure was 27 m3 andfinally, for human waste was 37 m3. The schoolwould build three fixed dome biogas digesters forthe feedstocks so that the digesters would be usedconcurrently and in addition, when one digester isunder maintenance the other digesters would beproducing biogas. Furthermore, it would be expen-sive to have one biogas digester that would use amixture of cow dung, human waste and chickenmanure since this would involve carrying somefeedstocks from longer distances to the digester.Therefore, the chicken manure digester would becloser to the chicken broilers and cattle dungdigester could be constructed in the cattle pastures.
4.4. Construction materials for the digesters
Table 5 shows the construction materials for the bio-gas digesters and these include cement, steel bars
mesh wire, oil paint, aggregate, sand and bricks. Incalculation of the material requirements for the bio-gas digesters, the gas production rate was calculat-ed first from equation 3. For the equation, the valuefor biogas yield in m3/kg for each feedstock wasobtained from Table 3 and in addition, the weightof dung available per day (kg/day) was alsoobtained from the same table. For example for cowdung, G = 500 × 0.04 = 20 m3 , where 500 rep-resents weight of cattle dung (kg) available per dayand 0.04 was the estimated biogas yield of cattleper kg (Table 3).
Tractors at the school could be used to transportcement, bricks and sand to the construction sites.Farm bricks would be used for the constructionbecause they are cheap and locally available. Thepermanently employed mission workers would beinvolved in the construction of the digesters. Theseworkers included builders, welders, farm brickmoulders, carpenters, drivers and groundsmen.
4.5. Calculation of the electric biogas
generator sizes
Equation 15 was used to size the three electric bio-gas generators for cow dung, chicken manure andhuman waste. The assumptions made in the calcu-lations are in section 3.6. For the cow dung havinga biogas yield of 18 m3, the size of the electric gen-erator would be 80 kVA, and for the 4 m3 biogasyield from chicken manure a 20 kVA generator setwould be used. Lastly, the 28 m3 biogas yield fromhuman waste would require 120 kVA generator set.Therefore, the three generators at the high schoolwould be used to harness the biogas for the elec-tricity generation.
4.6. Biogas production and distribution
Figure 4 shows a schematic diagram for the biogasproduction and distribution system. Sewage fromthe school community would be carried by meansof pipes to the sewage sump. The sewage sumpgate directs the sewage either into the sewage pondor mixing pit. When sump gate A is open while gateB is closed, the sewage gets into the sewage pond.When gate A is closed while gate B is open, thesludge gets into the mixing pit. In the mixing pit,water is continuously added to the sludge until acorrect sludge water-mixing ratio is obtained. Ahomogeneous mixture of water and slurry in themixing pit is maintained by using a mechanical stir-
18 Journal of Energy in Southern Africa • Vol 24 No 4 • November 2013
Table 5: Material estimates for the digesters
(Nijaguna, 2002)
Feedstock G Cement Bricks Sand Aggregate Steel Mason Mesh wire Labour Paint(m3) bags No (m3) (m3) (kg) (days) (kg) (days) (L)
Cattle dung 20 91 10 184 10.85 3.89 221 33 66 148 7.0
Chicken manure 6 40 5 121 5.05 1.29 74 16 31 68 3.0
Human waste 27 115 13 239 13.0 5.06 276 41 85 192 9.0
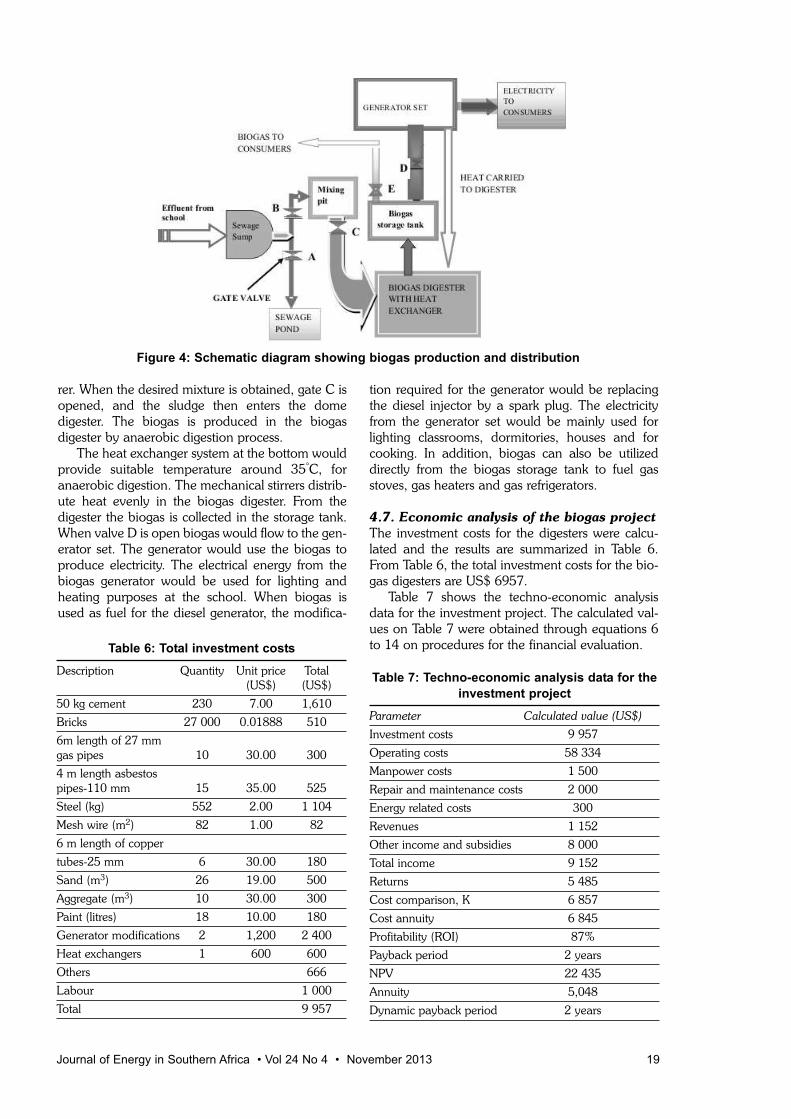
rer. When the desired mixture is obtained, gate C isopened, and the sludge then enters the domedigester. The biogas is produced in the biogasdigester by anaerobic digestion process.
The heat exchanger system at the bottom wouldprovide suitable temperature around 35°C, foranaerobic digestion. The mechanical stirrers distrib-ute heat evenly in the biogas digester. From thedigester the biogas is collected in the storage tank.When valve D is open biogas would flow to the gen-erator set. The generator would use the biogas toproduce electricity. The electrical energy from thebiogas generator would be used for lighting andheating purposes at the school. When biogas isused as fuel for the diesel generator, the modifica-
tion required for the generator would be replacingthe diesel injector by a spark plug. The electricityfrom the generator set would be mainly used forlighting classrooms, dormitories, houses and forcooking. In addition, biogas can also be utilizeddirectly from the biogas storage tank to fuel gasstoves, gas heaters and gas refrigerators.
4.7. Economic analysis of the biogas project
The investment costs for the digesters were calcu-lated and the results are summarized in Table 6.From Table 6, the total investment costs for the bio-gas digesters are US$ 6957.
Table 7 shows the techno-economic analysisdata for the investment project. The calculated val-ues on Table 7 were obtained through equations 6to 14 on procedures for the financial evaluation.
Journal of Energy in Southern Africa • Vol 24 No 4 • November 2013 19
Figure 4: Schematic diagram showing biogas production and distribution
Table 6: Total investment costs
Description Quantity Unit price Total(US$) (US$)
50 kg cement 230 7.00 1,610
Bricks 27 000 0.01888 510
6m length of 27 mm gas pipes 10 30.00 300
4 m length asbestos pipes-110 mm 15 35.00 525
Steel (kg) 552 2.00 1 104
Mesh wire (m2) 82 1.00 82
6 m length of copper
tubes-25 mm 6 30.00 180
Sand (m3) 26 19.00 500
Aggregate (m3) 10 30.00 300
Paint (litres) 18 10.00 180
Generator modifications 2 1,200 2 400
Heat exchangers 1 600 600
Others 666
Labour 1 000
Total 9 957
Table 7: Techno-economic analysis data for the
investment project
Parameter Calculated value (US$)
Investment costs 9 957
Operating costs 58 334
Manpower costs 1 500
Repair and maintenance costs 2 000
Energy related costs 300
Revenues 1 152
Other income and subsidies 8 000
Total income 9 152
Returns 5 485
Cost comparison, K 6 857
Cost annuity 6 845
Profitability (ROI) 87%
Payback period 2 years
NPV 22 435
Annuity 5,048
Dynamic payback period 2 years

From Table 7, the repair and maintenance costswere US$ 2 000, the energy related costs were US$300.00 and the cost comparison was US$ 6 857.The cost annuity was US$ 6845 and the NetPresent Value was US$ 22 435. The dynamic pay-back period was one year.
The economic analysis of the biogas projectshowed that the project is financially feasible. TheNet Present Value is high and positive showing thefeasibility of the investment on the project. The pay-back period was short implying that the projectpays itself off within the service life or within a setpayback limit, which must be shorter than the tech-nical service period of 5 years.
5. Conclusion and recommendations
The total energy requirement for the school is 2 710kWh per day and the total energy from biogas ofthe feedstocks was 450 kWh/day. Therefore, thebiogas would contribute to 16% of the total energyneeds of the school. The total energy for lightingwas 135 kWh/per day. It can be concluded thatlighting for the whole school takes only 30% of elec-tricity that is generated from the biogas. Therefore,the other 60% of electricity from biogas would beenough for all electricity requirements in the follow-ing; computer laboratory, classrooms, administra-tion block, school library, boys and girls laborato-ries. The remainder 10% of electricity from biogaswould add to the cooking needs supported by theelectricity from the grid. The calculated annuity, thedynamic payback period and the net present value(NPV) are high. This can be concluded that theproject is favourable, profitable and worth under-taking.
Technical problems of the digesters include alack of trained operators, poor equipment designand failure to feed the digester regularly. It can berecommended that operators require inductioncourses for the digesters to be operated more effi-ciently. The school should have ready informationon operation of digesters and in addition operatorsshould be kept updated with relevant informationon biogas digesters. Furthermore, the opening andclosing of the gas outlet and main gate valves mustnot be cumbersome and the feedstock should befed into the digester when correct amount of wateris mixed with it. The most favourable total solids(TS) value desired for better biogas production is8% (Ituen et al., 2007). The pH changes in thedigester would affect methane formation processand therefore, pH fluctuation would be controlledby the addition of wooden ash at zero cost.However, temperature fluctuations in the digesterswould be minimal since the digesters would be con-structed underground.
ReferencesDavidsson, Å. (2007). Increase of biogas production at
waste water treatment plant- Addition of urbanorganic waste and pre-treatment of sludge, Waterand Environmental Engineering, Sweden:Department of Chemical Engineering, LundUniversity. Available at: www.dissertations.se/disser-tation/a80f88cc0e/ (Accessed on 24 August 2012).
Deublein, D. and Steinhauser, A. (2008). Biogas fromWaste and Renewable Resources. An Introduction,Weinheim: WILEY-VCH Verlag GmbH & Co. KGaA,
Finck, H. and Oelert, G. (1985). A guide to the financialevaluation of investment projects in energy supply,Germany: GTZ.
Fulford, D. (2001). Running a Biogas Programme.United Kingdom: ITDG Publishing.
Gerardi, M.H. (2003). The Microbiology of AnaerobicDigesters, Hoboken Jersey: John, Wiley & Sons, Inc.
Goswami, Y.D. and Kreith, F. (2008). Energy conver-sion, London New York: CRC press, Taylor andFrancis Group, Boca Raton.
Ituen, E.E., John, N.M. and Bassey, B.E. (2007). Biogasproduction from organic waste in Akwa Ibom Stateof Nigeria. Appropriate Technologies forEnvironmental Protection in the Developing World,207, pp. 17-19.
Jemmett, R., (2006). Methane, biogas, productionguide, United Kingdom, Available at: www.small-farm-permaculture-and-sustainable-living.com/sup-port-files/methane. (Accessed on 13 August 2006).
Jingura R.M. and Matengaifa, R. (2009). Optimizationof biogas production by anaerobic digestion for sus-tainable energy development in Zimbabwe,Renewable and Sustainable Energy Reviews, 13 (5),pp.1116-1120.
Lantz, M., Mattias, S. and Börjesson, L. (2007). Theprospects for an expansion of biogas systems inSweden- Incentives, barriers and potentials, EnergyPolicy (35), pp. 1830-1843.
Leksell, N. (2005). Present and future digestion capacityof Käppala waste treatment plant a study in a labo-ratory scale, Master thesis, Master of Science pro-gram in aquatic and Environmental Engineering,Uppsa University, Sweden.
Mukumba, P. (2007). Industrial attachment report withFirle Sewage Treatment Works, Harare, Zimbabwe.
Mwakaje, A.G. (2007). Dairy farming and biogas use inRungwe district, South-West Tanzania; a study ofopportunities and constraints, Renewable andSustainable Energy Reviews 12 (8), pp. 2240-2252.
Nijaguna, B.T. (2002). Biogas Technology. New Delhi:New Age International (P) Limited, Publishers.
Sathianathan, M.A. (1975). Biogas achievements andchallenges, New Delhi: Association of VoluntaryAgencies for Rural Development.
Shonhiwa, S. (2005). Renewable Energy Programme(REP) lectures notes, University of Zimbabwe,Faculty of Engineering, Department of MechanicalEngineering, Harare, Zimbabwe.
Sibisi N.T. and Green J.M. (2005). A floating dome bio-gas digester: perceptions of energizing a rural schoolin Maphephetheni, KwaZulu-Natal, Journal ofEnergy in Southern Africa 16 (2), pp. 45-52.
Thouars, A .P. (2007). Optimization of biogas produc-tion at Kappala wastewater treatment plant: thicken-
20 Journal of Energy in Southern Africa • Vol 24 No 4 • November 2013

ing sludge and biogas potential measurement in alaboratory scale. Master of Science thesis, Sweden.
Walekwa, P.N., Mugisha, J. and Drake, L. 2009. Biogasenergy from family-sized digesters in Uganda:Critical factors and policy implications, Energy Policy37, pp. 2754-2762.
Received 15 May 2012; revised 30 October 2013
Journal of Energy in Southern Africa • Vol 24 No 4 • November 2013 21

Abstract
To identify the critical success factors in the adoptionof energy efficiency actions in Brazilian hospitalsand describe their behaviour are the objectives ofthis paper. In order to achieve these goals, a litera-ture review was performed on green managementand energy efficiency. This was the basis to definethe questions of the interview script applied to twohospitals located in the state of São Paulo, Brazil.The interview script application was complementedby secondary data and direct observation. Theresults showed that: a) the studied hospitals areembracing environmental management actionsmore often and, whenever possible, energy efficien-cy actions are taken as well; and b) in the casesanalysed top management support, commitmentwith the environment, green process design andemployee empowerment were some of the mostrelevant critical success factors to the accomplish-ment of energy efficiency actions. These findingsmay be of interest to emerging countries, includingBRICS (Brazil, Russia, India, China and SouthAfrica).Keywords: Brazil; energy efficiency; critical successfactors; sustainability; green management; hospitals
1. Introduction
An essential green management strategy, energyefficiency has been suggested as a road towardssustainable development, which is in turn, consid-ers the best way to harmonize the economy, theenvironment and the society of today and tomor-row (Wu et al., 2012). Nevertheless, the majority ofstudies (Rohdin, 2007; Sardianou, 2008; VanBerkel, 2007; Walsh and Thornley, 2012) on ener-gy efficiency discuss the reality of the developedcountries and of the manufacturing sector(Taghizadeh and Pourrabbi, 2013; Fleiter et al.,
2011; Garcia, et al., 2007). Thus, there is a litera-ture gap, that is, a lack of research on developingcountries – such as Brazil – on service sectors – suchas hospitals – in the energy efficiency state-of-the-art body of knowledge.
Therefore, the analytical focus of this paper is onenergy efficiency in Brazilian hospitals, due to theenergy-saving opportunities found on the premises(heating, hot water, lighting and other related con-sumptions) and due to the fact that hospitals aresupposed to provide patients with top comfortablefacilities, by means of modern technology or man-agement strategies which will assure power costreduction (Congradac et al., 2012).
After the literature review of satisfactory experi-ences from energy efficiency practices in hospitals(Santamouris et al., 1994; Szklo et al., 2004;Bizzarri and Morini, 2006; Bujak, 2010; Saidur etal., 2010; Sanz-Calcedo et al., 2011; Vanhoudt etal., 2011; Congradac et al., 2012; Çakir et al.,2012), it was verified that the Brazilian scenario –Latin America’s most economically significantcountry and BRIC member – is not properlyassessed.
Based on existing gaps, the objective of thisstudy is to identify the critical success factors in theadoption of green management and energy effi-ciency actions in Brazilian hospitals. Because thisresearch topic is still exploratory, it is qualitativeresearch, using a two-case study strategy in order toachieve its proposed goal.
2. Conceptual background
2.1 Green management and energy
efficiency in Brazil
Green management can be defined as an organiza-tional process outlined to reach environmental sus-tainability, reduce waste, obtain corporate socialresponsibility and competitive advantage by foster-ing green goals and strategies totally integrated with
22 Journal of Energy in Southern Africa • Vol 24 No 4 • November 2013
Critical factors to be considered when planning the
implementation of environmental improvements and
energy saving
Juliane Barbosa dos Santos
Charbel José Chiappetta JabbourUNESP – Sao Paulo State University, Brazil

the company’s objectives and strategies (Jabbour etal., 2012).
Many green management studies are focused onindustrial organizations, because their activitieshave a greater visible environmental impact. Theservice companies – known as the ‘silent destroyersof the environment’ – are given much less attention(Molina-Azorín et al., 2009).
However, even service companies can adoptthree types of green management practices(González-Benito and González-Benito, 2006):• Organizational and planning practices, related
with the Environmental Management • System (EMS) development and implementa-
tion, as well as other organizational aspectswhich are important to the environmental man-agement;
• Communication practices, related with the com-munication on developed environmentalactions; and
• Operational practices, related with the opera-tional changes performed in the production sys-tem and in the operations, which are importantto the environmental issues.Pursuant to the World Business Council for
Sustainable Development (WBCSD) (2012), theprinciple of eco-efficiency, which is related withoperational environmental practices (González-Benito and González-Benito, 2006) – is achieved bydelivering goods and services at competitive prices,meeting the human needs and providing quality oflife, while progressively diminishing the ecologicalimpacts and the resource intensity along its lifecycle, creating more value and reducing the impact.
The eco-efficiency has three main dimensions(WBCSD, 2012): • Reduction of the resource consumption:
includes the minimization of the use of energy,materials, water and earth; recycling increaseand product durability;
• Reduction of the impact on the environment:includes the minimization of air emissions, waterdischarges, waste elimination and dispersion oftoxic substances, as well as the promotion of thesustainable use of renewable resources;
• Enhancement of product/service value, mean-ing the offer of greater benefits to clients by thefunctionality, flexibility and modularity of theproduct, enabling the achievement of the samefunctional need by the client with less materialsand resources.Some organizations have a fourth dimension:
the EMS implementation (WBCSD, 2012). Thereare many eco-efficiency actions, such as the reduc-tion in the consumption of water or energy (VanBerkel, 2007). Energy efficiency is a powerful andcost-effective way to supply the sustainable devel-opment requirements against the dependence onfossil fuels (Al-Mansour, 2011). In Brazil, the energy
efficiency activities started in 1984 with the estab-lishment of Inmetro (National Institute of Metrology,Quality and Technology), currently responsible forthe Brazilian Labelling Program on EnergyEfficiency (Bodach and Hamhaber, 2010). In 1985,the Brazilian National Program of Electric EnergyConservation (PROCEL) was devised in order topromote the conservation of electric energy accord-ing to the supply and demand, so that the invest-ment costs in the electricity generation sector couldbe curtailed (Bodach and Hamhaber, 2010).
After the 2001 energy crisis, the National Policyfor Conservation and Rational Use of Energy, LawNo. 10.295, from October 17, 2001 was estab-lished, with a focus on elaborating the consumptionlimits or the minimum requirements to the energyefficiency of power-consuming machines or devices(Bodach and Hamhaber, 2010). On December 11,2002 the 4.508 decree was set up, becoming a fur-ther step in the voluntary process of energy effi-ciency improvement (Garcia et al., 2007).
The ‘Procel Edifica’ action plan was approved inSeptember 2006. It performs the voluntary labellingof the energy efficiency levels in public, commercialand service buildings (Carlo and Lamberts, 2008).The Brazilian Energy Plan estimates to 2030 thatthe energy efficiency actions in the electric sectormay avoid the consumption of 53 TWh of energy(Sheinbaum et al., 2011).
2.2 Critical success factors of energy
efficiency in hospitals
The Critical Success Factors (CSF) are intendedto clarify the important areas that influence theorganizational success (Eni, 1989), especially usefulto the performance management and organization-al excellence measurement (Xu et al., 2011).
The literature review on green management crit-ical success factors (Daily and Huang, 2001;Babakri et al., 2003; Zutshi and Sohal, 2004;Chavan, 2005; Wee and Quazi, 2005; Zutshi et al.,2008; Sambasivan and Fei, 2008) enabled theidentification of the factors shown in Table 1.
Hospitals are major power consumers, sincethey are supposed to provide patients with top com-fortable facilities and may save a great deal of ener-gy efficiency (Congradac et al., 2012).
Hospitals as central health care providers canminimize the negative side effects from their activi-ties to the environment by applying the sustainabil-ity concept in green building projects, energy effi-ciency improvement or environmental manage-ment systems (Weisz et al., 2011).
2.3 Conceptual framework of the study
A conceptual framework was set up to relate themost relevant concepts from this research, thus pro-posing a mutual relationship, for posterior verifica-tion that such framework is adherent or not to the
Journal of Energy in Southern Africa • Vol 24 No 4 • November 2013 23

analysed cases (Figure 1). The green practices pro-posed by González-Benito and González-Benito(2006) with the energy efficiency and its dimen-sions allocated into the operational practices arepresented in this framework. The research focus ison energy efficiency in hospitals, trying to discoverwhich most relevant critical success factors facingthe constant demands from the reduction of theenergy consumption (Szklo et al., 2004).
3. Research methodology
This study is devoted to understand the energy effi-ciency CSF in Brazilian hospitals. According to asearch made from the ISI Web of Science andScopus, studies with this analytical focus were not
located during 2011 and 2012 (using the keywordsof this paper). This way, the topic can be regardedas exploratory. In this context, qualitative research isthe most appropriate one, with an option for thecase study strategy (two cases) (Voss et al., 2002).
The data to this research comes from two hospi-tals in the state of São Paulo, Brazil. After the agree-ment, interview date and time, direct observationand document analysis for data was established.This phase took place in 2012, in Hospitals 1 and2, according to Table 2.
4. Results
Hospital 1 refers to a large Philanthropic hospital,with about 230 beds. Hospital 1 presents the fol-
24 Journal of Energy in Southern Africa • Vol 24 No 4 • November 2013
Table 1: Systematization of the critical success factors related with green management
Environmental Concepts Researchmanagement CSF
Top management Communication of the policy, plan and further worker-related Daily and Huang (2001);support information; Zutshi and Sohal (2004);
Leadership, management and support; Chavan (2005); Wee andReluctance in providing the needed resources; Quazi (2005); Zutshi et al.Top management commitment; (2008); Sambasivan andProvision of basic training. Fei (2008)
Commitment with Increasing pressure from clients, government and other parties Sambasivan and Fei (2008)the environment interested in demonstrating environmental commitment.
Green process design Procedures and activities in the green process factor area. Wee and Quazi (2005)
Employee The skilled employees have autonomy and decision power, Daily and Huang (2001);empowerment being more inclined to get involved in the environmental Chavan (2005)
improvement; The responsibility increase may cause the employees to oppose the EMS.
EMS Time, effort and high EMS implementation cost; Babakri et al. (2003);The EMS integration may allow the organizations for being Zutshi and Sohal (2004); more competitive in business; Zutshi et al. (2008)Long-term initiatives in the EMS adoption.
Supplier All involved parties in the environmental management Wee and Quazi (2005)management – enclosing suppliers, clients and employees.
Information Information share among the organizations may help in Wee and Quazi (2005)management finding solutions.
Advanced environ- Life Cycle Analysis (LCA); Zutshi and Sohal (2004)mental management Design for Disassembly (DFD);practices Industrial ecology.
Rewards Reinforce the empowerment and the decision-making process; Daily and Huang (2001)Motivation to continue with the good environmental practices.;
Review and Belief that there is no need for constant review and Chavan (2005);improvement;
improvement To a continuous, adequate and effective management. Sambasivan and Fei (2008);
Teamwork The contribution of each individual to the organizational well- Daily and Huang (2001);being is important to an accomplished EMS; Wee and Quazi (2005);Creation of green teams to implement the environmental projects;Sambasivan and Fei (2008)Organizations committed with the environment are inclined to reinforce teamwork and loyalty.
Environmental Preparation of employees to new environmental operations, Daily and Huang (2001);training helping in corrective action efforts; Zutshi and Sohal (2004);
The employees need to be aware of the importance of their Zutshi et al. (2008)operations to the organization and the environmental impact; The training length may originate various outcomes.

lowing green practices: Healthcare Waste Manage-ment Plan, a campaign against disposable cups,campaign for imaging examination material collec-tion, own water collection and storage system, sub-stitution of bulbs and air-conditioning device usecontrol.
Hospital 2 refers to a medium-sized public hos-pital. It has 91 beds. Hospital 2 presents the follow-ing green practices: Healthcare Waste ManagementPlan, Water Conservation Program, proper batteryand bulb disposal, substitution of bulbs, correct useof the air-conditioning device, Plan for the RationalUse of Energy and an implementing project on indi-vidual energy control.
Hospitals 1 and 2 present similarities in the crit-ical success factors regarding green management.These similarities can be observed based on eachCSF adopted by this research and described further.
4.1 Top management support
To Daily and Huang (2001), Zutshi and Sohal(2004), Chavan (2005), Wee and Quazi (2005),Zutshi et al., (2008) and Sambasivan and Fei(2008), an environmentally aware top managementenables an open and participative employee man-agement. Both hospitals have top managementsupport as a critical success factor. According to the
interviewee from Hospital 1, there is both supportand pressure for green issues. In Hospital 2, such acritical factor is highlighted by the support for greentrainings and release of budgetary resources.
4.2 Commitment to the environment
The commitment with the green responsibilities islisted by Sambasivan e Fei (2008) as a critical suc-cess factor. In both studied hospitals, one can findsupport and incentive in the sustainability-relatedissues as well as pressures originated from the sur-rounding community.
4.3 Green process design
Wee and Quazi (2005) developed and validated aset of green management critical success factorsbased on bibliographic research and interviews withenvironmental managers, thus establishing thegreen process design as a core critical factor.
The green process design critical factor corre-sponds in Hospital 1 to the Healthcare WasteManagement Plan, campaign against disposablecups, campaign for imaging examination materialcollection, own water collection and storage system,substitution of bulbs and air-conditioning deviceuse control.
In Hospital 2, the green process design critical
Journal of Energy in Southern Africa • Vol 24 No 4 • November 2013 25
Figure 1: Framework with the green management critical success factors focusing
on energy eco-efficiency
Table 2: Data collection procedures summary
Data collection dynamics
Hospital Type Interviewee Documents
1. General Hospital / Infrastructure and Project Manager Documents available in the Unit website.Philanthropic Hospital Documents on the Unit history and data.
2 Specialized Hospital / Maintenance Engineer Documents available in the Unit website.Public Hospital ocuments on the Unit history and data.

factor corresponds to the Healthcare WasteManagement Plan, Water Conservation Program,proper battery and bulb disposal, substitution ofbulbs, correct use of the air-conditioning device,Plan for the Rational Use of Energy and an imple-menting project on individual energy control.
4.4 Employee empowerment
To Daily and Huang (2001), motivated andengaged employees are more participative wheninvolved in advanced green management practices.The employee empowerment can be realized inHospital 1 due to the fact that the interviewee –infrastructure and project manager – has proposedand led green management-related ideas, such asthe feasibility study on the replacement of fluores-cent bulbs with LED bulbs. In the second case, theinterviewee – a maintenance engineer – has auton-omy to accomplish a feasibility study, such as tostudy energy sectorial sub-metering, so that expens-es can be better controlled.
4.5 Environmental management systems
The critical factor related to EnvironmentalManagement System (EMS) implementation isimportant to Babakri et al., (2003), Zutshi andSohal (2004) and Zutshi et al., (2008), becausethey enable corporate competitiveness. Both hospi-tals lack the EMS, and to date there is no intentionrecorded to implement it.
4.6 Supplier management
The supplier management critical success factor isinclusive of clients, suppliers and employees, and allmust be involved in the green management, a rele-vant item to Wee and Quazi (2005). The suppliermanagement critical success factor in the greenmanagement area was not found in both hospitals.
4.7 Information management
According to Wee and Quazi (2005), the share ofinformation among organizations can lead to solu-tions. At first, the share of information amongorganizations in order to solve problems was notdetected in both cases. Information shared via theweb in the first case and internally in the secondcase solely informs the public on projects or newsalready consolidated.
4.8 Adoption of advanced green
management practices
The adoption of green management practices areinserted in major critical success factor categoriespresented by Zutshi and Sohal (2004), and they canbe used in any organization, regardless of its size,business nature or sector. On advanced green man-agement practices focusing on energy efficiency, itis highlighted in the second case the Plan for theRational Use of Energy. The substitution of bulbs
and the correct use of the air conditioning deviceare the directed practices, among others. In the firstcase, the energy efficiency measurements are limit-ed to substitution of bulbs and the use of the airconditioning device only in areas of great need.
4.9 Employees rewards
A reinforcement to continuously motivate the com-mitment of the employees with the green issues isan important factor to Daily and Huang (2001).The reward critical success factor was not attestedwith factors related with the environmental issues innone of the cases studied. Thus, there are nobonuses for energy saving in the studied hospitals.
4.10 Review and improvement
According to Chavan (2005) constant reviews andimprovement are needed in order to have a contin-uous, adequate and effective management(Sambasivan and Fei, 2008). The review andimprovement critical success factor was not identi-fied in the first case, but it can be observed in thesecond case, when the interviewee states that in the2002 energy crisis (‘the 2002 Brazilian blackout’),the employees revised the energy saving relatedproject, and a new awareness arose.
4.11 Teamwork
The contribution of each individual, combiningcompetences in the organization is important to asuccessful green management (Daily and Huang,2001). In the first case, the teamwork critical suc-cess factor is related with several actions, amongthem the total employee adherence to the dispos-able cup campaign, as well to the non-use of airconditioning devices in unnecessary areas and alsoto trivial actions such as turning off the light whenleaving a place. According to Wee and Quazi’s con-ception (2005), the creation of green teams is need-ed to the implementation of the environmentalprojects. In the second case, the main difficulty ismaintaining the employee awareness; as time goesby such awareness undergoes a common relax-ation. The employee awareness is the main obsta-cle in the adoption of green practices.
4.12 Environmental training
The environmental training prepares the employeesto new green operations and helps in the correctiveaction efforts (Daily and Huang, 2001). In the firstcase, there is no specific environmental training buta general week training performed to the newemployees, in which some orientations are trans-mitted, among them the environmental-relatedones. In the second case, when the eco-efficiencyprograms were installed, there was training in mid-1997. As the employees need to be aware of theirorganizational operations and their environmentalimpact (Zutshi and Sohal, 2004), a new training
26 Journal of Energy in Southern Africa • Vol 24 No 4 • November 2013

was again reinforced during the energy crisis,known as the ‘2002 Brazilian blackout’.
5. Discussing the adherence between the
proposed framework and reality of Hospitals
1 and 2 cases
In Figure 2, an empirical framework refining theconceptual framework (Figure 1) was presented torelate the environmental management critical suc-cess factors with a focus on the energy efficiency.From the four dimensions based on the WBCSD(2012), both hospitals have three of them (reduc-tion in the resource consumption, reduction of thenature impact and enhancement of the servicevalue). The fourth dimension constituted by theimplementation of an EMS does not take place inthe two hospital units. Also there is no intention todate to implement the EMS.
In both cases, the ‘reduction of the resource con-sumption’ is the central issue. Searching for furthergreen actions, both hospitals attempt to accomplishprojects aiming at saving energy, basically. Theenergy efficient practices seemed to be related withone another:• To Hospital 1, one can highlight the employee
empowerment, commitment with the environ-ment, green management practices, greenprocess design, top management support, team-work and environmental training;
• To Hospital 2, it is highlighted the employeeempowerment, commitment with the environ-ment, green management practices, greenprocess design, top management support, team-work, environmental training and review andimprovement;
• In an exploratory way, it was possible in additionto spot critical factors not yet met, that is, barri-ers that should be overcome, both for Hospital 1(financial and lack of sub-metering) and forHospital 2 (human organizational factors andlack of sub-metering).
This way the conceptual framework is adequateto offer understanding on energy efficiency CSF inHospitals 1 and 2, also suggesting that the topic‘barriers to energy efficiency’ should be incorporat-ed to the empirical framework, refining the concep-tual framework. Further, the EMS is lacking in real-ity.
6. Conclusion
The aim of this study is to identify the critical suc-cess factors in the adoption of energy eco-efficiencyprograms in some Brazilian hospitals. In order toachieve this goal, a literature review on the topicwas held and a case study was conducted using evi-dence from two hospitals located in the state of SãoPaulo, Brazil. The two cases were analysed regard-ing a brief hospital characterization, green manage-
ment characterization and finally the energy effi-ciency and CSF characterization.
In Hospital 1, the critical success factors are thetop management support, the commitment with theenvironment, green process design, employeeempowerment, advanced environmental manage-ment practices, environmental training and team-work.
In Hospital 2, the critical success factors are topmanagement support, commitment with the envi-ronment, green process design, employee empow-erment, advanced environmental managementpractices, review and improvement, environmentaltraining and teamwork.
Table 3 shows the two studied cases relating thecritical success factors and the main barriers found.Therefore, the objective proposed by this study wasachieved.
Table 3: Systematization of the opportunities
and barriers found in the studied cases
Critical success factorsHospital 1 Hospital 2
top management support; top management support;
commitment with the commitment with theenvironment; environment;
green process design; green process design;
employee empowerment; employee empowerment;
advanced environmental advanced environmental management practices; management practices;
environmental training; review and improvement;
teamwork. environmental training;
teamwork.
According to this context, this study shares itscontribution with two cases in hospitals from thestate of São Paulo. As a suggestion, a future studyshould analyse the support from specialized consul-tancy on energy efficiency to Hospitals’ sustainabil-ity, exploring critical barriers and factors of success
.
ReferencesAl-Mansour F. (2011). ‘Energy efficiency trends and poli-
cy in Slovenia’, Energy, Vol. 36, pp.1868–1877.Babakri, K.A, Bennett R.A, and Franchetti M. (2003).
‘Critical factors for implementing ISO 14001 stan-dard in united states industrial companies’, Journalof Cleaner Production, vol. 11, pp.749-752.
Bizzarri G., and Morini G. L. (2006). ‘New technologiesfor an effective energy retrofit of hospitals’, AppliedThermal Engineering, Vol. 26, pp.161-169.
Bodach S, and Hamhaber J. (2010). ‘Energy efficiencyin social housing: Opportunities and barriers from acase study in Brazil’, Energy Policy, Vol. 12, pp.7898-7910.
Journal of Energy in Southern Africa • Vol 24 No 4 • November 2013 27

Bujak J. (2010). ‘Heat consumption for preparingdomestic hot water in hospitals’, Energy andBuilding, Vol. 42, pp. 1047-1055.
Çakir U, Çomakli K., and Yuksel F. (2012). ‘The role ofcogeneration systems in sustainability of energy’,Energy Conversion and Management, (in press).
Carlo J., and Lamberts R. (2008). ‘Development ofenvelope efficiency labels for commercial buildings:Effect of different variables on electricity consump-tion’, Energy and Buildings, vol.40, pp. 2002-2008.
Chavan M. (2005). ‘An appraisal of environment man-agement systems: A competitive advantage for smallbusinesses’, Management of Environmental Quality:An International Journal, Vol. 16, pp. 444-463.
Congradac V, Prebiracevic B, Jorgovanovic N, andStanisic D (2012). ‘Assessing the energy consump-tion for heating and cooling in hospitals’, Energyand Buildings, Vol. 48, pp. 146-154.
Daily B.F, and Huang S. (2001). ‘Achieving sustainabili-ty through attention to human resource factors inenvironmental management’, International Journalof Operations & Production Management, vol. 21,pp. 1539-1552.
Eni G.O. (1989). ‘The concept of critical success factors(CSFs) as a planning tool for healthcare managers’,Health Management Forum, Vol.2, pp. 12-17.
Fleiter T, Worrell E., and Eichhammer W. (2011).‘Barriers to energy efficiency in industrial bottom-upenergy demand models – a review’, Renewable andSustainable Energy Reviews, Vol. 6, pp. 3099-3111.
Garcia A.G.P, Szklo A.S, Schaeffer R., and Mcneil M A.(2007). ‘Energy-efficiency standards for electricmotors in Brazilian industry’, Energy Policy, Vol. 35,pp. 3424-3439.
González-Benito J, and González-Benito O. (2006). ‘Areview of determinant factors of environmentalproactivity’, Business Strategy and the Environment,Vol.15, pp. 87-102.
Jabbour C.J.C., Silva E.M, Paiva E.L., and SantosF.C.A. (2012) ‘Environmental management in Brazil:is it a completely competitive priority?’ Journal ofCleaner Production, Vol. 21, pp. 11-22.
Molina-Azorín J.F, Claver-Cortés E, Pereira-Moliner J.,and Tarí J.J. (2009). ‘Environmental practices andfirm performance: an empirical analysis in theSpanish hotel industry’, Journal of CleanerProduction, Vol.17, pp. 516-524.
Rohdin P, Thollander P, and Solding P. (2007). ‘Barriersto and drivers for energy efficiency in the Swedishfoundry industry’, Energy Policy, Vol. 35, pp. 672-677.
Saidur R, Hasanuzzaman M, Yogeswaran S,Mohammed H A, and Hossain M S. (2010). ‘Anend-use energy analysis in a Malaysian public hospi-tal’, Energy, Vol. 35, pp. 4780-4785.
Sambasivan M. and Fei N.Y. (2008). ‘Evaluation of criti-cal success factors of implementation of ISO 14001using analytic hierarchy process (AHP): a case studyfrom Malaysia’, Journal of Cleaner Production,Vol.16, pp.1424-1433.
Sardianou E. (2008). ‘Barriers to industrial energy effi-ciency investments in Greece’, Journal of CleanerProduction, Vol. 16, pp.1416-1423.
Santamouris M., Dascalaki E, Balaras C, Argiriou A.,and Gaglia A. (1994) ‘Energy performance andenergy conservation in health care buildings inHellas’, Energy Conversion Management, vol.35,pp. 293-305.
Sanz-Calcedo J G, Blázquez F C, Rodríguez F.L, Ruiz-Celma A. (2011). ‘Influence of the number of userson the energy efficiency of health centres’, Energyand Buildings, Vol. 43, pp. 1544-1548.
Sheinbaum C, Ruíz B.J, and Ozawa L. (2011). ‘Energyconsumption and related CO2 emissions in five LatinAmerican countries: Changes from 1990 to 2006and perspectives’, Energy, Vol.36, pp. 3629-3638.
Szklo A S, Soares J.B, and Tolmasquim M.T. (2004).‘Energy consumption indicators and CHP technicalpotential in the Brazilian hospital sector’, EnergyConversion and Management, Vol. 45, pp. 2075-2091.
Taghizadeh, H., and Pourrabbi, M.V. (2013). ‘Energycost versus production as a performance benchmarkfor analysis of companies’, Journal of Energy inSouthern Africa, Vol.24, pp. 2-8.
Voss, C, Tsikriktsis, N, and Frohlich, M. (2002). ‘Caseresearch in operations management’, InternationalJournal of Operations & Production Management,Vol. 2, pp.195-219.
Vanhoudt D, Desmedt J, Van Bael J, Robeyn N, andHoes H. (2011). ‘An aquifer thermal storage systemin a Belgian hospital: Long-term experimental evalu-ation of energy and cost savings’, Energy andBuildings, Vol. 43, pp. 3657-3665.
Van Berkel R. (2007). ‘Eco-efficiency in primary metalsproduction: Context, perspectives and methods’,Resources, Conservation and Recycling, Vol. 51,pp.511-540.
Walsh C, and Thornley P. (2012). ‘Barriers to improvingenergy efficiency within the process industries with afocus on low grade heat utilization’, Journal ofCleaner Production, Vol. 23, pp. 138-146.
World Business Council for Sustainable Development –WBCSD. (2012). ‘Corporate social responsibility:making good business sense’, WBCSD, 2000.Available at: http://www. wbcsd. Org, Access: May2012.
Wee Y S, and Quazi H A. (2005). ‘Development andvalidation of critical factors of environmental man-agement’, Industrial Management & Data Systems,Vol.105, pp. 96-114.
Weisz U, Hass W, Pelikan J M, and Schmied H. (2011).‘Sustainable hospitals: A socio-ecological approach’,Gaia, Vol.20, pp. 191-198.
Wu J, Wu Z, and Holländer R. (2012). ‘The applicationof Positive Matrix Factorization (PMF) to eco-effi-ciency analysis’, Journal of EnvironmentalManagement, Vol.98, pp. 11-14.
Xu P., Chan E.W, and Qian Q.K. (2011). ‘Success fac-tors of energy performance contracting (EPC) forsustainable building energy efficiency retrofit (BEER)of hotel buildings in China’, Energy Policy, Vol.39,pp. 7389-7398.
Zutshi A., and Sohal A S. (2004). ‘Adoption and main-tenance of environmental management systems:Critical success factors’, Management of
28 Journal of Energy in Southern Africa • Vol 24 No 4 • November 2013

Environmental Quality: An International Journal,Vol.15, pp. 399-419.
Zutshi A., Sohal A.S, and Adams C. (2008).‘Environmental management system adoption bygovernment departments/agencies’, InternationalJournal of Public Sector Management, Vol. 21, pp.525-539.
Received 23 February 2013; revised 22 November 2013
Journal of Energy in Southern Africa • Vol 24 No 4 • November 2013 29

Abstract
In this study, flue gas emissions from combustion ofeco-fuel briquettes in a ceramic lined stove wereinvestigated. The eco-fuel briquettes were made ofbiomass such as spent coffee beans, mielie husks,saw dust, paper pulp and coal fines using a handoperated screw press. A combustion set-up consist-ing of digital weightometer, a ceramic lined stoveand a complete chimney system was used. Theemissions from the combustion process were meas-ured using a Testo 350 gas analyser linked to thechimney system. The eco-fuel briquettes made froma mixture of biomass and coal fines burnt within theacceptable exposure limits as set out by theOccupational Safety and Health Agency (OSHA).The flue gas emissions from the combustion of eco-fuel briquettes were found to contain 74 parts permillion (ppm) carbon monoxide (CO), 4.32 ppmhydrogen sulphide (H2S), 1.34ppm nitrogen oxides(NOx) and 3.67 ppm sulphur oxides (SOx). Themeasured gross calorific value was 18.9MJ/kg, witha burning rate of 2g/min. These properties makeeco-fuel briquettes suitable for domestic applica-tions. A survey conducted as part of this study alsorevealed a significant demand for eco-fuel bri-quettes in many informal settlements in GautengProvince, South Africa, at a competitive selling priceof R2.60/kg.
Keywords: biomass fuel, coffee grounds, clean air,eco-fuel, emissions, flue gas quality
1. Introduction
1.1 Eco-fuel briquettes
Due to the rising costs and historical lack of accessto electricity, heat energy for cooking and heating inmost townships of Gauteng Province in SouthAfrica is obtained from the combustion of paraffin,fuel wood and coal. A recent survey conducted aspart of this study has indicated that each householdin these townships could use up to 200 kg of coaland 20 kg wood per month in addition to electrici-ty for lighting and other applications in the winterseason. Combustion of these fuels contributes sig-nificantly to air pollution resulting in potential risksto human health. 1 cubic meter of fuel wood emits61-73 kg of carbon dioxide (CO2) equivalents aswell as other toxic and greenhouse gasses over itslife cycle. Prolonged exposure to these, the toxicemissions such as carbon monoxide (CO), SulphurOxides (SOx) and Nitrogen oxide (NOx) may causehuman health complications (Raymer, 2006).
Briquetting of biomass is a densification processwhich improves its handling characteristics,enhances its volumetric calorific value, reducestransportation cost and produces a uniform, clean,stable fuel or an input for further refining processes(Granada et al., 2002). Fuel briquettes are bondedby the random alignment of fibers, generated whenplant fibres and shredded waste paper are soaked inwater. The process occurs at ambient temperatureat a pressure of 1.5 to 3.0 MPa. To a large degree,the bonding force in the fuel briquette is mechani-cal, not chemical. Because of this, retaining fibreintegrity and the right degree of plasticity in the mix-ture is crucial to the quality of the fuel briquette(Husain et al., 2002).
Fuel briquettes made from corn stover, which isa major biomass stream in the United States ofAmerica, comprised roughly of 75% of total agri-
30 Journal of Energy in Southern Africa • Vol 24 No 4 • November 2013
Emissions analysis from combustion of eco-fuel briquettes
for domestic applications
Tsietsi J PilusaDepartment of Mechanical Engineering Science, University of Johannesburg
Robert Huberts Department of Chemical Engineering Technology, University of Johannesburg
Edison Muzenda Department of Chemical Engineering Technology, University of Johannesburg

cultural residues with an average bulk density of 42kg/m3. These briquettes are produced using ahydraulic piston and cylinder press at pressures of5-15 Mega Pascal (MPa), (Mani et al., 2006). Otherfuel briquettes are made from palm shell andresidue and are available in 40 mm, 50 mm and 60mm diameters. They are also made using ahydraulic press at pressures of 5-13.5 MPa but havea higher density of 1200 kg/m3 when comparedwith other briquettes, (Husain et al., 2002).
The eco-fuel briquettes shown in Figure 1 weremade from a mixture containing 32% spent coffeegrounds, 23% coal fines, 11% saw dust, 18% mieliehusks, 10% waste paper and 6% paper pulp con-taminated water, using a very low pressure, ofabout 0.87MPa, hand operated screw press. All bri-quettes had an outer diameter of 100 mm, innerdiameter of 35 mm and were 50 mm long. Therewas no need for a chemical binder; the materialcomponents underwent natural binding by inter-locking themselves by means of partially decom-posed plant fibres. They are not as compact as cornstover and Palm shell briquettes but yet have longerburning times and higher gross calorific values(Yaman et al., 2001).
1.2 Flue gas emissions
Flue gas emissions from biomass combustion referto the gas product resulting from burning of bio-mass solid fuel. Household solid fuels are mostlyburnt with ambient air as opposed to combustion
with pure oxygen. Since ambient air contains about79 volume percent gaseous nitrogen, which isessentially non-combustible, the largest part of theflue gas from most fossil fuel combustion is inertnitrogen, (Demirbas and Sahin, 1998). The nextlargest part of the flue gas is carbon dioxide whichcan be as much as 10 to 15 volume percent. This isclosely followed in volume by water vapour createdby the combustion of the hydrogen in the fuel withatmospheric oxygen.
A typical flue gas from the combustion of fossilfuels will also contain some very small amounts ofnitrogen oxides (NOx), hydrogen sulphide (H2S),sulphur oxides (SOx) and particulate matter(Debdoubri et al., 2005). The nitrogen oxides arederived from a very small fraction of the nitrogen inthe ambient air as well as from any nitrogen-con-taining compounds in the fossil fuel. The sulphurdioxide is derived from any sulphur-containingcompounds in the fuels.
1.3 Toxicity of combustion emissions
The potential health hazard to humans from expo-sure to combustion emissions depends on the inher-ent toxicity of the gases and the frequency andduration of exposure. Keeping exposure to belowthe permissible limits can be achieved by takingprecautions. The permissible limits of concentrationfor the long-term exposure of humans to toxic gasesare set by the threshold limit value (TLV). This isdefined as the upper permissible concentration limit
Journal of Energy in Southern Africa • Vol 24 No 4 • November 2013 31
Figure 1: Production of briquettes using a manually operated screw press

of the gases believed to be safe for humans evenwith an exposure of 8 hours per day, 5 days perweek over a period of many years (Wright &Welbourn, 2002).
Recommended TLV values are published in thehazardous substance database bank by theOccupational Safety and Health Agency (OSHA).The OSHA database is assumed to be appropriateto be used as a benchmark for toxic gas exposurelimits in the South African context. With the uncer-tainties involved in the designation of occupationalexposure standards and the variability of the occu-pational environment, it would be unreasonable tointerpret occupational limits as rigidly as one mightinterpret an engineering standard or specification(Peters and Timmerhaus, 1991).
2. Materials and methods
The experimental apparatus comprised of a digitalweightometer, POCA ceramic lined stove andextraction system complete with a chimney. The gasextraction manifold was linked to a 980 mm stain-less steel pipe of 90 mm diameter and 2 mm thick-ness as shown in Figure.2. A multi-purpose gasprobe was installed 50 mm above the manifold forcontinuous gas sampling and analysis. Emissionsfrom the eco-fuel briquettes combustion chamberwere sampled directly from the chimney tunnelthrough the multi-purpose probe on a real timebasis and measured through the Testo 350 analyzerelectrochemical cells. Eco-fuel briquettes of knownmass were combusted in a POCA stove and a 4 litrestainless steel pot was filled with cold water and puton the stove. The stove and pot were transferred toa weightometer in order to monitor the fuel con-sumption rate and heat transfer efficiencies. Datawas collected over a 210 minute period for analysis.The velocity of natural incoming air was measuredusing an anemometer and this together with thecross sectional area of the incoming path was usedto establish the air flow rate.
The combustion behaviour of the briquettescould be predicted and modified by varying themanufacturing conditions, mainly the diameter fac-tor and the raw material. The unburnt ash contentof the fuel briquettes can be estimated using theempirical model suggested by Tabares et al. (2000).The model defines the ash content as a function offixed carbon being the principal factor of the weightcharacteristics during combustion. The relationshipfunction is defined by Tabares et.al (2000) as fol-lows:
W = ƒc(2.46 – 0.36ƒc + 3.9 × 10⁻⁴d+ 0.13di + 0.05e4.59-0.037t – 0.26m – 1.2 × 10⁻⁴Cv)
Where,W is the remaining weight of ash in (w/w %).
ƒc is fixed carbon in (w/w %)m is the final moisture content in the briquette in
(w/w %)di is the briquettes diameter in (cm)d is briquette density in (kg/m3)t is burning time in (minutes)Cv is the calorific value of the briquettes in (kJ/kg)
Figure 2: Schematic diagram of the combustion
system used
3. Results and discussions
A survey was conducted at various informal settle-ments in Gauteng Province, South Africa, revealedthat there is a need for alternative renewable ener-gy source in addition to the existing ones. Table 1summarizes the prices paid by households towardsenergy sources. Responses from this survey clearlyindicate that, although people in the townshipshave access to electricity and other various energysources, there is still a need for additional alterna-tive energy sources such as fuel briquettes. Theneed for alternative sources is mainly driven by thecurrent overall cost of energy. It has also been deter-mined from the survey that an average home wouldspend around R430.00 to meet the householdenergy demands per month. Most people are tryingto save energy so as to offset higher food prices.Paraffin and liquid petroleum gas are not widelyused due to their costs and fire hazards. The bri-quettes could be a potential additional source ofenergy, not as a substitute for current sources ofenergy. The raw materials from which eco-fuel bri-quettes are produced are seasonal and may not be
32 Journal of Energy in Southern Africa • Vol 24 No 4 • November 2013

consistent to meet continuous demand. Further-more, they produce the least heat energy per kilo-gram compared to existing gaseous, liquid and solidfossil fuels. They are also slightly more expensivethan low grade coal which is widely used as a fuel.
3.1 Properties of eco-fuel briquettes
Ultimate and proximate analyses of dry eco-fuel bri-quettes were conducted using the ICP-Optimamodel 2100DV. Eco-fuel briquettes contain 26.30%fixed carbon, 39.34% volatile matter, 10.9% mois-ture and 10.46% ash as per proximate analysis. Theultimate analysis show 36.65% carbon, 4.60%hydrogen, 36.3% oxygen, 0.75% nitrogen and0.34% sulphur in the briquettes. Bomb calorimetertests have shown the briquettes yielding a grosscalorific value of 18.9MJ/kg. The dry bulk densitywas measured as 721 kg/m3. It was noticed that theTebares et al. (2000) correlation defined by Eq. 1does not give an accurate ash content estimation foreco-fuel briquettes. This could be as a result of thegeometry of the eco-fuel briquettes being a hol-lowed cylindrical shape as opposed to the solidcylindrical briquettes used to derive the Tabares etal. empirical correlation.
Table 2 outlines the comparisons of propertiesbetween coal and eco-fuel briquettes. This compar-ison indicates that coal is still a better fuel in termsof its higher calorific value (25.92MJ/kg), carboncontent (61.2%) and lower ash content of 12%compared to the eco-fuel briquettes which havecalorific value, carbon content and ash content of18.9MJ/kg, 22.5% and 28.4% respectively.However, the eco-fuel briquettes are made oforganic waste material with a lower sulphur contentof 0.002% compared to 3.9% in coal.
3.2 Eco-fuel briquettes combustion
Variation of flame temperature with the concentra-tion of oxygen in the combustion gases is shown inFigure 3. The oxygen concentration drops below8.31% at the maximum combustion rate at a flametemperature of 1970C. As the flue gas temperaturedrops, the oxygen concentration in the flue gassesincreases, meaning that less oxygen is consumed
when the combustion process slows down. The finaloxygen concentration of 20.57% is attained whenthe flue gas temperature is equal to the ambient
temperature, providing evidence that the combus-tion process stopped and oxygen was no longerconsumed. The air to fuel ratio of 1.44:1 wasobtained which shows that 60% of air was con-sumed for every 40% of fuel combusted.
3.3 Eco-fuel briquettes emissions
Table 3 shows a comparison between the actual gasemissions from fuel briquettes and maximumhuman exposure limit over 8 hours. The table clear-ly indicates that the gas emission produced by thefuel briquettes conforms to the Occupational Safetyand Health Agency (OSHA) occupational exposurestandards as indicated in Table 4. High carbon diox-ide concentration indicates compete combustionresulting in carbon monoxide been oxidized to lesstoxic carbon dioxide which is more of a greenhousegas as opposed to other toxic emissions presents inTable 3. Proper ventilation for dilution of high car-bon dioxide concentration in the emission is essen-
Journal of Energy in Southern Africa • Vol 24 No 4 • November 2013 33
Table 1: Domestic alternative fuel prices as per survey conducted in March 2009
Type Electricity Coal Wood Paraffin LPG Eco-fuel briquettes
Rate R0.89/kWh R2.6/kg R2.80/kg R13.50/kg R15/kg R2.26/kg
Energycontent 3.6MJ/kWh 25.92MJ/kg 16MJ/kg 42MJ/kg 49.3MJ/kg 18.9MJ/kg
Fuel cost R 0.25/MJ R 0.10/MJ R 0.175/MJ R0.32/MJ R 0.304/MJ R 0.119/MJ
Table 2: Comparison of coal and fuel briquettes
properties
Combustion gas Eco-fuel briquette Coalproperties
Gross calorific values 18.9 25.9
Specific gravity 0.71 0.86
Carbon w/w% 22.5 61.2
Hydrogen w/w% 0.71 4.3
Oxygen w/w% 43.8 7.4
Sulphur w/w% 0.0020 3.9
Nitrogen w/w% 0.0010 1.2
Ash w/w% 28.4 12.0
Water w/w% 10.9 10.0
Carbon dioxide: volume% 19.7 15.0
Oxygen: volume % 13.4 3.7
% Excess air 12.8 20.0
Nm3/GJ:8MJ/1.14m3 142.5 293.6
Table 3: Emissions for the selected toxic emissions vs. the maximum exposure limit over 8 hours
CO2(ppm) CO(ppm) H2S (ppm) SO2 (ppm) NO (ppm) NO2 (ppm)
21332 73.78 4.32 3.67 1.34 2.73 Briquettes emissions
5000 50 -200 20 5 25 5 OSHA limit

tial, not only for prolonged exposure but also toensure that enough oxygen in the air is provided forefficient combustion.
Although the other gases are in low concentra-tions as shown in Figure 4, the maximum safe expo-sure time to the combustion gasses produced by thefuel briquettes is 11.25 minutes due to the high car-bon dioxide concentration. In principle, the fuel bri-quette is deemed a clean fuel compared to otherfossil fuels. The carbon dioxide produced is 2 892times the carbon monoxide, which indicates com-plete combustion. Furthermore, carbon dioxide isless toxic than carbon monoxide; therefore, com-bustion of fuel briquettes is even more suitable forwell ventilated indoor applications.
Table 5 summarizes the flue gas compositionsfor natural gas, fuel oil and coal. From this summa-ry, it is evident that combustion of eco-fuel bri-quettes emits less toxic gasses compared to otherfossil fuels. A theoretical air requirement for com-bustion of the fuel briquettes was estimated as
2.57m3 of air for every kg of fuel combusted. Theexperimental dry air consumed during combustionwas measured as 752.65g at absolute pressure of82.96 kPa. The average volumetric flow rate of theflue gas was measured as 0.4m3/h over a period of210 minutes and absolute pressure of 82.96 kPa,which is equivalent to 3.20m3 of flue gas produc-tion per kilogram of eco-fuel combusted.
4. Conclusions
Combustion of fuel briquettes in a laboratory-scalePOCA ceramic stove was investigated to evaluateits combustion characteristics and gas emissionquality. The results show that high combustion effi-ciencies could be achieved by choosing appropriateoperating conditions. The efficiencies were between91-95% for carbon utilization efficiency and over99.5% for CO combustion efficiency at an estimat-ed air-to-fuel ratio of 1.44:1. The average burningrate of 2g/min was obtained from the test work,meaning that 1 kg of eco-fuel briquettes can burn
34 Journal of Energy in Southern Africa • Vol 24 No 4 • November 2013
Figure 3: Flue gas temperatures with oxygen concentrations
Table 4: Occupational Safety and Health Agency (OSHA) occupational exposure standard, obtained
from the hazardous substance data bank
Gas component Occupational exposure standard
Carbon monoxide CASRN: 630-08-0 OSHA Standards: [29 CFR 1910.1000 (7/1/98)]. Permissible Exposure (CO) Limit: 8-hr Time Weighted Average: 50 ppm (55 mg/cu m). Vacated 1989 OSHA PEL
WA 35 ppm (40 mg/cu m); Ceiling limit 200 ppm (229 mg/cu m) is still enforced in some states.
Nitrogen oxide CASRN: 10102-43-9 OSHA Standards: [29 CFR 1910.1000 (7/1/98)]. Permissible(NOx) Exposure Limit: 8-hr Time Weighted Average: 25 ppm (30 mg/cu m).
Hydrogen sulphide CASRN: 7783-06-4 OSHA Standards: [29 CFR 1910.1000 (7/1/98)](H2S) Permissible Exposure Limit: Acceptable Ceiling Concentration: 20 ppm.
Permissible Exposure Limit: Acceptable maximum peak above the acceptable ceiling concentration for an 8-hour shift. Concentration: 50 ppm. Maximum Duration: 10 minutes once, only if no other meas. exp. occurs.
Sulphur oxides CASRN: 7446-09-5 OSHA Standards: 1910.1000 (7/1/98)](SOx) Permissible Exposure Limit: 8-hr Time Weighted Average: 5 ppm (13 mg/cu m). [29 CFR]

for 7 hours which makes it ideal for domestic appli-cations. The standard enthalpy of formation of thebriquettes was estimated as -1619.3kJ/mol.
The flue gas produced from this reaction con-sisted of 2.13 vol% CO2, 74 ppm CO, 4.32 ppmH2S ,1.34 ppm NO, 3.67 ppm SO2, 5.5 vol% watervapour (H2O), 59.8 ppm hydrogen(H2), 60.3 vol%nitrogen (N2) and 12.8 vol% oxygen (O2). The gaswas mostly dominated by inert atmospheric nitro-gen, oxygen, carbon dioxide and water vapour. Thetest results have shown that combustion of Eco- fuelbriquettes emits less toxic emissions compared tofossil fuels based on controlled condition combus-tion and atmospheric combustion.
5. Recommendations
The effects of operating parameters on fuel bri-quettes combustion, such as gas velocity and excessair, and preheated air temperature and velocity mayneed to be investigated in details in order to modelthe combustion efficiency of the briquettes undergiven conditions. The empirical correlation suggest-ed by Tabares et.al (2000) for estimating the ashcontent of the eco-fuel briquettes may need to bestudied for various briquettes geometry.
Although eco-fuel briquettes burn cleanly withinthe acceptable OSHA emission exposure limits,consumers need to be educated of the health haz-ards associated with the exposure of combustion
Journal of Energy in Southern Africa • Vol 24 No 4 • November 2013 35
Table 5: Comparison of flue gas quality of various fuels
Chemical species OSHA-max limit Natural gas Fuel oil Coal Eco-Fuel (ppm) Briquettes
Nitrogen (N2) - 78-80% 78-80% 78-80% 60.3%
Carbon dioxide (CO2) 5,000 10-12% 12-14% 10.6% 21.3%
Oxygen (O2) - 2-3% 2-6% 7% 12.8%
Carbon monoxide (CO) 50-200 70-110ppm 5,579ppm 74ppm
Nitrogen dioxide (NO2) 5 1% 2.73ppm
Nitric oxide (NO) 25 1% 1.34ppm
Ammonia (NH3) 50
Sulphur dioxide (SO2) 5 >2,000ppm 3.67ppm
Hydrocarbon (CxHy ) -
Hydrogen sulphide (H2S) 20 4.32ppm
Ash - 0 0 12% 28.4%
Figure 4: Variations of low concentration emissions in the flue gas

gasses over prolonged periods, and without suffi-cient ventilation, in addition, combustion of eco-fuel briquettes using uncertified stoves may causeexcessive emissions due air-fuel ratio imbalances.
Acknowledgement
The authors would like to acknowledge the NationalResearch Foundation (NRF) of South Africa andPhumani Paper for the financial support. We would liketo express our sincere appreciation to Prof Kim Bermanand Ms Nthabiseng Phiri for promoting this study andfinancing the design and fabrication of the screw press.The professional and technical support from NationalBrands Limited (Pty) Ltd and the University ofJohannesburg is greatly appreciated.
ReferencesDebdoubi, A, El amarti, A., Colacio, E. (2005).
Production of fuel briquettes from esparto partiallypyrolyzed, Energy Conversion and Management,Vol.46, pp.1877–1884.
Demirbas, A., and Sahin, A., (1998), Evaluation of bio-mass residue: Briquetting waste paper and wheatstraw mixtures. Fuel Processing Technology, Vol. 55,pp.175-183.
Granada E., Lopez Gonzelez L.M., Miguez J.L., andMoran J., (2002), Fuel lignocellulosic briquettes diedesign and product study. Renewable Energy, Vol.27, pp.561-573.
Husain, Z., Zainac, Z. and Abdullah, Z., (2002),Briquetting of palm fibre and shell from the process-ing of palm nuts to palm oil. Biomass and Energy,Vol. 22, pp. 505-509.
Mani, S., Tabil, L.G. and Sokhansanj, S., (2006).Specific energy requirement for compacting cornstover. Bioresource Technology, Vol. 97, pp. 1420-1426.
Peters, M.S. and Timmerhaus, K.D., (1991). PlantDesign and Economics for Chemical Engineers, 4thEdition, McGraw-Hill.
Raymer, A.K.P, (2006). A comparison of avoided green-house gas emissions when using different kind ofwood energy. Biomass and Bioenergy, Vol. 30,pp.605-617.
Tabares, J.L.M, Ortiz, L., Granda E., and Viar F.P.,(2000). Feasibility study of Energy use for densificat-ed lignocellulosic (briquettes). Fuel, Vol. 79, pp.1229-1237.
Wright D.A. and Welbourn P., (2002). Environmentaltoxicology, Cambridge University Press.
Yaman, S., SahanSahan, M., Haykiri-Acma, H., Sesen,K., and Kucukbayrak, S. (2001). Fuel briquettesfrom biomass–lignite blends. Fuel ProcessingTechnology, Vol. 72, pp. 1–8.
Received 4 June 2012; revised 25 October 2013
36 Journal of Energy in Southern Africa • Vol 24 No 4 • November 2013

Abstract
In this paper, the convective heat transfer coeffi-cients of papad for greenhouse drying under a nat-ural convection mode are reported. Various experi-ments were conducted during the month of April2010 at Guru Jambheshwar University of Scienceand Technology Hisar, India (29o5’5” N 75o45’55”E). Experimental data obtained for the natural con-vection greenhouse drying of papad was used toevaluate the constants in the Nusselt numberexpression by using simple linear regression analy-sis. These values of the constant were used furtherto determine the values of the convective heat trans-fer coefficient. The average value of a convectiveheat transfer coefficient was determined as 1.23W/m2 oC. The experimental error in terms of per-cent uncertainty was also evaluated.
Keywords: papad, papad drying, convective heattransfer coefficient, natural convection greenhouse
Nomenclature
At Area of tray, m2
C Experimental constantCv Specific heat of humid air, J/kg oCg Acceleration due to gravity, m/s2
Gr Grashof number = βgX3ρv2∆T/µv
2
hc Convective heat transfer coefficient, W/m2 oChc,av Average convective heat transfer coefficient,
W/m2 oCKv Thermal conductivity of humid air, W/m oCmev Mass evaporated, kgn Experimental constantN Number of observations in each setNo Number of setsNu Nusselt number = hc X/ Kv
Pr Prandtl number = mvCv/Kv
P(T) Partial vapour pressure at temperature T, N/m2
Qe Rate of heat utilized to evaporate moisture,J/m2 s
Tp Temperature of papad surface, oCTe Temperature just above the papad surface, oC
Tg Temperature inside the greenhouse, oCt Time, s ∆T Effective temperature difference, oCX Characteristic dimension, m
Greek symbols
β Coefficient of volumetric expansion (K-1)σ Standard deviationγ Relative humidity (%)λ Latent heat of vaporization, J/kgµv Dynamic viscosity of humid air, Ns/m2
ρv Density of humid air, kg/m3
1. Introduction
Papad is an important oriental snack food item par-ticularly popular in South and South-East Asiancountries. Its preparation involves gelatinization ofthe flour of different pulses with water contents gen-erally varying from 27% to 30% per kg of papadweight. The kneaded dough is made into balls andthen rolled with the help of a rolling pin into a cir-cular thin disc of 130 mm to 210 mm diameter ofthickness varying from 0.4 mm to 0.7 mm. It isdried by different means to a moisture level of 14%to 15% (Math et al., 2004; Velu et al., 2004; Kumaret al., 2011; Parab et al., 2012; Kamat and Yenagi,2012; Teradal and Ravindra, 2013). Papad dryinginvolves removal of moisture in order to preserve it.Though the preservation for enhanced life is the pri-mary reason for drying, it also brings substantialreduction in weight and volume.
Papad drying is basically a heat and mass trans-fer process in which heat from the surrounding airand the sun transfers to the papad surface by dif-ferent heat transfer modes. A part of this heat trav-els to the interior of papad and removes moisturefrom the interior to its surface by heat transfer tak-ing the latent heat of vaporization. The remainingpart of heat is utilized to increase the papad surfacetemperature which causes evaporation of the mois-ture to the surrounding air in the form of sensibleheat.
Journal of Energy in Southern Africa • Vol 24 No 4 • November 2013 37
Experimental study on natural convection greenhouse
drying of papad
Mahesh Kumar Mechanical Engineering Department, Guru Jambheshwar University of Science and Technology, Hisar, India
.

Open sun drying is the most primitive (tradition-al) method of papad drying which is weatherdependant and also prone to microbial and othercontamination. In spite of many disadvantages,open sun drying is still practiced in places through-out the world. Although the hot air industrial driersare available to get the good quality of the product,they consume large amount of energy. The scarcityof fossil fuels, steep rise in the energy cost, and envi-ronmental pollution are the driving factors in theuse of energy efficient and renewable dryingprocesses. Solar energy is an important alternativesource of energy and preferred to other energysources because it is abundant, non-pollutant, andinexhaustible. Also, it is environmentally benign,cheap, and renewable which can be effectively usedfor drying purposes, if harvested properly. Anadvanced and alternative technique to the tradi-tional method is greenhouse drying, in which theproduct is placed in trays and receives solar radia-tion through the plastic cover, while moisture isremoved by natural convection or forced air flow.The uses of appropriate greenhouse dryers lead toreduction of drying time interval as well as improvethe quality of the product in terms of texture, colourand taste. Furthermore, the contamination byinsects, microorganisms, and bacteria can be pre-vented (Esper and Muhlbauer, 1998; Condori et al.,2001; Tiwari, 2003; Kadam et al., 2011; Kumar,2013).
The convective heat transfer coefficient is animportant parameter in drying rate simulation,since the temperature difference between the airand the product varies with this coefficient (Anwar& Tiwari, 2001).The convective heat transfer coef-ficient depends on the physical properties of thehumid air surrounding the papad and the tempera-
ture difference between the papad surface and theair. Papad research has been carried out by variousworkers relating to its diametrical expansion, waterand oil absorption, chemical composition, texture,flavour, quality etc. (Bhattacharya & Narasimha,1999; Math et al., 2004; Velu et al., 2004; Nazni &Pradheepa, 2010; Parab et al., 2012; Veena et al.,2012). Kumar et al., (2011) evaluated the convec-tive heat transfer coefficients of papad drying underopen sun and indoor forced convection conditions.The average values of convective heat transfer coef-ficients under open sun and forced convection dry-ing modes were reported to be 3.54 W/m2 oC and1.56 W/m2 oC respectively. Recently, Kumar (2013)evaluated the convective and evaporative heattransfer coefficients of papad under forced convec-tion greenhouse mode. The average values of con-vective and evaporative heat transfer coefficientswere determined as 0.759 W/m2 oC and 23.48W/m2 oC respectively.
The usage of greenhouse for papad dryingunder natural convection mode is a new approachin papad preservation. The present study has beenundertaken to evaluate the convective heat transfercoefficient of papad for greenhouse drying undernatural convection. This research work would behelpful in designing a dryer for drying papad to itsoptimum storage moisture level of about 14% to15%.
2. Materials and methods
2.1 Experimental set-up and
instrumentation
A roof type even span greenhouse of 1.2×0.8 m2
effective floor area was fabricated of PVC pipe andan ultraviolet film covering of thickness 200microns. The central height and the walls were
38 Journal of Energy in Southern Africa • Vol 24 No 4 • November 2013
Figure 1: Schematic view of the experimental unit

maintained as 0.6 m and 0.4 m respectively. An airvent with an effective opening of 0.04 m2 was pro-vided at the roof for natural convection. Theschematic view of the experimental unit for green-house drying in the natural convection mode isshown in Figure 1 and its photograph is shown inFigure 2.
Figure 2: A photograph of an experimental unit
for papad drying
A circular shaped wire mesh tray of diameter0.180 m was used to accommodate the papad forsingle layer drying. It was kept directly over the dig-ital weighing balance of 6 kg capacity (model TJ-6000, Scaletech, made in India) having a leastcount of 0.1 g. The papad surface temperature (Tp)and air temperature at different locations weremeasured by calibrated copper-constantan thermo-couples connected to a ten channel digital temper-ature indicator with a least count of 0.1 oC (an accu-racy of ±0.1%). The relative humidity () and thetemperature just above the papad surface (Te) wasmeasured by a digital humidity/temperature meter(model Lutron-HT 3006, made in Taiwan). It had aleast count of 0.1% relative humidity (an accuracyof ±3% on the full scale range of 10% to 95% ofrelative humidity) and 0.1 oC temperature (an accu-racy of ± 0.8 oC on the full scale range of 50 oC).
2.2 Sample preparation and experimental
observations
Papad was prepared by taking the flour of moongbean (Indian trade name – moong) and phaseolusmungo (Indian trade name – urad dal) mixed with27.5% water content per kg of papad weight. Theflour was purchased locally, and that fraction offlour which passed through an eighty five mesh(180 microns) British Standard sieve was used formaking papad. The dough was kneaded and rolledin a circular shape of 0.7 mm thickness and 180mm diameter with the help of pastry-board and
pastry-roller. The freshly prepared papad of 23.5 gwas used for each run of the greenhouse papaddrying under natural convection.
Experiments were performed during the monthof April 2010 at Guru Jambheshwar University ofScience and Technology Hisar (29o5’5” N75o45’55” E). The orientation of the greenhouseduring the experimentation was kept east-west.Experimental setup was located on the open floorof a three-floor building to have a good exposure tothe solar radiation. Each observation was taken forpapad drying after half an hour time interval. Thepapad sample was kept in the wire mesh tray overthe digital weighing balance. The moisture evapo-rated was calculated by taking the difference ofmass of papad between two consecutive readings.The papad sample was dried till no variation in itsmass was observed. In order to obtain accurateresults, the experimentation procedure was repeat-ed four times for each freshly prepared new papadsample of the same size (i.e., 180 mm diameter and0.7 mm thickness) on consecutive days at the sametiming. The initial mass of papad sample for eachrun of drying was kept constant (i.e., 23.5 g).
3. Theory
3.1 Thermal modelling
The convective heat transfer coefficient for evapo-ration under natural convection can be determinedby using the following relations (Tiwari and Suneja,1997; Kumar et al., 2011):
Journal of Energy in Southern Africa • Vol 24 No 4 • November 2013 39
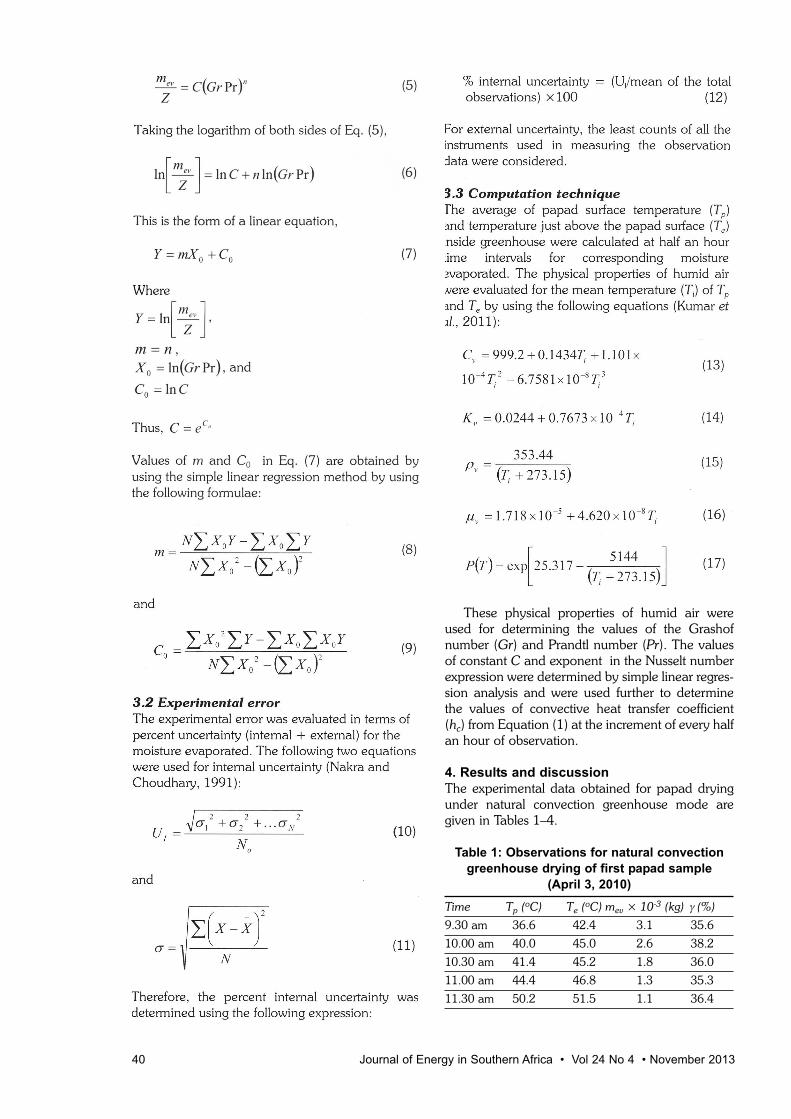
These physical properties of humid air wereused for determining the values of the Grashofnumber (Gr) and Prandtl number (Pr). The valuesof constant C and exponent in the Nusselt numberexpression were determined by simple linear regres-sion analysis and were used further to determinethe values of convective heat transfer coefficient(hc) from Equation (1) at the increment of every halfan hour of observation.
4. Results and discussion
The experimental data obtained for papad dryingunder natural convection greenhouse mode aregiven in Tables 1–4.
Table 1: Observations for natural convection
greenhouse drying of first papad sample
(April 3, 2010)
Time Tp (oC) Te (oC) mev × 10-3 (kg) γ (%)
9.30 am 36.6 42.4 3.1 35.6
10.00 am 40.0 45.0 2.6 38.2
10.30 am 41.4 45.2 1.8 36.0
11.00 am 44.4 46.8 1.3 35.3
11.30 am 50.2 51.5 1.1 36.4
40 Journal of Energy in Southern Africa • Vol 24 No 4 • November 2013

Table 2: Observations for natural convection
greenhouse drying of second papad sample
(April 4, 2010)
Time Tp (oC) Te (oC)mev × 10-3 (kg) γ (%)
9.30 am 37.8 42.8 2.8 36.8
10.00 am 41.2 43.8 2.5 39.4
10.30 am 42.6 44.0 2.0 37.2
11.00 am 45.6 45.6 1.5 36.5
11.30 am 51.4 50.3 1.0 37.6
Table 3: Observations for natural convection
greenhouse drying of third papad sample
(April 5, 2010)
Time Tp (oC) Te (oC)mev × 10-3 (kg) γ (%)
9.30 am 38.0 42.0 2.9 37.0
10.00 am 41.4 44.0 2.6 39.6
10.30 am 42.6 44.2 2.2 37.4
11.00 am 45.8 45.8 1.2 37.5
11.30 am 51.8 50.2 1.0 37.8
Table 4: Observations for natural convection
greenhouse drying of fourth papad sample
(April 6, 2010)
Time Tp (oC) Te (oC)mev × 10-3 (kg) γ (%)
9.30 am 37.2 42.6 3.0 36.2
10.00 am 40.6 44.4 2.7 38.8
10.30 am 42.0 44.6 1.9 36.6
11.00 am 45.0 46.2 1.4 35.9
11.30 am 50.8 50.9 1.1 35.1
The data given in Tables 1–4 were used todetermine the values of constant and exponent n inthe Nusselt number expression by simple linearregression analysis. Then the values of constant Cand exponent n were considered further for deter-mining the values of the convective heat transfercoefficient by Eq. (1). The values of constants (C &n) and the convective heat transfer coefficients forpapad drying during natural convection green-house drying mode are presented in Table 5. Theranges of Grashof number were also given. The
product of Grashof and Prandtl number indicatesthat the entire drying of papad for natural green-house mode falls within a laminar flow, because GrPr ≤ 107(Holman, 2004).
The values of constant and exponent werefound to vary from 0.906 to 0.925 and 0.144 to0.155 respectively. The convective heat transfercoefficients were observed to vary from 1.08 W/m2
oC to 1.40 W/m2 oC (Table 5). It was observed thatdifferent values of the convective heat transfer coef-ficient were obtained for similar papad sample driedon consecutive days. This variation could be due tochange in operating conditions on each day.
It is observed from Tables 1–4 that the rate ofmoisture removal increases initially and thendecreases for a given day. This can be explained interms of the convective heat transfer coefficient.The variation of convective heat transfer coeffi-cients with respect to drying time is illustrated inFigure 3. It can be seen from Figure 3 that the val-ues of convective heat transfer coefficient decreasesas the drying period progresses for the entire papadsample on each day. The average values of con-stants (&) and the convective heat transfer coeffi-cient were also calculated which are presented inTable 6.
Figure 3: Variation of hc versus drying time
Table 6: Average values of constants and the
convective heat transfer coefficient
C n hc,av (W/m2 oC)
0.920 0.149 1.23
Journal of Energy in Southern Africa • Vol 24 No 4 • November 2013 41
Table 5: Values of experimentally evaluated parameters and the convective heat
transfer coefficients
c n Gr Pr hc (W/m2 oC)
First Papad Sample (April 3, 2010)
0.924 0.154 1.598 × 10⁶ – 4.403 × 10⁶ 0.695 – 0.696 1.24 – 1.40
Second Papad Sample (April 4, 2010)
0.925 0.146 1.543 × 10⁶ – 4.288 × 10⁶ 0.695 – 0.696 1.10 – 1.24
Third Papad Sample (April 5, 2010)
0.925 0.144 1.594 × 10⁶ – 4.242 × 10⁶ 0.695 – 0.696 1.08 – 1.21
Fourth Papad Sample (April 6, 2010)
0.906 0.155 1.102 × 10⁶ – 3.862 × 10⁶ 0.695 – 0.696 1.16 – 1.37

The percent uncertainty (internal + external)was evaluated in the range of 33.71% to 38.92%for the natural convection greenhouse papad dryingand the different values of the convective heattransfer coefficients were found to be within thisrange. The experimental percent uncertainties forpapad drying under natural convection greenhousemode are presented in Table 7. To show the vari-ability of the convective heat transfer coefficientsvalues from its true value (or error free value) SPSSsoftware (Statistical Package for the Social Sciences,version 16.0) has been used which provided errorbars with 95% confidence interval. The error barsfor the convective heat transfer coefficients are illus-trated in Figure 4.
Table 7: Experimental percent uncertainties
Sample Internal un- External un- Total un-number certainty (%) certainty (%) certainty (%)
First 38.52 0.4 38.92
Second 33.31 0.4 33.71
Third 38.12 0.4 38.52
Fourth 36.16 0.4 36.56
Figure 4: Error bars for the convective heat
transfer coefficients
5. Conclusions
The research reported herein was set forth in orderto evaluate the convective heat transfer coefficientsfor natural convection greenhouse drying of papad.The experimental data was analysed by usingNusselt number expression with the help of simplelinear regression analysis. The average values ofconstant and exponent in the Nusselt numberexpression were found to be 0.920 and 0.149respectively. The values of convective heat transfer
coefficient were observed to vary from 1.08 W/m2
oC to 1.40 W/m2 oC. The average value of convec-tive heat transfer coefficient for papad drying undernatural convection greenhouse mode was found tobe 1.23 W/m2 oC. The experimental errors wereevaluated within range of 33.71% to 38.94%. Thisresearch work would be helpful in designing a dryerfor drying papad to optimum moisture level forretaining its quality during storage period.
ReferencesAnwar, S.I. and Tiwari, G.N. (2001). Evaluation of con-
vective heat transfer coefficient in crop drying underopen sun drying conditions. Energy ConversionManagement, 42(5): 627-637.
Bhattacharya, S. and Narasimha, H.V. (1999).Characterization of papad from different blends ofcereals with blackgram. Journal of Food Quality,22(2): 157-166.
Condori, M., Echazu, R. and Saravia, L. (2001). Solardrying of sweet pepper and garlic using the tunnelgreenhouse drier. Renewable Energy, 22(4): 447-460.
Esper, A. and Muhlbauer, W. (1998). Solar drying-aneffective means of food preservation. RenewableEnergy, 15: 95-100.
Holman, J.P. (2004). Heat transfer, Tata McGraw Hill,New Delhi.
Kadam, D.M., Nangare, D.D., Singh, R. and Kumar, S.(2011). Low-cost greenhouse technology for dryingonion (Allium Cepa L.) slices. Journal of FoodProcess Engineering, 34: 67-82.
Kamat, S. and Yenagi, N. (2012). Evaluation of indige-nous technology of preparation of papad with spe-cial reference to cereals and millets. Indian Journalof Traditional Knowledge, 11(1): 123-133.
Kumar, M. (2013). Forced convection greenhouse papaddrying: an experimental study. Journal ofEngineering, Science and Technology, 8(2): 177-189.
Kumar, M., Khatak, P., Sahdev, R.K., and Prakash, O.(2011). The effect of open sun and indoor forcedconvection on heat transfer coefficients for the dry-ing of papad, Journal of Energy in Southern Africa,22(2): 40-46.
Malik, M.A.S., Tiwari, G.N., Kumar, A., and Sodha,M.S. (1982). Solar Distillation. Pergamon Press,Oxford.
Math, R.G., Velu, V., Nagender, A., and Rao, D.G.(2004). Effect of frying conditions on moisture, fat,and density of papad. Journal of Food Engineering,64(2): 429-434.
Nakra, B.C. and Choudhary, K.K. (1991).Instrumentation, measurement and analysis, TataMcGraw- Hill Publishing Co, New Delhi.
Nazni, P. and Pradheepa, S. (2010). Physico-chemicalanalysis and organoleptic evaluation of papads pre-pared from jowar millet flour. International Journalof Current Research, 3: 33-37.
Parab, D.N., Dhalagade, J.R., Sahoo, A.K., and
42 Journal of Energy in Southern Africa • Vol 24 No 4 • November 2013

Ranveer, R.C. (2012). Effect of incorporation ofmushroom (Pleurotus sajor-kaju) powder on qualitycharacteristics of papad (Indian snack food).International Journal Food Science Nutrition, 63(7):866-870.
Teradal, D. and Ravindra, U. (2013). Utilization of elitecowpea (Vigna unguiculata (L.) walp) genotypes inthe preparation of papad and storage studies. AsianJournal of Bio Science, 8(1): 72-75.
Tiwari, G.N. (2003). Greenhouse technology for con-trolled environment, New Delhi, Narosa PublishingHouse, India.
Tiwari, G.N. and Suneja S. (1997). Solar thermal engi-neering systems, New Delhi, Narosa PublishingHouse.
Veena, B., Reddy, B.S., and Sharan, S. (2012). Effect ofincorporation of soya flour on the quality of papad.Journal of Biology, Agriculture and Healthcare, 2(5):119-126.
Velu, V., Balaswamy, K., Nagender, A., and Rao, D.G.(2004). Effect of various ingredients and additiveson papad. Food Research International, 15(2): 78-88.
Received 20 February 2012; revised 10 October 2013
Journal of Energy in Southern Africa • Vol 24 No 4 • November 2013 43

Abstract
This present work looked at the effect of sand block-ing the heat transfer area of the radiator and itseffect on the engine coolant through the conduct ofexperiments and a mathematical model developed.The results indicated that the percentage area cov-ered resulted in a proportional increase of the inletand outlet temperatures of the coolant in the radia-tor. The mathematically model developed also pre-dicted the experimental data very well. Regressionanalysis pointed out that every 10% increase areaof the radiator covered with silt soil resulted in anincrease of about 1.7oC of the outlet temperature ofthe radiator coolant. Similarly, using mud as a covermaterial, 10% of the area covered of the radiatorresulted in an increase of about 2oC of the outlettemperature of the radiator coolant. Statisticalanalysis pointed to the fact that the result obtainedfor mud, silt and the mathematical model were notsignificantly different. Thus, irrespective of the typeof material that blocks the radiator surface area, thecoolant rises proportional of the radiator covered.
Keywords: radiator, silt, mud, coolant.
1. Introduction
When new engines are developed, they will beexpected to operate under severe conditions anddemanding load profiles as studied by Kem andAbros (1997), thus, increasing the demand of effec-tive engine cooling systems. The automotive indus-try is continuously involved in a strong competitivemarket to obtain the best automobile design in mul-tiple aspects. Some of the aspect includes perform-ance, low fuel consumption, aesthetics, safety,
cheaper and low maintenance. According to Oliet et al., (2007), the air-cooled
heat exchangers found in a vehicle radiator, Air-Conditioning (AC) condenser, evaporator andcharge air cooler, has an important role in its weightand also in the design of its front-end module. Inaddition, it has a strong impact on the car aerody-namic behaviour. Looking at these challenges, thedesign process is optimized to obtain the optimumdesign.
The high working temperatures of the internalcombustion engine which are the cause of its highefficiency are at the same time a source of greatpractical challenge in construction and operation.Moreover, there are challenges in obtaining materi-als capable of continuously enduring the high tem-peratures to which the cylinder, piston and valvesare subjected to, while at the same time retainingsufficient strength to withstand the high workingloads (Pulkrabek, 1997). The maximum tempera-ture attained during combustion is approximatelyequal to the melting point of platinum, and the tem-perature even of the exhaust gas is above that ofmelting point of aluminium. Thus, it is essential thatheat be abstracted from the combustion chamber ata sufficient rate to prevent a dangerous temperaturebeing reached. Unfortunately, it is quite impossibleto prevent the hot gas from flowing over the metalsurfaces. Excessive cooling also prevents propervaporization of the fuel, leading to further waste. Inaddition, it may lead to dilution of the crankcase oilby un-vaporized fuel, which gets down past the pis-ton. On the other hand, a high operating tempera-ture changes weight and reduces volumetric effi-ciency (VE) on account of the excessive heating ofthe incoming charge. Consequently, there is reduc-tion of output power.
Over the years there have been increasingdemands on the engine cooling system of a car.This has been caused by a steady increase in engine
44 Journal of Energy in Southern Africa • Vol 24 No 4 • November 2013
Dirt analysis on the performance of an engine
cooling system
Yashvir Singh Mechanical Engineering Department, University of Petroleum and Energy Studies, Uttarakhand, India
Nishant Kr. SinghMechanical Engineering Department, Hindustan College of Science and Technology, Uttar Pradesh, India
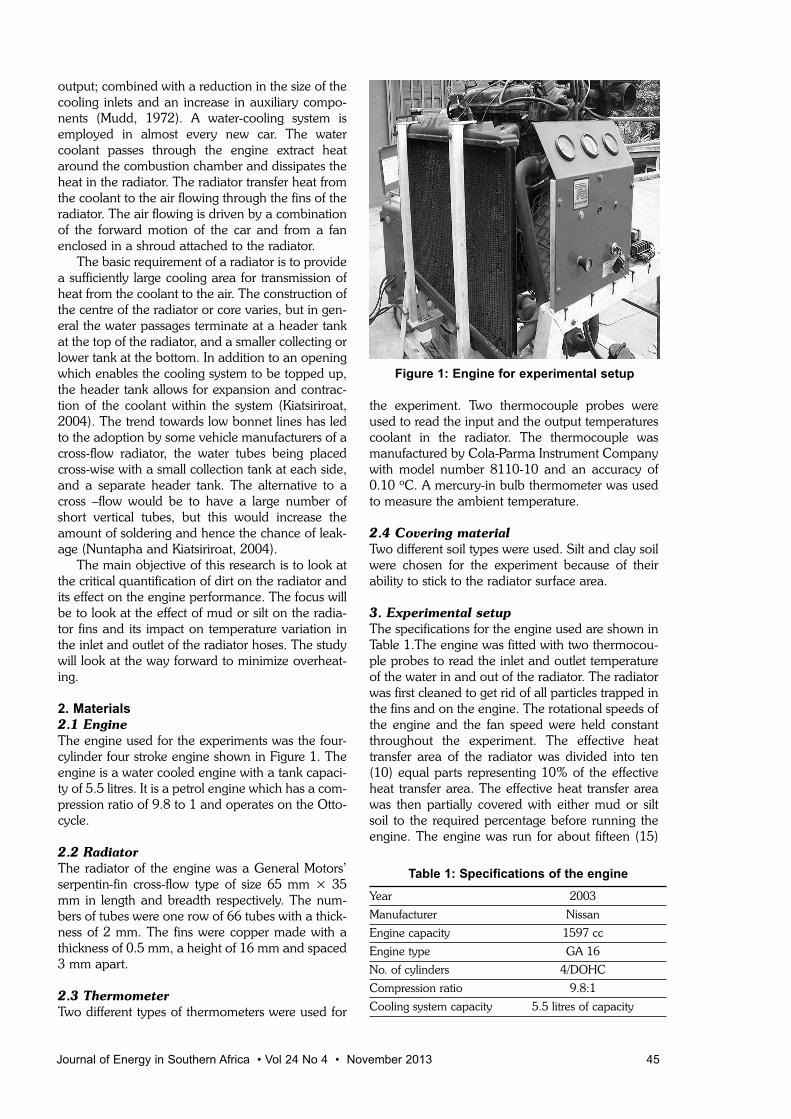
output; combined with a reduction in the size of thecooling inlets and an increase in auxiliary compo-nents (Mudd, 1972). A water-cooling system isemployed in almost every new car. The watercoolant passes through the engine extract heataround the combustion chamber and dissipates theheat in the radiator. The radiator transfer heat fromthe coolant to the air flowing through the fins of theradiator. The air flowing is driven by a combinationof the forward motion of the car and from a fanenclosed in a shroud attached to the radiator.
The basic requirement of a radiator is to providea sufficiently large cooling area for transmission ofheat from the coolant to the air. The construction ofthe centre of the radiator or core varies, but in gen-eral the water passages terminate at a header tankat the top of the radiator, and a smaller collecting orlower tank at the bottom. In addition to an openingwhich enables the cooling system to be topped up,the header tank allows for expansion and contrac-tion of the coolant within the system (Kiatsiriroat,2004). The trend towards low bonnet lines has ledto the adoption by some vehicle manufacturers of across-flow radiator, the water tubes being placedcross-wise with a small collection tank at each side,and a separate header tank. The alternative to across –flow would be to have a large number ofshort vertical tubes, but this would increase theamount of soldering and hence the chance of leak-age (Nuntapha and Kiatsiriroat, 2004).
The main objective of this research is to look atthe critical quantification of dirt on the radiator andits effect on the engine performance. The focus willbe to look at the effect of mud or silt on the radia-tor fins and its impact on temperature variation inthe inlet and outlet of the radiator hoses. The studywill look at the way forward to minimize overheat-ing.
2. Materials
2.1 Engine
The engine used for the experiments was the four-cylinder four stroke engine shown in Figure 1. Theengine is a water cooled engine with a tank capaci-ty of 5.5 litres. It is a petrol engine which has a com-pression ratio of 9.8 to 1 and operates on the Otto-cycle.
2.2 Radiator
The radiator of the engine was a General Motors’serpentin-fin cross-flow type of size 65 mm × 35mm in length and breadth respectively. The num-bers of tubes were one row of 66 tubes with a thick-ness of 2 mm. The fins were copper made with athickness of 0.5 mm, a height of 16 mm and spaced3 mm apart.
2.3 Thermometer
Two different types of thermometers were used for
the experiment. Two thermocouple probes wereused to read the input and the output temperaturescoolant in the radiator. The thermocouple wasmanufactured by Cola-Parma Instrument Companywith model number 8110-10 and an accuracy of0.10 oC. A mercury-in bulb thermometer was usedto measure the ambient temperature.
2.4 Covering material
Two different soil types were used. Silt and clay soilwere chosen for the experiment because of theirability to stick to the radiator surface area.
3. Experimental setup
The specifications for the engine used are shown inTable 1.The engine was fitted with two thermocou-ple probes to read the inlet and outlet temperatureof the water in and out of the radiator. The radiatorwas first cleaned to get rid of all particles trapped inthe fins and on the engine. The rotational speeds ofthe engine and the fan speed were held constantthroughout the experiment. The effective heattransfer area of the radiator was divided into ten(10) equal parts representing 10% of the effectiveheat transfer area. The effective heat transfer areawas then partially covered with either mud or siltsoil to the required percentage before running theengine. The engine was run for about fifteen (15)
Journal of Energy in Southern Africa • Vol 24 No 4 • November 2013 45
Figure 1: Engine for experimental setup
Table 1: Specifications of the engine
Year 2003
Manufacturer Nissan
Engine capacity 1597 cc
Engine type GA 16
No. of cylinders 4/DOHC
Compression ratio 9.8:1
Cooling system capacity 5.5 litres of capacity

minutes to attain stable conditions before readingswere taken.
For each set-up, three readings were taken atintervals of two minutes. After each experiment, theradiator was removed and washed to get rid of allthe sand particles and then dried in open air. Eachexperiment was repeated three times according tothe random sample technique adopted.
3.1Radiator heat transfer model
There are two common models available in the lit-erature for analysing the heat transfer process in aradiator. The two methods are: • Log mean temperature difference; and• Effectiveness-Number of heat transfer units
method.
In modelling, the radiator and the �-NTU wasused because the focus of the work is on the outletand inlet temperature of the water after the effectiveheat transfer area is then partially covered witheither clay or silt soil to the required percentagebefore running the engine. The model was devel-oped to predict the outlet temperature of thecoolant from the radiator given the dimensions ofthe radiator, the flow rates of the fluids and the cool-ing load. In order to solve the analytical model, thefollowing assumptions were made:(i) Constant coolant flow rate and fluid tempera-
tures at both the inlet and outlet temperatures,the system operated at a steady state
(ii) There were no phase changes in the coolant (iii) Heat conduction through the walls of the
coolant tube was negligible (iv) Heat loss by coolant was only transferred to
the cooling air, thus no other heat transfermode such as radiation was considered
(v) Coolant fluid flow was in a fully developedcondition in each tube
(vi) All dimensions were uniform throughout theradiator and the heat transfer of surface areawas consistent and distributed uniformly
(vii) The thermal conductivity of the radiator mate-rial was considered to be constant
(viii)There was no fluid stratification, losses andflow misdistribution.
The relevant equations are given from equation 1 to7.
46 Journal of Energy in Southern Africa • Vol 24 No 4 • November 2013
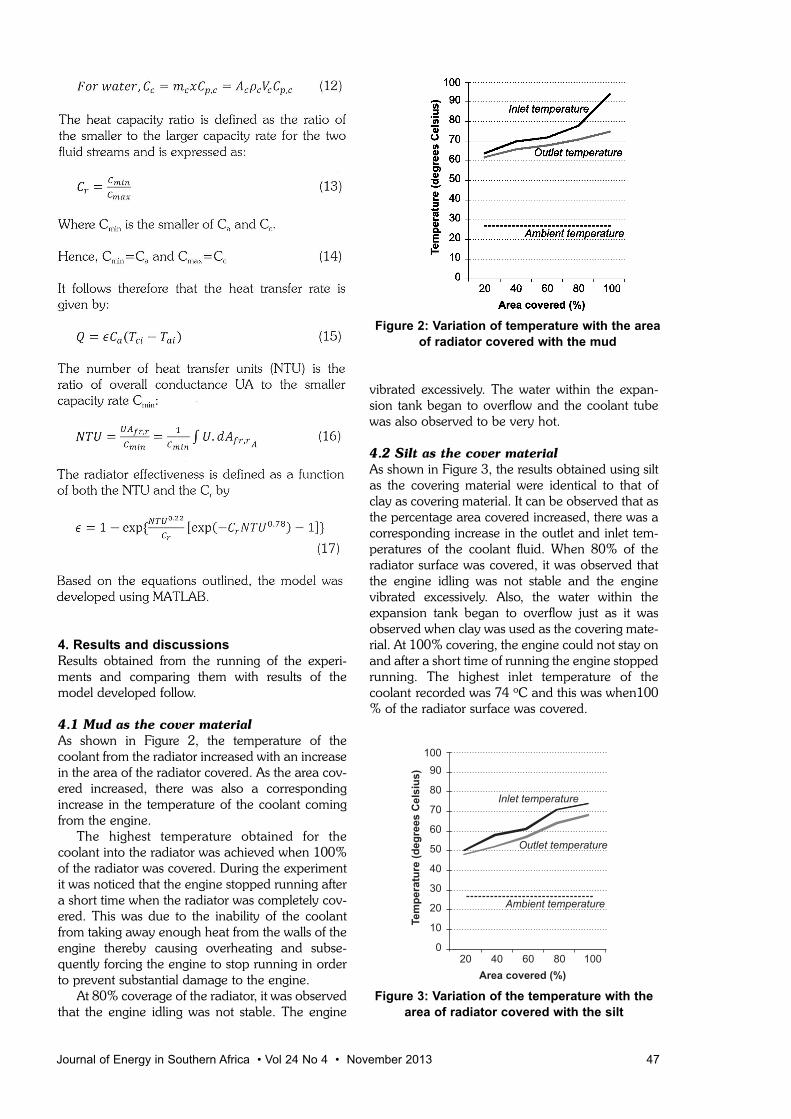
4. Results and discussions
Results obtained from the running of the experi-ments and comparing them with results of themodel developed follow.
4.1 Mud as the cover material
As shown in Figure 2, the temperature of thecoolant from the radiator increased with an increasein the area of the radiator covered. As the area cov-ered increased, there was also a correspondingincrease in the temperature of the coolant comingfrom the engine.
The highest temperature obtained for thecoolant into the radiator was achieved when 100%of the radiator was covered. During the experimentit was noticed that the engine stopped running aftera short time when the radiator was completely cov-ered. This was due to the inability of the coolantfrom taking away enough heat from the walls of theengine thereby causing overheating and subse-quently forcing the engine to stop running in orderto prevent substantial damage to the engine.
At 80% coverage of the radiator, it was observedthat the engine idling was not stable. The engine
vibrated excessively. The water within the expan-sion tank began to overflow and the coolant tubewas also observed to be very hot.
4.2 Silt as the cover material
As shown in Figure 3, the results obtained using siltas the covering material were identical to that ofclay as covering material. It can be observed that asthe percentage area covered increased, there was acorresponding increase in the outlet and inlet tem-peratures of the coolant fluid. When 80% of theradiator surface was covered, it was observed thatthe engine idling was not stable and the enginevibrated excessively. Also, the water within theexpansion tank began to overflow just as it wasobserved when clay was used as the covering mate-rial. At 100% covering, the engine could not stay onand after a short time of running the engine stoppedrunning. The highest inlet temperature of thecoolant recorded was 74 oC and this was when100% of the radiator surface was covered.
Figure 3: Variation of the temperature with the
area of radiator covered with the silt
Journal of Energy in Southern Africa • Vol 24 No 4 • November 2013 47
Figure 2: Variation of temperature with the area
of radiator covered with the mud

4.3 Discussions
When results obtained using mud were comparedto that obtained using silt as shown in Figures 4 and5, it was observed that the coolant temperature inthe radiator was higher when mud was used as thecover material than when silt was used. This couldbe explained by the fact that mud stuck better onthe radiator surface than silt. Because silt is loose,pocket of air space was observed on the coveredradiator surface. This resulted in some amount ofair passing through the air spaces to aid in the cool-ing of the coolant to a lower temperature than whenmud was used. Since less heat was removed fromthe coolant, the resultant temperature of the coolantobtained from the radiator was also found to behigher for mud than silt as shown in Figure 5 below.
Figure 4: Variation of the temperature water
inlet to the radiator with the area of radiator
covered
Figure 5: Variation of the temperature of the
outlet water to the radiator with the area of
radiator covered
Also, when the result of the model was com-pared to the results obtained for the experiment asshown in Figure 6), it was observed that the modelpredicted the heat transfer phenomenon quite well.In spite of the many assumptions, it was observed
that the temperature of the coolant from the radia-tor was comparable to results obtained for theexperiments. The model predicted closely, theresults obtained when clay was the covering mate-rial better than silt. This is perhaps due to the factthat clay was a better coverage material than silt asalready mentioned. It was generally observed thatas the area of the radiator covered was increased,the temperature of the coolant from the radiatoralso increased considerably. This can be explainedby the fact that the effective heat transfer area wasreduced, thereby limiting the quantity of air admit-ted through the radiator for purposes of cooling thecoolant. In all cases this trend of increasing outlettemperature of the coolant from the radiator wasobserved. As shown in the Figure 6, the tempera-ture of the ambient air was found to be relativelyconstant. This therefore did not significantly affectthe rate of heat transfer because the air mass wasalmost constant just as the thermal properties of theair.
Figure 6: Comparison of model results of
temperature of water out of the radiator with
results obtained with silt and mud
Figure 7: Comparison of results of inlet
temperature of water into the radiator for the
model with that of silt and mud
48 Journal of Energy in Southern Africa • Vol 24 No 4 • November 2013

Comparing the temperature of the coolant intothe radiator for three scenarios – the model, mudcovering and silt covering, it can be observed inFigure 8 that the results obtained were similar. Themodel was able to predict the heat transfer processquite well. In all the three cases, the temperature ofthe coolant into the radiator increased as the area ofthe radiator covered also increased. This is due tothe fact that when the surface area of the radiator isreduced by covering, less heat is taken out of thecoolant, thus increasing the outlet temperature ofthe coolant from the radiator as observed. Since thecoolant is not well cooled, it picks up heat from theengine which increases its temperature higher thanexpected before entering the radiator.
4.4 Regression and Anova analysis
Presented in Figures 8, 9 and 10 are the graphicalregression relationships between the radiatorcoolant outlet temperatures and the proportion ofthe radiator surface area covered with mud, silt andMatlab simulation respectively. As expected, it canbe seen that as the percentage of the radiator sur-face covered increases the outlet temperature of theradiator coolant increases.
Table 2 shows the regression models used topredict the outlet temperatures of radiator coolantfrom the percentage of area covered of the radiator.The three models were developed using silt andmud to cover the radiator. The Matlab model was a
simulated model to evaluate the validity of the siltand mud models. All the three models predictedwell and were statistically significant at a 1% proba-bility level. The coefficient of determination (R2) ofthe three models ranged from 0.98 to 0.99. At least99% of the variation in the outlet coolant tempera-tures was explained by the percentage of the areacovered of the radiator. For the silt model, for every10% increase or decrease of the area covered of theradiator resulted in an average increase or decrease
Journal of Energy in Southern Africa • Vol 24 No 4 • November 2013 49
Table 2: Models to predict outlet temperature (°C) of coolant from the Area covered of the radiator
(%)
Model Regression Equation R2 T-Test P-Value
Mud Outlet temp.(°C) = 59.1 + 0.155 area covered (%) 0.989 76.87 <0.001
Silt Outlet temp.(°C) = 42.2 + 0.260 area covered (%) 0.991 26.61 <0.001
Matlab Outlet temp.(°C) = 48.1 + 0.265 area covered (%) 0.982 22.32 <0.001
Figure 8: Regression relationship between
radiator outlet temperature and the percentage of
radiator surface area covered with mud
Figure 9: Regression relationship between
radiator outlet temperature and the percentage
of radiator surface area covered with silt
Figure 10: Regression relationship between
radiator outlet temperature and the percentage
of radiator surface area covered using Matlab
simulation

of about 1.7 degree Celsius of the outlet tempera-ture of the radiator coolant. In the case of the mudmodel, a 10% increase or decrease of the area cov-ered of the radiator resulted in about 2.1 degreesCelsius of the outlet temperature of the radiatorcoolant (Table 2). In the Matlab model, a change in10% of the area covered of the radiator resulted ina change of about 2 degrees Celsius of the outlettemperature of the radiator coolant.
Analysis of variance (Anova) was conducted tofind out if there were statistically significant differ-ences among the three models (Table 3). As shownin Table 3, there were no statistically significant dif-ferences among the three models. This indicatesthat the Matlab model was consistent with the mudand silt models. It can also be said when the sameamount of mud or silt covers the same area of aradiator the same temperature rise of the radiatorcoolant will result.
5. Conclusions
Experiments were successfully conducted on theradiator of a four cylinder diesel at base load. Twodifferent soil types, namely silt and mud, were usedas covering material to cover the heat transfer areaof the radiator to determine the heat transferprocess during the running of the engine. It wasobserved that the inlet temperature of the coolant inthe radiator increased as the percentage area of theradiator covered increased. It was also observedthat the outlet temperature of the coolant from theradiator increased monotonically with increases inthe percentage area of the radiator covered. In bothcases, at 80% coverage of the heat transfer area ofthe radiator the engine vibrated excessively and theidling was not stable. The engine stopped runningafter a short while. At 100% coverage the enginestopped running immediately after starting. Thisphenomenon was expected because as the effectivetransfer area of the radiator is reduced, less heat istaken out and thereby affecting the temperature ofthe coolant and hence the performance of theengine.
A mathematical model was developed to predictthe heat transfer phenomenon. The model devel-oped predicted the heat transfer so well. It wasobserved that the inlet temperature of the coolant inthe radiator increased as the percentage area of theradiator covered increased. The outlet temperatureof the coolant from the radiator also increased as
the percentage of the area of the radiator increased.It was also observed that the heat transfer modeldeveloped agreed with the experimental results.
The analysis of variance results pointed to thefact that the results obtained for silt, mud and themathematical model were not significantly differentat 95% confidence interval. This point to the factthat, irrespective of the covering material, the effectof temperature rises will effectively be the same.
ReferencesKem, J. and Ambros. P. (1997). Concepts for a con-
trolled Optimized Vehicle Engine Cooling System.Society of Automotive Engineers Publication,971816, 357-362.
Oliet, C., Oliva, A., Castro, J., Perez-Segarra, C.D.(2007). Parametric studies on automotive radiators,Applied Thermal Engineering, 2033-2043.
Pulkrabek, W.W. (1997). Engineering Fundamentals ofthe Internal Combustion Engine, pages 270-280.
Mudd, S.C. (1972). Technology for Motor VehicleMechanics, Euston Road London, Oxford Press.
Kiatsiriroat, T. (2004). The application of automobileradiator in waste heat recovery process, FinalReport, Energy Planning and Policy Office,Thailand.
Nuntaphan, A. and Kiatsiriroat,T. (2004). Performanceof thermosyphon heat exchanger modified fromautomobile radiator, in: The 18th Conference ofMechanical Engineering Network of Thailand, KonKaen, Thailand.
Received 4 May 2012; revised 30 October 2013
50 Journal of Energy in Southern Africa • Vol 24 No 4 • November 2013
Table 3: Analysis of variance (Anova) for comparison outlet temperatures based on the silt, mud
and Matlab models
Sum of squares Df Mean square F-value p-value
Between groups 106246 2 53123 1425 0.225
Within groups 1230285 33 37283
Total 1336531 35

Abstract
Solar thermal energy (STE) technology refers to theconversion of solar energy to readily usable energyforms. The most important component of a STEtechnology is the collectors; these absorb the short-er wavelength solar energy (400-700nm) and con-vert it into usable, longer wavelength (about 10times as long) heat energy. Depending on the qual-ity (temperature and intensity) of the resulting ther-mal energy, further conversions to other energyforms such as electrical power may follow.Currently some high temperature STE technologiesfor electricity production have attained technicalmaturity; technologies such as parabolic dish (com-mercially available), parabolic trough and powertower are only hindered by unfavourable marketfactors including high maintenance and operatingcosts. Low temperature STEs have so far beenrestricted to water and space heating; however,owing to their lower running costs and almost main-tenance free operation, although operating at lowerefficiencies, may hold a key to future wider usage ofsolar energy. Low temperature STE conversiontechnology typically uses flat plate and low concen-trating collectors such as parabolic troughs to har-ness solar energy for conversion to mechanicaland/or electrical energy. These collector systems arerelatively cheaper, simpler in construction and easi-er to operate due to the absence of complex solartracking equipment. Low temperature STEs oper-ate within temperatures ranges below 300oC. Thisresearch work is geared towards developing feasiblelow temperature STE conversion technology forelectrical power generation. Preliminary small-scaleconcept plants have been designed at 500Wp and10KWp. Mathematical models of the plant systemshave been developed and simulated on the EES(Engineering Equation Solver) platform. Fourteen
candidate working fluids and three cycle configura-tions have been analysed with the models. Theanalyses included a logic model selector throughwhich an optimal conversion cycle configurationand working fluid mix was established. This was fol-lowed by detailed plant component modelling; thedetailed component model for the solar field wascompleted and was based on 2-dimensional seg-mented thermal network, heat transfer and thermofluid dynamics analyses. Input data such as solarinsolation, ambient temperature and wind speedwere obtained from the national meteorology data-bases. Detailed models of the other cycle compo-nents are to follow in next stage of the research. Thispaper presents findings of the system and solar fieldcomponent.
Keywords: low temperature solar thermal energy,mathematical model, EEES computer simulations,working fluids, cycle configuration, component andsystem models
1. Introduction
Most naturally occurring energies such as light ener-gy from the sun, chemical energy in fossil and bio-mass fuels, mechanical energy in hydro-streams ofrivers and oceans, in tidal waves, and in wind etc.,thermal energy in geothermal resources, andnuclear energy in nuclear fuels are present not in areadily usable form and sometimes presents a tech-nical burden if an attempt is made to transport it inits natural form. Energy conversion systems allowus to transform the natural energy to convenientlyusable, storable and transportable forms. Thispaper looks at the conversion of low temperaturesolar thermal energy to electrical energy.
Journal of Energy in Southern Africa • Vol 24 No 4 • November 2013 51
System and component modelling of a low temperature
solar thermal energy conversion cycle
Shadreck M Situmbeko
Freddie L Inambao University of KwaZulu-Natal, Howard College, Mechanical Engineering, Durban, South Africa

STE technology refers to the conversion ofshorter wavelength solar energy (400-700nm) tolonger wavelength (about 10 times as long) heatenergy. The most important component of a STEtechnology is the collectors which absorb and con-vert solar energy into electrical power, for example.
Currently some high temperature solar thermalenergy (HTSTE) technologies for electricity produc-tion have attained technical maturity and are onlyhindered by unfavourable market factors includinghigh maintenance and operating costs. Examples ofHTSTE technologies include parabolic dish, para-bolic trough, and power tower systems (Groen-endaal, 2002).
Low temperature solar thermal energy (LTSTE)technologies have so far been restricted to waterand space heating with little or no emphasis onpower generation. Examples of applications in-clude:• Evaporation ponds for extraction of sea water
salt;• Concentrating brine solutions in leach mining
and removing dissolved solids from wastestreams;
• Domestic and process water heating;• Preheating of ventilation air; and• Crop drying as in drying of coffee beans and
marigolds.However, owing to their lower running costs and al-most maintenance free operation, LTSTE technolo-gies, although operating at lower efficiencies, mayhold a key to future wider usage of solar energy.
Current research on LTSTE for power genera-tion include solar thermal organic Rankine cycle,solar thermal Kalina cycle, Solar Chimney andSNAP (Groenendaal, 2002). Figure 1 showsschematic illustrations of the Solar Chimney, SNAPPlants, Organic Rankine and Kalina Cycles.
2. Feasibility study for development of low
temperature solar thermal energy
LTSTE conversion technology typically uses flatplate and low concentrating collectors such as par-
abolic troughs to harness solar energy for conver-sion to mechanical and/or electrical energy. Thesecollector systems are relatively cheaper, simpler inconstruction and easier to operate due to theabsence of complex solar tracking equipment foundin HTSTE systems. LTSTE operate within tempera-tures ranges below 300oC.
Figures 2 and 3 show two possible experimentalsetups. The general layout consists of the solar col-lector, heat exchangers, turbine-generator, pumpsand piping. The first concept sketch shows the firstexperimental setup whereby the heat transfer fluidis pumped through the solar collector where it isheated and is then passed through the evaporatorwhere heat is transferred to the working fluid. In thesecond experimental setup, as shown in the secondconcept sketch, the working fluid is directly heatedand evaporated by a solar collector. Whereas thefirst setup has the advantage of eliminating oneheat exchanger, the evaporator, and reducing therequired piping, it presents other design challenges;for instance the solar collector must have therequired corrosion resistance and be able to with-stand higher pressures associated with the workingfluid.
Preliminary small-scale concept plants havebeen designed at 500Wp and 10KWp, where thesmaller model is intended as a laboratory experi-ment and the larger as a field experiment. The aimof this laboratory test is to get an insight in theexperimental test setup and results recording andanalyses as well as to implement any neededimprovements. The field experimental setup willinvolve the 10kWp Low Temperature Solar EnergyConversion Model.
Designing the cycle involves optimally sizing itsmain components so as to attain the intended out-put. The main cycle components are the evaporatorand condenser heat exchangers, and the turbineand pumps work devices, the solar collectors arrayand the generator. The other design aspect involvessizing the duct network so as to minimise both pres-sure and heat losses and determining the quantities
52 Journal of Energy in Southern Africa • Vol 24 No 4 • November 2013
Figure 1: Examples of low temperature solar thermal energy technologies
Kalina Cycle
(www.eng.usf.edu)
Solar chimney
(Schlaich, 1995)SNAP plant Organic Rankine Cycle
(montaraventures.com)

of both the working and heat transfer fluids as wellas specifying the type of insulation.
The solar field is an important aspect of thisdesign as it involves not only determining the size ofthe field but also the layout of the solar collectorsarray.
The preliminary array design is based on theSolardome SA Solar Collector size 1840 x 1650mm, giving area of 3.04 m2 (www.solardome.co.za). The efficiencies of flat plate collector fromThermomax Industries (www.thermotechs.com)
range from 35 to 50 % for domestic hot water withmean temperature Tm ≈ 55oC. Where Tm is theaverage temperature of fluid in the collector and isgiven by:
Tm = (1)
where Tin and Tout are respectively the solar collec-tor inlet and outlet temperatures. The range of effi-ciencies for Rankine cycle operating at low to medi-um temperatures ranges from 9.9 to 14.1%
Journal of Energy in Southern Africa • Vol 24 No 4 • November 2013 53
Figure 2: Experimental setup concept 1
Figure 3: Experimental setup concept 2
Tin + Tout2

(Nishith, 2009). Taking averages the overall systemefficiency could be taken as 5.1%. Thus the solarthermal energy available should be about 9.8kWThfor the laboratory model and 196kWTh for the fieldmodel. Durban Insolation data averages 4.328kWh/m2/day (www.gaisma.com). First approxima-tions of the corresponding solar fields are shown inTable 1 and preliminary solar array layouts areshown in Figures 4 .
Table 1: First pass size estimates of the
solar arrays
Parameter Lab. model Field model Units(solar (solar
collector) collector)
Output power 0.5 10 kW
ORC mean efficiency 12 12 %
Solar mean efficiency 42.5 42.5 %
Input power 9.80 196.08 kW
Durban insolation 4.328 4.328kWh/m2/day
Incident area 27 545 m2
Solar collector area 3.04 3.04 m2
No. of solar collectors 9 179
3. Mathematical modelling
Mathematical models of the plant systems havebeen developed and simulated on the EES(Engineering Equation Solver) platform. Fourteencandidate working fluids and three cycle configura-tions have been analysed with the models. Theanalyses include a logic model selector throughwhich an optimal conversion cycle configurationand working fluid mix is established.
3.1 First pass mathematical modelling
(Situmbeko, 2011)
The first pass model gives an initial insight into theperformance of the proposed energy conversionsystem design. This first pass model output togeth-
er with the more detailed specifications of compo-nents for the proposed system design will yield amore detailed model with more realistic perform-ance parameters that can now be incorporated inthe design, development and validation of thephysical model. In this work a more generalizedmodel is first proposed as in Figure 6. This is thenfurther customized to the thermo-physical proper-ties of the different proposed working fluids. In par-ticular a mathematical logic model is incorporatedto assign an appropriate cycle configuration to eachproposed working fluid.
The first pass model makes a number ofassumptions such as: • pumping and expansion efficiencies are
assumed as hpump = 0.65, hturbine = 0.85• modelling of heat exchangers at this stage is only
performed as a thermal process to determinerequired input thermal energy and requiredexhaust thermal energy (detailed heat exchang-er modelling will be done at a later stage)
• thermal losses in the cycle components andducting are negligible;
• pressure head losses in the heat exchangers arenegligible; and
• no work and no heat transfer occur in thevalves, etc. Three types of models can be identified with low
temperature thermal cycles depending on thenature of the working fluid. Based on the fluids’ T-s(temperature versus entropy) saturation curvesthese three types of energy conversion systems are:the conventional Rankine cycle, Rankine cycle witha recuperator and Rankine cycle with a superheateras shown in Figure 7. A summary of results of com-puter simulations of the first pass model is shown inTable 2.
3.2 Detailed component models: Solar field
collector modelling
Detail modelling of a solar collector requires knowl-edge of the geometrical measurements and thermal
54 Journal of Energy in Southern Africa • Vol 24 No 4 • November 2013
Figure 4: Two layouts options for 500 Wp solar field
(requires 9 solar collectors with two layout options)
Figure 5: Possible layout for 10kWp solar field
(requires 180 solar collectors)

properties of materials used in the construction. Theprocess is based on carrying out an energy balancewhich can be either steady state or transient. A tran-sient model is more useful when the solar data canbe measured and fed synchronously to the simula-tion model.
Figure 8 shows the cross-section of a One-Riser-Pipe Solar Thermal Collector that was used todevelop the energy balance represented in equa-tions 2 to 6 below.
For the glass cover:
Qstore,C = Qin,C – Qconv,C→a – Qrad,C→a +Qconv,A→C + Qrad,A→C (2)
For the absorber plate:
Qstore,A = Qin,A – Qconv,A→C – Qrad,A→C – Qcond,A→F – Qcond,A→a (3)
For the heat transfer fluid:
Qcond,A→F = Qcond,F→a + Cth (4)
For the storage tank:
Qstore,T = Qth – Qcond,T→a (5)
Thermal efficiency:
(6)
Journal of Energy in Southern Africa • Vol 24 No 4 • November 2013 55
Figure 6: General configuration of a LTSTE technology and a Model Logic Selector
Figure 7: Three configuration options
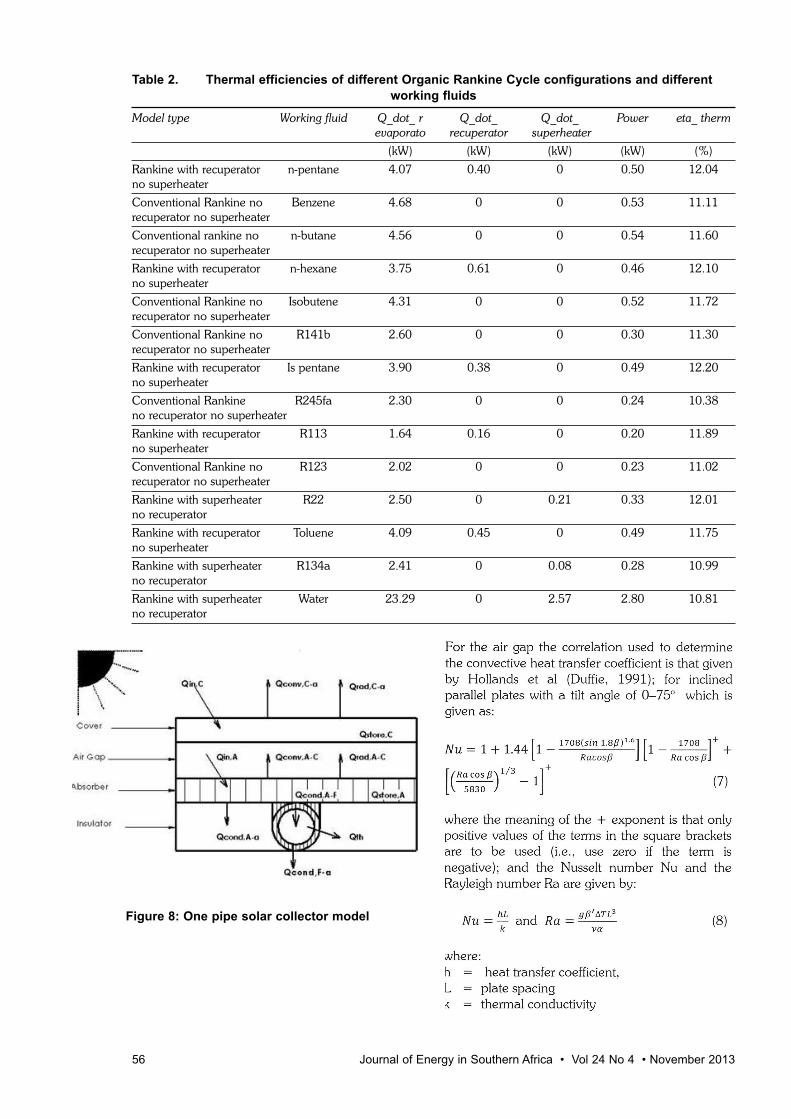
56 Journal of Energy in Southern Africa • Vol 24 No 4 • November 2013
Table 2. Thermal efficiencies of different Organic Rankine Cycle configurations and different
working fluids
Model type Working fluid Q_dot_ r Q_dot_ Q_dot_ Power eta_ thermevaporato recuperator superheater
(kW) (kW) (kW) (kW) (%)
Rankine with recuperator n-pentane 4.07 0.40 0 0.50 12.04no superheater
Conventional Rankine no Benzene 4.68 0 0 0.53 11.11recuperator no superheater
Conventional rankine no n-butane 4.56 0 0 0.54 11.60recuperator no superheater
Rankine with recuperator n-hexane 3.75 0.61 0 0.46 12.10no superheater
Conventional Rankine no Isobutene 4.31 0 0 0.52 11.72recuperator no superheater
Conventional Rankine no R141b 2.60 0 0 0.30 11.30recuperator no superheater
Rankine with recuperator Is pentane 3.90 0.38 0 0.49 12.20no superheater
Conventional Rankine R245fa 2.30 0 0 0.24 10.38no recuperator no superheater
Rankine with recuperator R113 1.64 0.16 0 0.20 11.89no superheater
Conventional Rankine no R123 2.02 0 0 0.23 11.02recuperator no superheater
Rankine with superheater R22 2.50 0 0.21 0.33 12.01no recuperator
Rankine with recuperator Toluene 4.09 0.45 0 0.49 11.75no superheater
Rankine with superheater R134a 2.41 0 0.08 0.28 10.99no recuperator
Rankine with superheater Water 23.29 0 2.57 2.80 10.81no recuperator
Figure 8: One pipe solar collector model

The model also requires inputs of ambient tem-peratures; these are included in Table 3.
Transient conditionsConsidering the steady-state model above, corre-sponding transient models can be developed. Theseare however not used in the current model as thetransiency is modelled into the time step segmentedmodel.
Storage modelThe thermal storage model consists of an energybalance consisting of charging, discharging andthermal losses. In this model, however, only charg-ing has been considered. The discharging and ther-mal losses will be considered at the time of couplingthe solar cycle sub-model to the thermal conversioncycle sub-model. The charging model is given bythe equations:
4 Computer simulations
4.1 Description of the computer model
The model consists of a code written in EES. EEShas the advantage that apart from its flexible solvercapabilities it also already contains thermodynamicproperties of most working fluids and materialsincluding the ethylene glycol water mixture used inthis model and the air contained in the air gap. Thethermodynamic properties include density, specific
Journal of Energy in Southern Africa • Vol 24 No 4 • November 2013 57
Table 3: Hourly ambient temperatures for the
modelled day (www.weather.com)
Time Temp. Time Temp. Time Temp. (oC) (oC) (oC)
5am 20 1pm 26 9pm 23
6am 20 2pm 27 10pm 22
7am 20 3pm 26 11pm 21
8am 20 4pm 26 12am 21
9am 22 5pm 26 1am 21
10am 23 6pm 24 2am 20
11am 25 7pm 24 3am 20
12pm 25 8pm 23 4am 20

heat, thermal conductivity, viscosity, etc.The code is arranged in the following format:
• Main Program: Calls the two procedures Nus-seltNumber and HourCycle; and outputs ther-mal storage data.
• SubProgram SegmentedModel: calculates theenergy balance for each cycle; calls the I_sol
• Function I_sol: calculates the hour solar radia-tion
• Procedure NusseltNumber: calculates theNusselt number for each segment of the air gap.
• Procedure HourCycle: compiles energy data forall cycles in each hour
4.2 Model validation
The model was run for the selected hourly ambienttemperatures of the typical March-April day as inTable 3. The model calculated the hourly total radi-ation as in equations 12 to 14. Two tests were donefor the 9-solar-collectors field and the 180-solar-col-lectors field. The model used was a one pipe model;thus it was assumed for the 9 solar collectors thatthree one-pipe solar collectors were connected inseries and for the 180 solar collectors that eighteenone-pipe solar collectors were connected in series.The geometrical sizes and thermal properties of thesingle riser pipe solar collectors model are given inTable 4.
5. Results of computer models and
simulations
The results of the solar model computer simulationsare presented in the following charts:
5.1 Computer solar radiation model
Figure 9 shows the computed hour radiation values.The computed solar radiation is highest at noonand is almost symmetrically reducing to zero on
sides, the forenoon and the afternoon. The peak atnoon is 613.2 W/m2. The simplified model seemsadequate for design purposes. In actual situationsthe model would have to take into account otherweather parameters such as cloud cover, wind andprecipitation. The solar radiation curve closely fol-lows the fourth order polynomial:
y = 0.296x4 – 8.306x3 + 59.70x2 – 21.82x – 27.03
5.2 Temperature modelling results
Figure 10 shows the temperature profiles along thesegments of the collectors. T_p is the temperatureprofile for the absorber plate and T_wg is the tem-perature profile for the water ethylene glycol work-ing fluid. The numbers enclosed in the parenthesesrepresent the number of the one-pipe-model collec-tors as they are connected in series. These resultsare for a one cycle pass with no storage model con-nected.
Figure 11 shows the energy profiles along thesegments of the collectors. Q_dot_wg is the heattransfer profile to the working fluid and Q_dot_lossrepresents the thermal losses from the collector ateach segment. Similarly these results are for a onecycle pass with no storage model connected.
The rate of heat gain by the working fluiddecreases along linear segments of the collectorwhilst the rate of heat losses from the collectorincreases along the linear segments of the collector.
Figure 12 shows results for the 180-solar collec-tor single pipe field model. The computer modelconsists of 18 one-pipe models connected in seriesto represent the 180-solar collector field.
There is a steady build-up of temperature for allcomponents along the model segments and banks.
58 Journal of Energy in Southern Africa • Vol 24 No 4 • November 2013
Table 4: Description of the simulated model
Length of absorber plate 2.0 m for entire collector; 200mm for each segment model
Width of absorber plate 1.0m for entire collector; 125mm for the one-pipe model
Diameter of riser pipe 6mm internal diameter
Material of absorber plate 1mm Aluminium plate
Material of riser pipe I.D 6mmX1mm Copper Pipe
Material of insulation 40mm Polyurethane Form
Material of transparent cover 4mm Solar Grade Glass
Transmissivity of cover 0.9
Absorptance of absorber 0.9
Emissivity of absorber 0.1
Emissivity of glass 0.85
Heat transfer fluid Ethylene glycol water; 50% concentration
Number of thermal model segments 10 for each collector; the model collector consists of a one-pipe absorber plate2.0m length X 125mm width
Size of storage tank 300 litres for the 9 solar collectors (i.e. for the entire solar field); or 12.5 litresfor one-pipe model

The temperature is highest in the absorber plateand lowest in the transparent cover; also the rate oftemperature increase is lowest in the transparentcover. The rate of temperature increase closely fol-lows the same profile in both the absorber and inthe working fluid.
Curve fit results yielded the following second
order polynomials:
T_p: y = -0.320x2 + 8.483x + 17.93
T_wg: y = -0.334x2 + 9.080x + 11.32
T_c: y = -0.087x2 + 2.367x + 13.87
Journal of Energy in Southern Africa • Vol 24 No 4 • November 2013 59
Figure 9: Simulated hourly solar radiation values
Figure 10: Plot of temperature profiles versus segment numbers
Figure 11: Energy gains and losses profiles
versus segments
Figure 12: Temperature profile along solar banks; 180-
collector model

Figure 13 shows the hourly temperature profiles.These simulations consists of several cycles (114cycles calculated) to make an hour. The tempera-ture measurement is taken at the end of the hour.These simulations include a thermal storage repre-sented by the tank temperature T_tank.
The absorber plate attains the highest tempera-ture followed by the working fluid (water ethyleneglycol) at the exit of the solar field and in the tankstorage. The three temperature profiles follow eachother closely and build-up slowly from morning to ahigh about noon. The absorber increases tempera-ture from ambient temperature of 20oC to slightlyover 100oC about noon; the water ethylene glycolattains a maximum of slightly below 100oC andabout 90oC at the exit of the solar collector and inthe storage tank respectively. This is desirable forheat transfer to continue flowing from the absorberto the working fluid.
The transparent cover has a much lower tem-perature ranging from ambient temperature toabout 40oC. This ensures lower thermal losses.
Curve fitting gave the following results:
T_p: y = -0.460x3 + 6.007x2 - 8.466x + 23.20
T_wg: y = -0.439x3 + 5.955x2 - 10.06x + 24.93
T_tank: y = -0.403x3 + 5.831x2 - 12.62x + 27.75
T_c: y = -0.258x3 + 3.694x2 - 11.48x + 27.65
T_ambient: y = 0.988x + 18.17
5.3 Energy modelling results
Figures 14 and 15 show useful heat gains and ther-mal losses.
The levels of heat transfer to the working fluid inthe storage tank increases with time from the lowestvalues in the morning (7am) to the highest values inmid-morning (11am) and then decreases with timeattaining lower values at noon and 1pm respective-ly.
The levels of heat transfer also decrease withineach hour, being higher at the beginning of thehour than at the end; this, however, could be due tothe hourly radiation level being assumed constant.
The level of thermal losses increases with timefrom the lowest at the start of the modelling time(7am) to the highest and the end of the modellingtime (1pm). Sky losses are the highest ranging fromabout 50% to 100%.
Figure 16 shows average hourly thermal effi-ciency. The thermal efficiencies are highest near thecommencement of the modelling period (7am, 8amand 9am are highest; the lowest efficiencies are at1pm followed by 12pm).
The average efficiency has a high of 56% at8pm and a low of 35% at 1pm; the regressionanalysis yielded the following curve fit:
y = 0.055x3 - 1.321x2 + 4.265x + 51.42.
6. Discussions and conclusions
Preliminary small-scale concept plants, 500Wp and10kWp, have been presented, modelled and com-puter-simulated. The first pass modelling used 14candidate organic fluids and three optional plantconfigurations which gave thermal efficiencies rang-ing from 10.38% to 12.20%; the highest beingIsopentane and organic Rankine with recuperatorand the lowest being R245fa with conventionalorganic Rankine cycle.
The solar field modelling has been done withEthylene Glycol Water (50% concentration) as theheat transfer fluid. The model included simulationsof hourly solar insolation values, and solar collectorand storage tank energy balances.
The general trend exhibited by the temperatureprofiles for the absorber, ethylene glycol water andtransparent cover along the flow direction of theheat transfer fluid is that of a second order polyno-mial continuously increasing but with a diminishinggradient.
The hourly temperature profiles for theabsorber, transparent cover, heat transfer fluid at
60 Journal of Energy in Southern Africa • Vol 24 No 4 • November 2013
Figure 13: Hourly temperature profiles

collector exit, and heat transfer fluid in the storagetank, on the other hand exhibited a third orderpolynomial character starting with a lower gradient,developing into a steep gradient and then slowingdown to a lower gradient.
The hourly efficiency curve also exhibited athird order polynomial profile starting with highervalues and tailing down to lower values.
By regression one is able to mathematicallydetermine the totals and averages for futures analy-ses.
A simple analysis of the 9-collector model showsthe thermal energy output being less than the
approximated requirements. These will be adjustedin the full simulations once the models of the othercomponents have been finalised.
The main limitation in the simulations was thelower number of permissible variables of the aca-demic commercial version of the software and thelow computing speed to the extent that some simu-lation cycles had to be broken down to allow formanual entering of data midway through the simu-lations.
The valuable insights gained from these simula-tions will provide a solid basis for the final conceptsdesigns and physical validations.
ReferencesDuffie J.A., and Beckman W.A., (1991). Solar
Engineering of Thermal Processes, 2nd Ed., JohnWiley & Son, USA, p281.
Engineering Equation Solver (EES).Groenendaal B.J., (2002). ECN project number 7.7372:
Solar Thermal Power Technologies. Incropera F.P. et al, (2007) Fundamentals of Heat and
Mass Transfer; John Wiley & Sons, USA.Nishith B. D. and Santanu B., (2009). Process integra-
tion of organic Rankine cycle, Energy Journal, Vol.34 pp 1674–1686.
Schlaich J. and Robinson M., (1995). Principle of a
Journal of Energy in Southern Africa • Vol 24 No 4 • November 2013 61
Figure 14: Heat energy rates for storage
Figure 15: Thermal losses
Figure 16: Average hourly thermal efficiency

Solar Chimney: Solar Chimney, Axel MengesGmbH.
Situmbeko S. M., Inambao F. L., (2011). MathematicalModelling and Simulation of Low Temperature SolarThermal Energy Conversion Systems, ProceedingsISES Solar World Congress, Kassel, Germany.
Silva M R. et al, (2011). Interactive Tool to Teach SolarParabolic Trough Concepts; Proceedings ISES,SWC, Kassel, German, September 2011.
Website:www.weather.com/weather/hourbyhour/graph/SFXX0011?begHour=2&begDay=95#hhView(accessed April 03, 2012).
Website: http://www.ienergyinc.com/(accessedNovember 5, 2013).
Website: www.nrel.gov/csp/troughnet/power_plant_ sys-tems.htmlhttp://www.nrel.gov/csp/troughnet/power_plant_systems.html (accessed November 5, 2013).
Website: www.brightsourceenergy.com/technology(accessed November 5, 2013).
Website: www.:montaraventures.com/energy/wp-con-tent/uploads/2008/05/rankine-cycle-diagram.jpg(accessed January 13, 2010).
Website: www.eng.usf.edu/~hchen4/Kalina%20Cycle.htm (accessed April 04, 2012).
Website: www.solardome.co.za/documents/file/25-solar-dome-sa-priclelist.html (accessed March 12, 2012).
Website:www.thermotechs.com/Downloads/Thermomax%20Handbook.pdf (accessed March 12, 2012).
Website: www.gaisma.com/en/location/durban.html(accessed March 12, 2012).
Received 23 May 2012; revised 4 October 2013
62 Journal of Energy in Southern Africa • Vol 24 No 4 • November 2013

Abstract
The paper discusses the modelling of the influenceof temperature on average daily electricity demandin South Africa using a piecewise linear regressionmodel and the generalized extreme value theoryapproach for the period - 2000 to 2010. Empiricalresults show that electricity demand in South Africais highly sensitive to cold temperatures. Extremelow average daily temperatures of the order of8.20C are very rare in South Africa. They onlyoccur about 8 times in a year and result in hugeincreases in electricity demand.
Keywords: Extreme value theory, piecewise linearregression, regression splines, temperature
1. Introduction
Drivers of electricity demand are generally dividedinto economic factors, calendar effects, weathervariables and lagged demand variables. Inclusion ofthese factors in electricity demand models improvesthe predictive power of the models and alsoenables system operators and load forecasters tohave a better understanding of the factors thathave a greater impact on electricity demand.Weather variables such as temperature, solar radia-tion, humidity, wind speed and rainfall are oftenused as explanatory variables in regression based loadforecasting models. Most authors, however, use tem-perature as the main driver (Munoz et al., 2010).
The influence of temperature on daily electricityload forecasting has been studied extensively in theenergy sector using classical time series, regressionbased methods including artificial neural networks(Miragedis et al., 2006; Hekkenberg et al., 2009;Psiloglou et al., 2009; Munoz et al., 2010; Pilli-
Sihvola et al., 2010; among others). The paper dis-cusses the modelling of the effect of average dailytemperature on daily electricity demand in SouthAfrica using a piecewise linear regression modellingframework and the generalized extreme value theoryapproach. A generalized extreme value distribution(GEVD) is fitted to the temperature data below thereference temperature. Extreme value theory(EVT) is a powerful and fairly robust frameworkfor modelling the tail behaviour of a distribution(Gencay and Selcuk, 2004). Extreme value theoryhas been applied in various fields such as flood fre-quency analysis, environmental sciences, model-ling extreme temperatures, finance and insuranceincluding material and life sciences. The family ofextreme value distributions is called the generalizedextreme value distribution. GEVD consists of theGumbel, Frechet and Weibull class distributionswhich are also known as the type I, II and III extremevalue distributions respectively.
The rest of the paper is organized as follows. Themodels are discussed in Section 2. In Section 3 webriefly describe the data used. Empirical results arepresented in Section 4 while Section 5 concludes.
2. The models
Our modelling approach is in two stages. A piecewiselinear regression model is used to explore the effect oftemperature on daily electricity demand. In stagetwo, we fit a generalized extreme value distributionto the temperature values below the reference tem-perature. The fitted distribution is then used to esti-mate extreme low temperatures and calculating thecorresponding marginal increases of electricitydemand.
2.1 Piecewise linear regression model
The piecewise linear regression model used formodelling the influence of temperature on electric-ity demand is given in equation (1).
Journal of Energy in Southern Africa • Vol 24 No 4 • November 2013 63
Modelling influence of temperature on daily peak
electricity demand in South Africa
Delson ChikobvuDepartment of Mathematical Statistics and Actuarial Science, University of the Free State, South Africa
Caston SigaukeSchool of Statistics and Actuarial Science, University of the Witwatersrand, South Africa
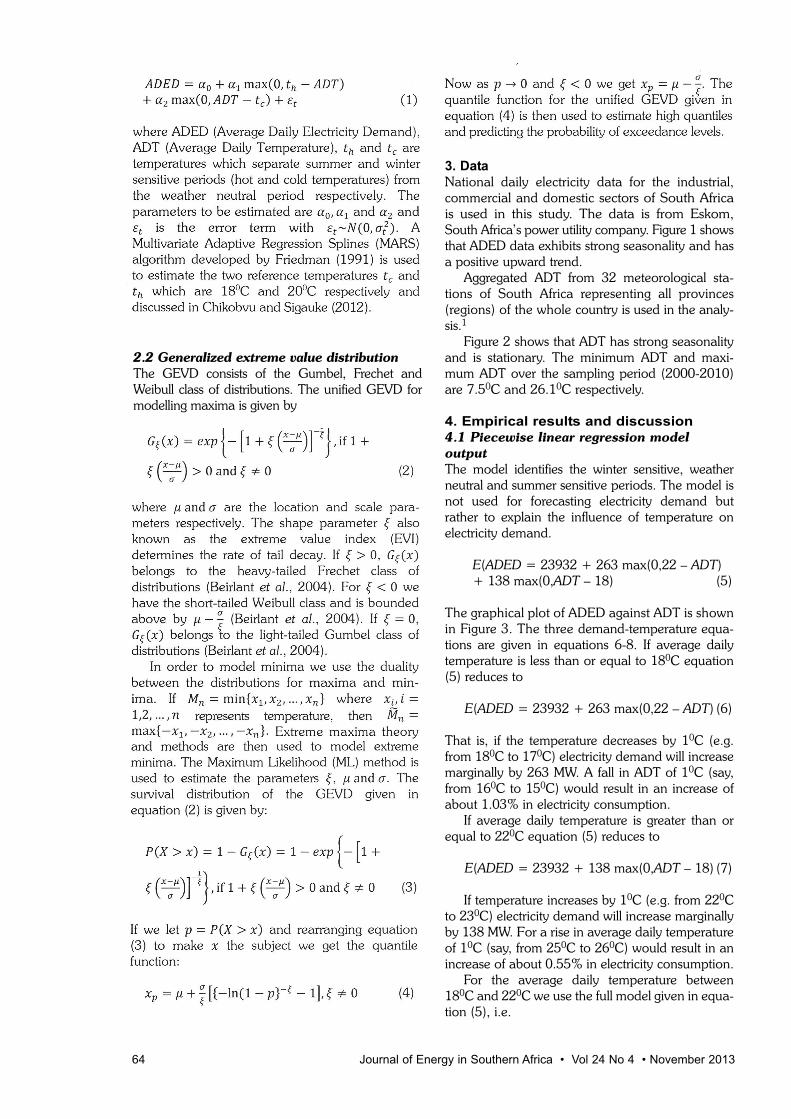
2.2 Generalized extreme value distribution
The GEVD consists of the Gumbel, Frechet andWeibull class of distributions. The unified GEVD formodelling maxima is given by
3. Data
National daily electricity data for the industrial,commercial and domestic sectors of South Africais used in this study. The data is from Eskom,South Africa’s power utility company. Figure 1 showsthat ADED data exhibits strong seasonality and hasa positive upward trend.
Aggregated ADT from 32 meteorological sta-tions of South Africa representing all provinces(regions) of the whole country is used in the analy-sis.1
Figure 2 shows that ADT has strong seasonalityand is stationary. The minimum ADT and maxi-mum ADT over the sampling period (2000-2010)are 7.50C and 26.10C respectively.
4. Empirical results and discussion
4.1 Piecewise linear regression model
output
The model identifies the winter sensitive, weatherneutral and summer sensitive periods. The model isnot used for forecasting electricity demand butrather to explain the influence of temperature onelectricity demand.
E(ADED = 23932 + 263 max(0,22 – ADT) + 138 max(0,ADT – 18) (5)
The graphical plot of ADED against ADT is shownin Figure 3. The three demand-temperature equa-tions are given in equations 6-8. If average dailytemperature is less than or equal to 180C equation(5) reduces to
E(ADED = 23932 + 263 max(0,22 – ADT) (6)
That is, if the temperature decreases by 10C (e.g.from 180C to 170C) electricity demand will increasemarginally by 263 MW. A fall in ADT of 10C (say,from 160C to 150C) would result in an increase ofabout 1.03% in electricity consumption.
If average daily temperature is greater than orequal to 220C equation (5) reduces to
E(ADED = 23932 + 138 max(0,ADT – 18) (7)
If temperature increases by 10C (e.g. from 220Cto 230C) electricity demand will increase marginallyby 138 MW. For a rise in average daily temperatureof 10C (say, from 250C to 260C) would result in anincrease of about 0.55% in electricity consumption.
For the average daily temperature between180C and 220C we use the full model given in equa-tion (5), i.e.
64 Journal of Energy in Southern Africa • Vol 24 No 4 • November 2013

E(ADED = 23932 + 263 max(0,22 – ADT) + 138max(0,ADT – 18) (8)
If temperature decreases by 10C (e.g. from 220Cto 210C) electricity demand will increase marginallyby 125 MW. A decrease of ADT from 200C to 190Cwould result in an increase of about 0.51% in elec-tricity consumption.
This analysis shows that electricity demand inSouth Africa is highly sensitive to cold temperature(see Figure 3). There is a non-linear relationshipbetween temperature and electricity demand asshown in Figure 3. This non-linear relationship ismodelled in literature using heating degree days(HDD) and cooling degree days (CDD). Modellingof this relationship between temperature and elec-tricity demand is discussed in literature (Mirasgedis,2006; Franco and Sanstad, 2008; Psilogu et al.,2009; Munoz et al., 2010; Pilli-Sihvola et al.,2010; among others). HDD and CDD are calculat-ed using the following functions:
HDDt = max(Tr – ADT,) (9)
CDDt = max(ADT – Tr ,0) (10)
where ADT is the average daily temperature attime and is the reference temperature.
In this paper a piecewise linear regression modelis used with two reference temperature valueswhich are estimated using the MARS algorithm(Friedman, 1991).
Figure 3 shows the plot of the model in equation(5). The piecewise linear regression plot separates thenon-linear response of electricity demand to tempera-ture into three regions: cold for temperatures lowerthan 180C, neutral for temperatures between 180Cand 220C, and hot for temperatures above 220C.
There are other several methods of filtering data(i.e. removing both the trend and the calendareffects) which are discussed in literature (see Moral-Carcedo and Vic´ens-Otero, 2005; Munoz et al.,2010; among others).
Journal of Energy in Southern Africa • Vol 24 No 4 • November 2013 65
Figure 1: Average daily electricity demand (megawatts) from 2000-2010
Figure 2: Time series plot of average temperature (degrees C)
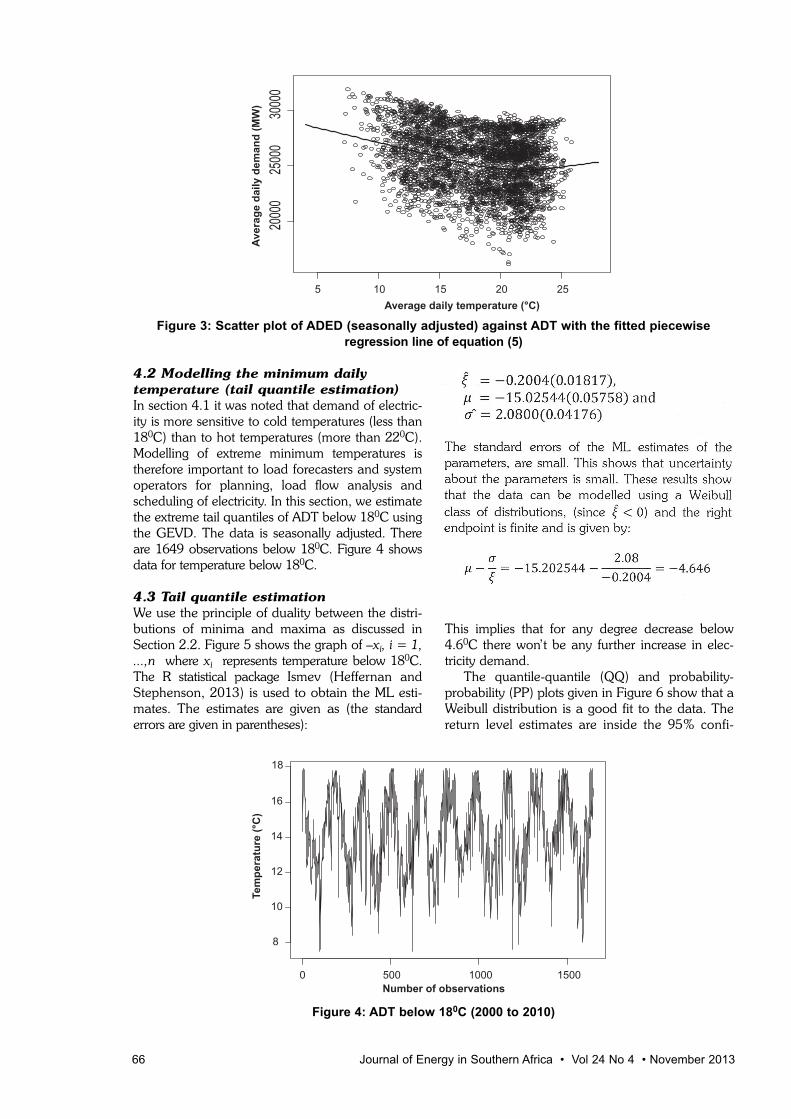
4.2 Modelling the minimum daily
temperature (tail quantile estimation)
In section 4.1 it was noted that demand of electric-ity is more sensitive to cold temperatures (less than180C) than to hot temperatures (more than 220C).Modelling of extreme minimum temperatures istherefore important to load forecasters and systemoperators for planning, load flow analysis andscheduling of electricity. In this section, we estimatethe extreme tail quantiles of ADT below 180C usingthe GEVD. The data is seasonally adjusted. Thereare 1649 observations below 180C. Figure 4 showsdata for temperature below 180C.
4.3 Tail quantile estimation
We use the principle of duality between the distri-butions of minima and maxima as discussed inSection 2.2. Figure 5 shows the graph of –xi, i = 1,...,n where xi represents temperature below 180C.The R statistical package Ismev (Heffernan andStephenson, 2013) is used to obtain the ML esti-mates. The estimates are given as (the standarderrors are given in parentheses):
This implies that for any degree decrease below4.60C there won’t be any further increase in elec-tricity demand.
The quantile-quantile (QQ) and probability-probability (PP) plots given in Figure 6 show that aWeibull distribution is a good fit to the data. Thereturn level estimates are inside the 95% confi-
66 Journal of Energy in Southern Africa • Vol 24 No 4 • November 2013
Figure 3: Scatter plot of ADED (seasonally adjusted) against ADT with the fitted piecewise
regression line of equation (5)
Figure 4: ADT below 180C (2000 to 2010)

dence interval. This is an indication that the fitteddistribution is capable of accurately predictingfuture return levels. We then use equation (4) toestimate the future return levels for different returnperiods. The return level is the quantile of theGEVD (Weibull distribution). For example, the 95th
quantile is obtained as follows:
The number of observations that are smallerthan the estimated tail quantile (x0.05 = 10.369) arethen counted and found to be 78. For the observednumber of exceedances, we get 0.05 × 1649 =82.45 ≈ 82 where 1649 is the number of tempera-ture values below 180C. The increase in electricitydemand for a drop of temperature from 180C to x0.05
= 10.4°C is given by (18 – 10.4) × 263 =1998.8MW, where 263 is the marginal increase indemand for a decrease of 10C below 180C as dis-cussed in Section 4.1. It should be noted that this
Journal of Energy in Southern Africa • Vol 24 No 4 • November 2013 67
Figure 5: Inverted graph of Figure 4. Figure 4 is inverted so that we can use the duality between the
distributions for maxima and minima
Figure 6: Diagnostic plots illustrating the fit of the data (temperature below 180C) to the GEVD, (a)
Probability plot (top left panel), (b) Quantile plot (top right panel), (c) Return level plot (bottom left
panel) and (d) Density plot (bottom right panel)

increase in ADED for temperature decreases below180C is bounded above. As temperature decreasesbelow 180C, the increases in ADED reaches a cer-tain maximum after which any further decrease intemperature will not have any effect on ADED. Thatis as temperature decreases people will switch onheating systems up to a point when all the heatingsystems are all switched on and no additional ener-gy is consumed.
Table 1 presents a summary of the estimated tailquantiles at different tail probabilities. The tailquantiles (temperature) are given in column 2. Theobserved number of observations (temperature)that are smaller than the estimated tail quantiles areshown in column 3 while column 4 shows the cor-responding number estimated using GEVD. Inequation (5) it is given that for a degree decrease intemperature below 180C there will be a marginalincrease in demand of 263 MW. For each of the esti-mated quantiles in column 2, column 5 shows themarginal increases from one quantile to the next, e.g.if temperature drops from 11.30C to 10.40C there
will be an increase in demand of 263(11.3 – 10.4)= 236.7MW. Similarly, for a decrease from 10.40Cto 8.80C the marginal increase will be 263(10.4 –8.8) = 420.8MW. Extreme low average daily tem-peratures of the order of 8.20C are very rare in SouthAfrica. This only occurs about 8 times in a year.
Table 2 given in the Appendix summarizes thetemperature values at high quantiles and the corre-sponding marginal increases while Figure 7 showsthat the marginal increases converge to 1.58 MWwhen temperature converges to 4.60C.
A summary of the monthly frequency of occur-rence of temperature values below 12.40C (i.e.above the 95th quantile –x0.05 = 10.369 is given inTable 2. Over the sampling period, i.e. years 2000to 2010 the month of July has the highest number ofdays with temperature values below 10.40C. This isan indication that the month of July is the coldestmonth in South Africa and the winter period is fromMay to August of each year.
The bar chart of the monthly frequency ofoccurrence of exceedances is given in Figure 8.
68 Journal of Energy in Southern Africa • Vol 24 No 4 • November 2013
Table 1: In-sample evaluation of estimated tail quantiles at different probabilities (number of
exceedances)
Quantiles Temp (xp) Observed no. GEVD (no. of Marginal increase inof exceedances exceedances) demand (MW)
90th 11.30C 164 159
95th 10.40C 82 78 236.7
99th 8.80C 16 12 420.8
99.5th 8.20C 8 8 157.8
Table 2: Monthly frequency of exceedances below x0.05 = 10.4°C
Month Jan Feb Mar Apr May Jun Jul Aug Sep Oct Nov Dec
Freqency 0 0 0 0 11 16 45 6 0 0 0 0
Figure 7: (a) Left panel shows that the gradual decrease in temperature converges to 4.60C
and (b) Right panel shows that the marginal increases converge to 1.58MW when temperature
converges to 4.60C

Figure 8: Bar chart of the monthly frequency of
occurrence of exceedances (x0.05 = 10.4).
The exceedances are average daily
temperature values below 10.40C
5. Conclusion
An analysis of the intensity and frequency ofoccurrence of extreme low temperatures is impor-tant for load forecasters in the electricity sector. Inthis paper, the modelling of the influence of tem-perature on average daily electricity demand inSouth Africa using a piecewise linear regressionmodel and the extreme value theory modellingframework is discussed. The developed piecewiselinear regression model is not meant for forecastingbut to model the effect of temperature on electricitydemand. The study establishes temperature as animportant variable in explaining electricity demand.Empirical evidence from this study shows that fortemperature values below 180C demand for elec-tricity in South Africa increases significantly whilefor temperature values above 220C demandincreases slightly. This analysis is important for deci-sion makers in Eskom, South Africa’s power utilitycompany. Extreme low temperatures can be mod-elled by the Weibull class of distributions. Extremelow temperatures of the order of 60C are very rarein South Africa, but can cause huge increases inelectricity demand. An investigation of expected
cooler or warmer than typical years is importantand helps in guiding planning to decision makers inthe electricity sector.
Areas for future research would include a compar-ative analysis of the generalized extreme value distri-bution with a generalized Pareto distribution and ageneralized single Pareto distribution in modellingextreme low temperatures in South Africa. Theseareas will be studied elsewhere.
Note
1. Average daily temperature for the whole country isusually built into the modelling as weighted averagetemperatures from different meteorological stations ofa country. The weightings should reflect consumptionof electricity of each region (province). Populationfigures are often used for estimating the weights. Inthis research, the weightings were not done since onlyaggregated average daily temperature was available.
Acknowledgments
The authors are grateful to Eskom for providing the dataand to the numerous people who assisted in making com-ments on this paper.
ReferencesChikobvu, D. and Sigauke, C., (2012). A frequentist and
Bayesian regression analysis to daily peak electricityload forecasting in South Africa. African Journal ofBusiness Management, 6(40): 10524-10533.
ClimateTemp.info. (Accessed on 10 June 2012) www.climatetemp.info/south-africa/.Franco, G. and Sanstad, A.H. (2008). Climate change
and electricity demand in California. ClimaticChange, 87 (Suppl 1): S139-S151.
Heffernan, J.E. and Stephenson, A.G. (2013). Ismev:R package version 1.39.
Hekkenberg, M., Benders, R.M.J., Moll, H.C. and
Journal of Energy in Southern Africa • Vol 24 No 4 • November 2013 69
Appendix
Table 2: Evaluation of estimated tail quantiles using the GEVD quantile function
Observation number 1 2 3 4 5
Quantile 99.99th 99.999th 99.9999th 99.99999th 99.999999th
Temp (deg C) 6.285 5.679 5.297 5.056 4.905
Marginal increase (MW) 252.74 159.38 100.5 63.38 39.713
Observation number 6 7 8 9 10
Quantile 99.9999999th 99.99999999th 99.999999999th 99.9999999999th 99.99999999999th
Temp (deg C) 4.809 4.749 4.711 4.687 4.672
Marginal increase (MW) 25.248 15.78 9.994 6.312 3.945
Observation number 11 12 13 14
Quantile 99.999999999999th 99.9999999999999th 99.99999999999999th 99.999999999999999th
Temp (deg C) 4.662 4.656 4.652 4.646
Marginal increase (MW) 2.63 1.578 1.052 1.578

Schoot, A.J.M. (2009). Indications for a changingElectricity demand pattern: The temperaturedependence of electricity demand in theNetherlands, Energy Policy, 37: 1542-1551.
Gencay, R. and Selcuk, F. (2004). Extreme value theoryand value-at-risk: relative performance in emergingmarkets. International Journal of Forecasting, 20:287-303.
Hyndman, R.J., Fan, S. (2010). Density forecasting forlong-term peak electricity demand. IEEE Transactionson Power Systems, 25(2): 1142-1153.
Mirasgedis, S., Sarafidis, Y., Georgopoulou, E., Lalas,D.P., Mschovitis, M., Karagiannis, F. andPapakonstantinou, D. (2006). Models for mid-termelectricity demand forecasting incorporating weatherinfluences. Energy, 31: 208-227.
Moral-Carcedoa, J. and Vic´ens-Otero, J. (2005).Modelling the non-linear response of Spanish elec-tricity demand to temperature variations. EnergyEconomics, 27, 477–494.
Munoz, A., Sanchez-Ubeda, E.F., Cruz, A. and Marin, J.(2010). Short-term forecasting in power systems: aguided tour. Energy Systems, 2: 129-160.
Pilli-Sihvola, K., Aatola, P., Ollikainen, M. andTuomenvirta, H. (2010). Climate change and electrici-ty consumption Witnessing increasing or decreasing useand costs, Energy Policy, 38(5), pp. 2409-2419.
Psiloglou, B.E., Giannakopoulos, C., Majithia, S. andPetrakis, M., (2009). Factors affecting electricitydemand in Athens, Greece and London, UK: Acomparative assessment. Energy, 34: 1855-1863.
SouthAfrica.info. (Accessed on 10 June 2012)southafrica.info/travel/advice/climate.htm.
www.ral.ucar.edu/˜ericg/softextreme.php.
Received 1 October 2012; revised 21 November 2013
70 Journal of Energy in Southern Africa • Vol 24 No 4 • November 2013

Abstract
A computational analysis to investigate the effects ofcompressor pressure ratio, turbine inlet tempera-ture, ambient relative humidity and ambient tem-perature on the performance parameters of an aircooled gas turbine cycle with evaporative cooling ofinlet air has been presented. The blade coolingmethod selected is film cooling. The analysis indi-cates that the mass of coolant required for bladecooling is reduced with increase in temperaturedrop across the humidifier. Both decrease in ambi-ent temperature and ambient relative humidityresults in an increase in plant efficiency and plantspecific work. The highest efficiency is obtained at aturbine inlet temperature of 1500 K for all range ofambient relative humidity and ambient tempera-ture, beyond which it decreases. The compressorpressure ratio corresponding to the maximum plantspecific work, however, varies with both ambientrelative humidity and ambient temperature. Theincrease in specific work due to drop in ambient rel-ative humidity is more pronounced at higher pres-sure ratios. Similarly, the increase in efficiency dueto ambient temperature drop is prominent at higherturbine inlet temperatures. Finally, a design nomo-graph is presented to select the design parameterscorresponding to best efficiency and specific work.
Keywords: inlet-air cooling, air-humidifier, gas tur-bine, evaporative cooling, parametric analysis, air-film blade cooling
Nomenclature
a = ratio of mass of coolant to mass of gas flow
a,b,c = constantscp = specific heat (kJ-kg-1.K-1)
fh = correction factor to account for vaporadded in humidifier
F = factor Fsa = correction factor to account actual blade
surfacegt = gas turbineh = specific enthalpy (kJ.kg-1)∆Hr = lower heating value (kJ.kg-1)m = mass flow rate (kg.s-1)Q = heat energy transfer (W)rp = cycle pressure ratioR = gas constant (kJ-kg-1.K-1)p = total pressure (bar)S = blade perimeter (m)
= average Stanton number
t = pitch of blade (m)T = temperature (K)TIT = turbine inlet temperature (K) = combustor
exit temperatureW = specific work (kJ.kg-1)t a = air temperature (oC)
Greek symbols
φ = relative humidity (ratio)ω = specific humidity (kg/kg)α = gas flow discharge angle (degree)
ε = effectiveness (%)
η = efficiency (%)
Subscripts
a = air, ambientav = averageb = bladec = compressorcomb= combustor
Journal of Energy in Southern Africa • Vol 24 No 4 • November 2013 71
Performance analysis of an air humidifier integrated gas
turbine with film air cooling of turbine blade
Alok K Mahapatra Department of Mechanical Engineering, Nalanda Institute of Technology, Bhubaneswar, India
B E Sanjay Department of Mechanical Engineering, National Institute of Technology, Jamshedpur, India
.

dr = drope = exitf = fuel g = gasalt = alternatorgt = gas turbineh = humidifierI = inlet, stage of compressorin = inletinc = increasej = coolant bleed pointsnet = difference between two valuesp = pressureplant = gas turbine plantpt = polytropicsat = saturationvap = water vaporv = volume ……..(m3)w = water
Acronym
AFC = Air film coolingAHIGT = Air humidifier integrated gas turbineC = CompressorCC = Combustion chamberGT = Gas turbineRH = relative humidity (ratio)
1. Introduction
Gas turbines have gained widespread acceptance inthe power generation, mechanical drive, and gastransmission markets. The gas turbine cycle burningnatural gas (NG) as fuel, gives high efficiency, largeoutput, and reduced emission. Major power plantequipment manufacturers are currently undertakinghigh profile development programs of gas turbines.The present state-of-the-art gas turbine plant(LMS100) employing an intercooled gas turbine,yields simple cycle thermal efficiency of the order of47 per cent based on a lower heating value analy-sis. The efficiency of the gas turbine cycle has beenimproved mainly due to combination of many fac-tors e.g. increased firing temperature, increasedpressure ratio, improved component design, coolingand combustion technologies, and advanced mate-rials and system integration (e.g. combined cycles,intercooling, recuperation, reheat, chemical recu-peration) etc.
Wright and Gibbons (2007) have thoroughlyreviewed the recent developments in gas turbinematerials and technologies. Consequently, thermalefficiencies are currently very attractive, with simplecycle efficiencies ranging between 32% and 42 %and combined cycle efficiencies reaching the 60%mark. The efficiency of the gas turbine cycle hasbeen improved mainly due to enhanced gas turbineperformance through advancements in materials
and cooling methods in recent years. The two important methods of improving the
gas turbine performance are by inlet air cooling andgas turbine blade cooling. The highest losses ofpower due to increase in the ambient air tempera-ture in gas turbine power output usually coincidewith periods of high electricity demand. A gas tur-bine loses approximately 7% of its nominal powerwhen the intake temperature increases from 15 oC,ISO conditions, to 25 oC, and in cases such as insummer when the ambient temperature increasesabove 25 oC, the losses are still bigger, reachingeven 15% of the power rating with 36 oC. By theaddition of an air-cooling system at the compressorintake, the inlet air can be conditioned to lowertemperatures than ambient, thus improving plantperformance at high ambient temperatures. As theinlet air temperature drops, compressor workdecreases and so the network and cycle efficiencyincreases. In addition, air density increases withdrop in inlet temperature, which results in anincrease in mass flow rate of air entering the com-pressor and so the power output is furtherenhanced.
De Lucia et al. (1995) have studied gas turbineswith inlet air cooling and concluded that evapora-tive cooling could enhance the power produced byup to 4% per year. Hosseini et al., (2007) summa-rized that the output of a gas turbine of the Farscombined cycle power plant at 38 oC ambient tem-perature and 8% relative humidity is 11 MW more,and the temperature drop of the inlet air is about 190C with media evaporative cooling installations.Zadpoor and Nikooyan (2009) have concluded thatevaporative inlet cooling systems do not work wellin humid areas. Najjar (1996) analyzed that theaddition of absorption inlet cooling improves thepower output by about 21%, overall thermal effi-ciency by about 38 % and overall specific fuel con-sumption by 28%. Bassily (2001) carried out ener-gy balance analysis of gas turbine cycles and report-ed that introducing indirect inlet air cooling, evapo-rative after cooling of the compressor dischargealong with regeneration, intercooling, and reheatincrease the performance significantly. Wang andChiou (2004) calculated that the expected benefitsfrom the inclusion of the inlet cooling feature isabout 12% increase in power output and 5.16%increase in efficiency when the ambient tempera-ture is cooled from 305 K to 283 K. Bassily (2001)presented the effect of evaporative inlet and aftercooling on the performance of recuperated gas tur-bine cycle and showed that evaporative inlet cool-ing could boost the efficiency of the recuperatedcycle by up to 3.2%. Alhazmy and Najjar (2004)have analysed the inlet air chilling using a coolingcoil and observed that the cooling coil improves theturbine output by 10% during cold humid condi-tions and by 18% during hot humid conditions.
72 Journal of Energy in Southern Africa • Vol 24 No 4 • November 2013

However, net power generated from the plant dropsby 6.1% and 37.6%, respectively. Kakaras et.al.,(2004) presented a computer simulation of an inletair cooling method and reported that the integra-tion of absorption inlet cooling demonstrates higherpower and efficiency compared to evaporativecooling for simple gas turbines.
The search for a better performance of gas tur-bine engines has also led to adoption of higher tur-bine inlet temperatures. However, the maximumvalue of TIT is restricted by metallurgical limits ofturbine blade material, which should be kept at1123 K in order to protect the blades from damage.The turbine inlet temperature TIT could be raisedabove this limit by using especial high temperaturematerials or cooling the hot turbine componentswith a suitable coolant. The objective of the bladecooling is to keep the blade temperature to a safelevel, to ensure a long creep life, low oxidationrates, and low thermal stresses. The universalmethod of blade cooling is by air bled from com-pressor flowing through the internal passages in theblades.
Work in this area has been done by Louis et al.,(1983), Wu and Louis [1984], El-Masri (1986), El-Masri (1988), Briesh et al,. (1995), Bolland andStadaas (1995), Bolland (1991), Chiesa andMacchi (2002),Dechamps (1998), and Sanjay etal., (2007), Sanjay et al., (2008), Sanjay et al.,(2009) and Sanjay (2011). Nevertheless, Horlock etal., (2001) have argued that the efficiency benefitsof higher temperatures may be more than offset bythe increased losses associated with the cooling flowrates required. Also increasing TIT increases NOxemission and so necessary control mechanism mustbe employed to keep this NOx emission within per-missible limits. This increase in coolant mass flowrequirement and emission of NOx gases with adop-tion of higher TIT can be substantially reduced by
the integration of inlet air cooling systems to gas tur-bines and combined cycle plants. It is thereforeinteresting to investigate the effect of integration ofinlet air cooling to cooled gas turbine based com-bined cycle plant
It is observed from a study in the cited literaturesthat none of the previous work has investigated thesimultaneous effect of compressor inlet air-coolingand gas turbine blade cooling on the performanceof a gas turbine cycle. It is interesting to note thatthe mass of coolant required for gas turbine bladecooling is a function of inlet air temperature andreduces with increase in temperature drop.
The present work is an attempt in this directiondealing with the combined effect of turbine bladecooling and evaporative inlet air-cooling on the per-formance of basic gas turbine cycle. The effects ofcompressor pressure ratio, turbine inlet tempera-ture, ambient relative humidity and ambient tem-perature have been observed on the thermody-namic performance parameters of the cycle. Figure1 shows the schematic diagram of a basic gas tur-bine cycle with inlet air humidifier and is beingcalled air humidifier integrated gas turbine(AHIGT).
2. Modelling of governing equations
Parametric study of the combined cycle using dif-ferent means of cooling has been carried out bymodeling the various elements of a gas turbinecycle using the governing equations. The followingare the modeling details of various elements.
2.1 Gas model
The specific heat of real gas varies with temperatureand also with pressure at extreme high pressure lev-els. However, in the present model, it is assumedthat specific heat of gas varies with temperatureonly and is given in the form of polynomials as fol-
Journal of Energy in Southern Africa • Vol 24 No 4 • November 2013 73
Figure 1: Schematic of an air humidifier integrated gas turbine

lows:
The enthalpy of ambient air entering the air-humidifier is assigned zero value. In the gas model,natural gas (NG) is the fuel used in combustors andthe composition and physical properties (such as,etc.) of burnt gas composition depend upon thecomposition of NG that may vary from well-to-well(i.e. the source of NG). For this thermodynamicstudy, the fuel composition is taken as CH4 = 86.21%, C2H6 = 7.20 %, and CO2 = 5.56 %, and N2 =1.03 % by weight.
2.2 Humidifier model
Cooling in a hot, relatively dry climate can beaccomplished by evaporative cooling. Evaporativecooling involves passing air across a spray of wateror forcing air through a soaked pad that is keptreplenished with water (Moran and Shapiro, 1995).Owing to the low humidity of entering air, a part ofthe water injected evaporates. The energy requiredfor evaporation is provided by the air stream, whichis undergoes a reduction in temperature.
The following assumptions are made in thehumidifier model:• The relative humidity at the humidifier outlet is
95%• The pressure drop of air in the humidifier is 1%
of the ambient air pressure.Applying the mass balance equation across the
humidifier control volume boundary gives
74 Journal of Energy in Southern Africa • Vol 24 No 4 • November 2013

2.5 Cooled gas turbine
Unlike steam turbine blading, gas turbine bladingsneed cooling. The objective of the blade cooling isto keep the “blade temperature to a safe level, toensure a long creep life, low oxidation rates, andlow thermal stresses. The universal method of bladecooling is by air bled from the compressor flowingthrough the internal passages in the blades. In thecase of film cooling, the coolant exits from the lead-ing edge of blade and a film is formed over theblade surface, which reduces the heat transfer fromthe hot gas to the blade surface.
In this work, the gas turbine blades have beenmodeled to be cooled by the air-film cooling (AFC)method. The cooling model used for cooled turbineis the refined version of that by Louis et al. Themass flow rate of coolant required in a blade row isexpressed as (Sanjay, 2011):
Also blade coolant requirement is dependent onthe temperature of coolant air at the bleed points,which in turn, is dependent upon the temperatureof air at the compressor inlet. With a drop in tem-perature of air at the inlet of compressor achievedin the humidifier, there is a proportionate drop inthe temperature of bled coolant due to more effec-tive blade cooling achieved by lower temperaturebled coolant and hence lesser coolant requirement.Also, as the mass of bled coolant is less, hence thequantum of pumping and mixing loss associatedwith the mixing of coolant stream with main gasstream is also less.
Figure 2 gives the details of expansionprocess for a cooled turbine stage. Process b1-c1 inFigure 2 depicts cooling due to heat transferbetween hot gas and coolant, which takes place atconstant pressure line due to which exergy decreas-es, while process c1-d1 depicts drop in temperaturedue to mixing of coolant with gas which is an irre-versible process and also takes place along constantpressure line, which leads to drop in entropy.Process d1-a2 in the model denotes a process simi-lar to throttling.
Journal of Energy in Southern Africa • Vol 24 No 4 • November 2013 75
Table 1: Input data for analysis [21-24, 27]
Parameter Symbol Unit
Gas properties: Cp=¦(T) kJ/kg KEnthalpy h=ócp(T) dT KJ/kg
Air-humidifier Pressure drop across %humidifier = 1Wetted pad, cross flow type -
Compressor Polytropic efficiency (hp,c) %=92. 0Mechanical efficiency(hm) %=98. 5Inlet plenum loss= 0. 5% of entry pr. bar
Combustor Combustor efficiency (hcomb) %=99. 5Pressure loss (ploss)=2. 0% barof entry pressure MJ/kgLower heating value = 42. 0 %
Gas turbine Polytropic efficiency (hpt) %=92. 0Exhaust pressure=1. 08 barExhaust hood loss=4 KTurbine blade temp = 1123 K
Alternator Alternator efficiency=98. 5 %

The deviation between actual and theoreticalvalue is driven by the amount of coolant andcoolant temperature used for cooling of blades andthe actual value varies with blade cooling require-ments. At TIT 1700K for air-film cooling, its maxi-mum value is ±6% (Sanjay, 2011). Turbine workand exergy destruction are given by the mass, ener-gy and exergy balance of gas turbine as under:
Modeling of cycle components and governing
equations developed for cycles proposed have beencoded using C++ and results obtained. A flowchartof the programme code ‘Simucomb’ illustrating themethod of solution is detailed in an earlier article(Sanjay 2011). The input data used in the analysisis given in Table 1.
4. Result and discussions
The influence of evaporative inlet air cooling on gasturbine performance has been shown through theperformance curves, plotted using modeling, gov-erning equations and input parameters (Table 1).
Fig. 3(a) shows the effect of inlet cooling on thevariation of coolant mass required for blade coolingwith respect to ambient temperature. It is evidentfrom the results that the coolant mass requiredincreases with increase in ambient temperature forboth the cases. However, as the ambient tempera-ture increases for a given RH, the effectiveness ofthe cooling is also increased due to a higher satura-tion pressure and, as a result, the increase in themass of coolant required for turbine blade cooling isless for a given rise in temperature in case of inletcooled gas turbine.
Figure 3(b) shows the effect of CIT on mass ofblade coolant required and mass of fuel require-ment for EVGT configuration. It is observed that as
76 Journal of Energy in Southern Africa • Vol 24 No 4 • November 2013
Figure 2: Expansion path in cooled gas turbine row

the CIT is reduced, and the blade coolant mass flowrate decreases. This is because, with a drop in tem-perature of air at the inlet of compressor, that isachieved in the refrigeration system, there is a pro-portionate drop in the temperature of bled coolantdue to more effective blade cooling achieved bylower temperature bled coolant and, hence, lessercoolant requirement. However, due to the reductionin the CIT, the rise in temperature required to beachieved in the CC increases (for a given TIT). Thisrequires a higher amount of heat to be supplied inthe CC and so mass of fuel input increases.
Figure 4 shows the benefit of inlet cooled GTcycle over the basic GT cycle without inlet coolingin terms of enhancement in plant efficiency. It isobserved that when the relative humidity isdecreased for a given ambient temperature, the effi-
ciency of inlet cooled GT cycle is increased due tohigher drop in temperature achieved in the evapo-rator whereas the efficiency without inlet coolingalmost remains unaltered. It can also be concludedfrom the results that for a given ambient relativehumidity as the ambient temperature increasesthough the efficiency is reduced for both the casesthe improvement in efficiency obtained due to inletcooling is increased. This is due to the fact that athigher ambient temperature the difference betweenwet and dry bulb temperature is higher resulting inmore effective cooling leading to larger temperaturedrop in the humidifier and lesser amount of coolantrequirement as discussed for Figure 3(a).
Figure 5 shows the effect of TIT on plant effi-ciency at different ambient temperature. It isobserved that the efficiency reduces with increase in
Journal of Energy in Southern Africa • Vol 24 No 4 • November 2013 77
Figure 3(a): Effect of ambient temperature on coolant mass for basic and inlet cooled gas turbine
Figure 3(b): Effect of ambient temperature on coolant mass for basic and inlet cooled gas turbine

temperature. This is because at higher ambient tem-perature though the drop in temperature is higherowing to higher difference between WBT and DBT,the compressor inlet temperature is also high. Adrop of 20o C at an ambient temperature of 318Kresults in a CIT of 298K against a CIT of 284K at anambient temperature of 288K where the tempera-ture drop is only 8oC. However, the reduction inefficiency at higher ambient temperature becomesless pronounced compared to basic gas turbine dueto inlet cooling. It is also found from the results thatthe rate of increase in efficiency is higher at higherTIT. The inlet air cooling boosts the efficiency by 3.51 % at a TIT of 1300K (rp,c=25, RHa=0. 2) whenthe ambient temperature drops by 300 C. Thisenhancement increases to 4. 22% for a TIT of1800K at the same value of rp,c, RHa and ambienttemperature drop. .
Figure 6 shows the variation of rp,c and increasein RH of air achieved in the humidifier on plant spe-cific work. It is clearly seen that the specific workincreases with increase in specific humidity of airachieved in the humidifier, the enhancement beinghigher at higher value of rp,c. The specific workincreases by 11. 62% at rp,c=28 against an increaseof 8. 4% at rp,c=16 for same increase in RH of airachieved in the humidifier. The effect of variation ofrp,c on turbine specific work suggests that specificwork slightly increases with increase in pressureratio for all range of specific humidity after which itdecreases. It is also observed that the rp,c corre-sponding to maximum specific work increases withdecrease in ambient relative humidity. This suggeststhat for a higher value of plant specific work thereexists an optimum rp,c (for a given increase in RHachieved in the humidifier) and the rp,c needs to bechosen.
Figure 7 shows the variation of rp,c and Ta onspecific fuel consumption and plant specific work ofan AHIGT cycle. An increase in the specific workand decrease in specific fuel consumption isobserved with decrease in Ta. This is because athigher temperature though the temperature drop inhumidifier is higher, the compressor inlet tempera-ture is also high. The specific fuel consumptiondecreases by 4. 29% at rp,c=28 against a decreaseof 3. 66% at rp,c=16 for same range of ambienttemperature drop. The effect of variation of rp,c onturbine specific work suggests that specific workincreases with increase in pressure ratio for all rangeof ambient temperature after which it decreases. Itis also observed that the rp,c corresponding to max-imum specific work is higher at lower ambient tem-perature. This suggests that for a higher value ofplant specific work there exist an optimum rp,c (cor-
78 Journal of Energy in Southern Africa • Vol 24 No 4 • November 2013
Figure 4: Effect of ambient condition on plant
efficiency of gas turbine with and without inlet
cooling
Figure 5: Effect of turbine inlet temperature on plant efficiency at different ambient temperature

responding to a given ambient temperature) andthe same needs to be chosen as per discussionsdetailed in the previous section.
Figure 8 also called design nomogram, is helpfulin selecting the design parameters such as rp,c TITand cooling means for the best plant efficiency andspecific work. The results show that for all pressureratios, there exist an optimum TIT at which plantefficiency is the maximum. However, plant specificwork continues to increase with increase in TIT anddecreases with increase in rp,c. The existence of opti-mum rp,c at any TIT with reference to the maximumplant efficiency is due to the combined effect ofmany factors. With increasing rp,c and TIT, the com-pressor work input, the fuel and coolant air require-ments increase, however, the gas turbine work alsoincreases but is restricted by the increasing pump-ing, cooling and mixing losses.
5. Conclusions
Based on the analysis of an air-humidifier-integrat-ed-gas turbine cycle, the simultaneous integrationof inlet air cooling and gas turbine blade cooling,the following conclusions can be deduced:• The mass of coolant required for turbine blade
cooling increases with increase in ambient tem-perature and ambient relative humidity for a gasturbine.
• The plant efficiency increases when inlet coolingusing air-humidifier is integrated into a gas tur-bine plant.
• The enhancement in efficiency and specificwork due to inlet-air cooling is higher at higherambient temperature.
• The rate of increase in efficiency due to drop inambient temperature is higher at higher value ofTIT.
Journal of Energy in Southern Africa • Vol 24 No 4 • November 2013 79
Figure 6: Effect of compression ratio on plant specific work at different ambient relative humidity
Figure 7: Specific fuel consumption versus plant specific work for different rp,c and Ta

• The plant specific work increases with increasein specific humidity of air achieved in thehumidifier and this enhancement is higher athigher value of rp,c.
• It is also observed that the rp,c corresponding tomaximum specific work increases with decreasein ambient relative humidity.
• An increase in the specific work and decrease inspecific fuel consumption is observed withdecrease in ambient temperature due to integra-tion with inlet air humidifier. It is also observedthat the rp,c corresponding to maximum specificwork is higher at lower ambient temperature.
• The design monogram shows that for all pres-sure ratios, there exists an optimum TIT at whichplant efficiency is the maximum.
ReferencesAlhazmy, M. M. , and Najjar, Y. S. H. (2004).
Augmentation of gas turbine performance using aircoolers. App. Therm. Eng. , 24, 415–429.
Basilly, A. M. (2001). Effects of evaporative inlet andafter-cooling on the recuperated gas turbine cycle.App. Therm. Eng. , 21, 1875-1890.
Bassily, A. M, (2001). “Performance improvements ofthe intercooled reheat regenerative gas turbine cyclesusing indirect evaporative cooling of the inlet air andevaporative cooling of the compressor discharge,Proceedings of the Institution of MechanicalEngineers Part A, Journal of Power And Energy,Vol. 215, pp: 545-557.
Bolland, O. , and Stadaas, J. F. (1995). ComparativeEvaluation of combined cycles and gas turbine sys-tems with injections, steam injection and recupera-tion. ASME Journal of Engineering for Gas Turbinesand Power, 117, 138-145.
Bolland, O. (1991). “A comparative evaluation of
advanced combined cycle alternatives. ” ASMEJournal of Engineering for Gas Turbines and Power,113, 190-197.
Briesh, M. S. , Bannister, R. L. , Diakunchak, I. S. , andHuber, D. J. (1995). A combined cycle designed toachieve greater than 60 percent efficiency. ASMEJournal of Engineering for Gas Turbines and Power,117, 734 -741.
Chiesa, Macchi. (2002). A thermodynamic analysis ofdifferent options to break 60 % electrical efficiencyin combined cycle power plants. Proc. , ASMETurbo-Expo 2002, ASME, Amsterdam, GT-2002-30663.
Dechamps, P. J. (1998). Advanced combined cycle alter-natives with latest gas turbines. ASME Journal ofEngineering for Gas Turbines and Power, 120, 350-357.
Delucia, M. , Bronconi, R. , and Carnevale, E. (1994).Performance and economic enhancement of cogen-eration gas turbines through compressor inlet aircooling. ASME Transactions Journal of Engineeringfor Gas Turbines and Power, 116, 360-365.
El-Masri, M. A. (1988). GASCAN - An interactive codefor thermal analysis of gas turbine systems. ASMETransactions Journal of Engineering for GasTurbines and Power, 110, 201-209.
El-Masri, M. A. (1986). On thermodynamic of gas tur-bines cycle – Part-2 – A model for expansion incooled turbines. ASME Transactions Journal ofEngineering for Gas Turbines and Power, 108, 151-159.
Gas Turbine World. (2010). Pequot Publishing Inc. Vol.32(1).
Horlock, J. H. , Watson, D. T. , and Jones, V. (2001).Limitation on Gas turbine performance imposed bylarge turbine cooling flows. ” ASME Journal ofEngineering for Gas Turbines and Power, 123, 487-494.
Hosseini, R. , Beshkani, A. , and Soltani, M. (2007).Performance improvement of gas turbines of Fars(Iran) combined cycle power plant by intake air
80 Journal of Energy in Southern Africa • Vol 24 No 4 • November 2013
Figure 8: Plant efficiency versus plant specific work for different rp,c and TIT

cooling using a media evaporative cooler, EnergyConversion and Management, 48, 1055–1064.
Kakaras, E. , Doukelis, A. , and Karellas, S. , (2004).Compressor intake-air cooling in gas turbine plants”,Energy, 29, 2347–2358.
Louis, J. F. , Hiraoka, K. , and El-Masri, M. A. (1983). Acomparative study of influence of different means ofturbine cooling on gas turbine performance. Proc. ,ASME Turbo-Expo 2002, ASME, Amsterdam, 83-GT-180.
Data Series, IFI/PLENUNM, New York, Washington. Moran, M. , and Shapiro, H. (1995). Fundamentals of
Engineering Thermodynamics. John Wiley, NewYork.
Sanjay, B. E. , Singh, O. , and Prasad, B. N. (2007).Energy and Exergy Analysis of Steam CooledReheat Gas-Steam Combined Cycle. App. Therm.Eng. , 27, 2779–2790.
Sanjay, B. E. , Singh, O. , and Prasad, B. N. (2008).Influence of Different Means of Turbine BladeCooling on the Thermodynamic Performance ofCombined Cycle. ” App. Therm. Eng. , 28, 2315-2326.
Sanjay, B. E. , Singh, O. , and Prasad, B. N. (2009).Comparative Performance Analysis of CogenerationGas Turbine Cycle for Different Blade CoolingMeans. Int. Journal of Thermal Sciences, 48(7),1432-1440.
Sanjay, B. E. (2011). “Investigation of effect of variationof cycle parameters on thermodynamic performanceof gas/ steam combined cycle. ” Energy, 36, 157-167.
Touloukian, Y. S. , and Tadash, M. (1970). Thermo-physical Properties of Matter. Vol. 6, The TPRC
Wang, F. J. , and Chiou, J. S. , (2004). Integration ofsteam injection and inlet air cooling for a gas turbinegeneration system, Energy Conversion andManagement, 45, 15–26.
Wright, I. G. , and Gibbons, T. B. (2007). Recent devel-opments in gas turbine materials and technologyand their implications for syngas firing, InternationalJournal of Hydrogen Energy, 32, 3610 – 3621.
Yousef S. H. Najjar (1996). Enhancement OfPerformance Of Gas Turbine Engines By Inlet AirCooling and Cogeneration System, Applied ThermalEngineering, Vol. 16, No. 2, pp. 163-173.
Zadpoor, A. A. , and Nikooyan, A. A. (2009).“Development of an Improved Desiccant-BasedEvaporative Cooling System for Gas Turbines” ,ASME Journal of Engineering for Gas Turbines andPower, 131, 034506.
Received 13 December 2011; revised 25 November 2013
Journal of Energy in Southern Africa • Vol 24 No 4 • November 2013 81

Justin Beukes B Com Rationum (Accountingand Economics) B Com (Hons) Com (Economics)M Com (Economics) E-mail: [email protected] Beukes obtained his M Com in Economics, atthe Nelson Mandela Metropolitan University in2013. He is currently a junior economist in the pri-vate sector. His fields of interest include financial,resource and environmental economics.
Delson Chikobvu PhD (MathematicalStatistics)Senior Lecturer: Mathematical Statistics andActuarial Science, Department of MathematicalStatistics and Actuarial Science, University of theFree State P. O. Box 339 Bloemfontein 9300South AfricaTel: +27 51 401 2779E-mail: [email protected]
Dr Delson Chikobvu is a Senior Lecturer: Math-ematical Statistics and Actuarial Science, Depart-ment of Mathematical Statistics and ActuarialScience, University of the Free State.
Juliane Barbosa dos Santos M Sc(Industrial Eng) Researcher: Sustainable Development, UNESP –Sao Paulo State University, School of Engineeringat Bauru, Sao Paulo, ZIP CODE 17033360,Avenida Eng. L. Edmundo Carrijo Coube, 14-01,Bauru, Sao Paulo State, BrazilTel: +55 14 31036122E-mail: [email protected] Barbosa dos Santos is a researcher with aMaster’s degree in Industrial Engineering. She is aresearcher in the field of sustainability, energy man-agement and environmental issues in Brazilianorganizations.
Mario Du Preez B Com (Economics) B ComHon (Economics) M Com (Economics) PhD(Economics)Associate Professor: Economics, Department ofEconomics, School of Economics, DevelopmentStudies and Tourism, Nelson MandelaMetropolitan University
PO Box 77, Port Elizabeth, 6031, South AfricaTel: +27 41 504 4815 E-mail: [email protected] Du Preez is an environmental economist witha PhD in environmental economics. Currently he isappointed as an associate professor in theEconomics Department of the Nelson MandelaMetropolitan University. His research interestsinclude non-market valuation, cost-benefit analysisand public choice theory.
Robert Huberts PhD (Chem. Eng.)Senior Lecturer & Researcher, Department ofChemical Engineering Technology, Faculty ofEngineering and the Built Environment, Universityof Johannesburg. PO Box 1701, Doornfontein,Johannesburg 2028Tel: +27 11 559 6517 Fax: +27 11 559 6430 E-mail: [email protected] Huberts holds a PhD in Chemical Engin-eering from the University of the Witwatersrand. Hehas worked at the Council for Mineral Technology(Mintek) for 12 years in the biotechnology researchfield. He worked in the IT industry and has beeninvolved in small business. Since 2004, he has beena Senior Lecturer (and later postgraduate supervi-sor) in the Department of Chemical Engineering atthe University of Johannesburg. His currentresearch interests are in the areas of waste energyand biotechnology.
Freddie L. Inambao MSc (Eng.), PhD(Technical Sciences) Senior Lecturer, MechanicalEngineering, University of KwaZulu-Natal, Durban,South Africa Tel: +27 (0) 31 260 8530 Fax: +27(0) 260 3217 E-Mail: [email protected] Dr Inambao is a Senior Lecturer at the University ofKwaZulu-Natal. He has published papers in rep-utable Journals and presented papers at bothNational and International levels in the fields ofAlternative and Renewable Energy, EnergyManagement and Internal Combustion Engines andrelated fields. Dr Inambao holds an MSc inMechanical Engineering and PhD in TechnicalSciences from Volgograd Polytechnic Institute.
82 Journal of Energy in Southern Africa • Vol 24 No 4 • November 2013
Details of authors

Charbel José Chiappetta Jabbour PhD (Industrial Eng) Researcher: Sustainable Development, UNESP –Sao Paulo State University, School of Engineeringat Bauru, Sao Paulo, ZIP CODE 17033360,Avenida Eng. L. Edmundo Carrijo Coube, 14-01,Bauru, Sao Paulo State, BrazilTel: +55 14 31036122E-mail: [email protected] [email protected] Charbel José Chiappetta Jabbour is an AssociateProfessor of Sustainability and Industrial Engineer-ing at UNESP – Sao Paulo State University. He ispublishing in journals such as the Journal ofCleaner Production, International Journal ofSustainability in Higher Education, InternationalJournal of Production Economics, and others. He isEditor in Chief of the Latin American Journal ofManagement for Sustainable Development andDeputy-Editor of the Brazilian Journal of Scienceand Technology.
Mahesh Kumar B Tech. M.E. PhDAssistant Professor, Department of MechanicalEngineering, Guru Jambheshwar, University ofScience & Technology, Hisar, India, 125001Tel: 0941 693 5137 / 01662 263564E-mail: [email protected] Kumar is an Assistant Professor, Depart-ment of Mechanical Engineering, Jambheshwar,University of Science & Technology, Hisar, India.He has previously published in this journal.
Golden Makaka M Sc PhD (Applied Physics) Senior Lecturer (Renewable Energy), PhysicsDepartment, University of Fort Hare, Private Bag,X1314, Alice, 5700 South Africa Tel: +27 (0)40 602 2207Cell: +27 (0)71 8973 486 Dr Golden Makaka is a physicist with masters’degree in Applied Physics and a PhD in physics. Heis currently a senior lecturer and a post graduatecoordinator in the Physics Department at Fort HareUniversity. He specialized in renewable energy,energy efficiency and building physics. He is also aconsultant in passive solar energy efficiency build-ing design strategies in South Africa.
Sampson Mamphweli PhD Physics,MenvSc, Mini-MBASenior Researcher: (Renewable Energy), Instituteof Technology, University of Fort Hare, Tel: +27 4060 22311 Fax: +27 4065 30665 Mobile: +27 82 2140 367Dr Sampson Mamphweli is a Senior Researcher atthe Institute of Technology, University of Fort Hare,South Africa. He possesses a Doctor of Philosophydegree in Physics from the University of Fort Hare,
and a Master of Environmental Sciences degreefrom the University of Venda, South Africa. He isalso in possession of a Certificate in FinancingRenewable Energy and Energy Efficiency fromRENAC Renewables based in Germany. DrMamphweli also possesses the Green Power Mini-MBA from the Green Power Academy based inBritain. He is a recipient of the prestigiousUniversity of Fort Hare Vice Chancellor’s EmergingResearcher medal for the year 2012. He conductsresearch on renewable energy technologies andtheir applications, and he is a respected authority inthe biomass to energy field. He has published 18scientific papers in peer-reviewed journals and con-ference proceedings including two book chapters.Dr Mamphweli reviews papers for publication inseveral journals in the engineering and renewableenergy fields of study. His current area of researchinterest includes biomass gasification for electricitygeneration, biogas digesters, co-gasification of coaland biomass for electricity generation as well assolar energy technologies.
Sherpherd MisiDepartment of Civil Engineering University ofZimbabwe, P. O. Box MP167, Mount Pleasant,Harare, ZimbabweTel: +263 7721 00941Fax: +263 430 3280 E-mail: [email protected] holds a PhD in Renewable Energy (Biomass),an M Sc in Renewable Energy Engineering, and a BSc (Hons) in Civil Engineering. He is a Lecturer inthe Faculty of Engineering, University of Zimbabwe.
Alok Ku Mohapatra B E (Mech) M.Tech(CIM) PhD (Thermal Eng.)Professor: Department of Mechanical EngineeringPrincipal: Nalanda Institute of Technology,Bhubaneswar. Odisha, India-754005E-mail: [email protected]. Alok ku Mohapatra has an M.Tech in ComputerIntegrated Manufacturing from the Indian Instituteof Technology, Madras, and a PhD in ThermalEngineering from the National Institute ofTechnology, Jamshedpur. He has more than 13years of teaching and research experience in vari-ous reputed engineering colleges across India.Currently, he is appointed as the Principal at theNalanda Institute of Technology, Bhubaneswar,India, in addition to the position of Professor andHead of the Mechanical Engineering Department.His research interest includes energy and exergyanalysis of gas turbines and combined cycle plantincluding cogeneration, trigeneration and poly-genation systems.
Journal of Energy in Southern Africa • Vol 24 No 4 • November 2013 83

Patrick MukumbaPhysics Department, University of Fort Hare,Private Bag, X1314, Alice, 5700Cell: +27 71 5056 937Fax: +27 40 653 0665E-mail: [email protected] Mukumba is a PhD candidate (RenewableEnergy) in the Physics Department at the Universityof Fort Hare (UFH). He holds an M Sc inRenewable Energy Engineering (University ofZimbabwe), a BSc Ed (Hons) in Physics withBindura University of Science Education (Zim-babwe) and a Diploma in Education (Science) withBelvedere Technical Teachers’ College (Zimbabwe),His research work is on biomass and biogas.
Edison Muzenda PhD (Chem. Eng.)Associate Professor: Environmental and ProcessSystems Engineering Research Group, Departmentof Chemical Engineering Technology, Faculty ofEngineering and the Built Environment, Universityof Johannesburg., PO Box 1701, Doornfontein,Johannesburg 2028Tel: +27 11 559 6817Fax: +2711559 6430
E-mail: [email protected] Muzenda is an Associate Professor,Research and Postgraduate Coordinator as well asHead of the Environmental and Process SystemsEngineering Research Group in the Department ofChemical Engineering at the University ofJohannesburg. He holds a B Sc Hons (Zimbabwe,1994) and a PhD in Chemical Engineering(Birmingham, 2000). He has more than 15 years’experience in academia. Prof Edison’s teachinginterests and experience are in unit operations,multi-stage separation processes, environmentalengineering, chemical engineering thermodynam-ics, entrepreneurship skills, professional engineeringskills, research methodology as well as process eco-nomics, management and optimization. He is arecipient of several awards and scholarships for aca-demic excellence. His research interests are in wastewater treatment, gas scrubbing, environment, wasteminimization and utilization, energy as well asphase equilibrium measurement and computation.He has published more than 85 international peerreviewed and refereed scientific papers in journals,conferences and books.
Prof Edison has supervised over 18 postgradu-ate students as well as more than 130 Honours andB Tech research students. He serves as reviewer fora number of reputable international conferencesand journals. He has also chaired several sessionsat International Conferences. Edison is an associatemember of the Institution of Chemical Engineers(AMIChemE), a member of the InternationalAssociation of Engineers (IAENG); associate mem-ber of Water Institute of Southern Africa (WISA)
and member of the International ScientificCommittee of the World Academy of Science,Engineering and Technology (WASET) as well amember of the Scientific Technical Committee andEditorial Board of the Planetary Scientific ResearchCentre. Prof Edison is recognized in Marquis Who’sWho 2012 as an Engineering Educator.
Tsietsi J Pilusa Masters (Chem. Eng.)Department of Mechanical Engineering Science,University of Johannesburg, PO Box 17011,Doornfontein, Johannesburg 2028Tel: +2710 210 4800Fax: +2710 210, 4800 E-mail: [email protected] Pilusa holds a Master’s degree in ChemicalEngineering from the University of Johannesburg.He has more than 7 years’ experience in mining,metallurgy and waste management industries. He isan associate member of the South African Instituteof Mining and Metallurgy (SAIMM) and is a regis-tered member of South African Institute ofChemical Engineers (SAIChe). He is also registeredwith the Engineering Council of South Africa(ECSA) as candidate Technologist. His main areasof research are in alternative fuels, waste to energy,environmental pollution and waste management.His research involves classifications of industrialwastes, energy recovery, beneficiations processesand energy utilization mechanisms.
B E Sanjay B E (Mech) M.Tech (Design) PhD(Mechanical Eng.)Professor: Department of Mechanical Engineering,National Institute of Technology, Jamshedpur, India- 831014E-mail: [email protected]. Sanjay is a graduate of Mechanical Engineer-ing with a Masters and PhD in Mechanical Eng-ineering. He has over 20 years of professional expe-rience with over 13 years devoted to impartingEngineering education at the highest level. He hasover a score of publications in the world's leadingjournals in the area of Mechanical Engineering andEngineering Education. His j-index and h-10 indexare currently four and with around a hundred cita-tions. He is also the co-author of numerous bookson thermal and mechanical engineering. He ispresently working as Professor of MechanicalEngineering at the National Institute of Technology,Jamshedpur, India. He also has over five years ofindustrial experience in inspection of rotating andreciprocating machines as well as pressure vessels.He is Level-II in Ultra-sonic and radiographic test-ing as well as a certified welding inspector. Hisresearch interest includes energy and exergy analy-sis of gas turbines and combined cycle plant includ-ing cogeneration, green energy systems.
84 Journal of Energy in Southern Africa • Vol 24 No 4 • November 2013

Caston Sigauke M Sc (Operations Research)Lecturer: Operations Research and Statistics,School of Mathematical and Computer Sciencesand Department of Statistics and OperationsResearch, University of Limpopo, Turfloop,Campus, Private Bag X 1106, Sovenga 0727South AfricaTel: +27 (0) 15 268 2188Fax: +27 (0) 15 268 3487Cell: +27 835 255 684E-mails: [email protected] [email protected] Caston Sigauke is a Lecturer in OperationsResearch and Statistics, School of Mathematicaland Computer Sciences and the Department ofStatistics and Operations Research, University ofLimpopo, Turfloop, Campus. He is undertaking aPhD in Statistics with the University of the FreeState.
Nishant Singh B Eng (Mech) M Tech (MechEng) Assistant Professor: Mechanical Engineering,Hindustan College of Science and Technology,NH-2, Agra-Delhi Highway, Farah, Mathura, UttarPradesh, IndiaTel: +9199 9758 2969E-mail: [email protected] Singh is a mechanical engineer with aMaster’s degree in Mechanical Engineering, and ispursuing a PhD in Optimization Techniques. Since2005 he has been involved in teaching andresearch. He taught various subjects like kinematicsof machines and dynamics of machines.Currently he is assistant professor in the MechanicalEngineering Department of Hindustan College ofScience and Technology, Mathura. He is also serv-ing as visiting faculty to the Excel Institute ofManagement & Technology, Mathura, India.
Yashvir Singh B Eng (Mech) M Tech (MechEng) Assistant Professor: Mechanical Engineering,University of Petroleum and Energy StudiesEnergy Acres, P.O. Bidholi, Via Premnagar,Dehradun, IndiaTel: +9197 6099 5818Fax: +911 3527 7609 0/95E-mail: [email protected] Singh is a mechanical engineer withMaster’s degree in Mechanical Engineering, and ispursuing a PhD in alternative fuels. Since 2007 hehas been involved in teaching and research. Hetaught various subjects related to alternate fuelsused in internal combustion engines.Currently he is appointed as assistant professor inthe Mechanical Engineering Department of theUniversity of Petroleum and Energy Studies,Dehradun. He is also serving as a visiting faculty to
the Apex Institute of Technology, Bilaspur, India.
Shadreck M Situmbeko B Eng. (Mech), MSc (Eng. Design)University of Kwazulu-Natal, MechanicalEngineering, Durban, South AfricaTel 27 (0) 31 260 8530Fax 27 (0) 31 2603217Cell 27 710570753; 267 72952615E-Mail: [email protected];[email protected] Situmbeko is a Mechanical Engineer witha master’s degree in engineering design and cur-rently pursuing a PhD in Mechanical Engineering.He has lectured at University of Botswana in thedepartment of Industrial Design and Technology for9 years from 2004. Previously he worked as ChiefEngineer Energy and Chief Engineer Projects withRIPCO(B), Botswana (1996-2003). He has under-taken a number of renewable energy projects andconsultancies and has authored a number of peerreviewed conference papers and journal papers.
Ernest E van Dyk BSc (Physics and AppliedMathematics) BScHons (Physics) MSc (Physics)PhD (Physics) Pr.Nat.Sci.Professor of Physics, Nelson Mandela MetropolitanUniversity (NMMU)Director: Centre for Energy Research, NMMUHead of Department: Physics, NMMUCentre for Energy Research, PO Box 77000,Nelson Mandela Metropolitan University, PortElizabeth, 6031 Tel: +27 41 504 2259Fax: +27 41 504 1959E-mail: [email protected]: http://energy.nmmu.ac.zaErnest van Dyk obtained his PhD in Physics at theUniversity of Port Elizabeth in 1994. He teachesPhysics at the NMMU and is also Director of theCentre for Energy Research (CER) at the NMMUsince 2006. The CER is involved with severalrenewable energy research projects for industry andgovernment agencies. He is currently also thePhysics Head of Department. Prof van Dyk’s research interests are in the field ofSolar Energy, specialising in Photovoltaics andSolar Thermal research. He has supervised 16 MScand 7 PhD student projects to completion and iscurrently supervising 1 MSc students and 6 PhDstudents. He has published forty-seven scientificjournal articles in the field of Photovoltaics and hasauthored or co-authored 37 international confer-ence papers and 117 national conference presenta-tions. Prof van Dyk has a passion for teachingPhysics and researching Renewable EnergyTechnologies.
Journal of Energy in Southern Africa • Vol 24 No 4 • November 2013 85

Authors / Title index
AGO S
Evaluation of the regression parameters of theAngstrom-Page Model for predicting global solarradiation . . . . . . . . . . . . . . . . . . . . . . . . . . . . .24 (2) 46
ANNEGARN H J
Human and physical energy cycles in a subsistencevillage in South Africa . . . . . . . . . . . . . . . . . . .24 (2) 67
BEUKES J
A cost-benefit analysis of Concentrator PhotovoltaicTechnology use in South Africa: A case study . .24 (4) 2
BIGOT D
Photovoltaic electricity production in a residential houseon Reunion . . . . . . . . . . . . . . . . . . . . . . . . . . .24 (2) 46
BOJIC M
Photovoltaic electricity production in a residential houseon Reunion . . . . . . . . . . . . . . . . . . . . . . . . . . .24 (2) 46
BOTHA F
Simulation of a syngas from a coal production plantcoupled to a high temperature nuclear reactor .24 (2) 37
BOUMBE T J
Operational evaluation of the performance of a solarpowered absorption system in Pretoria . . . . . .24 (3) 26
BRADNUM C
The Manica Charcoal Stove Project . . . . . . . . . .24 (2) 2
BURTON S G
Technologies for recovery of energy from waste-waters:Applicability and potential in South Africa . . . .24 (1) 15
BVUMBE T J
Operational evaluation of the performance of a solarpowered absorption system in Pretoria . . . . . .24 (3) 26
CHAMOLI S
Exergy analysis of a flat plate solar collector . . .24 (3) 8
CHIKAVA W
Human and physical energy cycles in a subsistencevillage in South Africa . . . . . . . . . . . . . . . . . . .24 (2) 67
CHIKOBVU D
Modelling influence of temperature on daily peakelectricity demand in South Africa . . . . . . . . . .24 (4) 63
COHEN B
Technologies for recovery of energy from waste-waters:Applicability and potential in South Africa . . . .24 (1) 15
CUETKOVIC D
Photovoltaic electricity production in a residential houseon Reunion . . . . . . . . . . . . . . . . . . . . . . . . . . .24 (2) 46
DJORDJEVIC S
Photovoltaic electricity production in a residential houseon Reunion . . . . . . . . . . . . . . . . . . . . . . . . . . .24 (2) 46
DOBSON R
Simulation of a syngas from a coal production plantcoupled to a high temperature nuclear reactor .24 (2) 37
DOS SANTOS J B
Critical factors to be considered when planning theimplementation of environmental improvements andenergy saving . . . . . . . . . . . . . . . . . . . . . . . . . .24 (4) 22
DU PREEZ M
A cost-benefit analysis of Concentrator PhotovoltaicTechnology use in South Africa: A case study . .24 (4) 2
GOUWS R
Measurement and verification of load shiftinginterventions for a fridge plant system in South Africa . .24 (1) 9
HARMS T
Simulation of a syngas from a coal production plantcoupled to a high temperature nuclear reactor .24 (2) 37
HARRISON S T L
Technologies for recovery of energy from waste-waters:Applicability and potential in South Africa . . . .24 (1) 15
HUBERTS R
Emissions analysis from combustion of eco-fuelbriquettes for domestic applications . . . . . . . . .24 (4) 30
INAMBAO F L
Operational evaluation of the performance of a solarpowered absorption system in Pretoria . . . . . .24 (3) 26
INAMBAO F L
System and component modelling of a low temperaturesolar thermal energy conversion cycle . . . . . . .24 (4) 51
JABBOUR C J
Critical factors to be considered when planning theimplementation of environmental improvements andenergy saving . . . . . . . . . . . . . . . . . . . . . . . . . .24 (4) 22
86 Journal of Energy in Southern Africa • Vol 24 No 4 • November 2013
Index to Volume 24: February–November 2013

KLUNNE W J
Small hydropower in Southern Africa – an overview offive countries in the region . . . . . . . . . . . . . . . .24 (3) 14
KUMAR M
Experimental study on natural convection greenhousegas drying of papad . . . . . . . . . . . . . . . . . . . .24 (4) 37
LIDBETTER R T
Load shifting opportunities for typical cement plants . . . . . . . . . . . . . . . . . . . . . . . . . . . . . . . . . . . .24 (1) 35
LIEBENBERG L
Load shifting opportunities for typical cement plants . . . . . . . . . . . . . . . . . . . . . . . . . . . . . . . . . . . .24 (1) 35
LLOYD P
Reassessment of the environmental impacts of sulphuroxide emissions from power stations . . . . . . . .24 (2) 28
LYSKO M D
Solar radiation analysis and regression coefficients forthe Vhembe Region, Limpopo Province, South Africa24(3) 2
MAHAPATRA A K
Performance analysis of an air humidifier integrated gasturbine with film air cooling of turbine blade . .24 (4) 71
MALAKA G
A possible design and justification for a biogas plant atNyazura Adventist High School, Rusape, Zimbabwe . . . . . . . . . . . . . . . . . . . . . . . . . . . . . . . . . . . . . . .24 (4) 12
MALAUDZI S T
Solar radiation analysis and regression coefficients forthe Vhembe Region, Limpopo Province, South Africa . . . . . . . . . . . . . . . . . . . . . . . . . . . . . . . . . . . . . . .24 (3) 2
MAMPHWELI G
A possible design and justification for a biogas plant atNyazura Adventist High School, Rusape, Zimbabwe . . . . . . . . . . . . . . . . . . . . . . . . . . . . . . . . . . . .24 (4) 12
MANUEL G
The significance of relevance trees in the identificationof artificial neural networks input vectors . . . . .24 (1) 27
MERVEN B
Policy options for the sustainable development ofZambia’s electricity sector . . . . . . . . . . . . . . . .24 (2) 16
MIRANVILLE F
Photovoltaic electricity production in a residential houseon Reunion . . . . . . . . . . . . . . . . . . . . . . . . . . .24 (2) 46
MISI G
A possible design and justification for a biogas plant atNyazura Adventist High School, Rusape, Zimbabwe . . . . . . . . . . . . . . . . . . . . . . . . . . . . . . . . . . . . . . .24 (4) 12
MULAUDZI S T
Solar radiation analysis and regression coefficients forthe Vhembe Region, Limpopo Province, South Africa . . . . . . . . . . . . . . . . . . . . . . . . . . . . . . . . . . . . . . .24 (3) 2
MUKUMBA P
A possible design and justification for a biogas plant atNyazura Adventist High School, Rusape, Zimbabwe . . . . . . . . . . . . . . . . . . . . . . . . . . . . . . . . . . . .24 (4) 12
MUZENDA E
Emissions analysis from combustion of eco-fuelbriquettes for domestic applications . . . . . . . .24 (4) 30
NIKOLIC D
Photovoltaic electricity production in a residential houseon Reunion . . . . . . . . . . . . . . . . . . . . . . . . . . .24 (2) 46
PARVEDY A P
Photovoltaic electricity production in a residential houseon Reunion . . . . . . . . . . . . . . . . . . . . . . . . . . .24 (2) 46
PATHER-ELIAS S
Technologies for recovery of energy from waste-waters:Applicability and potential in South Africa . . . .24 (1) 15
PILUSA T J
Emissions analysis from combustion of eco-fuelbriquettes for domestic applications . . . . . . . . .24 (4) 30
POURRABBI M V P
Energy cost versus production as a performancebenchmark for analysis of companies . . . . . . . .24 (1) 2
PRETORIUS J H C
The significance of relevance trees in the identificationof artificial neural networks input vectors . . . . .24 (1) 27
SANJAY B E
Performance analysis of an air humidifier integrated gasturbine with film air cooling of turbine blade . .24 (4) 71
SANKARAN V
Solar radiation analysis and regression coefficients forthe Vhembe Region, Limpopo Province, South Africa . . . . . . . . . . . . . . . . . . . . . . . . . . . . . . . . . . . . . . .24 (3) 2
SIGAUKE C
Modelling influence of temperature on daily peakelectricity demand in South Africa . . . . . . . . . .24 (4) 63
SINGH N K
Dirt analysis on the performance of an engine coolingsystem . . . . . . . . . . . . . . . . . . . . . . . . . . . . . . .24 (4) 44
SINGH Y
Dirt analysis on the performance of an engine coolingsystem . . . . . . . . . . . . . . . . . . . . . . . . . . . . . . .24 (4) 44
SITUMBEKO S M
System and component modelling of a low temperaturesolar thermal energy conversion cycle . . . . . . .24 (4) 51
STAFFORD W
Technologies for recovery of energy from waste-waters:Applicability and potential in South Africa . . . .24 (1) 15
TAGHIZADEH H
Energy cost versus production as a performancebenchmark for analysis of companies . . . . . . . .24 (1) 2
Journal of Energy in Southern Africa • Vol 24 No 4 • November 2013 87

TEMBO B
Policy options for the sustainable development ofZambia’s electricity sector . . . . . . . . . . . . . . . .24 (2) 16
VAN DYK E
A cost-benefit analysis of Concentrator PhotovoltaicTechnology use in South Africa: A case study . .24 (4) 2
VAN HILLE R
Technologies for recovery of energy from waste-waters:Applicability and potential in South Africa . . . .24 (1) 15
VON BLOTTNITZ H
Technologies for recovery of energy from waste-waters:Applicability and potential in South Africa . . . .24 (1) 15
WANG W
Decoupling analysis of electricity consumption fromeconomic growth in China . . . . . . . . . . . . . . . .24 (2) 57
ZHANG M
Decoupling analysis of electricity consumption fromeconomic growth in China . . . . . . . . . . . . . . . .24 (2) 57
Subject index
Africa
KLUNNE W J
Small hydropower in Southern Africa – an overview offive countries in the region . . . . . . . . . . . . . . . .24 (3) 14
Air-film blade cooling
MAHAPATRA A K & SANJAY B E
Performance analysis of an air humidifier integrated gasturbine with film air cooing of turbine blade . .24 (4) 71
Air-humidifier
MAHAPATRA A K & SANJAY B E
Performance analysis of an air humidifier integrated gasturbine with film air cooling of turbine blade . .24 (4) 71
Angstrom Prescott
MALAUDZI S T, SANKARAN V & LYSKO M D
Solar radiation analysis and regression coefficients forthe Vhembe Region, Limpopo Province, South Africa . . . . . . . . . . . . . . . . . . . . . . . . . . . . . . . . . . . . . . .24 (3) 2
Artificial neural networks
MANUEL G & PRETORIUS J H C
The significance of relevance trees in the identificationof artificial neural networks input vectors . . . . .24 (1) 27
Biodiesel
STAFFORD W, COHEN B, PATHER-ELIAS S,
VON BLOTTNITZ H, VAN LILLE R, HARRISON
S T L & BURTON S G
Technologies for recovery of energy from waste-waters:Applicability and potential in South Africa . . . .24 (1) 15
Bioethanol
STAFFORD W, COHEN B, PATHER-ELIAS S,
VON BLOTTNITZ H, VAN LILLE R, HARRISON
S T L & BURTON S G
Technologies for recovery of energy from waste-waters:Applicability and potential in South Africa . . . .24 (1) 15
Biogas
STAFFORD W, COHEN B, PATHER-ELIAS S,
VON BLOTTNITZ H, VAN LILLE R, HARRISON
S T L & BURTON S G
Technologies for recovery of energy from waste-waters:Applicability and potential in South Africa . . . .24 (1) 15
Biogas digesters
MUKUMBA P, MAKAKA G, MAMPHELI S, &
MISI S
A possible design and justification for a biogas plant atNyazura Adventist High School, Rusape, Zimbabwe . . . . . . . . . . . . . . . . . . . . . . . . . . . . . . . . . . . .24 (4) 12
Biogas potential
MUKUMBA P, MAKAKA G, MAMPHELI S, &
MISI S
A possible design and justification for a biogas plant atNyazura Adventist High School, Rusape, Zimbabwe . . . . . . . . . . . . . . . . . . . . . . . . . . . . . . . . . . . . . . .24 (4) 12
Biomass
STAFFORD W, COHEN B, PATHER-ELIAS S,
VON BLOTTNITZ H, VAN LILLE R, HARRISON
S T L & BURTON S G
Technologies for recovery of energy from waste-waters:Applicability and potential in South Africa . . . .24 (1) 15
Biomass fuel
PILUSA T J, HUBERTS R & MUZENDA E
Emissions analysis from combustion of eco-fuelbriquettes for domestic applications . . . . . . . . .24 (4) 30
Brazil
DOS SANTOS J B & JABBOUR C J
Critical factors to be considered when planning theimplementation of environmental improvements andenergy saving . . . . . . . . . . . . . . . . . . . . . . . . . .24 (4) 22
Cement plant
LIDBETTER R T & LIEBENBERG L
Load shifting opportunities for typical cement plants . . . . . . . . . . . . . . . . . . . . . . . . . . . . . . . . . . . . . . .24 (1) 35
Charcoal stove design
BRADNUM C
The Manica Charcoal Stove Project . . . . . . . . . .24 (2) 2
China
ZHANG M & WANG M
Decoupling analysis of electricity consumption fromeconomic growth in China . . . . . . . . . . . . . . . .24 (2) 57
Chiller units
GOUWS R
Measurement and verification of load shiftinginterventions for a fridge plant system in South Africa . . . . . . . . . . . . . . . . . . . . . . . . . . . . . . . . . . . . .24 (1) 9
Clean air
PILUSA T J, HUBERTS R & MUZENDA E
Emissions analysis from combustion of eco-fuelbriquettes for domestic applications . . . . . . . . .24 (4) 30
88 Journal of Energy in Southern Africa • Vol 24 No 4 • November 2013

Clearness Index
AGO S
Evaluation of the regression parameters of theAngstrom-Page Model for predicting global solarradiation . . . . . . . . . . . . . . . . . . . . . . . . . . . . .24 (2) 46
Climate change
TEMBO B & MERVEN B
Policy options for the sustainable development ofZambia’s electricity sector . . . . . . . . . . . . . . . .24 (2) 16
Coal-to-liquids
BOTHA F, DOBSON R & HARMS T
Simulation of a syngas from a coal production plantcoupled to a high temperature nuclear reactor .24 (2) 37
Coffee grounds
PILUSA T J, HUBERTS R & MUZENDA E
Emissions analysis from combustion of eco-fuelbriquettes for domestic applications . . . . . . . . .24 (4) 30
Cogeneration
BOTHA F, DOBSON R & HARMS T
Simulation of a syngas from a coal production plantcoupled to a high temperature nuclear reactor .24 (2) 37
Combustion and gasification
STAFFORD W, COHEN B, PATHER-ELIAS S,
VON BLOTTNITZ H, VAN LILLE R, HARRISON
S T L & BURTON S G
Technologies for recovery of energy from waste-waters:Applicability and potential in South Africa . . . .24 (1) 15
Community centred design
BRADNUM C
The Manica Charcoal Stove Project . . . . . . . . . .24 (2) 2
Component and system models
SITUMBEKO S M & INAMBAO F L
System and component modelling of a low temperaturesolar thermal energy conversion cycle . . . . . . .24 (4) 51
Concentrator photovoltaic technology
DU PREEZ M, BEUKES, J, & VAN DYK E
A cost-benefit analysis of Concentrator PhotovoltaicTechnology use in South Africa: A case study . .24 (4) 2
Conceptual energy model
CHIKAVA W & ANNEGARN H
Human and physical energy cycles in a subsistencevillage in South Africa . . . . . . . . . . . . . . . . . . .24 (2) 67
Convective heat transfer coefficient
KUMAR M
Experimental study on natural convection greenhousegas drying of papad . . . . . . . . . . . . . . . . . . . . .24 (4) 37
Coolant
SINGH Y & SNGH NK
Dirt analysis on the performance of an engine coolingsystem . . . . . . . . . . . . . . . . . . . . . . . . . . . . . . .24 (4) 44
Cooling
BVUMBE T J & INAMBAO F L
Operational evaluation of the performance of a solarpowered absorption system in Pretoria . . . . . .24 (3) 26
Cost benefit analysis
DU PREEZ M, BEUKES, J, & VAN DYK E
A cost-benefit analysis of Concentrator PhotovoltaicTechnology use in South Africa: A case study . .24 (4) 2
Critical success factors
DOS SANTOS J B & JABBOUR C J
Critical factors to be considered when planning theimplementation of environmental improvements andenergy saving . . . . . . . . . . . . . . . . . . . . . . . . .24 (4) 22
Cycle configuration
SITUMBEKO S M & INAMBAO F L
System and component modelling of a low temperaturesolar thermal energy conversion cycle . . . . . . .24 (4) 51
Social discount rate
DU PREEZ M, BEUKES, J, & VAN DYK E
A cost-benefit analysis of Concentrator PhotovoltaicTechnology use in South Africa: A case study . .24 (4) 2
Data envelope analysis
TAGHIZADEH H & POURRABBI M V P
Energy cost versus production as a performancebenchmark for analysis of companies . . . . . . . .24 (1) 2
Decoupling index
ZHANG M & WANG M
Decoupling analysis of electricity consumption fromeconomic growth in China . . . . . . . . . . . . . . . .24 (2) 57
Demand forecast
MANUEL G & PRETORIUS J H C
The significance of relevance trees in the identificationof artificial neural networks input vectors . . . . .24 (1) 27
Demand-side management
LIDBETTER R T & LIEBENBERG L
Load shifting opportunities for typical cement plants24(1) 35
Design for development
BRADNUM C
The Manica Charcoal Stove Project . . . . . . . . . .24 (2) 2
Eco-fuel
PILUSA T J, HUBERTS R & MUZENDA E
Emissions analysis from combustion of eco-fuelbriquettes for domestic applications . . . . . . . . .24 (4) 51
Economic performance
BVUMBE T J & INAMBAO F L
Operational evaluation of the performance of a solarpowered absorption system in Pretoria . . . . . .24 (3) 26
EES Computer simulations
SITUMBEKO S M & INAMBAO F L
System and component modelling of a low temperaturesolar thermal energy conversion cycle . . . . . . . .24 (4) ?
Efficiency
TAGHIZADEH H & POURRABBI M V P
Energy cost versus production as a performancebenchmark for analysis of companies . . . . . . . .24 (1) 2
Journal of Energy in Southern Africa • Vol 24 No 4 • November 2013 89

Electrical energy
BOJIC M, PARVEDY, A P, MIRANVILLE F,
BIGOT D, CVETKOVIC D, DJORDJEVIC, S &
NIKOLIC D
Photovoltaic electricity production in a residential houseon Reunion . . . . . . . . . . . . . . . . . . . . . . . . . . .24 (2) 46
Electricity
KLUNNE W J
Small hydropower in Southern Africa – an overview offive countries in the region . . . . . . . . . . . . . . . .24 (3) 14
Electricity consumption
ZHANG M & WANG M
Decoupling analysis of electricity consumption fromeconomic growth in China . . . . . . . . . . . . . . . .24 (2) 57
Electronic pedometer
CHIKAVA W & ANNEGARN H
Human and physical energy cycles in a subsistencevillage in South Africa . . . . . . . . . . . . . . . . . . .24 (2) 67
Emissions
PILUSA T J, HUBERTS R & MUZENDA E
Emissions analysis from combustion of eco-fuelbriquettes for domestic applications . . . . . . . . .24 (4) 30
Energy
STAFFORD W, COHEN B, PATHER-ELIAS S,
VON BLOTTNITZ H, VAN LILLE R, HARRISON
S T L & BURTON S G
Technologies for recovery of energy from waste-waters:Applicability and potential in South Africa . . . .24 (1) 15
Energy efficiency
GOUWS R
Measurement and verification of load shiftinginterventions for a fridge plant system in South Africa . . . . . . . . . . . . . . . . . . . . . . . . . . . . . . . . . . . . . . .24 (1) 9
Energy efficiency evaluation
TAGHIZADEH H & POURRABBI M V P
Energy cost versus production as a performancebenchmark for analysis of companies . . . . . . . .24 (1) 2
Energy expenditure
CHIKAVA W & ANNEGARN H
Human and physical energy cycles in a subsistencevillage in South Africa . . . . . . . . . . . . . . . . . . .24 (2) 67
Energy intake
CHIKAVA W & ANNEGARN H
Human and physical energy cycles in a subsistencevillage in South Africa . . . . . . . . . . . . . . . . . . .24 (2) 67
Energy planning
TEMBO B & MERVEN B
Policy options for the sustainable development ofZambia’s electricity sector . . . . . . . . . . . . . . . .24 (2) 16
EnergyPlus
BOJIC M, PARVEDY, A P, MIRANVILLE F,
BIGOT D, CVETKOVIC D, DJORDJEVIC S &
NIKOLIC D
Photovoltaic electricity production in a residential houseon Reunion . . . . . . . . . . . . . . . . . . . . . . . . . . .24 (2) 46
Environmental impacts
LLOYD P
Reassessment of the environmental impacts of sulphuroxide emissions from power stations . . . . . . . .24 (2) 28
Evaporative cooling
MAHAPATRA A K & SANJAY B E
Performance analysis of an air humidifier integrated gasturbine with film air cooling of turbine blade . .24 (4) 71
Exergy
CHAMOLI S
Exergy analysis of a flat plate solar collector . . .24 (3) 8
Extreme value theory
CHIKOBVU D & SIGAUKE C
Modelling influence of temperature on daily peakelectricity demand in South Africa . . . . . . . . . .24 (4) 63
Flue gas quality
PILUSA T J, HUBERTS R & MUZENDA E
Emissions analysis from combustion of eco-fuelbriquettes for domestic applications . . . . . . . . .24 (4) 30
Fridge plants
GOUWS R
Measurement and verification of load shiftinginterventions for a fridge plant system in South Africa . . . . . . . . . . . . . . . . . . . . . . . . . . . . . . . . . . . . . . .24 (1) 9
Gasification
BOTHA F, DOBSON R & HARMS T
Simulation of a syngas from a coal production plantcoupled to a high temperature nuclear reactor .24 (2) 37
Gas turbine
MAHAPATRA A K & SANJAY B E
Performance analysis of an air humidifier integrated gasturbine with film air cooling of turbine blade . .24 (4) 71
Gautrain
MANUEL G & PRETORIUS J H C
The significance of relevance trees in the identificationof artificial neural networks input vectors . . . . .24 (1) 27
Global horizontal irradiance
MALAUDZI S T, SANKARAN V & LYSKO M D
Solar radiation analysis and regression coefficients forthe Vhembe Region, Limpopo Province, South Africa . . . . . . . . . . . . . . . . . . . . . . . . . . . . . . . . . . . . .24 (3) 2
Global solar radiation
AGO S
Evaluation of the regression parameters of theAngstrom-Page Model for predicting global solarradiation . . . . . . . . . . . . . . . . . . . . . . . . . . . . .24 (2) 46
Green Management
DOS SANTOS J B & JABBOUR C J
Critical factors to be considered when planning theimplementation of environmental improvements andenergy saving . . . . . . . . . . . . . . . . . . . . . . . . . .24 (4) 22
High temperature electrolysis
BOTHA F, DOBSON R & HARMS T
Simulation of a syngas from a coal production plantcoupled to a high temperature nuclear reactor .24 (2) 37
90 Journal of Energy in Southern Africa • Vol 24 No 4 • November 2013

High temperature reactor
BOTHA F, DOBSON R & HARMS T
Simulation of a syngas from a coal production plantcoupled to a high temperature nuclear reactor .24 (2) 37
Hospitals
DOS SANTOS J B & JABBOUR C J
Critical factors to be considered when planning theimplementation of environmental improvements andenergy saving . . . . . . . . . . . . . . . . . . . . . . . . . .24 (4) 22
Hydropower
KLUNNE W J
Small hydropower in Southern Africa – an overview offive countries in the region . . . . . . . . . . . . . . . .24 (3) 14
Hydro technology
TEMBO B & MERVEN B
Policy options for the sustainable development ofZambia’s electricity sector . . . . . . . . . . . . . . . .24 (2) 16
Inlet-air cooling
MAHAPATRA A K & SANJAY B E
Performance analysis of an air humidifier integrated gasturbine with film air cooling of turbine blade . .24 (4) 71
Input vectors
MANUEL G & PRETORIUS J H C
The significance of relevance trees in the identificationof artificial neural networks input vectors . . . . .24 (1) 27
LiBr-water
BVUMBE T J & INAMBAO F L
Operational evaluation of the performance of a solarpowered absorption system in Pretoria . . . . . .24 (3) 26
Life cycle approach
STAFFORD W, COHEN B, PATHER-ELIAS S,
VON BLOTTNITZ H, VAN LILLE R, HARRISON
S T L & BURTON S G
Technologies for recovery of energy from waste-waters:Applicability and potential in South Africa . . . .24 (1) 15
Linear regression
MALAUDZI S T, SANKARAN V & LYSKO M D
Solar radiation analysis and regression coefficients forthe Vhembe Region, Limpopo Province, South Africa . . . . . . . . . . . . . . . . . . . . . . . . . . . . . . . . . . . . . . .24 (3) 2
LMDI method
ZHANG M & WANG M
Decoupling analysis of electricity consumption fromeconomic growth in China . . . . . . . . . . . . . . . .24 (2) 57
Load-shift
LIDBETTER R T & LIEBENBERG L
Load shifting opportunities for typical cement plants . . . . . . . . . . . . . . . . . . . . . . . . . . . . . . . . . . . .24 (1) 35
Low temperature solar thermal energy
SITUMBEKO S M & INAMBAO F L
System and component modelling of a low temperaturesolar thermal energy conversion cycle . . . . . . .24 (4) 51
M&V baseline developments
GOUWS R
Measurement and verification of load shiftinginterventions for a fridge plant system in South Africa . . . . . . . . . . . . . . . . . . . . . . . . . . . . . . . . . . . . . . .24 (1) 9
M&V service level adjustment
GOUWS R
Measurement and verification of load shiftinginterventions for a fridge plant system in South Africa . . . . . . . . . . . . . . . . . . . . . . . . . . . . . . . . . . . . .24 (1) 9
Mathematical model
SITUMBEKO S M & INAMBAO F L
System and component modelling of a low temperaturesolar thermal energy conversion cycle . . . . . . .24 (4) 51
Mud
SINGH Y & SNGH NK
Dirt analysis on the performance of an engine coolingsystem . . . . . . . . . . . . . . . . . . . . . . . . . . . . . . .24 (4) 44
Natural convection greenhouse
KUMAR M
Experimental study on natural convection greenhousegas drying of papad . . . . . . . . . . . . . . . . . . . . .24 (4) 37
Notified network demand
MANUEL G & PRETORIUS J H C
The significance of relevance trees in the identificationof artificial neural networks input vectors . . . . .24 (1) 27
Optimisation
CHAMOLI S
Exergy analysis of a flat plate solar collector . . .24 (3) 8
Parametric analysis
MAHAPATRA A K & SANJAY B E
Performance analysis of an air humidifier integrated gasturbine with film air cooling of turbine blade . .24 (4) 71
Papad
KUMAR M
Experimental study on natural convection greenhousegas drying of papad . . . . . . . . . . . . . . . . . . . . .24 (4) 37
Papad drying
KUMAR M
Experimental study on natural convection greenhousegas drying of papad . . . . . . . . . . . . . . . . . . . . .24 (4) 37
Photovoltaic
BOJIC M, PARVEDY, A P, MIRANVILLE F,
BIGOT D, CVETKOVIC D, DJORDJEVIC S &
NIKOLIC D
Photovoltaic electricity production in a residential houseon Reunion . . . . . . . . . . . . . . . . . . . . . . . . . . .24 (2) 46
Piecewise linear regression
CHIKOBVU D & SIGAUKE C
Modelling influence of temperature on daily peakelectricity demand in South Africa . . . . . . . . . .24 (4) 63
Power stations
LLOYD P
Reassessment of the environmental impacts of sulphuroxide emissions from power stations . . . . . . . .24 (2) 28
Journal of Energy in Southern Africa • Vol 24 No 4 • November 2013 91

Predicting models
AGO S
Evaluation of the regression parameters of theAngstrom-Page Model for predicting global solarradiation . . . . . . . . . . . . . . . . . . . . . . . . . . . . .24 (2) 46
Rapid railway system
MANUEL G & PRETORIUS J H C
The significance of relevance trees in the identificationof artificial neural networks input vectors . . . . .24 (1) 27
Radiator
SINGH Y & SNGH NK
Dirt analysis on the performance of an engine coolingsystem . . . . . . . . . . . . . . . . . . . . . . . . . . . . . . .24 (4) 44
Raw mill
LIDBETTER R T & LIEBENBERG L
Load shifting opportunities for typical cement plants . . . . . . . . . . . . . . . . . . . . . . . . . . . . . . . . . . . . . . .24 (1) 35
Regression splines
CHIKOBVU D & SIGAUKE C
Modelling influence of temperature on daily peakelectricity demand in South Africa . . . . . . . . . .24 (4) 63
Relevance trees
MANUEL G & PRETORIUS J H C
The significance of relevance trees in the identificationof artificial neural networks input vectors . . . . .24 (1) 27
Residential house
BOJIC M, PARVEDY, A P, MIRANVILLE F,
BIGOT D, CVETKOVIC D, DJORDJEVIC S &
NIKOLIC D
Photovoltaic electricity production in a residential houseon Reunion . . . . . . . . . . . . . . . . . . . . . . . . . . .24 (2) 46
Rural subsistence village
CHIKAVA W & ANNEGARN H
Human and physical energy cycles in a subsistencevillage in South Africa . . . . . . . . . . . . . . . . . . .24 (2) 67
Silt
SINGH Y & SNGH NK
Dirt analysis on the performance of an engine coolingsystem . . . . . . . . . . . . . . . . . . . . . . . . . . . . . . .24 (4) 44
Solar collector
CHAMOLI S
Exergy analysis of a flat plate solar collector . . .24 (3) 8
Solar energy
CHAMOLI S
Exergy analysis of a flat plate solar collector . . .24 (3) 8
Solar powered absorption
BVUMBE T J & INAMBAO F L
Operational evaluation of the performance of a solarpowered absorption system in Pretoria . . . . . .24 (3) 26
Solar radiation
MALAUDZI S T, SANKARAN V & LYSKO M D
Solar radiation analysis and regression coefficients forthe Vhembe Region, Limpopo Province, South Africa . . . . . . . . . . . . . . . . . . . . . . . . . . . . . . . . . . . . . . .24 (3) 2
South Africa
MALAUDZI S T, SANKARAN V & LYSKO M D
Solar radiation analysis and regression coefficients forthe Vhembe Region, Limpopo Province, South Africa . . . . . . . . . . . . . . . . . . . . . . . . . . . . . . . . . . . . . . .24 (3) 2
STAFFORD W, COHEN B, PATHER-ELIAS S,
VON BLOTTNITZ H, VAN LILLE R, HARRISON
S T L & BURTON S G
Technologies for recovery of energy from waste-waters:Applicability and potential in South Africa . . . .24 (1) 15
Sulphur oxide
LLOYD P
Reassessment of the environmental impacts of sulphuroxide emissions from power stations . . . . . . . .24 (2) 28
Sunshine duration
AGO S
Evaluation of the regression parameters of theAngstrom-Page Model for predicting global solarradiation . . . . . . . . . . . . . . . . . . . . . . . . . . . . .24 (2) 46
Sustainability
DOS SANTOS J B & JABBOUR C J
Critical factors to be considered when planning theimplementation of environmental improvements andenergy saving . . . . . . . . . . . . . . . . . . . . . . . . . .24 (4) 22
Synthesis gas
BOTHA F, DOBSON R & HARMS T
Simulation of a syngas from a coal production plantcoupled to a high temperature nuclear reactor .24 (2) 37
Systems performance
BVUMBE T J & INAMBAO F L
Operational evaluation of the performance of a solarpowered absorption system in Pretoria . . . . . .24 (3) 26
Techno-economic analysis
MUKUMBA P, MAKAKA G, MAMPHELI S, MISI
S
A possible design and justification for a biogas plant atNyazura Adventist High School, Rusape, Zimbabwe . . . . . . . . . . . . . . . . . . . . . . . . . . . . . . . . . . . . . . .24 (4) 12
Teheran Stock Exchange
TAGHIZADEH H & POURRABBI M V P
Energy cost versus production as a performancebenchmark for analysis of companies . . . . . . . .24 (1) 2
Temperature
CHIKOBVU D & SIGAUKE C
Modelling influence of temperature on daily peakelectricity demand in South Africa . . . . . . . . . .24 (4) 63
User centred design
BRADNUM C
The Manica Charcoal Stove Project . . . . . . . . . .24 (2) 2
Venda
CHIKAVA W & ANNEGARN H
Human and physical energy cycles in a subsistencevillage in South Africa . . . . . . . . . . . . . . . . . . .24 (2) 67
92 Journal of Energy in Southern Africa • Vol 24 No 4 • November 2013

Wastewater waste
STAFFORD W, COHEN B, PATHER-ELIAS S,
VON BLOTTNITZ H, VAN LILLE R, HARRISON
S T L & BURTON S G
Technologies for recovery of energy from waste-waters:Applicability and potential in South Africa . . . .24 (1) 15
Working fluids
SITUMBEKO S M & INAMBAO F L
System and component modelling of a low temperaturesolar thermal energy conversion cycle . . . . . . .24 (4) 51
Zambia
TEMBO B & MERVEN B
Policy options for the sustainable development ofZambia’s electricity sector . . . . . . . . . . . . . . . .24 (2) 16
Journal of Energy in Southern Africa • Vol 24 No 4 • November 2013 93

94 Journal of Energy in Southern Africa • Vol 24 No 4 • November 2013

Journal of Energy in Southern Africa • Vol 24 No 4 • November 2013 95

96 Journal of Energy in Southern Africa • Vol 24 No 4 • November 2013