1 PSE Number: E-5000 SEC Number: 152-747 File Number ...
380
1 PSE Number: E-5000 SEC Number: 152-747 File Number: ________ AYALA LAND, INC. ___________________________________ (Company’s Full Name) 31F Tower One and Exchange Plaza, Ayala Triangle, Ayala Avenue, Makati City 1226 ___________________________________ (Company Address) (632) 750-6974 ___________________________________ (Telephone Number) December 31, 2018 ___________________________________ (Year Ending) Annual Report - SEC Form 17-A ___________________________________ (Form Type) ___________________________________ (Amendments – if applicable)
-
Upload
khangminh22 -
Category
Documents
-
view
13 -
download
0
Transcript of 1 PSE Number: E-5000 SEC Number: 152-747 File Number ...

1
PSE Number: E-5000 SEC Number: 152-747 File Number: ________
AYALA LAND, INC. ___________________________________
(Company’s Full Name)
31F Tower One and Exchange Plaza, Ayala Triangle, Ayala Avenue, Makati City 1226
___________________________________ (Company Address)
(632) 750-6974 ___________________________________
(Telephone Number)
December 31, 2018 ___________________________________
(Year Ending)
Annual Report - SEC Form 17-A ___________________________________
(Form Type) ___________________________________
(Amendments – if applicable)

Scanned with CamScanner

3
12. Check whether the issuer: (a) has filed all reports required to be filed by Section 17 of the SRC and SRC Rule 17 thereunder or
Section 11 of the RSA and RSA Rule 11(a)-1 thereunder, and sections 26 and 141 of the Corporation Code of the Philippines during the preceding 12 months (or for such shorter period that the registrant was required to file such reports):
Yes [x] No [ ] (b) has been subject to such filing requirements for the past 90 days: Yes [x] No [ ] 13. Aggregate market value of the voting stock held by non-affiliates:
APPLICABLE ONLY TO ISSUERS INVOLVED IN INSOLVENCY/SUSPENSION OF PAYMENTS PROCEEDINGS
DURING THE PRECEEDING FIVE YEARS 14. Check whether the issuer has filed all documents and reports required to be filed by Section 17 of
the Code subsequent to the distribution of securities under a plan confirmed by a court or the Commission.
Yes [ ] No [ ] Not applicable
DOCUMENTS INCORPORATED BY REFERENCE 15. Briefly describe documents incorporated by reference and identify the part of the SEC Form 17-A
into which the document is incorporated:
2018 Audited Consolidated Financial Statements (incorporated as reference for Items 5, 7, 10 & 12 of SEC Form 17-A)

4
TABLE OF CONTENTS Page No. PART I - BUSINESS Item 1. Business 5 Item 2. Properties 17 Item 3. Legal Proceedings 19 Item 4. Submission of Matters to a Vote of Security Holders 20 PART II – SECURITIES OF THE REGISTRANT Item 5. Market for Issuer’s Common Equity and Related
Stockholder Matters 21 PART III – FINANCIAL INFORMATION Item 6. Management’s Discussion and Analysis and Results of Operation 25 Item 7. Financial Statements 40 Item 8. Information on Independent Accountant and
Other Related Matters 41 PART IV – MANAGEMENT AND CERTAIN SECURITY HOLDERS Item 9. Directors and Executive Officers of the Issuer 42 Item 10. Executive Compensation 52 Item 11. Security Ownership of Certain Beneficial
Owners and Management 54 Item 12. Certain Relationships and Related Transactions 56 PART V – CORPORATE GOVERNANCE Item 13. Compliance with Leading Practice on Corporate Governance 56 EXHIBITS AND SCHEDULES Item 14. Exhibits and Reports on SEC Form 17-C 57
(a) Exhibits (b) Reports on SEC Form 17-C SIGNATURES 60 INDEX TO EXHIBITS 61 INDEX TO SUPPLEMENTARY SCHEDULES 66

5
PART I - BUSINESS Item 1. Business Background Ayala Land, Inc. (“Ayala Land” or the “Company”) was formerly the real estate division of Ayala Corporation and was incorporated on June 30, 1988 to focus on the development of its existing real estate assets. In July 1991, the Company became publicly-listed through an initial public offering (“IPO”) of its primary and secondary shares on the Makati and Manila Stock Exchanges (predecessors of the PSE). Ayala Corporation’s effective ownership in Ayala Land amounted to 88% as a result of the IPO. Over the years, several developments further reduced Ayala Corporation’s effective interest in Ayala Land; the exercise of stock options by respective employees of Ayala Corporation and Ayala Land, the disposal of Ayala Land shares by Ayala Corporation and Ayala Land’s issuance of new shares in relation to its acquisition of interest in companies owning properties in Canlubang, Laguna in 1993. Furthermore, the conversion of a P3.0 billion, convertible, long-term commercial paper to Ayala Land Common B Shares publicly issued in December 1994, exchanges under bonds due in 2001, and equity top-up placements conducted through an overnight book-built offering in July 2012, March 2013 and January 2015. As of December 31, 2018, Ayala Corporation’s effective ownership in Ayala Land is 46.77% with the remainder owned by the public. Ayala Land is listed with a total of 14,734,881,081 outstanding common shares and 13,066,494,759 voting preferred shares. Foreign ownership is 22.03% composed of 5,517,690,120 outstanding common shares and 607,204,775 voting preferred shares. Equity attributable to equity holders of Ayala Land amounted to ₱166.25 billion. Ayala Land has a total market capitalization of P598.2 billion based on the closing price of P40.60 per common share on December 28, 2018, the last trading day of the year. Ayala Land is the largest and most diversified real estate conglomerate in the Philippines. It is engaged in land acquisition, planning, and development of large scale, integrated, mixed-use, and sustainable estates, industrial estates, development and sale of residential and office condominiums, house and lots, and commercial and industrial lots, development and lease of shopping centers and offices, co-working spaces, and standard factory buildings and warehouses, and the development, management, and operation of hotels and resorts and co-living spaces. The Company is also engaged in construction, property management, retail electricity supply and airline services. It also has investments in Cebu Holdings, Inc., OCLP Holdings, Inc., Prime Orion Philippines, Inc., MCT Bhd, Qualimed and Merkado Supermarket. Ayala Land has 26 estates, is present in in 57 growth centers nationwide and has a total land bank of 11,624 hectares at the end of 2018. Products / Business Lines Property Development Property Development is composed of the Strategic Land Bank Management Group, Visayas-Mindanao Group, Residential Business Group and MCT Bhd, Ayala Land’s listed subsidiary in Malaysia. The Strategic Land Bank Management Group handles the acquisition, planning and development of large scale, mixed-use, and sustainable estates, and the development and sale, or lease of its commercial lots in its estates in Metro Manila and the Luzon region. The Visayas-Mindanao Group handles the acquisition, planning and development of large scale, mixed-use, and sustainable estates, and the development and sale, or lease of its commercial lots in its estates in key cities in the Visayas and Mindanao regions.

6
The Residential Business Group handles the development and sale of residential and office condominiums and house and lots for the luxury, upscale, middle-income, affordable, and socialized housing segments, and the development and sale of commercial lots under the following brands: AyalaLand Premier (“ALP”) for luxury lots, residential and office condominiums, Alveo Land Corp. (“Alveo”) for upscale lots, residential and office condominiums, Avida Land Corp. (“Avida”) for middle-income lots, house and lot packages, and residential and office condominiums, Amaia Land Corp. (“Amaia”) for affordable house and lot packages and residential condominiums, and BellaVita Land Corp. (“BellaVita”) for socialized house and lot packages. MCT Bhd. is a publicly-listed property developer in Malaysia engaged in land acquisition, planning, and development of residential condominiums for sale for middle income segment. MCT has a land bank of 515 acres located in Subang Jaya, Cyberjaya and Petaling Jaya. Ayala Land owns 66.3% in MCT Bhd.
Commercial Leasing Commercial Leasing involves the development and lease of shopping centers through Ayala Malls, and offices, through Ayala Land Offices, co-working spaces through the “Clock In” brand, and standard factory buildings and warehouses under Laguna Technopark, Inc., and the development, management, and operation of hotels and resorts through AyalaLand Hotels and Resorts, Inc. and co-living spaces through “The Flats” brand. Services Services include construction, property management, retail electricity supply and airline services. Construction of Ayala Land and third-party projects and land development is done through Makati Development Corporation (“MDC”). Property Management is done through Ayala Property Management Corporation (“APMC”). Retail electricity supply is done through Direct Power Services, Inc. (DPSI), Ecozone Power Management, Inc. (EPMI), and Philippine Integrated Energy Solutions, Inc. (PhilEnergy). Airline service is done through AirSWIFT for Ayala Land’s tourism estates in Lio, Palawan and Sicogon Island resort through its fleet of four modern turbo-prop aircrafts. Strategic Investments Ayala Land’s strategic investments include Cebu Holdings, Inc. (70.43%), OCLP Holdings, Inc. (21.01%), Prime Orion Philippines, Inc., (63.9%), MCT Bhd., (66.3%) Qualimed (40.0%) and Merkado Supermarket (50.0%). Products / Business Lines (with 10% or more contribution to 2018 consolidated revenues before intercompany adjustments):
Property Development 52% Commercial Leasing 15% Services 33%
7
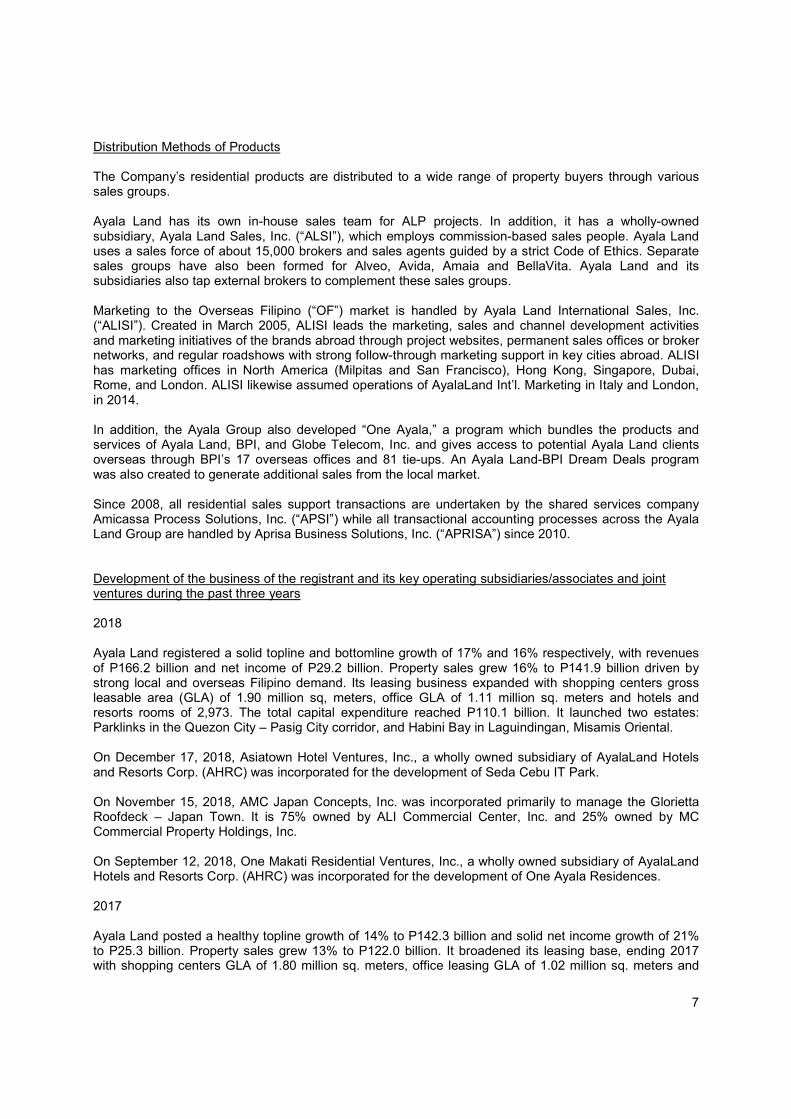
Distribution Methods of Products The Company’s residential products are distributed to a wide range of property buyers through various sales groups. Ayala Land has its own in-house sales team for ALP projects. In addition, it has a wholly-owned subsidiary, Ayala Land Sales, Inc. (“ALSI”), which employs commission-based sales people. Ayala Land uses a sales force of about 15,000 brokers and sales agents guided by a strict Code of Ethics. Separate sales groups have also been formed for Alveo, Avida, Amaia and BellaVita. Ayala Land and its subsidiaries also tap external brokers to complement these sales groups. Marketing to the Overseas Filipino (“OF”) market is handled by Ayala Land International Sales, Inc. (“ALISI”). Created in March 2005, ALISI leads the marketing, sales and channel development activities and marketing initiatives of the brands abroad through project websites, permanent sales offices or broker networks, and regular roadshows with strong follow-through marketing support in key cities abroad. ALISI has marketing offices in North America (Milpitas and San Francisco), Hong Kong, Singapore, Dubai, Rome, and London. ALISI likewise assumed operations of AyalaLand Int’l. Marketing in Italy and London, in 2014. In addition, the Ayala Group also developed “One Ayala,” a program which bundles the products and services of Ayala Land, BPI, and Globe Telecom, Inc. and gives access to potential Ayala Land clients overseas through BPI’s 17 overseas offices and 81 tie-ups. An Ayala Land-BPI Dream Deals program was also created to generate additional sales from the local market. Since 2008, all residential sales support transactions are undertaken by the shared services company Amicassa Process Solutions, Inc. (“APSI”) while all transactional accounting processes across the Ayala Land Group are handled by Aprisa Business Solutions, Inc. (“APRISA”) since 2010. Development of the business of the registrant and its key operating subsidiaries/associates and joint ventures during the past three years 2018 Ayala Land registered a solid topline and bottomline growth of 17% and 16% respectively, with revenues of P166.2 billion and net income of P29.2 billion. Property sales grew 16% to P141.9 billion driven by strong local and overseas Filipino demand. Its leasing business expanded with shopping centers gross leasable area (GLA) of 1.90 million sq, meters, office GLA of 1.11 million sq. meters and hotels and resorts rooms of 2,973. The total capital expenditure reached P110.1 billion. It launched two estates: Parklinks in the Quezon City – Pasig City corridor, and Habini Bay in Laguindingan, Misamis Oriental. On December 17, 2018, Asiatown Hotel Ventures, Inc., a wholly owned subsidiary of AyalaLand Hotels and Resorts Corp. (AHRC) was incorporated for the development of Seda Cebu IT Park. On November 15, 2018, AMC Japan Concepts, Inc. was incorporated primarily to manage the Glorietta Roofdeck – Japan Town. It is 75% owned by ALI Commercial Center, Inc. and 25% owned by MC Commercial Property Holdings, Inc. On September 12, 2018, One Makati Residential Ventures, Inc., a wholly owned subsidiary of AyalaLand Hotels and Resorts Corp. (AHRC) was incorporated for the development of One Ayala Residences. 2017 Ayala Land posted a healthy topline growth of 14% to P142.3 billion and solid net income growth of 21% to P25.3 billion. Property sales grew 13% to P122.0 billion. It broadened its leasing base, ending 2017 with shopping centers GLA of 1.80 million sq. meters, office leasing GLA of 1.02 million sq. meters and

8
2,583 hotel and resort rooms. The total capital expenditure reached P91.4 billion. It launched three estates: Evo City in Cavite, Azuela Cove in Davao and Seagrove in Cebu. On December 4, 2017, Capitol Central Commercial Ventures Corp. is a wholly owned subsidiary of Ayala Land, Inc. and was incorporated for the development of Ayala Malls Capitol Central. On November 16, 2017, Arca South Commercial Ventures Corp., a wholly-owned subsidiary of Ayala Land, Inc. and was incorporated for the development of Ayala Malls Arca South. On November 3, 2017, Bay City Commercial Ventures Corp. (BCCVC), a wholly owned subsidiary of Ayala Land, Inc. was incorporated for the development of Ayala Malls Manila Bay. On October 10, 2017, Makati North Hotel Ventures, a wholly owned subsidiary of AHRC was incorporated for the development of Seda Ayala North Exchange. On September 28, 2017, One Makati Hotel Ventures, Inc., a wholly owned subsidiary of AHRC and was incorporated for the development of Seda One Ayala. On September 6, 2017, Bay Area Hotel Ventures, a wholly owned subsidiary of AHRC was incorporated for the development of Seda Bay Area. On July 7, 2017, AyalaLand Premier, Inc., a wholly owned subsidiary of Ayala Land was registered to engage primarily in general contracting services. On June 5, 2017, Makati Cornerstone Leasing Corp., a wholly owned subsidiary of Ayala Land was incorporated to develop Circuit BPO Towers 1 and 2. On March 1, 2017, MDBI Construction Corp., formerly MDC Triangle, Inc., was incorporated. The company is 67% owned by Makati Development Corp., and 33% owned by Bouyges Batiment International, a Europe-based company which is also a subsidiary of Bouyges Construction. MDBI was organized to engage in general contracting services. 2016 Ayala Land grew its revenues by 16% to P124.6 billion and its net income by 19% to P20.9 billion. Property sales grew 3% to P108.0 billion. Its leasing business expanded, closing 2016 with shopping centers GLA of 1.62 million sq. meters, office leasing GLA of 836 thousand sq. meters and total hotels and resorts rooms of 2,027. Ayala Land spent P85.4 billion in capital expenditures. On October 10, 2016, Lio Tourism Estate Management Corp. is a wholly owned subsidiary of Ten Knots Phils., Inc. (TKPI) and was incorporated. On March 9, 2016, Altaraza Prime Realty Corporation, a wholly owned subsidiary of the Company, was incorporated on to develop Altaraza IT Park, Bulacan. Bankruptcy, Receivership or Similar Proceedings None for any of the subsidiaries and affiliates above.

9
Material Reclassification, Merger, Consolidation or Purchase or Sale of a Significant Amount of Assets (not ordinary) over the past three years 2018 In December 2018, ALI acquired 8,051 common shares of LTI for ₱800.0 million increasing its ownership to 95%. On November 7, 2018, Ayala Land, Inc., in partnership with Ayala Corporation, launched its 26th estate, Habini Bay in Misamis Oriental. The 526-hectare estate is positioned as a new center of trade and commerce in Northern Mindanao. On November 6, 2018, SEC approved the merger between CHI and CPVDC with CHI as the surviving entity. ALI acquired additional 59,631,200 common shares of CHI totaling to ₱352.8 million. Further, an additional 77,742,516 shares were acquired as a result of swap of CPVDC shares for a total consideration of ₱229.3 million which brings Parent Company’s ownership to 70.4%. On May 11, 2018, Ayala Land entered into a Memorandum of Understanding with Green Square Properties Corporation (GSPC) and Green Circle Properties and Resources, Inc. (GCPRI) for the formation of a joint-venture company (JVC) that will own and develop 27,852 hectares of land (the Properties), specifically located in Dingalan Aurora and General Nakar, Province of Quezon. ALI will own 51%, and GSPC and GCPRI will jointly own 49% of the JVC. On April 30, 2018, ALI and POPI executed a Deed of Exchange where ALI will subscribe to 1,225,370,620 common shares of POPI for an aggregate subscription price of P3.0 billion in exchange for 30,186 common shares of Laguna Technopark, Inc. (LTI). The subscription and exchange shall be subject to and deemed effective only upon the issuance by the SEC of the confirmation of valuation of the shares. On April 27, 2018 Ayala Land, Inc. issued and listed on the Philippine Dealing & Exchange Corp. a P10 billion bond due April 2028 with a coupon rate of 5.9203% p.a. for the initial five-year period of the ten-year term of the bond. The coupon rate will reprice on April 27, 2023, the fifth anniversary of the Issue Date, at the higher of (a) 5.9203% or (b) the prevailing 5-year benchmark plus 75 bps which shall apply to all interest payments thereafter. The Bond was assigned an issue credit rating of PRS AAA, with a Stable Outlook, by Philratings, the highest investment grade indicating minimal credit risk. The issuance is the fifth tranche of the Fixed Rate Bond series of the Company’s P50 billion Debt Securities Program as approved by the Securities and Exchange Commission (SEC) in March 2016. On April 4, 2018, Ayala Land, Inc. (ALI) signed a Deed of Absolute Sale with Central Azucarera de Tarlac, Inc. for the acquisition of several parcels of land with an aggregate area of approximately 290 hectares located in Barangay Central, City of Tarlac, Province of Tarlac. On March 23, 2018, the Executive Committee of Ayala Land approved the exchange of its 75% equity interest in Laguna Technopark, Inc. (LTI) into additional shares of stock in Prime Orion Philippines, Inc. (POPI). The value of the transaction is P3.0 billion where POPI will issue 1,225,370,620 common shares to ALI in exchange for 30,186 LTI common shares and bring ALI’s direct ownership in POPI to 63.90% from 54.91%. On February 26, 2018, the Board of Directors of Cebu Holdings, Inc. (CHI) during its meeting, approved the merger of Cebu Property Ventures Development Corp. (CPVDC) with CHI as the surviving entity. The merger will consolidate CHI’s portfolio under one listed entity, creating a unified portfolio for its investments and is expected to result in operational synergies, efficient funds management and simplified reporting to government agencies, as a result of the merger. The plan of merger shall be submitted for approval of the stockholders of the two companies during their respective annual stockholders’ meeting to be held on April 10, 2018.

10
On February 20, 2018, the Philippine Competition Commission (PCC) approved the setting up of a joint venture between the Company and Royal Asia Land, Inc. to acquire, own, and develop a 936-hectare commercial and residential project in Silang and Carmona, Cavite. Both firms will own 50% equity in the joint venture vehicle while Royal Asia Land will receive a consultation fee of 2% of the joint venture firm's gross revenue for its participation in the planning and development of the property. ALI, meanwhile, will develop and market the project and receive a management fee of 12% and sales and marketing fee of 5% of the gross revenue. The PCC has deemed that the transaction does not result in a substantial lessening of competition because it will not have a structural effect on the market. On January 11, 2018, SIAL CVS Retailers, Inc., FamilyMart Co., Ltd., and ITOCHU Corporation have concluded the transaction to sell 100% of the outstanding shares of Philippine FamilyMart CVS, Inc. (PFM) to P-H-O-E-N-I-X Petroleum Philippines, Inc. (PNX), further to a Memorandum of Agreement (MOA) entered into by the parties last October 30, 2017. On January 2, 2018, Ayala Land, Inc., (ALI) through its wholly-owned subsidiary, Regent Wise Investments Limited (RWIL), signed a share purchase agreement to acquire an additional 17.24% share in MCT Bhd (MCT), subject to completion of certain conditions. This will bring ALI’s shareholding in MCT to 50.19% from 32.95%. Subsequently, on January 5, 2018, Regent Wise Investments Limited (RWIL), issued a notice of an unconditional mandatory take-over offer to the Board of Directors of MCT Bhd (MCT), to acquire all remaining shares of the company that are not already held by RWIL, following the completion of certain conditions to the share purchase agreement. The take-over offer is made in connection to the acquisition of additional shares in MCT, which increased ALI’s shareholding in MCT to 50.19%. On March 23, 2018, Ayala Land completed the acquisition process, increasing its ownership stake in MCT to 66.25%. 2017 On October 30, 2017, SIAL CVS Retailers, Inc., FamilyMart Co., Ltd., and ITOCHU Corporation entered into a Memorandum of Agreement (MOA) to sell 100% of the outstanding shares of Philippine FamilyMart CVS, Inc. (PFM) to P-H-O-E-N-I-X Petroleum Philippines, Inc. (PNX). SIAL CVS Retailers, Inc., a 50-50 joint venture company between ALI Capital Corp. (a 100% subsidiary of Ayala Land, Inc.) and SSI Group, Inc. (SSI), currently owns 60% of PFM, while Japanese companies, FamilyMart Co., Ltd. and ITOCHU Corporation, own 37.6% and 2.4% respectively. In June 2017, Orion Land, Inc. (OLI), a subsidiary of POPI, acquired 512,480,671 common shares equivalent to 11.69% ownership at ₱2.45/share amounting to ₱1,255.58 million. The acquisition of POPI shares by OLI was treated as an acquisition of non-controlling interest resulting to a debt to equity reserve of ₱405.18 million. This increased ALI’s effective share ownership to 63.05%. On February 23, 2017, Ayala Land together with BPI Capital Corporation and Kickstart Ventures, Inc. signed an investment agreement to acquire ownership stakes in BF Jade E-Service Philippines, Inc, owner and operator of online fashion platform, Zalora Philippines. ALI will own 1.91% of Zalora Philippines through this transaction. On February 22, 2017, Ayala Land signed an investment agreement to acquire a 1.91% ownership stake in BF Jade E-Service Philippines, Inc, the owner and operator of the online fashion platform Zalora Philippines (Zalora), subject to the fulfillment of certain conditions precedent, including obtaining the approval or deemed approval of the Philippine Competition Commission. On February 20, 2017, The Board of Directors during its meeting approved the raising of up to ₱20.00 billion through (i) retail bonds, (ii) corporate notes and/or (iii) bilateral term loans with a term of up to ten (10) years, to partially finance general corporate requirements. The Board also approved the raising of up to ₱10.00 billion through the issuance of short dated notes with a tenor of up to 21 months to refinance the Corporation’s short-term loans.

11
In February 2017, ALI purchased additional 631,000 common shares of POPI from BPI Securities Corporation for ₱1.26 million. ALI’s interest remains at 51% of total POPI’s outstanding capital stock. In 2017, ALI purchased additional 97,763,900 common shares of CHI from BPI Securities Corporation totaling ₱575.0 million which brought up ALI’s ownership to 72% of the total outstanding capital stock of CHI. 2016 On August 19, 2016, The Board of Directors during its meeting approved the terms and conditions of the P7.0 billion third tranche of the Fixed-rate Bonds Series and P3.0 billion Homestarter Bonds under the Corporation’s P50.0 Billion Debt Securities Program as approved by the SEC in March 2016. On June 1, 2016, Ayalaland Mall Synergies, Inc., a wholly owned subsidiary of Ayala Land, Inc, was incorporated. The company will house the Commercial Business Group’s allied businesses such as but not limited to the partnership with Mercato, LED, and operations of upcoming mall’s foodcourt. On May 19, 2016, additional ESOWN shares were subscribed under the ESOWN totaling 3,110,756 common shares. On May 18, 2016, additional ESOWN shares were subscribed totaling 293,919 common shares at P26.27 per share by four (4) grantees. On May 11, 2016, 137 ESOWN grantees subscribed to 13,646,546 common shares at P26.27 per share. In April 2016, Ayala Land purchased 6,000,000 common shares and 24,000,000 preferred redeemable shares, with par value of P10 per share each of Prow Holdings, Inc. (PHI) for P300,000,000. Further, on May 23, 2016, additional 3,000,000 common shares and 12,000,000 preferred redeemable shares with par value of P10 per share were acquired by ALI. Subsequently in August 2016, Ayala Land acquired 9,150,931 common shares and 12,876,456 preferred redeemable shares in Prow Holdings, Inc. (PHI) for a total consideration of P220,273,870 which brought ALI’s ownership to 55% of the total outstanding capital stock in relation to the joint venture agreement for the development of Alviera Estate in Porac, Pampanga. In March 2016, ALI bought additional 200,953,364 common shares of CHI. This increased the Company’s stake from 56.40% to 66.87% of the total outstanding capital stock of CHI. On March 14, 2016, the Company acquired 55% interest in Prow Holdings, Inc. for a purchase price of P150 million. The acquisition was made in line with the Company’s partnership with Leonio Land, Inc. to develop a mixed-use community in Porac, Pampanga. On March 1, 2016, SIAL Specialty Retailers, Inc. (“SIAL”), a joint venture company between ALI and the SSI Group, Inc., entered into a Deed of Absolute Sale with Metro Retail Stores Group, Inc. to sell fixed assets including fit-outs, furniture, fixtures and equipment in SIAL’s department stores located at Fairview Terraces and UP Town Center. In March 2016, the Company acquired an 18% stake in OCLP Holdings, Inc. (OHI), consistent with its thrust of expanding operations into other areas within and outside Metro Manila through partnerships. OHI holds 99.51% equity interest in Ortigas & Company Limited Partnership (OCLP), an entity engaged in real estate development and leasing businesses. On February 24, 2016, Ayala Land and Prime Orion Philippines, Inc. (“POPI”) executed a Deed of Subscription and a Supplement to the Deed of Subscription whereby ALI subscribed to 2,500,000,000 common shares of stock of POPI, which will represent 51.06% of the total outstanding shares of POPI. The consideration for the ALI subscription is PhP2.25 per share or a total subscription price of

12
PhP5,625,000,000.00 of which 25% or PhP1,406,250,000.00 was paid on February 24 and the 75% to be paid upon fulfillment of certain terms and conditions. Consequently, on July 4, 2018, the SEC approved Ayala Land’s increase in shares in POPI and issued a certificate of increase in capital stock. In February 2016, the Company purchased additional 906,000 common shares of CHI from BPI Securities totaling P4.06 million. This brings ALI’s ownership from 56.36% to 56.40% of total outstanding capital stock of CHI. On January 21, 2016, Ayala Land and LT Group, Inc. (LTG) entered into an agreement to jointly develop a 35-hectare township that spans portions of Pasig City and Quezon City. On March 13, 2016, ALI-ETON Property Development Corporation was incorporated. On January 12, 2016, Ayala Land, and its subsidiaries and affiliates together with Cebu Holdings, Inc., and Cebu Property Ventures and Development Corporation, (the “ALI Group”) signed a Memorandum of Agreement (“MOA”) with Manila Water Philippine Ventures, Inc. (“MWPV”), a wholly-owned subsidiary of Manila Water Company, Inc. Under the Agreement, MWPV shall provide water and used water services to all ALI Group projects nationwide. On January 21, 2016, ALI and LT Group, Inc. (“LTG”) entered into an agreement to jointly develop a project along the C5 corridor. The project is envisioned to be a township development that spans portions of Pasig City and Quezon City. Various diversification/ new product lines introduced by the company during the last three years The Flats Ayala Land opened its first co-living product, branded as “The Flats” on September 2018. It is located in Amorsolo, Makati and offers a total of 898 beds across 196 multiple occupancy rooms and communal spaces. Clock In In 2017, Ayala Land launched a co-working space product branded as “Clock In” with three operating branches in Makati and BGC with a total of 433 seats. In 2018, it launched three new sites in Vertis North Quezon City, 30Th Corporate Center in Pasig and Ayala North Exchange in Makati. Standard Factory Buildings and Warehouses In 2018, Ayala Land started to offer standard factory buildings (SFB) and warehouses for lease inside industrial parks to capture the growing opportunities in manufacturing and logistics. Ayala Land has a total of 136,864 sq. meters of SFB and warehouse GLA across various locations such as Laguna Technopark, Cavite Technopark, the Tutuban complex in Manila, and the Lepanto Ceramics facility in Laguna. Hospitals/Clinics Ayala Land entered into a strategic partnership with the Mercado Group in July 2013 to establish hospitals and clinics located in the Company’s integrated mixed-use developments branded as QualiMed. In 2014, QualiMed opened three (3) clinics in Trinoma, Fairview Terraces, McKinley Exchange Corporate Center, and Qualimed General Hospital in Atria Park, Iloilo while UP Town Center Clinic in Quezon City was opened in the end of 2015. In the 2nd Quarter of 2016, Qualimed opened a hospital in Altaraza San Jose Del Monte Bulacan. In the 3rd Quarter of 2017, Qualimed opened its 102-bed hospital in Nuvali, Sta. Rosa, Laguna. Supermarkets ALI Capital Corporation (formerly Varejo Corporation), a subsidiary of Ayala Land, entered into a joint venture agreement with Entenso Equities Incorporated, a wholly-owned entity of Puregold Price Club, Inc., to develop and operate mid-market supermarkets for some of Ayala Land’s mixed-use projects

13
branded as Merkado Supermarket. The first supermarket was opened in the 3rd quarter of 2015 at UP Town Center while its second store was opened in December 2017 at Ayala Malls Vertis North. Competition Ayala Land is the only full-line real estate developer in the Philippines with a major presence in almost all sectors of the industry. Ayala Land believes that, at present, there is no other single property company that has a significant presence in all sectors of the property market. Ayala Land has different competitors in each of its principal business lines. With respect to its shopping center business, Ayala Land’s main competitor is SM which owns numerous shopping centers around the country. Ayala Land is able to effectively compete for tenants given that most of its shopping centers are located inside its mixed-used estates, populated by residents and office workers. The design of Ayala Land’s shopping centers also features green open spaces and parks. For office rental properties, Ayala Land sees competition in smaller developers such as Kuok Properties (developer of Enterprise Building), Robinsons Land (developer of Robinsons Summit Center) and non-traditional developers such as the AIG Group (developer of Philam Towers) and RCBC (developer of RCBC towers). For BPO office buildings, Ayala Land competes with the likes of Megaworld, SM and Robinsons Land. Ayala Land is able to effectively compete for tenants primarily based upon the quality and location of its buildings, reputation as a building owner and the quality of support services provided by its property manager, rental and other charges. With respect to residential lots and condominium products, Ayala Land competes with developers such as Megaworld, DMCI Homes, Robinsons Land, and SM Development Corporation. Ayala Land is able to effectively compete for purchasers primarily on the basis of reputation, price, reliability, and the quality and location of the community in which the relevant site is located. For the middle-income business, Ayala Land sees the likes of SM Development Corp, Megaworld, Filinvest Land and DMCI Homes as key competitors. Alveo and Avida are able to effectively compete for buyers based on quality and location of the project and availability of attractive in-house financing terms. For the affordable housing segment, Amaia competes with Camella Homes, DMCI Homes, Filinvest, Robinsons Land and SM Development Corporation. BellaVita, a relatively new player in the socialized housing market, will continue to aggressively expand its geographical footprint with product launches primarily located in provincial areas. Suppliers The Company has a broad base of suppliers, both local and foreign. The Company is not dependent on one or a limited number of suppliers. Customers Ayala Land has a broad market base including local and foreign individual and institutional clients. The Company does not have a customer that will account for twenty percent (20%) or more of its revenues. Transactions with related parties Please refer to Item 12 of this report (“Certain Relationships and Related Transactions).

14
Government approvals/regulations The Company secures various government approvals such as the environmental compliance certificate, development permits, license to sell, etc. as part of the normal course of its business. Employees Ayala Land has a total workforce of 362 regular employees as of December 31, 2018. The breakdown as follows:
Senior Management 26 Middle Management 212 Staff 124 Total 362
Employees take pride in being an ALI employee because of the company’s long history of bringing high quality developments to the Philippines. With the growth of the business, career advancement opportunities are created for employees. These attributes positively affect employee engagement and retention. The Company aims that its leadership development program and other learning interventions reinforce ALI’s operating principles and provide participants with a set of tools and frameworks to help them develop skills and desired qualities of an effective leader. The programs are also venues to build positive relations and manage networks within the ALI Group. ALI has a healthy relation with its employees’ union. Both parties openly discuss employee concerns without necessity of activating the formal grievance procedure. Further, employees are able to report fraud, violations of laws, rules and regulations, or misconduct in the organization thru reporting channels under the ALI Business Integrity Program. Ayala Land is subject to significant competition in each of its principal businesses of property development, commercial leasing and services. In property development, Ayala Land competes with other developers to attract condominium and house and lot buyers. In commercial leasing, it competes for shopping center and office space tenants, as well as customers of the retail outlets, restaurants, and hotels and resorts across the country. However, Ayala Land believes that, at present, there is no single property company that has a significant presence in all sectors of the property market. Risks Ayala Land is subject to significant competition in each of its principal businesses. Ayala Land competes with other developers and developments to attract land and condominium buyers, shopping center and office tenants, and customers of retail outlets, restaurants, and hotels and resorts across the country. However, Ayala Land believes that, at present, there is no single property company that has a significant presence in all sectors of the property market. High-End, Middle-Income, Affordable Residential, and Economic and Socialized Housing Developments With respect to high-end and middle-income land and condominium sales, Ayala Land competes for buyers primarily on the basis of reputation, reliability, price, quality, and the location of the community in which the relevant site is located. For the affordable, economic and socialized housing markets, Ayala Land competes for buyers based on quality of projects, affordability of units and availability of financing.

15
Ayala Land is also actively tapping the overseas Filipino market. In addition, it has seen demand from foreign buyers both residing in the country and abroad. Shopping Center, Office Space and Land Rental For its shopping centers, Ayala Land competes for tenants primarily based on the ability of the shopping center to attract customers. This is typically hinged on the location and the tenant-mix of the retail center, the reputation of the retail center owner, as well as rental and other charges. The market for shopping centers has become competitive and with the growing number of pipeline and new shopping center openings across the country. Some competing shopping centers are located within relatively close proximity of Ayala Land's commercial centers. With respect to its office rental properties, Ayala Land competes for tenants primarily based on the quality and location of the relevant building, reputation of the building's owner, quality of support services provided by the property manager, and rental and other charges. The Company is addressing the continuing demand from BPOs and corporate by providing fully integrated and well-maintained developments (high rise or campus facility) in key locations in the country. Hotel and Resort Operations The local hotel and resort sector is largely driven by foreign and local travel for leisure or business purposes. Any slowdown in tourism and business activity due to global financial and local political turmoil and security concerns could potentially limit growth of the Company's hotels and resorts. Construction Ayala Land's construction business, Makati Development Corporation (MDC), is benefiting from the improved performance of the construction industry, particularly from an uptick in development activities mostly from the residential and retail sector. With booming construction across the country, Ayala Land must manage the risk of providing enough skilled workers to deploy to its various projects. Any slowdown in the construction business could potentially cap growth of the Company's construction arm. Property Management Ayala Land directly manages its properties as well as other third-party properties through Ayala Property Management Corporation (APMC). Its employees directly interface with customers and must ensure that Ayala Land’s brand, quality and reputation are upheld in the regular upkeep of managed properties. Employees must continuously be trained to be able to provide high-quality service in order to preserve Ayala Land’s brand equity. Other risks that the company may be exposed to are the following: - Changes in Philippine and international interest rates - Changes in the value of the Peso versus other currencies - Changes in construction material and labor costs, power rates and other costs - Changes in laws and regulations that apply to the Philippine real estate industry - Changes in the country's political and economic conditions - Changes in the country’s liquidity and credit exposures To mitigate the above-mentioned risks, Ayala Land shall continue to adopt appropriate risk management tools as well as conservative financial and operational controls and policies to manage the various business risks it faces. Working Capital Ayala Land finances its working capital requirements through a combination of internally-generated cash, pre-selling, joint ventures agreements, borrowings and issuance of bond proceeds from the sale of non-core assets.

16
Domestic and Export Sales The table below illustrates the amounts of revenue, profitability, and identifiable assets attributable to domestic and foreign operations for the years ended December 31, 2018, 2017, 2016: (in P’000)
2018 2017 2016 Consolidated revenues
Domestic 156,142,062 139,131,909 122,873,268
Foreign 7,604,756 241,432 392,627 163,746,818 139,373,341 123,265,895 Net operating income
Domestic 52,436,826 43,071,498 38,271,169 Foreign 1,129,534 (90,142) 343,765
53,566,360 42,981,356 38,614,934 Net Income Attributable to Equity Holders of ALI
Domestic 28,283,472 25,321,099 20,509,657 Foreign 957,408 (16,134) 398,854 Total 29,240,880 25,304,965 20,908,511
Total Assets
Domestic 636,521,219 564,182,334 527,825,623 Foreign 32,299,263 9,810,000 8,607,372 Total 668,820,482 573,992,334 536,432,995

17
Item 2. Properties LAND BANK / PROPERTIES WITH MORTGAGE OF LIEN The following table provides summary information on ALI’s land bank as of December 31, 2018. Properties included are either wholly-owned or part of a joint venture and free of lien unless noted. In Estates Location Hectares Outside Estates Hectares Metro Manila 168 Metro Manila 162 Makati CBD Makati City 46 Las Pinas 89 BGC Taguig City 27 QC 25 Parklinks Quezon City - Pasig City 35 Muntinlupa 18 Arca South Taguig City 21 Manila 16 Vertis North Quezon City 16 Pasig 8 Circuit Makati Makati City 11 Paranaque 4 Cloverleaf Quezon City 7 Makati 3 Southpark District Muntinlupa City 4 Mandaluyong 1 Pasay 0.1 Luzon 5,298 Luzon 4,427 Nuvali Sta. Rosa, Laguna 1545 Cavite 1,953 Alviera Porac, Pampanga 1468 Batangas 909 Altaraza San Jose Del Monte, Bulacan 844 Laguna 665 Lio El Nido, Palawan 837 Tarlac 290 Vermosa Imus, Cavite 426 Bulacan 230 Evo City Kawit, Cavite 180 Bataan 220 Pampanga 81 Camarines Sur 29 Rizal 26 Quezon 20 Cagayan - Tuguegarao 2 Nueva Ecija 2 Visayas 851 Visayas 101 Sicogon Island Resort Iloilo 662 Cebu 71 North Point Talisay, Negros Occidental 130 Iloilo 19 Cebu Park District Cebu City, Cebu 19 Negros Occidental 11 Atria Park District Mandurriao, Iloilo 10 Gatewalk Central Mandaue, Cebu 13 Seagrove Mactan, Cebu 13 Capitol Central Talisay, Negros Occidental 4 Mindanao 172 Mindanao 445 Habini Bay Laguindingan, Misamis Oriental 134 Misamis Oriental 230 Azuela Cove Davao City, Davao del Sur 25 Davao del Sur 215 Abreeza Davao City, Davao del Sur 9 Centrio Cagayan de Oro, Misamis Oriental 3 2018 Land Bank: 11,624 6,489 5,135
LEASED PROPERTIES The Company has an existing contract with BCDA to develop, under a lease agreement a mall with an estimated gross leasable area of 152,000 square meters on a 9.8-hectare lot inside Fort Bonifacio. The lease agreement covers 25 years, renewable for another 25 years subject to reappraisal of the lot at market value. The annual fixed lease rental amounts to P106.5 million while the variable rent ranges from 5% to 20% of gross revenues. Subsequently, the Company transferred its rights and obligations granted to or imposed under the lease agreement to SSECC, a subsidiary, in exchange for equity. On January 28, 2011, a notice was given to the Company for the P4.0 billion development of a 7.4-hectare lot at the University of the Philippines’ Diliman East Campus, also known as the UP Integrated School, along Katipunan Avenue, Quezon City. The Company signed a 25-year lease contract for the

18
property last June 22, 2011, with an option to renew 58,000 square meters for another 25 years by mutual agreement. The project involves the construction of a retail establishment with 63,000 square meters of available gross leasable area and a combination of Headquarter-and-BPO- type buildings with an estimated 8,000 square meters of office space. (For the complete list of leased properties, please refer to Audited FS) Rental Properties The Company’s properties for lease are largely shopping centers, office buildings and hotels and resorts. As of December 31, 2018, rental revenues from these properties amount to 34.9 billion or 15% consolidated revenues before intercompany adjustments, 17% higher than P29.9 billion recorded in 2017. Property Acquisitions With 11,624 hectares in its land bank as of December 31, 2018, Ayala Land believes that it has sufficient properties for development in next 25 years. Nevertheless, the Company continues to seek new opportunities for additional, large-scale, master-planned developments in order to replenish its inventory and provide investors with an entry point into attractive long-term value propositions. The focus is on acquiring key sites in the Mega Manila area and other geographies with progressive economies that offer attractive potential and where projected value appreciation will be fastest. On May 15, 2018, Ayala Land, Inc. (“ALI”) entered into a Memorandum of Understanding with Green Square Properties Corporation (“GSPC”) and Green Circle Properties and Resources, Inc. (“GCPRI”) on May 11, 2018 for the formation of a Joint-Venture Company (“JVC”) that will own and develop 27,852 hectares of land (“the Properties”), specifically located in Dingalan, Aurora and General Nakar, Province of Quezon. ALI will own 51%, and GSPC and GCPRI will jointly own 49% of the JVC. On April 4, 2018, Ayala Land, Inc. (ALI) signed a Deed of Absolute Sale with Central Azucarera de Tarlac, Inc. for the acquisition of several parcels of land with an aggregate area of approximately 290 hectares located in Barangay Central, City of Tarlac, Province of Tarlac. On February 20, 2018, the Philippine Competition Commission (PCC) approved the setting up of a joint venture between the Company and Royal Asia Land, Inc. to acquire, own, and develop a 936-hectare commercial and residential project in Silang and Carmona, Cavite. Both firms will own 50% equity in the joint venture vehicle while Royal Asia Land will receive a consultation fee of 2% of the joint venture firm's gross revenue for its participation in the planning and development of the property. ALI, meanwhile, will develop and market the project and receive a management fee of 12% and sales and marketing fee of 5% of the gross revenue. The PCC has deemed that the transaction does not result in a substantial lessening of competition because it will not have a structural effect on the market. In June 2015, ALI, through SM-ALI Group consortium, participated and won in the bidding for Lot No. 8-B-1, containing an area of 263,384 sqm, which is a portion of Cebu City-owned lot located at the South Road Properties, Cebu City covered by Transfer Certificate of Title No. 107-2011000963 (the “Property”). SM-ALI Group consortium is a consortium among SM Prime Holdings, Inc. (“SM”), Ayala Land, and Cebu Holdings, Inc. (“CHI”, together with ALI collectively referred to as the “ALI Group”). The SM-ALI Group will co-develop the property pursuant to a joint master plan. In April 2015, ALI purchased all of the 8.2 million common shares of Aegis PeopleSupport Realty Corporation amounting to P435 million. Aegis PeopleSupport Realty Corporation is a PEZA-registered entity and the owner of Aegis building along Villa Street, Cebu IT Park, Lahug, Cebu City. The building is

19
a certified LEED-Gold Office with a gross leasable area of 18,092 sqm and is largely occupied by Teleperformance under a long-term lease. On February 6, 2015, ALI purchased the combined remaining interest of Allante Realty and Development Corporation (Allante) and DBH, Inc. (DBH) in North Triangle Depot Commercial Corporation (NTDCC) consisting of 167,548 common shares and 703,904 preferred shares amounting to P229 million. This brings ALIC) consisting of 167,548 common shares and 703,904 total outstanding capital stock of NTDCC. In January 2014, ALI entered and signed into a 50-50% joint venture agreement with AboitizLand, Inc. for the development of a 15-hectare mixed-use community in Mandaue City, Cebu. The first project of this joint venture will involve the construction of a mall and a residential condominium unit with an estimated initial cost of P3 billion. On November 23, 2013, ALI, through its wholly-owned subsidiary, Ayala Hotels and Resorts Corp, (AHRC) signed an agreement to acquire 100% interest in Asian Conservation Company, Inc. (ACCI) which effectively consolidates the remaining 40% interest in Ten Knots Development Corp. (TKDC) and Ten Knots Philippines Inc. (TKPI) (60%-owned subsidiary of the Company prior to this acquisition). The agreement resulted in the Company effectively obtaining 100% interest in TKPI and TKDC. On April 16, 2013, ALI entered into a Sale and Purchase Agreement (SPA) with Global International Technologies Inc. (GITI) to acquire the latter’s 32% interest in ALI Property Partners Co. (APPCo) for P3.52 billion. GITI is a 100% owned company of the Goldman Sachs Group Inc. The acquisition increased ALI’s stake in APPCo from 68% to 100%. APPCo owns BPO buildings in Makati, Quezon City and Laguna with a total gross leasable area of around 230,000 sqm. The carrying amount of the non-controlling interest is reduced to nil as APPCo became wholly owned by the Company. The difference between the fair value of the consideration paid and the amount by which the non-controlling interest is adjusted is recognized in equity attributable to the Company amounting to P2,722.6 million. MORTGAGE, LIEN OR ENCUMBRANCE OVER PROPERTIES The Company has certain properties in Makati City that are mortgaged with BPI in compliance with BSP rules on directors, officers, stockholders and related interests. Item 3. Legal Proceedings As of December 31, 2018, ALI, its subsidiaries, and its affiliates, are not involved in any litigation regarding an event which occurred during the past five (5) years that they consider material. However, there are certain litigation ALI is involved in which it considers material, and though the events giving rise to the said litigation occurred beyond the five (5) year period, the same are still unresolved, as follows: Las Piñas Property
Certain individuals and entities have claimed an interest in ALI’s properties located in Las Piñas, Metro Manila, which are adjacent to its development in Ayala Southvale.
Prior to purchasing the aforesaid properties, ALI conducted an investigation of titles to the properties and had no notice of any title or claim that was superior to the titles purchased by ALI. ALI traced its titles to their original certificates of title and ALI believes that it has established its superior ownership position over said parcels of land. ALI has assessed these adverse claims and believes that its titles are in general superior to the purported titles or other evidence of alleged ownership of these claimants. On this basis, beginning October 1993, ALI filed petitions in the Regional Trial Court of Makati and Las Piñas for quieting of title to nullify the purported titles or claims of these adverse claimants. These cases are at

20
various stages of trial and appeal. Some of these cases have been decided by the Supreme Court. These include decisions affirming the title of ALI to some of these properties, which have been developed and offered for sale to the public as Sonera, Ayala Southvale. The remaining pending cases involve the remaining area of approximately 126 hectares.
Ayala Property Management Corp.(APMC)
As a result of the explosion which occurred on October 19, 2007 at the basement of the Makati Supermarket Building, the Philippine National Police has filed a complaint with the Department of Justice (“DOJ”) and recommended the prosecution of certain officers/employees of Makati Supermarket Corporation, the owner of the building, as well as some employees of ALI’s subsidiary, APMC, among other individuals, for criminal negligence. In a Joint Resolution dated April 23, 2008, the DOJ special panel of prosecutors ruled that there was no probable cause to prosecute the APMC employees for criminal negligence. This was affirmed by the DOJ Secretary in a Resolution dated November 17, 2008. A Motion for Reconsideration was filed by the Philippine National Police which remains pending with the DOJ. To date, no civil case has been filed by any of the victims of the incident.
ALI has made no allowance in respect of such actual or threatened litigation expenses. Item 4. Submission of Matters to a Vote of Security Holders Except for the matters taken up during the Annual Meeting of Stockholders, there was no other matter submitted to a vote of security holders during the period covered by this report.

21
PART II – SECURITIES OF THE REGISTRANT Item 5. Market for Issuer’s Common Equity and Related Stockholders Matters Market Information Ayala Land common shares are listed with the Philippine Stock Exchange. Philippine Stock Exchange Prices (in PhP/share)
High Low Close 2018 2017 2018 2017 2018 2017 First Quarter 47.50 37.95 39.75 31.25 41.10 33.05 Second Quarter 43.35 42.40 36.05 33.15 37.90 39.75 Third Quarter 45.00 46.10 36.55 39.10 40.05 43.50 Fourth Quarter 43.20 46.00 38.00 41.00 40.60 44.60
The market capitalization of ALI as of end-2018, based on the closing price of P40.60/share, was approximately P598.2 billion .
The price information as of the close of the latest practicable trading date April 11, 2019 is P46.70 per share. Stockholders The following are the top 20 registered holders of the common equity securities of the Company:
Common Stockholders: There are 9,095 registered holders of common shares of the Company as of January 31, 2019:
Stockholder Name No. of Common Shares Percentage (of common shares)
1. Ayala Corporation* 6,891,880,451 46.773% 2. PCD Nominee Corporation (Non-Filipino) 5,510,752,668 37.399% 3. PCD Nominee Corporation (Filipino) 2,044,618,116 13.876% 4. ESOWN Administrator 2009 16,480,097 0.112% 5. ESOWN Administrator 2012 14,629,575 0.099% 6. ESOWN Administrator 2015 13,169,178 0.089% 7. ESOWN Administrator 2010 13,158,784 0.089% 8. ESOWN Administrator 2016 12,363,048 0.084%
9. ESOWN Administrator 2013 11,361,655 0.077% 10. ESOWN Administrator 2011 10,279,971 0.070% 11. ESOWN Administrator 2017 10,238,821 0.069% 12. ESOWN Administrator 2014 9,989,115 0.068% 13. ESOWN Administrator 2018 8,316,310 0.056% 14. Emilio Lolito J. Tumbocon 7,340,134 0.050% 15. Estrellita B. Yulo 5,732,823 0.039% 16. Jose Luis Gerardo Yulo 5,326,367 0.036% 17. Ma. Angela Y. La’o 3,728,620 0.025% 18. Lucio W. Yan 3,483,871 0.024% 19. Telengtan Brothers and Sons, Inc. 3,480,000 0.024% 20. Ma. Lourdes G. Latonio 3,124,650 0.021%
*245,155 shares held by Ayala Corporation (or 0.0017% of the outstanding common shares) are lodged with PCD Nominee Corporation.

22
Voting Preferred Stockholders: There are approximately 2,844 registered holders of voting preferred shares of the Company as of January 31, 2019.
Stockholder Name No. of Voting Preferred Shares
Percentage (of voting preferred
shares) 1. Ayala Corporation 12,163,180,640 93.08679% 2. HSBC Manila OBO A/C 000-171512-554 512,777,000 3.92437% 3. Government Service Insurance System 156,350,871 1.19658% 4. HSBC Manila OBO A/C 000-171512-571 15,051,000 0.11519% 5. DB MLA OBO SSBTC Fund HG16 15,000,000 0.11480% 6. Wealth Securities, Inc. 14,825,373 0.11346% 7. Deutsche Bank AG Manila OBO SSBTC Fund
OD67 AC 12087020417 13,670,744 0.10462%
8. Samuel Villes Santos and/or Luzviminda Lat Santos
12,001,800 0.09185%
9. DB MLA OBO SSBTC Fund C021 8,497,223 0.06503% 10. Investors Securities, Inc. 6,251,770 0.04785% 11. First Metro Securities Brokerage Corp. 5,103,853 0.03906% 12. Deutsche Regis Partners Inc. 3,961,757 0.03032% 13. DB MLA OBO SSBTC Fund FA20 3,951,800 0.03024% 14. Papa Securities Corporation 3,536,538 0.02707% 15. DB MLA OBO SSBTC Fund FA2N 3,534,608 0.02705% 16. Ansaldo, Godinez & Co. Inc. 3,388,848 0.02594% 17. HSBC Manila OBO A/C 000-171512-551 2,940,048 0.02250% 18. Belson Securities, Inc. 2,800,874 0.02144% 19. CBNA FAO 6002079572 CITIMNFOR c/o
Carmelynna C. Malabanan 2,725,700 0.02086%
20. Maybank ATR Kim Eng Securities, Inc. 2,666,714 0.02041% Dividends STOCK DIVIDEND (Per Share)
PERCENT DECLARATION DATE RECORD DATE PAYMENT DATE
20% February 1, 2007 May 22, 2007 June 18, 2007
CASH DIVIDEND (Per Common Share)
PESO AMOUNT DECLARATION DATE RECORD DATE PAYMENT DATE
0.2380 Feb. 26, 2016 March 11, 2016 March 23, 2016
0.2380 Aug. 18, 2016 Sept. 02, 2016 Sept. 16, 2016 0.2400 Feb. 20, 2017 Mar. 06, 2017 Mar. 22, 2017
0.2400 Aug. 18, 2017 Sept. 05, 2017 Sept. 15, 2017 0.2520 Feb. 20, 2018 Mar. 12, 2018 April 3, 2018 0.2520 Aug. 17, 2018 Sep. 6, 2018 Oct. 2, 2018 0.2600 Feb. 27, 2019 Mar. 13, 2019 March 29, 2019
CASH DIVIDEND (Per Voting Preferred Share)
PESO AMOUNT DECLARATION DATE RECORD DATE PAYMENT DATE
0.00474786 Feb. 26, 2016 June 15, 2016 June 29, 2016
0.00474786 Feb. 20, 2017 June 15, 2017 June 29, 2017 0.00474786 Feb. 20, 2018 June 15, 2018 June 29, 2018

23
Dividend policy Dividends declared by the Company on its shares of stocks are payable in cash or in additional shares of stock. The payment of dividends in the future will depend upon the earnings, cash flow and financial condition of the Company and other factors. Special cash dividends are declared depending on the availability of cash, taking into account the Company’s CAPEX and project requirements and the progress of its ongoing asset rationalization program. Cash dividends are subject to approval by the Company's Board but no stockholder approval is required. Property dividends which may come in the form of additional shares of stock are subject to approval by both the Company's Board of Directors and the Company's stockholders. In addition, the payment of stock dividends is likewise subject to the approval of the SEC and PSE.
Recent Sale of Securities For the past three years, common shares were issued representing the exercise of stock options by the Company’s executives under the Executive Stock Option Plan (ESOP) and the subscription to the common shares under the Executive Stock Ownership Plan (ESOWN) as follows:
Year No. of Shares ESOP* ESOWN (exercised) (subscribed)
2017 - 12.3 Million 2018 - 9.9 Million
*not offered starting 2015 The aforesaid issuance of shares was covered by the Commission’s approval of the Company’s Stock Option Plan on July 1991 and subsequently on March 2006. On March 12, 2013, Ayala Corporation executed the placement of, and subscription to the Company’s 399,528,229 common shares at P30.50 per share or an aggregate of P12.2 billion. The placement price of P30.50 per share was at a 3.6% discount on the 5-day volume-weighted average price of the Company’s stock and was the agreed clearing price among the purchasers of the shares and the placement agent, UBS Investment Bank. On January 12, 2015, Ayala Corporation executed the placement of, and subscription to the Company’s 484,848,500 common shares at P33.00 per share or an aggregate of P16 billion. The placement price of P33.00 per share was at a 3.9% discount on the 5-day volume-weighted average price of the Company’s stock and was the agreed clearing price among the purchasers of the shares and the placement agent, UBS AG. The Company filed Notices of Exemption with the SEC for the issuance of the 399,528,229 and 484,848,500 common shares under the following provisions of the SRC: SRC Subsection 10.1 (e), The sale of capital stock of a corporation to its own stockholders exclusively, where no commission or other remuneration is paid or given directly or indirectly in connection with the sale of such capital stock.

24
SRC Subsection 10.1 (h), “Broker’s transaction, executed upon customer’s orders, on any registered Exchange or other trading market.” SRC Subsection 10.1 (k), “The sale of securities by an issuer to fewer than twenty (20) persons in the Philippines during any twelve-month period.” SRC Subsection 10.1 (l), “The sale of securities to banks, insurance companies, and investment companies.” Corporate Governance i. The evaluation system which was established to measure or determine the level of compliance of
the Board and top-level management with its Revised Manual of Corporate Governance consists of a Customer Satisfaction Survey which is filled up by the various functional groups indicating the compliance rating of certain institutional units and their activities. The evaluation process also includes a Board Performance Assessment which is accomplished by the Board indicating the compliance ratings. The above are submitted to the Compliance Officer who issues the Annual Corporate Governance Report to the Securities and Exchange Commission.
ii. To ensure good governance, the Board establishes the vision, strategic objectives, key policies, and
procedures for the management of the Company, as well as the mechanism for monitoring and evaluating Management’s performance. The Board also ensures the presence and adequacy of internal control mechanisms for good governance.
iii. There were no deviations from the Company’s Revised Manual of Corporate Governance. The
Company has adopted in the Manual of Corporate Governance the leading practices and principles of good corporate governance, and full compliance therewith has been made since the adoption of the Revised Manual.
iv. The Company is taking further steps to enhance adherence to principles and practices of good
corporate governance.

25
PART III – FINANCIAL INFORMATION Item 6. Management’s Discussion and Analysis of Financial Condition and Results of Operation Review of 2018 operations vs 2017
2018 was another year of robust growth for Ayala Land, Inc. (ALI or “the Company”), posting total revenues of P166.25 billion and net income of P29.24 billion, for a solid top line and bottomline growth of 17% and 16%, respectively. The strong performance of property development and commercial leasing, supported by the full consolidation of Malaysia-based subsidiary MCT Bhd, boosted revenues from Real Estate by 17% to P155.96 billion. Earnings before interest and taxes (EBIT) margin improved by a quarter percentage point, to 30.37% from 30.11% in 2017. BUSINESS SEGMENTS Property Development. This segment includes the sale of residential lots and units, office spaces, commercial and industrial lots, and the operations of MCT Bhd. Total revenues from Property Development grew by 18%, to P113.36 billion from P96.39 billion previous year.
Residential. Driven by new bookings and project completions, revenues from the sale of Ayala Land residential lots and units and from MCT Bhd’s operations reached P94.63 billion, an 18% growth from previous year’s P79.90 billion.
Revenues generated by AyalaLand Premier (ALP) rose by 6% to P28.00 billion from P26.50 billion previous year, due to bookings from The Courtyards in Vermosa, Cavite and The Alcoves in Cebu Business Park and higher completion of The Suites at the Bonifacio Global City, Taguig, Metro Manila. Alveo posted slightly higher revenues at P26.29 billion from previous year’s P26.17 billion. The increase is attributed to bookings from Orean Place Tower 1 at Vertis North, Quezon City, Metro Manila and Travertine Tower at Portico, Pasig City, Metro Manila, and higher completion at The Residences at Evo City in Kawit, Cavite. Bookings from Avida Towers Sola Tower 2 at Vertis North; Altura Tower 2 at South Park District, Muntinlupa City, Metro Manila; Asten Tower 3 at Makati City; and higher completion of Sola Tower 1 at Vertis North fueled Avida’s 16% revenue growth to P24.22 billion from previous year’s P20.84 billion. Amaia posted a 20% improvement in revenues, to P7.36 billion from P5.74 billion, as a result of bookings and higher completion from Amaia Skies Shaw Tower 1 in Mandaluyong City, Metro Manila; Amaia Skies Cubao Tower 2 in Quezon City; Amaia Scapes General Trias in Cavite; and Amaia Steps Nuvali, Laguna. Meanwhile, bookings from BellaVita’s projects in Pililia, Rizal; Cabanatuan East, Nueva Ecija; and Iloilo almost doubled its revenues to P1.15 billion from P652 million previous year. Overall, the average GP (gross profit) of Ayala Land’s vertical projects improved to 34% from 30% due to higher margins from Alveo’s High Park Tower 2, Orean Place Tower 1 and Avida’s Sola Tower 2 in Vertis North and Avida’s project in Southpark District, Altura Tower 2. On the other hand, the average GP of horizontal projects decreased to 44% from 47% due to the lower contribution of higher margin projects.

26
MCT Bhd recognized revenues of P7.60 billion from sales and completion progress of its projects in Cybersouth, an integrated development in Southern Klang Valley, and Lakefront, a residential project in Cyberjaya.
Office for Sale. Higher bookings from One Vertis Plaza in Vertis North and The Stiles East Enterprise Plaza in Circuit Makati and higher completion progress of Park Triangle Corporate Plaza in BGC and the Alveo Financial Tower in Makati CBD hiked revenues from the sale of office spaces by 16%, to P11.00 billion from P9.45 billion previous year. However, the lack of higher margin inventory resulted in a lower GP margin of 33% from 37% the previous year. Commercial and Industrial Lots. Revenues from the sale of commercial and industrial lots grew by 10% to P7.73 billion from P7.04 billion, driven by commercial lot sales in the Vis-Min estates and in Evo City, Cavite, and industrial lot sales in Alviera, Pampanga and in the Cavite Technopark. The sale of commercial lots in Arca South, Alviera, Evo City and Lio and of industrial lots in Alviera and Cavite Technopark moved the GP margin of this segment upwards to 50% from previous year’s 40%.
Strong demand from both local and overseas Filipinos fueled a full-year 16% increase in sales reservations, reaching P141.9 billion from previous year’s P121.96 billion. In the fourth quarter alone, reservation sales grew by 21% to PHP 33.8 billion. On the other hand, net booked sales reached P110.8 billion, a 14% increase from previous year’s P96.9 billion, with the fourth quarter number growing by 9% to P32.7 billion. In 2018, Ayala Land launched P139.4-billion worth of residential and office-for-sale projects. Commercial Leasing. This segment covers the operation of shopping centers, office buildings, and hotels and resorts. Total revenues from commercial leasing amounted to P34.91 billion, 17% higher than P29.94 billion posted a year ago.
Shopping Centers. The contribution of Greenbelt and Glorietta in Makati City and the improved performance of newly opened malls in Quezon City, such as UP Town Center, Ayala Malls Cloverleaf and Vertis North, and in Pasig City, namely Ayala Malls Feliz and The 30th boosted the segment’s revenues by 13% to P19.91 billion from P17.66 billion. EBITDA (Earnings Before Interest, Taxes, Depreciation and Amortization) margin was maintained at 66%. The average monthly lease rate was at P1,073 per sq. meter, while same mall rental grew by 6%. The average occupancy rate for all malls was 89%, while the occupancy rate of stable malls was higher at 95%. The Company opened three new malls in 2018—Circuit Mall in Makati with 52,000 sq. meters of gross leasable area (GLA), Capitol Central Mall in Bacolod with 67,000 sq. meters, and One Bonifacio High Street in Taguig with 23,000 sq. meters—bringing the shopping centers’ year-end GLA to 1.90 million sq. meters. Offices. Revenues from office leasing rose by 29% to P8.61 billion from P6.66 billion due to the stabilized occupancy of new offices such as Vertis Corporate Center in Quezon City, Circuit Corporate Center in Makati City, and The 30th Corporate Center in Pasig City. Office leasing EBITDA margin was sustained at 91%. The monthly lease rate for offices averaged P755 per sq. meter. The average occupancy rate for all offices was 91%, while the occupancy rate of stable offices was 96%. The Company completed four new offices in 2018—Bacolod Capitol Corporate Center with 11,000-sq. meters GLA, Vertis North Corporate Center 3 with 38,000 sq. meters, Ayala North Exchange HQ Tower with 20,000 sq. meters and another 22,000 sq. meters in its BPO Tower—bringing the offices’ year-end GLA to 1.11 million sq. meters.

27
Hotels and Resorts. Full-year operations of Seda Vertis North, Seda Capitol Central Bacolod and the recently renovated Apulit Island Resort in El Nido, Palawan coupled with the improved performance of our B&B’s nudged revenues from our hotels and resorts higher by 14%, to reach P6.39 billion from previous year’s P5.62 billion. Average revenue-per-available-room (REVPAR) of all hotels and resorts slightly decreased by 1% to P3,531 and P7,989 a night, respectively. Meanwhile, REVPAR of stable hotels increased by 6% to P4,369 a night; that of stable resorts increased by 12% to P10,896. EBITDA margin of this segment improved to 29% from 28% previous year. The average room rate a night of all hotels was P5,020, while that of stable hotels was PHP 5,593. Meanwhile, the average room rate a night of all resorts was P12,593, while that of stable resorts was P17,035. The average occupancy rates of all hotels and resorts were at 70% and 63%, respectively, while those of stable hotels and stable resorts were at 78% and 64%, respectively. A total of 390 rooms were added to the portfolio—Seda Capitol Central, 108; Seda Lio, 118; Circuit Residences, 80; Lio Dormitel, 42; Huni Sicogon, 19; Drift Hostel Sicogon, 16; and Sicogon Dormitel, 7—bringing the total number of rooms in operation to 2,973 by end-2018. The hotels and resorts business operates 660 hotel rooms under its international brand segment—312 for Fairmont Hotel and Raffles Residences, and 348 for Holiday Inn & Suites, both locked in Ayala Center, Makati CBD. Our homegrown Seda Hotels operates 1,828 rooms—Atria, Iloilo, 152; BGC, Taguig, 179; Centrio, Cagayan de Oro, 150; Abreeza, Davao, 186; Nuvali, Santa Rosa, Laguna, 150; Vertis North, Quezon City, 438; Capitol Central, Bacolod, 154; Lio, Palawan, 118; and Ayala Center Cebu, 301. El Nido Resorts operates 193 rooms in its four island resorts (Pangulasian, Lagen, Miniloc and Apulit), and Lio Tourism Estate currently has 144 rooms under its Bed and Breakfast (B&B) category and Dormitel offerings. Lastly, the Sicogon Tourism Estate in Iloilo currently operates 68 B&B rooms.
Services. This segment is composed of the Company’s construction business through Makati Development Corporation (MDC); property management, through Ayala Property Management Corporation (APMC), power services, through Direct Power Services, Inc. (DPSI), Ecozone Power Management, Inc. (EPMI), and Philippine Integrated Energy Solutions, Inc. (PhilEnergy); and airline services firm AirSWIFT, for the hotels and resorts business. Total revenues of this segment rose by 5% to P76.72 billion from P72.81 billion previous year.
Construction. The increased order book of projects from the Ayala Land group resulted in a corresponding increase in construction revenues, reaching P71.42 billion, 6% more than previous year’s P67.40 billion. Property Management and Others. APMC, the power services companies, and AirSWIFT together posted revenues of P5.30 billion, a slight 2% decrease from the year-ago figure of P5.41 billion due to decreasing external retail electricity supply contracts.
Blended EBITDA margins of the Services business slightly declined to 9% from 10%. Equity in Net Earnings of Investees, Interest, Interest on Real Estate Sales, Fees, Investment, and Other Income The full consolidation of MCT Bhd into Ayala Land resulted in a 13% decrease in equity in net earnings of associates and JVs, to P750 million from previous year’s P866 million. Meanwhile, interest, interest from real estate sales and investment income increased by 31% to P8.00 billion from P6.09 billion previous year due to higher interest income from money market placements and accretion on installment sales. Other income reached P1.54 billion, 31% lower year-on-year.

28
Project and Capital Expenditures Ayala Land spent P110.1 billion in capital expenditures to support the aggressive completion of new projects, 41% of which was spent on residential projects; 23% on commercial projects; 15%, land acquisition; 12%, development of estates; and 9%, on investments. Financial Condition Ayala Land’s balance sheet solidly positions the Company to pursue its growth plans. Cash and cash equivalents, including short-term investments and UITF investments classified as FVPL, stood at P27.56 billion, resulting in a current ratio of 1.26:1. Total borrowings amounted to P187.10 billion, translating to a debt-to-equity ratio of 0.85:1 and a net debt-to-equity ratio of 0.72:1. Return on equity as of December 31, 2018 was at 16.5%.
End-December 2018 End-December 2017 Current ratio 1 1.26:1 1.30:1 Debt-to-equity ratio 2 0.85:1 0.91:1 Net debt-to-equity ratio 3 0.72:1 0.77:1 Profitability Ratios: Return on assets 4 5.35% 5.07% Return on equity 5 16.52% 16.09% Asset to Equity ratio 6 3.04:1 2.99:1 Interest Rate Coverage Ratio 7 6.1 6.0
1 Current assets / current liabilities 2 Total debt/ consolidated stockholders’ equity (Total debt includes short-term debt, long-term debt and current portion of long-term debt) 3 Net debt/ consolidated stockholders’ equity (Net debt is total debt less cash and cash equivalents, short term investments and financial assets through fvpl) 4 Total Net income / average total assets 5 Net income attributable to equity holders of ALI / average total stockholders’ equity attributable to equity holders of ALI 6 Total Assets /Total stockholders’ equity 7 EBITDA/Interest expense There are no events that will trigger direct or contingent financial obligation that is material to the company, including any default or acceleration of an obligation. There are no material off-balance sheet transactions, arrangements, obligations (including contingent obligations), and other relationships of the company with unconsolidated entities or other persons created in 2017. Causes for any material changes (+/- 5% or more) in the financial statements Real estate revenues increased by 17% due to the consistent growth of property development and commercial leasing. Property development grew by 18% driven by new bookings and project completions from residential projects and sales of office spaces, commercial and industrial lots. Commercial leasing was higher by 17% coming from improved performance of newly opened malls. Interest income from real estate sales and interest & investment income higher by 31% mainly due to higher rate in 2018 from short-term investments. Equity in net earnings of associates and joint ventures went down by 13% primarily due to the consolidation of ALI’s investment in MCT Bhd in 2018 from equity pickup treatment in 2017.

29
Other Income lower by 31% mainly due to the impact of the reversal of Comtrust impairment in 2017. Real estate costs increased by 15% primarily driven by higher sales and incremental project completions from residential and leasing businesses. General and administrative expenses higher by 25% due to the consolidation of ALI’s investment in MCT Bhd in 2018. Interest and other financing charges and other charges grew by 19% due to the increase in interest expense on banks as a result of higher average loan balance and bank rate in 2018. Provision for income tax increased by 22% due to higher taxable income driven by higher real estate revenues. Non-controlling interests higher by 39% as a result of the consolidation of ALI’s investment in MCT Bhd in 2018. Balance Sheet items – December 2018 versus December 2017 Cash and cash equivalents up by 14% primarily due to the consolidation of ALI’s investment in MCT Bhd in 2018. Short-term investments went down by 35% mainly coming from matured money market placements of Ayala Hotels Inc., BG West Properties, Inc., and Roxas Land Corp. Financial assets at fair value through profit or loss lower by 12% due to the maturity of some investments in ARCH Capital Funds. Real estate Inventories higher by 15% primarily due to the impact of PIC Q&A No. 2018-11 on the classification of land by real estate developer. Other current assets lower by 8% mainly due to the decrease in input VAT, partly offset by increase in CWT mostly from residential projects. Non-current accounts and notes receivable went down by 92% due to reclass to Contract asset, impact of the PFRS 15 Revenue from Contracts with Customers implementation in 2018. Investments in associates and joint ventures lower by 13% driven by the consolidation of ALI’s investment in MCT Bhd in 2018 from equity pickup treatment in 2017. Investment properties up by 12% primarily due to the impact of PIC Q&A No. 2018-11 on the classification of land by real estate developer. Property and equipment increased by 25% mainly coming from inclusion of ALI’s investment in MCT Bhd in 2018. Deferred tax assets higher by 22% due to additional DTA from PAS Straight-line recognition of revenue (Accounting Standard vs BIR) of leasing group. Other noncurrent assets grew by 36% due to the increase in bookings of pre-operating expenses, deferred input VAT and deferred charges. Account and other payables up by 25% mostly due to the consolidation of ALI’s investment in MCT Bhd in 2018.

30
Short-term debt dropped by 18% due to conversion to long term debt from short term debt. Income tax payable up by 165% due to higher taxable income primarily from real estate revenues. Current portion of long-term debt increased by 254% due to incremental debt (bonds and loans) of Ayala Land Inc., Amorsedia Development Corp., and Alveo Land Corp., and inclusion of ALI’s investment in MCT Bhd in 2018. Deposit and other current liabilities declined by 69% due to the decrease in customers' deposits from real estate customers who reached the 10% threshold for sales bookings. Deferred tax liabilities higher by 66% primarily coming from the recognition of deferred tax liability for the uncollected receivables from residential development. Total Equity attributable to equity holders of Ayala Land, Inc. grew by 12% due to the increase in equity reserve as a result of the consolidation of ALI’s investment in MCT Bhd in 2018. Non-controlling interests up by 29% largely due to NIAT share of subsidiaries and consolidation of ALI’s investment in MCT Bhd in 2018. Review of 2017 operations vs 2016 Ayala Land, Inc. (ALI or “the Company”) posted a net income of P25.30 billion, a solid earnings growth of 21% in 2017. The Company sustained a healthy topline with P142.30 billion in total consolidated revenues, 14% higher than 2016. Real Estate revenues likewise increased 13% to P133.1 billion, driven by the resurgence of property sales and the strong growth of its leasing business. Meanwhile, earnings before interest and taxes (EBIT) margin registered at 30.1% compared to 29.7% last year. Business Segments The details of the individual performance of each business segment are discussed as follows: Property Development. This includes the sale of residential lots and units, office spaces, as well as commercial and industrial lots. Total revenues from Property Development amounted to P96.39 billion, 24% higher than P77.73 billion last year. Residential. Revenues from the sale of residential lots and units reached P79.90 billion, 25% higher than P64.08 billion last year, driven by bookings and project completion across all residential brands.
Ayala Land Premier (ALP) registered revenues of P26.50 billion, 7% higher than P24.86 billion last year given higher completion from its subdivision projects such as Cerilo in Nuvali and The Courtyards Phase 2 in Vermosa and its condominium projects such as Park Central North in Makati and Arbor Lanes 3 in Arca South.
Alveo meanwhile recorded revenues of P26.17 billion, a robust gain of 45% from P18.03 billion last year due to higher completion of its subdivision projects such as Ardia in Vermosa, Cavite and Montala in Alviera, Porac Pampanga and its condominium projects such as High Park Tower 2 in Vertis North, Quezon City, Verve Residences 2 and Veranda Phase 2.
Avida posted revenues of P20.83 billion, a strong growth of 22% from P17.07 billion last year on the account of combined higher bookings and incremental completion of its condominium projects such as Avida Towers Turf 1, The Montane and Avida Tower Verte in Bonifacio Global City, Avida Tower Sola 1 in Vertis North, Avida Towers Riala 3 in Cebu City, and Avida Towers One Union Place 1 and 2 in Arca

31
South and its subdivision projects such as Hillcrest Estates, Woodhill Settings, and Southfield Settings in Nuvali.
Amaia generated revenues of P5.74 billion, a significant increase of 72% from P3.35 billion last year as a result of higher bookings and completion Skies Towers in Avenida, Shaw, Sta. Mesa and Cubao and Steps projects in Bicutan, Sucat, Nuvali Parkway and Capitol Central in Bacolod City. BellaVita meanwhile reached revenues of P652 million, 16% lower than P776 million last year.
The average gross profit margin of horizontal projects improved to 47% from 43% due to the higher contribution of The Courtyards and Ardia in Vermosa, Riomonte in Nuvali and Montala in Alviera while the average gross profit margin of vertical developments declined to 30% from 35% in recognition of higher project costs.
Office for Sale. Revenues from the sale of office spaces reached P9.45 billion, 15% higher than P8.20 billion last year driven by higher completion of Alveo’s High Street South Corporate Plaza 2, Alveo Financial Tower in Makati CBD, and Avida’s Capital House in BGC. Gross profit margin of offices for sale was maintained at 37%. Commercial and Industrial Lots. Revenues from the sale of commercial and industrial lots reached P7.04 billion, 29% higher than P5.45 billion last year due to higher lot sales in Arca South, Taguig, Vermosa, Cavite and industrial lots in Cavite. Gross profit margin slightly declined to 40% from 41% due to the mix of projects sold.
A resurgence of property sales was seen in 2017 as reservation sales increased 13% to P121.96 billion from P108.05 billion in 2016 which only posted an annual growth of 3%. Total reservation sales in 2017 translated to an average of P10.2 billion in monthly sales. Net booked sales grew 16% to P96.86 billion from P83.33 billion in the previous year. In the fourth quarter of 2017, property sales also notably increased, sales take-up grew 17% to P27.78 billion and net booked sales grew 18% to P29.92 billion. Commercial Leasing. This includes the Company’s Shopping Centers and Office Leasing as well as Hotels and Resorts operations. Total revenues from commercial leasing amounted to P29.94 billion, 7% higher than P28.07 billion last year. Shopping Centers. Revenues from shopping centers reached P17.66 billion. 10% higher than P16.08 billion last year due to the improved performance of the new malls such as The 30th, Tutuban Center and UP Town Center.
Shopping Centers EBITDA margin slightly decreased to 66% from 67% due to early-stage operations of newly opened malls.
The average monthly lease rate registered at P1,087 per square meter while same mall rental growth is at 5%. The average occupancy rate for all malls is at 92% while the occupancy rate of stable malls is at 97%. The Company opened 5 new malls in 2017, namely, The 30th in Pasig, Ayala Malls Vertis North and Ayala Malls Cloverleaf in Quezon City, Ayala Malls Marikina and Ayala Malls Feliz, Marikina. This brings the total gross leasable area (GLA) of Shopping Centers to 1.80 million square meters at the end of 2017.
Offices. Revenues from office leasing reached P6.66 billion, 12% higher than P5.94 billion last year due to the stabilized occupancy of the new offices namely, UP Town Center BPO, Cebu eBloc 4 and ATC BPO.
Office leasing EBITDA margin was maintained at 91% given the stabilized occupancy of new offices.

32
The average monthly lease rate registered at P739 per square meter. The average occupancy rate for all offices is at 86% while the occupancy rate of stable offices is at 97%. The Company completed 6 new offices in 2017, namely, Circuit BPO Tower 1 and 2 in Makati, The 30th Corporate Center in Pasig, One Bonifacio High Street in BGC, Tech Tower Cebu and Vertis North BPO 2 in Quezon City. This brings the total gross leasable area (GLA) of Office Leasing to 1.02 million square meters at the end of 2017. Hotels and Resorts. Revenues from hotels and resorts reached P6.64 billion, 10% higher than P6.05 billion last year, due to the higher occupancy and average room rate of El Nido resorts and the opening of Seda Vertis North. Revenue-per-available-room (REVPAR) of hotels decreased by 6% to P3,576 per night mainly due to the lower occupancy of its internationally-branded hotels in Makati. Meanwhile, the REVPAR of resorts barely declined, settling at P8,052 per night. (2017 revenues of Hotels and Resorts restated to P5.62 billion to carve-out AirSWIFT’s revenues of P1.02 billion) Hotels and resorts EBITDA margin was maintained at 28% given its sustained performance from last year.
The average room rate per night of hotels and resorts is P5,050 and P13,210 respectively. The occupancy of hotels registered at an average of 71% while the occupancy of resorts registered at an average of 61%.
The hotels and resorts segment operates 961 hotel rooms from its internationally branded segment; Cebu City Marriott, Fairmont Hotel and Raffles Residences Makati and Holliday Inn & Suites Makati, 1,301 rooms from Seda Hotels located in Atria in Iloilo, BGC in Taguig, Centrio in Cagayan de Oro, Abreeza in Davao, Nuvali in Santa Rosa Laguna, Vertis North in Quezon City and Seda Bacolod, 213 island resort rooms at El Nido Resorts in Lagen, Miniloc, Apulit and Pangulasian Islands and 82 rooms at Lio Tourism Estate, both in Palawan and 26 rooms at Sicogon Island Resort in Iloilo. In 2017, The Company opened Seda Vertis North, initial rooms in Seda Bacolod, additional rooms in Casa Kalaw, Balai Adlao and Hotel Covo in Lio, Palawan and additional rooms in Balay Kogon, Sicogon. This brings the total number of rooms to 2,583 at the end of 2017.
Services. This includes the Company’s wholly-owned construction and property management companies; Makati Development Corporation and Ayala Property Management Corporation. Total revenues from the services segment amounted to P71.80 billion, 5% higher than P68.49 billion last year. Construction. Revenues reached P67.40 billion, 3% higher than P65.32 billion due to increased order book and higher completion of projects within the Ayala Land group. Property Management. Revenues from property management registered at P4.39 billion, 38% higher than P3.17 billion in the previous year due to more managed properties from completed projects. Blended EBITDA margins of the services segment registered at 10%, a slight decline from 11% in the previous year due to project mix. Equity in Net Earnings of Investees, Interest, Interest on Real Estate Sales, Fees, Investment, and Other Income Equity in net earnings of associates and joint ventures substantially increased by 56% to P865.57 million from P554.41 million last year due to the higher net income contribution of non-consolidated associates while interest, interest on real estate sales, investment and other income reached P8.33 billion, 31% higher than P6.37 billion last year. Interest, Interest on Real Estate Sales and Investment income grew due to higher interest income from money market placements and accretion income while other income increased due to higher marketing and management fees.

33
Expenses Total expenses registered at P104.31 billion, 13% higher than P91.97 billion last year mainly due to higher real estate expenses which grew 15% to P87.92 billion from P76.57 billion last year. General and administrative expenses (GAE) increased by only 3% to P7.28 billion from P7.03 billion last year. This resulted into further improvement in the GAE ratio to 5.1% from 5.6% in 2016. Interest expense, financing and other charges meanwhile posted a 9% increase to P9.11 billion from P8.37 billion last year as a result of higher interest expense from the higher average daily loan balance. The average cost of debt registered at 4.6%, slightly higher than 4.5% in the previous year as a result of higher interest rates. Project and Capital Expenditures Ayala Land spent P91.4 billion in capital expenditures, higher than its estimated budget of P88.0 billion at the start of 2017, to support the aggressive completion of new projects in its pipeline. 48% was spent on residential projects, 29% on commercial projects, 17% for land acquisition and other investments and 6% for the development of the estates. Financial Condition The Company’s balance sheet continues to be solidly positioned to support its growth plans. Cash and cash equivalents, including short-term investments and UITF investments classified as FVPL, stood at P25.82 billion resulting in a current ratio of 1.30:1. Total borrowings registered at P174.39 billion which translated to a debt-to-equity ratio of 0.91:1 and a net debt-to-equity ratio of 0.77:1. Return on equity was at 16.1% as of December 31, 2017.
End-December 2017 End-December 2016 Current ratio 1 1.30:1 1.12:1 Debt-to-equity ratio 2 0.91:1 0.93:1 Net debt-to-equity ratio 3 0.77:1 0.79:1 Profitability Ratios: Return on assets 4 5.07% 4.99% Return on equity 5 16.09% 14.86% Asset to Equity ratio 6 2.99:1 3.11:1 Interest Rate Coverage Ratio 7 6.0 5.9
1 Current assets / current liabilities 2 Total debt/ consolidated stockholders’ equity (Total debt includes short-term debt, long-term debt and current portion of long-term debt) 3 Net debt/ consolidated stockholders’ equity (Net debt is total debt less cash and cash equivalents, short term investments and financial assets through fvpl) 4 Total Net income / average total assets 5 Net income attributable to equity holders of ALI / average total stockholders’ equity attributable to equity holders of ALI 6 Total Assets /Total stockholders’ equity 7 EBITDA/Interest expense There are no events that will trigger direct or contingent financial obligation that is material to the company, including any default or acceleration of an obligation.

34
There are no material off-balance sheet transactions, arrangements, obligations (including contingent obligations), and other relationships of the company with unconsolidated entities or other persons created in 2017. Causes for any material changes (+/- 5% or more) in the financial statements Income Statement items – 2017 versus 2016 Real estate and hotel revenues grew by 13% primarily due to higher sales bookings, incremental project completion from residential projects and strong performance of malls, leasing and hotels & resorts business groups. Interest and investment income improved by 6% due to the increase in interest income from money market placements due to higher ADB of 16.6B vs. 11.4B, YoY and yield of 2.1% vs. 1.6%, YoY, and increase in accretion income. Equity in net earnings of associates and joint ventures higher by 56% largely due to increase in NIAT contribution from FBDC companies. Other Income increased by 241% due to higher marketing and management fees and the one-time take up of negative goodwill from purchase price allocation on ALI’s investment in OCLP Holdings Inc. Real estate and hotel costs up by 15% primarily due to higher sales and incremental project completion coming from residential, malls, leasing and hotels & resorts business segments. Interest and other financing charges and other charges increased by 9% mainly due to higher borrowings to finance various capital expenditures. Provision for income tax increased by 19% largely due to increase in taxable income primarily from real estate. Non-controlling interests lower by 19% mainly due to decrease in NIAT contribution from non-consolidated companies. Balance Sheet items – 2017 versus 2016 Short-term investments grew by P4.5B primarily due to money market placements of AHI, BGWest, Alveo, RLC and MDC. Financial assets at fair value through profit or loss decreased by 72% mainly due to the maturity of BG West, POPI, ALI Capital and APMC’s UITF investment placements. Real estate Inventories lower by 7% primarily due to higher sales despite lesser launches of RBG projects. Other current assets up by 34% due to increase in input VAT and CWT mainly from residential projects and various prepayments (Taxes & Licenses, Ads and Promo, Marketing and Management fees, etc.). Non-current accounts and notes receivable improved by 27% primarily due to higher bookings and increase in project POC. Land and improvements declined by 7% mainly due to the transfer from unsubdivided land to investment properties.

35
Investments in associates and joint ventures higher by 7% due to the new investment in ALI Eton and contribution from ALI's share in the equity in net earnings for full year 2017. Investment properties grew by 25% primarily due to the additional project costs on new and existing malls and buildings for lease. Available-for-sale financial assets better by 7% mainly due to higher investments from ALI Capital and Ayalaland Malls Synergies Inc. Property and equipment improved by 8% mainly coming from the increase in Hotel PPE and ALI Capital (Airswift). Deferred tax assets higher by 8% due to leasing group's PAS Straight-line recognition of revenue (Accounting Standard vs BIR). Other non-current assets lower by 20% due to transder of advances to other companies to investment properties. Short-term debt down by 27% primarily due to Avida, ALI and Alveo's payment of short-term unsecured peso denominated bank loan availments. Income tax payable decreased by 33% mainly due to payment of income taxes. Deposit and other current liabilities up by 39% due to the increase in customers' deposits from real estate customers who reached the 10% threshold for sales bookings. Current portion of long-term debt higher by 27% due to incremental debt of NTDCC, Phil. Energy, and Alveo. Long-term debt – net of current portion grew by 15% largely due to ALI's additional long-term debt availments, P7B short-dated notes and P7B bond issuance on May 2017. Pension liabilities increased by 14% due to additional provision based on actuarial valuation report. Deposits and other non-current liabilities increased by 6% due to deposits from real estate customers and contribution from leasing group's advance rental and security deposits. Net unrealized gain/loss on available for sale financial assets down by 7% mainly due to sale of SSI investment. Review of 2016 operations vs 2015 Ayala Land, Inc. (ALI or “the Company”) generated a net income after tax (attributable to equity holders of ALI) of P20.91 billion in 2016, 19% higher than the P17.63 billion posted in 2015. Consolidated total revenues reached P124.63 billion, 16% higher than the P107.18 billion posted in the same period last year. Revenues from Real Estate increased by 17% to P117.70 billion driven by the steady performance of its Property Development, Commercial Leasing and Services businesses. The ratio of General and Administrative Expenses (GAE) to revenues improved further to 5.6% from 6.2% while the Earnings before interest and taxes (EBIT) margin registered higher at 30% from 29% during the same period last year. Business Segments The details of the individual performance of each business segment are discussed as follows:

36
Property Development. This includes the sale of residential lots and units, office spaces, as well as commercial and industrial Lots. Total revenues from Property Development amounted to P79.24 billion in 2016, 17% higher than the P67.77 billion reported during the same period in 2015. Revenues from the sale of residential lots and units reached P65.12 billion, 12% higher than P58.39 billion posted in the same period last year, driven by bookings and project completion across all residential brands. Ayala Land Premier (ALP) registered revenues of P24.86 billion, slightly higher than the P23.40 billion posted in the same period in 2015 driven by higher bookings from projects such as Park Central Tower in Makati City and increased completion of residential buildings such as The Two Roxas Triangle and Garden Towers 1 & 2 in Ayala Center Makati, East and West Gallery Place in Bonifacio Global City, Arbor Lanes in Arca South, Taguig, and horizontal projects such as Riomonte and Soliento in Nuvali, Laguna and The Courtyards in Vermosa, Cavite. Alveo meanwhile registered revenues of P18.57 billion, 29% higher than the P14.36 billion generated in the same period due to increased completion of residential towers such as Park Triangle Residences, One and Two Maridien and Two Serendra in Bonifacio Global City, Lerato Tower 3 and Kroma in Makati and Portico Tower 1 in Pasig and subdivision projects such as Lumira and Mondia in Nuvali, Laguna. Avida recorded revenues of P17.07 billion, 16% higher compared to same period last year on the account of higher bookings from Avida Tower Sola 1 in Vertis North, Quezon City and One Union Place Tower 3 in Arca South, Taguig and increased completion of Vita Towers in Vertis North, Asten Towers in Makati, The Montane and Turf Tower 1 in Bonifacio Global City, Riala Tower 1 and 2 in Cebu IT Park, Avida Towers Davao and subdivision projects in Nuvali namely Hillcrest Estates and Southfield Settings. Amaia posted revenues of P3.35 billion which is lower compared to same period in 2015 due to lower sales take-up from Amaia Scapes and Skies Projects. BellaVita meanwhile significantly grew its revenues to P776.10 million, posting a 46% growth from P529.80 million last year due to higher bookings in General Trias Cavite, Alaminos Laguna, Tayabas Quezon, Cabanatuan City, Nueva Ecija and Cagayan De Oro City, Misamis Oriental. Residential sales for 2016 reached a total of P108.00 billion, 3% higher year-on-year, equivalent to an average monthly sales take-up of P9.0 billion. Residential Gross Profit (GP) margins of vertical developments improved to 35% from 34% due to sale of higher margin projects such as Park Central Tower in Makati while horizontal projects slightly declined to 43% from 44% due to higher development and land cost of recently launched projects. Revenues from the sale of office spaces reached P8.20 billion, posting a 28% growth from the P6.42 billion registered in the same period in 2015 driven by higher bookings from Alveo Financial Tower in Makati Central Business District, Alveo Park Triangle Tower and Alveo Park Triangle Corporate Plaza and higher completion of High Street South Corporate Plaza 1 and 2 in Bonifacio Global City. Avida’s office projects in Bonifacio Global City also contributed significant revenues from higher bookings from Avida Capital House and higher completion of One Park Drive. Gross profit margins of offices for sale buildings declined to 37% from 38% during the same period last year. Revenues from the sale of commercial and industrial lots doubled to P5.92 billion from P2.95 billion due to higher lot sales in Arca South, Naic and Altaraza in 2016. GP margins of Commercial and Industrial lots declined to 41% from 50% due to sale of higher margin commercial lots in Arca South and Nuvali in the same period last year. Commercial Leasing. This includes shopping centers and office leasing as well as hotels and resorts operations. Total revenues from commercial leasing amounted to P26.56 billion in 2016, 8% higher than the P24.50 billion recorded in the same period last year.

37
Revenues from Shopping Centers reached P14.97 billion, 12% higher year-on-year from P13.37 billion due to the improved performance of stable malls and contribution of new malls such as UP Town Center in Quezon City, Ayala Malls Solenad in Nuvali, Santa Rosa Laguna, Tutuban Center, Manila, Ayala Malls Legazpi in Albay and the higher occupancy and average rental rates of existing malls. Shopping Centers EBITDA margin declined to 67% from 69% due to lower margins of newly opened malls. Monthly average lease rates registered 1% lower to P1,143 per square meter from P1,155 per square meter in the same period last year. Same mall rental growth increased by 5% year-on-year. Average occupancy rate registered at 91%. Total gross leasable area (GLA) of Shopping Centers registered at 1.62 million square meters for full year 2016. Revenues from Office Leasing reached P5.54 billion, 7% higher year-on-year from P5.16 billion due to the higher average rental rates of existing buildings and the positive contribution of new offices such as Bonifacio Stopover, UP Technohub Building P and UP Town Center BPO in Quezon City. Office Leasing EBITDA margin improved to 91% from 90% last year. Monthly average lease rates of offices registered 4% higher to P725 per square meter from P698 per square meter in the same period last year. Average occupancy rate registered at 87%, 3% higher than previous year due to the completion of leased office spaces for tenant fit-out. Total gross leasable area (GLA) of Office Leasing registered at 836 thousand square meters for 2016. Revenues from Hotels and Resorts reached P6.05 billion, 1% higher year-on-year from P5.97 billion due to the improved revenue-per-available-room (REVPAR) of hotel and resorts. REVPAR of hotels increased by 0.7% to P3,786 per night while REVPAR of resorts increased by 7% to P8,087 per night. Hotels and Resorts EBITDA margin was at 28%. Average occupancy rate of Hotels registered at 73% while Resorts registered at 59% during the period. Hotels and Resorts currently operates 961 hotel rooms from its internationally branded segment; Cebu City Marriott, Fairmont Hotel and Raffles Residences Makati and Holiday Inn & Suites Makati, 213 island resort rooms from El Nido Resorts in Lagen, Miniloc, Apulit and Pangulasian Islands in the province of Palawan, 30 bed and breakfast rooms in Casa Kalaw Lio El Nido and 6 bed and breakfast rooms from Balay Kogon Sicogon, Iloilo and 817 rooms from its Seda Hotels located in Iloilo, Bonifacio Global City, Taguig, Centrio Cagayan de Oro, Abreeza in Davao and Nuvali in Santa Rosa Laguna. Total rooms under the Hotels and Resorts portfolio registered at 2,027 as of December 31, 2016. Services. This includes the Company’s wholly-owned Construction and Property Management companies; respectively Makati Development Corporation and Ayala Property Management Corporation. Total revenues from the Services business amounted to P66.65 billion, 47% higher than the P45.25 billion reported in the same period in 2015. Revenues from Construction reached P65.32 billion, 48% higher year-on-year from P44.07 billion due to the increase in order book of projects and higher completion within the Ayala Land Group. Revenues from Property Management reached P1.34 million, 14% higher year-on-year from P1.18 million due to the increase in managed properties from completed projects. Blended EBITDA margins of the Services businesses declined to 11% from 14%. Equity in Net Earnings of Investees, Interest, Fees, Investment and Other Income Equity in net earnings of associates and JVs registered a 495% growth to P554 million in 2016 due higher net earnings from Modular Construction Technology (MCT) Bhd., Ortigas & Co. Ltd Partnership and Fort Bonifacio Development Corporation. Meanwhile, Interest, Investment and Other Income reached P6.37 billion, mainly due to higher interest income on accretion and installment sales. Expenses Total expenses registered at P91.97 billion in 2016, 16% higher than the P79.43 billion posted in the same period last year mainly driven by Real Estate and Hotels expenses which grew 17% to P76.57 billion from P65.34 billion last year.

38
General and Administrative Expenses (GAE) grew by 7% to P7.03 billion from P6.59 billion last year as a result of efficient cost management measures. GAE-to-revenue ratio further improved to 5.6% from 6.2% last year. Interest Expense, Financing and Other Charges meanwhile registered at P8.37 billion, 11% higher year-on year from P7.51 billion, mainly attributed to higher interest expense and a lower average interest rate of 4.49% compared to 4.71% during the previous year. Project and Capital Expenditure Ayala Land spent a total of P85.40 billion for project and capital expenditures in 2016. Of the total capital expenditure, 14% was spent on land acquisition, 5% was spent on the development of its estates, 43% was spent on the completion of residential projects and 30% was spent on commercial leasing projects with the rest of the amount disbursed for new businesses, services and other investments. Financial Condition Ayala Land posted a solid balance sheet position in 2016 which provides adequate capacity to support its growth plans in the coming years. Cash and Cash Equivalents including short term investments and UITF investments classified as FVPL stood at P22.64 billion, resulting in a current ratio of 1.12:1. Total Borrowings stood at P159.80 billion as of December 31, 2016 from P130.99 billion as of December 2015, translating to a Debt-to-Equity Ratio of 0.93:1 and a Net Debt-to-Equity Ratio of 0.79:1. Return on Equity was at 14.9% as of December 31, 2016.
End-December 2016 End-December 2015 Current ratio 1 1.12:1 1.14:1 Debt-to-equity ratio 2 0.93:1 0.87:1 Net debt-to-equity ratio 3 0.79:1 0.74:1 Profitability Ratios: Return on assets 4 5.0% 5.0% Return on equity 5 14.9% 14.7% Asset to Equity ratio 6 3.11 2.95 Interest Rate Coverage Ratio 7 5.9 5.5
1 Current assets / current liabilities 2 Total debt/ consolidated stockholders’ equity (Total debt includes short-term debt, long-term debt and current portion of long-term debt) 3 Net debt/ consolidated stockholders’ equity (Net debt is total debt less cash and cash equivalents, short term investments and financial assets through fvpl) 4 Total Net income / average total assets 5 Net income attributable to equity holders of ALI / average total stockholders’ equity attributable to equity holders of ALI 6 Total Assets /Total stockholders’ equity 7 EBITDA/Interest expense There are no events that will trigger direct or contingent financial obligation that is material to the company, including any default or acceleration of an obligation. There are no material off-balance sheet transactions, arrangements, obligations (including contingent obligations), and other relationships of the company with unconsolidated entities or other persons created in 2016.

39
Causes for any material changes (+/- 5% or more) in the financial statements Income Statement items – 2016 versus 2015 Real estate and hotel revenues increased by 17% mainly due to higher sales bookings and incremental project completion of residential projects and better performance of malls, leasing and hotels & resorts business groups. Equity in net earnings of associates and joint ventures improved by 495% primarily due to higher equity from Malaysia (MCT-Modular Construction Technology) and China (Tianjin Eco-City Ayala) investments and contribution from Ortigas & Co. Ltd. Partnership and FBDC companies. Real estate and hotel costs up by 17% due to higher costs coming from residential, malls, leasing and hotels & resorts business segments in 2016. General and administrative expense higher by 7% primarily due to increase in contracted services, professional fees, insurance and repairs & maintenance. Interest and other financing charges and other charges grew by 11% mainly due to the increased borrowings to finance various capital expenditures. Provision for income tax increased by 20% largely due to higher taxable income mainly from real estate. Balance Sheet items – 2016 versus 2015 Cash and cash equivalents improved by 10% largely due to bond issuance and loan availments made and the impact of the consolidation of POPI and Anvaya entities in 2016. Short term investments up by 26% primarily due to additional money market placements and the impact of the consolidation of Anvaya companies in 2016. Financial assets at fair value through profit or loss higher by 168% due to BG West, NUVALI companies, POPI, and APMC's UITF investment placements. Accounts and notes receivables increased by 50% mainly due to higher sales and additional bookings from residential business group projects (subdivision, condominium, house & lot, and office building for sale) and improved performance of malls, leasing, and hotels & resorts business segments and increase in advances to contractors. Real estate Inventories increased by 13% primarily due to new project launches of residential projects and incremental completion of the existing projects. Other current assets up by 8% due to the increase in prepaid expenses and current project costs. Non-current accounts and notes receivable decline by 15% largely due to the sale of real estate receivables on a without recourse basis, and contribution from decrease in advances to other companies. Land and improvements increased by 9% primarily due to the consolidation of Prow Holdings, Inc. and additional acquisition of land parcels for future development. Investments in associates and joint ventures higher by 43% due to the investments made with OCLP Holdings and ALI Eton and share in equity for full year 2016. Investment properties up by 34% primarily due to the additional project costs on new & existing malls, buildings for lease and hotels and contribution from additional land acquisitions.

40
Available-for-sale financial assets improved by 177% due to Alviera country club share, Cebu City Sports Club and contribution from POPI. Property and equipment higher by 9% largely due to increase in MDC's additional batching plants, machineries and equipment in response to capacity requirements brought about by new projects/contracts. Deferred tax assets increased by 25% primarily due to higher deferred tax assets mainly from residential group’s tax effect of temporary difference arising from sale and collection on booked accounts and contribution from PAS Straight-line recognition of revenue per Accounting Standard vs BIR computation. Other non-current assets up by 66% largely due to the increase in leasehold rights on the acquisition of Prime Orion Philippines, Inc., and increase in prepaid costs incurred for the unlaunched projects. Account and other payables increased by 24% due to higher expenses related to the development and project costs of new and existing projects of the residential, commercial, hotels & resorts business group and contribution from the increase in accrued expenses, interest payable, taxes payable and higher payables to external suppliers/contractors due to increased volume of construction projects for ALI. Short-term debt 131% increased primarily due to additional short-term unsecured peso denominated bank loan availments. Income tax payable higher by 15% mainly due to higher taxable income from real estate. Deposit and other current liabilities up by 40% due to the increase in advances and deposits for various residential projects. Current portion of long-term debt decreased by 41% mainly due to loan payments made. Deferred tax liabilities higher by 144% primarily due to POPI's stepped-up value based from purchase price allocation. Long-term debt - net of current portion increased by 17% largely due to ALI's bond issuance amounting to P25B. Deposits and other noncurrent liabilities grew by 25% due to higher non-current security deposits from residential customers and contribution from leasing group's increase in security deposits, reservations and advance rental deposits. Non-controlling interest up by 55% mainly due to the increase in non-controlling interest's share in full year 2016 NIAT and contribution from NCI share of Prow Holdings, Nuevo Centro, Aviana, POPI and BG companies. Item 7. Financial Statements The 2018 consolidated financial statements of the Company are incorporated in the accompanying Index to Exhibits.

41
Item 8. Information on Independent Accountant and Other Related Matters Independent Public Accountants (a) The principal accountant and external auditor of the Company is SyCip Gorres Velayo & Co. (SGV &
Co.). The same accounting firm is being recommended for re-election at the annual stockholders’ meeting.
(b) Representatives of SGV & Co. for the current year and for the most recently completed fiscal year are
expected to be present at the annual stockholders’ meeting. They will have the opportunity to make a statement if they desire to do so and are expected to be available to respond to appropriate questions
Pursuant to the General Requirements of SRC Rule 68, Par. 3 (Qualifications and Reports of Independent Auditors), the Company has engaged SGV & Co. as external auditor, and Mr. Michael C. Sabado is the Partner-in-charge for the audit year 2018 while Ms. Lucy L. Chan served as such for the audit years 2016 to 2017.
Changes in and Disagreements with Accountants on Accounting and Financial Disclosure
The Company has engaged the services of SGV & Co. during the two most recent fiscal years. There were no disagreements with the SGV & Co. on any matter of accounting and financial disclosure.
(c) Audit and Audit-Related Fees
ALI and its subsidiaries paid its external auditor the following fees in the past two years: (in Php million; with VAT)
Year Audit & Audit-related Fees Tax Fees Other Fees 2018 31.96* - 9.37** 2017 29.33* - 13.76**
* Pertains to audit fees. **SGV fees for the validation of stockholders’ votes during the annual stockholders’ meeting and other assurance fees.
(d) Tax Fees
Tax consultancy services are secured from entities other than the external auditor.
Under paragraph 3.3 a of the ALI Audit Committee Charter, the Audit Committee (composed of Jaime C. Laya, Chairman, Rizalina G. Mantaring, and Antonino T. Aquino, members) recommends to the Board the appointment of the external auditor and the audit fees.

42
PART IV – MANAGEMENT AND CERTAIN SECURITY HOLDERS Item 9. Directors and Executive Officers of the Registrant The write-ups below include positions held as of December 31, 2018 and in the past five years, and personal data as of December 31, 2018 of directors and executive officers.
Board of Directors Fernando Zobel de Ayala Jaime Augusto Zobel de Ayala Bernard Vincent O. Dy Antonino T. Aquino Arturo G. Corpuz Jaime C. Laya Delfin L. Lazaro Rizalina G. Mantaring Cesar V. Purisima
Fernando Zobel de Ayala, Filipino, 58, has served as Chairman of the Board of ALI since April 1999. He holds the following positions in publicly listed companies: President and Chief Operating Officer of Ayala Corporation; Chairman of Manila Water Company, Inc.; Director of Bank of The Philippine Islands, Globe Telecom, Inc. and Integrated Micro-Electronics, Inc.; and Independent Director of Pilipinas Shell Petroleum Corporation. He is the Chairman of AC International Finance Ltd., ALI Eton Property Development Corporation, Liontide Holdings, Inc., AC Energy, Inc., Ayala Healthcare Holdings, Inc., Automobile Central Enterprise, Inc., Alabang Commercial Corporation, Accendo Commercial Corp. and Hero Foundation, Inc.; Co-Chairman of Ayala Foundation, Inc. and Ayala Group Club, Inc.; Vice-Chairman of AC Industrial Technology Holdings, Inc., Aurora Properties Incorporated, Vesta Property Holdings, Inc., Ceci Realty Inc., Fort Bonifacio Development Corporation, Bonifacio Land Corporation, Emerging City Holdings, Inc., Columbus Holdings, Inc., Berkshires Holdings, Inc., AKL Properties Inc., AC Ventures Holding Corp. and Bonifacio Art Foundation, Inc.; Director of LiveIt Investments Ltd., AG Holdings Ltd., AC Infrastructure Holdings Corporation, Asiacom Philippines, Inc., Ayala Retirement Fund Holdings, Inc., AC Education, Inc., Honda Cars Philippines, Inc., Isuzu Philippines Corporation, and Manila Peninsula; Member of the Board for INSEAD and Georgetown University; Member of the International Advisory Board of Tikehau Capita; Member of the Philippine-Singapore Business Council, INSEAD East Asia Council, World Presidents’ Organization; and Chief Executives Organization; Chairman of Habitat for Humanity’s Asia-Pacific Capital Campaign Steering Committee; and Member of the Board of Trustees of Caritas Manila, Pilipinas Shell Foundation, and the National Museum. He graduated with B.A. Liberal Arts at Harvard College in 1982 and holds a CIM from INSEAD, France. Jaime Augusto Zobel de Ayala, Filipino, 59, has served as a Director, Vice Chairman and Member of the Executive Committee of ALI since June 1988. He holds the following positions in publicly listed companies: Chairman and CEO of Ayala Corporation; Chairman of Globe Telecom, Inc., Integrated Micro-Electronics, Inc. and Bank of the Philippine Islands; and Vice Chairman of Manila Water Company, Inc. He is also the Chairman of AC Education, Inc., Ayala Retirement Fund Holdings, Inc., AC Industrial Technology Holdings, Inc., AC Ventures Holding Corp., AC Infrastructure Holdings Corporation and Asiacom Philippines, Inc.; Co-Chairman of Ayala Foundation, Inc. and Ayala Group Club, Inc.; Director of Alabang Commercial Corporation, Ayala International Pte. Ltd., AC Energy, Inc., Ayala Healthcare Holdings, Inc., Light Rail Manila Holdings, Inc. and AG Holdings Ltd. Outside the Ayala group, he is a member of various business and socio-civic organizations in the Philippines and abroad, including the JP Morgan International Council, JP Morgan Asia Pacific Council, Mitsubishi Corporation International Advisory Council, and Council on Foreign Relations. He sits on the board of the Singapore Management University, the Global Advisory Board of University of Tokyo, and on various advisory boards of Harvard University, including the Global Advisory Council, HBS Board of Dean’s Advisors, and HBS Asia-Pacific

43
Advisory Board, which he chairs. He is Chairman Emeritus of the Asia Business Council, Co-Vice Chairman of the Makati Business Club, Chairman of Endeavor Philippines, and a board member of Eisenhower Fellowships. He was awarded the Presidential Medal of Merit in 2009, the Philippine Legion of Honor with rank of Grand Commander in 2010, and the Order of Mabini with rank of Commander in 2015 by the President of the Philippines in recognition of his outstanding public service. In 2017, he was recognized as a United Nations Sustainable Development Goals Pioneer for his work in sustainable business strategy and operations. The first recipient of the award from the Philippines, he was one of 10 individuals recognized for championing sustainability and the pursuit of the 17 SDGs in business. He graduated with B.A. in Economics (Cum Laude) from Harvard College in 1981 and obtained an MBA from the Harvard Graduate School of Business in 1987. Bernard Vincent O. Dy, Filipino, 55, is the President and Chief Executive Officer of ALI since April 7, 2014. Prior to this, he was the Head of Residential Business, Commercial Business and Corporate Marketing and Sales. He is also the Chairman of Ayala Property Management Corporation, Makati Development Corporation, Alveo Land Corporation, Amaia Land Corporation, AyalaLand Commercial Reit, Inc., Bellavita Land Corporation, Ayagold Retailers, Inc., Station Square East Commercial Corporation, Aviana Development Corp., Cagayan De Oro Gateway Corp., BGSouth Properties, Inc., BGNorth Properties, Inc., BGWest Properties, Inc., Portico Land Corp., Philippine Integrated Energy Solutions, Inc., Avencosouth Corp., and Nuevocentro, Inc. Mr. Dy also serves as Vice Chairman of Ayala Greenfield Development Corporation and Alviera Country Club, Inc. He is also President of Bonifacio Land Corporation, Emerging City Holdings, Inc., Columbus Holdings, Inc., Berkshires Holdings, Inc., Fort Bonifacio Development Corporation, Aurora Properties Incorporated, Vesta Property Holdings, Inc., Ceci Realty Inc., Alabang Commercial Corporation and Accendo Commercial Corp. Mr. Dy also serves as Director of Prime Orion Philippines, Inc., Cebu Holdings, Inc., and MCT Bhd of Malaysia, Avida Land Corporation, Amicassa Process Solutions, Inc., Whiteknight Holdings, Inc., AyalaLand Medical Facilities Leasing, Inc., Serendra, Inc., Alveo-Federal Land Communities, Inc., ALI Eton Property Development Corporation., and AKL Properties Inc. Mr. Dy is the President of Hero Foundation Inc. and Bonifacio Art Foundation, Inc. He is also a member of Ayala Foundation, Inc. and Ayala Group Club, Inc. He has also been a Director of the Junior Golf Foundation of the Philippines since 2010 and serves as Vice Chairman since 2017.He earned a Bachelor’s Degree in Business Administration from the University of Notre Dame in 1985. He also received his MBA in 1989 and MAs International Relations in 1997, both from the University of Chicago. Antonino T. Aquino, Filipino, 71, has served as Director of ALI since April 2009. He is also a Director of Manila Water Company, Inc. (MWC), another publicly listed company, since 1998. He was the President of ALI from April 2009 to April 2014, MWC from April 1999 to April 2009, and Ayala Property Management Corporation from 1989 to 1999. He has served the Ayala group in various capacities for 38 years. Currently, he is a Board member of Nuevocentro, Inc., Anvaya Beach & Nature Club and Mano Amiga Academy, Inc. He is also a private sector representative in the Multi Sectoral Advisory Board of the Philippine Army and the Multi Sector Governance Council of the Armed Forces of the Philippines. He was named “Co-Management Man of the Year 2009” by the Management Association of the Philippines for his leadership role in a very successful waterworks privatization and public-private sector partnership. In 2015, Mr. Aquino was elected as Director of The Philippine American Life and General Insurance Company (Philam). He earned a degree in BS Management and completed academic requirements for Masters in Business from the Ateneo de Manila University in 1968 and 1975, respectively. Arturo G. Corpuz, Filipino, 63, has served as a Director of ALI since April 2016. He was a member of the Management Committee of ALI from 2008 to December 31, 2016. He is also a member of the Board of Ceci Realty, Inc. Aurora Properties, Inc., Vesta Properties Holdings, Inc., Nuevocentro, Inc., Next Urban Alliance Development Corp. and Alviera Country Club, Inc. He is a former President of the Philippine Economic Society and a Fellow of the Foundation for Economic Freedom and the Philippine Institute of Environmental Planning. Mr. Corpuz received his baccalaureate degree in Architecture from the University of the Philippines in 1977 and his masteral and doctoral degrees in urban and regional planning from Cornell University in 1984 and 1989.

44
Jaime C. Laya, Filipino, 79, has served as an Independent Director of ALI since April 2010 and as its Lead Independent Director since April 2017. He is member of the Board of Directors of publicly listed companies, being Independent Director of GMA Network, Inc., GMA Holdings, Inc. and Manila Water Company, Inc. and Regular Director of Philippine Trust Company (Philtrust Bank). His other significant positions are: Chairman and President of Philtrust Bank, Independent Director of Philippine AXA Life Insurance Co., Inc. and of Charter Ping An Insurance Corporation; and Trustee of Cultural Center of the Philippines, St. Paul's University - Quezon City, Ayala Foundation, Inc., Escuela Taller de Filipinas Foundation, Inc., Fundación Santiago, and other non-profit, non-stock corporations. He graduated magna cum laude from University of the Philippines in 1957 with a degree in B.S.B.A. (Accounting) and completed his M.S. in Industrial Management at Georgia Institute of Technology in 1960 and his Ph.D. in Financial Management at Stanford University in1967. He has served as Minister of the Budget, Minister of Education, Culture and Sports, Governor of the Central Bank of the Philippines, Chairman of the National Commission for Culture and the Arts, and Professor and Dean of Business Administration of the University of the Philippines. Delfin L. Lazaro, Filipino, 72, has served as a member of the Board of ALI since May 1996. He is a Director of publicly listed companies namely, Ayala Corporation, Integrated Micro-Electronics, Inc. Manila Water Company, Inc., Globe Telecom, Inc. His other significant positions are Chairman of Atlas Fertilizer & Chemicals, Inc.; Chairman and President of A.C.S.T. Business Holdings, Inc.; Vice Chairman and President of Asiacom Philippines, Inc.; and Director of AYC Holdings, Inc. Ltd., AC International Finance, Ltd., Purefoods International, Ltd., AC Industrial Technology Holdings. Inv., Probe Productions, Inc. He graduated with BS Metallurgical Engineering at the University of the Philippines in 1967 and took his MBA (with Distinction) at Harvard Graduate School of Business in 1971. Rizalina G. Mantaring, Filipino, 59, has served as an Independent Director of ALI since April 2014. Concurrently, she also holds the following positions: Chairman, Sun Life Financial Philippine Holding Co. Inc.; Chairman, Sun Life Financial Philippines Foundation Inc.; Director, Sun Life Grepa Financial, Inc.; and Independent Director of First Philippine Holdings Corp. Inc., East Asia Computer Center Inc., Roosevelt College Inc., and Microventures Foundation Inc. She is also President of the Management Association of the Philippines and a member of its Board of Governors; and a member of the Makati Business Club Board of Trustees and Philippine Business for Education Board of Trustees. A recipient of the Asia Talent Management Award in the Asia Business Leaders Award organized by the global business news network CNBC, she has also been recognized by the International Association of Business Communicators (Philippines) with the CEO Excel award, was named by Moneysense Magazine as one of the 12 Most Influential in Personal Finance, and was selected as one of the 100 Most Outstanding Alumni of the past century by the University of the Philippines College of Engineering. She holds a BS Electrical Engineering degree from the University of the Philippines where she graduated with honors in 1982. She obtained her MS degree in Computer Science from the State University of New York at Albany in 1993. Cesar V. Purisima, Filipino, 58, was appointed as an Independent Director of ALI. in April 18, 2018. He is an Asia Fellow at the Milken; Independent Director of AIA Group Limited; Independent Director of Universal Robina Corporation; Member of the Global Advisory Council of Sumitomo Mitsui Banking Corporation; Executive-in-Residence of the Asian Institute of Management; Member of the Boards of Trustees of International School, Manila and De La Salle University; Member of International Advisory Council (Phils.), Singapore Management University; and Advisor of the Partners Group AG LIFE Council. He served the Philippine Government as a Secretary of Finance from February 2005 to July 2005 and from July 2010 to June 2016. As Secretary of Finance, he also served as a member of the Monetary Board of the Bangko Sentral ng Pilipinas, Governor for the Philippines of the World Bank Group and Asian Development Bank; and Chairman of various public finance sectors. He was also the Head of the Cabinet Economic Development Cluster of the Philippines from July 2010 to June 2016. He also served as the Secretary of the Department of Trade and Industry from January 2004 to February 20015. He was also the Alternate Governor for the International Monetary Fund. Prior to his stint in the government service, he was the Chairman & Country Managing Partner of SGV & Co., and was a member of the Global Executive Board and Global Practice Council of Ernst & Young. Mr. Purisima obtained his Bachelor of Science degree in Commerce Major in Accounting and Financial Institutions from De La Salle

45
University in 1979 and was among the top placers in the 1979 CPA Board Examination. He earned his Master of Business Administration degree from Kellogg School of Management, Northwestern University, Illinois in 1983 and was conferred the Doctor of Humanities Honoris Causa by Angeles University in 2012. Nominees to the Board of Directors for election at the stockholders’ meeting: All the nominees are incumbent directors.
Management Committee Members / Key Executive Officers Bernard Vincent O. Dy* President and Chief Executive Officer Dante M. Abando Senior Vice President Augusto D. Bengzon Senior Vice President, Chief Finance Officer, Treasurer, & Chief Compliance Officer Anna Ma. Margarita B. Dy Senior Vice President Jose Emmanuel H. Jalandoni Senior Vice President Robert S. Lao Senior Vice President Jaime E. Ysmael Senior Vice President Lyle A. Abadia Vice President Leovigildo D. Abot Vice President Aniceto V. Bisnar, Jr. Vice President Manuel A. Blas II Vice President Ruby P. Chiong Vice President Dindo R. Fernando Vice President Javier D. Hernandez Vice President Joseph Carmichael Z. Jugo Vice President Michael Alexis C. Legaspi Vice President Christopher B. Maglanoc Vice President Romeo T. Menpin, Jr. Vice President Carol T. Mills Vice President William Thomas F. Mirasol Vice President Rodelito J. Ocampo Vice President Ginaflor C. Oris Vice President Angelica L. Salvador Vice President Eliezer C. Tanlapco Vice President Maria Rowena Victoria M. Tomeldan Vice President Jennylle S. Tupaz Vice President Amelia Ann T. Alipao Chief Information Officer and Data Protection Officer Solomon M. Hermosura Group General Counsel & Corporate Secretary *Member of the Board
Dante M. Abando, Filipino, 54, is a Senior Vice President and Member of the Management Committee of ALI. He is the President of Makati Development Corporation. He is also the Chairman of MDC BuildPlus, Inc. and Chairman and President of MDC Concrete, Inc., MDC Equipment Solutions, Inc. and MDBI Construction Corp., a joint venture of Makati Development Corporation and Bouygues Batiment International. He was the past President and Board Member of Alveo Land Corporation. He is currently a Board Member of Avida Land Corporation, Serendra, Inc. and Anvaya Cove Golf & Sports Club, Inc. Since 2014, he has been a member of the Board of Trustees of the Philippine Constructors Association (PCA) and its subsidiaries and is currently its Chairman and President. He has also been a member of the Board of Trustees of the University of the Philippines Alumni Engineers (UPAE) since 2015. He graduated with a degree in Bachelor of Science in Civil Engineering from the University of the Philippines in 1986 and earned his Master’s degree in Business Administration in 1995 from the same university. In 2012, he completed the Executive Program on Real Estate Management at Harvard University Graduate School of Design.

46
Augusto D. Bengzon, Filipino, 55, joined ALI in December 2004 and currently serves as its Senior Vice President, Chief Finance Officer, Chief Compliance Officer & Treasurer. He is a Director of Cebu Holdings Inc. and Prime Orion Philippines Inc., the publicly listed subsidiaries of ALI. His other significant positions include: Chairman of Aprisa Business Process Solutions Inc.; Vice Chairman of CMPI Holdings Inc.; Director, Treasurer & Compliance Officer of Anvaya Cove Golf and Sports Club Inc.; Director & President of CMPI Land Inc.; Director & Assistant Treasurer of Ayala Greenfield Development Corp.; Director and Treasurer of ALI Eton Property Development Corp., Amaia Land Corp., Aurora Properties Inc., Avida Land Corp., Ayala Property Management Corp., Bellavita Land Corp., BGNorth Properties Inc., BGSouth Properties Inc., BGWest Properties Inc., Ceci Realty Inc., Philippine Integrated Energy Solutions Inc., Serendra Inc. and Vesta Property Holdings Inc.; Director of AG Counselors Corporation, Alabang Commercial Corporation, ALINet.Com Inc., Alviera Country Club Inc., Alveo Land Corp., Ayala Land Commercial Reit Inc., Ecozone Power Management Inc., Laguna Technopark Inc., Makati Development Corp., Nuevocentro Inc., Northgate Hotel Ventures, Inc., Portico Land Corp., Station Square East Commercial Corp. and Southcrest Hotel Ventures, Inc.; Treasurer of AKL Properties, Inc., Cebu Property Ventures and Development Corporation, and Hero Foundation, Inc., Assistant Treasurer of Ayala Greenfield Golf & Leisure Club, Inc. Prior to joining ALI, he was Vice President and Credit Officer at Citibank N.A. where he spent sixteen years in various line management roles covering Treasury, Corporate Finance and Relationship Management. He received his Bachelor of Science degree in Business Management from the Ateneo de Manila University and is a graduate of the Philippine Trust Institute. He was granted the Andres K. Roxas scholarship at the Asian Institute of Management where he received his Master’s in Business Management degree. Anna Ma. Margarita B. Dy, Filipino, 49, is a Senior Vice President since January 1, 2015 and a member of the Management Committee of ALI since August 2008. She is the Head of the Strategic Landbank Management (SLMG) of ALI. She is also the Chairman of Cebu Holdings, Inc. one of the publicly listed subsidiaries of ALI. Her other significant positions are: Director and Executive Vice President of Fort Bonifacio Development Corporation; Director of AyalaLand Estates, Inc., Director and President of Nuevocentro, Inc., and Alviera Country Club, Inc; Director of Aurora Properties, Inc., Vesta Properties Holdings, Inc., CECI Realty, Inc., AyalaLand Medical Facilities Leasing, Inc., Director of Anvaya and Next Urban Alliance Development Corp. Prior to joining ALI, she was a Vice President of Benpres Holdings Corporation. She graduated magna cum laude from Ateneo De Manila University with BS of Arts Degree in Economics Honors Program. She earned her Master’s degree in Economics from London School of Economics and Political Science UK 1991 and MBA at Harvard Graduate School of Business Administration in Boston. Jose Emmanuel H. Jalandoni, Filipino, 51, is a Senior Vice President and a member of the Management Committee of ALI. He is the Group Head of commercial businesses including malls, offices, hotels, resorts and Chairman of ALI Capital Corporation. He is Director of Cebu Holdings, Inc. and Prime Orion Philippines, Inc., publicly listed subsidiaries of ALI. His other significant positions are: Chairman of the Board of ALI Commercial Center, Inc., ALI Makati Hotel and Residences, Inc., ALI Makati Hotel Property, Inc., ALI Triangle Hotel Ventures, Inc., Arca South Integrated Terminal, Inc., Arca South Hotel Ventures, Inc., Ayala Hotels, Inc., AyalaLand Hotels and Resorts Corporation, AyalaLand Medical Facilities Leasing, Inc., AyalaLand Offices, Inc., Bay Area Hotel Ventures, Inc., Bonifacio Hotel Ventures, Inc., Capitol Central Hotel Ventures, Inc., Cebu Insular Hotel Company, Inc., Circuit Makati Hotel Ventures, Inc., Direct Power Services, Inc., Econorth Resort Ventures, Inc., EcoSouth Hotel Ventures, Inc., Ecozone Power Management, Inc., Enjay Hotels, Inc., Greenhaven Property Ventures, Inc., Integrated Eco-Resort Inc., Laguna Technopark, Inc., Makati North Hotel Ventures, Inc., North Triangle Hotel Ventures., Inc., Northgate Hotel Ventures, Inc., One Makati Hotel Ventures, Inc., Orion Land, Inc., Sentera Hotel Ventures, Inc., Sicogon Island Tourism Estate Corporation, Soltea Commercial Corporation, Southcrest Hotel Ventures, Inc., Tutuban Properties, Inc., Whiteknight Holdings, Inc., One Dela Rosa Property Development, Inc., One Makati Residential Ventures, Inc., He is also Chairman and President of ALINET.Com. Inc., He is also Director of the following companies: Accendo Commercial Corporation, Alabang Commercial Corporation ALI Eton Property Development Corporation, Ayagold Retailers, Inc., Ayala Property Management Corporation, AyalaLand Commercial Reit, Inc., Bacuit Bay Development Corporation, Berkshires Holdings, Inc., Bonifacio Land Corporation Cagayan de Oro Gateway Corporation, Cebu Holdings, Inc., Chirica Resorts Corporation, Columbus Holdings, Inc.,

47
Ecoholdings Company Inc., Emerging City Holdings, Inc., Fort Bonifacio Development Corporation, Lio Resort Ventures, Inc., Lio Tourism Estate Management Corporation, Makati Cornerstone Leasing Corporation, Makati Development Corporation, North Eastern Commercial Corporation (formerly Asterion), North Liberty Resort Ventures, Inc., Pangulasian Island Resort Corporation, Paragua Eco-Resort Ventures, Inc., Philippine FamilyMart CVS, Inc., Philippine Integrated Energy Solutions, Inc., Regent Horizons Conservation Company, Inc., Sicogon Town Hotel, Inc., Station Square East Commercial Corporation, Ten Knots Development Corporation, Ten Knots Philippines, Inc. He joined ALI in 1996 and held various positions in the Company. He graduated with a degree of Bachelor of Science in Legal Management from Ateneo de Manila University. He earned his Master’s Degree in Business Administration from Asian Institute of Management. He is a Chartered Financial Analyst. Robert S. Lao, Filipino, 45, has been Senior Vice President of ALI. and a member of the Management Committee of Ayala Land, Inc. since April 19, 2017. He is also the Group Head of Ayala Land’s Residential Business Group and the Group Head of the Central Land Acquisition Unit. He is concurrently the President and a member of the Board of Directors of Alveo Land Corp, Chairman of Avida Land Corp., President and a member of the Board of Directors of Amaia Land Corp since January 2016, and President of BellaVita Land Corporation. He is also a member of the Board of Directors of Serendra, Inc. and Amaia Southern Properties Inc., President of BGSouth Properties, Inc., and the Chief Operating Officer of Portico Land Corp. Prior to joining Ayala Land, Inc., he served as a Senior Process Engineer of Fujitsu Computer Products Corporation of the Philippines (FCPP) and Lead Process Engineer of PT. Quantum Electronics in Indonesia. He is a licensed Real Estate Broker. He studied at the University of Santo Tomas (UST) and graduated cum laude in Bachelor of Science in Industrial Engineering in 1995. He completed his Master’s in Business Management (MBM) degree in 2001 from the Asian Institute of Management (AIM) and attended the International Student Exchange Program from University of Cologne in Germany. Jaime E. Ysmael, Filipino, 58, is a Senior Vice President of ALI. Concurrently, he is a Managing Director of Ayala Corporation and Chairman, President & Chief Executive Officer of OCLP Holdings, Inc., and Concrete Aggregates Corporation. His other significant positions include: Chairman of the Board of Directors of Anvaya Cove Beach and Nature Club, Inc. and Anvaya Golf and Sports Club, Inc.; Chairman and President of Tower One and Exchange Plaza Condominium Corporation; He is also a member of the Board of Directors of various Ayala Land subsidiaries and affiliates. Outside of the company, he is a Trustee of the Shareholders Association of the Philippines, FINEX Research and Development Foundation, Inc. and the CIBI Foundation. He is also a Trustee and President of the Alumni Tree Project. Mr. Ysmael holds a degree in Business Administration, Major in Accounting (Summa Cum Laude) at the University of the East, Manila, Philippines and is a Certified Public Accountant. He earned an MBA, Major in Finance, at The Wharton School and an MA in International Studies at The School of Arts and Sciences of the University of Pennsylvania in Philadelphia, USA, as a fellow of The Joseph H. Lauder Institute of Management and International Studies. Lyle A. Abadia, Filipino, 61, has served as Vice President of ALI since November 2016. Currently, he is the Head of Special Projects reporting to the Office of the President. Likewise, he is a Board of Director of Amicassa Process Solutions, Inc. and BellaVita Land Corporation. Prior to joining Ayala Land, Inc. in 2004, he held various executive positions in two (2) ALI’s subsidiaries, commencing in 1982 under Ayala Theatres Management, Inc. and moved to join Laguna Technopark, Inc. in 1991 as one of the pioneering executive officers who crafted the successful transformation of the 650 hectares former sugarcane plantation into what is now known as one of the word- class industrial estates in the country. He likewise set up BellaVita Land Corporation (a wholly-owned subsidiary of Ayala Land) and took the helm as President from 2011 to 2017.Mr. Abadia holds a degree in Bachelor of Science in Commerce, Major in Accounting at the Colegio De San Jose – Recoletos. He completed a Basic Management Program at the Asian Institute of Management (AIM) and in-house program for Harvard Leadership Acceleration Program (LEAP). Leovigildo D. Abot, Filipino, 55, is currently a Vice President of ALI and Operations Management Control Head of Makati Development Corporation. Prior to this, he was ALI’s Chief Audit Executive. He joined ALI in 2000 as Chief Finance Officer (CFO) of Ayala Hotels, Inc. Over the years in ALI, he occupied several

48
CFO positions in other ALI’s business units such as Avida Land Corporation, Ayala Land Premier (formerly Land and Community Development Group) and Strategic Landbank Management Group (SLMG). He was also the Head of ALI’s Corporate Accounting Division, concurrent to his CFO assignment in SLMG. As ALI’s Principal Accounting Officer, he led the transformation initiative of consolidating the transactional accounting functions of more than 25 ALI companies into Aprisa Business Process Solutions, Inc. He also headed ALI’s transition to international accounting and reporting standards). He graduated Magna Cum Laude from University of the East- Manila with BS in Business Administration, major in Accounting (Honors Program) in 1984. He is a Certified Public Accountant). He completed his Strategic Business Economics Program (SBEP) at University of Asia and the Pacific from 1999 to 2000. and attended Management Development Program at the Asian Institute of Management where he also completed his Strategic Finance Course. He was accepted as Fellow of the Institute of Corporate Directors (ICD) after his completion of the ICD’s Professional Directors Program in 2016. Aniceto V. Bisnar, Jr., Filipino, 55, is a Vice President of ALI since January 2009 and the Chief Operating Officer of its Visayas-Mindanao Group. He is currently the President Cebu Holdings, Inc., a publicly listed subsidiary of ALI. His other significant positions are: Chairman of Adauge Commercial Corp., Central Block Developers, Inc., Cebu Leisure Company, Inc. and Amaia Southern Properties, Inc.; Chairman and President of North Point Estate Association, Inc., Asian I-Office Properties, Inc., Cebu Business Park Association, Inc., and Asia Town I.T. Park Association, Inc. He is the Director and President of Aviana Development Corporation and Lagdigan Land Corporation. He is also the Vice President of Solinea, Inc. He holds the directorship of: Accendo Commercial Corporation, Cebu District Property Enterprise, Inc., Westview Commercial Ventures Corp., Cagayan de Oro Gateway Corp., Avenco South Corporation, Taft Punta Engaño Property, Inc., Bonifacio Estates Services Corp., Aurora Properties Inc., Ceci Realty, Inc., Vesta Property Holdings, Inc., and Board of Trustee of the Hero Foundation, Inc. He completed his Master in Business Management degree in 1989 from the Asian Institute of Management in Makati City and graduated in the top 5% of his class at the Philippine Military Academy in Baguio City in 1985. He also took up Master Planning and Mixed-Use Development at Harvard University School of Urban Design. Manuel A. Blas II, Filipino, 64, serves as Vice President of and the Estate Head for Bonifacio Global City and Makati Projects of ALI. He is also a Managing Director of Bonifacio Arts Foundation, Inc. which manages the BGC Arts Center and The Mind Museum. He also holds the following positions in Fort Bonifacio Development Corporation Subsidiaries: President of Bonifacio Estate Services Corporation and Bonifacio Transport Corporation, Director of Bonifacio Global City Estate Association, Bonifacio Water Corporation and Bonifacio Gas Corporation. He graduated from De La Salle University and has a master’s degree in Religious Studies from Maryhill School of Theology. Ruby P. Chiong, Filipino, 51, has served as Vice President of ALI. since November 2016. She is the Chief Finance Officer of Ayala Land Inc.’s Commercial Business Group. Her other positions include: Directors of Ayala Land Malls, Inc. and Ayalaland Hotels and Resorts Corp; Director and Treasurer of ALI Commercial Center, Inc., Ayalaland Offices, Inc., North Triangle Depot Commercial Corporation, Leisure and Allied Philippines, Inc., Ten Knots Development Corporation, Ayala Theatres Management, Inc., Laguna Technopark, Inc., Direct Powers Services, Inc., Ecozone Power Management, Inc., Director and Vice President of ALI Capital Corp.; Treasurer of Alabang Commercial Corporation, Station Square East Commercial Corporation, Prime Orion Philippines Inc. Prior to being Chief Finance Officer in ALI, she was an Associate Director of Corporate Strategy at Ayala Corporation. She earned a degree of BS in Business Administration and Accountancy from the University of the Philippines, Diliman in 1987 and took her Master’s Degree in Management at the Asian Institute of Management in 1996. Dindo R. Fernando, Filipino, 49, has been Vice President of ALI. since April 2017. He currently heads the company’s External Affairs Division. Moreover, he is the Treasurer of Anvaya Beach and Nature Club, Corporate Secretary of Santa Rosa (Laguna) Business Club, Board Member of the Calamba City Business Club and Vice President of Avida Towers Makati West Condominium Corporation. Prior to joining ALI, he was Head of Political Research at the Makati Business Club where he oversaw congressional research, analysis and publication. He graduated with a degree in AB Political Science from the Lyceum of the Philippines in 1989.

49
Javier D. Hernandez, Filipino, 50, has been Vice President of ALI since April 2017. He is currently the President and Chief Executive Officer of the Ten Knots group, responsible for the overall management of El Nido Resorts and LIO Estate in El Nido, Palawan. In addition, he serves as Vice Chairman of Pangulasian Island Resort Corporation; Director, President and Treasurer of Sicogon Island Tourism Estate Corp.; Director and Treasurer of El Nido Foundation; and Vice President for Operations of Alabang Commercial Corporation. He holds Directorships in the following companies: South Innovative Theater Management, North Triangle Depot Commercial Corporation, Primavera Towncentre, Inc., Ayalaland Malls Vismin, Inc., Ten Knots Philippines, Inc., Bacuit Bay Development Corporation, Ecoholdings Company, Inc., Regent Horizons Conservation Company,Inc., LIO Tourism Estate Management Corp., Chirica Resorts Corporation, Pangulasian Island Resort Corp., LIO Resort Ventures, Inc., North Liberty Resort Ventures, Inc. and Paragua Eco-Resort Ventures, Inc. He has worked for Ayala Land for 25 years, spending seven years with Mall Operations, four years with the Sales and Marketing Group, thereafter rejoining the Malls group for another 13 years before transferring to AyalaLand Hotels and Resorts mid-2016. He graduated with a Bachelors Degree in Business Administration from the San Francisco State University. Joseph Carmichael Z. Jugo, Filipino, 44, is a Vice President of ALI. and is currently the Managing Director of Ayala Land Premier. He is concurrently Chairman & President of Ayalaland Premier, Inc., Roxas Land Corp., OLC Development Corp., Southportal Properties, Inc.; Vice Chairman & President of Ayala Hotels., Inc.; Chairman of Ayalaland Sales, Inc., Ayalaland Club Management, Inc., Verde Golf Development Corp.; President, Chief Executive Officer & Director of Ayala Greenfield Development Corp., Ayala Greenfield Golf & Leisure Club, Inc.; President & Director of BGWest Properties, Inc., Anvaya Cove Golf & Sports Club, Inc.; Director of Anvaya Cove Beach & Nature Club, Inc., Amicassa Process Solutions, Inc., Serendra, Inc. and Ayala Center Estate Association. In his more than 15 years in the company, he has been a part of and handled various business lines including business development for the retail and malls group, project development for the residential business group, project development for the leisure group and sales for the local and international markets. He graduated from the Ateneo de Manila with a degree in Management Economics in 1997 and completed his MBM from the Asian Institute of Management (with Distinction) in 2002. He attended the International Graduate Student Exchange Program at the Tuck School of Business, Dartmouth College in 2002 and completed the INSEAD Asian International Executive Programme (AIEP) in 2015 Michael Alexis C. Legaspi, Filipino, 60, is the President and CEO of AyalaLand Hotels & Resorts Corporation (AHRC), owner of a portfolio of global hotel brands, and also owner, developer and operator of its home grown Seda Hotels. AHRC currently has 21 hotels and resorts in its portfolio with 12 more currently under construction. He is concurrently the Chairman of Ten Knots Development Corporation, owner-operator of the El Nido Resorts group in Palawan comprised of four eco-tourism island resorts: Miniloc Island Resort, Lagen Island Resort, Apulit Island Resort and Pangalusian Island Resort, as well as several boutique resorts in the Lio Tourisim Estate. Al also sits as President of the owning companies of the Fairmont and Raffles Hotels Makati, Holiday Inn & Suites Makati, and the various Seda Hotels in Bonifacio Global City, Nuvali, Davao, Cagayan de Oro, Iloilo, Quezon City, Bacolod, Cebu and Lio in El Nido. In addition, he serves as Vice President and Director of the Philippine Hotel Owners Association. He graduated with a degree of B.S. Hotel & Restaurant Administration from the University of the Philippines, Diliman and has been with Ayala Land for 21 years. Christopher B. Maglanoc, Filipino, 47, is a Vice President of ALI since April 2013 and is currently President of Avida Land Corporation. He was Chief Operating Officer and Head of Project and Strategic Management in Avida Land before he was elected as President of the Company effective January 1, 2012. Prior to his stint in Avida in 2004, he occupied Management positions in various business units in Ayala Land, Inc. (i.e. Commercial Centers, Corporate Planning, and Alveo Land, Inc.). His other significant positions include: Chairman of Avida Sales Corp.; President of Avencosouth Corp.; Director of AmicaSSA Process Solutions, Inc., BellaVita, Blue Horizons Holdings Pte Ltd., and BGNorth Properties, Inc. He graduated from UP Los Baños with degrees in BA Sociology and BS Economics in 1990 and 1992, respectively. He finished his MBA from the Asian Institute of Management and attended the International Student Exchange Program in Copenhagen Business School in Denmark in 1997.

50
Romeo T. Menpin, Jr., Filipino, 49, is a Vice President of ALI since January 2014. He is currently the Head of the Construction Methods and Support Group of Makati Development Corporation (MDC). He is also currently the President of MDC Equipment Solutions, Inc. and MDC Conqrete, Inc. He is also a Director of Philipipine Integrated Energy Solutions, Inc. (PhilEnergy) Before joining MDC, he was a Director, President and Chief Operating Officer of Ayala Property Management Corporation (APMC) and also the President of PhilEnergy. He joined ALI in May 2008 from Kuok Group of Companies where he was a Vice President and Head of Mall Operations of Shangri-la Plaza Corporation. Prior to this, he also held various management positions from APMC and Laguna Technopark, Inc.. He graduated with a degree of Bachelor of Science in Mechanical Engineering from Mapua Institute of Technology and completed units in Masters in Business Administration from De La Salle University in 2001. Carol T. Mills, Filipino, 46, has served as Vice President of ALI since November 2016. She is the President of Ayala Land Offices, Inc. She is Chairman and President of various Ayala Land Offices subsidiaries namely UP North Property Holdings, Inc., First Gateway Real Estate Corp., One Dela Rosa Property Development Inc., ALO Prime Realty Corp., Glensworth Development Inc., Hillsford Property Corp., and Sunnyfield E-Office Corp.; President of North Eastern Commercial Corp. and Makati Cornerstone Leasing Corp as well as a Director of North Triangle Depot Commercial Corp., ALI Capital Corp., DirectPower Services, Inc. and Central Block Developers Inc. She joined ALI in 1993 and prior to her current position, she was Deputy Head of Business Development for Ayala Malls Group from 2008 to 2013, General Manager for Alabang Town Center from 2004 to 2008, and Operations Manager for Glorietta from 2000 to 2004. She graduated Magna Cum Laude from the University of the Philippines in 1993 with a Bachelor of Science degree in Business Administration and earned her Masters in Business Administration from the Amos Tuck School of Business, Dartmouth College in New Hampshire, USA in 1998. William Thomas F. Mirasol, Filipino, 54, is a Vice President of ALI since January 2014 He was the Chief Operating Officer and Senior Vice President of Ortigas & Co. (OCLP Holdings, Inc.) and a director of a number of subsidiaries of ALI. In his 25 years with the company, he has handled various business lines including retail operations, commercial project development, commercial leasing and operations, Land & House development and sales force organization & management for local and international markets. He graduated from De La Salle University Manila with a degree in Commerce in 1989. He finished his MBM from the Asian Institute of Management in 1992. Rodelito J. Ocampo, Filipino, 55, is a Vice President of ALI since December 2010. He is currently Makati Development Corporation’s (MDC) Head of Construction Operations and the President of MDC BuildPlus. Before his MDC assignment, he served as Technical Services Head of Avida Land Corp. and Alveo Land Corp., wholly owned subsidiaries of ALI and Head of the Construction Management of ALI Residential Buildings. Prior to joining ALI, he was employed by a construction firm where he held various engineering and project management positions for a period of 10 years. He is a licensed Civil Engineer. He graduated from Mapua Institute of Technology with a degree in BS Civil Engineering in 1983. Ginaflor C. Oris, Filipino, 51, is currently a Vice President of ALI and the Chief Finance Officer and Corporate Finance and Procurement Group Head of Makati Development Corporation (MDC). Prior to her assignment to MDC, she was the Managing Director for Corporate Finance and Asset Management of Ayala Corporation (AC). She was concurrently the CFO of Azalea Group, which held AC’s various investments in information and communications technology (ICT), business process outsourcing (BPO), venture capital funds and emerging market funds. She brings with her more than 20 years of experience gained from AC and BPI Capital Corporation covering strategic financial management, execution of mergers, acquisitions and divestment transactions, financial reporting, controls, risk management and oversight of some of AC’s portfolio investments and other assets. She graduated from Ateneo de Manila University with a degree of B.S Mathematics major in Computer Science in 1987. She completed Master in Business Management at Asian Institute of Management in 1992. Angelica L. Salvador, Filipino, 56, is a Vice President of ALI, and is currently the Controller of the Company. Her other key functions are as President of Aprisa Business Process Solutions, Inc. and

51
Member of the Board of Directors of Amaia Land Corp and of AmicaSSa Process Solutions, Inc. Prior to her current assignment, she was the Chief Finance Officer of the ALI Residential Business Group and of various ALI-owned subsidiaries including Alveo Land Corp., Ayala Property Management Corp., Ayala Land International Sales, Inc, and Laguna Technopark, Inc. Before joining Ayala Land, she was part of the Internal Audit Team of Ayala Corporation. She graduated cum laude from the University of the Philippines Diliman with Bachelor of Science degree in Business Administration and Accountancy, and obtained her Master’s in Business Management (MBM) degree from the Asian Institute of Management. Eliezer C. Tanlapco, Filipino, 69, is the Group Head of Human Resources and Public Affairs and member of the Management Committee of ALI. Prior to this role, he was a Human Resources Consultant for Ayala Group Counselors Corporation and Ayala Corporation from which he retired as Employee Relations and Services Director. He was previously ALI VP for Human Resources. He is a member of the Board of Directors of Ayala Multi-Purpose Cooperative and was the Vice Chair of Ayala Group HR Council, Ayala Group Corporate Security Council, and Champion of Ayala Group Labor Relations Network. He has had extensive work experience as Senior Leader in Human Resources and Community Development for multinational companies locally and abroad. He practiced law with a law firm and with the Office of the President of the Philippines. He holds a Bachelor of Arts degree from the University of the Philippines and earned his Law Degree at Ateneo de Manila University. He completed his Management Development Program from the Asian Institute of Management, and Strategic Business Economics Program from the University of Asia and the Pacific, both with distinction. Maria Rowena Victoria M. Tomeldan, Filipino, 57, is a Vice President of ALI and President and CEO of Prime Orion Philippines, Inc. Prior to this she was the Head of Ayala Malls Group of ALI. Her other significant positions include: Chairman and President of AMSI, Inc., Orion Property Development, Inc., LCI Commercial Ventures, Inc., FLT Prime Insurance Corporation and Bay City Commercial Ventures Corp.; Vice Chairman of the Board of Directors of Lagoon Development Corporation; Director and President of Laguna Technopark, Inc. and Orion Land Inc.; Director Ayalaland Commercial Reit, Inc.; and Governor of the Ayala Center Estate Association, Inc. Presently, she is a board member of the International Council of Shopping Centers (ICSC) - Asia Advisory Board and is a 2015 ICSC Trustees Distinguished Service Awardee. She was a cum laude graduate of Bachelor of Arts in Economics from the University of the Philippines in 1983 and earned her Masters in Business Administration (MBA) degree from the same university in 1988. She finished the Executive Development Program at the Aresty Institute of Executive Education in Wharton University, Pennsylvania, USA in 2005. Jennylle S. Tupaz, Filipino, 46, is Vice President of ALI and head of the AyalaMalls Group. Prior to joining the commercial business of ALI in 2018, she was involved in the residential development business for over 21 years. She was president of Alveo Land Corp., ALI’s upscale residential brand, where she spent 11 years leading project development. She held earlier positions in Avida and the Leisure & Lifestyle Communities Group (eventually merged with Ayala Land Premier). She holds a Bachelor of Science degree in Statistics from the University of the Philippines, and a Master’s Degree in Business Administration from the University of Chicago Booth School of Business. Amelia Ann T. Alipao, Filipino, 56 is currently Assistant Vice President and Chief Information Officer of ALI. She has been appointed as Group Data Protection Officer for ALI Group of Companies in 2017 and currently a member of the Data Privacy Council for Real Estate of the National Privacy Commission. She is also a member of the Board of Aprisa Business Process Inc. Prior to joining ALI she took on dual roles in SAP Philippines as Account Manager handling government accounts and as Project Manager for SAP Implementation. She also served as Assistant Vice President in Coca-Cola Bottlers Inc where she handled various IT systems implementation and delivery. Her IT career started as IT Instructor in I/Act of SGV. Her experience combines an agile exposure as an IT practitioner for over 2 decades. She holds a Bachelor in Arts in Biology and Bachelor of Science in Business Management from De La Salle University. Solomon M. Hermosura, Filipino, 56, has served as the Corporate Secretary of the Company since April 2011 and the Group General Counsel of the Company since April 2015. He was the General Counsel from April 2014 to April 2015. He is a Managing Director of Ayala Corporation and a member of its

52
Management Committee since 2009 and the Ayala Group Management Committee since 2010. He is also the Group Head of Corporate Governance, Chief Legal Officer, Chief Compliance Officer, Corporate Secretary and Data Protection Officer of Ayala Corporation. He is the CEO of Ayala Group Legal. He also serves as Corporate Secretary of Globe Telecom, Inc., Manila Water Company, Inc., Integrated Micro-Electronics, Inc., Ayala Foundation, Inc. He also serves as a Corporate Secretary and a member of the Board of Directors of a number of companies in the Ayala group. He is currently a member of the faculty of the College of Law of San Beda University. He served as a Director of Bank of the Philippine Islands from April 18, 2013 to April 9, 2014. He graduated valedictorian with Bachelor of Laws degree from San Beda College in 1986 and placed third in the 1986 Bar Examination. Significant Employees The Company considers its human resources working as a team as a key element for its continued success. But the Company has no employee who is not an executive officer and who is expected to make individually on his own a significant contribution to the business. Family Relationships Fernando Zobel de Ayala, Chairman of the Board of Directors, and Jaime Augusto Zobel de Ayala, Vice Chairman, are brothers. Involvement in Certain Legal Proceedings (over the past 5 years) None of the Directors or Executive Officers is involved in any material pending legal proceedings in any court or administrative agency of the government. a. None of them has been involved in any bankruptcy petition. b. None of them has been convicted by final judgment in a criminal proceeding or being subject to a
pending criminal proceeding, both domestic and foreign. c. None of them has been subject to any order, judgment or decree of any court of competent
jurisdiction (domestic or foreign) permanently or temporarily enjoining, barring, suspending or otherwise limiting their involvement in any type of business, securities, commodities or banking activities.
d. None of them has been found by a domestic or foreign court of competent jurisdiction (in a civil
action), the Commission or comparable foreign body, or a domestic or foreign exchange or other organized trading market or self regulatory organization, to have violated a securities or commodities law or regulation.
Item 10. Executive Compensation Directors and Executive Officers Directors. Article IV Section 17 of the Company’s By-Laws provides:
“Section 17 – Each director of the Corporation shall be entitled to receive from the Corporation, pursuant to a resolution of the Board of Directors, fees and other compensation for his services as director. The Board of Directors shall have the sole authority to determine the amount, form, and structure of the fees and other compensation of directors. In no case shall the total yearly compensation of directors exceed one percent (1%) of the net income before income tax of the Corporation during the preceding year.
The compensation and remuneration committee of the Board of Directors shall have

53
the responsibility for recommending to the Board of Directors the fees and other compensation for directors. In discharging this duty, the committee shall be guided by the objective of ensuring that the level of compensation should fairly pay directors for work required in a company of the Corporation’s size and scope.” (As amended on April 13, 2011.)
During the 2011 annual stockholders’ meeting, the stockholders ratified the resolution increasing the remuneration of non-executive directors as follows:
From To Retainer Fee: P 500,000.00 P 1,000,000.00 Board Meeting Fee per meeting attended: P 100,000.00 P 200,000.00
Committee Meeting Fee per meeting attended: P 20,000.00 P 100,000.00
None of the directors, in their personal capacity, has been contracted and compensated by the Company for services other than those provided as a director. Officers. The Company adopts a performance-based compensation scheme. The total annual compensation of the President and top four highly compensated executives amounted to P205.4 million in 2017 and P235.25 million in 2018. The projected total annual compensation for the current year is P243.86 million.
Total compensation paid to all senior personnel from Manager and up amounted to P1,064 million in 2017 and P1,125.52 million in 2018. The projected total annual compensation for the current year is P1,204.3 million.
Name and Principal Position Year Salary Other Variable Pay Bernard Vincent O. Dy* President & CEO Dante M. Abando Senior Vice President Anna Ma. Margarita B. Dy Senior Vice President Jose Emmanuel H. Jalandoni Senior Vice President Jaime E. Ysmael Senior Vice President
CEO & Most Highly Compensated Executive Officers
Actual 2017 P112.3M P93.1M Actual 2018 P122.95M P112.3M Projected 2019 P131.56M **P112.3M
All other officers*** as a group unnamed
Actual 2017 P701.0M P363.0M Actual 2018 P706.05M P419.47M Projected 2019 P755.47M **P448.83M
* Compensation includes full year effect of CEO and market adjustments to selected officers for retention purposes. ** Exclusive of Stock Option exercise. *** Managers and up. The total annual compensation paid to all senior personnel from Manager and up was all paid in cash. The total annual compensation includes the basic salary and other variable pay (guaranteed bonus and performance bonus).

54
The Company has no other arrangement with regard to the remuneration of its existing directors and officers aside from the compensation received as herein stated.
Each executive officer executed an employment contract with the Company for an indefinite period (the terms and conditions of which are in accordance with existing laws) and is entitled to receive retirement benefits in accordance with the terms and conditions of the Company’s BIR-registered Employees’ Retirement Fund. There is no plan or arrangement by which the Executive Officers will receive from the Company any form of compensation in case of a change-in-control of the Company or change in the officers’ responsibilities following such change-in-control. Options Outstanding Since 1998, the Company has offered its officers options to acquire common shares under its executive stock option plan (ESOP).
There were no ESOP shares available as of end-December 2018. Item 11. Security Ownership of Certain Record and Beneficial Owners and Management
(a) Security Ownership of Record and Beneficial Owners of more than 5% as of January 31, 2019:
Title of Class
Name, Address of Record Owner and Relationship with Issuer
Name of Beneficial Owner and Relationship with Record Owner
Citizenship No. of Shares Held
Percent (of total outstanding shares)
Common Ayala Corporation14 32/F to 35/F, Tower One and Exchange Plaza Ayala Triangle Ayala Ave., Makati City
Ayala Corporation15 Filipino 6,892,125,606 24.79059%
Preferred 12,163,180,640 43.75028% Common PCD Nominee
Corporation (Non-Filipino)16 G/F MSE Bldg. Ayala Ave., Makati City
PCD participants acting for themselves or for their customers17
Various Non-Filipino
5,510,752,668 19.82187%
Common PCD Nominee Corporation (Filipino)16 G/F MSE Bldg. Ayala Ave., Makati City
PCD participants acting for themselves or for their customers17
Filipino 2,044,372,961 7.35350%
14 Ayala Corporation (“AC”) is the parent of the Company. 15 Under the By-Laws of AC and the Revised Corporation Code, the AC Board has the power to decide how AC’s shares are to be voted. 16 PCD is not related to the Company. 17 Each beneficial owner of shares through a PCD participant is the beneficial owner to the extent of the number of shares in his account with the PCD participant. The beneficial owner, with certification of ownership of shares from the PCD Participant, has the power to vote either in person or by proxy. Out of the 7,555,125,629 common shares registered in the name of PCD Nominee Corporation, 1,905,943,436 or 6.85557% of the voting stock is for the account of Deutsche Bank Manila (DB), 1,383,760,038 or 4.97731% of the voting stock is for the account of The Hongkong and Shanghai Banking Corporation (HSBC). As advised to the Company, none of HSBC, DB or any of its customers beneficially own more than 5% of the Company’s common shares.

55
(b) Security Ownership of Directors and Management (Executive Officers) as of January 31, 2019.
Title of Class
Name of Beneficial Owner
Amount and Nature of Beneficial Ownership
Citizenship Percent (of total outstanding shares)
Directors Common Fernando Zobel de Ayala (direct) 12,000 Filipino 0.00004% Common Jaime Augusto Zobel de Ayala (direct) 12,000 Filipino 0.00004% Common Bernard Vincent O. Dy (direct & indirect) 13,924,757 Filipino 0.05009% Common Antonino T. Aquino (direct & indirect) 20,305,226 Filipino 0.07304% Common Arturo G. Corpuz (direct & indirect) 6,253,511 Filipino 0.02249% Common Jaime C. Laya (direct) 10,000 Filipino 0.00004% Common Delfin L. Lazaro (direct) 1 Filipino 0.00000% Common Rizalina G. Mantaring (direct) 1 Filipino 0.00000% Common Cesar V. Purisima (direct) 1 Filipino 0.00000% CEO and Most Highly Compensated Executive Officers Common Bernard Vincent O. Dy (direct & indirect) 13,924,757 Filipino 0.05009% Common Dante M. Abando (direct & indirect) 5,062,611 Filipino 0.01821% Common Anna Ma. Margarita B. Dy (indirect) 6,035,699 Filipino 0.02171% Common Jose Emmanuel H. Jalandoni (direct & indirect) 6,497,357 Filipino 0.02337% Common Jaime E. Ysmael (direct & indirect) 8,868,248 Filipino 0.03190% Other Executive Officers Common Augusto D. Bengzon (indirect) 2,675,273 Filipino 0.00962% Common Robert S. Lao (indirect) 1,335,685 Filipino 0.00480% Common Lyle A. Abadia (indirect) 671,708 Filipino 0.00242% Common Leovigildo D. Abot (direct & indirect) 1,224,876 Filipino 0.00440% Common Aniceto V. Bisnar, Jr. (indirect) 2,064,357 Filipino 0.00742% Common Manny A. Blas II (direct & indirect) 2,070,054 Filipino 0.00744% Common Ruby P. Chiong (indirect) 1,006,719 Filipino 0.00362% Common Dindo R. Fernando (indirect) 830,332 Filipino 0.00299% Common Javier D. Hernandez (indirect) 302,609 Filipino 0.00109% Common Joseph Carmichael Z. Jugo (indirect) 623,128 Filipino 0.00224% Common Michael Alexis C. Legaspi (indirect) 4,351,313 Filipino 0.01565% Common Christopher B. Maglanoc (indirect) 831,679 Filipino 0.00299% Common Romeo T. Menpin (direct & indirect) 501,629 Filipino 0.00180% Common Carol T. Mills (indirect) 733,193 Filipino 0.00264% Common William Thomas F. Mirasol (direct & indirect) 377,958 Filipino 0.00136% Common Rodelito J. Ocampo (direct & indirect) 2,676,837 Filipino 0.00963% Common Ginaflor C. Oris (indirect) 636,135 Filipino 0.00229% Common Angelica L. Salvador (direct & indirect) 1,114,010 Filipino 0.00401% Common Maria Rowena Victoria M.
Tomeldan (direct & indirect) 1,188,280 Filipino 0.00427%
Common Jennylle S. Tupaz (indirect) 579,188 Filipino 0.00208% Common Eliezer C. Tanlapco (indirect) 205,651 Filipino 0.00074% Common Amelia Ann T. Alipao (indirect) 1,399,828 Filipino 0.00504% Common
Solomon M. Hermosura (direct) 480
Filipino 0.00000%
Preferred (direct) 480 0.00000% All Directors and Officers as a group 94,382,814 0.33949%
None of the members of the Company’s directors and management owns 2.0% or more of the outstanding capital stock of the Company. (c) Voting Trust Holders of 5% or more
The Company knows of no persons holding more than 5% of common shares under a voting trust or similar agreement.

56
(d) Changes in Control
No change of control in the Company has occurred since the beginning of its last fiscal year. Item 12. Certain Relationships and Related Transactions Related Party Transactions The Company and its subsidiaries (the “Group”), in their regular conduct of business, have entered into transactions with associates and other related parties principally consisting of advances and reimbursement of expenses, purchase and sale of real estate properties, construction contracts, and development, management, underwriting, marketing, leasing and administrative service agreements. Sales and purchases of goods and services to and from related parties are made on an arm’s length basis and at current market prices at the time of the transactions. However, no other transaction, without proper disclosure, was undertaken by the Group in which any director or executive officer, any nominee for election as director, any beneficial owner of more than 5% of the Company’s outstanding shares (direct or indirect) or any member of his immediate family was involved or had a direct or indirect material interest. ALI employees are required to promptly disclose any business and family-related transactions with the Company to ensure that potential conflicts of interest are surfaced and brought to the attention of management. Parent Company / Major Holders As of January 31, 2019, Ayala Corporation owns 68.54% of the total outstanding voting shares of the Company. PART V – CORPORATE GOVERNANCE Item 13. Compliance with leading practice on Corporate Governance Ayala Land has always been committed to strong and transparent corporate governance, going well beyond mere compliance with the code mandated by law. Ayala Land made several important improvements to its governance in 2004, focusing on increasing the involvement of various governance bodies, strengthening performance management, and ensuring compliance with Philippine Accounting Standards. In 2007, the Company adopted several initiatives aimed toward achieving governance excellence. These include conduct of a Self-Assessment Survey by the Board of Directors and Board Committees, development of Business Contingency Plans, adoption of risk-based audit approach and independent quality review of the Internal Audit function. Ayala Land believes that these changes will streamline its existing business models, improve execution, reduce risks, and better safeguard the collective and individual interests of its diverse set of shareholders. Ayala Land seeks to promote and enhance compliance to good corporate governance. Ayala Land requires the observance of best practices and transparency in all of its subsidiaries, including those that are not listed on the PSE and not covered by the SEC Code of Corporate Governance. The evaluation system which was established to measure or determine the level of compliance of the Board of Directors and top-level management with its Revised Manual of Corporate Governance (the “Revised Manual”) consists of a Customer Satisfaction Survey which is filled up by the various functional groups indicating the compliance rating of certain institutional units and their activities. The evaluation process also includes a Board Performance Assessment which is accomplished by the Board of Directors

57
indicating the compliance ratings. The above are submitted to the Compliance Officer who issues the required certificate of compliance with the Revised Manual of the SEC. To ensure good governance, the Board establishes the vision, strategic objectives, key policies, and procedures for the management of the company, as well as the mechanism for monitoring and evaluating Management’s performance. The Board also makes certain the presence and adequacy of internal control mechanisms for good governance. There were no deviations from the Revised Manual. The Company has adopted in the Revised Manual the leading practices and principles of corporate transparency, and full compliance therewith has been made since the adoption of the Revised Manual. The Company is taking further steps to further strengthen adherence to principles and practices of good corporate governance. Item 14. Exhibits and Reports on SEC Form 17-C (a) Exhibits - See accompanying Index to Exhibits The following exhibit is incorporated by reference in this report:
2018 Consolidated Audited Financial Statements The other exhibits, as indicated in the Index to Exhibits are either not applicable to the Company
or require no answer. (b) Reports on SEC Form 17-C The following current reports have been reported by Ayala Land during the year 2018.
Unstructured Disclosures Ayala Land acquires additional stake in MCT Bhd Board Attendance for 2017 Issuance of notice for unconditional mandatory take-over offer to MCT Bhd Conclusion of FamilyMart sale transaction MCT transfer of shares MCT notice of take-over offer dispatch Analysts’ Briefing Invitation on FY 2017 results Press Release on Ayala Land’s FY 2017 results Notice and Agenda of 2018 Annual Stockholders’ Meeting Declaration of Cash Dividends Results of the Regular Meeting of the Board of Directors on Feb 2018 Closing of MCT Bhd unconditional mandatory take-over offer Disclosure on Ayala Land’s Audited Financial Statements as of December 31, 2017 Approval of exchange of shares in Laguna Technopark, Inc. (LTI) into additional
shares in Prime Orion Philippines, Inc. (POPI) Signing of Deed of Absolute Sale with Central Azucarera de Tarlac, Inc. Results of the 2018 Annual Stockholders’ Meeting Results of the 2018 Organizational Meeting of Board of Directors Analysts’ Briefing Invitation on 1Q 2018 results Amended results of the 2018 Organizational Meeting of Board of Directors Press Release on Ayala Land’s 1Q 2018 results ALI enters into a Memorandum of Understanding with Green Square Properties

58
Corporation (GSPC) and Green Circle Properties Resources, Inc. Corporate Governance Training Attendance of Officer Analysts’ Briefing Invitation on 1H 2018 results Press Release on Ayala Land’s 1H 2018 results Results of the Regular Meeting of the Board of Directors on August 2018 Declaration of Cash Dividends Analysts’ Briefing Invitation on 9M 2018 results Press Release on Ayala Land’s 9M 2018 results Notice of 2019 Annual Stockholders’ Meeting
Clarification of News Reports
Ayala, Eton to invest P53 billion in township (BusinessWorld)
Its Final: Ayala Land loses Las Pinas golf course (The Manila Times Internet Edition)
ALI spending record P110.8 billion this year (philSTAR.net)
ALI purchase of Central Azucarera de Tarlac assets gets PCC OK (philSTAR.net)
Ayala Land seeks SEC nod to issues P10-billion 10-year bonds (manilastandard.net)
Ayala Land mulls P5-billion bond issuance (BusinessWorld Online) Ayala Land eyes fund-raising in early 2019 (BusinessWorld Online) Ayala Land pouring P18B for Habini Bay project (BusinessWorld Online)
(c) Reports under SEC Form 17-C filed None. (d) Material events subsequent to the end of the reporting period that have not been reflected in the financial statements of the reporting period On February 27, 2019, the Board of Directors of Ayala Land, Inc. (ALI) at its regular meeting approved the following:
1. The declaration of cash dividends of P0.26 per outstanding common share. This first half regular cash dividends reflect a 3% increase from last year’s first half dividend per share of P0.252. The cash dividend will be payable on March 29, 2019 to stockholders of common shares as of record date March 13, 2019.
2. The Company’s 2019 stock option program pursuant to our Employee Stock Ownership Plan (the “Plan”). The program authorizes the grant to qualified executives, in accordance with the terms of the Plan, stock options covering up to a total of 14,430,750 common shares at a subscription price of P44.49 per share, which is the average price of our common shares at the Philippine Stock Exchange over the last 30-day trading as of February 26, 2019.
3. The filing with the Securities and Exchange Commission (“SEC”) of a 3-year shelf registration of up to P 50 billion of debt securities (the “Shelf Registration”).
4. The raising of up to P45 billion through: (a) retail bonds of up to P16 billion under the Shelf Registration and listed on the Philippine Dealing and Exchange Corporation (PDEx), (b) SEC-exempt Qualified Buyer Notes of up to P4 billion for enrollment on the PDEx, and (c) bilateral term loans of up to P 25 billion to partially finance general corporate requirements and to refinance maturing loans.

59
On February 1, 2019, the Executive Committee of Ayala Land, Inc. (ALI) approved the purchase of a 20% equity interest owned by Mitsubishi Corporation in Laguna Technopark, Inc. (LTI), equivalent to 8,051 common shares, with a total value of P800 million. Subsequently, ALI will exchange the 20% equity interest in LTI for additional shares of stock in Prime Orion Philippines, Inc. (POPI), equivalent to 323,886,640 common shares, subject to conditions to be fulfilled by POPI. This transaction will strengthen POPI’s vision to be the leading real estate logistics and industrial estate developer and operator in the Philippines.

Scanned with CamScanner

61
AYALA LAND, INC. INDEX TO EXHIBITS Form 17-A – Item 7
No.
(3) Plan of Acquisition, Reorganization, Arrangement, Liquidation, or Succession n.a. (5) Instruments Defining the Rights of Security Holders, Including Indentures n.a. (8) Voting Trust Agreement n.a. (9) Material Contracts n.a. (10) 2018 Consolidated Financial Statements: Ayala Land, Inc. and Subsidiaries (with notarized Statement of Management Responsibility)
Attached 2018 Financial Statements of “significant” subsidiaries/affiliates which are not consolidated n.a. (13) Letter re: Change in Certifying Accountant n.a. (16) Report Furnished to Security Holders n.a. (18) Subsidiaries of the Registrant 62 (19) Published Report Regarding Matters Submitted to Vote of Security Holders n.a. (20) Consent of Experts and Independent Counsel n.a. (21) Power of Attorney n.a. (29) Additional Exhibits n.a. ------- n.a. Not applicable or require no answer.

62
AYALA LAND, INC. – SUBSIDIARIES, ASSOCIATES AND JOINT VENTURES (As of December 31, 2018)
The consolidated financial statements represent the consolidation of the financial statements of Ayala Land and the following subsidiaries, associates, and joint ventures as of December 31, 2018:
Effective Ownership
% Real Estate: Alveo Land Corporation (Alveo) 100%
Serendra, Inc. 39 Solinea, Inc. (Solinea) 65 BGSouth Properties, Inc. (BGS) 50 Portico Land Corp. (Portico) 60
Serendra, Inc. 28 Amorsedia Development Corporation 100
OLC Development Corporation and Subsidiary 100 HLC Development Corporation 100 Allysonia International Ltd. 100
Avida Land Corporation (Avida) 100 Buklod Bahayan Realty and Development Corp. 100 Avida Sales Corp. and Subsidiaries 100 Amicassa Process Solutions, Inc. 100 Avencosouth Corp. (Avencosouth) 70 BGNorth Properties, Inc. (BGN) 50
Amaia Land Co. (Amaia) 100 Amaia Southern Properties, Inc. (ASPI) 65
AyalaLand Premier, Inc. 100 Ayala Land International Sales, Inc. (ALISI) 100
Ayalaland International Marketing, Inc. (AIMI) 100 Ayala Land International (Singapore) Pte. Ltd. 100 Ayalaland International Marketing (Hong Kong) Limited (ALIM HK) 100 Ayala Land International Marketing , SRL (ALIM SRL) 100 Ayala Land International Marketing London 100
Ayala Land Sales, Inc. 100 Southportal Properties, Inc. 65 Buendia Landholdings, Inc. 100 Crans Montana Holdings, Inc. 100 Crimson Field Enterprises, Inc. 100 Ecoholdings Company, Inc. (ECI) 100 NorthBeacon Commercial Corporation NBCC) 100 Red Creek Properties, Inc. 100 Regent Time International, Limited (Regent Time) (British Virgin Islands) 100 North Eastern Commercial Corp. (formerly Asterion Technopod, Incorporated) 100 Westview Commercial Ventures Corp. (formerly Crestview E-Office Corporation) (Westview)
100
North Ventures Commercial Corp. (formerly Fairview Prime Commercial Corp. (formerly Gisborne Property Holdings, Inc.)
100
Hillsford Property Corporation (HPC) 100 Primavera Towncentre, Inc. (PTI) 100 Summerhill E-Office Corporation (Summerhill) 100 Sunnyfield E-Office Corporation (Sunnyfield) 100 Subic Bay Town Centre, Inc. 100 Regent Wise Investments Limited (Regent Wise) (Hongkong company) 100
AyalaLand Real Estate Investments Inc. 100 AyalaLand Advisory Broadway Inc. 100

63
AyalaLand Development (Canada) Inc. 100 AyalaLand OpenAsia Holdings PTE, Limited 100 Blue Horizons Holdings PTE, Limited 100 Modular Construction Technology (MCT) Bhd. 66
AyalaLand Commercial REIT, Inc. (ALCRI) 100 Arvo Commercial Corporation (Arvo) 100 BellaVita Land Corporation (BellaVita) 100 Nuevo Centro, Inc. (Nuevo Centro) 54
Alviera Country Club, Inc. 50 Cavite Commercial Town Center, Inc. 100 One Dela Rosa Property Development, Inc. 100 AyalaLand Offices, Inc. (ALO) (formerly ALI Property Partners Corp. (APPCo)) 100
One Dela Rosa Property Development, Inc. - Glensworth Development, Inc. (Glensworth) 100 UP North Property Holdings, Inc. 100
ALO Prime Realty Corporation 100 Makati Cornerstone Leasing Corp. 100 Arca South Commercial Ventures Corp. 100 Capitol Central Commercial Ventures Corp. 100 Bay City Commercial Ventures Corp. 100 Laguna Technopark, Inc. (LTI) 95
Ecozone Power Management, Inc. 95 Aurora Properties Incorporated 80
Soltea Commercial Corp. 16 Vesta Property Holdings, Inc. 70 Altaraza Prime Realty Corporation 100 Prow Holdings Inc 55 Station Square East Commercial Corporation (SSECC) 69 Next Urban Alliance Development Corp. 100 Accendo Commercial Corp. (Accendo) 67
Avencosouth Corp. 20 Aviana Development Corporation 7
Aviana Development Corporation 50 Cagayan de Oro Gateway Corp. (CDOGC) 70 Ceci Realty, Inc. (Ceci) 60
Soltea Commercial Corp. 12 Soltea Commercial Corp. 60 CMPI Holdings, Inc. 60
CMPI Land, Inc. 36 ALI-CII Development Corporation (ALI-CII) 50 Roxas Land Corporation (RLC) 50 Adauge Commercial Corporation (Adauge) 60 Ayalaland Estates, Inc. (formerly Southgateway Development Corp.) 100 Ayalaland MetroNorth, Inc. (AMNI) 100 Verde Golf Development Corporation 100 North Triangle Depot Commercial Corporation (NTDCC) 73 BGWest Properties, Inc. (BGW) 50 Lagdigan Land Corporation 60 Central Block Developers, Inc. 45 Cebu Holdings, Inc. (CHI) 70
Cebu Leisure Company, Inc. 70 CBP Theatre Management Inc. 70 Taft Punta Engaño Property Inc. (TPEPI) 39 Cebu Insular Hotel Company, Inc. (CIHCI) 26 Solinea, Inc. 25 Amaia Southern Properties, Inc. (ASPI) 25

64
Southportal Properties, Inc. 25 Central Block Developers, Inc. 39
Alabang Commercial Corporation (ACC) 50 South Innovative Theater Management (SITMI) 50
ALI Commercial Center Inc. 100 AMC Japan Concepts, Inc. 75
Prime Orion Philippines Inc. 67 FLT Prime Insurance Corp. 55 Orion Solutions, Inc 70 Orion I Holdings Philippines, Inc. 70 OE Holdings, Inc. 70 Orion Land Inc. 70 Lepanto Ceramics, Inc. 70
Ayalaland Malls Synergies, Inc. 100 Ayala Land Malls, Inc. (formerly Solerte, Inc.) 100
AyalaLand Malls Vismin, Inc. 100 AyalaLand Malls NorthEast, Inc. 100
Construction: Makati Development Corporation (MDC) 100
MDC Subic, Inc. 100 MDC Build Plus, Inc. 100 MDC Conqrete, Inc. (MCI) 100 MDC Equipment Solutions, Inc. (MESI) 100 MDBI Construction Corp. (formerly MDC Triangle) 67
Hotels and Resorts: Ayala Hotels, Inc. (AHI) 50 AyalaLand Hotels and Resorts Corporation (AHRC) and Subsidiaries 100
ALI Makati Hotel & Residences, Inc. (formerly KHI-ALI Manila, Inc.) 80 ALI Makati Hotel Property, Inc. (formerly KHI Manila Property, Inc.) 80 Asian Conservation Company Limited and Subsidiary 100 Enjay Hotels, Inc. (Enjay) 100 Greenhaven Property Venture, Inc. (GPVI) 100 Cebu Insular Hotel Company, Inc. (CIHCI) 63 Bonifacio Hotel Ventures, Inc. 100 Southcrest Hotel Ventures, Inc. 67 Northgate Hotel Ventures, Inc. 70 North Triangle Hotel Ventures, Inc. 100 Ecosouth Hotel Ventures, Inc. 100 Sentera Hotel Ventures Inc. 100 Econorth Resorts Ventures, Inc. 100 ALI Triangle Hotel Ventures, Inc. 100 Circuit Makati Hotel Ventures, Inc. 100 Capitol Centre Hotel Ventures, Inc. 100 Arca South Hotel Ventures, Inc. 100 Sicogon Town Hotel, Inc. 100 Bay Area Hotel Ventures, Inc. 100 Makati North Hotel Ventures, Inc. 100 One Makati Hotel Ventures, Inc. 100 Sicogon Island Tourism Estate, Corp. 100 Asiatown Hotel Ventures, Inc. 100 One Makati Residential Ventures, Inc. 100
ALI Makati Hotel & Residences, Inc. (formerly KHI-ALI Manila, Inc.) 20 ALI Makati Hotel Property, Inc. (formerly KHI Manila Property, Inc.) 20 Ten Knots Phils., Inc. (TKPI) 60

65
Bacuit Bay Development Corporation 60 Lio Resort Ventures Inc. 60 North Liberty Resort Ventures Inc. 60 Paragua Eco-Resort Ventures Inc. 60 Lio Tourism Estate Management Corp. 60
Ten Knots Development, Corp. (TKDC) 60 Chirica Resorts Corp. 60 Kingfisher Capital Resources Corp. 60 Pangalusian Island Resort Corporation 60
Property Management: Ayala Property Management Corporation (APMC) 100
Prime Support Services, Inc. 100 Ayala Theatres Management, Inc. and Subsidiaries 100 DirectPower Services, Inc. (DirectPower) 100 Philippine Integrated Energy Solutions, Inc. (PhilEnergy) 100 Entertainment: Five Star Cinema, Inc. 100 Leisure and Allied Industries Philippines, Inc. (LAIP) 50 Others: ALInet.com, Inc. (ALInet) 100 First Longfield Investments Limited (First Longfield) (Hongkong company) 100
Green Horizons Holdings Limited 100 PCM Formosa Company Limited 50
Esta Galleria, Inc. 50 Aprisa Business Process Solutions, Inc. (Aprisa) 100 AyalaLand Club Management, Inc. 100 ALI Capital Corp. (formerly Varejo Corp.) 100
Integrated Eco-resort Inc. 100 Island Transvoyager, Inc. 100
Arca South Integrated Terminal, Inc. 100 Whiteknight Holdings, Inc. (WHI) 100 Ayalaland Medical Facilities Leasing Inc. (Ayala Land Healthcare Leasing Inc.) 100 Anvaya Cove Beach and Nature Club, Inc. 73 Anvaya Cove Golf and Sports Club, Inc. 76

66
AYALA LAND, INC.
INDEX TO SUPPLEMENTARY SCHEDULES
Form 17-A, Item 7 Supplementary Schedules (For schedules A-M please refer to 67 - 116) Report of Independent Public Accountants on Supplementary Schedules A. Financial Assets B. Amounts Receivable from Directors, Officers, Employees, Related Parties and Principal Stockholders (Other than Related Parties) C. Accounts Receivable from Related Parties which are eliminated during the Consolidation Period D. Intangible Assets - Other Assets E. Long-Term Debt F. Indebtedness to Related Parties (Long-Term Loans from Related Companies) G. Guarantees of Securities of Other Issuers H. Capital Stock I. Reconciliation of Retained Earnings Available for Dividend Declaration J. Map of Relationships of Companies within the Group K. List of Applicable Standards and Interpretations L. Financial Ratios M. Schedule and Use of Bond Proceeds
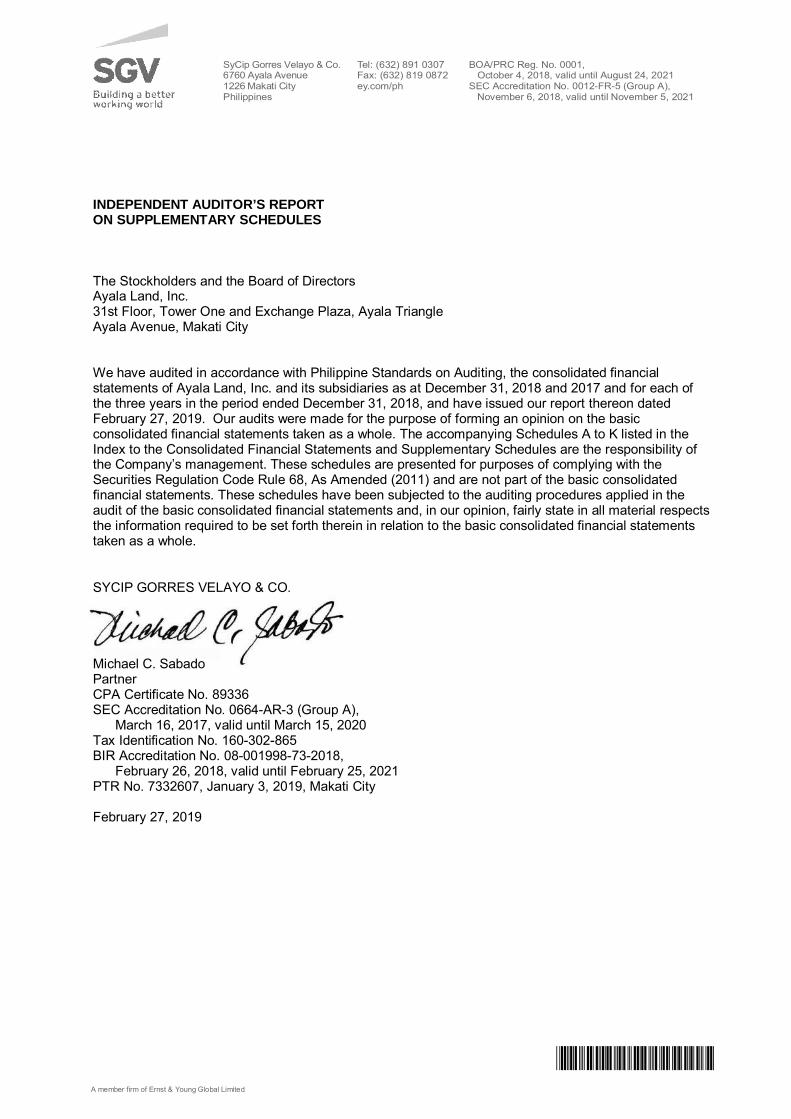
*SGVFS032855*
INDEPENDENT AUDITOR’S REPORTON SUPPLEMENTARY SCHEDULES
The Stockholders and the Board of DirectorsAyala Land, Inc.31st Floor, Tower One and Exchange Plaza, Ayala TriangleAyala Avenue, Makati City
We have audited in accordance with Philippine Standards on Auditing, the consolidated financialstatements of Ayala Land, Inc. and its subsidiaries as at December 31, 2018 and 2017 and for each ofthe three years in the period ended December 31, 2018, and have issued our report thereon datedFebruary 27, 2019. Our audits were made for the purpose of forming an opinion on the basicconsolidated financial statements taken as a whole. The accompanying Schedules A to K listed in theIndex to the Consolidated Financial Statements and Supplementary Schedules are the responsibility ofthe Company’s management. These schedules are presented for purposes of complying with theSecurities Regulation Code Rule 68, As Amended (2011) and are not part of the basic consolidatedfinancial statements. These schedules have been subjected to the auditing procedures applied in theaudit of the basic consolidated financial statements and, in our opinion, fairly state in all material respectsthe information required to be set forth therein in relation to the basic consolidated financial statementstaken as a whole.
SYCIP GORRES VELAYO & CO.
Michael C. SabadoPartnerCPA Certificate No. 89336SEC Accreditation No. 0664-AR-3 (Group A), March 16, 2017, valid until March 15, 2020Tax Identification No. 160-302-865BIR Accreditation No. 08-001998-73-2018, February 26, 2018, valid until February 25, 2021PTR No. 7332607, January 3, 2019, Makati City
February 27, 2019
SyCip Gorres Velayo & Co.6760 Ayala Avenue1226 Makati CityPhilippines
Tel: (632) 891 0307Fax: (632) 819 0872ey.com/ph
BOA/PRC Reg. No. 0001, October 4, 2018, valid until August 24, 2021SEC Accreditation No. 0012-FR-5 (Group A), November 6, 2018, valid until November 5, 2021
A member firm of Ernst & Young Global Limited

AYALA LAND, INC. AND SUBSIDIARIESSCHEDULE A - Financial AssetsAs of December 31, 2018
NAME OF ISSUING ENTITY AND ASSOCIATION OF EACH ISSUE
AMOUNT IN THE BALANCE SHEET
INCOME RECEIVED & ACCRUED
Loans and ReceivablesA. Cash in Bank 14,461,268,770Php 47,201,112Php
BPIPeso 4,044,255,994 14,631,664 Foreign Currency 61,309,059 956,393
Other Banks Peso 6,161,305,015 30,723,814 Foreign Currency 4,194,398,702 889,241
B. Cash Equivalents 1/ 9,478,437,160 397,995,187 BPI
Special Savings Account 22,011,459 Time Deposits 3,312,149,958 100,937,212 Others 4,773,213
Other BanksSpecial Savings Account 295,817 Time Deposits 6,166,287,202 261,097,769 Others 8,879,717
C. Loans and receivable 49,062,641,491 252,629,913 Trade 49,062,641,491 252,629,913 Advances to other companiesInvestment in bonds classified as loans and receivables 2/ - -
D . Financial Assets at FVPL 476,245,089 910,377 Investment in UITF 85,723,726 910,377 Investment in Funds 390,521,363
E. AFS Financial assets 1,495,794,541 - TOTAL : 74,974,387,051Php 698,736,589Php
1/ Cash equivalents are short term, highly liquid investments that are made for varying period of up to three (3) months depending on the immediate cash requirements of the group and earn interest at the respective short term rates.
2/ Investment in bonds classified as loans and receivables pertain to the Company's investment in unsecured subordinated notes of Land Bank of the Philippines and Development Bank of the Philippines and Company's investment in collateralized bonds of First Metro Investment Corp.


AYALA LAND, INC. AND SUBSIDIARIESSCHEDULE B - Amounts Receivable from Directors, Officers, Employees, Related Partiesand Principal Stockholders (Other than Related Parties)As of December 31, 2018
CURRENT NON-CURRENTEmployees
Notes Receivable 496,082,656Php 729,704,717Php 332,809,216Php 685,508,485Php 207,469,672Php 892,978,157Php Accounts Receivable 335,777,630 1,149,496,021 1,265,046,855 207,469,672 12,757,125 220,226,796
831,860,286Php 1,879,200,738Php 1,597,856,071Php 892,978,157Php 220,226,796Php 1,113,204,954Php
TOTALNAME BEGINNING BALANCE ADDITIONS DEDUCTIONS ENDING BALANCE

AYALA LAND INC. AND SUBSIDIARIESSchedule C - Accounts Receivable from Related Parties which are eliminated during the Consolidation PeriodAs of December 31, 2018
Receivable Balance per ALI-PARENT
Payable Balance per ALI Subsidiaries
Current Non-Current
Ayala Land, Inc. (ALI) Subsidiaries:Accendo Commercial Corp 1,106,979,387 1,106,979,387 1,106,979,387 Adauge Commercial Corp. 9,077,616 9,077,616 9,077,616 AKL Properties Inc. 56,000 56,000 56,000 Alabang Commercial Corporation (Conso) 24,512,433 24,512,433 24,512,433 ALI Capital Corp. (Conso) 50,240,816 50,240,816 50,240,816 ALI Commercial Center, Inc. 58,893,474 58,893,474 58,893,474 ALI-CII Development Corporation 11,023,909 11,023,909 11,023,909 ALO Prime Realty Corporation 150 150 150 Altaraza Prime Realty Corporation 236,317 236,317 236,317 Alveo Land Corporation (Conso) 3,588,393,074 3,588,393,074 3,588,393,074 Amaia Land Corporation (Conso) 1,214,882,987 1,214,882,987 1,214,882,987 Amorsedia Development Corporation (Conso) 526,795,896 526,795,896 526,795,896 Anvaya Cove Beach and Nature Club Inc 236,798 236,798 236,798 Anvaya Cove Golf and Sports Club Inc. 76,995,384 76,995,384 76,995,384 APRISA Business Process Solutions, Inc 209,119 209,119 209,119 Arca South Commercial Ventures Corp. 230,237,231 230,237,231 230,237,231 Arca South Integrated Terminal, Inc 12,482,712 12,482,712 12,482,712 Arvo Commercial Corporation 91,741,748 91,741,748 91,741,748 North Eastern Commercial Corp. 660,348,356 660,348,356 660,348,356 Aurora Properties, Inc. 71,832,311 71,832,311 71,832,311 Aviana Development Corporation 95,423,536 95,423,536 95,423,536 Avida Land Corporation (Conso) 5,490,884,025 5,490,884,025 5,490,884,025 Ayala Hotels Inc. 415,797,195 415,797,195 415,797,195 Ayala Land International Sales, Inc.(Conso) 123,292,180 123,292,180 123,292,180 Ayala Land Sales Inc. 53,207,038 53,207,038 53,207,038 Ayala Property Management Corporation (Conso) 92,592 92,592 92,592 Ayala Theaters Management, Inc. 77,733 77,733 77,733 AyalaLand Club Management, Inc. 24,894,573 24,894,573 24,894,573 AyalaLand Commercial REIT, Inc. 304 304 304 AyalaLand Hotels and Resorts Corp. (Conso) 100,955,569 100,955,569 100,955,569 Ayalaland Malls Synergies, Inc. 34,399,901 34,399,901 34,399,901 AyalaLand Malls, Inc. (Conso) 13,361,415 13,361,415 13,361,415 Ayalaland Medical Facilities Leasing Inc. 10,563,108 10,563,108 10,563,108 Ayalaland Metro North, Inc. 2,691,860 2,691,860 2,691,860 AyalaLand Offices, Inc. (Conso) 180,683,399 180,683,399 180,683,399 Bay City Commercial Ventures Corp. 1,444,544,573 1,444,544,573 1,444,544,573 BellaVita Land Corp. 695,185,661 695,185,661 695,185,661 BG West Properties, Inc 770,374,179 770,374,179 770,374,179 Buendia Landholdings, Inc. 84,716 84,716 84,716 Cagayan De Oro Gateway Corporation 456,876,226 456,876,226 456,876,226 Capitol Central Commercial Ventures Corp. 1,539,337,167 1,539,337,167 1,539,337,167 Cavite Commercial Towncenter Inc. 45,852,683 45,852,683 45,852,683 Cebu Holdings, Inc. (Conso) 838,728,394 838,728,394 838,728,394 CECI Realty Corp. 242,833,351 242,833,351 242,833,351 Central Block Developers, Inc. 2,721,842 2,721,842 2,721,842 CMPI Holdings, Inc (Conso) - - - Crans Montana Property Holdings Corporation 544,671 544,671 544,671 Crimson Field Enterprises, Inc. 195,444,766 195,444,766 195,444,766 Direct Power Services Inc. 6,273,201 6,273,201 6,273,201 Ecoholdings Company, Inc. 702,623 702,623 702,623 First Longfield Investments Ltd. (Conso) 717,741 717,741 717,741 FIVE STAR Cinema Inc. 2,587 2,587 2,587 Hillsford Property Corporation 200,841 200,841 200,841 Lagdigan Land Corporation 608,784 608,784 608,784 Leisure and Allied Industries Phils. Inc. 817,791 817,791 817,791 Makati Development Corporation (Conso) 99,623,196 99,623,196 99,623,196 Next Urban Alliance Development Corp. 107,262 107,262 107,262 North Triangle Depot Commercial Corp 859,999,707 859,999,707 859,999,707 North Ventures Commercial Corp. 46,807,474 46,807,474 46,807,474 NorthBeacon Commercial Corporation 4,708,568 4,708,568 4,708,568 Nuevocentro, Inc. (Conso) 2,316,786,011 2,316,786,011 2,316,786,011
Amount Owed by Ayala Land, Inc. (ALI) Subsidiaries to ALI PARENT
Page 1 of 22

Philippine Integrated Energy Solutions, Inc. 3,671,158 3,671,158 3,671,158 Primavera Towncentre, Inc. 25,382,017 25,382,017 25,382,017 Prime Orion Philippines, Inc. (Conso) 73,705,152 73,705,152 73,705,152 Red Creek Properties, Inc. 232,798,709 232,798,709 232,798,709 Regent Time International Ltd. 417,166 417,166 417,166 Regent Time International, Limited 97,348,097 97,348,097 97,348,097 Regent Wise Investments Limited(Conso) 62,915,189 62,915,189 62,915,189 Roxas Land Corp. 51,144,409 51,144,409 51,144,409 Serendra Inc. 144,589,902 144,589,902 144,589,902 Soltea Commercial Corp. 8,864,124 8,864,124 8,864,124 Ayalaland Estates, Inc. 1,623,992,114 1,623,992,114 1,623,992,114 Southportal Properties, Inc. 242,553,175 242,553,175 242,553,175 Station Square East Commercial Corp 1,176,947,707 1,176,947,707 1,176,947,707 Subic Bay Town Center Inc. 343,000 343,000 343,000 Summerhill Commercial Ventures Corp. 36,828,139 36,828,139 36,828,139 Sunnyfield E-Office Corp 9,839,502 9,839,502 9,839,502 Ten Knots Development Corporation(Conso) 41,057,365 41,057,365 41,057,365 Ten Knots Philippines, Inc.(Conso) 1,044,372 1,044,372 1,044,372 Verde Golf Development Corporation 94,416,964 94,416,964 94,416,964 Vesta Property Holdings Inc. 14,076,108 14,076,108 14,076,108 Westview Commercial Ventures Corp. 7,811,702 7,811,702 7,811,702 Whiteknight Holdings, Inc. 32,531,075 32,531,075 32,531,075 Ayalaland Premier, Inc. 9,470,368 9,470,368 9,470,368 Makati Cornerstone Leasing Corp. 9,137,886,189 9,137,886,189 9,137,886,189
Sub-Total 36,981,017,862 36,981,017,862 36,981,017,862 -
Receivable Balance per ALI Subsidiaries
Payable Balance per ALI Parent Current Non-Current
Ayala Land, Inc. (ALI) Subsidiaries:Accendo Commercial Corp 14,218,195 14,218,195 14,218,195 Adauge Commercial Corp. 253 253 253 Alabang Commercial Corporation (Conso) 11,361,541 11,361,541 11,361,541 ALI Capital Corp. (Conso) 67,073 67,073 67,073 ALI Commercial Center, Inc. 47,704,674 47,704,674 47,704,674 ALO Prime Realty Corporation 7,268 7,268 7,268 Alveo Land Corporation (Conso) 2,935,510,865 2,935,510,865 2,935,510,865 Amaia Land Corporation (Conso) 2,611,255 2,611,255 2,611,255 Amorsedia Development Corporation (Conso) 120,706,662 120,706,662 120,706,662 APRISA Business Process Solutions, Inc 1,152,487 1,152,487 1,152,487 Arvo Commercial Corporation 978,397,598 978,397,598 978,397,598 North Eastern Commercial Corp. 6,393,722 6,393,722 6,393,722 Aurora Properties, Inc. 59,264,497 59,264,497 59,264,497 Avida Land Corporation (Conso) 1,848,799,859 1,848,799,859 1,848,799,859 Ayala Hotels Inc. 2,051,687,342 2,051,687,342 2,051,687,342 Ayala Land International Sales, Inc.(Conso) 12,941,143 12,941,143 12,941,143 Ayala Land Sales Inc. 21,911,132 21,911,132 21,911,132 Ayala Property Management Corporation (Conso) 15,821,897 15,821,897 15,821,897 AyalaLand Hotels and Resorts Corp. (Conso) 16,763,087 16,763,087 16,763,087 AyalaLand Malls, Inc. (Conso) 2,082,761 2,082,761 2,082,761 Ayalaland Metro North, Inc. 3,402,383 3,402,383 3,402,383 AyalaLand Offices, Inc. (Conso) 3,218,273 3,218,273 3,218,273 BellaVita Land Corp. 1,730,970 1,730,970 1,730,970 BG West Properties, Inc 16,184,050 16,184,050 16,184,050 Buendia Landholdings, Inc. 709,316 709,316 709,316 Cagayan De Oro Gateway Corporation 5,187,649 5,187,649 5,187,649 Cavite Commercial Towncenter Inc. 23,926 23,926 23,926 Cebu Holdings, Inc. (Conso) 36,337,493 36,337,493 36,337,493 CECI Realty Corp. 10,019,256 10,019,256 10,019,256 Crans Montana Property Holdings Corporation 92,728,430 92,728,430 92,728,430 Crimson Field Enterprises, Inc. 10,050,000 10,050,000 10,050,000 Direct Power Services Inc. 7,854,659 7,854,659 7,854,659 First Longfield Investments Ltd. (Conso) 15,362,571 15,362,571 15,362,571 FIVE STAR Cinema Inc. 79,990 79,990 79,990 Makati Development Corporation (Conso) 7,169,187,539 7,169,187,539 7,169,187,539 North Triangle Depot Commercial Corp 183,984,912 183,984,912 183,984,912 North Ventures Commercial Corp. 2,337,588 2,337,588 2,337,588 NorthBeacon Commercial Corporation 7,097,951 7,097,951 7,097,951 Nuevocentro, Inc. (Conso) 116,013 116,013 116,013
Amount Owed by ALI PARENT to ALI SUBSIDIARIES
Page 2 of 22

Philippine Integrated Energy Solutions, Inc. 5,039,785 5,039,785 5,039,785 Primavera Towncentre, Inc. 1,407,328 1,407,328 1,407,328 Prime Orion Philippines, Inc. (Conso) 111,083,502 111,083,502 111,083,502 Red Creek Properties, Inc. 18,000,592 18,000,592 18,000,592 Regent Time International, Limited 427,170,848 427,170,848 427,170,848 Serendra Inc. 99,970,995 99,970,995 99,970,995 Soltea Commercial Corp. 463,752 463,752 463,752 Ayalaland Estates, Inc. 1,603,565 1,603,565 1,603,565 Southportal Properties, Inc. 57,882,000 57,882,000 57,882,000 Station Square East Commercial Corp 2,456,544 2,456,544 2,456,544 Subic Bay Town Center Inc. 3,030,017 3,030,017 3,030,017 Summerhill Commercial Ventures Corp. 690,513 690,513 690,513 Ten Knots Development Corporation(Conso) 73,563 73,563 73,563 Verde Golf Development Corporation 142,445 142,445 142,445 Vesta Property Holdings Inc. 29,949,661 29,949,661 29,949,661 Westview Commercial Ventures Corp. 121,144 121,144 121,144 Ayalaland Premier, Inc. 7,072,979 7,072,979 7,072,979 Makati Cornerstone Leasing Corp. 189,650,352 189,650,352 189,650,352 ONE DELA ROSA PROP INC 439,683,274 439,683,274 439,683,274
Sub-Total 17,108,509,138 17,108,509,138 17,108,509,138 -
Receivable Balance per MDC & Subsidiaries
Payable Balance per ALI Subsidiaries Current Non-Current
Ayala Land, Inc. (ALI) Subsidiaries:Arvo Commercial Corp 369,575,809 369,575,809 369,575,809 Avida Land Corp. (Conso) 2,777,926,609 2,777,926,609 2,777,926,609 Laguna Technopark, Inc. 165,267,074 165,267,074 165,267,074 Amaia Land Corp. (Conso) 681,371,653 681,371,653 681,371,653 BellaVita Land Corp. 45,299,055 45,299,055 45,299,055 BG West Properties, Inc. 2,222,290,345 2,222,290,345 2,222,290,345 Aurora Properties, Inc. 7,192,209 7,192,209 7,192,209 Serendra Inc. 268,314,635 268,314,635 268,314,635 Vesta Prop. Holdings, Inc 24,590,547 24,590,547 24,590,547 Ceci Realty, Inc. 7,110,438 7,110,438 7,110,438 Roxas Land Corporation 336,712,095 336,712,095 336,712,095 Ayala Hotels, Inc. 503,532,793 503,532,793 503,532,793 Southportal Properties 399,403,241 399,403,241 399,403,241 AYALALAND HOTELS AND RES (Conso) 1,460,200,253 1,460,200,253 1,460,200,253 Alveo Land Corp. (Conso) 4,583,290,035 4,583,290,035 4,583,290,035 Leisure & Allied Ind.Phil 150,200,000 150,200,000 150,200,000 Station Square East 368,400 368,400 368,400 ALI Commercial Center,Inc 179,848,495 179,848,495 179,848,495 Aviana Development Corp. 145,087,295 145,087,295 145,087,295 Accendo Commercial Corp 134,230,994 134,230,994 134,230,994 Adauge Commercial Corp. 6,690,624 6,690,624 6,690,624 North Triangle Depot 111,545,883 111,545,883 111,545,883 Cebu Holdings, Inc. (Conso) 922,496,514 922,496,514 922,496,514 Ayala Land Intl Sales,Inc 5,524,043 5,524,043 5,524,043 Primavera Towncentre, Inc 20,000,000 20,000,000 20,000,000 Cavite Comml Town Center 189,351,025 189,351,025 189,351,025 Ayalaland Metro North Inc 242,177,833 242,177,833 242,177,833 Soltea Commercial Corp. 181,069,461 181,069,461 181,069,461 AMSI, Inc. 56,649,934 56,649,934 56,649,934 Capitol Central Commercial Ventures Corp. 856,759,759 856,759,759 856,759,759 One Dela Rosa Property 2,019,459 2,019,459 2,019,459 North Ventures Com Corp 3,111,587 3,111,587 3,111,587 North Eastern Comm Corp 37,822,592 37,822,592 37,822,592 Westview Comml Vents Corp 2,718,359 2,718,359 2,718,359 Sunnyfield E-Office Corp. 3,702,028 3,702,028 3,702,028 Summerhill Com. Ven. Corp 425,922,691 425,922,691 425,922,691 Phil Integ Energy Sol,Inc 30,877,626 30,877,626 30,877,626 Central Block Dev., Inc. 2,367,634,874 2,367,634,874 2,367,634,874 Makati Cornerstone Leasin 72,970,173 72,970,173 72,970,173 Ayala Greenfield Devt Cor (Conso) 261,134,154 261,134,154 261,134,154 Ten Knots Philippines, In (Conso) 212,066,409 212,066,409 212,066,409 Southgateway Dev. Corp 119,114,626 119,114,626 119,114,626 Nuevocentro Inc. (Conso) 547,742,934 547,742,934 547,742,934 Crans Montana Prop Hold 297,038,454 297,038,454 297,038,454
Amount Owed by ALI SUBSIDIARIES TO MAKATI DEVELOPMENT CORP. AND SUBSIDIARIES
Page 3 of 22

CagayanDeOro Gateway Corp 356,610,721 356,610,721 356,610,721 Lagdigan Land Corp. 48,324,953 48,324,953 48,324,953 ALI Capital Corp. (Conso) 288,090,084 288,090,084 288,090,084 Verde Golf Development Corporation 5,012,324 5,012,324 5,012,324 Chirica Resorts Corporation - TKDC 20,000,000 20,000,000 20,000,000 Arca South Integrated Terminal, Inc 15,204,960 15,204,960 15,204,960 Ayalaland Medical Facilit 268,615,169 268,615,169 268,615,169 Sub-Total 22,439,811,227 22,439,811,227 22,439,811,227
Receivable Balance per ACCENDO
Payable Balance per ALI Subsidiaries Current Non-Current
Ayala Land, Inc. (ALI) Subsidiries:Ayala Property Management Corporation 395,257 395,257 395,257 Makati Development Corporation 178,854 178,854 178,854 Avida Land Corporation (Conso) 3,307,459 3,307,459 3,307,459 Alveo Land Corporation 28,600 28,600 28,600 Station Square East Commercial Corp 5,000 5,000 5,000 ALI Commercial Center, Inc. 80,367 80,367 80,367 Aviana Development Corporation 2,664,621 2,664,621 2,664,621 Adauge Commercial Corp. 21,163 21,163 21,163 North Triangle Depot Commercial Corp 30,185 30,185 30,185 Cebu Holdings, Inc. (Conso) 25,030,029 25,030,029 25,030,029 Ayalaland Metro North, Inc. 5,456,553 5,456,553 5,456,553 Soltea Commercial Corp. 5,009,451 5,009,451 5,009,451 North Ventures Commercial Corp. 300 300 300 North Eastern Commercial Corp. 300 300 300 Westview Commercial Ventures Corp. 20,749 20,749 20,749 Summerhill Commercial Ventures Corp. 55,154,216 55,154,216 55,154,216 Philippine Integrated Energy Solutions, Inc. 361 361 361 South Innovative Theater Management Inc. 6,865 6,865 6,865 Ayala Hotels & Resorts (Conso) 137,394 137,394 137,394 Cagayan De Oro Gateway Corporation 240,135 240,135 240,135 HLC Development Corporation 30,177,388 30,177,388 30,177,388 Airswift Transport, Inc. 31,397 31,397 31,397 Sub-Total 127,976,644 127,976,644 127,976,644 -
Receivable Balance per ADAUGE
Payable Balance per ALI Subsidiaries Current Non-Current
Ayala Land, Inc. (ALI) Subsidiries:Arvo Commercial Corporation 5,157,432 5,157,432 5,157,432 Makati Development Corporation 13,371 13,371 13,371 Avida Land Corporation 50,361,638 50,361,638 50,361,638 Alabang Commercial Corporation 10,000,000 10,000,000 10,000,000 Accendo Commercial Corp 119,429 119,429 119,429 Cebu Holdings, Inc. 10,000,000 10,000,000 10,000,000 Ayalaland Metro North, Inc. 1,305 1,305 1,305 Sunnyfield E-Office Corp 945,732 945,732 945,732 Summerhill Commercial Ventures Corp. 7,120,588 7,120,588 7,120,588 Sentera Hotel Ventures, Inc. 813,843 813,843 813,843 Ten Knots Philippines, Inc. 25,190 25,190 25,190 Panay Medical Ventures Inc. 6,471,275 6,471,275 6,471,275 Airswift Transport, Inc. 5,478,133 5,478,133 5,478,133 Sub-Total 96,507,937 96,507,937 96,507,937 -
Receivable Balance per ACC & Subsidiaries
Payable Balance per ALI Subsidiaries Current Non-Current
Ayala Land, Inc. (ALI) Subsidiries:Arvo Commercial Corp 91,657 91,657 91,657 Avida Land Corp. 28,026,436 28,026,436 28,026,436 Amaia Land Corp. 70,950 70,950 70,950 Serendra Inc. 160,294 160,294 160,294 Alveo Land Corp. 111,498 111,498 111,498 Five Star Cinema, Inc. 3,652,824 3,652,824 3,652,824 Leisure & Allied Ind.Phil 89,720 89,720 89,720 Station Square East 43,615 43,615 43,615 ALI Commercial Center,Inc 1,763,083 1,763,083 1,763,083
Amount Owed by ALI Subsidiaries to ACCENDO COMMERCIAL CORP.
Amount Owed by ALI Subsidiaries to ADAUGE COMMERCIAL CORP.
Amount Owed by ALI Subsidiaries to ALABANG COMMERCIAL CORP. & SUBSIDIARIES
Page 4 of 22

Orion Land Inc. 913 913 913 Accendo Commercial Corp 20,589 20,589 20,589 North Triangle Depot 349,495 349,495 349,495 Cebu Leisure Co. Inc. 19,625 19,625 19,625 Ayala Land Sales, Inc. 571,187 571,187 571,187 Ayalaland Metro North Inc 4,700 4,700 4,700 Soltea Commercial Corp. 26,320 26,320 26,320 North Beacon Comml Corp. 41,800 41,800 41,800 North Ventures Com Corp 2,100 2,100 2,100 North Eastern Comm Corp 3,750 3,750 3,750 Summerhill Com. Ven. Corp 271,435 271,435 271,435 CagayanDeOro Gateway Corp 900 900 900 Lautan Kuras Property Inc. 5,040 5,040 5,040 Ten Knots Philippines, Inc. 288 288 288 Ayalaland Malls Vismin, Inc. 384,345 384,345 384,345 Sub-Total 35,712,563 35,712,563 35,712,563
Receivable Balance per ALI CAPITAL CORP.
Payable Balance per ALI Subsidiaries Current Non-Current
Ayala Land, Inc. (ALI) Subsidiries:Arvo Commercial Corp 7,116,413 7,116,413 7,116,413 Avida Land Corp. 80,049,279 80,049,279 80,049,279 AYALALAND HOTELS AND RES (Conso) 2,810,307 2,810,307 2,810,307 Ayalaland Metro North Inc 23,485,313 23,485,313 23,485,313 Summerhill Com. Ven. Corp 74,425,752 74,425,752 74,425,752 Ten Knots Philippines, In (Conso) 8,470,890 8,470,890 8,470,890 Ten Knots Development Corporation (Conso) 20,237,199 20,237,199 20,237,199 WhiteKnight Holdings, Inc 20,556,250 20,556,250 20,556,250 Sub-Total 237,151,402 237,151,402 237,151,402
Receivable Balance per ACCI
Payable Balance per ALI Subsidiaries Current Non-Current
Ayala Land, Inc. (ALI) Subsidiries:Arvo Commercial Corporation 16,925,245 16,925,245 16,925,245 Ayala Property Management Corporation 29,260,908 29,260,908 29,260,908 Makati Development Corporation 147,564 147,564 147,564 Avida Land Corporation 244,425,898 244,425,898 244,425,898 Amaia Land Corporation 7,272 7,272 7,272 BellaVita Land Corp. 24,600 24,600 24,600 Aurora Properties, Inc. 1,169 1,169 1,169 Serendra Inc. 40,902 40,902 40,902 CECI Realty Corp. 4,466 4,466 4,466 Ayala Hotels Inc. 4,050 4,050 4,050 Alveo Land Corporation 2,733,945 2,733,945 2,733,945 Alabang Commercial Corporation (Conso) 15,700,568 15,700,568 15,700,568 ALI-CII Development Corporation 3,251 3,251 3,251 Ayala Theaters Management, Inc. 12,541 12,541 12,541 FIVE STAR Cinema Inc. 859 859 859 Leisure and Allied Industries Phils. Inc. 1,292,552 1,292,552 1,292,552 Station Square East Commercial Corp 242,255 242,255 242,255 ALI Commercial Center, Inc. 2,904 2,904 2,904 Prime Orion Phils, Inc. (Conso) 16,218 16,218 16,218 Accendo Commercial Corp 1,780,050 1,780,050 1,780,050 North Triangle Depot Commercial Corp 2,368,246 2,368,246 2,368,246 Subic Bay Town Center Inc. 176,428 176,428 176,428 Cebu Holdings, Inc. (Conso) 41,012,535 41,012,535 41,012,535 Ayalaland Metro North, Inc. 56,171,049 56,171,049 56,171,049 Soltea Commercial Corp. 61,479,866 61,479,866 61,479,866 Ayalaland Malls Synergies, Inc. 17,033,395 17,033,395 17,033,395 NorthBeacon Commercial Corporation 85,000 85,000 85,000 North Ventures Commercial Corp. 378,609 378,609 378,609 North Eastern Commercial Corp. 271,875 271,875 271,875 Westview Commercial Ventures Corp. 4,559 4,559 4,559 Summerhill Commercial Ventures Corp. 147,558,910 147,558,910 147,558,910 Makati Cornerstone Leasing Corp. 11,629 11,629 11,629 Ayala Hotels & Resorts (Conso) 27,858,170 27,858,170 27,858,170
Amount Owed by ALI Subsidiaries to ALI CAPITAL CORP.
Amount Owed by ALI Subsidiaries to ALI COMMERCIAL CENTER INC.
Page 5 of 22

Ten Knots Philippines, Inc. (Conso) 22,123 22,123 22,123 Ayalaland Estates, Inc. 0 0 0 Crans Montana Property Holdings Corporation 11,000,000 11,000,000 11,000,000 Cagayan De Oro Gateway Corporation 24,065,220 24,065,220 24,065,220 APRISA Business Process Solutions, Inc 10,400 10,400 10,400 HLC Development Corporation 69,119,462 69,119,462 69,119,462 Ten Knots Development Corporation 5,133,443 5,133,443 5,133,443 Ten Knots Philippines, Inc. 11,739 11,739 11,739 AyalaLand Malls, Inc. 99,546 99,546 99,546 Airswift Transport, Inc. 41,134,986 41,134,986 41,134,986 Sub-Total 817,634,405 817,634,405 817,634,405
Receivable Balance per ALI-CII
Payable Balance per ALI Subsidiaries Current Non-Current
Ayala Land, Inc. (ALI) Subsidiries:Avida Land Corporation 36,000,000 36,000,000 36,000,000 Amaia Land Corporation 6,048 6,048 6,048 Avida Sales Corp 671,304 671,304 671,304 Cebu Holdings, Inc. 13,600,000 13,600,000 13,600,000 Ayalaland Metro North, Inc. 16,183,646 16,183,646 16,183,646 Soltea Commercial Corp. 18,399,663 18,399,663 18,399,663 Summerhill Commercial Ventures Corp. 1,410,284 1,410,284 1,410,284 Sub-Total 86,270,946 86,270,946 86,270,946 -
Receivable Balance per ALVEO LAND CORP. &
Subsidiaries Payable Balance per ALI
Subsidiaries Current Non-Current Ayala Land, Inc. (ALI) Subsidiries:Arvo Commercial Corp 156,650,000 156,650,000 156,650,000 Ayala Prop. Mngt.Corp 1,824,717 1,824,717 1,824,717 Makati Development Corp. (Conso) 8,616,428 8,616,428 8,616,428 Avida Land Corp. (Conso) 1,204,313,450 1,204,313,450 1,204,313,450 Amaia Land Corp. 35,000,000 35,000,000 35,000,000 BellaVita Land Corp. 821,316,395 821,316,395 821,316,395 Aurora Properties, Inc. 11,419,925 11,419,925 11,419,925 Serendra Inc. 206,486,300 206,486,300 206,486,300 Vesta Prop. Holdings, Inc 300,822,668 300,822,668 300,822,668 AYALALAND HOTELS AND RES (Conso) 42,834,142 42,834,142 42,834,142 Alveo Land Corp. 403,184 403,184 403,184 KAWIT PRIME HOLDINGS, INC 8,377,626 8,377,626 8,377,626 Station Square East 6,000,000 6,000,000 6,000,000 ALI Commercial Center,Inc 1,725 1,725 1,725 Accendo Commercial Corp 379,616,460 379,616,460 379,616,460 Cebu Holdings, Inc. 191,150,000 191,150,000 191,150,000 Ayala Land Intl Sales,Inc 550,371 550,371 550,371 Ayalaland Metro North Inc 322,800,000 322,800,000 322,800,000 Soltea Commercial Corp. 21,900,000 21,900,000 21,900,000 AMSI, Inc. 20,000,000 20,000,000 20,000,000 North Eastern Comm Corp 15,943,216 15,943,216 15,943,216 Summerhill Com. Ven. Corp 550,600,000 550,600,000 550,600,000 Ayala Greenfield Devt Cor (Conso) 414,604,290 414,604,290 414,604,290 Nuevocentro Inc. (Conso) 157,853,596 157,853,596 157,853,596 Crans Montana Prop Hold 72,171,743 72,171,743 72,171,743 CagayanDeOro Gateway Corp 51,400,000 51,400,000 51,400,000 Mercado Gen. Hospital Inc 55,690 55,690 55,690 Ten Knots Philippines, Inc. 49,000,000 49,000,000 49,000,000 AyalaLand Malls, Inc. 54,613 54,613 54,613 Chirica Resorts Corporation - TKDC 10,084 10,084 10,084 Airswift Transport, Inc. 180,250,000 180,250,000 180,250,000 Ayalaland Medical Facilit 7,080,978 7,080,978 7,080,978 Sub-Total 5,239,107,601 5,239,107,601 5,239,107,601 -
Receivable Balance per AMAIA LAND, INC. &
Subsidiaries Payable Balance per ALI
Subsidiaries Current Non-Current Ayala Land, Inc. (ALI) Subsidiries:
Amount Owed by ALI Subsidiaries to ALI-CII DEVELOPMENT CORP
Amount Owed by ALI Subsidiaries to ALVEO LAND CORP. & SUBSIDIARIES
Amount Owed by ALI Subsidiaries to AMAIA LAND, INC. & SUBSIDIARIES
Page 6 of 22

Makati Development Corp. (Conso) 3,292,640 3,292,640 3,292,640 Avida Land Corp. (Conso) 34,976,277 34,976,277 34,976,277 Amaia Land Corp. 35,970 35,970 35,970 BellaVita Land Corp. 73,890,341 73,890,341 73,890,341 Alveo Land Corp. 150,000 150,000 150,000 Ayala Land Intl Sales,Inc 282,463 282,463 282,463 Long Land Realty Corp. 20,098,465 20,098,465 20,098,465 Sub-Total 132,726,157 132,726,157 132,726,157 -
Receivable Balance per AMORSEDIA DEVPT. CORP. & Subsidiaries
Payable Balance per ALI Subsidiaries Current Non-Current
Ayala Land, Inc. (ALI) Subsidiaries:Avida Land Corp. 63,000,000 63,000,000 63,000,000 BellaVita Land Corp. 20,384,000 20,384,000 20,384,000 Ayala Land Intl Sales,Inc 19,127 19,127 19,127 Sub-Total 83,403,127 83,403,127 83,403,127 -
Receivable Balance per ANVAYA COVE BEACH
Payable Balance per ALI Subsidiaries Current Non-Current
Ayala Land, Inc. (ALI) Subsidiries:Ayala Property Management Corporation 970,406 970,406 970,406 Avida Land Corporation 82,000,000 82,000,000 82,000,000 Anvaya Cove Golf and Sports Club, Inc. 20,943,354 20,943,354 20,943,354 Sub-Total 103,913,760 103,913,760 103,913,760
Receivable Balance per ANVAYA COVE GOLF
Payable Balance per ALI Subsidiaries Current Non-Current
Ayala Land, Inc. (ALI) Subsidiries:Makati Development Corporation 192,121 192,121 192,121 Avida Land Corporation 20,000,000 20,000,000 20,000,000 Anvaya Cove Beach and Nature Club, Inc 3,381,710 3,381,710 3,381,710 Sub-Total 23,573,830 23,573,830 23,573,830
Receivable Balance per APRISA
Payable Balance per ALI Subsidiaries Current Non-Current
Ayala Land, Inc. (ALI) Subsidiries:Arvo Commercial Corporation 172,701 172,701 172,701 Ayala Property Management Corporation 583,493 583,493 583,493 Makati Development Corporation (MDC) 3,712,476 3,712,476 3,712,476 Avida Land Corporation (MDC) 79,925,326 79,925,326 79,925,326 Amaia Land Corporation (MDC) 906,478 906,478 906,478 BellaVita Land Corp. 63,974 63,974 63,974 Aurora Properties, Inc. 379,260 379,260 379,260 Serendra Inc. 768,823 768,823 768,823 Vesta Property Holdings Inc. 406,002 406,002 406,002 CECI Realty Corp. 549,992 549,992 549,992 Roxas Land Corp. 179,317 179,317 179,317 AyalaLand Hotels and Resorts Corp. (MDC) 113,758 113,758 113,758 Alveo Land Corporation 626,996 626,996 626,996 Alabang Commercial Corporation 525,633 525,633 525,633 ALI-CII Development Corporation 449,129 449,129 449,129 ALI Commercial Center, Inc. 2,361,918 2,361,918 2,361,918 Prme Orion Phils., Inc. (Conso) 371,309 371,309 371,309 Aviana Development Corporation 35,729 35,729 35,729 Accendo Commercial Corp 148,337 148,337 148,337 Adauge Commercial Corp. 6,451 6,451 6,451 North Triangle Depot Commercial Corp 481,818 481,818 481,818 Subic Bay Town Center Inc. 50,288 50,288 50,288 Cebu Holdings, Inc. 792,120 792,120 792,120 Cavite Commercial Towncenter Inc. 52,209 52,209 52,209 Ayalaland Metro North, Inc. 73,706 73,706 73,706 Soltea Commercial Corp. 80,262 80,262 80,262 Capitol Central Commercial Ventures Corp. 51,576 51,576 51,576 Bay City Commercial Ventures Corp. 6,227 6,227 6,227
Amount Owed by ALI Subsidiaries to AMORSEDIA DEVPT. CORP. & SUBSIDIARIES
Amount Owed by ALI Subsidiaries to ANVAYA COVE BEACH & NATURE CLUB, INC.
Amount Owed by ALI Subsidiaries to ANVAYA COVE GOLF & NATURE CLUB, INC.
Amount Owed by ALI Subsidiaries to APRISA BUSINESS SOLUTIONS, INC.
Page 7 of 22

NorthBeacon Commercial Corporation 98,722 98,722 98,722 North Eastern Commercial Corp. 1,962,847 1,962,847 1,962,847 Westview Commercial Ventures Corp. 64,549 64,549 64,549 Summerhill Commercial Ventures Corp. 25,825,049 25,825,049 25,825,049 Central Block Developers, Inc. 20,790 20,790 20,790 Makati Cornerstone Leasing Corp. 326,336 326,336 326,336 Ayalaland Estates, Inc. 45,688 45,688 45,688 Nuevocentro, Inc. 158,054 158,054 158,054 Crans Montana Property Holdings Corporation 70,560 70,560 70,560 Lagdigan Land Corporation 949 949 949 Whiteknight Holdings, Inc. 62,049 62,049 62,049 Ayalaland Medical Facilities Leasing Inc. 29,371 29,371 29,371 Sub-Total 122,540,271 122,540,271 122,540,271
Receivable Balance per ARVO COMMERCIAL
CORP. Payable Balance per ALI
Subsidiaries Current Non-Current Ayala Land, Inc. (ALI) Subsidiries:Alabang Commercial Corporation (Conso) 81,440 81,440 81,440 Leisure and Allied Industries Phils. Inc. 99,182 99,182 99,182 Station Square East Commercial Corp 1,670 1,670 1,670 ALI Commercial Center, Inc. 5,230 5,230 5,230 North Triangle Depot Commercial Corp 1,470 1,470 1,470 Primavera Towncentre, Inc. 308,275 308,275 308,275 Cavite Commercial Towncenter Inc. 12,643 12,643 12,643 Soltea Commercial Corp. 12,850 12,850 12,850 Sub-Total 522,760 522,760 522,760
Receivable Balance per AURORA PROPERTIES,
INC. Payable Balance per ALI
Subsidiaries Current Non-Current Ayala Land, Inc. (ALI) Subsidiries:Makati Development Corporation 7,680 7,680 7,680 Avida Land Corporation 121,996,669 121,996,669 121,996,669 Vesta Property Holdings Inc. 27,739 27,739 27,739 CECI Realty Corp. 167,851 167,851 167,851 Alveo Land Corporation 1,003,294 1,003,294 1,003,294 Accendo Commercial Corp 37,762 37,762 37,762 Ayala Land International Sales, Inc 10,000,000 10,000,000 10,000,000 Ayalaland Metro North, Inc. 158,600,871 158,600,871 158,600,871 Summerhill Commercial Ventures Corp. 113,012,861 113,012,861 113,012,861 Ayala Hotels and Resorts (Conso) 1,182,354 1,182,354 1,182,354 Nuevocentro, Inc. 55,359 55,359 55,359 HLC Development Corporation 5,032,430 5,032,430 5,032,430 Chirica Resorts Corporation 726 726 726 Airswift Transport, Inc. 15,061,241 15,061,241 15,061,241 Sub-Total 426,186,836 426,186,836 426,186,836
Receivable Balance per AVIDA LAND CORP. &
Subsidiaries Payable Balance per ALI
Subsidiaries Current Non-Current Ayala Land, Inc. (ALI) Subsidiries:Arvo Commercial Corp 28,282,560 28,282,560 28,282,560 Ayala Prop. Mngt.Corp 8,427,240 8,427,240 8,427,240 Makati Development Corp. (Conso) 908,323 908,323 908,323 Avida Land Corp. (Conso) 244,056 244,056 244,056 Amaia Land Corp. (Conso) 59,171,216 59,171,216 59,171,216 BellaVita Land Corp. 312,458,371 312,458,371 312,458,371 BG West Properties, Inc. 72,451 72,451 72,451 Aurora Properties, Inc. 38,574,705 38,574,705 38,574,705 Serendra Inc. 1,682,303 1,682,303 1,682,303 Vesta Prop. Holdings, Inc 14,652 14,652 14,652 Ceci Realty, Inc. 7,589 7,589 7,589 Roxas Land Corporation 2,032,853 2,032,853 2,032,853 Ayala Hotels, Inc. 25,702 25,702 25,702 Alveo Land Corp. (Conso) 46,835,486 46,835,486 46,835,486
Amount Owed by ALI Subsidiaries to ARVO COMMERCIAL CORP.
Amount Owed by ALI Subsidiaries to AURORA PROPERTIES, INC.
Amount Owed by ALI Subsidiaries to AVIDA LAND CORP. & SUBSIDIARIES
Page 8 of 22

ALI-CII Development Corp. 75,000 75,000 75,000 Ayala Theaters Mgt, Inc. 69,503 69,503 69,503 Station Square East 420,337 420,337 420,337 Orion Land Inc. 2,507,960 2,507,960 2,507,960 Accendo Commercial Corp 269,380 269,380 269,380 Cebu Holdings, Inc. (Conso) 43,699,203 43,699,203 43,699,203 Ayala Land Intl Sales,Inc 13,133,221 13,133,221 13,133,221 Ayalaland Metro North Inc 5,080,320 5,080,320 5,080,320 Soltea Commercial Corp. 34,025 34,025 34,025 AMSI, Inc. 10,082,732 10,082,732 10,082,732 Summerhill Com. Ven. Corp 75,193,636 75,193,636 75,193,636 Ayala Greenfield Devt Cor 180,978,578 180,978,578 180,978,578 AyalaLand Estates, Inc. 355,353,089 355,353,089 355,353,089 Nuevocentro Inc. 195,898,473 195,898,473 195,898,473 Crans Montana Prop Hold 6,704 6,704 6,704 CagayanDeOro Gateway Corp 305,097,177 305,097,177 305,097,177 Airswift Transport, Inc. 30,207,110 30,207,110 30,207,110 Sub-Total 1,716,843,956 1,716,843,956 1,716,843,956 -
Receivable Balance per AHI
Payable Balance per ALI Subsidiaries Current Non-Current
Ayala Land, Inc. (ALI) Subsidiries:Arvo Commercial Corporation 85,653,768 85,653,768 85,653,768 Avida Land Corporation 883,414,358 883,414,358 883,414,358 Amaia Land Corporation 25,971,347 25,971,347 25,971,347 BellaVita Land Corp. 2,000,000 2,000,000 2,000,000 Ayalaland Commercial REIT, Inc. 109,474 109,474 109,474 Cebu Holdings, Inc. (Conso) 225,696,618 225,696,618 225,696,618 Ayala Land International Sales, Inc 3,000,000 3,000,000 3,000,000 Ayalaland Metro North, Inc. 603,845,433 603,845,433 603,845,433 Soltea Commercial Corp. 6,522,547 6,522,547 6,522,547 Summerhill Commercial Ventures Corp. 433,980,467 433,980,467 433,980,467 AyalaLand Hotels and Resorts Corp. (Conso) 134,662,478 134,662,478 134,662,478 Ayalaland Estates, Inc. 26,194 26,194 26,194 Crans Montana Property Holdings Corporation 3,003,790 3,003,790 3,003,790 Mercado General Hospital, Inc. 18,062,437 18,062,437 18,062,437 HLC Development Corporation 62,124,950 62,124,950 62,124,950 Airswift Transport, Inc. 10,208,292 10,208,292 10,208,292 Sub-Total 2,498,282,153 2,498,282,153 2,498,282,153
Receivable Balance per ALISI & Subs
Payable Balance per ALI Subsidiaries Current Non-Current
Ayala Land, Inc. (ALI) Subsidiries:Avida Land Corp. 93,867,792 93,867,792 93,867,792 Amaia Land Corp. 10,550,629 10,550,629 10,550,629 BellaVita Land Corp. 1,837,093 1,837,093 1,837,093 Alveo Land Corp. 43,800,597 43,800,597 43,800,597 Ayala Land Intl Sales,Inc. (Conso) (93,574) (93,574) (93,574)Ayala Greenfield Devt Cor 316,989 316,989 316,989 Sub-Total 150,279,527 150,279,527 150,279,527
Receivable Balance per ALSI
Payable Balance per ALI Subsidiaries Current Non-Current
Ayala Land, Inc. (ALI) Subsidiries:Avida Land Corporation 21,907,274 21,907,274 21,907,274 BellaVita Land Corp. 44,100 44,100 44,100 Alveo Land Corporation 8,824 8,824 8,824 Aviana Development Corporation 259,728 259,728 259,728 Soltea Commercial Corp. 50,000,000 50,000,000 50,000,000 Ayala Greenfield Development Corp 2,650,083 2,650,083 2,650,083 Nuevocentro, Inc. 1,649,182 1,649,182 1,649,182 Sub-Total 76,519,192 76,519,192 76,519,192
Receivable Balance per APMC & Subsidiaries
Payable Balance per ALI Subsidiaries Current Non-Current
Amount Owed by ALI Subsidiaries to AYALA HOTELS, INC.
Amount Owed by ALI Subsidiaries to AYALA LAND INTERNATIONAL SALES, INC. & SUBS.
Amount Owed by ALI Subsidiaries to AYALA LAND SALES, INC.
Amount Owed by ALI Subsidiaries to AYALA PROPERTY MANAGEMENT CORP. & Subsidiaries
Page 9 of 22

Ayala Land, Inc. (ALI) Subsidiries:Arvo Commercial Corp 235,200 235,200 235,200 Avida Land Corp. (Conso) 963,534,649 963,534,649 963,534,649 Amaia Land Corp. (Conso) 11,224,651 11,224,651 11,224,651 BG West Properties, Inc. 28,000 28,000 28,000 Aurora Properties, Inc. 298,628 298,628 298,628 Serendra Inc. 1,763,823 1,763,823 1,763,823 Vesta Prop. Holdings, Inc 392,267 392,267 392,267 Ceci Realty, Inc. 614,606 614,606 614,606 Alveo Land Corp. (Conso) 29,245,661 29,245,661 29,245,661 Alabang Commercial Corp. 5,000 5,000 5,000 ALI Commercial Center,Inc 3,499,428 3,499,428 3,499,428 Tutuban Properties, Inc. 1,774,080 1,774,080 1,774,080 Aviana Development Corp. 658,560 658,560 658,560 Accendo Commercial Corp 6,581,377 6,581,377 6,581,377 North Triangle Depot 268,310 268,310 268,310 Cebu Holdings, Inc. (Conso) 63,913,575 63,913,575 63,913,575 Cavite Comml Town Center 122,600 122,600 122,600 Ayalaland Metro North Inc 259,399 259,399 259,399 Soltea Commercial Corp. 496,720 496,720 496,720 Captl Cntrl Com Vent Corp 354,101 354,101 354,101 Ayala Land Offices (Conso) 6,949,074 6,949,074 6,949,074 One Dela Rosa Property 626,661 626,661 626,661 North Beacon Comml Corp. 50,960 50,960 50,960 Hillsford Property Corp. 221,353 221,353 221,353 North Eastern Comm Corp 19,313,198 19,313,198 19,313,198 Sunnyfield E-Office Corp. 113,399 113,399 113,399 Makati Cornerstone Leasin 687,493 687,493 687,493 Ayala Greenfield Devt Cor 321,709 321,709 321,709 Ayala Hotels & Resorts (Conso) 441,100 441,100 441,100 AyalaLand Estates, Inc. 597,368 597,368 597,368 Nuevocentro Inc. 5,400,996 5,400,996 5,400,996 CagayanDeOro Gateway Corp 763,948 763,948 763,948 AyalaLand Malls, Inc. 15,600,000 15,600,000 15,600,000 Sub-Total 1,136,357,895 1,136,357,895 1,136,357,895 -
Receivable Balance per ATMI
Payable Balance per ALI Subsidiaries Current Non-Current
Ayala Land, Inc. (ALI) Subsidiries:Arvo Commercial Corporation 300 300 300 Cebu Leisure Company, Inc. 499 499 499 South Innovative Theater Management Inc. 1,434 1,434 1,434 Sub-Total 2,233 2,233 2,233
Receivable Balance per ACMI
Payable Balance per ALI Subsidiaries Current Non-Current
Ayala Land, Inc. (ALI) Subsidiries:Ayala Land Sales Inc. 63,000 63,000 63,000 AyalaLand Offices, Inc. 1,500 1,500 1,500 Ayalaland Estates, Inc. 32,000 32,000 32,000 APRISA Business Process Solutions, Inc 4,500 4,500 4,500 Verde Golf Development Corporation 3,903,239 3,903,239 3,903,239 AyalaLand Premier, Inc. 50,000 50,000 50,000 Anvaya Cove Beach and Nature Club, Inc 2,375,410 2,375,410 2,375,410 Anvaya Cove Golf and Sports Club, Inc. 6,153,728 6,153,728 6,153,728 Sub-Total 12,583,377 12,583,377 12,583,377 -
Receivable Balance per ALCRI
Payable Balance per ALI Subsidiaries Current Non-Current
Ayala Land, Inc. (ALI) Subsidiries:Avida Land Corporation 240,700,000 240,700,000 240,700,000 Ayalaland Metro North, Inc. 16,300,000 16,300,000 16,300,000 Soltea Commercial Corp. 25,000,000 25,000,000 25,000,000 Summerhill Commercial Ventures Corp. 20,000,000 20,000,000 20,000,000 HLC Development Corporation 25,000,000 25,000,000 25,000,000 Sub-Total 327,000,000 327,000,000 327,000,000
Amount Owed by ALI Subsidiaries to AYALALAND CLUB MANAGEMENT, INC.
Amount Owed by ALI Subsidiaries to AYALA THEATERS MANAGEMENT, INC.
Amount Owed by ALI Subsidiaries to AYALALAND COMMERCIAL REIT, INC.
Page 10 of 22

Receivable Balance per AEI
Payable Balance per ALI Subsidiaries Current Non-Current
Ayala Land, Inc. (ALI) Subsidiries:Avida Land Corporation 326,800,000 326,800,000 326,800,000 Amaia Land Corporation 50,000,000 50,000,000 50,000,000 Ayalaland Metro North, Inc. 89,700,000 89,700,000 89,700,000 North Eastern Commercial Corp. 17,202,807 17,202,807 17,202,807 Summerhill Commercial Ventures Corp. 22,082,229 22,082,229 22,082,229 Nuevocentro, Inc. 2,100 2,100 2,100 HLC Development Corporation 34,201,039 34,201,039 34,201,039 Sub-Total 539,988,175 539,988,175 539,988,175
Receivable Balance per AHRC & Subsidiaries
Payable Balance per ALI Subsidiaries Current Non-Current
Ayala Land, Inc. (ALI) Subsidiries:Ayala Prop. Mngt.Corp 370,404 370,404 370,404 Makati Development Corp. 4,553 4,553 4,553 Avida Land Corp. (Conso) 50,000,000 50,000,000 50,000,000 BellaVita Land Corp. 85 85 85 Ayala Hotels, Inc. 362 362 362 AYALALAND HOTELS AND RES (Conso) (0) (0) (0)Accendo Commercial Corp 45,040 45,040 45,040 Central Block Dev., Inc. 151,521 151,521 151,521 Ten Knots Development Corporation (Conso) 8,100,203 8,100,203 8,100,203 Lio Resort Ventures Inc - TKPI 2,836,034 2,836,034 2,836,034 Sub-Total 61,508,202 61,508,202 61,508,202 -
Receivable Balance per AMSI
Payable Balance per ALI Subsidiaries Current Non-Current
Ayala Land, Inc. (ALI) Subsidiries:Prime Orion (Conso) 1,501,782 1,501,782 1,501,782 North Eastern Commercial Corp. 821,864 821,864 821,864 Sub-Total 2,323,647 2,323,647 2,323,647
Receivable Balance per ALMI
Payable Balance per ALI Subsidiaries Current Non-Current
Ayala Land, Inc. (ALI) Subsidiries:Arvo Commercial Corp 4,423,931 4,423,931 4,423,931 Alabang Commercial Corp. (Conso) 3,754,888 3,754,888 3,754,888 Station Square East 1,785,352 1,785,352 1,785,352 ALI Commercial Center,Inc 1,579,695 1,579,695 1,579,695 Prime Orion Phils., Inc. (Conso) 2,506,279 2,506,279 2,506,279 Accendo Commercial Corp 3,324,082 3,324,082 3,324,082 Adauge Commercial Corp. 469,468 469,468 469,468 North Triangle Depot 2,235,442 2,235,442 2,235,442 Cebu Holdings, Inc. 3,503,712 3,503,712 3,503,712 Cavite Comml Town Center 412,905 412,905 412,905 Ayalaland Metro North Inc 1,934,791 1,934,791 1,934,791 Soltea Commercial Corp. 1,097,921 1,097,921 1,097,921 AMSI, Inc. 1,040,464 1,040,464 1,040,464 Captl Cntrl Com Vent Corp 1,259,810 1,259,810 1,259,810 Bay City Comm. Vent. Corp 1,405,128 1,405,128 1,405,128 North Beacon Comml Corp. 2,588,022 2,588,022 2,588,022 North Ventures Com Corp 1,383,030 1,383,030 1,383,030 North Eastern Comm Corp 4,155,854 4,155,854 4,155,854 Westview Comml Vents Corp 443,959 443,959 443,959 Summerhill Com. Ven. Corp 429,594 429,594 429,594 Central Block Dev., Inc. 627,456 627,456 627,456 Makati Cornerstone Leasin 2,038,124 2,038,124 2,038,124 Nuevocentro Inc. 2,415 2,415 2,415 CagayanDeOro Gateway Corp 373,795 373,795 373,795 AyalaLand Malls, Inc. (Conso) - - - Sub-Total 42,776,116 42,776,116 42,776,116
Amount Owed by ALI Subsidiaries to AYALALAND ESTATES, INC.
Amount Owed by ALI Subsidiaries to AYALA HOTELS & RESORTS GROUP
Amount Owed by ALI Subsidiaries to AYALALAND MALLS SYNERGIES, INC.
Amount Owed by ALI Subsidiaries to AYALALAND MALLS, INC.
Page 11 of 22

Receivable Balance per AMNI
Payable Balance per ALI Subsidiaries Current Non-Current
Ayala Land, Inc. (ALI) Subsidiries:Makati Development Corporation 984,767 984,767 984,767 Avida Land Corporation 2,070 2,070 2,070 Alveo Land Corporation 273,336 273,336 273,336 Alabang Commercial Corporation (Conso) 103,950 103,950 103,950 Station Square East Commercial Corp 2,900 2,900 2,900 ALI Commercial Center, Inc. 282,209 282,209 282,209 Accendo Commercial Corp 990 990 990 North Triangle Depot Commercial Corp 66,282 66,282 66,282 Cebu Leisure Company, Inc. 800 800 800 Soltea Commercial Corp. 200 200 200 NorthBeacon Commercial Corporation 594 594 594 UP North Property Holdings, Inc. 6,862 6,862 6,862 North Ventures Commercial Corp. 920 920 920 North Eastern Commercial Corp. 64,514 64,514 64,514 Summerhill Commercial Ventures Corp. 3,244 3,244 3,244 Cagayan De Oro Gateway Corporation 900 900 900 AyalaLand Malls, Inc. 22,543 22,543 22,543 Sub-Total 1,817,082 1,817,082 1,817,082
Receivable Balance per ALO & Subsidiaries
Payable Balance per ALI Subsidiaries Current Non-Current
Ayala Land, Inc. (ALI) Subsidiries:Arvo Commercial Corp 48,754,682 48,754,682 48,754,682 Makati Development Corp. 560,464 560,464 560,464 Avida Land Corp. 315,464,761 315,464,761 315,464,761 Amaia Land Corp. 39,998,520 39,998,520 39,998,520 Ceci Realty, Inc. 4,143 4,143 4,143 Alabang Commercial Corp. 10,000 10,000 10,000 ALI Commercial Center,Inc 7,840 7,840 7,840 Orion Land Inc. 6,250 6,250 6,250 Cebu Holdings, Inc. (Conso) 20,122,085 20,122,085 20,122,085 Ayalaland Metro North Inc 109,287,813 109,287,813 109,287,813 Soltea Commercial Corp. 34,500,000 34,500,000 34,500,000 Ayalaland Offices Inc. (Conso) 400,058 400,058 400,058 One Dela Rosa Property 447,454 447,454 447,454 Hillsford Property Corp. 80,277,376 80,277,376 80,277,376 North Ventures Com Corp 19,278 19,278 19,278 North Eastern Comm Corp 689,197 689,197 689,197 Westview Comml Vents Corp 439,490,972 439,490,972 439,490,972 Sunnyfield E-Office Corp. 50,786,996 50,786,996 50,786,996 Summerhill Com. Ven. Corp 29,597,334 29,597,334 29,597,334 Central Block Dev., Inc. 1,141,003,579 1,141,003,579 1,141,003,579 ALO Prime Realty Corporat 688,000,000 688,000,000 688,000,000 Makati Cornerstone Leasin 7,140,666 7,140,666 7,140,666 Ecosouth Ventures, Inc. 3,184,962 3,184,962 3,184,962 Nuevocentro Inc. 432,600 432,600 432,600 HLC Development Corporation 52,424,288 52,424,288 52,424,288 Ayalaland Medical Facilit 39,555 39,555 39,555 Sub-Total 3,062,650,874 3,062,650,874 3,062,650,874
Receivable Balance per BAY CITY COMM'L.
Payable Balance per ALI Subsidiaries Current Non-Current
Ayala Land, Inc. (ALI) Subsidiries:Arvo Commercial Corporation 5,000,000 5,000,000 5,000,000 Arca South Commercial Ventures Corp. 144,895,152 144,895,152 144,895,152 Summerhill Commercial Ventures Corp. 300,000,000 300,000,000 300,000,000 Sub-Total 449,895,152 449,895,152 449,895,152 -
Receivable Balance per BELLAVITA
Payable Balance per ALI Subsidiaries Current Non-Current
Ayala Land, Inc. (ALI) Subsidiries:Makati Development Corporation (Conso) 121,815 121,815 121,815 Avida Land Corporation (Conso) 687,340 687,340 687,340
Amount Owed by ALI Subsidiaries to AYALALALAND METRO NORTH, INC.
Amount Owed by ALI Subsidiaries to AYALALAND OFFICES, INC. & SUBSIDIARIES
Amount Owed by ALI Subsidiaries to BAY CITY COMMERCIAL VENTURES, INC.
Amount Owed by ALI Subsidiaries to BELLAVITA LAND CORP.
Page 12 of 22

Amaia Land Corporation 8,000 8,000 8,000 Primavera Towncentre, Inc. 7,593,743 7,593,743 7,593,743 Summerhill Commercial Ventures Corp. 55,000,000 55,000,000 55,000,000 Ayala Greenfield Development Corp 27,825,000 27,825,000 27,825,000 Red Creek Properties, Inc. 1,899,778 1,899,778 1,899,778 Sub-Total 93,135,677 93,135,677 93,135,677 -
Receivable Balance per BG WEST
Payable Balance per ALI Subsidiaries Current Non-Current
Ayala Land, Inc. (ALI) Subsidiries:BG West Properties, Inc 194,500 194,500 194,500 Ayala Greenfield Development Corp 20,126,580 20,126,580 20,126,580 Sub-Total 20,321,080 20,321,080 20,321,080 -
Receivable Balance per CDOGC
Payable Balance per ALI Subsidiaries Current Non-Current
Ayala Land, Inc. (ALI) Subsidiries:Arvo Commercial Corporation 180 180 180 Ayala Property Management Corporation 6,000 6,000 6,000 Makati Development Corporation 4,000 4,000 4,000 Avida Land Corporation 10,000 10,000 10,000 Amaia Land Corporation 2,000 2,000 2,000 Alveo Land Corporation 598,836 598,836 598,836 Leisure and Allied Industries Phils. Inc. (51,348) (51,348) (51,348)ALI Commercial Center, Inc. 12,475 12,475 12,475 Accendo Commercial Corp 31,782 31,782 31,782 North Triangle Depot Commercial Corp 5,820 5,820 5,820 Cebu Holdings, Inc. 11,500 11,500 11,500 North Ventures Commercial Corp. 2,500 2,500 2,500 Philippine Integrated Energy Solutions, Inc. 1,091,444 1,091,444 1,091,444 Ayala Hotels & Resorts (Conso) 11,600,823 11,600,823 11,600,823 Lagdigan Land Corporation 3,925 3,925 3,925 AyalaLand Malls, Inc. 18,142 18,142 18,142 Sub-Total 13,348,079 13,348,079 13,348,079
Receivable Balance per CAPITOL CENTRAL
COMM'L. Payable Balance per ALI
Subsidiaries Current Non-Current Ayala Land, Inc. (ALI) Subsidiries:Arvo Commercial Corporation 22,489 22,489 22,489 Avida Land Corporation 55,628,886 55,628,886 55,628,886 Westview Commercial Ventures Corp. 5,809 5,809 5,809 Summerhill Commercial Ventures Corp. 41,436,509 41,436,509 41,436,509 Sub-Total 97,093,693 97,093,693 97,093,693
Receivable Balance per CCTCI
Payable Balance per ALI Subsidiaries Current Non-Current
Ayala Land, Inc. (ALI) Subsidiries:Ayala Property Management Corporation 564,520 564,520 564,520 Makati Development Corporation 39,280 39,280 39,280 Avida Land Corporation 20,000 20,000 20,000 Amaia Land Corporation 148,406 148,406 148,406 Alveo Land Corporation 654,456 654,456 654,456 Leisure and Allied Industries Phils. Inc. 268 268 268 Soltea Commercial Corp. 16,000,000 16,000,000 16,000,000 Ayalaland Malls Synergies, Inc. 266,173 266,173 266,173 Sub-Total 17,693,104 17,693,104 17,693,104
Receivable Balance per CHI & Subsidiaries
Payable Balance per ALI Subsidiaries Current Non-Current
Ayala Land, Inc. (ALI) Subsidiries:Arvo Commercial Corp 13,723,816 13,723,816 13,723,816 Ayala Prop. Mngt.Corp 31,191 31,191 31,191 Makati Development Corp. 2,173,070 2,173,070 2,173,070
Amount Owed by ALI Subsidiaries to CAPITOL CENTRAL COMMERCIAL
Amount Owed by ALI Subsidiaries to BG WEST PROPERTIES, INC.
Amount Owed by ALI Subsidiaries to CAGAYAN DE ORO GATEWAY CORP.
Amount Owed by ALI Subsidiaries to CAVITE COMMERCIAL TOWNCENTER, INC.
Amount Owed by ALI Subsidiaries to CEBU HOLDINGS, INC.
Page 13 of 22

Avida Land Corp. (Condo) 323,813,220 323,813,220 323,813,220 Amaia Land Corp. (Condo) 636,101 636,101 636,101 Serendra Inc. 18,854 18,854 18,854 Southportal Properties 178,091,668 178,091,668 178,091,668 Alveo Land Corp. (Condo) 251,866,236 251,866,236 251,866,236 Leisure & Allied Ind.Phil 6,035 6,035 6,035 Station Square East 5,890 5,890 5,890 ALI Commercial Center,Inc 799,225 799,225 799,225 Aviana Development Corp. 900 900 900 Accendo Commercial Corp 366,135 366,135 366,135 Adauge Commercial Corp. 23,271 23,271 23,271 North Triangle Depot 829,886 829,886 829,886 Subic Bay Town Centre Inc 943 943 943 Cebu Holdings, Inc. (Condo) 150,814,565 150,814,565 150,814,565 Ayala Land Sales, Inc. 1,911,454 1,911,454 1,911,454 Ayala Land Intl Sales,Inc 5,046,010 5,046,010 5,046,010 Ayalaland Metro North Inc 220,228,840 220,228,840 220,228,840 Soltea Commercial Corp. 15,659,971 15,659,971 15,659,971 Captl Cntrl Com Vent Corp 11,073 11,073 11,073 North Beacon Comml Corp. 19,354 19,354 19,354 North Ventures Com Corp 600 600 600 Westview Comml Vents Corp 4,578 4,578 4,578 Summerhill Com. Ven. Corp 248,872,056 248,872,056 248,872,056 Central Block Dev., Inc. 21,351,681 21,351,681 21,351,681 South Innovative Theater Management Inc. 5,560 5,560 5,560 Ayala Hotels & Resorts (Conso) 343,613 343,613 343,613 Ten Knots Philippines, Inc. (Condo) 218,110 218,110 218,110 CagayanDeOro Gateway Corp 228,746 228,746 228,746 HLC Development Corporation 4,530,963 4,530,963 4,530,963 Airswift Transport, Inc. 37,483,975 37,483,975 37,483,975 Ayalaland Medical Facilit 125,090 125,090 125,090 Sub-Total 1,479,242,679 1,479,242,679 1,479,242,679
Receivable Balance per CECI
Payable Balance per ALI Subsidiaries Current Non-Current
Ayala Land, Inc. (ALI) Subsidiries:Makati Development Corporation 4,475,350 4,475,350 4,475,350 Avida Land Corporation 409,517,161 409,517,161 409,517,161 Amaia Land Corporation 2,785,615 2,785,615 2,785,615 Aurora Properties, Inc. 14,874,183 14,874,183 14,874,183 Vesta Property Holdings Inc. 17,969,029 17,969,029 17,969,029 CECI Realty Corp. 138 138 138 Alveo Land Corporation 965 965 965 Leisure and Allied Industries Phils. Inc. 108,300 108,300 108,300 Cebu Holdings, Inc. 10,000,000 10,000,000 10,000,000 Soltea Commercial Corp. 26,576,362 26,576,362 26,576,362 Ayalaland Malls Synergies, Inc. 2,321,287 2,321,287 2,321,287 Glensworth Development, Inc. 540,608 540,608 540,608 Summerhill Commercial Ventures Corp. 75,186,953 75,186,953 75,186,953 Ayalaland Hotels and Resorts Corp. (Conso) 102,796 102,796 102,796 Ten Knots Philippines, Inc. 150,285 150,285 150,285 Ayalaland Estates, Inc. 272 272 272 Nuevocentro, Inc. 174,133 174,133 174,133 Crans Montana Property Holdings Corporation 8,145 8,145 8,145 Mercado General Hospital, Inc. 6,083,535 6,083,535 6,083,535 HLC Development Corporation 2,975,101 2,975,101 2,975,101 Airswift Transport, Inc. 20,081,655 20,081,655 20,081,655 Sub-Total 593,931,873 593,931,873 593,931,873
Receivable Balance per CRANS MONTANA
Payable Balance per ALI Subsidiaries Current Non-Current
Ayala Land, Inc. (ALI) Subsidiries:Ayala Property Management Corporation 30,357 30,357 30,357 Ayalaland Medical Facilities Leasing Inc. 153,655 153,655 153,655 Sub-Total 184,012 184,012 184,012 -
Amount Owed by ALI Subsidiaries to CECI REALTY CORP.
Amount Owed by ALI Subsidiaries to CRANS MONTANA PROPERTY HOLDINGS, CORP.
Amount Owed by ALI Subsidiaries to CRIMSON FIELD ENTERPRISES
Page 14 of 22

Receivable Balance per CFEI
Payable Balance per ALI Subsidiaries Current Non-Current
Ayala Land, Inc. (ALI) Subsidiries:Red Creek Properties, Inc. 5,369,406 5,369,406 5,369,406 Sub-Total 5,369,406 5,369,406 5,369,406 -
Receivable Balance per DPSI
Payable Balance per ALI Subsidiaries Current Non-Current
Ayala Land, Inc. (ALI) Subsidiries:Arvo Commercial Corporation 11,735 11,735 11,735 Avida Land Corporation 197,172,181 197,172,181 197,172,181 Serendra Inc. 7,078,549 7,078,549 7,078,549 Alveo Land Corporation 7,222,374 7,222,374 7,222,374 Alabang Commercial Corporation 7,677,465 7,677,465 7,677,465 ALI-CII Development Corporation 1,829,299 1,829,299 1,829,299 Station Square East Commercial Corp 12,624,140 12,624,140 12,624,140 ALI Commercial Center, Inc. 22,263,997 22,263,997 22,263,997 North Triangle Depot Commercial Corp 13,628,241 13,628,241 13,628,241 Cebu Holdings, Inc. (Conso) 5,091,031 5,091,031 5,091,031 Cavite Commercial Towncenter Inc. 1,512,197 1,512,197 1,512,197 Ayalaland Metro North, Inc. 61,815 61,815 61,815 Ayalaland Offices (Conso) 27,659,046 27,659,046 27,659,046 One Dela Rosa Property Development, Inc. 4,523,164 4,523,164 4,523,164 NorthBeacon Commercial Corporation 5,894,627 5,894,627 5,894,627 North Eastern Commercial Corp. 4,735,286 4,735,286 4,735,286 Summerhill Commercial Ventures Corp. 5,915,768 5,915,768 5,915,768 Philippine Integrated Energy Solutions, Inc. 10,511,542 10,511,542 10,511,542 Makati Cornerstone Leasing Corp. 2,389,245 2,389,245 2,389,245 Crans Montana Property Holdings Corporation 7,037,074 7,037,074 7,037,074 Sub-Total 344,838,777 344,838,777 344,838,777
Receivable Balance per ECI
Payable Balance per ALI Subsidiaries Current Non-Current
Ayala Land, Inc. (ALI) Subsidiries:Ten Knots Philippines, Inc. 94,668,752 94,668,752 94,668,752 Sub-Total 94,668,752 94,668,752 94,668,752 -
Receivable Balance per FLIL
Payable Balance per ALI Subsidiaries Current Non-Current
Ayala Land, Inc. (ALI) Subsidiries:Ayalaland Malls Synergies, Inc. 1,226,078 1,226,078 1,226,078 ALI Capital Corp. 306,687,547 306,687,547 306,687,547 Arca South Integrated Terminal, Inc. 10,798,555 10,798,555 10,798,555 Sub-Total 318,712,179 318,712,179 318,712,179
Receivable Balance per FSCI
Payable Balance per ALI Subsidiaries Current Non-Current
Ayala Land, Inc. (ALI) Subsidiries:Cebu Holdings, Inc. 17,011,398 17,011,398 17,011,398 Soltea Commercial Corp. 2,790 2,790 2,790 Summerhill Commercial Ventures Corp. 3,571,080 3,571,080 3,571,080 South Innovative Theater Management Inc. 1,283,834 1,283,834 1,283,834 Sub-Total 21,869,102 21,869,102 21,869,102
Receivable Balance per Hillsford
Payable Balance per ALI Subsidiaries Current Non-Current
Ayala Land, Inc. (ALI) Subsidiries:North Eastern Commercial Corp. 1,550 1,550 1,550 Sub-Total 1,550 1,550 1,550 -
Receivable Balance per LAGDIGAN
Payable Balance per ALI Subsidiaries Current Non-Current
Ayala Land, Inc. (ALI) Subsidiries:
Amount Owed by ALI Subsidiaries to DIRECT POWER SERVICES INC.
Amount Owed by ALI Subsidiaries to ECOHOLDINGS COMPANY, INC.
Amount Owed by ALI Subsidiaries to FIRST LONGFIELD INVESTMENTS LTD.
Amount Owed by ALI Subsidiaries to FIVE STAR CINEMA
Amount Owed by ALI Subsidiaries to HILLSFORD PROPERTY CORP.
Amount Owed by ALI Subsidiaries to LAGDIGAN LAND CORP.
Page 15 of 22

Avida Land Corporation 78,000,000 78,000,000 78,000,000 Sub-Total 78,000,000 78,000,000 78,000,000 -
Receivable Balance per LAIP
Payable Balance per ALI Subsidiaries Current Non-Current
Ayala Land, Inc. (ALI) Subsidiries:Avida Land Corporation 22,000 22,000 22,000 Sub-Total 22,000 22,000 22,000 -
Receivable Balance per MCLC
Payable Balance per ALI Subsidiaries Current Non-Current
Ayala Land, Inc. (ALI) Subsidiries:Arvo Commercial Corporation 158,047 158,047 158,047 Avida Land Corporation (Conso) 32,742,727 32,742,727 32,742,727 BellaVita Land Corp. 19,944,476 19,944,476 19,944,476 Station Square East Commercial Corp 1,600 1,600 1,600 ALI Commercial Center, Inc. 169,620 169,620 169,620 North Triangle Depot Commercial Corp 8,940 8,940 8,940 Soltea Commercial Corp. 30,000,000 30,000,000 30,000,000 Sub-Total 83,025,409 83,025,409 83,025,409 -
Receivable Balance per NORTH EASTERN
Payable Balance per ALI Subsidiaries Current Non-Current
Ayala Land, Inc. (ALI) Subsidiries:Arvo Commercial Corporation 843 843 843 Ayala Property Management Corporation 58,768 58,768 58,768 Makati Development Corporation 43,575,840 43,575,840 43,575,840 Avida Land Corporation 440,229 440,229 440,229 Alveo Land Corporation 490,422 490,422 490,422 Leisure and Allied Industries Phils. Inc. 77,436 77,436 77,436 Station Square East Commercial Corp 16,930 16,930 16,930 ALI Commercial Center, Inc. 445,665 445,665 445,665 North Triangle Depot Commercial Corp 118,773 118,773 118,773 Subic Bay Town Center Inc. 843 843 843 Cebu Leisure Company, Inc. 470 470 470 Ayalaland Metro North, Inc. 9,703 9,703 9,703 Soltea Commercial Corp. 1,550 1,550 1,550 Ayalaland Malls Synergies, Inc. 676,749 676,749 676,749 NorthBeacon Commercial Corporation 1,643 1,643 1,643 North Ventures Commercial Corp. 3,123 3,123 3,123 Summerhill Commercial Ventures Corp. 843 843 843 South Innovative Theater Management Inc. 8,150 8,150 8,150 North Triangle Hotel Ventures, Inc. 23,468,798 23,468,798 23,468,798 Ayalaland Estates, Inc. 564,985 564,985 564,985 Cagayan De Oro Gateway Corporation 300 300 300 Sub-Total 69,962,066 69,962,066 69,962,066
Receivable Balance per NTDCC
Payable Balance per ALI Subsidiaries Current Non-Current
Ayala Land, Inc. (ALI) Subsidiries:Avida Land Corporation (Conso) 73,768,979 73,768,979 73,768,979 Amaia Land Corporation 1,341,516 1,341,516 1,341,516 Alveo Land Corporation (Comso) 117,455 117,455 117,455 Ayala Theaters Management, Inc. 99,971 99,971 99,971 Leisure and Allied Industries Phils. Inc. 36,929 36,929 36,929 Station Square East Commercial Corp 137,322 137,322 137,322 ALI Commercial Center, Inc. 4,123,362 4,123,362 4,123,362 Accendo Commercial Corp 7,367 7,367 7,367 Subic Bay Town Center Inc. 400 400 400 Cebu Holdings, Inc. (Conso) 3,028,881 3,028,881 3,028,881 Ayalaland Metro North, Inc. 5,090,927 5,090,927 5,090,927 Soltea Commercial Corp. 3,550 3,550 3,550 NorthBeacon Commercial Corporation 6,221 6,221 6,221 North Ventures Commercial Corp. 75,028 75,028 75,028 North Eastern Commercial Corp. 15,177,838 15,177,838 15,177,838
Amount Owed by ALI Subsidiaries to LEISURE & ALLIED INDUSTRIES PHILS. INC.
Amount Owed by ALI Subsidiaries to MAKATI CORNERSTONE LEASING CORP.
Amount Owed by ALI Subsidiaries to NORTH EASTERN COMMERCIAL CORP.
Amount Owed by ALI Subsidiaries to NORTH TRIANGLE DEPOT COMMERCIAL CORP.
Page 16 of 22

Summerhill Commercial Ventures Corp. 63,741,898 63,741,898 63,741,898 Central Block Developers, Inc. 18,800,000 18,800,000 18,800,000 Ecozone Power Management, Inc. 0 0 0 South Innovative Theater Management Inc. 112,320 112,320 112,320 Ayalaland Hotels and Resorts Corp. (Conso) 30,207,474 30,207,474 30,207,474 Cagayan De Oro Gateway Corporation 28,046 28,046 28,046 HLC Development Corporation 84,335,929 84,335,929 84,335,929 Lio Resort Ventures Inc - TKPI 25,000,000 25,000,000 25,000,000 Airswift Transport, Inc. 875,769 875,769 875,769 Ayalaland Medical Facilities Leasing Inc. 119,340 119,340 119,340 Sub-Total 326,236,524 326,236,524 326,236,524
Receivable Balance per NVCC
Payable Balance per ALI Subsidiaries Current Non-Current
Ayala Land, Inc. (ALI) Subsidiries:Arvo Commercial Corporation 21,322,506 21,322,506 21,322,506 Ayala Property Management Corporation 1,790,801 1,790,801 1,790,801 Makati Development Corporation 2,742,315 2,742,315 2,742,315 Avida Land Corporation (Conso) (889,504) (889,504) (889,504)Amaia Land Corporation 254,306 254,306 254,306 Arca South Integrated Terminal, Inc 5,057,007 5,057,007 5,057,007 Alabang Commercial Corporation (Conso) 13,730 13,730 13,730 Leisure and Allied Industries Phils. Inc. 3,136,696 3,136,696 3,136,696 Station Square East Commercial Corp 8,900 8,900 8,900 ALI Commercial Center, Inc. 630,108 630,108 630,108 Accendo Commercial Corp 520 520 520 North Triangle Depot Commercial Corp 227,850 227,850 227,850 Subic Bay Town Center Inc. 200 200 200 Cebu Holdings, Inc. (Conso) 70,068,292 70,068,292 70,068,292 Ayalaland Metro North, Inc. 70,501,721 70,501,721 70,501,721 Soltea Commercial Corp. 31,180,363 31,180,363 31,180,363 Ayalaland Malls Synergies, Inc. 65,422 65,422 65,422 NorthBeacon Commercial Corporation 3,400 3,400 3,400 North Eastern Commercial Corp. 5,300 5,300 5,300 Summerhill Commercial Ventures Corp. 31,057,686 31,057,686 31,057,686 Central Block Developers, Inc. 15,000,000 15,000,000 15,000,000 Capitol Central Hotel Ventures, Inc. 76,995 76,995 76,995 Cagayan De Oro Gateway Corporation 3,600 3,600 3,600 HLC Development Corporation 38,368,381 38,368,381 38,368,381 Airswift Transport, Inc. 45,939,174 45,939,174 45,939,174 Ayalaland Medical Facilities Leasing Inc. 53,030 53,030 53,030 Sub-Total 336,618,800 336,618,800 336,618,800
Receivable Balance per NBCC
Payable Balance per ALI Subsidiaries Current Non-Current
Ayala Land, Inc. (ALI) Subsidiries:Avida Land Corporation (Conso)) 39,026,596 39,026,596 39,026,596 Amaia Land Corporation 10,173,753 10,173,753 10,173,753 Alveo Land Corporation 565,447 565,447 565,447 Alabang Commercial Corporation (Conso) 7,782 7,782 7,782 Leisure and Allied Industries Phils. Inc. 128,828 128,828 128,828 Station Square East Commercial Corp 10,248 10,248 10,248 ALI Commercial Center, Inc. 113,894 113,894 113,894 Tutuban Properties, Inc. 5,977 5,977 5,977 Accendo Commercial Corp 11,252 11,252 11,252 North Triangle Depot Commercial Corp 58,479 58,479 58,479 Subic Bay Town Center Inc. (34,773) (34,773) (34,773)Cebu Holdings, Inc. 5,000,201 5,000,201 5,000,201 Ayalaland Metro North, Inc. 8,086,021 8,086,021 8,086,021 Soltea Commercial Corp. 15,096,122 15,096,122 15,096,122 Hillsford Property Corporation 5,898 5,898 5,898 North Ventures Commercial Corp. 17,809 17,809 17,809 North Eastern Commercial Corp. 61,515 61,515 61,515 Summerhill Commercial Ventures Corp. 41,051,335 41,051,335 41,051,335 Makati Cornerstone Leasing Corp. 106,486 106,486 106,486 Nuevocentro, Inc. 2,304,948 2,304,948 2,304,948 Cagayan De Oro Gateway Corporation 11,252 11,252 11,252
Amount Owed by ALI Subsidiaries to NORTH VENTURES COMMERCIAL CORP.
Amount Owed by ALI Subsidiaries to NORTHBEACON COMMERCIAL CORP.
Page 17 of 22

APRISA Business Process Solutions, Inc 1,200 1,200 1,200 AyalaLand Malls, Inc. 1,822 1,822 1,822 Airswift Transport, Inc. 15,000,000 15,000,000 15,000,000 Sub-Total 136,812,092 136,812,092 136,812,092 -
Receivable Balance per NUEVOCENTRO &
Subsidiaries Payable Balance per ALI
Subsidiaries Current Non-Current Ayala Land, Inc. (ALI) Subsidiries:Avida Land Corp. 15,634 15,634 15,634 Laguna Technopark, Inc. 2,417,272 2,417,272 2,417,272 Aurora Properties, Inc. 100 100 100 Vesta Prop. Holdings, Inc 26,154 26,154 26,154 Ceci Realty, Inc. 136,990 136,990 136,990 Alveo Land Corp. 9,000 9,000 9,000 AyalaLand Estates, Inc. 1,100 1,100 1,100 Prow Holdings, Inc. 122,764,360 122,764,360 122,764,360 Sub-Total 125,370,610 125,370,610 125,370,610
Receivable Balance per ODR
Payable Balance per ALI Subsidiaries Current Non-Current
Ayala Land, Inc. (ALI) Subsidiries:Arvo Commercial Corporation 36,824,515 36,824,515 36,824,515 Ayala Property Management Corporation 119,260 119,260 119,260 Avida Land Corporation 646,850,000 646,850,000 646,850,000 Amaia Land Corporation 490,000,000 490,000,000 490,000,000 Alveo Land Corporation 2,845,390 2,845,390 2,845,390 Accendo Commercial Corp 348,293 348,293 348,293 Cebu Holdings, Inc. 36,800,000 36,800,000 36,800,000 Ayalaland Metro North, Inc. 5,000,000 5,000,000 5,000,000 Hillsford Property Corporation 25,000,000 25,000,000 25,000,000 Westview Commercial Ventures Corp. 20,632,975 20,632,975 20,632,975 Sunnyfield E-Office Corp 35,000,000 35,000,000 35,000,000 Summerhill Commercial Ventures Corp. 10,997,634 10,997,634 10,997,634 Central Block Developers, Inc. 65,300,000 65,300,000 65,300,000 Econorth Resorts Ventures, Inc. 157,495 157,495 157,495 HLC Development Corporation 119,100,000 119,100,000 119,100,000 Airswift Transport, Inc. 1,556,224 1,556,224 1,556,224 Sub-Total 1,496,531,785 1,496,531,785 1,496,531,785 -
Receivable Balance per PHIL. ENERGY
Payable Balance per ALI Subsidiaries Current Non-Current
Ayala Land, Inc. (ALI) Subsidiries:Avida Land Corporation (610,875) (610,875) (610,875)Amaia Land Corporation 57,876 57,876 57,876 Alabang Commercial Corporation 10,164,083 10,164,083 10,164,083 Accendo Commercial Corp 8,794,362 8,794,362 8,794,362 North Triangle Depot Commercial Corp 12,830,187 12,830,187 12,830,187 Cebu Holdings, Inc. 29,564,112 29,564,112 29,564,112 Ayalaland Metro North, Inc. 399,486 399,486 399,486 North Eastern Commercial Corp. 96,883 96,883 96,883 Summerhill Commercial Ventures Corp. 1,228,230 1,228,230 1,228,230 Ayala Hotels & Resorts (Conso) 2,839,180 2,839,180 2,839,180 Cagayan De Oro Gateway Corporation 1,971 1,971 1,971 HLC Development Corporation 58,122 58,122 58,122 Ten Knots Philippines, Inc. 122,931 122,931 122,931 Sub-Total 65,546,548 65,546,548 65,546,548
Receivable Balance per PRIMAVERA
Payable Balance per ALI Subsidiaries Current Non-Current
Ayala Land, Inc. (ALI) Subsidiries:Arvo Commercial Corporation 401,906 401,906 401,906 Avida Land Corporation 93,317 93,317 93,317 Amaia Land Corporation 127,183 127,183 127,183 First Gateway Real Estate Corp 837,584 837,584 837,584
Amount Owed by ALI Subsidiaries to NUEVOCENTRO, INC. & SUBSIDIARIES
Amount Owed by ALI Subsidiaries to ONE DELA ROSA PROPERTY DEVELOPMENT, INC.
Amount Owed by ALI Subsidiaries to PHIL. INTEGRATED ENERGY SOLUTIONS, INC.
Amount Owed by ALI Subsidiaries to PRIMAVERA CENTRE, INC.
Page 18 of 22

North Ventures Commercial Corp. 3,749 3,749 3,749 AyalaLand Malls, Inc. 5,705 5,705 5,705 Sub-Total 1,469,444 1,469,444 1,469,444 -
Receivable Balance per POPI & Subs.
Payable Balance per ALI Subsidiaries Current Non-Current
Ayala Land, Inc. (ALI) Subsidiries:Arvo Commercial Corp 54,957,764 54,957,764 54,957,764 Ayala Prop. Mngt.Corp 1,233 1,233 1,233 Makati Development Corp. 62,727 62,727 62,727 Avida Land Corp. 445,354,919 445,354,919 445,354,919 Amaia Land Corp. 3,229 3,229 3,229 Laguna Technopark, Inc. 856,197 856,197 856,197 Leisure & Allied Ind.Phil 78,701 78,701 78,701 ALI Commercial Center,Inc 235,137 235,137 235,137 Prime Orion Phils., Inc. (Conso) (856,197) (856,197) (856,197)North Triangle Depot 20,540 20,540 20,540 Cebu Holdings, Inc. (Conso) 28,003,409 28,003,409 28,003,409 Ayalaland Metro North Inc 8,312,988 8,312,988 8,312,988 Soltea Commercial Corp. 26,560,320 26,560,320 26,560,320 AMSI, Inc. 54,271 54,271 54,271 North Ventures Com Corp 400 400 400 North Eastern Comm Corp 2,000 2,000 2,000 Summerhill Com. Ven. Corp 197,030,665 197,030,665 197,030,665 Central Block Dev., Inc. 54,000,000 54,000,000 54,000,000 South Innovative Theater Management Inc. 6,340 6,340 6,340 Ayalaland Hotels and Resorts Corp. (Conso) 124,323 124,323 124,323 Ten Knots Philippines, In 36,227 36,227 36,227 AyalaLand Estates, Inc. 1,131 1,131 1,131 Nuevocentro Inc. 1,176,577 1,176,577 1,176,577 HLC Development Corporation 10,090,565 10,090,565 10,090,565 Airswift Transport, Inc. 20,401,799 20,401,799 20,401,799 Sub-Total 846,515,264 846,515,264 846,515,264 -
Receivable Balance per RCPI
Payable Balance per ALI Subsidiaries Current Non-Current
Ayala Land, Inc. (ALI) Subsidiaries:Crimson Field Enterprises, Inc. 24,420 24,420 24,420 Sub-Total 24,420 24,420 24,420 -
Receivable Balance per SERENDRA
Payable Balance per ALI Subsidiaries Current Non-Current
Ayala Land, Inc. (ALI) Subsidiaries:Ayala Property Management Corporation 333,119 333,119 333,119 Makati Development Corporation 183,195 183,195 183,195 Avida Land Corporation (Conso) 732,266,447 732,266,447 732,266,447 Amaia Land Corporation 1,659,970,133 1,659,970,133 1,659,970,133 BellaVita Land Corp. 958 958 958 BG West Properties, Inc 17,001,618 17,001,618 17,001,618 Alveo Land Corporation 2,243,214 2,243,214 2,243,214 Leisure and Allied Industries Phils. Inc. 56,967,551 56,967,551 56,967,551 Cebu Holdings, Inc. 137,300,000 137,300,000 137,300,000 Summerhill Commercial Ventures Corp. 173,463 173,463 173,463 HLC Development Corporation 2,530,614 2,530,614 2,530,614 Sub-Total 2,608,970,311 2,608,970,311 2,608,970,311 -
Receivable Balance per SOLTEA
Payable Balance per ALI Subsidiaries Current Non-Current
Ayala Land, Inc. (ALI) Subsidiaries:Avida Land Corporation 1,455,881 1,455,881 1,455,881 Amaia Land Corporation 107,736 107,736 107,736 Alveo Land Corporation 268,115 268,115 268,115 Station Square East Commercial Corp 2,470 2,470 2,470 ALI Commercial Center, Inc. 736,056 736,056 736,056 North Triangle Depot Commercial Corp 58,550 58,550 58,550
Amount Owed by ALI, ALI-Subsidiaries to SERENDRA, INC.
Amount Owed by ALI Subsidiaries to PRIME ORION PHILS., INC. & SUBSIDIARIES
Amount Owed by ALI-Subsidiaries to RED CREEK PROPERTIES, INC.
Amount Owed by ALI, ALI-Subsidiaries to SOLTEA
Page 19 of 22

Cebu Leisure Company, Inc. 6,600 6,600 6,600 Cavite Commercial Towncenter Inc. 17,785 17,785 17,785 Ayalaland Malls Synergies, Inc. 181,008 181,008 181,008 North Ventures Commercial Corp. 500 500 500 North Eastern Commercial Corp. 4,540 4,540 4,540 South Innovative Theater Management Inc. 5,950 5,950 5,950 Sub-Total 2,845,191 2,845,191 2,845,191 -
Receivable Balance per SOUTHPORTAL
Payable Balance per ALI Subsidiaries Current Non-Current
Ayala Land, Inc. (ALI) Subsidiaries:Avida Land Corporation 86,011,775 86,011,775 86,011,775 Ayalaland Metro North, Inc. 15,066,498 15,066,498 15,066,498 Summerhill Commercial Ventures Corp. 37,029,951 37,029,951 37,029,951 HLC Development Corporation 1,104,856 1,104,856 1,104,856 Sub-Total 139,213,080 139,213,080 139,213,080 -
Elimination Entry #201 Receivable Balance per
SSECC Payable Balance per ALI
Subsidiaries Current Non-Current Ayala Land, Inc. (ALI) Subsidiaries:Arvo Commercial Corporation 107,375 107,375 107,375 Makati Development Corporation (Conso) 548,000 548,000 548,000 Avida Land Corporation (Conso) 2,505,501 2,505,501 2,505,501 Amaia Land Corporation 186,107 186,107 186,107 BellaVita Land Corp. 14,978 14,978 14,978 Serendra Inc. 592,284 592,284 592,284 Alveo Land Corporation (Conso) 1,211,374 1,211,374 1,211,374 Alabang Commercial Corporation (Conso) 11,210 11,210 11,210 Leisure and Allied Industries Phils. Inc. 1,126,681 1,126,681 1,126,681 ALI Commercial Center, Inc. 1,446,263 1,446,263 1,446,263 Accendo Commercial Corp 180 180 180 North Triangle Depot Commercial Corp 333,467 333,467 333,467 Cebu Holdings, Inc. (Conso) 25,016,575 25,016,575 25,016,575 Ayalaland Metro North, Inc. 51,220 51,220 51,220 Soltea Commercial Corp. 2,600,600 2,600,600 2,600,600 NorthBeacon Commercial Corporation 3,390 3,390 3,390 North Ventures Commercial Corp. 880 880 880 North Eastern Commercial Corp. 2,700 2,700 2,700 Summerhill Commercial Ventures Corp. 13,851,316 13,851,316 13,851,316 Cagayan De Oro Gateway Corporation 1,300 1,300 1,300 AyalaLand Malls, Inc. 19,118 19,118 19,118
Sub-Total 49,630,520 49,630,520 49,630,520
Elimination Entry #202 Receivable Balance per
SBTCI Payable Balance per ALI
Subsidiaries Current Non-Current Ayala Land, Inc. (ALI) Subsidiaries:MDC - Subic 854,410 854,410 854,410 Avida Land Corporation 110,100,000 110,100,000 110,100,000 Leisure and Allied Industries Phils. Inc. 227,698 227,698 227,698 Station Square East Commercial Corp 780 780 780 ALI Commercial Center, Inc. 41,580 41,580 41,580 Accendo Commercial Corp 3,090 3,090 3,090 North Triangle Depot Commercial Corp 34,005 34,005 34,005 Cebu Holdings, Inc. 19,900,000 19,900,000 19,900,000 Ayalaland Metro North, Inc. 15,000,000 15,000,000 15,000,000 Soltea Commercial Corp. 5,044,175 5,044,175 5,044,175 North Ventures Commercial Corp. 700 700 700 Summerhill Commercial Ventures Corp. 40,425,468 40,425,468 40,425,468 South Innovative Theater Management Inc. 1,740 1,740 1,740
Econorth Resorts Ventures, Inc. 137,431 137,431 137,431 Sub-Total 191,771,076 191,771,076 191,771,076 -
Elimination Entry #189 Receivable Balance per
SUMMERHILL Payable Balance per ALI
Subsidiaries Current Non-Current Ayala Land, Inc. (ALI) Subsidiaries:
Amount Owed by ALI-Subsidiaries to SOUTHPORTAL PROPERTIES, INC.
Amount Owed by STATION SQUARE EAST COMMERCIAL CORP.
Amount Owed by SUBIC BAY TOWN CENTER, INC.
Amount Owed by ALI-Subsidiaries to SUMMERHILL COMMERCIAL VENTURES CORP.
Page 20 of 22

Arvo Commercial Corporation 22,963 22,963 22,963 Makati Development Corporation 132,001 132,001 132,001 Alabang Commercial Corporation (Conso) 4,970 4,970 4,970 Leisure and Allied Industries Phils. Inc. 3,013,675 3,013,675 3,013,675 Station Square East Commercial Corp 13,060 13,060 13,060 ALI Commercial Center, Inc. 574,822 574,822 574,822 North Triangle Depot Commercial Corp 112,555 112,555 112,555 Subic Bay Town Center Inc. 1,380 1,380 1,380 Cebu Holdings, Inc. 740 740 740 Ayalaland Metro North, Inc. 41,220 41,220 41,220 Soltea Commercial Corp. 250 250 250 Ayalaland Malls Synergies, Inc. 8,715 8,715 8,715 NorthBeacon Commercial Corporation 1,200 1,200 1,200 North Ventures Commercial Corp. 2,280 2,280 2,280 North Eastern Commercial Corp. 3,160 3,160 3,160 AyalaLand Offices, Inc. 1,394 1,394 1,394 North Triangle Hotel Ventures, Inc. 17,248 17,248 17,248 Sub-Total 3,951,633 3,951,633 3,951,633 -
Elimination Entry #181 Receivable Balance per
TKDC & Subsidiaries Payable Balance per ALI
Subsidiaries Current Non-Current Ayala Land, Inc. (ALI) Subsidiaries:Avida Land Corp. 21,000,000 21,000,000 21,000,000 AYALALAND HOTELS AND RES 1,567,514 1,567,514 1,567,514 Cebu Holdings, Inc. 7,000,000 7,000,000 7,000,000 Summerhill Com. Ven. Corp 103,000,000 103,000,000 103,000,000 DirectPower Services, Inc 9,458 9,458 9,458 Ecoholdings Company, Inc. 700 700 700 Ten Knots Philippines, Inc. (Conso) 670,082,282 670,082,282 670,082,282 Airswift Transport, Inc. 4,484,290 4,484,290 4,484,290 Sub-Total 807,144,244 807,144,244 807,144,244 -
Elimination Entry #180 Receivable Balance per
TKPI & Subsidiaries Payable Balance per ALI
Subsidiaries Current Non-Current Ayala Land, Inc. (ALI) Makati Development Corp. 123,712 123,712 123,712 AYALALAND HOTELS AND RES (Conso) 913,154 913,154 913,154 Ten Knots Philippines, Inc. (Conso) 59,899 59,899 59,899 Ecoholdings Company, Inc. 649,444 649,444 649,444 Ten Knots Development Corporation (Conso) 49,811,002 49,811,002 49,811,002 Airswift Transport, Inc. 22,507,978 22,507,978 22,507,978 Sub-Total 74,065,189 74,065,189 74,065,189 -
Elimination Entry #179 Receivable Balance per
VPHI Payable Balance per ALI
Subsidiaries Current Non-Current Ayala Land, Inc. (ALI) Arvo Commercial Corporation 53,119,613 53,119,613 53,119,613 Avida Land Corporation (Conso) 523,321,500 523,321,500 523,321,500 Aurora Properties, Inc. 150 150 150 Alveo Land Corporation 34,841,018 34,841,018 34,841,018 Accendo Commercial Corp 223,663 223,663 223,663 Cebu Holdings, Inc. 146,250,000 146,250,000 146,250,000 Ayala Land International Sales, Inc 6,300,000 6,300,000 6,300,000 Ayalaland Metro North, Inc. 246,868,556 246,868,556 246,868,556 Soltea Commercial Corp. 206,496,449 206,496,449 206,496,449 North Eastern Commercial Corp. 35,150 35,150 35,150 Summerhill Commercial Ventures Corp. 302,324,686 302,324,686 302,324,686 Central Block Developers, Inc. 70,000,000 70,000,000 70,000,000 North Triangle Hotel Ventures, Inc. 35,262,747 35,262,747 35,262,747 Ten Knots Philippines, Inc. - Conso 625,826,608 625,826,608 625,826,608 Nuevocentro, Inc. 1,535,095 1,535,095 1,535,095 Panay Medical Ventures Inc. 348,087 348,087 348,087 HLC Development Corporation 67,136,671 67,136,671 67,136,671 Airswift Transport, Inc. 48,185,293 48,185,293 48,185,293 Ayalaland Medical Facilities Leasing Inc. 2,795,983 2,795,983 2,795,983 Sub-Total 2,370,871,270 2,370,871,270 2,370,871,270 -
Amount Owed by ALI to TEN KNOTS PHILIPPINES, INC. & SUBSIDIARIES
Amount Owed by ALI to VESTA PROPERTIES INCORPORATED
Amount Owed by ALI to TEN KNOTS DEVELOPMENT CORP. & SUBSIDIARIES
Page 21 of 22

Elimination Entry #180 Receivable Balance per
WESTVIEW Payable Balance per ALI
Subsidiaries Current Non-Current Ayala Land, Inc. (ALI) Avida Land Corporation 645,930 645,930 645,930 Amaia Land Corporation 577,624 577,624 577,624 Leisure and Allied Industries Phils. Inc. (895,040) (895,040) (895,040) North Triangle Depot Commercial Corp 5,210 5,210 5,210 Subic Bay Town Center Inc. 9,983 9,983 9,983 Cebu Holdings, Inc. 5,210 5,210 5,210 Capitol Central Commercial Ventures Corp. 103,189 103,189 103,189 Sub-Total 452,106 452,106 452,106 -
Elimination Entry #180 Receivable Balance per
WHI Payable Balance per ALI
Subsidiaries Current Non-Current Ayala Land, Inc. (ALI) Summerhill Commercial Ventures Corp. 10,159,426 10,159,426 10,159,426 Ayalaland Medical Facilities Leasing Inc. 2,928,214 2,928,214 2,928,214 Sub-Total 13,087,640 13,087,640 13,087,640 -
TOTAL ELIMINATED RECEIVABLES 107,069,941,229 107,069,941,229 107,069,941,229 -
Amount Owed by ALI to WESTVIEW VENTURES COMMERCIAL CORP.
Amount Owed by ALI to WHITEKNIGHT HOLDINGS, INC.
Page 22 of 22

AYALA LAND, INC. AND SUBSIDIARIESSchedule D - Intangible Assets - Other AssetsAs of December 31, 2018
DESCRIPTIONBEGINNING BALANCE
ADDITIONS AT COST
CHARGED TO COSTS &
EXPENSES
CHARGED TO OTHER ACCTS
OTHER CHANGES ADDITIONS
(DEDUCTIONS)ENDING BALANCE
Lease Right 1/ 4,463,862,293Php -Php (384,034,065) -Php -Php 4,079,828,228Php
4,463,862,293Php -Php (384,034,065)Php -Php -Php 4,079,828,228Php
1/ Includes the following intangible assets and classified under non-current assets. - the right to use the property in Apulit Island expiring on December 31, 2029 - leasehold rights arising from the acquisition of POPI involving lease agreement with Philippine National Railways (PNR) expiring on September 5, 2039 - NTDCC's development rights on an 8.3-hectare portion of the MRT Development Corporation expiring on June 21, 2048

AYALA LAND, INC. AND SUBSIDIARIESSCHEDULE E - LONG-TERM DEBTAs of December 31, 2018
TITLE OF ISSUE & TYPE OF OBLIGATION
AMOUNT AUTHORIZED BY
INDENTURE/ FACILITY AGREEMENT
CURRENT PORTION OF LONG-TERM DEBT
(in '000)
LONG-TERM DEBT (NET OF CURRENT
PORTION)(in '000)
Interest RateNo. of Periodic
InstallmentMaturity Date
Ayala Land, Inc.:Bonds
Philippine Peso 9,350,000 9,341,196 - 5.625% N/A, Bullet April 27, 2019
Philippine Peso 3,000,000 2,971,976 - 3.000% N/A, Bullet October 19, 2019
Philippine Peso 4,000,000 - 3,989,546 4.625% N/A, Bullet October 10, 2020
Philippine Peso 5,650,000 - 5,644,680 6.000% N/A, Bullet April 27, 2022
Philippine Peso 7,000,000 - 6,960,744 4.500% N/A, Bullet April 29, 2022
Philippine Peso 8,000,000 - 7,909,305 7.024% N/A, Bullet October 05, 2023
Philippine Peso 7,000,000 - 6,952,613 3.892% N/A, Bullet October 07, 2023
Philippine Peso 15,000,000 - 14,923,051 5.000% N/A, Bullet January 30, 2024
Philippine Peso 8,000,000 - 7,945,703 5.625% N/A, Bullet April 25, 2025
Philippine Peso 7,000,000 - 6,949,421 4.750% N/A, Bullet October 25, 2025
Philippine Peso 8,000,000 - 7,939,468 4.850% N/A, Bullet March 23, 2026
Philippine Peso 7,000,000 - 6,969,630 5.262% N/A, Bullet May 02, 2027
Philippine Peso 10,000,000 - 9,886,828 5.920% N/A, Bullet April 27, 2028
Philippine Peso 2,000,000 - 1,984,613 6.000% N/A, Bullet October 10, 2033Fixed rate corporate notes (FXCNs)
Philippine Peso 5,000,000 50,000 4,750,000 4.500% 33 March 10, 2023
Philippine Peso 1,000,000 10,000 954,859 7.525% 11 January 19, 2026
Philippine Peso 4,300,000 3,995,630 2.750% N/A, Bullet April 17, 2019
Philippine Peso 3,100,000 3,097,745 - 3.250% N/A, Bullet February 23, 2019Bank loan -US DollarBank loan -Peso - Bank Loan (BDO) 10,000,000 82,000 8,036,000 4.500% 8 February 28, 2026
Bank Loan (BPI) 609,875 30,494 500,533 4.500% Various Various from 2021 to 2023
Bank Loan (DBP) 4,789,500 278,725 3,751,425 4.725% Various Various from 2020 to 2021
Bank Loan (LBP) 5,000,000 50,000 4,877,091 6.906% 39 March 19, 2028
Bank Loan (MBTC) 10,000,000 - 9,957,171 4.949% 28 March 21, 2027
Bank Loan (RCBC) 1,900,000 47,500 1,776,500 4.500% 26 March 30, 2023
Sub-Total 146,699,375 19,955,266Php 122,659,181Php
Subsidiaries:Bonds 5,000,000 - 4,980,702 5.320% N/A, Bullet June 06, 2021Fixed rate corporate notes (FXCNs) Various 37,500 1,350,000 Various fixed rates Various Various from 2018 to 2020Bank loan -Peso
Bank Loan (BPI) Various 1,188,803 7,977,151 Various fixed and floating rates Various Various from 2015 to 2027
Bank Loan (LandBank of the Phil) Various 184,175 4,030,700 Various fixed rates Various Various from 2020 to 2022
Bank Loan (PNB) Various 313,125 3,901,250 Various fixed rates Various Various from 2020 to 2027
Bank Loan (UBP) 3,000,000 937,500 1,687,500 5.25% Various March 30, 2022
Bank Loan (RCBC) 1,143,000 6,800 116,882 5.000% 12 January 30, 2020Bank loan -MYR Various 616,021 2,769,566 Various Various Various
Sub-Total 3,283,924Php 26,813,751Php
23,239,190Php 149,472,932Php

AYALA LAND, INC. AND SUBSIDIARIESSCHEDULE F - Indebtedness to Related Parties (Long Term Loans from Related Companies) As of December 31, 2018
BALANCE AT BALANCE ATBEGINNING OF PERIOD END OF PERIOD
(in '000) (in '000)
Bank of the Philippine Islands 12,292,473Php 9,696,981Php
NAME OF RELATED PARTY

AYALA LAND, INC. AND SUBSIDIARIESSCHEDULE G - GUARANTEES OF SECURITIES OF OTHER ISSUERSAs of December 31, 2018
NAME OF ISSUING ENTITY OF SECURITIES GUARANTEED BY THE COMPANY FOR W/C THIS STATEMENT IS FILED
TITLE OF ISSUE OF EACH CLASS OF
SECURITIES GUARANTEED
TOTAL AMOUNT GUARANTEED & OUTSTANDING
AMOUNT OWNED BY PERSON FOR W/C
STATEMENT IS FILED
NATURE OFGUARANTEE
NOT APPLICABLE

AYALA LAND, INC. AND SUBSIDIARIESSCHEDULE H- CAPITAL STOCKAs of December 31, 2018
ISSUED SUBSCRIBEDTREASURY
SHARESTOTAL
Common Stock 20,000,000,000 14,614,387,486 120,493,595 14,734,881,081 5,601,470 6,923,412,191 134,733,309 Preferred Stock 15,000,000,000 13,066,494,759 13,066,494,759 12,163,180,640 480
OTHERSTITLE OF ISSUENUMBER OF
SHARES AUTHORIZED
NUMBER OF SHARES ISSUED AND OUTSTANDING AT SHOWN UNDER RELATED BALANCE SHEET CAPTION
NUMBER OF SHARES
RESERVED FOR OPTIONS,
WARRANTS, CONVERSION AND OTHER
RIGHTS
NUMBER OF SHARES HELD BY RELATED PARTIES
DIRECTORS, OFFICERS AND
EMPLOYEES

AYALA LAND, INC.SCHEDULE I - RECONCILIATION OF RETAINED EARNINGS AVAILABLE FOR DIVIDEND DECLARATIONDecember 31,2018Schedule I - Reconciliation Of Retained Earnings Available For Dividend Declaration
Amount (In Thousands)Unappropriated Retained Earnings, beginning 48,563,943,910Php Less adjustments:
Treasury sharesDeferred tax assets (2,628,917,293) Fair Value adjustment (593,852,588)
Unappropriated Retained Earnings, as adjusted, beginning 45,341,174,030 Net Income based on the face of AFS 15,198,950,784Php Less: Non-actual/unrealized income net of tax
Amount of provision for deferred tax during the year (381,935,670) Unrealized foreign exchange gain - net (except those
attributable to Cash and Cash Equivalents) Unrealized actuarial gainFair value adjustment of Investment Property resulting to gain
adjustment due to deviation from PFRS/GAAP-gain Other unrealized gains or adjustments to the retained earnings as a
result of certain transactions accounted for under the PFRSAdd: Non-actual losses
Depreciation on revaluation increment (after tax)Adjustment due to deviation from PFRS/GAAP – loss Loss on fair value adjustment of investment property (after tax)
Net Income Actual/Realized 14,817,015,114Php Less: Other adjustments
Dividend declarations during the period (7,485,914,705) Effects of prior period adjustments Reversal of Treasury shares
7,331,100,410 Unappropriated Retained Earnings, as adjusted, ending 52,672,274,439
Items

AYALA CORPORATION AND SUBSIDIARIESSCHEDULE J - CORPORATE ORGANIZATIONAL CHART (part 1)As of December 31, 2018
47.04%
100% 100% 100% 100%
47.0% 50% 100% 100.00%
40% 100% 100% 100%
35.1% 100% 100% 100%
100% 100% 78.8% 100%
30.9% 78.1% 30.9% 60%
100.00% 100.00%
20.1%
50%
60%
16.3%
0.04%
2.1%
AYALA CORPORATION
AC INDUSTRIAL TECHNOLOGY
HOLDINGS, INC.
AYALA AVIATION CORPORATION
AC INTERNATIONAL
LIONTIDE HOLDINGS INC.
AG COUNSELORS CORPORATION
AYALA HOTELS, INC. (73.5%)
AYALA LAND, INC.
ASIACOM PHILIPPINES, INC.
AYC FINANCE LIMITED
AZALEA INTERNATIONAL
VENTURE PARTNERS LIMITED
AYALA HEALTHCARE HOLDINGS, INC.
BANK OF THE PHILIPPINE ISLANDS
AC VENTURES HOLDING CORP.
BESTFULL HOLDINGS LIMITED
DARONG AGRICULTURAL AND
DEVELOPMENT
GLOBE TELECOM, INC.
AC INFRASTRUCTURE HOLDINGS
CORPORATION
MICHIGAN HOLDINGS, INC.
MANILA WATER COMPANY, INC.
PHILWATER HOLDINGS COMPANY,
INC.
PUREFOODS INTERNATIONAL
TECHNOPARK LAND, INC.
AC ENERGY, INC.
MERMAC, INC.
LAGDIGAN LAND CORPORATION
(68.2%)
AC EDUCATION, INC.
HCX TECHNOLOGY PARTNERS, INC.

Legend:% of ownership appearing outside the box - direct economic % of ownership % of ownership appearing inside the box - effective % of economic ownership
Subsidiaries Ayala Land, Inc.
Alveo Land Corporation
(100%)
Serendra, Inc. (39%)
Solinea, Inc. (formerly
Bigfoot Palms, Inc.) (65%)
BGSouth Properties, Inc. (50%)
Portico Land Corp. (60%)
Alveo-Federal Land Communities, Inc.
(50%)
Serendra, Inc. (28%)
Amorsedia Development Corporation
(100%)
OLC Development Corporation
(100%)
Ayala Greenfield
Development Corp. (50%)
HLC Development Corporation
(100%)
Allysonia International Ltd (100%)
Avida Land Corporation
(100%)
Buklod Bahayan
Realty and Development Corp. (100%)
Avida Sales Corp. (100%)
Amicassa Process
Solutions, Inc. (100%)
BGNorth Properties, Inc. (50%)
Avenco South Corporation
(70%)
Buendia Landholdings,
Inc. (100%)
Ayala Land Sales, Inc.
(100%)
Amaia Land Co. (formerly First Realty
Communities, Inc.) (100%)
Amaia Southern
Properties, Inc. (65%)
Ayala Land International
Sales, Inc. (100%)
Ayalaland International Marketing, Inc. (AIMI)
(100%)
Ayala Land International (Singapore)
Pte. Ltd. (100%)
Ayalaland International
Marketing (Hong Kong)
Limited (100%)
Ayala Land International Marketing , SRL (100%)
Ayala Land International
Marketing London (100%)
Crans Montana
Holdings, Inc. (100%)
Crimson Field Enterprises, Inc. (100%)
Ecoholdings Company, Inc.
(100%)
NorthBeacon Commercial Corporation
(100%)
Red Creek Properties, Inc. (100%)
Ayala Land, Inc.

Regent Time
International, Limited
(100%)
Bonifacio Land Corp. (5%)
(An Associate of ALI Group)
Fort Bonifacio Development Corporation
(55%)
North Eastern Commercial
Corp. (formerly Asterion
Technopod, Incorporated)
(100%)
Westview Commercial
Ventures Corp (formerly
Crestview E-Office Corporation)
(100%)
North Ventures Commercial
Corp. (formerly Fairview Prime
Commercial Corp.)
(100%)
Hillsford Property
Corporation (100%)
Primavera Towncentre
, Inc. (100%)
Summerhill E-Office
Corporation (100%)
Sunnyfield E-Office
Corporation (100%)
Subic Bay Town
Centre, Inc. (100%)
Regent Wise
Investments Limited (100%)
AyalaLand Real Estate
Investments Inc. (100%)
Rize-AyalaLand (Kingsway) GP Inc.,
(49%) (An Associate of ALI Group)
AyalaLand Advisory Broadway
Inc. (100%)
AyalaLand Development (Canada) Inc.
(100%)
Tianjin Eco City Ayala Land
Development Co., Ltd. (40%)
(An Associate of ALI Group)
MCT Bhd. (66.25%)
Blue Horizons Holdings PTE,
Limited (100%)
AyalaLand OpenAsia
Holdings PTE, Ltd. (100%)
AyalaLand Commercial
REIT, Inc. (100%)
Arvo Commercial Corporation
(100%)
BellaVita Land
Corporation (100%)
ALO Prime Realty
Corporation (100%)
AyalaLand Offices, Inc. (ALO) (formerly ALI Property Partners Corp.
(APPCo)) (100%)
First Gateway Real Estate
Corp. (100%)
Glensworth Development,
Inc. (100%)
UP North Property Holdings,
Inc. (100%)
One Dela Rosa Property
Development, Inc. (100%)
Ayala Land, Inc.
Aurora Properties, Incorporated
(80%)
Soltea Commercial Corp. (20%)
Vesta Property Holdings, Inc.
(70%)
Station Square East Commercial
Corporation (69%)
Accendo Commercial Corp. (67%)
Avenco South Corporation
(30%)Aviana
Development Corporation
(10%)
Cagayan de Oro Gateway Corp. (70%)
Ceci Realty, Inc. (60%)
Soltea Commercial Corp. (20%)
CMPI Holdings, Inc. (60%)
CMPI Land, Inc. (60%)
ALI-CII Development Corporation
(50%)
Roxas Land Corporation
(50%)
Makati Development Corporation (100%)
MDC - Subic (100%)
MDC - Build Plus (100%)
MDC Equipment Solutions, Inc. (100%)
MDC Conqrete Inc.
(100%)MDBI
Construction Corp. (67%)
Ayala Hotels, Inc. (50%)
AyalaLand Hotels and Resorts Corporation
(100%)Enjay Hotels, Inc. (100%)
Cebu Insular Hotel Company, Inc. (63%)
Greenhaven Property Venture, Inc. (100%)
Bonifacio Hotel Ventures, Inc. (100%)
Southcrest Hotel Ventures, Inc. (67%)
Northgate Hotel Ventures, Inc. (70%)
North Triangle Hotel Ventures, Inc. (100%)
Ecosouth Hotel Ventures, Inc. (100%)
ALI Makati Hotels & Residences, Inc. (80%)
ALI Makati Hotel Property, Inc. (80%)
Regent Horizons Conservation Company, Inc. (formerly Asian Conservation
Company, Inc. (100%)Ten Knots Phils, Inc. and
Subsidiary (40%)
Ten Knots Development, Corp. and Subs (40%)Sentera Hotel
Ventures Inc. (100%)
Lagdian Land Corporation (60%)

Ventures Inc. (100%)Econorth Resorts
Ventures, Inc. (100)ALI Triangle Hotel
Ventures, Inc. (100%)ArcaSouth Hotel
Ventures, Inc. (ASHVI) (100%)
Capitol Central Hotel Ventures, Inc. (CCHVI) (100%)
Circuit Makati Hotel Ventures, Inc. (CMHVI) (100%)
Sicogon Town Hotel, Inc. (100%)
Sicogon Island Tourism Estate, Corp. (100%)
Bay Area Hotel Ventures, Inc. (100%)
Makati North Hotel Ventures, Inc. (100%)
One Makati Hotel Ventures, Inc. (100%)
One Makati Residential Ventures, Inc. (100%)
Asiatown Hotel Ventures, Inc. (100%)
Ayala Land, Inc.
Ten Knots Phils, Inc. (60%)
Bacuit Bay Development
Corporation (100%)
Paragua Eco-Resort Ventures Inc. (100%)
North Liberty Resort Ventures Inc. (100%)
Lio Resort Ventures Inc.
(100%)
Lio Tourism Estate Management Corp(100%)
Ten Knots Development Corp.
(60%)
Chirica Resorts Corp. (100%)
Kingfisher Capital Resources Corp.
(100%)
Pangalusian Island Resort Corporation
(100%)
Ayala Property Management
Corporation (100%)
Prime Support Services, Inc. (100%)
Ayala Theatres Management, Inc.
(100%)Five Star
Cinema, Inc. (100%)
Leisure and Allied Industries
Philippines, Inc. (50%)
ALInet.com, Inc. (100%) Cavite Commercial
Town Center, Inc. (100%)
First Longfield Investments Limited
(100%)
Green Horizons Holdings Limited (100%)
PCM Formosa Company Limited (50%)
Esta Galleria, Inc. (100%)
Aprisa Business Process
Solutions, Inc. (100%)
DirectPower Services, Inc. (100%) Philippine Integrated Energy
Solutions, Inc. (100%)ALI Capital Corp. (formerly Varejo
Corporation) (100%)
Integrated Eco-resort Inc.
(100%)
Airswift Transport, Inc. (formerly Island
Transvoyager, Inc.) (100%)
SIAL Specialty
Retailers, Inc. (50%)
(Joint Venture Entity of ALI group)
Adauge Commercial Corporation (60%)
Ayalaland Estates, Inc. (formerly Southgateway
Development Corp.) (100%)

AyaGold Retailers, Inc. (50%) (Joint
Venture Entity of ALI group)
Ayala Land, Inc.
Central Block Developers, Inc.. (45%)
AyalaLand Club Management, Inc. (100%)
North Triangle Depot Commercial Corporation (73%)
Soltea Commercial Corp. (60%)
Cebu Holdings, Inc. (70%)
Taft Punta Engaño Property Inc. (55%)
Asian I-Office Properties, Inc. (100%)
Cebu Leisure Company, Inc. (100%)
CBP Theatre Management Inc. (100%)
Cebu Insular Hotel Company, Inc. (37%)
Solinea, Inc. (formerly Bigfoot Palms, Inc. (35%)
Amaia Southern Properties, Inc. (35%)
Cebu District Property Enterprise, Inc. (15%)
Southportal Properties, Inc. (35%)
Central Block Developers, Inc. (55%)
BGWest Properties, Inc. (50%)
Verde Golf Development
Corporation (100%)Alabang Commercial Corporation (50%)
South Innovative Theater Management,
Inc. (100%)
Whiteknight Holdings, Inc. (100%)
Mercado General Hospital, Inc. (33%) (An Associate of ALI
Group)
Ayala Land, Inc.
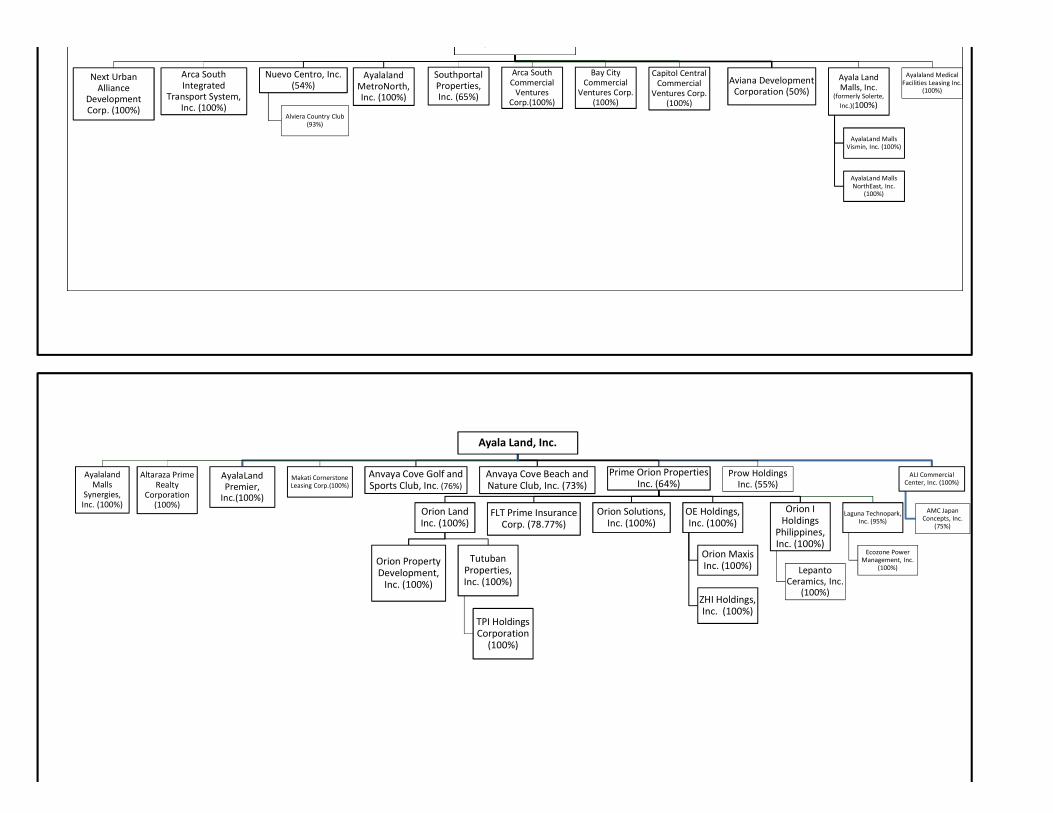
Ayala Land, Inc.
Next Urban Alliance
Development Corp. (100%)
Arca South Integrated
Transport System, Inc. (100%)
Nuevo Centro, Inc. (54%)
Alviera Country Club (93%)
Ayalaland MetroNorth, Inc. (100%)
Southportal Properties, Inc. (65%)
Arca South Commercial
Ventures Corp.(100%)
Bay City Commercial
Ventures Corp. (100%)
Capitol Central Commercial
Ventures Corp.(100%)
Aviana Development Corporation (50%)
Ayala Land Malls, Inc.
(formerly Solerte, Inc.)(100%)
AyalaLand Malls Vismin, Inc. (100%)
AyalaLand Malls NorthEast, Inc.
(100%)
Ayalaland Medical Facilities Leasing Inc.
(100%)
Ayala Land, Inc.
Ayalaland Malls
Synergies, Inc. (100%)
Altaraza Prime Realty
Corporation (100%)
AyalaLand Premier,
Inc.(100%)
Makati Cornerstone Leasing Corp.(100%)
Anvaya Cove Golf and Sports Club, Inc. (76%)
Anvaya Cove Beach and Nature Club, Inc. (73%)
Prime Orion Properties Inc. (64%)
Orion Land Inc. (100%)
Orion Property Development,
Inc. (100%)
Tutuban Properties, Inc. (100%)
TPI Holdings Corporation
(100%)
FLT Prime Insurance Corp. (78.77%)
Orion Solutions, Inc. (100%)
OE Holdings, Inc. (100%)
Orion Maxis Inc. (100%)
ZHI Holdings, Inc. (100%)
Orion I Holdings
Philippines, Inc. (100%)
Lepanto Ceramics, Inc.
(100%)
Laguna Technopark, Inc. (95%)
Ecozone Power Management, Inc.
(100%)
Prow Holdings Inc. (55%)
ALI Commercial Center, Inc. (100%)
AMC Japan Concepts, Inc.
(75%)

Direct Investments in Joint Ventures Direct Investments in Associates
Ayala Land, Inc.
Cebu District Property Enterprise,
Inc. (35%)
Emerging City Holdings, Inc. (50%)
Columbus Holdings, Inc. (70%)
Berkshires Holdings, Inc. (50%)
Columbus Holdings, Inc. (30%)
ALI Eton Property Development
Corporation (50%)
AKL Properties, Inc. (50%)
Ayala Land, Inc.
Bonifacio Land Corp. (5%)
(An Associate of the Group)
Fort Bonifacio Development Corp.
(55%)
Lagoon Development
Corporation (30%)
ALI Makati Hotels & Residences, Inc. (20%)
(Subsidiary of the Group)
ALI Makati Property, Inc. (20%) (Subsidiary
of the Group)
OCLP Holdings, Inc. (21%)
Ortigas and Company Limited Partnership
(99.5%)
Bonifacio Land Corp. (70%)(An Associate of ALI Group)
Fort Bonifacio Development Corp. (55%)

AYALA LAND, INC. AND SUBSIDIARIESSCHEDULE K - LIST OF APPLICABLE STANDARDS AND INTERPRETATIONSAs of December 31, 2018
√
First-time Adoption of Philippine Financial Reporting Standards √Amendments to PFRS 1 and PAS 27: Cost of an Investment in a Subsidiary, Jointly Controlled Entity or Associate
√
Amendments to PFRS 1: Additional Exemptions for First-time Adopters
√
Amendment to PFRS 1: Limited Exemption from Comparative PFRS 7 Disclosures for First-time Adopters
√
Amendments to PFRS 1: Severe Hyperinflation and Removal of Fixed Date for First-time Adopters
√
Amendments to PFRS 1: Government Loans √Amendments to PFRS 1: Borrowing costs √Amendments to PFRS 1: Meaning of ‘Effective PFRSsShare-based Payment √Amendments to PFRS 2: Vesting Conditions and Cancellations √Amendments to PFRS 2: Group Cash-settled Share-based Payment Transactions
√
Amendments to PFRS 2: Definition of Vesting Condition √Business Combinations √Amendments to PFRS 3: Accounting for Contingent Consideration in a Business Combination
√
Amendments to PFRS 3: Scope Exceptions for Joint Arrangements √
Insurance Contracts √
Amendments to PAS 39 and PFRS 4: Financial Guarantee Contracts √
Non-current Assets Held for Sale and Discontinued Operations √Amendments to PFRS 5: Changes in Methods of Disposal √
PFRS 6 Exploration for and Evaluation of Mineral Resources √Financial Instruments: Disclosures √Amendments to PFRS 7: Transition √Amendments to PAS 39 and PFRS 7: Reclassification of Financial Assets
√
Amendments to PAS 39 and PFRS 7: Reclassification of Financial Assets – Effective Date and Transition
√
Amendments to PFRS 7: Improving Disclosures about Financial Instruments
√
Amendments to PFRS 7: Disclosures - Transfers of Financial Assets √
Amendments to PFRS 7: Disclosures – Offsetting Financial Assets and Financial Liabilities
√
Amendments to PFRS 7: Amendments to PFRS 7: Servicing Contracts
√
Applicability of the Amendments to PFRS 7 to Condensed Interim Financial Statements
√
Amendments to PFRS 7: Mandatory Effective Date of PFRS 9 and Transition DisclosuresOperating Segments √Amendments to PFRS 8: Aggregation of Operating Segments and Reconciliation of the Total of the Reportable Segments’ Assets to the Entity’s Assets
√
Financial Instruments (2010 version)Financial Instruments - Hedge Accounting and amendments to PFRS 9, PFRS 7 and PAS 39 (2013 version)Financial Instruments (2014 or final version)Amendments to PFRS 9: Mandatory Effective Date of PFRS 9 and Transition Disclosures
√
Consolidated Financial Statements √
Adopted Not Adopted Not Applicable
PFRS 1 (Revised)
Not early adopted
PHILIPPINE FINANCIAL REPORTING STANDARDS AND INTERPRETATIONSEffective as of December 31, 2018
PFRSs Practice Statement Management CommentaryPhilippine Financial Reporting Standards
Framework for the Preparation and Presentation of Financial Statements Conceptual Framework Phase A: Objectives and qualitative characteristics
√
Not early adopted
PFRS 5
Not early adopted
PFRS 9
PFRS 2
PFRS 3 (Revised)
PFRS 4
PFRS 7
PFRS 8
Not early adopted
Not early adopted

Adopted Not Adopted Not ApplicablePHILIPPINE FINANCIAL REPORTING STANDARDS AND INTERPRETATIONSEffective as of December 31, 2018Framework for the Preparation and Presentation of Financial Statements
Amendments to PFRS 10, PFRS 12 and PAS 27: Investment Entities √
Amendment to PFRS 10: Investment Entities: Applying the Consolidation Exception
√
Amendment to PFRS 10 and PAS 28: Sale or Contribution of Assets between an Investor and its Associate or Joint VentureAmendment to PFRS 10: Consolidated Financial Statement: PFRS 12: Disclosure of Interest in Other Entities and PAS 28: Investment in Associates and Joint Ventures – Investment Entities: Applying the Consolidation exception
√
Joint Arrangements √Amendment to PFRS 11: Accounting for Acquisitions of Interests in Joint Operations
√
Disclosure of Interests in Other Entities √
Amendments to PFRS 10, PFRS 12 and PAS 27: Investment Entities √
Fair Value Measurement √Amendments to PFRS 13: Short-term receivable and payables √Amendments to PFRS 13: Portfolio Exception √
PFRS 14 Regulatory Deferral Accounts √PFRS 15 Revenue from Contracts with Customers √PFRS 16 Leases
Presentation of Financial Statements √Amendment to PAS 1: Capital Disclosures √Amendments to PAS 32 and PAS 1: Puttable Financial Instruments and Obligations Arising on Liquidation
√
Amendments to PAS 1: Presentation of Items of Other Comprehensive Income
√
Amendments to PAS 1: Clarification of the requirements for comparative information
√
Amendment to PAS 1: Disclosure Initiative √PAS 2 Inventories √
Statement of Cash Flows √Amendments to PAS 7: Disclosure Initiative √
PAS 8 Accounting Policies, Changes in Accounting Estimates and Errors √
PAS 10 Events after the Balance Sheet Date √PAS 11 Construction Contracts √
Income Taxes √Amendment to PAS 12: Recovery of Underlying Assets √Amendment to PAS 12: Recognition of Deferred Tax Assets for Unrealized losses
√
Property, Plant and Equipment √Amendment to PAS 16: Classification of servicing equipment √Amendment to PAS 16 and PAS 38: Revaluation Method - Proportionate Restatement of Accumulated Depreciation
√
Amendment to PAS 16 and PAS 38: Clarification of Acceptable Methods of Depreciation and Amortization
√
Amendments to PAS 16 and PAS 41: Bearer Plants √PAS 17 Leases √PAS 18 Revenue √
Employee Benefits √Amendments to PAS 19: Actuarial Gains and Losses, Group Plans and Disclosures
√
Employee Benefits √Amendments to PAS 19: Defined Benefit Plans - Employee Contributions
√
Amendments to PAS 19: Regional Market Issue regarding Discount Rate
√
PAS 20 Accounting for Government Grants and Disclosure of Government Assistance
√
The Effects of Changes in Foreign Exchange Rates √Amendment: Net Investment in a Foreign Operation √
PAS 23 (Revised) Borrowing Costs √Related Party Disclosures √
Not early adoptedPhilippine Accounting Standards
PAS 1 (Revised)
PAS 24 (Revised)
PAS 7
PAS 12
PAS 16
PAS 19
PAS 19 (Amended)
PAS 21
PFRS 12
PFRS 13
PFRS 10 Deferred
PFRS 11

Adopted Not Adopted Not ApplicablePHILIPPINE FINANCIAL REPORTING STANDARDS AND INTERPRETATIONSEffective as of December 31, 2018Framework for the Preparation and Presentation of Financial Statements Amendments to PAS 24: Key Management Personnel √PAS 26 Accounting and Reporting by Retirement Benefit Plans √
Separate Financial Statements √
Amendments to PFRS 10, PFRS 12 and PAS 27: Investment Entities √
Amendment to PAS 27: Equity Method in Separate Financial Statements
√
Investments in Associates and Joint Ventures √Amendment to PFRS 10 and PAS 28: Sale or Contribution of Assets between an Investor and its Associate or Joint Venture
√
PAS 29 Financial Reporting in Hyperinflationary Economies √PAS 31 Interests in Joint Ventures √
Financial Instruments: Disclosure and Presentation √Amendments to PAS 32 and PAS 1: Puttable Financial Instruments and Obligations Arising on Liquidation
√
Amendment to PAS 32: Classification of Rights Issues √Amendment to PAS 32: Presentation – Tax effect of distribution to holders of equity instrument
√
Amendments to PAS 32: Offsetting Financial Assets and Financial Liabilities
√
PAS 33 Earnings per Share √Interim Financial Reporting √Amendments to PAS 34: Interim financial reporting and segment information for total assets and liabilities
√
Amendments to PAS 34: Disclosure of Information ‘elsewhere in the interim financial report’
√
Impairment of Assets √Amendments to PAS 36: Recoverable Amount Disclosures for Non-Financial Assets
√
PAS 37 Provisions, Contingent Liabilities and Contingent Assets √Intangible Assets √Amendments to PAS 16 and PAS 38: Revaluation Method - Proportionate Restatement of Accumulated Amortization
√
Amendments to PAS 16 and PAS 38: Clarification of Acceptable Methods of Depreciation and Amortization
√
Financial Instruments: Recognition and Measurement √Amendments to PAS 39: Transition and Initial Recognition of Financial Assets and Financial Liabilities
√
Amendments to PAS 39: Cash Flow Hedge Accounting of Forecast Intragroup Transactions
√
Amendments to PAS 39: The Fair Value Option √
Amendments to PAS 39 and PFRS 4: Financial Guarantee Contracts √
Amendments to PAS 39 and PFRS 7: Reclassification of Financial Assets
√
Amendments to PAS 39 and PFRS 7: Reclassification of Financial Assets – Effective Date and Transition
√
Amendments to Philippine Interpretation IFRIC–9 and PAS 39: Embedded Derivatives
√
Amendment to PAS 39: Eligible Hedged Items √Amendment to PAS 39: Novation of Derivatives and Continuation of Hedge Accounting
√
Investment Property √Amendment to PAS 40: Interrelationship between PFRS 3 and PAS 40
√
Agriculture √
Amendment to PAS 16 and PAS 41: Bearer Plants √
IFRIC 1 Changes in Existing Decommissioning, Restoration and Similar Liabilities
√
IFRIC 2 Members' Share in Co-operative Entities and Similar Instruments √IFRIC 4 Determining Whether an Arrangement Contains a Lease √
IFRIC 5 Rights to Interests arising from Decommissioning, Restoration and Environmental Rehabilitation Funds
√
IFRIC 6 Liabilities arising from Participating in a Specific Market - Waste Electrical and Electronic Equipment
√
PAS 24 (Revised)
PAS 27 (Amended)
PAS 28 (Amended)
PAS 32
PAS 34
PAS 41
Philippine Interpretations
PAS 40
PAS 36
PAS 38
PAS 39
Adopted Not Adopted Not ApplicablePHILIPPINE FINANCIAL REPORTING STANDARDS AND INTERPRETATIONSEffective as of December 31, 2018Framework for the Preparation and Presentation of Financial Statements IFRIC 7
Applying the Restatement Approach under PAS 29 Financial Reporting in Hyperinflationary Economies
√
IFRIC 8 Scope of PFRS 2 √Reassessment of Embedded Derivatives √Amendments to Philippine Interpretation IFRIC–9 and PAS 39: Embedded Derivatives
√
IFRIC 10 Interim Financial Reporting and Impairment √IFRIC 11 PFRS 2- Group and Treasury Share Transactions √IFRIC 12 Service Concession Arrangements √IFRIC 13 Customer Loyalty Programmes √
The Limit on a Defined Benefit Asset, Minimum Funding Requirements and their Interaction
√
Amendments to Philippine Interpretations IFRIC- 14, Prepayments of a Minimum Funding Requirement
√
IFRIC 15 Agreements for the Construction of Real Estate* √IFRIC 16 Hedges of a Net Investment in a Foreign Operation √IFRIC 17 Distributions of Non-cash Assets to Owners √IFRIC 18 Transfers of Assets from Customers √IFRIC 19 Extinguishing Financial Liabilities with Equity Instruments √IFRIC 20 Stripping Costs in the Production Phase of a Surface Mine √IFRIC 21 Levies √IFRIC 22 Foreign Currency Transactions and Advance Consideration √IFRIC 23 Uncertainty over Income tax treatmentsSIC-7 Introduction of the Euro √
SIC-10 Government Assistance - No Specific Relation to Operating Activities √
Consolidation - Special Purpose Entities √Amendment to SIC - 12: Scope of SIC 12 √
SIC-13 Jointly Controlled Entities - Non-Monetary Contributions by Venturers √
SIC-15 Operating Leases - Incentives √
SIC-25 Income Taxes - Changes in the Tax Status of an Entity or its Shareholders
√
SIC-27 Evaluating the Substance of Transactions Involving the Legal Form of a Lease
√
SIC-29 Service Concession Arrangements: Disclosures. √SIC-31 Revenue - Barter Transactions Involving Advertising Services √SIC-32 Intangible Assets - Web Site Costs √
PIC 2016-02PAS 32 and PAS 38: Accounting Treatment of Club Shares Held by an Entity
√
* Effectivity has been deferred by the SEC and FRSC
Not early adopted
SIC-12
IFRIC 9
IFRIC 14

AYALA LAND, INC. AND SUBSIDIARIESSCHEDULE L - FINANCIAL RATIOSDecember 31, 2018
Schedule L - Financial Ratios2018 2017 (as restated)
Current / liquidity ratios
Current Assets 302,829,899 240,852,281 Current liabilities 240,784,527 184,623,237 Current ratios 1.26 1.30
Current Assets 302,829,899 240,852,281Inventory 104,371,611 90,845,608Quick assets 198,458,288 150,006,673Current liabilities 240,784,527 184,623,237Quick ratios 0.82 0.81
2018 2017 (as restated)
Solvency/ debt-to-equity ratios
Short-term debt 14,386,717 17,644,350Current portion of long-term debt 23,265,173 6,572,775Long-term debt - net of current portion 149,446,949 150,168,631Debt 187,098,839 174,385,756Equity * 220,221,197 192,263,358Less: Unrealized gain - AFS -454,138 40,530Equity, net of unrealized gain 220,675,335 192,222,829Debt to equity ratio 0.85 0.91
Debt 187,098,839 174,385,756 Cash and cash equivalents 24,387,091 20,998,089 Short term investments 3,085,373 4,739,734 Financial assets at FV through P&L 85,724 82,978 Net Debt 159,540,651 148,564,955 Equity* 220,221,197 192,263,358 Net Debt to equity ratio 0.72 0.77
2018 2017 (as restated)
Asset to equity ratios
Total Assets 668,820,481 573,992,334 Total Equity* 220,221,197 192,263,358 Asset to Equity Ratio 3.04 2.99
2018 2017 (as restated)
Interest rate coverage ratio
Net income after tax 33,216,589 28,165,659 Add:Provision for income tax 11,984,440 9,824,981Interest expense and other financing charges 9,594,003 7,914,326Other charges 1,270,281 1,196,076
(Amounts inThousands)
(Amounts inThousands)
(Amounts inThousands)
(Amounts inThousands)
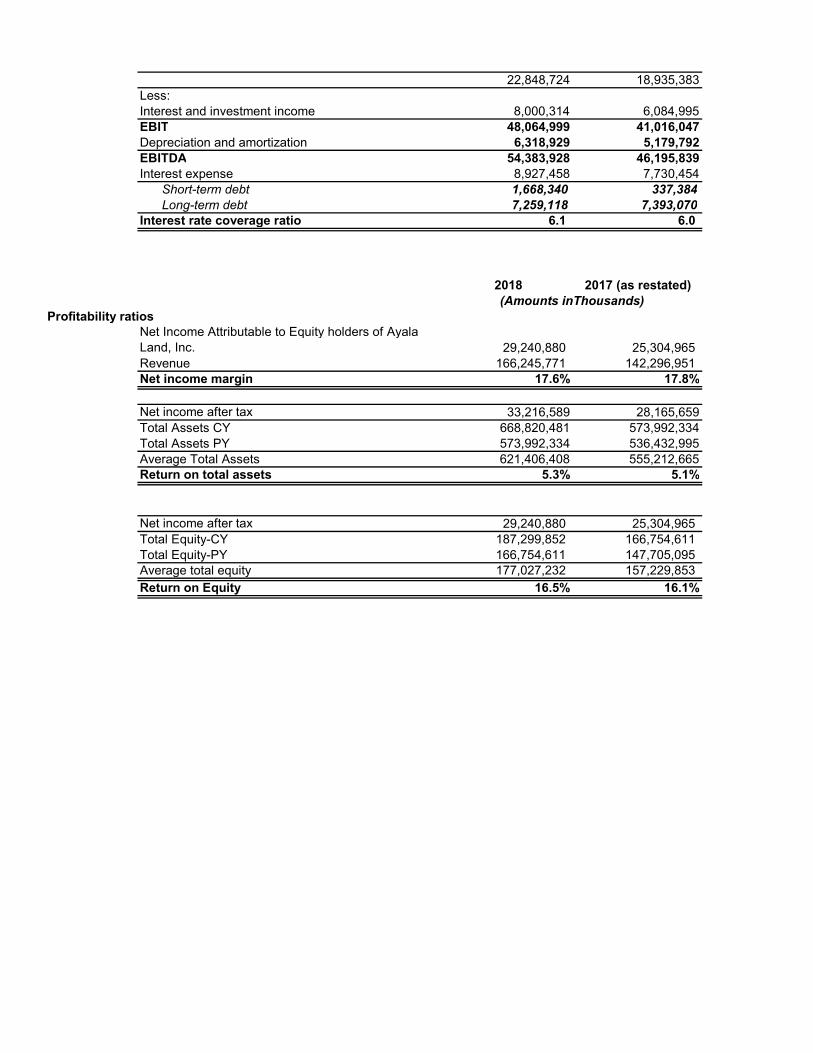
22,848,724 18,935,383Less:Interest and investment income 8,000,314 6,084,995EBIT 48,064,999 41,016,047Depreciation and amortization 6,318,929 5,179,792EBITDA 54,383,928 46,195,839Interest expense 8,927,458 7,730,454
Short-term debt 1,668,340 337,384Long-term debt 7,259,118 7,393,070
Interest rate coverage ratio 6.1 6.0
2018 2017 (as restated)
Profitability ratiosNet Income Attributable to Equity holders of Ayala Land, Inc. 29,240,880 25,304,965 Revenue 166,245,771 142,296,951 Net income margin 17.6% 17.8%
Net income after tax 33,216,589 28,165,659Total Assets CY 668,820,481 573,992,334Total Assets PY 573,992,334 536,432,995Average Total Assets 621,406,408 555,212,665Return on total assets 5.3% 5.1%
Net income after tax 29,240,880 25,304,965 Total Equity-CY 187,299,852 166,754,611 Total Equity-PY 166,754,611 147,705,095 Average total equity 177,027,232 157,229,853 Return on Equity 16.5% 16.1%
(Amounts inThousands)

Schedule M – Bond Proceeds P8.0 Billion Fixed Rate Bonds due 2023
(In pesos)
ESTIMATED PER PROSPECTUS
ACTUAL
Issue Amount 8,000,000,000.00 8,000,000,000.00 Less: Estimated Upfront Expenses
SEC Registration & Legal Research Fee 2,020,000.00 2,020,000.00
Documentary Stamp Tax 60,000,000.00 60,000,000.00
Underwriting Fee 30,000,000.00 30,000,000.00
Estimated Professional Expenses & Agency fees
Marketing/Printing/Photocopying Costs and OPEs
9,000,000.00
5,000,000.00
4,044,234.00 49,875.00
Listing Fee 100,000.00 100,000.00
Total Expenses 106,120,000.00 96,214,109.00
Net Proceeds 7,893,880,000.00 7,903,785,891.00
Balance of Proceeds as of 12.31.2018 NIL Ayala Land raised from the Bonds gross proceeds of P8.0 billion. After issue-related expenses, actual net proceeds amounted to approximately P7.90 billion. Net proceeds were used to partially finance various projects. P10.0 Billion Fixed Rate Bonds due 2028
(In pesos)
ESTIMATED PER PROSPECTUS
ACTUAL
Issue Amount 10,000,000,000.00 10,000,000,000.00 Less: Estimated Upfront Expenses
SEC Registration & Legal Research Fee 2,525,000.00 2,525,000.00
Documentary Stamp Tax 75,000,000.00 75,000,000.00
Underwriting Fee 37,500,000.00 37,500,000.00
Estimated Professional Expenses & Agency fees
Marketing/Printing/Photocopying Costs and OPEs
9,000,000.00
5,000,000.00
4,901,842.56 622,938.20
Listing Fee 200,000.00 200,000.00
Total Expenses 129,225,000.00 120,749,780.76
Net Proceeds 9,870,775,000.00 9,879,250,219.24
Balance of Proceeds as of 12.31.2018 NIL Ayala Land raised from the Bonds gross proceeds of P10.0 billion. After issue-related expenses, actual net proceeds amounted to approximately P9.88 billion. Net proceeds were used to partially finance various projects.
P7.0 Billion Fixed Rate Bonds due 2027
(In pesos)
ESTIMATED PER PROSPECTUS
ACTUAL
Issue Amount 7,000,000,000.00 7,000,000,000.00 Less: Estimated Upfront Expenses
SEC Registration & Legal Research Fee 1,767,500.00 1,767,500.00
Documentary Stamp Tax 35,000,000.00 35,000,000.00
Underwriting Fee 26,250,000.00 26,250,000.00
Estimated Professional Expenses & Agency fees
Marketing/Printing/Photocopying Costs and OPEs
9,000,000.00
5,000,000.00
3,161,187.20 990,430.17
Listing Fee 100,000.00 100,000.00
Total Expenses 74,617,500.00 67,269,117.37
Net Proceeds 6,925,382,500.00 6,932,730,882.63
Balance of Proceeds as of 12.31.2018 NIL Ayala Land raised from the Bonds gross proceeds of P10.0 billion. After issue-related expenses, actual net proceeds amounted to approximately P6.92 billion. Net proceeds were used to partially finance various projects.

P7.0 Billion Fixed Rate Bonds due 2023 and P3.0 Billion Homestarter Bonds due 2019
(In pesos)
ESTIMATED PER PROSPECTUS
ACTUAL
Issue Amount 10,000,000,000.00 10,000,000,000.00 Less: Estimated Upfront Expenses
SEC Registration & Legal Research Fee 2,525,000.00 2,525,000.00
Documentary Stamp Tax 50,000,000.00 50,000,000.00
Underwriting Fee 44,250,000.00 26,250,000.00
Estimated Professional Expenses & Agency fees
Marketing/Printing/Photocopying Costs and OPEs
9,000,000.00
5,000,000.00
2,960,000.00 201,849.33
Listing Fee 200,000.00 200,000.00
Total Expenses 110,975,000.00 82,136,849.33
Net Proceeds 9,889,025,000.00 9,917,863,150.67
Balance of Proceeds as of 12.31.2018 NIL Ayala Land raised from the Bonds gross proceeds of P10.0 billion. After issue-related expenses, actual net proceeds amounted to approximately P9.9 billion. Net proceeds were used to partially finance various projects.
P7.0 Billion Fixed Rate Bonds due 2025
(In pesos)
ESTIMATED PER PROSPECTUS
ACTUAL
Issue Amount 7,000,000,000.00 8,000,000,000.00 Less: Estimated Upfront Expenses
SEC Registration & Legal Research Fee 1,767,500.00 1,767,500.00
Documentary Stamp Tax 35,000,000.00 35,000,000.00
Underwriting Fee 26,250,000.00 26,250,000.00
Estimated Professional Expenses & Agency fees
Marketing/Printing/Photocopying Costs and OPEs
7,500,000.00
2,500,000.00
2,301,963.00 248,847.18
Listing Fee 100,000.00 100,000.00
Total Expenses 73,117,500.00 65,668,310.18
Net Proceeds 6,926,882,500.00 6,934,331,689.82
Balance of Proceeds as of 12.31.2018 NIL Ayala Land raised from the Bonds gross proceeds of P7.0 billion. After issue-related expenses, actual net proceeds amounted to approximately P6.9 billion. Net proceeds were used to partially finance various projects.
P8.0 Billion Fixed Rate Bonds due 2026
(In pesos)
ESTIMATED PER PROSPECTUS
ACTUAL
Issue Amount 8,000,000,000.00 8,000,000,000.00 Less: Estimated Upfront Expenses
SEC Registration & Legal Research Fee 2,588,125.00 2,588,125.00
Documentary Stamp Tax 40,000,000.00 40,000,000.00
Underwriting Fee 30,000,000.00 30,000,000.00
Estimated Professional Expenses & Agency fees
Marketing/Printing/Photocopying Costs and OPEs
7,500,000.00
2,500,000.00
3,651,246.00 398,937.60
Listing Fee 100,000.00 100,000.00
Total Expenses 82,688,125.00 76,738,308.60
Net Proceeds 7,917,311,875.00 7,923,261,691.40
Balance of Proceeds as of 12.31.2018 NIL Ayala Land raised from the Bonds gross proceeds of P8.0 billion. After issue-related expenses, actual net proceeds amounted to approximately P7.9 billion. Net proceeds were used to partially finance various projects.

P7.0 Billion Fixed Rate Bonds due 2022
(In pesos)
ESTIMATED PER PROSPECTUS
ACTUAL
Issue Amount 7,000,000,000.00 7,000,000,000.00 Less: Estimated Upfront Expenses
SEC Registration & Legal Research Fee - -
Documentary Stamp Tax 35,000,000.00 35,000,000.00
Underwriting Fee 26,250,000.00 25,724,999.99
Estimated Professional Expenses & Agency fees
Marketing/Printing/Photocopying Costs and OPEs
5,740,000.00
2,500,000.00
3,058,763.32 19,307.59
Listing Fee 100,000.00 100,000.00
Total Expenses 69,590,000.00 63,903,070.90
Net Proceeds 6,930,410,000.00 6,936,096,929.10
Balance of Proceeds as of 12.31.2018 NIL Ayala Land raised from the Bonds gross proceeds of P7.0 billion. After issue-related expenses, actual net proceeds amounted to approximately P6.9 billion. Net proceeds were used to partially finance various projects.
P5.0 Billion Fixed Rate Bonds due 2021
(In pesos) ESTIMATED
PER PROSPECTUS ACTUAL
Issue Amount 5,000,000,000.00 5,000,000,000.00 Expenses Documentary Stamp Tax 25,000,000.00 25,000,000.00 SEC Registration 1,812,500.00 1,812,500.00 Legal Research Fee 18,125.00 18,125.00 Upfront Fees - - Underwriting Fee 18,750,000.00 18,750,000.00 Professional Expenses and Agency Fees 3,828,500.00 4,051,801.20 Out of Pocket Expenses (publication, printing etc.) 2,500,000.00 275,128.39 Total Expenses 52.051.125.00 49,907,554.59
Net Proceeds 4,947,978,875.00 4,950,092,445.41
Balance of Proceeds as of 12.31.2018 NIL Cebu Holdings, Inc. raised from the Bonds gross proceeds of P5.0 billion. After issue-related expenses, actual net proceeds amounted to approximately P4.95 billion. Net proceeds were used to partially finance various projects. P8 Billion Fixed Rate Callable Bonds due 2025
(in pesos) ESTIMATED
PER PROSPECTUS ACTUAL
Issue Amount 8,000,000,000.00 8,000,000,000.00 Expenses Documentary Stamp Tax 40,000,000.00 40,000,000.00 Underwriting Fee 30,000,000.00 30,000,000.00 SEC Registration SEC Registration Fee 4,312,500.00 4,312,500.00 SEC Legal Research Fee 43,125.00 43,125.00 Professional Expenses 7,748,500.00 7,178,064.00 Marketing/Printing/Photocopying Costs and OPEs 2,500,000.00 126,279.00 Listing Fee 168,000.00 100,000.00 Total Expenses 84,772,125.00 81,759,968.00
Net Proceeds 7,915,227,875.00 7,918,240,032.00
Balance of Proceeds as of 12.31.2018 NIL
Ayala Land raised from the Bonds gross proceeds of P8.0 billion. After issue-related expenses, actual net proceeds amounted to approximately P7.9 billion. Net proceeds were used to partially finance various projects.

P4.0 Billion in Fixed Rate Bonds due 2020 and P2.0 Billion Fixed Rate Bonds due 2033
(in pesos) ESTIMATED
PER PROSPECTUS ACTUAL
Issue Amount 6,000,000,000.00 6,000,000,000.00 Expenses Documentary Stamp Tax 30,000,000.00 30,000,000.00 Upfront Fees Underwriting Fee (375 bps + GRT) 22,500,000.00 22,500,000.00 Professional Expenses 1,457,500.00 2,517,808.07 Listing Fee 100,000.00 100,000.00 Out of Pocket Expenses (publication, printing etc.) 1,000,000.00 5,530.00 Total Expenses 55,057,500.00 55,123,338.07
Net Proceeds 5,944,942,500.00 5,944,876,661.93
Balance of Proceeds as of 12.31.2018 NIL Ayala Land raised from the Bonds gross proceeds of P6.0 billion. After issue-related expenses, actual net proceeds amounted to approximately P5.9 billion. Net proceeds were used to partially finance various projects.
P15.0 Billion Fixed Rate Bonds due 2024
(in pesos) ESTIMATED
PER PROSPECTUS ACTUAL
Issue Amount 15,000,000,000.00 15,000,000,000.00 Expenses Documentary Stamp Tax 75,000,000.00 75,000,000.00 SEC Registration 5,812,500.00 5,812,500.00 Legal Research Fee 58,125.00 58,125.00 Upfront Fees Underwriting Fee 56,250,000.00 56,250,000.00 Professional Expenses 7,336,000.00 401,082.05 Trustee 20,000.00 20,000.00 Registry Account Opening Fee 150,000.00 150,000.00 Listing Fee 100,000.00 100,000.00 Out of Pocket Expenses (publication, printing etc.) 2,500,000.00 97,807.91 Total Expenses 147,226,625.00 137,889,514.96
Net Proceeds 14,852,773,375.00 14,862,110,485.04
Balance of Proceeds as of 12.31.2018 NIL Ayala Land raised from the Bonds gross proceeds of P15.0 billion. After issue-related expenses, actual net proceeds amounted to approximately P14.9 billion. Net proceeds were used to partially finance various projects.
P9.35 Billion Fixed Rate Callable Bonds due 2019 and P5.65 Billion Fixed Rate Callable Bonds due 2022
(in pesos) ESTIMATED
PER PROSPECTUS ACTUAL
Issue Amount 15,000,000,000.00 15,000,000,000.00 Expenses Documentary Stamp Tax 75,000,000.00 75,000,000.00 Underwriting Fee 54,035,000.00 54,035,000.00 Rating Fee 5,040,000.00 4,125,000.00 SEC Registration SEC Registration Fee 4,312,500.00 4,312,500.00 SEC Legal Research Fee 43,125.00 43,125.00 Professional Expenses 1,960,000.00 3,064,146.00 Marketing/Printing/Photocopying Costs and OPEs 500,000.00 383,755.82 Registry and Paying Agency Fee 337,500.00 1,056,314.87 Trustee Fees 112,500.00 20,000.00 Listing Fee 100,000.00 443,666.68 Total Expenses 141,440,625.00 142,483,508.37
Net Proceeds 14,858,559,375.00 14,857,516,491.63
Balance of Proceeds as of 12.31.2018 NIL Ayala Land raised from the Bonds gross proceeds of P15.0 billion. After issue-related expenses, actual net proceeds amounted to approximately P14.9 billion. Net proceeds were used to partially finance various projects.

HOMESTARTER BONDS 6
(in pesos) PROSPECTUS ACTUAL
Issue Amount 2,000,000,000.00 2,000,000,000.00 Expenses Underwriting and Other Professional Fees 15,000,000.00 15,060,000.00 Issue Management Fee 2,000,000.00 2,000,000.00 Underwriting Fee 12,500,000.00 12,500,000.00 Legal Fee – Joint Underwriters 500,000.00 560,000.00 Marketing/Printing/Photocopying Costs and OPEs 2,200,000.00 1,486,780.27 Documentary Stamp Tax 10,000,000.00 10,000,000.00 Total Expenses 27,200,000.00 26,546,789.27
Net Proceeds 1,972,800,000.00 1,973,453,210.73
Balance of Proceeds as of 12.31.2018 NIL Ayala Land raised from the Bonds gross proceeds of P2.0 billion. After issue-related expenses, actual net proceeds amounted to approximately P1.97 billion. Net proceeds were used to partially finance various projects. HOMESTARTER BONDS 5
(in pesos) PROSPECTUS ACTUAL
Issue Amount 1,000,000,000.00 1,000,000,000.00 Expenses SEC Registration 1,325,625.00 1,325,625.00 Underwriting and Other Professional Fees 8,000,000.00 9,421,000.00 Marketing/Printing/Photocopying Costs and OPEs 2,200,000.00 1,587,085,83 Registry and Paying Agency Fees 200,000.00 154,090.30 Documentary Stamp Tax 10,000,000.00 5,000,000.00 Total Expenses 21,725,625.00 17,487,801.13
Net Proceeds 978,274,375.00 982,512,198.87
Balance of Proceeds as of 12.31.2018 NIL Ayala Land raised from the Bonds gross proceeds of P1.0Bn. After issue-related expenses, actual net proceeds amounted to P982.5 million. Net proceeds were used to partially finance various projects.

C O V E R S H E E T for
AUDITED FINANCIAL STATEMENTS
SEC Registration Number
1 5 2 7 4 7
C O M P A N Y N A M E
A Y A L A L A N D , I N C . A N D S U B S I D I A R
I E S
PRINCIPAL OFFICE ( No. / Street / Barangay / City / Town / Province )
3 1 s t F l o o r , T o w e r O n e a n d E x c h
a n g e P l a z a , A y a l a T r i a n g l e , A y
a l a A v e n u e , M a k a t i C i t y
Form Type Department requiring the report Secondary License Type, If Applicable
A A F S S E C
C O M P A N Y I N F O R M A T I O N
Company’s Email Address Company’s Telephone Number Mobile Number
[email protected] 908-3677
No. of Stockholders Annual Meeting (Month / Day) Fiscal Year (Month / Day)
12,039 04/24 12/31
CONTACT PERSON INFORMATION
The designated contact person MUST be an Officer of the Corporation
Name of Contact Person Email Address Telephone Number/s Mobile Number
Angelica L. Salvador salvador.angel@ayalalan
d.com.ph
908-3681
CONTACT PERSON’s ADDRESS
30th Floor, Tower One and Exchange Plaza, Ayala Triangle, Ayala Avenue, Makati City
NOTE 1 : In case of death, resignation or cessation of office of the officer designated as contact person, such incident shall be reported to the Commission within thirty (30) calendar days from the occurrence thereof with information and complete contact details of the new contact person designated. 2 : All Boxes must be properly and completely filled-up. Failure to do so shall cause the delay in updating the corporation’s records with the Commission and/or non-receipt of Notice of Deficiencies. Further, non-receipt of Notice of Deficiencies shall not excuse the corporation from liability for its deficiencies.

Ayala Land, Inc. and Subsidiaries
Consolidated Financial StatementsDecember 31, 2018 and 2017and Years Ended December 31, 2018,2017 and 2016
and
Independent Auditor’s Report

*SGVFS032855*
INDEPENDENT AUDITOR’S REPORT
The Board of Directors and StockholdersAyala Land, Inc.
Opinion
We have audited the accompanying consolidated financial statements of Ayala Land, Inc. and itssubsidiaries (the Group), which comprise the consolidated statements of financial position as atDecember 31, 2018 and 2017, and the consolidated statements of income, consolidated statements ofcomprehensive income, consolidated statements of changes in equity and consolidated statements ofcash flows for each of the three years in the period ended December 31, 2018, and notes to theconsolidated financial statements, including a summary of significant accounting policies.
In our opinion, the accompanying consolidated financial statements present fairly, in all material respects,the consolidated financial position of the Group as at December 31, 2018 and 2017, and its consolidatedfinancial performance and its consolidated cash flows for each of the three years in the period endedDecember 31, 2018 in accordance with Philippine Financial Reporting Standards (PFRSs).
Basis for Opinion
We conducted our audits in accordance with Philippine Standards on Auditing (PSAs). Ourresponsibilities under those standards are further described in the Auditor’s Responsibilities for the Auditof the Consolidated Financial Statements section of our report. We are independent of the Group inaccordance with the Code of Ethics for Professional Accountants in the Philippines (Code of Ethics)together with the ethical requirements that are relevant to our audit of the consolidated financialstatements in the Philippines, and we have fulfilled our other ethical responsibilities in accordance withthese requirements and the Code of Ethics. We believe that the audit evidence we have obtained issufficient and appropriate to provide a basis for our opinion.
Key Audit Matters
Key audit matters are those matters that, in our professional judgment, were of most significance in ouraudit of the consolidated financial statements of the current period. These matters were addressed in thecontext of our audit of the consolidated financial statements as a whole, and in forming our opinionthereon, and we do not provide a separate opinion on these matters. For each matter below, ourdescription of how our audit addressed the matter is provided in that context.
We have fulfilled the responsibilities described in the Auditor’s Responsibilities for the Audit of theConsolidated Financial Statements section of our report, including in relation to these matters.Accordingly, our audit included the performance of procedures designed to respond to our assessment ofthe risks of material misstatement of the consolidated financial statements. The results of our auditprocedures, including the procedures performed to address the matters below, provide the basis for ouraudit opinion on the accompanying consolidated financial statements.
SyCip Gorres Velayo & Co.6760 Ayala Avenue1226 Makati CityPhilippines
Tel: (632) 891 0307Fax: (632) 819 0872ey.com/ph
BOA/PRC Reg. No. 0001, October 4, 2018, valid until August 24, 2021SEC Accreditation No. 0012-FR-5 (Group A), November 6, 2018, valid until November 5, 2021
A member firm of Ernst & Young Global Limited

*SGVFS032855*
- 2 -
Adoption of PFRS 15, Revenue from Contracts with Customers
Effective January 1, 2018, the Group adopted the new revenue recognition standard, PFRS 15, Revenuefrom Contracts with Customers, using the modified retrospective approach. The adoption of PFRS 15 issignificant to our audit because this involves application of significant judgment and estimation in thefollowing areas: (1) identification of the contract for sale of real estate property that would meet therequirements of PFRS 15; (2) assessment of the probability that the entity will collect the considerationfrom the buyer; (3) application of the output method as the measure of progress in determining real estaterevenue; (4) determination of the actual costs incurred as cost of sales; and (5) recognition of cost toobtain a contract.
The Group identifies the contract that meets all the criteria required under PFRS 15 for a valid revenuecontract. In the absence of a signed contract to sell, the Group identifies alternative documentation thatare enforceable and that contains each party’s rights regarding the real estate property to be transferred,the payment terms and the contract’s commercial substance.
In evaluating whether collectability of the amount of consideration is probable, the Group considers thesignificance of the buyer’s initial payments in relation to the total contract price (or buyer’s equity).Collectability is also assessed by considering factors such as past history with buyers, age of residentialand office development receivables and pricing of the property. Management regularly evaluates thehistorical sales cancellations and back-outs if it would still support its current threshold of buyers’ equitybefore commencing revenue recognition.
In measuring the progress of its performance obligation over time, the Group uses the output method.This method measures progress based on physical proportion of work done on the real estate projectwhich requires technical determination by the Group’s specialists (project engineers).
In determining the actual costs incurred to be recognized as cost of sales, the Group estimates costsincurred on materials, labor and overhead which have not yet been billed by the contractor.
The Group identifies sales commission after contract inception as the cost of obtaining the contract. Forcontracts which qualified for revenue recognition, the Group capitalizes the total sales commission due tosales agent as cost to obtain contract and recognizes the related commission payable. The Group usespercentage of completion method in amortizing sales commission consistent with the Group’s revenuerecognition policy.
The adoption of PFRS 15 as at January 1, 2018 resulted to reclassification of receivables and customers’deposit to contract assets and contract liabilities amounting to P=73.9 billion and P=18.1 billion, respectively.The disclosures related to the adoption of PFRS 15 are included in Note 2 to the consolidated financialstatements.
Audit Response
We obtained an understanding of the Group’s revenue recognition process, including the process ofimplementing the new revenue recognition standard. We reviewed the PFRS 15 adoption papers andaccounting policies prepared by management, including revenue streams identification and scoping, andcontract analysis.
A member firm of Ernst & Young Global Limited

*SGVFS032855*
- 3 -
For the identification of the alternative documentation for sale of real estate property (in the absence of asigned contract to sell) that would meet the requirements of PFRS 15, our audit procedures include,among others, involvement of our internal specialist in reviewing the Group’s legal basis regarding theenforceability of the alternative documentation against previous court decisions, buyers’ behavior andindustry practices.
For the buyers’ equity, we evaluated management’s basis of the buyer’s equity by comparing this to thehistorical analysis of sales collections from buyers with accumulated payments above the collectionthreshold.
In determining real estate revenue and cost of sales, we obtained an understanding of the Group’sprocesses for determining the percentage of completion (POC) under the output method. We performedtests of the relevant controls. We obtained the certified POC reports prepared by the project engineers.We assessed the competence and objectivity of the project engineers by reference to their qualifications,experience and reporting responsibilities. For selected projects, we conducted ocular inspections, maderelevant inquiries and obtained the supporting details of POC reports showing the stage of completion ofthe major activities of the project construction.
For the real estate inventories and cost of sales, we obtained an understanding of the Group’s costaccumulation process and performed tests of the relevant controls. For selected projects, we traced costsaccumulated, including those incurred but not yet billed costs, to supporting documents such as invoicesand accomplishment reports from the contractors and official receipts.
For the recognition of cost to obtain a contract, we obtained an understanding of the sales commissionprocess. For selected contracts, we agreed the basis for calculating the sales commission capitalized andthe portion recognized in profit or loss, particularly: (a) the percentage of commission due againstcontracts with sales agents, (b) the total commissionable amount (e.g., net contract price) against therelated contract to sell, and, (c) the POC against the POC used in recognizing the related revenue fromreal estate sales.
We test computed the transition adjustments and evaluated the disclosures made in the consolidatedfinancial statements on the adoption of PFRS 15.
Adoption of PFRS 9, Financial Instruments
On January 1, 2018, the Group adopted Philippine Financial Reporting Standards (PFRS) 9, FinancialInstruments. PFRS 9, which replaced PAS 39, Financial Instruments: Recognition and Measurement,provides revised principles for classifying financial assets and introduces a forward-looking expectedcredit loss model to assess impairment on debt financial assets not measured at fair value through profitor loss and loan commitments and financial guarantee contracts. The Group adopted the modifiedretrospective approach in adopting PFRS 9.
1. Classification and Measurement of Financial Assets
As at January 1, 2018 (the transition date), the Group classified its financial assets based on its businessmodels for managing these financial assets and the contractual cash flow characteristics of the financialassets. This resulted to transition adjustments that increased retained earnings and noncontrollinginterest by P=358.6 million and P=205.4 million, respectively, and decreased other comprehensive incomeby P=564.0 million. Thereafter, the financial assets were accounted for based on the transition dateclassification, while newly originated or acquired financial assets were also classified based on thePFRS 9 classification criteria.
A member firm of Ernst & Young Global Limited

*SGVFS032855*
- 4 -
The Group’s application of the PFRS 9 classification criteria is significant to our audit as the classificationdetermines how financial assets are measured and accounted for in the financial statements.
The disclosures in relation to the adoption of the PFRS 9 classification criteria are included in Note 2 tothe consolidated financial statements.
Audit Response
We obtained an understanding of the Group’s contracts review process to establish the contractual cashflow characteristics of debt financial assets, including the identification of standard and non-standardcontracts, and reviewed the assessment made by management by inspecting underlying contracts on asample basis. We obtained the approved business models for the Group’s portfolios of financial assets.For significant portfolios, we assessed the frequency and relative amount of sales in the past, understoodhow the business performance is measured and evaluated performance measurement reports.
We test computed the transition adjustments and evaluated the disclosures on the adoption of thePFRS 9 classification criteria made in the consolidated financial statements.
2. Expected Credit Loss (ECL)
The Group’s adoption of the ECL model is significant to our audit as it involves the exercise of significantmanagement judgment and estimation. Key areas of judgment include: segmenting the Group’s creditrisk exposures; determining the method to estimate lifetime ECL; defining what comprises default;determining assumptions to be used in the ECL model such as the expected life of the residential andoffice developemnt receivables and timing and amount of expected net recoveries from defaultedaccounts; and incorporating forward-looking information in calculating ECL.
Refer to Note 2 to the consolidated financial statements for the disclosures in relation to the adoption ofthe PFRS 9 ECL model.
Audit Response
We obtained an understanding of the approved methodologies and models used for the Group’s differentcredit exposures and assessed whether these considered the requirements of PFRS 9 to reflect anunbiased and probability-weighted outcome, the time value of money and, the best available forward-looking information.
We (a) assessed the Group’s segmentation of its credit risk exposures based on homogeneity of creditrisk characteristics; (b) checked the methodology used in applying the simplified approach by evaluatingthe key inputs, assumptions, and formulas used; (c) compared the definition of default against historicalanalysis of accounts and credit risk management policies and practices in place, (d) tested loss givendefault by inspecting historical recoveries including the timing, related direct costs, and write-offs; (e)evaluated the forward-looking information used for overlay through statistical test and corroboration usingpublicly available information; and (f) tested the effective interest rate, or an approximation thereof, usedin discounting the expected loss.
Further, we checked the data used in the ECL models, such as the historical analysis of defaults, andrecovery data, by reconciling data from source system reports to the data warehouse and from the datawarehouse to the loss allowance analysis/models and financial reporting systems. To the extent that theloss allowance analysis is based on credit exposures that have been disaggregated into subsets withsimilar risk characteristics, we traced or re-performed the disaggregation from source systems to the lossallowance analysis. We also assessed the assumptions used where there are missing or insufficientdata.
A member firm of Ernst & Young Global Limited

*SGVFS032855*
- 5 -
We recalculated impairment provisions on a sample basis. We evaluated the disclosures made in theconsolidated financial statements on allowance for credit losses using the ECL model.
Accounting for business acquisition
In January 2018, Ayala Land, Inc. through its wholly owned subsidiary, Regent Wise Investments, Ltd.acquired additional 39.4% of MCT Berhad (MCT) for a total consideration of P=5.98 billion, therebyobtaining control over MCT. The previously held interest in MCT was revalued based on the acquisitiondate fair value which resulted to a remeasurement loss of P=1.8 billion. The negative goodwill recognizedbased on the final purchase price allocation performed was P=1.9 billion. We consider the accounting forthis acquisition as a key audit matter because it required a significant amount of management judgmentand estimation in identifying the underlying acquired assets and liabilities and in determining their fairvalues, specifically the acquired inventories, property and equipment and investment properties.
Further details of the acquisition made by the Group and the purchase price allocation are disclosed inNote 25 to the consolidated financial statements.
Audit Response
We reviewed the purchase agreement covering the acquisition, the consideration paid and the finalpurchase price allocation. We reviewed the identification of MCT’s underlying assets and liabilities basedon our understanding of MCT’s business and management’s explanations on the rationale for theacquisition. We assessed the competence, capabilities and objectivity of the external appraiser whovalued the inventories, property and equipment and investment properties by considering theirqualifications, experience and reporting responsibilities. We involved our internal specialist in evaluatingthe methodologies and assumptions used in arriving at the fair values of the real estate properties. Wecompared the key assumptions used such as the list prices and adjustment factors by reference torelevant market data.
Consolidation Process
The consolidated financial statements of the Group represents the consolidation of the financialstatements of Ayala Land, Inc. and its various direct and indirect subsidiaries. We consider the Group’sconsolidation process as a key audit matter because of the complexity arising from the numerouscomponent entities within the Group requiring layers of consolidation, voluminous intercompanytransactions that require elimination and deferral, subsequent realization of profit or revenue, monitoringof fair value adjustments arising from business combinations, and adjustments to non-controllinginterests.
Note 1 to the consolidated financial statements provides the relevant information on the Group’ssubsidiaries.
Audit Response
We obtained an understanding of the Group’s consolidation process and the Group’s process foridentifying related parties and related party transactions and the reconciliation of intercompany balances.We tested significant consolidation adjustments, including elimination, deferral and realization of profit orrecoveries from intercompany transactions and balances, amortization/depreciation/reversal of fair valueadjustments arising from business combinations, the currency translation adjustments, movements innon-controlling interests and other equity adjustments.
A member firm of Ernst & Young Global Limited

*SGVFS032855*
- 6 -
Other Information
Management is responsible for the other information. The other information comprises the informationincluded in the SEC Form 20-IS (Definitive Information Statement), SEC Form 17-A and Annual Reportfor the year ended December 31, 2018, but does not include the consolidated financial statements andour auditor’s report thereon. The SEC Form 20-IS (Definitive Information Statement), SEC Form 17-Aand Annual Report for the year ended December 31, 2018 are expected to be made available to us afterthe date of this auditor’s report.
Our opinion on the consolidated financial statements does not cover the other information and we will notexpress any form of assurance conclusion thereon.
In connection with our audits of the consolidated financial statements, our responsibility is to read theother information identified above when it becomes available and, in doing so, consider whether the otherinformation is materially inconsistent with the consolidated financial statements or our knowledgeobtained in the audits, or otherwise appears to be materially misstated.
Responsibilities of Management and Those Charged with Governance for the ConsolidatedFinancial Statements
Management is responsible for the preparation and fair presentation of the consolidated financialstatements in accordance with PFRSs, and for such internal control as management determines isnecessary to enable the preparation of consolidated financial statements that are free from materialmisstatement, whether due to fraud or error.
In preparing the consolidated financial statements, management is responsible for assessing the Group’sability to continue as a going concern, disclosing, as applicable, matters related to going concern andusing the going concern basis of accounting unless management either intends to liquidate the Group orto cease operations, or has no realistic alternative but to do so.
Those charged with governance are responsible for overseeing the Group’s financial reporting process.
Auditor’s Responsibilities for the Audit of the Consolidated Financial Statements
Our objectives are to obtain reasonable assurance about whether the consolidated financial statementsas a whole are free from material misstatement, whether due to fraud or error, and to issue an auditor’sreport that includes our opinion. Reasonable assurance is a high level of assurance, but is not aguarantee that an audit conducted in accordance with PSAs will always detect a material misstatementwhen it exists. Misstatements can arise from fraud or error and are considered material if, individually orin the aggregate, they could reasonably be expected to influence the economic decisions of users takenon the basis of these consolidated financial statements.
As part of an audit in accordance with PSAs, we exercise professional judgment and maintainprofessional skepticism throughout the audit. We also:
∂ Identify and assess the risks of material misstatement of the consolidated financial statements,whether due to fraud or error, design and perform audit procedures responsive to those risks, andobtain audit evidence that is sufficient and appropriate to provide a basis for our opinion. The risk ofnot detecting a material misstatement resulting from fraud is higher than for one resulting from error,as fraud may involve collusion, forgery, intentional omissions, misrepresentations, or the override ofinternal control.
A member firm of Ernst & Young Global Limited

*SGVFS032855*
- 7 -
∂ Obtain an understanding of internal control relevant to the audit in order to design audit proceduresthat are appropriate in the circumstances, but not for the purpose of expressing an opinion on theeffectiveness of the Group’s internal control.
∂ Evaluate the appropriateness of accounting policies used and the reasonableness of accountingestimates and related disclosures made by management.
∂ Conclude on the appropriateness of management’s use of the going concern basis of accounting and,based on the audit evidence obtained, whether a material uncertainty exists related to events orconditions that may cast significant doubt on the Group’s ability to continue as a going concern. If weconclude that a material uncertainty exists, we are required to draw attention in our auditor’s report tothe related disclosures in the consolidated financial statements or, if such disclosures are inadequate,to modify our opinion. Our conclusions are based on the audit evidence obtained up to the date ofour auditor’s report. However, future events or conditions may cause the Group to cease to continueas a going concern.
∂ Evaluate the overall presentation, structure and content of the consolidated financial statements,including the disclosures, and whether the consolidated financial statements represent the underlyingtransactions and events in a manner that achieves fair presentation.
∂ Obtain sufficient appropriate audit evidence regarding the financial information of the entities orbusiness activities within the Group to express an opinion on the consolidated financial statements.We are responsible for the direction, supervision and performance of the audit. We remain solelyresponsible for our audit opinion.
We communicate with those charged with governance regarding, among other matters, the plannedscope and timing of the audit and significant audit findings, including any significant deficiencies ininternal control that we identify during our audit.
We also provide those charged with governance with a statement that we have complied with relevantethical requirements regarding independence, and to communicate with them all relationships and othermatters that may reasonably be thought to bear on our independence, and where applicable, relatedsafeguards.
From the matters communicated with those charged with governance, we determine those matters thatwere of most significance in the audit of the consolidated financial statements of the current period andare therefore the key audit matters. We describe these matters in our auditor’s report unless law orregulation precludes public disclosure about the matter or when, in extremely rare circumstances, wedetermine that a matter should not be communicated in our report because the adverse consequences ofdoing so would reasonably be expected to outweigh the public interest benefits of such communication.
A member firm of Ernst & Young Global Limited

*SGVFS032855*
- 8 -
The engagement partner on the audit resulting in this independent auditor’s report is Michael C. Sabado.
SYCIP GORRES VELAYO & CO.
Michael C. SabadoPartnerCPA Certificate No. 89336SEC Accreditation No. 0664-AR-3 (Group A), March 16, 2017, valid until March 15, 2020Tax Identification No. 160-302-865BIR Accreditation No. 08-001998-73-2018, February 26, 2018, valid until February 25, 2021PTR No. 7332607, January 3, 2019, Makati City
February 27, 2019
A member firm of Ernst & Young Global Limited

*SGVFS032855*
AYALA LAND, INC. AND SUBSIDIARIESCONSOLIDATED STATEMENTS OF FINANCIAL POSITION(Amounts in Thousands)
December 31
2018
2017 (As restated -
see Note 2)
ASSETS
Current AssetsCash and cash equivalents (Notes 2, 4 and 30) P=23,996,570 P=20,998,089Short-term investments (Notes 2, 5 and 30) 3,085,373 4,739,734Financial assets at fair value through profit or loss
(Notes 2, 6 and 30) 476,245 540,606Accounts and notes receivable (Notes 2, 7 and 30) 78,245,866 75,917,344Contract assets (Notes 2, 15 and 30) 48,473,011 −Inventories (Notes 2 and 8) 104,371,611 90,845,608Other current assets (Notes 2 and 9) 44,181,222 47,810,900 Total Current Assets 302,829,898 240,852,281
Noncurrent AssetsNoncurrent accounts and notes receivable (Notes 2, 7 and 30) 3,367,890 44,522,898Noncurrent contract assets (Notes 2, 15 and 30) 35,437,047 −Financial assets at fair value through other comprehensive income
(Notes 2, 10 and 30) 1,495,795 −Available-for-sale financial assets (Notes 2, 10 and 30) − 1,475,241Investments in associates and joint ventures (Note 11) 23,389,752 26,800,823Investment properties (Note 12) 225,005,910 200,239,815Property and equipment (Note 13) 35,749,200 28,524,088Deferred tax assets - net (Note 24) 13,040,993 10,648,013Other noncurrent assets (Notes 14 and 27) 28,503,997 20,929,175 Total Noncurrent Assets 365,990,584 333,140,053
P=668,820,482 P=573,992,334
LIABILITIES AND EQUITY
Current LiabilitiesShort-term debt (Notes 17 and 30) P=14,386,717 P=17,644,350Accounts and other payables (Notes 16 and 30) 171,999,422 137,683,859Contract liabilities (Note 15) 21,874,681 −Income tax payable 2,588,669 978,433Current portion of long-term debt (Notes 17 and 30) 23,265,173 6,572,775Deposits and other current liabilities (Note 18) 6,669,865 21,743,820 Total Current Liabilities 240,784,527 184,623,237
Noncurrent LiabilitiesLong-term debt - net of current portion (Notes 17 and 30) 149,446,949 150,168,631Pension liabilities (Note 27) 1,550,198 1,535,671Contract liabilities - net of current portion (Note 15) 8,630,235 −Deferred tax liabilities - net (Note 24) 5,894,705 3,543,791Deposits and other noncurrent liabilities (Notes 19 and 30) 42,292,671 41,857,646 Total Noncurrent Liabilities 207,814,758 197,105,739 Total Liabilities 448,599,285 381,728,976
(Forward)

*SGVFS032855*
- 2 -
December 31
2018
2017(As restated -
see Note 2)
Equity (Note 20)Equity attributable to equity holders of Ayala Land, Inc. Paid-in capital P=62,350,964 P=61,948,711 Retained earnings (Note 2) 132,090,020 109,976,450 Stock options outstanding (Note 29) 65,462 99,064 Remeasurement loss on defined benefit plans (Note 27) (219,782) (160,015) Fair value reserve of financial assets at FVOCI (Note 10) (454,138) 40,530
Cumulative translation adjustments 868,271 1,001,986 Equity reserves (Note 1) (7,400,945) (6,152,115)
187,299,852 166,754,611Non-controlling interests (Note 20) 32,921,345 25,508,747 Total Equity 220,221,197 192,263,358
P=668,820,482 P=573,992,334
See accompanying Notes to Consolidated Financial Statements.

*SGVFS032855*
AYALA LAND, INC. AND SUBSIDIARIESCONSOLIDATED STATEMENTS OF INCOME(Amounts in Thousands, Except Earnings Per Share Figures)
Years Ended December 312018 2017 2016
REVENUE (Note 21)Real estate sales (Notes 21 and 31) P=155,954,816 P=133,097,831 P=117,700,488Interest income from real estate sales (Note 7) 7,042,078 5,409,944 5,010,993Equity in net earnings of associates and
joint ventures (Notes 11 and 21) 749,924 865,566 554,414163,746,818 139,373,341 123,265,895
Interest and investment income (Notes 6, 22 and 26) 958,236 675,051 702,964Other income (Notes 22 and 25) 1,540,717 2,248,559 659,936
2,498,953 2,923,610 1,362,900166,245,771 142,296,951 124,628,795
COSTS AND EXPENSESReal estate sales (Note 23) 101,079,130 87,921,064 76,566,404General and administrative expenses
(Notes 23, 27 and 29) 9,101,328 7,274,845 7,031,350Interest and other financing charges (Note 23) 9,594,003 7,914,326 7,314,387Other expenses (Note 23) 1,270,281 1,196,076 1,053,207
121,044,742 104,306,311 91,965,348
INCOME BEFORE INCOME TAX 45,201,029 37,990,640 32,663,447
PROVISION FOR INCOME TAX (Note 24)Current 13,390,637 11,959,895 10,070,055Deferred (1,406,197) (2,134,914) (1,838,393)
11,984,440 9,824,981 8,231,662
NET INCOME P=33,216,589 P=28,165,659 P=24,431,785
Net income attributable to: Equity holders of Ayala Land, Inc. (Note 28) P=29,240,880 P=25,304,965 P=20,908,011 Non-controlling interests 3,975,709 2,860,694 3,523,774
P=33,216,589 P=28,165,659 P=24,431,785
Earnings Per Share (Note 28)Net income attributable to equity holders of Ayala Land,
Inc.: Basic and diluted P=1.98 P=1.71 P=1.43
See accompanying Notes to Consolidated Financial Statements.

*SGVFS032855*
AYALA LAND, INC. AND SUBSIDIARIESCONSOLIDATED STATEMENTS OF COMPREHENSIVE INCOME(Amounts in Thousands)
Years Ended December 312018 2017 2016
Net income P=33,216,589 P=28,165,659 P=24,431,785
Other comprehensive income (loss)Item that may be reclassified to profit or loss in
subsequent years:Cumulative translation adjustment 451,195 1,001,986 −
Items that will not be reclassified to profit or loss insubsequent years:
Fair value reserve of financial assets at FVOCI(Note 10) 71,938 (3,064) 124,932
Remeasurement gain (loss) on pension liabilities(Note 27) (85,381) 281,290 107,956
Income tax effect 25,614 (84,387) (32,387)463,366 1,195,825 200,501
Total comprehensive income P=33,679,955 P=29,361,484 P=24,632,286
Total comprehensive income attributable to: Equity holders of of Ayala Land, Inc. P=29,701,636 P=26,500,790 P=21,107,974 Non-controlling interests 3,978,319 2,860,694 3,524,312
P=33,679,955 P=29,361,484 P=24,632,286
See accompanying Notes to Consolidated Financial Statements.

*SGVFS032855*
AYALA LAND, INC. AND SUBSIDIARIESCONSOLIDATED STATEMENTS OF CHANGES IN EQUITY(Amounts in Thousands)
Attributable to equity holders of Ayala Land, Inc.
Capital Stock(Note 20)
AdditionalPaid-inCapital
(Note 20)Subscriptions
Receivable
AppropriatedRetainedEarnings(Note 20)
UnappropriatedRetainedEarnings(Note 20)
StockOptions
Outstanding
RemeasurementGain (Loss)on Defined
BenefitPlans
(Note 27)
Fair valuereserve of
financialassets at
FVOCI (Note 10)
CumulativeTranslation
Adjustments(Note 20)
EquityReserves
(Note 20) TotalNon-Controlling
Interests Total EquityAs of January 1, 2018, as previously reported P=16,031,596 P=47,454,241 (P=1,537,126) P=8,000,000 P=101,976,450 P=99,064 (P=160,015) P=40,530 P=1,001,986 (P=6,152,115) P=166,754,611 P=25,508,747 P=192,263,358Effect of adoption of new accounting
standards (Note 2)− − − − 358,605 − − (563,997) − − (205,392) 205,392 −
Balances at January 1, 2018, as restated 16,031,596 47,454,241 (1,537,126) 8,000,000 102,335,055 99,064 (160,015) (523,467) 1,001,986 (6,152,115) 166,549,219 25,714,139 192,263,358Net income − − − − 29,240,880 − − − − − 29,240,880 3,975,709 33,216,589Other comprehensive income (loss) − − − − − − (59,767) 69,329 451,195 − 460,757 2,609 463,366Total comprehensive income − − − − 29,240,880 − (59,767) 69,329 451,195 − 29,701,637 3,978,318 33,679,955Cost of stock options − 132,121 − − − (33,602) − − − − 98,519 − 98,519Collection of subscription receivable − − 270,132 − − − − − − − 270,132 − 270,132Stock options exercised 9,934 399,628 (409,562) − − − − − − − − − −Acquisition of control on previously held interest − − − − − − − − (584,910) − (584,910) 4,773,524 4,188,614Acquisition of non-controlling interest − − − − − − − − − (1,248,830) (1,248,830) (509,596) (1,758,426)Cash dividends declared − − − − (7,485,915) − − − − − (7,485,915) (1,035,040) (8,520,955)As of December 31, 2018 P=16,041,530 P=47,985,990 (P=1,676,556) P=8,000,000 P=124,090,020 P=65,462 (P=219,782) (P=454,138) P=868,271 (P=7,400,945) P=187,299,852 P=32,921,345 P=220,221,197
As of January 1, 2017 P=16,019,331 P=46,928,521 (P=1,385,682) P=8,000,000 P=83,798,555 P=89,697 (P=356,918) P=43,594 P=− (P=5,432,003) P=147,705,095 P=24,978,092 P=172,683,187Net income − − − − 25,304,965 − − − − − 25,304,965 2,860,694 28,165,659Other comprehensive income (loss) − − − − − − 196,903 (3,064) 1,001,986 − 1,195,825 − 1,195,825Total comprehensive income − − − − 25,304,965 − 196,903 (3,064) 1,001,986 − 26,500,790 2,860,694 29,361,484Cost of stock options − 144,478 − − − 9,367 − − − − 153,845 − 153,845Collection of subscription receivable − − 242,063 − − − − − − − 242,063 − 242,063Stock options exercised 12,265 381,242 (393,507) − − − − − − − − − −Acquisition of non-controlling interest − − − − − − − − − (586,010) (586,010) (1,247,563) (1,833,573)Increase in non-controlling interest − − − − − − − − − (134,102) (134,102) 408,138 274,036Net change in non-controlling interest − − − − − − − − − − − (387,883) (387,883)Cash dividends declared − − − − (7,127,070) − − − − − (7,127,070) (1,102,731) (8,229,801)As of December 31, 2017 P=16,031,596 P=47,454,241 (P=1,537,126) P=8,000,000 P=101,976,450 P=99,064 (P=160,015) P=40,530 P=1,001,986 (P=6,152,115) P=166,754,611 P=25,508,747 P=192,263,358

*SGVFS032855*
- 2 -
Attributable to equity holders of Ayala Land, Inc.
Capital Stock(Note 20)
AdditionalPaid-inCapital
(Note 20)Subscriptions
Receivable
AppropriatedRetainedEarnings(Note 20)
UnappropriatedRetainedEarnings(Note 20)
StockOptions
Outstanding
RemeasurementGain (Loss)on Defined
BenefitPlans
(Note 27)
Fair valuereserve of
financial assetsat FVOCI(Note 10)
CumulativeTranslation
Adjustments(Note 20)
EquityReserves(Note 20) Total
Non-ControllingInterests Total Equity
As of January 1, 2016 P=16,002,280 P=46,217,696 (P=1,147,528) P=6,000,000 P=71,951,761 P=190,747 (P=432,487) (P=80,800) P=− (P=4,970,965) P=133,730,704 P=16,094,707 P=149,825,411Net income − − − − 20,908,011 − − − − − 20,908,011 3,523,774 24,431,785Other comprehensive income − − − − − − 75,569 124,394 − − 199,963 538 200,501Total comprehensive income − − − − 20,908,011 − 75,569 124,394 − − 21,107,974 3,524,312 24,632,286Collection of subscription receivable − − 180,338 − − − − − − − 180,338 − 180,338Appropriation − − − 2,000,000 (2,000,000) − − − − − − − −Cash dividends declared − − − − (7,061,217) − − − − − (7,061,217) (1,559,064) (8,620,281)Cost of stock options − 198,445 − − − 9,889 − − − − 208,334 − 208,334Stock options exercised 17,051 512,380 (418,492) − − (110,939) − − − − − − −Acquisition on non-controlling interest − − − − − − − − − (461,038) (461,038) (748,746) (1,209,784)Net increase in non-controlling interest − − − − − − − − − − − 7,666,883 7,666,883As of December 31, 2016 P=16,019,331 P=46,928,521 (P=1,385,682) P=8,000,000 P=83,798,555 P=89,697 (P=356,918) P=43,594 P=− (P=5,432,003) P=147,705,095 P=24,978,092 P=172,683,187
See accompanying Notes to Consolidated Financial Statements.

*SGVFS032855*
AYALA LAND, INC. AND SUBSIDIARIESCONSOLIDATED STATEMENTS OF CASH FLOWS(Amounts in Thousands)
Years Ended December 31
2018
2017(As restated –
see Note 2)
2016(As restated –
see Note 2)
CASH FLOWS FROM OPERATING ACTIVITIESIncome before income tax P=45,201,029 P=37,990,640 P=32,663,447Adjustments for: Interest and other financing charges (Note 23) 9,594,003 7,914,326 7,314,387 Depreciation and amortization (Notes 12, 13, 14 and
23) 6,318,929 5,179,792 5,874,560 Dividends received from investees (Note 11) 331,461 621,579 232,950 Provision for impairment losses (Note 23) 146,974 572,001 412,259 Cost of share-based payments (Note 29) 98,519 153,845 208,335 Unrealized gain on financial assets at fair value
through profit or loss (Note 22) (4,633) (13,119) (2,422) Realized gain on financial assets at fair value
through profit or loss (Note 22) − (15,860) (6,305)Gain on sale of available-for-sale investments − (25,713) −Gain on sale of investment in associates and jointly controlled entities (588) − −
Gain on sale of property and equipment (Note 22) (46,570) (69,566) (37,447)Gain on business combination (Note 22) (59,475) − (188,086)
Equity in net earnings of associates and jointventures (Note 11) (749,924) (865,566) (554,414)
Interest income (7,952,628) (5,987,681) (5,695,312)Operating income before changes in working capital 52,877,097 45,454,678 40,221,952Changes in operating assets and liabilities: Decrease (increase) in: Accounts and notes receivable – trade (83,557,042) (10,671,714) (14,135,347) Inventories (Note 8) 12,136,508 11,551,710 (10,652,706) Other current assets (Note 9) 3,629,678 (7,952,463) (1,406,487) Increase (decrease) in: Accounts and other payables 25,998,377 (7,008,035) 26,451,366 Deposits and other current liabilities (Note 18) 15,430,961 6,155,797 3,976,821 Pension liabilities (Note 27) (45,240) 233,734 (3,646)Cash generated from operations 26,470,339 37,763,707 44,451,953Interest received 7,940,610 5,963,687 5,661,647Income tax paid (12,832,593) (11,899,324) (8,859,232)Interest paid (9,810,439) (7,594,485) (7,566,031)Net cash provided by operating activities 11,767,917 24,233,585 33,688,337
CASH FLOWS FROM INVESTING ACTIVITIESProceeds from: Sale/redemption of short-term investments 2,519,341 126,605 171,694
Sale/redemption of financial assets at FVTPL 71,690 3,408,555 2,948,650 Sale of investments in FVOCI (Note 10) 51,384 159,074 562 Disposal of property and equipment (Note 13) 3,744,743 622,957 280,775 Disposal of investment properties (Note 12) 1,722,933 165 550,255
Disposal of investments in associates and jointly controlled entities 83,957 196,654 −
(Forward)

*SGVFS032855*
- 2 -
Years Ended December 31
2018
2017(As restated –
see Note 2)
2016(As restated –
see Note 2)Additions to:
Short-term investments (P=865,006) (P=4,658,694) (P=214,744)Financial assets at fair value through profit or loss (2,696) (1,955,642) (2,760,693)Available-for-sale financial assets (Note 10) − (226,494) (837,168)Investments in associates and joint ventures (Note 11) (3,724,958) (1,073,319) (7,142,335)Investment properties (Note 12) (32,803,016) (30,846,466) (35,508,154)Property and equipment (Note 13) (2,842,787) (2,326,115) (3,721,845)
Net decrease (increase) in:Accounts and notes receivable – nontrade (Note 7) 41,657,193 (718,287) (10,712,931)Other noncurrent assets (Note 14) (7,906,689) 3,384,920 (3,502,623)
Net decrease in cash from business combination (Note 25) (4,684,335) − (105,381)Net cash used in investing activities (2,978,246) (33,906,087) (60,553,938)
CASH FLOWS FROM FINANCING ACTIVITIESProceeds from short and long-term debt (Note 17) 128,994,834 157,564,449 51,937,179Payments of short and long-term debt (Note 17) (119,970,061) (142,980,030) (23,131,953)Increase (decrease) in deposits and other noncurrent
liabilities (5,584,237) 5,217,509 7,353,729Acquisition of non-controlling interest (Note 20) (1,758,426) (1,559,537) (1,209,784)Proceeds from capital stock subscriptions (Note 20) 270,132 242,063 180,338Dividends paid to non-controlling interests (1,035,040) (1,102,731) (1,559,064)Dividends paid to equity holders of Ayala Land, Inc.
(Note 20) (7,181,498) (7,193,183) (6,983,060)Increase (decrease) in non-controlling interests − (387,883) 2,095,156Net cash provided by (used in) financing activities (6,264,296) 9,800,657 28,682,541
NET INCREASE IN CASH AND CASH EQUIVALENTS 2,525,375 128,155 1,816,940
EFFECT OF CHANGES IN FOREIGN CURRENCY 473,106 (34,396) −
CASH AND CASH EQUIVALENTS AT BEGINNINGOF YEAR 20,998,089 20,904,330 19,087,390
CASH AND CASH EQUIVALENTS AT ENDOF YEAR (Note 4) P=23,996,570 P=20,998,089 P=20,904,330
See accompanying Notes to Consolidated Financial Statements.

*SGVFS032855*
AYALA LAND, INC. AND SUBSIDIARIESNOTES TO CONSOLIDATED FINANCIAL STATEMENTS
1. Corporate Information
Ayala Land, Inc. (the Parent Company or ALI) is domiciled and was incorporated on June 30, 1988 inthe Republic of the Philippines with corporate life of fifty years. The Parent Company’s parent is AyalaCorporation (AC). AC is a publicly listed company which is 47.04%-owned by Mermac, Inc. and therest by the public as of December 31, 2018. The Parent Company’s registered office and principalplace of business is 31st Floor, Tower One and Exchange Plaza, Ayala Triangle, Ayala Avenue,Makati City.
The Parent Company and its Subsidiaries (the Group) are incorporated to hold, develop, manage,administer, sell, convey, encumber, purchase, acquire, rent or otherwise deal in and dispose of, foritself or for others, residential including, but not limited to, all kinds of housing projects, commercial,industrial, urban or other kinds of real property; to acquire, purchase, hold, manage, develop and sellsubdivision lots, with or without buildings or improvements; to erect, construct, alter, manage,operate, lease, in whole or in part, buildings and tenements of the Group or of other persons; and toengage or act as real estate broker. The Group is also involved in hotels and resorts operations.
The consolidated financial statements of Ayala Land, Inc. and Subsidiaries as of December 31, 2018and 2017, and for each of the three years in the period ended December 31, 2018 were endorsed forapproval by the Audit Committee on February 14, 2019 and were approved and authorized for issueby the Board of Directors (BOD) on February 27, 2019.
The consolidated financial statements represent the consolidation of the financial statements of theParent Company and the following domestic and foreign subsidiaries:
December 312018* 2017*
Real Estate:Alveo Land Corporation (Alveo) 100% 100%
Serendra, Inc. 39 39Solinea, Inc. (Solinea) 65 65BGSouth Properties, Inc. (BGS) 50 50Portico Land Corp. (Portico) 60 60
Serendra, Inc. 28 28Amorsedia Development Corporation (ADC) 100 100
OLC Development Corporation and Subsidiary 100 100HLC Development Corporation 100 100Allysonia International Ltd. 100 100
Avida Land Corporation (Avida) 100 100Buklod Bahayan Realty and Development Corp. 100 100Avida Sales Corp. and Subsidiaries 100 100Amicassa Process Solutions, Inc. 100 100Avencosouth Corp. (Avencosouth) 70 70BGNorth Properties, Inc. (BGN) 50 50
Amaia Land Co. (Amaia) 100 100Amaia Southern Properties, Inc. (ASPI) 65 65
AyalaLand Premier, Inc. 100 100Ayala Land International Sales, Inc. (ALISI) 100 100
Ayala Land International Marketing, Inc. (AIMI) 100 100Ayala Land International (Singapore) Pte. Ltd 100 100Ayala Land International Marketing (Hong Kong) Ltd 100 100Ayala Land International Marketing, SRL (ALIM SRL) 100 100
(Forward)

- 2 -
*SGVFS032855*
December 312018* 2017*
Ayala Land International Marketing London 100% 100%Ayala Land Sales, Inc. 100 100Southportal Properties, Inc. (Southportal) 65 65Buendia Landholdings, Inc. 100 100Crans Montana Holdings, Inc. 100 100Crimson Field Enterprises, Inc. 100 100Ecoholdings Company, Inc. (ECI) 100 100NorthBeacon Commercial Corporation (NBCC) 100 100Red Creek Properties, Inc. 100 100Regent Time International, Limited (Regent Time) (British
Virgin Islands)100 100
North Eastern Commercial Corp. (NECC) 100 100Westview Commercial Ventures Corp. (Westview) 100 100North Ventures Commercial Corporation 100 100Hillsford Property Corporation (Hillsford) 100 100Primavera Towncentre, Inc. (PTI) 100 100Summerhill E-Office Corporation (Summerhill) 100 100Sunnyfield E-Office Corporation (Sunnyfield) 100 100Subic Bay Town Centre, Inc. (SBTCI) 100 100Regent Wise Investments Limited (Regent Wise)
(Hongkong company)100 100
AyalaLand Real Estate Investments Inc. (Canada) 100 100AyalaLand Advisory Broadway Inc. (Canada) 100 100AyalaLand Development (Canada) Inc. 100 100AyalaLand OpenAsia Holdings PTE, Ltd (Singapore) 100 100Blue Horizons Holdings PTE, Ltd (Singapore) 100 100MCT, Bhd. (MCT) (Malaysia) 66 −
AyalaLand Commercial REIT, Inc. (ALCRI) 100 100Arvo Commercial Corporation (Arvo) 100 100BellaVita Land Corporation (BellaVita) 100 100Nuevo Centro, Inc. (Nuevo Centro) 54 55
Alviera Country Club, Inc. (Alviera) 50 50Cavite Commercial Town Center, Inc. (CCTCI) 100 100One Dela Rosa Property Development, Inc. 100 −AyalaLand Offices, Inc. (ALO) 100 100
One Dela Rosa Property Development, Inc. − 100First Gateway Real Estate Corp. 100 100Glensworth Development, Inc. (Glensworth) 100 100UP North Property Holdings, Inc. 100 100
ALO Prime Realty Corporation 100 100Makati Cornerstone Leasing Corp. (MCLC) 100 100Arca South Commercial Ventures Corp. 100 100Capitol Central Commercial Ventures Corp. 100 100Bay City Commercial Venture Corp. (BCCVC) 100 100Laguna Technopark, Inc. (LTI) 95 75
Ecozone Power Management, Inc. 95 75Aurora Properties Incorporated 80 80
Soltea Commercial Corp. 16 16Vesta Property Holdings, Inc. 70 70Altaraza Prime Realty Corporation (Altaraza) 100 100Prow Holdings, Inc. 55 55Station Square East Commercial Corporation (SSECC) 69 69Next Urban Alliance Development Corp. 100 100
(Forward)

- 3 -
*SGVFS032855*
December 312018* 2017*
Accendo Commercial Corp. (Accendo) 67% 67%Avencosouth Corp. 20 20Aviana Development Corporation 7 7
Aviana Development Corporation 50 50Cagayan de Oro Gateway Corp. (CDOGC) 70 70Ceci Realty, Inc. (Ceci) 60 60
Soltea Commercial Corp. 12 12Soltea Commercial Corp. 60 60CMPI Holdings, Inc. 60 60
CMPI Land, Inc. 36 36ALI-CII Development Corporation (ALI-CII) 50 50Roxas Land Corporation (RLC) 50 50Adauge Commercial Corporation (Adauge) 60 60AyalaLand Estates, Inc. (formerly Southgateway
Development Corp. (SDC))100 100
Ayalaland MetroNorth, Inc. (AMNI) 100 100Verde Golf Development Corp. 100 100North Triangle Depot Commercial Corporation (NTDCC) 73 73BGWest Properties, Inc. (BGW) 50 50Lagdigan Land Corp. (Lagdigan) 60 60Central Block Developers, Inc. (CBDI) 45 35Cebu Holdings, Inc. (CHI) 70 72
Cebu Leisure Company, Inc. 70 72CBP Theatre Management Inc. 70 72Taft Punta Engaño Property Inc. (TPEPI) 39 40Cebu Insular Hotel Company, Inc. (CIHCI) 26 27Solinea, Inc. 25 25Amaia Southern Properties, Inc. (ASPI) 25 25Southportal Properties, Inc. (Southportal) 25 25Central Block Developers, Inc. (CBDI)** 39 41
Alabang Commercial Corporation (ACC) 50 50South Innovative Theater Management (SITMI) 50 50
ALI Commercial Center, Inc. 100 100AMC Japan Concepts, Inc. 75 −
Prime Orion Philippines, Inc. (POPI) 67 63FLT Prime Insurance Corporation 55 45Orion Solutions, Inc. 70 63Orion Holdings Philippines, Inc. 70 63OE Holdings, Inc. 70 63Orion Land, Inc. 70 63Lepanto Ceramics, Inc. 70 63
Ayalaland Malls Synergies, Inc. 100 100Ayalaland Malls, Inc. (formerly Solerte, Inc.) 100 100
Ayalaland Malls Vismin, Inc. 100 100Ayalaland Malls NorthEast, Inc. 100 100
(Forward)

- 4 -
*SGVFS032855*
December 312018* 2017*
Construction:Makati Development Corporation (MDC) 100% 100%
MDC Subic, Inc. 100 100MDC Build Plus, Inc. 100 100MDC Conqrete, Inc. (MCI) 100 100MDC Equipment Solutions, Inc. (MESI) 100 100MDBI Construction Corp. 67 67
Hotels and Resorts:Ayala Hotels, Inc. (AHI) 50 50AyalaLand Hotels and Resorts Corporation (AHRC)
and Subsidiaries 100 100ALI Makati Hotel & Residences, Inc. 80 80ALI Makati Hotel Property, Inc. 80 80Regent Horizons Conservation Company, Inc. 100 100Enjay Hotels, Inc. (Enjay) 100 100Greenhaven Property Venture, Inc. (GPVI) 100 100Cebu Insular Hotel Company, Inc. (CIHCI) 63 63Bonifacio Hotel Ventures, Inc. 100 100Southcrest Hotel Ventures, Inc. 67 67Northgate Hotel Ventures, Inc. 70 70North Triangle Hotel Ventures, Inc. 100 100Ecosouth Hotel Ventures, Inc. 100 100Sentera Hotel Ventures, Inc. 100 100Econorth Resorts Ventures, Inc. 100 100ALI Triangle Hotel Ventures, Inc. 100 100Circuit Makati Hotel Ventures, Inc. 100 100Capitol Centre Hotel Ventures, Inc. 100 100Arca South Hotel Ventures, Inc. 100 100Sicogon Town Hotel, Inc. 100 100Bay Area Hotel Ventures, Inc. 100 100Makati North Hotel Ventures, Inc. (MNHVI) 100 100One Makati Hotel Ventures, Inc. (OMHVI) 100 100Sicogon Island Tourism Estate Corp. (SITE Corp.) 100 100Asiatown Hotel Ventures, Inc. 100 −One Makati Residential Ventures, Inc. 100 −
ALI Makati Hotels & Residences, Inc. 20 20ALI Makati Hotel Property, Inc. 20 20Ten Knots Phils., Inc. (TKPI) 60 60
Bacuit Bay Development Corporation 60 60Lio Resort Ventures, Inc. 60 60North Liberty Resort Ventures, Inc. 60 60Paragua Eco-Resort Ventures, Inc. 60 60Lio Tourism Estate Management Corporation 60 60
Ten Knots Development, Corp. (TKDC) 60 60Chirica Resorts Corp. 60 60Kingfisher Capital Resources Corp. 60 60Pangulasian Island Resort Corporation 60 60
Property Management:Ayala Property Management Corporation (APMC) 100 100
Prime Support Services, Inc. 100 100Ayala Theatres Management, Inc. (ATMI) and Subsidiaries 100 100DirectPower Services, Inc. (DirectPower) 100 100Philippine Integrated Energy Solutions, Inc. (PhilEnergy) 100 100
(Forward)

- 5 -
*SGVFS032855*
December 312018* 2017*
Entertainment:Five Star Cinema, Inc. 100% 100%Leisure and Allied Industries Philippines, Inc. (LAIP) 50 50
Others:ALInet.com, Inc. (ALInet) 100 100First Longfield Investments Limited (First Longfield)
(Hongkong Company)100 100
Green Horizons Holdings Limited 100 100Aprisa Business Process Solutions, Inc. (Aprisa) 100 100AyalaLand Club Management, Inc. 100 100ALI Capital Corp. (formerly Varejo Corp.) 100 100
Integrated Eco-resort, Inc. 100 100Airswift Transport, Inc. (formerly Island Transvoyager,Inc.) (Airswift) 100 100
Arca South Integrated Terminal, Inc. 100 100Whiteknight Holdings, Inc. 100 100Ayalaland Medical Facilities Leasing, Inc. 100 100Anvaya Cove Beach and Nature Club, Inc. (Anvaya CoveBeach) 73 73Anvaya Cove Golf and Sports Club, Inc. (Anvaya CoveGolf) 76 78
*represents the Group’s percentage and effective ownership**includes CPVDC interest in CBDI
The above companies are domiciled in the Philippines except for the foreign entities which isdomiciled and incorporated in the country as mentioned above.
AC owns the other 50.0% of AHI. The Company exercises control over AHI. Likewise, the Company,through its 50.0% effective ownership and by virtue of a management contract or shareholders’agreement, exercises control over the operations and management of ACC, BGWest, BGNorth,BGSouth, RLC, ALI-CII and LAIP. Accordingly, the accounts of AHI, ACC, BGWest, BGNorth,BGSouth, RLC, ALI-CII and LAIP are consolidated to the accounts of the Company (see Note 3).
The following were the changes in the group structure during 2018:One Makati Residential Ventures, Inc. is a wholly owned subsidiary of AyalaLand Hotels and ResortsCorp. (AHRC) and was registered with the Securities and Exchange Commission on September 12,2018. The company was organized primarily for the development of One Ayala Residences.
AMC Japan Concepts, Inc. was incorporated on November 15, 2018 and is 75% owned by ALICommercial Center, Inc. and 25% owned by MC Commercial Property Holdings, Inc. The Companyis organized primarily to manage the Glorietta Roofdeck – Japan Town.
Asiatown Hotel Ventures, Inc. is a domestic corporation registered with the Securities and ExchangeCommission on December 17, 2018. The Company is wholly owned subsidiary of AyalaLand Hotelsand Resorts Corp. (AHRC) and was organized primarily for the development of Seda Cebu IT Park.
In January 2018, ALI purchased additional 202,774,547 shares of POPI from Genez InvestmentCorporation for P=497.7 million increasing the Company’s ownership to 67%.
On April 30, 2018, ALI and POPI executed a Deed of Exchange where ALI will subscribe to1,225,370,620 common shares of POPI for an aggregate subscription price of P=3.0 billion inexchange for 30,186 common shares of Laguna Technopark, Inc. (LTI). The subscription andexchange shall be subject to and deemed effective only upon the issuance by the SEC of theconfirmation of valuation of the shares. As of audit report date, the SEC has yet to issue its approval.

- 6 -
*SGVFS032855*
In December 2018, ALI acquired 8,051 common shares of LTI for P=800.0 million increasing itsownership to 95%.
On January 2, 2018, the Group through RWIL signed a share purchase agreement to acquire anadditional 17.24% share in MCT Bhd (MCT) from Barry Goh Ming Choon for a toal cost ofRM202.5 million which brought ALI’s shareholding in MCT from 32.95% to 50.19%. Subsequently,RWIL conducted a mandatory take-over offer (MO) from the period January 26 to February 19, 2018in accordance with the laws of Malaysia. Acceptances for 295,277,782 shares were received fromthe MO equivalent to 22.12% that increased ALI’s ownership stake to 72.13% as of February 19,2018.
In March 2018, the Irredeemable Convertible Unsecured Loan Stock of Dato Sri Tong and Tan SriBarry Go, founders of MCT, were converted into 122,218,357 shares. This resulted in a 6.07%dilution of ALI’s stake in MCT as of date of share issuance. As such, the current ownership stake ofALI in MCT is 66.25%.
In 2018, ALI acquired additional 59,631,200 common shares of CHI totaling to P=352.8 million.Further, an additional 77,742,516 shares was acquired as a result of swap of CPVDC shares for atotal consideration of P=229.3 million which brings Parent Company’s ownership to 70.4%.
On November 6, 2018, SEC has approved the merger between CHI and CPVDC with CHI as thesurviving entity.
2. Summary of Significant Accounting Policies
Basis of PreparationThe consolidated financial statements of the Group have been prepared using the historical costbasis, except for financial assets at fair value through profit or loss (FVPL), financial assets at fairvalue through other comprehensive income (FVOCI) and available-for-sale financial assets that havebeen measured at fair value. The consolidated financial statements are presented in Philippine Peso(P=), which is also the Parent Company’s functional currency and all values are rounded to the nearestthousand (P=000), except when otherwise indicated.
The consolidated financial statements provide comparative information in respect of the previousperiod.
Statement of ComplianceThe consolidated financial statements of the Group have been prepared in compliance with PhilippineFinancial Reporting Standards (PFRSs), which include the availment of the relief granted by theSecurities and Exchange Commission (SEC) under Memorandum Circular Nos. 14-2018 and 3-2019as discussed in the section below on Adoption of New and Amended Accounting Standards andInterpretations. PFRSs include Philippine Financial Reporting Standards, Philippine AccountingStandards and Interpretations issued by the Philippine Interpretations Committee (PIC).
Basis of ConsolidationThe consolidated financial statements comprise the financial statements of the Group as ofDecember 31, 2018 and 2017 and for each of the three years in the period endedDecember 31, 2018.
Control is achieved when the Group is exposed, or has rights, to variable returns from its involvementwith the investee and has the ability to affect that return through its power over the investee.Specifically, the Group controls an investee if and only if the Group has:∂ Power over the investee (i.e. existing rights that give it the current ability to direct the relevant
activities of the investee),∂ Exposure, or rights, to variable returns from its involvement with the investee, and∂ The ability to use its power over the investee to affect its returns.

- 7 -
*SGVFS032855*
When the Group has less than a majority of the voting or similar rights of an investee, the Groupconsiders all relevant facts and circumstances in assessing whether it has power over an investee,including:∂ The contractual arrangement with the other vote holders of the investee∂ Rights arising from other contractual arrangements∂ The Group’s voting rights and potential voting rights
The Group re-assesses whether or not it controls an investee if facts and circumstances indicate thatthere are changes to one or more of the three elements of control. Consolidation of a subsidiarybegins when the Group obtains control over the subsidiary and ceases when the Group loses controlof the subsidiary. Assets, liabilities, income and expenses of a subsidiary acquired or disposed ofduring the year are included or excluded in the consolidated financial statements from the date theGroup gains control or until the date the Group ceases to control the subsidiary.
The financial statements of the subsidiaries are prepared for the same reporting period as theCompany, using consistent accounting policies. All intra-group balances, transactions, unrealizedgains and losses resulting from intra-group transactions and dividends are eliminated in full.
Non-controlling interests pertain to the equity in a subsidiary not attributable, directly or indirectly tothe Parent Company. Any equity instruments issued by a subsidiary that are not owned by the ParentCompany are non-controlling interests including preferred shares and options under share-basedtransactions. The portion of profit or loss and net assets in subsidiaries not wholly-owned arepresented separately in the consolidated statements of income, consolidated statements ofcomprehensive income, consolidated statements of changes in equity and consolidated statements offinancial position, separately from the Parent Company’s equity. Non-controlling interests are net ofany outstanding subscription receivable.
A change in the ownership interest of a subsidiary, without loss of control, is accounted for as anequity transaction. If the Group loses control over a subsidiary, it:
∂ Derecognizes the assets (including goodwill) and liabilities of the subsidiary, the carrying amountof any non-controlling interest and the cumulative translation differences recorded in equity.
∂ Recognizes the fair value of the consideration received, the fair value of any investment retainedand any surplus or deficit in profit or loss.
∂ Reclassifies the parent’s share of components previously recognized in other comprehensiveincome to profit or loss or retained earnings, as appropriate.
Adoption of New and Amended Accounting Standards and InterpretationsThe accounting policies adopted in the preparation of the Group’s consolidated financial statementsare consistent with those of the previous financial year except for the adoption of the following newand amended PFRSs which became effective January 1, 2018.
The nature and impact of each new standard and amendment are described below:
∂ Amendments to PFRS 2, Share-based Payment, Classification and Measurement of Share-basedPayment TransactionsThe Group’s accounting policy for cash-settled share-based payments is consistent with theapproach clarified in the amendments. In addition, the Group has no share-based paymenttransaction with net settlement features for withholding tax obligations and has not made anymodifications to the terms and conditions of its share-based payment transaction. Therefore,these amendments do not have any impact on the Group’s consolidated financial statements.
∂ PFRS 9, Financial InstrumentsPFRS 9 replaces PAS 39, Financial Instruments: Recognition and Measurement for annualperiods beginning on or after January 1, 2018, bringing together all three aspects of theaccounting for financial instruments: classification and measurement; impairment; and hedgeaccounting.

- 8 -
*SGVFS032855*
The Group applied PFRS 9 using modified retrospective approach, with an initial application dateof January 1, 2018. The Group has not restated the comparative information, which continues tobe reported under PAS 39. Differences arising from the adoption of PFRS 9 have beenrecognized directly in retained earnings and other components of equity.
The effect of adopting PFRS 9 as at January 1, 2018 was, as follows:
As previouslyreported December
31, 2017 Reference AdjustmentAs restated
January 1, 2018Available-for-sale financial
assetsP=1,475,241 (a) (P=1,475,241) P=−
Financial assets at fair valuethrough othercomprehensive income − (a) 1,475,241 1,475,241
Retained earnings 109,976,450 (a) 358,604 110,335,054Net unrealized gain (loss) on
financial assets at FVOCI 40,530 (a) (563,996) (523,466)Non-controlling interests 25,508,747 (a) 205,392 25,714,139
The nature of these adjustments are described below:
(a) Classification and measurementUnder PFRS 9, debt instruments are subsequently measured at fair value through profit orloss, amortized cost, or fair value through OCI. The classification is based on two criteria: theGroup’s business model for managing the assets; and whether the instruments’ contractualcash flows represent ‘solely payments of principal and interest’ on the principal amountoutstanding.
The assessment of the Group’s business model was made as of the date of initial application,January 1, 2018, and then applied retrospectively to those financial assets that were notderecognized before January 1, 2018. The assessment of whether contractual cash flows ondebt instruments are solely comprised of principal and interest was made based on the factsand circumstances as at the initial recognition of the assets.
The classification and measurement requirements of PFRS 9 did not have a significantimpact to the Group. The Group continued measuring at fair value all financial assetspreviously held at fair value under PAS 39. The following are the changes in theclassification of the Group’s financial assets:
• Cash and cash equivalents, short term investments and accounts and notes receivablespreviously classified as loans and receivables are held to collect contractual cash flowsand give rise to cash flows representing solely payments of principal and interest. Theseare now classified and measured as financial assets at amortized cost beginningJanuary 1, 2018.
• Equity investments in listed and non-listed companies previously classified as Available-for-sale (AFS) financial assets are now classified and measured as financial assetsdesignated at fair value through OCI. The Group elected to classify irrevocably its equityinvestments under this category as it intends to hold these investments for theforeseeable future. Total impairment losses recognized in profit or loss for theseinvestments in prior periods amounted to P=564.0 million. As a result of the change inclassification of the Group’s equity investments, the previously recognized impairmentloss on these investments that were previously presented under retained earnings, wasreclassified to fair value reserve of financial assets at FVOCI as at January 1, 2018resulting in an increase in retained earnings of P=358.6 million, afer noncontrolling interestof P=205.4 million.

- 9 -
*SGVFS032855*
The Group has not designated any financial liabilities as at fair value through profit or loss. Thereare no changes in classification and measurement for the Group’s financial liabilities.In summary, upon adoption of PFRS 9, the Group had the following required or electedreclassifications as at January 1, 2018.
PFRS 9 Measurement Categories
PAS 39 Categories BalancesFair value through
profit or loss Amortized costFair value
through OCILoans and receivables
Cash and cash equivalents P=20,998,089 P=− P=20,998,089 P=−Short term investments 4,739,734 − 4,739,734 −Accounts and notes receivables 120,440,242 − 120,440,242 −
Available-for-sale financial assets 1,475,241 − − 1,475,241Financial assets at FVPL 540,606 540,606 − −
P=148,193,912 P=540,606 P=146,178,065 P=1,475,241
(b) ImpairmentThe adoption of PFRS 9 has fundamentally changed the Group’s accounting for impairmentlosses for financial assets by replacing PAS 39’s incurred loss approach with a forward-looking expected credit loss (ECL) approach. PFRS 9 requires the Group to record anallowance for impairment losses for all debt financial assets not held at FVPL. ECLs arebased on the difference between the contractual cash flows due in accordance with thecontract and all the cash flows that the Group expects to receive. The shortfall is thendiscounted at an approximation to the asset’s original effective interest rate. The expectedcash flows will include cash flows from the sale of collateral held or other creditenhancements that are integral to the contractual terms.
For residential and office development trade receivables and contract assets, the Group hasapplied the standard’s simplified approach and has calculated ECLs based on lifetimeexpected credit losses. Therefore, the Group does not track changes in credit risk, butinstead recognizes a loss allowance based on lifetime ECLs at each reporting date.
The Group used the vintage analysis accounts for expected credit losses by calculating thecumulative loss rates of a given residential and office development trade receivables andcontract assets pool. It derives the probability of default from the historical data of ahomogenous portfolio that share the same origination period. The information on the numberof defaults during fixed time intervals of the accounts is utilized to create the PD model. Itallows the evaluation of the loan activity from its origination period until the end of thecontract period.
In addition to life of loan loss data, primary drivers like macroeconomic indicators ofqualitative factors such as forward-looking data on inflation and interest rates were added tothe expected loss calculation to reach a forecast supported by both quantitative andqualitative data points.
The key inputs in the model include the Group’s definition of default and historical data ofthree years for the origination, maturity date and default date. The Group considers aresidential and office development trade receivables in default when contractual payment areninety (90) days past due. However, in certain cases, the Group may also consider areceivable to be in default when internal or external information indicates that the Group isunlikely to receive the outstanding contractual amounts in full before taking into account anycredit enhancements held by the Group.
The probability of default is applied to the estimate of the loss arising on default which isbased on the difference between the contractual cash flows due and those that the Groupwould expect to receive, including from the repossession of the subject real estate property,net of cash outflows. For purposes of calculating loss given default, accounts are segmentedbased on facility/collateral type and completion. In calculating the recovery rates, the Group

- 10 -
*SGVFS032855*
considered collections of cash and/or cash from resale of real estate properties afterforeclosure, net of direct costs of obtaining and selling the real estate properties after thedefault event such as commission, refurbishment, payment required under Maceda law andcost to complete (for incomplete units).
As these are future cash flows, these are discounted back to the reporting date using theappropriate effective interest rate, usually being the original EIR or an approximation thereof.
For other financial assets such accrued receivable, receivable from related parties andadvances to other companies, ECLs are recognized in two stages. For credit exposures forwhich there has not been a significant increase in credit risk since initial recognition, ECLsare provided for credit losses that result from default events that are possible within the next12-months (a 12-month ECL). For those credit exposures for which there has been asignificant increase in credit risk since initial recognition, a loss allowance is required forcredit losses expected over the remaining life of the exposure, irrespective of the timing of thedefault (a lifetime ECL).
For cash and cash equivalents and short-term investments, the Group applies the low creditrisk simplification. The probability of default and loss given defaults are publicly available andare considered to be low credit risk investments. It is the Group’s policy to measure ECLs onsuch instruments on a 12-month basis. However, when there has been a significant increasein credit risk since origination, the allowance will be based on the lifetime ECL. The Groupuses the ratings from Standard and Poor’s (S&P), Moody’s and Fitch to determine whetherthe debt instrument has significantly increased in credit risk and to estimate ECLs.
There is no transition adjustment in relation to the impairment allowance as of January 1,2018.
∂ Amendments to PFRS 4, Applying PFRS 9 Financial Instruments with PFRS 4 InsuranceContracts
The amendments address concerns arising from implementing PFRS 9, the new financialinstruments standard before implementing the new insurance contracts standard. Theamendments introduce two options for entities issuing insurance contracts: a temporaryexemption from applying PFRS 9 and an overlay approach. The temporary exemption is firstapplied for reporting periods beginning on or after January 1, 2018. An entity may elect theoverlay approach when it first applies PFRS 9 and apply that approach retrospectively to financialassets designated on transition to PFRS 9. The entity restates comparative information reflectingthe overlay approach if, and only if, the entity restates comparative information when applyingPFRS 9.
The amendments are not applicable to the Group since none of the entities within the Group haveactivities that are predominantly connected with insurance or issue insurance contracts.
∂ PFRS 15, Revenue from Contracts with Customers
PFRS 15 supersedes PAS 11, Construction Contracts, PAS 18, Revenue and relatedInterpretations and it applies, with limited exceptions, to all revenue arising from contracts withcustomers. PFRS 15 establishes a five-step model to account for revenue arising from contractswith customers and requires that revenue be recognized at an amount that reflects theconsideration to which an entity expects to be entitled in exchange for transferring goods orservices to a customer.
PFRS 15 requires entities to exercise judgement, taking into consideration all of the relevant factsand circumstances when applying each step of the model to contracts with their customers. Thestandard also specifies the accounting for the incremental costs of obtaining a contract and thecosts directly related to fulfilling a contract. In addition, the standard requires extensivedisclosures.

- 11 -
*SGVFS032855*
On February 14, 2018, the PIC issued PIC Q&A 2018-12 (PIC Q&A) which provides guidance onsome implementation issues of PFRS 15 affecting the real estate industry. On October 25, 2018and February 8, 2019, the SEC issued SEC Memorandum Circular No. 14 Series of 2018 andSEC Memorandum Circular No. 3 Series of 2019, respectively, providing relief to the real estateindustry by deferring the application of the following provisions of the above PIC Q&A for a periodof three years until December 31, 2020:a. Exclusion of land and uninstalled materials in the determination of percentage of completion
(POC) discussed in PIC Q&A No. 2018-12-Eb. Accounting for significant financing component discussed in PIC Q&A No. 2018-12-Dc. Accounting to Common Usage Service Area (CUSA) Charges discussed in PIC Q&A No.
2018-12-H
Under the same SEC Memorandum Circular No. 3 Series of 2019, the adoption of PIC Q&ANo. 2018-14: PFRS 15 – Accounting for Cancellation of Real Estate Sales was also deferreduntil December 31, 2020.
The SEC Memorandum Circular also provided the mandatory disclosure requirements should anentity decide to avail of any relief. Disclosures should include:a. The accounting policies applied.b. Discussion of the deferral of the subject implementation issues in the PIC Q&A.c. Qualitative discussion of the impact to the consolidated financial statements had the
concerned application guideline in the PIC Q&A has been adopted.d. Should any of the deferral options result into a change in accounting policy (e.g., when an
entity excludes land and/or uninstalled materials in the POC calculation under the previousstandard but opted to include such components under the relief provided by the circular),such accounting change will have to be accounted for under PAS 8, i.e., retrospectively,together with the corresponding required quantitative disclosures.
Except for the CUSA charges discussed under PIC Q&A No. 2018-12-H which applies to leasingtransactions, the above deferral will only be applicable for real estate sales transactions.
Effective January 1, 2021, real estate companies will adopt PIC Q&A No. 2018-12 and PIC Q&ANo. 2018-14 and any subsequent amendments thereof retrospectively or as the SEC will laterprescribe.
The Group availed of the deferral of adoption of the above specific provisions of PIC Q&As. Hadthese provisions been adopted, it would have the following impact in the consolidated financialstatements:∂ The exclusion of land and uninstalled materials in the determination of POC would reduce
the percentage of completion of real estate projects resulting in a decrease in retainedearnings as at January 1, 2018 as well as a decrease in the revenue from real estate salesin 2018. This would result to the land portion of sold inventories together with connectionfees, to be treated as contract fulfillment asset.
∂ The mismatch between the POC of the real estate projects and right to an amount ofconsideration based on the schedule of payments explicit in the contract to sell wouldconstitute a significant financing component. Interest income would have been recognizedfor contract assets and interest expense for contract liabilities using effective interest ratemethod and this would have impacted retained earnings as at January 1, 2018 and therevenue from real estate sales in 2018. Currently, any significant financing componentarising from the mismatch discussed above is not considered for revenue recognitionpurposes.
∂ For airconditioning services, common use services and administration and handlingservices, would have acted as principal, these would have resulted to the gross presentationof the related revenue and the related expenses and cost. Currently, the related revenue ispresented net of costs and expenses. These would not result to any adjustment in theretained earnings as of January 1, 2018 and net income.

- 12 -
*SGVFS032855*
∂ Upon sales cancellation, the repossessed inventory would be recorded at fair value pluscost to repossess (or fair value less cost to repossess if this would have been opted). Thiswould have increased retained earnings as at January 1, 2018 and gain from repossessionin 2018. Currently, the Group records the repossessed inventory at its original carryingamount and recognize any difference between the carrying amount of the derecognizedreceivable and the repossessed property in profit or loss.
The Group adopted PFRS 15 using the modified retrospective method of adoption with the dateof initial application of January 1, 2018. Under this method, the standard can be applied either toall contracts at the date of initial application or only to contracts that are not completed at thisdate. The Group elected to apply the standard to all contracts as at January 1, 2018.
The cumulative effect of initially applying PFRS 15 is recognized at the date of initial applicationas an adjustment to the opening balance of retained earnings. Therefore, the comparativeinformation was not restated and continues to be reported under PAS 11, PAS 18 and relatedInterpretations.
The effect of adopting PFRS 15 as at January 1, 2018, was as follows (in thousands):
As previouslyreported
December 31, 2017 Reference AdjustmentA restated
January 1, 2018Contract assets P=− (a) P=73,937,300 P=73,937,300Contract liabilities − (a) 18,085,639 18,085,639
Set out below, are the amounts by which each financial statement line item is affected as at andfor the year ended December 31, 2018 as a result of the adoption of PFRS 15. The adoption ofPFRS 15 did not have a material impact on the Group’s consolidated statement ofcomprehensive income and consolidated statement of cash flows. The first column showsamounts prepared under PFRS 15 and the second column shows what the amounts would havebeen had PFRS 15 not been adopted:
Consolidated statement of financial position for the year ended December 31, 2018
Amounts prepared under
PFRS 15 Previous PFRSIncrease
(decrease)ASSETSCurrent AssetsAccounts and notes receivable (Note 7) P=78,245,866 P=126,718,877 (P=48,473,011)Contract assets (Note 15) 48,473,011 − 48,473,011
Total Current Assets 126,718,877 126,718,877 −Noncurrent AssetsNoncurrent accounts and notes receivable (Note 7) 3,367,890 38,804,937 (35,437,047)Noncurrent contract assets (Note 15) 35,437,047 − 35,437,047
Total Noncurrent Assets 38,804,937 38,804,937 −Total Assets P=165,523,814 P=165,523,814 P=−
LIABILITIES AND EQUITYCurrent LiabilitiesContract liabilities (Note 15) P=21,874,681 P=− P=21,874,681Deposits and other current liabilities (Note 18) 6,669,865 37,174,781 (30,504,916)
Total Current Liabilities 28,544,546 37,174,781 (8,630,235)Noncurrent LiabilitiesNoncurrent contract liabilities (Note 15) 8,630,235 − 8,630,235
Total Noncurrent Liabilities 8,630,235 − 8,630,235Total Liabilities P=37,174,781 P=37,174,781 P=−
The adjustments as at January 1, 2018 represents the Group’s recording as contract asset(instead of sales contract receivables) any excess of progress of work over the right to an amountof consideration that is unconditional. Meanwhile, the excess of collection over progress of workis recorded as contract liability.

- 13 -
*SGVFS032855*
Before the adoption of PFRS 15, contract asset is not presented separately from trade residentialand office development receivables while contract liabilities are presented as customers’ deposit.
The above resulted in recording of contract assets of P=73,937.3 million and contact liabilities ofP=18,085.6 million as of January 1, 2018.
PIC Q&A on Advances to Contractors and PIC Q&A on Land ClassificationThe Group adopted PIC Q&A 2018-11, Classification of Land by Real Estate Developer and PIC Q&A2018-15, PAS 1- Classification of Advances to Contractors in the Nature of Prepayments: Current vs.Non-current starting January 1, 2018. The impact of adoption is applied retrospectively whichresulted to the following reclassifications in the consolidated statement of financial position.
Reclassfied toDecember 31, 2017 Reference Inventories/
Current AssetsInvestment Properties/
Noncurrent AssetsLand and improvements (a) P=28,653,230 P=65,623,425Advances to contractors and suppliers (b) 16,032,251 6,361,904
P=44,685,481 P=71,985,329
(a) Land and improvements previously presented as non-current asset includes land which theBOD has previously approved to be developed into residential development for sale. Beforethe adoption of PIC Q&A 2018-11, the classification was based on the Group’s timing to startthe development of the property. This was reclassified under inventories in the consolidatedstatement of financial position. Land with undetermined future use was reclassified toinvestment properties (see Notes 8 and 12).
(b) Advances to contractors and suppliers previously presented under current assets,representing prepayments for the construction of investment property was reclassified to non-current asset. Before the adoption of PIC Q&A 2018-15, the classification of the Group isbased the timing of application of these advances against billings and timing of delivery ofgoods and services. This interpretation aims to classify the prepayment based on the actualrealization of such advances based on the determined usage/realization of the asset to whichit is intended for (e.g. inventory, investment property, property plant and equipment) (seeNotes 9 and 14).
∂ Amendments to PAS 28, Investments in Associates and Joint Ventures, Measuring an Associateor Joint Venture at Fair Value (Part of Annual Improvements to PFRSs 2014 - 2016 Cycle)
The amendments clarify that an entity that is a venture capital organization, or other qualifyingentity, may elect, at initial recognition on an investment-by-investment basis, to measure itsinvestments in associates and joint ventures at fair value through profit or loss. They also clarifythat if an entity that is not itself an investment entity has an interest in an associate or jointventure that is an investment entity, the entity may, when applying the equity method, elect toretain the fair value measurement applied by that investment entity associate or joint venture tothe investment entity associate’s or joint venture’s interests in subsidiaries. This election is madeseparately for each investment entity associate or joint venture, at the later of the date on which(a) the investment entity associate or joint venture is initially recognized; (b) the associate or jointventure becomes an investment entity; and (c) the investment entity associate or joint venturefirst becomes a parent. Retrospective application is required.
The amendments do not have material impact on the Group’s consolidated financial statements.

- 14 -
*SGVFS032855*
∂ Amendments to PAS 40, Investment Property, Transfers of Investment Property
The amendments clarify when an entity should transfer property, including property underconstruction or development into, or out of investment property. The amendments state that achange in use occurs when the property meets, or ceases to meet, the definition of investmentproperty and there is evidence of the change in use. A mere change in management’s intentionsfor the use of a property does not provide evidence of a change in use. Retrospective applicationof the amendments is not required and is only permitted if this is possible without the use ofhindsight.
Since the Group’s current practice is in line with the clarifications issued, the Group does notexpect any effect on its consolidated financial statements upon adoption of these amendments.
∂ Philippine Interpretation IFRIC-22, Foreign Currency Transactions and Advance Consideration
The interpretation clarifies that, in determining the spot exchange rate to use on initial recognitionof the related asset, expense or income (or part of it) on the derecognition of a non-monetaryasset or non-monetary liability relating to advance consideration, the date of the transaction is thedate on which an entity initially recognizes the nonmonetary asset or non-monetary liability arisingfrom the advance consideration. If there are multiple payments or receipts in advance, then theentity must determine the date of the transaction for each payment or receipt of advanceconsideration. Retrospective application of this interpretation is not required.Since the Group’s current practice is in line with the clarifications issued, the Group does notexpect any effect on its consolidated financial statements upon adoption of this interpretation.
Effective beginning on or after January 1, 2019
∂ Amendments to PFRS 9, Prepayment Features with Negative CompensationUnder PFRS 9, a debt instrument can be measured at amortized cost or at fair value throughother comprehensive income, provided that the contractual cash flows are ‘solely payments ofprincipal and interest (SPPI) on the principal amount outstanding’ (the SPPI criterion) and theinstrument is held within the appropriate business model for that classification. The amendmentsto PFRS 9 clarify that a financial asset passes the SPPI criterion regardless of the event orcircumstance that causes the early termination of the contract and irrespective of which partypays or receives reasonable compensation for the early termination of the contract. Theamendments should be applied retrospectively and are effective from January 1, 2019, withearlier application permitted.
The Group is currently assessing the impact of adopting this interpretation.
∂ PFRS 16, LeasesPFRS 16 sets out the principles for the recognition, measurement, presentation and disclosure ofleases and requires lessees to account for all leases under a single on-balance sheet modelsimilar to the accounting for finance leases under PAS 17, Leases. The standard includes tworecognition exemptions for lessees – leases of ’low-value’ assets (e.g., personal computers) andshort-term leases (i.e., leases with a lease term of 12 months or less). At the commencementdate of a lease, a lessee will recognize a liability to make lease payments (i.e., the lease liability)and an asset representing the right to use the underlying asset during the lease term (i.e., theright-of-use asset). Lessees will be required to separately recognize the interest expense on thelease liability and the depreciation expense on the right-of-use asset.
Lessees will be also required to remeasure the lease liability upon the occurrence of certainevents (e.g., a change in the lease term, a change in future lease payments resulting from achange in an index or rate used to determine those payments). The lessee will generallyrecognize the amount of the remeasurement of the lease liability as an adjustment to the right-of-use asset.

- 15 -
*SGVFS032855*
Lessor accounting under PFRS 16 is substantially unchanged from today’s accounting underPAS 17. Lessors will continue to classify all leases using the same classification principle as inPAS 17 and distinguish between two types of leases: operating and finance leases.
PFRS 16 also requires lessees and lessors to make more extensive disclosures than underPAS 17.
A lessee can choose to apply the standard using either a full retrospective or a modifiedretrospective approach. The standard’s transition provisions permit certain reliefs.
The Group is currently assessing the impact of adopting this standard.
∂ Amendments to PAS 19, Employee Benefits, Plan Amendment, Curtailment or Settlement
The amendments to PAS 19 address the accounting when a plan amendment, curtailment orsettlement occurs during a reporting period. The amendments specify that when a planamendment, curtailment or settlement occurs during the annual reporting period, an entity isrequired to:
• Determine current service cost for the remainder of the period after the plan amendment,curtailment or settlement, using the actuarial assumptions used to remeasure the net definedbenefit liability (asset) reflecting the benefits offered under the plan and the plan assets afterthat event.
• Determine net interest for the remainder of the period after the plan amendment, curtailmentor settlement using: the net defined benefit liability (asset) reflecting the benefits offered underthe plan and the plan assets after that event; and the discount rate used to remeasure that netdefined benefit liability (asset).
The amendments also clarify that an entity first determines any past service cost, or a gain or losson settlement, without considering the effect of the asset ceiling. This amount is recognized inprofit or loss. An entity then determines the effect of the asset ceiling after the plan amendment,curtailment or settlement. Any change in that effect, excluding amounts included in the netinterest, is recognized in other comprehensive income.
The amendments apply to plan amendments, curtailments, or settlements occurring on or afterthe beginning of the first annual reporting period that begins on or after January 1, 2019, withearly application permitted. These amendments will apply only to any future plan amendments,curtailments, or settlements of the Group.
∂ Amendments to PAS 28, Long-term Interests in Associates and Joint VenturesThe amendments clarify that an entity applies PFRS 9 to long-term interests in an associate orjoint venture to which the equity method is not applied but that, in substance, form part of the netinvestment in the associate or joint venture (long-term interests). This clarification is relevantbecause it implies that the expected credit loss model in PFRS 9 applies to such long-terminterests.
The amendments also clarified that, in applying PFRS 9, an entity does not take account of anylosses of the associate or joint venture, or any impairment losses on the net investment,recognized as adjustments to the net investment in the associate or joint venture that arise fromapplying PAS 28, Investments in Associates and Joint Ventures.
The amendments should be applied retrospectively and are effective from January 1, 2019, withearly application permitted. The Group is currently assessing the impact of adopting thisinterpretation.

- 16 -
*SGVFS032855*
∂ Philippine Interpretation IFRIC-23, Uncertainty over Income Tax TreatmentsThe interpretation addresses the accounting for income taxes when tax treatments involveuncertainty that affects the application of PAS 12 and does not apply to taxes or levies outsidethe scope of PAS 12, nor does it specifically include requirements relating to interest andpenalties associated with uncertain tax treatments.
The interpretation specifically addresses the following:
• Whether an entity considers uncertain tax treatments separately• The assumptions an entity makes about the examination of tax treatments by taxation
authorities• How an entity determines taxable profit (tax loss), tax bases, unused tax losses, unused tax
credits and tax rates• How an entity considers changes in facts and circumstances
An entity must determine whether to consider each uncertain tax treatment separately or togetherwith one or more other uncertain tax treatments. The approach that better predicts the resolutionof the uncertainty should be followed.
This interpretation is not relevant to the Group because there is no uncertainty involved in the taxtreatments made by management in connection with the calculation of current and deferred taxesas of December 31, 2018 and 2017.
∂ Annual Improvements to PFRSs 2015-2017 Cycle• Amendments to PFRS 3, Business Combinations, and PFRS 11, Joint Arrangements,
Previously Held Interest in a Joint OperationThe amendments clarify that, when an entity obtains control of a business that is a jointoperation, it applies the requirements for a business combination achieved in stages, includingremeasuring previously held interests in the assets and liabilities of the joint operation at fairvalue. In doing so, the acquirer remeasures its entire previously held interest in the jointoperation.
A party that participates in, but does not have joint control of, a joint operation might obtainjoint control of the joint operation in which the activity of the joint operation constitutes abusiness as defined in PFRS 3. The amendments clarify that the previously held interests inthat joint operation are not remeasured.
An entity applies those amendments to business combinations for which the acquisition date ison or after the beginning of the first annual reporting period beginning on or after January 1,2019 and to transactions in which it obtains joint control on or after the beginning of the firstannual reporting period beginning on or after January 1, 2019, with early application permitted.These amendments are currently not applicable to the Group but may apply to futuretransactions.
• Amendments to PAS 12, Income Tax Consequences of Payments on Financial InstrumentsClassified as EquityThe amendments clarify that the income tax consequences of dividends are linked moredirectly to past transactions or events that generated distributable profits than to distributionsto owners. Therefore, an entity recognizes the income tax consequences of dividends in profitor loss, other comprehensive income or equity according to where the entity originallyrecognized those past transactions or events.
An entity applies those amendments for annual reporting periods beginning on or afterJanuary 1, 2019, with early application is permitted. These amendments are not relevant tothe Group because dividends declared by the Group do not give rise to tax obligations underthe current tax laws.

- 17 -
*SGVFS032855*
• Amendments to PAS 23, Borrowing Costs, Borrowing Costs Eligible for CapitalizationThe amendments clarify that an entity treats as part of general borrowings any borrowingoriginally made to develop a qualifying asset when substantially all of the activities necessaryto prepare that asset for its intended use or sale are complete.
An entity applies those amendments to borrowing costs incurred on or after the beginning ofthe annual reporting period in which the entity first applies those amendments. An entityapplies those amendments for annual reporting periods beginning on or after January 1, 2019,with early application permitted.
The Group is currently assessing the impact of adopting this amendment.
Effective beginning on or after January 1, 2020
∂ Amendments to PFRS 3, Definition of a Business
The amendments to PFRS 3 clarify the minimum requirements to be a business, remove theassessment of a market participant’s ability to replace missing elements, and narrow thedefinition of outputs. The amendments also add guidance to assess whether an acquiredprocess is substantive and add illustrative examples. An optional fair value concentration test isintroduced which permits a simplified assessment of whether an acquired set of activities andassets is not a business.
An entity applies those amendments prospectively for annual reporting periods beginning on orafter January 1, 2020, with earlier application permitted.
These amendments will apply on future business combinations of the Group.
∂ Amendments to PAS 1, Presentation of Financial Statements, and PAS 8, Accounting Policies,Changes in Accounting Estimates and Errors, Definition of Material
The amendments refine the definition of material in PAS 1 and align the definitions used acrossPFRSs and other pronouncements. They are intended to improve the understanding of theexisting requirements rather than to significantly impact an entity’s materiality judgments.
An entity applies those amendments prospectively for annual reporting periods beginning on orafter January 1, 2020, with earlier application permitted.
Effective beginning on or after January 1, 2021
∂ PFRS 17, Insurance ContractsPFRS 17 is a comprehensive new accounting standard for insurance contracts coveringrecognition and measurement, presentation and disclosure. Once effective, PFRS 17 will replacePFRS 4, Insurance Contracts. This new standard on insurance contracts applies to all types ofinsurance contracts (i.e., life, non-life, direct insurance and re-insurance), regardless of the typeof entities that issue them, as well as to certain guarantees and financial instruments withdiscretionary participation features. A few scope exceptions will apply.
The overall objective of PFRS 17 is to provide an accounting model for insurance contracts that ismore useful and consistent for insurers. In contrast to the requirements in PFRS 4, which arelargely based on grandfathering previous local accounting policies, PFRS 17 provides acomprehensive model for insurance contracts, covering all relevant accounting aspects. The coreof PFRS 17 is the general model, supplemented by:• A specific adaptation for contracts with direct participation features (the variable fee
approach)

- 18 -
*SGVFS032855*
• A simplified approach (the premium allocation approach) mainly for short-duration contractsPFRS 17 is effective for reporting periods beginning on or after January 1, 2021, withcomparative figures required. Early application is permitted.
The new standard is not applicable to the Group since none of the entities within the Group haveactivities that are predominantly connected with insurance or issue insurance contracts.
Deferred Effectivity
∂ Amendments to PFRS 10, Consolidated Financial Statements, and PAS 28, Sale or Contributionof Assets between an Investor and its Associate or Joint VentureThe amendments address the conflict between PFRS 10 and PAS 28 in dealing with the loss ofcontrol of a subsidiary that is sold or contributed to an associate or joint venture. Theamendments clarify that a full gain or loss is recognized when a transfer to an associate or jointventure involves a business as defined in PFRS 3. Any gain or loss resulting from the sale orcontribution of assets that does not constitute a business, however, is recognized only to theextent of unrelated investors’ interests in the associate or joint venture.
On January 13, 2016, the Financial Reporting Standards Council deferred the original effectivedate of January 1, 2016 of the said amendments until the International Accounting StandardsBoard (IASB) completes its broader review of the research project on equity accounting that mayresult in the simplification of accounting for such transactions and of other aspects of accountingfor associates and joint ventures.
The Group is currently assessing the impact of adopting these amendments.
Current and Noncurrent ClassificationThe Group presents assets and liabilities in consolidated statement of financial position based oncurrent/noncurrent classification. An asset is current when:
(c) Expected to be realized or intended to be sold or consumed in normal operating cycle;(d) Held primarily for the purpose of trading;(e) Expected to be realized within 12 months after reporting date; or(f) Cash or cash equivalent unless restricted from being exchanged or used to settle a liability for at
least 12 months after reporting date.
All other assets are classified as noncurrent.
A liability is current when:
∂ It is expected to be settled in the normal operating cycle;∂ It is held primarily for the purpose of trading;∂ It is due to be settled within 12 months after reporting date; or∂ There is no unconditional right to defer the settlement of the liability for at least 12 months after
reporting date.
The Group classifies all other liabilities as noncurrent.
Deferred tax assets and liabilities are classified as noncurrent assets and liabilities, respectively.
Fair Value MeasurementFair value is the price that would be received to sell an asset or paid to transfer a liability in an orderlytransaction between market participants at the measurement date. The fair value measurement isbased on the presumption that the transaction to sell the asset or transfer the liability takes placeeither:∂ In the principal market for the asset or liability, or∂ In the absence of a principal market, in the most advantageous market for the asset or liability

- 19 -
*SGVFS032855*
The principal or the most advantageous market must be accessible to the Group.
The fair value of an asset or a liability is measured using the assumptions that market participantswould use when pricing the asset or liability, assuming that market participants act in their economicbest interest.
A fair value measurement of a non-financial asset takes into account a market participant's ability togenerate economic benefits by using the asset in its highest and best use or by selling it to anothermarket participant that would use the asset in its highest and best use.
The Group uses valuation techniques that are appropriate in the circumstances and for whichsufficient data are available to measure fair value, maximizing the use of relevant observable inputsand minimizing the use of unobservable inputs.
All assets for which fair value is measured or disclosed in the consolidated financial statements arecategorized within the fair value hierarchy, described as follows, based on the lowest level input thatis significant to the fair value measurement as a whole:∂ Level 1 - Quoted (unadjusted) market prices in active markets for identical assets or liabilities∂ Level 2 - Valuation techniques for which the lowest level input that is significant to the fair value
measurement is directly or indirectly observable∂ Level 3 - Valuation techniques for which the lowest level input that is significant to the fair value
measurement is unobservable.
For assets and liabilities that are recognized in the consolidated financial statements on a recurringbasis, the Group determines whether transfers have occurred between Levels in the hierarchy by re-assessing categorization (based on the lowest level input that is significant to the fair valuemeasurement as a whole) at the end of each reporting period.
External valuers are involved for valuation of significant assets, such as investment properties.Involvement of external valuers is decided upon annually by corporate finance after discussion withand approval by the Company’s audit committee. Selection criteria include market knowledge,reputation, independence and whether professional standards are maintained.
The Group, in conjunction with the external valuers, also compares each of the changes in the fairvalue of each asset with relevant external sources to determine whether the change is reasonable.
For the purpose of fair value disclosures, the Group has determined classes of assets on the basis ofthe nature, characteristics and risks of the asset and the level of the fair value hierarchy as explainedabove.
Cash and Cash EquivalentsCash includes cash on hand and in banks. Cash equivalents are short-term, highly liquid investmentsthat are readily convertible to known amounts of cash with original maturities of three (3) months orless from dates of placement and that are subject to an insignificant risk of change in value.
Financial Instruments – initial recognition and subsequent measurement effective January 1, 2018
Financial InstrumentsDate of recognitionThe Group recognizes a financial asset or a financial liability in the consolidated statement of financialposition when it becomes a party to the contractual provisions of the instrument. Purchases or salesof financial assets that require delivery of assets within the time frame established by regulation orconvention in the marketplace are recognized on the settlement date.

- 20 -
*SGVFS032855*
a. Financial assetsInitial recognition of financial instrumentsFinancial assets are classified, at initial recognition, as subsequently measured at amortized cost, fairvalue through other comprehensive income (OCI), and fair value through profit or loss.
The classification of financial assets at initial recognition depends on the financial asset’s contractualcash flow characteristics and the Group’s business model for managing them. The Group initiallymeasures a financial asset at its fair value plus, in the case of a financial asset not at fair valuethrough profit or loss, transaction costs. Trade receivables, except for sales contract receivables, aremeasured at the transaction price determined under PFRS 15. Refer to the accounting policies onRevenue from contracts with customers.
In order for a financial asset to be classified and measured at amortized cost or fair value throughOCI, it needs to give rise to cash flows that are ‘solely payments of principal and interest (SPPI)’ onthe principal amount outstanding. This assessment is referred to as the SPPI test and is performed atan instrument level.
The Group’s business model for managing financial assets refers to how it manages its financialassets in order to generate cash flows. The business model determines whether cash flows will resultfrom collecting contractual cash flows, selling the financial assets, or both.
Purchases or sales of financial assets that require delivery of assets within a time frame establishedby regulation or convention in the market place (regular way trades) are recognised on the trade date,i.e., the date that the Group commits to purchase or sell the asset.
Subsequent measurementFor purposes of subsequent measurement, financial assets are classified in four categories:∂ Financial assets at amortized cost (debt instruments)∂ Financial assets at fair value through OCI with recycling of cumulative gains and losses (debt
instruments)∂ Financial assets designated at fair value through OCI with no recycling of cumulative gains and
losses upon derecognition (equity instruments)∂ Financial assets at fair value through profit or loss
Financial assets at amortized costThis category is the most relevant to the Group. The Group measures financial assets at amortisedcost if both of the following conditions are met:∂ The financial asset is held within a business model with the objective to hold financial assets in
order to collect contractual cash flows; and∂ The contractual terms of the financial asset give rise on specified dates to cash flows that are
solely payments of principal and interest on the principal amount outstanding.
Financial assets at amortized cost are subsequently measured using the effective interest (EIR)method and are subject to impairment. Gains and losses are recognized in profit or loss when theasset is derecognized, modified or impaired.
The Group’s financial assets at amortized cost includes cash and cash equivalents, short-terminvestments and accounts and notes receivables.
Financial assets at fair value through OCI (debt instruments)The Group measures debt instruments at fair value through OCI if both of the following conditions aremet:∂ The financial asset is held within a business model with the objective of both holding to collect
contractual cash flows and selling; and∂ The contractual terms of the financial asset give rise on specified dates to cash flows that are solely
payments of principal and interest on the principal amount outstanding.

- 21 -
*SGVFS032855*
For debt instruments at fair value through OCI, interest income, foreign exchange revaluation andimpairment losses or reversals are recognized in the consolidated statement of income and computedin the same manner as for financial assets measured at amortized cost. The remaining fair valuechanges are recognized in OCI. Upon derecognition, the cumulative fair value change recognized inOCI is recycled to profit or loss.
The Group does not have debt instruments at fair value through OCI.
Financial assets designated at fair value through OCI (equity instruments)Upon initial recognition, the Group can elect to classify irrevocably its equity investments as equityinstruments designated at fair value through OCI when they meet the definition of equity under PAS32, Financial Instruments: Presentation and are not held for trading. The classification is determinedon an instrument-by-instrument basis.
Gains and losses on these financial assets are never recycled to profit or loss. Dividends arerecognized as other income in the consolidated statement of income when the right of payment hasbeen established, except when the Group benefits from such proceeds as a recovery of part of thecost of the financial asset, in which case, such gains are recorded in OCI. Equity instrumentsdesignated at fair value through OCI are not subject to impairment assessment.
The Group’s financial assets at fair value through OCI includes investments in quoted and unquotedequity instruments.
Financial assets at fair value through profit or lossFinancial assets at fair value through profit or loss include financial assets held for trading, financialassets designated upon initial recognition at fair value through profit or loss, or financial assetsmandatorily required to be measured at fair value. Financial assets are classified as held for trading ifthey are acquired for the purpose of selling or repurchasing in the near term. Derivatives, includingseparated embedded derivatives, are also classified as held for trading unless they are designated aseffective hedging instruments. Financial assets with cash flows that are not solely payments ofprincipal and interest are classified and measured at fair value through profit or loss, irrespective ofthe business model. Notwithstanding the criteria for debt instruments to be classified at amortisedcost or at fair value through OCI, as described above, debt instruments may be designated at fairvalue through profit or loss on initial recognition if doing so eliminates, or significantly reduces, anaccounting mismatch.
Financial assets at fair value through profit or loss are carried in the statement of financial position atfair value with net changes in fair value recognized in the statement of profit or loss.
This category includes investment in Unit Investment Trust Fund (UITF) and investment in ARCHCapital Asian Partners L.P. (ARCH Capital Fund) as held for trading and classified these as financialassets at FVPL.
DerecognitionA financial asset (or, where applicable, a part of a financial asset or part of a group of similar financialassets) is primarily derecognized (i.e., removed from the Group’s consolidated statement of financialposition) when:∂ The rights to receive cash flows from the asset have expired
Or∂ The Group has transferred its rights to receive cash flows from the asset or has assumed an
obligation to pay the received cash flows in full without material delay to a third party under a‘pass-through’ arrangement; and either (a) the Group has transferred substantially all the risksand rewards of the asset, or (b) the Group has neither transferred nor retained substantially allthe risks and rewards of the asset, but has transferred control of the asset
When the Group has transferred its rights to receive cash flows from an asset or has entered into apass-through arrangement, it evaluates if, and to what extent, it has retained the risks and rewards of

- 22 -
*SGVFS032855*
ownership. When it has neither transferred nor retained substantially all of the risks and rewards ofthe asset, nor transferred control of the asset, the Group continues to recognize the transferred assetto the extent of its continuing involvement. In that case, the Group also recognizes an associatedliability. The transferred asset and the associated liability are measured on a basis that reflects therights and obligations that the Group has retained.
Continuing involvement that takes the form of a guarantee over the transferred asset is measured atthe lower of the original carrying amount of the asset and the maximum amount of consideration thatthe Group could be required to repay.
Impairment of Financial AssetsThe Group recognizes an allowance for expected credit losses (ECLs) for all debt instruments notheld at fair value through profit or loss. ECLs are based on the difference between the contractualcash flows due in accordance with the contract and all the cash flows that the Group expects toreceive, discounted at an approximation of the original effective interest rate. The expected cashflows will include cash flows from the sale of collateral held or other credit enhancements that areintegral to the contractual terms.
For trade receivables and contract assets, the Group applies a simplified approach in calculatingECLs. Therefore, the Group does not track changes in credit risk, but instead recognizes a lossallowance based on lifetime ECLs at each reporting date. The Group has established a provisionmatrix for trade receivables and a vintage analysis for sales contract receivables and contract assetsthat is based on historical credit loss experience, adjusted for forward-looking factors specific to thedebtors and the economic environment.
For other financial assets such accrued receivable, receivable from related parties and advances toother companies, ECLs are recognized in two stages. For credit exposures for which there has notbeen a significant increase in credit risk since initial recognition, ECLs are provided for credit lossesthat result from default events that are possible within the next 12-months (a 12-month ECL). Forthose credit exposures for which there has been a significant increase in credit risk since initialrecognition, a loss allowance is required for credit losses expected over the remaining life of theexposure, irrespective of the timing of the default (a lifetime ECL).
For cash and cash equivalents and short-term investments, the Group applies the low credit risksimplification. The probability of default and loss given defaults are publicly available and areconsidered to be low credit risk investments. It is the Group’s policy to measure ECLs on suchinstruments on a 12-month basis. However, when there has been a significant increase in credit risksince origination, the allowance will be based on the lifetime ECL. The Group uses the ratings fromStandard and Poor’s (S&P), Moody’s and Fitch to determine whether the debt instrument hassignificantly increased in credit risk and to estimate ECLs.
The Group considers a debt investment security to have low credit risk when its credit risk rating isequivalent to the globally understood definition of ‘investment grade’.
The key inputs in the model include the Group’s definition of default and historical data of three yearsfor the origination, maturity date and default date. The Group considers trade receivables andcontract assets in default when contractual payment are 90 days past due, except for certaincircumstances when the reason for being past due is due to reconciliation with customers of paymentrecords which are administrative in nature which may extend the definition of default to 90 days andbeyond. However, in certain cases, the Group may also consider a financial asset to be in defaultwhen internal or external information indicates that the Group is unlikely to receive the outstandingcontractual amounts in full before taking into account any credit enhancements held by the Group.
Determining the stage for impairmentAt each reporting date, the Group assesses whether there has been a significant increase in creditrisk for financial assets since initial recognition by comparing the risk of default occurring over theexpected life between the reporting date and the date of initial recognition. The Group considers

- 23 -
*SGVFS032855*
reasonable and supportable information that is relevant and available without undue cost or effort forthis purpose. This includes quantitative and qualitative information and forward-looking analysis.
The Group considers that there has been a significant increase in credit risk when contractualpayments are more than 90 days past due.
An exposure will migrate through the ECL stages as asset quality deteriorates. If, in a subsequentperiod, asset quality improves and also reverses any previously assessed significant increase incredit risk since origination, then the loss allowance measurement reverts from lifetime ECL to 12-months ECL.
b. Financial liabilitiesInitial recognition and measurementFinancial liabilities are classified, at initial recognition, as financial liabilities at fair value through profitor loss, loans and borrowings, payables, or as derivatives designated as hedging instruments in aneffective hedge, as appropriate.
All financial liabilities are recognized initially at fair value and, in the case of loans and borrowings andpayables, net of directly attributable transaction costs.
The Group’s financial liabilities include “Accounts and other payables” (other than “Taxes payable”which is covered by other accounting standard), “Short-term and long-term debts”.
Subsequent measurementThe measurement of financial liabilities depends on their classification, as described below:
Financial liabilities at fair value through profit or lossFinancial liabilities at fair value through profit or loss include financial liabilities held for trading andfinancial liabilities designated upon initial recognition as at fair value through profit or loss.
Financial liabilities are classified as held for trading if they are incurred for the purpose ofrepurchasing in the near term. This category also includes derivative financial instruments enteredinto by the Group that are not designated as hedging instruments in hedge relationships as definedby PFRS 9. Separated embedded derivatives are also classified as held for trading unless they aredesignated as effective hedging instruments.
Gains or losses on liabilities held for trading are recognized in the consolidated statement of income.
Financial liabilities designated upon initial recognition at fair value through profit or loss aredesignated at the initial date of recognition, and only if the criteria in PFRS 9 are satisfied. The Grouphas not designated any financial liability as at fair value through profit or loss.
Loans and borrowingsThis is the category most relevant to the Group. After initial recognition, interest-bearing loans andborrowings are subsequently measured at amortized cost using the EIR method. Gains and lossesare recognized in profit or loss when the liabilities are derecognized as well as through the EIRamortization process.
Amortized cost is calculated by taking into account any discount or premium on acquisition and feesor costs that are an integral part of the EIR. The EIR amortization is included as finance costs in thestatement of profit or loss.
This category generally applies to short term and long term debt.
DerecognitionA financial liability is derecognized when the obligation under the liability is discharged or cancelled orexpires. When an existing financial liability is replaced by another from the same lender on

- 24 -
*SGVFS032855*
substantially different terms, or the terms of an existing liability are substantially modified, such anexchange or modification is treated as the derecognition of the original liability and the recognition ofa new liability. The difference in the respective carrying amounts is recognized in the consolidatedstatement of income.
c. Offsetting Financial InstrumentsFinancial assets and financial liabilities are offset and the net amount reported in the consolidatedstatement of financial position, if, and only if, there is a currently enforceable legal right to offset therecognized amounts and there is an intention to settle on a net basis, or to realize the asset and settlethe liability simultaneously.
Financial Instruments – initial recognition and subsequent measurement prior to January 1, 2018Financial InstrumentsDate of recognitionThe Group recognizes a financial asset or a financial liability in the consolidated statement of financialposition when it becomes a party to the contractual provisions of the instrument. Purchases or salesof financial assets that require delivery of assets within the time frame established by regulation orconvention in the marketplace are recognized on the settlement date.
Initial recognition of financial instrumentsAll financial assets and financial liabilities are initially recognized at fair value. Except for financialassets and financial liabilities at FVPL, the initial measurement of financial instruments includestransaction costs. The Group classifies its financial assets in the following categories: financialassets at FVPL, held-to-maturity (HTM) investments, AFS financial assets and loans and receivables.The Group classifies its financial liabilities into financial liabilities at FVPL and other financial liabilities.The classification depends on the purpose for which the investments were acquired or liabilitiesincurred and whether they are quoted in an active market. Management determines the classificationof its investments at initial recognition and, where allowed and appropriate, re-evaluates suchdesignation at every reporting date.
“Day 1” differenceWhere the transaction price in a non-active market is different from the fair value from otherobservable current market transactions in the same instrument or based on a valuation techniquewhose variables include only data from observable market, the Group recognizes the differencebetween the transaction price and fair value (a “Day 1” difference) in the consolidated statement ofincome under “Interest and investment income” and “Interest and other financing charges” accountsunless it qualifies for recognition as some other type of asset or liability. In cases where fair value isdetermined using data which is not observable, the difference between the transaction price andmodel value is only recognized in the consolidated statement of income when the inputs becomeobservable or when the instrument is derecognized. For each transaction, the Group determines theappropriate method of recognizing the ‘Day 1’ difference amount.
Financial assets and financial liabilities at FVPLFinancial assets and financial liabilities at FVPL include financial assets and financial liabilities heldfor trading and financial assets and financial liabilities designated upon initial recognition as at FVPL.
Financial assets and financial liabilities are classified as held for trading if they are acquired for thepurpose of selling and repurchasing in the near term. Derivatives, including separated embeddedderivatives are also classified as held for trading unless they are designated as effective hedginginstruments or a financial guarantee contract. Fair value gains or losses on investments held fortrading, net of interest income accrued on these assets, are recognized in the consolidated statementof income under “Other income” or “Other charges”.

- 25 -
*SGVFS032855*
Financial assets may be designated at initial recognition as FVPL if any of the following criteria aremet:∂ The designation eliminates or significantly reduces the inconsistent treatment that would
otherwise arise from measuring the assets or liabilities or recognizing gains or losses on them ona different basis; or
∂ The assets are part of a group of financial assets which are managed and their performanceevaluated on a fair value basis, in accordance with a documented risk management orinvestment strategy; or
∂ The financial instrument contains an embedded derivative that would need to be separatelyrecorded.
As of December 31, 2017, the Group holds its investment in Unit Investment Trust Fund (UITF) andinvestment in ARCH Capital Asian Partners L.P. (ARCH Capital Fund) as held for trading andclassified these as financial assets at FVPL. Management takes the view that these are held fortrading and such portfolios are managed by professional managers.
HTM investmentsHTM investments are quoted nonderivative financial assets with fixed or determinable payments andfixed maturities for which management has the positive intention and ability to hold to maturity.Where the Group sells other than an insignificant amount of HTM investments, the entire categorywould be tainted and reclassified as AFS financial assets. After initial measurement, theseinvestments are measured at amortized cost using the effective interest method, less impairment invalue. Amortized cost is calculated by taking into account any discount or premium on acquisitionand fees that are integral parts of the effective interest rate.
The amortization is included in “Interest and investment income” in the consolidated statement ofincome. Gains and losses are recognized in the consolidated statement of income under “Otherincome” or “Other charges” when the HTM investments are derecognized and impaired, as well asthrough the amortization process.
As of December 31, 2017, the Group has no HTM investments.
Loans and receivablesLoans and receivables are financial assets with fixed or determinable payments and fixed maturitiesthat are not quoted in an active market. They are not entered into with the intention of immediate orshort-term resale and are not designated as AFS financial assets or financial assets at FVPL. Thisaccounting policy relates to the consolidated statement of financial position captions “Short-terminvestments” and “Accounts and notes receivable”.
After initial measurement, loans and receivables are subsequently measured at amortized cost usingthe effective interest method, less allowance for impairment. Amortized cost is calculated by takinginto account any discount or premium on acquisition and fees that are integral parts of the effectiveinterest rate. The amortization is included in the “Interest income from real estate sales” in theconsolidated statement of income. The losses arising from impairment of such loans and receivablesare recognized in the consolidated statement of income under the “Other expenses” account.Loans and receivables are included in current assets if maturity is within 12 months from the reportingdate, otherwise these are classified as noncurrent assets.
AFS financial assetsAFS financial assets are those which are designated as such or do not qualify to be classified ordesignated as at FVPL, HTM, or loans and receivables.
Financial assets may be designated at initial recognition as AFS if they are purchased and heldindefinitely, and may be sold in response to liquidity requirements or changes in market conditions.
After initial measurement, AFS financial assets are measured at fair value. The unrealized gains andlosses arising from the fair valuation of AFS financial assets are excluded from reported earnings and

- 26 -
*SGVFS032855*
are reported as “Net unrealized gain on available-for-sale financial assets” in the equity section of theconsolidated statement of financial position.
When the security is disposed of, the cumulative gain or loss previously recognized in equity isrecognized in the consolidated statement of income under “Other income” account or “Other charges”account. Where the Group holds more than one investment in the same security, these are deemedto be disposed on a weighted average basis. The losses arising from impairment of suchinvestments are recognized in the consolidated statement of income under the “Other charges”account.
When the fair value of the AFS financial assets cannot be measured reliably because of lack ofreliable estimation of future cash flows and discount rates necessary to calculate the fair value ofcomputed equity instruments, these investments are carried at cost less allowance for impairmentlosses. AFS financial assets are classified as noncurrent assets unless the intention is to disposesuch assets within 12 months from reporting date.
Other financial liabilitiesIssued financial instruments or their components, which are not designated as at FVPL are classifiedas other financial liabilities where the substance of the contractual arrangement results in the Grouphaving an obligation either to deliver cash or another financial asset to the holder, or to satisfy theobligation other than by the exchange of a fixed amount of cash or another financial asset for a fixednumber of own equity shares. The components of issued financial instruments that contain bothliability and equity elements are accounted for separately, with the equity component being assignedthe residual amount after deducting from the instrument as a whole the amount separatelydetermined as the fair value of the liability component on the date of issue.
After initial measurement, other financial liabilities are subsequently measured at amortized costusing the effective interest method. Amortized cost is calculated by taking into account any discountor premium on the issue and fees that are integral parts of the effective interest rate. Any effects ofrestatement of foreign currency-denominated liabilities are recognized in the consolidated statementof income.
This accounting policy applies primarily to the Group’s “Accounts and other payables” (other than“Taxes payable” which is covered by other accounting standard), “Short-term and long-term debts,”and other obligations that meet the above definition.
Derecognition of Financial Assets and LiabilitiesFinancial assetA financial asset (or, where applicable a part of a financial asset or part of a group of financial assets)is derecognized when:a. the rights to receive cash flows from the asset have expired;b. the Group retains the right to receive cash flows from the asset, but has assumed an obligation to
pay them in full without material delay to a third party under a ‘pass-through’ arrangement; orc. the Group has transferred its right to receive cash flows from the asset and either: (a) has
transferred substantially all the risks and rewards of the asset, or (b) has neither transferred norretained the risks and rewards of the asset but has transferred the control of the asset.
Where the Group has transferred its rights to receive cash flows from an asset or has entered into a‘pass-through’ arrangement, and has neither transferred nor retained substantially all the risks andrewards of the asset nor has transferred control of the asset, the asset is recognized to the extent ofthe Group’s continuing involvement in the asset. Continuing involvement that takes the form of aguarantee over the transferred asset is measured at the lower of original carrying amount of the assetand the maximum amount of consideration that the Group could be required to repay.

- 27 -
*SGVFS032855*
Financial liabilityA financial liability is derecognized when the obligation under the liability has expired, or is dischargedor is cancelled. Where an existing financial liability is replaced by another from the same lender onsubstantially different terms, or the terms of an existing liability are substantially modified, such anexchange or modification is treated as a derecognition of the original liability and the recognition of anew liability, and the difference in the respective carrying amounts is recognized in the consolidatedstatement of income.
Impairment of Financial AssetsThe Group assesses at each reporting date whether there is objective evidence that a financial assetor group of financial assets is impaired. A financial asset or a group of financial assets is deemed tobe impaired if, and only if, there is objective evidence of impairment as a result of one or more eventsthat has occurred after the initial recognition of the asset (an incurred ‘loss event’) and that loss event(or events) has an impact on the estimated future cash flows of the financial asset or the group offinancial assets that can be reliably estimated.
Evidence of impairment may include indications that the borrower or a group of borrowers isexperiencing significant financial difficulty, default or delinquency in interest or principal payments, theprobability that they will enter bankruptcy or other financial reorganization and where observable dataindicate that there is measurable decrease in the estimated future cash flows, such as changes inarrears or economic conditions that correlate with defaults.
Loans and receivablesFor loans and receivables carried at amortized cost, the Group first assesses whether objectiveevidence of impairment exists individually for financial assets that are individually significant, orcollectively for financial assets that are not individually significant. If the Group determines that noobjective evidence of impairment exists for individually assessed financial asset, whether significantor not, it includes the asset in a group of financial assets with similar credit risk characteristics andcollectively assesses for impairment. Those characteristics are relevant to the estimation of futurecash flows for groups of such assets by being indicative of the debtors’ ability to pay all amounts dueaccording to the contractual terms of the assets being evaluated. Assets that are individuallyassessed for impairment and for which an impairment loss is, or continues to be recognized, are notincluded in a collective assessment for impairment.
If there is objective evidence that an impairment loss has been incurred, the amount of loss ismeasured as the difference between the asset’s carrying amount and the present value of theestimated future cash flows (excluding future credit losses that have not been incurred). The carryingamount of the asset is reduced through the use of an allowance account and the amount of loss ischarged to the consolidated statement of income under “Other charges” account.
Interest income continues to be recognized based on the original effective interest rate of the asst.Receivable, together with the associated allowance accounts, are written off when there is no realisticprospect of future recovery and all collateral has been realized. If, in a subsequent year, the amountof the estimated impairment loss decreases because of an event occurring after the impairment wasrecognized, the previously recognized impairment loss is reversed. Any subsequent reversal of animpairment loss is recognized in the consolidated statement of income, to the extent that the carryingvalue of the asset does not exceed its amortized cost at the reversal date.
For the purpose of a collective evaluation of impairment, financial assets are grouped on the basis ofsuch credit risk characteristics such as customer type, payment history, past-due status and term.
Future cash flows in a group of financial assets that are collectively evaluated for impairment areestimated on the basis of historical loss experience for assets with credit risk characteristics similar tothose in the group. Historical loss experience is adjusted on the basis of current observable data toreflect the effects of current conditions that did not affect the period on which the historical lossexperience is based and to remove the effects of conditions in the historical period that do not exist

- 28 -
*SGVFS032855*
currently. The methodology and assumptions used for estimating future cash flows are reviewedregularly by the Group to reduce any difference between loss estimates and actual loss experience.
Financial asset carried at costIf there is objective evidence that an impairment loss on an unquoted equity instrument that is notcarried at fair value because its fair value cannot be reliably measured, or on a derivative asset that islinked to and must be settled by delivery of such an unquoted equity instrument has been incurred,the amount of the loss is measured as the difference between the asset’s carrying amount and thepresent value of estimated future cash flows discounted at the current market rate of return for asimilar financial asset.
AFS financial assetsFor AFS financial assets, the Group assesses at each reporting date whether there is objectiveevidence that a financial asset or group of financial assets is impaired.
In the case of equity investments classified as AFS financial assets, this would include a significant orprolonged decline in the fair value of the investments below its cost or where other objective evidenceof impairment exists. The determination of what is ‘significant’ or ‘prolonged’ requires judgment. TheGroup treats ‘significant’ generally as 20% or more and ‘prolonged’ as greater than six (6) months forquoted equity securities. The Group evaluates other factors, including normal volatility in share pricefor quoted equities and the future cash flows and the discount factors for unquoted equities (see Note10). Where there is evidence of impairment, the cumulative loss - measured as the differencebetween the acquisition cost and the current fair value, less any impairment loss on that financialasset previously recognized in the consolidated statement of income - is removed from equity andrecognized in the consolidated statement of income in the “Other charges” account. Impairmentlosses on equity investments are not reversed through the consolidated statement of income.Increases in fair value after impairment are recognized directly in equity through the consolidatedstatement of comprehensive income.
In the case of debt instruments classified as AFS financial assets, impairment is assessed based onthe same criteria as financial assets carried at amortized cost. Future interest income is based on thereduced carrying amount and is accrued using the rate of interest used to discount future cash flowsfor the purpose of measuring impairment loss and is recorded as part of “Interest and investmentincome” account in the consolidated statement of income. If, in subsequent year, the fair value of adebt instrument increases and the increase can be objectively related to an event occurring after theimpairment loss was recognized in the consolidated statement of income, the impairment loss isreversed through the consolidated statement of income.
Offsetting Financial InstrumentsFinancial assets and financial liabilities are offset and the net amount reported in the consolidatedstatement of financial position, if, and only if, there is a currently enforceable legal right to offset therecognized amounts and there is an intention to settle on a net basis, or to realize the asset and settlethe liability simultaneously.
Deposits and Retentions PayableDeposits and retentions payable are measured initially at fair value. After initial recognition, depositsand retentions payable are subsequently measured at amortized cost using the effective interestmethod.
For deposits, the difference between the cash received and its fair value is deferred and amortizedusing the straight-line method under the “Real estate revenue” account in the consolidated statementof income.
Concession Financial ReceivableThe Company accounts for its concession arrangement with the DOTr under the Financial Assetmodel as it has an unconditional contractual right to receive cash or other financial asset for itsconstruction services from or at the direction of the grantor. Under the concession arrangement, the

- 29 -
*SGVFS032855*
Company is awarded the right to build and operate an integrated transport terminal for Metro Manilaand its adjacent provinces. The legal title to these assets shall be transferred to the government atthe end of the concession period.
The “Concession Financial Receivable” pertains to the fair value of the Annual Grantor Paymentrelated to the operating and maintenance services and recovery of construction costs of the terminalfacility. These are amortized using the effective interest rate over the life of the related concession.
In addition, the Company recognizes and measures construction revenues and costs in accordancewith PAS 11, Construction Contracts, and PAS 18, Revenue, for the services it performs. Recognitionof revenue is by reference to the ‘stage of completion method,’ also known as the ‘percentage ofcompletion method’ as provided under PAS 11. Contract revenue and costs from construction worksare recognized as “Construction Revenue” and “Construction Expense” in profit or loss in the periodin which the work is performed.
InventoriesProperty acquired or being constructed for sale in the ordinary course of business, rather than to beheld for rental or capital appreciation, is held as inventory and is measured at the lower of cost andnet realizable value (NRV).
Cost includes:∂ Land cost∂ Land improvement cost∂ Amounts paid to contractors for construction and development∂ Planning and design costs, costs of site preparation, professional fees, property transfer taxes,
construction overheads and other related costs.
NRV is the estimated selling price in the ordinary course of the business, based on market prices atthe reporting date, less estimated costs of completion and the estimated costs of sale.
Prepaid ExpensesPrepaid expenses are carried at cost less the amortized portion. These typically compriseprepayments for commissions, marketing fees, advertising and promotions, taxes and licenses,rentals and insurance.
Input Value-Added Tax (VAT)Input VAT arises from the purchase of goods and services. These are applied against output VAT.The remaining balance is recoverable in future periods. These are carried at cost less allowance forimpairment loss, if any. Impairment loss is recognized when input VAT can no longer be recovered.
Deposits in EscrowDeposits in escrow pertain to the proceeds from the sale of the Group’s projects that have only beengranted temporary License to Sell (LTS) as of reporting date. These proceeds are deposited in alocal bank and earn interest at prevailing bank deposit rates.
Materials, Parts and SuppliesMaterials, parts and supplies are valued at the lower of cost or NRV. Cost is determined using themoving average method. NRV is the estimated selling price in the ordinary course of business, lessestimated costs of completion and estimated costs necessary to make the sale.
An allowance for inventory losses is provided for slow-moving, obsolete and defective materials, partsand supplies based on management’s physical inspection and evaluation. When inventories are sold,the cost and related allowance is removed from the account and the difference is charged againstoperations.

- 30 -
*SGVFS032855*
Advances to Other Companies and Advances to Contractors and SuppliersAdvances to other companies and advances to contractors and suppliers are carried at cost lessimpairment losses, if any.
Investments in Associates and Joint VenturesInvestments in associates and joint ventures (investee companies) are accounted for under the equitymethod of accounting. An associate is an entity in which the Group has significant influence andwhich is neither a subsidiary nor a joint venture. A joint arrangement is a contractual arrangementwhereby two or more parties undertake an economic activity that is subject to joint control, and a jointventure is a joint arrangement that involves the establishment of a separate entity in which eachventurer has an interest.
An investment is accounted for using the equity method from the day it becomes an associate or jointventure. On acquisition of investment, the excess of the cost of investment over the investor’s sharein the net fair value of the investee’s identifiable assets, liabilities and contingent liabilities isaccounted for as goodwill and included in the carrying amount of the investment and not amortized.Any excess of the investor’s share of the net fair value of the investee’s identifiable assets, liabilitiesand contingent liabilities over the cost of the investment is excluded from the carrying amount of theinvestment, and is instead included as income in the determination of the share in the earnings of theinvestees.
Under the equity method, the investments in the investee companies are carried in the consolidatedstatement of financial position at cost plus post-acquisition changes in the Group’s share in the netassets of the investee companies, less any impairment in values. The consolidated statement ofincome reflects the share of the results of the operations of the investee companies. The Group’sshare of post-acquisition movements in the investee’s equity reserves is recognized directly in equity.Profits and losses resulting from transactions between the Group and the investee companies areeliminated to the extent of the interest in the investee companies and for unrealized losses to theextent that there is no evidence of impairment of the asset transferred. Dividends received aretreated as a reduction of the carrying value of the investment.
The Group discontinues applying the equity method when their investments in investee companiesare reduced to zero. Accordingly, additional losses are not recognized unless the Group hasguaranteed certain obligations of the investee companies. When the investee companiessubsequently report net income, the Group will resume applying the equity method but only after itsshare of that net income equals the share of net losses not recognized during the period the equitymethod was suspended.
The reporting dates of the investee companies and the Group are identical and the investeecompanies’ accounting policies conform to those used by the Group for like transactions and eventsin similar circumstances.
Upon loss of significant influence over the associate, the Group measures and recognizes anyretaining investment at its fair value. Any difference between the carrying amount of the associateupon loss of significant influence and the fair value of the retaining investment and proceeds fromdisposal is recognized in the consolidated statement of income.
Interest in Joint OperationMakati Development Corporation (MDC), a subsidiary of the Company, has an interest in jointarrangement, whereby the parties have a contractual arrangement that establishes joint control. MDCrecognizes its share of jointly held assets, liabilities, income and expenses of the joint operation withsimilar items, line by line, in its financial statements.
The financial statements of the joint operation are prepared for the same reporting period as theGroup. Adjustments are made where necessary to bring the accounting policies in line with those ofthe Company.

- 31 -
*SGVFS032855*
Investment PropertiesInvestment properties comprise completed property and property under construction or re-development that are held to earn rentals or capital appreciation or both and that are not occupied bythe companies in the Group.
The Group uses the cost model in measuring investment properties since this represents thehistorical value of the properties subsequent to initial recognition. Investment properties, except forland, are carried at cost less accumulated depreciation and amortization and any impairment inresidual value. Land is carried at cost less any impairment in value.
Expenditures incurred after the investment property has been put in operation, such as repairs andmaintenance costs, are normally charged against income in the period in which the costs areincurred.
Constructions-in-progress are carried at cost (including borrowing cost) and transferred to the relatedinvestment property account when the construction and related activities to prepare the property forits intended use are complete, and the property is ready for occupation.
Depreciation of investment properties are computed using the straight-line method over the estimateduseful lives of the assets. The estimated useful lives and the depreciation method are reviewedperiodically to ensure that the period and method of depreciation are consistent with the expectedpattern of economic benefits from items of investment properties.
The estimated useful lives of investment properties which is comprised of buildings, ranges from 20-40 years.
Investment properties are derecognized when either they have been disposed of, or when theinvestment property is permanently withdrawn from use and no future economic benefit is expectedfrom its disposal. Any gain or loss on the retirement or disposal of an investment property isrecognized in the consolidated statement of income in the year of retirement or disposal.
A transfer is made to investment property when there is a change in use, evidenced by ending ofowner-occupation, commencement of an operating lease to another party or ending of construction ordevelopment. A transfer is made from investment property when and only when there is a change inuse, evidenced by commencement of owner-occupation or commencement of development with aview to sale. A transfer between investment property, owner-occupied property and inventory doesnot change the carrying amount of the property transferred nor does it change the cost of thatproperty for measurement or disclosure purposes.
The Group discloses the fair values of its investment properties in accordance with PAS 40. TheGroup engages independent valuation specialist to assess the fair values as at December 31, 2018and 2017. The Group’s investment properties consist of land and building pertaining to landproperties, retail (malls) and office properties. These were valued by reference to market-basedevidence using comparable prices adjusted for specific market factors such as nature, location andcondition of the property.
Property and EquipmentProperty and equipment, except for land, are carried at cost less accumulated depreciation andamortization and any impairment in value. Land is carried at cost less any impairment in value. Theinitial cost of property and equipment comprises its construction cost or purchase price and anydirectly attributable costs of bringing the asset to its working condition and location for its intendeduse, including borrowing costs.
Major repairs are capitalized as part of property and equipment only when it is probable that futureeconomic benefits associated with the item will flow to the Group and the cost of the items can bemeasured reliably. All other repairs and maintenance are charged against current operations asincurred.

- 32 -
*SGVFS032855*
Depreciation and amortization of property and equipment commences once the property andequipment are available for use and are computed on a straight-line basis over the estimated usefullives of the property and equipment as follows:
YearsBuildings and improvements 20-40Machinery and construction equipment 5Furniture, fixtures and equipment 3-10Transportation equipment 3-5Hotel property and equipment 20-50
The assets’ residual values, estimated useful lives and depreciation and amortization method arereviewed periodically to ensure that the amounts, periods and method of depreciation andamortization are consistent with the expected pattern of economic benefits from items of property andequipment.
When property and equipment are retired or otherwise disposed of, the cost and the relatedaccumulated depreciation and amortization and accumulated provision for impairment losses, if any,are removed from the accounts and any resulting gain or loss is credited to or charged againstcurrent operations.
Intangible AssetsIntangible assets acquired separately are measured on initial recognition at cost. The cost ofintangible assets acquired in a business combination is its fair value as at the date of acquisition.Following initial recognition, intangible assets are carried at cost less any accumulated amortizationand accumulated impairment losses, if any. Internally generated intangible assets, excludingcapitalized development costs, are not capitalized and expenditure is reflected in the consolidatedstatement of income in the year in which the expenditure is incurred.
Leasehold rights with finite lives are amortized using the straight-line method over the estimateduseful life of 20 to 23 years and assessed for impairment whenever there is an indication that theintangible asset may be impaired. The amortization period and the amortization method for anintangible asset with a finite useful life are reviewed at least at the end of each reporting period.Changes in the expected useful life or the expected pattern of consumption of future economicbenefits embodied in the asset is accounted for by changing the amortization period or method, asappropriate, and are treated as changes in accounting estimates. The amortization expense onintangible assets with finite lives is recognized in the consolidated statement of income in theexpense category consistent with the function of the intangible assets.
Gains or losses arising from derecognition of an intangible asset are measured as the differencebetween the net disposal proceeds and the carrying amount of the asset and are recognized in theconsolidated statement of income when the asset is derecognized.
As of December 31, 2018 and 2017 intangible asset pertaining to leasehold right is included under“Other noncurrent assets”.
Business Combinations and GoodwillBusiness combinations are accounted for using the acquisition method. The cost of an acquisition ismeasured as the aggregate of the consideration transferred, measured at acquisition date fair valueand the amount of any non-controlling interest in the acquiree. For each business combination, theacquirer measures the non-controlling interest in the acquiree at fair value of the acquiree’sidentifiable net assets. Acquisition costs incurred are expensed and included in administrativeexpenses.
When the Group acquires a business, it assesses the financial assets and liabilities assumed forappropriate classification and designation in accordance with the contractual terms, economic

- 33 -
*SGVFS032855*
circumstances and pertinent conditions as at the acquisition date. This includes the separation ofembedded derivatives in host contracts by the acquiree.
If the business combination is achieved in stages, the acquisition date fair value of the acquirer’spreviously held equity interest in the acquiree is remeasured to fair value at the acquisition datethrough profit or loss.
Any contingent consideration to be transferred by the acquirer will be recognized at fair value at theacquisition date. Subsequent changes to the fair value of the contingent consideration which isdeemed to be an asset or liability will be recognized in accordance with PFRS 9 (effective January 1,2018) either in profit or loss or as a change to other comprehensive income. If the contingentconsideration is classified as equity, it should not be remeasured until it is finally settled within equity.
Goodwill is initially measured at cost being the excess of the aggregate of the considerationtransferred and the amount recognized for non-controlling interest over the net identifiable assetsacquired and liabilities assumed. If this consideration is lower than the fair value of the net assets ofthe subsidiary acquired, the difference is recognized in profit or loss as bargain purchase gain. TheGroup reassesses whether it has correctly identified all of the assets acquired and all of the liabilitiesassumed and reviews the procedures used to measure amounts to be recognized at the acquisitiondate.
After initial recognition, goodwill is measured at cost less any accumulated impairment losses. Forthe purpose of impairment testing, goodwill acquired in a business combination is, from theacquisition date, allocated to each of the Group’s cash-generating units that are expected to benefitfrom the combination, irrespective of whether other assets or liabilities of the acquiree are assigned tothose units.
Where goodwill forms part of a cash-generating unit and part of the operation within that unit isdisposed of, the goodwill associated with the operation disposed of is included in the carrying amountof the operation when determining the gain or loss on disposal of the operation. Goodwill disposed ofin this circumstance is measured based on the relative values of the operation disposed of and theportion of the cash-generating unit retained.
If the initial accounting for a business combination can be determined only provisionally by the end ofthe period in which the combination is effected because either the fair values to be assigned to theacquiree’s identifiable assets, liabilities or contingent liabilities or the cost of the combination can bedetermined only provisionally, the acquirer shall account for the combination using those provisionalvalues. The acquirer shall recognize any adjustments to those provisional values as a result ofcompleting the initial accounting within twelve months of the acquisition date as follows: (i) thecarrying amount of the identifiable asset, liability or contingent liability that is recognized or adjustedas a result of completing the initial accounting shall be calculated as if its fair value at the acquisitiondate had been recognized from that date; (ii) goodwill or any gain recognized shall be adjusted by anamount equal to the adjustment to the fair value at the acquisition date of the identifiable asset,liability or contingent liability being recognized or adjusted; and (iii) comparative information presentedfor the period before the initial accounting for the combination is complete shall be presented as if theinitial accounting has been completed from the acquisition date.
Combinations of entities under common controlBusiness combinations of entities under common control are accounted for using the pooling ofinterests method. The pooling of interests method is generally considered to involve the following:
∂ The assets and liabilities of the combining entities are reflected in the consolidated financialstatements at their carrying amounts. No adjustments are made to reflect fair values, orrecognize any new assets or liabilities, at the date of the combination. The only adjustments thatare made are those adjustments to harmonize accounting policies.

- 34 -
*SGVFS032855*
∂ No new goodwill is recognized as a result of the combination. The only goodwill that isrecognized is any existing goodwill relating to either of the combining entities. Any differencebetween the consideration paid or transferred and the equity acquired is reflected within equity.
∂ The consolidated statement of income reflects the results of the combining entities for the fullyear, irrespective of when the combination took place.
∂ Comparatives are presented as if the entities had always been combined.
The effects of intercompany transactions on current assets, current liabilities, revenues, and cost ofsales for the current period presented and on retained earnings at the beginning of the current periodpresented are eliminated to the extent possible.
Asset AcquisitionsIf the assets acquired and liabilities assumed in an acquisition transaction do not constitute abusiness as defined under PFRS 3, the transaction is accounted for as an asset acquisition. TheGroup identifies and recognizes the individual identifiable assets acquired (including those assets thatmeet the definition of, and recognition criteria for, intangible assets) and liabilities assumed. Theacquisition cost is allocated to the individual identifiable assets and liabilities on the basis of theirrelative fair values at the date of purchase. Such transaction or event does not give rise to goodwill.Where the Group acquires a controlling interest in an entity that is not a business, but obtains lessthan 100% of the entity, after it has allocated the cost to the individual assets acquired, it notionallygrosses up those assets and recognizes the difference as non-controlling interests.
Impairment of Nonfinancial AssetsThe Group assesses at each reporting date whether there is an indication that an asset may beimpaired (e.g. investments in associates and joint ventures, investment properties, property andequipment). If any such indication exists, or when annual impairment testing for an asset is required,the Group makes an estimate of the asset’s recoverable amount. An asset’s recoverable amount isthe higher of an asset’s or CGU’s fair value less costs to sell and its value in use and is determinedfor an individual asset, unless the asset does not generate cash inflows that are largely independentof those from other assets or groups of assets. Where the carrying amount of an asset exceeds itsrecoverable amount, the asset is considered impaired and is written down to its recoverable amount.In assessing value in use, the estimated future cash flows are discounted to their present value usinga pre-tax discount rate that reflects current market assessments of the time value of money and therisks specific to the asset. Impairment losses of continuing operations are recognized in theconsolidated statement of income in those expense categories consistent with the function of theimpaired asset.
For assets excluding goodwill, an assessment is made at each reporting date as to whether there isany indication that previously recognized impairment losses may no longer exist or may havedecreased. If any such indication exists, the recoverable amount is estimated. A previouslyrecognized impairment loss is reversed only if there has been a change in the assumptions used todetermine the asset’s recoverable amount since the last impairment loss was recognized. If such isthe case, the carrying amount of the asset is increased to its recoverable amount. That increasedamount cannot exceed the carrying amount that would have been determined, net of depreciationand amortization, had no impairment loss been recognized for the asset in prior years. Such reversalis recognized in the consolidated statement of income unless the asset is carried at revalued amount,in which case, the reversal is treated as a revaluation increase. After such reversal, the depreciationand amortization charge is adjusted in future periods to allocate the asset’s revised carrying amount,less any residual value, on a systematic basis over its remaining useful life.The following criteria are also applied in assessing impairment of specific assets:
Investments in associates and joint venturesAfter application of the equity method, the Group determines whether it is necessary to recognize anyadditional impairment loss with respect to the Group’s net investment in the investee companies. TheGroup determines at each reporting date whether there is any objective evidence that the investmentin associates or joint ventures is impaired. If this is the case, the Group calculates the amount of

- 35 -
*SGVFS032855*
impairment as being the difference between the recoverable amount and the carrying value of theinvestee company and recognizes the difference in the consolidated statement of income.
ProvisionsProvisions are recognized when the Group has a present obligation (legal or constructive) as a resultof a past event, it is probable that an outflow of resources embodying economic benefits will berequired to settle the obligation, and a reliable estimate can be made of the amount of the obligation.Where the Group expects a provision to be reimbursed, the reimbursement is recognized as aseparate asset but only when the reimbursement is virtually certain. If the effect of the time value ofmoney is material, provisions are determined by discounting the expected future cash flows at a pre-tax rate that reflects current market assessments of the time value of money and, where appropriate,the risks specific to the liability. Where discounting is used, the increase in the provision due to thepassage of time is recognized as interest expense. Provisions are reviewed at each reporting dateand adjusted to reflect the current best estimate.
Pension CostPension cost is actuarially determined using the projected unit credit method. This method reflectsservices rendered by employees up to the date of valuation and incorporates assumptions concerningemployees’ projected salaries. Actuarial valuations are conducted with sufficient regularity, withoption to accelerate when significant changes to underlying assumptions occur. Pension costincludes: a) service costs comprising current service costs, past-service costs, b) gains and losses oncurtailments and non-routine settlements, and c) net interest cost on benefit obligation.
Remeasurements, comprising of actuarial gains or losses, the effect of the asset ceiling, excludingnet interest cost and the return on plan assets (excluding net interest), are recognized immediately inthe statement of consolidated financial position with a corresponding debit or credit to OCI in theperiod in which they occur. Remeasurements are not reclassified to profit or loss in subsequentperiods.
The liability recognized in the consolidated statement of financial position in respect of defined benefitpension plans is the present value of the defined benefit obligation at the reporting date less fair valueof the plan assets. The defined benefit obligation is calculated annually by independent actuariesusing the projected unit credit method. The present value of the defined benefit obligation isdetermined by using risk-free interest rates of long-term government bonds that have terms tomaturity approximating the terms of the related pension liabilities or applying a single weightedaverage discount rate that reflects the estimated timing and amount of benefit payments.
Share-based PaymentsThe Group has equity-settled, share-based compensation plans with its employees.
PFRS 2 OptionsFor options granted after November 7, 2002 that have not vested on or before January 1, 2005, thecost of equity-settled transactions with employees is measured by reference to the fair value at thedate on which they are granted. The fair value is determined using the Black-Scholes model, furtherdetails of which are given in Note 29.
The cost of equity-settled transactions is recognized, together with a corresponding increase inequity, over the period in which the performance conditions are fulfilled, ending on the date on whichthe relevant employees become fully entitled to the award (vesting date). The cumulative expenserecognized for equity-settled transactions at each reporting date until the vesting date reflects theextent to which the vesting period has expired and the Group’s best estimate of the number of equityinstrument that will ultimately vest. The income or expense for a period represents the movement incumulative expense recognized as at the beginning and end of that period.
No expense is recognized for awards that do not ultimately vest, except for awards where vesting isconditional upon a market condition, which are treated as vesting irrespective of whether or not themarket condition is satisfied, provided that all other performance conditions are satisfied.

- 36 -
*SGVFS032855*
Where the terms of an equity-settled award are modified, as a minimum, an expense is recognized asif the terms had not been modified. In addition, an expense is recognized for any increase in thevalue of the transaction as a result of the modification, as measured at the date of modification.Where an equity-settled award is cancelled, it is treated as if it had vested on the date of cancellation,and any expense not yet recognized for the award is recognized immediately. However, if a newaward is substituted for the cancelled award, and designated as a replacement award on the datethat it is granted, the cancelled and new awards are treated as if they were a modification of theoriginal award, as described in the previous paragraph.
Pre-PFRS 2 OptionsFor options granted before November 7, 2002 that has vested before January 1, 2005, the intrinsicvalue of stock options determined as of grant date is recognized as expense over the vesting period.
The dilutive effect of outstanding options is reflected as additional share dilution in the computation ofdiluted earnings per share (see Note 28).
Employee Stock Ownership PlanThe Parent Company has an employee stock ownership plan (ESOWN) which allows the grantees topurchase the Parent Company’s shares. The Company recognizes stock compensation expenseover the holding period. The Parent Company treats its ESOWN plan as option exercisable within agiven period. These are accounted for similar to the PFRS 2 options. Dividends paid on the awardsthat have vested are deducted from equity and those paid on awards that are unvested are chargedto profit or loss. For the unsubscribed shares where the employees still have the option to subscribein the future, these are accounted for as options.
EquityWhen the shares are sold at a premium, the difference between the proceeds and the par value iscredited to “Additional paid-in capital” account. Direct costs incurred related to equity issuance arechargeable to “Additional paid-in capital” account. If additional paid-in capital is not sufficient, theexcess is charged against retained earnings. When the Group issues more than one class of stock, aseparate account is maintained for each class of stock and the number of shares issued.Subscriptions receivable pertains to the uncollected portion of the subscribed shares.
Retained earnings represent accumulated earnings of the Group less dividends declared.
Equity reserves pertain to the excess of the cost of business combinations over the net carryingamounts of the assets and liabilities of the acquired companies.
Own equity instruments which are reacquired (treasury shares) are recognized at cost and deductedfrom equity. No gain or loss is recognized in the profit or loss on the purchase, sale, issue orcancellation of the Company’s own equity instruments. Any difference between the carrying amountand the consideration, if reissued, is recognized in additional paid-in capital. Voting rights related totreasury shares are nullified for the Group and no dividends are allocated to them respectively. Whenthe shares are retired, the capital stock account is reduced by its par value and the excess of costover par value upon retirement is debited to additional paid-in capital when the shares were issuedand to retained earnings for the remaining balance.
Revenue Recognition effective January 1, 2018Revenue from Contract with CustomersThe Group primarily derives its real estate revenue from the sale of vertical and horizontal real estateprojects. Revenue from contracts with customers is recognized when control of the goods or servicesare transferred to the customer at an amount that reflects the consideration to which the Groupexpects to be entitled in exchange for those goods or services. The Group has generally concludedthat it is the principal in its revenue arrangements, except for the provisioning of water, electricity, air-conditioning and common use service area in its mall retail spaces, wherein it is acting as agent.

- 37 -
*SGVFS032855*
The disclosures of significant accounting judgements, estimates and assumptions relating to revenuefrom contracts with customers are provided in Note 3.
Real estate salesThe Group derives its real estate revenue from sale of lots, house and lot and condominium units.Revenue from the sale of these real estate projects under pre-completion stage are recognized overtime during the construction period (or percentage of completion) since based on the terms andconditions of its contract with the buyers, the Group’s performance does not create an asset with analternative use and the Group has an enforceable right to payment for performance completed todate.
In measuring the progress of its performance obligation over time, the Group uses the output method.The Group recognizes revenue on the basis of direct measurements of the value to customers of thegoods or services transferred to date, relative to the remaining goods or services promised under thecontract. Progress is measured using survey of performance completed to date. This is based on themonthly project accomplishment report prepared by the third party surveyor as approved by theconstruction manager which integrates the surveys of performance to date of the constructionactivities for both sub-contracted and those that are fulfilled by the developer itself.
Any excess of progress of work over the right to an amount of consideration that is unconditional,recognized as residential and office development receivables, under trade receivables, is included inthe “contract asset” account in the asset section of the consolidated statement of financial position.
Any excess of collections over the total of recognized trade receivables and contract assets isincluded in the “contract liabilities” account in the liabilities section of the consolidated statement offinancial position.
Cost recognitionThe Group recognizes costs relating to satisfied performance obligations as these are incurred takinginto consideration the contract fulfillment assets such as connection fees. These include costs ofland, land development costs, building costs, professional fees, depreciation, permits and licensesand capitalized borrowing costs. These costs are allocated to the saleable area, with the portionallocable to the sold area being recognized as costs of sales while the portion allocable to the unsoldarea being recognized as part of real estate inventories.
Contract costs include all direct materials and labor costs and those indirect costs related to contractperformance. Expected losses on contracts are recognized immediately when it is probable that thetotal contract costs will exceed total contract revenue. Changes in contract performance, contractconditions and estimated profitability, including those arising from contract penalty provisions, andfinal contract settlements which may result in revisions to estimated costs and gross margins arerecognized in the year in which the changes are determined.
Rental income under noncancellable and cancellable leases on investment properties is recognizedin the consolidated statement of income on a straight-line basis over the lease term and the terms ofthe lease, respectively, or based on a certain percentage of the gross revenue of the tenants, asprovided under the terms of the lease contract.
Marketing fees, management fees from administration and property management are recognizedwhen services are rendered.
Hotel and resorts revenueThe Group recognizes revenue from hotel operations at a point in time (i.e., when the related serviceand goods are rendered or served). Revenue from banquets and other special events are recognizedwhen the events take place.

- 38 -
*SGVFS032855*
Cost of hotel operationsCost of hotel operations pertains to expenses incurred in relation to sale of goods and rendering ofservices. These are recognized when a decrease in future economic benefits related to a decreasein an asset or an increase of a liability has arisen than can be measured reliably. These arerecognized when incurred and measured at the amount paid or payable.
Construction revenue and costRevenue from fixed price construction contracts are recognized overtime using the milestone-basedrevenue recognition which is in reference to the output method. The output method is determinedbased on the start and completion of a task of the contract work inclusive of uninstalled goods andmaterials delivered to the site.
Contract costs include all direct materials and labor costs and those indirect costs related to contractperformance. Expected losses on contracts are recognized immediately when it is probable that thetotal contract costs will exceed total contract revenue. Changes in contract performance, contractconditions and estimated profitability, including those arising from contract penalty provisions, andfinal contract settlements which may result in revisions to estimated costs and gross margins arerecognized in the year in which the changes are determined.
Interest income is recognized as it accrues using the effective interest method.
Dividend income is recognized when the Group’s right to receive the payment is established.
Contract BalancesReceivablesA receivable represents the Group’s right to an amount of consideration that is unconditional(i.e., only the passage of time is required before payment of the consideration is due).
Contract assetsA contract asset is the right to consideration in exchange for goods or services transferred to thecustomer. If the Group performs by transferring goods or services to a customer before the customerpays consideration or before payment is due, a contract asset is recognized for the earnedconsideration that is conditional.
Contract liabilitiesA contract liability is the obligation to transfer goods or services to a customer for which the Grouphas received consideration (or an amount of consideration is due) from the customer. If a customerpays consideration before the Group transfers goods or services to the customer, a contract liability isrecognized when the payment is made or the payment is due (whichever is earlier). Contract liabilitiesare recognized as revenue when the Group performs under the contract.
The contract liabilities also include payments received by the Group from the customers for whichrevenue recognition has not yet commenced.
Costs to obtain contractThe incremental costs of obtaining a contract with a customer are recognized as an asset if the Groupexpects to recover them. The Group has determined that commissions paid to brokers and marketingagents on the sale of pre-completed real estate units are deferred when recovery is reasonablyexpected and are charged to expense in the period in which the related revenue is recognized asearned. Commission expense is included in the “Real estate costs and expenses” account in theconsolidated statement of income.
Costs incurred prior to obtaining contract with customer are not capitalized but are expensed asincurred.

- 39 -
*SGVFS032855*
Amortization, de-recognition and impairment of capitalized costs to obtain a contractThe Group amortizes capitalized costs to obtain a contract to cost of sales over the expectedconstruction period using percentage of completion following the pattern of real estate revenuerecognition. The amortization is included within cost of sales.
A capitalized cost to obtain a contract is derecognized either when it is disposed of or when no furthereconomic benefits are expected to flow from its use or disposal.
At each reporting date, the Group determines whether there is an indication that cost to obtain acontract maybe impaired. If such indication exists, the Group makes an estimate by comparing thecarrying amount of the assets to the remaining amount of consideration that the Group expects toreceive less the costs that relate to providing services under the relevant contract. In determining theestimated amount of consideration, the Group uses the same principles as it does to determine thecontract transaction price, except that any constraints used to reduce the transaction price will beremoved for the impairment test.
Where the relevant costs or specific performance obligations are demonstrating marginal profitabilityor other indicators of impairment, judgement is required in ascertaining whether or not the futureeconomic benefits from these contracts are sufficient to recover these assets. In performing thisimpairment assessment, management is required to make an assessment of the costs to completethe contract. The ability to accurately forecast such costs involves estimates around cost savings tobe achieved over time, anticipated profitability of the contract, as well as future performance againstany contract-specific performance indicators that could trigger variable consideration, or servicecredits. Where a contract is anticipated to make a loss, these judgements are also relevant indetermining whether or not an onerous contract provision is required and how this is to be measured.
Revenue Recognition prior to January 1, 2018
Revenue and Cost RecognitionRevenue is recognized to the extent that it is probable that the economic benefits will flow to theGroup and the revenue can be reliably measured.
For real estate sales, the Group assesses whether it is probable that the economic benefits will flowto the Group when the sales prices are collectible. Collectibility of the sales price is demonstrated bythe buyer’s commitment to pay, which in turn is supported by substantial initial and continuinginvestments that give the buyer a stake in the property sufficient that the risk of loss through defaultmotivates the buyer to honor its obligation to the seller. Collectibility is also assessed by consideringfactors such as the credit standing of the buyer, age and location of the property.
Revenue from sales of completed real estate projects is accounted for using the full accrual method.In accordance with PIC Q&A 2006-01, the percentage-of-completion method is used to recognizeincome from sales of projects where the Group has material obligations under the sales contract tocomplete the project after the property is sold, the equitable interest has been transferred to thebuyer, construction is beyond preliminary stage (i.e., engineering, design work, construction contractsexecution, site clearance and preparation, excavation and the building foundation are finished), andthe costs incurred or to be incurred can be measured reliably. Under this method, revenue isrecognized as the related obligations are fulfilled, measured principally on the basis of the physicalproportion of contract work. The percentage of completion is determined by the Company’s projectengineers.
Any excess of collections over the recognized receivables are included in the “Deposits and othercurrent liabilities” account in the liabilities section of the consolidated statement of financial position.
If any of the criteria under the full accrual or percentage-of-completion method is not met, the depositmethod is applied until all the conditions for recording a sale are met. Pending recognition of sale,cash received from buyers are presented under the “Deposits and other current liabilities” account inthe liabilities section of the consolidated statement of financial position.

- 40 -
*SGVFS032855*
Cost of real estate sales is recognized consistent with the revenue recognition method applied and isdetermined with reference to the specific, including estimated costs, on the property allocated to soldarea. Cost of residential and commercial lots and units sold before the completion of thedevelopment is determined on the basis of the acquisition cost of the land plus its full developmentcosts, which include estimated costs for future development works, as determined by the Company’sin-house technical staff.
Estimated development costs include direct land development, shared development cost, buildingcost, external development cost, professional fees, post construction, contingency, miscellaneousand socialized housing. Miscellaneous costs include payments such as permits and licenses,business permits, development charges and claims from third parties which are attributable to theproject. Contingency includes fund reserved for unforeseen expenses and/ or cost adjustments.Revisions in estimated development costs brought about by increases in projected costs in excess ofthe original budgeted amounts are considered as special budget appropriations that are approved bymanagement and are made to form part of total project costs on a prospective basis and allocatedbetween costs of sales and real estate inventories.
Revenue from construction contracts included in the “Real estate” account in the consolidatedstatement of income is recognized using the percentage-of-completion method, based on thecompletion of a physical proportion of the contract work inclusive of the uninstalled goods andmaterials delivered to the site.
Contract costs include all direct materials and labor costs and those indirect costs related to contractperformance. Expected losses on contracts are recognized immediately when it is probable that thetotal contract costs will exceed total contract revenue. Changes in contract performance, contractconditions and estimated profitability, including those arising from contract penalty provisions, andfinal contract settlements which may result in revisions to estimated costs and gross margins arerecognized in the year in which the changes are determined.
Rental income under noncancellable and cancellable leases on investment properties is recognizedin the consolidated statement of income on a straight-line basis over the lease term and the terms ofthe lease, respectively, or based on a certain percentage of the gross revenue of the tenants, asprovided under the terms of the lease contract.
Marketing fees, management fees from administration and property management are recognizedwhen services are rendered.
Rooms revenue from hotel and resort operations is recognized when the services are rendered.
Revenue from banquets and other special events are recognized when the events take place.
Interest income is recognized as it accrues using the effective interest method.
Dividend income is recognized when the Group’s right to receive the payment is established.
CommissionsCommissions paid to sales or marketing agents on the sale of pre-completed real estate units aredeferred when recovery is reasonably expected and are charged to expense in the period in whichthe related revenue is recognized as earned. Accordingly, when the percentage of completionmethod is used, commissions are likewise charged to expense in the period the related revenue isrecognized. Commission expense is included in the “Real estate costs and expenses” account in theconsolidated statement of income.
Expense RecognitionExpenses are recognized in the consolidated statement of income when decrease in future economicbenefit related to a decrease in an asset or an increase in a liability has arisen that can be measuredreliably.

- 41 -
*SGVFS032855*
Expenses are recognized in the consolidated statement of income:
∂ On the basis of a direct association between the costs incurred and the earning of specific itemsof income;
∂ On the basis of systematic and rational allocation procedures when economic benefits areexpected to arise over several accounting periods and the association can only be broadly orindirectly determined; or
∂ Immediately when expenditure produces no future economic benefits or when, and to the extentthat, future economic benefits do not qualify or cease to qualify, for recognition in the statement offinancial position as an asset.
Direct operating expenses and general and administrative expenses are recognized as they areincurred.
Borrowing CostsBorrowing costs directly attributable to the acquisition or construction of an asset that necessarilytakes a substantial period of time to get ready for its intended use or sale are capitalized as part ofthe cost of the respective assets (included in “Inventories”, “Investment properties” and “Property andequipment” accounts in the consolidated statement of financial position). All other borrowing costsare expensed in the period in which they occur. Borrowing costs consist of interest and other coststhat an entity incurs in connection with the borrowing of funds.
The interest capitalized is calculated using the Group’s weighted average cost of borrowings afteradjusting for borrowings associated with specific developments. Where borrowings are associatedwith specific developments, the amounts capitalized is the gross interest incurred on thoseborrowings less any investment income arising on their temporary investment. Interest is capitalizedfrom the commencement of the development work until the date of practical completion. Thecapitalization of borrowing costs is suspended if there are prolonged periods when developmentactivity is interrupted. If the carrying amount of the asset exceeds its recoverable amount, animpairment loss is recorded.
LeasesThe determination of whether an arrangement is, or contains, a lease is based on the substance ofthe arrangement at inception date whether the fulfillment of the arrangement is dependent on the useof a specific asset or assets or the arrangement conveys a right to use the asset. A reassessment ismade after inception of the lease only if one of the following applies:
(a) There is a change in contractual terms, other than a renewal or extension of the arrangement;(b) A renewal option is exercised or extension granted, unless the term of the renewal or extension
was initially included in the lease term;(c) There is a change in the determination of whether fulfillment is dependent on a specified asset; or(d) There is substantial change to the asset.
Where a reassessment is made, lease accounting shall commence or cease from the date when thechange in circumstances gave rise to the reassessment for scenarios (a), (c), or (d) and at the date ofrenewal or extension period for scenario (b).
Group as lesseeLeases where the lessor retains substantially all the risks and benefits of ownership of the asset areclassified as operating leases. Fixed lease payments are recognized as an expense in theconsolidated statement of income on a straight-line basis while the variable rent is recognized as anexpense based on terms of the lease contract.
As disclosed under Adoption of New and Amended Accounting Standards and Interpretations, theGroup will adopt PFRS 16, Leases on January 1, 2019. The standard requires lessess to account forall leases under s single on-balance sheet model. The Group is currently assessing the impact of thisstandard.

- 42 -
*SGVFS032855*
Group as lessorLeases where the Group does not transfer substantially all the risk and benefits of ownership of theassets are classified as operating leases. Lease payments received are recognized as an income inthe consolidated statement of income on a straight-line basis over the lease term. Initial direct costsincurred in negotiating operating leases are added to the carrying amount of the leased asset andrecognized over the lease term on the same basis as the rental income. Contingent rents arerecognized as revenue in the period in which they are earned.
Current TaxCurrent tax assets and liabilities for the current and prior periods are measured at the amountexpected to be recovered from or paid to the tax authority. The tax rates and tax laws used tocompute the amount are those that are enacted or substantively enacted as at the end of thereporting period.
Deferred TaxDeferred tax is provided, using the liability method, on all temporary differences, with certainexceptions, at the reporting date between the tax bases of assets and liabilities and their carryingamounts for financial reporting purposes.
Deferred tax liabilities are recognized for all taxable temporary differences, with certain exceptions.Deferred tax assets are recognized for all deductible temporary differences, carryforward benefits ofunused tax credits from excess of minimum corporate income tax (MCIT) over the regular corporateincome tax and unused net operating loss carryover (NOLCO), to the extent that it is probable thattaxable income will be available against which the deductible temporary differences and carryforwardbenefits of unused tax credits and NOLCO can be utilized.
Deferred tax liabilities are not provided on nontaxable temporary differences associated withinvestments in domestic associates and interests in joint ventures.
The carrying amount of deferred tax assets is reviewed at each reporting date and reduced to theextent that it is no longer probable that sufficient taxable income will be available to allow all or part ofthe deferred tax assets to be utilized. Unrecognized deferred tax assets are reassessed at eachreporting date and are recognized to the extent that it has become probable that future taxableincome will allow all or part of the deferred tax assets to be recovered.
Deferred tax assets and liabilities are measured at the tax rate that is expected to apply to the periodwhen the asset is realized or the liability is settled, based on tax rates and tax laws that have beenenacted or substantively enacted at the reporting date. Movements in the deferred income tax assetsand liabilities arising from changes in tax rates are charged against or credited to income for theperiod.
Deferred tax assets and liabilities are offset, if a legally enforceable right exists to set off current taxassets against current tax liabilities and the deferred income taxes relate to the same taxable entityand the same taxation authority.
Foreign Currency TransactionsEach entity in the Group determines its own functional currency and items included in the financialstatements of each entity are measured using that functional currency. Transactions in foreigncurrencies are initially recorded using the exchange rate at the date of the transactions. Monetaryassets and liabilities denominated in foreign currencies are restated using the closing exchange rateprevailing at the reporting date. Exchange gains or losses arising from foreign exchange transactionsare credited to or charged against operations for the year.
As at reporting date, the assets and liabilities of subsidiaries whose functional currency is not thePhilippines Peso are translated into the presentation currency of the Parent Company (the PhilippinePeso) at the closing rate as at the reporting date, and the consolidated statement of income accountsare translated at monthly weighted average exchange rate. The exchange differences arising on the

- 43 -
*SGVFS032855*
translation are taken directly to a separate component of equity under “Cumulative translationadjustments” account. Upon disposal of a foreign subsidiary, the deferred cumulative amountrecognized in other comprehensive income relating to that particular foreign operation is recognizedin the consolidated statement of income.
Investments in foreign associates are translated to Philippine Peso using the closing exchange rateprevailing at reporting date. The Group’s share in the results of operations of the foreign investee istranslated using the exchange rate at the dates of the transactions or, where practicable, the rate thatapproximates the exchange rates at the dates of the transactions, such as the average rate for theperiod. Any resulting exchange difference is recognized as a separate component of equity.
Earnings Per Share (EPS)Basic EPS is computed by dividing net income for the year attributable to common equity holders ofthe Company by the weighted average number of common shares issued and outstanding during theyear adjusted for any subsequent stock dividends declared. Diluted EPS is computed by dividing netincome for the year attributable to common equity holders of the Company by the weighted averagenumber of common shares issued and outstanding during the year plus the weighted averagenumber of common shares that would be issued on conversion of all the dilutive potential commonshares into common shares. Calculation of dilutive EPS considers the potential ordinary shares ofsubsidiaries, associates and joint ventures that have dilutive effect on the basic EPS of the Company.The calculation of diluted earnings per share does not assume conversion, exercise, or other issue ofpotential common shares that would have an antidilutive effect on earnings per share.
Segment ReportingThe Group’s operating businesses are organized and managed separately according to the nature ofthe products and services provided, with each segment representing a strategic business unit thatoffers different products and serves different markets. Financial information on business segments ispresented in Note 31 of the consolidated financial statements.
ContingenciesContingent liabilities are not recognized in the consolidated financial statements. They are disclosedunless the possibility of an outflow of resources embodying economic benefits is remote. Contingentassets are not recognized in the consolidated financial statements but disclosed when an inflow ofeconomic benefits is probable.
Events after the Reporting PeriodPost year-end events that provide additional information about the Group’s position at the reportingdate (adjusting events) are reflected in the consolidated financial statements. Post year-end eventsthat are not adjusting events are disclosed in the consolidated financial statements when material.
3. Significant Accounting Judgments and Estimates
The preparation of the accompanying consolidated financial statements in conformity with PFRSsrequires management to make estimates and assumptions that affect the amounts reported in theconsolidated financial statements and accompanying notes. The estimates and assumptions used inthe accompanying consolidated financial statements are based upon management’s evaluation ofrelevant facts and circumstances as of the date of the consolidated financial statements. Actualresults could differ from such estimates.

- 44 -
*SGVFS032855*
JudgmentsIn the process of applying the Group’s accounting policies, management has made the followingjudgments, apart from those involving estimations, which have the most significant effect on theamounts recognized in the consolidated financial statements:
Existence of a contractThe Group’s primary document for a contract with a customer is a signed contract to sell. It hasdetermined, however, that in cases wherein contract to sell are not signed by both parties, thecombination of its other signed documentation such as reservation agreement, official receipts,buyers’ computation sheets and invoices, would contain all the criteria to qualify as contract with thecustomer under PFRS 15.
In addition, part of the assessment process of the Group before revenue recognition is to assess theprobability that the Group will collect the consideration to which it will be entitled in exchange for thereal estate property that will be transferred to the customer. In evaluating whether collectability of anamount of consideration is probable, an entity considers the significance of the customer’s initialpayments in relation to the total contract price. Collectability is also assessed by considering factorssuch as past history with the customer, age and pricing of the property. Management regularlyevaluates the historical cancellations and back-outs if it would still support its current threshold ofcustomers’ equity before commencing revenue recognition.
Revenue recognition method and measure of progressThe Group concluded that revenue for real estate sales is to be recognized over time because: (a)the Group’s performance does not create an asset with an alternative use and; (b) the Group has anenforceable right for performance completed to date. The promised property is specifically identifiedin the contract and the contractual restriction on the Group’s ability to direct the promised property foranother use is substantive. This is because the property promised to the customer is notinterchangeable with other properties without breaching the contract and without incurring significantcosts that otherwise would not have been incurred in relation to that contract. In addition, under thecurrent legal framework, the customer is contractually obliged to make payments to the developer upto the performance completed to date. In addition, the Group requires a certain percentage of buyer'spayments of total selling price (buyer's equity), to be collected as one of the criteria in order to initiaterevenue recognition. Reaching this level of collection is an indication of buyer’s continuingcommitment and the probability that economic benefits will flow to the Group. The Group considersthat the initial and continuing investments by the buyer of about 10% would demonstrate the buyer’scommitment to pay.
The Group has determined that output method used in measuring the progress of the performanceobligation faithfully depicts the Group’s performance in transferring control of real estate developmentto the customers.
Definition of default and credit-impaired financial assetsThe Group defines a financial instrument as in default, which is fully aligned with the definition ofcredit-impaired, when it meets one or more of the following criteria:
Quantitative criteria – for sales contracts receivable, the customer receives a notice of cancellationand does not continue the payments.
Qualitative criteriaThe customer meets unlikeliness to pay criteria, which indicates the customer is in significant financialdifficulty. These are instances where:a. The customer is experiencing financial difficulty or is insolventb. The customer is in breach of financial covenant(s)c. An active market for that financial assets has disappeared because of financial difficultiesd. Concessions have been granted by the Group, for economic or contractual reasons relating to
the customer’s financial difficultye. It is becoming probable that the customer will enter bankruptcy or other financial reorganization

- 45 -
*SGVFS032855*
The criteria above have been applied to the financial instruments held by the Group and areconsistent with the definition of default used for internal credit risk management purposes. Thedefault definition has been applied consistently to model the Probability of Default (PD), Loss GivenDefault (LGD) and Exposure at Default (EAD) throughout the Group’s expected loss calculation.
Incorporation of forward-looking informationThe Group incorporates forward-looking information into both its assessment of whether the creditrisk of an instrument has increased significantly since its initial recognition and its measurement ofECL.
To do this, the Group considers a range of relevant forward-looking macro-economic assumptions forthe determination of unbiased general industry adjustments and any related specific industryadjustments that support the calculation of ECLs. Based on the Group’s evaluation and assessmentand after taking into consideration external actual and forecast information, the Group formulates a‘base case’ view of the future direction of relevant economic variables as well as a representativerange of other possible forecast scenarios. This process involves developing two or more additionaleconomic scenarios and considering the relative probabilities of each outcome. External informationincludes economic data and forecasts published by governmental bodies, monetary authorities andselected private-sector and academic institutions.
The base case represents a most-likely outcome and is aligned with information used by the Groupfor other purposes such as strategic planning and budgeting. The other scenarios represent moreoptimistic and more pessimistic outcomes. Periodically, the Group carries out stress testing of moreextreme shocks to calibrate its determination of these other representative scenarios.
The Group has identified and documented key drivers of credit risk and credit losses of each portfolioof financial instruments and, using an analysis of historical data, has estimated relationships betweenmacro-economic variables and credit risk and credit losses.
Distinction of land between real estate inventories and investment propertiesThe Group determines whether a property will be classified as real estate inventories or investmentproperties. In making this judgment, the Group considers whether the property will be sold in thenormal operating cycle (real estate inventories). All other properties that are not yet determined to besold in the normal operating cycle are classified as investment properties.
Property acquisitions and business combinationsThe Group acquires subsidiaries that own real estate properties. At the time of acquisition, the Groupconsiders whether the acquisition represents the acquisition of a business. The Group accounts foran acquisition as a business combination where an integrated set of activities is acquired in additionto the property. More specifically, consideration is made with regard to the extent to which significantprocesses are acquired and, in particular, the extent of ancillary services provided by the Group (e.g.,maintenance, cleaning, security, bookkeeping, hotel services, etc.). The significance of any processis judged with reference to the guidance in PAS 40 on ancillary services.
When the acquisition of subsidiaries does not represent a business, it is accounted for as anacquisition of a group of assets and liabilities. The cost of the acquisition is allocated to the assetsand liabilities acquired based upon their relative fair values, and no goodwill or deferred tax isrecognized.
Consolidation of entities in which the Group holds only 50% or less than majority of voting rightsThe Group considers that it controls the following entities even though it owns 50% or less thanmajority of the voting rights.
ACCFor ACC, ALI holds 50% of the voting rights, and is also the single largest shareholder and theremaining 50% of the equity shares are held by several shareholders. The second largeststockholder of ACC holds 8.3% share while the other shareholders’ equity interest ranges from 2.1%

- 46 -
*SGVFS032855*
to 8.3%. In addition, ALI has an existing management services agreement with ACC which gives ALIthe exclusive control and decision over the relevant activities of ACC.
BG Entities (BGWest, BGNorth and BGSouth)For the BG entities, wherein ALI and the other shareholder each own 50% of the voting rights, ALIcontrols the investee through exercise of its exclusive project development and marketing agreementas well as the ability to decide on the financing, operating and strategic policies of the investees. Thisenabled ALI to conclude that it has control.
AHI, RLC, ALI-CII and LAIPALI has an existing management services agreement with AHI, RLC, ALI-CII and LAIP which givesALI the exclusive control and decision over the relevant activities of AHI, RLC, ALI-CII and LAIP.
Significant influence on BLC and OHIThe Group considers that it has significant influence over investees when it has board representationwhich allows them to participate in the financial and operating policy decisions but is not control orjoint control of those policies (see Note 11).
Service concession agreementThe Group has made a judgment that the concession agreement with DOTr qualifies under PhilippineInterpretation IFRIC 12, Service Concession Arrangements. Management has assessed that DOTrcontrols and regulates the service, determines to whom this service will be provided and controls theprice. In addition, management has also determined that the DOTr has the significant control overthe residual interest of the Terminal at the end of the term. Management has also made a judgmentthat the Terminal and commercial assets (mall facilities) are physically separable and are capable ofbeing operated independently.
Management has further assessed that said concession agreement qualifies under the FinancialAsset model as it has an unconditional contractual right to receive cash or other financial assets (i.e.the Annual Grantor Payment) for its construction, operating and maintenance services directly fromDOTr.
ContingenciesThe Group is currently involved in various legal proceedings. The estimate of the probable costs forthe resolution of these claims has been developed in consultation with outside counsel handling thedefense of these matters and is based upon an analysis of potential results. The Group currentlydoes not believe that these proceedings will have a material effect on the Group’s consolidatedfinancial statements (see Note 36).
Management’s Use of EstimatesThe key assumptions concerning the future and other key sources of estimation uncertainty at thereporting date, that have a significant risk of causing a material adjustment to the carrying amounts ofassets and liabilities within the next financial year are discussed below.
Revenue and cost recognition on real estate projectsThe Group’s revenue recognition and cost policies require management to make use of estimatesand assumptions that may affect the reported amounts of revenues and costs. The Group’s revenuefrom real estate and construction contracts is recognized based on the percentage of completion aremeasured principally on the basis of the estimated completion of a physical proportion of the contractwork. Apart from involving significant estimates in determining the quanitity of imports such asmaterials, labor and equipment needed, the assessment process for the POC is complex and theestimated project development costs requires technical determination by management’s specialists(project engineers). See Notes 21 and 23 for the related balances.
Similarly, the commission is determined using the percentage of completion.

- 47 -
*SGVFS032855*
Accounting for business combinationIn 2018, the Group, through its wholly owned subsidiary, RWIL, has acquired additional 39.4% inMCT for a total consideration of 5.98 billion which brings its ownership to 72.3%. Management hasmeasured the inventories, property and equipment and investment properties that were acquiredusing the appraisal report that was prepared by the external appraiser. These appraisals involveselecting the appropriate valuation methodology and making various assumptions such as price persqm, adjustment factors, discount rate, location, size and time element factors. The properties werevalued using the sales comparison approach. Significant assumptions used include comparableproperty prices adjusted for nature, location and condition of the land.
Provision for expected credit losses of trade receivables and contract assetsThe Group uses a provision matrix to calculate ECLs for trade receivables other than sales contractreceivables. The provision rates are based on days past due for groupings of various customersegments that have similar loss patterns.
The provision matrix is initially based on the Group’s historical observed default rates. The Group willcalibrate the matrix to adjust the historical credit loss experience with forward-looking informationsuch as inflation and GDP growth rates. At every reporting date, the historical observed default ratesare updated and changes in the forward-looking estimates are analyzed.
The Group uses vintage analysis approach to calculate ECLs for residential and office developmentreceivables and contract assets. The vintage analysis accounts for expected losses by calculatingthe cumulative loss rates of a given loan pool. It derives the probability of default from the historicaldata of a homogenous portfolio that share the same origination period. The information on thenumber of defaults during fixed time intervals of the accounts is utilized to create the PD model. Itallows the evaluation of the loan activity from its origination period until the end of the contract period.
The assessment of the correlation between historical observed default rates, forecast economicconditions (inflation and interert rates) and ECLs is a significant estimate. The amount of ECLs issensitive to changes in circumstances and of forecast economic conditions. The Group’s historicalcredit loss experience and forecast of economic conditions may also not be representative ofcustomer’s actual default in the future.
The information about the ECLs on the Group’s trade receivables and contract assets is disclosed inNotes 7 and 30.
Evaluation of net realizable value of real estate inventoriesThe Group adjusts the cost of its real estate inventories to net realizable value based on itsassessment of the recoverability of the inventories. NRV for completed real estate inventories isassessed with reference to market conditions and prices existing at the reporting date and isdetermined by the Group in the light of recent market transactions. NRV in respect of real estateinventories under construction is assessed with reference to market prices at the reporting date forsimilar completed property, less estimated costs to complete construction and less estimated costs tosell. The amount and timing of recorded expenses for any period would differ if different judgmentswere made or different estimates were utilized. See Note 8 for the related balances.
Share-based paymentsThe expected life of the options is based on the expected exercise behavior of the stock optionholders and is not necessarily indicative of the exercise patterns that may occur. The volatility isbased on the average historical price volatility which may be different from the expected volatility ofthe shares of stock of the Group. See Note 29 for the related balances.
Estimating pension liabilities and other retirement benefitsThe determination of the Group’s obligation and cost for pension and other retirement benefits isdependent on selection of certain assumptions used by actuaries in calculating such amounts. Theseinclude the determination of the discount rates, future salary increases, mortality rates and future

- 48 -
*SGVFS032855*
pension increases. Significant assumptions are disclosed in Note 27 and include among others,discount rate and salary increase rate.
In determining the appropriate discount rate, management considers the interest rates of governmentbonds that are denominated in the currency in which the benefits will be paid, with extrapolatedmaturities corresponding to the expected duration of the defined benefit obligation.
The mortality rate is based on 1994 Group Annuity Mortality Table and is modified accordingly withestimates of mortality improvements. Future salary increases and pension increases are based onexpected future inflation rates.
While the Group believes that the assumptions are reasonable and appropriate, significantdifferences in actual experience or significant changes in assumptions could materially affectretirement obligations. See Note 27 for the related balances.
Fair value of financial instrumentsWhen the fair values of financial assets and financial liabilities recorded or disclosed in theconsolidated statement of financial position cannot be derived from active markets, they aredetermined using internal valuation techniques using generally accepted market valuation models.The inputs to these models are taken from observable markets where possible, but where this is notfeasible, estimates are used in establishing fair values. These estimates may include considerationsof liquidity, volatility and correlation. Certain financial assets and liabilities were initially recorded attheir fair values by using the discounted cash flow methodology. See Note 30 for the relatedbalances.
4. Cash and Cash Equivalents
This account consists of:
2018 2017(In Thousands)
Cash on hand P=56,862 P=52,194Cash in banks 14,461,269 10,107,551Cash equivalents 9,478,439 10,838,344
P=23,996,570 P=20,998,089
Cash in banks earn interest at the respective bank deposit rates. Cash equivalents are short-term,highly liquid investments that are made for varying periods of up to three (3) months depending onthe immediate cash requirements of the Group, and earn interest at the respective short-term rates.
The annual interest rates of the cash equivalents are as follows:
2018 2017Philippine Peso 2.5% to 6.9% 1.6% to 4.8%US Dollar 1.0% to 3.5% 0.8% to 2.0%
There is no restriction on the Group’s cash balances as of December 31, 2018 and 2017.
5. Short-term Investments
Short-term investments consist of money market placements made for varying periods of more thanthree (3) months and up to one (1) year and earn interest at the respective short-term investmentrates.

- 49 -
*SGVFS032855*
The annual interest rates of the short-term investments are as follows:
2018 2017Philippine Peso 1.8% to 2.9% 2.3% to 3.7%US Dollar 2.2% to 3.3% 2.0% to 2.2%
6. Financial Assets at FVTPL
This account consists of:
2018 2017(In Thousands)
Investment in ARCH Capital Fund P=390,521 P=457,628Investment in Unit Investment Trust Funds (UITF) 85,724 82,978
P=476,245 P=540,606
Investment in ARCH Capital Fund pertains to monetary interest in a fund in which the managementtakes the view that these are held for trading and it is a portfolio of identified property funds investedand managed by professional managers.
The Group invests in money market UITF which aims to generate liquidity and stable income byinvesting in a diversified portfolio of primarily short-term fixed income instruments and with nominimum holding period requirement.
As of December 31, 2018, the Group invested in BPI Money Market Fund (MMF) with a fair value ofP=85.7 million. The BPI MMF’s Net Asset Value (NAV) was at P=8,331.5 million with duration of150 days.
As of December 31, 2017, the Group invested in BPI Money Market Fund (MMF) with a fair value ofP=83.0 million. The BPI MMF’s Net Asset Value (NAV) was at P=5,866.9 million with duration of142 days.
The following table provides the fair value hierarchy of the Group’s financial assets at FVTPL whichare measured at fair value as of December 31, 2018 and 2017:
2018
Date of Valuation
Fair value measurement using
Total
Quoted prices inactive markets
(Level 1)
Significantobservable
inputs(Level 2)
Significantunobservable
inputs(Level 3)
(In Thousands)Investment in Unit Investment Trust
Fund (UITF) December 31, 2018 P=85,724 P=− P=85,724 P=−Investment in ARCH Capital Fund September 30, 2018 390,521 − − 390,521
2017
Date of Valuation
Fair value measurement using
Total
Quoted prices inactive markets
(Level 1)
Significantobservable inputs
(Level 2)
Significantunobservable
inputs(Level 3)
(In Thousands)Investment in Unit Investment Trust
Fund (UITF) December 31, 2017 P=82,978 P=– P=82,978 P=–Investment in ARCH Capital Fund September 30, 2017 457,628 − − 457,628
The fair value of the investment in UITF is based on net asset values as of reporting dates.
The fair value of the investment in ARCH Capital Fund is determined using the discounted cash flow(DCF) method. Under the DCF method in fund fair valuation, it is estimated using assumptions

- 50 -
*SGVFS032855*
regarding the benefits and liabilities of ownership over the underlying asset’s life including an exit orterminal value. This method involves the projection of a series of cash flows on a real propertyinterest. To this projected cash flow series, a market-derived discount rate is applied to establish thepresent value of the income stream, associated with the underlying asset. The exit yield is normallyseparately determined and differs from the discount rate. Significant inputs considered were rental,growth and discount rates. The higher the rental and growth rates, the higher the fair value. Thehigher the discount rates, the lower the fair value.
Reconciliation of fair value measurement of Investment in Arch Fund is shown below:
2018 2017(In Thousands)
Balance at beginning of year P=457,628 P=435,452Redemptions (69,803) (17,250)Additions 2,696 39,426Balance at end of year P=390,521 P=457,628
Reconciliation of fair value measurement of Investment in UITF is shown below:
2018 2017(In Thousands)
Balance at beginning of year P=82,978 P=1,529,088Redemptions (1,887) (3,375,445)Additions − 1,916,216Unrealized gains included under “Other income” 4,633 13,119Balance at end of year P=85,724 P=82,978
7. Accounts and Notes Receivable
Accounts and notes receivable account consists of:
2018 2017 (In Thousands)
Trade: Residential and office development P=36,430,354 P=89,198,616 Corporate business 4,885,870 1,605,933 Shopping centers 2,686,281 2,709,587 Construction contracts 1,873,091 2,494,726 Management fees 86,047 328,614 Others 3,100,997 1,376,849Advances to other companies 19,823,781 16,185,359Accrued receivables 6,803,160 4,700,167Receivables from related parties (Note 26) 5,683,237 1,734,477Receivables from employees 1,113,206 831,860
82,486,024 121,166,188Less allowance for impairment losses 872,268 725,946
81,613,756 120,440,242Less noncurrent portion 3,367,890 44,522,898
P=78,245,866 P=75,917,344
The classes of trade receivables of the Group are as follows:∂ Residential and office development - pertain to receivables from the sale of high-end, upper
middle-income and affordable residential lots and units; economic and socialized housing unitsand sale of commercial lots; sale of office units; and leisure community developments. Uponadoption of PFRS 15, the Group records any excess of progress of work over the right to an

- 51 -
*SGVFS032855*
amount of consideration that is unconditional, recognized as residential and office developmenttrade receivables, as contract asset (see Notes 2 and 15).
∂ Corporate business - pertain to lease receivables from office and factory buildings andreceivables from sale of industrial lots
∂ Shopping centers - pertain to lease receivables from retail spaces∂ Construction contracts - pertain to receivables from third party construction projects∂ Management fees - pertain to receivables from facilities management services∂ Others - pertain to receivables from hotel operations and other support services
Sales contract receivables, under residential and office development receivables are collectible inmonthly installments over a period of one (1) to ten (10) years. These are carried at amortized costusing the effective interest rate method with annual interest rates ranging from 8.3% to 13%. Titles toreal estate properties are transferred to the buyers only once full payment has been made.
Corporate business receivables are collectible on a monthly or quarterly basis depending on theterms of the lease contracts.
Receivables from shopping centers, construction contracts and management fees are due within 30days upon billing.
Receivables from hotel operations and other support services included under other trade receivablesare normally due within 30 to 90 days upon billing.
Advances to other companies includes advances made to joint venture partners that have been madein consideration of project costs and purchases of land that are still subject to completion. Thedocumentation for these advances provides that these will be payable over a fixed term or ondemand in order to allow for repayment of the advances when closing does not occur.
Advances to other companies also includes receivables from MRT Development Corporation(MRTDC) shareholders which pertains to interest-bearing advances made by NTDCC to MRTDCequivalent to the Pre-2006 Development Rights Payment (DRP) Payables and the Residual DepotDRP which is due more than one year, in relation to the funding and repayment agreement. As ofDecember 31, 2018 and 2017, receivables from MRTDC shareholders amounted to P=436.7 millionand P=445.5 million, respectively.
On December 17, 2014, NTDCC and MRTDC shareholders executed a “funding and repaymentagreement” wherein the latter agrees to repay NTDCC, for the account of MRTDC, its respective prorata share in the Total Depot DRP Advances (the Pre-2006 DRP Payables and the Residual DepotDRP, including 15% interest rate accrued on such DRP payables).
Commencing on January 1, 2015, the MRTDC Shareholders shall effect the repayment of theirrespective pro rata share in the Total Depot DRP Payables, through a set-off against their respectiveshare in the commercial center royalties to be received from the Group.
Set off shall be effective as of the beginning of every calendar month, commencing January 30, 2015and shall result in the settlement of the portion of the Total DRP Payables to the extent of the amountof the commercial center royalties then the balance will fall due to the relevant MRTDC Shareholders.
Accrued receivables and receivables from related parties are due and demandable. Receivables fromemployees pertain to housing, car, salary and other loans granted to the Group’s employees whichare collectible through salary deduction, are interest-bearing (6.0% per annum) and payable onvarious maturity dates.

- 52 -
*SGVFS032855*
Receivables amounting to P=872.3 million and P=725.9 million as of December 31, 2018 and 2017,respectively, were impaired and fully provided for. Movements in the allowance for impairment lossesfollow:
2018
TradeResidential
and officeDevelopment
ShoppingCenters
ConstructionContracts
CorporateBusiness
ManagementFees Others
Advances toOther
Companies Total(In Thousands)
Balance at beginning of year P=13,555 P=560,817 P=26,547 P=79,209 P=3,012 P=31,860 P=10,946 P=725,946Provisions during the period
(Note 23)− 59,092 − 23,793 2,936 143,736 6,491 236,048
Translation adjustment − − − − − − − −Reversal (Note 23) − (61,198) − (16,339) − − (11,537) (89,074)Accounts written off − (652) − − − − − (652)Balance at end of year P=13,555 P=558,059 P=26,547 P=86,663 P=5,948 P=175,596 P=5,900 P=872,268Individually impaired P=− P=360,794 P=26,547 P=60,780 P=5,550 P=146,577 P=5,900 P=606,148Collectively impaired 13,555 197,265 − 25,883 398 29,019 − 266,120Total P=13,555 P=558,059 P=26,547 P=86,663 P=5,948 P=175,596 P=5,900 P=872,268
2017
TradeResidential
and officeDevelopment
ShoppingCenters
ConstructionContracts
CorporateBusiness
ManagementFees Others
Advances toOther
Companies Total(In Thousands)
Balance at beginning of year P=13,555 P=527,751 P=26,547 P=57,623 P=3,012 P=112,696 P=448,663 P=1,189,847Provisions during the period
(Note 23) − 42,274 – 47,413 − 4,031 – 93,718Translation adjustment – – – − – 142 – 142Reversal (Note 23) – (3,153) – (25,827) − (47,507) (433,374) (509,861)Accounts written off − (6,055) – − − (37,502) (4,343) (47,900)Balance at end of year P=13,555 P=560,817 P=26,547 P=79,209 P=3,012 P=31,860 P=10,946 P=725,946
Individually impaired − 403,906 26,547 79,209 2,614 27,438 10,946 550,660Collectively impaired 13,555 156,911 − − 398 4,422 − 175,286Total P=13,555 P=560,817 P=26,547 P=79,209 P=3,012 P=31,860 P=10,946 P=725,946
As of December 31, 2017, nominal amount of trade receivables from residential and officedevelopment amounting to P=99,530.8 million was recorded initially at fair value. The fair values of thereceivables were obtained by discounting future cash flows using the applicable rates of similar typesof instruments.
Movements in the unamortized discount of the Group’s receivables as of December 31, 2017 follow:
2017(In Thousands)
Balance at beginning of year P=7,448,048Additions during the year 8,294,042Accretion for the year (Note 22) (5,409,944)Balance at end of year P=10,332,146
The Group entered into agreements with BPI Asset Management and Trust Corporation in 2018 and2017 for the assignment of interest-bearing employee receivables amounting to P=11.3 million andP=69.0 million, respectively. The transactions were without recourse and did not result to any gain orloss.
The Group sold residential receivables on a without recourse basis to partner mortgage banks, whichinclude BPI Family Savings Bank, a related party, amounting to P=12,323.6 million in 2018 andP=7,711.3 million in 2017. These were sold at a discount with total proceeds of P=11,459.7 million and

- 53 -
*SGVFS032855*
P=7,320.8 million, respectively. The Group recognized loss on sale (under “Other charges”)amounting to P=863.9 million and P=390.5 million in 2018 and 2017, respectively.
8. Inventories
This account consists of:
2018 2017(In Thousands)
Real estate: Residential and commercial lots: At cost P=52,116,837 P=44,097,360 At NRV − 9,065
52,116,837 44,106,425 Residential and condominium units - at cost 49,675,074 44,321,347
Offices - at cost 2,579,700 2,417,836P=104,371,611 P=90,845,608
A summary of the movement in inventories is set out below:
2018
Residential andcommercial lots
Residential andcondominium
units Offices Total(In Thousands)
Balances at beginning of year P=44,106,425 P=44,321,347 P=2,417,836 P=90,845,608Land acquired during the year 6,694,113 73,850 466,474 7,234,437Acquisition through business combination
(Note 25)- 13,620,873 - 13,620,873
Construction/development costs incurred 23,640,668 23,287,225 6,030,005 52,957,898Borrowing costs capitalized − 167,036 − 167,036Disposals (recognized as cost of real estate
sales) (Note 23)(29,520,948) (32,044 ,896) (6,218,244) (67,784,088)
Transfers from (to) investment properties(Notes 12 and 38) 7,196,579 249,639 (116,371) 7,329,847
Balances at end of year P=52,116,837 P=49,675,074 P=2,579,700 P=104,371,611
2017 (as restated, see Note 2)
Residential andcommercial lots
Residential andcondominium
units Offices Total(In Thousands)
Balances at beginning of year P=61,518,381 P=44,550,090 P=2,496,975 P=108,565,446Land acquired during the year 360,264 − − 360,264Construction/development
costs incurred 5,491,565 32,744,518 4,675,937 42,912,020Borrowing costs capitalized − 28,754 − 28,754Disposals (recognized as cost of real estate
sales) (Note 23) (22,107,339) (33,002,015) (4,755,076) (59,864,430)Transfers from (to) investment properties
(Notes 12 and 38) (2,454,884) − − (2,454,884)Reversal of write-down 1,298,438 − − 1,298,438Balances at end of year P=44,106,425 P=44,321,347 P=2,417,836 P=90,845,608
On January 1, 2018, the Group adopted PIC Q&A 2018-11, Classification of Land by Real EstateDeveloper. Land and improvements previously presented as non-current asset includes land whichthe Board of Directors has previously approved to be developed into residential development for sale.

- 54 -
*SGVFS032855*
Before the adoption of PIC Q&A 2018-11, the classification was based on the Group’s timing to startthe development of the property. This was reclassified under inventories in the consolidatedstatement of financial position (see Note 2).
The Company reversed P=1,298.4 million allowance for impairment in inventories as of December 31,2017, due to higher fair values than their carrying amounts.
The cost of the inventories carried at NRV amounted to nil and P=14.6 million as of December 31,2018 and 2017, respectively.
The Group has no purchase commitments pertaining to its inventories as of December 31, 2018 and2017.
9. Other Current Assets
This account consists of:
2018
2017(as restated –
see Note 2)(In Thousands)
Value-added input tax P=13,763,265 P=16,966,146Prepaid expenses (Note 15) 12,574,213 9,861,763Advances to contractors (Note 2) 11,400,879 16,032,251Creditable withholding taxes 3,586,572 2,888,827Materials, parts and supplies - at cost 659,363 546,981Others 2,196,930 1,514,932
P=44,181,222 P=47,810,900
Value-added input tax is applied against value-added output tax. The remaining balance isrecoverable in future periods.
Prepaid expenses consist of prepayments for commissions, marketing fees, advertising andpromotions, taxes and licenses, rentals and insurance.
Advances to contractors represents prepayments for the construction of inventories.
Creditable withholding taxes are applied against income tax payable.
Materials, parts and supplies pertain to inventories to be used in the construction and maintenance ofprojects.
Others include deferred charges and letters of credit. Deferred charges pertain to project-relatedcosts already paid but not yet consumed in the actual construction activities.
10. Financial Assets at Fair Value through OCI and Available-for-sale Financial Assets
As of December 31, 2018, financial assets at FVTPL consists of investments in (in thousands):
Shares of stock: Quoted P=1,425,412 Unquoted 521,912
1,947,324Net unrealized loss (451,529)
P=1,495,795

- 55 -
*SGVFS032855*
As of December 31, 2017, available-for-sale financial assets consists of investments in (in thousands,as restated – Note 2):
Shares of stock: Quoted P=1,475,014 Unquoted 523,693
1,998,707Net unrealized loss (523,466)
P=1,475,241
Investments in quoted shares of stock include shares held for clubs wherein the Group does notexercise control or demonstrate significant influence.
Investments in unquoted shares of stock include unlisted shares of public utility companies which theGroup will continue to carry as part of the infrastructure that it provides to its real estate projects.
Movements in the reserves for financial assets at FVOCI and available-for-sale financial assets as ofDecember 31, 2018 and 2017 are as follows:
December 31,2018
January 1, 2018(as restated –
see Note 2)(In Thousands)
Balance at beginning of year (P=523,466) (P=515,789)Fair value changes during the year 71,938 (7,677)Balance at end of year ( 451,528) ( 523,466)
As of December 31, 2018 and 2017, reserves for financial assets at FVOCI and available-for-salefinancial assets attributable to non-controlling interests amounted to P=2.6 million and nil, respectively.
The following table provides the fair value hierarchy of the Group’s financial assets at fair valuethrough OCI and AFS financial assets which are measured at fair value as of December 31, 2018 and2017:
December 31, 2018
Date of Valuation
Fair value measurement using
Total
Quotedprices in
activemarkets(Level 1)
Significantobservable
inputs(Level 2)
Significantunobservable
inputs(Level 3)
Shares of stock: Quoted
Real estate December 31, 2018 P=554,655 P=554,655 P=– P=– Tourism and leisure December 31, 2018 182,300 182,300 – –
Retail December 31, 2018 109,079 109,079 – – Financial Asset Management December 31, 2018 65,261 65,261 – – Utilities and energy December 31, 2018 2,273 2,273 – – Telecommunication December 31, 2018 149 149 – – Unquoted Tourism and leisure Various 549,480 – – 549,480 Utilities and energy Various 19,833 – – 19,833 Real estate Various 11,888 − − 11,888 Telecommunication Various 877 – – 877
P=1,495,795 P=913,717 P=– P=582,078

- 56 -
*SGVFS032855*
December 31, 2017
Date of Valuation
Fair value measurement using
Total
Quotedprices in
activemarkets(Level 1)
Significantobservable
inputs(Level 2)
Significantunobservable
inputs(Level 3)
Shares of stock: (In Thousands) Quoted
Real estate December 31, 2017 P=755,384 P=755,384 P=– P=– Tourism and leisure December 31, 2017 99,883 99,883 – – Retail December 31, 2017 83,886 83,886 – – Financial Asset Management December 31, 2017 8,330 8,330 – – Utilities and energy December 31, 2017 3,995 3,995 – – Telecommunication December 31, 2017 70 70 – –
P=951,548 P=951,548 P=– P=–
11. Investments in Associates and Joint Ventures
This account consists of:
2018 2017(In Thousands)
Investment in stocks – costBalance at beginning of year P=21,643,179 P=20,766,514Additions 3,724,958 1,073,319Disposals (83,369) (196,654)Acquisition of control on previously held interest (5,792,066) −Balance at end of year 19,492,702 21,643,179
Accumulated equity in net earnings: Balance at beginning of year 4,462,790 4,218,803 Equity in net earnings during the year 749,924 865,566 Dividends received during the year (331,461) (621,579)
Acquisition of control on previously held interest (1,094,148) −Balance at end of year 3,787,105 4,462,790
Subtotal 23,279,807 26,105,969Equity in cumulative translation adjustment 109,945 694,854
P=23,389,752 P=26,800,823
The equity in cumulative translation adjustments represents exchange differences arising from thetranslation of financial statements of the foreign operations, whose functional currency is other thanPhilippine Peso.
Details of the Group’s investments in associates and joint ventures and the related percentages ofownership are shown below:
Percentages ofOwnership Carrying Amounts2018 2017 2018 2017
(In Thousands)Joint ventures: Emerging City Holdings, Inc. (ECHI) 50% 50% P=3,911,350 P=3,916,375 ALI-ETON Property Development Corporation 50 50 2,108,668 603,719
AKL Properties, Inc. (AKL) 50 − 1,942,622 − Berkshires Holdings, Inc. (BHI) 50 50 1,933,313 1,910,360
Cebu District Property Enterprise, Inc. (CDPEI) 35 42 1,464,432 1,476,052Alveo-Federal Land Communities, Inc. 50 50 789,078 661,201
AyaGold Retailers, Inc. (AyaGold) 50 50 160,485 95,842BYMCW, Inc. 31 31 55,500 51,000SIAL Specialty Retailers, Inc. (SIAL Specialty) 50 50 26,462 26,462
12,391,910 8,741,011

- 57 -
*SGVFS032855*
Percentages ofOwnership Carrying Amounts2018 2017 2018 2017
Associates:OCLP Holdings, Inc.(OHI) 21 21 P=8,090,085 P=7,737,712
Bonifacio Land Corp. (BLC) 10 10 1,427,555 1,395,035 Rize-Ayalaland (Kingsway) GP, Inc. (Rize-Ayalaland) 49 49 793,945 673,769 Tianjin Eco-City Ayala Land Development Co., Ltd (Tianjin Eco-
City) 40 40 470,118 464,977 Mercado General Hospital, Inc. (MGHI) 33 33 178,044 279,274 Lagoon Development Corporation 30 30 38,095 34,991
MCT, Bhd (MCT) − 33 − 7,471,123 BIB Aurora Insurance Corp. − 10 − 2,931
10,997,842 18,059,812P=23,389,752 P=26,800,823
The Company considers a subsidiary as a subsidiary with material NCI, an associate and a jointventure with material interest if its net assets exceed 5% of its total consolidated net assets of theGroup as of reporting period and considers the relevance of the nature of activities of the subsidiarycompared to other operations of the Group. There are no significant restrictions on the Company’sability to use assets and settle liabilities of the Group.
Financial information of the associates with material interest
OHI
OHI owns 99.5% interest in Ortigas & Company Limited Partnership (OCLP), an entity engaged inreal estate development and leasing businesses. In 2016, ALI acquired a 21.1% stake in OHIconsistent with its thrust of expanding its operations to other areas within and outside of Metro Manilathrough partnerships. The acquisition was made possible via the purchase of shares from existingOHI shareholders, and this was recorded under “Investments in associates and joint ventures”account for P=7,320.7 million. In 2017, the Group finalized the purchase price allocation of itsacquisition of OHI through business combination in March 2016. The final purchase price allocationresulted in gain from bargain purchase of P=148.0 million.
Below is the summarized financial information for OHI:
2018 2017(In Thousands)
Current assets P=18,303,587 P=14,885,750Noncurrent assets 16,354,455 11,733,438Current liabilities (8,827,937) (6,816,078)Noncurrent liabilities (18,713,282) (14,350,692)Equity 7,116,823 5,452,418Proportion of Group’s ownership 21.1% 21.1%Group’s share in identifiable net assets 1,501,650 1,150,460Carrying amount of the investment 8,090,085 7,737,712Fair value adjustments 6,588,435 6,587,252Negative Goodwill P=148,046 P=148,046Dividends received P=27,308 P=34,865

- 58 -
*SGVFS032855*
Net assets attributable to the equity holders of OHI amounted to P=7,116.8 million andP=5,452.4 million as of December 31, 2018 and 2017, respectively.
2018 2017(In Thousands)
Revenue P=9,278,509 P=6,738,000Cost and expenses (7,467,724) (5,283,000)Net income (continuing operations) 1,810,785 1,455,000Group’s share in net income for the year 382,076 305,550Total comprehensive income 1,810,785 1,455,000Group’s share in total comprehensive income for the
year 382,076 305,550
MCT
On April 6, 2015, the Group, through its wholly-owned subsidiary, RWIL, has acquired 9.16% of theshares of MCT Berhad (MCT) (formerly Malaysian company GW Plastics Holdings Bhd.), through aprivate placement for a total amount of US$43.0 million or P=1,900.0 million. MCT, first established in1999 as a construction company, is a property development company specializing in mixed-useprojects that include retail, office, hotel, and mid- to affordable residential. MCT is able to deliverprojects at lower costs by adhering to a modular construction technique and by being an integratedbuilder with an in-house design team, inhouse trading company, direct execution of specialist worksand its own pre-cast and ready-mixed concrete plants.
In May 2015, the Group entered into call option agreements with the two founders and majorityshareholders of MCT, Barry Goh Ming Choon and Tong Seech Wi, that will give the Group theopportunity to increase its shareholdings in MCT up to a maximum of 32.95%. Then, on October 15,2015, the Group exercised its option to acquire additional shares of MCT for a total cost ofUS$92.0 million to bring its total shareholding from 9.16% to 32.95%. The increase in stake willprovide the Company with the opportunity to establish a stronger foothold in the Real Estate sector inMalaysia.
On January 2, 2018, the Group through RWIL signed a share purchase agreement to acquire anadditional 17.24% share in MCT Bhd (MCT) from Barry Goh Ming Choon for a toal cost of RM202.5million which brought ALI’s shareholding in MCT from 32.95% to 50.19%. Subsequently, RWILconducted a mandatory take-over offer (MO) from the period January 26 to February 19, 2018 inaccordance with the laws of Malaysia. Acceptances for 295,277,782 shares were received from theMO equivalent to 22.12% that increased ALI’s ownership stake to 72.13% as of February 19, 2018.
This eventually increased ALI’s ownership stake in MCT from 50.19% to 72.31% as ofFebruary 19, 2018 (see Note 25).
Set out below is the summarized financial information for MCT in 2017 before it was consolidated toALI (in thousands):
Current assets P=9,465,034Noncurrent assets 8,752,953Current liabilities (5,690,285)Noncurrent liabilities (2,634,264)Equity 9,893,438Proportion of Group’s ownership 32.95%Group’s share in identifiable net assets 3,259,888Carrying amount of the investment 7,471,123Fair value adjustments 3,345,445Dividends received P=–

- 59 -
*SGVFS032855*
Net assets attributable to the equity holders of MCT amounted to P=9,893.4 million as ofDecember 31, 2017.
Revenue 5,989,162Cost and expenses (5,288,527)Net income (continuing operations) 700,635Group’s share in net income for the year 230,859Total comprehensive income 700,635Group’s share in total comprehensive income for the year 230,859
BLC
The Group has a 10% interest in BLC, which is involved in the purchase, subscription or otherwisedisposal of real and personal properties. BLC is a private company incorporated on October 20, 1994and there is no quoted market price available for its shares. Its registered office and principal place ofbusiness is Taguig City, Philippines.
Set out below is the summarized financial information for BLC:
2018 2017(In Thousands)
Current assets P=5,036,409 P=8,253,289Noncurrent assets 37,539,401 37,357,443Current liabilities (3,798,971) (4,606,258)Noncurrent liabilities (6,558,980) (7,332,631)Equity 32,217,859 33,671,843Less: noncontrolling interest 14,491,952 15,324,979Equity attributable to Parent Company 17,725,907 18,346,864Proportion of Group’s ownership 10.1% 10.1%Group’s share in identifiable net assets 1,790,317 1,853,033Carrying amount of the investment 1,427,555 1,395,035Negative goodwill (P=362,762) (P=457,998)Dividends received P=70,731 P=50,522
Net assets attributable to the equity holders of BLC amounted to P=17,725.9 million andP=18,346.9 million as of December 31, 2018 and 2017, respectively.
2018 2017(In Thousands)
Revenue P=4,925,102 P=6,124,561Cost and expenses (2,906,515) (4,233,400)Net income (continuing operations) 2,018,587 1,891,161Net income attributable to minority interest (944,922) (1,119,547)Net income attributable to parent 1,073,665 771,614Group’s share in net income for the year 108,440 77,933Total comprehensive income attributable to parent 1,073,665 771,613Group’s share in total comprehensive income for the
year 108,440 77,933
Aggregate financial information on associates with immaterial interest (Rize-Ayalaland, Tianjin Eco-City, LDC, MGHI and others) is as follows:
2018 2017(In Thousands)
Carrying amount P=1,480,202 P=1,455,942Share in net income (loss) from continuing operations 5,935 (75,995)Share in total comprehensive income (loss) 5,935 (75,995)

- 60 -
*SGVFS032855*
Financial information of joint venture with material interest
ECHI 2018 2017(In Thousands)
Current assets P=10,420,615 P=13,980,028Noncurrent assets 32,372,361 30,806,231Current liabilities (3,285,205) (4,313,401)Noncurrent liabilities (7,479,522) (7,396,186)Equity 32,028,249 33,076,672Less: minority interest 22,464,296 23,833,518Equity 9,563,953 9,243,154Proportion of Group’s ownership 50% 50%Group’s share in identifiable net assets 4,781,976 4,621,577Carrying amount of the investment 3,911,350 3,916,375Fair value adjustment P=870,626 P=705,202Dividends received P=200,000 P=350,000
2018 2017(In Thousands)
Revenue P= 5,315,083 P=6,167,341Cost and expenses (3,112,379) (3,806,627)Net income (continuing operations) 2,202,704 2,360,714Net income attributable to minority interest (1,405,934) (1,730,425)Net income attributable to parent 796,770 630,289Group’s share in net income for the year 398,385 315,145Total comprehensive income attributable to parent 798,535 629,819Group’s share in total comprehensive income for the
year 399,267 314,910
Net assets attributable to the equity holders of ECHI amounted to P=9,564.0 million andP=9,243.2 million as of December 31, 2018 and 2017, respectively.
Aggregate financial information on joint ventures with immaterial interest (BHI, CDPEI, Alveo-Federal,ALI-Eton, SIAL CVS, SIAL Specialty, AyaGold and BYMCW, Inc.) is as follows:
2018 2017(In Thousands)
Carrying amount P=8,480,560 P=4,824,636Share in net loss from continuing operations 82,075 (18,985)Share in total comprehensive loss 82,075 (18,985)
The following are the significant transactions affecting the Group’s investments in associates and jointventures:
Investments in ECHI, BHI and BLCThe Parent Company’s 5.3% direct investment in BLC and 4.8% through Regent Time are accountedfor using the equity method because the Parent Company has significant influence over BLC.
On April 17, 2003, the following transactions were consummated pursuant to the terms andconditions of the Assignment Agreement (Agreement), dated February 8, 2003, among the ParentCompany, Evergreen Holdings, Inc. (EHI), Greenfield Development Corporation and Larouge, B.V.(Larouge), as amended, and the Agreement, dated November 23, 2002, among the Parent Company,EHI and Neo Oracle Holdings, Inc. [formerly Metro Pacific Corporation (MPC)] as amended:
(a) The assignment to the Parent Company and EHI of the rights and obligations of Larouge underthe loan agreement between Larouge and MPC, pursuant to which, Larouge extended MPC aloan in the principal amount of US$90.0 million, together with all the rights, title and interests of

- 61 -
*SGVFS032855*
Larouge in the pledge constituted on 50.4% of the outstanding shares in BLC. The considerationpaid by the Parent Company and EHI for such assignment was approximately US$90.0 million,subject in part to foreign exchange adjustment.
(b) The assignment to the Parent Company and EHI, acting in this instance through the joint venturecorporation, Columbus Holdings, Inc. (Columbus), of the controlling interest in BLC representing50.4% of BLC’s outstanding capital stock. This assignment was effected by MPC under a dacionen pago arrangement, and included an assignment of payables of BLC in the principal amount ofP=655.0 million together with its underlying security in the form of shares in Fort BonifacioDevelopment Corporation (FBDC) representing 5.6% of its outstanding capital stock.
The Agreement, as amended, also provides for the constitution of a pledge over 5.0% of BLC’sunencumbered shares as security for contingent liabilities and breach of representation andwarranties. The pledge lien over the 5.0% BLC shares shall continue to subsist until the thirdanniversary of the closing date.
The Parent Company and EHI jointly hold the 50.4% equity interest in BLC through ECHI and BHI.The Parent Company and EHI assigned the notes receivable from MPC to ECHI and BHI, whichacquired the shares of stock of Columbus. Columbus directly owns the 50.4% interest in BLC. BLCowns 55.0% interest in FBDC, the primary developer of certain areas in Fort Bonifacio Global City forresidential, commercial and business development. Columbus accounted for the acquisition of the50.4% interest in BLC using the purchase method.
Subsequent to this, the Parent Company and EHI acquired additional shares of BLC through acombination of direct acquisition and through its associates at varying dates:
On July 31, 2008, the Group acquired, through the Company, Regent Time and Columbus, additional4,360,178 shares of BLC from FBDC amounting to P=689.0 million, equivalent to 7.7% ownership inBLC. In January and October 2009, a total of 2,295,207 BLC shares were acquired fromDevelopment Bank of the Philippines and MPC, pertaining to the pledged shares, through Columbusamounting to P=362.6 million. This resulted in an increase in Group’s effective interest in BLC to45.1% as of December 31, 2009.
In 2011, BLC redeemed its 3,485,050 preferred shares with an aggregate redemption price ofP=500.0 million.
Investment in Rize-AyalalandRize-Ayalaland (Kingsway) GP, Inc. was incorporated on January 25, 2013 under the laws of BritishColumbia, Canada. The Company's effective ownership is 49.0% through its Vancouver-basedsubsidiary, AyalaLand Real Estate Investments, Inc.
Investment in Cebu District Property Enterprise, Inc.Cebu District Property Enterprise, Inc. (CDPEI) was incorporated on February 20, 2014 and is a50:50 joint venture between the Company and Aboitiz Land, Inc. CDPEI’s main purpose is to createa mixed-use commercial and residential district with the 15.4 hectare property in Subangdaku,Mandaue. On April 11, 2014, ALI’s 50% equity was further broken down to 35% ALI, 10% CHI and5% CPVDC.
Investment in Alveo-Federal Land Communities, Inc.Alveo Land Corp. signed a Joint Venture Agreement (JVA) with Federal Land, Inc. last April 29, 2015for equal ownership over AFLCI. The JV is for the development of Treveio Nuvali located in Lagunanear Nuvali.
Investment in ALI-ETON Property Development CorporationALI-ETON Property Development Corporation was incorporated on March 13, 2016. The company isa joint venture between Ayala Land, Inc. LT Group, Inc.. The ALI and LT Group, Inc. entered into anagreement on January 21, 2016 to jointly develop a project along the C5 corridor. The project isenvisioned to be a township development that spans portions of Pasig City and Quezon City.

- 62 -
*SGVFS032855*
Investment in BYMCW, Inc.On August 2, 2017, Bouygues Travaux Publics Philippines Inc. (BYTPPI) incorporated BYMCW Inc.(BYMCW) to engage in general building and contracting business. BYMCW’s registered officeaddress is at 2nd floor, Welfare Building, LRTA Compound, Aurora Blvd., Barangay 189, Pasay City,Metro Manila.
On December 6, 2017, MDC acquired 30% ownership over BYMCW after buying fifty one (51) millionshares held by BYTPPI.
Investment in AyaGold Retailers, Inc.AyaGold Retailers, Inc., a joint venture between Entenso Equities Incorporated (EEI, a wholly ownedsubsidiary of Puregold Price Club, Inc.) and ALI Capital Corp. (a wholly owned subsidiary of theCompany and the holding company for its retail-related initiatives), was incorporated inOctober 2, 2013. It is organized primarily to finance, build and operate mid-market supermarkets forsome of Company’s new integrated and mixed-use developments. The mid-market supermarkets willbe carried under a new brand to be jointly developed by both ALI Capital Corp. and EEI. Thepartnership with EEI will enable the Company to support its mixed-use developments and, at thesame time, grow its recurring income portfolio.
Investment in SIAL SpecialtySIAL Specialty was incorporated on September 27, 2012 as a joint venture between ALI Capital Corp.and Store Specialist, Inc. (SSI). Varejo is a wholly owned subsidiary of the Company. SSI is one ofthe largest specialty retail companies in the Philippines with the exclusive distribution rights to avariety of brands from around the world. On March 1, 2016, the SIAL entered into a Deed of AbsoluteSale with Metro Retail Stores Group, Inc. (Purchaser) to sell assets in its two department stores for atotal purchase price of P=498.81 million.
The partnership, which combines the Company’s expertise in developing mixed-use developmentsand SSI’s proven track record in retail, is aimed at pursuing retail solutions to address the growingand changing lifestyle needs of the market.
SIAL Specialty was organized primarily for the investment and operation of mid-market departmentstores and to pursue other investment opportunities in the Philippine retail sector.
Investment in SIAL CVSSIAL CVS is an equally owned joint venture between ALI Capital Corp., the Company’s wholly ownedsubsidiary and SII, SSI’s wholly owned subsidiary.
SIAL CVS shall be the vehicle for the investment in the operation of convenience stores in thePhilippines. SIAL CVS capitalizes on the Company’s expertise in mixed-use developments and SSI’sexperience in the Philippine retail market. The Parties agreed to incorporate a special purposevehicle that shall form a partnership with FamilyMart Co. Ltd. and Itochu Corporation for the operationof FamilyMart convenience stores in the Philippines.
SIAL CVS Retailers, Inc., FamilyMart Co., Ltd., and ITOCHU Corporation have concluded thetransaction to sell 100% of the outstanding shares of Philippine FamilyMart CVS, Inc. (PFM) to P-H-O-E-N-I-X Petroleum Philippines, Inc. (PNX), further to a Memorandum of Agreement (MOA) enteredinto by the parties last October 30, 2017.
PFM is the official Area Franchisee of the Family Mart brand of convenience stores in the Philippines,with a current network of 67 company-owned and franchised stores all over the country. PNX is theleading independent and fastest-growing oil company in the Philippines, with a wide network of retailstations and commercial and industrial clients all over the Philippines.
The transaction was approved by the Philippine Competition Commission (PCC) last January 3,2018.

- 63 -
*SGVFS032855*
Investment in MGHIIn July 2013, the Company entered into an agreement with the Mercado Family to acquireWhiteknight Holdings, Inc. (WHI), a 33% equity stockholder of MGHI. Its acquisition of WHI will allowthe Company to build a strategic partnership with the Mercado Group and support MGHI’s futuregrowth. This partnership also enhances the potential of Ayala Land’s development of mixed-usecommunities by offering the critical component of medical services to complement the residential,shopping centers, office and hotel developments therein.
Investment in AKLAKL Properties, Inc. is a 50:50 joint venture between Ayala Land, Inc. and Royal Asia Land, Inc., andis organized primarily for future mixed-use development in South Luzon area.
12. Investment Properties
The rollforward analysis of this account follows:
2018
Land BuildingsConstruction
in Progress Total(In Thousands)
CostBalance at beginning of year P=84,893,792 P=93,046,926 P=49,660,702 P=227,601,420Additions 6,336,730 16,789,386 13,725,237 36,851,353Acquisition through business
combination (Note 25) 1,223,498 4,489,137 − 5,712,635Disposals (1,642,908) (83,917) − (1,726,825)Foreign currency exchange
differences 209,538 78,540 − 288,078Transfers (Notes 8,13 and 38) (7,497,112) 3,233,277 (8,026,620) (12,290,455)Balance at end of year 83,523,538 117,553,349 55,359,319 256,436,206
Accumulated DepreciationBalance at beginning of year – 27,258,780 – 27,258,780Depreciation (Note 23) – 4,052,276 – 4,052,276Disposals − (3,892) (3,892)Foreign currency exchange
differences − 20,307 – 20,307Balance at end of year – 31,327,471 – 31,327,471Accumulated impairment lossesBalance at beginning and end ofyear 102,825 − − 102,825
Net Book Value P=83,420,713 P=86,225,878 P=55,359,319 P=225,005,910
2017 (as restated, see Note 2)
Land BuildingsConstructionin Progress Total
(In Thousands)CostBalance at beginning of year P=83,564,863 P=84,412,874 P= 32,813,911 P=200,791,648Additions 2,450,973 7,039,883 20,502,732 29,993,588Disposals (3,192,672) (5,019) – (3,197,691)Transfers (Notes 8,13 and 38) 2,070,628 1,599,240 (3,655,941) 13,927Retirement – (52) – (52)Balance at end of year 84,893,792 93,046,926 49,660,702 227,601,420
(Forward)

- 64 -
*SGVFS032855*
Land BuildingsConstructionin Progress Total
Accumulated DepreciationBalance at beginning of year P=– P=23,778,254 P=– P=23,778,254Depreciation (Note 23) – 3,482,978 – 3,482,978Disposals – (4,905) – (4,905)Transfers – 2,453 – 2,453Balance at end of year – 27,258,780 – 27,258,780Accumulated impairment lossesBalance at beginning of year 151,825 − – 151,825Reversal (49,000) − – (49,000)Balance at end of year 102,825 − – 102,825Net Book Value P=84,790,967 P=65,788,146 P=49,660,702 P=200,239,815
On January 1, 2018, the Group adopted PIC Q&A 2018-11, Classification of Land by Real EstateDeveloper. Land and improvements previously presented as non-current asset includes land whichthe Board of Directors has previously approved to be developed into residential development for sale.Before the adoption of PIC Q&A 2018-11, the classification was based on the Group’s timing to startthe development of the property. Land with undetermined future use was reclassified to InvestmentProperties (see Note 2).
Certain parcels of land are leased to several individuals and corporations. Some of the leasecontracts provide, among others, that within a certain period from the expiration of the contracts, thelessee will have to demolish and remove any and all improvements (such as buildings) introduced orbuilt within the leased properties. Otherwise, the lessor will cause the demolition and removal thereofand charge the cost to the lessee unless the lessor occupies and appropriates the same for its useand benefit.
Construction in progress pertain to buildings under construction to be leased as retail and officespaces upon completion.
The aggregate fair value of the Group’s investment properties amounted to P=328,057.2 million andP=324,590.7 million as of December 31, 2018 and 2017, respectively.
The fair values of the investment properties were determined by independent professionally qualifiedappraisers.
The following table provides the fair value hierarchy of the Group’s investment properties as ofDecember 31, 2018 and 2017:
2018
Date of Valuation
Fair value measurement using
Total
Quoted pricesin activemarkets(Level 1)
Significantobservable
inputs(Level 2)
Significantunobservable
inputs(Level 3)
(In Thousands)Land properties Various P=152,670,030 P=– P=– P=152,670,030Retail properties Various 73,034,911 – – 73,034,911Office properties Various 101,208,761 – – 101,208,761Hospital properties Various 1,143,511 – – 1,143,511

- 65 -
*SGVFS032855*
2017
Date of Valuation
Fair value measurement using
Total
Quoted pricesin activemarkets
(Level 1)
Significantobservable
inputs(Level 2)
Significantunobservable
inputs(Level 3)
(In Thousands)Land properties Various P=173,843,898 P=– P=– P=173,843,898Retail properties Various 90,209,964 – – 90,209,964Office properties Various 59,396,908 – – 59,396,908Hospital properties Various 1,139,911 – – 1,139,911
The values of the land and buildings were arrived at using the Market Data Approach. Market DataApproach provides an indication of value by comparing the subject asset with identical or similarassets for which price information is available. This approach was used for the land andcondominium unit as it is commonly used in the property market since inputs and data for thisapproach are available. For Market Data Approach, the higher the price per sqm., the higher the fairvalue.
The significant unobservable inputs to valuation of investment properties ranges from P=5,100-P=250,000 per sqm.
Interest capitalized amounted to P=19.0 million, P=17.7 million and P=129.5 million in 2018, 2017 and2016, respectively. The capitalization rates are 2.00-6.85%, 2.50-4.75% and 3.20-4.75% in 2018,2017 and 2016, respectively (see Note 17).
Consolidated rental income from investment properties amounted to P=35,811.4 million,P=28,091.4 million and P=21,319.0 million in 2018, 2017 and 2016, respectively (see Note 21).Consolidated direct operating expenses arising from the investment properties in 2018, 2017 and2016 amounted to P=7,457.9 million, P=5,032.9 million and P=4,436.9 million, respectively (see Note 23).
Depreciation and amortization expense pertaining to investment properties amounted toP=4,052.3 million, P=3,483.0 million and P=2,834.6 million in 2018, 2017 and 2016, respectively(see Note 23).
13. Property and Equipment
The rollforward analysis of this account as of December 31 follow:
2018Land,
Buildings andImprovements
Machinery andConstruction
Equipment
Furniture,Fixtures and
EquipmentTransportation
Equipment
HotelProperty and
Equipment Total(In Thousands)
CostBalance at beginning of year P=7,746,147 P=9,618,096 P=6,060,857 P=3,099,103 P=14,093,721 P=40,617,924Additions 1,792,136 261,850 334,048 58,105 396,647 2,842,786Additions through business
combination (Note 25) 3,078,371 1,356,321 128,848 35,883 − 4,599,423Disposals (2,023,545) (1,268,959) (719,701) (176,768) (361,870) (4,550,843)Foreign currency exchange
difference 218,548 631,664 123,806 74,214 − 1,048,232Transfers (Notes 12 and 38) 4,477,605 47 1,111 − 421,846 4,900,609Balance at end of year 15,289,262 10,599,019 5,928,969 3,090,537 14,550,344 49,458,131Accumulated Depreciation
and AmortizationBalance at beginning of year 2,642,575 3,158,297 3,185,248 719,029 2,388,687 12,093,836Depreciation and amortization
(Note 23) 526,797 360,317 272,763 247,094 475,648 1,882,619Disposals (36,420) (234,284) (96,021) (142,917) (343,028) (852,670)Foreign currency exchange
difference 93,903 292,142 123,806 75,295 − 585,146Balance at end of year 3,226,855 3,576,472 3,485,796 898,501 2,521,307 13,708,931Net Book Value P=12,062,407 P=7,022,547 P=2,443,173 P=2,192,036 P=12,029,037 P=35,749,200

- 66 -
*SGVFS032855*
2017Land,
Buildings andImprovements
Machinery andConstruction
Equipment
Furniture,Fixtures and
EquipmentTransportation
Equipment
HotelProperty and
Equipment Total(In Thousands)
CostBalance at beginning of year P=7,442,660 P=11,561,696 P=5,748,890 P=2,545,639 P=12,017,826 P=39,316,711Additions 475,800 256,480 388,004 679,225 526,607 2,326,116Disposals (365,271) (2,233,714) (62,259) (125,761) − (2,787,005)Transfers (Notes 12 and 38) 192,958 33,634 (13,778) − 1,549,288 1,762,102Balance at end of year 7,746,147 9,618,096 6,060,857 3,099,103 14,093,721 40,617,924Accumulated Depreciation and
AmortizationBalance at beginning of year 2,222,943 4,960,711 2,943,931 720,053 1,964,687 12,812,325Depreciation and amortization
(Note 23) 509,961 185,721 293,718 104,178 424,000 1,517,578Disposals (88,574) (1,988,135) (51,703) (105,202) − (2,233,614)Transfers (1,755) − (698) − − (2,453)Balance at end of year 2,642,575 3,158,297 3,185,248 719,029 2,388,687 12,093,836Net Book Value P=5,103,572 P=6,459,799 P=2,875,609 P=2,380,074 P=11,705,034 P=28,524,088
The depreciation and amortization of property and equipment (included under various consolidatedstatements of income accounts) amounted to P=1,882.6 million, P=1,517.6 million and P=2,954.8 millionin 2018, 2017 and 2016, respectively. No interest was capitalized in 2018 and 2017. (see Note 17).
14. Other Noncurrent Assets
This account consists of:
2018
2017(as restated –
see Note 2)(In Thousands)
Advances to contractors (Note 2) P=9,355,940 P=6,361,904Prepaid expenses (Note 15) 9,026,562 6,634,987Leasehold rights 4,079,828 4,463,862Deferred input VAT 3,025,078 2,403,553Deposits – others 2,134,677 813,255Net pension assets (Note 27) 62,065 76,522Development rights 49,157 29,395Others 770,690 145,697
P=28,503,997 P=20,929,175
Advances to contractors represents prepayments for the construction of investment properties andproperty and equipment.
Prepaid expenses consist of project costs incurred for unlaunched projects of the Group, advancerental payments, noncurrent prepaid management fees, commissions and advertising and promotions(see Note 15).
Leasehold rights consist of the following:∂ Through the acquisition of POPI, ALI acquired leasehold rights arising from their lease agreement
with Philippine National Railways (PNR) (see Notes 25 and 33).∂ TKPI’s leasehold rights pertains to the right to use the property in Apulit Island located in Taytay,
Palawan expiring on December 31, 2029.∂ NTDCC’s leasehold rigts refer to development rights on an 8.3-hectare portion of the MRT
Development Corporation, which is located on the North Triangle property, and enabled theGroup to develop and construct a commercial center.

- 67 -
*SGVFS032855*
The movements during the year follow:
2018 2017(In Thousands)
Balance at beginning of year P=4,463,862 P=4,643,097Amortization (384,034) (179,235)Balance at end of year P=4,079,828 P=4,463,862
Deferred input VAT pertains to unamortized VAT portion from purchases of capital goods
Deposits - others pertain to various utility deposits and security deposits for leases.
Development rights pertain to the saleable and non-saleable development rights acquired by theparent company. The non-saleable portion is allocated to the gross floor area of a structure in aparticular lot that can be developed in the future. The development rights are capitalized as additionalcost of the structure once the development commences.
Others pertain to prepayments for expenses that is amortized for more than one year.
15. Contract Balances and Cost to Obtain a Contract
Contract assets and liabilities
The account consists of:
2018(In Thousands)
Contract assets P=83,910,058Contract liabilities (30,504,916)
Contract assets are initially recognized for revenue earned from real estate sales as receipt ofconsideration is conditional on successful completion of installation. Upon completion of performanceobligation and acceptance by the customer, the amounts recognized as contract assets arereclassified to trade residential and office development receivables.
Contract liabilities consist of collections from real estate customers which have not reached the 10%threshold to qualify for revenue recognition and excess of collections over the recognized receivablesand contract assets based on percentage of completion.
As of December 31, 2018, nominal amount of contract assets from residential and office developmentamounting to P=100,983.3 million was recorded initially at fair value. The fair values of the contractassets were obtained by discounting future cash flows using the applicable rates of similar types ofinstruments.
Movements in the unamortized discount of the Group’s contract assets as of December 31, 2018follow:
2018(In Thousands)
Balance at beginning of year P=10,332,147Additions during the year 13,783,125Accretion for the year (Note 21) (7,042,078)Balance at end of year P=17,073,194

- 68 -
*SGVFS032855*
The amount of revenue recognized from amounts included in contract liabilities at the beginning ofthe year amounted to P=11,479.4 million.
Cost to Obtain a ContractThe balances below pertains to the cost to obtain contracts included in the other current andnoncurrent assets (see Notes 9 and 14):
2018(In Thousands)
Balance at the beginning of year P=2,258,052Additions 5,713,387Amortization (Note 22) (5,048,405)Balance at the end of year P=2,923,034
In line with the Group's accounting policy, as set out in Note 2, if a contract or specific performanceobligation exhibited marginal profitability or other indicators of impairment, judgement was applied toascertain whether or not the future economic benefits from these contracts were sufficient to recoverthese assets. In performing this impairment assessment, management is required to make anassessment of the costs to complete the contract. The ability to accurately forecast such costsinvolves estimates around cost savings to be achieved over time, anticipated profitability of thecontract, as well as future performance against any contract-specific key performance indicators thatcould trigger variable consideration, or service credits.
16. Accounts and Other Payables
This account consists of:2018 2017(In Thousands)
Accounts payable P=101,055,160 P=76,977,468Taxes payable 20,101,227 19,336,133Accrued project costs 18,072,293 15,946,912Accrued salaries and employee benefits 6,025,804 5,485,382Accrued professional and management fees 4,666,896 3,993,579Retentions payable 4,372,925 334,796Accrued repairs and maintenance 2,667,501 1,764,627Liability for purchased land 2,544,623 3,710,462Accrued utilities 2,436,233 2,298,695Interest payable 1,887,310 1,907,503Accrued advertising and promotions 1,266,336 1,075,653Accrued rentals 870,599 1,566,953Payable to related parties (Note 26) 702,189 640,147Dividends payable 664,546 360,130DRP obligation 236,362 230,103Other accrued expenses 4,429,418 2,055,316
P=171,999,422 P=137,683,859
Accounts payable and accrued expenses are noninterest-bearing and are normally settled on30- to 60-day terms, except for accrued project costs.
Taxes payable pertains to the Group’s output VAT, expanded withholding tax, capital gains tax andfringe benefit tax.
Accrued project cost are expenses related to materials, overhead and subcontractor cost not yetbilled by the contractor.

- 69 -
*SGVFS032855*
Retentions payable pertains to the amount withheld by the Group on contractor’s billings to bereleased after the guarantee period, usually one (1) year after the completion of the project or upondemand. The retention serves as a security from the contractor should there be defects in the project.
Liability for purchased land pertains to the current portion of unpaid unsubdivided land acquiredpayable during the year. These are normally payable in quarterly or annual installment payments orupon demand.
DRP obligation pertains to the current portion of the liability arising from the assignment agreementbetween the Group and MRTDC of the latter’s development rights (see Note 36). In consideration ofthe lease, the Group will be charged an annual rent related to the original DRP obligation on theMRTDC and 5% of the rental income from the Group’s commercial center business. Of the 5%variable amount due, 2.42% shall be directly paid by the Group to the minority shareholders ofMonumento Rail Transit Corporation, 28.47% shall be paid directly to Metro Global HoldingsCorporation and the remaining 69.11% shall be applied against receivables (see Note 7).
Other accrued expenses consist mainly of accruals from commissions, royalty, transportation andtravel, janitorial and security, postal and communication and other expenses.
17. Short-term and Long-term Debts
The short-term debt amounted to P=14,386.7 million and P=17,644.4 million as of December 31, 2018and 2017, respectively, represents both peso and foreign currency-denominated bank loans. Peso-denominated short-term loans had a weighted average cost of 5.00% and 2.64% per annum in 2018and 2017.
In compliance with BSP rules on directors, officers, stockholders and related interests, certain short-term and long-term debt with a carrying value of P=14,170.3 million and P=17,697.5 million as ofDecember 31, 2018 and 2017 are secured by a real estate mortgages dated September 2, 2014 andMarch 14, 2016 covering both land and building of the Greenbelt Mall. Net book value of the propertyamounted to P=2,618.9 million and P=3,121.3 million as of December 31, 2018 and 2017, respectively,which is accounted as part of the “Investment properties” account.
Long-term debt consists of:
2018 2017(In Thousands)
Parent Company: Bonds:
Due 2019 P=12,332,530 P=12,340,950Due 2020 4,000,000 4,000,000Due 2022 12,650,000 12,650,000Due 2023 15,000,000 7,000,000Due 2024 15,000,000 15,000,000Due 2025 15,000,000 15,000,000Due 2026 8,000,000 8,000,000Due 2027 7,000,000 7,000,000Due 2028 10,000,000 −Due 2033 2,000,000 2,000,000
Short-dated notes 7,100,000 7,100,000 Fixed rate corporate notes (FXCNs) 5,770,000 9,064,000 Php - denominated long term loan 29,465,677 24,873,145 US Dollar - denominated long term loan − 1,516,624
143,318,207 125,544,719
(Forward)

- 70 -
*SGVFS032855*
2018 2017(In Thousands)
Subsidiaries:Bonds P=5,000,000 P=5,000,000Bank loans - Philippine Peso 20,350,585 23,578,229Bank loans - Malaysian Ringgit 3,385,586 −Fixed rate corporate notes 1,387,500 3,275,000
30,123,671 31,853,229173,441,878 157,397,948
Less unamortized transaction costs 729,756 656,542172,712,122 156,741,406
Less current portion 23,265,173 6,572,775P=149,446,949 P=150,168,631
ALI Parent
Below is the summary of the outstanding Peso bonds issued by the Parent Company:
YearIssued
Term(Years)
Interestrate
PrincipalAmount
(In thousands)
Carrying Value(In thousands)
Features2018 20172012 7.0 5.6250% P=9,350,000 P=9,341,196 P=9,330,126 Fixed rate bond due 20192012 10.0 6.0000% 5,650,000 5,644,680 5,637,991 Fixed rate bond due 20222013 7.0 4.6250% 4,000,000 3,989,546 3,984,041 Fixed rate bond due 20202013 20.0 6.0000% 2,000,000 1,984,613 1,983,990 Fixed rate bond due 20332013 10.5 5.0000% 15,000,000 14,923,051 14,910,133 Fixed rate bond due 20242014 11.0 5.6250% 8,000,000 7,945,703 7,938,923 Fixed rate bond due 20252015 7.0 4.5000% 7,000,000 6,960,744 6,953,043 Fixed rate bond due 20222016 9.5 4.7500% 7,000,000 6,949,421 6,943,375 Fixed rate bond due 20252016 10.0 4.8500% 8,000,000 7,939,468 7,932,643 Fixed rate bond due 20262016 3.0 3.0000% 2,982,530 2,971,976 2,969,108 Homestarter Bond due 20192016 7.0 3.8915% 7,000,000 6,952,613 6,943,949 Fixed rate bond due 20232017 10.0 5.2624% 7,000,000 6,969,630 6,966,801 Fixed rate bond due 20272018 10.0 5.9203% 10,000,000 9,886,828 − Fixed rate bond due 20282018 5.0 7.0239% 8,000,000 7,909,305 − Fixed rate bond due 2023Total P=100,368,774 P=82,494,123
Philippine Rating Services Corporation (PhilRatings) rated the Parent Company’s 2018 bond issue“PRS Aaa” with a stable outlook, and maintained the “PRS Aaa” rating with a stable outlook for allother outstanding bonds. PRS Aaa is the highest rating assigned by PhilRatings, indicating thatobligor’s capacity to meet its financial commitment on the obligation is extremely strong and that thatit has the smallest degree of investment risk. On the other hand, an Outlook is an indication as to thepossible direction of any rating change within a one year period and serves as a further refinement tothe assigned credit rating for the guidance of investors, regulators, and the general public. A StableOutlook indicates that the rating is likely to be maintained or to remain unchanged in the next twelvemonths.
Philippine Peso 7-Year and 10-year Bonds due 2019 and 2022In April 2012, the Parent Company issued a total of P=15,000.0 million bonds, broken down into aP=9,350.0 million bond due 2019 at a fixed rate equivalent to 5.6% p.a. and a P=5,650.0 million bonddue 2022 at a fixed rate equivalent to 6.0% p.a. PhilRatings assigned a PRS Aaa rating on the bondsindicating that it has the smallest degree of investment risk. Interest payments are protected by alarge or by an exceptionally stable margin and principal is assured. While the various protectiveelements are likely to change, such changes as can be visualized are most unlikely to impair thefundamentally strong position of such issues. PRS Aaa is the highest credit rating possible onPhilRatings’ rating scales for long-term issuances.
Philippine Peso 10-year and 6-month Bonds due 2024In July 2013, the Parent Company issued a total of P=15,000.0 million bonds due 2024 at a fixed rateequivalent to 5.0% p.a. Credit Rating and Investors Services Philippines, Inc. (CRISP) assigned a

- 71 -
*SGVFS032855*
"AAA" on the bonds indicating that it has a minimal credit risk owing to the Company’s capacity torepay its debt obligations. AAA is the highest rating assigned by CRISP.
Philippine Peso 7-Year and 20-year Bonds due 2020 and 2033In October 2013, the Parent Company issued a total of P=6,000.0 million bonds, broken down into aP=4,000.0 million bond due 2020 at a fixed rate equivalent to 4.6% p.a. and a P=2,000.0 million bonddue 2033 at a fixed rate equivalent to 6.0% p.a. CRISP assigned a "AAA" rating on the bondsindicating that it has a minimal credit risk owing to the Parent Company’s capacity to repay its debtobligations. AAA is the highest rating assigned by CRISP.
Philippine Peso 11-year Bonds due 2025In April 2014, the Parent Company issued a total of P=8,000.0 million bonds due 2025 at a fixed rateequivalent to 5.6% p.a. The Bonds were assigned an issue credit rating of PRS Aaa, with a StableOutlook, by PhilRatings.
Philippine Peso 7.0 Billion Fixed Rate Bonds due 2022In April 2015, the Parent Company issued a total of P=7,000.0 million bonds due 2022 at a fixed rateequivalent to 4.5% p.a. The Bonds were assigned an issue credit rating of PRS Aaa, with a StableOutlook, by PhilRatings.
Philippine Peso 9-year and 6-month Bonds due 2025In April 2016, the Parent Company issued a total of P=7,000.0 million bonds due 2025 at a fixed rateequivalent to 4.75% p.a. The Bonds is the second tranche of the Fixed-rate Bonds Series under theParent Company's P=50,000.0 million Debt Securities Program registered in the SEC. The Bondswere assigned an issue credit rating of PRS Aaa, with a Stable Outlook, by PhilRatings.
Philippine Peso 10-year Bonds due 2026In March 2016, the Parent Company issued a total of P=8,000.0 million bonds due 2026 at a fixed rateequivalent to 4.85% p.a. The Bonds is the first tranche of the Fixed-rate Bonds Series under theParent Company's P=50,000,000,000 Debt Securities Program registered in the SEC. The Bonds wereassigned an issue credit rating of PRS Aaa, with a Stable Outlook, by PhilRatings.
Philippine Peso 3-Year Homestarter Bond due 2019 and 7-year Bonds due 2023In October 2016, the Parent Company issued a total of P=10,000.0 million bonds, broken down into aP=3,000.0 million Homestarter bond due 2019 at a fixed rate of 3.0% p.a. and a P=7,000.0 million fixedrate bond due 2023 at a rate equivalent to 3.8915% p.a. The Bonds represent the first tranche ofHomestarter Bonds series and the third tranche of the Fixed-rate Bonds Series issued under theParent Company's P=50,000.0 million Debt Securities Program registered with the SEC, and listed inthe PDEx. The Bonds have been rated PRS Aaa with a Stable Outlook by PhilRatings. In 2017, theParent Company paid P=9.1 million as an early down payment of the outstanding 3-Year HomestarterBond. In 2018, the Parent Company paid P=8.4 million as an early down payment of the outstanding3-Year Homestarter Bond. As of December 31, 2018 and 2017, the remaining balance of the 3-YearHomestarter Bond amounted to P=2,982.5 million and P=2,990.9 million, respectively.
Philippine Peso 10-year Bonds due 2027In May 2017, the Parent Company issued a P=7,000.0 million fixed rate bond due 2027 at a rateequivalent to 5.2624% p.a. The Bonds represent the fourth tranche of the Fixed-rate Bonds Seriesissued under the Parent Company's P=50,000.0 million Debt Securities Program registered with theSEC, and listed in PDEx. The Bonds have been rated PRS Aaa with a Stable Outlook by PhilRatings.
Philippine Peso 10-year Bonds due 2028In April 2018, the Parent Company issued a P=10,000.0 million fixed rate bond due 2028 at a rateequivalent to 5.9203% p.a. and subject to repricing on 27 April 2023, the fifth anniversary of the IssueDate, at the higher of 5.9203% or the prevailing 5-year benchmark plus 75 bps. The Bonds representthe fifth tranche of the Fixed-rate Bonds Series issued under the Parent Company's P=50,000.0 millionDebt Securities Program registered with the SEC,and listed in the PDEx. The Bonds have been ratedPRS Aaa with a Stable Outlook by PhilRatings.

- 72 -
*SGVFS032855*
Philippine Peso 5-year Bonds due 2023In October 2018, the Parent Company issued a P=8,000.0 million fixed rate bond due 2023 at a rateequivalent to 7.0239% p.a. The Bonds represent the sixth and final tranche of the Fixed-rate BondsSeries issued under the Parent Company's P=50,000.0 million Debt Securities Program registered withthe SEC, and listed in the PDEx. The Bonds have been rated PRS Aaa with a Stable Outlook byPhilRatings.
Philippine Peso 21-month Note due 2019In July 2017, the Parent Company issued and listed on the PDEx a P=4,300.0 million Corporate Note.This Note issue is an SEC-registration exempt transaction under Section 10.1(l) of the SecuritiesRegulation Code (SRC) and Section 10.1.3 of the 2015 Implementing Rules and Regulations of theSRC. Thus, the Note was offered on a limited basis to juridical persons or entities who, at the point ofoffer or sale, were Qualified Buyers. The Notes bear a fixed interest rate of 2.75% p.a. TheCorporate Notes will mature in April 2019.
Philippine Peso 15-month Note due 2019In November 2017, the Parent Company issued and listed on the PDEx Corp. a P=3,100.0 millionCorporate Note. This Note issue is an SEC-registration exempt transaction under Section 10.1(l) ofthe Securities Regulation Code (SRC) and Section 10.1.3 of the 2015 Implementing Rules andRegulations of the SRC. Thus, the Note was offered on a limited basis to juridical persons or entitieswho, at the point of offer or sale, were Qualified Buyers. The Notes bear a fixed interest rate of3.25% p.a. The Corporate Notes will mature in February 2019.
Philippine Peso 5-, 10-, 15-Year FXCN due on 2016, 2021 and 2026In January 2011, the Parent Company issued P=10,000.0 million FXCNs to various financialinstitutions and retail investors. The notes will mature on various dates up to 2026. The FXCNs bearfixed interest rates ranging from 5.6% to 7.5% p.a. depending on the term of the notes. TheCompany prepaid P=1,950.0 million of notes due in 2016 on January 19, 2013. In 2014, the ParentCompany paid P=43.0 million for the matured portion of the loan. In January 2016, the ParentCompany paid P=3,750 million notes for the matured portion of the loan. In 2017, the Parent Companypaid P=43.0 million for the matured portion of the loan. In 2018, the Company prepaid P=3,234.0 millionnotes and paid P=10.0mn for the matured portion of the loan. As of December 31, 2018 and 2017, theremaining balance of the FXCN amounted to P=970.0 million and P=4,214.0 million, respectively.
Philippine Peso 10-year Note due 2023In December 2012, the Parent Company executed a P=5,000.0 million committed Corporate Notefacility with a local bank, of which an initial P=3,500.0 million was drawn in 2012. The balance ofP=1,500.0 million was subsequently drawn in January 2013. Notes currently bear a fixed interest rateof 4.5%. The Corporate Notes will mature on the third month succeeding the tenth anniversary of theinitial drawdown date. In 2015, P=50.0 million was prepaid by the Company. In 2016, anotherP=50.0 million worth of amortization was paid by the Parent Company. In 2017, the Parent Companypaid another amortization in the amount of P=50.0 million. In 2018, another P=50.0 million worth ofamortization was paid by the Company. As of December 31, 2018 and 2017, the remaining balanceof the note amounted to P=4,800.0 million and P=4,850.0 million, respectively.
Peso-denominated Long-term Loans In August to September 2015, the Parent Company assumed an aggregate of P=15,442.3 million
various long-term facilities of some subsidiaries from various banks. The loans bear fixed interestrates ranging from 4.5% to 4.7% p.a. and terms ranging from 4.4 years to 10.5 years. In 2016, theCompany paid P=251.6 million. During 2017, the Parent Company also paid P=317.6 million for itscurrent portion Peso-denominated loans. In March 2017, the Company executed a P=10,000.0 millionlong-term facility with a domestic bank, of which the Company had simultaneously drawn an initialP=5,000.0 million. The loan carries a fixed interest rate of 4.949% p.a. and a term of 10 years. Thebalance of facility of P=5,000.0 million was drawn in April 2017. In March 2018, the Companyexecuted a P=5,000.0 million long-term facility with a domestic bank, of which the Company hadsimultaneously drawn the entire facility amount. As of December 31, 2018 and 2017, remaining

- 73 -
*SGVFS032855*
balance of the Peso-denominated long-term loans amounted to P=29,465.7 million andP=24,873.1 million, respectively.
US Dollar-denominated Long-term LoansIn October 2012, the Parent Company executed and had fully withdrawn a US$58.5 million long-termfacility. The loan bears a floating interest rate based on a credit spread over the three-monthUS Dollar London Interbank Offered Rate (LIBOR), repriceable quarterly. The loan will mature on thethird month succeeding the tenth anniversary of the initial drawdown date. In January 2014 andOctober 2015, the Company made partial prepayments on the loan in the amount of US$5.8 millionand US$12.8 million, respectively. Subsequently in March 2016, a US$30.0 million long-term facilitywas assigned by ALI Makati Hotel Property, Inc. to the Parent Company. The assigned loan bears afloating interest rate based on a credit spread over the three-month US Dollar London InterbankOffered Rate (LIBOR), repriceable quarterly and had a remaining term of 3 years and 4 months fromthe time of assignment. The Parent Company fully paid the remaining dollar-denominated loans onDecember 20, 2018.
SubsidiariesThe subsidiaries’ loans will mature on various dates up to 2028. Peso-denominated loans bearvarious floating interest rates at 60 bps to 80 bps spread over the benchmark 91-day PDST-R2 orand fixed interest rates ranging from 3.89% to 6.49% p.a. Certain loans which are subject to floatinginterest rates are subject to floor floating interest rates equivalent to (i) 95.0% or par of the OvernightReverse Repurchase Agreement Rate of the Bangko Sentral ng Pilipinas (BSP Overnight Rate) or (ii) the BSP Overnight Rate plus a spread of 20 bps to 75 bps p.a. or (iii) the average of the BangkoSentral ng Pilipinas Overnight Deposit Rate and Term Deposit Facility with a term closed to the 90-day interest period. The total outstanding balance of the subsidiaries’ loans as of December 31, 2018and 2017 amounted to P=21,738.1 million and P=26,853.2 million loans, respectively.
Philippine Peso 5.0 Billion Fixed Rate Bonds due 2021In June 2014, Cebu Holdings, Inc. issued a total of P=5,000.0 million bonds due 2021 at a fixed rateequivalent to 5.3% p.a. The Bonds have been rated PRS Aaa by PhilRatings, indicating that obligor’scapacity to meet its financial commitment on the obligation is extremely strong.
The loan agreements contain some or all of the following restrictions: material changes in nature ofbusiness; maintenance of debt-to-equity ratio; payment of dividends and additional loans maturingbeyond a year which will result in a violation of the required debt-to-equity ratios; merger orconsolidation where the Company/subsidiary is not the surviving corporation; guarantees oradvances; encumbrance for borrowed money; and sale of substantially all assets. These restrictionsand requirements were complied with by the Group as of December 31, 2018 and 2017.
Interest capitalized amounted to P=196.2 million and P=61.8 million in 2018 and 2017, respectively.The capitalization rates are 2%-7.65% in 2018 and 2.5-5.05% in 2017 (see Notes 8, 12 and 13).
Transaction costs capitalized amounted to P=251.4 million and P=129.8 million in 2018 and 2017,respectively. Amortization amounted to P=178.2 million and P=111.5 million in 2018 and 2017,respectively and included under “Interest and other financing charges” (see Note 23).
18. Deposits and Other Current Liabilities
This account consists of:
2018 2017(In Thousands)
Security deposits P=5,544,289 P=3,359,779Customers’ deposits − 18,085,639Others 1,125,576 298,402
P=6,669,865 P=21,743,820

- 74 -
*SGVFS032855*
Security deposits are equivalent to three (3) to six (6) months’ rent of tenants with cancellable leasecontracts and whose lease term will end in the succeeding year. This will be refunded to the lesseesat the end of the lease term or be applied to the last months' rentals on the related contracts.
Customers’ deposits consist of collections from real estate customers which have not reached the10% threshold to qualify for revenue recognition (see Note 2). As of December 31, 2018, thecutomers’ deposits account have been reported as contract liabilities in the consolidated statementsof financial position under the modified retrospective approach.
Other current liabilities mostly pertain to estimated liability on property development and unearnedincome.
19. Deposits and Other Noncurrent Liabilities
This account consists of:
2018 2017(In Thousands)
Deposits P= 18,844,346 P=19,101,139Contractors payable 7,264,642 7,955,096Liability for purchased land 6,019,262 2,303,140Retentions payable 5,722,577 8,376,115Deferred Output VAT 1,923,754 1,683,848DRP obligation 1,001,146 728,390Subscriptions payable 498,175 498,175Other liabilities 1,018,769 1,211,743
P=42,292,671 P=41,857,646
Deposits include security deposits from tenants of retail and office spaces and deferred credits arisingfrom sale of real estate properties. Security deposits are equivalent to three (3) to six (6) months’ rentof long-term tenants with noncancellable leases. This will be refunded to the lessees at the end ofthe lease term or be applied to the last months' rentals on the related contracts. Deferred creditspertain to advances from buyers of real estate properties to cover various processing fees including,but not limited to, fees related to transfer of title such as registration fees, documentary taxes andtransfer taxes. Payments made by the Group for the processing of title are charged to this account.
Contractors payable represents estimated liability on property development.
Retentions payable pertains to the amount withheld by the Group on contractor’s billings to bereleased after the guarantee period, usually one (1) year after the completion of the project or upondemand. The retention serves as a security from the contractor should there be defects in the project.
Liability for purchased land pertains to the portion of unpaid unsubdivided land acquired during theyear. These are normally payable in quarterly or annual installment payments within three (3) orfive (5) years.
DRP obligation pertains to the liability arising from the assignment agreement between NTDCC andMRTDC of the latter’s development rights (see Note 36). In consideration of the lease, the Companywill be charged an annual rent related to the original DRP obligation on the MRTDC and 5% of therental income from the Company’s commercial center business.
The Group’s subscription payable pertains to POPI’s investment in Cyber Bay.
On April 25, 1995, Central Bay, a wholly owned subsidiary of Cyber Bay, entered into a Joint VentureAgreement with the Philippine Reclamation Authority (PRA; formerly Public Estates Authority) for thecomplete and entire reclamation and horizontal development of a portion of the Manila-Cavite Coastal

- 75 -
*SGVFS032855*
Road and Reclamation Project (the Project) consisting of three partially reclaimed and substantiallyeroded islands (the Three Islands) along Emilio Aguinaldo Boulevard in Parañaque and Las Piñas,Metro Manila with a combined total area of 157.8 hectares, another area of 242.2 hectarescontiguous to the Three Islands and, at Central Bay’s option as approved by the PRA, an additional350 hectares more or less to regularize the configuration of the reclaimed area.
On March 30, 1999, the PRA and Central Bay executed an Amended Joint Venture Agreement(AJVA) to enhance the Philippine Government’s share and benefits from the Project which wasapproved by the Office of the President of the Philippines on May 28, 1999.
On July 9, 2002, the Supreme Court (SC) (in the case entitled “Francisco Chavez vs. Amari CoastalBay and Reclamation Corp.”) issued a ruling declaring the AJVA null and void. Accordingly, PRA andCentral Bay were permanently enjoined from implementing the AJVA.
On July 26, 2002, Central Bay filed a Motion for Reconsideration (MR) of said SC decision. OnMay 6, 2003, the SC En Banc denied with finality Central Bay’s MR. On May 15, 2003, Central Bayfiled a Motion for Leave to Admit Second MR. In an En Banc Resolution of the SC datedJuly 8, 2003, the SC resolved to admit the Second MR of Central Bay.
On November 11, 2003, the SC rendered a 7-7 split decision on Central Bay’s Second MR. Becauseof the new issues raised in the SC’s latest resolution that were never tried or heard in the case,Central Bay was constrained to file on December 5, 2003 a Motion for Re-deliberation of the SC’slatest resolution which motion was denied with finality by the SC.
With the nullification of the AJVA, Central Bay has suspended all Project operations. OnAugust 10, 2007, in view of the failure by the PRA to comply with its obligations and representationsunder the AJVA, Cyber Bay and Central Bay have filed their claims for reimbursement of Projectexpenses in the amount of P=10,200.0 million with the PRA. Cyber Bay and Central Bay provided thePRA with the summary and details of their claims on September 5, 2007.
On July 15, 2008, Cyber Bay sent a follow-up letter to the PRA. The PRA, in its letter datedJuly 18, 2008, informed Cyber Bay that its claim is still being evaluated by the PRA. As atOctober 3, 2013, the claim is still being evaluated by the PRA.
On November 13, 2012, the SEC approved the conversion of debt to equity of Cyber Bay resulting toa change in percentage ownership of POPI from 22.3% to 10.5%. The management assessed thatPOPI ceased to have significant influence over Cyber Bay. As a result of the debt to equityconversion, the investment in Cyber Bay was reclassified to financial asset through FVOCI.
As at December 31, 2018, the Group has unpaid subscription in Cyber Bay amounting toP=481.7 million. The investment in Cyber Bay under “financial assets through FVOCI” amounted toP=548.3 million as of December 31, 2018 (see Note 10).
Other liabilities include nontrade payables, accrued payables and warranty payables.

- 76 -
*SGVFS032855*
20. Equity
The details of the number of shares follow:
December 31, 2018
Number of Shares AmountPreferred Common Preferred Common
(In Thousands)Authorized 15,000,000 20,000,000 P=1,500,000 P=20,000,000Issued 13,066,495 14,614,387 P=1,306,649 P=14,614,387Subscribed – 120,494 – 120,494Issued and outstanding 13,066,495 14,734,881 P=1,306,649 P=14,734,881
December 31, 2017
Number of Shares AmountPreferred Common Preferred Common
(In Thousands)Authorized 15,000,000 20,000,000 P=1,500,000 P=20,000,000Issued 13,066,495 14,606,355 P=1,306,649 P=14,606,355Subscribed – 118,592 – 118,592Issued and outstanding 13,066,495 14,724,947 P=1,306,649 P=14,724,947
Preferred Shares (P=0.10 par value per share)The Parent Company’s preferred shares prior to 2012 were subscribed and issued through a stockrights offer with the following features: (a) non-voting; (b) dividend rate of 4.6% p.a., payable annually,noncumulative; (c) nonparticipating; (d) convertible at the option of the holder at a ratio of one (1)preferred share to one (1) common share commencing on the 10th year from issue date at anexercise price equivalent to the higher of (i) the 30-day average closing price or (ii) closing price ofcommon shares immediately preceding the exercise date, less the par value of the preferred shares;(e) no pre-emptive rights; (f) non-redeemable; (g) non-listed; and, (h) preferred in liquidation to theextent of par value.
The dividends for preferred shares are declared upon the sole discretion of the Parent Company’sBOD.
On February 20, 2012, the BOD approved the following restructuring exercise in order to comply withthe regulatory requirement on Filipino-ownership following the Supreme Court’s ruling that nonvotingshares do not count as equity when computing for a company’s Filipino-ownership level:
a. Redemption and retirement of the 13.0 billion outstanding preferred shares with par value ofP=0.10.
b. Reclassification of the 1,970.0 million unissued preferred shares to voting preferred sharesthrough an amendment of Article Seventh of the Articles of Incorporation.
c. Increase in authorized capital stock by P=1,300.0 million creating new voting preferred shares anda stock rights offer of 13,000 million voting preferred shares from the increase in the authorizedcapital stock.
On April 18, 2012, the stockholders ratified the BOD resolution on the capital restructuring. Thevoting preferred shares shall have the following features, rights, and privileges: (a) voting;(b) dividend rate of 4.7% per annum, equivalent to 90.0% of the 10-year PDST R2 (repriced every ten(10) years from issue date), payable annually, non-cumulative; (c) convertible at the option of theholder at a ratio of one (1) voting preferred share to one (1) common share commencing on the 10thyear from issue date at an exercise price equivalent to the higher of (i) the 30-day average closingprice or (ii) closing price of common shares immediately preceding the exercise date, less the par

- 77 -
*SGVFS032855*
value of the preferred shares; (d) no pre-emptive rights; (e) redeemable at par at the sole option ofthe corporation; (f) non-listed; and, (g) preferred in liquidation to the extent of par value.The SEC approved on January 31, 2013 the following:
a. The decrease in authorized capital stock by P=1,303.5 million, the aggregate par value of the13,034.6 million preferred shares which have been redeemed and retired, from P=22,803.5 millionto P=21,500.0 million, and
b. The amendments to Articles of Incorporation reflecting the decrease in capital stock.
As of December 31, 2018 and 2017, the Parent Company’s authorized and outstanding preferredshares amounted to P=1,500.0 million and P=1,306.6 million, respectively.
Common Shares (P=1.00 par value per share)On April 7, 2014, the stockholders resolved to approve the amendment of the Seventh Article of theArticles of Incorporation exempting from pre-emptive rights (1) the issuance of 1 billion commonshares for properties or assets needed for the business of the Parent Company or for cash to acquireproperties or assets needed for the business of the Parent Company or in payment of a debtcontracted prior to the issuance of such shares, and (2) the issuance of common shares covered bythe Parent Company’s Stock Option Plans for members of the management committees of the ParentCompany’s subsidiaries or affiliates.
Likewise, the stockholders resolved to approve the amendment of the Stock Option Plan of theParent Company to include the members of the Management Committees of the Parent Company’ssubsidiaries and affiliates as eligible grantees of stock options.
The rollforward analysis of the outstanding number of common shares follows:
2018 2017(In Thousands)
At beginning of year 14,724,947 14,712,682Additional subscriptions 9,934 12,265At end of year 14,734,881 14,724,947
No transfer of stock or interest which will reduce the ownership of Filipino citizens to less than therequired percentage of the capital stock as provided by existing laws shall be allowed or permitted tobe recorded in the books of the Parent Company.
On April 13, 2013, the stockholders resolved to approve the amendment of the Seventh Article of theCompany’s Articles of Incorporation for the purpose of excluding or exempting treasury shares fromthe pre-emptive rights of stockholders.
On January 9, 2015, the Executive Committee of the Parent Company approved a top-up placementof 484,848,500 common shares of the Company at a price of P=33.00 per share. The placement wasconducted via an accelerated bookbuilt offering structured as a top-up placement, whereby AC sold484,848,500 listed common shares of stock to qualified third party buyers and subscribe to the samenumber of new shares from the Parent Company. The Parent Company completed the placement onJanuary 12, 2015, raising an aggregate of P=16,000.0 million in paid-up capital. The price was at3.9% discount on the 5-day volume-weighted average price of ALI shares. Transaction cost chargedto additional paid-in capital amounted to P=194.0 million.
On March 6, 2013, the Parent Company’s Board resolved to approve the placement made by AC ofits existing 320,000,000 listed common shares of the Company to certain qualified third party buyersor investors at P=30.50 per share. The Parent Company completed the top-up placement, raising anaggregate of P=12,200.0 million in paid up capital. The price was at 3.6% discount on the 5-dayvolume-weighted average price of ALI shares. Transaction cost charged to additional paid-in capitalamounted to P=162.4 million.
- 78 -
*SGVFS032855*
On July 10, 2012, the Parent Company’s executive committee approved the placement of 680 millionlisted common shares of stock with par value of P=1.00 per share, at a price of P=20.00 per share, andthe issuance of equal number of new shares of the Parent Company, at the same price of P=20.00 pershare, with AC as the seller of the placement tranche and subscriber of the subscription tranche. TheParent Company completed the top-up placement, raising an aggregate of P=13,600 million in paid upcapital. The price was at 5.0% discount to the closing price. Transaction cost charged to additionalpaid-in capital amounted to P=200.0 million.
On April 2, 2008, the Parent Company’s stockholders approved the allotment and subsequentissuance of the shares for the above-mentioned purposes and for the further amendment of theAmended Articles of Incorporation of the Parent Company to exclude the issuance of shares from thepre-emptive rights of the stockholders pursuant to Section 39 of the Philippine Corporation Code.
On February 12, 2008, the BOD approved the allotment and subsequent issuance of up to 1 billioncommon shares of stock with an aggregate par value of P=1,000.0 million for the purpose ofexchanging such shares for properties or assets and/or to raise funds to acquire properties or assetsneeded for the business of the Parent Company via issuance of equity or equity-linked instruments,the price and the terms and conditions of which shall be determined by the BOD based on prevailingmarket conditions or on agreements negotiated.
On July 5, 1991, the Parent Company launched its initial public offering where a total of 400 millioncommon shares were offered at an offering price of P=26.00 per share. The registration statementwas approved on July 20, 1992. The Parent Company has 9,102 and 9,209 existing shareholders asof December 31, 2018 and 2017, respectively.
Treasury SharesThe amendment of the Articles of Incorporation on April 17, 2013 allowed the re-selling of the79,528,299 listed common shares as part of the top-up placement transaction completed inJuly 2013. Treasury common shares were sold at P=30.50 per share resulting to additional paid-incapital of P=1,601.6 million.
On July 16, 2012, the Parent Company redeemed the 13.0 billion outstanding non-voting preferredshares through payment of the redemption price of P=0.10 per share. As of December 31, 2012, theredeemed preferred shares were treated as treasury shares and were subsequently retired uponapproval of the Parent Company’s SEC application for the decrease in authorized capital stock onJanuary 31, 2013.
On August 12, 2008, the BOD approved a share buyback program. It is part of the ParentCompany’s balance sheet management program and aims to (i) improve the Parent Company’sbalance sheet structure and capital efficiency and (ii) enhance shareholder value through therepurchase of shares whenever the stock is trading at a price discount perceived by the ParentCompany as not reflective of its fair corporate value.
In 2008, the Parent Company repurchased a total of 79,528,228 of its common shares through openmarket purchases using the trading facilities of the Philippine Stock Exchange for a total purchaseprice of P=823.9 million in relation to its share buyback program.
Retained EarningsThe BOD approved the declaration and payment from unappropriated retained earnings of cashdividends of P=0.51, P=0.48 and P=0.48 per share in 2018, 2017 and 2016, respectively, to all issuedand outstanding shares.
On February 20, 2018, the BOD approved the declaration of cash dividends amounting to P=0.252 peroutstanding common share and was paid out on April 3, 2018 to the shareholders on record as ofMarch 12, 2018. Further, on the same date, the BOD declared annual cash dividends of 4.8% peryear or P=0.0047 per share to all shareholders of the Parent Company’s unlisted voting preferredshares. These were paid on June 29, 2018 to the shareholders on record as of June 15, 2018.

- 79 -
*SGVFS032855*
On August 17, 2018, the BOD approved the declaration and payment from unappropriated retainedearnings of cash dividends of P=0.252 per share. The cash dividend was paid out onOctober 2, 2018 to stockholders of common shares on record as of September 6, 2018.
On February 20, 2017, the BOD approved the declaration of cash dividends amounting to P=0.24 peroutstanding common share and was paid out on March 22, 2017 to the shareholders on record as ofMarch 6, 2017. Further, on the same date, the BOD declared annual cash dividends of 4.8% peryear or P=0.0047 per share to all shareholders of the Parent Company’s unlisted voting preferredshares. These were paid on June 29, 2017 to the shareholders on record as of June 15, 2017.
On August 18, 2017, the BOD approved the declaration and payment from unappropriated retainedearnings of cash dividends of P=0.24 per share. The cash dividend was paid out onSeptember 15, 2017 to stockholders of common shares on record as of September 5, 2017.
On February 26, 2016, the BOD approved the declaration of cash dividends amounting to P=0.24 peroutstanding common share and was paid out on March 23, 2016 to the shareholders on record as ofMarch 11, 2016. Further, on the same date, the BOD declared annual cash dividends of 4.8% peryear or P=0.0047 per share to all shareholders of the Company’s unlisted voting preferred shares.These were paid on June 29, 2016 to the shareholders on record as of June 15, 2016.
On August 18, 2016, the BOD approved the declaration and payment from unappropriated retainedearnings of cash dividends of P=0.2380 per share. The cash dividend was paid out onSeptember 16, 2016 to stockholders of common shares as of record date.
Total dividends for common shares declared for 2018 and 2017 amounted to P=7,423.9 million andP=7,065.0 million, respectively.
Retained earnings of P=8,000.0 million are appropriated for future expansion. The increase ofP=2,000.0 million in 2016 represents a continuing appropriation for land banking activities and plannedbuilding construction projects. Each year, the Parent Company incurs capital expenditures forproperty development which include among others land banking and building construction projects.The appropriation is being fully utilized to cover part of the annual expenditure requirement of theParent Company.
The Parent Company has earmarked additional funds for expansion projects in the residential,shopping centers, office and hotel business segments, as well as various infrastructure projects forthe Parent Company’s mixed-use developments.
The following are among the major capital expenditures of the Parent Company which were approvedby the BOD:
a) Ayala Triangle Garden 2 with product offering for a Triple A HQ Office Building, a 5-Star Hoteland 3-level Retail Podium with gardens and civic spaces which was approved by the Board onMay 29, 2015. The project was launched in June 2015 and expected to be completed in 2020.
b) Ayala Center Redevelopment which will offer intermodal transport facility, a 5-storey regionalmall, 2 BPO towers, a SEDA hotel and a 300-units residential for lease was approved by theBoard on November 27, 2015. The project was launched in January 2016 and expected to becompleted in 2021.
Retained earnings also include undistributed net earnings amounting to P=46,486.7 million andP=54,547.0 million as of December 31, 2018 and 2017, respectively, representing accumulated equityin the net earnings of subsidiaries, associates and joint ventures. These are not available fordividend distribution unless declared by subsidiaries and other investees.

- 80 -
*SGVFS032855*
In accordance with SEC Memorandum Circular No. 11 issued in December 2008, the ParentCompany’s retained earnings available for dividend declaration as of December 31, 2018 and 2017amounted to P=52,672.2 million and P=45,343.5 million, respectively.
Retained earnings are further restricted for the payment of dividends to the extent of the cost oftreasury shares.
Cumulative Translation AdjustmentThe cumulative translation adjustments represents exchange differences arising from the translationof financial statements of the foreign operations, whose functional currency is other than PhilippinePeso.
Equity ReservesIn January 2018, ALI purchased additional 202,774,547 shares of POPI from Genez InvestmentCorporation for P=497.7 million increasing the Parent Company’s ownership to 67%.
In December 2018, ALI acquired 8,051 common shares of LTI for P=800.0 million increasing itsownership to 95%.
In 2018, ALI acquired additional 59,631,200 common shares of CHI totaling to P=352.8 million.Further, an additional 77,742,516 shares was acquired as a result of swap of CPVDC shares for atotal consideration of P=229.3 million which brings Parent Company’s ownership to 70.4%.
In March 2018, the Irredeemable Convertible Unsecured Loan Stock of Dato Sri Tong and Tan SriBarry Go, founders of MCT, were converted into 122,218,357 shares. This resulted in a 6.07%dilution of ALI’s stake in MCT as of date of share issuance. As such, the current ownership stake ofALI in MCT is 66.25%. This resulted in an increase in Equity reserve amounting to P=1,044.5 million.
The transactions were accounted for as an equity transaction since there were no changes in control.The movements within equity are accounted for as follows:
2018
Consideration paid
Carrying value ofNon-controlling
interests acquired
Differencerecognized within
Equity(In Thousands)
4.14% in POPI P=497,652 P=315,951 P=181,70120.00% in LTI 800,000 528,295 271,7051.53% net reduction in CHI 582,106 826,752 (244,646)
P=1,879,758 P=1,670,998 P=208,760
In 2017, ALI purchased additional 97,763,900 common shares of CHI from BPI SecuritiesCorporation totaling P=575.0 million which brought up the Company’s ownership to 72% of the totaloutstanding capital stock of CHI (see Note 1).
In February 2017, ALI purchased additional 631,000 common shares of POPI from BPI SecuritiesCorporation for P=1.26 million. ALI’s interest remains at 51% of the total POPI’s outstanding capitalstock (see Note 1).
In June 2017, Orion Land, Inc. (OLI), a subsidiary of POPI, acquired 512,480,671 common sharesequivalent to 11.69% ownership at P=2.45 share amounting to P=1,255.58 million. The acquisition ofPOPI shares by OLI was treated as an acquisition of non-controlling interest resulting to a debit toequity reserve of P=405.18 million. This increased ALI’s effective ownership to 63.05%.

- 81 -
*SGVFS032855*
The transactions were accounted for as an equity transaction since there were no change in control.The movements within equity are accounted for as follows:
Consideration paid
Carrying value ofNon-controlling
interests acquired
Differencerecognized within
Equity(In Thousands)
5.09% in CHI P=574,994 P=394,907 P=180,08711.69% in POPI 1,258,579 852,656 405,923
P=1,833,573 P=1,247,563 P=586,010
In August 2017, AHRC entered into a memorandum of agreement with Sicogon DevelopmentCorporation (SIDECO) and an individual to develop Sicogon Island into a new leisure destination. Theinvestment of SIDECO and an individual to SITEC changed the ownership interest of AHRC in SITECfrom 100% to 77% without a loss of control. The difference between the amount by which non-controlling interest of 23% are adjusted and the fair value of consideration paid is recognized directlyto equity amounting to P=134.0 million.
In 2016, ALI purchased additional 201,859,364 common shares of CHI for total consideration ofP=1,209.8 million which brought ALI’s ownership from 56.4% to 66.9% (see Note 1). The transactionwas accounted for as an equity transaction since there was no change in control. The movementswithin equity are accounted for as follows:
Consideration paid
Carrying value ofNon-controlling
interests acquired
Differencerecognized within
Equity(In Thousands)
10.5% in CHI P=1,209,784 P=748,746 P=461,038
In 2015, the Company purchased additional shares from non-controlling interests of CHI, NTDCC,API. The transactions were accounted as an equity transaction since there was nochange in control. The movements within equity are accounted for as follows:
Consideration paid
Carrying value ofNon-controlling
interests acquired
Differencerecognized within
Equity(In Thousands)
6.7% in CHI P=649,927 P=434,074 P=215,8539.4% in NTDCC 778,356 174,770 603,5861.9% in API 58,157 45,540 12,617
P=1,486,440 P=654,384 P=832,056
In 2014, the Company acquired additional shares from non-controlling interests of Philenergy(40.0%), NTDCC (14.5%) and CECI (0.40%) and were accounted as an equity transaction sincethere was no change in control.
In 2013, the Company acquired additional 32% interest in APPCo and additional 40% interests inTKDC and TKPI increasing its ownership interest to 100%. The transactions were accounted as anequity transaction since there was no change in control. Following is the schedule of the movement inequity reserves recorded within the equity:
Consideration paid
Carrying value ofNon-controlling
interests acquiredDifference recognized
within Equity(In Thousands)
6.7% in CHI P=3,520,000 P=797,411 P=2,722,5899.4% in NTDCC 2,000,000 1,413,960 586,040
P=5,520,000 P=2,211,371 P=3,308,629

- 82 -
*SGVFS032855*
Non-controlling interestsThe financial information on the Company’s significant subsidiaries with material NCI follows:
CHI and SubsidiariesCHI, a publicly-listed company, was incorporated in the Republic of the Philippines. It is engaged inreal estate development, sale of subdivided land, residential and office condominium units, sportsclub shares, and lease of commercial spaces. The registered office address of CHI is at 20F ACCTower, Bohol St., Cebu Business Park, Cebu City, Philippines.
2018 2017(In Thousands, except for %)
Proportion of equity interests held by non-controllinginterests 29.6% 28.0%
Accumulated balances of material non-controllinginterests P=3,543,749 P=2,340,127
Net income allocated to material non-controllinginterests 291,009 227,641
Comprehensive income allocated to material non-controlling interests 302,984 226,467
The summarized financial information of CHI is provided below. This information is based onamounts before inter-company eliminations.
2018 2017(In Thousands)
Statement of financial position Current assets P=3,598,044 P=3,383,588 Noncurrent assets 22,743,784 17,260,743 Current liabilities (9,455,296) (5,693,010) Noncurrent liabilities (6,816,128) (7,003,688) Total equity 10,070,404 7,947,633 Attributable to: Equity holders of CHI 8,073,365 6,989,133 Non-controlling interests 1,997,039 958,500 Dividends paid to non-controlling interests − −
For the years ended December 312018 2017
(In Thousands)Statement of comprehensive income Revenue P=3,721,840 P=3,092,234 Cost and expenses (2,479,081) (2,020,529) Income before income tax 1,242,759 1,071,705 Provision for income tax (272,729) (258,701) Income from operations 970,030 813,004 Other comprehensive income (loss) 39,917 (4,195) Total comprehensive income 1,009,947 808,809 Attributable to: Equity holders of CHI P=897,028 P=752,192 Non-controlling interests 112,919 56,617
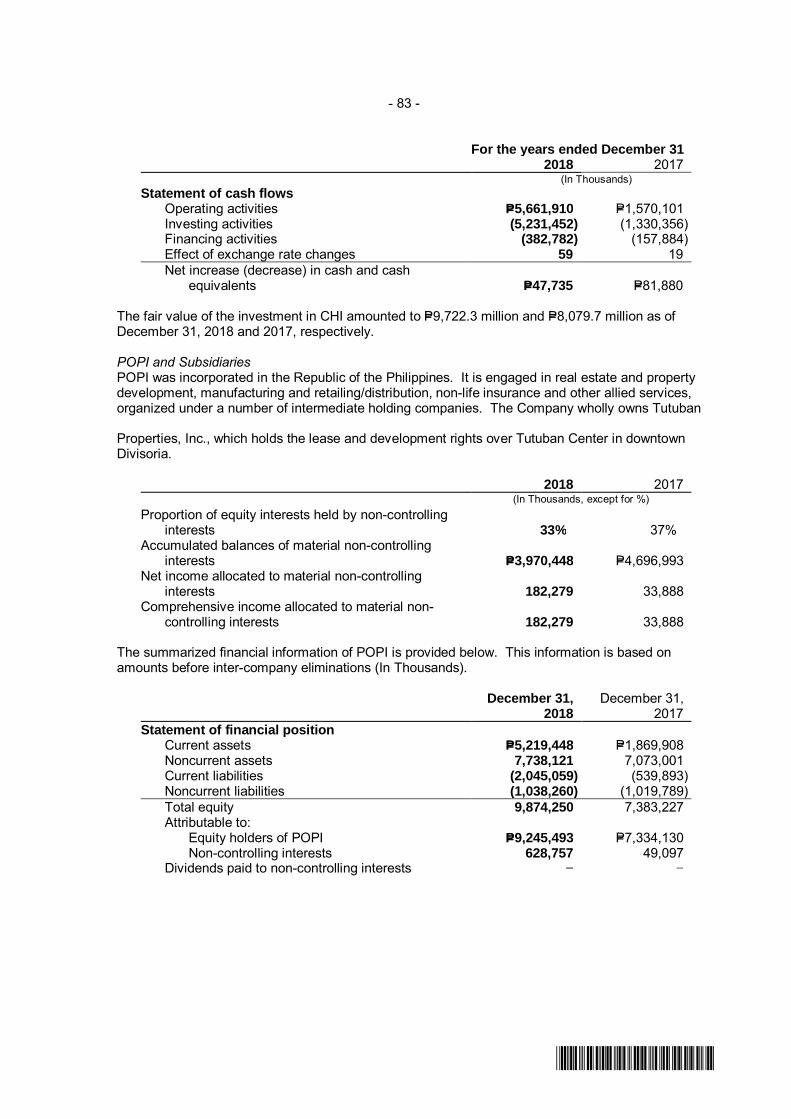
- 83 -
*SGVFS032855*
For the years ended December 312018 2017
(In Thousands)Statement of cash flows Operating activities P=5,661,910 P=1,570,101 Investing activities (5,231,452) (1,330,356) Financing activities (382,782) (157,884)
Effect of exchange rate changes 59 19Net increase (decrease) in cash and cash
equivalents P=47,735 P=81,880
The fair value of the investment in CHI amounted to P=9,722.3 million and P=8,079.7 million as ofDecember 31, 2018 and 2017, respectively.
POPI and SubsidiariesPOPI was incorporated in the Republic of the Philippines. It is engaged in real estate and propertydevelopment, manufacturing and retailing/distribution, non-life insurance and other allied services,organized under a number of intermediate holding companies. The Company wholly owns Tutuban
Properties, Inc., which holds the lease and development rights over Tutuban Center in downtownDivisoria.
2018 2017(In Thousands, except for %)
Proportion of equity interests held by non-controllinginterests 33% 37%
Accumulated balances of material non-controllinginterests P=3,970,448 P=4,696,993
Net income allocated to material non-controllinginterests 182,279 33,888
Comprehensive income allocated to material non-controlling interests 182,279 33,888
The summarized financial information of POPI is provided below. This information is based onamounts before inter-company eliminations (In Thousands).
December 31,2018
December 31,2017
Statement of financial position Current assets P=5,219,448 P=1,869,908 Noncurrent assets 7,738,121 7,073,001 Current liabilities (2,045,059) (539,893) Noncurrent liabilities (1,038,260) (1,019,789) Total equity 9,874,250 7,383,227 Attributable to: Equity holders of POPI P=9,245,493 P=7,334,130 Non-controlling interests 628,757 49,097 Dividends paid to non-controlling interests − −

- 84 -
*SGVFS032855*
For the years ended December 312018 2017
Statement of comprehensive income Revenue P=3,480,091 P=733,707 Cost and expenses (2,773,181) (654,084) Income before income tax 706,910 79,623 Provision for income tax (152,195) (52,065) Income from operations 554,715 27,558 Other comprehensive loss − − Total comprehensive income 554,715 27,558 Attributable to: Equity holders of POPI P=441,907 P=20,532 Non-controlling interests 112,808 7,026Statement of cash flows Operating activities P=538,031 ( 149,327) Investing activities (746,879) (4,727,524) Financing activities 217,512 4,230,458Net decrease in cash and cash equivalents P=8,664 ( 646,393)
The fair value of the investment in POPI amounted to P=6,407.1 million and P=5,639.2 million as ofDecember 31, 2018 and 2017, respectively.
Capital ManagementThe primary objective of the Group’s capital management policy is to ensure that debt and equitycapital are mobilized efficiently to support business objectives and maximize shareholder value. TheGroup establishes the appropriate capital structure for each business line that properly reflects itspremier credit rating and allows it the financial flexibility, while providing it sufficient cushion to absorbcyclical industry risks.
The Group considers debt as a stable source of funding. The Group lengthened the maturity profileof its debt portfolio and makes it a point to spread out its debt maturities by not having a significantpercentage of its total debt maturing in a single year.
The Group manages its capital structure and makes adjustments to it, in the light of changes ineconomic conditions. It monitors capital using leverage ratios on both a gross debt and net debtbasis. As of December 31, 2018 and 2017, the Group had the following ratios:
2018 2017Debt to equity 84.8:1 90.8:1Net debt to equity 72.3:1 77.3:1
Debt consists of short-term and long-term debts. Net debt includes short-term and long-term debtless cash and cash equivalents, short-term investments and financial assets at FVPL (net ofInvestment in ARCH Capital Fund). Equity, which the Group considers as capital, pertains to the totalequity. The Group excludes the “Fair value reserve of financial assets at FVOCI” attributable to theequity holders of the Company in computing the debt to equity ratio.
The Group is subject to externally imposed capital requirements due to loan covenants (see Note 17).No changes were made in the objectives, policies or processes for managing capital during the yearsended December 31, 2018 and 2017.
Financial risk assessmentThe Group’s financial condition and operating results would not be materially affected by the currentchanges in interest, currency, credit, liquidity and market conditions.
Exposure to changes in interest rates is reduced by a debt portfolio mix of both fixed and floatinginterest rates. The Group’s ratio of fixed to floating rate debt stood at 89:11 and 85:15 as of

- 85 -
*SGVFS032855*
December 31, 2018 and 2017, respectively. As a result, any adverse movement in interest rates ismitigated.
Exposure to foreign currency holdings is at MYR130.8 million and US$96.5 million as ofDecember 31, 2018, respectively and US$147.6 million as of December 31, 2017.
Credit risks continue to be managed through defined credit policies and continuing monitoring ofexposure to credit risks. The Group’s base of counterparties remains diverse. As such, it is notexposed to large concentration of credit risk.
Liquidity risk is addressed with long term funding already locked in, while funds are placed on cashequivalents, short term investment and financial assets at FVTPL.
21. Revenue
This account consists of:
2018 2017 2016(In Thousand)
Revenue from contracts with customersResidential development P=120,396,794 P=101,797,865 P=82,738,691Hotels and resorts 6,386,896 5,621,164 6,052,309Construction 2,393,683 1,559,430 10,700,886Other 237,601 898,000 −
Rental income 33,581,920 28,631,316 23,219,595Equity in net earnings of associates and joint
venture 749,924 865,566 554,414Total Revenue P=163,746,818 P=139,373,341 P=123,265,895
The Group derives revenue from the transfer of goods and services over time and at a point in time,respectively, in different product types. The Group’s disaggregation of each sources of revenue fromcontracts with customers are presented below:
Residential development2018
(In thousands)Type of ProductCondominium P=35,284,221Coremid 33,694,884Middle Income Housing 33,401,701Lot only 18,253,589
P=120,634,395
All of the Group’s real estate sales from residential development are revenue from contracts withcustomers recognized over time.
Hotels and resorts2018
(In thousands)Type of ProductRooms P=3,909,395Food and beverage 2,116,548Other operated department 296,049Others 64,904
P=6,386,896

- 86 -
*SGVFS032855*
The Group’s construction revenue all pertains to transactions with related parties.
Set-out below is the reconciliation of contracts with customers with the amounts disclosed in segmentinformation (in millions):
2018
ResidentialDevelopment International Construction
Hotels andReosrts
PropertyManagement
and Others Total
Sales to externalcustomer
P=105,752 P=7,602 P=2,394 P=6,387 P=238 P=122,373
Interest 7,042 − − − − 7,042Total revenue fromcontracts with customers 225,589 7,602 2,394 6,387 238 129,415
22. Interest and Investment Income and Other Income
Interest and investment income consists of:
2018 2017 2016(In Thousands)
Interest income from banks P=657,920 P=476,737 P=148,352Interest income from advances to
officers/employees and othercompanies 252,630 101,000 472,361
Gain on sale of equipment and otherproperties 46,570 69,566 37,447
Gain on sale of investments 588 25,713 43,657Others 528 2,035 1,147
P=958,236 P=675,051 P=702,964
Other income consists of:
2018 2017 2016(In Thousands)
Marketing and management fees P=254,483 P=402,238 P=142,973Others - net (Note 25) 1,286,234 1,846,321 516,963
P=1,540,717 P=2,248,559 P=659,936
Other income mainly consists of gain on business combination, realized and unrealized gain onfinancial asset at FVTPL and gain from disposal of subsidiary. It also includes the financial impact ofnet foreign exchange transactions amounting P=92.8 million, P=23.3 million gain and P=15.4 million lossin 2018, 2017 and 2016, respectively. It also includes reversal of impairment losses amounting toP=1,298.44 million in 2017 (see Note 8). In 2017, the Company reversed its allowance for impairmentin inventories due to higher fair value than its carrying amount.

- 87 -
*SGVFS032855*
23. Costs and Expenses and Other Charges
Real estate costs and expenses consist of:
2018 2017 2016(In Thousands)
Cost of real estate sales (Note 8) P=67,784,088 P=59,864,430 P=47,379,487Marketing and management fees 5,165,668 4,492,983 2,366,929Depreciation and amortization 5,044,758 4,113,833 4,918,250Rental 3,960,419 2,105,239 1,954,860Hotels and resorts operations 3,030,787 5,435,408 3,516,962Manpower costs 1,800,424 1,212,904 1,606,117Materials and overhead 1,341,224 531,180 7,061,926Direct operating expenses: Light and water 4,440,156 2,830,100 1,423,600 Taxes and licenses 2,873,125 2,726,850 2,412,017 Commission 2,124,226 1,459,921 1,394,617 Repairs and maintenance 1,582,239 1,082,041 1,476,788 Insurance 271,700 125,526 124,194 Professional fees 172,226 183,563 195,256 Transportation and travel 170,781 118,059 169,308 Entertainment, amusement
and recreation 28,243 27,539 37,980 Others 1,289,066 1,611,488 528,113
101,079,130 P=87,921,064 P=76,566,404
General and administrative expenses consist of:
2018 2017 2016(In Thousands)
Manpower costs (Notes 27 and 29) P=4,685,180 P=3,756,307 P=3,852,675Taxes and licenses 818,797 595,027 557,289Professional fees 744,679 672,843 477,875Depreciation and amortization 640,608 484,707 438,691Security and janitorial 603,404 431,002 357,945Utilities 324,402 274,623 248,977Repairs and maintenance 304,003 246,796 152,106Rent 195,669 135,569 194,883Transport and travel 106,366 113,229 98,660Advertising 103,423 59,381 61,811Training and seminars 79,023 88,439 62,591Donations and contribution 76,059 42,667 84,825Insurance 74,139 39,510 113,526Supplies 64,550 50,674 49,221Dues and fees 61,447 63,693 63,480Entertainment, amusement and
recreation 41,970 50,587 49,870Others 177,609 169,791 166,925
P=9,101,328 P=7,274,845 P=7,031,350

- 88 -
*SGVFS032855*
Manpower costs included in the consolidated statements of income follows:
2018 2017 2016(In Thousands)
Real estate costs and expensesCost of real estate P=1,534,290 P=1,203,777 P=1,605,950
Hotels and resorts operations 266,134 9,127 167General and administrative expenses 4,685,180 3,756,307 3,852,675
P=6,485,604 P=4,969,211 P=5,458,792
Depreciation and amortization expense included in the consolidated statements of income follows:
2018 2017 2016(In Thousands)
Real estate costs and expenses:Cost of real estate P=5,044,758 P=4,113,833 P=4,918,250
Hotels and resorts operations 633,563 581,252 517,619General and administrative expenses 640,608 484,707 438,691
P=6,318,929 P=5,179,792 P=5,874,560
Other expenses consist of:
2018 2017 2016(In Thousands)
Write-offs and other charges P=1,123,307 P=1,040,218 P=654,686Net provision for (reversals of)
impairment losses on: Receivables (Note 7) 146,974 (416,143) 398,521
Inventories − 523,001 − Investment properties
(Note 12) – 49,000 –P=1,270,281 P=1,196,076 P=1,053,207
Interest and other financing charges consist of:
2018 2017 2016(In Thousands)
Interest expense on: Long-term debt P=7,259,118 P=7,393,070 P=6,114,265 Short-term debt 1,668,340 337,384 837,918Other financing charges 666,545 183,872 362,204
P=9,594,003 P=7,914,326 P=7,314,387

- 89 -
*SGVFS032855*
24. Income Tax
Net deferred tax assets:
2018 2017(In Thousands)
Deferred tax assets on: Difference between tax and book basis of
accounting for real estate transactions P=10,197,204 P=7,873,272 Unrealized foreign exchange losses 789,217 57,162 Allowance for probable losses 649,222 606,470
NOLCO 489,446 565,564 Accrued expenses 396,403 1,204,205 Retirement benefits 365,488 283,469 Advanced rentals 58,464 23,719 Others 515,196 485,887
13,460,640 11,099,748Deferred tax liabilities on: Capitalized interest and other expenses (434,023) (447,596) Others 14,376 (4,139)
(419,647) (451,735)P=13,040,993 P=10,648,013
Net deferred tax liabilities:
2018 2017(In Thousands)
Deferred tax assets on: Difference between tax and book basis of
accounting for real estate transactions P=43,621 P=522,615 Allowance for probable losses 84,617 27,907 Accrued expense 55,935 26,384 NOLCO 40,994 3,871 Unrealized foreign exchange loss 179 − Others 53,901 70,139
279,247 650,916Deferred tax liabilities on: Fair value adjustment arising from business
combination (3,823,380) (1,624,814) Difference between tax and book basis of
accounting for real estate transactions (1,662,926) (1,922,421) Capitalized interest and other expenses (144,668) (15,658) Retirement benefits 119,229 (29,302) Prepaid expenses (38,435) − Unrealized foreign exchange gain (6,124) (3,120) Others (617,648) (599,392)
(6,173,952) (4,194,707)(P=5,894,705) (P=3,543,791)
As of December 31, 2018 and 2017 deferred tax liabilities have not been recognized on theundistributed earnings and cumulative translation adjustment of foreign subsidiaries since the timingof the reversal of the temporary difference can be controlled by the Group and management does notexpect the reversal of the temporary differences in the foreseeable future.
Certain subsidiaries of the Company have NOLCO amounting to P=2,109.2 million andP=1,290.6 million as of December 31, 2018 and 2017, respectively and MCIT amounting to

- 90 -
*SGVFS032855*
P=427.1 million and P=24.2 million as of December 31, 2018 and 2017, respectively. Deferred taxassets are recognized only to the extent that taxable income will be available against which thedeferred tax assets can be used. As of December 31, 2018, total unrecognized NOLCO and MCITamounted to P=341.1 million and P=18.6 million, respectively. The subsidiaries will recognize apreviously unrecognized deferred tax asset to the extent that it has become probable that futuretaxable income will allow the deferred tax asset to be recovered.
The carryover NOLCO and MCIT that can be claimed as deduction from future taxable income orused as deductions against income tax liabilities are as follows:
NOLCO:Year Incurred Amount Used/Expired Balance Expiry Year
(In Thousands)2015 P=318,468 P=318,468 P=− 20182016 452,178 − 452,178 20192017 666,258 − 666,258 20202018 990,792 − 990,792 2021
P=2,427,696 P=318,468 P=2,109,228
MCIT:Year Incurred Amount Used/Expired Balance Expiry Year
(In Thousands)2015 P=4,481 P=4,481 P=− 20172016 2,371 − 2,371 20182017 16,332 − 16,332 20192018 408,373 − 408,373 2020
P=431,557 P=4,481 P=427,076
Reconciliation between the statutory and the effective income tax rates follows:
2018 2017 2016Statutory income tax rate 30.00% 30.00% 30.00%Tax effect of: Equity in net earnings of associates and joint
ventures (0.35) (0.68) (0.51)Income under tax holiday and other nontaxable
income (Note 31) (0.92) (0.57) (3.11) Interest income and capital gains taxed at lower
rates (1.62) (2.51) (0.65) Others – net (0.60) (0.38) (0.53)Effective income tax rate 26.51% 25.86% 25.20%
Deferred tax related to remeasurement gain on defined benefit plans recognized in OCI amounted toP=25.6 million and P=84.4 million in 2018 and 2017, respectively.
Republic Act (RA) No.10963 or the Tax Reform for Acceleration and Inclusion Act (TRAIN) wassigned into law on December 19, 2017 and took effect January 1, 2018, making the new tax lawenacted as of the reporting date. Although the TRAIN changes existing tax law and includes severalprovisions that will generally affect businesses on a prospective basis, the management assessedthat the same will not have any significant impact on the financial statement balances as of thereporting date.

- 91 -
*SGVFS032855*
Board of Investments (BOI) IncentivesThe Board of Investments issued certificates of registrations to the following companies inaccordance with the existing Omnibus Investment Code. The projects have been granted an IncomeTax Holiday (ITH) for a fixed period from the date of registration or actual start of operations,whichever is earlier.
Registration Date Project Location ITH Start ITH PeriodEconorth Resort Ventures Inc. November 21, 2017 Seda Lio March 2018 4 yearsCapitol Central Hotel Ventures, Inc.
September 08, 2017 Seda Capitol Central January 2018 4 years
Sentera Hotel Ventures, Inc. September 11, 2015 Seda Nuvali December 2015 4 yearsEcosouth Hotel Ventures, Inc. June 09, 2014 Seda Nuvali Hotel June 2014 4 yearsGreenhaven Properrty Ventures, Inc.
December 06, 2011 Holiday Inn & Makati Suites April 2013 6 years
Bonifaco Hotel Ventures, Inc. January 11, 2012 Seda BGC June 2018 6 yearsNorthgate Hotel Ventures Inc. February 09, 2012 Seda Centrio February 2012 6 yearsMDC Conqrete, Inc. November 10, 2015 Modular Housing November 2015 4 yearsBellaVita Land Corporation September 17, 2015 San Pablo, Laguna September 2015 4 yearsBellaVita Land Corporation May 05, 2015 Porac, Pampanga May 2015 4 yearsAmaia Land Corp July 18, 2018 Amaia Scapes Bulacan Sector 3B July 2018 3 yearsAmaia Land Corp. April 26, 2017 Amaia Steps Alabang - Delicia April 2017 3 yearsAmaia Land Corp. April 20, 2017 Amaia Steps Capitol Central April 2017 3 yearsAmaia Land Corp. April 20, 2017 Amaia Steps Sucat - Isabela April 2017 3 yearsAmaia Land Corp. December 15, 2016 Novaliches, QC December 2016 3 yearsAmaia Land Corp. September 29, 2016 Amaia Scapes Iloilo September 2016 4 yearsAmaia Land Corp November 24, 2015 Amaia Cabuyao S2 November 2015 3 yearsAmaia Land Corp September 29, 2015 Amaia Steps Capitol Central September 2015 4 yearsAmaia Land Corp August 24, 2015 Amaia Scapes CDO S1 August 2015 4 yearsAmaia Land Corp August 19, 2015 Amaia Nuvali Parkway August 2015 3 yearsAmaia Land Corp August 10, 2015 Amaia Scapes San Pablo August 2015 4 yearsAmaia Land Corp July 24, 2015 Amaia Steps Altaraza B-A July 2015 4 yearsAmaia Land Corp July 23, 2015 Amaia Gen. Trias S2 July 2015 3 yearsAmaia Land Corp July 21, 2015 Amaia Novaliches July 2015 3 yearsAmaia Land Corp July 20, 2015 Amaia Steps Pasig 1B July 2015 3 yearsAmaia Land Corp June 18, 2015 Amaia Scapes Bauan S1 June 2015 4 yearsAmaia Land Corp. June 4, 2015 Amaia Scapes Camsur S1 June 2015 4 yearsAmaia Land Corp. March 24, 2015 Amaia Steps Mandaue March 2015 3 yearsAmaia Land Corp. May 21, 2015 Amaia Scapes Batangas May 2015 4 yearsAmaia Land Corp. May 21, 2015 Amaia Cabuyao S1 May 2015 4 yearsAmaia Land Corp. March 11, 2015 Amaia Scapes Pampanga March 2015 4 yearsAmaia Land Corp. March 11, 2015 Amaia Scapes Trese S1 March 2015 4 yearsAmaia Land Corp. March 11, 2015 Amaia Shaw T1 March 2015 3 yearsAmaia Land Corp. February 11, 2015 Urdaneta Pangasinan February 2015 4 yearsAmaia Land Corp. February 11, 2015 Amaia Steps Nuvali February 2015 4 yearsAvida Land Corp. September 4, 2015 Avida Prime Taft Tower 3 September 2015 3 yearsAvida Land Corp. June 16, 2015 Avida Atria Tower 2 July 2015 3 yearsAvida Land Corp. June 16, 2015 Avida Serin East Tower 1 July 2015 3 yearsAvida Land Corp. April 30, 2015 Avida Altura Tower 2 May 2015 3 yearsAvida Land Corp. April 30, 2015 Avida Asten Tower 2 May 2015 3 years
25. Business Combinations and Acquisition of Non-controlling Interests
Business Combinations
MCT BerhadOn January 2, 2018, Ayala Land, Inc., (ALI) through its wholly owned subsidiary, Regent WiseInvestments Limited (RWIL), signed a share purchase agreement to acquire an additional 17.24%share in MCT Berhad (MCT), subject to completion of certain conditions.
On January 5, 2018, the transfer of shares was completed, increasing the Company’s shareholding inMCT to 50.19% from 32.95%. RWIL also issued a notice of an unconditional mandatory take-overoffer to the BOD of MCT, to acquire all remaining shares of the Company that are not already held byRWIL, following the completion of certain conditions to the share purchase agreement.

- 92 -
*SGVFS032855*
The mandatory take-over offer made in connection to the acquisition of additional shares in MCTclosed as of 5:00 p.m. (Malaysian time) February 19, 2018. Owners of 295,277,682 shares acceptedthe offer, equivalent to 22.12% of MCT’s total outstanding shares. As a result of the offer, ALI’sshareholdings in MCT increased from 50.19% to 72.31%. Total consideration paid is P=5.98 billion(see Note 11).
Subsequently, the Group remeasured its previously held interest in MCT based on its acquisition-datefair value which resulted to a remeasurement loss of P=1.79 billion.
The Group finalized the purchase price allocation of its acquisition of MCT through businesscombination in December 2018. The final purchase price allocation resulted in gain from bargainpurchase of P=1.85 billion.
The net gain of P=60 million from the acquisition is presented under ‘Other income’ account in theconsolidated statements of income.
The following are the fair values of the identifiable assets and liabilities assumed (in thousands):
AssetsCash and cash equivalents P=1,078,224Trade and other receivables 2,833,560Inventories 13,620,873Investment properties 5,712,635Property, plant and equipment 4,599,423Other noncurrent assets 69,222
27,913,937LiabilitiesAccounts and other payables 5,506,336Borrowings 2,752,114Income tax payable 128,551Deferred tax liabilities 2,287,772
10,674,773Net assets 17,239,164Total net assets acquired 12,465,640Acquisition cost (10,611,567)Negative goodwill P=1,854,073
The fair value of the trade and other receivables approximate their carrying amounts since these areshort-term in nature. None of the trade receivables have been impaired and it is expected that the fullcontractual amounts can be collected.
From January 8 to December 31, 2018, the Group’s share in MCT’s revenue and net incomeamounted to P=7.6 billion and P=1.3 billion.
Acquisition of Non-controlling Interests
Prime Orion Philippines, Inc. (POPI)In January 2018, ALI purchased additional 202,774,547 shares of POPI from Genez InvestmentCorporation for P=497.7 million increasing the Company’s ownership to 67%.
In February 2017, ALI purchased additional 631,000 common shares of POPI from BPI SecuritiesCorporation for P=1.26 million. ALI’s interest remains at 51% of the total POPI’s outstanding capitalstock.
In June 2017, Orion Land, Inc. (OLI), a subsidiary of POPI, acquired 512,480,671 common sharesequivalent to 11.69% ownership at P=2.45 share amounting to P=1,255.58 million. The acquisition of

- 93 -
*SGVFS032855*
POPI shares by OLI was treated as an acquisition of non-controlling interest resulting to a debit toequity reserve of P=405.18 million. This increased ALI’s effective ownership to 63.05%.
Cebu Holdings, Inc. (CHI)In 2018, ALI acquired additional 59,631,200 common shares of CHI totaling to P=352.8 million.Further, an additional 77,742,516 shares was acquired as a result of swap of CPVDC shares for atotal consideration of P=229.3 million which brings Parent Company’s ownership to 70.4%.
On various dates in 2017, ALI acquired a total of 5.1% additional ownership interest in CHI for a totalconsideration of P=574.99 million. This brought ALI’s ownership from 66.9% to 72.0% of theoutstanding capital stock of CHI and there was no change in control.
In 2016, ALI acquired a total of 10.5% additional ownership in CHI for a total consideration ofP=1,209.8 million. This brought ALI’s ownership from 56.4% to 66.9% of the outstanding capital stockof CHI and there was no change in control.
Laguna Technology, Inc. (LTI)In December 2018, ALI acquired 8,051 common shares of LTI for P=800.0 million increasing itsownership to 95%.
26. Related Party Transactions
Parties are considered to be related if one party has the ability, directly or indirectly, to control theother party or exercise significant influence over the other party in making financial and operatingdecisions. Parties are also considered to be related if they are subject to common control or commonsignificant influence which include affiliates.
In its regular conduct of business, the Group has entered into transactions with its parent company,associates and other related parties principally consisting of advances and reimbursement ofexpenses, purchase and sale of real estate properties, construction contracts, development,management, underwriting, marketing, leasing and administrative service agreements.
Terms and Conditions of Transactions with Related PartiesTransactions with related parties are made at normal market prices. Outstanding balances at yearend are unsecured, interest free and settlement occurs generally in cash, except otherwise indicated.There have been no guarantees provided or received for any related party receivables or payables.The Group does not provide any allowance relating to receivable from related parties.
This assessment is undertaken each financial year through examining the financial position of therelated parties and the markets in which the related parties operate.
The following tables provide the total amount of transactions that have been entered into with relatedparties for the relevant financial year (in thousands):
a. Transactions with Bank of the Philippine Islands (BPI), an associate of Ayala Corporation (AC)
Cash and cash equivalents earn interest from 2.5% to 6.0% per annum for Philippine Peso-denominated and 1.0% to 3.0% per annum for USD-denominated investments. Investment inFVPL are UITF which earns interest depending on the duration of time invested in the fund.Interest earned with investments in BPI for the year amounted to P=129.3 million, P=123.0 millionand P=56.7 million in 2018, 2017 and 2016, respectively.
Short-term debts are secured peso denominated bank loans with interest rate ranging from 5.5%to 5.6% while long-term debts bear fixed rates ranging from 4.5% to 6.9% and floating ratesranging from 5.4% to 6.5% per annum with remaining terms ranging from less than a year to9.9 years. Interest expense incurred on borrowings from BPI amounted to P=1,460.0 million,

- 94 -
*SGVFS032855*
P=458.17 million and P=628.8 million for the years ended December 31, 2018, 2017 and 2016,respectively.
As of December 31, 2018 and 2017, the Group maintains current and savings account, moneymarket placements and short-term and long-term debt payable with BPI broken down as follows:
2018 2017(In Thousands)
Cash in bank P=4,105,565 P=3,886,603Cash equivalents 3,312,150 4,362,631Marketable Securities 1,615,568 925,643Short term debt 4,476,000 5,405,000Long-term debt 9,696,981 12,292,473
b. Outstanding balances with parent company, associates and other related party
Receivables from/payables to other related parties pertain mostly to advances andreimbursement of operating expenses related to development cost and land acquisitions.Payables to related parties consist of expenses incurred on utilities, professional services andother miscellaneous services as well as purchases of vehicles. These are generally trade-related, noninterest-bearing and settled within one year.
Outstanding balances from/to related parties follow (amounts in thousands):
2018Receivable from related parties Payable to related parties
Current Noncurrent Total Current Noncurrent TotalParent Company P=140,137 P=– P=140,137 P=135,872 P=– P=135,872Associates 5,049,084 – 5,049,084 212,766 – 212,766Other related parties:Globe Telecom (Globe) 149,638 – 149,638 2,878 – 2,878Bank of the Philippine Islands 131,803 – 131,803 44,170 – 44,170Columbus 1 – 1 267,355 – 267,355Others 212,573 – 212,573 39,148 – 39,148
494,015 – 494,015 353,551 – 353,551P=5,683,236 P=– P=5,683,236 P=702,189 P=– P=702,189
2017Receivable from related parties Payable to related parties
Current Noncurrent Total Current Noncurrent TotalParent Company P=100,648 P=– P=100,648 P=73,123 P=– P=73,123Associates 1,154,972 – 1,154,972 222,310 – 222,310Other related parties:Globe Telecom (Globe) 126,007 – 126,007 3,792 – 3,792Bank of the Philippine Islands 122,675 – 122,675 44,125 – 44,125Columbus – – – 267,355 – 267,355Others 230,175 – 230,175 29,442 – 29,442
478,857 – 478,857 344,714 – 344,714P=1,734,477 P=– P=1,734,477 P=640,147 P=– P=640,147
c. Revenue and expenses from related parties
The revenue from parent company, associates and other related parties pertains mostly toincome from leasing and development projects while expenses composed of management feesand training expenses. These are usually non-interest bearing and not impaired. Transactionsare settled within one year.
Revenue and expenses from related parties follow:

- 95 -
*SGVFS032855*
Revenue from related parties:
2018 2017 2016(In Thousands)
Parent Company P=28,081 P=5,114 P=51,914Associates 4,703,524 1,564,343 258,685Other Related PartiesBank of the Philippine Islands 330,519 192,803 222,045Manila Water Philippine Ventures, Inc. 218,127 1,118 –Globe Telecom, Inc. 193,899 113,889 221,243Innove Communications 6,909 271 –Manila Water Company, Inc. (MWCI) 2,653 2,384 1,128Laguna AAA Waterworks Corp.
(LAWC) 1,500 1,500 1,500Michigan Holdings, Inc. 1,101 1,198 –Psi Technologies − 82,164 109,486Panay Medical Ventures, Inc. − 57,356 –Others 868 2,522 19,528
755,576 455,205 574,930Total P=5,487,181 P=2,024,662 P=885,529
Expenses from related parties:
2018 2017 2016(In Thousands)
Parent Company P=1,035 P=16,489 P=29,318Associates 3,153,547 206,050 194,792
Other Related PartiesManila Water Company, Inc. 385,925 222,386 194,836Bank of the Philippine Islands 296,002 195,143 217,097Innove Communications, Inc. 68,805 52,129 42,238AG Counselors Corp. 60,718 172,799 179,881Globe Telecom, Inc. 53,920 50,131 58,434Manila Water Philippine Ventures, Inc. 53,038 117,078 –LAWC 6,202 5,564 –Others 371,342 77,406 177,360
1,295,952 892,636 869,846Total P=4,450,534 P=1,115,175 P=1,093,956
The following describes the nature of the material transactions of the Group with related parties as ofDecember 31, 2018 and 2017:
∂ On January 12, 2016, the Parent Company has entered into a partnership with Manila WaterPhilippine Ventures, Inc., a wholly owned subsidiary of Manila Water Company, Inc., for thewaterworks of ALI’s projects nationwide. The MOA was signed by ALI and its subsidiaries andaffiliates, Cebu Holdings, Inc. and Cebu Property Ventures and Development Corp. Revenueand expense in 2018 amounted to P=218.1 million and P=53.0 million, respectively, and P=1.1 millionand P=117.1 million in 2017, respectively.
∂ Certain credit facilities with BPI with a total carrying value of P=14,170.3 million andP=17,697.5 million as of December 31, 2018 and 2017, respectively, are secured by a real estatemortgage. This is in compliance with BSP ruling on directors, officers, stockholders and relatedinterests.
- 96 -
*SGVFS032855*
∂ On April 17, 2012, AC awarded the Daang Hari-SLEX Link road project to MDC with total contractprice of P=804.4 million. The scope of work includes the construction of a 4 km. toll road that willexit South Luzon near the Susana Heights Interchange passing through government properties inMuntinlupa and will end in Daang Hari in Imus, Cavite. The project was started last June 2012and was completed in June 2015. Additional accomplishments from change orders in 2016amounting to 46.3 million, pertain to direct works on the toll plaza, main tunnel across SLEXand segments of roads in Daang Hari.
∂ In October 2012, BG South, a subsidiary of Alveo, entered into a contract with FBDC for thepurchase of land in Bonifacio Global City. The Deed of Absolute Sale related to the contract wasexecuted in 2012 for which the purchase price amounted to P=806.4 million, plus VAT. As of2018, P=859.4 million, inclusive of VAT, were paid by BG South. Outstanding payable amountedto P=43.8 million and P=175.1 million as of December 31, 2018 and 2017, respectively.
∂ In November 2012, BG South, subsequently entered into a contract with FBDC for the purchaseof land in Bonifacio Global City. The Deed of Absolute Sale related to the contract was executedin 2012 for which the purchase price amounted to 727.8 million, plus VAT. As of 2018,P=811.9 million, inclusive of VAT, were paid by BG South. Outstanding payable amounted toP=3.3 million and P=13.3 million as of December 31, 2018 and 2017, respectively.
∂ In July 2013, BG South, subsequently entered into a contract with FBDC for the purchase of landin Bonifacio Global City. The Deed of Absolute Sale related to the contract was executed in 2013for which the purchase price amounted to P=1,424 million, plus VAT. As of 2018, P=1,595 million,inclusive of VAT, were paid by BG South. Outstanding payable amounted to nil andP=520.3 million as of December 31, 2018 and 2017, respectively.
∂ On May 20, 2013, DirectPower and its customers, which are all within the Ayala Group, enteredinto a Retail Electricity Supply contract wherein DirectPower agreed to supply electricity at aspecific rate pursuant to the provisions and implementing rules and regulations of R.A. No. 9136or the Electric Power Industry Reform Acts of 2001. Among the customers of Direct Power areFBDC, LDC, BPI, San Lazaro BPO Complex and 6750 Ayala Ave.
∂ The Group sold residential receivables on a without recourse basis to BPI Family Savings Bank,Inc., a related party, amounting to P=2,206.0 million and P=986.9 million in 2018 and 2017,respectively. Proceeds of receivables sold to BPI amounted to P=2,082.8 million in 2018 andP=930.2 million in 2017. The Group recognized loss on sale (under “Other charges”) amounting toP=123.3 million and P=56.7 million in 2018 and 2017, respectively.
∂ Revenue from Globe pertains to development management fee and for lease of spaces.∂ As of December 31, 2018 and 2017, the funds include investment in securities of its related
parties with carrying value of P=1.5 billion and P=0.5 billion, respectively (see Note 27).
d. Remuneration of Key Management Personnel (KMP)
Key management personnel of the Group include all officers with position of vice president andup. Compensation of key management personnel amounted to P=172.2 million and P=141.3 millionin 2018 and 2017, respectively.
Compensation of key management personnel by benefit type follows:
2018 2017(In Thousands)
Short-term employee benefits P=156,678 P=129,686Post-employment benefits (Note 27) 15,497 11,623
P=172,175 P=141,309
27. Retirement Plan
The Group has funded, noncontributory tax-qualified defined benefit type of retirement plans (thePlan) covering substantially all of their employees. The benefits are based on a defined benefitformula.

- 97 -
*SGVFS032855*
The Plan aims to maintain a full funding, i.e., the Plan’s assets fully covered the Plan’s liabilities, asmeasured through generally accepted actuarial methodologies. Such will provide a higher level ofassurance that all promised benefits can be paid from existing assets and expected investmentreturns. The target funded status is within the range of 80% to 100%.
The Group’s fund is in the form of a trust fund being maintained by the trustee banks such as BPIAsset Management and Trust Corporation (collectively the “Retirement Fund”). The primary objectiveof the Retirement Fund is to achieve the highest total rate of return possible, consistent with a prudentlevel of risk. The investment strategy articulated in the asset allocation policy has been developed inthe context of long-term capital market expectations, as well as multi-year projections of actuarialliabilities. Accordingly, the investment objectives and strategies emphasize a long-term outlook, andinterim performance fluctuations will be viewed with the corresponding perspective.
The components of expense (included in manpower costs under “General and administrativeexpenses”) in the consolidated statements of income follows:
2018 2017 2016(In Thousands)
Current service cost P=310,759 P=372,590 P=283,522Past service cost 10,563 − −Net interest cost on benefit obligation 77,418 149,523 99,337Total pension expense P=398,740 P=522,113 P=382,859
The remeasurement effects recognized in other comprehensive income (included in Equity under“Remeasurement loss on defined benefit plans”) in the consolidated statements of financial positionfollow:
2018 2017 2016(In Thousands)
Return loss plan assets (excluding amountincluded in net interest) P=184,923 P=22,169 P=49,760
Remeasurement loss (gain) due to liabilityexperience 101,979 (55,893) (73,212)
Remeasurement gain due to liabilityassumption changes - demographic (2,476) (14,319) −
Remeasurement gain due to liabilityassumption changes - economic (369,807) (233,247) (84,504)
Remeasurements in other comprehensiveincome (P=85,381) (P=281,290) (P=107,956)
The funded status and amounts recognized in the consolidated statement of financial position for theretirement plan as of December 31, 2018 and 2017, are as follows:
2018 2017(In Thousands)
Benefit obligations P=3,676,584 P=3,560,752Plan assets (2,188,451) (2,101,603)Net pension liability position P=1,488,133 P=1,459,149
As of December 31, 2018 and 2017 pension assets (included under “other noncurrent assets”)amounted to P=62.1 million and P=76.5 million, respectively, and pension liabilities amounted toP=1,550.2 million and P=1,535.7 million, respectively.

- 98 -
*SGVFS032855*
Changes in net defined benefit liability of funded plans in 2018 are as follows (in thousands):
Net benefit cost in consolidatedstatement of income Remeasurements in other comprehensive income
January 1,2018
Currentservice cost
Past servicecost
Netinterest Subtotal
Benefitspaid
Returnon planAssets*
Remeasurementloss
due toliability
experience
Remeasurementgain
due toliability
assumptionchanges -
demographic
Remeasurementgain
due toliability
assumptionchanges -economic
Netremeasure-
ment lossContributionby employer
Transferin /(out)
December 31,2018
Present value of defined benefitobligation P=3,560,752 P=310,759 P=10,563 P=194,009 P=515,331 (P=291,482) P=– P=101,979 (P=2,476) (P=199,045) (99,542) P=– (P=8,475) P=3,676,584
Fair value of plan assets (2,101,603) – – (116,591) (116,591) 112,806 184,923 – – – 184,923 (317,518) 49,532 (2,188,451)Net defined benefit liability
(asset) P=1,459,149 P=310,759 P=10,563 P=77,418 P=398,740 (P=178,676) P=184,923 P=101,979 (P=2,476) (P=199,045) 85,381 (P=317,518) P=41,057 P=1,488,133*excluding amount included in net interest
Changes in net defined benefit liability of funded plans in 2017 are as follows (in thousands):
Net benefit cost in consolidatedstatement of income Remeasurements in other comprehensive income
January 1,2017
Currentservice cost
Past servicecost
Netinterest Subtotal
Benefitspaid
Returnon planAssets*
Remeasurement(gain)/loss
due toliability
experience
Remeasurement(gain)/loss
due toliability
assumptionchanges -
demographic
Remeasurement(gain)/loss
due toliability
assumptionchanges -economic
Netremeasure-
ment lossContributionby employer
Transferin /(out) Settlements
December 31,2017
Present value of defined benefitobligation P=3,573,076 P=372,590 P=− P=255,112 P=627,702 (P=280,414) P=– (P=55,893) (P=14,319) (P=233,247) (P=303,459) P=– (P=17,309) P=(38,844) P=3,560,752
Fair value of plan assets (2,147,750) – – (105,589) (105,589) 292,343 22,169 – – – 22,169 (201,620) − 38,844 (2,101,603)Net defined benefit liability (asset) P=1,425,326 P=372,590 P=– P=149,523 P=522,113 P=11,929 P=22,169 (P=55,893) (P=14,319) (P=233,247) (P=281,290) (P=201,620) (P=17,309) P=– P=1,459,149*excluding amount included in net interest

- 99 -
*SGVFS032855*
All equity and debt instruments held have quoted prices in an active market. The remaining planassets do not have quoted market prices in an active market.
The plan assets have diverse investments and do not have any concentration risk.
The fair value of plan assets by each class as at the end of the reporting period are as follows:
December 312018 2017
(In Thousands)Cash and cash equivalents P=25,316 P=99,619Equity investmentsUnit Investment Trust Funds 168,235 174,888Mutual Funds 1,699 90,727Holding Firms 145,042 56,937Financials 56,256 37,021Property 60,689 31,708Industrials 14,229 15,168Services 4,422 10,213Mining and Oil - 10
450,572 416,672Debt investmentsGovernment securities 513,434 639,492AAA rated debt securities 549,416 466,886Not rated debt securities 649,140 431,374
1,711,990 1,537,752Other assets 573 47,560
P=2,188,451 P=2,101,603
The Retirement Fund’s investments will be appropriately diversified to control overall risk and willexhibit portfolio characteristics similar to the set benchmark for each asset class. In case ofsecurities, the aggregate holdings of any security may not exceed 10% of the Plan assets. Thecriteria for including an asset class in the strategic policy include: (a) wide recognition and acceptanceamong institutional investors; (b) low correlation with other accepted asset classes; and (c) ameaningful performance history. The Group expects to make contributions of P=457.98 million to itsretirement fund in 2019.
The allocation of the fair value of plan assets follows:
2018 2017Investments in debt securities 78.23% 73.17%Investments in equity securities 20.59% 19.83%Others 1.18% 7.00%
Funds invested in debt securities include government securities, corporate notes and bonds andmoney market placements. Investments in equity securities consist of investments in PSE listedstocks and unit investment trust funds. Others were in the form of cash and cash equivalents.
The Group’s transactions with the funds mainly pertain to contributions, benefit payments andsettlements.

- 100 -
*SGVFS032855*
As of December 31, 2018 and 2017, the funds include investment in securities of its related parties(see Note 26). Details of the investment per type of security are as follows:
December 31, 2018December 31,
2017Carrying
ValueFair
ValueUnrealized
(Gain) LossFair
Value(In Thousands)
Investments in debt securities P=1,123,977 P=1,100,365 P=23,612 P=350,270Investments in equity securities 343,794 334,123 9,671 106,459Others 31,000 31,539 (539) 57,858
P=1,498,771 P=1,466,027 P=32,744 P=514,587
The plan assets include shares of stock of the Parent Company with fair value amounting toP=27.7 million, and P=17.7 million as of December 31, 2018 and 2017, respectively. The ParentCompany gives the trustee bank the discretion to exercise voting rights over the shares. The planassets include debt securities of the Parent Company amounting to P=62.9 million and P=74.2 million asof December 31, 2018 and 2017, respectively. The loss of the fund arising from investment in debtand equity securities of the Parent Company amounted to P=1.1 million in 2017 (nil in 2018).
The cost of defined benefit pension plans and other post-employment medical benefits as well as thepresent value of the pension liabilities are determined using actuarial valuations. The actuarialvaluation involves making various assumptions. The principal assumptions used in determiningpension and post-employment medical benefit obligations for the defined benefit plans are shownbelow:
2018 2017Discount rates 5.50 to 8.48% 4.98 to 5.89%Future salary increases 3.0 to 8.0% 1.2 to 8.0%
The sensitivity analysis below has been determined based on reasonably possible changes of eachsignificant assumption on the defined benefit obligation as of the end of the reporting period,assuming all other assumptions were held constant:
2018
Effect on income before income taxIncrease (decrease)
Change in basis points+ 100 basis
points- 100 basis
points(In Thousands)
Discount rate (P=174,364) P=205,983Salary increase rate 205,103 (176,441)
2017
Effect on income before income taxIncrease (decrease)
Change in basis points+ 100 basis
points- 100 basis
points(In Thousands)
Discount rate (P=192,030) P=385,674Salary increase rate 375,423 (182,399)

- 101 -
*SGVFS032855*
Shown below is the maturity analysis of the undiscounted benefit payments:
Year ending: 2018 2017(In Thousands)
1 year and less P=457,984 P=292,760more than 1 years to 5 years 1,847,382 1,646,853more than 5 years to 10 years 1,965,131 1,981,683more than 10 years to 15 years 4,614,824 9,805,099more than 15 years to 20 years 1,469,983 769,920more than 20 years 11,679,381 5,202,878
The average duration of the defined benefit obligation is 5.3 to 24.0 years and 7.6 to 26.1 years in2018 and 2017, respectively.
28. Earnings Per Share
The following tables present information necessary to compute EPS (amounts in thousands exceptEPS):
EPS on net income attributable to equity holders of Ayala Land, Inc. are as follows:
2018 2017 2016(In Thousands)
Net income attributable to equity holders of Ayala Land, Inc. P=29,240,880 P=25,304,965 P=20,908,011Less: dividends on preferred stock (62,038) (62,038) (62,038)Net income attributable to equity holders of the Parent
Company for basic and diluted earnings per share P=29,178,842 P=25,242,927 20,845,973Weighted average number of common shares for basic EPS 14,730,049 14,721,881 14,588,347Add: dilutive shares arising from stock options 966 66,997 1,196Adjusted weighted average number of common shares for
diluted EPS 14,731,015 14,788,878 14,589,543Basic and diluted EPS P=1.98 P=1.71 P=1.43
Basic EPS is computed by dividing net income for the year attributable to common equity holders ofthe Company by the weighted average number of common shares issued and outstanding during theyear adjusted for any subsequent stock dividends declared.
Diluted EPS is computed by dividing net income for the year attributable to common equity holders ofthe Company by the weighted average number of common shares issued and outstanding during theyear plus the weighted average number of common shares that would be issued on conversion of allthe dilutive potential common shares into common shares. The calculation of diluted earnings pershare does not assume conversion, exercise, or other issue of potential common shares that wouldhave an antidilutive effect on earnings per share.
The convertibility of the preferred shares will start on the 10th year from the issue date which was in2012. This has an antidilutive effect on the computation of diluted EPS.
29. Stock Options and Ownership Plans
The Parent Company has stock option plans for key employees covering 2.5% of the ParentCompany’s authorized capital stock. The grantee is selected based on certain criteria likeoutstanding performance over a three-year period.

- 102 -
*SGVFS032855*
ESOPThe ESOP grantees may exercise in whole or in part the vested allocation in accordance with thevesting percentage and vesting schedule stated in the ESOP. Also, the grantee must be anemployee of the Parent Company or any of its subsidiaries during the 10-year option period. In casethe grantee retires, he is given 3 years to exercise his vested and unvested options. In case thegrantee resigns, he is given 90 days to exercise his vested options.
The Parent Company has no ESOP grant and availment during 2018, 2017 and 2016.
ESOWNIn November 2001, the Parent Company offered all its ESOWN subscribers with outstanding ESOWNsubscriptions the option to cancel the subscriptions within the 5-year holding period. InDecember 2001, the program for ESOWN was indefinitely suspended.
In 2005, the Parent Company introduced a revised ESOWN Plan (the Plan) wherein grantees maysubscribe in whole or in part to the shares awarded to them based on a discounted market price thatwas determined by the Compensation Committee as the offer price set at grant date. The granteespaid for the shares subscribed through installments over a maximum period of ten (10) years. Thesubscription is subject to a holding period stated in the plan. To subscribe, the grantee must be anemployee of the Parent Company or any of its subsidiaries during the ten (10)-year payment period.In case the grantee resigns, unsubscribed shares are cancelled, while the subscription may be paidup to the percent of holding period completed and payments may be converted into the equivalentnumber of shares. In case the grantee is separated, not for cause, but through retrenchment andredundancy, subscribed shares may be paid in full, unsubscribed shares may be subscribed, orpayments may be converted into the equivalent number of shares. In case the grantee retires, thegrantee may subscribe to the unsubscribed shares anytime within the ten (10)-year period. The plandoes not allow sale or assignment of the shares. All shares acquired through the Plan are subject tothe Parent Company’s right to repurchase.
The subscribed shares are effectively treated as options exercisable within a given period which isthe same time as the grantee’s payment schedule. The fair values of stock options granted areestimated on the date of grant using the Black-Scholes Merton (BSM) Formula and Binomial TreeModel (BTM), taking into account the terms and conditions upon which the options were granted.The BSM Formula and BTM Model requires six inputs to produce an option stock value namely;market value of the share, book value of the share, time to maturity, volatility rate, dividend yield, andrisk free rate. The expected volatility was determined based on an independent valuation.
Movements in the number of options outstanding and weighted average exercise prices (WAEP)under ESOWN follow:
2018 WAEP 2017 WAEPAt January 1 5,150,628 P=19.31 7,288,035 P=19.95Granted 10,384,365 11,420,517Subscribed (9,933,523) 41.14 (12,264,970) 33.32Availment 96,516 113,541Cancelled (96,516) (1,406,495)At December 31 5,601,470 P=32.71 5,150,628 P=19.31

- 103 -
*SGVFS032855*
The fair value of stock options granted under ESOWN at grant date and the assumptions used todetermine the fair value of the stock options follow:
Grant DateMarch 28,
2018March 01,
2017April 05,
2016March 20,
2015March 20,
2014March 18,
2013March 13,
2012March 31,
2011Number of unsubscribed
shares − − 181,304 − 1,369,887 1,713,868 3,967,302 3,843,057Fair value of each option
(BTM) P=− P=8.48 P=13.61 P=16.03 P=12.60 P=16.05 P=9.48 P=7.81Fair value of each option
(BSM) P=12.71 P=− P=18.21 P=20.63 P=12.16 P=11.85 P=6.23 P=7.27Weighted average share price P=41.02 P=39.72 P=35.58 P=36.53 P=31.46 P=30.00 P=21.98 P=15.5Exercise price P=45.07 P=35.81 P=26.27 P=29.58 P=22.55 P=21.45 P=14.69 P=13.2Expected volatility 34.04% 30.95% 32.03% 31.99% 33.50% 36.25% 33.00% 36.25%Dividend yield 1.22% 1.34% 1.27% 1.02% 1.42% 1.93% 0.9% 1.01%Interest rate 4.14% 4.41% 4.75% 4.11% 3.13% 2.78% 5.70% 5.60%
Total expense (included under “General and administrative expenses”) recognized in 2018, 2017 and2016 in the consolidated statements of income arising from share-based payments amounted toP=98.52 million, P=153.8 million and P=208.3 million, respectively (see Note 23).
POPIPOPI introduced the ESOWN Plan (the Plan) wherein grantees (employees within POPIGroup) may subscribe in whole or in part to the shares awarded to them based on a discountedmarket price, but in no case lower than the par value, that was determined at grant date. Thegrantees paid for the shares subscribed through installments over a maximum period of ten (10)years. To subscribe, the grantee must be an employee, officer or director of POPI as of June 30,2015. In case the grantee resigns, unsubscribed shares are cancelled and returned to the plan pool,while the subscription payments may be converted into the equivalent number of shares. In case thegrantee is separated, not for cause, but through retrenchment and redundancy, subscribed sharesmay be paid in full, unsubscribed shares may be subscribed, or payments may be converted into theequivalent number of shares. In case the grantee retires, the grantee may subscribe to theunsubscribed shares anytime within the ten (10)-year period. The plan does not allow sale orassignment of the shares.
The BOD of POPI approved the allocation of 32 million shares (first tranche) for ESOWN plan whichwill be taken from the remaining unissued shares (with grant date in 2016) and the increase inauthorized of stock of POPI, which was approved by the SEC in July 2016. In 2017, notice of grantfor the 218 million shares (second tranche of ESOWN plan) was issued to employees for the right tosubscribe to the common shares of POPI at P=1.68 per share which were fully availed as ofDecember 31, 2018. In 2018, POPI has no ESOWN grant.
The fair values of these options are estimated on the date of grant using the Cox-Ross-Rubensteinoption pricing model. The assumptions used to determine the fair value of the stock options are asfollows:
December 31, 2017 June 30, 2016Share price at the date of grant P=2.12 P=1.76Risk free interest rate 5.6818% 4.0915%Annualized volatility 49.68% 56.00%Annual dividend yield − −Exit rates − −Termination for cause − −Voluntary resignation − 0.15%Involuntary separation 7.29% 0.15%
The resulting personnel expense recognized for the periods ended December 31, 2017 and June 30,2016 amounted to P=33.34 million and P=27.47 million, respectively (nil for the six months endedDecember 31, 2016 and December 31, 2018).

- 104 -
*SGVFS032855*
30. Financial Assets and Liabilities
Fair Value InformationThe following tables set forth the carrying values and estimated fair values of the Group’s financialassets and liabilities recognized as of December 31, 2018 and 2017:
December 31, 2018 December 31, 2017Carrying
Value Fair ValueCarrying
Value Fair Value(In Thousands)
Financial Assets at FVPL P=476,245 P=476,245 P=540,606 P=540,606Financial Assets at FVOCIUnquoted equity securities 521,912 521,912 − −Quoted equity securities 973,882 973,882 − −
1,495,794 1,495,794 − −Available-for-Sale Financial AssetsUnquoted equity securities − − 523,693 523,693Quoted equity securities − − 951,548 951,548
− − 1,475,241 1,475,241P=1,972,039 P=1,972,039 P=2,015,847 P=2,015,847
Loans and ReceivablesNoncurrent trade residential and office
developmentP=− P=− P=89,198,616 P=89,355,705
Receivable from employees − − 831,860 831,875P=− P=− P=90,030,476 P=90,187,580
Financial assets at amortized costNoncurrent trade residential and office
developmentP=− P=− − −
Receivable from employees 1,113,205 1,119,854 − −P=1,113,205 P=1,119,854 − −
Other financial liabilitiesLong-term debt P=172,712,122 P=155,719,341 P=156,741,406 P=149,526,824Deposits and other noncurrent liabilities 39,607,119 38,193,626 43,497,420 39,724,172
P=212,319,241 P=193,912,967 P=200,238,826 P=189,250,996
The methods and assumptions used by the Group in estimating the fair value of the financialinstruments are as follows:
Cash and cash equivalents, short-term investments and current receivables, accounts and otherpayables, current payables and short term debt - Carrying amounts approximate fair values due tothe relatively short-term maturities of these financial instruments.
Financial assets at FVPL - UITF - These are investments in fund. Fair value is based on net assetvalues as of reporting dates.
Noncurrent accounts and notes receivables - The fair values of residential accounts and notesreceivable, and receivable from employees, are based on the discounted value of future cash flowsusing the applicable rates for similar types of instruments. The discount rates used ranged from2.90% to 6.37% and 4.53% to 7.20% as of December 31, 2018 and 2017.
Financial assets at FVOCI and AFS quoted equity securities - fair values are based on quoted pricespublished in markets.
Financial assets at FVOCI unquoted equity securities – fair values are based on the latest sellingprice available.

- 105 -
*SGVFS032855*
AFS unquoted equity securities - These are carried at cost less allowance for impairment lossesbecause fair value cannot be measured reliably due to lack of reliable estimates of future cash flowsand discount rates necessary to calculate the fair value.
Liabilities - The fair value of noncurrent unquoted instruments (long-term debt and deposits) areestimated using the discounted cash flow methodology using the Group’s current incrementalborrowing rates for similar borrowings with maturities consistent with those remaining for the liabilitybeing valued. The discount rates used ranged 7.28% to 8.79% and 3.93% to 7.20% as ofDecember 31, 2018 and 2017, respectively. The fair value of noncurrent unquoted debt instrumentswith floating rates are estimated using discounted cash flow - last repricing method.
Fair Value HierarchyThe Group uses the following hierarchy for determining and disclosing the fair value of the financialinstruments by valuation technique:
Level 1: quoted (unadjusted prices) in active markets for identical assets and liabilitiesLevel 2: other techniques for which all inputs which have a significant effect on the recorded fair valueare observable, either directly or indirectlyLevel 3: techniques which use inputs which have a significant effect on the recorded fair value thatare not based on observable market data
The Group categorizes trade receivable, receivable from employees, long-term debt and deposits andother noncurrent liabilities under Level 3. The fair value of these financial instruments is determinedby discounting future cash flows using the applicable rates of similar types of instruments plus acertain spread. This spread is the unobservable input and the effect of changes to this is that thehigher the spread, the lower the fair value.
Quoted FVOCI and AFS financial assets amounting to P=913.7 million and P=951.5 million as ofDecember 31, 2018, and 2017, respectively, were classified under Level 1 (see Note 10).
Unquoted FVOCI financial assets amounting to P=582.1 million as of December 31, 2018 wereclassified under Level 3 (see Note 10).
Investment in Arch Capital Fund amounting to P=390.5 million and P=457.6 million as of December 31,2018, and 2017, respectively, were classified under Level 3 (see Note 6).
Investment in Unit Investment Trust Fund (UITF) amounting to P=85.72 million and P=82.98 million asof December 31, 2018, and 2017, respectively were classified under Level 2 (see Note 6).
There have been no reclassifications from Level 1 to Level 2 categories in 2018 and 2017.
Financial Risk Management Objectives and PoliciesThe Group’s principal financial instruments comprise of cash and cash equivalents, short-terminvestment, financial assets at FVPL, AFS quoted and unquoted equity securities, investments inbonds, bank loans, corporate notes and bonds. The financial debt instruments were issued primarilyto raise financing for the Group’s operations. The Group has various financial assets such as tradereceivables and trade payables which arise directly from the conduct of its operations.
Exposure to liquidity, credit, interest rate, currency and equity risks arise in the normal course of theGroup’s business activities. The main objectives of the Group’s financial risk management are asfollows:
∂ to identify and monitor such risks on an ongoing basis;∂ to minimize and mitigate such risks; and∂ to provide a degree of certainty about costs.

- 106 -
*SGVFS032855*
The use of derivative financial instruments, if any, is solely for management of the Group’s financialrisk exposures. It is the Group’s policy not to enter into derivative transactions for speculativepurposes.
The Group’s financing and treasury function operates as a centralized service for managing financialrisks and activities as well as providing optimum investment yield and cost-efficient funding for theGroup.
There were no changes in the Group’s financial risk management objectives and policies in 2018 and2017.
Liquidity riskLiquidity risk is defined by the Group as the risk of losses arising from funding difficulties due todeterioration in market conditions and/or the financial position of the Group that make it difficult for theGroup to raise the necessary funds or that forces the Group to raise funds at significantly higherinterest rates than usual.
This is also the possibility of experiencing losses due to the inability to sell or convert marketablesecurities into cash immediately or in instances where conversion to cash is possible but at a lossdue to wider than normal bid-offer spreads.
The Group employs scenario analysis and contingency planning to actively manage its liquidityposition and guarantee that all operating, investing and financing needs are met. The Group hascome up with a three-layered approach to liquidity through the prudent management of sufficient cashand cash equivalents, the potential sale of accounts receivables and the maintenance of short-termrevolving credit facilities.
Cash and cash equivalents are maintained at a level that will enable it to fund its general andadministrative expenses as well as to have additional funds as buffer for any opportunities oremergencies that may arise. Management develops viable funding alternatives through a continuousprogram for the sale of its receivables and ensures the availability of ample unused short-termrevolving credit facilities from both local and foreign banks as back-up liquidity.
The Group ascertains that its cash is invested in short-term bank placements and special depositaccounts, as well as in high-quality and marketable government and corporate securities.
The table summarizes the maturity profile of the Group’s financial liabilities at December 31, 2018and 2017 based on contractual undiscounted payments:
December 31, 2018
< 1 year >1 to < 5 years > 5 years Total(In Thousands)
Accounts and other payables P=150,010,885 P=– P=– P=150,010,885Short-term debt 14,386,717 − – 14,386,717Long-term debt 23,239,191 83,586,294 65,886,637 172,712,122Deposits and other current liabilities 5,544,289 − − 5,544,289Deposits and other noncurrent
liabilities − 32,437,911 5,502 32,443,413193,181,082 116,024,205 65,892,139 375,097,426
Interest payable* P=6,801,028 P=23,189,458 P=8,041,909 P=38,032,395*includes future interest payment

- 107 -
*SGVFS032855*
December 31, 2017
< 1 year >1 to < 5 years > 5 years Total(In Thousands)
Accounts and other payables P=116,440,223 P=– P=– P=116,440,223Short-term debt 17,644,350 − – 17,644,350Long-term debt 6,583,334 67,181,422 83,633,192 157,397,948Deposits and other current liabilities 3,359,779 − − 3,359,779Deposits and other noncurrent
liabilities − 42,769,030 728,390 43,497,420144,027,686 109,950,452 84,361,582 338,339,720
Interest payable* P=6,207,902 P=23,029,949 P=11,764,882 P=41,002,733*includes future interest payment
Cash and cash equivalents, short-term investments and financial assets at FVPL are used for theGroup’s liquidity requirements. Please refer to the terms and maturity profiles of these financialassets shown on the maturity profile of the interest-bearing financial assets and liabilities disclosed inthe interest rate risk section. There are no undrawn loan commitments from long-term credit facilitiesas of December 31, 2018 and 2017.
Credit riskCredit risk is a risk that a counterparty will not meet its obligation under its financial instrument orcustomer contract leading to a financial loss.
The Group’s credit risks are primarily attributable to installments receivable, rental receivables andother financial assets. To manage credit risks, the Group maintains defined credit policies andmonitors its exposure to credit risks on a continuous basis.
In respect of installments receivable from the sale of properties, credit risk is managed primarilythrough credit reviews and an analysis of receivables on a continuous basis. The Group alsoundertakes supplemental credit review procedures for certain installment payment structures. TheGroup’s stringent customer requirements and policies in place contribute to lower customer defaultthan its competitors. Customer payments are facilitated through various collection modes includingthe use of postdated checks and auto-debit arrangements. Exposure to bad debts is not significantas title to real estate properties are not transferred to the buyers until full payment has been madeand the requirement for remedial procedures is minimal given the profile of buyers.
Credit risk arising from rental income from leasing properties is primarily managed through a tenantselection process. Prospective tenants are evaluated on the basis of payment track record and othercredit information. In accordance with the provisions of the lease contracts, the lessees are requiredto deposit with the Group security deposits and advance rentals which helps reduce the Group’scredit risk exposure in case of defaults by the tenants. For existing tenants, the Group has put inplace a monitoring and follow-up system. Receivables are aged and analyzed on a continuous basisto minimize credit risk associated with these receivables. Regular meetings with tenants are alsoundertaken to provide opportunities for counseling and further assessment of paying capacity.
Other financial assets are comprised of cash and cash equivalents excluding cash on hand, short-term investments, financial assets at FVPL and financial assets at FVOCI. The Group adheres tofixed limits and guidelines in its dealings with counterparty banks and its investment in financialinstruments. Bank limits are established on the basis of an internal rating system that principallycovers the areas of liquidity, capital adequacy and financial stability. The rating system likewisemakes use of available international credit ratings. Given the high credit standing of its accreditedcounterparty banks, management does not expect any of these financial institutions to fail in meetingtheir obligations. Nevertheless, the Group closely monitors developments over counterparty banksand adjusts its exposure accordingly while adhering to pre-set limits.

- 108 -
*SGVFS032855*
The Group’s maximum exposure to credit risk as of December 31, 2018 and 2017 is equal to thecarrying values of its financial assets.
Given the Group’s diverse base of counterparties, it is not exposed to large concentrations of creditrisk.
An impairment analysis is performed at each reporting date using a provision matrix to measureexpected credit losses. The provision rate based on days past due of all customers as they havesimilar loss patterns. Generally, trade receivables are written off if past due for more than one yearand are not subject to enforcement activity. The security deposits and advance rental are consideredin the calculation of impairment as recoveries. As of December 31, 2018 and 2017, the exposure atdefault amounts to P=24,674.0 million and P=73,948.2 million, respectively. The expected credit lossrate is 3.5% and 1.0% that resulted in the ECL of P=872.3 million and P=725.9 million as ofDecember 31, 2018 and December 31, 2017, respectively.

- 109 -
*SGVFS032855*
As of December 31, 2018 and 2017, the aging analysis of past due but not impaired trade receivables presented per class follow:
December 31, 2018
NeitherPast Due nor Past Due but not Impaired Individually
Impaired <30 days 30-60 days 61-90 days 91-120 days >120 days Total Impaired Total(In Thousands)
Trade:Residential and office development P=31,149,975 P=1,365,932 P=840,946 P=481,319 P=328,043 P=2,264,139 P=5,280,379 P=− P=36,430,354Shopping centers 996,664 409,377 296,025 308,243 62,595 252,583 1,328,823 360,794 2,686,281Construction contracts 1,343,275 418,124 9,746 8,789 4,738 61,872 503,269 26,547 1,873,091Corporate business 3,832,306 333,030 97,304 73,108 93,023 396,319 992,784 60,780 4,885,870Management fees 49,203 − 8,896 4,690 5,699 12,009 31,294 5,550 86,047Others 2,504,430 32,641 152,302 9,112 11,201 244,734 449,990 146,577 3,100,997
Advances to other companies 14,159,361 4,043 510,092 24,994 102,893 5,016,498 5,658,520 5,900 19,823,781Accrued receivables 5,285,913 394,184 103,466 100,677 210,836 708,084 1,517,247 – 6,803,160Related parties 5,677,422 2,961 945 140 − 1,769 5,815 – 5,683,237Receivables from employees 841,056 26,343 9,859 11,352 13,596 211,000 272,150 – 1,113,206
P=65,839,605 P=2,986,635 P=2,029,581 P=1,022,424 P=832,624 P=9,169,007 P=16,040,271 P=606,148 P=82,486,024
December 31, 2017
NeitherPast Due nor Past Due but not Impaired Individually
Impaired <30 days 30-60 days 61-90 days 91-120 days >120 days Total Impaired Total(In Thousands)
Trade:Residential and office development P=78,002,747 P=1,919,761 P=1,661,734 P=1,903,018 P=1,923,855 P=3,787,501 P=11,195,869 P=− P=89,198,616Shopping centers 1,173,130 223,190 88,550 273,673 80,647 466,491 1,132,551 403,906 2,709,587Construction contracts 1,515,589 230,384 242,186 84,440 67,198 328,382 952,590 26,547 2,494,726Corporate business 1,080,987 44,152 53,175 26,832 116,657 204,921 445,737 79,209 1,605,933Management fees 286,416 − 10,461 4,526 4,229 20,368 39,584 2,614 328,614Others 1,042,885 142,876 44,697 20,118 23,835 75,000 306,526 27,438 1,376,849
Advances to other companies 11,296,914 22,143 349,750 78,318 15,539 4,411,749 4,877,499 10,946 16,185,359Accrued receivables 4,105,494 44,388 86,060 55,768 62,569 345,888 594,673 – 4,700,167Related parties 750,201 258,946 238,871 67,739 190,345 228,375 984,276 – 1,734,477Receivables from employees 775,781 4,599 3,193 6,330 757 41,200 56,079 – 831,860
P=100,030,144 P=2,890,439 P=2,778,677 P=2,520,762 P=2,485,631 P=9,909,875 P=20,585,384 P=550,660 P=121,166,188

- 110 -
*SGVFS032855*
The table below shows the credit quality of the Company’s financial assets as of December 31, 2018 and 2017:
December 31, 2018
Neither Past Due nor Impaired Past Due but IndividuallyHigh Grade Medium Grade Low Grade Unrated Total not Impaired Impaired Total
(In Thousands)Cash and cash equivalents (excluding
cash on hand) P=23,939,708 P=– P=– P=– P=23,939,708 P=– P=– P=23,939,708Short-term investments 3,085,373 – – – 3,085,373 – – 3,085,373Financial assets at FVPL 476,245 – – – 476,245 – – 476,245Accounts and notes receivables:
Trade:Residential and office development 25,113,148 3,217,698 2,819,129 – 31,149,975 5,280,379 – 36,430,354Shopping centers 560,938 301,188 134,538 – 996,664 1,328,823 360,794 2,686,281Construction contracts 1,343,275 − − – 1,343,275 503,269 26,547 1,873,091Corporate business 3,705,372 104,806 22,128 – 3,832,306 992,784 60,780 4,885,870Management fees 28,496 6,102 14,605 – 49,203 31,294 5,550 86,047Others 2,396,875 40,891 66,664 – 2,504,430 449,990 146,577 3,100,997
Advances to other companies 13,537,359 288,451 333,551 – 14,159,361 5,658,520 5,900 19,823,781Accrued receivables 4,987,699 272,237 25,977 – 5,285,913 1,517,247 – 6,803,160Related parties 3,355,745 2,011,575 310,102 – 5,677,422 5,815 – 5,683,237Receivable from employees 702,738 126,481 11,837 – 841,056 272,150 – 1,113,206
Financial Assets at FVOCI:Unquoted – – – 521,912 521,912 – – 521,912Quoted 973,882 – – – 973,882 – – 973,882
P=84,206,853 P=6,369,429 P=3,738,531 P=521,912 P=94,836,725 P=16,040,271 P=606,148 P=111,483,144

- 111 -
*SGVFS032855*
December 31, 2017
Neither Past Due nor Impaired Past Due but IndividuallyHigh Grade Medium Grade Low Grade Unrated Total not Impaired Impaired Total
(In Thousands)Cash and cash equivalents (excluding
cash on hand) P=20,945,895 P=– P=– P=– P=20,945,895 P=– P=– P=20,945,895Short-term investments 4,739,734 – – – 4,739,734 – – 4,739,734Financial assets at FVPL 540,606 – – – 540,606 – – 540,606Accounts and notes receivables:
Trade:Residential and office development 69,673,802 4,420,801 3,908,144 – 78,002,747 11,195,869 – 89,198,616Shopping centers 864,438 172,244 136,448 – 1,173,130 1,132,551 403,906 2,709,587Construction contracts 1,515,589 − − – 1,515,589 952,590 26,547 2,494,726Corporate business 975,600 60,065 45,322 – 1,080,987 445,737 79,209 1,605,933
Management fees 228,921 4,454 53,041 – 286,416 39,584 2,614 328,614Others 887,298 54,287 101,300 – 1,042,885 306,526 27,438 1,376,849
Advances to other companies 11,072,734 138,479 85,701 – 11,296,914 4,877,499 10,946 16,185,359Accrued receivables 3,612,566 269,518 223,410 – 4,105,494 594,673 – 4,700,167Related parties 492,328 157,672 100,201 – 750,201 984,276 – 1,734,477Receivable from employees 772,615 926 2,240 – 775,781 56,079 – 831,860
AFS financial assets:Unquoted – – – 523,693 523,693 – – 523,693Quoted 951,548 – – – 951,548 – – 951,548
P=117,273,674 P=5,278,446 P=4,655,807 P=523,693 P=127,731,620 P=20,585,384 P=550,660 P=148,867,664

- 112 -
*SGVFS032855*
The credit quality of the financial assets was determined as follows:
Cash and cash equivalents, short-term investments, financial assets at FVTPL, financial assets atFVOCI and AFS quoted securities - based on the nature of the counterparty and the Group’s internalrating system;
Receivables - high grade pertains to receivables with no default in payment; medium grade pertainsto receivables with up to 3 defaults in payment; and low grade pertains to receivables with more than3 defaults in payment;
The unquoted AFS financial assets and unquoted financial assets at FVOCI are unrated.
Interest rate riskInterest rate risk is the risk that the fair value or future cash flows of a financial instrument willfluctuate because of changes in market interest rates.
The Group’s interest rate risk management policy centers on reducing the overall interest expenseand exposure to changes in interest rates. Changes in market interest rates relate primarily to theGroup’s interest-bearing debt obligations with floating interest rate as it can cause a change in theamount of interest payments.
The Group manages its interest rate risk by leveraging on its premier credit rating and increasing thefixed interest component of its debt portfolio. The Company’s ratio of fixed to floating rate debt stoodat around 89:11 and 85:15 as of December 31, 2018 and 2017, respectively.
The following tables demonstrate the sensitivity of the Group’s profit before tax and equity to areasonably possible change in interest rates on December 31, 2018 and 2017, with all variables heldconstant, (through the impact on floating rate borrowings):
December 31, 2018Effect on income before income tax
Increase (decrease)
Change in basis points+ 100 basis
points- 100 basis
points(In Thousands)
Floating rate borrowings (P=210,576) P=210,576
December 31, 2017Effect on income before income tax
Increase (decrease)
Change in basis points+ 100 basis
points- 100 basis
points(In Thousands)
Floating rate borrowings (P=254,397) P=254,397
The assumed change in rate is based on the currently observable market environment. There is noother impact on the Group’s equity other than those already affecting the net income.

- 113 -
*SGVFS032855*
The terms and maturity profile of the interest-bearing financial assets and liabilities, together with their corresponding nominal amounts and carrying values are shown inthe following table (in thousands):
December 31, 2018
Interest terms (p.a.) Rate Fixing Period Nominal Amount < 1 year 1 to 5 years > 5 years Carrying ValueGroupCash and cash equivalents
(excluding cash on hand) Fixed at the date of investment Various P=23,939,708 P=23,939,708 P=– P=– P=23,939,708Short-term investments Fixed at the date of investment or revaluation cut-off Various 3,085,373 3,085,373 – – 3,085,373Accounts and notes receivable Fixed at the date of sale Date of sale 1,113,205 220,227 892,978 − 1,113,205
P=28,138,286 P=27,245,308 P=892,978 P=– P=28,138,286CompanyShort-term debtFloating-Peso Variable Monthly P=13,500,900 P=13,500,900 P=– P=– P=13,500,900Long-term debtFixed Peso Fixed at 5.6250% to 6.0000% 7 and 10 years 15,000,000 9,341,196 5,644,680 – 14,985,876 Peso Fixed at 4.6250% to 6.0000% 7,10.5 and 20 years 21,000,000 – 18,989,546 1,907,664 20,897,210 Peso Fixed at 5.6250% 11 years 8,000,000 – – 7,945,703 7,945,703 Peso Fixed at 4.5000% 7 years 7,000,000 – 6,960,744 – 6,960,744 Peso Fixed at 3.8915% to 4.85% 7, 9.5 and 10 years 22,000,000 – 6,952,613 14,888,889 21,841,502 Peso Fixed at 3.00% 3 years 2,982,530 2,971,976 − – 2,971,976 Peso Fixed at 5.2624% 10 years 7,000,000 – – 6,969,630 6,969,630 Peso Fixed at 5.9203% to 7.0239% 5 and 10 years 18,000,000 − 7,909,305 9,886,828 17,796,133 Peso Fixed at 2.7500% 1.75 years 4,000,000 3,995,630 − – 3,995,630 Peso Fixed at 3.2500% 1.25 years 3,100,000 3,097,745 − – 3,097,745 Peso Fixed at 4.5000% to 7.8750% 5, 10 and 15 years 5,770,000 60,000 4,800,000 904,859 5,764,859 Peso Fixed at 4.50% to 4.949% Up to 10.5 years 29,465,677 488,719 8,113,458 20,785,262 29,387,439FloatingUSD Variable 3.4 and 10.3 years − − − − −SubsidiariesShort-term debtFloating Peso Variable Monthly 885,817 885,817 − − 885,817Long-term debt
Fixed Peso Fixed at 3.627% to 5.75% 5 to 10 years 23,465,452 2,556,770 19,274,884 1,607,802 23,439,456Floating MYR Variable Monthly 6,658,219 727,155 4,941,064 990,000 6,658,219
P=187,828,595 P=37,625,908 P=83,586,294 P=65,886,637 P=187,098,839

- 114 -
*SGVFS032855*
December 31, 2017
Interest terms (p.a.) Rate Fixing Period Nominal Amount < 1 year 1 to 5 years > 5 years Carrying ValueGroupCash and cash equivalents
(excluding cash on hand) Fixed at the date of investment Various P=20,945,895 P=20,945,895 P=– P=– P=20,945,895Short-term investments Fixed at the date of investment or revaluation cut-off Various 4,739,734 4,739,734 – – 4,739,734Accounts and notes receivable Fixed at the date of sale Date of sale 831,860 56,079 775,781 831,860
P= 26,517,489 P= 25,741,708 P= 775,781 P=– P= 26,517,489CompanyShort-term debtFloating-Peso Variable Monthly P= 16,991,350 P= 16,991,350 P=– P=– P= 16,991,350Long-term debtFixed Peso Fixed at 5.6250% to 6.0000% 7 and 10 years 15,000,000 – 14,968,117 – 14,968,117 Peso Fixed at 4.6250% to 6.0000% 7,10.5 and 20 years 21,000,000 – 3,984,041 16,894,123 20,878,164 Peso Fixed at 5.6250% 11 years 8,000,000 – – 7,938,923 7,938,923 Peso Fixed at 4.5000% 7 years 7,000,000 – 6,953,043 – 6,953,043 Peso Fixed at 3.8915% to 4.85% 7, 9.5 and 10 years 22,000,000 – – 21,819,967 21,819,967 Peso Fixed at 3.00% 3 years 2,990,950 – 2,969,108 – 2,969,108 Peso Fixed at 5.2624% 10 years 7,000,000 – – 6,966,801 6,966,801 Peso Fixed at 2.7500% 1.75 years 4,000,000 – 3,980,934 – 3,980,934 Peso Fixed at 3.2500% 1.25 years 3,100,000 – 3,082,433 – 3,082,433 Peso Fixed at 4.5000% to 7.8750% 5, 10 and 15 years 9,064,000 93,000 3,541,000 5,408,576 9,042,576 Peso Fixed at 4.50% to 4.949% Up to 10.5 years 24,873,145 399,594 5,614,450 18,812,161 24,826,205FloatingUSD Variable 3.4 and 10.3 years 1,516,624 478,597 435,210 602,817 1,516,624SubsidiariesShort-term debtFloating Peso Variable Monthly 653,000 653,000 – – 653,000Long-term debt
Fixed Peso Fixed at 3.627% to 5.75% 5 to 10 years 25,574,500 4,039,747 20,130,165 1,358,954 25,528,866Floating Peso Variable at 0.75% over 91-day PDST-R2 3 months 6,278,729 1,559,722 1,333,513 3,376,410 6,269,645
P=175,042,298 P=24,215,010 P=66,992,014 P=83,178,732 P=174,385,756

- 115 -
*SGVFS032855*
Foreign currency riskForeign currency risk is the risk that the fair value or future cash flows of a financial instrument willfluctuate because of changes in foreign exchange rates. Financial assets and credit facilities of theGroup, as well as major contracts entered into for the purchase of raw materials, are mainlydenominated in Philippine Peso. The Group’s placements in foreign currencies amounting to$158.4 million and MYR685.9 million as of December 31, 2018 and $180.6 million as ofDecember 31, 2017. The amount of the Group’s foreign currency-denominated debt amounting to$61.9 million and MYR816.7 million as of December 31, 2018 and $33.0 million as of December 31,2017. As such, the Group’s foreign currency risk is minimal.
The following table shows the Group’s consolidated foreign currency-denominated monetary assetsand liabilities and their peso equivalents as of December 31, 2018 and December 31, 2017:
December 312018 2017
US Dollar MYR ringgit Php Equivalent US Dollar Php EquivalentFinancial AssetsCash and cash equivalents $41,201 MYR333,726 P=6,377,767 $102,275 P=5,106,601Short-term investments 62,466 230,661 6,211,741 62,991 3,145,158Accounts and notes receivable - net 47,722 82,505 3,561,610 14,598 728,895Other current assets 6,532 − 340,619 590 29,439Other noncurrent assets 484 39,001 516,739 104 5,192
Total 158,405 685,893 17,008,476 180,558 9,015,285Financial LiabilitiesAccounts and other payables 11,915 479,143 6,676,292 1,664 83,106Other current liabilities 217 − 10,594 − −Short-term debt 46,675 70,000 3,339,988 − –Long-term debt − 267,540 3,385,587 30,375 1,516,624Other noncurrent liabilities 3,053 − 160,698 919 45,866
Total 61,860 816,683 13,573,159 32,958 1,645,596
Net foreign currency denominatedfinancial instruments $96,545 (MYR130,790) P=3,435,317 $147,600 P=7,369,689
In translating the foreign currency-denominated monetary assets in peso amounts, the exchangerates used were P=52.58 to US$1.00, and P=49.93 to US$1.00, the Philippine Peso - US dollarexchange rates as of December 31, 2018 and 2017, respectively. The Philippine Peso- MY ringgitexchange rate as of December 31, 2018 used was P=12.66 to MYR1.00.
The following table demonstrates the sensitivity to a reasonably possible change in the Philippinepeso-US dollar exchange rate, with all variables held constant, of the Group’s profit before tax (due tochanges in the fair value of monetary assets and liabilities) and the Group’s equity.
Change in exchange rate
Effect on income before taxIncrease (decrease)
2018 2017USD
P=1.00 P=96,545 P=147,600(P=1.00) (96,545) (147,600)
MYRP=1.00 (P=130,790) P=−(P=1.00) 130,790 −
There is no other impact on the Group’s equity other than those already affecting the net income.

- 116 -
*SGVFS032855*
Equity price riskQuoted AFS financial assets are acquired at a certain price in the market. Such investment securitiesare subject to price risk due to changes in market values of instruments arising either from factorsspecific to individual instruments or their issuers or factors affecting all instruments traded in themarket. Depending on several factors such as interest rate movements, country’s economicperformance, political stability, domestic inflation rates, these prices change, reflecting how marketparticipants view the developments.
The Group’s market risk policy requires it to manage such risks by setting and monitoring objectivesand constraints on investments; diversification plan; limits on investment in each country, sector andmarket.
The analysis below demonstrates the sensitivity to a reasonably possible change of market index withall other variables held constant, of the Group’s equity (in thousands).
Effect on equityIncrease (decrease)
Change in PSEi index 2018 2017(In Thousands)
+5% P=34,690 P=51,552-5% (34,690) (51,552)
Quoted financial assets at FVPL pertain to investment in UITF (Fund). The Fund, which is structuredas a money market UITF, aims to generate liquidity and stable income by investing in a diversifiedportfolio of primarily short-term fixed income instruments.
As of December 31, 2018 and 2017, the Group's investment in the Fund where all other variablesheld constant, the fair value, net income and equity will increase or decrease by: (i) BPI UITFP=0.4 million with a duration of 0.41 year and P=0.3 million with a duration of 0.39 year, respectively, fora 100 basis points decrease or increase, in interest rates.
31. Segment Information
The industry segments where the Group and its associates and joint ventures operate follows:
∂ Property developments - sale of high-end and upper middle-income residential lots and units,affordable housing units and lots, economic housing and leisure community developments; leaseof residential developments under joint venture; acquisition, development and sale of large-scale,mixed-use, master-planned communities; sale of override units or the Company’s share inproperties made available to subsidiaries for development
∂ International – development and sale of residential lots and units in MCT Berhad∂ Shopping centers - development of shopping centers and lease to third parties of retail space and
land therein; operation of movie theaters, food courts, entertainment facilities, gas stations andcarparks in these shopping centers; management and operation of malls which are co-ownedwith partners
∂ Offices - development and lease or sale of office buildings; sale of industrial lots and lease offactory building
∂ Hotels and Resorts - development and management of hotels and resorts/serviced apartmentsand lease of land to hotel tenants
∂ Construction - land development and construction of the Group and third-party projects∂ Property management and others - facilities management of the Group and third-party projects

- 117 -
*SGVFS032855*
Assets, liabilities, revenues and expenses of the Strategic Landbank Management and Visayas-Mindanao segment were reallocated to other business segments namely, shopping centers,corporate businesses and residential developments according to the nature of the products andservices provided.
The Company and its subsidiaries generally account for inter-segment sales and transfers as if thesales and transfers were to third parties at current market prices.
Management committee monitors the operating results of its business units separately for thepurpose of making decisions about resource allocation and performance assessment.
For the years ended December 31, 2018, 2017 and 2016, there were no revenue transactions with asingle external customer which accounted for 10% or more of the consolidated revenue from externalcustomers.

- 118 -
*SGVFS032855*
Business segmentsThe following tables regarding business segments present assets and liabilities as of December 31 and revenue and profit information for each of the two years in theperiod ended December 31 (in millions):
2018
PropertyDevelopment
International ShoppingCenters Offices
Hotels andResorts Construction
PropertyManagement
and Others CorporateIntersegmentAdjustments Consolidated
RevenueRevenues from contracts with customers P=105,753 P=7,602 P=− P=− P=6,387 P=2,394 P=237 P=− P=− P=122,373Interest income from real estate sales 7,042 – – – – – – – – 7,042Rental revenue − − 19,908 8,614 − − 5,060 − − 33,582Intersegments sales − − − − − 69,027 − − (69,027) −Equity in net earnings of associates and joint ventures 451 − 10 − − − − 289 − 750Total revenue 113,246 7,602 19,918 8,614 6,387 71,421 5,297 289 (69,027) 163,747Real estate costs and expenses 81,662 5,528 9,001 3,204 4,994 66,111 5,919 1,302 (67,541) 110,180
Gross margin 31,584 2,074 10,917 5,410 1,393 5,310 (622) (1,013) (1,486) 53,567Interest and investment income 958Other charges (1,271)Interest and other financing charges (9,594)Other income 1,541Provision for income tax (11,984)Net income P=33,217Net income attributable to: Equity holders of Ayala Land, Inc. P=29,241 Non-controlling interests 3,976
P=33,217Other InformationSegment assets P=274,128 P=21,774 P=69,488 P=46,013 P=34,190 P=54,955 P=6,590 P=460,890 (P=335,639) P=632,389Investment in associates and joint ventures 21,667 − 38 − − 56 − 1,629 − 23,390
295,795 21,774 69,526 46,013 34,190 55,011 6,590 462,519 (335,639) 655,779Deferred tax assets 3,164 − 333 137 339 56 44 2,615 6,353 13,041Total assets P=298,959 P=21,774 P=69,859 P=46,150 P=34,529 P=55,067 P=6,634 P=465,134 (P=329,286) P=668,820Segment liabilities P=170,872 P=10,348 P=27,659 P=16,855 P=13,631 P=47,355 P=3,176 P=264,436 (P=111,628) P=442,704Deferred tax liabilities 1,721 − 271 40 10 4 8 18 3,823 5,895Total liabilities P=172,593 P=10,348 P=27,930 P=16,895 P=13,641 P=47,359 P=3,184 P=264,454 (P=107,805) P=448,599Segment additions to:Property and equipment P=(1,008) P=4,570 P=(426) P=833 P=524 P=2,774 P=833 (P=658) P=– P=7,442Investment properties P=4,289 P=7,683 P=6,143 P=3,883 P=3,337 P=787 (P=1) P=16,881 (P=438) P=42,564Depreciation and amortization P=707 P=618 P=2,724 P=1,555 P=207 P=1,475 P=242 P=266 (P=1,475) P=6,319Non-cash expenses other than depreciation and amortization P=– P=– P=– P=– P=– P=– P=– P=– P=– P=–Impairment losses (P=5) P=– (P=2) P=– P=– P=– P=173 P=8 P=– P=174

- 119 -
*SGVFS032855*
2017
PropertyDevelopment
ShoppingCenters Offices
Hotels andResorts Construction
PropertyManagement
and Others CorporateIntersegmentAdjustments Consolidated
RevenueSales to external customers P=96,387 P=17,657 P=6,664 P=5,621 P=1,559 P=5,408 P=– (P=198) P=133,098Interest income from real estate sales 5,410 – – – – – – – 5,410Intersegments sales – – − – 65,841 – – (65,841) –Equity in net earnings of associates and joint ventures 529 (113) – – – – 450 – 866Total revenue 102,326 17,544 6,664 5,621 67,400 5,408 450 (66,039) 139,374Real estate costs and expenses 75,322 8,415 2,622 4,619 62,921 4,779 1,114 (64,596) 95,196Gross margin 27,004 9,129 4,042 1,002 4,479 629 (664) (1,443) 44,178Interest and investment income 675Other charges (1,196)Interest and other financing charges (7,914)Other income 2,248Provision for income tax (9,825)Net income P=28,166Net income attributable to: Equity holders of Ayala Land, Inc. P=25,305 Non-controlling interests 2,861
P=28,166Other InformationSegment assets P=474,286 P=135,479 P=96,243 P=44,494 P=50,014 P=7,696 P=20,026 (P=291,695) P=536,543Investment in associates and joint ventures 9,964 7,897 − − 51 − 8,889 − 26,801
484,250 143,376 96,243 44,494 50,065 7,696 28,915 (291,695) 563,344Deferred tax assets 2,465 367 154 267 31 23 2,260 5,081 10,648Total assets P=486,715 P=143,743 P=96,397 P=44,761 P=50,096 P=7,719 P=31,175 (P=286,614) P=573,992Segment liabilities P=227,905 P=113,880 P=54,234 P=37,194 P=42,381 P=3,303 P=12,769 (P=113,481) P=378,185Deferred tax liabilities 1,612 244 26 40 − 13 14 1,595 3,544Total liabilities P=229,517 P=114,124 P=54,260 P=37,234 P=42,381 P=3,316 P=12,783 (P=111,886) P=381,729Segment additions to:Property and equipment P=359 P=119 P=304 P=1,058 P=1,122 P=655 P=279 (P=1,570) P=2,326Investment properties P=1,774 P=20,967 P=12,971 P=2,998 P=– P=6 P=17,220 (P=25,943) P=29,993Depreciation and amortization P=267 P=2,151 P=927 P=586 P=1,570 P=258 P=990 (P=1,569) P=5,180Non-cash expenses other than depreciation and amortization P=– P=– P=– P=– P=– P=– P=– P=– P=–Impairment losses P=– P=39 P=21 P=– P=– P=– P=96 P=– P=156

- 120 -
*SGVFS032855*
2016
PropertyDevelopment
ShoppingCenters
CorporateBusinesses
Hotels andResorts Construction
PropertyManagement
and Others CorporateIntersegmentAdjustments Consolidated
RevenueSales to external customers P=77,728 P=16,079 P=5,803 P=6,052 P=10,701 P=1,337 P=– P=– P=117,700Interest income from real estate sales 5,011 – – – – – – – 5,011Intersegments sales – – 137 – 54,615 1,837 – (56,589) –Equity in net earnings of associates and joint ventures 352 (293) – – – – 495 – 554Total revenue 83,091 15,786 5,940 6,052 65,316 3,174 495 (56,589) 123,265Real estate costs and expenses 62,355 8,408 1,966 4,709 59,969 2,044 1,049 (56,902) 83,598Gross margin 20,736 7,378 3,974 1,343 5,347 1,130 (554) 313 39,667Interest and investment income 703Other charges (1,053)Interest and other financing charges (7,314)Other income 660Provision for income tax (8,231)Net income P=24,432Net income attributable to: Equity holders of Ayala Land, Inc. P=20,908 Non-controlling interests 3,524
P=24,432Other InformationSegment assets P=435,290 P=124,331 P=81,819 P=37,740 P=48,988 P=7,641 P=20,661 (P=254,901) P=501,569Investment in associates and joint ventures 9,392 7,362 – – – – 8,231 – 24,985
444,682 131,693 81,819 37,740 48,988 7,641 28,892 (254,901) 526,554Deferred tax assets 2,141 385 107 379 42 28 2,539 4,258 9,879Total assets P=446,823 P=132,078 P=81,926 P=38,119 P=49,030 P=7,669 P=31,431 (P=250,643) P=536,433Segment liabilities P=216,231 P=110,465 P=38,483 P=28,395 P=42,249 P=4,072 P=22,120 (P=102,622) P=359,393Deferred tax liabilities 2,215 231 24 498 – 16 11 1,362 4,357Total liabilities P=218,446 P=110,696 P=38,507 P=28,893 P=42,249 P=4,088 P=22,131 (P=101,260) P=363,750Segment additions to:Property and equipment P=65 P=665 P=152 P=612 P=1,992 P=1,908 P=45 P=– P=5,439Investment properties P=199 P=15,072 P=10,391 P=2,394 P=- P=36 P=1,297 P=– P=29,389Depreciation and amortization P=173 P=1,787 P=574 P=521 P=1,606 P=249 P=965 P=– P=5,875Non-cash expenses other than depreciation and amortization P=– P=– P=– P=– P=– P=– P=– P=– P=–Impairment losses P=– P=81 P=13 P=– P=– P=– P=305 P=– P=399

- 121 -
*SGVFS032855*
32. Performance Obligations
Information about the Group’s performance obligations are summarized below:
Real estate salesThe Group entered into contracts to sell with one identified performance obligation which is the saleof the real estate unit together with the services to transfer the title to the buyer upon full payment ofcontract price. The amount of consideration indicated in the contract to sell is fixed and has novariable consideration.
The sale of real estate unit may cover the contract for either the (i) serviced lot; (ii) service lot andhouse, and (ii) condominium unit and the Group concluded that there is one performance obligation ineach of these contracts. The Group recognizes revenue from the sale of these real estate projectsunder pre-completed contract over time during the course of the construction.
Payment commences upon signing of the contract to sell and the consideration is payable in cash orunder various financing schemes entered with the customer. The financing scheme would includepayment of 10% of the contract price spread over a certain period (e.g., one to two years) at a fixedmonthly payment with the remaining balance payable (a) in full at the end of the period either throughcash or external financing; or (b) through in-house financing which ranges from two (2) to ten (10)years with fixed monthly payment. The amount due for collection under the amortization schedule foreach of the customer does not necessarily coincide with the progress of construction, which results toeither a contract asset or contract liability.
After the delivery of the completed real estate unit, the Group provides one year warranty to repairminor defects on the delivered serviced lot and house and condominium unit. This is assessed by theGroup as a quality assurance warranty and not treated as a separate performance obligation.
Hotels and resortsRooms revenue from hotel and resort operations is recognized when the services are rendered.Revenue from banquets and other special events are recognized when the events take place.
ConstructionRevenue from fixed price construction contracts are recognized overtime using the milestone-basedrevenue recognition which is in reference to output method. The output method is determined basedon the start and completion of a task of the contract work inclusive of uninstalled goods and materialsdelivered to the site.
The transaction price allocated to the remaining performance obligations (unsatisfied or partiallysatisfied) as at December 31, 2018 are as follows:
December 31, 2018(In Thousands)
Within one year P=47,937,926More than one year 55,328,212
P=103,266,138
The remaining performance obligations expected to be recognized within one year and in more thanone year relate to the continuous development of the Group’s real estate projects. The Group’scondominium units are completed within three years and five years, respectively, from start ofconstruction while serviced lots and serviced lots and house are expected to be completed within twoto three years from start of development.

- 122 -
*SGVFS032855*
33. Registration with Philippine Economic Zone Authority (PEZA)
Ayala Land Inc., the Parent Company, was registered with PEZA last December 13, 2017 as aDeveloper/Operator of the Southpark Corporate Center.
North Eastern Commercial Corporation, a wholly owned subsidiary, was registered with PEZA lastNovember 28, 2017 as a Developer/Operator of the 30th Coporate Center.
Ayala Land Inc., the Parent Company, was registered with PEZA last November 6, 2017 as aDeveloper/Operator of the Vertis North IT Park.
Central Block Developers, Inc., a wholly owned subsidiary, was registered with PEZA last June 22,2017 as a Developer/Operator of the Central Bloc 1 & 2.
Ayalaland Metro North, Inc., a wholly owned subsidiary, was registered with PEZA last December 29,2016 as a Developer/Operator of the UP Town Corporate Center.
Pangulasian Island Resort Corporation (PIRC), a subsidiary of Ten Knots Development Corporationwhich is a subsidiary of Ayala Land, Inc., is registered with the Philippine Economic Zone Authority(PEZA) under the Certificate of Registration number 16-055 and Registration Agreement datedMarch 21, 2016. The registration shall entitle PIRC to conduct activities limited to resort operations,travel/tours/leisure and recreation-related activities, and the importation of raw materials, machinery,equipment, tools, goods, wares, articles, or merhandise directly used in its registered operationsinside the Green Tourism Ecozone - Pangulasian.
PIRC shall be entitled to the following incentives as provided under PEZA Board ResolutionNo. 02-342 (Guidelines for the Registration and Administration of Incentives to Tourism EcozoneDevelopers Operators and Locators) and the 2014 Investments Priorities Plan: (a) Remaining IncomeTax Holiday (ITH) of Ten Knots Development Corporation (TKDC) reckoned from October 2012 perPEZA Notice of Approval of Start of Commercial Operations (SCO) to TKDC dated November 12,2012, and upon expiry of the ITH period, PIRC shall pay the 5% Gross Income Tax (5% GIT) onincome solely derived from servicing foreign clients, in lieu of all national and local taxes; (b) Tax andduty-free importation of capital equipment required for the technical viability and operation of PIRC'sregistered activity.
Nuevo Centro, a wholly-owned subsidiary of Ayala Land, Inc., is registered with PEZA with Certificateof Registration number EZ 16-30 under Registration Agreement dated July 19, 2016. The registrationas a Special Economic Zone Developer/Operator shall entitle Nuevo Centro, Inc. to establish,develop, administer, manage, and operate a Special Economic Zone to be known as AlvieraIndustrial Park. It has been designated a 311,954-square meter area located at Barangays Doloresand Banaba, Porac, Pampanga. The Company shall be exempt from payment of all national andlocal taxes, except real property taxes on land and shall pay a 5% final tax on gross income.
ALO Prime Realty Corporation, a wholly-owned subsidiary is registered with the PEZA with certificateof registration number 09-03-F under Registration Agreement dated May 29, 2009, as amended byRegistration Agreement dated May 6, 2010, pursuant to the provision of Republic Act (R.A.)No. 7916, as amended, as an Ecozone Facilities Enterprise to construct a 12-storey office building(exclusive of 1 penthouse and 2 level basement parking) with a gross floor area of 24,214 squaremeters, more or less, which shall be established on a 3,621 square meter lot, located at Block 8,Lots 1 and 2, Asiatown IT Park, for lease to registered enterprises.
APRC, a wholly-owned subsidiary is registered with the PEZA with certificate of registration number09-03-F under Registration Agreement dated May 29, 2009, as amended by Registration Agreementdated May 6, 2010, pursuant to the provision of Republic Act (R.A.) No. 7916, as amended, as anEcozone Facilities Enterprise to construct a 12-storey office building (exclusive of 1 penthouse and2 level basement parking) with a gross floor area of 24,214 square meters, more or less, which shallbe established on a 3,621 square meter lot, located at Block 8, Lots 1 and 2, Asiatown IT Park, forlease to registered enterprises.

- 123 -
*SGVFS032855*
APRC shall be exempted from the payment of all national and local taxes and in lieu thereof, thecompany shall pay a 5% final tax on gross income (GIT) earned from locator IT enterprise and relatedoperations in accordance with the provision of Rule XX of the Rules and Regulations implementingR.A. 7916, as amended. The company shall pay the real property taxes on commercial spacesoccupied by non-PEZA registered enterprises. Pursuant to BIR’s Rules and Regulation No. 14-2002(amending further pertinent provision of Revenue Regulations No. 2-98, as amended), incomepayments to PEZA-registered enterprises under the 5% GIT incentives are exempt from expandedwithholding tax.
APRC will be subjected to all evaluation and/or processing requirement and procedures prescribedunder PEZA Rules and Regulations, and other pertinent circulars and directives. The company’sentitlement to incentives shall continue as long as it remains in good standing, commit no violation ofPEZA Rules and Regulations, other pertinent circulars and directives, and the terms and conditions ofits registration agreement with PEZA.
Laguna Technopark, Inc. was registered with PEZA on October 27, 1999 as a non-pioneer “ecozonedeveloper/operator”. The PEZA registration entitled the subsidiary to a four-year income tax holidayfrom the start of its commercial operations. At the expiration of its four-year tax holiday, thesubsidiary pays income tax at the special tax rate of 5% on its gross income earned from sourceswithin the PEZA economic zone in lieu of paying all national and local income taxes.
Likewise, Ceci Realty, Inc. also became registered with PEZA in 2007 as the “developer/operator” ofthe Lakeside Ecozone.
Glensworth Development, Inc., a wholly owned subsidiary of Ayala Land Offices, Inc., was registeredwith PEZA as an Economic Zone Information IT Facility Enterprise last December 14, 2007 toconstruct a 4-storey building at the Lakeside Ecozone, Barangay Sta. Rosa, Laguna for lease toPEZA-registered enterprises. As a PEZA-registered enterprise, the Glensworth is entitled toincentives which, among others, include a lower income tax rate of 5% on gross income in lieu of allnational and local taxes.
Hillsford Property Corporation, a wholly owned subsidiary, was registered with PEZA last January 29,2009 as an Ecozone Facilities Enterprise at the John Hay Special Tourism Economic Zone located inBaguio.
Sunnyfield E-Office Corporation, a wholly owned subsidiary, was registered with PEZA lastDecember 17, 2010 as a Developer/Operator of Iloilo Technohub.
Westview Commercial Ventures Corporation, a wholly owned subsidiary, was registered with PEZAlast December 17, 2010 as an Ecozone Facilities Enterprise at the Ayala Northpoint Technohublocated in Bacolod.
On December 18, 2007, PEZA approved the registration of AiO, the subsidiary, as an Economic ZoneInformation Technology (IT) Facility Enterprise. As a registered ecozone facilities enterprise, thesubsidiary is entitled to establish, develop, construct, administer, manage and operate a12-storey building and 17-storey building located at Asia Town IT Park, in accordance with the termsand conditions of the Registration Agreement with PEZA. The Group shall pay income tax at thespecial tax rate of 5% on its gross income earned from sources within the PEZA economic zone inlieu of paying all national and local income taxes. Gross income earned refers to gross sales or grossrevenues derived from any business activity, net of returns and allowances, less cost of sales ordirect costs but before any deduction is made for administrative expenses or incidental losses.Income generated from sources outside of the PEZA economic zone shall be subject to regularinternal revenue taxes. It is certified by the Bureau of Internal Revenue under Section 4.106-6 and4 108-6 of Revenue Regulation No. 16-2005 that the enterprise is conducted for purposes of its VATzero-rating transactions with its local suppliers of goods, properties and services.

- 124 -
*SGVFS032855*
Cebu Property Ventures Development Corporation was registered with PEZA on April 6, 2000 as anInformation Technology (IT) Park developer or operator and was granted approval by PEZA onOctober 10, 2001. The PEZA registration entitled CPVDC to a four-year tax holiday from the start ofapproval of registered activities. At the expiration of its four-year tax holiday, CPVDC pays incometax at the special rate of 5% on its gross income earned from sources within the PEZA economiczone in lieu of paying all national and local income taxes.
34. Leases
Operating Leases - Group as LessorThe Group entered into lease agreements with third parties covering its investment property portfolio.These leases generally provide for either (a) fixed monthly rent, or (b) minimum rent or a certainpercentage of gross revenue, whichever is higher.
Future minimum rentals receivable under noncancellable operating leases of the Group follows:
2018 2017(In Thousands)
Within one year P=8,300,061 P=887,835After one year but not more than five years 27,223,203 3,457,212More than five years 18,204,281 21,121,236
P=53,727,545 P=25,466,283
Operating Leases - Group as LesseeThe Group entered into lease agreements with third parties. These leases generally provide foreither (a) fixed monthly rent, or (b) minimum rent or a certain percentage of gross revenue, whicheveris higher.
Future minimum rentals payable under noncancellable operating leases of the Group follows:
2018 2017(In Thousands)
Within one year P=969,402 P=733,899After one year but not more than five years 3,214,368 2,687,534More than five years 38,974,801 18,594,127
P=43,158,571 P=22,015,560
Parent CompanyOn September 2, 2014, Parent Company signed a Lease Agreement with D.M. Wenceslao &Associates Inc. for the lease of several parcels of land along Asean Avenue and MacapagalBoulevard, Aseana City, Paranaque City with an aggregate area of 92,317 sqm. Parent Companysigned a 45-year lease contract with an option to renew for another 45 years subject to such termsand conditions as may be mutually agreed upon by the lessor and the Parent Company.
On April 26, 2012 Parent Company signed a Lease Agreement with the Province of NegrosOccidental for the lease of a parcel of land with an aggregate area of 40,481 sq. m. located alongGatuslao cor. North and South Capitol Roads, Bacolod City, registered in the name of the Province ofNegros Occidental. The Parent Company signed a 50-year lease contract with an option to renew asmay be mutually agreed upon by the lessor and the Company.
ArvoOn December 4, 2013, Arvo entered an agreement with Liberty Commercial Center, Inc. (LCC) toconstruct a five-storey commercial mall building with an aggregate gross floor area of approximately30,400 square meters on a 10,000 square meter portion of the land, and the Company to act ascoordinator for the construction and development of the building. The Company assisted LCC in

- 125 -
*SGVFS032855*
obtaining a loan from a local bank in the aggregate amount of approximately P=1,325.00 million to fullyfund the cost of the design and construction of the building. Upon completion of the construction ofthe building, the Company shall lease the building from LCC under a building lease agreement.
On October 15, 2014, Arvo entered into a property lease agreement with Rotonda DevelopmentCorporation for the construction, development and operation of a commercial and mall center. Theterms of the lease shall be 42 years, with an option to renew for another 40 years subject to mutualagreement of the parties. The lease agreement provided rent-free period of 2 years and leasepayments shall commence thereafter. Lease payments shall be paid annually at P=60.00 per sqm,subject to an annual escalation of 4%.
On March 5, 2015, Arvo entered into a building lease agreement with L.C. Lopez Resources, Inc. thathas a lease term of 40 years with an option for renewal for another 10 years upon mutual agreementof the parties. Arvo shall have the right but not the obligation to retrofit the leased premises as maybe deemed necessary. Arvo shall pay monthly rent equivalent of P=170.00 per sqm with annualescalation of 5%.
AMNIOn January 28, 2011, the Board of Regents of the University of the Philippines awarded to the ParentCompany the P=4.0 billion development of a 7.4-hectare lot at the University of the Philippines’ DilimanEast Campus, also known as the UP Integrated School, along Katipunan Avenue, Quezon City. TheParent Company signed a 25-year lease contract for the property last June 22, 2011, with an optionto renew for another 25 years subject to mutual agreement of the parties. The lease payments shallcommence as soon as sales are registered by the merchants.
A retail establishment with about 63,000 sqm of gross leasable area and an office/BPO building about8,000 sqm of gross leasable area have been constructed on the property.
SBTCIOn October 16, 2009, SBTCI has executed a lease agreement with the Subic Bay MetropolitanAuthority (SBMA), for the development of a 7.5-hectare property along Rizal Highway within the SubicBay Freeport Zone, located between the two main gates linking the Freeport Zone to Olongapo City.The lease commitment is expected to be completed in 2060 after the 50-year lease term. The leasemay be renewed for another 25 years upon mutual agreement of the parties. SBTCI offered todevelop a mall with an estimated gross leasable area of 38,000 sqm. On March 25, 2010, SBTCIentered into an assignment of lease agreement whereby SBTCI assigned its rights and obligationsgranted to or imposed under the lease agreement to its subsidiary, SBTCI. The lease payments toSBMA started from the commencement of the commercial operation of the mall last April 26, 2012which was completed during the same period.
SSECCThe Company has an existing contract with Bases Conversion and Development Authority (BCDA) todevelop, under a lease agreement signed on July 2000, a mall with an estimated gross leasable areaof 152,000 sqm on a 9.8-hectare lot inside Fort Bonifacio. Subsequently, the Company transferred itsrights and obligations granted to or imposed under the lease agreement to SSECC, a subsidiary, inexchange for equity. The lease agreement covers 25 years, renewable for another 25 years subjectto reappraisal of the lot at market value. The annual fixed lease rental amounts to P=106.5 millionwhile the variable rent ranges from 5% to 20% of gross revenues.
POPIOn August 28, 1990, POPI, through a Deed of Assignment, acquired all the rights, titles, interests andobligations of Gotesco Investment, Inc. in a contract of lease of the land owned by PNR for theTutuban Terminal. The contract provided for a payment of a guaranteed minimum annual rental plusa certain percentage of gross sales. The lease covers a period of 25 years until 2014 and isautomatically renewable for another 25 years, subject to compliance with the terms and conditions ofthe lease agreement. On December 22, 2009, POPI entered into an agreement with PNR for the

- 126 -
*SGVFS032855*
renewal of its lease contract for another 25 years beginning September 5, 2014. Rent expensecharged to operations amounted to P=149.56 million for the year ended December 31, 2018.
35. Interest in Joint Operation
MDC has a 51.0% interest in Makati Development Corporation - First Balfour, Inc. Joint Venture (theJoint Venture), a joint operation whose purpose is to design and build St. Luke’s Medical Center (theProject) in Fort Bonifacio Global City, Taguig. The application of PFRS 11 does not have significantimpact on the Group’s accounting of its interest in joint operation since it already reported its share ininterest in joint operation using proportionate consolidation.
The Project, which started on January 31, 2007, is a world-class medical facility comprising, more orless, of a 611-bed hospital and a 378-unit medical office building, with an approximate gross floorarea of 154,000 sqm, which meets international standards, and all standards and guidelines ofapplicable regulatory codes of the Philippines and complies with the criteria of the Environment ofCare of the Joint Commission International Accreditation. The project was completed on October 30,2009. Activities in 2011 to 2018 mainly pertain to winding down operations.
The share of MDC in the net assets and liabilities of the Joint Venture at December 31, 2018 and2017 which are included in the consolidated financial statements follow:
2018 2017(In Thousands)
Current assets:Cash and cash equivalents P=7,643 P=7,701Other current assets 37,376 37,365Total assets P=45,019 P=45,066Total liabilities P=6,727 P=6,859
The following is the share of the MDC on the net income (loss) of the Joint Venture:
2018 2017(In Thousands)
Construction costs (P=29) (P=384)Interest and other income 137 120Income (loss) before income tax 108 (264)Provision for income tax (23) (21)Net income (loss) P=85 (P=285)
The Joint Venture’s Management Board declared and paid cash dividends amounting to P=20.0 millionin 2017 (nil in 2018). Based on 51% share, MDC received P=10.7 million cash dividends in 2017.
Provision for income tax pertains to the final tax on interest income.
36. Long-term Commitments and Contingencies
Commitmentsa. On December 8, 2017, ALI assigned to NTDCC development rights on certain portions of the
North Triangle lot pads covered by a Deed of Assignment and Encroachment SettlementAgreement amounting to P631.2 million.

- 127 -
*SGVFS032855*
b. ALI and LT Group, Inc. (LTG) entered into an agreement on January 21, 2016 to jointly develop aproject along the C5 corridor. The project is envisioned to be a township development that spansportions of Pasig City and Quezon City. A new company named, ALI-ETON PropertyDevelopment Corporation, was incorporated on March 13, 2016.
c. On August 11, 2015, the Group won the bid for the Integrated Transport System Project – SouthTerminal (“ITS South Project"). The Company was awarded by the Department of Transportationand Communications (“DOTC”) with a 35-year concession agreement to build and operate theITS South Project and will likewise have the right to develop and operate commercial leasingfacilities on the same 5.57 hectare former Food Terminal Inc. property on which the futuretransport terminal will be built. The site of the ITS South Project is right next to ARCA South,where the Company is developing an integrated mixed-use estate. It is estimated that up to4,000 buses and 160,000 passengers will feed into ITS South from SLEX every day. Full blastconstruction of the terminal to start by 2H 2018 and targeted to be operational by 1H 2020.
d. On June 30, 2015, the Parent Company, through SM-ALI Group Consortium (the Consortium),participated and won in the bidding for Lot No. 8-B-1, containing an area of 263,384 sqm, whichis portion of Cebu City-owned lot located at the South Road Properties, Cebu City covered byTransfer Certificate of Title No. 107-2011000963. The Consortium is a consortium amongSMPHI, the Company and CHI (together with the Company collectively referred to as the “ALIGroup”). The SM-ALI Group has finished with the joint masterplan and is now securing permits tocommence development. Consistent with the agreed payment schedule in the Deed of AbsoluteSale, as of August 1, 2017 the ALI Group has paid P=3.8 billion, excluding taxes.
e. On August 8, 1997, an “Assignment Agreement” was executed between Department ofTransportation and Communications (DOTC), Metro Rail and MRTDC whereby MRTDC agreedto be bound by all obligations in respect of the Development Rights and make payments toDOTC.
f. On February 21, 2002, MRTDC and NTDCC entered into an assignment agreement wherein thedevelopment rights of MRTDC over an 8.3 hectare portion of the MRT Depot (inclusive of projectdevelopment costs incurred in relation thereto) was assigned to NTDCC in exchange for32,600,000 shares of stock to be issued out of the increase in the authorized capital stock ofNTDCC, each share with a par value of P=10, or an aggregate par value of P=326.00 million. Theamount of development rights in excess of the aggregate par value of the shares subscribed wascredited to additional paid-in capital.
On January 13, 2006, the deed of assignment between MRTDC and NTDCC was acknowledgedby DOTC making MRTDC and NTDCC jointly and severally liable for the DRP and all otherobligations attached thereto. NTDCC has been paying rent to DOTC in behalf of MRTDC sinceJanuary 1, 2006. The DRP obligation is payable annually for 42 years from the date ofassumption, renewable upon expiration. As of December 31, 2018 and 2017, the DRP obligationamounted to P=1,001.1 million and P=958.8 million, respectively (see Notes 16 and 19).Total DRPobligation paid amounted to P=229.8 million and P=223.1 million in 2018 and 2017, respectively.Total rent expense recognized in the statements of comprehensive income under the “Realestate costs and expenses” account included in direct operating expenses amounted toP=318.0 million and P=344.83 million in 2018 and 2017, respectively.
On March 21, 2007, DOTC, National Housing Authority (NHA), MRTDC, and NTDCC entered intoa Memorandum of Agreement (MOA) whereby DOTC assigns, transfers and conveys to NHA, itssuccessors or assigns, the right to demand and collect the Depot DRP Payable and Depot DRP.In the MOA, DOTC authorizes MRTDC/ NTDCC to remit the Depot DRP Payable and the DepotDRP to NHA directly which shall be credited by DOTC in favour of MRTDC/ NTDCC as paymentfor the DRP.
On December 17, 2014, NTDCC, MRTDC and MRTDC shareholders executed a “Funding andRepayment Agreement” wherein the latter agrees to repay NTDCC, for the account of MRTDC,

- 128 -
*SGVFS032855*
its respective pro rata share in the Total Depot DRP Advances (the Pre-2006 DRP Payables andthe Residual Depot DRP, including 15% interest rate accrued on such DRP payables).
g. On June 4, 2014, AHRC, a wholly owned subsidiary of the Parent Company has signed along-term management agreement with the Mandarin Oriental Hotel Group to develop andoperate luxury hotel in Makati City. Set to open its doors by 2020, the new Mandarin OrientalManila will be featuring 275 spacious rooms complemented by an extensive range of modernamenities including premium selection of restaurants and a signature spa. AHRC is committed topay $5 million (P=223.6 million) to Manila Mandarin Hotel, Inc. upon the opening of the New Hotelor June 30, 2017, whichever is earlier. In 2017, the Group fully paid the said amount.
h. On May 12, 2014, ALI has signed the terms of reference with Sureste Properties, Inc. (SPI), awholly owned subsidiary of Bloomberry Resorts Corp. (BLOOM) for the retail area to be openedin the new Phase 1-A of Solaire Resort & Casino. The Company will be the leasing andmarketing agent of the said area with gross leasable area of more than 5,000 sqm.
ContingenciesThe Group has various contingent liabilities arising in the ordinary conduct of business including acase related to property restriction violation. The estimate of the probable cost for the resolution ofthis claim has been developed in consultation with outside counsel handling the defense in this matterand is based upon an analysis of potential results. In the opinion of management and its legalcounsel the eventual liability under these lawsuits or claims, if any, will not have a material or adverseeffect on the Group’s financial position and results of operations. Accordingly, no provision for anyliability has been made in the consolidated financial statements.
Disclosures required by PAS 37, Provisions, Contingent Liabilities and Contingent Assets, were notprovided as it may prejudice the Group’s position in ongoing claims and it can jeopardize the outcomeof the claims and contingencies.
37. Concession Agreement with Department of Transportation (DOTr)
On January 26, 2016, the Group through ASITI entered into a Concession Agreement (CA) with theDepartment of Transportation (DOTr). The CA sets forth the rights and obligations of ASITI asconcessionaire, including the construction and operation of the South Integrated Transport SystemProject (the Project) of DOTr. During the concession period, DOTr will monitor and review theperformance of the concessionaire.
The concession will run for a period of 35 years from the start of the construction of the Project.Under the terms of the concession agreement, ASITI will design, engineer, construct, operate andmaintain a mass transportation intermodal terminal at the outskirts of Metro Manila. The operation ofthe Project includes the collection and remittance of terminal fees to DOTr of the concessionaireduring the concession period. In addition, ASITI will be permitted to develop and operate commercialleasing facilities.
Upon the start of the construction the Project, DOTr will give to ASITI the full, exclusive anduninterrupted use and possession of a 5.57 hectare property known as the Project Land. Ownershipof the Project Land shall remain with DOTr at all times while the possession, custody and risk of lossor deterioration of the Project and commercial assets shall vest in the concessionaire during theconcession period. ASITI shall transfer the Project and the related assets, free from any liens orencumbrances, to DOTr at the end of the concession period. ASITI will be entitled to annualpayments from DOTr amounting to P=277.9 million during the 35-year concession period, subject tomeeting benchmarks set for certain key performance indicators enumerated in the CA.
As of December 31, 2018, construction of the Project has not yet commenced.

- 129 -
*SGVFS032855*
38. Notes to Consolidated Statements of Cash Flows
Disclosed below is the rollforward of liabilities under financing activities:
2018
January 1, 2018 Cash flowsNon-cashchanges
Foreignexchange
movementDecember 31,
2018(In Thousands)
Short-term debt P=17,644,350 (P=3,257,633) P=− P=− P=14,386,717Current long-term debt 6,572,775 (6,598,176) 23,265,173 25,401 23,265,173Non-current long-term debt 150,168,631 18,880,582 (20,513,059) 910,795 149,446,949Dividends payable (Note 16) 360,130 (7,181,498) 7,485,914 − 664,546Deposits and other noncurrent liabilities 41,857,646 (5,584,237) 6,019,262 − 42,292,671Total liabilities from financing activities P=216,603,532 (P=2,742,734) P=16,257,290 P=936,196 P=230,056,056
2017
January 1, 2017 Cash flowsNon-cash
changes
Foreignexchangemovement
December 31,2017
(In Thousands)Short-term debt P=24,244,350 (P=6,600,000) P=− P=17,644,350Current long-term debt 5,187,111 1,362,005 − 23,659 6,572,775Non-current long-term debt 130,369,877 20,263,514 − (464,760) 150,168,631Dividends payable (Note 16) 426,244 (8,295,914) 8,229,800 360,130Deposits and other noncurrent liabilities 39,321,390 2,536,256 − 41,857,646Total liabilities from financing activities P=199,548,972 P=9,265,861 P=8,229,800 (P=441,101) P=216,603,532
The noncash activities of the Group pertain the following:
2018∂ transfer from investment properties to inventories amounting to P=7,446.2 million∂ transfer from inventories to investment properties amounting to P=116.4 million∂ transfer from investment properties to property and equipment amounting to P=4,900.6 million∂ transfer from investment properties to other noncurrent assets amounting to 60.0 million,
respectively
2017∂ transfer from inventories to investment properties amounting to P=2,454.9 million∂ transfer from investment properties to property and equipment amounting to P=1,764.6 million∂ transfer from investment properties to other current and noncurrent assets amounting to
P=86.3 million and 62.1 million, respectively
2016∂ transfers from inventories to investment properties amounting to P=1,065.3 million∂ transfer from investment properties to property and equipment amounting to P=16.7 million
39. Events After Reporting Date
On February 4, 2019, the Executive Committee approved the exchange of the 20% equity interestacquired from Mitsubishi Corporation in Laguna Technopark, Inc. (LTI), equivalent to 8,051 commonshares, with a total value of P=800 million, for additional shares of stock in Prime Orion Philippines,Inc. (POPI), equivalent to 323,886,640 common shares, subject to conditions to be fulfilled by POPI.
On February 27, 2019, the BOD approved the declaration of cash dividends amounting to P=0.26 peroutstanding common share. These will be paid on March 29, 2019 to shareholders on record as ofMarch 13, 2019.

- 130 -
*SGVFS032855*
On the same date, the BOD approved the filing with the SEC of a 3-year shelf registration of up toP=50 billion of debt securities (‘the Shelf Registration’). It also approved the raising of up to P=45 billionthrough: (a) retail bonds of up to P=16 billion under the Shelf Registration and listed on the PhilippineDealing and Exchange Corporation (PDEx), (b) SEC-exempt Qualified Buyer Notes of up to P=4 billionfor enrollment on the PDEx, and (c) bilateral term loans of up to P=25 billion to partially finance generalcorporate requirements and to refinance maturing loans.
The BOD also approved the Parent Company’s 2019 stock option program pursuant to our EmployeeStock Ownership Plan (the “Plan”). The program authorizes the grant to qualified executives, inaccordance with the terms of the Plan, stock options covering up to a total of 14,430,750 commonshares at a subscription price of P=44.49 per share, which is the average price of our common sharesat the Philippine Stock Exchange over the last 30-day trading as of February 26, 2019.

Ayala Land, Inc.
Parent Company Financial StatementsDecember 31, 2018 and 2017
and
Independent Auditor’s Report

*SGVFS033960*
INDEPENDENT AUDITOR’S REPORT
The Board of Directors and StockholdersAyala Land, Inc.
Opinion
We have audited the accompanying parent company financial statements of Ayala Land, Inc.(the Parent Company), which comprise the parent company statements of financial position as atDecember 31, 2018 and 2017, and the parent company statements of income, parent companystatements of comprehensive income, parent company statements of changes in equity and parentcompany statements of cash flows for the years then ended, and notes to the parent company financialstatements, including a summary of significant accounting policies.
In our opinion, the accompanying parent company financial statements present fairly, in all materialrespects, the financial position of the Parent Company as at December 31, 2018 and 2017, and itsfinancial performance and its cash flows for each of the three years in the period endedDecember 31, 2018 in accordance with Philippine Financial Reporting Standards (PFRSs).
Basis for Opinion
We conducted our audits in accordance with Philippine Standards on Auditing (PSAs). Ourresponsibilities under those standards are further described in the Auditor’s Responsibilities for the Auditof the Parent Company Financial Statements section of our report. We are independent of the ParentCompany in accordance with the Code of Ethics for Professional Accountants in the Philippines (Code ofEthics) together with the ethical requirements that are relevant to our audit of the parent companyfinancial statements in the Philippines, and we have fulfilled our other ethical responsibilities inaccordance with these requirements and the Code of Ethics. We believe that the audit evidence we haveobtained is sufficient and appropriate to provide a basis for our opinion.
Responsibilities of Management and Those Charged with Governance for the Parent CompanyFinancial Statements
Management is responsible for the preparation and fair presentation of the parent company financialstatements in accordance with PFRSs, and for such internal control as management determines isnecessary to enable the preparation of parent company financial statements that are free from materialmisstatement, whether due to fraud or error.
In preparing the parent company financial statements, management is responsible for assessing theParent Company’s ability to continue as a going concern, disclosing, as applicable, matters related togoing concern and using the going concern basis of accounting unless management either intends toliquidate the Parent Company or to cease operations, or has no realistic alternative but to do so.
Those charged with governance are responsible for overseeing the Parent Company’s financial reportingprocess.
SyCip Gorres Velayo & Co.6760 Ayala Avenue1226 Makati CityPhilippines
Tel: (632) 891 0307Fax: (632) 819 0872ey.com/ph
BOA/PRC Reg. No. 0001, October 4, 2018, valid until August 24, 2021SEC Accreditation No. 0012-FR-5 (Group A), November 6, 2018, valid until November 5, 2021
A member firm of Ernst & Young Global Limited

*SGVFS033960*
- 2 -
Auditor’s Responsibilities for the Audit of the Parent Company Financial Statements
Our objectives are to obtain reasonable assurance about whether the parent company financialstatements as a whole are free from material misstatement, whether due to fraud or error, and to issue anauditor’s report that includes our opinion. Reasonable assurance is a high level of assurance, but is not aguarantee that an audit conducted in accordance with PSAs will always detect a material misstatementwhen it exists. Misstatements can arise from fraud or error and are considered material if, individually orin the aggregate, they could reasonably be expected to influence the economic decisions of users takenon the basis of these parent company financial statements.
As part of an audit in accordance with PSAs, we exercise professional judgment and maintainprofessional skepticism throughout the audit. We also:
∂ Identify and assess the risks of material misstatement of the parent company financial statements,whether due to fraud or error, design and perform audit procedures responsive to those risks, andobtain audit evidence that is sufficient and appropriate to provide a basis for our opinion. The risk ofnot detecting a material misstatement resulting from fraud is higher than for one resulting from error,as fraud may involve collusion, forgery, intentional omissions, misrepresentations, or the override ofinternal control.
∂ Obtain an understanding of internal control relevant to the audit in order to design audit proceduresthat are appropriate in the circumstances, but not for the purpose of expressing an opinion on theeffectiveness of the Parent Company’s internal control.
∂ Evaluate the appropriateness of accounting policies used and the reasonableness of accountingestimates and related disclosures made by management.
∂ Conclude on the appropriateness of management’s use of the going concern basis of accounting and,based on the audit evidence obtained, whether a material uncertainty exists related to events orconditions that may cast significant doubt on the Parent Company’s ability to continue as a goingconcern. If we conclude that a material uncertainty exists, we are required to draw attention in ourauditor’s report to the related disclosures in the parent company financial statements or, if suchdisclosures are inadequate, to modify our opinion. Our conclusions are based on the audit evidenceobtained up to the date of our auditor’s report. However, future events or conditions may cause theParent Company to cease to continue as a going concern.
∂ Evaluate the overall presentation, structure and content of the parent company financial statements,including the disclosures, and whether the parent company financial statements represent theunderlying transactions and events in a manner that achieves fair presentation.
We communicate with those charged with governance regarding, among other matters, the plannedscope and timing of the audit and significant audit findings, including any significant deficiencies ininternal control that we identify during our audit.
We also provide those charged with governance with a statement that we have complied with relevantethical requirements regarding independence, and to communicate with them all relationships and othermatters that may reasonably be thought to bear on our independence, and where applicable, relatedsafeguards.
A member firm of Ernst & Young Global Limited

*SGVFS033960*
- 3 -
Report on the Supplementary Information Required Under Revenue Regulations 15-2010
Our audits were conducted for the purpose of forming an opinion on the parent company financialstatements taken as a whole. The supplementary information required under Revenue Regulations15-2010 in Note 34 to the parent company financial statements is presented for purposes of filing with theBureau of Internal Revenue and is not a required part of the basic parent company financial statements.Such information is the responsibility of the management of Ayala Land, Inc. The information has beensubjected to the auditing procedures applied in our audit of the basic parent company financialstatements. In our opinion, the information is fairly stated, in all material respects, in relation to the basicparent company financial statements taken as a whole.
The engagement partner on the audit resulting in this independent auditor’s report is Michael C. Sabado.
SYCIP GORRES VELAYO & CO.
Michael C. SabadoPartnerCPA Certificate No. 89336SEC Accreditation No. 0664-AR-3 (Group A), March 16, 2017, valid until March 15, 2020Tax Identification No. 160-302-865BIR Accreditation No. 08-001998-73-2018, February 26, 2018, valid until February 25, 2021PTR No. 7332607, January 3, 2019, Makati City
February 27, 2019
A member firm of Ernst & Young Global Limited

*SGVFS033960*
AYALA LAND, INC.PARENT COMPANY STATEMENTS OF FINANCIAL POSITION
December 31
2018
2017(As restated -
see Note 2)ASSETSCurrent AssetsCash and cash equivalents (Notes 4, 23 and 27) P=1,123,468,643 P=587,557,457Financial assets at fair value through profit or loss
(Notes 5, 23 and 27) 1,969,029 1,918,566Accounts and notes receivable (Notes 6, 23 and 27) 89,681,769,079 67,598,545,021Contract assets (Note 14) 10,608,729,457 −Inventories (Note 7) 25,375,032,394 20,712,785,349Other current assets (Note 8) 11,317,254,276 12,085,637,521
Total Current Assets 138,108,222,878 100,986,443,914Noncurrent AssetsNoncurrent accounts and notes receivable (Notes 6 and 27) 663,422,134 16,712,201,933Noncurrent contract assets (Note 14) 7,953,482,357 −Financial assets at fair value through other comprehensive income
(Notes 9 and 27) 247,401,447 −Available-for-sale financial assets (Notes 9 and 27) − 217,714,920Investments in subsidiaries, associates and joint ventures
(Note 10) 151,498,802,354 119,844,019,436Investment properties (Note 11) 88,663,136,558 86,650,733,443Property and equipment (Note 12) 1,066,994,712 828,989,167Deferred tax assets - net (Note 22) 2,562,368,952 2,181,321,759Other noncurrent assets (Note 13) 4,202,816,282 5,707,416,860
Total Noncurrent Assets 256,858,424,796 232,142,397,518P=394,966,647,674 P=333,128,841,432
LIABILITIES AND EQUITYCurrent LiabilitiesShort-term debt (Notes 16, 23 and 27) P=13,500,900,000 P=16,991,350,000Accounts and other payables (Notes 15, 23 and 27) 90,670,281,141 59,476,247,167Contract liabilities (Note 14) 10,476,250,868 −Current portion of long-term debt (Notes 16, 23 and 27) 20,255,266,261 971,190,276Deposits and other current liabilities (Note 17) 2,596,506,307 4,194,740,011
Total Current Liabilities 137,499,204,577 81,633,527,454Noncurrent LiabilitiesLong-term debt - net of current portion (Notes 16, 23 and 27) 122,659,181,389 124,271,705,905Pension liabilities - net (Note 24) 1,214,803,803 1,212,493,603Contract liabilities - net of current portion (Note 14) 3,143,547,293 −Deposits and other noncurrent liabilities (Notes 18 and 27) 4,026,622,637 7,727,724,424
Total Noncurrent Liabilities 131,044,155,122 133,211,923,932Total Liabilities 268,543,359,699 214,845,451,386
Equity (Note 19)Paid-in capital 62,350,964,177 61,948,711,384Stock options outstanding (Note 26) 65,461,806 99,063,674Retained earnings 64,244,722,057 56,563,943,910Fair value reserve of financial assets at FVOCI (Note 9) 69,173,878 39,487,351Remeasurement loss on defined benefit plans (Note 24) (307,033,943) (367,816,273)
Total Equity 126,423,287,975 118,283,390,046P=394,966,647,674 P=333,128,841,432
See accompanying Notes to Parent Company Financial Statements.

*SGVFS033960*
AYALA LAND, INC.PARENT COMPANY STATEMENTS OF INCOME
Years Ended December 312018 2017
REVENUEReal estate (Note 20) P=40,938,668,136 P=37,202,154,673Interest income from real estate sales (Notes 6, 20 and 14) 1,701,410,613 1,595,607,661
42,640,078,749 38,797,762,334Interest income (Notes 4 and 23) 665,038,570 494,497,136Dividend income 8,620,607,070 10,495,133,950Other income (Note 21) 3,685,996,737 2,436,534,959
12,971,642,377 13,426,166,04555,611,721,126 52,223,928,379
COSTS AND EXPENSES (Note 21)Real estate 28,585,376,175 25,580,926,543General and administrative expenses 2,267,438,383 2,462,133,741Interest expense and other financing charges 8,167,354,685 6,448,102,197Other charges 92,785,049 4,782,138Other expenses 2,013,205 273,084
39,114,967,497 34,496,217,703
INCOME BEFORE INCOME TAX 16,496,753,629 17,727,710,676
PROVISION FOR INCOME TAX (Note 22)Current 1,704,899,608 1,760,394,894Deferred (407,096,763) 354,873,532
1,297,802,845 2,115,268,426
NET INCOME P=15,198,950,784 P=15,612,442,250
Earnings Per Share (Note 25)Basic and diluted P=1.03 P=1.06
See accompanying Notes to Parent Company Financial Statements.

*SGVFS033960*
AYALA LAND, INC.PARENT COMPANY STATEMENTS OF COMPREHENSIVE INCOME
Years Ended December 312018 2017
Net Income P=15,198,950,784 P=15,612,442,250
Other comprehensive income (loss)Items that may be reclassified to profit or loss in
subsequent years: Fair value reserve of financial assets at FVOCI (Note 9) 29,686,527 13,061,701Items that will not be reclassified to profit or loss in
subsequent years: Remeasurement gain (loss) on pension liability (Note 24) 86,831,900 (13,241,200) Income tax effect (26,049,570) 3,972,360
Total other comprehensive income - net of tax 90,468,857 3,792,861
Total comprehensive income P=15,289,419,641 P=15,616,235,111
See accompanying Notes to Parent Company Financial Statements.

*SGVFS033960*
AYALA LAND, INC.PARENT COMPANY STATEMENTS OF CHANGES IN EQUITY
Capital Stock(Note 19)
AdditionalPaid-in Capital
(Note 19)
SubscriptionsReceivable
(Note 19)
AppropriatedRetainedEarnings(Note 19)
UnappropriatedRetainedEarnings(Note 19)
Stock OptionsOutstanding
(Note 26)
Net UnrealizedGain on
Available for SaleFinancial Assets
(Note 9)
RemeasurementLoss on Defined
Benefit Plans(Note 24) Total
As of January 1, 2018 P=16,031,597,034 P=47,454,239,398 (P=1,537,125,048) P=8,000,000,000 P=48,563,943,910 P=99,063,674 P=39,487,351 (P=367,816,273) P=118,283,390,046Net income − − − − 15,198,950,784 − − − 15,198,950,784Other comprehensive gain − − − − − − 29,686,527 60,782,330 90,468,857Total comprehensive income − − − − 15,198,950,784 − 29,686,527 60,782,330 15,289,419,641Cost of stock options − 132,121,289 − − − (33,601,868) − − 98,519,421Adjustment in prior year (32,257,932) (32,257,932)Collections of subscription receivable − − 270,131,504 − − − − − 270,131,504Stock options exercised 9,933,523 399,628,314 (409,561,837) − − − − − −Cash dividends declared − − − − (7,485,914,705) − − − (7,485,914,705)
As of December 31, 2018 P=16,041,530,557 P=47,985,989,001 (P=1,676,555,381) P=8,000,000,000 P=56,244,722,057 P=65,461,806 P=69,173,878 (P=307,033,943) P=126,423,287,975
As of January 1, 2017 P=16,019,332,064 P=46,928,519,282 (P=1,385,680,992) P=8,000,000,000 P=40,078,570,822 P=89,696,962 P=26,425,650 (P=358,547,433) P=109,398,316,355Net income − − − − 15,612,442,250 − − − 15,612,442,250Other comprehensive loss − − − − − − 13,061,701 (9,268,840) 3,792,861Total comprehensive income − − − − 15,612,442,250 − 13,061,701 (9,268,840) 15,616,235,111Cost of stock options − 144,477,825 − − − 9,366,712 − − 153,844,537Collections of subscription receivable − − 242,063,205 − − − − − 242,063,205Stock options exercised 12,264,970 381,242,291 (393,507,261) − − − − − −Cash dividends declared − − − − (7,127,069,162) − − − (7,127,069,162)
As of December 31, 2017 P=16,031,597,034 P=47,454,239,398 (P=1,537,125,048) P=8,000,000,000 P=48,563,943,910 P=99,063,674 P=39,487,351 (P=367,816,273) P=118,283,390,046

*SGVFS033960*
AYALA LAND, INC.PARENT COMPANY STATEMENTS OF CASH FLOWS
Years Ended December 31
2018
2017(As restated -
see Note 2)
CASH FLOWS FROM OPERATING ACTIVITIESIncome before income tax P=16,496,753,629 P=17,727,710,676Adjustments for: Interest expense and amortization of transaction cost
(Note 17 and 21) 7,443,676,259 6,183,863,123 Depreciation (Notes 11, 12 and 21) 1,214,401,615 990,581,981 Cost of share-based payments (Note 24) 98,519,421 153,844,537 Unrealized foreign exchange loss (gain) (Note 21) (189,879,957) 24,131,249
Provision for impairment losses and write-offs (Note 21) 2,013,205 526,630,121 Gain on financial assets at fair value
through profit or loss (Note 21) (50,463) (27,135)Gain on sale of property and equipment (Note 21) (20,261,459) (34,784,163)
Gain on sale of investment property (Note 21) − (388,954,545)Gain on sale of investment in subsidiaries, associates and
joint ventures (Note 21) (3,072,132,224) − Interest income (665,038,570) (494,497,136) Dividend income (8,620,607,070) (10,495,133,950)Operating income before changes in working capital 12,687,394,386 14,193,364,758Changes in operating assets and liabilities: Decrease (increase) in:
Contract assets (Note 14) 7,501,868,819 − Inventories (Notes 7 and 30) 2,203,290,407 4,282,598,610 Other current assets 2,225,411,824 (3,307,130,599) Accounts and notes receivable (Note 6) (26,637,138,088) 8,438,896,659 Increase (decrease) in: Accounts and other payables (Note 15) 31,259,657,882 (11,492,777,259) Contract liabilities (Note 14) 6,842,341,358 − Pension liabilities (Note 24) 89,142,100 35,603,294 Other current liabilities 5,179,223,099 4,151,895,498Cash generated from operations 41,351,191,787 16,302,450,961Dividends received 8,898,190,029 10,374,705,370Interest received 664,983,278 394,386,083Income tax paid (3,164,254,804) (2,899,127,992)Interest paid (7,184,760,234) (8,811,664,285)Net cash provided by operating activities 40,565,350,056 15,360,750,137
CASH FLOWS FROM INVESTING ACTIVITIESProceeds from disposal/maturity/redemption of: Investment properties (Note 11) 8,487,327,932 15,252,347,521 Investments in subsidiaries, associates
and joint ventures (Note 10) 1,713,057,874 2,136,196,999 Property and equipment (Note 12) 24,625,545 46,446,913Decrease (increase) in other noncurrent assets 1,506,927,194 (2,574,945,544)Increase in accounts and notes receivable – nontrade (Note 6) (5,740,927,675) (7,059,688,486)Purchases/additions to: Available-for-sale financial assets − (4,262,248)
(Forward)

*SGVFS033960*
- 2 -
Years Ended December 31
2018
2017(As restated -
see Note 2) Property and equipment (Note 12) (P=432,346,680) (P=278,816,310) Investment properties (Note 11) (16,462,705,261) (18,883,950,790) Investments in subsidiaries, associates and joint ventures
(Note 10) (30,327,966,500) (15,492,366,518)Net cash used in investing activities (41,232,007,571) (26,859,038,463)
CASH FLOWS FROM FINANCING ACTIVITIESProceeds from short-term and long-term debts (Note 16) 123,457,980,477 84,482,556,117Proceeds from capital stock subscriptions 270,131,504 242,063,205Decrease in deposits and other noncurrent liabilities (Note 18) (5,803,125,746) (4,005,298,319)Payments of cash dividends (Note 19) (7,485,914,705) (7,127,069,162)Payments of short-term and long-term debts (Note 16) (109,236,502,829) (62,789,051,250)Net cash provided by financing activities 1,202,568,701 10,803,200,591
NET INCREASE (DECREASE) IN CASHAND CASH EQUIVALENTS 535,911,186 (695,087,735)
CASH AND CASH EQUIVALENTSAT BEGINNING OF YEAR 587,557,457 1,282,645,192
CASH AND CASH EQUIVALENTSAT END OF YEAR (Note 4) P=1,123,468,643 P=587,557,457
See accompanying Notes to Parent Company Financial Statements.

*SGVFS033960*
AYALA LAND, INC.NOTES TO PARENT COMPANY FINANCIAL STATEMENTS
1. Corporate Information
Ayala Land, Inc. (the “Parent Company”, or “ALI”) is domiciled and was incorporated on June 30,1988 in the Republic of the Philippines with a corporate life of 50 years. The Parent Company is asubsidiary of Ayala Corporation (AC). AC is a publicly-listed company, 47.04%-owned by Mermac,Inc. and the rest by the public as of December 31, 2018. The Parent Company’s registered office andprincipal place of business is 31st Floor, Tower One and Exchange Plaza, Ayala Triangle, AyalaAvenue, Makati City.
The Parent Company is incorporated to hold, develop, manage, administer, sell, convey, encumber,purchase, acquire, rent or otherwise deal in and dispose of, for itself or for others, residentialincluding, but not limited to, all kinds of housing projects, commercial, industrial, urban or other kindsof real property; to acquire, purchase, hold, manage, develop and sell subdivision lots, with or withoutbuildings or improvements; to erect, construct, alter, manage, operate, lease, in whole or in part,buildings and tenements of the Parent Company or of other persons; and to engage or act as realestate broker.
The accompanying parent company financial statements were endorsed for approval by the AuditCommittee on February 14, 2019 and were approved and authorized for issue by the Board ofDirectors (BOD) on February 27, 2019.
2. Summary of Significant Accounting Policies
Basis of PreparationThe parent company financial statements have been prepared using the historical cost basis, exceptfor financial assets at fair value through profit or loss (FVPL), financial assets at fair value throughother comprehensive income (FVOCI) and available-for-sale financial assets that have beenmeasured at fair value. The parent company financial statements are presented in Philippine Peso(P=), which is also the Parent Company’s functional currency and all amounts are rounded to thenearest peso, except when otherwise indicated.
The parent company financial statements provide comparative information in respect of the previousperiod.
Statement of ComplianceThe parent company financial statements of Ayala Land, Inc., which are prepared for submission tothe Philippine Securities and Exchange Commission (SEC) and to the Bureau of Internal Revenue(BIR), have been prepared in compliance with Philippine Financial Reporting Standards (PFRSs).PFRSs include Philippine Financial Reporting Standards, Philippine Accounting Standards andInterpretations issued by the Philippine Interpretations Committee (PIC).
The Parent Company also prepares and issues consolidated financial statements presented incompliance with PFRSs which can be obtained from the Parent Company’s registered address.
Adoption of New and Amended Accounting Standards and InterpretationsThe accounting policies adopted in the preparation of the parent company financial statements areconsistent with those of the previous financial year except for the adoption of the following new andamended PFRSs which became effective January 1, 2018.

- 2 -
*SGVFS033960*
The nature and impact of each new standard and amendment are described below:
∂ Amendments to PFRS 2, Share-based Payment, Classification and Measurement of Share-basedPayment Transactions
The Parent Company’s accounting policy for cash-settled share-based payments is consistentwith the approach clarified in the amendments. In addition, the Parent Company has no share-based payment transaction with net settlement features for withholding tax obligations and hadnot made any modifications to the terms and conditions of its share-based payment transaction.Therefore, these amendments do not have any impact on the Parent Company’s financialstatements.
∂ PFRS 9, Financial InstrumentsPFRS 9 replaces PAS 39, Financial Instruments: Recognition and Measurement for annualperiods beginning on or after January 1, 2018, bringing together all three aspects of theaccounting for financial instruments: classification and measurement; impairment; and hedgeaccounting.
The Parent Company applied PFRS 9 using modified retrospective approach, with an initialapplication date of January 1, 2018. The Parent Company has not restated the comparativeinformation, which continues to be reported under PAS 39. Differences arising from the adoptionof PFRS 9 have been recognized directly in retained earnings and other components of equity.
The effect of adopting PFRS 9 as at January 1, 2018 was, as follows:
As previouslyreported
December 31, 2017 Reference AdjustmentA restated
January 1, 2018Available-for-sale
financial assets P=217,714,920 (a) (P=217,714,920) P=−Financial assets at fair value
through othercomprehensive income (a) 217,714,920 217,714,920
The nature of these adjustments are described below:
(a) Classification and measurementUnder PFRS 9, debt instruments are subsequently measured at fair value through profit orloss, amortized cost, or fair value through OCI. The classification is based on two criteria: theParent Company’s business model for managing the assets; and whether the instruments’contractual cash flows represent ‘solely payments of principal and interest’ on the principalamount outstanding.
The assessment of the Parent Company’s business model was made as of the date of initialapplication, January 1, 2018, and then applied prospectively to those financial assets thatwere not derecognized before January 1, 2018. The assessment of whether contractual cashflows on debt instruments are solely comprised of principal and interest was made based onthe facts and circumstances as at the initial recognition of the assets.
The classification and measurement requirements of PFRS 9 did not have a significantimpact to the Parent Company. The Parent Company continued measuring at fair value allfinancial assets previously held at fair value under PAS 39. The following are the changes inthe classification of the Parent Company’s financial assets:
• Cash and cash equivalents, short term investments and accounts and notes receivablespreviously classified as loans and receivables are held to collect contractual cash flowsand give rise to cash flows representing solely payments of principal and interest. Theseare now classified and measured as financial assets at amortized cost beginningJanuary 1, 2018.

- 3 -
*SGVFS033960*
• Equity investments in listed and non-listed companies previously classified as Available-for-sale (AFS) financial assets are now classified and measured as financial assetsdesignated at fair value through OCI. The Parent Company elected to classifyirrevocably its equity investments under this category as it intends to hold theseinvestments for the foreseeable future.
The Parent Company has not designated any financial liabilities as at fair value through profit orloss. There are no changes in classification and measurement for the Parent Company’sfinancial liabilities.
In summary, upon adoption of PFRS 9, the Parent Company had the following required or electedreclassifications as at January 1, 2018.
PFRS 9 Measurement Categories
PAS 39 Categories Balances
Fair valuethrough
profit or loss Amortized costFair value
through OCILoans and receivables
Cash and cash equivalents P=587,557,457 P=− P=587,557,457 P=−Accounts and notes receivables 84,310,746,954 − 84,310,746,954 −
Available-for-sale financial assets 217,714,920 − − 217,714,920Financial assets at FVPL 1,918,566 1,918,566 − −
P=85,117,937,897 P=1,918,566 P=84,898,304,411 P=217,714,920
(b) ImpairmentThe adoption of PFRS 9 has fundamentally changed the Parent Company’s accounting forimpairment losses for financial assets by replacing PAS 39’s incurred loss approach with aforward-looking expected credit loss (ECL) approach. PFRS 9 requires the Parent Companyto record an allowance for impairment losses for all loans and other debt financial assets notheld at FVPL. ECLs are based on the difference between the contractual cash flows due inaccordance with the contract and all the cash flows that the Parent Company expects toreceive. The shortfall is then discounted at an approximation to the asset’s original effectiveinterest rate. The expected cash flows will include cash flows from the sale of collateral heldor other credit enhancements that are integral to the contractual terms.
For installment contracts receivables (ICR) presented under trade receivables and contractassets, the Parent Company has applied the standard’s simplified approach and hascalculated ECLs based on lifetime expected credit losses. Therefore, the Parent Companydoes not track changes in credit risk, but instead recognizes a loss allowance based onlifetime ECLs at each reporting date.
The Parent Company used the vintage analysis accounts for expected credit losses bycalculating the cumulative loss rates of a given loan pool. It derives the probability of defaultfrom the historical data of a homogenous portfolio that share the same origination period.The information on the number of defaults during fixed time intervals of the accounts isutilized to create the probability model. It allows the evaluation of the loan activity from itsorigination period until the end of the contract period.
In addition to life of loan loss data, primary drivers like macroeconomic indicators ofqualitative factors such as forward-looking data on inflation and interest rates were added tothe expected loss calculation to reach a forecast supported by both quantitative andqualitative data points.
The key inputs in the model include the Parent Company’s definition of default and historicaldata of three years for the origination, maturity date and default date. The Parent Companyconsiders an ICR in default when contractual payment are 90 days past due. However, incertain cases, the Parent Company may also consider a financial asset to be in default wheninternal or external information indicates that the Parent Company is unlikely to receive the

- 4 -
*SGVFS033960*
outstanding contractual amounts in full before taking into account any credit enhancementsheld by the Parent Company.
The probability of default is applied to the estimate of the loss arising on default which isbased on the difference between the contractual cash flows due and those that the ParentCompany would expect to receive, including from the repossession of the subject real estateproperty, net of cash outflows. For purposes of calculating loss given default, accounts aresegmented based on facility/collateral type and completion. In calculating the recovery rates,the Parent Company considered collections of cash and/or cash from resale of real estateproperties after foreclosure, net of direct costs of obtaining and selling the real estateproperties after the default event such as commission, association dues, refurbishment,payment required under Maceda law, cost to complete (for incomplete units).
As these are future cash flows, these are discounted back to the time of default using theappropriate effective interest rate, usually being the original EIR or an approximation thereof.
For other financial assets such as accrued interest receivable, receivable from tenants andothers, ECLs are recognized in two stages. For credit exposures for which there has notbeen a significant increase in credit risk since initial recognition, ECLs are provided for creditlosses that result from default events that are possible within the next 12-months (a 12-monthECL). For those credit exposures for which there has been a significant increase in creditrisk since initial recognition, a loss allowance is required for credit losses expected over theremaining life of the exposure, irrespective of the timing of the default (a lifetime ECL).
For cash and cash equivalents, the Parent Company applies the low credit risk simplification.The probability of default and loss given defaults are publicly available and are considered tobe low credit risk investments. It is the Parent Company’s policy to measure ECLs on suchinstruments on a 12-month basis. However, when there has been a significant increase incredit risk since origination, the allowance will be based on the lifetime ECL. The ParentCompany uses the ratings from Standard and Poor’s (S&P), Moody’s and Fitch to determinewhether the debt instrument has significantly increased in credit risk and to estimate ECLs.
There is no transition adjustment in relation to the impairment allowance as ofJanuary 1, 2018.
∂ Amendments to PFRS 4, Applying PFRS 9 Financial Instruments with PFRS 4 InsuranceContracts
The amendments address concerns arising from implementing PFRS 9, the new financialinstruments standard before implementing the new insurance contracts standard. Theamendments introduce two options for entities issuing insurance contracts: a temporaryexemption from applying PFRS 9 and an overlay approach. The temporary exemption is firstapplied for reporting periods beginning on or after January 1, 2018. An entity may elect theoverlay approach when it first applies PFRS 9 and apply that approach retrospectively to financialassets designated on transition to PFRS 9. The entity restates comparative information reflectingthe overlay approach if, and only if, the entity restates comparative information when applyingPFRS 9.
The amendments are not applicable to the Parent Company since there are no activities withinthe Parent Company that are predominantly connected with insurance or issue insurancecontracts.

- 5 -
*SGVFS033960*
∂ PFRS 15, Revenue from Contracts with Customers
PFRS 15 supersedes PAS 11, Construction Contracts, PAS 18, Revenue and relatedInterpretations and it applies, with limited exceptions, to all revenue arising from contracts withcustomers. PFRS 15 establishes a five-step model to account for revenue arising from contractswith customers and requires that revenue be recognized at an amount that reflects theconsideration to which an entity expects to be entitled in exchange for transferring goods orservices to a customer.
PFRS 15 requires entities to exercise judgement, taking into consideration all of the relevant factsand circumstances when applying each step of the model to contracts with their customers. Thestandard also specifies the accounting for the incremental costs of obtaining a contract and thecosts directly related to fulfilling a contract. In addition, the standard requires extensivedisclosures.
On February 14, 2018, the PIC issued PIC Q&A 2018-12 (PIC Q&A) which provides guidance onsome implementation issues of PFRS 15 affecting real estate industry. On October 25, 2018 andFebruary 8, 2019, the SEC issued SEC Memorandum Circular No. 14 Series of 2018 and SECMemorandum Circular No. 3 Series of 2019, respectively, providing relief to the real estateindustry by deferring the application of the following provisions of the above PIC Q&A for a periodof 3 years:a. Exclusion of land and uninstalled materials in the determination of percentage of completion
(POC) discussed in PIC Q&A No. 2018-12-Eb. Accounting for significant financing component discussed in PIC Q&A No. 2018-12-Dc. Accounting to Common Usage Service Area (CUSA) Charges discussed in PIC Q&A
No. 2018-12-H
Under the same SEC Memorandum Circular No. 3 Series of 2019, the adoption of PIC Q&ANo. 2018-14: PFRS 15 – Accounting for Cancellation of Real Estate Sales was also deferred.
The SEC Memorandum Circular also provided the mandatory disclosure requirements should anentity decide to avail of any relief. Disclosures should include:a. The accounting policies appliedb. Discussion of the deferral of the subject implementation issues in the PIC Q&Ac. Qualitative discussion of the impact to the financial statements had the concerned application
guideline in the PIC Q&A has been adopted.d. Should any of the deferral options result into a change in accounting policy (e.g., when an
entity excludes land and/or uninstalled materials in the POC calculation under the previousstandard but opted to include such components under the relief provided by the circular),such accounting change will have to be accounted for under PAS 8, i.e., retrospectively,together with the corresponding required quantitative disclosures.
Except for the CUSA charges discussed under PIC Q&A No. 2018-12-H which applies to leasingtransactions, the above deferral will only be applicable for real estate sales transactions.
Effective January 1, 2021, real estate companies will adopt PIC Q&A No. 2018-12 and PIC Q&ANo. 2018-14 and any subsequent amendments thereof retrospectively or as the SEC will laterprescribe.
The Parent Company availed of the deferral of adoption of the above specific provisions of PICQ&As. Had these provisions been adopted, it would have the following impact in the parentcompany financial statements:∂ The exclusion of land and uninstalled materials in the determination of POC would reduce the
percentage of completion of real estate projects resulting in a decrease in retained earningsas at January 1, 2018 as well as a decrease in the revenue from real estate sales in 2018.This would result to the land portion of sold inventories together with connection fees, to betreated as contract fulfillment asset.

- 6 -
*SGVFS033960*
∂ The mismatch between the POC of the real estate projects and right to an amount ofconsideration based on the schedule of payments explicit in the contract to sell wouldconstitute a significant financing component. Interest income would have been recognizedfor contract assets and interest expense for contract liabilities using effective interest ratemethod and this would have impacted retained earnings as at January 1, 2018 and therevenue from real estate sales in 2018. Currently, any significant financing componentarising from the mismatch discussed above is not considered for revenue recognitionpurposes.
∂ For airconditioning services, common use services and administration and handling services,would have acted as principal, these would have resulted to the gross presentation of therelated revenue and the related expenses and cost. Currently, the related revenue ispresented net of costs and expenses. These would not result to any adjustment in theretained earnings as of January 1, 2018 and net income.
∂ Upon sales cancellation, the repossessed inventory would be recorded at fair value plus costto repossess (or fair value less cost to repossess if this would have been opted). This wouldhave increased retained earnings as at January 1, 2018 and gain from repossession in 2018.Currently, the Parent Company records the repossessed inventory at cost.
The Parent Company adopted PFRS 15 using the modified retrospective method of adoption withthe date of initial application of January 1, 2018. Under this method, the standard can be appliedeither to all contracts at the date of initial application or only to contracts that are not completed atthis date. The Parent Company elected to apply the standard to all contracts as atJanuary 1, 2018.
The cumulative effect of initially applying PFRS 15 is recognized at the date of initial applicationas an adjustment to the opening balance of retained earnings. Therefore, the comparativeinformation was not restated and continues to be reported under PAS 11, PAS 18 and relatedInterpretations.
The effect of adopting PFRS 15 as at January 1, 2018 was as follows:
As previouslyreported
December 31, 2017 Reference AdjustmentA restated
January 1, 2018Contract assets P=− (a) P=26,064,081,633 P=26,064,080,633Contract liabilities − (a) 6,777,456,803 6,777,456,803
Set out below, are the amounts by which each financial statement line item is affected as at andfor the year ended December 31, 2018 as a result of the adoption of PFRS 15. The adoption ofPFRS 15 did not have a material impact on profit or loss, OCI or the Parent Company’s operating,investing and financing cash flows. The first column shows amounts prepared under PFRS 15and the second column shows what the amounts would have been had PFRS 15 not beenadopted:
Parent company statement of financial position for the year ended December 31, 2018
Amounts prepared under
PFRS 15 Previous PFRSIncrease
(decrease)ASSETSCurrent AssetsAccounts and notes receivable (Note 6) P=89,681,769,079 P=100,290,498,536 (P=10,608,729,457)Contract assets (Note 14) 10,608,729,457 − 10,608,729,457
Total Current Assets 100,290,498,536 100,290,498,536 −Noncurrent AssetsNoncurrent accounts and notes receivable (Note 6) 663,422,134 8,616,904,491 (7,953,482,357)Noncurrent contract assets (Note 14) 7,953,482,357 − 7,953,482,357
Total Noncurrent Assets 8,616,904,491 8,616,904,491 −Total Assets P=108,907,403,027 P=108,907,403,027 P=−
(Forward)

- 7 -
*SGVFS033960*
Amounts prepared under
PFRS 15 Previous PFRSIncrease
(decrease)LIABILITIES AND EQUITYCurrent LiabilitiesContract liabilities (Note 14) P=10,476,250,868 P=− P=10,476,250,868Deposits and other current liabilities (Note 18) 2,596,506,307 16,216,304,468 13,619,798,161
Total Current Liabilities 13,072,757,175 16,216,304,468 (3,143,547,293)Noncurrent LiabilitiesNoncurrent contract liabilities (Note 14) 3,143,547,293 − 3,143,547,293
Total Noncurrent Liabilities 3,143,547,293 − 3,143,547,293Total Liabilities P=16,216,304,468 P=16,216,304,468 P=−
The nature of the adjustments as at January 1, 2018 and the reasons for the significant changesin the parent company statement of financial position as at December 31, 2018 for the yearended December 31, 2018 are described below:
(a) The Parent Company records any excess of progress of work over the right to an amount ofconsideration that is unconditional, recognized as installment contract receivables, ascontract asset while the excess of collection/ receivable over progress of work is recorded ascontract liability.
Before the adoption of PFRS 15, contract asset is not presented separately from installmentcontracts receivables while contract liabilities are presented as customers’ deposit. For thosereceivables with interest rate explicit in the contract, the Parent Company records interest incomebased on the principal amount multiplied by the applicable interest rate while for thosereceivables without explicit interest rate stated in the contract were recorded at fair value at initialrecognition and the related interest is accreted using effective interest rate method.
The above resulted in recording of contract assets of P=26,064.1 million and contact liabilities ofP=6,777.5 million as of January 1, 2018.
As at December 31, 2018, PFRS 15 increased contract assets and contract liabilities byP=17,999.0 million and P=13,619.8 million, respectively and decreased installment contractsreceivable and customers’ deposit liabilities by P=17,999.0 million and P=13,619.8 million,respectively.
PIC Q&A on Advances to Contractors and PIC Q&A on Land ClassificationThe Parent Company adopted PIC Q&A 2018-11, Classification of Land by Real Estate Developerand PIC Q&A 2018-15, PAS 1- Classification of Advances to Contractors in the Nature ofPrepayments: Current vs. Non-current starting January 1, 2018. The impact of adoption is appliedretrospectively which resulted to the following reclassifications in the parent company statements offinancial position.
December 31, 2016 ReferenceInventories/
Current AssetInvestment Properties/
Non-current AssetLand and improvements (a) P=5,258,105,373 P=49,404,410,897Advances to contractors and suppliers (b) 9,421,308,041 435,865,155
P=14,679,413,414 P=49,840,276,052
(a) Land and improvements previously presented as non-current asset includes land which theBoard of Directors has previously approved to be developed into residential development forsale. Before the adoption of PIC Q&A 2018-11, the classification was based on the ParentCompany’s timing to start the development of the property. This was reclassified underinventories in the parent company statement of financial position. Land intended asinvestment property or with unintended future use was reclassified to investment properties.

- 8 -
*SGVFS033960*
(b) Advances to contractors and suppliers previously presented under current assets,representing prepayments for the construction of investment property was reclassified to non-current asset. Before the adoption of PIC Q&A 2018-15, the classification of the ParentCompany is based the timing of application of these advances against billings and timing ofdelivery of goods and services. This interpretation aims to classify the prepayment based onthe actual realization of such advances based on the determined usage/realization of theasset to which it is intended for (e.g. inventory, investment property, property plant andequipment).
∂ Amendments to PAS 28, Investments in Associates and Joint Ventures, Measuring an Associateor Joint Venture at Fair Value (Part of Annual Improvements to PFRSs 2014 - 2016 Cycle)
The amendments clarify that an entity that is a venture capital organization, or other qualifyingentity, may elect, at initial recognition on an investment-by-investment basis, to measure itsinvestments in associates and joint ventures at fair value through profit or loss. They also clarifythat if an entity that is not itself an investment entity has an interest in an associate or jointventure that is an investment entity, the entity may, when applying the equity method, elect toretain the fair value measurement applied by that investment entity associate or joint venture tothe investment entity associate’s or joint venture’s interests in subsidiaries. This election is madeseparately for each investment entity associate or joint venture, at the later of the date on which(a) the investment entity associate or joint venture is initially recognized; (b) the associate or jointventure becomes an investment entity; and (c) the investment entity associate or joint venturefirst becomes a parent. Retrospective application is required.
The amendments do not have material impact on the Parent Company’s financial statements.
∂ Amendments to PAS 40, Investment Property, Transfers of Investment Property
The amendments clarify when an entity should transfer property, including property underconstruction or development into, or out of investment property. The amendments state that achange in use occurs when the property meets, or ceases to meet, the definition of investmentproperty and there is evidence of the change in use. A mere change in management’s intentionsfor the use of a property does not provide evidence of a change in use. Retrospective applicationof the amendments is not required and is only permitted if this is possible without the use ofhindsight.
Since the Parent Company’s current practice is in line with the clarifications issued, the ParentCompany does not expect any effect on its parent company financial statements upon adoptionof these amendments.
∂ Philippine Interpretation IFRIC-22, Foreign Currency Transactions and Advance Consideration
The interpretation clarifies that, in determining the spot exchange rate to use on initial recognitionof the related asset, expense or income (or part of it) on the derecognition of a non-monetaryasset or non-monetary liability relating to advance consideration, the date of the transaction is thedate on which an entity initially recognizes the nonmonetary asset or non-monetary liability arisingfrom the advance consideration. If there are multiple payments or receipts in advance, then theentity must determine the date of the transaction for each payment or receipt of advanceconsideration. Retrospective application of this interpretation is not required.
Since the Parent Company’s current practice is in line with the clarifications issued, the ParentCompany does not expect any effect on its parent company financial statements upon adoptionof this interpretation.
- 9 -
*SGVFS033960*
Effective beginning on or after January 1, 2019
∂ Amendments to PFRS 9, Prepayment Features with Negative CompensationUnder PFRS 9, a debt instrument can be measured at amortized cost or at fair value throughother comprehensive income, provided that the contractual cash flows are ‘solely payments ofprincipal and interest on the principal amount outstanding’ (the SPPI criterion) and the instrumentis held within the appropriate business model for that classification. The amendments to PFRS 9clarify that a financial asset passes the SPPI criterion regardless of the event or circumstancethat causes the early termination of the contract and irrespective of which party pays or receivesreasonable compensation for the early termination of the contract. The amendments should beapplied retrospectively and are effective from January 1, 2019, with earlier application permitted.
The Parent Company is currently assessing the impact of adopting this interpretation.
∂ PFRS 16, LeasesPFRS 16 sets out the principles for the recognition, measurement, presentation and disclosure ofleases and requires lessees to account for all leases under a single on-balance sheet modelsimilar to the accounting for finance leases under PAS 17, Leases. The standard includes tworecognition exemptions for lessees – leases of ’low-value’ assets (e.g., personal computers) andshort-term leases (i.e., leases with a lease term of 12 months or less). At the commencementdate of a lease, a lessee will recognize a liability to make lease payments (i.e., the lease liability)and an asset representing the right to use the underlying asset during the lease term (i.e., theright-of-use asset). Lessees will be required to separately recognize the interest expense on thelease liability and the depreciation expense on the right-of-use asset.
Lessees will be also required to remeasure the lease liability upon the occurrence of certainevents (e.g., a change in the lease term, a change in future lease payments resulting from achange in an index or rate used to determine those payments). The lessee will generallyrecognize the amount of the remeasurement of the lease liability as an adjustment to the right-of-use asset.
Lessor accounting under PFRS 16 is substantially unchanged from today’s accounting underPAS 17. Lessors will continue to classify all leases using the same classification principle as inPAS 17 and distinguish between two types of leases: operating and finance leases.
PFRS 16 also requires lessees and lessors to make more extensive disclosures than underPAS 17.
A lessee can choose to apply the standard using either a full retrospective or a modifiedretrospective approach. The standard’s transition provisions permit certain reliefs.
The Parent Company is currently assessing the impact of adopting this standard.
∂ Amendments to PAS 19, Employee Benefits, Plan Amendment, Curtailment or SettlementThe amendments to PAS 19 address the accounting when a plan amendment, curtailment orsettlement occurs during a reporting period. The amendments specify that when a planamendment, curtailment or settlement occurs during the annual reporting period, an entity isrequired to:
• Determine current service cost for the remainder of the period after the plan amendment,curtailment or settlement, using the actuarial assumptions used to remeasure the net definedbenefit liability (asset) reflecting the benefits offered under the plan and the plan assets afterthat event.

- 10 -
*SGVFS033960*
• Determine net interest for the remainder of the period after the plan amendment, curtailmentor settlement using: the net defined benefit liability (asset) reflecting the benefits offeredunder the plan and the plan assets after that event; and the discount rate used to remeasurethat net defined benefit liability (asset).
The amendments also clarify that an entity first determines any past service cost, or a gain or losson settlement, without considering the effect of the asset ceiling. This amount is recognized inprofit or loss. An entity then determines the effect of the asset ceiling after the plan amendment,curtailment or settlement. Any change in that effect, excluding amounts included in the netinterest, is recognized in other comprehensive income.
The amendments apply to plan amendments, curtailments, or settlements occurring on or afterthe beginning of the first annual reporting period that begins on or after January 1, 2019, withearly application permitted. These amendments will apply only to any future plan amendments,curtailments, or settlements of the Parent Company.
∂ Amendments to PAS 28, Long-term Interests in Associates and Joint VenturesThe amendments clarify that an entity applies PFRS 9 to long-term interests in an associate orjoint venture to which the equity method is not applied but that, in substance, form part of the netinvestment in the associate or joint venture (long-term interests). This clarification is relevantbecause it implies that the expected credit loss model in PFRS 9 applies to such long-terminterests.
The amendments also clarified that, in applying PFRS 9, an entity does not take account of anylosses of the associate or joint venture, or any impairment losses on the net investment,recognized as adjustments to the net investment in the associate or joint venture that arise fromapplying PAS 28, Investments in Associates and Joint Ventures.
The amendments should be applied retrospectively and are effective from January 1, 2019, withearly application permitted. The Parent Company is currently assessing the impact of adoptingthis interpretation.
∂ Philippine Interpretation IFRIC-23, Uncertainty over Income Tax TreatmentsThe interpretation addresses the accounting for income taxes when tax treatments involveuncertainty that affects the application of PAS 12 and does not apply to taxes or levies outsidethe scope of PAS 12, nor does it specifically include requirements relating to interest andpenalties associated with uncertain tax treatments.
The interpretation specifically addresses the following:• Whether an entity considers uncertain tax treatments separately• The assumptions an entity makes about the examination of tax treatments by taxation
authorities• How an entity determines taxable profit (tax loss), tax bases, unused tax losses, unused tax
credits and tax rates• How an entity considers changes in facts and circumstances
An entity must determine whether to consider each uncertain tax treatment separately or togetherwith one or more other uncertain tax treatments. The approach that better predicts the resolutionof the uncertainty should be followed.
This interpretation is not relevant to the Parent Company because there is no uncertaintyinvolved in the tax treatments made by management in connection with the calculation of currentand deferred taxes as of December 31, 2018 and 2017.

- 11 -
*SGVFS033960*
∂ Annual Improvements to PFRSs 2015-2017 Cycle• Amendments to PFRS 3, Business Combinations, and PFRS 11, Joint Arrangements,
Previously Held Interest in a Joint OperationThe amendments clarify that, when an entity obtains control of a business that is a jointoperation, it applies the requirements for a business combination achieved in stages, includingremeasuring previously held interests in the assets and liabilities of the joint operation at fairvalue. In doing so, the acquirer remeasures its entire previously held interest in the jointoperation.
A party that participates in, but does not have joint control of, a joint operation might obtainjoint control of the joint operation in which the activity of the joint operation constitutes abusiness as defined in PFRS 3. The amendments clarify that the previously held interests inthat joint operation are not remeasured.
An entity applies those amendments to business combinations for which the acquisition dateis on or after the beginning of the first annual reporting period beginning on or afterJanuary 1, 2019 and to transactions in which it obtains joint control on or after the beginning ofthe first annual reporting period beginning on or after January 1, 2019, with early applicationpermitted. These amendments are currently not applicable to the Parent Company but mayapply to future transactions.
• Amendments to PAS 12, Income Tax Consequences of Payments on Financial InstrumentsClassified as EquityThe amendments clarify that the income tax consequences of dividends are linked moredirectly to past transactions or events that generated distributable profits than to distributionsto owners. Therefore, an entity recognizes the income tax consequences of dividends in profitor loss, other comprehensive income or equity according to where the entity originallyrecognized those past transactions or events.
An entity applies those amendments for annual reporting periods beginning on or afterJanuary 1, 2019, with early application is permitted. These amendments are not relevant tothe Parent Company because dividends declared by the Parent Company do not give rise totax obligations under the current tax laws.
• Amendments to PAS 23, Borrowing Costs, Borrowing Costs Eligible for CapitalizationThe amendments clarify that an entity treats as part of general borrowings any borrowingoriginally made to develop a qualifying asset when substantially all of the activities necessaryto prepare that asset for its intended use or sale are complete.
An entity applies those amendments to borrowing costs incurred on or after the beginning ofthe annual reporting period in which the entity first applies those amendments. An entityapplies those amendments for annual reporting periods beginning on or after January 1, 2019,with early application permitted.
Effective beginning on or after January 1, 2020
∂ Amendments to PFRS 3, Definition of a Business
The amendments to PFRS 3 clarify the minimum requirements to be a business, remove theassessment of a market participant’s ability to replace missing elements, and narrow thedefinition of outputs. The amendments also add guidance to assess whether an acquiredprocess is substantive and add illustrative examples. An optional fair value concentration test isintroduced which permits a simplified assessment of whether an acquired set of activities andassets is not a business.

- 12 -
*SGVFS033960*
An entity applies those amendments prospectively for annual reporting periods beginning on orafter January 1, 2020, with earlier application permitted.
These amendments will apply on future business combinations of the Parent Company.
∂ Amendments to PAS 1, Presentation of Financial Statements, and PAS 8, Accounting Policies,Changes in Accounting Estimates and Errors, Definition of Material
The amendments refine the definition of material in PAS 1 and align the definitions used acrossPFRSs and other pronouncements. They are intended to improve the understanding of theexisting requirements rather than to significantly impact an entity’s materiality judgements.
An entity applies those amendments prospectively for annual reporting periods beginning on orafter January 1, 2020, with earlier application permitted.
Effective beginning on or after January 1, 2021
∂ PFRS 17, Insurance ContractsPFRS 17 is a comprehensive new accounting standard for insurance contracts coveringrecognition and measurement, presentation and disclosure. Once effective, PFRS 17 will replacePFRS 4, Insurance Contracts. This new standard on insurance contracts applies to all types ofinsurance contracts (i.e., life, non-life, direct insurance and re-insurance), regardless of the typeof entities that issue them, as well as to certain guarantees and financial instruments withdiscretionary participation features. A few scope exceptions will apply.
The overall objective of PFRS 17 is to provide an accounting model for insurance contracts that ismore useful and consistent for insurers. In contrast to the requirements in PFRS 4, which arelargely based on grandfathering previous local accounting policies, PFRS 17 provides acomprehensive model for insurance contracts, covering all relevant accounting aspects. Thecore of PFRS 17 is the general model, supplemented by:• A specific adaptation for contracts with direct participation features (the variable fee
approach)• A simplified approach (the premium allocation approach) mainly for short-duration contracts
PFRS 17 is effective for reporting periods beginning on or after January 1, 2021, withcomparative figures required. Early application is permitted.
The new standard is not applicable to the Parent Company since there are no activities within theParent Company that are predominantly connected with insurance or issue insurance contracts.
Deferred Effectivity
∂ Amendments to PFRS 10, Consolidated Financial Statements, and PAS 28, Sale or Contributionof Assets between an Investor and its Associate or Joint VentureThe amendments address the conflict between PFRS 10 and PAS 28 in dealing with the loss ofcontrol of a subsidiary that is sold or contributed to an associate or joint venture. Theamendments clarify that a full gain or loss is recognized when a transfer to an associate or jointventure involves a business as defined in PFRS 3. Any gain or loss resulting from the sale orcontribution of assets that does not constitute a business, however, is recognized only to theextent of unrelated investors’ interests in the associate or joint venture.
On January 13, 2016, the Financial Reporting Standards Council deferred the original effectivedate of January 1, 2016 of the said amendments until the International Accounting StandardsBoard (IASB) completes its broader review of the research project on equity accounting that mayresult in the simplification of accounting for such transactions and of other aspects of accountingfor associates and joint ventures.

- 13 -
*SGVFS033960*
Current and Noncurrent ClassificationThe Parent Company presents assets and liabilities in parent company statement of financial positionbased on current/noncurrent classification. An asset is current when it is:
∂ Expected to be realized or intended to be sold or consumed in normal operating cycle;∂ Held primarily for the purpose of trading;∂ Expected to be realized within 12 months after reporting date; or∂ Cash or cash equivalent unless restricted from being exchanged or used to settle a liability for at
least 12 months after reporting date.
All other assets are classified as noncurrent.
A liability is current when:
∂ It is expected to be settled in the normal operating cycle;∂ It is held primarily for the purpose of trading;∂ It is due to be settled within 12 months after reporting date; or∂ There is no unconditional right to defer the settlement of the liability for at least 12 months after
reporting date.
The Parent Company classifies all other liabilities as noncurrent.
Deferred tax assets and liabilities are classified as noncurrent assets and liabilities, respectively.
Fair Value MeasurementFair value is the price that would be received to sell an asset or paid to transfer a liability in an orderlytransaction between market participants at the measurement date. The fair value measurement isbased on the presumption that the transaction to sell the asset or transfer the liability takes placeeither:∂ In the principal market for the asset or liability, or∂ In the absence of a principal market, in the most advantageous market for the asset or liability
The principal or the most advantageous market must be accessible to the Parent Company.
The fair value of an asset or a liability is measured using the assumptions that market participantswould use when pricing the asset or liability, assuming that market participants act in their economicbest interest.
A fair value measurement of a non-financial asset takes into account a market participant's ability togenerate economic benefits by using the asset in its highest and best use or by selling it to anothermarket participant that would use the asset in its highest and best use.
The Parent Company uses valuation techniques that are appropriate in the circumstances and forwhich sufficient data are available to measure fair value, maximizing the use of relevant observableinputs and minimizing the use of unobservable inputs.
All assets for which fair value is measured or disclosed in the financial statements are categorizedwithin the fair value hierarchy, described as follows, based on the lowest level input that is significantto the fair value measurement as a whole:∂ Level 1 - Quoted (unadjusted) market prices in active markets for identical assets or liabilities∂ Level 2 - Valuation techniques for which the lowest level input that is significant to the fair value
measurement is directly or indirectly observable∂ Level 3 - Valuation techniques for which the lowest level input that is significant to the fair value
measurement is unobservable.

- 14 -
*SGVFS033960*
For assets and liabilities that are recognized in the financial statements on a recurring basis, theParent Company determines whether transfers have occurred between Levels in the hierarchy by re-assessing categorization (based on the lowest level input that is significant to the fair valuemeasurement as a whole) at the end of each reporting period.
External valuers are involved for valuation of significant assets, such as investment properties.Involvement of external valuers is decided upon annually by corporate finance after discussion withand approval by the Parent Company’s audit committee. Selection criteria include market knowledge,reputation, independence and whether professional standards are maintained.
At each reporting date, corporate finance analyses the movements in the values of assets which arerequired to be re-measured or re-assessed as per the Parent Company’s accounting policies.
The Parent Company, in conjunction with the external valuers, also compares each of the changes inthe fair value of each asset with relevant external sources to determine whether the change isreasonable.
For the purpose of fair value disclosures, the Parent Company has determined classes of assets onthe basis of the nature, characteristics and risks of the asset and the level of the fair value hierarchyas explained above.
Cash and Cash EquivalentsCash includes cash on hand and in banks. Cash equivalents are short-term, highly liquid investmentsthat are readily convertible to known amounts of cash with original maturities of three (3) months orless from dates of placement and that are subject to an insignificant risk of changes in value.
Financial Instruments – initial recognition and subsequent measurement effective January 1, 2018
Financial InstrumentsDate of recognitionThe Parent Company recognizes a financial asset or a financial liability in the parent companystatement of financial position when it becomes a party to the contractual provisions of theinstrument. Purchases or sales of financial assets that require delivery of assets within the timeframe established by regulation or convention in the marketplace are recognized on the settlementdate.
a. Financial assetsInitial recognition of financial instrumentsFinancial assets are classified, at initial recognition, as subsequently measured at amortized cost, fairvalue through other comprehensive income (OCI), and fair value through profit or loss.
The classification of financial assets at initial recognition depends on the financial asset’s contractualcash flow characteristics and the Parent Company’s business model for managing them. The ParentCompany initially measures a financial asset at its fair value plus, in the case of a financial asset notat fair value through profit or loss, transaction costs. Trade receivables, except for sales contractreceivables, are measured at the transaction price determined under PFRS 15. Refer to theaccounting policies on Revenue from contracts with customers.
In order for a financial asset to be classified and measured at amortized cost or fair value throughOCI, it needs to give rise to cash flows that are ‘solely payments of principal and interest (SPPI)’ onthe principal amount outstanding. This assessment is referred to as the SPPI test and is performedat an instrument level.
The Parent Company’s business model for managing financial assets refers to how it manages itsfinancial assets in order to generate cash flows. The business model determines whether cash flowswill result from collecting contractual cash flows, selling the financial assets, or both.

- 15 -
*SGVFS033960*
Purchases or sales of financial assets that require delivery of assets within a time frame establishedby regulation or convention in the market place (regular way trades) are recognised on the trade date,i.e., the date that the Parent Company commits to purchase or sell the asset.
Subsequent measurementFor purposes of subsequent measurement, financial assets are classified in four categories:∂ Financial assets at amortized cost (debt instruments)∂ Financial assets at fair value through OCI with recycling of cumulative gains and losses (debt
instruments)∂ Financial assets designated at fair value through OCI with no recycling of cumulative gains and
losses upon derecognition (equity instruments)∂ Financial assets at fair value through profit or loss
Financial assets at amortized costThis category is the most relevant to the Parent Company. The Parent Company measures financialassets at amortised cost if both of the following conditions are met:∂ The financial asset is held within a business model with the objective to hold financial assets in
order to collect contractual cash flows; and∂ The contractual terms of the financial asset give rise on specified dates to cash flows that are
solely payments of principal and interest on the principal amount outstanding.
Financial assets at amortized cost are subsequently measured using the effective interest (EIR)method and are subject to impairment. Gains and losses are recognized in profit or loss when theasset is derecognized, modified or impaired.
The Parent Company’s financial assets at amortized cost includes “Cash and cash equivalents” and“Accounts and notes receivables”.
Financial assets at fair value through OCI (debt instruments)The Parent Company measures debt instruments at fair value through OCI if both of the followingconditions are met:∂ The financial asset is held within a business model with the objective of both holding to collect
contractual cash flows and selling; and∂ The contractual terms of the financial asset give rise on specified dates to cash flows that are solely
payments of principal and interest on the principal amount outstanding.
For debt instruments at fair value through OCI, interest income, foreign exchange revaluation andimpairment losses or reversals are recognized in the consolidated statement of income and computedin the same manner as for financial assets measured at amortized cost. The remaining fair valuechanges are recognized in OCI. Upon derecognition, the cumulative fair value change recognized inOCI is recycled to profit or loss.
The Parent Company does not have debt instruments at fair value through OCI.
Financial assets designated at fair value through OCI (equity instruments)Upon initial recognition, the Parent Company can elect to classify irrevocably its equity investmentsas equity instruments designated at fair value through OCI when they meet the definition of equityunder PAS 32, Financial Instruments: Presentation and are not held for trading. The classification isdetermined on an instrument-by-instrument basis.
Gains and losses on these financial assets are never recycled to profit or loss. Dividends arerecognized as other income in the parent company statement of income when the right of paymenthas been established, except when the Parent Company benefits from such proceeds as a recoveryof part of the cost of the financial asset, in which case, such gains are recorded in OCI. Equityinstruments designated at fair value through OCI are not subject to impairment assessment.

- 16 -
*SGVFS033960*
The Parent Company’s financial assets at fair value through OCI includes investments in quoted andunquoted equity instruments.
Financial assets at fair value through profit or lossFinancial assets at fair value through profit or loss include financial assets held for trading, financialassets designated upon initial recognition at fair value through profit or loss, or financial assetsmandatorily required to be measured at fair value. Financial assets are classified as held for trading ifthey are acquired for the purpose of selling or repurchasing in the near term. Derivatives, includingseparated embedded derivatives, are also classified as held for trading unless they are designated aseffective hedging instruments. Financial assets with cash flows that are not solely payments ofprincipal and interest are classified and measured at fair value through profit or loss, irrespective ofthe business model. Notwithstanding the criteria for debt instruments to be classified at amortisedcost or at fair value through OCI, as described above, debt instruments may be designated at fairvalue through profit or loss on initial recognition if doing so eliminates, or significantly reduces, anaccounting mismatch.
Financial assets at fair value through profit or loss are carried in the parent company statement offinancial position at fair value with net changes in fair value recognized in the parent companystatement of profit or loss.
This category includes investment in Unit Investment Trust Fund (UITF) as held for trading andclassified this as financial assets at FVPL.
DerecognitionA financial asset (or, where applicable, a part of a financial asset or part of a group of similar financialassets) is primarily derecognized (i.e., removed from the Parent Company’s statement of financialposition) when:∂ The rights to receive cash flows from the asset have expired
Or∂ The Parent Company has transferred its rights to receive cash flows from the asset or has
assumed an obligation to pay the received cash flows in full without material delay to a third partyunder a ‘pass-through’ arrangement; and either (a) the Parent Company has transferredsubstantially all the risks and rewards of the asset, or (b) the Parent Company has neithertransferred nor retained substantially all the risks and rewards of the asset, but has transferredcontrol of the asset
When the Parent Company has transferred its rights to receive cash flows from an asset or hasentered into a pass-through arrangement, it evaluates if, and to what extent, it has retained the risksand rewards of ownership. When it has neither transferred nor retained substantially all of the risksand rewards of the asset, nor transferred control of the asset, the Parent Company continues torecognize the transferred asset to the extent of its continuing involvement. In that case, the ParentCompany also recognizes an associated liability. The transferred asset and the associated liabilityare measured on a basis that reflects the rights and obligations that the Parent Company hasretained.
Continuing involvement that takes the form of a guarantee over the transferred asset is measured atthe lower of the original carrying amount of the asset and the maximum amount of consideration thatthe Parent Company could be required to repay.
Impairment of Financial AssetsThe Parent Company recognizes an allowance for expected credit losses (ECLs) for all debtinstruments not held at fair value through profit or loss. ECLs are based on the difference betweenthe contractual cash flows due in accordance with the contract and all the cash flows that the ParentCompany expects to receive, discounted at an approximation of the original effective interest rate.The expected cash flows will include cash flows from the sale of collateral held or other creditenhancements that are integral to the contractual terms.

- 17 -
*SGVFS033960*
For trade receivables and contract assets, the Parent Company applies a simplified approach incalculating ECLs. Therefore, the Parent Company does not track changes in credit risk, but insteadrecognizes a loss allowance based on lifetime ECLs at each reporting date. The Parent Company hasestablished a provision matrix for trade receivables and a vintage analysis for sales contractreceivables and contract assets that is based on historical credit loss experience, adjusted forforward-looking factors specific to the debtors and the economic environment.
For other financial assets such accrued receivable, receivable from related parties and advances toother companies, ECLs are recognized in two stages. For credit exposures for which there has notbeen a significant increase in credit risk since initial recognition, ECLs are provided for credit lossesthat result from default events that are possible within the next 12-months (a 12-month ECL). Forthose credit exposures for which there has been a significant increase in credit risk since initialrecognition, a loss allowance is required for credit losses expected over the remaining life of theexposure, irrespective of the timing of the default (a lifetime ECL).
For cash and cash equivalents, the Parent Company applies the low credit risk simplification. Theprobability of default and loss given defaults are publicly available and are considered to be low creditrisk investments. It is the Parent Company’s policy to measure ECLs on such instruments on a 12-month basis. However, when there has been a significant increase in credit risk since origination, theallowance will be based on the lifetime ECL. The Parent Company uses the ratings from Standardand Poor’s (S&P), Moody’s and Fitch to determine whether the debt instrument has significantlyincreased in credit risk and to estimate ECLs.
The Parent Company considers a debt investment security to have low credit risk when its credit riskrating is equivalent to the globally understood definition of ‘investment grade’.
The key inputs in the model include the Parent Company’s definition of default and historical data ofthree years for the origination, maturity date and default date. The Parent Company considers tradereceivables and contract assets in default when contractual payment are 90 days past due. However,in certain cases, the Parent Company may also consider a financial asset to be in default wheninternal or external information indicates that the Parent Company is unlikely to receive theoutstanding contractual amounts in full before taking into account any credit enhancements held bythe Parent Company.
Determining the stage for impairmentAt each reporting date, the Parent Company assesses whether there has been a significant increasein credit risk for financial assets since initial recognition by comparing the risk of default occurringover the expected life between the reporting date and the date of initial recognition. The ParentCompany considers reasonable and supportable information that is relevant and available withoutundue cost or effort for this purpose. This includes quantitative and qualitative information andforward-looking analysis.
The Parent Company considers that there has been a significant increase in credit risk whencontractual payments are more than 90 days past due.
An exposure will migrate through the ECL stages as asset quality deteriorates. If, in a subsequentperiod, asset quality improves and also reverses any previously assessed significant increase incredit risk since origination, then the loss allowance measurement reverts from lifetime ECL to 12-months ECL.
b. Financial liabilitiesInitial recognition and measurementFinancial liabilities are classified, at initial recognition, as financial liabilities at fair value through profitor loss, loans and borrowings, payables, or as derivatives designated as hedging instruments in aneffective hedge, as appropriate.

- 18 -
*SGVFS033960*
All financial liabilities are recognized initially at fair value and, in the case of loans and borrowings andpayables, net of directly attributable transaction costs.
The Parent Company’s financial liabilities include “Accounts and other payables” (other than “Taxespayable and Interest payable” which is covered by other accounting standard), “Short-term and long-term debts”, “Deposits and other noncurrent liabilities” (other than unearned income under“Deposits”).
Subsequent measurementThe measurement of financial liabilities depends on their classification, as described below:
Financial liabilities at fair value through profit or lossFinancial liabilities at fair value through profit or loss include financial liabilities held for trading andfinancial liabilities designated upon initial recognition as at fair value through profit or loss.
Financial liabilities are classified as held for trading if they are incurred for the purpose ofrepurchasing in the near term. This category also includes derivative financial instruments enteredinto by the Parent Company that are not designated as hedging instruments in hedge relationships asdefined by PFRS 9. Separated embedded derivatives are also classified as held for trading unlessthey are designated as effective hedging instruments.
Gains or losses on liabilities held for trading are recognized in the parent company statement ofincome.
Financial liabilities designated upon initial recognition at fair value through profit or loss aredesignated at the initial date of recognition, and only if the criteria in PFRS 9 are satisfied. The ParentCompany has not designated any financial liability as at fair value through profit or loss.
Loans and borrowingsThis is the category most relevant to the Parent Company. After initial recognition, interest-bearingloans and borrowings are subsequently measured at amortized cost using the EIR method. Gainsand losses are recognized in profit or loss when the liabilities are derecognized as well as through theEIR amortization process.
Amortized cost is calculated by taking into account any discount or premium on acquisition and feesor costs that are an integral part of the EIR. The EIR amortization is included as finance costs in thestatement of profit or loss.
This category generally applies to “Short-term debt” and “Long-term debt”.
DerecognitionA financial liability is derecognized when the obligation under the liability is discharged or cancelled orexpires. When an existing financial liability is replaced by another from the same lender onsubstantially different terms, or the terms of an existing liability are substantially modified, such anexchange or modification is treated as the derecognition of the original liability and the recognition ofa new liability. The difference in the respective carrying amounts is recognized in the parent companystatement of income.
c. Offsetting Financial InstrumentsFinancial assets and financial liabilities are offset and the net amount reported in the parent companystatement of financial position, if, and only if, there is a currently enforceable legal right to offset therecognized amounts and there is an intention to settle on a net basis, or to realize the asset and settlethe liability simultaneously.

- 19 -
*SGVFS033960*
Financial Instruments – initial recognition and subsequent measurement prior to January 1, 2018
Financial InstrumentsDate of recognitionThe Parent Company recognizes a financial asset or a financial liability in the parent companystatement of financial position when it becomes a party to the contractual provisions of theinstrument. Purchases or sales of financial assets that require delivery of assets within the timeframe established by regulation or convention in the marketplace are recognized on the settlementdate.
Initial recognition of financial instrumentsAll financial assets and financial liabilities are initially recognized at fair value. Except for financialassets and financial liabilities at FVPL, the initial measurement of financial instruments includestransaction costs. The Parent Company classifies its financial assets in the following categories:financial assets at FVPL, held-to-maturity (HTM) investments, AFS financial assets and loans andreceivables. The Parent Company classifies its financial liabilities into financial liabilities at FVPL andother financial liabilities. The classification depends on the purpose for which the investments wereacquired or liabilities incurred and whether they are quoted in an active market. Managementdetermines the classification of its investments at initial recognition and, where allowed andappropriate, re-evaluates such designation at every reporting date.
“Day 1” differenceWhere the transaction price in a non-active market is different from the fair value from otherobservable current market transactions in the same instrument or based on a valuation techniquewhose variables include only data from observable market, the Parent Company recognizes thedifference between the transaction price and fair value (a “Day 1” difference) in the parent companystatement of income under “Interest and investment income” and “Interest and other financingcharges” accounts unless it qualifies for recognition as some other type of asset or liability. In caseswhere fair value is determined using data which is not observable, the difference between thetransaction price and model value is only recognized in the parent company statement of incomewhen the inputs become observable or when the instrument is derecognized. For each transaction,the Parent Company determines the appropriate method of recognizing the ‘Day 1’ differenceamount.
Financial assets and financial liabilities at FVPLFinancial assets and financial liabilities at FVPL include financial assets and financial liabilities heldfor trading and financial assets and financial liabilities designated upon initial recognition as at FVPL.
Financial assets and financial liabilities are classified as held for trading if they are acquired for thepurpose of selling and repurchasing in the near term. Derivatives, including separated embeddedderivatives are also classified as held for trading unless they are designated as effective hedginginstruments or a financial guarantee contract. Fair value gains or losses on investments held fortrading, net of interest income accrued on these assets, are recognized in the parent companystatement of income under “Other income” or “Other charges”.
Financial assets may be designated at initial recognition as FVPL if any of the following criteria aremet:∂ The designation eliminates or significantly reduces the inconsistent treatment that would
otherwise arise from measuring the assets or liabilities or recognizing gains or losses on them ona different basis; or
∂ The assets are part of a group of financial assets which are managed and their performanceevaluated on a fair value basis, in accordance with a documented risk management orinvestment strategy; or
∂ The financial instrument contains an embedded derivative that would need to be separatelyrecorded.

- 20 -
*SGVFS033960*
As of December 31, 2017, the Parent Company holds its investment in Unit Investment Trust Fund(UITF) as held for trading and classified this as financial assets at FVPL. Management takes the viewthat these are held for trading and such portfolios are managed by professional managers.
HTM investmentsHTM investments are quoted nonderivative financial assets with fixed or determinable payments andfixed maturities for which management has the positive intention and ability to hold to maturity.Where the Parent Company sells other than an insignificant amount of HTM investments, the entirecategory would be tainted and reclassified as AFS financial assets. After initial measurement, theseinvestments are measured at amortized cost using the effective interest method, less impairment invalue. Amortized cost is calculated by taking into account any discount or premium on acquisitionand fees that are integral parts of the effective interest rate.
The amortization is included in “Interest and investment income” in the parent company statement ofincome. Gains and losses are recognized in the parent company statement of income under “Otherincome” or “Other charges” when the HTM investments are derecognized and impaired, as well asthrough the amortization process.
As of December 31, 2017, the Parent Company has no HTM investments.
Loans and receivablesLoans and receivables are financial assets with fixed or determinable payments and fixed maturitiesthat are not quoted in an active market. They are not entered into with the intention of immediate orshort-term resale and are not designated as AFS financial assets or financial assets at FVPL. Thisaccounting policy relates to the parent company statement of financial position caption “Accounts andnotes receivable”.
After initial measurement, loans and receivables are subsequently measured at amortized cost usingthe effective interest method, less allowance for impairment. Amortized cost is calculated by takinginto account any discount or premium on acquisition and fees that are integral parts of the effectiveinterest rate. The amortization is included in the “Interest income from real estate sales” in the parentcompany statement of income. The losses arising from impairment of such loans and receivables arerecognized in the parent company statement of income under the “Other expenses” account.Loans and receivables are included in current assets if maturity is within 12 months from the reportingdate, otherwise these are classified as noncurrent assets.
AFS financial assetsAFS financial assets are those which are designated as such or do not qualify to be classified ordesignated as at FVPL, HTM, or loans and receivables.
Financial assets may be designated at initial recognition as AFS if they are purchased and heldindefinitely, and may be sold in response to liquidity requirements or changes in market conditions.
After initial measurement, AFS financial assets are measured at fair value. The unrealized gains andlosses arising from the fair valuation of AFS financial assets are excluded from reported earnings andare reported as “Net unrealized gain on available-for-sale financial assets” in the equity section of theparent company statement of financial position.
When the security is disposed of, the cumulative gain or loss previously recognized in equity isrecognized in the parent company statement of income under “Other income” account or “Othercharges” account. Where the Parent Company holds more than one investment in the same security,these are deemed to be disposed on a weighted average basis. The losses arising from impairmentof such investments are recognized in the parent company statement of income under the “Othercharges” account.

- 21 -
*SGVFS033960*
When the fair value of the AFS financial assets cannot be measured reliably because of lack ofreliable estimation of future cash flows and discount rates necessary to calculate the fair value ofcomputed equity instruments, these investments are carried at cost less allowance for impairmentlosses. AFS financial assets are classified as noncurrent assets unless the intention is to disposesuch assets within 12 months from reporting date.
Other financial liabilitiesIssued financial instruments or their components, which are not designated as at FVPL are classifiedas other financial liabilities where the substance of the contractual arrangement results in the ParentCompany having an obligation either to deliver cash or another financial asset to the holder, or tosatisfy the obligation other than by the exchange of a fixed amount of cash or another financial assetfor a fixed number of own equity shares. The components of issued financial instruments that containboth liability and equity elements are accounted for separately, with the equity component beingassigned the residual amount after deducting from the instrument as a whole the amount separatelydetermined as the fair value of the liability component on the date of issue.
After initial measurement, other financial liabilities are subsequently measured at amortized costusing the effective interest method. Amortized cost is calculated by taking into account any discountor premium on the issue and fees that are integral parts of the effective interest rate. Any effects ofrestatement of foreign currency-denominated liabilities are recognized in the parent companystatement of income.
This accounting policy applies primarily to the Parent Company’s “Accounts and other payables”(other than “Taxes payable” which is covered by other accounting standard), “Short-term and long-term debts,” and other obligations that meet the above definition.
Derecognition of Financial Assets and LiabilitiesFinancial assetA financial asset (or, where applicable a part of a financial asset or part of a group of financial assets)is derecognized when:a. the rights to receive cash flows from the asset have expired;b. the Parent Company retains the right to receive cash flows from the asset, but has assumed an
obligation to pay them in full without material delay to a third party under a ‘pass-through’arrangement; or
c. the Parent Company has transferred its right to receive cash flows from the asset and either: (a)has transferred substantially all the risks and rewards of the asset, or (b) has neither transferrednor retained the risks and rewards of the asset but has transferred the control of the asset.
Where the Parent Company has transferred its rights to receive cash flows from an asset or hasentered into a ‘pass-through’ arrangement, and has neither transferred nor retained substantially allthe risks and rewards of the asset nor has transferred control of the asset, the asset is recognized tothe extent of the Parent Company’s continuing involvement in the asset. Continuing involvement thattakes the form of a guarantee over the transferred asset is measured at the lower of original carryingamount of the asset and the maximum amount of consideration that the Parent Company could berequired to repay.
Financial liabilityA financial liability is derecognized when the obligation under the liability has expired, or is dischargedor is cancelled. Where an existing financial liability is replaced by another from the same lender onsubstantially different terms, or the terms of an existing liability are substantially modified, such anexchange or modification is treated as a derecognition of the original liability and the recognition of anew liability, and the difference in the respective carrying amounts is recognized in the consolidatedstatement of income.

- 22 -
*SGVFS033960*
Impairment of Financial AssetsThe Parent Company assesses at each reporting date whether there is objective evidence that afinancial asset or group of financial assets is impaired. A financial asset or a group of financial assetsis deemed to be impaired if, and only if, there is objective evidence of impairment as a result of one ormore events that has occurred after the initial recognition of the asset (an incurred ‘loss event’) andthat loss event (or events) has an impact on the estimated future cash flows of the financial asset orthe group of financial assets that can be reliably estimated.
Evidence of impairment may include indications that the borrower or a group of borrowers isexperiencing significant financial difficulty, default or delinquency in interest or principal payments, theprobability that they will enter bankruptcy or other financial reorganization and where observable dataindicate that there is measurable decrease in the estimated future cash flows, such as changes inarrears or economic conditions that correlate with defaults.
Loans and receivablesFor loans and receivables carried at amortized cost, the Parent Company first assesses whetherobjective evidence of impairment exists individually for financial assets that are individually significant,or collectively for financial assets that are not individually significant. If the Parent Companydetermines that no objective evidence of impairment exists for individually assessed financial asset,whether significant or not, it includes the asset in a group of financial assets with similar credit riskcharacteristics and collectively assesses for impairment. Those characteristics are relevant to theestimation of future cash flows for groups of such assets by being indicative of the debtors’ ability topay all amounts due according to the contractual terms of the assets being evaluated. Assets thatare individually assessed for impairment and for which an impairment loss is, or continues to berecognized, are not included in a collective assessment for impairment.
If there is objective evidence that an impairment loss has been incurred, the amount of loss ismeasured as the difference between the asset’s carrying amount and the present value of theestimated future cash flows (excluding future credit losses that have not been incurred). The carryingamount of the asset is reduced through the use of an allowance account and the amount of loss ischarged to the parent company statement of income under “Other charges” account.
Interest income continues to be recognized based on the original effective interest rate of the asset.Receivable, together with the associated allowance accounts, are written off when there is no realisticprospect of future recovery and all collateral has been realized. If, in a subsequent year, the amountof the estimated impairment loss decreases because of an event occurring after the impairment wasrecognized, the previously recognized impairment loss is reversed. Any subsequent reversal of animpairment loss is recognized in the parent company statement of income, to the extent that thecarrying value of the asset does not exceed its amortized cost at the reversal date.
For the purpose of a collective evaluation of impairment, financial assets are grouped on the basis ofsuch credit risk characteristics such as customer type, payment history, past-due status and term.
Future cash flows in a group of financial assets that are collectively evaluated for impairment areestimated on the basis of historical loss experience for assets with credit risk characteristics similar tothose in the group. Historical loss experience is adjusted on the basis of current observable data toreflect the effects of current conditions that did not affect the period on which the historical lossexperience is based and to remove the effects of conditions in the historical period that do not existcurrently. The methodology and assumptions used for estimating future cash flows are reviewedregularly by the Parent Company to reduce any difference between loss estimates and actual lossexperience.

- 23 -
*SGVFS033960*
Financial asset carried at costIf there is objective evidence that an impairment loss on an unquoted equity instrument that is notcarried at fair value because its fair value cannot be reliably measured, or on a derivative asset that islinked to and must be settled by delivery of such an unquoted equity instrument has been incurred,the amount of the loss is measured as the difference between the asset’s carrying amount and thepresent value of estimated future cash flows discounted at the current market rate of return for asimilar financial asset.
AFS financial assetsFor AFS financial assets, the Parent Company assesses at each reporting date whether there isobjective evidence that a financial asset or group of financial assets is impaired.
In the case of equity investments classified as AFS financial assets, this would include a significant orprolonged decline in the fair value of the investments below its cost or where other objective evidenceof impairment exists. The determination of what is ‘significant’ or ‘prolonged’ requires judgment. TheParent Company treats ‘significant’ generally as 20% or more and ‘prolonged’ as greater than six (6)months for quoted equity securities. The Parent Company evaluates other factors, including normalvolatility in share price for quoted equities and the future cash flows and the discount factors forunquoted equities (see Note 9). Where there is evidence of impairment, the cumulative loss -measured as the difference between the acquisition cost and the current fair value, less anyimpairment loss on that financial asset previously recognized in the parent company statement ofincome - is removed from equity and recognized in the parent company statement of income in the“Other charges” account. Impairment losses on equity investments are not reversed through theparent company statement of income. Increases in fair value after impairment are recognized directlyin equity through the parent company statement of comprehensive income.
In the case of debt instruments classified as AFS financial assets, impairment is assessed based onthe same criteria as financial assets carried at amortized cost. Future interest income is based on thereduced carrying amount and is accrued using the rate of interest used to discount future cash flowsfor the purpose of measuring impairment loss and is recorded as part of “Interest and investmentincome” account in the parent company statement of income. If, in subsequent year, the fair value ofa debt instrument increases and the increase can be objectively related to an event occurring afterthe impairment loss was recognized in the parent company statement of income, the impairment lossis reversed through the parent company statement of income.
Offsetting Financial InstrumentsFinancial assets and financial liabilities are offset and the net amount reported in the parent companystatement of financial position, if, and only if, there is a currently enforceable legal right to offset therecognized amounts and there is an intention to settle on a net basis, or to realize the asset and settlethe liability simultaneously.
Deposits and Retentions PayableDeposits and retentions payable are measured initially at fair value. After initial recognition, depositsand retentions payable are subsequently measured at amortized cost using the effective interestmethod.
For deposits, the difference between the cash received and its fair value is deferred and amortizedusing the straight-line method under the “Real estate revenue” account in the parent companystatement of income.
InventoriesProperty acquired or being constructed for sale in the ordinary course of business, rather than to beheld for rental or capital appreciation, is held as inventory and is measured at the lower of cost or netrealizable value (NRV).

- 24 -
*SGVFS033960*
Cost includes:∂ Land cost∂ Land improvement cost∂ Amounts paid to contractors for construction and development∂ Planning and design costs, costs of site preparation, professional fees, property transfer taxes,
construction overheads and other related costs
NRV is the estimated selling price in the ordinary course of the business, based on market pricesat the reporting date, less estimated costs of completion and the estimated costs of sale.
Prepaid ExpensesPrepaid expenses are carried at cost less the amortized portion. These typically comprise marketingfees, advertising and promotions, taxes and licenses, rentals and insurance.
Input Value-Added Tax (VAT)Input VAT arises from the purchase of goods and services. These are applied against output VAT.The remaining balance is recoverable in future periods. These are carried at cost less allowance forimpairment loss, if any. Impairment loss is recognized when input VAT can no longer be recovered.
Deposits in EscrowDeposits in escrow pertain to the proceeds from the sale of the Parent Company’s projects that haveonly been granted temporary License to Sell (LTS) as of reporting date. These proceeds aredeposited in a local bank and earn interest at prevailing bank deposit rates.
Materials, Parts and SuppliesMaterials, parts and supplies are valued at the lower of cost or NRV. Cost is determined using themoving average method. NRV is the estimated selling price in the ordinary course of business, lessestimated costs of completion and estimated costs necessary to make the sale.
An allowance for inventory losses is provided for slow-moving, obsolete and defective materials, partsand supplies based on management’s physical inspection and evaluation. When inventories are sold,the cost and related allowance is removed from the account and the difference is charged againstoperations.
Advances to Other Companies, Advances to Contractors and Suppliers and Deposits on LandPurchasesAdvances to other companies, advances to contractors and suppliers and deposits on land purchasesare carried at cost less impairment losses, if any.
Investments in Subsidiaries, Associates and Joint VenturesThe Parent Company’s investments in its subsidiaries, associates and joint ventures are accountedfor under the cost method and are carried at cost less accumulated provisions for impairment losses,if any. A subsidiary is an entity over which the Parent Company has control. The Parent Companycontrols an entity when it is exposed, or has rights to variable returns from its involvement with theentity and has the ability to affect those returns through its power over the entity. An associate is anentity in which the Parent Company has a significant influence and which is neither a subsidiary nor ajoint venture. A joint arrangement is a contractual arrangement whereby two or more partiesundertake an economic activity that is subject to joint control, and a joint venture is a jointarrangement that involves the establishment of a separate entity in which each venturer has aninterest.
The Parent Company recognizes income from the investment only to the extent that the ParentCompany receives distributions from accumulated profits of the investee arising after the date ofacquisition. Distributions received in excess of such profits are regarded as recovery of investmentand are recognized as a reduction of the cost of the investment.

- 25 -
*SGVFS033960*
The Parent Company reduces the carrying value of its investment based on average acquisition costper share (historical cost) when the Parent Company disposes the investment or the investeereacquires its own equity instruments from the Parent Company.
Investment PropertiesInvestment properties comprise completed property and property under construction orre-development that are held to earn rentals or capital appreciation or both and that are not occupiedby the Parent Company. It also includes land intended as investment property or with unintendedfuture use.
The Parent Company uses the cost model in measuring investment properties since this representsthe historical value of the properties subsequent to initial recognition. Investment properties, exceptfor land, are carried at cost less accumulated depreciation and amortization and any impairment inresidual value. Land is carried at cost less any impairment in value.
Expenditures incurred after the investment property has been put in operation, such as repairs andmaintenance costs, are normally charged against income in the period in which the costs areincurred.
Construction-in-progress are carried at cost (including borrowing cost) and transferred to the relatedinvestment property account when the construction and related activities to prepare the property forits intended use are complete, and the property is ready for occupation.
Depreciation of investment properties are computed using the straight-line method over the estimateduseful lives of the assets. The estimated useful lives and the depreciation method are reviewedperiodically to ensure that the period and method of depreciation are consistent with the expectedpattern of economic benefits from items of investment properties.
The estimated useful lives of investment properties, which is comprised of buildings, ranges from 20to 40 years.
Investment properties are derecognized when either they have been disposed of, or when theinvestment property is permanently withdrawn from use and no future economic benefit is expectedfrom its disposal. Any gain or loss on the retirement or disposal of an investment property isrecognized in the parent company statement of income in the year of retirement or disposal.
A transfer is made to investment property when there is a change in use, evidenced by ending ofowner-occupation, commencement of an operating lease to another party or ending of construction ordevelopment. A transfer is made from investment property when and only when there is a change inuse, evidenced by commencement of owner-occupation or commencement of development with aview to sale. A transfer between investment property, owner-occupied property and inventory doesnot change the carrying amount of the property transferred nor does it change the cost of thatproperty for measurement or disclosure purposes.
The Parent Company discloses the fair values of its investment properties in accordance withPAS 40. The Parent Company engaged independent valuation specialist to assess fair value as atDecember 31, 2018 and 2017. The Parent Company’s investment properties consist of land andbuilding pertaining to land properties, retail (malls) and office properties. These were valued byreference to market-based evidence using comparable prices adjusted for specific market factorssuch as nature, location and condition of the property.
Property and EquipmentProperty and equipment, except for land, are carried at cost less accumulated depreciation andamortization and any impairment in value. Land is carried at cost less any impairment in value. Theinitial cost of property and equipment comprises its construction cost or purchase price and anydirectly attributable costs of bringing the asset to its working condition and location for its intendeduse, including borrowing costs.

- 26 -
*SGVFS033960*
Major repairs are capitalized as part of property and equipment only when it is probable that futureeconomic benefits associated with the item will flow to the Parent Company and the cost of the itemscan be measured reliably. All other repairs and maintenance are charged against current operationsas incurred.
Depreciation and amortization of property and equipment commences once the property andequipment are available for use and is computed on a straight-line basis over the estimated usefullives of the property and equipment as follows:
YearsBuildings and improvements 20-40Furniture, fixtures and office equipment 3-10Transportation equipment 3-5
The assets’ residual values, estimated useful lives and depreciation and amortization method arereviewed periodically to ensure that the amounts, periods and method of depreciation andamortization are consistent with the expected pattern of economic benefits from items of property andequipment.
When property and equipment are retired or otherwise disposed of, the cost and the relatedaccumulated depreciation and amortization and accumulated provision for impairment losses, if any,are removed from the accounts and any resulting gain or loss is credited to or charged againstcurrent operations.
Impairment of Nonfinancial AssetsThe Parent Company assesses at each reporting date whether there is an indication that an assetmay be impaired. If any such indication exists, or when annual impairment testing for an asset isrequired, the Parent Company makes an estimate of the asset’s recoverable amount. An asset’srecoverable amount is the higher of an asset’s or cash-generating unit’s fair value less costs ofdisposal and its value in use. It is determined for an individual asset, unless the asset does notgenerate cash inflows that are largely independent of those from other assets or Parent Companys ofassets. Where the carrying amount of an asset exceeds its recoverable amount, the asset isconsidered impaired and is written down to its recoverable amount. In assessing value in use, theestimated future cash flows are discounted to their present value using a pre-tax discount rate thatreflects current market assessments of the time value of money and the risks specific to the asset.Impairment losses of continuing operations are recognized in the parent company statement ofincome in those expense categories consistent with the function of the impaired asset.
An assessment is made at each reporting date as to whether there is any indication that previouslyrecognized impairment losses may no longer exist or may have decreased. If any such indicationexists, the recoverable amount is estimated. A previously recognized impairment loss is reversedonly if there has been a change in the estimates used to determine the asset’s recoverable amountsince the last impairment loss was recognized. If that is the case, the carrying amount of the asset isincreased to its recoverable amount. That increased amount cannot exceed the carrying amount thatwould have been determined, net of depreciation, had no impairment loss been recognized for theasset in prior years. Such reversal is recognized in the parent company statement of income unlessthe asset is carried at revalued amount, in which case, the reversal is treated as a revaluationincrease. After such reversal, the depreciation charge is adjusted in future periods to allocate theasset’s revised carrying amount, less any residual value, on a systematic basis over its remainingestimated useful life.
The following criteria are also applied in assessing impairment of specific assets:
Investments in subsidiaries, associates and joint venturesThe Parent Company determines at each reporting date whether there is any objective evidence thatthe investment in subsidiaries, associates or joint ventures is impaired. If this is the case, the ParentCompany calculates the amount of impairment as being the difference between the recoverable
- 27 -
*SGVFS033960*
amount and the carrying value of the investee company and recognizes the difference in the parentcompany statement of income.
ProvisionsProvisions are recognized when the Parent Company has a present obligation (legal or constructive)as a result of a past event, it is probable that an outflow of resources embodying economic benefitswill be required to settle the obligation, and a reliable estimate can be made of the amount of theobligation. Where the Parent Company expects a provision to be reimbursed, the reimbursement isrecognized as a separate asset but only when the reimbursement is virtually certain. If the effect ofthe time value of money is material, provisions are determined by discounting the expected futurecash flows at a pre-tax rate that reflects current market assessments of the time value of money and,where appropriate, the risks specific to the liability. Where discounting is used, the increase in theprovision due to the passage of time is recognized as interest expense. Provisions are reviewed ateach reporting date and adjusted to reflect the current best estimate.
Pension CostPension cost is actuarially determined using the projected unit credit method. This method reflectsservices rendered by employees up to the date of valuation and incorporates assumptions concerningemployees’ projected salaries. Actuarial valuations are conducted with sufficient regularity, withoption to accelerate when significant changes to underlying assumptions occur. Pension costincludes: a) service costs comprising current service costs and past-service costs b) gains and losseson curtailments and non-routine settlements, and c) net interest cost on benefit obligation.
Remeasurements, comprising of actuarial gains or losses, the effect of the asset ceiling excluding netinterest cost and the return on plan assets (excluding net interest), are recognized immediately in theparent company statement of financial position with a corresponding debit or credit to OCI in theperiod in which they occur. Remeasurements are not reclassified to profit or loss in subsequentperiods.
The liability recognized in the parent company statement of financial position in respect of definedbenefit pension plans is the present value of the defined benefit obligation at the reporting date lessfair value of the plan assets. The defined benefit obligation is calculated annually by independentactuaries using the projected unit credit method. The present value of the defined benefit obligationis determined by using risk-free interest rates of long-term government bonds that have terms tomaturity approximating the terms of the related pension liabilities or applying a single weightedaverage discount rate that reflects the estimated timing and amount of benefit payments.
Share-based PaymentsThe Parent Company has equity-settled, share-based compensation plans with its employees.
PFRS 2 optionsFor options granted after November 7, 2002 that have not vested on or before January 1, 2005, thecost of equity-settled transactions with employees is measured by reference to the fair value at thedate on which they are granted. The fair value is determined by using the Binomial Tree andBlack-Scholes model, further details of which are presented in Note 26.
The cost of equity-settled transactions is recognized, together with a corresponding increase inequity, over the period in which the performance conditions are fulfilled, ending on the date on whichthe relevant employees become fully entitled to the award (vesting date). The cumulative expenserecognized for equity-settled transactions at each reporting date until the vesting date reflects theextent to which the vesting period has expired and the Parent Company’s best estimate of thenumber of equity instrument that will ultimately vest. The income or expense for a period representsthe movement in cumulative expense recognized as at the beginning and end of that period.
No expense is recognized for awards that do not ultimately vest, except for awards where vesting isconditional upon a market condition, which are treated as vesting irrespective of whether or not themarket condition is satisfied, provided that all other performance conditions are satisfied.

- 28 -
*SGVFS033960*
Where the terms of an equity-settled award are modified, as a minimum, an expense is recognized asif the terms had not been modified. In addition, an expense is recognized for any increase in thevalue of the transaction as a result of the modification, as measured at the date of modification.
Where an equity-settled award is cancelled, it is treated as if it had vested on the date of cancellation,and any expense not yet recognized for the award is recognized immediately. However, if a newaward is substituted for the cancelled award, and designated as a replacement award on the datethat it is granted, the cancelled and new awards are treated as if they were a modification of theoriginal award, as described in the previous paragraph.
Pre-PFRS 2 optionsFor options granted before November 7, 2002 that has vested before January 1, 2005, the intrinsicvalue of stock options determined as of grant date is recognized as expense over the vesting period.
The dilutive effect of outstanding options is reflected as additional share dilution in the computation ofdiluted earnings per share (see Note 25).
Employee Stock Ownership PlanThe Parent Company has an employee stock ownership plan (ESOWN) which allows the grantees topurchase the Parent Company’s shares at a discounted price. The Parent Company recognizesstock compensation expense over the holding period. The Parent Company treats its ESOWN planas option exercisable within a given period. These are accounted for similar to the PFRS 2 options.Dividends paid on the awards that have vested are deducted from equity and those paid on awardsthat are unvested are charged to profit or loss. For the unsubscribed shares where the employeesstill have the option to subscribe in the future, these are accounted for as options.
EquityWhen the shares are sold at a premium, the difference between the proceeds and the par value iscredited to “Additional paid-in capital” account. Direct costs incurred related to equity issuance arechargeable to “Additional paid-in capital” account. If additional paid-in capital is not sufficient, theexcess is charged against retained earnings. When the Parent Company issues more than one classof stock, a separate account is maintained for each class of stock and the number of shares issued.
Subscriptions receivable pertains to the uncollected portion of the subscribed shares.
Retained earnings represent accumulated earnings of the Parent Company less dividends declared.
Own equity instruments which are reacquired (treasury shares) are recognized at cost and deductedfrom equity. No gain or loss is recognized in the parent company statement of income on thepurchase, sale, issue or cancellation of its own equity instruments. Any difference between thecarrying amount and the consideration, if reissued, is recognized under “Additional paid-in capital”.Voting rights related to treasury shares are nullified for the Parent Company and no dividends areallocated to them respectively. When the shares are retired, the capital stock account is reduced byits par value and the excess of cost over par value upon retirement is debited to additional paid-incapital when the shares were issued and to retained earnings for the remaining balance.
Revenue Recognition effective January 1, 2018Revenue from Contract with CustomersThe Parent Company primarily derives its real estate revenue from the sale of vertical and horizontalreal estate projects. Revenue from contracts with customers is recognized when control of the goodsor services are transferred to the customer at an amount that reflects the consideration to which theParent Company expects to be entitled in exchange for those goods or services. The ParentCompany has generally concluded that it is the principal in its revenue arrangements, except for theprovisioning of water, electricity, air-conditioning and common use service area in its mall retailspaces, wherein it is acting as agent.

- 29 -
*SGVFS033960*
The disclosures of significant accounting judgements, estimates and assumptions relating to revenuefrom contracts with customers are provided in Note 3.
Real estate salesThe Parent Company derives its real estate revenue from sale of lots, house and lot andcondominium units. Revenue from the sale of these real estate projects under pre-completion stageare recognized over time during the construction period (or percentage of completion) since based onthe terms and conditions of its contract with the buyers, the Parent Company’s performance does notcreate an asset with an alternative use and the Parent Company has an enforceable right to paymentfor performance completed to date.
In measuring the progress of its performance obligation over time, the Parent Company uses theoutput method. The Parent Company recognizes revenue on the basis of direct measurements of thevalue to customers of the goods or services transferred to date, relative to the remaining goods orservices promised under the contract. Progress is measured using survey of performance completedto date. This is based on the monthly project accomplishment report prepared by the projectengineers as approved by the construction manager which integrates the surveys of performance todate of the construction activities for both sub-contracted and those that are fulfilled by the developeritself.
Any excess of progress of work over the right to an amount of consideration that is unconditional,recognized as residential and office development receivables, under trade receivables, is included inthe “contract asset” account in the asset section of the parent company statement of financialposition.
Any excess of collections over the total of recognized trade receivables and contract assets isincluded in the “contract liabilities” account in the liabilities section of the parent company statementsof financial position.
Cost recognitionThe Parent Company recognizes costs relating to satisfied performance obligations as these areincurred taking into consideration the contract fulfillment assets such as connection fees. Theseinclude costs of land, land development costs, building costs, professional fees, depreciation, permitsand licenses and capitalized borrowing costs. These costs are allocated to the saleable area, withthe portion allocable to the sold area being recognized as costs of sales while the portion allocable tothe unsold area being recognized as part of real estate inventories.
Contract costs include all direct materials and labor costs and those indirect costs related to contractperformance. Expected losses on contracts are recognized immediately when it is probable that thetotal contract costs will exceed total contract revenue. Changes in contract performance, contractconditions and estimated profitability, including those arising from contract penalty provisions, andfinal contract settlements which may result in revisions to estimated costs and gross margins arerecognized in the year in which the changes are determined.
Dividend income is recognized when the Parent Company’s right to receive the payment isestablished.
Contract BalancesReceivablesA receivable represents the Parent Company’s right to an amount of consideration that isunconditional (i.e., only the passage of time is required before payment of the consideration is due).
Contract assetsA contract asset is the right to consideration in exchange for goods or services transferred to thecustomer. If the Parent Company performs by transferring goods or services to a customer beforethe customer pays consideration or before payment is due, a contract asset is recognized for theearned consideration that is conditional.

- 30 -
*SGVFS033960*
Contract liabilitiesA contract liability is the obligation to transfer goods or services to a customer for which the ParentCompany has received consideration (or an amount of consideration is due) from the customer. If acustomer pays consideration before the Parent Company transfers goods or services to thecustomer, a contract liability is recognized when the payment is made or the payment is due(whichever is earlier). Contract liabilities are recognized as revenue when the Parent Companyperforms under the contract.
The contract liabilities also include payments received by the Parent Company from the customers forwhich revenue recognition has not yet commenced.
Costs to Obtain ContractThe incremental costs of obtaining a contract with a customer are recognized as an asset if theParent Company expects to recover them. The Parent Company has determined that commissionspaid to brokers and marketing agents on the sale of pre-completed real estate units are deferredwhen recovery is reasonably expected and are charged to expense in the period in which the relatedrevenue is recognized as earned. Commission expense is included in the “Real estate costs andexpenses” account in the parent company statement of income.
Costs incurred prior to obtaining contract with customer are not capitalized but are expensed asincurred.
Amortization, de-recognition and impairment of capitalized costs to obtain a contractThe Parent Company amortizes capitalized costs to obtain a contract to cost of sales over theexpected construction period using percentage of completion following the pattern of real estaterevenue recognition. The amortization is included within cost of sales.
A capitalized cost to obtain a contract is derecognized either when it is disposed of or when no furthereconomic benefits are expected to flow from its use or disposal.
At each reporting date, the Parent Company determines whether there is an indication that cost toobtain a contract maybe impaired. If such indication exists, the Parent Company makes an estimateby comparing the carrying amount of the assets to the remaining amount of consideration that theParent Company expects to receive less the costs that relate to providing services under the relevantcontract. In determining the estimated amount of consideration, the Parent Company uses the sameprinciples as it does to determine the contract transaction price, except that any constraints used toreduce the transaction price will be removed for the impairment test.
Where the relevant costs or specific performance obligations are demonstrating marginal profitabilityor other indicators of impairment, judgement is required in ascertaining whether or not the futureeconomic benefits from these contracts are sufficient to recover these assets. In performing thisimpairment assessment, management is required to make an assessment of the costs to completethe contract. The ability to accurately forecast such costs involves estimates around cost savings tobe achieved over time, anticipated profitability of the contract, as well as future performance againstany contract-specific performance indicators that could trigger variable consideration, or servicecredits. Where a contract is anticipated to make a loss, these judgements are also relevant indetermining whether or not an onerous contract provision is required and how this is to be measured.
Revenue Recognition prior to January 1, 2018
Revenue and Cost RecognitionRevenue is recognized to the extent that it is probable that the economic benefits will flow to theParent Company and the revenue can be reliably measured.
For real estate sales, the Parent Company assesses whether it is probable that the economic benefitswill flow to the Parent Company when the sales prices are collectible. Collectibility of the sales priceis demonstrated by the buyer’s commitment to pay, which in turn is supported by substantial initial
- 31 -
*SGVFS033960*
and continuing investments that give the buyer a stake in the property sufficient that the risk of lossthrough default motivates the buyer to honor its obligation to the seller. Collectibility is also assessedby considering factors such as the credit standing of the buyer, age and location of the property.
Revenue from sales of completed real estate projects is accounted for using the full accrual method.In accordance with PIC Q&A 2006-01, the percentage-of-completion method is used to recognizeincome from sales of projects where the Parent Company has material obligations under the salescontract to complete the project after the property is sold, the equitable interest has been transferredto the buyer, construction is beyond preliminary stage (i.e., engineering, design work, constructioncontracts execution, site clearance and preparation, excavation and the building foundation arefinished), and the costs incurred or to be incurred can be measured reliably. Under this method,revenue is recognized as the related obligations are fulfilled, measured principally on the basis of thephysical proportion of contract work. The percentage of completion is determined by the ParentCompany’s project engineers.
Any excess of collections over the recognized receivables are included in the “Deposits and othercurrent liabilities” account in the liabilities section of the parent company statements of financialposition.
If any of the criteria under the full accrual or percentage-of-completion method is not met, the depositmethod is applied until all the conditions for recording a sale are met. Pending recognition of sale,cash received from buyers are presented under the “Deposits and other current liabilities” account inthe liabilities section of the parent company statements of financial position.
Cost of real estate sales is recognized consistent with the revenue recognition method applied and isdetermined with reference to the specific, including estimated costs, on the property allocated to soldarea. Cost of residential and commercial lots and units sold before the completion of thedevelopment is determined on the basis of the acquisition cost of the land plus its full developmentcosts, which include estimated costs for future development works, as determined by the ParentCompany’s in-house technical staff.
Estimated development costs include direct land development, shared development cost, buildingcost, external development cost, professional fees, post construction, contingency, miscellaneousand socialized housing. Miscellaneous costs include payments such as permits and licenses,business permits, development charges and claims from third parties which are attributable to theproject. Contingency includes fund reserved for unforeseen expenses and/ or cost adjustments.Revisions in estimated development costs brought about by increases in projected costs in excess ofthe original budgeted amounts are considered as special budget appropriations that are approved bymanagement and are made to form part of total project costs on a prospective basis and allocatedbetween costs of sales and real estate inventories.
Revenue from construction contracts included in the “Real estate” account in the parent companystatements of income is recognized using the percentage-of-completion method, based on thecompletion of a physical proportion of the contract work inclusive of the uninstalled goods andmaterials delivered to the site.
Contract costs include all direct materials and labor costs and those indirect costs related to contractperformance. Expected losses on contracts are recognized immediately when it is probable that thetotal contract costs will exceed total contract revenue. Changes in contract performance, contractconditions and estimated profitability, including those arising from contract penalty provisions, andfinal contract settlements which may result in revisions to estimated costs and gross margins arerecognized in the year in which the changes are determined.

- 32 -
*SGVFS033960*
Rental income under noncancellable and cancellable leases on investment properties is recognizedin the parent company statement of income on a straight-line basis over the lease term and the termsof the lease, respectively, or based on a certain percentage of the gross revenue of the tenants, asprovided under the terms of the lease contract.
Marketing fees, management fees from administration and property management are recognizedwhen services are rendered.
Interest income is recognized as it accrues using the effective interest method.
Dividend income is recognized when the Parent Company’s right to receive the payment isestablished.
CommissionsCommissions paid to sales or marketing agents on the sale of pre-completed real estate units aredeferred when recovery is reasonably expected and are charged to expense in the period in whichthe related revenue is recognized as earned. Accordingly, when the percentage of completionmethod is used, commissions are likewise charged to expense in the period the related revenue isrecognized. Commission expense is included in the “Real estate costs and expenses” account in theparent company statement of income.
Expense RecognitionExpenses are recognized in the parent company statement of income when decrease in futureeconomic benefit related to a decrease in an asset or an increase in a liability has arisen that can bemeasured reliably.
Expenses are recognized in the parent company statement of income:∂ On the basis of a direct association between the costs incurred and the earning of specific items
of income;∂ On the basis of systematic and rational allocation procedures when economic benefits are
expected to arise over several accounting periods and the association can only be broadly orindirectly determined; or
∂ Immediately when expenditure produces no future economic benefits or when, and to the extentthat, future economic benefits do not qualify or cease to qualify, for recognition in the parentcompany statement of financial position as an asset.
Direct operating expenses and general and administrative expenses are recognized as they areincurred.
Borrowing CostsBorrowing costs directly attributable to the acquisition or construction of an asset that necessarilytakes a substantial period of time to get ready for its intended use or sale are capitalized as part ofthe cost of the respective assets. All other borrowing costs are expensed in the period in which theyoccur. Borrowing costs consist of interest and other costs that an entity incurs in connection with theborrowing of funds.
The interest capitalized is calculated using the Parent Company’s weighted average cost ofborrowings after adjusting for borrowings associated with specific developments. Where borrowingsare associated with specific developments, the amounts capitalized is the gross interest incurred onthose borrowings less any investment income arising on their temporary investment. Interest iscapitalized from the commencement of the development work until the date of practical completion.The capitalization of finance costs is suspended if there are prolonged periods when developmentactivity is interrupted. If the carrying amount of the asset exceeds its recoverable amount, animpairment loss is recorded.

- 33 -
*SGVFS033960*
LeasesThe determination of whether an arrangement is, or contains, a lease is based on the substance ofthe arrangement at inception date whether the fulfillment of the arrangement is dependent on the useof a specific asset or assets or the arrangement conveys a right to use the asset. A reassessment ismade after inception of the lease only if one of the following applies:(a) There is a change in contractual terms, other than a renewal or extension of the arrangement;(b) A renewal option is exercised or extension granted, unless the term of the renewal or extension
was initially included in the lease term;(c) There is a change in the determination of whether fulfillment is dependent on a specified asset; or(d) There is substantial change to the asset.
Where a reassessment is made, lease accounting shall commence or cease from the date when thechange in circumstances gave rise to the reassessment for scenarios (a), (c), or (d) and at the date ofrenewal or extension period for scenario (b).
Parent Company as lesseeLeases where the lessor retains substantially all the risks and benefits of ownership of the asset areclassified as operating leases. Fixed lease payments are recognized as an expense in the parentcompany statement of income on a straight-line basis while the variable rent is recognized as anexpense based on terms of the lease contract.
As disclosed under Adoption of New and Amended Accounting Standards and Interpretations, theParent Company will adopt PFRS 16, Leases on January 1, 2019. The standard requires lessess toaccount for all leases under s single on-balance sheet model. The Parent Company is currentlyassessing the impact of this standard.
Parent Company as lessorLeases where the Parent Company does not transfer substantially all the risk and benefits ofownership of the assets are classified as operating leases. Lease payments received are recognizedas an income in the parent company statement of income on a straight-line basis over the lease term.Initial direct costs incurred in negotiating operating leases are added to the carrying amount of theleased asset and recognized over the lease term on the same basis as the rental income. Contingentrents are recognized as revenue in the period in which they are earned.
Current TaxCurrent tax assets and liabilities for the current and prior periods are measured at the amountexpected to be recovered from or paid to the tax authority. The tax rates and tax laws used tocompute the amount are those that are enacted or substantively enacted as at the end of thereporting period.
Deferred TaxDeferred tax is provided, using the liability method, on all temporary differences, with certainexceptions, at the reporting date between the tax bases of assets and liabilities and their carryingamounts for financial reporting purposes.
Deferred tax liabilities are recognized for all taxable temporary differences, with certain exceptions.Deferred tax assets are recognized for all deductible temporary differences, carryforward benefits ofunused tax credits from excess of minimum corporate income tax (MCIT) over the regular corporateincome tax and unused net operating loss carryover (NOLCO), to the extent that it is probable thattaxable income will be available against which the deductible temporary differences and carryforwardbenefits of unused tax credits and NOLCO can be utilized.
Deferred tax liabilities are not provided on nontaxable temporary differences associated withinvestments in domestic subsidiaries, associates and interests in joint ventures.

- 34 -
*SGVFS033960*
The carrying amount of deferred tax assets is reviewed at each reporting date and reduced to theextent that it is no longer probable that sufficient taxable income will be available to allow all or part ofthe deferred tax assets to be utilized. Unrecognized deferred tax assets are reassessed at eachreporting date and are recognized to the extent that it has become probable that future taxable profitwill allow all or part of the deferred tax assets to be recovered.
Deferred tax assets and liabilities are measured at the tax rate that is expected to apply to the periodwhen the asset is realized or the liability is settled, based on tax rates and tax laws that have beenenacted or substantively enacted at the reporting date. Movements in the deferred tax assets andliabilities arising from changes in tax rates are charged against or credited to income for the period.
Deferred tax assets and liabilities are offset, if a legally enforceable right exists to set off current taxassets against current tax liabilities and the deferred income taxes relate to the same taxable entityand the same taxation authority.
Foreign Currency TransactionsTransactions in foreign currencies are initially recorded using the exchange rate at the date of thetransactions. Monetary assets and liabilities denominated in foreign currencies are restated using theclosing exchange rates prevailing at reporting date. Exchange gains or losses arising from foreignexchange transactions are credited to or charged against operations for the year.
Earnings Per Share (EPS)Basic EPS is computed by dividing net income for the year attributable to common equity holders ofthe Parent Company by the weighted average number of common shares issued and outstandingduring the year adjusted for any subsequent stock dividends declared. Diluted EPS is computed bydividing net income for the year attributable to common equity holders of the Parent Company by theweighted average number of common shares issued and outstanding during the year plus theweighted average number of common shares that would be issued on conversion of all the dilutivepotential common shares into common shares. Calculation of dilutive EPS considers the potentialordinary shares of subsidiaries, associates and joint ventures that have dilutive effect on the basicEPS of the Parent Company. The calculation of diluted earnings per share does not assumeconversion, exercise, or other issue of potential common shares that would have an antidilutive effecton earnings per share.
Segment ReportingThe Parent Company’s operating businesses are organized and managed separately according tothe nature of the products and services provided, with each segment representing a strategicbusiness unit that offers different products and serves different markets. Financial information onbusiness segments is presented in Note 28 of the parent company financial statements.
ContingenciesContingent liabilities are not recognized in the parent company financial statements. These aredisclosed unless the possibility of an outflow of resources embodying economic benefits is remote.Contingent assets are not recognized in the parent company financial statements but disclosed whenan inflow of economic benefits is probable.
Events after the Reporting DatePost year-end events that provide additional information about the Parent Company’s position at thereporting date (adjusting events) are reflected in the parent company financial statements. Post year-end events that are not adjusting events are disclosed in the parent company financial statementswhen material.
- 35 -
*SGVFS033960*
3. Significant Accounting Judgments and Estimates
The preparation of the accompanying parent company financial statements in conformity with PFRSsrequires management to make estimates and assumptions that affect the amounts reported in theparent company financial statements and accompanying notes. The estimates and assumptionsused in the accompanying parent company financial statements are based upon management’sevaluation of relevant facts and circumstances as of the date of the parent company financialstatements. Actual results could differ from such estimates.
JudgmentsIn the process of applying the Parent Company’s accounting policies, management has made thefollowing judgments, apart from those involving estimations, which have the most significant effect onthe amounts recognized in the parent company financial statements:
Existence of a contractThe Parent Company’s primary document for a contract with a customer is a signed contract to sell. Ithas determined, however, that in cases wherein contract to sell are not signed by both parties, thecombination of its other signed documentation such as reservation agreement, official receipts,buyers’ computation sheets and invoices, would contain all the criteria to qualify as contract with thecustomer under PFRS 15.
In addition, part of the assessment process of the Parent Company before revenue recognition is toassess the probability that the Parent Company will collect the consideration to which it will be entitledin exchange for the real estate property that will be transferred to the customer. In evaluatingwhether collectability of an amount of consideration is probable, an entity considers the significanceof the customer’s initial payments in relation to the total contract price. Collectability is also assessedby considering factors such as past history with the customer, age and pricing of the property.Management regularly evaluates the historical cancellations and back-outs if it would still support itscurrent threshold of customers’ equity before commencing revenue recognition.
Revenue recognition method and measure of progressThe Parent Company concluded that revenue for real estate sales is to be recognized over timebecause: (a) the Parent Company’s performance does not create an asset with an alternative useand; (b) the Parent Company has an enforceable right for performance completed to date. Thepromised property is specifically identified in the contract and the contractual restriction on the ParentCompany’s ability to direct the promised property for another use is substantive. This is because theproperty promised to the customer is not interchangeable with other properties without breaching thecontract and without incurring significant costs that otherwise would not have been incurred in relationto that contract. In addition, under the current legal framework, the customer is contractually obligedto make payments to the developer up to the performance completed to date. In addition, the ParentCompany requires a certain percentage of buyer's payments of total selling price (buyer's equity), tobe collected as one of the criteria in order to initiate revenue recognition. Reaching this level ofcollection is an indication of buyer’s continuing commitment and the probability that economic benefitswill flow to the Parent Company. The Parent Company considers that the initial and continuinginvestments by the buyer of about 10% would demonstrate the buyer’s commitment to pay.
The Parent Company has determined that output method used in measuring the progress of theperformance obligation faithfully depicts the Parent Company’s performance in transferring control ofreal estate development to the customers.
Definition of default and credit-impaired financial assetsThe Parent Company defines a financial instrument as in default, which is fully aligned with thedefinition of credit-impaired, when it meets one or more of the following criteria:
Quantitative criteria – for sales contracts receivable, the customer receives a notice of cancellationand does not continue the payments.

- 36 -
*SGVFS033960*
Qualitative criteriaThe customer meets unlikeliness to pay criteria, which indicates the customer is in significant financialdifficulty. These are instances where:a. The customer is experiencing financial difficulty or is insolventb. The customer is in breach of financial covenant(s)c. An active market for that financial assets has disappeared because of financial difficultiesd. Concessions have been granted by the Parent Company, for economic or contractual reasons
relating to the customer’s financial difficultye. It is becoming probable that the customer will enter bankruptcy or other financial reorganization
The criteria above have been applied to the financial instruments held by the Parent Company andare consistent with the definition of default used for internal credit risk management purposes. Thedefault definition has been applied consistently to model the Probability of Default (PD), Loss GivenDefault (LGD) and Exposure at Default (EAD) throughout the Parent Company’s expected losscalculation.
Incorporation of forward-looking informationThe Parent Company incorporates forward-looking information into both its assessment of whetherthe credit risk of an instrument has increased significantly since its initial recognition and itsmeasurement of ECL.
To do this, the Parent Company considers a range of relevant forward-looking macro-economicassumptions for the determination of unbiased general industry adjustments and any related specificindustry adjustments that support the calculation of ECLs. Based on the Parent Company’sevaluation and assessment and after taking into consideration external actual and forecastinformation, the Parent Company formulates a ‘base case’ view of the future direction of relevanteconomic variables as well as a representative range of other possible forecast scenarios. Thisprocess involves developing two or more additional economic scenarios and considering the relativeprobabilities of each outcome. External information includes economic data and forecasts publishedby governmental bodies, monetary authorities and selected private-sector and academic institutions.
The base case represents a most-likely outcome and is aligned with information used by the ParentCompany for other purposes such as strategic planning and budgeting. The other scenariosrepresent more optimistic and more pessimistic outcomes. Periodically, the Parent Company carriesout stress testing of more extreme shocks to calibrate its determination of these other representativescenarios.
The Parent Company has identified and documented key drivers of credit risk and credit losses ofeach portfolio of financial instruments and, using an analysis of historical data, has estimatedrelationships between macro-economic variables and credit risk and credit losses.
Distinction of land between real estate inventories and investment propertiesThe Parent Company determines whether a property will be classified as real estate inventories orinvestment properties. In making this judgment, the Parent Company considers whether the propertywill be sold in the normal operating cycle (real estate inventories). All other properties that are not yetdetermined to be sold in the normal operating cycle are classified as investment properties.
Control of entities in which the Parent Company holds only 50% or less than majority of voting rightsThe Parent Company considers that it controls the following entities even though it owns 50% or lessthan majority of the voting rights.
Alabang Commercial Corp. (ACC)For ACC, the Parent Company holds 50% of the voting rights, and is also the single largestshareholder and the remaining 50% of the equity shares are held by several shareholders. Thesecond largest stockholder of ACC holds 8.3% share while the other shareholders’ equity interestranges from 2.1% to 8.3%. In addition, the Parent Company has an existing management services

- 37 -
*SGVFS033960*
agreement which gives the Parent Company the exclusive control and decision over the relevantactivities of ACC.
BGWest Properties, Inc. (BG West)For the BG West, wherein the Parent Company and the other shareholder each own 50% of thevoting rights, the Parent Company controls the investee through exercise of its exclusive projectdevelopment and marketing agreement as well as the ability to decide on the financing, operating andstrategic policies of the investees. This enabled the Parent Company to conclude that it has control.
Ayala Hotels, Inc. (AHI), Roxas Land Corp. (RLC), ALI-CII Development Corp. (ALI-CII) and Leisureand Allied Industries Philippines, Inc. (LAIP).Parent Company has an existing management services agreement with AHI, RLC, ALI-CII and LAIPwhich gives Parent Company the exclusive control and decision over the relevant activities of AHI,RLC, ALI-CII and LAIP.
Significant influence on OCLP Holdings, Inc.(OHI) and Bonifacio Land Corp (BLC)The Parent Company considers that it has significant influence over investees when it has boardrepresentation which allows them to participate in the financial and operating policy decisions but isnot control or joint control of those policies (see Note 11).
ContingenciesThe Parent Company is currently involved in various legal proceedings. The estimate of the probablecosts for the resolution of these claims has been developed in consultation with outside counselhandling the defense in these matters and is based upon an analysis of potential results. The ParentCompany currently does not believe that these proceedings will have a material effect on the ParentCompany’s financial position (see Note 29).
Management’s Use of EstimatesThe key assumptions concerning the future and other key sources of estimation uncertainty at thereporting date, that have a significant risk of causing a material adjustment to the carrying amounts ofassets and liabilities within the next financial year are discussed below.
Revenue and cost recognition on real estate projectsThe Parent Company’s revenue recognition and cost policies require management to make use ofestimates and assumptions that may affect the reported amounts of revenues and costs. The ParentCompany’s revenue from real estate is recognized based on the percentage of completion aremeasured principally on the basis of the estimated completion of a physical proportion of the contractwork. Apart from involving significant estimates in determining the quanitity of imports such asmaterials, labor and equipment needed, the assessment process for the POC is complex and theestimated project development costs requires technical determination by management’s specialists(project engineers). See Notes 20 and 21 for the related balances.
Similarly, the commission is determined using the percentage of completion.
Provision for expected credit losses of trade receivables and contract assetsThe Parent Company uses a provision matrix to calculate ECLs for trade receivables other than tradereceivables from residential business. The provision rates are based on days past due for groupingsof various customer segments that have similar loss patterns.
The provision matrix is initially based on the Parent Company’s historical observed default rates. TheParent Company will calibrate the matrix to adjust the historical credit loss experience with forward-looking information such as inflation and interest rates. At every reporting date, the historicalobserved default rates are updated and changes in the forward-looking estimates are analyzed.
- 38 -
*SGVFS033960*
The Parent Company uses vintage analysis approach to calculate ECLs for trade receivables fromresidential business and contract assets. The vintage analysis accounts for expected losses bycalculating the cumulative loss rates of a given loan pool. It derives the probability of default from thehistorical data of a homogenous portfolio that share the same origination period. The information onthe number of defaults during fixed time intervals of the accounts is utilized to create the PD model. Itallows the evaluation of the loan activity from its origination period until the end of the contract period.
The assessment of the correlation between historical observed default rates, forecast economicconditions (inflation and interert rates) and ECLs is a significant estimate. The amount of ECLs issensitive to changes in circumstances and of forecast economic conditions. The Parent Company’shistorical credit loss experience and forecast of economic conditions may also not be representativeof customer’s actual default in the future.
The information about the ECLs on the Parent Company’s trade receivables and contract assets isdisclosed in Notes 6, 14 and 27.
Evaluation of net realizable value of real estate inventoriesThe Parent Company adjusts the cost of its real estate inventories to net realizable value based on itsassessment of the recoverability of the inventories. NRV for completed real estate inventories isassessed with reference to market conditions and prices existing at the reporting date and isdetermined by the Parent Company in the light of recent market transactions. NRV in respect of realestate inventories under construction is assessed with reference to market prices at the reportingdate for similar completed property, less estimated costs to complete construction and less estimatedcosts to sell. The amount and timing of recorded expenses for any period would differ if differentjudgments were made or different estimates were utilized. See Note 7 for the related balances.
Share-based paymentsThe expected life of the options is based on the expected exercise behavior of the stock optionholders and is not necessarily indicative of the exercise patterns that may occur. The volatility isbased on the average historical price volatility which may be different from the expected volatility ofthe shares of stock of the Parent Company. See Note 26 for the related balances.
Estimating pension liabilities and other retirement benefitsThe determination of the Parent Company’s obligation and cost for pension and other retirementbenefits is dependent on selection of certain assumptions used by actuaries in calculating suchamounts. These include the determination of the discount rates, future salary increases, mortalityrates and future pension increases. Significant assumptions are disclosed in Note 24 and includeamong others, discount rate and salary increase rate.
In determining the appropriate discount rate, management considers the interest rates of governmentbonds that are denominated in the currency in which the benefits will be paid, with extrapolatedmaturities corresponding to the expected duration of the defined benefit obligation.
The mortality rate is based on publicly available mortality tables and is modified accordingly withestimates of mortality improvements. Future salary increases and pension increases are based onexpected future inflation rates.
While the Parent Company believes that the assumptions are reasonable and appropriate, significantdifferences in actual experience or significant changes in assumptions could materially affectretirement obligations. See Note 24 for the related balances.
Fair value of financial instrumentsWhere the fair values of financial assets and financial liabilities recorded and disclosed in the parentcompany statement of financial position cannot be derived from active markets, they are determinedusing internal valuation techniques and generally accepted market valuation models.
- 39 -
*SGVFS033960*
The inputs to these models are taken from observable markets where possible, but where this is notfeasible, estimates are used in establishing fair values. These estimates may include considerationsof liquidity, volatility, and correlation. Certain financial assets and liabilities were initially recorded attheir fair values by using the discounted cash flow methodology. See Note 27 for the relatedbalances.
4. Cash and Cash Equivalents
This account consists of:
2018 2017Cash on hand P=905,774 P=1,187,483Cash in banks 868,621,495 481,215,547Cash equivalents 253,941,374 105,154,427
P=1,123,468,643 P=587,557,457
Cash in banks earns interest at the respective bank deposit rates. Cash equivalents are short-term,highly liquid investments that are made for varying periods of up to three (3) months depending onthe immediate cash requirements of the Parent Company, and earn interest at the respective short-term investment rates.
The annual interest rates of the cash equivalents are as follows:
2018 2017Philippine Peso 5.8% to 6.8% 2.5% to 2.8%US Dollar − 1.1% to 2.0%
There is no restriction on the Parent Company’s cash balances as of December 31, 2018 and 2017.
5. Financial Assets at FVPL
The Parent Company has investments in the BPI Money Market Fund (MMF) (the Fund). The Fund,which is structured as a money market UITF, aim to generate liquidity and stable income by investingin a diversified portfolio of primarily short-term fixed income instruments and with no minimum holdingperiod requirement.
As of December 31, 2018, the Parent Company invested in the Fund with a fair value of P=2.0 million.The BPI MMF’s Net Asset Value (NAV) was at P=8,331.5 million with duration of 150 days.
As of December 31, 2017, the Parent Company invested in the Fund with a fair value of P=1.9 million.The BPI MMF’s Net Asset Value (NAV) was at P=5,866.9 million with duration of 142 days.
The following table provides the fair value hierarchy of the Parent Company’s financial assets atFVPL which are measured at fair value as of December 31, 2018 and 2017:
2018
Date of Valuation
Fair value measurement using
Total
Quoted prices inactive markets
(Level 1)
Significantobservable
inputs(Level 2)
Significantunobservable
inputs(Level 3)
Investment in UITF December 31, 2018 P=1,969,029 P=− P=1,969,029 P=−

- 40 -
*SGVFS033960*
2017
Date of Valuation
Fair value measurement using
Total
Quoted prices inactive markets
(Level 1)
Significantobservable
inputs(Level 2)
Significantunobservable
inputs(Level 3)
Investment in UITF December 31, 2017 P=1,918,566 P=– P=1,918,566 P=–
The fair value of the investment in UITF is based on net asset values as of reporting dates.
Reconciliation of the fair value measurement is shown below:
2018 2017Balance at beginning of year P=1,918,566 P=1,891,431Unrealized gains included under “Other income”
(see Note 21) 50,463 27,135Balance at end of year P=1,969,029 P=1,918,566
6. Accounts and Notes Receivable
Accounts and notes receivable account consists of:
2018 2017Trade Residential and office development P=36,813,840,342 P=30,870,053,637 Corporate business 697,893,154 600,337,803 Shopping centers 562,648,223 496,047,893 Rent receivables 11,792,950 8,510,295 Others 1,761,052,911 1,126,434,420Receivable from related parties (Note 23) 37,692,233,291 39,604,749,149Advances to other companies 10,752,450,763 9,295,570,595Dividends receivable 1,984,062,467 2,261,645,426Receivable from employees 227,170,279 203,392,990Interest receivable (Note 23) 12,711,404 12,656,112
90,515,855,784 84,479,398,320Less allowance for impairment losses 170,664,571 168,651,366
90,345,191,213 84,310,746,954Less noncurrent portion 663,422,134 16,712,201,933
P=89,681,769,079 P=67,598,545,021
The classes of trade receivables of the Parent Company follow:∂ Residential and office development - pertains to receivables from the sale of high-end and
upper middle-income residential lots and units, sale of commercial lots, and leisurecommunity developments. Upon adoption of PFRS 15, the Parent Company records anyexcess of progress of work over the right to an amount of consideration that is unconditional,recognized as residential and office development trade receivables, as contract asset(see Notes 2 and 14).
∂ Corporate business - pertain to lease receivables of office buildings.∂ Shopping centers - pertain to lease receivables from retail spaces∂ Rent receivables - pertain to receivables for lease of land and Ayala Property Management
Corporation (APMC) - administered properties.∂ Others - pertain mainly to receivables from facility management and other support services.

- 41 -
*SGVFS033960*
Sales contract receivables, included under residential and office development, are collectible inmonthly installments over a period of one (1) to ten (10) years. These are carried at amortized costusing the effective interest rate method with annual interest rates ranging from 8.3% to 13%. Titles toreal estate properties are transferred to the buyers only once full payment has been made.
Corporate business receivables are collectible on a monthly or quarterly basis depending on theterms of the lease contracts.
Receivables from shopping centers and rent receivables are due within 30 days upon billing.
Receivables from facility management and other support services included under other tradereceivables are normally due within 30 to 90 days upon billing.
Receivable from related parties, dividends receivable and interest receivable are due anddemandable.
Advances to other companies includes advances made to joint venture partners that have been madein consideration of project costs and purchases of land that are still subject to completion. Thedocumentation for these advances provides that these will be payable over a fixed term or ondemand in order to allow for repayment of the advances when closing does not occur.
Receivables from employees pertain to housing, car, salary and other loans granted to the ParentCompany’s employees which are collectible through salary deduction, are interest-bearing (6.0% perannum) and payable on various maturity dates.
Receivables amounting to P=171.0 million and P=168.7 million as of December 31, 2018 and 2017,respectively, were impaired and fully provided with allowance. The movements in the allowance forECLs on receivables follow:
2018
Trade
Shoppingcenters
Corporatebusiness Others
Advancesto other
companies TotalBalance at beginning of year P=146,696,986 P=21,954,380 − − P=168,651,366Provisions during the year
(Note 21) 2,013,205 − − − 2,013,205Reversal (Note 21) − − − − −Accounts written off − – – − –Balance at end of year P=148,710,191 P=21,954,380 P=− P=− P=170,664,571Individually impaired P=41,154,049 P=21,954,380 P=− P=− P=63,108,429Collectively impaired 107,556,142 – – − 107,556,142Total P=148,710,191 P=21,954,380 P=− P=− P=170,664,571Gross amounts of receivables
Individually determined tobe impaired P=41,154,049 P=21,954,380 P=− P=− P=63,108,429

- 42 -
*SGVFS033960*
2017
Trade
Shoppingcenters
Corporatebusiness Others
Advancesto other
companies TotalBalance at beginning of year P=149,977,931 P=12,806,532 P=89,029,354 P=443,194,586 P=695,008,403Provisions during the year(Note 21) − 9,147,848 − − 9,147,848Reversal (Note 21) (3,280,945) − (89,029,354) (443,194,586) (535,504,885)Accounts written off − – – − –Balance at end of year P=146,696,986 P=21,954,380 P=− P=− P=168,651,366Individually impaired P=39,140,844 P=21,954,380 P=− − P=61,095,224Collectively impaired 107,556,142 – – − 107,556,142Total P=146,696,986 P=21,954,380 P=− P=− P=168,651,366Gross amounts of receivables
Individually determined tobe impaired P=39,140,844 P=21,954,380 P=− P=− P=61,095,224
As of December 31, 2017, nominal amount of trade receivables from residential developmentamounting to P=33,685.6 million were recorded initially at fair value. The fair values of the receivableswere obtained by discounting future cash flows using the applicable rates of similar types ofinstruments.
Movements in the unamortized discount of the Parent Company’s receivables as of 2017 are asfollows:
2017Balance at beginning of year P=2,705,737,737Additions during the year 1,797,032,350Accretion for the year (Note 20) (1,595,607,661)Balance at end of year P=2,907,162,426
The Parent Company entered into agreements with BPI Asset Management and Trust Corporation in2018 and 2017 for the assignment of interest-bearing employee receivables amounting to nil andP=69.0 million, respectively. The transactions were without recourse and did not result to any gain orloss.
In 2017, the Parent Company sold receivables on a without recourse basis to partner mortgagebanks, which include BPI Family savings bank, a related party, totaling to P=1,214.7 million and weresold at discount with total proceeds P=1,137.5 million. The Parent Company recognized loss on sale(under “Interest and other financing charges”) amounting P=76.6 million in 2017.
7. Inventories
This account consists of:
20182017
(As restated)
Real estate Residential and commercial lots P=17,430,924,850 P=10,317,609,822 Residential and commercial units - at cost 7,944,107,544 10,395,175,527
P=25,375,032,394 P=20,712,785,349

- 43 -
*SGVFS033960*
A summary of the movements in inventories is set out below:
2018
Residential andcommercial lots
Residentialand commercial
units TotalBalances at beginning of year P=10,317,609,822 P=10,395,175,527 P=20,712,785,349Construction/development costs
incurred/adjustments 3,249,444,027 14,612,690,545 17,862,134,572Disposals (recognized as cost of real
estate sales) (Note 21) (3,001,666,450) (17,063,758,528) (20,065,424,978)Transfers from investment property
(Note 11) 6,865,537,451 – 6,865,537,451Balances at end of year P=17,430,924,850 P=7,944,107,544 P=25,375,032,394
2017 (as restated, see Note 2)
Residential andcommercial lots
Residentialand commercial
units TotalBalances at beginning of year P=14,787,292,564 P=9,626,070,274 P=24,413,362,838Construction/development costs
incurred/adjustments 4,341,562,217 6,363,776,643 10,705,338,860Disposals (recognized as cost of real
estate sales) (Note 21) (12,893,885,479) (5,594,671,390) (18,488,556,869)Transfers from investment property
(Note 11) 2,784,202,467 – 2,784,202,467Write-down of inventories/reversal of
write-down (Note 21) 1,298,438,053 – 1,298,438,053Balances at end of year P=10,317,609,822 P=10,395,175,527 P=20,712,785,349
On January 1, 2018, the Parent Company adopted PIC Q&A 2018-11, Classification of Land by RealEstate Developer. Land and improvements previously presented as non-current asset includes landwhich the Board of Directors has previously approved to be developed into residential developmentfor sale. Before the adoption of PIC Q&A 2018-11, the classification was based on the ParentCompany’s timing to start the development of the property. This was reclassified under inventories inthe parent company statement of financial position (see Note 2).
The Parent Company has no purchase commitments pertaining to its inventories as ofDecember 31, 2018 and 2017.
None of these assets were used as collateral or as a security to the loans and obligations of theParent Company.
8. Other Current Assets
This account consists of:
2018January 1, 2018
(As restated)Prepaid taxes and licenses P=4,377,359,930 P=2,780,324,930Advances to contractors and suppliers 3,409,868,454 4,878,060,269Prepaid expenses 1,998,782,468 1,538,497,790Value-added input tax – net 1,525,215,468 2,882,726,576Materials and supplies 6,027,956 6,027,956
P=11,317,254,276 P=12,085,637,521

- 44 -
*SGVFS033960*
Prepaid taxes and licenses pertains to the excess of payments made against current income tax duewhich can be claimed against income tax for future periods, and prepayments on other taxes andlicenses.
Advances to contractors and suppliers are recouped upon every progress billing payment dependingon the percentage of accomplishment. On January 1, 2018, the Parent Company adopted PIC Q&A2018-15, PAS 1-Classification of Advances to Contractors in the Nature of Prepayments: Current vs.Non-current. Advances to contractors and suppliers previously presented as current assets,representing prepayments for the construction of investment property were reclassified to non-currentassets (see Note 13).
Prepaid expenses mainly include prepayments for commissions, marketing and management fees,advertising and promotions, rentals and insurance.
The value-added input tax is applied against value-added output tax. The remaining balance isrecoverable in future periods.
Materials, parts and supplies pertain to inventories to be used in the construction and maintenance ofprojects.
9. Financial Assets at Fair Value through OCI and Available-for-sale Financial Assets
As of December 31, 2018, financial assets at FVOCI consists of investments in:
Shares of stock: Unquoted P=165,740,922 Quoted 12,486,647
178,227,569Net unrealized gain 69,173,878
P=247,401,447
As of December 31, 2017, available-for-sale financial assets consists of investments in:
Shares of stock: Unquoted P=165,740,922 Quoted 12,486,647
178,227,569Net unrealized gain 39,487,351
P=217,714,920
Investments in quoted shares of stock include shares held for clubs wherein the Parent Companydoes not exercise control or demonstrate significant influence.
Investments in unquoted shares of stock include unlisted shares of public utility companies which theParent Company will continue to carry as part of the infrastructure that it provides to its real estateprojects.
Movements in the reserves for financial assets at FVOCI and AFS financial assets as ofDecember 31, 2018 and 2017 are as follows:
2018 January 1, 2018Balance at beginning of year P=39,487,351 P=26,425,650Fair value changes during the year 29,686,527 13,061,701Balance at end of year P=69,173,878 P=39,487,351

- 45 -
*SGVFS033960*
The following tables provide the fair value hierarchy of the Parent Company’s financial assets atFVOCI and AFS financial assets which are measured at fair value as of December 31, 2018and 2017:
2018Fair value measurement using
Date of Valuation Total
Quoted pricesin activemarkets(Level 1)
Significantobservable
inputs(Level 2)
Significantunobservable
inputs(Level 3)
Shares of stock: (In Thousands) Quoted Tourism and leisure December 31, 2018 P=69,074 P=69,074 P=– P=– Unquoted Tourism and leisure Various 157,850 – – 157,850 Utilities and energy Various 8,590 – – 8,590 Real estate Various 11,887 – – 11,887
2017Fair value measurement using
Date of Valuation Total
Quoted pricesin activemarkets(Level 1)
Significantobservable
inputs(Level 2)
Significantunobservable
inputs(Level 3)
Shares of stock: (In Thousands) Quoted Tourism and leisure December 31, 2017 P=51,974 P=51,974 P=– P=–
10. Investments in Subsidiaries, Associates and Joint Ventures
This account consists of:
Percentagesof Direct
Ownership Carrying Amounts2018 2017 2018 2017
Subsidiaries: Regent Wise Investment Ltd. and Subsidiary
(Regent Wise) 100% 100% P=14,335,140,045 P=7,835,600,112 AyalaLand Hotels and Resorts Corporation and
Subsidiaries (AHRC) 100 100 12,680,432,000 10,856,932,000 Prime Orion Philippines, Inc. (POPI) 67 51 9,154,662,866 5,626,260,734 One Dela Rosa Property Development, Inc.
(ODR) 90 - 8,815,000,000 -Amaia Land Corporation and Subsidiary (Amaia) 100 100 7,006,931,640 7,006,931,640AyalaLand Offices, Inc. (ALO) 100 100 6,769,686,376 6,913,336,376Avida Land Corporation and Subsidiaries (Avida) 100 100 6,689,977,831 6,689,977,831Bay City Commercial Ventures Corp. (BCCVC) 100 100 4,939,087,324 2,466,076,875Cebu Holdings, Inc. and Subsidiaries (CHI) 70 72 4,392,171,631 4,039,411,704
AyalaLand Estates, Inc. (formerly SouthgatewayDevelopment Corp.) (SDC) 100 100 4,005,642,479 4,047,717,118
North Ventures Commercial Corp. (FairviewPrime) 100 100 3,904,145,284 4,094,145,284Summerhill E-Office Corporation (Summerhill) 100 100 2,978,700,000 2,623,700,000Alveo Land Corporation and Subsidiaries (Alveo) 100 100 2,677,613,403 2,677,613,403
North Triangle Depot Commercial Corporation(NTDCC) 73 73 2,640,805,402 2,640,805,402
ALI Capital Corp. 100 100 2,625,000,000 1,339,000,000
(Forward)

- 46 -
*SGVFS033960*
Percentagesof Direct
Ownership Carrying Amounts2018 2017 2018 2017
Arca South Commercial Ventures Corp. (ASCVC) 100% 100% P=2,310,500,000 P=1,367,302,500 BellaVita Land Corporation (BellaVita) 100 100 2,300,000,000 2,300,000,000
Amorsedia Development Corp. and Subsidiary(ADC) 100 100 2,274,943,627 2,274,943,627
Makati Cornerstone Leasing Corp. (MCLC) 100 100 2,213,961,000 2,213,961,000Capitol Central Commercial Ventures Corp.
(CCCVC) 100 100 2,156,642,500 1,641,642,500Ayalaland MetroNorth, Inc. (AMNI) 100 100 2,006,038,210 1,665,726,210Arvo Commercial Corporation (Arvo) 100 100 1,800,000,000 1,800,000,000Central Block Developers Inc. (CBDI) 45 45 1,495,017,000 871,325,000North Beacon Commercial Corporation (NBCC) 100 100 1,388,100,000 1,403,500,000North Eastern Commercial Corp. (formerly
Asterion Technopod Inc.) (ATI) 100 100 1,300,100,000 1,300,100,000Aurora Properties Incorporated (API) 80 80 1,199,997,664 1,199,997,664Cavite Commercial Town Centre, Inc. (CCTC) 100 100 1,154,160,793 999,540,793Roxas Land Corporation (RLC) 50 50 1,117,022,960 1,361,022,960Aviana Development Corporation (Aviana) 50 50 966,000,000 966,000,000Accendo Commercial Corp. (Accendo) 67 67 874,697,062 774,197,062Cagayan De Oro Gateway Corporation (CDOGC) 70 70 867,680,000 867,680,000Philippine Integrated Energy Solutions, Inc.
(PhilEnergy) 100 100 854,500,000 854,500,000Nuevo Centro, Inc. (Nuevo Centro) 54 54 819,223,620 819,223,620Laguna Technopark, Inc. (LTI) 20 75 800,000,000 30,229,290Soltea Commercial Corp. (Soltea) 60 60 796,416,740 796,416,740Makati Development Corporation and
Subsidiaries (MDC) 100 100 750,958,813 750,958,813Westview Commercial Ventures Corp.
(Westview) 100 100 745,429,824 592,672,116ALO Prime Realty Corporation 100 100 733,676,554 673,676,554Ecoholdings Company, Inc. (Ecoholdings) 100 100 718,368,400 718,368,400Ceci Realty, Inc. (Ceci) 60 60 699,785,665 699,785,665Whiteknight Holdings, Inc. (WHI) 100 100 693,925,952 693,925,952Prow Holdings, Inc. (Prow) 55 55 670,273,870 670,273,870Anvaya Cove Golf & Sports Club, Inc. (Anvaya
Cove Golf) 76 78 629,662,382 661,203,707Adauge Commercial Corporation (Adauge) 60 60 600,000,000 600,000,000ALI Makati Hotel Property, Inc. 20 20 584,702,865 584,702,865Vesta Property Holdings, Inc. (VPHI) 70 70 574,188,300 714,188,300Ayala Hotels, Inc. (AHI) 50 50 564,772,538 564,772,538Anvaya Cove Beach & Nature Club Inc. (Anvaya
Cove Beach) 73 73 527,834,847 530,938,546Subic Bay Town Centre, Inc. (SBTCI) 100 100 508,500,000 508,500,000Crans Montana Holdings, Inc. (CMHI) 100 100 505,329,030 505,329,030Ten Knots Development Corporation and
Subsidiaries (TKDC) 60 60 495,000,000 495,000,000Station Square East Commercial Corporation
(SSECC) 69 69 461,825,050 461,825,050Red Creek Properties, Inc. (RCPI) 100 100 431,511,128 431,511,128AyalaLand Commercial REIT, Inc. (ALCRI) 100 100 300,000,000 300,000,000Serendra, Inc. (Serendra) 28 28 266,027,100 266,027,100Alabang Commercial Corporation (ACC) 50 50 258,431,769 258,431,769Ayalaland Medical Facilities Leasing, Inc.
(AMFLI) 100 100 255,000,000 205,000,000BGWest Properties, Inc. (BG West) 50 50 250,000,000 250,000,000AMSI, Inc. (formerly Ayalaland Malls Synergies,
Inc.) (AMSI) 100 100 235,000,000 125,000,000Crimson Field Enterprises, Inc. (CFEI) 100 100 219,714,272 219,714,272
(Forward)

- 47 -
*SGVFS033960*
Percentagesof Direct
Ownership Carrying Amounts2018 2017 2018 2017
Southportal Properties, Inc. (Southportal) 65% 65% P=188,500,000 P=188,500,000Sunnyfield E-Office Corporation (Sunnyfield) 100 100 173,000,000 173,000,000First Longfield Investments Limited (FLIL) 100 100 167,923,610 167,923,610Arca South Integrated Terminal, Inc. 100 100 151,000,000 151,000,000Hillsford Property Corporation (HPC) 100 100 150,000,000 150,000,000Ayala Land International Sales, Inc. and
Subsidiary (ALISI) 100 100 138,700,000 138,700,000ALInet.com, Inc. (ALInet) 100 100 130,482,764 130,482,764ALI Commercial Center, Inc. (ACCI) 100 100 125,000,000 125,000,000Leisure and Allied Industries Philippines, Inc.
(LAIP) 50 50 106,300,000 106,300,000ALI-CII Development Corporation (ALI-CII) 50 50 102,765,300 102,765,300Ten Knots Philippines, Inc.and Subsidiaries
(TKPI) 60 60 93,131,600 93,131,600Primavera Towncentre, Inc. (PTI) 100 100 91,000,000 91,000,000Lagdigan Land Corp. (Lagdigan) 60 60 63,000,000 48,000,000Aprisa Business Process Solutions (Aprisa) 100 100 40,000,000 40,000,000DirectPower Services, Inc. (DirectPower) 100 100 40,000,000 40,000,000CMPI Holdings, Inc. (CMPI) 60 60 28,800,000 28,800,000ALI Makati Hotel & Residences, Inc. (AMHRI) 20 20 22,097,135 22,097,135Ayala Land Sales, Inc. (ALSI) 100 100 10,000,000 10,000,000AyalaLand Malls, Inc. (ALMI) 100 100 5,000,000 5,000,000Ayala Land Premier, Inc. (ALPI) 100 100 5,000,000 2,500,000Altaraza Prime Realty Corporation (Altaraza) 100 100 4,000,000 4,000,000Verde Golf Development Corp (Verde Golf) 100 100 3,125,000 3,125,000Buendia Landholdings, Inc. (BLI) 100 100 2,833,562 2,833,562Ayala Land Club Management, Inc. 100 100 2,500,000 2,500,000Ayala Property Management Corporation
(APMC) 100 100 1,912,026 1,912,026Ayala Theatres Management, Inc. (ATMI) 100 100 864,559 864,559Next Urban Alliance Development Corp. 100 100 365,500 62,500Five Star Cinema, Inc. (FSCI) 100 100 250,000 250,000Regent Time International, Limited (Regent Time) 100 100 52 52
Joint Ventures:ALI-ETON Property Development Corporation 50 50 2,176,000,000 642,000,000AKL Properties, Inc. (AKL) 50 - 1,959,687,075 -Emerging City Holdings, Inc. (ECHI) 50 50 1,555,004,550 1,555,004,550Cebu District Property Enterprise, Inc. (CDPEI) 35 35 1,050,000,000 1,050,000,000Berkshires Holdings, Inc. (BHI) 50 50 666,430,521 666,430,521
Associates:OHI 21 21 7,190,241,828 7,190,241,828BLC 10 5 346,881,162 346,881,015Lagoon Development Corporation (LDC) 30 30 37,050,000 37,050,000
151,818,762,060 120,163,979,142 Less allowance for probable losses 319,959,706 319,959,706
P=151,498,802,354 P=119,844,019,436
The above companies are domestic except for Regent Time which is domiciled and incorporated inBritish Virgin Islands and FLIL and Regent Wise which are domiciled and incorporated in Hong Kong.
As of December 31, 2018, and 2017, the Parent Company had no commitments to its interests in jointventures.
Investment in Regent WiseIn 2015 and 2014, the Parent Company’s additional investments amounted to P=6,096.5 million andP=208.4 million, respectively, which increased the total investment in Regent Wise to P=7,835.6 milllionand P=1,739.1 million, respectively.

- 48 -
*SGVFS033960*
On April 6, 2015, Regent Wise has acquired 9.2% of the shares of Modular Construction Technology(MCT) Bhd. (formerly Malaysian company GW Plastics Holdings Bhd.), through a private placementfor a total amount of US$43.0 million or P=1.9 billion. MCT Bhd., first established in 1999 as aconstruction company, is a property development company specializing in mixed-use projects thatinclude retail, office, hotel, and mid- to affordable residential. MCT Bhd. is able to deliver projects atlower costs by adhering to a modular construction technique and by being an integrated builder withan in-house design team, inhouse trading company, direct execution of specialist works and its ownpre-cast and ready-mixed concrete plants.
In May 2015, Regent Wise entered into call option agreements with the two founders and majorityshareholders of MCT, Barry Goh Ming Choon and Tong Seech Wi, that will give Regent Wise theopportunity to increase its shareholdings in MCT up to a maximum of 33.0%. Then, onOctober 15, 2015, Regent Wise exercised its option to acquire additional shares of Malaysiandevelopment and construction company, MCT, Bhd. (MCT) for a total cost of US$92 million to bringits total shareholding from 9.2% to 33.0%. The increase in stake will provide the Parent Companywith the opportunity to establish a stronger foothold in the Real Estate sector in Malaysia.
On January 2, 2018, Regent Wise signed a share purchase agreement to acquire an additional17.24% share in MCT from Barry Goh Ming Choon for a total cost of RM202.5 million which broughtRegent Wise’s shareholding in MCT from 33.0% to 50.2%. Subsequently, Regent Wise conducted amandatory take-over offer (MO) from the period January 26 to February 19, 2018 in accordance withthe laws of Malaysia. Acceptances for 295,277,782 shares were received from the MO equivalent to22.1% that increased Regent Wise’s ownership stake to 72.1% as of February 19, 2018.
In March 2018, the Irredeemable Convertible Unsecured Loan Stock of Dato Sri Tong and Tan SriBarry Go, founders of MCT, were converted into 122,218,357 shares. This resulted in a 6.1% dilutionof Regent Wise’s stake in MCT as of date of share issuance. As such, the current ownership stake ofRegent Wise in MCT is 66.3%.
Due to the acquisition of additional MCT shares, the Parent Company made additional cash infusionsto Regent Wise amounting to P=6,499.5 million in 2018. As of December 31, 2018 and 2017, theinvestment in Regent Wise amounted to P=14,335.1 million and P=7,835.6 million, respectively.
Investment in AHRCIn 2010, the Parent Company established AHRC to support the Parent Company’s hotel and resortbusiness. The Parent Company subscribed to all common and preferred shares issued at a totalconsideration of P=1.2 billion.
In 2018 and 2017, the Parent Company made additional infusions amounting to P=1,823.5 million andP=2,750.5 million, respectively. As of December 31, 2018, and 2017, the Parent Company’sinvestment amounted to P=12,680.4 million and P=10,856.9 million, respectively.
Investment in POPIOn February 24, 2016, ALI and POPI executed a Deed of Subscription and Supplement to theDeed of Subscription whereby the Parent Company subscribed to 2.5 billion of common shares ofPOPI stock at P=2.25 per share or representing 51.4% of the total outstanding shares of POPI to betaken out of the increase in capital stock of POPI. On July 4, 2016, SEC approved such increase inPOPI and issued a Certificate of Increase in Capital Stock.
In February 2017, ALI purchased additional 631,000 common shares of POPI from BPI SecuritiesCorporation for P=1.3 million. ALI’s interest remains at 51.0% of the total POPI’s outstanding capitalstock.

- 49 -
*SGVFS033960*
In 2018, ALI’s 75.0% equity interest in LTI was exchanged into additional shares of stock in POPIamounting to P=3,030.8 million. The acquisition resulted to LTI becoming a subsidiary of POPI. TheParent Company also purchased additional investment from Genez Investment Corporationamounting to P=497.7 million increasing its investment to P=9,154.7 million and its interest to 67.0%.
Investment in ODRODR is a wholly-owned subsidiary of ALO, which is involved in leasing office and commercial spaces.In October 2018, ODR increased its authorized capital stock by 881,500,000 shares which weresubsequently acquired by ALI for P=8,815.0 million, resulting to a 90.0% ownership in ODR.
Investment in ALOOn July 18, 2014, the Board of Directors (BOD) and the stockholders of APPCo approved the changeof its corporate name to AyalaLand Offices, Inc (ALO). On October 17, 2014, the amended Articles ofIncorporation was executed and subsequently approved by SEC on November 18, 2014. In 2015,the Parent Company made additional infusions amounting to P=3,270.5 million increasing itsinvestment cost to P=7,200.6 million as of December 31, 2015. In 2018 and 2017, the ParentCompany redeemed preferred shares amounting to P=143.65 million for each year, decreasing itsinvestment cost to P=6,769.7 million and P=6,913.3 million as of December 31, 2018 and 2017.
Investment in BCCVCBay City Commercial Ventures Corp. was incorporated on November 3, 2017. BCCVC is a whollyowned subsdiary which was organized primarily for the development of Ayala Malls Bay City. TheParent Company made capital infusions for a total cost 2,473.0 million in 2018 which increased theParent Company’s investment to P=4,939.1 million and P=2,446.1 million as of December 31, 2018 and2017, respectively.
Investment in CHIIn 2017, ALI purchased additional 97,763,900 common shares of CHI from BPI SecuritiesCorporation totaling P=575.0 million which brought up ALI ownership to 72.0% of the total outstandingcapital stock of CHI.
In 2018, ALI acquired additional 59,631,200 common shares of CHI totaling to P=352.8 million.Further, an additional 77,742,516 shares was acquired as a result of swap of CPVDC shares for atotal consideration of P=229.3 million which brings Parent Company’s ownership to 70.4%.
As of December 31, 2018 and 2017, the investment in CHI amounted to P=4,392.2 million andP=4,039.4 million, respectively.
Investment in Fairview PrimeOn July 31, 2014, the Board of Directors and stockholders of Fairview Prime Commercial Corp.approved the amendment of Fairview Prime’s Articles of Incorporation to change its name to NorthVentures Commercial Corp. The Amendment was subsequently approved by the SEC onDecember 3, 2014.
In 2015 and 2014, the Parent Company made additional investments amounting to P=145.9 millionand P=2,515.9 million, respectively in Fairview Prime. As of December 31, 2015 and 2014, the ParentCompany’s investment amounted to P=4,264.1 million and P=1,748.3 million, respectively.
In 2018 and 2017, the Parent Company’s investment in preferred shares of Fairview Prime amountingto P=190.0 million and P=120.0 million was redeemed, which decreased the Parent Company’s totalinvestment in Fairview Prime to P=3,904.1 million and P=4,094.1 million as of December 31, 2018and 2017, respectively.

- 50 -
*SGVFS033960*
Investment in SummerhillIn 2018 and 2017, the Parent Company made additional capital infusions for a total cost ofP=355.0 million and P=462.7 million, respectively which increased the Parent Company’s investment toP=2,978.7 million and P=2,623.7 million as of December 31, 2018 and 2017, respectively.
Investment in ALI Capital Corp.In 2018, the Parent Company converted its intercompany receivable from ALI Capital Corp to equitysecurities amounting to P=1,286 million increasing its investment. The carrying amount of the ParentCompany’s investment is P=2,399.1 million, net of impairment amounting to P=225.9 million as ofDecember 31, 2018.
Investment in ASCVCArca South Commercial Ventures Corp., a wholly owned subsidiary, was incorporated onNovember 16, 2017 for the development of Ayala Malls Arca South. The Parent Company’sinvestment amounted to P=1,367.3 million as of December 31, 2017.
In 2018, the Parent Company funded a construction which amounted to P=943.2 million increasing itsinvestment to P=2,310.5 million as of December 31, 2018
Investment in CCCVCCapitol Central Commercial Ventures Corp., a wholly-owned subsidiary was incorporated onDecember 4, 2017 for the development of Ayala Malls Capitol Central. In 2018, the Parent Companymade additional investment of P=515.0 million increasing its investment cost to P=2,156.6 million as ofDecember 31, 2018.
Investment in AMNIAMNI was incorporated in November 29, 2012 and is a wholly owned subsidiary of the ParentCompany. It is established primarily to develop and operate shopping malls and offices.
In 2015, the Parent Company made additional investment amounting to P=1,179.2 million increasingits investment cost to P=1,665.7 million as of December 31, 2017.
In 2018, the Parent Company made subscription amounting to P=340.3 million increasing itsinvestment cost to P=2,006.0 million as of December 31, 2018.
Investment in CBDICBDI is a subsidiary of the Parent Company with pro-rata ownership of the ALI Parent Company’sCebu Companies, CPVDC and CHI. The project of CBDI is called Central Bloc and is located at thecore of Cebu IT Park. The development includes two BPO towers, an Ayala branded hotel, and a 5-storey mall. On July 28, 2015, CBDI was registered in SEC. CBDI was organized to develop, sell,invest, own, acquire, lease, hold, mortgage, administer, or otherwise deal with commercial,residential, industrial, or agricultural lands, buildings, structures or apertures, or in any other profitablebusiness enterprise, venture or establishment, including to own, hold in ownership, manage deal andengage in the general business of a hotel, apartment hotel, inn, resort, restaurant, café, bar,entertainment and other allied businesses and to the limit and extent permitted by law, alone or jointlywith other persons, natural or artificial.
In 2018 and 2017, the Parent Company made additional infusion amounting to P=623.7 million andP=608.8 million, respectively. The carrying amount of Parent Company’s investment in CBDIamounted to P=1,495.0 million and P=871.3 million as of December 31, 2018 and 2017, respectively.
Investment in NBCCIn 2008, the Parent Company, through NBCC and as part of its ongoing development in North Luzon,started to develop a 70,000 square meter retail center dubbed as “The MarQuee” mall located inAngeles City, Pampanga.

- 51 -
*SGVFS033960*
In 2015, the Parent Company made additional infusion amounting to P=910.0 million and redeemedP=21.0 million of its preferred shares. The carrying amount of the Parent Company’s investmentamounted to P=1,580.0 million as of December 31, 2015.
In 2017 and 2016, the Parent Company redeemed P=131.0 million and P=45.5 million of its preferredshares which decreased the total cost of its investment to P=1,403.5 million and P=1.534.5 million as ofDecember 31, 2017 and 2016.
In 2018, the Parent Company redeemed P=15.4 million of its preferred shares which decreased thetotal cost of its investment to P=1,388.1 million as of December 31, 2018.
Investment in ATIAsterion Technopod Inc., a wholly-owned subsidiary was incorporated on July 8, 2008. ATI wasorganized to manage the operations of the commercial businesses in the northeast area of MetroManila.
On August 16, 2016, the Board of Directors and stockholders of Asterion Technopod, Inc. approvedthe amendment of ATI’s Articles of Incorporation to change its name to North Eastern CommercialCorp. The Amendment was subsequently approved by the SEC on September 29, 2017.
In 2017, the Parent Company made additional infusions amounting to P=1,218.8 million whichincreased the Parent Company’s investment amount to P=1,300.1 million as of December 31, 2018and 2017.
Investment in CCTCIn 2015, the Parent Company made additional infusions amounting to P=682.7 million. The ParentCompany’s investment amount is P=1,086.1 million as of December 31, 2015.
In 2018 and 2017, the Parent Company redeemed P=30.0 million and P=31.0 million of its preferenceshares, respectively. Also, in 2018, the Parent Company made an additional infusion of P=184.6 millonthus increasing its investment to P= 1,154.1 million and P=999.5 million as of December 31, 2018and 2017, respectlively.
Investment in RLCIn 2018, the Parent Company’s investment in preferred shares of RLC amounting to P=244 million wasredeemed, which decreased the Parent Company’s total investment in RLC to P=1,117 million as ofDecember 31, 2018.
Investment in AccendoIn November 2018, ALI invested P=100.5 million in exchange for 10,050,000 common shares and90,450,000 preferred shares of Accendo increasing its investment to P=874.7 million in 2018.
Investment in LTIOn April 30, 2018, ALI and POPI executed a Deed of Exchange where ALI will subscribe to1,225,370,620 common shares of POPI for an aggregate subscription price of P=3.0 billion inexchange for its 30,186 common shares of LTI equivalent to 75% ownership.
In December 2018, ALI acquired 8,051 common shares of LTI for P=800.0 million which is equivalentto a 20.0% ownership.
Investment in WestviewIn 2017, the Parent Company redeemed P=15.0 million of its investment in preferred shares inWestview, which decreased the Parent Company’s total investment to P=592.7 million as ofDecember 31, 2017.
In 2018, the Parent Company made additional infusion amounting to P=152.8 million increasing itsinvestment which amounted to P=745.4 million.

- 52 -
*SGVFS033960*
Investment in ALO Prime Realty CorporationIn 2018 and 2017, the Parent Company made additional infusion amounting to P=60 million andP=160.0 million which increased the total cost of its investment to P=733.7 million and P=673.7 million asof December 31, 2018 and 2017,respectively.
Investment in Anvaya Cove GolfIn 2016, the Parent Company reclassified its Investment in Anvaya Cove Golf to investment insubsidiaries, associates and joint ventures in compliance with Philippine Interpretations Committee(PIC) Q&A 2016-02 PAS 32 and PAS 38 – Accounting Treatment of Club Shares Held by an Entity.As of December 31, 2018 and 2017, the Parent Company’s investment amounted to P=629.7 millionand P=661.2 million.
Investment in VPHIIn 2018 and 2017, the Parent Company’s investment in preferred shares of VPHI was redeemedamounting to P=140.0 million and P=420.0million, respectively. This decreased its investment in VPHI toits carrying amount of P=574.2 million and P=714.2 million as of December 31, 2018 and 2017,respectively.
Investment in Anvaya Cove BeachIn 2016, the Parent Company reclassified its Investment in Anvaya Cove Beach to investment insubsidiaries, associates and joint ventures in compliance with Philippine Interpretations Committee(PIC) Q&A 2016-02 PAS 32 and PAS 38 – Accounting Treatment of Club Shares Held by an Entity.As of December 31, 2018 and 2017, the Parent Company’s investment amounted to P=527.8 millionand P=530.9 million.
Investment in AMFLIAyalaland Medical Facilities Leasing, Inc. is a wholly owned subsidiary of the Parent Company. Itwas incorporated with SEC on April 13, 2015 to engage primarily in developing and lease of Built-to-suit structure for AMFLI’s hospital operations and retail.
In 2018, the Parent Company made additional infusion amounting to P=50.0 million. The carryingamount of Parent Company’s investment amounted to P=255.0 million as of December 31, 2018.
Investment in AMSIAMSI is a wholly owned subsidiary that was incorporated on June 1, 2016. AMSIwill house the Commercial Business Parent Company’s allied businesses such as but not limited tothe partnership with Meralco, LED, and operation of upcoming mall’s foodcourt. As ofDecember 31, 2016, investment in AMSI amounted to P=62.5 million.
On December 23, 2016, the Board of Directors and stockholders of AMSI approved the amendmentof its Articles of Incorporation to change its name to AMSI, Inc. The Amendment was subsequentlyapproved by the SEC on April 7, 2017.
In 2017, the Parent Company made additional infusion amounting to P=62.5 million increasing itsinvestment to P=125.0 million as of December 31, 2017.
In 2018, the Parent Company made additional capitalization amounting to P=110.0 million increasingits investment to P=235.0 million as of December 31, 2018.
Investment in FLIL and ARCH EntitiesIn 2006, the Parent Company and AC entered into a Shareholders’ Agreement with ARCH Capitaland Great ARCH Co. Limited, wherein the Parent Company and AC committed to invest a total ofUS$75.0 million in a private equity fund that will explore property markets in Asia, excluding Japanand Philippines. In the same year, an Amendment and Adherence Agreement was entered into bythe same parties, together with Fine State Parent Company Limited (Fine State) and Green HorizonsHoldings Limited (Green Horizons), a wholly owned subsidiary of FLIL, transferring the interests ofAC and the Parent Company in ARCH Capital into Fine State and Green Horizons, respectively. Fine

- 53 -
*SGVFS033960*
State and Green Horizons are wholly owned Hong Kong subsidiaries of AC and the Parent Company,respectively.
The Parent Company (through Green Horizons) and AC (through Fine State) both have interests inthe fund management company, ARCH Capital, which is tasked to raise third party capital and pursueinvestments for the private equity fund called ARCH Asian Partners, L.P. (Fund). As ofDecember 31, 2015 and 2014, the Parent Company (through Green Horizon) and AC (through FineState) owned a combined interest in ARCH Capital of 50%.
In 2012, the Parent Company’s investment over the Fund was reclassified from associate to FVPL.The Parent Company lost significant influence over the Fund since its investments pertain tomonetary interest and no longer equity interest.
As of December 31, 2015 and 2014, the Parent Company’s remaining capital commitment with theFund both amounted to nil.
In 2017, the Parent Company reversed the impairment of the investment which amounted toP=36.4 million. The carrying amount of the Parent Company’s investment amounted to P=167.9 millionas of December 31, 2018 and 2017.
Investment in LagdiganLagdigan Land Corp. (Lagdigan) is a 60:40 joint venture between the Parent Company and AC. Itwas incorporated on March 17, 2014 and its main purpose is to develop Laguindingan’s500-hectare property owned by AC. The vision is to develop it as a mixed-use area that will be theprimary growth area in Misamis Oriental. As of December 31, 2015 and 2014, investment inLagdigan amounted to P=12.0 million.
In 2017, the Parent Company made additional infusion amounting to P=36.0 million, equivalent to1,800,000 common shares and 16,200,000 preferred shares, increasing its investment toP=48.0 million as of December 31, 2017.
In 2018, the Parent Company made additional infusion amounting to P=15.0 million increasing itsinvestment which amounted to P=63.0 million as of December 31, 2018.
Investment in AMHRIIn December 2007, the Parent Company entered into a joint venture with Kingdom Hotel Investments,Inc. (KHI) to develop a 7,377-square meter property along Makati Avenue corner Arnaiz Avenue(formerly Pasay Road) into a luxury hotel complex comprising of a 300-room Fairmont Hotel,a 30-suite Raffles Hotel and 189 Raffles branded private residences.
The 7,377-square meter property developed was conveyed by the Parent Company to KAMI inexchange for 37,250 common shares, 38,250 redeemable preferred shares A and 16,758 preferredshares.
As of December 31, 2018 and 2017, the Parent Company’s investment in AMHRI amounted toP=22.1 million.
Investment in ALPIAyalaLand Premier, Inc., is a wholly owned subsidiary which was registered with the SEC onJuly 7, 2017 to engage primarily in general contracting services. In 2018, the Parent Company madeadditional infusion amounting to P=2.5 million thus increasing its investment from P=2.5 million inDecember 31, 2017 to P=5 million as of December 31, 2018.

- 54 -
*SGVFS033960*
Investment in ALI-ETON Property Development CorporationALI-ETON Property Development Corporation was incorporated on March 13, 2016. The companyis a joint venture between Ayala Land, Inc. and LT Parent Company, Inc. The ALI and LT ParentCompany, Inc. entered into an agreement on January 21, 2016 to jointly develop a project along theC5 corridor. The project is envisioned to be a township development that spans portions of Pasig Cityand Quezon City.
In 2018 and 2017, ALI made additional infusions amounting to P=1,534.0 million and P=622.0 million,respectively. The Parent Company’s investment amounted to P=2,176.0 and P=642.0 million as ofDecember 31, 2018 and 2017.
Investment in AKLIn 2018, the Parent Company invested P=1,959.7 million in AKL, which is a 50:50 joint venturebetween Ayala Land, Inc. and Royal Asia Land, Inc., and is organized primarily for future mixed-usedevelopment in South Luzon area.
Investment in ECHI, BHI and BLCOn April 17, 2003, the following transactions have been consummated pursuant to the terms andconditions of the Assignment Agreement (Agreement), dated February 8, 2003, among the ParentCompany, Evergreen Holdings, Inc. (EHI), Greenfield Development Corporation (GDC) and Larouge,B.V. (Larouge), as amended, and the Agreement, dated November 23, 2002, among the ParentCompany, EHI and Metro Pacific Corporation (MPC) as amended:
(a) The assignment to the Parent Company and EHI of the rights and obligations of Larouge underthe loan agreement between Larouge and MPC, pursuant to which, Larouge extended MPC aloan in the principal amount of US$90 million, together with all the rights, title and interests ofLarouge in the pledge constituted on 50.38% of the outstanding shares in BLC. Theconsideration paid by the Parent Company and EHI for such assignment was approximatelyUS$90 million, subject in part to foreign exchange adjustment.
(b) The assignment to the Parent Company and EHI acting in this instance through the joint venturecorporation, Columbus Holdings, Inc. (Columbus) of the controlling interest in BLC represented50.38% of BLC’s outstanding capital stock. This assignment was effected by MPC under adacion en pago arrangement, and included an assignment of payables of BLC in the principalamount of P=655.0 million together with its underlying security in the form of shares in FortBonifacio Development Corporation (FBDC) representing 5.6% of its outstanding capital stock.
The Agreement, as amended, also provides for the constitution of a pledge over 5.0% of BLC’sunencumbered shares as a security for contingent liabilities and breach of representation andwarranties. The pledge lien over the 5% BLC shares shall continue to subsist until the thirdanniversary of the closing date.
The Parent Company and EHI jointly hold the 50.4% equity interest in BLC through ECHI and BHI.The Parent Company and EHI assigned the notes receivable from MPC to ECHI and BHI, whichacquired the shares of stock of Columbus. Columbus directly owns the 50.4% interest in BLC. BLCowns 55% interest in FBDC, the primary developer of certain areas in Fort Bonifacio Global City forresidential, commercial and business development.
Columbus accounted for the acquisition of the 50.38% interest in BLC using the purchase method,resulting in a negative goodwill of P=1.4 billion.
The Parent Company and EHI acquired additional shares of BLC in 2009 and 2008 through acombination of direct acquisition and through Columbus at varying dates as follows:
∂ On July 31, 2008, the Parent Company acquired, through Regent and Columbus, additional4,360,178 shares of BLC from FBDC amounting to P=689.0 million, equivalent to 7.7% ownershipin BLC.

- 55 -
*SGVFS033960*
∂ In January and October 2009, a total of 2,295,207 BLC shares were acquired from DevelopmentBank of the Philippines and MPC, pertaining to the pledged shares, through Columbus amountingto P=362.6 million. In 2011, BLC redeemed its 3,485,050 preferred shares with an aggregateredemption price of P=500.0 million.
∂ In 2011, BLC redeemed its preferred shares amounting to P=48.2 million. In 2012, the ParentCompany invested additional P=50.5 million. As of December 31, 2015 and 2014, the ParentCompany’s interest in BLC amounted to P=373.5 million.
Investment in CDPEICebu District Property Enterprise, Inc. (CDPEI) was incorporated on February 20, 2014 and is a50:50 joint venture between the Parent Company and Aboitiz Land, Inc. CDPEI’s main purpose is tocreate a mixed-use commercial and residential district with the 15.4 hectare property in Subangdaku,Mandaue.
On April 11, 2014, ALI’s 50% equity was further broken down to 35% ALI and 15% CHI. As ofDecember 31, 2018 and 2017, the Parent Company’s interest in CDPEI amounted toP=1,050.0 million.
Investment in LDCIn 2016, the Parent Company redeemed P=7.2 million of investment in LDC decreasing the total costof investment amounting to P=37.05 million as of December 31, 2018 and 2017.
11. Investment Properties
The rollforward analysis of this account follows:
2018
Land BuildingsConstruction
in Progress TotalCostBalance at beginning of year P=53,404,379,135 P=31,179,084,229 P=12,843,281,476 P=97,426,744,840Additions 3,941,489,863 1,825,785,453 12,622,417,748 18,389,693,064Transfers (Notes 7) (6,865,915,301) 77,954,210 (77,576,360) (6,865,537,451)Disposals (1,110,822,122) – (7,376,505,810) (8,487,327,932)Balance at end of year 49,369,131,575 33,082,823,892 18,011,617,054 100,463,572,521Accumulated depreciationBalance at beginning of year – 10,673,185,915 – 10,673,185,915Depreciation (Note 21) – 1,024,424,566 – 1,024,424,566Transfers – – – −Balance at end of year – 11,697,610,481 – 11,697,610,481Accumulated impairment lossesBalance at beginning and end
of year 102,825,482 − − 102,825,482Net Book Value P=49,266,306,093 P=21,385,213,411 P=18,011,617,054 P=88,663,136,558

- 56 -
*SGVFS033960*
2017 (as restated, see Note 2)
Land BuildingsConstruction
in Progress TotalCostBalance at beginning of year P=54,491,077,545 P=24,685,074,329 P=26,389,626,219 P=105,565,778,093Additions 1,899,794,035 1,447,000,598 15,537,156,158 18,883,950,791Transfers (Notes 7 and 12) (2,638,095,149) 5,047,009,302 (5,269,551,672) (2,860,637,519)Disposals (348,397,296) – (23,813,949,229) (24,162,346,525)Balance at end of year 53,404,379,135 31,179,084,229 12,843,281,476 97,426,744,840Accumulated depreciationBalance at beginning of year – 9,879,297,809 – 9,879,297,809Depreciation (Note 21) – 791,434,966 – 791,434,966Transfers (Note 12) – 2,453,140 – 2,453,140Balance at end of year – 10,673,185,915 – 10,673,185,915Accumulated impairment lossesBalance at beginning of year 151,825,482 − − 151,825,482Reversal (49,000,000) − − (49,000,000)Balance at end of year 102,825,482 − − 102,825,482Net Book Value P=53,301,553,653 P=20,505,898,314 P=12,843,281,476 P=86,650,733,443
On January 1, 2018, the Parent Company adopted PIC Q&A 2018-11, Classification of Land by RealEstate Developer. Land and improvements previously presented as non-current asset includes landwhich the Board of Directors has previously approved to be developed into residential developmentfor sale. Before the adoption of PIC Q&A 2018-11, the classification was based on the ParentCompany’s timing to start the development of the property. Land with undetermined future use wasreclassified to Investment Properties (see Note 2).
Certain parcels of land are leased to several individuals and corporations. Some of the leasecontracts provide, among others, that within a certain period from the expiration of the contracts, thelessee will have to demolish and remove any and all improvements (such as buildings) introduced orbuilt within the leased properties. Otherwise, the lessor will cause the demolition and removal thereofand charge the cost to the lessee unless the lessor occupies and appropriates the same for its useand benefit.
Construction in progress (CIP) pertain to buildings under construction to be leased as retail and officespaces upon completion. The remaining CIP in 2018 mainly pertains to the ongoing construction ofVertis Towers and Seda Hotels which are expected to be completed in 2020.
On October 5, 2018, the Parent Company sold at cost to One Dela Rosa Properties, Inc. (ODRPI), awholly-owned subsidiary, the Ayala North Exchange BPO and Mall which is still under constructionlocated along Ayala Avenue, Makati City. The carrying value of the parcels of land and buildingsamounted to P=6,012.8 million.
The aggregate fair value of the Parent Company’s investment properties amounted toP=217,179.8 million and P=174,827.6 million as of December 31, 2018, and 2017, respectively.
The fair value of the investment properties was determined by independent professionally qualifiedappraisers.

- 57 -
*SGVFS033960*
The following table provides the fair value hierarchy of the Parent Company’s investment propertiesas of December 31, 2018 and 2017:
2018Fair value measurement using
Date ofValuation Total
Quoted pricesin activemarkets(Level 1)
Significantobservable
inputs(Level 2)
Significantunobservable
inputs(Level 3)
Land properties Various P=186,380,399,739 P=– P=– P=186,380,399,739Office properties Various 19,187,659,074 – – 19,187,659,074Retail properties Various 11,611,761,976 – – 11,611,761,976
2017Fair value measurement using
Date ofValuation Total
Quoted pricesin activeMarkets
(Level 1)
Significantobservable
Inputs(Level 2)
Significantunobservable
Inputs(Level 3)
Land properties Various P=124,562,841,036 P=– P=– P=124,562,841,036Retail properties Various 21,479,066,372 – – 21,479,066,372Office properties Various 28,785,682,172 – – 28,785,682,172
The values of the land and buildings were arrived at using the Market Data Approach. Market DataApproach provides an indication of value by comparing the subject asset with identical or similarassets for which price information is available. This approach was used as it is commonly used in theproperty market since inputs and data for this approach are available. For Market Data Approach, thehigher the price per sqm., the higher the fair value.
The significant unobservable inputs to valuation of investment properties ranges from P=6,617 toP=30,793 per sqm.
Rental income from investment properties amounted to P=4,061.9 million and P=3,842.6 million in 2018and 2017, respectively (see Note 20). Direct operating expenses arising from the investmentproperties amounted to P=2,687.5 million and P=1,697.8 million in 2018 and 2017, respectively(see Note 21).
Depreciation expense pertaining to investment properties amounted to P=1,024.4 million andP=791.4 million in 2018 and 2017, respectively (see Note 21).
In 2018 and 2017, the gain on sale of Investment properties amounted to nil and P=389.0 million,respectively, included under “Other income” in the parent company statements of income(see Note 21).

- 58 -
*SGVFS033960*
12. Property and Equipment
The rollforward analysis of this account as of December 31 follows:
2018
Land,Buildings andImprovements
Furniture,Fixtures
and OfficeEquipment
TransportationEquipment Total
CostBalance at beginning of year P=840,752,086 P=1,538,492,793 P=448,527,120 P=2,827,771,999Additions 202,585,568 168,597,398 61,163,714 432,346,680Disposals – (242,813) (26,937,030) (27,179,843)Balance at end of year 1,043,337,654 1,706,847,378 482,753,804 3,232,938,836Accumulated depreciationBalance at beginning of year 442,773,659 1,249,345,816 306,663,357 1,998,782,832Depreciation (Note 21) 49,819,549 74,536,788 65,620,712 189,977,049Disposals − (4,030,428) (18,785,329) (22,815,757)Balance at end of year 492,593,208 1,319,852,176 353,498,740 2,165,944,124Net Book Value P=550,744,446 P=386,995,202 P=129,255,064 P=1,066,994,712
2017
Land,Buildings and
Improvements
Furniture,Fixtures
and OfficeEquipment
TransportationEquipment Total
CostBalance at beginning of year P=771,705,868 P=1,417,576,253 P=454,416,772 P=2,643,698,893Additions 77,702,807 122,136,509 78,976,994 278,816,310Transfers (Note 11) (8,656,589) (1,219,969) – (9,876,558)Disposals – – (84,866,646) (84,866,646)Balance at end of year 840,752,086 1,538,492,793 448,527,120 2,827,771,999Accumulated depreciationBalance at beginning of year 393,813,620 1,164,162,515 317,316,718 1,875,292,853Depreciation (Note 21) 50,715,101 85,881,379 62,550,535 199,147,015Transfers (Note 11) (1,755,062) (698,078) − (2,453,140)Disposals − – (73,203,896) (73,203,896)Balance at end of year 442,773,659 1,249,345,816 306,663,357 1,998,782,832Net Book Value P=397,978,427 P=289,146,977 P=141,863,763 P=828,989,167
In 2018 and 2017, the gain on sale of Property plant and equipment amounted to P=20.3 million andP=34.8 million, respectively, included under “Other income” in the parent company statements ofincome (see Note 21).
Depreciation of property and equipment included in the general and administrative expensesamounted to P=190.0 million and P=199.1 million in 2018 and 2017, respectively (see Note 20). Nointerest was capitalized in 2018 and 2017 (see Note 21).
13. Other Noncurrent Assets
Other noncurrent assets totaling P=4,202.8 million and P=5,707.4 million as of December 31, 2018 and2017, respectively, consist of deferred charges, deposits, project costs, and other assets.
2018January 1, 2018
(As restated)Advances to contractors P=1,411,252,859 P=1,951,620,540Deposit on land purchases 946,399,671 1,652,162,983Deferred charges 253,175,293 272,222,912Recoverable deposits 209,404,293 205,901,478Project costs 59,226,375 55,850,017Other assets 1,323,357,791 1,569,658,930
P=4,202,816,282 P=5,707,416,860

- 59 -
*SGVFS033960*
Advances to contractors represents prepayments for the construction of investment properties andproperty and equipment. On January 1, 2018, the Parent Company adopted PIC Q&A 2018-15,PAS 1-Classification of Advances to Contractors in the Nature of Prepayments: Current vs. Non-current. Advances to contractors and suppliers previously presented as current assets, representingprepayments for the construction of investment property were reclassified to non-current assets
Deferred charges and project costs consist of project costs incurred for unlaunched projects of theGroup, advance rental payments, noncurrent prepaid management fees, commissions andadvertising and promotions
Recoverable deposits pertain to various utility deposits and security deposits for leases.
Other assets pertain to prepayments for expenses that is amortized for more than one year.
14. Contract Balances and Cost to Obtain a Contract
Contract assets and liabilities
As of December 31, 2018, the account consists of the following:
Current Noncurrent TotalContract asset P=10,608,729,457 P=7,953,482,357 P=18,562,211,814Contract liabilities 10,476,250,868 3,143,547,293 13,619,798,161
Contract assets are initially recognized for revenue earned from real estate sales as receipt ofconsideration is conditional on successful completion of installation. Upon completion of performanceobligation and acceptance by the customer, the amounts recognized as contract assets arereclassified to trade residential and office development receivables.
Contract liabilities consist of collections from real estate customers which have not reached the 10%threshold to qualify for revenue recognition and excess of collections over the recognized receivablesand contract assets based on percentage of completion.
There is no allowance for ECLs on contract assets as of December 31, 2018.
As of December 31, 2018, nominal amount of contract assets from residential and office developmentamounting to P=24,760.0 million was recorded initially at fair value. The fair values of the contractassets were obtained by discounting future cash flows using the applicable rates of similar types ofinstruments.
Movements in the unamortized discount of the Parent Company’s contract assets as ofDecember 31, 2018 follow:
2018Balance at beginning of year P=2,907,162,426Additions during the year 4,992,013,012Accretion for the year (Note 20) (1,701,410,613)Balance at end of year P=6,197,764,825
The Parent Company sold contract assets on a without recourse basis to partner mortgage banks,which include BPI Family savings bank, a related party, totaling to P=7,391.5 million in 2018 andP=1,214.7 million in 2017. These were sold at discount with total proceeds of P=6,933.3 million andP=1,137.5 million, respectively. The Parent Company recognized loss on sale (under “Interest andother financing charges”) amounting to P=458.1 million and P=76.6 million in 2018 and 2017,respectively.

- 60 -
*SGVFS033960*
The amount of revenue recognized from amounts included in contract liabilities at the beginning ofthe year amounted to P=6,777.5 million.
Cost to Obtain a ContractThe balances below pertains to the cost to obtain contracts included in the other current andnoncurrent assets (see Notes 8 and 13):
2018Balance at the beginning of year P=498,934,848Additions 1,265,950,160Amortization (Note 21) (1,145,995,148)Balance at the end of year P=618,889,860
In line with the Parent Company's accounting policy, as set out in Note 2, if a contract or specificperformance obligation exhibited marginal profitability or other indicators of impairment, judgementwas applied to ascertain whether or not the future economic benefits from these contracts weresufficient to recover these assets. In performing this impairment assessment, management isrequired to make an assessment of the costs to complete the contract. The ability to accuratelyforecast such costs involves estimates around cost savings to be achieved over time, anticipatedprofitability of the contract, as well as future performance against any contract-specific keyperformance indicators that could trigger variable consideration, or service credits.
15. Accounts and Other Payables
This account consists of:
2018 2017Accounts payable P=49,904,374,467 P=27,759,408,044Payable to related parties (Note 23) 17,629,693,407 11,637,100,944Accrued expenses Salaries and employee benefits 4,522,149,050 4,217,910,395 Project costs 2,606,919,785 1,930,230,638 Utilities 1,107,954,717 1,101,542,206 Commissions 1,047,140,810 1,124,298,951 Professional and management fees 936,518,992 1,422,148,520 Advertising and promotions 902,238,760 835,220,522 Repairs and maintenance 457,157,967 482,138,379 Representation 386,138,282 360,964,801 Rentals 124,712,711 174,902,491 Others 314,853,194 155,582,230Taxes payable 8,543,051,783 6,478,288,391Interest payable 1,540,004,242 1,430,591,994Retentions payable 456,490,469 −Liability for purchased land 190,882,505 365,918,661
P=90,670,281,141 P=59,476,247,167
Accounts payable and accrued expenses are noninterest-bearing and are normally settled within15-60 days. Other payables are noninterest-bearing and are normally settled within one year.
Accrued project cost are expenses related to materials, overhead and subcontractor cost not yetbilled by the contractor.
Other accrued expenses consist mainly of transportation and travel, janitorial and security, postal andcommunication, insurance and supplies.

- 61 -
*SGVFS033960*
Taxes payable pertain to statutory liabilities for expanded withholding tax, withholding tax oncompensation, final tax and fringe benefit tax.
Retentions payable pertains to the amount withheld by the Parent Company on contractor’s billings tobe released after the guarantee period, usually one (1) year after the completion of the project orupon demand. The retention serves as a security from the contractor should there be defects in theproject.
Liability for purchased land pertains to the current portion of unpaid unsubdivided land acquiredpayable during the year. These are normally payable in quarterly or annual installment payments orupon demand.
16. Short-term and Long-term Debt
The short-term debt of P=13,500.9 million and P=16,991.4 million as of December 31, 2018 and 2017,respectively, represents peso-denominated bank loans.
In compliance with BSP rules on directors, officers, stockholders and related interests, certain short-term and long-term debt with a carrying value of P=4,998.0 million and P=6,734.2 million as ofDecember 31, 2018 and 2017 are secured by a real estate mortgages dated September 2, 2014 andMarch 14, 2016 covering both land and building of the Greenbelt Mall. Net book value of the propertyamounted to P=2,618.9 million and P=3,121.3 million as of December 31, 2018 and 2017, respectivelywhich is accounted as part of the “Investment properties” account. The remaining balance ofP=152,121.1 million and P=136,101.9 million as of December 31, 2018 and 2017, respectively, areunsecured.
Peso-denominated short term loans had a weighted average cost of 3.6% and 2.6% per annumin 2018 and 2017.
Long-term debt consists of:
2018 2017Bonds:
Due 2019 P=12,332,530,000 P=12,340,950,000Due 2020 4,000,000,000 4,000,000,000Due 2022 12,650,000,000 12,650,000,000Due 2023 15,000,000,000 7,000,000,000Due 2024 15,000,000,000 15,000,000,000Due 2025 15,000,000,000 15,000,000,000Due 2026 8,000,000,000 8,000,000,000Due 2027 7,000,000,000 7,000,000,000Due 2028 10,000,000,000Due 2033 2,000,000,000 2,000,000,000
Short-dated notes 7,400,000,000 7,400,000,000Fixed rate corporate notes (FXCNs) 5,770,000,000 9,064,000,000 Php - denominated long term loan 29,465,676,562 24,873,145,313 US Dollar - denominated long term loan − 1,516,623,750
143,618,206,562 125,844,719,063Less unamortized transaction costs 703,758,912 601,822,882
142,914,447,650 125,242,896,181Less current portion 20,255,266,261 971,190,276
P=122,659,181,389 P=124,271,705,905

- 62 -
*SGVFS033960*
Below is the summary of the outstanding Peso bonds issued by the Parent Company:
YearIssued
Term(Years)
Interestrate
PrincipalAmount
Carrying ValueFeatures2018 2017
2012 7.0 5.6250% P=9,350,000,000 P=9,341,196,000 P=9,330,125,932 Fixed rate bond due 20192012 10.0 6.0000% 5,650,000,000 5,644,680,000 5,637,990,537 Fixed rate bond due 20222013 7.0 4.6250% 4,000,000,000 3,989,546,000 3,984,041,328 Fixed rate bond due 20202013 20.0 6.0000% 2,000,000,000 1,984,613,000 1,983,989,711 Fixed rate bond due 20332013 10.5 5.0000% 15,000,000,000 14,923,051,000 14,910,133,377 Fixed rate bond due 20242014 11.0 5.6250% 8,000,000,000 7,945,703,000 7,938,922,633 Fixed rate bond due 20252015 7.0 4.5000% 7,000,000,000 6,960,744,000 6,953,043,125 Fixed rate bond due 20222016 9.5 4.7500% 7,000,000,000 6,949,421,000 6,943,374,833 Fixed rate bond due 20252016 10.0 4.8500% 8,000,000,000 7,939,468,000 7,932,643,298 Fixed rate bond due 20262016 3.0 3.0000% 2,982,530,000 2,971,976,000 2,969,107,726 Homestarter Bond due 20192016 7.0 3.8915% 7,000,000,000 6,952,613,000 6,943,949,082 Fixed rate bond due 20232017 10.0 5.2624% 7,000,000,000 6,969,630,000 6,966,801,225 Fixed rate bond due 20272018 10.0 5.9023% 10,000,000,000 9,886,828,000 − Fixed rate bond due 20282018 5.0 7.02395% 8,000,000,000 7,909,305,000 − Fixed rate bond due 2028Total P=100,368,774,000 P=82,494,122,807
Philippine Rating Services Corporation (PhilRatings) rated the Parent Company’s 2018 bond issue“PRS Aaa” with a stable outlook, and maintained the “PRS Aaa” rating with a stable outlook for allother outstanding bonds. PRS Aaa is the highest rating assigned by PhilRatings, indicating thatobligor’s capacity to meet its financial commitment on the obligation is extremely strong and that thatit has the smallest degree of investment risk. On the other hand, an Outlook is an indication as to thepossible direction of any rating change within a one year period and serves as a further refinement tothe assigned credit rating for the guidance of investors, regulators, and the general public. A StableOutlook indicates that the rating is likely to be maintained or to remain unchanged in the next twelvemonths.
Philippine Peso 5-, 10-, 15-Year FXCN due on 2016, 2021 and 2026In January 2011, the Parent Company issued P=10,000.0 million FXCNs to various financialinstitutions and retail investors. The notes will mature on various dates up to 2026. The FXCNs bearfixed interest rates ranging from 5.6% to 7.5% p.a. depending on the term of the notes. TheCompany prepaid P=1,950.0 million of notes due in 2016 on January 19, 2013. In 2014, the ParentCompany paid P=43.0 million for the matured portion of the loan. In January 2016, the ParentCompany paid P=3,750 million notes for the matured portion of the loan. In 2017, the Parent Companypaid P=43.0 million for the matured portion of the loan. In 2018, the Company prepaid P=3,234.0 millionnotes and paid P=10.0mn for the matured portion of the loan. As of December 31, 2018 and 2017, theremaining balance of the FXCN amounted to P=970.0 million and P=4,214.0 million, respectively.
US Dollar-denominated Long-term LoansIn October 2012, the Parent Company executed and had fully withdrawn a US$58.5 million long-termfacility. The loan bears a floating interest rate based on a credit spread over the three-monthUS Dollar London Interbank Offered Rate (LIBOR), repriceable quarterly. The loan will mature on thethird month succeeding the tenth anniversary of the initial drawdown date. In January 2014 andOctober 2015, the Company made partial prepayments on the loan in the amount of US$5.8 millionand US$12.8 million, respectively. Subsequently in March 2016, a US$30.0 million long-term facilitywas assigned by ALI Makati Hotel Property, Inc. to the Parent Company. The assigned loan bears afloating interest rate based on a credit spread over the three-month US Dollar London InterbankOffered Rate (LIBOR), repriceable quarterly and had a remaining term of 3 years and 4 months fromthe time of assignment. The Parent Company fully paid the remaining dollar-denominated loans onDecember 20, 2018.
Philippine Peso 10-year Note due 2023In December 2012, the Parent Company executed a P=5,000.0 million committed Corporate Notefacility with a local bank, of which an initial P=3,500.0 million was drawn in 2012. The balance ofP=1,500.0 million was subsequently drawn in January 2013. Notes currently bear a fixed interest rateof 4.5%. The Corporate Notes will mature on the third month succeeding the tenth anniversary of theinitial drawdown date. In 2015, P=50.0 million was prepaid by the Company. In 2016, another

- 63 -
*SGVFS033960*
P=50.0 million worth of amortization was paid by the Parent Company. In 2017, the Parent Companypaid another amortization in the amount of P=50.0 million. In 2018, another P=50.0 million worth ofamortization was paid by the Company. As of December 31, 2018 and 2017, the remaining balanceof the note amounted to P=4,800.0 million and P=4,850.0 million, respectively.
Peso-denominated Long-term LoansIn August to September 2015, the Parent Company assumed an aggregate of P=15,442.3 millionvarious long-term facilities of some subsidiaries from various banks. The loans bear fixed interestrates ranging from 4.5% to 4.7% p.a. and terms ranging from 4.4 years to 10.5 years. In 2016, theCompany paid P=251.6 million. During 2017, the Parent Company also paid P=317.6 million for itscurrent portion Peso-denominated loans. In March 2017, the Company executed a P=10,000.0 millionlong-term facility with a domestic bank, of which the Company had simultaneously drawn an initialP=5,000.0 million. The loan carries a fixed interest rate of 4.949% p.a. and a term of 10 years. Thebalance of facility of P=5,000.0 million was drawn in April 2017. In March 2018, the Parent Companyexecuted a P=5,000.0 million long-term facility with a domestic bank, of which the Company hadsimultaneously drawn the entire facility amount. As of December 31, 2018 and 2017, remainingbalance of the Peso-denominated long-term loans amounted to P=29,465.7 million andP=24,873.1 million, respectively.
Philippine Peso 21-month Note due 2019In July 2017, the Parent Company issued and listed on the PDEx a P=4,300.0 million Corporate Note.This Note issue is an SEC-registration exempt transaction under Section 10.1(l) of the SecuritiesRegulation Code (SRC) and Section 10.1.3 of the 2015 Implementing Rules and Regulations of theSRC. Thus, the Note was offered on a limited basis to juridical persons or entities who, at the point ofoffer or sale, were Qualified Buyers. The Notes bear a fixed interest rate of 2.75% p.a. TheCorporate Notes will mature in April 2019.
Philippine Peso 15-month Note due 2019In November 2017, the Parent Company issued and listed on the PDEx Corp. a P=3,100.0 millionCorporate Note. This Note issue is an SEC-registration exempt transaction under Section 10.1(l) ofthe Securities Regulation Code (SRC) and Section 10.1.3 of the 2015 Implementing Rules andRegulations of the SRC. Thus, the Note was offered on a limited basis to juridical persons or entitieswho, at the point of offer or sale, were Qualified Buyers. The Notes bear a fixed interest rate of3.25% p.a. The Corporate Notes will mature in February 2019.
Philippine Peso 7-Year and 10-year Bonds due 2019 and 2022In April 2012, the Parent Company issued a total of P=15,000.0 million bonds, broken down into aP=9,350.0 million bond due 2019 at a fixed rate equivalent to 5.6% p.a. and a P=5,650.0 million bonddue 2022 at a fixed rate equivalent to 6.0% p.a. PhilRatings assigned a PRS Aaa rating on the bondsindicating that it has the smallest degree of investment risk. Interest payments are protected by alarge or by an exceptionally stable margin and principal is assured. While the various protectiveelements are likely to change, such changes as can be visualized are most unlikely to impair thefundamentally strong position of such issues. PRS Aaa is the highest credit rating possible onPhilRatings’ rating scales for long-term issuances.
Philippine Peso 10-year and 6-month Bonds due 2024In July 2013, the Parent Company issued a total of P=15,000.0 million bonds due 2024 at a fixed rateequivalent to 5.0% p.a. Credit Rating and Investors Services Philippines, Inc. (CRISP) assigned a"AAA" on the bonds indicating that it has a minimal credit risk owing to the Company’s capacity torepay its debt obligations. AAA is the highest rating assigned by CRISP.
Philippine Peso 7-Year and 20-year Bonds due 2020 and 2033In October 2013, the Parent Company issued a total of P=6,000.0 million bonds, broken down into aP=4,000.0 million bond due 2020 at a fixed rate equivalent to 4.6% p.a. and a P=2,000.0 million bonddue 2033 at a fixed rate equivalent to 6.0% p.a. CRISP assigned a "AAA" rating on the bondsindicating that it has a minimal credit risk owing to the Parent Company’s capacity to repay its debtobligations. AAA is the highest rating assigned by CRISP.

- 64 -
*SGVFS033960*
Philippine Peso 11-year Bonds due 2025In April 2014, the Parent Company issued a total of P=8,000.0 million bonds due 2025 at a fixed rateequivalent to 5.6% p.a. The Bonds were assigned an issue credit rating of PRS Aaa, with a StableOutlook, by PhilRatings.
Philippine Peso 7.0 Billion Fixed Rate Bonds due 2022In April 2015, the Parent Company issued a total of P=7,000.0 million bonds due 2022 at a fixed rateequivalent to 4.5% p.a. The Bonds were assigned an issue credit rating of PRS Aaa, with a StableOutlook, by PhilRatings.
Philippine Peso 10-year Bonds due 2026In March 2016, the Parent Company issued a total of P=8,000.0 million bonds due 2026 at a fixed rateequivalent to 4.85% p.a. The Bonds is the first tranche of the Fixed-rate Bonds Series under theParent Company's P=50,000,000,000 Debt Securities Program registered in the SEC. The Bondswere assigned an issue credit rating of PRS Aaa, with a Stable Outlook, by PhilRatings.
Philippine Peso 9-year and 6-month Bonds due 2025In April 2016, the Parent Company issued a total of P=7,000.0 million bonds due 2025 at a fixed rateequivalent to 4.75% p.a. The Bonds is the second tranche of the Fixed-rate Bonds Series under theParent Company's P=50,000.0 million Debt Securities Program registered in the SEC. The Bondswere assigned an issue credit rating of PRS Aaa, with a Stable Outlook, by PhilRatings.
Philippine Peso 3-Year Homestarter Bond due 2019 and 7-year Bonds due 2023In October 2016, the Parent Company issued a total of P=10,000.0 million bonds, broken down into aP=3,000.0 million Homestarter bond due 2019 at a fixed rate of 3.0% p.a. and a P=7,000.0 million fixedrate bond due 2023 at a rate equivalent to 3.8915% p.a. The Bonds represent the first tranche ofHomestarter Bonds series and the third tranche of the Fixed-rate Bonds Series issued under theParent Company's P=50,000.0 million Debt Securities Program registered with the SEC, and listed inthe PDEx. The Bonds have been rated PRS Aaa with a Stable Outlook by PhilRatings. In 2017, theParent Company paid P=9.1 million as an early down payment of the outstanding 3-Year HomestarterBond. In 2018, the Parent Company paid P=8.4 million as an early down payment of the outstanding3-Year Homestarter Bond. As of December 31, 2018 and 2017, the remaining balance of the 3-YearHomestarter Bond amounted to P=2,982.5 million and P=2,990.9 million, respectively.
Philippine Peso 10-year Bonds due 2027In May 2017, the Parent Company issued a P=7,000.0 million fixed rate bond due 2027 at a rateequivalent to 5.2624% p.a. The Bonds represent the fourth tranche of the Fixed-rate Bonds Seriesissued under the Parent Company's P=50,000.0 million Debt Securities Program registered with theSEC, and listed in PDEx. The Bonds have been rated PRS Aaa with a Stable Outlook byPhilRatings.
Philippine Peso 10-year Bonds due 2028In April 2018, the Parent Company issued a P=10,000.0 million fixed rate bond due 2028 at a rateequivalent to 5.9203% p.a. and subject to repricing on 27 April 2023, the fifth anniversary of the IssueDate, at the higher of 5.9203% or the prevailing 5-year benchmark plus 75 bps. The Bonds representthe fifth tranche of the Fixed-rate Bonds Series issued under the Parent Company's P=50,000.0 millionDebt Securities Program registered with the SEC,and listed in the PDEx. The Bonds have been ratedPRS Aaa with a Stable Outlook by PhilRatings.
Philippine Peso 5-year Bonds due 2023In October 2018, the Parent Company issued a P=8,000.0 million fixed rate bond due 2023 at a rateequivalent to 7.0239% p.a. The Bonds represent the sixth and final tranche of the Fixed-rate BondsSeries issued under the Parent Company's P=50,000.0 million Debt Securities Program registered withthe SEC, and listed in the PDEx. The Bonds have been rated PRS Aaa with a Stable Outlook byPhilRatings.

- 65 -
*SGVFS033960*
The loan agreements contain some or all of the following restrictions: material changes in nature ofbusiness; maintenance of debt-to-equity ratio; payment of dividends and additional loans maturingbeyond a year which will result in a violation of the required debt-to-equity ratios; merger orconsolidation where the Parent Company/subsidiary is not the surviving corporation; guarantees oradvances; encumbrance for borrowed money; and sale of substantially all assets. These restrictionsand requirements were complied with by the Parent Company as of December 31, 2018 and 2017.
Transaction costs capitalized amounted to P=251.4 million and P=129.8 million in 2018 and 2017,respectively. Amortization amounted to P=149.5 million and P=98.9 million in 2018 and 2017,respectively and included under “Interest expense and other financing charges” (see Note 21).
17. Deposits and Other Current Liabilities
This account consists of:
2018 2017Deposits P=1,998,803,799 P=3,597,501,899Unearned income 597,702,508 597,238,112
P=2,596,506,307 P=4,194,740,011
Deposits are equivalent to to three (3) to six (6) months’ rent of tenants with cancellable leasecontracts and whose lease term will end in the succeeding year. This will be refunded to the lesseesat the end of the lease term or be applied to the last months' rentals on the related contracts.
Unearned income pertains to rents and other charges paid in advance by the tenants and are beingdeferred monthly.
18. Deposits and Other Noncurrent Liabilities
This account consists of:
2018 2017Deposits P=1,777,573,330 P=6,939,509,266Liability for purchased land 2,102,023,959 −Retentions payable 33,479,744 474,592,155Subscriptions payable 25,875,052 25,875,052Others 87,670,552 287,747,951
P=4,026,622,637 P=7,727,724,424
Deposits include security deposits from tenants of retail and office spaces and deferred credits arisingfrom sale of real estate properties. Security deposits are equivalent to one (1) to three (3) months’rent of long-term tenants with noncancellable leases. This will be refunded to the lessees at the endof the lease term or be applied to the last months' rentals on the related contracts. Deferred creditspertain to advances from buyers of real estate properties to cover various processing fees including,but not limited to, fees related to transfer of title such as registration fees, documentary taxes andtransfer taxes. Payments made by the Parent Company for the processing of title are charged to thisaccount.
Liability for purchased land pertains to the portion of unpaid investment in land acquired during theyear. It is payable in annual installment payments within six (6) years.

- 66 -
*SGVFS033960*
Retentions payable pertain to retentions from the contractors’ progress billings which will be releasedafter the expiration of the project’s warranty period. The retention serves as a security from thecontractor should there be defects in the project.
Subscription payable mainly pertains to the Parent Company’s subscription payable to itssubsidiaries. The outstanding balance pertains to subscriptions to Batangas Asset Corp., CrimsonField Enterprises, Regent Time and Las Lucas Development Corp. In 2017, the Parent Companypaid its subscriptions payable to POPI amounting to P=4,218.7 million in exchange of the latter’s1,875.0 million shares with P=2.25 subscription price per share.
Others pertains to non-trade payable payables which are expected to be paid beyond 12 months.
19. Equity
The details of the number of shares follow:
December 31, 2018
Number of Shares AmountPreferred Common Preferred Common
Authorized 15,000,000,000 20,000,000,000 P=1,500,000,000 P=20,000,000,000Issued 13,066,494,760 14,614,387,486 P=1,306,649,476 P=14,614,387,486Subscribed – 120,493,595 – 120,493,595Outstanding 13,066,494,760 14,734,881,081 P=1,306,649,476 P=14,734,881,081
December 31, 2017
Number of Shares AmountPreferred Common Preferred Common
Authorized 15,000,000,000 20,000,000,000 P=1,500,000,000 P=20,000,000,000Issued 13,066,494,760 14,606,355,313 P=1,306,649,476 P=14,606,355,313Subscribed – 118,592,245 – 118,592,245Outstanding 13,066,494,760 14,724,947,558 P=1,306,649,476 P=14,724,947,558
The additional paid-in capital amounted to P=47,986.0 million and P=47,454.2 million as ofDecember 31, 2018 and 2017, respectively.
Preferred Shares (P=0.10 par value per share)The Parent Company’s preferred shares prior to 2012 were subscribed and issued through a stockrights offer with the following features: (a) non-voting; (b) dividend rate of 4.6% p.a., payable annually,noncumulative; (c) nonparticipating; (d) convertible at the option of the holder at a ratio of one (1)preferred share to one (1) common share commencing on the 10th year from issue date at anexercise price equivalent to the higher of (i) the 30-day average closing price or (ii) closing price ofcommon shares immediately preceding the exercise date, less the par value of the preferred shares;(e) no pre-emptive rights; (f) non-redeemable; (g) non-listed; and, (h) preferred in liquidation to theextent of par value.
The dividends for preferred shares are declared upon the sole discretion of the Parent Company’sBOD.
On February 20, 2012, the BOD approved the following restructuring exercise in order to comply withthe regulatory requirement on Filipino-ownership following the Supreme Court’s ruling that nonvotingshares do not count as equity when computing for a company’s Filipino-ownership level:
i. Redemption and retirement of the 13.0 billion outstanding preferred shares with par value ofP=0.10.

- 67 -
*SGVFS033960*
ii. Reclassification of the 1,970.0 million unissued preferred shares to voting preferred sharesthrough an amendment of Article Seventh of the Articles of Incorporation.
iii. Increase in authorized capital stock by P=1,300.0 million creating new voting preferred shares anda stock rights offer of 1,300 million voting preferred shares from the increase in the authorizedcapital stock.
On April 18, 2012, the stockholders ratified the BOD resolution on the capital restructuring.The voting preferred shares shall have the following features, rights, and privileges (a) voting;(b) dividend rate of 4.75% per annum, equivalent to 90% of the 10-year PDST R2 (repriced everyten (10) years from issue date), payable annually, non-cumulative; (c) convertible at the option of theholder at a ratio of one (1) voting preferred share to one (1) common share commencing on the 10thyear from issue date at an exercise price equivalent to the higher of (i) the 30-day average closingprice or (ii) closing price of common shares immediately preceding the exercise date, less the parvalue of the preferred shares; (d) no pre-emptive rights; (e) redeemable at par at the sole option ofthe corporation; (f) non-listed; and (g) preferred in liquidation to the extent of par value.
The SEC approved on January 31, 2013 the following:a. The decrease in authorized capital stock by P=1,303.5 million, the aggregate par value of the
13,034.6 preferred shares which have been redeemed and retired, from P=22,803.5 million toP=21,500.0 million, and
b. The amendments to Articles of Incorporation reflecting the decrease in capital stock.
As of December 31, 2018, the Parent Company’s authorized and outstanding preferred sharesamounted to P=1,500.0 million and P=1,306.6 million, respectively.
Common Shares (P=1.00 par value per share)On April 7, 2014, the stockholders resolved to approve the amendment of the Seventh Article of theArticles of Incorporation exempting from pre-emptive rights (1) the issuance of 1 billion commonshares for properties or assets needed for the business of the Parent Company or for cash to acquireproperties or assets needed for the business of the Parent Company or in payment of a debtcontracted prior to the issuance of such shares, and (2) the issuance of common shares covered bythe Parent Company’s Stock Option Plans for members of the management committees of the ParentCompany’s subsidiaries or affiliates.
Likewise, the stockholders resolved to approve the amendment of the Stock Option Plan of theParent Company to include the members of the Management Committees of the Parent Company’ssubsidiaries and affiliates as eligible grantees of stock options.
The rollforward of the outstanding number of common shares follows:
2018 2017At beginning of year 14,724,947,558 14,712,682,588Additional subscriptions 9,933,523 12,264,970At end of year 14,734,881,081 14,724,947,558
No transfer of stock or interest which will reduce the ownership of Filipino citizens to less than therequired percentage of the capital stock as provided by existing laws shall be allowed or permitted tobe recorded in the books of the Parent Company.
On April 13, 2013, the stockholders resolved to approve the amendment of the Seventh Article of theParent Company’s Articles of Incorporation for the purpose of excluding or exempting treasury sharesfrom the pre-emptive rights of stockholders.
On January 9, 2015, the Executive Committee of the Parent Company approved a top-up placementof 484,848,500 common shares of the Parent Company at a price of P=33.00 per share. Theplacement was conducted via an accelerated bookbuilt offering structured as a top-up placement,whereby AC sold 484,848,500 listed common shares of stock to qualified third party buyers and

- 68 -
*SGVFS033960*
subscribe to the same number of new shares from the Parent Company. The Parent Companycompleted the placement on Janaury 12, 2015, raising an aggregate of P=16,000.0 million in paid-upcapital. The price was at 3.9% discount on the 5-day volume-weighted average price of ALI shares.Transaction cost charged to additional paid-in capital amounted to P=194.0 million.
On March 6, 2013, the Parent Company’s Board resolved to approve the placement made by AC ofits existing 320,000,000 listed common shares of the Parent Company to certain qualified third partybuyers or investors at P=30.50 per share. The Parent Company completed the top-up placement,raising an aggregate of P=12,200.0 million in paid up capital. The price was at 3.6% discount on the 5-day volume-weighted average price of ALI shares. Transaction cost charged to additional paid-incapital amounted to P=162.4 million.
On July 10, 2012, the Parent Company’s executive committee approved the placement of680 million listed common shares of stock with par value of P=1.00 per share, at a price of P=20 pershare, and the issuance of equal number of new shares of the Parent Company, at the same price ofP=20 per share, with AC as the seller of the placement tranche and subscriber of the subscriptiontranche. The Parent Company completed the top-up placement, raising an aggregate ofP=13,600 million in paid up capital. The price was at 5.0% discount to the closing price. Transactioncost charged to additional paid-in capital amounted to P=200.0 million.
On February 12, 2008, the BOD approved the allotment and subsequent issuance of up to 1.0 billioncommon shares of stock of the Parent Company with an aggregate par value of P=1,000 million for thepurpose of exchanging such shares for properties or assets and/or to raise funds to acquireproperties or assets needed for the business of the Parent Company via issuance of equity or equity-linked instruments, the price and the terms and conditions of which shall be determined by the BODbased on prevailing market conditions or on agreements negotiated.
On April 2, 2008, the Parent Company’s stockholders approved the allotment and subsequentissuance of the shares for the above-mentioned purposes and for the further amendment of theAmended Articles of Incorporation of the Parent Company to exclude the issuance of shares from thepre-emptive rights of the stockholders pursuant to Section 39 of the Philippine Corporation Code.
On July 5, 1991, the Parent Company launched its Initial Public Offering where a total of 400 millioncommon shares were offered at an offering price of P=26 per share. The registration statement wasapproved on July 20, 1992. The Parent Company has 9,102 and 9,209 existing certifiedshareholders as of December 31, 2018 and 2017, respectively.
Subscription receivable amounted to P=1,676.6 million and P=1,537.1 million as of December 31, 2018and 2017, and presented as a reduction in paid-in capital.
Treasury SharesThe amendment of the Articles of Incorporation on April 17, 2013 allows the re-selling of the79,528,299 listed common shares as part of the top-up placement transaction completed inJuly 2013. Treasury common shares were sold at P=30.5 per share resulting to additional paid-incapital of P=1,601.6 million.
On July 16, 2012, the Parent Company redeemed the 13.0 billion outstanding non-voting preferredshares through payment of the redemption price of P=0.10 per share. As of December 31, 2012, theredeemed preferred shares were treated as treasury shares and was subsequently retired uponapproval of the Parent Company’s SEC application for the decrease in authorized capital stock onJanuary 31, 2013.
On August 12, 2008, the BOD approved the creation of a share buyback program. It is part of theParent Company’s financial position management program and aims to: (i) improve the ParentCompany’s financial position structure and capital efficiency; and (ii) enhance shareholder valuethrough the repurchase of shares whenever the stock is trading at a price discount perceived by theParent Company as not reflective of its fair corporate value.

- 69 -
*SGVFS033960*
In 2008, the Parent Company repurchased a total of 79,528,228 of its common shares through openmarket purchases using the trading facilities of the Philippine Stock Exchange for a total purchaseprice of P=823.9 million in relation to its share buyback program.
Retained EarningsThe BOD approved the declaration and payment from unappropriated retained earnings of cashdividends of P=0.51 and P=0.48 per share in 2018 and 2017, respectively, to all issued and outstandingshares.
On February 20, 2018, the BOD approved the declaration of cash dividends amounting to P=0.252 peroutstanding common share and was paid out on April 3, 2018 to the shareholders on record as ofMarch 12, 2018. Further, on the same date, the BOD declared annual cash dividends of 4.8% peryear or P0.0047 per share to all shareholders of the Parent Company’s unlisted voting preferredshares. These were paid on June 29, 2018 to the shareholders on record as of June 15, 2018.
On August 17, 2018, the BOD approved the declaration and payment from unappropriated retainedearnings of cash dividends of P0.252 per share. The cash dividend was paid out on October 2, 2018to stockholders of common shares on record as of September 6, 2018.
On February 20, 2017, the BOD approved the declaration of cash dividends amounting to P=0.24 peroutstanding common share and was paid out on March 22, 2017 to the shareholders on record as ofMarch 6, 2017. Further, on the same date, the BOD declared annual cash dividends of 4.8% peryear or P=0.0047 per share to all shareholders of the Parent Company’s unlisted voting preferredshares. These were paid on June 29, 2017 to the shareholders on record as of June 15, 2017.
On August 18, 2017, the BOD approved the declaration and payment from unappropriated retainedearnings of cash dividends of P=0.24 per share. The cash dividend was paid out onSeptember 15, 2017 to stockholders of common shares on record as of September 5, 2017.
On February 26, 2016, the BOD approved the declaration of cash dividends amounting toP=0.24 per outstanding common share and was paid out on March 23, 2016 to the shareholders onrecord as of March 11, 2016. Further, on the same date, the BOD declared annual cash dividends of4.8% per year or P=0.0047 per share to all shareholders of the Parent Company’s unlisted votingpreferred shares. These were paid on June 29, 2016 to the shareholders on record as ofJune 15, 2016.
On August 18, 2016, the BOD approved the declaration and payment from unappropriated retainedearnings of cash dividends of P=0.2380 per share. The cash dividend was paid out onSeptember 16, 2016 to stockholders of common shares as of record date.
Total dividends for common shares declared for 2018 and 2017 amounted to P=7,423.9 million andP=7,065.0 million, respectively.
Retained earnings of P=8,000.0 million are appropriated for future expansion. The increase ofP=2,000.0 million in 2016 represents a continuing appropriation for land banking activities and plannedbuilding construction projects. Each year, the Parent Company incurs capital expenditures forproperty development which include among others land banking and building construction projects.The appropriation is being fully utilized to cover part of the annual expenditure requirement of theParent Company.
The Parent Company has earmarked additional funds for expansion projects in the residential,shopping centers, office and hotel business segments, as well as various infrastructure projects forthe Parent Company’s mixed-use developments.

- 70 -
*SGVFS033960*
The following are among the major capital expenditures of the Parent Company which were approvedby the BOD:
a) Ayala Triangle Garden 2 with product offering for a Triple A HQ Office Building, a 5-Star Hoteland 3-level Retail Podium with gardens and civic spaces which was approved by the Board onMay 29, 2015. The project was launched in June 2015 and expected to be completed in 2020.
b) Ayala Center Redevelopment which will offer intermodal transport facility, a 5-storey regionalmall, 2 BPO towers, a SEDA hotel and a 300-units residential for lease was approved by theBoard on November 27, 2015. The project was launched in January 2016 and expected to becompleted in 2021.
In accordance with SEC Memorandum Circular No. 11 issued in December 2008, the ParentCompany’s retained earnings, after reconciling items, available for dividend declaration as ofDecember 31, 2018 and 2017 amounted to P=52,672.3 million and P=45,343.5 million, respectively.
Capital ManagementThe primary objective of the Parent Company’s capital management policy is to ensure that debt andequity capital are mobilized efficiently to support business objectives and maximize shareholdervalue. The Parent Company establishes the appropriate capital structure for each business line thatproperly reflects its premier credit rating and allows it the financial flexibility, while providing itsufficient cushion to absorb cyclical industry risks.
The Parent Company considers debt as a stable source of funding. The Parent Company lengthenedthe maturity profile of its debt portfolio and makes it a point to spread out its debt maturities by nothaving a significant percentage of its total debt maturing in a single year.
The Parent Company manages its capital structure and makes adjustments to it, in the light ofchanges in economic conditions. It monitors capital using leverage ratios on both gross debt and netdebt basis. As of December 31, 2018, and 2017, the Parent Company had the following ratios:
2018 2017Debt to equity 123.8:1 120.3:1Net debt to equity 122.9:1 119.8:1
Debt consists of short-term and long-term debts. Net debt includes short-term and long-term debtless cash and cash equivalents and financial assets at FVPL. Equity, which the Parent Companyconsiders as capital, pertains to the total equity. The Parent Company excludes the “Fair valuereserve of financial assets at FVOCI” in computing the debt to equity ratio.
The Parent Company is not subject to externally imposed capital requirements. No changes weremade in the objectives, policies or processes for managing capital during the years endedDecember 31, 2018 and 2017.
Financial risk assessmentThe Parent Company’s financial condition and operating results would not be materially affected bythe current changes in interest, currency, credit, liquidity and market conditions.
Exposure to changes in interest rates is reduced by a debt portfolio mix of both fixed and floatinginterest rates. The Parent Company’s ratio of fixed to floating rate debt stood at 91:9 and 87:13 as ofDecember 31, 2018, and 2017, respectively. As a result, any adverse movement in interest rates ismitigated.
Exposure to foreign currency holdings is at US$0.4 million and US$28.0 million as ofDecember 31, 2018, and December 31, 2017, respectively.

- 71 -
*SGVFS033960*
Credit risks continue to be managed through defined credit policies and continuing monitoring ofexposure to credit risks. The Parent Company’s base of counterparties remains diverse. As such, itis not exposed to large concentration of credit risk.
Liquidity risk is addressed with long-term funding already locked in, while funds are placed on cashequivalents and financial assets at FVPL.
20. Revenue
This account consists of:
2018 2017Revenue from contracts with customer
Residential development P=35,220,371,905 P=31,267,022,204Management and marketing fees 1,656,380,571 2,092,518,441Interest income from real estate sales 1,701,410,613 1,595,607,661
Rental income (Note 11) 4,061,915,660 3,842,614,028P=42,640,078,749 P=38,797,762,334
The Parent Company’s disaggregation of each sources of revenue from contracts with customers arepresented below:
Residential development
2018Type of ProductCondominium P=21,607,221,843House and lot 14,105,711,040Lot only 1,208,849,635
P=36,921,782,518
All of the Parent Company’s real estate sales from residential development are revenue fromcontracts with customers recognized over time.
Management and marketing fees
2018SegmentProperty development P=914,605,918Shopping centers 504,821,488Offices 236,953,165
P=1,656,380,571
Set-out below is the reconciliation of contracts with customers with the amounts disclosed in segmentinformation:
2018Property
DevelopmentShopping
CentersOffices Total
Sales to external customers P=36,135 P=505 P=237 P=36,877Interest income from real estate sales 1,701 − − 1,701Total revenue from contracts withcustomers P=37,836 P=505 P=237 P=38,578

- 72 -
*SGVFS033960*
21. Costs and Expenses and Other Income (Charges)
Real estate costs and expenses consist of:
2018 2017Cost of real estate sales (Note 7) P=20,065,424,978 P=18,488,556,869Marketing and management fees 3,876,840,445 3,111,445,037Depreciation (Note 11) 1,024,424,566 791,434,966Rental 274,075,041 262,027,844Manpower costs 261,012,975 171,685,229Direct operating expenses Commissions 1,145,995,148 1,001,187,124 Taxes and licenses 670,987,949 849,789,305 Security 441,168,172 347,559,641 Insurance 168,597,086 30,054,043 Repairs and maintenance 86,638,174 100,236,080 Transportation and travel 37,167,302 25,040,297 Supplies 8,792,980 8,027,945
Others 524,251,359 393,882,163P=28,585,376,175 P=25,580,926,543
General and administrative expenses consist of:
2018 2017Manpower costs P=1,224,725,271 P=1,530,569,094Professional fees 408,404,622 386,285,692Depreciation (Note 12) 189,977,049 199,147,015Advertising 81,919,922 44,479,952Donations and contribution 70,643,570 34,268,470Repairs and maintenance 57,817,433 52,528,479Utilities 35,253,703 37,662,469Transportation and travel 33,882,774 53,826,367Entertainment, amusement and recreation 25,492,552 28,296,723Rentals 23,297,294 30,134,733Security and janitorial 15,497,593 14,762,355Supplies 12,559,089 11,644,159Others 87,967,511 38,528,233
P=2,267,438,383 P=2,462,133,741
Depreciation expense included in the parent company statements of income follow:
2018 2017Included in: Real estate costs and expenses P=1,024,424,566 P=791,434,966 General and administrative expenses 189,977,049 199,147,015
P=1,214,401,615 P=990,581,981

- 73 -
*SGVFS033960*
Other expenses consists of:
2018 2017Provision for (reversal) of impairment losses and
write-offs: Inventories P=− P=621,001,330
Investment properties − (49,000,000) Other noncurrent assets − (8,944,963)
Investments in subsidiaries, associates and joint ventures (Note 10) − (36,426,246)
Receivables (Note 6) 2,013,205 (526,357,037)P=2,013,205 P=273,084
Interest expense and other financing charges consist of:
2018 2017Interest expense on: Long-term debt P=6,647,234,838 P=5,692,390,687 Short-term debt 612,065,190 370,078,746
Intercompany loans 34,872,454 22,486,898Other financing charges 873,182,203 363,145,866
P=8,167,354,685 P=6,448,102,197
Other financing charges pertain mainly to transaction costs from availment of short-term loans,availment of intercompany loans and bank charges.
Other charges consist of net realized/unrealized loss on foreign exchange transactions amounting toP=92.8 million and P=4.8 million for 2018 and 2017, respectively.
Other income consists of:
2018 2017Gain on sale of investment in subsidiaries,
associates and joint ventures (Note 10) P=3,072,132,224 P=75,094,450Gain on sale of property and equipment (Note 12) 20,261,459 34,784,163Unrealized gain on financial assets at FVPL (Note 5) 50,463 27,135Gain on sale of investment property (Note 11) − 388,954,545Others 593,552,591 1,937,674,666
P=3,685,996,737 P=2,436,534,959
22. Income Tax
The components of net deferred tax assets are as follows:
2018 2017Deferred tax assets on: Difference between tax and book basis of
accounting for real estate transactions P=2,074,436,787 P=1,648,169,658 Allowance for probable losses 530,278,353 530,278,353 Employee benefits 344,661,738 347,079,220 Allowance for impairment losses 51,199,372 50,595,410 Unrealized foreign exchange loss (4,184,475) 52,794,651
2,996,391,775 2,628,917,292Deferred tax liabilities on capitalized interest (434,022,823) (447,595,533)
P=2,562,368,952 P=2,181,321,759

- 74 -
*SGVFS033960*
There are no income tax consequences attaching the payment of dividends by the Parent Companyto its shareholders.
Provision for income tax consists of:
2018 2017Current P=1,687,765,787 P=1,743,097,434Deferred (407,096,763) 354,873,532Final 17,133,821 17,297,460
P=1,297,802,845 P=2,115,268,426
Reconciliation between the statutory and the effective income tax rates follows:
2018 2017Statutory income tax rate 30.00% 30.00%Tax effects of: Interest income and capital gains taxed
at lower rates (3.24) (2.54) Dividend income (15.68) (17.76) Others – net (3.21) 2.23Effective income tax rate 7.87% 11.93%
Deferred tax related to remeasurement gain (loss) on defined benefit plans recognized in OCIamounted to P=26.0 million and P=4.0 million in 2018 and 2017, respectively.
Republic Act (RA) No.10963 or the Tax Reform for Acceleration and Inclusion Act (TRAIN) wassigned into law on December 19, 2017 and took effect January 1, 2018, making the new tax lawenacted as of the reporting date. Although the TRAIN changes existing tax law and includes severalprovisions that will generally affect businesses on a prospective basis, the management assessedthat the same will not have any significant impact on the financial statement balances as of thereporting date.
23. Related Party Transactions
Parties are considered to be related if one party has the ability, directly or indirectly, to control theother party or exercise significant influence over the other party in making financial and operatingdecisions. Parties are also considered to be related if they are subject to common control or commonsignificant influence which include affiliates.
In its regular conduct of business, the Parent Company has entered into transactions with itssubsidiaries, associates and other related parties principally consisting of advances andreimbursement of expenses, purchase and sale of real estate properties, construction contracts,development, management, underwriting, marketing, leasing and administrative service agreements.
Terms and Conditions of Transactions with Related PartiesTransactions with related parties are made at normal market prices. Outstanding balances at yearend are unsecured, interest free and settlement occurs generally in cash, except otherwise indicated.There have been no guarantees provided or received for any related party receivables or payables.The Parent Company does not provide any allowance relating to receivable from related parties.
This assessment is undertaken each financial year through examining the financial position of therelated parties and the markets in which the related parties operate.

- 75 -
*SGVFS033960*
The following tables provide the total amount of transactions that have been entered into with relatedparties for the relevant financial year:
a. Transactions with Bank of the Philippine Islands (BPI), an associate of AC:
i. As of December 31, 2018 and 2017, the Parent Company maintains current and savingsaccount, money market placements, UITF investments, short-term debt and long-term debtpayable with BPI broken down as follows:
2018 2017Cash in bank P=188,135,123 P=221,584,978Cash equivalents – 12,494,856Financial assets at FVPL 1,969,029 1,918,566Short-term debt 4,467,000,000 5,405,000,000Long-term debt 531,026,562 1,329,194,063
From the Parent Company’s placements with BPI, the Parent Company has accrued interestreceivable amounting to nil and P=0.01 million as of December 31, 2018 and 2017,respectively. Interest income earned amounted to P=0.1 million in 2018 and P=0.4 millionin 2017.
As of December 31, 2018, and 2017, the Parent Company has an outstanding trust accountcontribution under BPI Asset Management and Trust Parent Company amounting toP=1,315.4 million and P=1,345.2 million, respectively.
ii. As of December 31, 2018 and 2017, the Parent Company has outstanding receivable fromand payable to BPI as follows:
2018 2017Interest receivable P=– P=11,208Interest payable 6,557,235 27,784,269
iii. Income earned and expenses incurred with BPI are as follows:
2018 2017Interest income P=106,539 P=356,890Interest expense 170,587,705 101,236,007
b. Outstanding balances with parent company, subsidiaries, associates, joint ventures and otherrelated parties (entities under common control)
Receivables from/payables to related parties pertain mostly to development and managementfees, advances and reimbursements of operating expenses related to development cost, workingcapital requirements and land acquisitions which are due and demandable.
Receivables from related parties follow:
2018Current Noncurrent Total
Parent Company P=138,955,030 P=– P=138,955,030Subsidiaries 36,981,628,844 – 36,981,628,844Associates 293,131,978 – 293,131,978Joint Ventures 44,341,308 – 44,341,308Other related parties 234,176,131 – 234,176,131
P=37,692,233,291 P=– P=37,692,233,291

- 76 -
*SGVFS033960*
2017Current Noncurrent Total
Parent Company P=98,815,570 P=– P=98,815,570Subsidiaries 38,883,876,466 – 38,883,876,466Associates 426,641,463 – 426,641,463Joint Ventures 1,599,380 – 1,599,380Other related parties 193,816,270 – 193,816,270
P=39,604,749,149 P=– P=39,604,749,149
Payable to related parties follow:
2018Current Noncurrent Total
Parent Company P=85,183,067 P=– P=85,183,067Subsidiaries 17,012,300,743 100,936,299 17,113,237,042Associates 211,322,930 – 211,322,930Joint Ventures 69,318 – 69,318Other related parties 320,817,349 – 320,817,349
P=17,629,693,407 P=100,936,299 P=17,730,629,706
2017Current Noncurrent Total
Parent Company P=72,206,977 P=– P=72,206,977Subsidiaries 11,028,777,419 100,936,666 11,129,714,085Associates 211,892,890 – 211,892,890Joint Ventures 69,318 – 69,318Other related parties 324,154,340 – 324,154,340
P=11,637,100,944 P=100,936,666 P=11,738,037,610
During 2018 and 2017, payables to related parties include a noncurrent liability pertaining toadvances from Allysonia International, Inc amounting to 100.9 million.
c. Revenue and expenses from related parties
The revenue from parent company, subsidiaries, associates, joint ventures and other relatedparties pertains mostly to income from leasing and development projects, dividend income,marketing and management fees, while expenses composed of marketing and managementfees, commission, and training expenses. Transactions are settled within one year, except asotherwise stated.
Revenue and expenses from related parties follow:
Revenue
2018
Dividend IncomeManagement and
Marketing Income Rental Income Interest Income TotalParent Company P=− P=− P=17,130,282 P=− P=17,130,282Subsidiaries 8,289,145,990 1,301,067,942 1,285,365,024 440,065,447 11,315,644,403Joint Ventures 260,000,000 52,371,411 − − 312,371,411Associates 71,461,080 240,042,137 − − 311,503,217Other Related
Parties − 62,899,081 95,051,133 − 157,950,214Total P=8,620,607,070 P=1,656,380,571 P=1,397,546,439 P=440,065,447 P=12,114,599,527

- 77 -
*SGVFS033960*
2017
Dividend IncomeManagement andMarketing Income Rental Income Interest Income Total
Parent Company P=− P=− P=2,430,077 P=− P=2,430,077Subsidiaries 9,920,159,708 1,802,942,009 1,052,542,558 377,923,445 13,153,567,720Joint Ventures 500,000,000 18,000,071 − − 518,000,071Associates 74,974,242 271,576,361 − − 346,550,603Other Related
Parties − − 38,124,753 − 38,124,753Total P=10,495,133,950 P=2,092,518,441 P=1,093,097,388 P=377,923,445 P=14,058,673,224
Costs and expenses
2018Rental
ExpensesManagement and
Marketing FeesCommission
ExpensesInterest
Expense TotalParent Company P=− P=– P=− P=− P=–Subsidiaries 23,997,913 2,450,261,698 413,666,253 34,872,454 2,922,798,318Joint Ventures 7,847,870 − − − 7,847,870Associates 14,520,878 – – – 14,520,878Other Related
Parties 3,367,951 11,172 3,379,123
Total P= 49,734,612 P=2,450,272,870 P=413,666,253 P=34,872,454 P= 2,948,546,189
2017
Rental ExpensesManagement and
Marketing FeesCommission
ExpensesInterest
Expense TotalParent Company P=− P=210,000 P=− P=− P=210,000Subsidiaries 556,964 1,231,826,443 51,168,607 22,486,898 1,306,038,912Joint Ventures − − − − −Associates 13,767,076 − − − 13,767,076Other Related
Parties 4,641,225 15,475 − − 4,656,700
Total P=18,965,265 P=1,232,051,918 P=51,168,607 P=22,486,898 P= 1,324,672,688
The following describes the nature of the material transactions of the Parent Company withrelated parties as of December 31, 2018, and 2017:
i. During 2015, the Parent Company purchased land from API and VPHI for the Soliento (K5),Riomonte (K6), and Cerilo (K7) projects. During 2017, payments were made amounting toP=32.1 million to API and P=1,373.6 million to VPHI which includes the final payment for theRiomonte (K6) project of P=375.6 million.
ii. During the year, Parent Company lent to and borrowed funds from various subsidiaries andaffiliates on an interest bearing basis. Outstanding intercompany peso-denominated loansof the Parent Company to subsidiaries and affiliates amounted to P=2,415.2 million andP=5,854.7 million as of December 31, 2018 and 2017, respectively. Interest rates rangesfrom 2.5% to 7.0% and 3.0% to 3.5% per annum for 2018 and 2017, respectively, withterms of 1 day up to 90 days.
iii. Receivables from/payables to MDC pertain to advances and retentions in relation toconstruction contracts involving the Parent Company’s real estate projects, with MDC beingthe primary contractor.
iv. Transaction with APMC pertain to agreements to administer properties of the ParentCompany for stipulated fees. Under this agreement, APMC shall manage, maintain,preserve and provide services for the efficient use of such properties. Further, APMCleases its carpark facilities (Ayala Center Carparks and Central Business District Carparks)under lease agreements with the Parent Company. These leases generally provide foreither (a) fixed monthly rent, or (b) minimum rent or a certain percentage of net operating

- 78 -
*SGVFS033960*
income, whichever is higher. The lease agreements are renewed annually upon mutualagreement of the parties. Aside from the property management services provided byAPMC and the leases discussed above, transactions with the Parent Company includenoninterest-bearing advances and reimbursements of expenses incurred in connection withthe maintenance of the administered properties.
v. Receivable from ALISI pertains to lease agreement with the Parent Company for office andparking spaces.
vi. Receivables from Alveo pertain mostly to advances and reimbursement of operatingexpenses related to development cost and land acquisitions. These are generally traderelated.
vii. On January 1, 2015, the Parent Company and ACCI entered into a lease contract for thelease of parcels of land and buildings within the Greenbelt and Glorietta developmentlocated at the Ayala Center, Makati City. The lease shall be for a period of two years fromJanuary 1, 2015 until December 31, 2016, renewable for another two years upon the writtenagreement of both parties. The lease generally provide for a fixed monthly rent and acertain percentage of gross rental revenue per month.
In consideration of the lease, the Parent Company and ACCI executed a Deed ofAssignment wherein, the Parent Company assigned to ACCI contracts of lease, securitydeposits, construction bonds and trade receivables with merchants occupying saiddevelopment. ACCI assumed all rights and obligations under the contracts of lease, othercontracts, permits and licenses, trade receivables, security deposits and constructionbonds.
The lease contract between ACCI and Parent Company has been renewed forfive (5) years covering the period January 1, 2017 to December 31, 2021. Please refer toNotes 19 and 30.
viii. On January 1, 2017, the Parent Company and ATI entered into a lease contract for thelease of a parcel of land with an area of 19,988 sq.m., three office towers and a commonretail podium mixed-use commercial building. The lease shall be for a period of 40 yearswhich commenced on January 1, 2017. The commencement of the lease period for thebuildings are by phase, Phase 1 started on January 18, 2017, Phase 2 on April 1, 2017,Phase 3 on October 1, 2017 and Phase 4 shall start on October 1, 2018. The lease on thebuildings is co-terminous with the land lease. The lease is renewable for another 40 yearsupon mutual agreement of both parties. The lease generally provide for a fixed monthlyrent and a certain percentage of gross rental revenue per month. Please refer toNotes 19 and 30.
ix. On November 29, 2017, the Parent Company sold to OLI the Southpark Mall and BPO inAlabang, Muntinlupa City for a gain of P=381.7 million. Subsequently, the Parent Companyassigned to OLI its Lease Agreement with Avida Land Corp. for the lease on the parcel ofland where the buildings were constructed. Please refer to Notes 11 and 30.
x. On December 27, 2017, the Parent Company sold at cost to MCLC buildings underconstruction located at Ayala Triangle Gardens and Sta. Ana Park, A.P. Reyes Ave., Brgy.Carmona, Makati City. Subsequently, the Parent Company signed a lease agreement withMCLC for the lease on the parcels of land it owns where the buildings were constructed.Please refer to Notes 11 and 30.
xi. On December 28, 2017, the Parent Company sold at cost to CCCVC a 7-storey commercialmall which is still under construction. Subsequently, the Parent Company assigned toCCCVC its Lease Agreement with the Province of Negros Occidental for the lease on aparcel of land where the buildings were constructed. Please refer to Notes 11 and 30.

- 79 -
*SGVFS033960*
xii. On December 28, 2017, the Parent Company sold at cost to BCCVC a mixed-usedcommercial center which is still under construction. Subsequently, the Parent Companyassigned to BCCVC its Lease Agreement with D.M. Wenceslao & Associates for the leaseon several parcels of land where the buildings were constructed. Please refer toNotes 11 and 30.
xiii. On December 28, 2017, the Parent Company sold at cost to ASCVC, the Arca South BPOand Mall which is still under construction. Subsequently, the Parent Company signed alease agreement with ASCVC for the lease on the parcels of land it owns where thebuildings were constructed. Please refer to Notes 11 and 30.
xiv. During 2017, the Parent Company and ATI entered into a lease contract for the lease of a24-storey building with a total construction floor area of 146,830 sq. m. located at 30Meralco Ave., Pasig City. The lease shall be for a period of 40 years which commenced onFebruary 1, 2016 for Phase 1 and August 1, 2017 for Phase 2. The lease is renewable foranother 40 years upon mutual agreement of both parties. The lease generally provide for afixed monthly rent and a certain percentage of gross rental revenue per month. Pleaserefer to Notes 11 and 30.
xv. In 2017, the Parent Company sold a property to ALI ETON Property DevelopmentCorporation located in Quezon City amounting to P=708.56 million.
xvi. In 2017, the Parent Company made advances to ALI Cap for infusion to Airswift amountingto P=217.5 million.
xvii. On October 5, 2018, the Parent Company sold at cost to One Dela Rosa Properties, Inc.(ODRPI), a wholly-owned subsidiary, the Ayala North Exchange BPO and Mall which is stillunder construction located along Ayala Avenue, Makati City. The carrying value of theparcels of land and buildings amounted to P=6,012.8 million.
d. Notes receivable pertains to housing, car, salary and other loans granted to the ParentCompany’s officers and employees which are collectible through salary deduction, bears6% interest p.a. and have various maturity dates ranging from 2015 to 2032 (see Note 6).
e. Compensation of key management personnel by benefit type follows:
2018 2017Short-term employee benefits P=156,677,620 P=129,686,100Post-employment benefits 15,496,600 11,622,450
P=172,174,220 P=141,308,550
24. Retirement Plan
The Parent Company has funded, noncontributory tax-qualified defined benefit type of retirement plan(the Plan) covering substantially all of its employees. The benefits are based on a defined benefitformula.
The Plan aims to maintain a full funding, i.e., the Plan’s assets fully covered the Plan’s liabilities, asmeasured through generally accepted actuarial methodologies. Such will provide a higher level ofassurance that all promised benefits can be paid from existing assets and expected investmentreturns. The target funded status is within the range of 80% to 100%.

- 80 -
*SGVFS033960*
The Parent Company’s fund is in the form of a trust fund being maintained by BPI Asset Managementand Trust Parent Company (the “Retirement Fund”). The primary objective of the Retirement Fund isto achieve the highest total rate of return possible, consistent with a prudent level of risk. Theinvestment strategy articulated in the asset allocation policy has been developed in the context oflong-term capital market expectations, as well as multi-year projections of actuarial liabilities.Accordingly, the investment objectives and strategies emphasize a long-term outlook, and interimperformance fluctuations will be viewed with the corresponding perspective.
Republic Act 7641, The New Retirement Law, requires a provision for retirement pay to qualifiedprivate sector employees in the absence of any retirement plan in the entity. The law does notrequire minimum funding of the plan.
The components of pension expense (included in “Manpower costs” under “General andadministrative expenses”) in the parent company statements of income follow:
2018 2017Current service cost P=174,652,400 P=179,382,900Net interest cost on benefit obligation 68,262,800 61,190,800Total pension expense P=242,915,200 P=240,573,700
The remeasurement effects recognized in other comprehensive income (loss) in the parent companystatements of comprehensive income follow:
2018 2017Return (gain) loss on plan assets(excluding amount included in net interest) P=110,057,000 P=7,993,700Actuarial loss (gain) due to liability experience 36,780,900 97,022,600Actuarial loss (gain) due to liability assumption
changes – economic (233,669,800) (91,775,100)Remeasurements in other comprehensive income (P=86,831,900) P=13,241,200
The funded status and amounts recognized in the parent company statements of financial position forthe pension plan as of December 31, 2018, and 2017 follow:
2018 2017Benefit obligation P=2,513,859,792 P=2,557,704,592Plan assets (1,299,055,989) (1,345,210,989)Net pension liability P=1,214,803,803 P=1,212,493,603

- 81 -
*SGVFS033960*
Changes in net pension liability are as follows:
Net benefit cost in parent companystatement of income Remeasurements in other comprehensive income
January 1,2018
Currentservice cost
Netinterest Subtotal
Benefitspaid
Returnon planassets*
Actuarial(gain) loss
due toliability
experience
Actuarial(gain) loss
due toliability
assumptionchanges -economic
Netremeasurement
loss/ (gain)Contributionby employer
Transferin /(out)
December 31,2018
Present value of definedbenefit obligation P=2,557,704,592 P=174,652,400 P=144,900,100 P=319,552,500 (P=158,302,600) P=– P=36,780,900 (P=233,669,800) (P=196,888,900) P=– (P=8,205,800) P=2,513,859,792
Fair value of plan assets (1,345,210,989) – (76,637,300) (76,637,300) 158,302,600 110,057,000 – – 110,057,000 (153,773,100) 8,205,800 (1,299,055,989)Net defined benefit liability
(asset) P=1,212,493,603 P=174,652,400 P=68,262,800 P=242,915,200 P=− P=110,057,000 P=36,780,900 (P=233,669,800) (P=86,831,900) (P=153,773,100) P=– P=1,214,803,803*excluding amount included in net interest
Changes in net pension liability in 2017 are as follows:
Net benefit cost in parent companystatement of income Remeasurements in other comprehensive income
January 1,2017
Currentservice cost
Netinterest Subtotal
Benefitspaid
Returnon planassets*
Actuarial(gain) loss
due toliability
experience
Actuarial(gain) loss
due toliability
assumptionchanges -economic
Netremeasurement
lossContributionby employer
Transferin /(out)
December 31,2017
Present value of defined benefitobligation P=2,503,563,392 P=179,382,900 P=128,283,300 P=307,666,200 (P=258,772,500) P=– P=97,022,600 (P=91,775,100) P=5,247,500 P=– P=– P=2,557,704,592
Fair value of plan assets (1,352,757,589) – (67,092,500) (67,092,500) 254,645,400 7,993,700 – – 7,993,700 (188,000,000) – (1,345,210,989)Net defined benefit liability
(asset) P=1,150,805,803 P=179,382,900 P=61,190,800 P=240,573,700 (P=4,127,100) P=7,993,700 P=97,022,600 (P=91,775,100) P=13,241,200 (P=188,000,000) P=– P=1,212,493,603*excluding amount included in net interest
The maximum economic benefit available is a combination of expected refunds from the plan and reductions in future contributions.

- 82 -
*SGVFS033960*
All equity and debt instruments held have quoted prices in an active market. The remaining planassets do not have quoted market prices in an active market.
The plan assets have diverse investments and do not have any concentration risk.
The fair value of plan assets by each class as at the end of the reporting period are as follows:
December 312018 2017
Cash and cash equivalents P=20,187,737 P=8,823,586Equity investmentsUnit investment trust funds 108,844,472 110,236,635Holding firms 74,498,317 59,372,809Financials 50,757,420 38,604,718Property 54,757,594 33,064,102Industrials 12,838,440 15,816,575Services 3,989,749 10,650,256Mining and Oil – 10,304
305,685,992 267,755,399
Debt investmentsGovernment securities 170,095,456 252,860,530AAA rated debt securities 353,412,913 464,973,407Not rated debt securities – –Others 449,157,162 350,449,243
972,665,531 1,068,283,180Other assets 516,729 348,824
P=1,299,055,989 P=1,345,210,989
The Retirement Fund’s investments will be appropriately diversified to control overall risk and willexhibit portfolio characteristics similar to the set benchmark for each asset class. In case ofsecurities, the aggregate holdings of any security may not exceed 10% of the Plan assets. Thecriteria for including an asset class in the strategic policy include: (a) wide recognition and acceptanceamong institutional investors; (b) low correlation with other accepted asset classes; and(c) a meaningful performance history.
The Parent Company expects to make contributions of P=244.4 million to its retirement fund in 2019.
The allocation of the fair value of plan assets follows:
2018 2017Investments in debt securities 74.87% 79.63%Investments in equity securities 23.53% 19.70%Others 1.60% 0.67%
Funds invested in debt securities include government securities, corporate notes and bonds, andspecial deposit accounts. Investments in equity securities consist of investments in PSE-listed stocksand equity securities held by unit investment trust funds. Others were in the form of cash and cashequivalents.
The Parent Company’s transactions with the Fund mainly pertain to contributions, benefit paymentsand settlements.

- 83 -
*SGVFS033960*
As of December 31, 2018 and 2017, the funds include investment in securities of its related parties.Details of the investment per type of security are as follows:
December 31, 2018December 31,
2017Carrying
ValueFair
ValueUnrealized
(Gain) LossFair
Value(In Thousands)
Investments in debt securities P=1,024,052 P=1,005,358 P=18,694 P=732,930Investments in equity securities 317,495 309,536 7,959 423,729Others 227 523 (296) 1,583
P=1,341,774 P=1,315,417 P=26,357 P=1,158,242
The plan assets include shares of stock of the Parent Company with fair value amounting toP=27.7 million and P=17.7 million as of December 31, 2018, and 2017, respectively. It also includesshares of stocks of related parties within the AC Group with fair value amounting toP=42.2 million and P=49.3 million as of December 31, 2018 and 2017, respectively. The ParentCompany gives the trustee bank the discretion to exercise voting rights over the shares. The planassets include debt securities of the Parent Company amounting to P=62.9 million and P=74.2 million asof December 31, 2018, and 2017, respectively. The fund incurred a P=1.1 million loss in 2018 arisingfrom investments in debt and equity securities of the Parent Company and a gain of P=0.01 million in2017.
The cost of defined benefit pension plans as well as the present value of the pension liabilities aredetermined using actuarial valuations. The actuarial valuation involves making variousassumptions. The principal assumptions used in determining pension obligations for the definedbenefit plans are shown below:
2018 2017Discount rate 7.00% 5.50%Future salary increases 6.00% 6.00%
The sensitivity analysis below has been determined based on reasonably possible changes of eachsignificant assumption on the defined benefit obligation as of the end of the reporting period,assuming all other assumptions were held constant:
2018Effect on Defined Benefit Obligation
Increase (decrease)
Change in basis points+ 100 basis
points- 100 basis
PointsDiscount rate (135,418,370) 151,126,901Salary increase rate 151,397,738 (138,126,737)
2017Effect on Defined Benefit Obligation
Increase (decrease)
Change in basis points+ 100 basis
points- 100 basis
PointsDiscount rate (156,787,291) 175,714,305Salary increase rate 171,366,208 (156,019,980)
Shown below is the maturity analysis of the undiscounted benefit payments:
Year ending: 2018 20171 year and less 396,308,800 235,330,500More than 1 year to 5 years 1,630,312,500 1,496,668,800More than 5 years to 10 years 1,387,325,200 1,476,075,400

- 84 -
*SGVFS033960*
The average duration of the defined benefit obligation as at December 31, 2018 and 2017 is5.3 years and 7.1 years, respectively.
25. Earnings Per Share
The following tables present information necessary to compute EPS:
2018 2017Net income attributable to equity holders of Ayala
Land, Inc. P=15,198,950,784 P=15,612,442,250Less: dividends on preferred stock (62,037,888) (62,037,888)Net income attributable to equity holders of the Parent
for basic and diluted earnings per share P=15,136,912,896 P=15,550,404,362Weighted average number of common shares for
basic EPS 14,730,049,087 14,721,881,314Add: dilutive shares arising from stock options 966,403 66,996,707Adjusted weighted average number of common
shares for diluted EPS 14,731,015,490 14,788,878,021Basic and diluted EPS P=1.03 P=1.06
Basic EPS is computed by dividing net income for the year attributable to common equity holders ofthe Parent Company by the weighted average number of common shares issued and outstandingduring the year adjusted for any subsequent stock dividends declared.
Diluted EPS is computed by dividing net income for the year attributable to common equity holders ofthe Parent Company by the weighted average number of common shares issued and outstandingduring the year plus the weighted average number of common shares that would be issued onconversion of all the dilutive potential common shares into common shares. The calculation of dilutedearnings per share does not assume conversion, exercise, or other issue of potential common sharesthat would have an antidilutive effect on earnings per share.
The convertibility of the preferred shares will start on the 10th year from the issue date which wasin 2012. This has an antidilutive effect on the computation of diluted EPS.
26. Stock Options and Ownership Plans
The Parent Company has stock option plans for key employees covering 2.5% of the ParentCompany’s authorized capital stock. The grantee is selected based on certain criteria likeoutstanding performance over a three-year period.
ESOPThe ESOP grantees may exercise in whole or in part the vested allocation in accordance with thevesting percentage and vesting schedule stated in the ESOP. Also, the grantee must be anemployee of the Parent Company or any of its subsidiaries during the 10-year option period. In casethe grantee retires, he is given 3 years to exercise his vested and unvested options. In case thegrantee resigns, he is given 90 days to exercise his vested options.
The Parent Company has no ESOP grant and availment during 2018, 2017 and 2016.
ESOWNIn November 2001, the Parent Company offered all its ESOWN subscribers with outstanding ESOWNsubscriptions the option to cancel the subscriptions within the 5-year holding period. InDecember 2001, the program for ESOWN was indefinitely suspended.

- 85 -
*SGVFS033960*
In 2005, the Parent Company introduced a revised ESOWN Plan (the Plan) wherein grantees maysubscribe in whole or in part to the shares awarded to them based on a discounted market price thatwas determined by the Compensation Committee as the offer price set at grant date. The granteespaid for the shares subscribed through installments over a maximum period of ten (10) years. Thesubscription is subject to a holding period stated in the plan. To subscribe, the grantee must be anemployee of the Parent Company or any of its subsidiaries during the ten (10)-year payment period.In case the grantee resigns, unsubscribed shares are cancelled, while the subscription may be paidup to the percent of holding period completed and payments may be converted into the equivalentnumber of shares. In case the grantee is separated, not for cause, but through retrenchment andredundancy, subscribed shares may be paid in full, unsubscribed shares may be subscribed, orpayments may be converted into the equivalent number of shares. In case the grantee retires, thegrantee may subscribe to the unsubscribed shares anytime within the ten (10)-year period. The plandoes not allow sale or assignment of the shares. All shares acquired through the Plan are subject tothe Parent Company’s right to repurchase.
The subscribed shares are effectively treated as options exercisable within a given period which isthe same time as the grantee’s payment schedule. The fair values of stock options granted areestimated on the date of grant using the Black-Scholes Merton (BSM) Formula and Binomial TreeModel (BTM), taking into account the terms and conditions upon which the options were granted.The BSM Formula and BTM Model requires six inputs to produce an option stock value namely;market value of the share, book value of the share, time to maturity, volatility rate, dividend yield, andrisk free rate. The expected volatility was determined based on an independent valuation.
Movements in the number of options outstanding and weighted average exercise prices (WAEP)under ESOWN follow:
2018 WAEP 2017 WAEPAt January 1 5,150,628 P=19.31 7,288,035 P=19.95Granted 10,384,365 11,420,517Subscribed (9,933,523) 41.14 (12,264,970) 33.32Availment 96,516 113,541Cancelled (96,516) (1,406,495)At December 31 5,601,470 P=32.71 5,150,628 P=19.31
The fair value of stock options granted under ESOWN at grant date and the assumptions used todetermine the fair value of the stock options follow:
Grant DateMarch 28,
2018March 01,
2017April 05,
2016March 20,
2015March 20,
2014March 18,
2013March 13,
2012March 31,
2011Number of unsubscribed
shares − − 181,304 − 1,369,887 1,713,868 3,967,302 3,843,057Fair value of each option
(BTM) P=− P=8.48 P=13.61 P=16.03 P=12.60 P=16.05 P=9.48 P=7.81Fair value of each option
(BSM) P=12.71 P=− P=18.21 P=20.63 P=12.16 P=11.85 P=6.23 P=7.27Weighted average share price P=41.20 P=39.72 P=35.58 P=36.53 P=31.46 P=30.00 P=21.98 P=15.5Exercise price P=45.07 P=35.81 P=26.27 P=29.58 P=22.55 P=21.45 P=14.69 P=13.2Expected volatility 34.04% 30.95% 32.03% 31.99% 33.50% 36.25% 33.00% 36.25%Dividend yield 1.22% 1.34% 1.27% 1.02% 1.42% 1.93% 0.9% 1.01%Interest rate 4.14% 4.41% 4.75% 4.11% 3.13% 2.78% 5.70% 5.60%
Total expense (included under “General and administrative expenses”) recognized in 2018, 2017 and2016 in the parent company statements of income arising from share-based payments amounted toP=98.52 million, P=153.8 million and P=208.3 million, respectively (see Note 21).

- 86 -
*SGVFS033960*
27. Financial Assets and Liabilities
Fair Value InformationThe following tables set forth the carrying values and estimated fair values of the ParentCompany’s financial assets and liabilities recognized as of December 31, 2018 and 2017:
2018 2017Carrying Value Fair Value Carrying Value Fair Value
Financial Assets at FVPL P=1,969,029 P=1,969,029 P=1,918,566 P=1,918,566Financial Assets at FVOCI
Unquoted equity securities 178,327,497 178,327,497 − −Quoted equity securities 69,073,950 69,073,950 − −
247,401,447 247,401,447 − −Available-for-Sale Financial Assets
Unquoted equity securities − − 165,740,922 165,740,922Quoted equity securities − − 51,973,998 51,973,998
− − 217,714,920 217,714,920P=249,370,476 P=249,370,476 P=219,633,486 P=219,633,486
Loans and Receivables Trade residential and office development P=− P=− P=30,870,053,637 P=28,598,338,603 Receivable from employees − − 203,392,990 203,407,985
P=− P=− P=31,073,446,627 P=28,801,746,588Financial assets at amortized cost Trade residential and office development P=36,813,840,342 P=35,922,083,155 P=− P=− Receivable from employees 227,170,279 233,819,753 − −
P=37,041,010,621 P=36,155,902,908 P=− P=−Other Financial Liabilities
Long-term debt 142,914,447,650 126,995,645,286 125,242,896,181 116,718,280,937Deposits and other noncurrent liabilities 3,658,235,592 3,629,768,661 7,727,724,424 7,756,008,339
P=146,572,683,242 P=130,625,413,947 P=132,970,620,605 P=124,474,289,276
The methods and assumptions used by the Parent Company in estimating the fair value of thefinancial instruments are as follows:
Cash and cash equivalents, current receivables, accounts and other payables, current payables andshort term debt - Carrying amounts approximate fair values due to the relatively short-term maturitiesof these financial instruments.
Financial assets at FVPL - These are investments in UITF. Fair value is based on net asset valuesas of reporting dates.
Noncurrent accounts receivable - The fair values of residential accounts receivable, and receivablefrom employees, are based on the discounted value of future cash flows using the applicable rates forsimilar types of instruments. The discount rates used for residential accounts receivable ranged from1.8% to 6.7% as of December 31, 2017. The discount rates used for receivable from employeesranged from 6.0% to 12.0% as of December 31, 2018 and 2017
Financial assets at FVOCI and AFS quoted equity and debt securities - Fair values are based onquoted prices published in markets.
Financial assets at FVOCI unquoted equity securities - Fair values are based on the latest sellingprice available.
AFS unquoted equity securities - These are carried at cost less allowance for impairment lossesbecause fair value cannot be measured reliably due to lack of reliable estimates of future cash flowsand discount rates necessary to calculate the fair value.

- 87 -
*SGVFS033960*
Liabilities - The fair value of noncurrent unquoted instruments are estimated using the discountedcash flow methodology using the Parent Company’s current incremental borrowing rates for similarborrowings with maturities consistent with those remaining for the liability being valued. The discountrates used ranged from 7.3% to 8.8% and 3.9% to 7.2% as of December 31, 2018, and 2017,respectively. The fair value of noncurrent unquoted debt instruments with floating rates are estimatedusing discounted cash flow - last repricing method.
Fair Value HierarchyThe Parent Company uses the following hierarchy for determining and disclosing the fair value of thefinancial instruments by valuation technique:
Level 1: quoted (unadjusted prices) in active markets for identical assets and liabilitiesLevel 2: other techniques for which all inputs which have a significant effect on the recorded
fairvalue are observable in the market, either directly or indirectlyLevel 3: techniques whic h use inputs which have a significant effect on the recorded fair value
that are not based on observable market data
The Parent Company categorizes trade receivable, receivable from employees, long-term debt anddeposits and other noncurrent liabilities under Level 3. The fair value of these financial instruments isdetermined by discounting future cash flows using the applicable rates of similar types of instrumentsplus a certain spread. This spread is the unobservable input and the effect of changes to this is thatthe higher the spread, the lower the fair value.
Quoted FVOCI and AFS financial assets amounting to P=69.0 million and P=52.0 million as ofDecember 31, 2018 and 2017, respectively, were classified under the Level 1 category (see Note 9).
Unquoted FVOCI financial assets amounting to P=178.3 million as of December 31, 2018 wereclassified under Level 3 (see Note 9).
Investment in UITF amounting to P=2.0 million and P=1.9 million as of December 31, 2018, and 2017,respectively were classified under Level 2 (see Note 5).
There have been no reclassifications from Level 1 to Level 2 categories in 2018 and 2017.
Financial Risk Management Objectives and PoliciesThe Parent Company’s principal financial instruments comprise cash and cash equivalents, financialassets at FVPL, AFS quoted and unquoted equity securities, bank loans, corporate notes and bonds.The financial debt instruments were issued primarily to raise financing for the Parent Company’soperations. The Parent Company has various financial assets such trade receivables and tradepayables which arise directly from the conduct of its operations.
Exposure to liquidity, credit, interest rate, foreign currency risks and equity price arise in the normalcourse of the Parent Company’s business activities. The main objectives of the Parent Company’sfinancial risk management are as follows:∂ to identify and monitor such risks on an ongoing basis;∂ to minimize and mitigate such risks; and∂ to provide a degree of certainty about costs.
The use of derivative financial instruments, if any, is solely for management of the Parent Company’sfinancial risk exposures. It is the Parent Company’s policy not to enter into derivative transactions forspeculative purposes.
The Parent Company’s financing and treasury function operates as a centralized service formanaging financial risks and activities as well as providing optimum investment yield and cost-efficient funding for the Parent Company.

- 88 -
*SGVFS033960*
There were no changes in the Parent Company’s financial risk management objectives and policiesin 2018 and 2017.
Liquidity riskLiquidity risk is defined by the Parent Company as the risk of losses arising from funding difficultiesdue to deterioration in market conditions and/or the financial position of the Parent Company thatmake it difficult for the Parent Company to raise the necessary funds or that forces the ParentCompany to raise funds at significantly higher interest rates than usual.
This is also the possibility of experiencing losses due to the inability to sell or convert marketablesecurities into cash immediately or in instances where conversion to cash is possible but at loss dueto wider than normal bid-offer spreads.
The Parent Company employs scenario analysis and contingency planning to actively manage itsliquidity position and guarantee that all operating, investing and financing needs are met. The ParentCompany has come up with a three-layered approach to liquidity through the prudent management ofsufficient cash and cash equivalents, the potential sale of accounts receivables and the maintenanceof short-term revolving credit facilities.
Cash and cash equivalents are maintained at a level that will enable it to fund its general andadministrative expenses as well as to have additional funds as buffer for any opportunities oremergencies that may arise. Management develops viable funding alternatives through a continuousprogram for the sale of its receivables and ensures the availability of ample unused short-termrevolving credit facilities from both local and foreign banks as back-up liquidity.
The Parent Company ascertains that its cash is invested in short-term bank placements and specialdeposit accounts, as well as in high-quality and marketable government and corporate securities.
The table summarizes the maturity profile of the Parent Company’s financial liabilities atDecember 31, 2018 and 2017 based on contractual undiscounted payments:
December 31, 2018
< 1 year 1 to < 5 years > 5 years TotalAccounts and other payables P=80,587,225,116 P=– P=– P=80,587,225,116Short-term debt 13,500,900,000 – – 13,500,900,000Long-term debt 20,255,266,261 59,370,346,135 63,288,835,254 142,914,447,650Deposits and other current
liabilities 1,998,803,799 – – 1,998,803,799Deposits and other noncurrent
liabilities 25,875,052 3,632,360,540 – 3,658,235,592P=116,368,070,228 P=63,002,706,675 P=63,288,835,254 P=242,659,612,157
Interest payable* P=5,584,269,409 P=23,624,390,149 P=11,541,745,071 P=40,750,404,629*includes future interest payment
December 31, 2017
< 1 year 1 to < 5 years > 5 years TotalAccounts and other payables P=51,567,366,782 P=– P=– P=51,567,366,782Short-term debt 16,991,350,000 – – 16,991,350,000Long-term debt 971,190,276 45,828,337,418 78,443,368,487 125,242,896,181Deposits and other current
liabilities 3,597,501,899 – – 3,597,501,899Deposits and other noncurrent
liabilities – 7,727,724,424 – 7,727,724,424P=73,127,408,957 P=53,556,061,842 P=78,443,368,487 P=205,126,839,286
Interest payable* P=4,866,829,683 P=20,095,924,263 P=11,320,315,530 P=36,283,069,477*includes future interest payment

- 89 -
*SGVFS033960*
Cash and cash equivalents and financial assets at FVPL are used for the Parent Company’s liquidityrequirements. Please refer to the terms and maturity profile of these financial statements under thematurity profile of the interest-bearing financial assets and liabilities disclosed in the interest rate risksection. There were no undrawn loan commitments from long-term credit facilities as ofDecember 31, 2018 and 2017.
Credit riskCredit risk is a risk that counterparty will not meet its obligation under its financial instrument orcustomer contract leading to a financial loss.
The Parent Company’s credit risks are primarily attributable to installments receivable, rentalreceivables and other financial assets. To manage credit risks, the Parent Company maintainsdefined credit policies and monitors its exposure to credit risks on a continuous basis.
In respect to installments receivable from the sale of properties, credit risk is managed primarilythrough credit reviews and an analysis of receivables on a continuous basis. The Parent Companyalso undertakes supplemental credit review procedures for certain installment payment structures.The Parent Company’s stringent customer requirements and policies in place contribute to lowercustomer default than its competitors. Customer payments are facilitated through various collectionmodes including the use of postdated checks and auto-debit arrangements. Exposure to bad debts isnot significant as title to real estate properties are not transferred to the buyers until full payment hasbeen made and the requirement for remedial procedures is minimal given the profile of buyers.
Credit risk arising from rental income from leasing properties is primarily managed through a tenantselection process. Prospective tenants are evaluated on the basis of payment track record and othercredit information. In accordance with the provisions of the lease contracts, the lessees are requiredto deposit with the Parent Company security deposits and advance rentals which helps reduce theParent Company’s credit risk exposure in case of defaults by the tenants. For existing tenants, theParent Company has put in place a monitoring and follow-up system. Receivables are aged andanalyzed on a continuous basis to minimize credit risk. Regular meetings with tenants are alsoundertaken to provide opportunities for counseling and further assessment of paying capacity.
Other financial assets comprise cash and cash equivalents, excluding cash on hand, financial assetsat FVPL and financial assets at FVOCI. The Parent Company adheres to fixed limits and guidelinesin its dealings with counterparty banks and its investment in financial instruments. Bank limits areestablished on the basis of an internal rating system that principally covers the areas of liquidity,capital adequacy and financial stability. The rating system likewise makes use of availableinternational credit ratings. Given the high credit standing of its accredited counterparty banks,management does not expect any of these financial institutions to fail in meeting their obligations.Nevertheless, the Parent Company closely monitors developments over counterparty banks andadjusts its exposure accordingly while adhering to pre-set limits.
The Parent Company’s maximum exposure to credit risk as of December 31, 2018 and 2017 is equalto the carrying values of its financial assets.
Given the Parent Company’s diverse base of counterparties, it is not exposed to large concentrationsof credit risk.
An impairment analysis is performed at each reporting date using a provision matrix to measureexpected credit losses. The provision rate based on days past due of all customers as they havesimilar loss patterns. Generally, trade receivables are written off if past due for more than one yearand are not subject to enforcement activity. The security deposits and advance rental are consideredin the calculation of impairment as recoveries. As of December 31, 2018 and 2017, the exposure atdefault amounts to P=43,604.0 million and P=43,638.4 million, respectively. The expected credit lossrate is 0.4% that resulted in the ECL of P=171.0 million and P=168.7 million as of December 31, 2018and December 31, 2017, respectively.

- 90 -
*SGVFS033960*
As of December 31, 2018 and 2017, the aging analysis of past due but not impaired trade receivables presented per class, is as follows:
2018Neither
Past Due Past Due but not Impaired Individuallynor Impaired 30 days 30-60 days 60-90 days 90-120 days 120 days Total Impaired Total
TradeResidential development P=33,149,446,879 P=794,998,504 P=692,326,525 P=470,939,019 P=297,797,643 P=1,408,331,772 P=3,664,393,463 P=− P=36,813,840,342Corporate business 566,451,614 3,157,796 18,773,530 26,861,061 4,925,261 55,769,512 109,487,160 21,954,380 697,893,154Shopping centers 464,946,412 5,018,140 2,221,089 2,841,605 2,364,043 44,102,885 56,547,762 41,154,049 562,648,223Rent receivables 11,792,950 − − − − − − − 11,792,950Others 1,761,052,911 − − − − − − − 1,761,052,911
Receivable from related parties 37,692,233,291 − − − − − − − 37,692,233,291Advances to other companies 10,752,450,763 − − − − − − − 10,752,450,763Dividends receivable 1,984,062,467 − − − − − − − 1,984,062,467Receivable from employees 227,170,279 − − − − − − − 227,170,279Interest receivable 12,711,404 − − − − − − − 12,711,404
P=86,622,318,970 P=803,174,440 P=713,321,144 P=500,641,685 P=305,086,947 P=1,508,204,169 P=3,830,428,385 P=63,108,429 P=90,515,855,784
2017Neither
Past Due Past Due but not Impaired Individuallynor Impaired 30 days 30-60 days 60-90 days 90-120 days 120 days Total Impaired Total
Trade Residential development P=28,928,864,344 P=233,302,715 P=317,461,854 P=223,872,160 P=335,033,198 P=831,519,366 P=1,941,189,293 P=− P=30,870,053,637 Corporate business 480,730,946 780,219 12,920,181 6,868,557 21,735,525 55,347,995 97,652,477 21,954,380 600,337,803 Shopping centers 339,773,506 6,047,785 10,573,315 2,479,737 4,283,415 93,749,291 117,133,543 39,140,844 496,047,893 Rent receivables 8,510,295 − − − − − − − 8,510,295 Others 1,126,434,420 − − − − − − − 1,126,434,420Receivable from related parties 39,604,749,149 − − − − − − − 39,604,749,149Advances to other companies 9,295,570,595 − − − − − − − 9,295,570,595Dividends receivable 2,261,645,426 − − − − − − − 2,261,645,426Receivable from employees 203,392,990 − − − − − − − 203,392,990Interest receivable 12,656,112 − − − − − − − 12,656,112
P=82,262,327,783 P=240,130,719 P=340,955,350 P=233,220,454 P=361,052,138 P=980,616,652 P=2,155,975,313 P=61,095,224 P=84,479,398,320

- 91 -
*SGVFS033960*
The table below shows the credit quality of the Parent Company’s financial assets as of December 31, 2018 and 2017:
December 31, 2018
Neither Past Due nor Impaired Past Due but IndividuallyHigh Grade Medium Grade Low Grade Unrated Total not Impaired Impaired Total
Cash and cash equivalents (excluding cashon hand) P=1,122,562,869 P=– P=– P=– P=1,122,562,869 P=– P=– P=1,122,562,869
Financial asset at FVPL 1,969,029 – – – 1,969,029 – – 1,969,029Accounts and notes receivables Trade Residential development 33,149,446,879 – 33,149,446,879 3,664,393,463 – 36,813,840,342 Corporate business 566,451,614 – – – 566,451,614 109,487,160 21,954,380 697,893,154 Shopping centers 444,222,792 20,723,620 – – 464,946,412 56,547,762 41,154,049 562,648,223 Rent receivables 11,792,950 – – – 11,792,950 – − 11,792,950 Others 1,761,052,911 – – – 1,761,052,911 – – 1,761,052,911 Advances to other companies 10,752,450,763 – – – 10,752,450,763 – – 10,752,450,763 Receivable from related parties 37,692,233,291 – – – 37,692,233,291 – – 37,692,233,291 Dividends receivable 1,984,062,467 – – – 1,984,062,467 – – 1,984,062,467 Receivable from employees 227,170,279 – – – 227,170,279 – – 227,170,279 Interest receivable 12,711,404 – – – 12,711,404 – – 12,711,404Financial Assets at Fair Value through OCI Unquoted – – – 178,327,497 178,327,497 – 178,327,497 Quoted 69,073,950 – – – 69,073,950 – – 69,073,950
P=87,795,201,198 P=20,723,620 P=- P=178,327,497 P=87,994,252,315 P=3,830,428,385 P=63,108,429 P=91,887,789,129

- 92 -
*SGVFS033960*
December 31, 2017
Neither Past Due nor Impaired Past Due but IndividuallyHigh Grade Medium Grade Low Grade Unrated Total not Impaired Impaired Total
Cash and cash equivalents (excluding cashon hand) P=586,369,974 P=– P=– P=– P=586,369,974 P=– P=– P=586,369,974
Financial asset at FVPL 1,918,566 – – – 1,918,566 – – 1,918,566Accounts and notes receivables Trade Residential development 26,578,675,035 1,595,586,284 754,603,025 – 28,928,864,344 1,941,189,293 – 30,870,053,637 Corporate business 480,730,946 – – – 480,730,946 97,652,477 21,954,380 600,337,803 Shopping centers 339,773,506 – – – 339,773,506 117,133,543 39,140,844 496,047,893 Rent receivables 8,510,295 – – – 8,510,295 – − 8,510,295 Others 1,126,434,420 – – – 1,126,434,420 – – 1,126,434,420 Advances to other companies 9,295,570,595 – – – 9,295,570,595 – – 9,295,570,595 Receivable from related parties 39,604,749,149 – – – 39,604,749,149 – – 39,604,749,149 Receivable from employees 2,261,645,426 – – – 2,261,645,426 – – 2,261,645,426 Dividends receivable 203,392,990 – – – 203,392,990 – – 203,392,990 Interest receivable 12,656,112 – – – 12,656,112 – – 12,656,112AFS financial assets Unquoted – – – 165,740,922 165,740,922 – – 165,740,922 Quoted 51,973,998 – – – 51,973,998 – – 51,973,998
P=80,552,401,012 P=1,595,586,284 P=754,603,025 P=165,740,922 P=83,068,331,243 P=2,155,975,313 P=61,095,224 P=85,285,401,780

- 93 -
*SGVFS033960*
The credit quality of the financial assets was determined as follows:
Cash and cash equivalents, financial assets at FVPL, financial assets at FVOCI and AFS quotedsecurities - based on the nature of the counterparty and the Parent Company’s internal rating system.
Receivables - high grade pertains to receivables with no default in payment; medium grade pertainsto receivables with up to three (3) defaults in payment in the past; and low grade pertains toreceivables with more than three (3) defaults in payment.
The unquoted AFS financial assets and unquoted financial assets at FVOCI are unrated.
Interest rate riskInterest rate risk is the risk that the fair value or future cash flows of a financial instrument willfluctuate because of changes in market interest rates.
The Parent Company’s interest rate risk management policy centers on reducing the overall interestexpense and exposure to changes in interest rates. Changes in market interest rates relate primarilyto the Parent Company’s interest-bearing debt obligations with floating interest rate as it can cause achange in the amount of interest payments.
The Parent Company manages its interest rate risk by leveraging on its premier credit rating andincreasing the fixed interest component of its debt portfolio. The Parent Company’s ratio of fixed tofloating rate debt stood at 91:9 and 83:17 as of December 31, 2018, and 2017 respectively.
The following tables demonstrate the sensitivity of the Parent Company’s income before income taxand equity to a reasonably possible change in interest rates on December 31, 2018 and 2017, with allvariables held constant, (through the impact of floating rate borrowings and changes in fair value ofAFS financial assets):
2018Effect on income before income tax
Change in basis points+100 basis points -100 basis points
Floating rate borrowings (P=135,009,000) P=135,009,000
2017Effect on income before income tax
Change in basis points+100 basis points -100 basis points
Floating rate borrowings (P=185,079,738) P=185,079,738
The assumed change in rate is based on the currently observable market environment. There is noother impact on the Parent Company’s equity other than those already affecting the net income.

- 94 -
*SGVFS033960*
The terms and maturity profile of the interest-bearing financial assets and liabilities, together with its corresponding nominal amounts and carrying values are shown in thefollowing tables:
2018
Interest terms (p.a.) Rate Fixing Period Nominal Amount < 1 year 1 to 5 years > 5 years Carrying ValueParent CompanyCash and cash equivalents
(excluding cash on hand)Fixed at the date of investment Various P=1,122,562,869 P=1,122,562,869 P=– P=– P=1,122,562,869Accounts and notes
receivable Fixed at the date of sale Date of sale 227,170,279 227,170,279 – – 227,170,279P=1,349,733,148 P=1,349,733,148 P=– P=– P=1,349,733,148
CompanyShort-term debtFloating-Peso Variable Monthly P=13,500,900,000 P=13,500,900,000 P=– P=– P=13,500,900,000Long-term debtFixed Peso Fixed at 5.6250% to 6.0000% 7 and 10 years 15,000,000,000 9,341,196,399 5,644,680,177 – 14,985,876,576 Peso Fixed at 4.6250% to 6.0000% 7,10.5 and 20 years 21,000,000,000 – 18,989,546,159 1,907,664,328 20,897,210,487 Peso Fixed at 5.6250% 11 years 8,000,000,000 – – 7,945,703,284 7,945,703,284 Peso Fixed at 4.5000% 7 years 7,000,000,000 – 6,960,744,471 – 6,960,744,471 Peso Fixed at 3.8915% to 4.85% 7, 9.5 and 10 years 22,000,000,000 – 6,952,612,918 14,888,888,878 21,841,501,796 Peso Fixed at 3.00% 3 years 2,982,530,000 2,971,976,035 – – 2,971,976,035 Peso Fixed at 5.2624% 10 years 7,000,000,000 – – 6,969,629,781 6,969,629,781 Peso Fixed at 5.9203% to 7.0239% 5 and 10 years 18,000,000,000 – 7,909,304,599 9,886,827,793 17,796,132,392 Peso Fixed at 2.7500% 1.75 years 4,300,000,000 4,295,630,115 – – 4,295,630,115 Peso Fixed at 3.2500% 1.25 years 3,100,000,000 3,097,744,962 – – 3,097,744,962 Peso Fixed at 4.5000% to 7.8750% 5, 10 and 15 years 5,770,000,000 60,000,000 4,800,000,000 904,858,778 5,764,858,778 Peso Fixed at 4.50% to 4.949% Up to 10.5 years 29,465,676,562 488,718,750 8,113,457,812 20,785,262,411 29,387,438,973FloatingUSD Variable 3.4 and 10.3 years – – – – –
P=157,119,106,562 P=33,756,166,261 P=59,370,346,136 P=63,288,835,253 P=156,415,347,650

- 95 -
*SGVFS033960*
2017
Interest terms (p.a.) Rate Fixing Period Nominal Amount < 1 year 1 to 5 years > 5 years Carrying ValueParent CompanyCash and cash equivalents
(excluding cash on hand)Fixed at the date of investment Various P=586,369,974 P=586,369,974 P=– P=– P=586,369,974Accounts and notes
receivable Fixed at the date of sale Date of sale 205,629,855 203,392,990 2,236,865 – 205,629,855P=791,999,829 P=789,762,964 P=2,236,865 P=– P=791,999,829
CompanyShort-term debtFloating-Peso Variable Monthly P=16,991,350,000 P=16,991,350,000 P=– P=– P=16,991,350,000Long-term debtFixed Peso Fixed at 5.6250% to 6.0000% 7 and 10 years 15,000,000,000 – 14,968,116,469 – 14,968,116,469 Peso Fixed at 4.6250% to 6.0000% 7,10.5 and 20 years 21,000,000,000 – 3,984,041,328 16,894,123,088 20,878,164,416 Peso Fixed at 5.6250% 11 years 8,000,000,000 – – 7,938,922,633 7,938,922,633 Peso Fixed at 4.5000% 7 years 7,000,000,000 – 6,953,043,125 – 6,953,043,125 Peso Fixed at 3.8915% to 4.85% 7, 9.5 and 10 years 22,000,000,000 – – 21,819,967,213 21,819,967,213 Peso Fixed at 3.00% 3 years 2,990,950,000 – 2,969,107,726 – 2,969,107,726 Peso Fixed at 5.2624% 10 years 7,000,000,000 – – 6,966,801,225 6,966,801,225 Peso Fixed at 2.7500% 1.75 years 4,300,000,000 – 4,280,936,331 – 4,280,936,331 Peso Fixed at 3.2500% 1.25 years 3,100,000,000 – 3,082,432,587 – 3,082,432,587 Peso Fixed at 4.5000% to 7.8750% 5, 10 and 15 years 9,064,000,000 93,000,000 3,541,000,000 5,408,575,573 9,042,575,573 Peso Fixed at 4.50% to 4.949% Up to 10.5 years 24,873,145,313 399,593,750 5,614,450,000 18,812,161,383 24,826,205,133Floating
USD Variable at 1.509% to 2.773%over 3-month LIBOR 3.4 and 10.3 years 1,516,623,750 478,596,526 435,209,852 602,817,372 1,516,623,750
P=142,836,069,063 P=17,962,540,276 P=45,828,337,418 P=78,443,368,487 P=142,234,246,181

- 96 -
*SGVFS033960*
Foreign currency riskForeign currency risk is the risk that the fair value or future cash flows of a financial instrument willfluctuate because of changes in foreign exchange rates.
Financial assets and credit facilities of the Parent Company, as well as major contracts enteredinto for the purchase of raw materials, are mainly denominated in Philippine Peso. There are onlyminimal placements in foreign currencies. As such, the Parent Company’s foreign currency risk isminimal.
The following table shows the Parent Company’s foreign currency-denominated monetary assetsand liabilities and their peso equivalents as of December 31, 2018 and 2017:
2018 2017US Dollar Php Equivalent US Dollar Php Equivalent
Financial AssetsCash and cash equivalents $416,925 P=21,921,920 $2,361,797 P=117,924,531Financial LiabilitiesShort-term debt – – – –Long-term debt – – 30,375,000 1,516,623,750
$– P=– $30,375,000 P=1,516,623,750Net foreign currency-denominated
assets/(liabilities) $416,925 P=21,921,920 ($28,013,203) (P=1,398,699,219)
In translating the foreign currency-denominated monetary assets in peso amounts, the exchangerate used were P=52.58 to US$1.00 and P=49.93 to US$1.00, the Philippine Peso - USD exchangerates as of December 31, 2018 and 2017, respectively.
The following table demonstrates the sensitivity to a reasonably possible change in the PhilippinePeso - U.S. Dollar exchange rate, with all variables held constant, of the Parent Company’s profitbefore tax (due to changes in the fair value of monetary assets and liabilities).
Increase (decrease) Effect on profit before taxin exchange rate 2018 2017 P=1.00 416,925 (28,013,203)(1.00) (416,925) 28,013,203)
There is no impact on the Parent Company’s equity other than those already affecting net income.
Equity price riskQuoted financial assets are acquired at a certain price in the market. Such investment securitiesare subject to price risk due to changes in market values of instruments arising either from factorsspecific to individual instruments or their issuers or factors affecting all instruments traded in themarket. Depending on several factors such as interest rate movements, country’s economicperformance, political stability, domestic inflation rates, these prices change, reflecting howmarket participants view the developments.
The Parent Company’s market risk policy requires it to manage such risks by setting andmonitoring objectives and constraints on investments; diversification plan; limits on investment ineach country, sector and market.

- 97 -
*SGVFS033960*
The analysis below demonstrates the sensitivity to a reasonably possible change of market indexwith all other variables held constant, of the Parent Company’s equity.
Effect on equityIncrease (decrease)
Change in PSEi index 2018 2017(In Thousands)
+5% P=287,990 P=173,796 -5% (287,990) (173,796)
Quoted financial assets at FVPL pertain to investment in UITF (Fund). The Fund, which isstructured as a money market UITF, aims to generate liquidity and stable income by investing in adiversified portfolio of primarily short-term fixed income instruments.
As of December 31, 2018 and 2017, the Parent Company's investment in the fund where all othervariables held constant, the fair value, net income and equity will increase (decrease) by: (i) BPIUITF P=8,073 with a duration of 0.4 year and P=7,482 with a duration of 0.4 year, respectively, for a100 basis points decrease or increase, in interest rates.
28. Segment Information
The industry segments where the Parent Company operates follow:
Core business:∂ Shopping centers - development of shopping centers and lease to third parties of retail space
and land therein; operation of movie theaters, food courts, entertainment facilities andcarparks in these shopping centers; management and operation of malls which are co-ownedwith partners
∂ Corporate business - development and lease of office buildings∂ Residential developments - sale of high-end and upper middle-income residential lots and
units, and leisure community developments; lease of residential developments under jointventure; acquisition, development and sale of large-scale, mixed-use, master-plannedcommunities; sale of override units or the Parent Company’s share in properties madeavailable to subsidiaries for development.
∂ Corporate - company-wide activities not catering to specific business units
Support Business:∂ Property management - facilities management of the Parent Company
Assets, liabilities, revenues and expenses of the Strategic Landbank Management and Visayas-Mindanao segment were reallocated to other business segments namely, shopping centers,corporate businesses and residential developments according to the nature of the products andservices provided.
Management committee monitors the operating results of its business units separately for thepurpose of making decisions about resource allocation and performance assessment.
For the years ended December 31, 2018 and 2017, there were no revenue transactions with asingle external customer which accounted for 10% or more of the consolidated revenue fromexternal customers.

- 98 -
*SGVFS033960*
Business segmentsThe following tables regarding business segments present assets and liabilities as of December 31 and revenue and profit information for the years ended December 31:
2018
PropertyDevelopment
ShoppingCenters Offices
PropertyManagement and
Others Corporate TotalRevenueRevenues from contracts with customers P=36,135 P=505 P=237 P= − P= − P=36,877Interest income from real estate sales 1,701 − − − − 1,701Rental revenue 28 1,581 2,397 56 − 4,062Total revenue 37,864 2,086 2,634 56 − 42,640Real estate costs and expenses 25,848 1,260 675 7 795 28,585
Operating profit 12,016 826 1,959 49 (795) 14,055General and administrative expenses (524) (454) (179) (83) (1,028) (2,268)Interest expense and other financing charges (424) – (1) – (7,742) (8,167)Interest income 3 2 1 179 480 665Other income 277 328 − – 3,081 3,686Dividend income – – – – 8,621 8,621Other expenses – (2) – − – (2)Other charges – – – – (93) (93)Provision for income tax (178) – (405) – (715) (1,298)Net income P=11,170 P=700 P=1,375 P=145 P=1,809 P=15,199Other InformationSegment assets P=147,943 P=87,482 P=47,230 P=31,351 P=78,399 P=392,405Deferred tax assets – – – – 2,562 2,562Total assets P=147,943 P=87,482 P=47,230 P=31,351 P=80,961 P=394,967Segment liabilities (P=95,087) (P=65,187) (P=30,723) (P=56,863) (P=20,683) (P=268,543)Segment additions to:Property and equipment P=34 P=230 P=26 P=7 P=135 P=432Investment properties 3,647 10,569 2,706 1,480 (P=12) 18,390Depreciation and amortization P=25 P=727 P=367 P=4 P=91 P=1,214
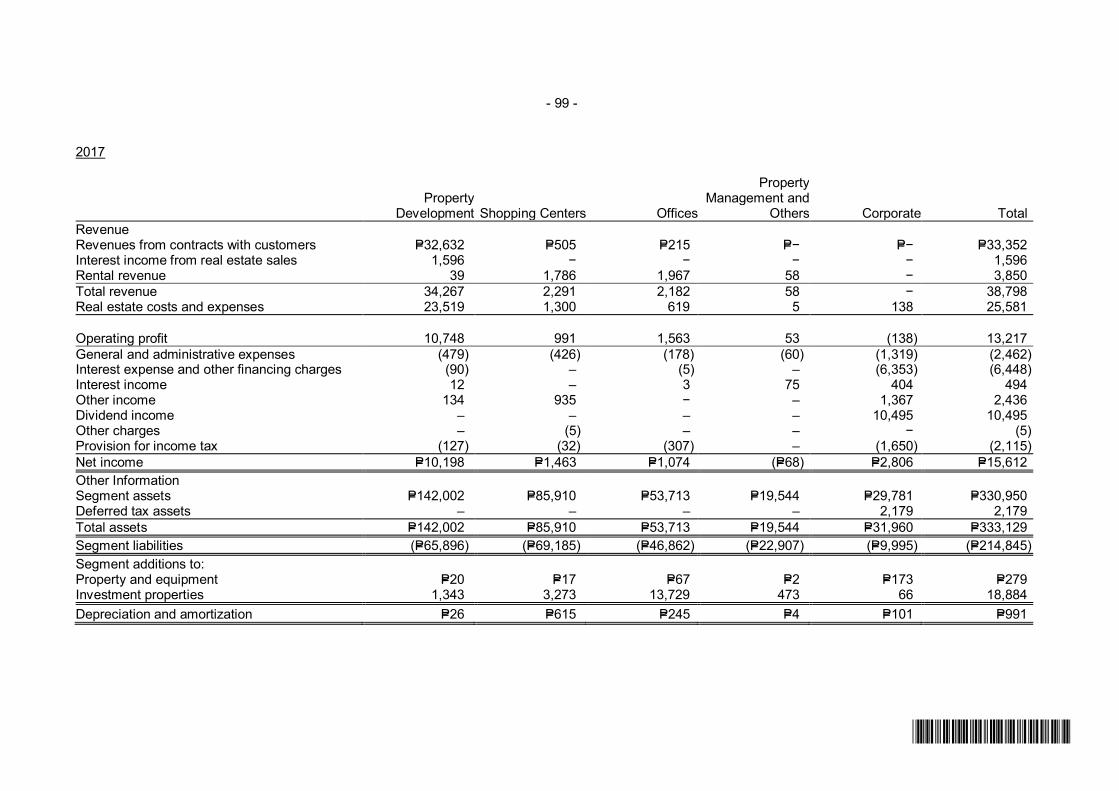
- 99 -
*SGVFS033960*
2017
PropertyDevelopment Shopping Centers Offices
PropertyManagement and
Others Corporate TotalRevenueRevenues from contracts with customers P=32,632 P=505 P=215 P=− P=− P=33,352Interest income from real estate sales 1,596 − − − − 1,596Rental revenue 39 1,786 1,967 58 − 3,850Total revenue 34,267 2,291 2,182 58 − 38,798Real estate costs and expenses 23,519 1,300 619 5 138 25,581
Operating profit 10,748 991 1,563 53 (138) 13,217General and administrative expenses (479) (426) (178) (60) (1,319) (2,462)Interest expense and other financing charges (90) – (5) – (6,353) (6,448)Interest income 12 – 3 75 404 494Other income 134 935 − – 1,367 2,436Dividend income – – – – 10,495 10,495Other charges – (5) – – − (5)Provision for income tax (127) (32) (307) – (1,650) (2,115)Net income P=10,198 P=1,463 P=1,074 (P=68) P=2,806 P=15,612Other InformationSegment assets P=142,002 P=85,910 P=53,713 P=19,544 P=29,781 P=330,950Deferred tax assets – – – – 2,179 2,179Total assets P=142,002 P=85,910 P=53,713 P=19,544 P=31,960 P=333,129Segment liabilities (P=65,896) (P=69,185) (P=46,862) (P=22,907) (P=9,995) (P=214,845)Segment additions to:Property and equipment P=20 P=17 P=67 P=2 P=173 P=279Investment properties 1,343 3,273 13,729 473 66 18,884Depreciation and amortization P=26 P=615 P=245 P=4 P=101 P=991

- 100 -
*SGVFS033960*
29. Performance Obligations
Information about the Parent Company’s performance obligations are summarized below:
Real estate salesThe Parent Company entered into contracts to sell with one identified performance obligation which isthe sale of the real estate unit together with the services to transfer the title to the buyer upon fullpayment of contract price. The amount of consideration indicated in the contract to sell is fixed andhas no variable consideration.
The sale of real estate unit may cover the contract for either the (i) serviced lot; (ii) service lot andhouse, and (ii) condominium unit and the Parent Company concluded that there is one performanceobligation in each of these contracts. The Parent Company recognizes revenue from the sale of thesereal estate projects under pre-completed contract over time during the course of the construction.
Payment commences upon signing of the contract to sell and the consideration is payable in cash orunder various financing schemes entered with the customer. The financing scheme would includepayment of 10% of the contract price spread over a certain period (e.g., one to two years) at a fixedmonthly payment with the remaining balance payable (a) in full at the end of the period either throughcash or external financing; or (b) through in-house financing which ranges from two (2) to ten (10)years with fixed monthly payment. The amount due for collection under the amortization schedule foreach of the customer does not necessarily coincide with the progress of construction, which results toeither a contract asset or contract liability.
After the delivery of the completed real estate unit, the Parent Company provides one year warrantyto repair minor defects on the delivered serviced lot and house and condominium unit. This isassessed by the Parent Company as a quality assurance warranty and not treated as a separateperformance obligation.
The transaction price allocated to the remaining performance obligations (unsatisfied or partiallysatisfied) as at December 31, 2018 are as follows:
Within one year P=19,606,414,936More than one year 22,347,460,487
P=41,953,875,423
The remaining performance obligations expected to be recognized within one year and in more thanone year relate to the continuous development of the Parent Company’s real estate projects. TheParent Company’s condominium units are completed within three years and five years, respectively,from start of construction while serviced lots and serviced lots and house are expected to becompleted within two to three years from start of development.
30. Leases
Operating Leases - Parent Company as LessorThe Parent Company entered into lease agreements with third parties covering its investmentproperty portfolio. These leases generally provide for either (a) fixed monthly rent, or (b) minimumrent or a certain percentage of gross revenue, whichever is higher.

- 101 -
*SGVFS033960*
Future minimum rentals receivable under noncancellable operating leases of the Parent Companyare as follows:
2018 2017Within one year P=1,877,760,950 P=970,730,347After one year but not more than five years 8,791,627,257 1,337,166,639More than five years 9,080,452,413 5,180,815,115
P=19,749,840,620 P=7,488,712,101
On January 1, 2015, the Parent Company and ACCI entered into a lease contract for the lease ofparcels of land and buildings within the Greenbelt and Glorietta development located at the AyalaCenter, Makati City. The lease shall be for a period of two years from January 1, 2015 untilDecember 31, 2016, renewable for another two years upon the written agreement of both parties.The lease generally provide for a fixed monthly rent and a certain percentage of gross rental revenueper month. The lease was renewed from January 1, 2017 to December 31, 2021 under the sameterms and conditions stated in the original contract of lease.
On January 1, 2017, the Parent Company and North Eastern Commercial Corp. (formerly AsterionTechnopod, Inc.) entered into a lease contract for the lease of a parcel of land with an area of 19,988sq.m., three office towers and a common retail podium mixed-use commercial building located at theVertis North estate. The lease of land shall be for a period of 25 years which commenced onJanuary 1, 2017. The commencement of the lease period for the buildings are by phase, Phase 1started on January 18, 2017, Phase 2 on April 1, 2017, Phase 3 on October 1, 2017 and Phase 4shall start on October 1, 2018. The lease on the buildings is co-terminous with the land lease. Thelease may be renewed for a period upon mutual agreement of both parties. The lease generallyprovide for a fixed monthly rent and a certain percentage of gross rental revenue per month.
On February 8, 2017, the Parent Company and North Eastern Commercial Corp. (formerly AsterionTechnopod, Inc.) entered into a lease contract for the lease of a for the lease of land and buildingconstructed on an approximately 20,000 sq.m parcel of land located at 30 Meralco Ave., Pasig City.The lease shall be for a period of 25 years which commenced on February 1, 2016 for Phase 1 andAugust 1, 2017 for Phase 2. The lease may be renewed for a period upon mutual agreement of bothparties. The lease generally provide for a fixed monthly rent and a certain percentage of gross rentalrevenue per month.
On December 27, 2017, the Parent Company signed a lease agreement with MCLC for the lease onthe parcels of land it owns where the buildings bought by MCLC were constructed. Please refer toNotes 11 and 23.
On December 28, 2017, the Parent Company signed a lease agreement with ASCVC for the lease onthe parcels of land it owns where the Arca South BPO and Mall were constructed. Please refer toNotes 11 and 23.
Operating Leases - Parent Company as Lessee
There are no future minimum rental payables under noncancellable operating leases since the ParentCompany has assigned to its subsidiaries, its rights to the properties leased from third parties.
On April 26, 2012, the Parent Company signed a Lease Agreement with the Province of NegrosOccidental for the lease of a parcel of land with an aggregate area of 40,481 sq. m. located alongGatuslao cor. North and South Capitol Roads, Bacolod City, registered in the name of the Province ofNegros Occidental. The Parent Company signed a 50-year lease contract with an option to renew asmay be mutually agreed upon by the lessor and the Parent Company. The lease was assigned bythe Parent Company to Capitol Central Commercial Ventures Corp., a wholly-owned subsidiary, onDecember 28, 2017.

- 102 -
*SGVFS033960*
On September 1, 2013, the Parent Company signed a Lease Agreement with Avida Land Corp. forthe lease of a parcel of land, with a total area of 19,311 sq. m., located along National Road,Muntinlupa City. The Parent Company signed a 50-year lease contract with an option to renew asmay be mutually agreed upon by the lessor and the Parent Company. The lease was assigned bythe Parent Company to Orion Land, Inc. on November 29, 2017.
On September 2, 2014, the Parent Company signed a Lease Agreement with D.M. Wenceslao &Associates Inc. for the lease of several parcels of land along Asean Avenue and MacapagalBoulevard, Aseana City, Paranaque City with an aggregate area of 92,317 sqm. The ParentCompany signed a 45-year lease contract with an option to renew for another 45 years subject tosuch terms and conditions as may be mutually agreed upon by the lessor and the Parent Company.The lease was assigned by the Parent Company to Bay City Commercial Ventures Corp., a wholly-owned subsidiary, on December 28, 2017.
31. Long-term Commitments and Contingencies
CommitmentsOn December 8, 2017, ALI assigned to NTDCC development rights on certain portions of the NorthTriangle lot pads covered by a Deed of Assignment and Encroachment Settlement Agreementamounting to P=631.2 million.
On January 12, 2016, the Parent Company has entered into a partnership with Manila WaterPhilippine Ventures, Inc, a wholly owned subsidiary of Manila Water Company, Inc, for thewaterworks of Parent Company’s projects nationwide. The Memorandum of Agreement (MOA) wassigned by Parent Company and its subsidiaries and affiliates, Cebu Holdings, Inc. and Cebu PropertyVentures and Development Corp. Total expenses amounted to P=0.2 million.
The Parent Company and LT Parent Company, Inc. (LTG) entered into an agreement onJanuary 21, 2016 to jointly develop a project along the C5 corridor. The project is envisioned to be atownship development that spans portions of Pasig City and Quezon City. A new company named,ALI-ETON Property Development Corporation, was incorporated on March 13, 2016. The newcompany is a joint venture between the Parent Company and LT Parent Company, Inc.
On August 11, 2015, the Parent Company won the bid for the Integrated Transport System Project –South Terminal (“ITS South Project"). The Parent Company was awarded by the Department ofTransportation and Communications (“DOTC”) with a 35-year concession agreement to build andoperate the ITS South Project and will likewise have the right to develop and operate commercialleasing facilities on the same 5.57 hectare former Food Terminal Inc. property on which the futuretransport terminal will be built. The site of the ITS South Project is right next to ARCA South, wherethe Parent Company is developing an integrated mixed-use estate. It is estimated that up to 4,000buses and 160,000 passengers will feed into ITS South from SLEX every day. Full blast constructionof the terminal to start by 2H 2018 and targeted to be operational by 1H 2020.
On June 30, 2015, the Parent Company, through SM-ALI Parent Company Consortium (theConsortium), participated and won in the bidding for Lot No. 8-B-1, containing an area of 263,384sqm, which is portion of Cebu City-owned lot located at the South Road Properties, Cebu Citycovered by Transfer Certificate of Title No. 107-2011000963. The Consortium is a consortium amongSMPHI, the Parent Company and CHI (together with the Parent Company collectively referred to asthe “ALI Parent Company”). The SM-ALI Parent Company has finished with the joint masterplan andis now securing permits to commence development. Consistent with the agreed payment schedule inthe Deed of Absolute Sale, as of August 1, 2017 the Consortium has paid P=3.8 billion, excludingtaxes.

- 103 -
*SGVFS033960*
On May 12, 2014, the Parent Company has signed the terms of reference with Sureste Properties,Inc. (SPI), a wholly owned subsidiary of Bloomberry Resorts Corp. (BLOOM) for the retail area to beopened in the new Phase 1-A of Solaire Resort & Casino. The Parent Company will be the leasingand marketing agent of the said area with gross leasable area of more than 5,000 sq. m.
ContingenciesThe Parent Company has various contingent liabilities arising in the ordinary conduct of businessincluding a case related to property restriction violation. The estimate of the probable cost for theresolution of this claim has been developed in consultation with outside counsel handling the defensein this matter and is based upon an analysis of potential results. In the opinion of management andits legal counsel the eventual liability under these lawsuits or claims, if any, will not have a material oradverse effect on the Parent Company’s financial position and results of operations. Accordingly, noprovision for any liability has been made in the parent company financial statements.
Disclosures required by PAS 37, Provisions, Contingent Liabilities and Contingent Assets, were notprovided as it may prejudice the Parent Company’s position in ongoing claims and it can jeopardizethe outcome of the claims and contingencies.
32. Notes to Statements of Cash Flows
Disclosed below is the roll forward of liabilities under financing activities:
January 1, 2018 Cash flowsNon-cashchanges
Foreign exchangemovement
December 31,2018
Short-term debt P=16,991,350,000 (P=3,490,450,000) P=− P=− P=13,500,900,000Current long-term debt 971,190,276 (1,063,975,325) 20,255,266,261 92,785,049 20,255,266,261Non-current long-term debt 124,271,705,905 18,642,741,745 (20,255,266,261) − 122,659,181,389Dividends payable − (7,485,914,705) 7,485,914,705 − −Deposits and other
noncurrent liabilities 7,727,724,424 (3,701,101,787) − − 4,026,622,637Total liabilities from
financing activities P=149,961,970,605 P=2,901,299,928 P=7,485,914,705 P=92,785,049 P=160,441,970,287
The noncash activities of the Parent Company pertain to the following:
2018∂ Transfer from investment properties to inventory amounted to P=6,865.9 million∂ Transfer from inventory to investment properties amounted to P=0.4 million∂ Liability for purchased land amounted to P=2,277.06 million
2017∂ Transfer from investment properties to inventory amounted to P=5,291.3 million∂ Transfer from investment properties to advances to contractors amounted to P=1,581.2 million∂ Transfer from investment properties to other current assets amounted to P=86.3 million∂ Transfer from property and equipment to investment properties amounted to P=7.4 million∂ Transfer from inventory to investment properties amounted to P=2,507.1 million∂ Outstanding receivables pertaining to the sale of investment properties amounted to
P=9,298.9 million
33. Events After the Reporting Date
On February 4, 2019, the Executive Committee approved the exchange of the 20% equity interestacquired from Mitsubishi Corporation in Laguna Technopark, Inc. (LTI), equivalent to 8,051 commonshares, with a total value of P=800 million, for additional shares of stock in Prime Orion Philippines,Inc. (POPI), equivalent to 323,886,640 common shares, subject to conditions to be fulfilled by POPI.

- 104 -
*SGVFS033960*
On February 27, 2019, the BOD approved the declaration of cash dividends amounting to P=0.26 peroutstanding common share. These will be paid on March 29, 2019 to shareholders on record as ofMarch 13, 2019.
On the same date, the BOD approved the filing with the SEC of a 3-year shelf registration of up toP=50 billion of debt securities (‘the Shelf Registration’). It also approved the raising of up to P=45 billionthrough: (a) retail bonds of up to P=16 billion under the Shelf Registration and listed on the PhilippineDealing and Exchange Corporation (PDEx), (b) SEC-exempt Qualified Buyer Notes of up to P=4 billionfor enrollment on the PDEx, and (c) bilateral term loans of up to P=25 billion to partially finance generalcorporate requirements and to refinance maturing loans.
The BOD also approved the Parent Company’s 2019 stock option program pursuant to our EmployeeStock Ownership Plan (the “Plan”). The program authorizes the grant to qualified executives, inaccordance with the terms of the Plan, stock options covering up to a total of 14,430,750 commonshares at a subscription price of P=44.49 per share, which is the average price of our common sharesat the Philippine Stock Exchange over the last 30-day trading as of February 26, 2019.
34. Supplementary Information Required Under Revenue Regulations 15-2010
In compliance with the requirements set forth by Revenue Regulations 15-2010 hereunder are theinformation on taxes, duties and license fees paid or accrued during the taxable year.
Value-Added Tax (VAT)The Parent Company is a VAT-registered company with VAT output tax declaration as follows:
Net Sales/Receipts Output VAT
Taxable sales on: Sale of goods P=40,513,774,223 P=4,861,652,907 Leasing income 2,783,963,188 334,075,583
Sales to Government 563,069,524 67,568,343Others 5,809,394,134 697,127,295
Zero-Rated Sales 1,537,096,214 −P=51,207,297,283 P=5,960,424,128
The sale of goods is recorded under Land and residential sales account while leasing income isrecorded under Rental income. The amount of VAT Input taxes claimed are broken down as follows:
Balance at beginning of year (net Input VAT position) P=2,519,625,485Current year’s purchases: Capital goods subject to amortization 10,797,141Goods other than capital goods 26,076,237 Services lodged under other accounts 4,302,549,673 Services rendered by non-residents 138,646Input VAT attributed to Sales to Government 1,589,264Input VAT applied during the year (5,960,424,128)Balance at end of year P=900,352,318

- 105 -
*SGVFS033960*
Documentary Stamp Tax (DST)The DST paid or accrued on the following transactions are:
Transaction Amount DSTInterest expense and other financing charges
DST on loans P=204,301,674,091 P=161,621,829DST on Intercompany loan 23,134,739,000 6,732,115Issuance of PDTC bonds 18,000,000,000 135,000,000DST on original issue of shares of stock 1,574,933,415 12,938,217Shares of stock not traded in stock exchange 383,132,402 2,873,495
Direct Operating ExpensesDST on leases and other hiring agreements 1,486,133,839 2,012,892
General and administrative expenses – –DST on original issue of shares of stock 1,743,472,000 10,059,720DST on leases and other hiring agreements 9,976,773 21,101
Capitalized DSTDST on promissory note 889,865,513 3,445,848DST on transfer of real property 13,063,838,824 195,957,613
P=264,587,765,857 P=530,662,830
Taxes and LicensesThe following are the taxes, licenses and permit fees in 2018 excluding DST:
DirectOperatingExpenses
General andAdministrative
Expenses TotalLocalReal property tax P=411,142,226 P=120,413 P=411,262,639License and permit fees 254,327,775 28,344,207 282,671,982Inspection fees 1,537,831 – 1,537,831Motor vehicle registration fees – 769,145 769,145Professional tax 5,000 84,216 89,216Community tax − 11,985 11,985Transfer Tax 14,943,701 14,943,701Others 1,962,225 64,066 2,026,291
668,975,057 44,337,733 713,312,790NationalFringe benefits tax P=– P=17,715,249 P=17,715,249Annual registration – 500 500
– 17,715,749 17,715,749P=668,975,057 P=62,053,482 P=731,028,539
Withholding TaxesDetails of withholding taxes for the year are as follows:
Final withholding taxes P=1,464,543,151Expanded withholding taxes 1,380,500,598Withholding taxes on compensation and benefits 475,210,254Balance at December 31 P=3,320,254,003
Tax Assessments and CasesThe Parent Company has no deficiency tax assessments whether protested or not. The ParentCompany has not been involved in any tax cases under preliminary investigation, litigation, and/orprosecution in courts or bodies outside the BIR.