Patterns of local and regional grain size distribution and their application to Holocene climate...
9
Patterns of local and regional grain size distribution and their application to Holocene climate reconstruction in semi-arid Inner Mongolia, China Yi Yin, Hongyan Liu ⁎, Siyuan He, Fengjun Zhao, Jiangling Zhu, Hongya Wang, Guo Liu, Xiuchen Wu College of Urban and Environmental Sciences, and MOE Laboratory for Earth Surface Processes, Peking University, Beijing, 100871, China abstract article info Article history: Received 14 April 2010 Received in revised form 4 May 2011 Accepted 7 May 2011 Available online 24 May 2011 Keywords: Grain size Lacustrine sediment Aeolian activity Palaeoenvironmental reconstruction Semi-arid region Northern China The semi-arid temperate steppe in northern central China is one of the main areas influenced by frequent dust and sand storms, and is at the same time a primary source of dust from deteriorated grasslands; thus, the sediment grain size distribution of inland lakes in this region can be a particularly useful indicator of palaeoenvrionmental change. The local pattern of grain size suggests that aeolian activity is the most important agent for sedimentation in the lake center in this region, as strong northwesterly winds prevail for most of the year and the surface runoff is very weak. Meanwhile, the regional pattern of topsoil grain size and its close association with mean annual precipitation (MAP) allows the establishment of a statistical model for palaeo-moisture reconstruction from sediment grain size. In this study, we reconstructed a humidity time series based on the sediment grain size sequence from Anguli Nuur Lake on the southern Inner Mongolian Plateau in China and found that it coincides very closely with the C/N ratio (carbon to nitrogen ratio) and other humidity indices revealed in previous studies of this temperate steppe region and from the δ 18 O values of stalagmite calcite in southern, monsoon-dominated China. This close relationship suggests that climate change in the semi-arid areas of Asia is strongly influenced by the Pacific summer monsoon and that it is reasonable to use sediment grain size as an indicator of humidity variability in the semi-arid steppe region. The reconstructed humidity increased during the early Holocene, and generally humid conditions lasted from about 10,400 until 7000 yr BP. The period from around 7000 to 5200 yr BP was a transition phase from humid to semi-arid conditions, and the monsoon intensity of that time may have been at the threshold for a semi- arid vegetation ecosystem. Finally, since approximately 5200 yr BP to present, the climate has become more arid, with corresponding vegetation deterioration and strong aeolian activity. © 2011 Elsevier B.V. All rights reserved. 1. Introduction The semi-arid temperate steppe on the central Inner Mongolian Plateau lies at the margin of Pacific monsoon influence, and is very sensitive to climate change since limited water availability constrains vegetation growth. It is one of the main areas to be influenced by frequent dust and sand storms in winter and spring, and is at the same time a primary source of dust from deteriorated grasslands (Wang et al., 2004; Lu et al., 2005). The dust, originating from the Inner Asian desert and deteriorated steppe, can be transported over a very long distance during winter and spring (e.g. to Japan, Iwasaka et al., 1983; Taiwan, Lin, 2001; and Alaska, Yasunari and Yamazaki, 2009); it is even likely to be a significant contributor to the deep-sea sediments of the North Pacific at mid-latitudes beneath the prevailing westerly winds (Duce et al., 1980; Bishop et al., 2002). The inland lake sediments have preserved abundant information about previous environmental change, and grain size in particular could be of great use given the strong aeolian transport in this semi-arid region. Mid- latitude semi-arid regions in Inner Asia are experiencing increasing drought due to temperature rise (IPCC, 2007), which is likely to have a profound influence on vegetation growth (Breshears et al., 2005; Allen et al., 2010). Thus, analysis of palaeo-environmental data is essential to understand the sensitivity of vegetation to modern climate dynamics and to predict future trends. Grain size has been commonly used as an indicator of palaeo- climate change, mostly to indicate water erosion intensity in humid regions where coarse particles indicate increased precipitation (Wang et al., 1990; Chen et al., 2000, 2003; Wu et al., 2006), and to indicate wind erosion intensity in arid and semi-arid regions where coarse particles indicate lake shrinkage (De Deckker et al., 1991; Porter and An, 1995; Qiang et al., 2007). However, the interpretation of grain size is difficult, changing from case to case, even for the same site (e.g. Jin et al., 2000; Peng et al., 2005), and largely depends on comparison with other indices, as there is a lack of knowledge about modern grain size patterns and processes. Therefore, a good understanding of modern grain size patterns and transportation characteristics can greatly support interpretation of grain size data in palaeoenviron- mental studies. Palaeogeography, Palaeoclimatology, Palaeoecology 307 (2011) 168–176 ⁎ Corresponding author. Fax: + 86 10 62759319. E-mail address: [email protected] (H. Liu). 0031-0182/$ – see front matter © 2011 Elsevier B.V. All rights reserved. doi:10.1016/j.palaeo.2011.05.011 Contents lists available at ScienceDirect Palaeogeography, Palaeoclimatology, Palaeoecology journal homepage: www.elsevier.com/locate/palaeo
Transcript of Patterns of local and regional grain size distribution and their application to Holocene climate...

Palaeogeography, Palaeoclimatology, Palaeoecology 307 (2011) 168–176
Contents lists available at ScienceDirect
Palaeogeography, Palaeoclimatology, Palaeoecology
j ourna l homepage: www.e lsev ie r.com/ locate /pa laeo
Patterns of local and regional grain size distribution and their applicationto Holocene climate reconstruction in semi-arid Inner Mongolia, China
Yi Yin, Hongyan Liu ⁎, Siyuan He, Fengjun Zhao, Jiangling Zhu, Hongya Wang, Guo Liu, Xiuchen WuCollege of Urban and Environmental Sciences, and MOE Laboratory for Earth Surface Processes, Peking University, Beijing, 100871, China
⁎ Corresponding author. Fax: +86 10 62759319.E-mail address: [email protected] (H. Liu).
0031-0182/$ – see front matter © 2011 Elsevier B.V. Adoi:10.1016/j.palaeo.2011.05.011
a b s t r a c t
a r t i c l e i n f oArticle history:Received 14 April 2010Received in revised form 4 May 2011Accepted 7 May 2011Available online 24 May 2011
Keywords:Grain sizeLacustrine sedimentAeolian activityPalaeoenvironmental reconstructionSemi-arid regionNorthern China
The semi-arid temperate steppe in northern central China is one of themain areas influenced by frequent dustand sand storms, and is at the same time a primary source of dust from deteriorated grasslands; thus, thesediment grain size distribution of inland lakes in this region can be a particularly useful indicator ofpalaeoenvrionmental change. The local pattern of grain size suggests that aeolian activity is the mostimportant agent for sedimentation in the lake center in this region, as strong northwesterly winds prevail formost of the year and the surface runoff is very weak. Meanwhile, the regional pattern of topsoil grain size andits close association with mean annual precipitation (MAP) allows the establishment of a statistical model forpalaeo-moisture reconstruction from sediment grain size. In this study, we reconstructed a humidity timeseries based on the sediment grain size sequence from Anguli Nuur Lake on the southern Inner MongolianPlateau in China and found that it coincides very closely with the C/N ratio (carbon to nitrogen ratio) andother humidity indices revealed in previous studies of this temperate steppe region and from the δ18O valuesof stalagmite calcite in southern, monsoon-dominated China. This close relationship suggests that climatechange in the semi-arid areas of Asia is strongly influenced by the Pacific summer monsoon and that it isreasonable to use sediment grain size as an indicator of humidity variability in the semi-arid steppe region.The reconstructed humidity increased during the early Holocene, and generally humid conditions lasted fromabout 10,400 until 7000 yr BP. The period from around 7000 to 5200 yr BP was a transition phase from humidto semi-arid conditions, and the monsoon intensity of that time may have been at the threshold for a semi-arid vegetation ecosystem. Finally, since approximately 5200 yr BP to present, the climate has become morearid, with corresponding vegetation deterioration and strong aeolian activity.
ll rights reserved.
© 2011 Elsevier B.V. All rights reserved.
1. Introduction
The semi-arid temperate steppe on the central Inner MongolianPlateau lies at the margin of Pacific monsoon influence, and is verysensitive to climate change since limited water availability constrainsvegetation growth. It is one of the main areas to be influenced byfrequent dust and sand storms in winter and spring, and is at the sametime a primary source of dust from deteriorated grasslands (Wang etal., 2004; Lu et al., 2005). The dust, originating from the Inner Asiandesert and deteriorated steppe, can be transported over a very longdistance during winter and spring (e.g. to Japan, Iwasaka et al., 1983;Taiwan, Lin, 2001; and Alaska, Yasunari and Yamazaki, 2009); it iseven likely to be a significant contributor to the deep-sea sediments ofthe North Pacific at mid-latitudes beneath the prevailing westerlywinds (Duce et al., 1980; Bishop et al., 2002). The inland lakesediments have preserved abundant information about previousenvironmental change, and grain size in particular could be of great
use given the strong aeolian transport in this semi-arid region. Mid-latitude semi-arid regions in Inner Asia are experiencing increasingdrought due to temperature rise (IPCC, 2007), which is likely to have aprofound influence on vegetation growth (Breshears et al., 2005;Allen et al., 2010). Thus, analysis of palaeo-environmental data isessential to understand the sensitivity of vegetation to modernclimate dynamics and to predict future trends.
Grain size has been commonly used as an indicator of palaeo-climate change, mostly to indicate water erosion intensity in humidregions where coarse particles indicate increased precipitation (Wanget al., 1990; Chen et al., 2000, 2003; Wu et al., 2006), and to indicatewind erosion intensity in arid and semi-arid regions where coarseparticles indicate lake shrinkage (De Deckker et al., 1991; Porter andAn, 1995; Qiang et al., 2007). However, the interpretation of grain sizeis difficult, changing from case to case, even for the same site (e.g. Jinet al., 2000; Peng et al., 2005), and largely depends on comparisonwith other indices, as there is a lack of knowledge about moderngrain size patterns and processes. Therefore, a good understanding ofmodern grain size patterns and transportation characteristics cangreatly support interpretation of grain size data in palaeoenviron-mental studies.
169Y. Yin et al. / Palaeogeography, Palaeoclimatology, Palaeoecology 307 (2011) 168–176
Topsoil grain size and mean annual precipitation (MAP) in thesemi-arid steppe of China are significantly linked (Liu et al., 2008),and the particles eroded from surrounding topsoil constitute thematerials transported into lake sediments. In general, lake sedimentsare transported by both wind and water; however, in this semi-aridtemperate steppe region, surface runoff is very weak, while aeolianerosion is extremely strong (Ji et al., 2004). In aeolian deposition, theparticle transport distance was shown to be determined more by dustgrain size than by wind velocity (Pye, 1987, 1995; Tsoar and Pye,1987). The resulting distinct pattern of a substantial decrease in sandcontent in loess deposition over short downwind distances istherefore due to the source-to-deposit transport distance of sand-sized particles, rather than the effect of wind intensity (Ding and Sun,1999; Ding et al., 2001, 2005; Yang and Ding, 2008). Thus, lakesediment grain size can be greatly influenced by the grain sizedistribution of the source materials, which in turn is closely linked toclimate. Meanwhile, higher precipitation supports denser vegetation,which acts to reduce both wind and water erosion (Shi et al., 2004),preventing coarse grains from entering the lake. Therefore, wehypothesize that grain size changes can potentially serve as anindicator of palaeo-moisture variability, with coarser grains indicatinga more arid environment, and vice versa, in semi-arid regions.
In this study, two different sediment sample types were inves-tigated: one sample set was of topsoil from a large region acrossthe woodland-steppe ecotone with a decreasing southeast-northwestMAP gradient, collected for analysis of the relationship between
Fig. 1. (a) Topography of north-central China, with the location of our study area (red rectanthis area (1–4); (b) study area showing topsoil sampling sites, vegetation patterns, and meansites (grey dots), slope deposit samples (triangle) and coring locations (stars); (d) averageprecipitation (blue) and mean annual temperature (red) in the last 50 years (1956–2006)
regional grain size pattern and MAP; the second sample set was ofsurface sediment from a specific desiccated lake (Anguli Nuur) and itssurroundings, analyzed to recover the characteristics of particletransportation. The aim of the study was to improve the usage ofgrain size as an indicator of palaeoenvrionmental change, and toquantitatively reconstruct Holocene moisture changes in the semi-arid region of China.
2. Study area and sample sites
Our study area (41°18′–43°55′N, 110°47′–117°30′E) is located inthe central part of the Chinese Inner Mongolian Plateau (Fig. 1a, b).Present climatic conditions are dominated by the winter monsoonfrom continental Inner Asia and the Pacific summer monsoon fromthe southeast; as a result, the waxing and waning of the Pacificmonsoon controls the quantity of precipitation and the horizontalmigration of vegetation zones over long time scales. A strongnorthwesterly wind prevails in winter and spring and is accompaniedby frequent sand and dust storms. The vegetation pattern changesfrom woodland and shrubland (MAPN~400 mm), to meadow steppe(MAP ~400–350 mm), to typical steppe (MAP ~350–250 mm), andthen to desert steppe (MAP ~250–150 mm) following a precipitationgradient which declines from southeast to northwest. However, thereis no such obvious gradient in modern mean annual temperature(MAT) or mean July temperature; thus the humidity pattern is mainlycontrolled by precipitation availability. The most frequent community
gle), the lake site (red dot), and distribution of deserts and sandy plains in and aroundannual precipitation isohyets; (c) Anguli Nuur lake surface and river channel samplingmonthly precipitation (blue) and monthly temperature (red); trends in mean annualat Zhangbei Meteorological Station, 40 km from Anguli Nuur.
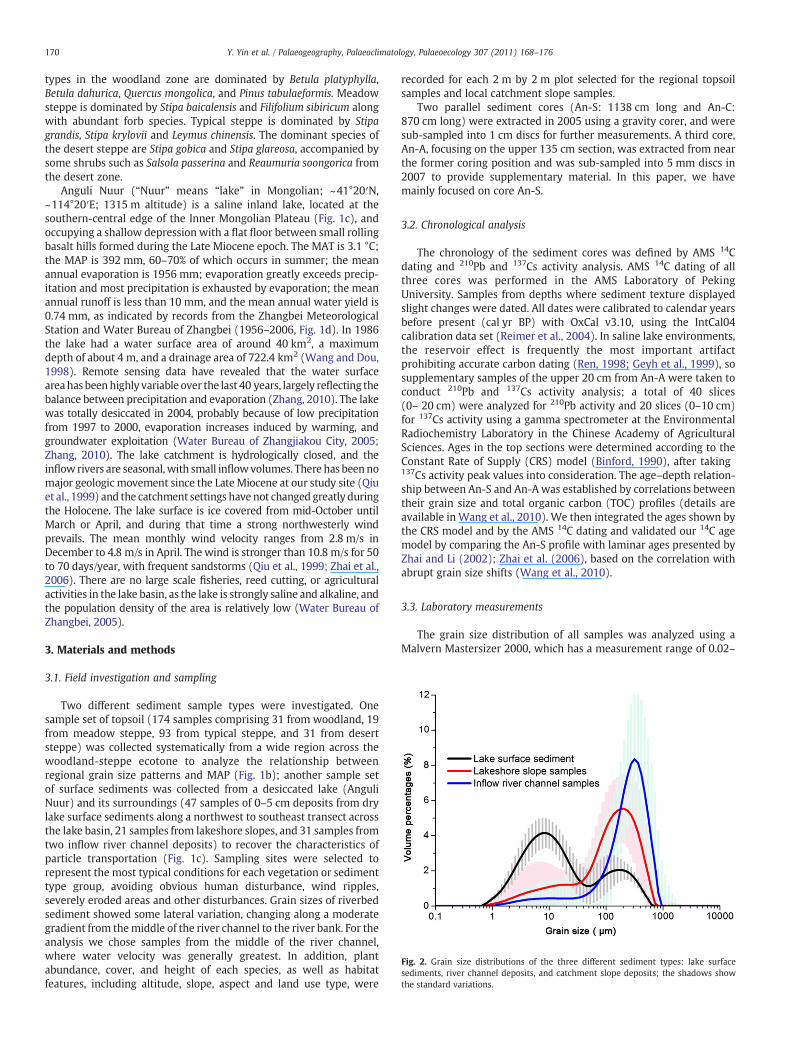
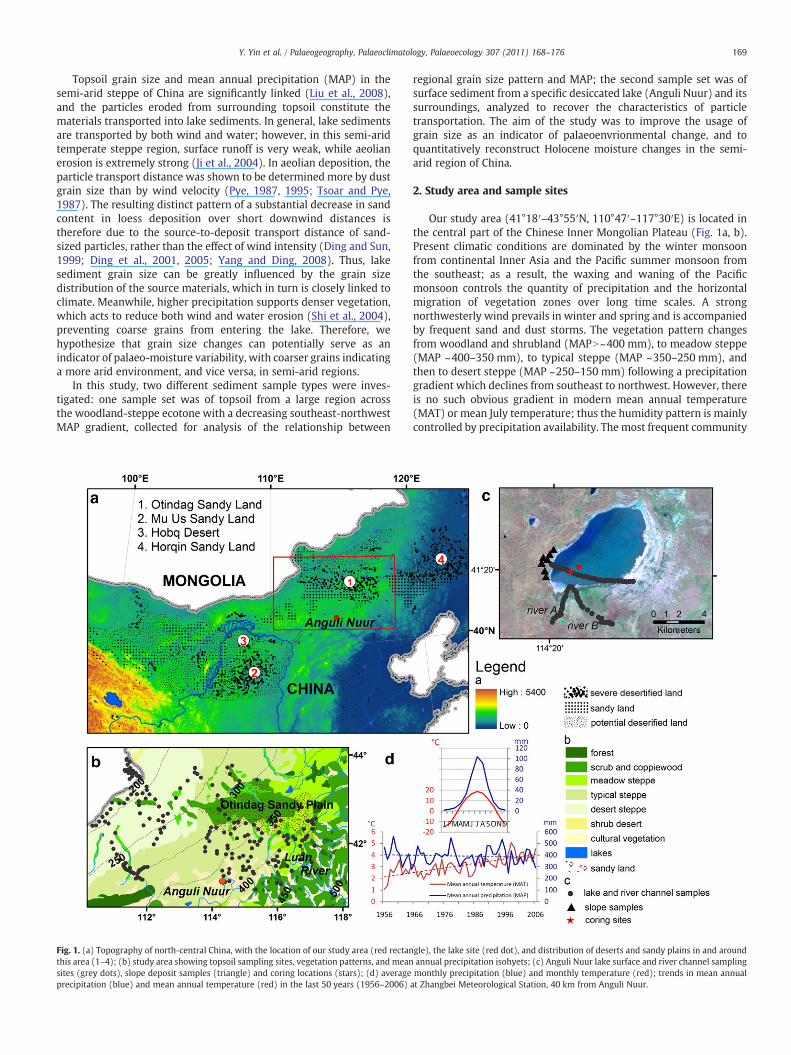
Fig. 2. Grain size distributions of the three different sediment types: lake surfacesediments, river channel deposits, and catchment slope deposits; the shadows showthe standard variations.
170 Y. Yin et al. / Palaeogeography, Palaeoclimatology, Palaeoecology 307 (2011) 168–176
types in the woodland zone are dominated by Betula platyphylla,Betula dahurica, Quercus mongolica, and Pinus tabulaeformis. Meadowsteppe is dominated by Stipa baicalensis and Filifolium sibiricum alongwith abundant forb species. Typical steppe is dominated by Stipagrandis, Stipa krylovii and Leymus chinensis. The dominant species ofthe desert steppe are Stipa gobica and Stipa glareosa, accompanied bysome shrubs such as Salsola passerina and Reaumuria soongorica fromthe desert zone.
Anguli Nuur (“Nuur” means “lake” in Mongolian; ~41°20′N,~114°20′E; 1315 m altitude) is a saline inland lake, located at thesouthern-central edge of the Inner Mongolian Plateau (Fig. 1c), andoccupying a shallow depression with a flat floor between small rollingbasalt hills formed during the Late Miocene epoch. The MAT is 3.1 °C;the MAP is 392 mm, 60–70% of which occurs in summer; the meanannual evaporation is 1956 mm; evaporation greatly exceeds precip-itation and most precipitation is exhausted by evaporation; the meanannual runoff is less than 10 mm, and the mean annual water yield is0.74 mm, as indicated by records from the Zhangbei MeteorologicalStation and Water Bureau of Zhangbei (1956–2006, Fig. 1d). In 1986the lake had a water surface area of around 40 km2, a maximumdepth of about 4 m, and a drainage area of 722.4 km2 (Wang and Dou,1998). Remote sensing data have revealed that the water surfaceareahas beenhighly variable over the last 40 years, largely reflecting thebalance between precipitation and evaporation (Zhang, 2010). The lakewas totally desiccated in 2004, probably because of low precipitationfrom 1997 to 2000, evaporation increases induced by warming, andgroundwater exploitation (Water Bureau of Zhangjiakou City, 2005;Zhang, 2010). The lake catchment is hydrologically closed, and theinflow rivers are seasonal,with small inflowvolumes. There has beennomajor geologic movement since the Late Miocene at our study site (Qiuet al., 1999) and the catchment settings have not changed greatly duringthe Holocene. The lake surface is ice covered from mid-October untilMarch or April, and during that time a strong northwesterly windprevails. The mean monthly wind velocity ranges from 2.8 m/s inDecember to 4.8 m/s in April. The wind is stronger than 10.8 m/s for 50to 70 days/year, with frequent sandstorms (Qiu et al., 1999; Zhai et al.,2006). There are no large scale fisheries, reed cutting, or agriculturalactivities in the lake basin, as the lake is strongly saline and alkaline, andthe population density of the area is relatively low (Water Bureau ofZhangbei, 2005).
3. Materials and methods
3.1. Field investigation and sampling
Two different sediment sample types were investigated. Onesample set of topsoil (174 samples comprising 31 from woodland, 19from meadow steppe, 93 from typical steppe, and 31 from desertsteppe) was collected systematically from a wide region across thewoodland-steppe ecotone to analyze the relationship betweenregional grain size patterns and MAP (Fig. 1b); another sample setof surface sediments was collected from a desiccated lake (AnguliNuur) and its surroundings (47 samples of 0–5 cm deposits from drylake surface sediments along a northwest to southeast transect acrossthe lake basin, 21 samples from lakeshore slopes, and 31 samples fromtwo inflow river channel deposits) to recover the characteristics ofparticle transportation (Fig. 1c). Sampling sites were selected torepresent the most typical conditions for each vegetation or sedimenttype group, avoiding obvious human disturbance, wind ripples,severely eroded areas and other disturbances. Grain sizes of riverbedsediment showed some lateral variation, changing along a moderategradient from themiddle of the river channel to the river bank. For theanalysis we chose samples from the middle of the river channel,where water velocity was generally greatest. In addition, plantabundance, cover, and height of each species, as well as habitatfeatures, including altitude, slope, aspect and land use type, were
recorded for each 2 m by 2 m plot selected for the regional topsoilsamples and local catchment slope samples.
Two parallel sediment cores (An-S: 1138 cm long and An-C:870 cm long) were extracted in 2005 using a gravity corer, and weresub-sampled into 1 cm discs for further measurements. A third core,An-A, focusing on the upper 135 cm section, was extracted from nearthe former coring position and was sub-sampled into 5 mm discs in2007 to provide supplementary material. In this paper, we havemainly focused on core An-S.
3.2. Chronological analysis
The chronology of the sediment cores was defined by AMS 14Cdating and 210Pb and 137Cs activity analysis. AMS 14C dating of allthree cores was performed in the AMS Laboratory of PekingUniversity. Samples from depths where sediment texture displayedslight changes were dated. All dates were calibrated to calendar yearsbefore present (cal yr BP) with OxCal v3.10, using the IntCal04calibration data set (Reimer et al., 2004). In saline lake environments,the reservoir effect is frequently the most important artifactprohibiting accurate carbon dating (Ren, 1998; Geyh et al., 1999), sosupplementary samples of the upper 20 cm from An-A were taken toconduct 210Pb and 137Cs activity analysis; a total of 40 slices(0– 20 cm) were analyzed for 210Pb activity and 20 slices (0–10 cm)for 137Cs activity using a gamma spectrometer at the EnvironmentalRadiochemistry Laboratory in the Chinese Academy of AgriculturalSciences. Ages in the top sections were determined according to theConstant Rate of Supply (CRS) model (Binford, 1990), after taking137Cs activity peak values into consideration. The age–depth relation-ship between An-S and An-A was established by correlations betweentheir grain size and total organic carbon (TOC) profiles (details areavailable inWang et al., 2010). We then integrated the ages shown bythe CRS model and by the AMS 14C dating and validated our 14C agemodel by comparing the An-S profile with laminar ages presented byZhai and Li (2002); Zhai et al. (2006), based on the correlation withabrupt grain size shifts (Wang et al., 2010).
3.3. Laboratory measurements
The grain size distribution of all samples was analyzed using aMalvern Mastersizer 2000, which has a measurement range of 0.02–

Table 1Mean values and coefficients of variation (inside the brackets) of MAP, vegetationcoverage and grain size fractions in different vegetation types.
Woodland(mainly Betulaforest patches)
Meadowsteppe
Typicalsteppe
Desertsteppe
Sample number 31 19 93 31Average MAP 418.59 (0.08) 378.34 (0.02) 288.19 (0.20) 152.83 (0.13)Average vegetationcoverage
70%a 51.8% 32.6% 11.3%
Clay (b2 μm) 3.19 (0.40) 2.21 (0.94) 0.92 (2.09) 0.88 (0.63)Silt (2–63 μm) 34.17 (0.25) 29.79 (0.48) 28.59 (0.48) 17.95 (0.50)Sand (N63 μm) 62.64 (0.13) 68.00 (0.23) 70.49 (0.19) 81.17 (0.11)
a Vegetation coverage of undergrowth herbaceous layer.
171Y. Yin et al. / Palaeogeography, Palaeoclimatology, Palaeoecology 307 (2011) 168–176
2000 μm. Samples were repeatedly pretreated with 10–20 ml of 30%H2O2 until no further bubbles were produced, to remove organicmatter, and then boiled with 10 ml of 10% HCl to remove carbonates.About 400 ml deionized water was added and the sample solutionwas kept for 12 h to rinse acidic ions, then the upper clear water layerwas siphoned off. This step was repeated at least 3 times until the pHvalue was close to 7. The sample residue was finally boiled with 10 mlof 0.5 mol/L (NaPO3)6 and treated on an ultrasonic vibrator for 30 sbefore testing by Malvern Mastersizer 2000 within 3 h after cooling.TOC and total nitrogen (TN) were analyzed by an Elementar Vario EL(Germany) after removal of roots and other macro organic remains,and ground to pass through a 149 μm soil sieve.
3.4. Statistical model for the relationship between topsoil grain sizeand MAP
In order to avoid human influence on vegetation and soil, weselected sites with minimal human disturbance, based on speciescomposition (human disturbance index (HDI) b1.8, Liu et al., 2006,2008). Sites located in the Otindag Sandy Plain were rejected for thestatistical model, as they have quite different soil parent materialsfrom the other relatively uniform weathering materials of granite.Thus we assumed that climate is a crucial control on the regional grainsize pattern through its effects on not only vegetation cover but alsoon soil development, micro-organism activity and erosion.
Climatic records from 1956 to 2006 from 50 stations withinand around the study area were collected to interpolate the spatialpattern of MAP using the Kriging method. An artificial neural network(ANN) was adopted to provide a convenient and powerful means ofperforming nonlinear classification and regression (Skapura, 1996;Van der Baan and Jutten, 2000). We divided the particle distribu-tions into 14 size fractions: C1 (b1 μm), C2 (1–2 μm), C3 (2–5 μm),C4 (5–10 μm), C5 (10–20 μm), C6 (20–30 μm), C7 (30–40 μm), C8 (40–50 μm), C9 (50–63 μm), C10 (63–100 μm), C11 (100–250 μm), C12 (250–500 μm), C13 (500–1000 μm) and C14 (N1000 μm) to build the inputmatrix, and defined MAP as the target matrix during back-propagating(BP) neural network construction and training. The BP neural networkwas implemented in MATLAB. We used the Levenberg–Marquardtalgorithm to train the net, and the mean squared error to estimatethe performance. Comparison with traditional statistical methods, suchas multiple linear regression and principal component regression, wasalso conducted to validate the performance of the BP neural net work.
3.5. Palaeo-moisture reconstruction and validation
The modern spatial relationship between grain size and MAPconstructed by the BP neural network was next used to establishtemporal variations, using lake sediment from the semi-arid region ofChina. It must be stressed that the relationship between moderntopsoil grain size and MAP was established when there was nosignificant modern MAT gradient, which means precipitation mainlydetermined the moisture status; however, changes in both temper-ature and precipitation have strong influences on the palaeoenviron-ment, so there are considerable risks in attributing the shifts directlyto precipitation changes. In addition, the linkage between surface soilcharacteristics and sediment through transportation and sorting isvery complicated. Consequently, it is very difficult to validate theabsolute value of the reconstructedMAP; however, relative trends canbe reliably obtained. Therefore, we conducted a systematic calibrationto create a relative humidity index (RHI), ranging from 0 to 1, basedon reconstructed MAP from the BP neural network, to show therelative humidity changes through time.
Two additional indices from other studies have been cited herefor comparison: one is the synthesized four-class ordinal wetnessindex (WI) from a review of 6 sites in the temperate steppe zone innorth-central China (Zhao et al., 2009; Fig. 5e); the other is the δ18O
record from stalagmite calcite in the Dongge Cave in southern China,indicating the Asian summer monsoon intensity (Dykoski et al., 2005;Fig. 5e). Other indices for the same profile An-S, including pollenand magnetism characteristics, were also considered when analyzingthe moisture changes through the Holocene (Liu et al., 2010; Wanget al., 2010).
4. Results
4.1. Regional topsoil grain size distribution and its relationship with MAP
The correlation between top soil sand fraction (N63 μm) and MAPwas significant at the 0.01 level (2-tailed), with a correlationcoefficient of −0.586: the higher the precipitation, the lower thesand fraction. Woodland and meadow steppe soils with higherprecipitation had the highest clay and lowest sand fractions, whiledesert steppe soils had the lowest clay fraction and the highest sandfraction (Table 1). Variations in clay fractions in all vegetation typeswere much higher than those in other fractions.
The BP neural network, which was constructed from the topsoilgrain size matrix and MAP matrix, achieved a better fit between thesimulated and observed data than that of the multiple linearregression or principal components analysis. The R2 of the trainingset reached 0.99 (the training set was a random sub-sample of 70% ofthe total sample set: n=119); the R2 of the validation and test setsreached 0.81 and 0.77, respectively (with 15% sub-sample sizes ineach case). Overall the R2 was 0.90, suggesting that the output couldexplain most of the variation in the 14 grain size groups, and therebydemonstrating that it is reasonable to use the BP neural network toreconstruct the past humidity changes.
4.2. Local patterns of grain size distribution
Fig. 2 shows the typical grain size distribution curves of the threedifferent sediment types: dry lake surface sediment, river channeldeposit, and catchment slope topsoil. The main peak of the frequencydistribution of river channel deposits was at around 300 μm, whilethat of the catchment slope samples was at around 200 μm. Themean grain size of lake surface samples was much smaller, and thesize distribution curves showed two peaks in most cases, at around 10and around 200 μm. The volumetrically weighted averages in grainsize fractions of samples taken along two inflow rivers and fromthe lake surface all showed a notable decreasing trend from the lakeshore to the centre (Fig. 3). The fractions of N250 μm particles alsoshowed the same decreasing pattern. However, following the sharpdecrease in the coarse particle fraction after entering the lake, thevolumetrically weighted averages became relatively stable.

Fig. 3. Trends in volumetrically weighted averages (triangles) of grain size fractions at sites along a transect from lake shore to lake center and along the inflow-rivers andpercentages of N250 μm particles (columns).
172 Y. Yin et al. / Palaeogeography, Palaeoclimatology, Palaeoecology 307 (2011) 168–176
4.3. Profile characteristics and chronology results
The 1138 cm An-S section was mainly composed of clay and silt.Three zones were identified by visual inspection: the lower 58 cm andthe upper 130 cm were silty clay; the middle part was mainly fineblack clay. Salt crystal slices were found at the depths of 383–425,450–460 and 495–529 cm, andwhite–dark laminations were found atthe depth of around 560–800 cm. No hiatus was found for the wholesection, thus we assumed that the sediment has not been stronglydisturbed, even if it could have been seasonally desiccated duringdrought events.
Four bulk sediment samples from different sites on the lake surfaceprovided calibrated 14C AMS ages as follows:modern age (An-S 5 cm),1870 cal yr BP (An-C 5 cm), 4245 cal yr BP (An-A 10 cm) and4455 cal yr BP (An-A 20 cm) (Fig. 4b). However, 210Pb and 137Csanalysis results show that the surface 20 cm of An-A was composed ofmodern sediment (Fig. 4a). The apparent disagreement indicates thestrong influence of the lake reservoir effect, which was site specific,fluctuating greatly through time and space, and depending on theproportions of the included organic matter, groundwater influence,exchange with atmospheric CO2, and other factors. The lake aquaticsystem may have changed significantly through the Holocene. Thus,direct linear correction of the whole profile by simply subtracting the“old carbon” age may be potentially risky.
From 20 cm and below, the sedimentation rate calculated by theCRS model was equivalent to the rate calculated by the 14C dates. Thematerials in the bottom section, along with even deeper sectionswhich could not be extracted by gravity coring in the field as theywere too loose, contained much more sand. Thus we assume thatthe 14C age of these bottom sediments is consistent with the end ofthe Younger Dryas, which does not reveal a strong influence of the
lake reservoir effect. Therefore, we decided to use 210Pb and 137Csdating for the upper 20 cm, to avoid the strong “lake reservoir ” effectin the upper section, and to allow linear interpolation between cali-brated 14C dates for the lower section without application of the lakereservoir effect correction as we do not know the exact influence.
Our chronology excluded two 14C dates of pollen extractionsfrom An-S (566 and 621 cm) in the lower section, which are not inreasonable agreement with other dates from both pollen extractionand bulk sediment samples from An-S and An-C. The deviationmay beattributed to modern contamination or to random error due to thesmall sample size.
The grain size results supported the age model, including thedramatic increase in coarse partial fraction (N100 μm) percentages inthe upper 130 cm (Fig. 4c). In addition, our dating coincides well withthe radiocarbon and laminar ages of Zhai's profile for the correspond-ing depth at 129 cm and below, based on the correlation with abruptgrain size shifts. An integrated age model of the whole core was thenconstructed (Fig. 4b): according to this model, a constant sedimen-tation rate was apparent before 5 ka BP, and then the sedimentationrate became notably slower. However, it has to be acknowledged thatthis age model is not totally satisfactory.
4.4. Reconstructed Holocene humidity variation
In general, the reconstructed relative humidity index (RHI) coin-cided very well with the C/N ratio and the other two regionalhumidity indices (Fig. 5). The reconstructed RHI and C/N ratio bothshowed an increasing trend from the onset of the Holocene andthen reached a relatively stable and high level by around 10,300 cal yrBP. These humid conditions persisted, with moderate fluctuations,until about 7000 cal yr BP; following this, the period around 7000–
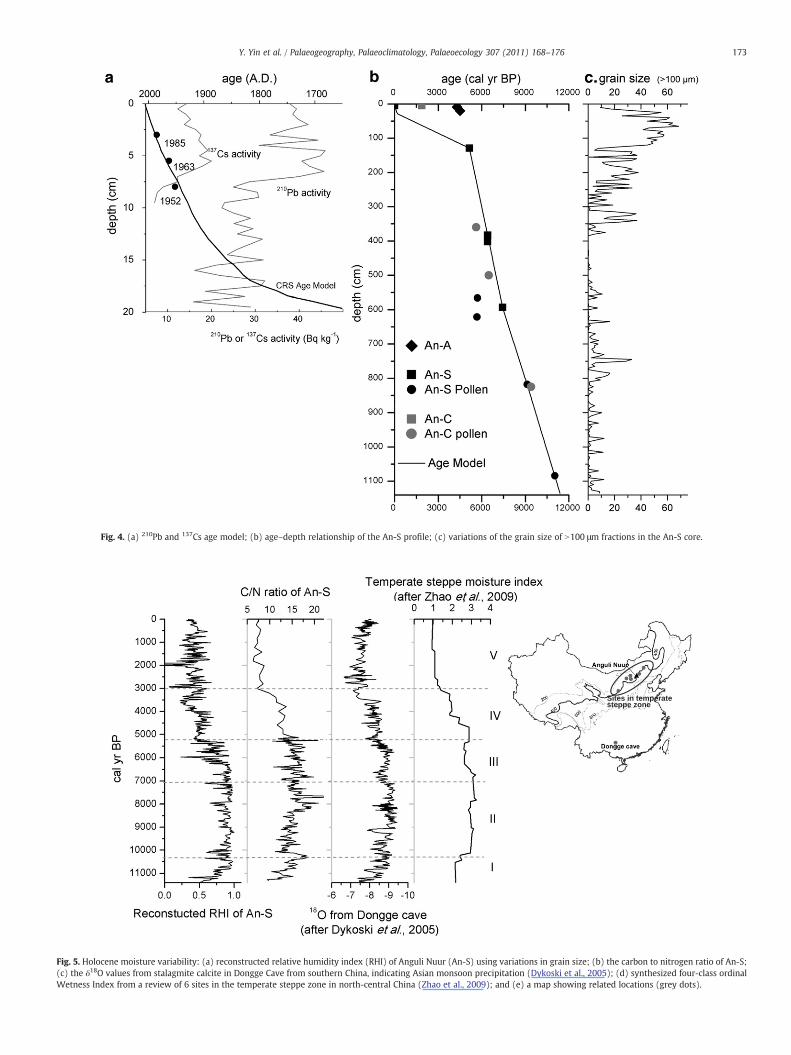
Fig. 4. (a) 210Pb and 137Cs age model; (b) age–depth relationship of the An-S profile; (c) variations of the grain size of N100 μm fractions in the An-S core.
Sites in temperatesteppe zone
Fig. 5. Holocene moisture variability: (a) reconstructed relative humidity index (RHI) of Anguli Nuur (An-S) using variations in grain size; (b) the carbon to nitrogen ratio of An-S;(c) the δ18O values from stalagmite calcite in Dongge Cave from southern China, indicating Asian monsoon precipitation (Dykoski et al., 2005); (d) synthesized four-class ordinalWetness Index from a review of 6 sites in the temperate steppe zone in north-central China (Zhao et al., 2009); and (e) a map showing related locations (grey dots).
173Y. Yin et al. / Palaeogeography, Palaeoclimatology, Palaeoecology 307 (2011) 168–176
174 Y. Yin et al. / Palaeogeography, Palaeoclimatology, Palaeoecology 307 (2011) 168–176
5200 cal yr BP was a transition phase from humid to dryer conditions.Finally, the humidity decreased to a significantly lower level. In total,five phases were distinguished by visual inspection, and are describedbelow.
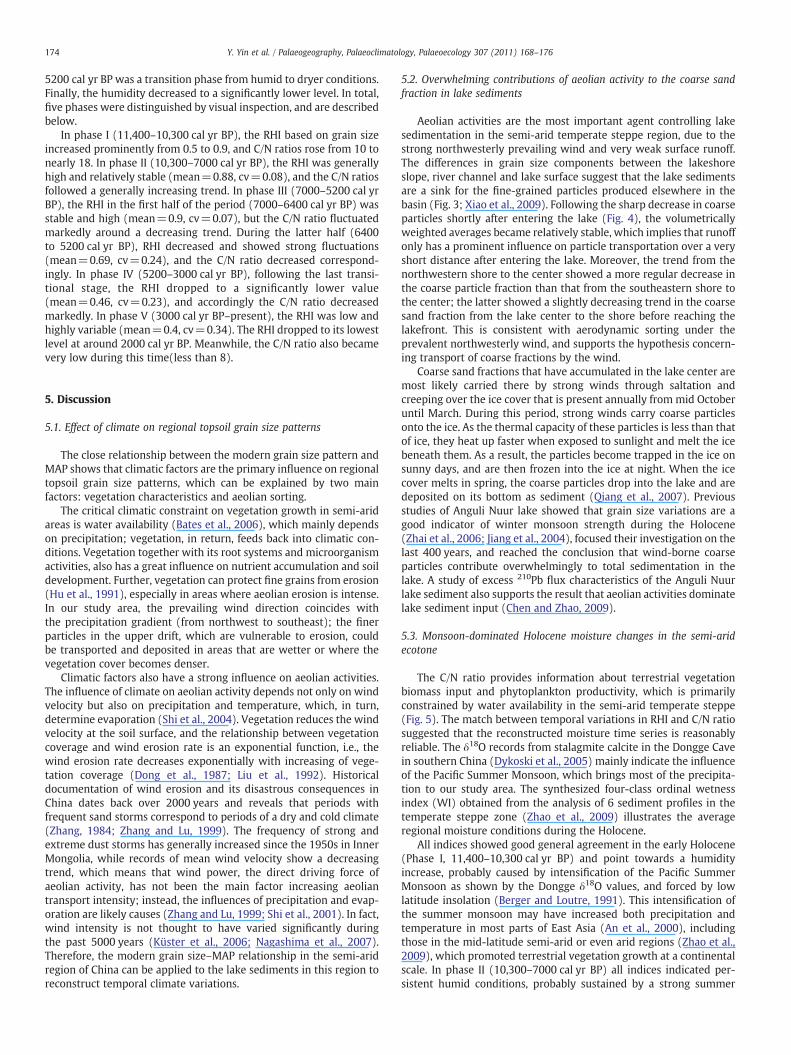
In phase I (11,400–10,300 cal yr BP), the RHI based on grain sizeincreased prominently from 0.5 to 0.9, and C/N ratios rose from 10 tonearly 18. In phase II (10,300–7000 cal yr BP), the RHI was generallyhigh and relatively stable (mean=0.88, cv=0.08), and the C/N ratiosfollowed a generally increasing trend. In phase III (7000–5200 cal yrBP), the RHI in the first half of the period (7000–6400 cal yr BP) wasstable and high (mean=0.9, cv=0.07), but the C/N ratio fluctuatedmarkedly around a decreasing trend. During the latter half (6400to 5200 cal yr BP), RHI decreased and showed strong fluctuations(mean=0.69, cv=0.24), and the C/N ratio decreased correspond-ingly. In phase IV (5200–3000 cal yr BP), following the last transi-tional stage, the RHI dropped to a significantly lower value(mean=0.46, cv=0.23), and accordingly the C/N ratio decreasedmarkedly. In phase V (3000 cal yr BP–present), the RHI was low andhighly variable (mean=0.4, cv=0.34). The RHI dropped to its lowestlevel at around 2000 cal yr BP. Meanwhile, the C/N ratio also becamevery low during this time(less than 8).
5. Discussion
5.1. Effect of climate on regional topsoil grain size patterns
The close relationship between the modern grain size pattern andMAP shows that climatic factors are the primary influence on regionaltopsoil grain size patterns, which can be explained by two mainfactors: vegetation characteristics and aeolian sorting.
The critical climatic constraint on vegetation growth in semi-aridareas is water availability (Bates et al., 2006), which mainly dependson precipitation; vegetation, in return, feeds back into climatic con-ditions. Vegetation together with its root systems and microorganismactivities, also has a great influence on nutrient accumulation and soildevelopment. Further, vegetation can protect fine grains from erosion(Hu et al., 1991), especially in areas where aeolian erosion is intense.In our study area, the prevailing wind direction coincides withthe precipitation gradient (from northwest to southeast); the finerparticles in the upper drift, which are vulnerable to erosion, couldbe transported and deposited in areas that are wetter or where thevegetation cover becomes denser.
Climatic factors also have a strong influence on aeolian activities.The influence of climate on aeolian activity depends not only on windvelocity but also on precipitation and temperature, which, in turn,determine evaporation (Shi et al., 2004). Vegetation reduces the windvelocity at the soil surface, and the relationship between vegetationcoverage and wind erosion rate is an exponential function, i.e., thewind erosion rate decreases exponentially with increasing of vege-tation coverage (Dong et al., 1987; Liu et al., 1992). Historicaldocumentation of wind erosion and its disastrous consequences inChina dates back over 2000 years and reveals that periods withfrequent sand storms correspond to periods of a dry and cold climate(Zhang, 1984; Zhang and Lu, 1999). The frequency of strong andextreme dust storms has generally increased since the 1950s in InnerMongolia, while records of mean wind velocity show a decreasingtrend, which means that wind power, the direct driving force ofaeolian activity, has not been the main factor increasing aeoliantransport intensity; instead, the influences of precipitation and evap-oration are likely causes (Zhang and Lu, 1999; Shi et al., 2001). In fact,wind intensity is not thought to have varied significantly duringthe past 5000 years (Küster et al., 2006; Nagashima et al., 2007).Therefore, the modern grain size–MAP relationship in the semi-aridregion of China can be applied to the lake sediments in this region toreconstruct temporal climate variations.
5.2. Overwhelming contributions of aeolian activity to the coarse sandfraction in lake sediments
Aeolian activities are the most important agent controlling lakesedimentation in the semi-arid temperate steppe region, due to thestrong northwesterly prevailing wind and very weak surface runoff.The differences in grain size components between the lakeshoreslope, river channel and lake surface suggest that the lake sedimentsare a sink for the fine-grained particles produced elsewhere in thebasin (Fig. 3; Xiao et al., 2009). Following the sharp decrease in coarseparticles shortly after entering the lake (Fig. 4), the volumetricallyweighted averages became relatively stable, which implies that runoffonly has a prominent influence on particle transportation over a veryshort distance after entering the lake. Moreover, the trend from thenorthwestern shore to the center showed a more regular decrease inthe coarse particle fraction than that from the southeastern shore tothe center; the latter showed a slightly decreasing trend in the coarsesand fraction from the lake center to the shore before reaching thelakefront. This is consistent with aerodynamic sorting under theprevalent northwesterly wind, and supports the hypothesis concern-ing transport of coarse fractions by the wind.
Coarse sand fractions that have accumulated in the lake center aremost likely carried there by strong winds through saltation andcreeping over the ice cover that is present annually from mid Octoberuntil March. During this period, strong winds carry coarse particlesonto the ice. As the thermal capacity of these particles is less than thatof ice, they heat up faster when exposed to sunlight and melt the icebeneath them. As a result, the particles become trapped in the ice onsunny days, and are then frozen into the ice at night. When the icecover melts in spring, the coarse particles drop into the lake and aredeposited on its bottom as sediment (Qiang et al., 2007). Previousstudies of Anguli Nuur lake showed that grain size variations are agood indicator of winter monsoon strength during the Holocene(Zhai et al., 2006; Jiang et al., 2004), focused their investigation on thelast 400 years, and reached the conclusion that wind-borne coarseparticles contribute overwhelmingly to total sedimentation in thelake. A study of excess 210Pb flux characteristics of the Anguli Nuurlake sediment also supports the result that aeolian activities dominatelake sediment input (Chen and Zhao, 2009).
5.3. Monsoon-dominated Holocene moisture changes in the semi-aridecotone
The C/N ratio provides information about terrestrial vegetationbiomass input and phytoplankton productivity, which is primarilyconstrained by water availability in the semi-arid temperate steppe(Fig. 5). The match between temporal variations in RHI and C/N ratiosuggested that the reconstructed moisture time series is reasonablyreliable. The δ18O records from stalagmite calcite in the Dongge Cavein southern China (Dykoski et al., 2005) mainly indicate the influenceof the Pacific Summer Monsoon, which brings most of the precipita-tion to our study area. The synthesized four-class ordinal wetnessindex (WI) obtained from the analysis of 6 sediment profiles in thetemperate steppe zone (Zhao et al., 2009) illustrates the averageregional moisture conditions during the Holocene.
All indices showed good general agreement in the early Holocene(Phase I, 11,400–10,300 cal yr BP) and point towards a humidityincrease, probably caused by intensification of the Pacific SummerMonsoon as shown by the Dongge δ18O values, and forced by lowlatitude insolation (Berger and Loutre, 1991). This intensification ofthe summer monsoon may have increased both precipitation andtemperature in most parts of East Asia (An et al., 2000), includingthose in the mid-latitude semi-arid or even arid regions (Zhao et al.,2009), which promoted terrestrial vegetation growth at a continentalscale. In phase II (10,300–7000 cal yr BP) all indices indicated per-sistent humid conditions, probably sustained by a strong summer
175Y. Yin et al. / Palaeogeography, Palaeoclimatology, Palaeoecology 307 (2011) 168–176
monsoon (with δ18O values around −9‰). Pollen records from thissite showed high arboreal pollen percentages (Liu et al., 2010),coinciding well with high terrestrial organic matter input as indicatedby C/N ratios. In phase III (7000-6400 cal yr BP), there was anapparent disagreement in the first half of the period between thereconstructed high RHI and desertification indicated by salt crystals inthe sediment; this could be explained by rising temperaturesenhancing lake water evaporation, which would have led to severedrought events on a local scale. This result would also imply that theRHI is more sensitive to direct precipitation changes, and probablyexperiences a time lag with respect to abrupt environmental changes.Pollen analysis results showed a high percentage of Ephedra andNitraria during that time, suggesting a more arid environment (Liu etal., 2010). Conditions during the latter half of phase III are consistentwith delayed environmental deterioration after droughts. During thisphase, the summer monsoon intensity did not showmarked changes;however, the monsoon intensity of that time may have been close tothe threshold for a semi-arid ecosystem interms of its wateravailability. In the following phases IV and V (5200 cal yr BP–present),all indices suggested a drier climate and the temperate steppe regionbecame dramatically drier as shown by regional WI values. Theseresults strongly suggest that the moisture evolution in this semi-aridarea is mainly controlled by summer monsoon intensity, and thatlocal extreme drought events could trigger nonlinear ecosystemdeterioration.
6. Conclusions
Our results and discussion suggest that aeolian activities are themost important agent influencing sedimentation in the semi-aridtemperate steppe region, which experiences a strong northwesterlyprevailing wind and very weak surface runoff. The grain size dis-tributions of surrounding sourcematerials, and source area vegetationconditions, are two critical factors in determining the lake sedimentgrain size, and are both controlled by water availability, mainlythrough MAP. Climatic conditions (especially moisture) and vegeta-tion coverage have stronger influences on aeolian activities than windvelocity. Thus, the modern spatial relationship between grain sizeand MAP can be used to estimate the temporal moisture conditionsinferred from lake sediments in the semi-arid region in China.
The reconstructed humidity variations coincided very closely withthe C/N ratio, as well as with other humidity indices obtained inprevious studies of this temperate steppe region and from the δ18Ovalues of stalagmite calcite in southern, monsoon-dominated China.These close relationships suggest that climate change in semi-aridareas is strongly influenced by the Pacific summer monsoon and thatit is reasonable to use sediment grain size as an indicator of humidityvariability in the semi-arid steppe region. The reconstructed humidityincreased from the beginning of the Holocene, and this generallyhumid period lasted from about 10,400 to 7000 cal yr BP. The periodfrom around 7000 to 5200 cal yr BP was a transition phase fromhumid to semi-arid and arid conditions, and the monsoon intensity ofthat time may have been at the threshold for a semi-arid vegetationecosystem. Since approximately 5200 yr BP, the climate has becomemore arid, in association with vegetation deterioration and strongaeolian activities.
Acknowledgements
This research was supported by a grant from the Natural SciencesFoundation of China (40771208 and 41071124). We are grateful toMr. Qinglu Li and his staff for their help in coring sediments fromAnguli Nuur, and Elisabeth Clement and Dave Chandler for their helpin editing the text. We also thank the reviewers and editors, whosecomments and suggestions have greatly improved the manuscript.
References
Allen, C., Macalady, A., Chenchouni, H., Bachelet, D., McDowell, N., Vennetier, M.,Kitzberger, T., Rigling, A., Breshears, D., Hogg, E., 2010. A global overview of droughtand heat-induced tree mortality reveals emerging climate change risks for forests.Forest Ecology and Management 259, 660–684.
An, Z.S., Porter, S.C., Kutzbach, J.E., Wu, X.H., Wang, S.M., Liu, X.D., Li, X.Q., Zhou, W.J.,2000. Asynchronous Holocene optimum of the East Asian monsoon. QuaternaryScience Reviews 19, 743–762.
Bates, J., Svejcar, T., Miller, R., Angell, R., 2006. The effects of precipitation timing onsagebrush steppe vegetation. Journal of Arid Environments 64, 670–697.
Berger, A., Loutre, M., 1991. Insolation values for the climate of the last 10 million years.Quaternary Science Reviews 10, 297–317.
Binford, M., 1990. Calculation and uncertainty analysis of 210Pb dates for PIRLA projectlake sediment cores. Journal of Paleolimnology 3, 253–267.
Bishop, J.K.B., Davis, R.E., Sherman, J.T., 2002. Robotic observations of dust stormenhancement of carbon biomass in the North Pacific. Science 298, 817–821.
Breshears, D., Cobb, N., Rich, P., Price, K., Allen, C., Balice, R., Romme, W., Kastens, J.,Floyd, M., Belnap, J., 2005. Regional vegetation die-off in response to global-change-type drought. PNAS 102, 15144.
Chen, Y.F., Zhao, Z.Z., 2009. Preliminary study on excess 210Pb flux characteristic of lakesediment in arid regions and its implication for aeolian activity. Journal of LakeSciences 21, 813–818 (in Chinese with English Abstract).
Chen, J.A., Wan, G.J., Tang, D., 2000. Recent climatic changes recorded by sediment grainsizes and isotopes in Erhai Lake. Progress in Natural Science 10, 54–61.
Chen, J.A., Wan, G.J., Zhang, F., 2003. Environment records of lake sediment underdifferent time scales – case study of grain size. Science in China (Series D) 33,563–568.
De Deckker, P., Correge, T., Head, J., 1991. Late Pleistocene record of cyclic eolian activityfrom tropical Australia suggesting the Younger Dryas is not an unusual climaticevent. Geology 19, 602–605.
Ding, Z.L., Sun, J.M., 1999. Changes in sand content of loess deposits along a North–Southtransect of the Chinese Loess Plateau and the implications for desert variations.Quaternary Research 52, 56–62.
Ding, Z.L., Yu, Z.W., Yang, S.L., Sun, J.M., Xiong, S.F., Liu, T.S., 2001. Coeval changes in grainsize and sedimentation rate of eolian loess, the Chinese Loess Plateau. GeophysicalResearch Letters 28, 2097–2100.
Ding, Z.L., Derbyshire, E., Yang, S.L., Sun, J.M., Liu, T.S., 2005. Stepwise expansion ofdesert environment across northern China in the past 3.5 Ma and implications formonsoon evolution. Earth and Planetary Science Letters 237, 45–55.
Dong, G.R., Li, C.Z., Jin, J., Gao, S.Y., Wu, D., 1987. Some results from wind erosionexperiments by wind tunnel. Chinese Science Bulletin 32, 297–301.
Duce, R., Unni, C., Ray, B., Prospero, J., Merrill, J., 1980. Long-range atmospherictransport of soil dust from Asia to the tropical North Pacific: temporal variability.Science 209, 1522.
Dykoski, C., Edwards, R., Cheng, H., Yuan, D., Cai, Y., Zhang, M., Lin, Y., Qing, J., An, Z.,Revenaugh, J., 2005. A high-resolution, absolute-dated Holocene and deglacialAsian monsoon record from Dongge Cave, China. Earth and Planetary ScienceLetters 233, 71–86.
Geyh, M., Grosjean, M., Núnez, L., Schotterer, U., 1999. Radiocarbon reservoir effect andthe timing of the late-glacial/early Holocene humid phase in the Atacama Desert(northern Chile). Quaternary Research 52, 143–153.
Hu, M.C., Liu, Y.Z., Wu, L., Yang, Z.T., Wu, D., 1991. An experimental study in wind tunnelon wind erosion of soil in Korqin Sandy Land. Journal of Desert Research 11, 22–29(in Chinese with English abstract).
IPCC, 2007. Climate Change 2007: Synthesis Report. In: Core Writing Team, Pachauri, R.K., Reisinger, A. (Eds.), Contribution of Working Groups I, II and III to the FourthAssessment Report of the Intergovernmental Panel on Climate Change. IPCC,Geneva, Switzerland.
Iwasaka, Y., Minoura, H., Nagaya, K., 1983. The transport and spacial scale of Asian dust-storm clouds: a case study of the dust-storm event of April 1979. Tellus B 35B,189–196.
Ji, J.J., Liu, Q., Li, Y.P., 2004. Features and simulation of surface water balance in semi-aridareas. Acta geographica sinica 59, 964–971 (in Chinese with English abstract).
Jiang, J.M., Wu, J.L., Shen, J., 2004. Lake sediment records of climatic and environmentalchange in Angulinao Lake. Scientia Geographica Sinica 24, 346–351 (in Chinesewith English abstract).
Jin, Z.D., Wang, S.M., Shen, J., Wang, J., 2000. Dust-storm events in Daihai Lake area,Inner Mongolia during the past 400 years: evidence from grain-size analysis of lakesediments. Journal of Lake Sciences 12, 193–198 (in Chinese with English abstract).
Küster, Y., Hetze, R., Krbetschek, M., Tao, M.X., 2006. Holocene loess sedimentationalong the Qilian Shan (China): significance for understanding the processes andtiming of loess deposition. Quaternary Science Reviews 25, 114–125.
Lin, T.H., 2001. Long-range transport of yellow sand to Taiwan in spring 2000: observedevidence and simulation. Atmospheric Environment 35, 5873–5882.
Liu, Y.Z., Dong, G.R., Li, C.Z., 1992. Study on some factors influencing soil erosion bywindtunnel experiment. Journal of Desert Research 12, 41–49 (in Chinese with Englishabstract).
Liu, H.Y., Wang, Y., Tian, Y.H., 2006. Climatic and anthropogenic controls of surfacepollen in East Asian steppes. Review of Palaeobotany and Palynology 138, 281–289.
Liu, H.Y., Yin, Y., Tian, Y.H., Ren, J.,Wang, H.Y., 2008. Climatic and anthropogenic controlsof topsoil features in the semi-arid East Asian steppe. Geophysical Research Letters35, L04401.
Liu, H.Y., Yin, Y., Zhu, J.L., Zhao, F.J., Wang, H.Y., 2010. How did the forest respond toHolocene climate drying at the forest-steppe ecotone in northern China? QuaternaryInternational 227, 46–52.
176 Y. Yin et al. / Palaeogeography, Palaeoclimatology, Palaeoecology 307 (2011) 168–176
Lu, H.Y., Miao, X.D., Zhou, Y.L., Mason, J., Swinehart, J., Zhang, J.F., Zhou, L.P., Yi, S.W.,2005. Late Quaternary aeolian activity in the Mu Us and Otindag dune fields(north China) and lagged response to insolation forcing. Geophysical ResearchLetters 32, L21716.
Nagashima, K., Tada, R., Matsui, H., Irino, T., Tani, A., Toyoda, S., 2007. Orbital- andmillennial-scale variations in Asian dust transport path to the Japan Sea. Palaeogeo-graphy, Palaeoclimatology, Palaeoecology 247, 144–161.
Peng, Y.J., Xiao, J.L., Nakamura, T., Liu, B., 2005. Holocene East Asian monsoonalprecipitation pattern revealed by grain-size distribution of core sediments of DaihaiLake in Inner Mongolia of north-central China. Earth and Planetary Science Letters233, 467–479.
Porter, S.C., An, Z.S., 1995. Correlation between climate events in the North Atlantic andChina during the last glaciation. Nature 375, 305–308.
Pye, K., 1987. Aeolian Dust and Dust Deposits. Academic Press, London, p. 334.Pye, K., 1995. The nature, origin and accumulation of loess. Quaternary Science Reviews
14, 653–667.Qiang, M.R., Chen, F.H., Zhang, J.W., Zu, R.P., Jin, M., Zhou, A.F., Xiao, S., 2007. Grain size in
sediments from Lake Sugan: a possible linkage to dust storm events at the northernmargin of the Qinghai–Tibetan Plateau. Environmental Geology 51, 1229–1238.
Qiu, W.L., Zhai, Q.M., Hu, H.B., Zhao, Y., Zheng, L.M., Li, R.Q., 1999. Holocene water levelchanges of Angulinao lake and their environmental significance. Journal of BeijingNormal University (Natural Science) 35, 542–548 (in Chinese with English abstract).
Reimer, P.J., Baillie, M.G.L., Bard, E., Bayliss, A., Beck, J.W., 2004. INTCAL04 terrestrialradiocarbon age calibration, 0–26 cal kyr BP. Radiocarbon 46, 1029–1058.
Ren, G.Y., 1998. A finding of the influence of “Hard Water” on radio carbon datingfor lake sediments in Inner Mongolia, China. Journal of Lake Science 10, 80–82(in Chinese with English abstract).
Shi, P.J., Yan, P., Yuan, Y., 2001. The driving force analyses of the blown-sand activity inNorthern China. Quaternary Sciences 21, 41–47 (in Chinese with English abstract).
Shi, P.J., Yan, P., Yuan, Y., 2004.Wind erosion research in China: past, present and future.Progress in Physical Geography 28, 366–386.
Skapura, D.M., 1996. Building Neural Networks. ACM Press, p. 282.Tsoar, H., Pye, K., 1987. Dust transport and the question of desert loess formation.
Sedimentology 34, 139–153.Van der Baan,M., Jutten, C., 2000. Neural networks in geophysical applications. Geophysics
65, 1032–1047.Wang, S.M., Dou, H.S., 1998. Lakes of China, 311–312. Science Press, Beijing, p. 545
(in Chinese).Wang, S.M., Yu, S.Y., Wu, R.J., Feng, M., 1990. The Daihai Lake – lake environment and
climate change. China University of Science and Technology Press, Hefei. (in Chinese).
Wang, X.M., Dong, Z.B., Zhang, J.W., Liu, L.C., 2004. Modern dust storms in China: anoverview. Journal of Arid Environments 58, 559–574.
Wang, H.Y., Liu, H.Y., Zhu, J.L., Yin, Y., 2010. Holocene environmental changes asrecorded by mineral magnetism of sediments from Anguli-nuur Lake, southeasternInner Mongolia Plateau, China. Palaeogeography, Palaeoclimatology, Palaeoecology285, 30–49.
Water Bureau of Zhangbei, 2005. Report on the investigation of Lakes, reservoirs, andrivers in the Zhangbei town, 2–8 (unpublished government report).
Water Bureau of Zhangjiakou City, 2005. Report on the investigation of the dessicationof the Angulinao Lake, 5–12 (unpublished government report).
Wu, Y.H., Lücke, A., Jin, Z.D., Wang, S.M., Schleser, G.H., Battarbee, R.W., Xia, W.L., 2006.Holocene climate development on the central Tibetan Plateau: a sedimentaryrecord from Cuoe Lake. Palaeogeography, Palaeoclimatology, Palaeoecology 234,328–340.
Xiao, J., Chang, Z., Si, B., Qin, X., Itoh, S., Lomtatidze, Z., 2009. Partitioning of the grain-size components of Dali Lake core sediments: evidence for lake-level changesduring the Holocene. Journal of Paleolimnology 42, 249–260.
Yang, S.L., Ding, Z.L., 2008. Advance–retreat history of the East-Asian summer monsoonrainfall belt over northern China during the last two glacial–interglacial cycles.Earth and Planetary Science Letters 274, 499–510.
Yasunari, T.J., Yamazaki, K., 2009. Impacts of Asian dust storm associated with thestratosphere-to-troposphere transport in the spring of 2001 and 2002 on dust andtritium variations in Mount Wrangell ice core, Alaska. Atmospheric Environment43, 2582–2590.
Zhai, Q.M., Li, R.Q., 2002. Annual laminations of grain size in Angulinuo Lake and theenvironmental changes in Bashang Plateau. Scientia Geographica Sinica 22, 331–335(in Chinese with English abstract).
Zhai, Q.M., Guo, Z.Y., Li, Y.L., Li, R.Q., 2006. Annually laminated lake sediments andenvironmental changes in Bashang Plateau, North China. Palaeogeography, Palaeocli-matology, Palaeoecology 241, 95–102.
Zhang, D.E., 1984. A preliminary analysis of climatology of the dustfall in the history inChina. Science in China Series B 24, 278–288.
Zhang, Y.K., 2010. Drivers of lake water area reduction and dessication in semi-aridregion of China over the last 40 years. Master thesis of Peking University, 74–86(in Chinese with English abstract).
Zhang, D.E., Lu, F., 1999.Winter sandstorm events in extensiveNorthern China. QuaternarySciences 5, 441–447 (in Chinese with English abstract).
Zhao, Y., Yu, Z.C., Chen, F.H., Zhang, J.W., Yang, B., 2009. Vegetation response toHolocene climate change in monsoon-influenced region of China. Earth-ScienceReviews 97, 242–256.