Comparative Analyses of Exclusivism in Mongolia and East Asian Societies
Upload
khangminh22Category
view
1download
0
BANK OF MONGOLIA
ANNUAL REPORT 2011

1. MONGOLIA - ECONOMY REVIEW 7
1.1 Domestic demand 7
1.2 Manufacturing 20
1.3 External sector 26
1.4 Capital market development 49
2. MONETARY POLICY 51
2.1 Monetary policy objective and implementation 21
3. EXCHANGE RATE POLICY 55
3.1 Exchange rate policy 55
3.2 Foreign exchange reserve management 57
4. BANKING SECTOR DEVELOPMENT 59
4.1 Key performance indicators in the banking sector 59
4.2 Asset and liability composition of the banking sector 61
4.3 Prudential norms in the banking sector 63
4.4 Banking supervision 65
5. COMMUNICATION 69
6. PAYMENT AND SETTLEMENT SYSTEMS 71
6.1 Payment and settlement system 71
6.2 Interbank payments 71
6.3 Payment cards 72
7. OTHER ACTIVITIES OF THE BANK OF MONGOLIA 75
8. SUMMARY OF POLICY AND PROCEDURES APPROVED BY THE BANK OF MONGOLIA IN YEAR 2011 81
9. ÀUDITED FINANCIAL STATEMENT 83
10. STATISTICAL APPENDIX 143
CONTENT

4 ANNUAL REPORT 2011
ORGANIZATIONAL CHART OF BOM
GOVERNOR
BOARD OFDIRECTORS
FIRST DEPUTYGOVERNOR
DEPUTYGOVERNOR
RISKMANAGEMENT
UNIT Restracturing PolicyDivision
Supervision Division
Offsite MonitoringDivision
Legal Division
Maintenance Division Unit of Secret
and Security
Debt RecoveryUnit
Special unit
CommunicationDivision
LondonRepresentative Offi ce
Monetary PolicyDivision
Banknote Division
Financlal MarketDivision
Treasury Fund
Balance of Payment, Statistics and Research
Division
Accounting Division
Switch Clearing Center
SoftwareManagement Unit
Research and Servicing Unit
Research Division
SUPERVISIONDEPARTMENT
FINANCIALINTELLIGENCE
UNIT
ADMINISTRATIONDEPARMENT
INTERNAL AUDITDEPARTMENT
MONETARYPOLICY ANDRESEARCH
DEPARTMENT
INTERNATIONALECONOMIC
DEPARTMENT
PAYMENT ANDACCOUNTINGDEPARTMENT
INFORMATIONTECHNOLOGYDEPARTMENT
Payment Policy and Regulation Division

5ANNUAL REPORT 2011
STATEMENT FROM THE GOVERNOR
Ladies and gentlemen!
The Bank of Mongolia aimed to reach the midterm sustainable economic growth through keeping the infl ation at one digit unit and promoting the strength to withstand the economic crisis in 2011.
In 2011, the economy of Mongolia expanded by 17.3% due to the intensive growth of total demand. The substantial increase was also in capital infl ow as the Mongolian huge minefi elds are in use.
Limiting the continuously growing infl ation from the beginning of the year, the Bank of Mongolia tightened the monetary policy by
increasing the policy rate thrice and the required reserves twice. As undertaking the steps, the Ulaanbaatar infl ation measured by CPI was remained at 11.1% and the State infl ation was at 10.2% in December 2011.
The banking sector continued to play the biggest role in economic and fi nancial market of Mongolia. In particular, the 99.4% of total deposits and 99.2% of total loans are only being formed by the banks. In 2011, the banking sector invested much in this high GDP growth. Loan outstanding of banks in 2010 increased by 39.8% and in 2011 by 52.1%. Total loan was increased by 23% in 2010 and 72.8% in 2011. Especially, the small and medium enterprises loan was increased by 66.8% and the mortgage loan increased by 95.8% in 2011.
As regularly evaluating the banking sector risks and the economic cycles to improve the anticyclical sustainability of monetary policy, phase the proper macro prudential instruments was the main concern of the Bank of Mongolia.
To promote the payment systems and the non-cash payment, the Bank of Mongolia brought out ‘The Interbank High Value Payment Systems’ and ‘The Integrated Interbank Payment Card System’.
By the infl uence of world economic condition, the risks of price downing of raw and mineral products and decrease of foreign exchange infl ow are still being remained. Mongolia, a country with high capital infl ow and accelerating growth of economy, is facing a requisition to bring out the macro prudential policy that mainly addresses for the anticyclical and coordinated macroeconomic policy. Promoting the private sector and

6 ANNUAL REPORT 2011
maintaining the non infl ationary and stable economic growth by transmitting to prudent budget policy and tigthening the monetary policy are projected to become the main challenges for the Government and the Central bank of Mongolia.
Purevdorj.LGovernor, Bank of Mongolia

Economis Review of Mongolia
7ANNUAL REPORT 2011
1.1 Domestic demand
Final demand
Recovering from 1.3 percent down in 2009, Mongolian economy grew 6.5 percent in 2010 and 17.3 percent in 2011. In terms of composition, growth in 2011 has mostly driven by private consumption and gross fixed capital formation which grew 13.3 and 69.9 percent respectfully. It is worth pointing out that the share of final consumption in growth has decreased relative to the gross captial formation since 2010. The main reason behind this change might be foreign investments causing the increase in gross capital fomration.
Source: NSO *preliminary data
Private consumptionAccording to the national statistics office final consumption consists 79.8 percent of GDP and it grew 13.3 percent in 2011. However private consumption holds 78.9 percent of final consumption on average in last five years. The private consumption grew 13.3 percent, 2.3 percent more than previous year, while last five year average growth rate was 12.2. Several indicators confirm this positive evolution of private consumption in 2011. Loan outstanding has increased 42.1 percent and total sales has grew 1.6 times.
ECONOMIC REVIEW OF MONGOLIA 1
Figure 1:
Economy growth, growth contribition

Economis Review of Mongolia
8 ANNUAL REPORT 2011
Source: NSO *preliminary data
Net exportDue to the mining sector boom, domestic economy has expanded and total export has increased in late years. On the other hand, expansion of mining, construction and service sector has pushed the import as well. For example in 2009 11658, in 2010 26378 and in 2011 56210 automobile was imported. It means 2.1 times more in numbers and 2.7 in value than 2010 in 2011. Also lifter import has increased 10.1 times, road machineries like bulldozer import has increased 2.5 times, trucks import increased 2.0 times in 2011.
Source: NSO *Preliminary data
Figure 2
Private consumption,GDP
growth
Figure 3:
Balance of trade

Economis Review of Mongolia
9ANNUAL REPORT 2011
Government fi nanceIn the reporting year, budget revenue generated MNT 4159.6 billion (38.2 percent of GDP), expenditure and net lending rose by MNT 4792.0 billion (44.0 percent of GDP), resulting in an overall budget deficit of MNT 632.4 billion and a current account surplus of MNT 906.7 billion.
Budget revenueTotal budget revenue and grants reached 4159.6 billion, increased by MNT 118.3 billion or 2.9 percent on projections. Total revenue increased by MNT 1037.1 billion or 33.2 percent from the same period of last year.
In comparison with the previous year, current account revenue (99.6 percent of total revenue) increased by MNT 1063.0 billion or 34.5 percent, which determined the total growth of revenue. Tax revenue (87.8 percent of current account revenue) increased by MNT 948.6 billion or 35.3 percent from the same period last year. Corporation tax revenue increased by MNT154.5 billion, personal income tax revenue increased by MNT 69.7 billion, which determined total growth of tax revenue. Revenue from price increase tax of some decreased by MNT 367.3 billion from the same period last year.
Table 1: Total revenue /Billion tugrug/
Total revenue Actual2011 Year on
yearProjection ActionTotal revenue and grantsCurrent revenueTax revenue
Personal income tax Taxes on social security contributions Taxes on property taxes Taxes and domestic goods and services Taxes on foreign trade Other taxes
Non-tax revenueCapital revenueGrants and Tranfers
3,122.53,078.32,688.2
975.0331.313.8
865.3193.3309.5390.1
5.738.5
4,041.34,018.33,556.6
808.8383.814.4
15,540.2351.2548.2461.714.48.6
4,159.64,141.33,636.9
831.8450.416.9
1,428.6337.4571.7504.416.81.5
33.234.535.3
(14.7)35.922.565.174.584.729.3
194.7(96.1)
Source: NSO * Preliminary data
Non-tax revenue (12.2 percent of current account revenue) rose by MNT 114.3 billion or 29.3 percent from the same period last year. Revenues from budget entities (36.7 percent of total non tax revenue) increased by MNT 22.1 billion or 13.5 percent, which
determined total growth of non-tax revenue.

Economis Review of Mongolia
10 ANNUAL REPORT 2011
Budget expenditureIn the reporting year, budget expenditure and net lending reached MNT4792.0 billion, decreased by MNT 264.8 billion or 5.2 percent on projections. Total expenditure increased by MNT 1711.3 billion or 55.6 percent from the same period last year. Current expenditure (67.5 percent of total expenditure) grew by MNT 977.7 billion or 43.3 percent, capital expenditure (22.3 percent of total expenditure) increased by MNT 476.5 billion or 80.7 percent and other lending minus repayments grew by MNT 257.1 billion, which determined growth of total expenditure and net lending.
Table 2: Total expenditure and net lending /billion tugrug/
Fiscal expenditure2010 2011
Share Year on yearActual Projection Action
Total expenditure and net lendingCurrent expenditure
Expenditure on goods and services Interest payments Subsides and transfers
Capital expenditureOther lending minus repaymentsCurrent balanceOverall balance
3,080.72,256.71,166.7
42.31,047.6
590.7233.4821.641.8
5,056.83,337.01,557.8
38.21,741.11,254.2
465.6681.3
-1,015.5
4,792.03,234.41,528.1
37.31,669.01,067.2
490.5906.9
-632.4
10067.547.21.2
51.622.310.2
55.643.331.0
(11.8)59.380.7
110.210.4
Source:NSO * Preliminary data
PricesPrice level measured by Consumer Price Index rose by 9.4 percent in 2011. Considering most annually increased CPI item groups transport items increased by 12.7 percent, clothing and footwear items by 18.4 percent, housing and utilities items by 14.4 percent, food items by 7.6 percent and education services by 7.5 percent. As the price level surged by 9.4 percent food price contribution was 24.4 percent, clothing and footwear items contributed 23.8 percent, transport items contributed 17.0 percent and housing and utilities contributed 21.5 percent.
Due to dropped meat prices CPI decreased in March and April, while rising in other months. In May and June inflation peaked at a highest level of 2011 caused by supply reduction from Russia. Fuel prices rose by 11.1-17.4 percent at that period.

Economis Review of Mongolia
11ANNUAL REPORT 2011
Source: NSO
Source: NSO
During 2011 food price contribution to inflation weaken, while other items prices increased their contribution. In particular, contribution of food prices to inflation was 62.1 percent in 2010 compared to 2011 as food prices contribution was 24.4 percent. Core inflation rose continuously during the whole year reaching at the end of the year 8.7 percent. The main reason for such a high increase were high government spending and rapidly growing loan outstanding, which are extended domestic demand for goods and services.
Figure 4:
Annual infl ation
Figure 5:
Contribution to Annual UB infl ation
percent

Economis Review of Mongolia
12 ANNUAL REPORT 2011
Box 1: The public survey of Mongolian socioeconomic, banking and fi nance
Overview of Mongolian society and economy: Mongolbank conducted a “Socioeconomic and Banking, Financial situation” public survey in September 2011 for the seventh time. The result of survey shows that there confi dence over wellbeing of the economy has increased and it has reached to the pre cirisis levels. However, 40 percent of the people have argued that the current economic growth has affected them negatively and 20 percent of them have says it had no effect. Most of the people conducted in survey thinks that consumer pirce has incresed, and the wealth created in economy is distributed unevenly. Thus our survey show that the rapid economic growth is not supporting main population and low, middle income citizens are more likely to suffer.
Source: Mongolbank, the survey result of SEBF
Source: Mongolbank, the survey result of SEBF
Figure 6:
Economic overview of Mongolia
(percentage of correspondents who
answered)
Figure 7:
Distribution of economic welfare
(percentage of correspondents who
answered)

Economis Review of Mongolia
13ANNUAL REPORT 2011
More than half of the citizens think that mining will be the main sector in near future and not so few of them puts hope on manufacturing and agriculture as well. In the long-term, people who sees mining as a main sector decreases slightly compared to short-term, and turn attention to banking, fi nance and education other than above.
Source: Mongolbank, the survey result of SEBF
Source: Mongolbank, the survey result of SEBF
The results showing 26 percent of household thinks poverty is at the same level. This might be related to the actual poverty rate being 32 percent last years and did not fell that much. From here we can say that the poverty rate is still very high levels. On the other hand, there is some decline in unemployment according to the results.
Most of the citizens support ongoing big size projects by the government, since it doesn’t confl ict with the national interests and economic benefi ts. According to the citizens if mining projects start, it might harm the nature, most of the revenue from the mining sector might go to foreigners and income inequality might increase.
.
Figure 8
Main sector determining development (percentage of correspondents who answered)
Finance 9
Poverty rate (percentage of correspondents who answered)

Economis Review of Mongolia
14 ANNUAL REPORT 2011
Source: Mongolbank, the survey result of SEBF
Source: Mongolbank, the survey result of SEBF
Despite 20 percent of the citizens support the current cash transfers, 80 percent of them thinks that Human development fund should be spent on generating employment, developing infrastructure and subsidizing the manufacturing sector.
Figure 10
Negative effect of mining sector to
economy (percentage of correspondents
who answered)
Figure 11
Source of Human Development fund
(percentage of correspondents who
answered)
2.1
2.4
3.7
6.3
8.0
8.1
9.0
20.3
40.1
05 10 15 20 25 30 35 40
to suppo rt technological sector
to train functional staff
others
to suppo rt health sector
to suppo rt educational sector
to suppo rt small and medium sized firms
to suppo rt infrastructure
to grant
to increase work place
percent

Economis Review of Mongolia
15ANNUAL REPORT 2011
Financial institutionst
Number of banks area found to be enough and trust for the banks is increased to the pre-crisis levels due to the recent improvements in credibility of banks.
Source: Mongolbank, the survey result of SEBF
Source: Mongolbank, the survey result of SEBF survey
According to the survey results, need for a better service from banks and fi nancial institutions has increased. This might be related to the lack organization, and high transaction cost of 21 thousand MNT cash transfers. While banks remain as the main fi nancial service provider, it has seen that use of cards, a non cash payment tool, has eased the payment activities.
It has been a better result than previous years that more than half of the citizens are holding their savings in the banks and fi nancial institutions. Moreover, people who holds their savings as cash has decreased due to the investments in real estate and securities. Finally, people who conducted in this survey found deposit rates satisfying, which was another improvement compared to previous years.
Figure 12
Bank credibility (percentage of correspondents who answered
Figure 13
Bank service (percentage of correspondents who answered)

Economis Review of Mongolia
16 ANNUAL REPORT 2011
Source: Mongolbank, the survey result of SEBF
Source: Mongolbank, the survey result of SEBF
Need for loans have decreased slightly rather than previous years, and suffi ciency of loan supply increased to the pre-crisis level. This could indicate that economy is recovered from crisis. More citizens are willing to take mortgage loan and SME are demanding trade and service loan mostly. Moreover, consumer credit still keeps the high levels this year. Form here we can conclude that, there are less interests in value adding credits. Finally, people fi nd loan rate higher has increased 4 percent from 2009 survey.
Figure 14
Whether the correspondent
has saving and/or deposit? (percentage
of correspondents who answered)
Figure 15
Loan expenditure /in 2011/ (percentage of correspondents who
answered)
NoYes

Economis Review of Mongolia
17ANNUAL REPORT 2011
Box 2: Summary of a survey on Medium Scale Industry:
Medium scale industry (MSI) enhances not only households’ income, but also encourages economic development such as arising new occupancies, reducing unemployment and poverty, generating new technology and products, binding small and large businesses. Branch bank has a core impact for MSI’s development as a fi nancial connector.
The Bank of Mongolia has done research among executive of MSI on “Medium Scale Industry’s Current Situation, Its Funding In Mongolia”, which caught up 2,227 transactors (entities) (Co.,Ltd, LLC, partnerships, corporations) in total in January, 2012 throughout the country. From MSI’s perspective, organizations which supports them most:
• Commercial banks• Governmental and local governmental sectors
These organizations generally supports their business by funding, organizing exhibitions, consulting, facilitating dues (acquitting from tax and VAT). If we assort by economic sectors, comparing to others, agricultural and industrial are the sectors which receives promotions more. In the further, these actions must be taken foremost:
• Make governmental agencies without any delay• Compose preferential, suffi cient fi nancial source• Encourage national industries• Tax friendly enviroment• Reduce corruption- these actions must be implemented in a policy making level.
Majority of entrepreneurs examined business environment, in particular, for manufacturing and serving as very inconvenient, which indicates that environment for running business, taking opportunities are elusive in Mongolia. Moreover, as the respondents mentioned, infl ation’s stable lower rate and tugrug’s imperceptible fl uctuation rate would positively impact on their business.
From the social perspective, poverty and unemployment are the main backwards for MSI’s development. Furthermore, high rate of unemployment and poverty causes problem on customer’s purchasing power and also, on the other hand, because of poverty and unemployment are high, MSI executives’ certain parts couldn’t have the deposit property and guarantee for obtaining fi nancing. As a result of the survey, corruption, bribery, political commotion are also the barriers for MSI’s progress.

Economis Review of Mongolia
18 ANNUAL REPORT 2011
MSI’s business environment. (-1=poor 1=good)
Likewise other developing countries, one of the major obstacle for MSI is fi nancing environment:
• Lack of preferential loans• Loan’s infl exible main terms • stock market is weakly progressed • Absence of deposit property, guarantee etc.
Preferential loans which mostly comes from international organizations, often delivered by government, there are insuffi cient enough for fi nancing MSI, at the same time, Mongolian banks doesn’t have a capacity lending out medium and long term loans which have low interest rate with adequate source. Due to progress of stock market is impotent (particularly in local areas) entrepreneurs have a lack of opportunity to make money by their own property and technologies, simultaneously owing to high rate of poverty, unemployment, absence of deposit property, guarantee there is a hampered situation for receiving loans.
As a result of the survey generally legislative and adjustment environment has been evaluated as “poor”:
• Governmental organizations’ service• Legislative and adjustment environment• Tax system• Access to do foreign trade
From a market side, the most ticklish issue is inequity. Hence, there are operative entities and partials who disingenuously being part of competition, on the other side, this indicates actions of such organizations which are responsible for making arrangement for the competition. Apart from that, competence of market and system of insurance has been noted as fl abbily.
As the survey performed, even though infrastructure context seem to be meaner, comparing to others, it is the most reasonable factor. Transportational process has been marked as the worst among infrastructure. tax friendly statesConsidering amount of outlays and diagnosing barriers entrepreneurs encountering would be essential for further policy making. Here are list of outlays seem to be the most problematic that MSI’s executives are encountering:

Economis Review of Mongolia
19ANNUAL REPORT 2011
• Interest rate• Commision• Expenses on technology• Rentals
Mostly, initial fi nancing sources have often been raised by family savings whereas forth one have received loans for their fi rst fi nancing. More than half percentage had a experience receiving loan from bank while rest of entrepreneurs didn’t loan, some of them did not inadequate the terms bank give, even some adequated with requirements, they didn’t prefer to take a loan because they often found the bank’s infl exible loan term as very “hard”.
Precedently, some entrepreneurs was fi nanced by preferential loans or started their business by their family savings while rest of them, who mostly involved in fi nancing before, funded by bank loans. Respondents often funded their circulating capitals, expanded their operations, bought technics and machines by they assignments they took from the bank. On the contrary, they are facing diffi culties paying back their loans owing to the factors such as high interest rate, short term and small amount. Further, overwhelming part of the participants need fundings with amount of 10-50 million tugrugs, on in average with 5.8 interest rate, at least with one year term.
See more about origin of the survey:
http://www.mongolbank.mn/documents/moneypolicy/SME_negtgel.pdf

Economis Review of Mongolia
20 ANNUAL REPORT 2011
1.2 Manufacturing
According to preliminary estimates of the National Statistical Commission, GDP increased to17.3 percent in 2011. The growth consists of 7.1 percentage points in net taxest; 4.0 percentage points in wholesale and retail trade, repair and maintenance of cars and motorcycles; 1.6 percentage points in transport and storage; and 1.5 percentage points in mining and quarrying sector. 1.0 percentage points in manufacturing production and remaining 2.1 percentage points to other sections.
From the whole grouth of the GDP more than 40 percentage of it goes to the trade and service sectors. So sould take more attention to development of manufacturing sector.
Compare to the previous year, net taxes on production grew by 52.2 percent; wholesale and retail trade, repair and maintenance of cars and motorcycles increased by 42.5 percent; administrative and supportive activities increased by 19.6 percent, manufacturing industry grew up by 16.0 percent. But agriculture, hunting and forestry, fishery that are the main sector of our country increased by only 0.3 percent. Water suppl. sewerage, waste, management decreased by 2.3 percent.
Table 3. Gross Domestic Product, sector (at 2005 prices, in million tugrug)
2010 2011* Growth Wage Contribution to growth
GDP 4,162,784.9 4,881,362.0 17.3 100.0 17.3
Agriculture, foresty and fi shing 664,150.1 666,359.3 0.3 13.7 0.1
Minning and quarrying 736,944.1 801,031.6 8.7 16.4 1.5
Manufacturing 248,573.0 288,293.8 16.0 5.9 1.0
Electricity, gas, steam and air conditioning supply 96,144.1 100,927.0 5.0 2.1 0.1
Water suply; sewerage, waste, management and redemination activities
16,640.1 16,263.0 -2.3 0.3 0.0
Construction 60,225.6 68,825.6 14.3 1.4 0.2
Wholesale and retail trade; repair of motor vehicles and motorcycles 387,486.2 552,128.3 42.5 11.3 4.0
Transportation and storage 491,459.4 559,116.0 13.8 11.5 1.6
Accommodation and food services 23,307.0 26,712.0 14.6 0.5 0.1
Information and communication 180,325.1 190,759.4 5.8 3.9 0.3
Financial and insurance service 143,563.3 159,915.8 11.4 3.3 0.4
Real estate activities 195,850.6 206,934.3 5.7 4.2 0.3
Professional, scientifi c and technical activities 41,916.8 45,481.0 8.5 0.9 0.1
Administrative and support services 52,767.7 63,127.9 19.6 1.3 0.2

Economis Review of Mongolia
21ANNUAL REPORT 2011
Benefits from the economic growth for citizen and activity of citizen that become actively involved in the economic growth are at very low increase. Compare to the economic growth poorness and unemployment are high. Mongolian economy�s dependence on the extraction of natural resources become obvious. Nevertheless. due to the efforts of World bank and Asian Development bank in improving the benefits of the economic growth, some results are on.
AgricultureAgriculture sector has declined by 16.6 percent in 2010 due to unusual large snow fall. But in the stated year it has increased back by 0.3 percent.
Source: National Statistical Offi ce
In 2011, 36.3 million head livestock were counted, which of 15.9 million head of coat , 15.7 million head of sheep, 2.3 million head of cattle, 2.1 million head of horse and 280 million head of camel. The total number of livestock increased by 3.6 million head or 11.0 percent compared to the previous year, of which coat by 14.8 percent, sheep by 8.2 percent, cattle by 7.5 percent, horse by 10.0 percent, camel 3.9 percent.
Public administration and defence; compulsory 76,079.9 76,992.9 1.2 1.6 0.0
Education 99,089.4 106,851.7 7.8 2.2 0.2
Human health and social work activities 50,138.4 53,304.0 6.3 1.1 0.1
Arts, entertainment and recreation 11,475.0 12,294.1 7.1 0.3 0.0
Other service activities 16,719.6 18,685.6 11.8 0.4 0.0
Net taxes on product 569,929.4 867,358.9 52.2 17.8 7.1Source: National Statistical Offi ce *preliminary data
Figure 16
Agriculture sector growth (%)

Economis Review of Mongolia
22 ANNUAL REPORT 2011
Source: National Statistical Offi ce
Source: National Statistical Offi ce
Aimags such as Huvsgul (3315.5 thousand), Arhangai, Tuv, Uvurhangai and Hentii are in the leading aimags based on the number of livestocks in each of them. On average one herdsman household is taking care 170 livestocks, including1 camel, 10 horses, 11 cattle, 73 sheeps and 75 goats. In the reporting year 13.1 million livestock which is the 84.6% of total female livestock have delivered offspring. Rate of delivering offspring has increased by 3.1 percentage points. In total 12.5 million newborn offspring were raised and ratio of young animal rearing has notched up by 26.9 percentage points to 94.9%.
In 2011, 446.1 thousand tons of cereals, 201.6 thousand tons of potatoes, 100.0 thousand tons of vegetables were harvested and 1195.2 thousand tons of gross hay harvest, 46.7 thousand tons of handmade fodder were produced. Cereal harvest increased by 25.6 percent, potatoes 20.1 percent, vegetables 20.3 percent, gross hay harvest by 5.1 percent, handmade fodder by 42.8 percent compared pervious year.
Figure 17
Number of livestock by type
Figure 18
Amount of lifestock by type

Economis Review of Mongolia
23ANNUAL REPORT 2011
IndustryIn 2011, the total industrial output increased by 9.7 percentages to MNT 2058.8 billion (at 2005 constant price) compared to the previous year. Increases in the industrial output was mainly due to 22.6% and 16.8% percentages increase in main mining and quarrying products such as crude oil flour spar concentrate and coal; 10.5 percent increase in manufacturing products such as food products and beverages. Furthermore, other mining and quarrying increased by 14.0 percent and manufacture of basic metals decreased by 9.2 percent from the previous year.
Table 4: Total industrial output growth (%), products of major commodities2009 2010 2011
Mining and quarrying 2.2 10.1 9.5Mining of coal and lignite extraction of peat 34.2 91.8 22.6Extraction of crude petroleum 59.3 16.7 16.8Mining of metal ores -6.2 -6.4 4.1Other mining and quarrying -10.8 19.5 -14Manufacturing -14.2 11.4 11.6Manufacture of food products and beverages 22.1 24 10.5Manufacture of drinks and beverages 15 33.9 23.4Manufacture of textiles -5.3 -21.8 1.7Manufacture of basic metals -64.1 29.6 -9.2Electricity, thermal energy and water supply 1.8 5.8 5.8Electricity, thermal energy, steam 2.2 6.4 6.2Source: National Statistical Offi cet
In the reporting year, industrial output sales reached MNT 5626.7 billion of which 62.4 percent worth of products were supplied to foreign market. Mining and quarrying output accounted for 64.9 percent of the total industrial output, whereas manufacturing output accounted for 27.8 percent and electricity, thermal energy and water supply output accounted for 7.3 percent. Products sold to foreign markets comprised 83.8 percent of the mining and quarrying output and 29.7 percent of the manufacturing output. Industrial output sales in Ulaanbaatar city accounted for 56.3 percent of the total and Orkhon aimag made up for 22.2 percent.
Mining and quarrying sectorMining and quarrying sector growth which was 3.6% in 2010 and 8.7% in 2011 respect in the years mentioned above. Mining and quarrying sector output were equivalent to about 8.6% of GDP in 2002 and 16.4% of GDP in 2011; therefore it clearly shows Mongolian economy�s dependence on the extraction of natural resources.

Economis Review of Mongolia
24 ANNUAL REPORT 2011
Source: National Statistical Offi ce
Increases in the mining and quarrying sector output were mainly due to 16.8-77.3% increase in main extraction of crude petroleum and mining of metal ores.
Table 5: Mining and quarryingoutput growth (%), products of major commodities2009 2010 2011
Coal 34.2 91.8 22.6Crude oil 59.3 16.7 16.8Copper concentrate 1.5 -2.1 -1.6Copper concentrate with 35% 2.4 -3.7 -2.7Molybdenium concentrate 38.7 -17.4 -8.5Molybdenium concentrate with 47% 26.8 -8.7 -11Gold -35.4 -38.4 -5.5Iron ore -0.6 132.3 77.3Fluor spar concentrate -19.3 22 -17.3Zinc concentrate -1.5 -20.4 -7Tangsten concentrate 19.5 -18.1 -6.9Source: National Statistical Offi ce
Mining sector has become its biggest sector, accounting for 47% of exports and 64.9% of total industrial output in 2011. Oyu Tolgoi and Tavan Tolgoi its development is project to have significant and long-term impacts on the Mongolian economy.
Figure 19
Mining and quarrying sector growth (%)

Economis Review of Mongolia
25ANNUAL REPORT 2011
Source: National Statistical Offi ce
Transportation and communicationIn 2011, 44.0 million tons of freight and 296.2 million passengers (on a gross basis) were carried by all means of transport. Compared to the previous year, freight transportation and passenger rose by 49.5 percent and by 18.2 percent respectively. Total transportation revenue reached MNT 756.0 billion which is grew by 27.4 percent from the previous year.
Source: National Statistical Offi ce
Source: National Statistical Offi ce
The communication sector revenue stood at MNT 459.0 billion, indicating an increase of MNT 57.1 billion or 14.3 percent from the previous year. Revenue from individuals reached MNT 343.9 billion, which is 74.9 percent of the total communication revenue.
Figure 20
Amount of coal export (million tonn)
Figure 21
Percent of Vehicles, by type (2011)
Figure 22
Number of Vehicles, by used year

Economis Review of Mongolia
26 ANNUAL REPORT 2011
ConstructionAccording to preliminary findings, construction companies performed construction and capital repair works worth MNT 450.7 billion – an increase of 28.5 percent from the previous year. Domestic construction companies performed 94.9 percent of the total housing and repair works
Out of the total construction work and repairs, engineering work comprised 33.3 percent; housing projects were 29.8 percent; other projects such as industrial projects, trade and service centers, hospitals, schools and cultural palaces were 27.4 percent; and capital repairs were 9.5 percent, respectively. Domestic construction companies performed 55.8 percent of the total housing and repair works in Ulaanbaatar city
Source: National Statistical Offi ce
1.3 External sector
Balance of paymentRecent economic indicators, such as economic growth from 11.2 percent to 17.3 percent, 83.1 percent to USD 11.3 billion1 increase in foreign trade turnover, 55.5 percent increase in foreign exchange turnover, are indicating that there was signifi canly expansion in Mongolian economy in 2011.
The current account incurred a defi cit of USD 2’757 million, the capital and fi nancial account had a surplus of USD 2’864 million, with net errors and omissions of USD 78 million, summing up to a surplus of USD 28 million of overall balance of payments in 2011.
1 C.I.F
Figure 23
Structure of construction,
capital repairs and maintenances, by
type

Economis Review of Mongolia
27ANNUAL REPORT 2011
Source: Bank of Mongolia
Current accountIn the reporting year, current account had a defi cit of USD 2,757 million, which equals to 32 percent of GDP, an increase by 3.1 times compared to 2010. The increase of trade defi cit by 5.5 times reaching USD 993 million, the increase of services defi cit by 3.9 times reaching USD 1,161 million and the increase of income account defi cit by 41 % reaching USD 843 million have most contributed to the increase of current account defi cit.
In 2011, the current account defi cit percentage to GDP increased by 18 percent from previous year. Reasons for this rapid increase were increases of service and goods payment, which is related to the Mongolia’s dramatic economic growth, mega projects implementation and the expansion of domestic demand. Approximately 78 percent of the current account defi cit accounts to trade and services defi cits, which means increased by 25 percent compared to 2010.
Source: Bank of Mongolia
Figure 24
Balance of payment (million USD)
Figure 25
Current account defi cit’s percentage to GDP

Economis Review of Mongolia
28 ANNUAL REPORT 2011
Source: Bank of Mongolia
Trade in goodsThe trade turover2 increased by 1.8 reaching USD 10’628 million compared to 2010, and main contributors were increases of export and import which is equal to 66 and 88 percent. The main factors contributing to the increase of trade turnover namely exports were the increase in physical quantity of main exporting goods and their price increase on world commodity markets, while the import increases were infl uenced by surge of machinery and equipments imports and petroleum products’ import and their respective price fl uctuations.
In the reporting year the exports3 has increased by 65 percent from 2010 reaching USD 4780 million, but 76 percent of this increase contributed by only 3 products’ increases- coal, copper and iron ore. The coal export increased by 156 percent due to the coal price surge on global markets by 85 percent, the copper concentrate export increased by 25 percent due to the copper price surge on global markets by 20 percent, iron ore exports increased by 74 percent due to the increase of physical quantity exported by 62 compared to the previous year.
The imports4 increased by 99 percent reaching USD 6’527 million compared to the previous year, the main contributors were:
• increase in heavy machinery, equipment and spare parts import by 2.1 times, reaching USD 1’167 million.
• increase in transportation vehicle import by 2.5 times, reaching USD 1’075 million
increase in petroleum products import by 1.7 times, reaching USD 1’135 million. In addition the imports of consumer goods have experienced an increase as well.
2 F.O.B3 C.I.F4 C.I.F
Figure 26
Structure of current account defi cit (net)
million USD

Economis Review of Mongolia
29ANNUAL REPORT 2011
Source: Bank of Mongolia
Table 6: Exports (million USD)2010 2011
Commoity description Quantity (ton, barrel)
Amount in USD
mil
Quantity (ton, barrel)
Amount in USD
milChange (%)
1 Coal 16,559,008.9 874.6 20,956,064.9 2,239.3 156.0% ↑2 Copper concentrate 568,664.1 770.6 572,791.2 963.6 25.0% ↑3 Iron ore and concentrate 3,539,320.4 250.9 5,753,124.3 437.3 74.3% ↑4 Crude oil 2,078,682.3 154.9 2,540,474.6 252.2 62.8% ↑5 Zinc ores and concentrate 119,788.7 134.1 120,724.1 142.7 6.4% ↑6 Washed cashmere 3,015.5 104.6 2,829.5 131.9 26.1% ↑7 Gold 5,060.3 178.3 2,655.4 113.0 -36.6% ↓8 Leucite, nepheline, and fl ourspar 376,049.5 63.2 404,000.7 94.9 50.2% ↑9 Combed cashmere 976.5 68.8 537.8 57.6 -16.2% ↓
10 Molibdenium ore and concentrate 4,768.7 52.0 4,191.0 46.4 -10.8% ↓Other 247.1 301.3 22.0% ↑
Total export 4,780.4 64.9% ↑
Source: Bank of Mongolia, CGA
Table 7:Imports (million USD)
Product description 2010 2011 Change (%)
1 Petroleum 546.2 1,167.3 113.7% ↑ 2 Heavy equipment and spare parts 678.0 1,134.9 67.4% ↑ 3 Vehicles 422.2 1,074.5 154.5% ↑ 4 Food products 114.2 212.3 85.8% ↑ 6 Offi ce and homeware 168.9 189.2 12.0% ↑ 7 Pharmaceutical products 63.5 90.5 42.5% ↑ 5 Iron products 22.8 58.0 154.5% ↑ 8 Textiles 1.7 1.8 9.3% ↑ 9 Other main import products 124.2 211.3 70.2% ↑
Other 1,136.2 2,387.1 110.1% ↑ Total import 6,526.9 99.1% ↑
Source: Bank of Mongolia, CGA
Figure 27
Trdae balance (million USD)
5 F.O.B

Economis Review of Mongolia
30 ANNUAL REPORT 2011
Trade in servicesMongolia has exported USD 622 million services (which is increased by 28 percent), and imported USD 1’782 million services from abroad (which is increased by 128 percent) resulting in services account defi cit of USD 1’160 million in 2011, an increase of 3.9 times from previous year.
Reasons for this rapid increase were: transportation sevices defi cit increased by 7.4 times and reached USD 822 million, travel services defi cit increased by 6 times, reached USD 126 million compared to 2010, respectively. Besides the trade turnover has increased, so transportation demand increased too, and the Bank of the Mongolia changed thier calculating coeffi cient when they using to convert F.O.B. to C.I.F , are the some reasons behind this rapid increase. The travel services’ income has decreased by 11 percent and reached USD 218 million, altough the expence increased by 30 percent and reached USD 344 million, therefore the travel services’ defi cit has increased.
Source: Bank of Mongolia
Income In the reporting year compensation of employees account showed a defi cit of USD 116 million, an increase by 3.6 times from 2010, due to the compensation of USD 146 million paid out to nonresident workers in Mongolia.
Investment income account defi cit increased 1.3 times from previous year reaching USD 728 million. That was affected by direct investment income defi cit and portfolio investment defi cit, which increased by 35 and 16 percent.
Figure 28
Services balance (million USD)
Economis Review of Mongolia
31ANNUAL REPORT 2011
Source: Bank of Mongolia
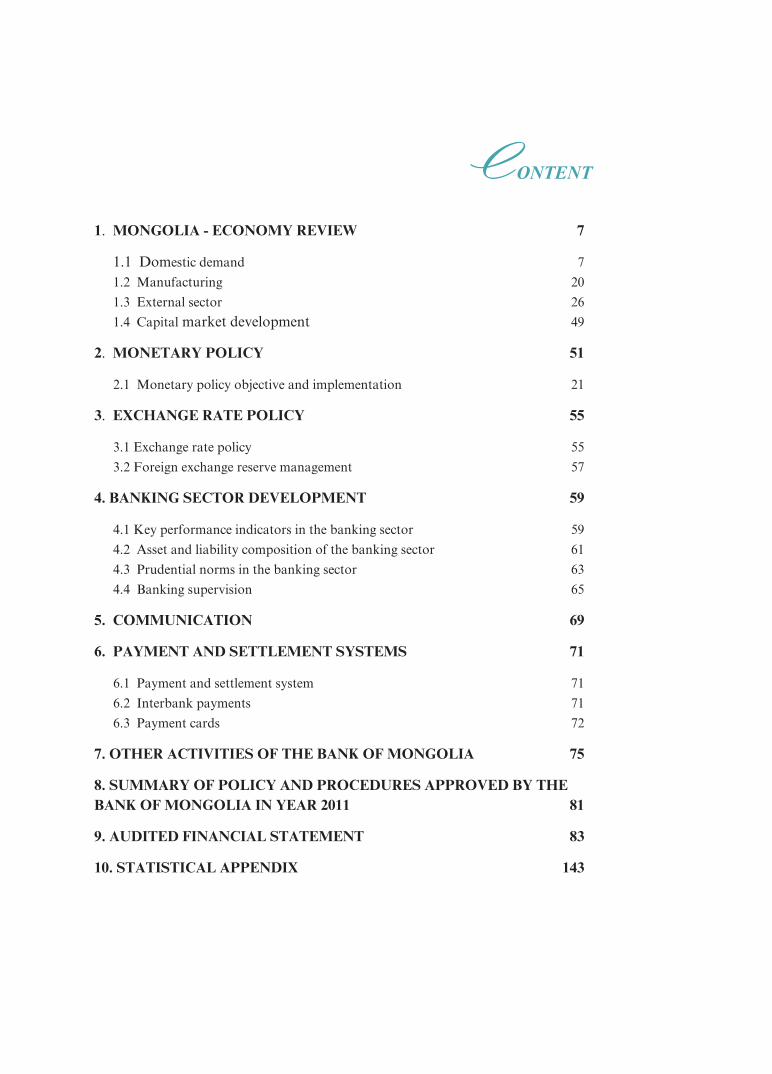
Foreign invested entities have distributed USD 257.3 million in dividends to its nonresident shareholders and paid USD 13.0 million in interest rate payments for the loans from direct investors. And residents have paid USD 97.6 million in interest rate payments for the loan brought from abroad.
Above mentioned factors led to income account defi cit of USD 843 million, an increase of 41 percent from previous year.
Current transfersNet current transfers increased by 27 percent compared to 2010 and reached USD 238 million. That was affected by an other current transfers, which increased by 43 percent and reached USD 220 million, altough net transfers of general government decreased by 46 percent and reached USD 18 million. The remittances received from workers abroad was USD 249 million, which increased by 0.6 percent compared to previous year, and remittances transferred abroad reached USD 191 million which increased by 61 percent. This tendency of signifi cant growth in remittances transferred abroad might decrease the surplus of current transfers.
Table 8. Remittances (millions of USD)
2009 2010 2011Annual changes
Amount PercentageWorkers remittance (net) 120.1 129.4 60.5 -68.9 -53%Received abroad 191.5 247.9 248.7 0.8 0%Transferred abroad 71.4 118.5 188.2 69.7 59%
Source: Bank of Mongolia
Figure 29
Net income balance (miliion USD)

Economis Review of Mongolia
32 ANNUAL REPORT 2011
Capital and fi nancial account
Source: Bank of Mongolia
Source: Bank of Mongolia
Capital and fi nancial account surplus increased 1.6 times in the reporting year, compared to 2010. It is explained by foreign direct investment, which is increased by 2.8 times compared to 2010, although portfolio investment account surplus decreased to USD 77 million and other investment account defi cit increased by 2.1 reached USD 1’947 million.
Foreign direct investment (FDI)At the end of 2011, there was a dramatic increase in FDI5
6 due to economic expansion, overheating, boom in construction sector as well as implementations of major projects for mineral sector. The shares of total FDI throughout countries are: Hong Kong (62%), Canada (9%), Republic of China (7%), USA (5%) and others 8 (%). Furthermore, out of total FDI, 85 percent were invested in mining sector, 7 percent and 3 percent were in Construction and
Financial & banking sector. 6 In regard to International Balance of Payment Methodology, credits, which is resident companies received from their foreign investors, is considered FDI.
Figure 30
Capital and fi nancial account balance
(million USD)
Figure 31
Financial account (million USD)

Economis Review of Mongolia
33ANNUAL REPORT 2011
Source: Bank of Mongolia, CGA
Source: Bank of Mongolia, CGA
Portfolio InvestmentsPortfolio investment account incurred a surplus of USD 1.0 million in the reporting year due to the following transactions:
• Foreign assets: Mongolian entities received repayment of securities totaling USD 21 million from non-residents.
• Equity securities: Net amount of USD 9 million equity securities was purchased by non-residents, through Mongolian Stock Exchange and brokerage companies.
• Government bond: In accordance with the decree titled, “Approval of the issuance of Government Bond” by State Great Khural, Government bond totaling MNT 76 billion for fi nancing long term housing loan program for 4,000 state employees, MNT 300 billion, out of which MNT 100 billion for cashmere sector, MNT 50 billion for wool sector, and the remaining MNT 150 billion to be used for promoting small-to-medium enterprise, traded through Mongolian Stock Exchange. Of which 5.7 percent or equivalent to MNT 21 billion bond was purchased by non-residents. Also the state owned Mongolian Development Bank issued a USD 20 million bond in the international capital market in 2011, with a guarantee by the Mongolian Government.
Figure 32
FDI by country
Figure 33
FDI by sector

Economis Review of Mongolia
34 ANNUAL REPORT 2011
Other investmentOther investment, which is a residual category, covers fi nancial instruments not included in direct investment, portfolio investment, or reserve assets. Other investment includes loans from Funds and use of Fund credit, fi nancial leases, other long and short-term loans, trade credits, currency and deposits.
Above transactions are classifi ed by: (1) assets and liabilities; (2) type of instruments- namely trade credits, loans, currency and deposits and ‘‘other assets and liabilities’’; and (3) resident sectors namely - monetary authorities, general government, banks, and other sectors. Trade credits, loans and ‘‘other assets and liabilities’’ are also classifi ed by original maturities.
During the year under review, Government of Mongolia disbursed the foreign loans of USD 197.2 million from the Donor countries and International Financial Institutions, paid USD 61.1 million for the principal repayment, as a result in the Government’s external debt outstanding reached to USD 1,927.2 million, showing an increase by 8 percent from the previous year.
Mongolian commercial banks borrowed USD 162.3 million from the non-resident and paid back USD 84.4 millions, resulting in the banking sector’s external debt position amounted to USD 333.9 million. At the same time, they did not give any type of loans to the non-residents, whereas received claims of USD 10.5 million for their outstanding lending.
Meanwhile, the non-banking sector, in other words private entities and person got long-term external loans of USD 263.5 million, short-term loans of USD 630.2 million, and repaid principal payments of USD 606.3 million. In relation to their shipment and its payment of the foreign trade, accounts receivable arised of USD 185.1 millions from the exports delivery, USD 221.0 millions from the advance payments of imports.
External debtIn relation to the Mongolia’s dramatic economic growth, big programs, projects implementation during last few years, amount of external borrowing and fi nancing has increased sharply which may affect macroeconomic stability. Therefore Bank of Mongolia urged the registration activity of the private sector’s external debt information according to the Law on Currency Settlement. From the fi rst quarter of 2011, the Bank of Mongolia published “Mongolia’s Gross External Debt Position” which shows countries all disbursed and outstanding debt.
As of the end of 2011, Mongolia’s gross external debt increased by 2.4 times more compared with previous year, reached USD 9.6 billions. Reasons for this rapid increase were: private sector’s external debt stock increased by 3.8 times more, reached USD 7.4 billion, Government disbursed and outstanding debt increased by 8 percent, reached USD 2.2 billion compared to 2010, respectively.
The Government outstanding debt increased by 9.1 percent, reaching USD 1,927 million, of which use of Fund credit outstanding rose by 1.2 percent reaching USD 268 million, banking sector’s external debt rose by 41.6 percent amounting to USD 685 million, non-banking sector’s external debt outstanding increased by 68.9 percent reaching USD 994 million and intercompany lending increased by 6.4 times reaching USD 5,748 millions,

Economis Review of Mongolia
35ANNUAL REPORT 2011
compared with 2010.
The banking sector’s external debt stock portfolio consists of 86 percent of long-term fi nancing, of which 34 percent bonds and notes, 40 percent loans, 22 percent, currency and deposits remaining 4 percent were other liabilities. In 2011, total of USD 77.7 million long-term loans, USD 84.7 million short-term loans disbursed, paid USD 30.8 million, USD 53.6 millions for principal payment respectively and a total of USD 15.7 million for interest payment.
Source: Bank of Mongolia
Source: Bank of Mongolia
At end-December 2011, the non banking sector’s external debt stock recorded USD 6,742 million, an increase of 4.5 times over the 2010. Main reasons of this drastic increase has been explained by following transactions of balance of payments:
• In reporting year, sub-account named -‘other’ in direct investment recorded surplus of USD 2,847.9 million. In other words, resident companies received a total of USD 3,824.9 million credits7 from their foreign investors, paid a total of USD 943.4 million
Figure 34
Banking sector’s external debt portfolio (USD million)
Figure 35
Non banking sector’s external debt portfolio (USD million)
7 This particular lending is a long term fi nancing, granted for the purpose of funding company's current asset and cash fl ow, in most cases has no strict repayment schedule, no interest rate and is added to the equity fund of the company.
Economis Review of Mongolia
36 ANNUAL REPORT 2011
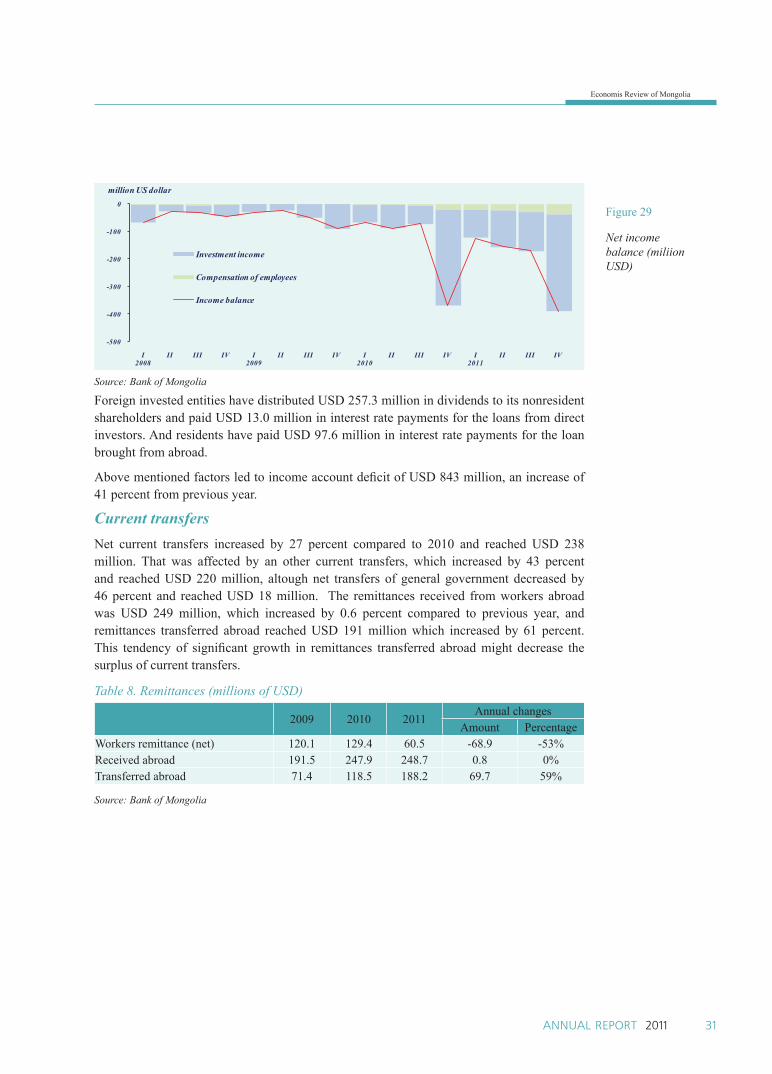
for principal payment. Most of this external fi nancing disbursed by mining sector’s companies.
• The net of trade credit defi cit of USD 406 million was due to delivery of exports and receipts of imports.
• A loan account’s surplus of USD 468.7 million shows the residents borrowed more than they repaid.
Table 9: Mongolian external debt position (thousand USD)
¯ç¿¿ëýëò 2008 20092010
20102011
III quarter I quarter II
quarterIII
quarterIV
quarter
General Government 1,602,179 1,818,076 1,772,756 1,766,993 1,798,322 1,851,688 1,832,380 1,927,195
Short term 0 0 0 0 0 0 0 0Money market instruments 0 0 0 0 0 0 0 0Loans 0 0 0 0 0 0 0 0Trade credits 0 0 0 0 0 0 0 0Other debt liabilities 0 0 0 0 0 0 0 0Arrears 0 0 0 0 0 0 0 0Other 0 0 0 0 0 0 0 0
Long term 1,602,179 1,818,076 1,772,756 1,766,993 1,798,322 1,851,688 1,832,380 1,927,195Bonds and notes 0 66,248 18,015 18,995 19,979 24,835 24,458 22,434Loans 1,602,179 1,751,828 1,754,742 1,747,998 1,778,343 1,826,852 1,807,923 1,904,761Trade credits 0 0 0 0 0 0 0 0Other debt liabilities 0 0 0 0 0 0 0 0
Monetary Authorities 752 245,608 265,435 264,494 271,353 272,988 275,385 267,689Short term 0 0 0 0 0 0 0 0
Money market instruments 0 0 0 0 0 0 0 0
Loans 0 0 0 0 0 0 0 0Currency and deposits 0 0 0 0 0 0 0 0Other debt liabilities 0 0 0 0 0 0 0 0Arrears 0 0 0 0 0 0 0 0Other 0 0 0 0 0 0 0 0
Long term 752 245,608 265,435 264,494 271,353 272,988 275,385 267,689Bonds and notes 0 0 0 0 0 0 0 0Loans 752 245,608 265,435 264,494 271,353 272,988 275,385 267,689Currency and deposits 0 0 0 0 0 0 0 0Other debt liabilities 0 0 0 0 0 0 0 0
Banks 365,849 341,077 275,616 483,612 490,232 567,302 609,283 684,851Short term 66,948 112,705 76,878 76,853 68,462 85,639 96,725 98,516
Money market instruments 0 0 0 0 0 0 0 0Loans 66,948 112,705 76,878 76,853 68,462 85,639 96,725 98,516Currency and deposits 0 0 0 0 0 0 0 0Other debt liabilities 0 0 0 0 0 0 0 0Arrears 0 0 0 0 0 0 0 0Other 0 0 0 0 0 0 0 0
Long term 298,902 228,372 198,738 406,760 421,770 481,662 512,559 586,335Bonds and notes 87,000 59,000 17,000 198,000 198,000 200,500 200,500 200,500Loans 116,105 115,293 95,377 117,156 127,760 161,131 227,558 235,356Currency and deposits 75,796 22,079 29,361 34,603 39,009 63,032 63,441 129,633Other debt liabilities 20,000 32,000 57,000 57,000 57,000 57,000 21,060 20,845
Other sectors 124,475 361,726 296,332 588,437 680,838 880,692 868,665 994,046Short term 2,675 135,479 1,290 235,966 291,717 476,337 468,493 548,775
Money market instruments n/a n/a n/a n/a n/a n/a n/a n/aLoans 2,675 12,175 1,290 87,404 142,364 263,606 315,303 378,825

Economis Review of Mongolia
37ANNUAL REPORT 2011
Currency and deposits n/a n/a n/a n/a n/a n/a n/a n/a
Trade credits n/a 123,304 n/a 148,562 149,352 212,731 153,190 169,951Other debt liabilities n/a n/a n/a n/a n/a n/a n/a n/aArrears n/a n/a n/a n/a n/a n/a n/a n/aOther n/a n/a n/a n/a n/a n/a n/a n/a
Long term 121,800 226,247 295,042 352,471 389,121 404,355 400,172 445,271Bonds and notes 0 0 0 0 0 0 0 0Loans 121,800 194,732 295,042 328,421 361,939 375,840 397,735 430,452Currency and deposits n/a n/a n/a n/a n/a n/a n/a n/aTrade credits n/a 31,515 n/a 24,050 27,182 28,515 2,437 14,819Other debt liabilities n/a n/a n/a n/a n/a n/a n/a n/a
Direct investments: 90,259 219,280 601,340 893,399 896,450 4,544,499 5,433,831 5,747,806
Intercompany lendings 90,259 219,280 601,340 893,399 896,450 4,544,499 5,433,831 5,747,806
Debt liabilities to affi liated enterprises 0 0 0 0 0 0 0 0
Arrears 0 0 0 0 0 0 0 0
Other 0 0 0 0 0 0 0 0Debt liabilities to direct investors 90,259 219,280 601,340 893,399 896,450 4,544,499 5,433,831 5,747,806
Arrears 0 0 0 0 0 0 0 1
Other 90,259 219,280 601,340 893,399 896,450 4,544,499 5,433,831 5,747,805
GROSS EXTERNAL DEBT 2,183,515 2,985,766 3,211,480 3,996,935 4,137,194 8,117,169 9,019,543 9,621,587
Source: Bank of Mongolia

Economis Review of Mongolia
38 ANNUAL REPORT 2011
International Investment Positions (IIP)Mongolia’s net IIP was USD -8,152.2 million at the end of 20118. In other words, a liability position were USD 8 billion higher than asset position. It was related to FDI and other investments, mainly to Government external debt outstanding.
Table 10: Mongolian international investment position (IIP) by end of 2011 9
À. ASSETS 6,271.8 Á. LIABILITIES 14,423.9
1. Direct investment abroad 1,875.3 6. Direct investment in Mongolia 9,434.5
1.1 Equity capital and reinvested earnings 1,873.2 6.1 Equity capital and reinvested earnings
3,686.7
1.2 Other capital 2.1 6.2 Other capital 5,747.8 2. Portfolio investment 22.8 7. Portfolio investment 956.3 2.1 Equity securities 22.7 7.1 Equity securities 714.1 2.2 Debt securities 0.2 7.2 Debt securities 242.2 3. Financial derivatives 1.5 8. Financial derivatives 1.5 4. Other investment 1,524.7 9. Other investment 4,031.6 4.1 Trade credits 420.2 9.1 Trade credits 184.8 4.2 Loans 7.9 9.2 Loans 3,315.6 4.2.1 Monetary authorities 0.0 9.2.1 Monetary authorities 267.7 4.2.2 General government 0.0 9.2.2 General government 1,904.8 4.2.3 Banks 7.9 9.2.3 Banks 333.9 4.2.4 Other sectors 0.0 9.2.4 Other sectors 809.3 4.3 Currency and deposits 1,096.6 9.3 Currency and deposits 510.4 4.4 Other assets 0.0 9.4 Other liabilities 20.8
5. Reserve assets 2,847.4Â. POSITION (8,152.2)
5.1 Monetary gold 175.95.2 Special drawing rights 69.6 10. Direct investment (net) (7,559.2)5.3 Reserve position in the Fund 0.2 11. Portfolio investment (net) (933.5)5.4 Currency and deposits 1,965.9 12. Financial derivatives (net) (0.0)5.5 Securities 635.9 13. Other investment (net) (2,506.9)5.6 Financial derivatives (net) 0.0 14. Reserve assets 2,847.4 5.7 Other claims 0.0Source: Bank of Mongolia
The asset, Mongolia’s outward-investment to non-residents (external assets), was USD 6,271.8 million, of which 45 percent was foreign exchange offi cial reserve, 30 percent was foreign direct investment, and 24 percent was other investment asset.
The liability, non-residents’ inward-investment in Mongolia, reached USD 14,423.2 million, of which 65 percent was foreign direct investment, 28 percent was other investment and outstanding 7 percent was portfolio investment.
The equity capital investment and other capital investment (inter-company lending) comprised 39 percent to USD 3,686.7 million and 61 percent to USD 5,747.8 million of foreign direct investment, respectively.
The external liability exceeded the external asset and increased by 4.5 times to USD 6.3 billion comparing to previous year:
8 Preliminary result 9 Outsanding value at the end of the reporting year

Economis Review of Mongolia
39ANNUAL REPORT 2011
• In terms of main structure, external asset decreased 4.2 percent to USD 272.5 million, whereas external liability increased 1.7 times to USD 6.1 billion,
• As for accounts, though long positions of the foreign offi cial reserve increased by 24 percent to USD 560.0 million, short positions of FDI increased by 395 percent to USD 6,032.8 million and other investment by 64 percent to USD 973.9 million, respectively,
• If seen by transactions, the increases in short position of the IIP due to balance of payments transaction was USD 4.847.7 billion, due to price changes was USD 764.7 million, due to other changes was USD 842.9 million, but decreased by USD 111.5 million due to exchange rate valuation.
Table 11: International investment position /by account/12/31/2010 03/31/2011 06/30/2011 09/30/2011 12/31/2011
Total position -1808.4 -2937.7 -5265.6 -6929.1 -8152.2Direct investment position -1526.4 -2096.5 -4410.9 -6510.8 -7559.2Portfolio investment position -1037.0 -1321.9 -1254.1 -978.0 -933.5Financial derivatives position 0.0 0.7 0.0 0.0 0.0Other investment position -1533.0 -1863.5 -2142.3 -2046.3 -2506.9Reserve assets 2288.0 2343.5 2541.6 2606.0 2847.4
Source: Bank of Mongolia

Economis Review of Mongolia
40 ANNUAL REPORT 2011
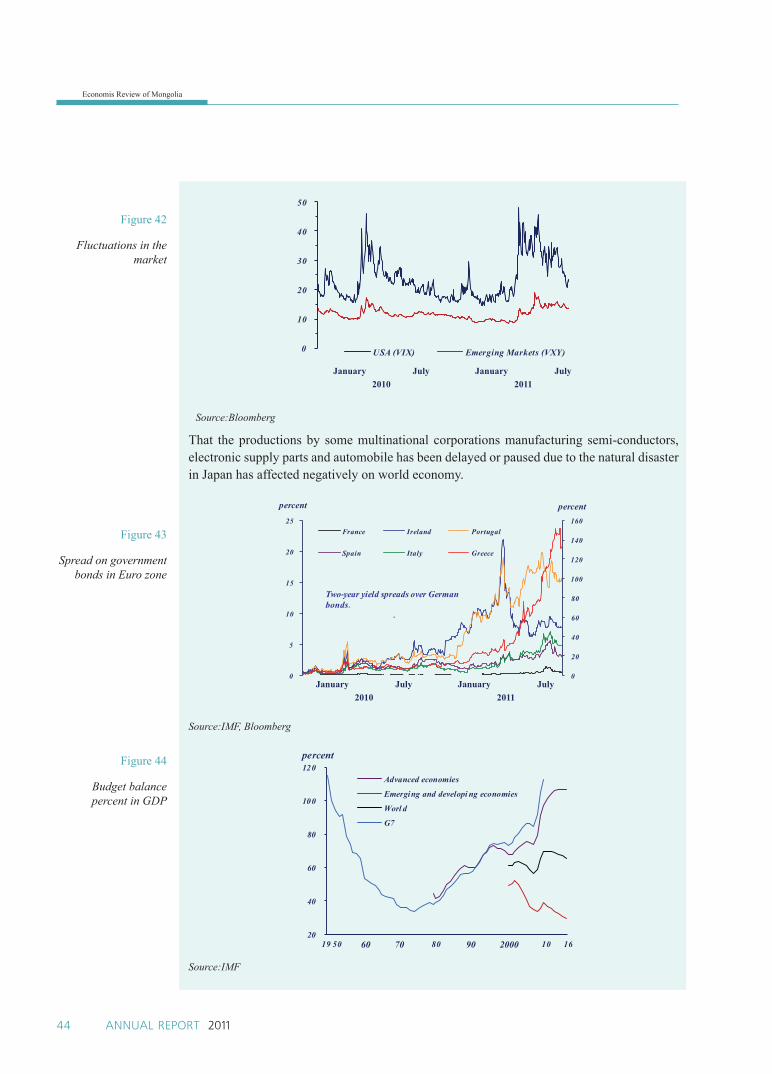
Box 3: Overview of World Economy
2011 has started with optimistic expectation of rapid recovery for the world economy and the pressure on infl ation caused by both drop in harvesting due to the fl ood in Australia, unpleasant weather conditions in Ukraine, Russia, China, and Pakistan and increasing price for food and oil due to political tension in the Middle East. Although Europe was facing longstanding debt crisis, gap of the return on government bonds for Greece and Germany was 12 times less in the end of 2010 than the end of 2011. Even though European authorities offering 110 billion Euros of aid to Greece’s debt crisis in May 2010, soon after 85 billion Euros for Ireland has calmed the situation for a while, other countries like Spain and Portugal that has high debt pressure got the attentions of investors and the negative expectations started to increase the interest on their bonds.
Source:IMF
At the beginning of 2011, Spain had initiated to decrease their budget and Euro bond has succeeded in the market and more affi rmative paces took place like Japan buying 25 percent of the bond. However, on 23rd of March Portuguese prime minister’s plan of decreasing their budget got disapproved by the parliament and led to his resignation which worsened the situation. Soon after on the 6th of April, Portugal has become the third country that requested fi nancial aid from European Union and the debt crisis has been escalated in euro zone.
Figure 36
World Economic Growth

Economis Review of Mongolia
41ANNUAL REPORT 2011
Table 12: World Economic Growth2005 2006 2007 2008 2009 2010 2011
World Output 4.4 5.0 5.2 3.0 -0.8 5.2 3.8Advanced Economies 2.5 3.0 2.7 0.5 -3.2 3.2 1.6
United States 3.1 2.9 2.0 0.4 -2.5 3.0 1.8Euro Area 1.5 2.8 2.6 0.6 -3.9 1.9 1.6
Germany 0.8 3.9 3.4 1.2 -4.8 3.6 3.0France 1.9 2.7 2.2 0.3 -2.3 1.4 1.6Italy 0.7 2.0 1.5 -1.0 -4.8 1.5 0.4Spain 3.6 4.0 3.7 0.9 -3.6 -0.1 0.7
Japan 1.9 2.4 2.4 -1.2 -5.3 4.4 -0.9United Kingdom 2.2 2.8 3.0 0.5 -4.8 2.1 0.9Canada 3.0 2.8 2.7 0.4 -2.6 3.2 2.3
Emerging and Developing Economies 7.0 7.7 8.3 6.1 2.1 7.3 6.2Africa /Sub-Saharan/ 6.2 6.4 7.1 5.6 2.8 5.4 5.2Central and Eastern Europe 5.6 6.4 5.4 3.1 -4.3 4.5 5.1Russia 6.4 8.2 8.1 5.6 -9.0 4.0 4.1Developing Asia 9.0 9.6 10.6 7.9 6.5 9.5 7.9
China 10.4 11.1 13.0 9.6 8.7 10.4 9.2India 9.0 9.5 10.0 6.2 6.8 10.1 7.8ASEAN-5 5.5 5.7 6.3 4.8 1.7 6.9 5.3
Middle East and North Africa 5.4 6.0 6.7 4.6 2.6 4.4 4.0Brazil 3.2 4.0 6.1 5.2 -0.6 7.5 3.8Mexico 5.2 3.2 1.2 -6.2 5.4 3.8
Source:IMF
Capital outfl ows from Asian and South American Counties has started due to the investors actions since there is a positive economic prospect in developed countries. Continuously growing infl ation pressure causes the expectation for the tightening monetary policy in the market and the countries like India, Brazil and China have been tightening their monetary policy step by step. Although in major countries with emerging economy10 the pressure of appreciating foreign exchange rate was increasing due to the increase in their domestic interest rate most of them continued to increase their foreign exchange reserve to prevent appreciation of nominal effective exchange rate.
10 Emerging economies

Economis Review of Mongolia
42 ANNUAL REPORT 2011
Source:IMF
In March of 2011, Japan has faced with Tsunami causing a damage of 240 billion USD twice as much as Kobe Earthquake of 1955. Financial market has reacted drastically to this natural disaster and in just 2 days after Tokyo Foreign Exchange Index dropped 20 percent and government bond interest rate has started to rise. Moreover insurance companies in Japan started pulling back their foreign exchange assets in the U.S. and Japanese Yen has started to appreciate rapidly against USD due to the aggression of the foreign exchange rate emerged from the expectations of funding domestic yen market expenses.
Source:IMF
Bank of Japan in order to provide liquidity in the money market has initiated to supply 82.4 trillion Japanese Yen of which 57.8 trillion was supplied in the market during the fi rst week after the disaster. It also intervened against the rapid appreciation of Japanese yen exchange rate, created loan channel of 1 trillion yen for the companies suffering from damage, expanded the types of approved collaterals and assets in the money market and confi rmed additional budget of 4 trillion yen for the recovery process after damage. As a result circumstances in the market tended to stabilize and the much appreciated exchange rate of yen till 76.3 against USD as of Match 17th has depreciated back to 82-83 in April.
Figure 37
Developed country infl ationè
Figure 38
Emerging economy and developing
country infl ation

Economis Review of Mongolia
43ANNUAL REPORT 2011
Source:IMF, Bloomberg
Source:IMF, Bloomberg
Source:Bloomberg
Figure 39
Foreign exchange rate
Figure 40
Price of raw materials and other products
Figure 41
Capital Market Index
January July 2010
January July 2010
January July 2010
January July 2011
January July 2011
January July 2011
EUROJPYCPYCHFGBP
Against US dollar(2011 .01.03 = 100)
Economis Review of Mongolia
44 ANNUAL REPORT 2011
Source:Bloomberg
That the productions by some multinational corporations manufacturing semi-conductors, electronic supply parts and automobile has been delayed or paused due to the natural disaster in Japan has affected negatively on world economy.
Source:IMF, Bloomberg
60 70 90 200020
40
60
80
100
120percent
Advanced economies
Emerging and developi ng economies
Worl d
G7
Source:IMF
Figure 42
Fluctuations in the market
Figure 43
Spread on government bonds in Euro zone
Figure 44
Budget balance percent in GDP
January July 2010
January July 2010
January July 2011
January July 2011

Economis Review of Mongolia
45ANNUAL REPORT 2011
-10
-8
-6
-4
-2
0
2percent
Advanced economies
Emergi ng and developi ng economies
Worl d
Source:IMF
Source:IMF, Bloomberg
When it is expected to have a negative effect on market due to the Euro zone problems, Japanese natural disaster and Middle Eastern political instability, American economic growth tented to slow down and the Standard and Poor’s has rated USA’s AAA ranking as having possible negatively trend. Another factor affecting to rate their rank with negative trend is their implementation of the second project to purchase fi nancial assets from Federal Reserve funds. As a result the forecasts of American economic growth of 2011 have decreased by 0.25 percent.
By the third quarter of 2011 there were statistics, researches and papers indicating the worsening of world economic conditions.
Euro zone’s policy to tighten their budget, banks and fi nancial institutes’ risky assets and their fi nancial responsibilities and their efforts to decrease the debt had a negative effect on economy though drop in lending, increased expense of fi nancing and worsen the return from interbank market, therefore adding up the risk of debt crisis. In addition, experts reminded that branches of Euro zone banks in emerging market and developing countries are tightening
Figure 45
Government debt percent in GDP
Figure 46
Interest Rate

Economis Review of Mongolia
46 ANNUAL REPORT 2011
their loans to small business and individuals had affected negatively on growth in these countries.
1998 2002 06 2011
Source:IMF, Bloomberg
On August 4th of 2011 return on government bonds of Spain and Italy have grown rapidly to 6.2 percent. Moreover, stocks and bonds owned by the banks and fi nancial institutions from Belgium, France and Scandinavian countries were sold aggressively and the debt crisis was covering all Europe. During this period credit ratings of the banks and fi nancial institutions that were in Euro zone or holding fi nancial positions related to Euro zone were dropping. Therefore it has been decided on August 4th that holding short positions were no longer allowed in some fi nancial instruments of 4 countries that had more severe conditions.
2000 02 04 06 08 10 2011
Source:IMF
On August 2nd of 2011, the president of United States has signed on a plan to increase the maximum amount on government debt and decrease the loss in budget. Thus only after 4 days later Standard and Poor’s has lowered USA’s credit rating of AAA to AA+ for the fi rst time in the history.
Figure 47
Products and raw material price cycle
Figure 48
Foreign Exchange reserve

Economis Review of Mongolia
47ANNUAL REPORT 2011
Source:IMF
The pressure of the foreign exchange rate rapidly appreciating was increasing in some countries since the safe investment options were denominating. During this period Japan has increased their intervention amount by 10 trillion Japanese yen and the Central bank of Switzerland has started intervening to hold the appreciation rate of Frank against Euro at 1.2.
Due to the slow growth of the world economy most countries were expecting infl ation, not changing their monetary policies and deciding to depreciate it more.
Share in World GDP, 2011
Country Contributions to Global GDP Growth
Figure 49
Current account by geographic
Figure 50
World production and consumption imbalance

Economis Review of Mongolia
48 ANNUAL REPORT 2011
Consumption Share, 2011
World GDP growth
Country Contributions to Global GDP Growth
Source:IMF
On August 9th of 2011 Federal Reserve Fund announced that they are aiming to hold the interest rate low at least until the middle of 2013. Following the trend of slow economic growth the price of raw material products has been dropping in world market. By the fourth quarter of 2011 in addition to slow economic growth in developed countries the economic growth in emerging market and developing countries was started to slow down and the fi nancial market were dominated by the Euro zone problems. This negative anticipation of slowing economic growth in emerging markets and developing countries was mainly caused by the drop in Chinese export and the fl ood in Thailand.
Many governments have started to take step toward supporting economic growth and many have been announcing that they are taking unconventional monetary policy in order to support their economy since most developed countries have zeroed our their interest rate. For instance On September 21st Federal Reserve fund bought government bond worth of 400 billion USD, on October 6th Bank of England raised their budget of purchasing assets by 75 billion pound, and on October 27th Bank of Japan also raised their budget of purchasing assets by 5 billion Japanese yen. The central banks of Australia, European Union, Brazil, Indonesia and Israel have softened their monetary policy through lowering their interest rate.
On October 26th of 2011, Euro zone summit took place and decided their plans on following three main ranges (i) to lower the pressure on Greece, (ii) to expand the fi nancial stability fund in Euro zone, (iii) to strengthen and keep the trust to banking sector. This decision created positive expectation in the market and led to more positive indicators however it did not last long. On November 1st it was announced that the public survey will take place in Greece, moreover their and Italian government fell apart creating executive governance and such political instabilities have added up the uncertainty and the negative expectations in the market.
In November 2011 expense of Euro/USD swap has topped since December 2008 and it affected negatively on operations of banks in Euro zone. The Federal Reserve Fund, Canada, Japan, Switzerland and England in order to provide liquidity of foreign exchange at the international level opened channel for swap agreement with additional 0.5 percent on
Figure 50
World production and consumption
imbalance

Economis Review of Mongolia
49ANNUAL REPORT 2011
overnight swap interest rate for foreign exchanges and it had positive effect on market raising the major capital market indexes by 3-4 percents on same day. Through opening this channel Euro/USD swap premium has decreased to 1.19 percent from 1.51.
By the end of 2011 European investors have been pulling back their investments from emerging market countries. According to balance of payment statistics, most of these were transferred to France. Thus in those countries there has been a pressure of rapid depreciation in foreign exchange rates and Brazil, Hungary, Indonesia, South Korea, Russia and Turkey have intervened to soften the rapid depreciation of foreign exchange rate.
Economic advisor and the general director of research department at IMF, Oliver Blanchard has made explanation on Euro zone crisis: (i) the main reason for the negative result was the wrong assessment, (ii) already settled opinions and understandings are coming true in reality, (iii) partial policy implementation are worsening the situation, (iv) policy to tighten the budget suddenly would affect the economic growth negatively and nations debts should be settled in long term with proper supervision not in short term.
In conclusion we are welcoming 2012 with more unfavorable, uncertain and risky world economy than the beginning of 2011.
1.4 Capital market
During 2011, the Mongolian Stock Exchange held 252 overlapping sales, totaling 122.8 million shares worth MNT 109.1 billion of 148 companies, 2.4 million government bills worth MNT 236.7 billion, and 439.5 thousand corporate bonds worth MNT 4.4 billion. Trade value of government bond has increased by MNT 206.7 billion or 7.9 times and shares by MNT 46.2 billion or 73.4 percent from the previous year. The total market capitalization rose by MNT 794.6 billion from the preceding year and reached MNT 2168.6 billion, or 20 percent of GDP. Tavan tolgoi, APU, Baganuur, Shivee ovoo, and Sharyn gol had the highest market capitalization.
Table 13. Capital market transactionTransaction amount Changes2010 2011 Amount Percent
Government bonds 30 236.7 206.7 7.9 äàõèíShares 62.9 109.1 46.2 73.4Corporate bonds 4.4Source:Mongolian Stock Exchange

Economis Review of Mongolia
50 ANNUAL REPORT 2011
TOP-20 index was 21687.57 points at the end of reporting year, up by 46.9 times from the previous year. This increase was due to the rise in the share prices of the some companies in the index, such as Bayanteeg, Suu, Talkh chiher, Mogoin gol, Remicon, APU, Tavan Tolgoi, Mongol shiltgeen, Bayan gol hotel, BDSec, State Department store, Baganuur, and Shivee ovoo. The average TOP-20 index was 21420.81 points.
Source: Mongolian Stock Exchange
Government bond worth MNT 65 billion for the program “To involve 4000 civil servants in housing loans” and MNT 171.7 billion for the program “To support wool and cashmere small and medium sized enterprises”, summing up at 2.4 million bonds worth MNT 236.7 billion were traded through 14 trading session. In 2011, 439.5 thousand bonds worth 4.4 billion of Just Agro and Mongol makh companies were traded.
In the reporting year, out of 148 companies whose shares were traded, the share price of 129 companies increased, those of 13 decreased, and share prices of 6 companies were remained stable. An average of 487.2 thousand shares worth MNT 432.9 million was traded daily. Table 14. The most active securities (by trade volume)
Securities companies Trade value /billion MNT/1 Remicon 33.32 Hermes center 263 Silikat 17.84 Berkh uul 10.25 Jenco tour bureau 5.6
Source: Mongolian Stock Exchange
Table 15. The most active securities (by trade value)Securities companies Trade value /billion MNT/
1 Sharyn gol 51.72 Baganuur 10.13 APU 7.64 Tavan tolgoi 4.75 Remicon 4.5
Source: Mongolian Stock Exchange
Figure 51
TOP-20 index, 2011

Monetary Policy
51ANNUAL REPORT 2011
2.1 Monetary Policy Objective and Implementation
Main Objective of Monetary Policy
As stated in the Central bank law, “The main objective of the Bank of Mongolia is to facilitate stability of the national currency – tugrug”. This means facilitating tugrug’s domestic purchasing power stability or providing price stability measured in domestic infl ation. Curbing infl ation at low and stabile rate has the benefi ts of preventing drop in real income and unequal distribution of income and easing the pressure on the shoulders of low income part of the nation. Moreover, infl ation at a stabile rate is a necessary condition for medium term sustainable economic growth, through escaping ineffi cient expenditure and reducing uncertainty in the economy.
Therefore, a numerical objective of infl ation rate is determined in “Monetary Policy Guidelines” of each year. For instance, it was stated in the “Monetary Policy Guidelines of 2011” that the infl ation rate measured in CPI shall not exceed a one digit number”, and as a result of many measures taken in recent years to meet this objective, infl ation rate was maintained close to the target rate in 2011. As for the exchange rate, it is kept as “consistent with macroeconomic fundamentals and a fl oating rate regime”.
Monetary policy measures and outcome
Bank of Mongolia has taken necessary actions and policy measures to serve the purpose of sustaining price stability, curbing infl ation at aimed rate and facilitating macroeconomic and fi nancial sector stability in the reporting year.
In the year in discussion, extensive fi scal expenditure, cash handout from the Human Development Fund, and private sector demand has played major role in increasing aggregate demand and further pressure on infl ation. Along with increased pressure on infl ation, price elevation of food, fuel and public administrative goods were the main reason for the BoM to tighten its monetary stance.
During the fi rst half of the year in discussion, several factors played role in fueling infl ation. First, price escalation of main food items (especially meat) fed by increased household consumption during the traditional White moon festival was a factor in increasing pressure on infl ation. Despite the meat stocking program of government, price elevation was further intensifi ed due to aftosa outburst in Eastern aimags. At the same time, world price of food and fuel were on the track of escalation. Second factor causing infl ationary pressure was expansionary fi scal policy, specifi cally, the increase of total expenditure of total approved government budget by 1017.7 billion tugrugs compared to the previous year (a rise of 33%), upsurge of current expenditure as a share of total fi scal expenditure and continuation of cash handout from the Human Development Fund. Third, soar of capital infl ow to the mining sector under the vast mining projects implementation, has intensifi ed money supply growth and consequently enhanced bank lending. For instance, during the fi rst half of 2011, annual growth of M2 had increased 1.5 times compared to the previous year, same period, and bank lending growth had risen 4.5 times.
Hence, for the fi rst half of the year in discussion, infl ation was mainly prompted by price elevation of some public administrative goods and factors of higher aggregate demand. Under the above detailed condition, BoM has taken the following measures.
MONETARY POLICY 2

Monetary Policy
52 ANNUAL REPORT 2011
1. In February 2012, in order to ease the increasing pressure on infl ation caused by higher level of aggregate demand generated by expansionary fi scal policy, cash handout to the people and excess demand from mining sector; infl ation in main trade partner economy (PRC) and world price elevation of food and fuel, monetary policy stance was shifted to contractionary mode and in this regard required reserve ratio was increased by 4 percentage points to 9%. Another motivation for the action was to facilitate the fi nancial sector, sustain its stability, reduce its “exposure to crisis” vulnerability and improve its ability to survive a negative shock.
2. In April 2011, with the purpose of decelerating the growth of money and lending activities; preventing the macro economy from overheating in medium term; easing the pressure on core infl ation caused by a sudden activation of economy; sustaining a medium term stabile economic growth and lowering the infl ation expectations of economic agents, BoM has took another contractionary measures by raising policy rate to 11.5% or a 0.5 percentage point raise.
During the second half of the reported year, same as earlier half, the monetary policy stance was tightened due to the following factors. First, continuation of cash handout from the Human Development Fund, extensive fi scal expenditure, and private sector demand were still pushing the aggregate demand to rise further. Moreover, price elevation of some public administrative goods had prompted core infl ation to continue to rise during March through July and consequently infl ation reached 12% in July. Second, elevation of meat price contributed mainly to consumer price infl ation and meat price in second half of the year did not follow its diminishing historical trend and higher level of meat price was sustained at the market. In addition, increase in fuel price channeled its way into other goods and services through increased transportation cost. Third, growth of loans to private sector exceeded GDP growth and created a condition of overheating. By the end of 2011, growth of total loan was 72.8%; growth of loan to private sector was 67.5%, whereas growth of nominal GDP was 28.7%.
Owing to the above mentioned demand and supply factors, both scope and pressure on expected infl ation were intensifi ed. Hence, BoM took the following policy measures in the second half of the year.
1. In August 2011, in order to ease infl ation pressure, cool down the overheating economy, precaution the vulnerability of fi nancial sector, and ease the depreciating pressure on tugrug due to rapidly rising import of consumption goods, BoM has raised policy rate by 0.25 percentage points to 11.75% and required reserve ratio by 2 percentage points to 11%, simultaneously.
2. In October 2011, as pro-cyclicality of 2011 budget amendment and 2012 draft budget was highly likely to lead to a surge of aggregate demand and consequently a higher infl ation; and as underperformance of global economy, reduction of capital was highly probable, accordingly a depreciating pressure on exchange rate was prevailing; with the intention of facilitating macroeconomic stability, policy rate was raised by 0.5 percentage points to 12.25%.
According to National Statistical Committee report, at the end of 2011, infl ation calculated by CPI was 10.2% at national level and 11.1% at Ulaanbaatar level, which were 3.2% and

Monetary Policy
53ANNUAL REPORT 2011
2.7% lower compared to the previous year, respectively. 36.5% of the increase in general price level was contributed by elevation of food price. Rise of price in food, clothing, transportation service and electricity, water, maintenance fee accounted for 36.5%, 18.3%, 16.5% and 12.1% of general infl ation, respectively. Whereas, meat price increase contributed 30.6% to general infl ation, equivalent to 3.4 percentage points.
Macroprudential policy measures
The main objective of macroprudential policy is to ensure fi nancial sector stability, prevent potential risks, to be prepared in case of inevitable systemic risk, and to overcome this risk with minimum amount of losses. According to international experience, during a period of high infl ow of funds and rapidly increasing real sector productivity classical monetary policy instruments are not suffi cient enough at protecting social conditions. As a result, it is becoming more common to apply the method of the European Central Bank, using macroprudential policy instruments alongside monetary policy instruments in order to maintain fi nancial stability. Especially, in an environment where funds fl ow freely across borders as globalization deepens, funds that follow a nation’s comparative yield increase have a direct impact on the country’s money supply, which reduces effectiveness of classical monetary policy instruments. Since the last crisis, this policy has become the only choice for creating a long-term, comprehensive macroeconomic policy and for actively implementing this policy.
With continuously expansive fi scal policy alongside high capital infl ow and exchange rate appreciation expectations, it is more effi cient for our country to take counter-cyclical monetary policy measures along with macroprudential measures. Therefore, due to symptoms of economic overheating and increasing speed of credit growth, the Bank of Mongolia decided to implement a macroprudential policy directed at the credit cycle and took policy measures to select an instrument directed at anchoring the speed of credit growth with minimum pressure on fi nancial intermediaries and maximum results. In the reporting year, within the framework of macroprudential policy, the Bank of Mongolia took the following measures to prevent economic overheating and to minimize overheating symptoms:
1. Tightened the monetary policy in a counter cyclical way twice in February and August of 2011, increased statutory reserve requirement twice by a total of 6 percentage points, 4 and 2 percentage points respectively. This measure, based on the economic outlook and its main indicators, was benefi cial in slowing down expected credit growth, increasing liquidity during economic downturn, to create certain reserves during economic expansion and meeting monetary policy objectives.
2. Set the liquidity ratio fl oor for banks in November 2011 and then raised this ratio by 7 percentage points upto 25 percent starting from the January 1, 2012.
3. It was decided in December 2011 to raise the fi rst tier capital and risk weighted asset ratios up to 7 percent starting from June 30, 2012, up to 8 percent from December 31, 2012, and up to 9 percent from June 30, 2013. Furthermore, it was decided that banks which have contributed to more than 5 percent of assets of the banking system for the last 6 months shall be set an additional capital adequacy ratio semi annually of 0.5 percent, 1 percent and 2 percent, respectively until June 30, 2013 and the total capital, risk weighted assets ratio was increased to 14 percent.

Monetary Policy
54 ANNUAL REPORT 2011
The overall aim of macroprudential policy is fi nancial stability and as for our country, where banks dominate the fi nancial sector, the banking system’s stability is of high priority. Therefore, in order to strengthen banking sector capacity, the decision to raise banks’ liquidity ratio and equity ratio during economic expansion was one of the measures of macroprudential policy.

Monetary Policy
55ANNUAL REPORT 2011
3.1 Exchange rate policy
A managed fl oating exchange rate regime contributes to mid- and long-term economic growth and prevents crises by providing a cushion in case of an adverse external shock via exchange rate and establishing macroeconomic equilibrium in a market economic way.
Therefore, under monetary policy framework of the last few years: The BOM has continued to pursue a fl oating exchange rate regime and allow it set consistent with macroeconomic fundamentals.
In 2011, economic growth accelerated to 17.3 percent, bank loan growth rate reached 72.8 percent, and government expenditure increased strongly. Expansionary fi scal policy stimulated aggregate demand, putting on more pressure on prices of goods and depreciating MNT since August 2011.
Furthermore, the current account defi cit widened to 30 percent of GDP, equivalent to 2.6 billion USD in 2011, increased 2.9 times from the year 2010. The trade defi cit increased 4.6 times to 1.76
11 billion USD, net exchange fl ow to the economy decreased fourfold or by 1.2 billion USD from 2010.
Even though foreign exchange infl ow rose by 40 percent, exchange outfl ow rose by 75 percent. It was the result of rapid increase of imports of goods, service payment, and loan payment.
Thus, macroeconomic fundamentals have driven MNT depreciation.
Moreover, USD appreciation against major currencies in the world market was the external factor for MNT depreciation.
For example, the USD index appreciated 10 percent from May 2011 to August 2011, 6 percent in the one month period September, and 9.4 percent from September 2011 to January 2012.
Major factors contributed to MNT depreciation are aggregate demand stimulated by expansionary fi scal policy, macroeconomic fundamentals or the current account defi cit contributed by imports of goods and services, and external negative effect or a fall in the terms of trade7
12 and uncertain expectation of foreign investment8
13, USD appreciation in the world market.
The Bank of Mongolia intervenes in the FX market to smooth excessive volatilities not only for the purpose of safe, effi cient, and immune economic environment, but also for stable macroeconomic or fi nancial condition. For example, the Bank of Mongolia increased foreign exchange reserve to a historically high level of 2.6 billion USD by intervening in order to smooth excessive appreciation of MNT in 20109
14 when foreign exchange infl ow increased rapidly.
11 C.I.F12 Th e terms of trade was 1.636 in the end of 2011, which was a 7 percent fall.13 Tendency that uncertain expectation of foreign investment arises in the year of parliamentary election. Paper by the Bank of Mongolia, 201114 Foreign exchange net infl ow reached 1.6 billion
3EXCHANGE RATE POLICY

Monetary Policy
56 ANNUAL REPORT 2011
At the beginning of 2011, the Bank of Mongolia kept policy to increase exchange reserve by intervening in order to smooth excessive appreciation of MNT and in the second and third quarter of the year, it did not intervene due to FX market equilibrium condition.
Nevertheless, when macroeconomic fundamentals resulted to depreciate MNT, the Bank of Mongolia started to intervene in order to avoid excessive depreciation of MNT from 8 November, 2011 and corrected expectation error due to short term imbalance in foreign exchange demand and supply. Thus, FX market stability was established.
In May 2011, the Bank of Mongolia and People’s Bank of China signed the currency swap agreement. The swap agreement will be conducive to maintain fi nancial stability and to ensure the MNT stability by immediately providing the market with CNY in case of FX market instability.
Source: The Bank of Mongolia
Source: The Bank of Mongolia
As of December 31, 2011, MNT reference rate against USD by the Bank of Mongolia was 1396.37, indicating 11.1 percent depreciation in comparison to the beginning of the year. During the reporting period, the average daily volatility rate was 0.24 percent, whereas the average daily appreciation and depreciation rates were 0.25 and 0.23 percent respectively.
Figure 52
Foreign exchange net fl ow and MNT rate
against USD
Figure 53
Frequency of daily fl uctuation in MNT
against USD

Monetary Policy
57ANNUAL REPORT 2011
Although the togrog exchange rate tended to depreciate, the fl uctuations of the exchange rate over the 85.4 percent of the year did not exceed 0.4 percent and only on 3 days it moved more than 1 percent.
3.2 Foreign exchange reserve management
There were no changes in the legal environment of foreign reserve management, in structure of foreign reserve management of the Bank of Mongolia and its monitoring system in 2011.
Although the decision was made to increase return of reserve management and to set 8 months for period of US dollar and Euro investments’ benchmark and 0-3 years for sector of investments, long-term investment stopped since risky situations10
15 arose in the world.
Therefore, as required by Mongolian law, the Bank of Mongolia invested its foreign reserves in time deposits and securities of central banks of the USA, Japan, France, Germany, and BIS for a reason to ensure safety of foreign exchange reserve.
As of December 30, 2011, the foreign exchange reserve reached at a historical high level of USD 2,458.40 million, which accounts to 17.42 weeks of Mongolia’s total import payments.
2006 2007 2008 2009 2010 2011
Source: The Bank of Mongolia
The foreign exchange reserve has increased USD 170.7 million or a 14.4 percent from the end of 2010. The increase was due to the following factors: Demand and time deposits by commercial banks at the Bank of Mongolia increased by
USD 69.5 million; Return on investments totaled USD 24.7 million which comprises interest income of time
deposits USD 6.0 million, income from short term securities of USD 2.5 million and gold trading income USD 15.9 million. Monetization of gold by the Bank of Mongolia amounted to USD 19.32 million due to
a 12.37 percent increase in monetizing gold price and 0.97 percent GBP appreciation against USD The Bank of Mongolia increased foreign exchange reserve by purchasing gold from
domestic gold mining companies and monetizing it; the Bank of Mongolia purchased USD 185.2 million from the commercial banks via the
foreign exchange auction and USD 31 million via forward, net purchase is USD 2.2 million.
15 U.S. Treasury bill yield continued to fall until the mid-March, 2011 due to political turmoil in North Africa and the Middle East, European sovereign-debt crisis, natural disaster in Japan, and Nuclear crisis.
Figure 54
Foreign exchange reserve (million U.S. dollar)

Monetary Policy
58 ANNUAL REPORT 2011
Main domestic source of foreign exchange reserve is purchase of gold. In the reporting period, the Bank of Mongolia continued the policy of concessional gold purchase from domestic gold suppliers. The Bank of Mongolia purchased a total of 3.3 ton in monetized terms valued at MNT 197.31 billion from 115 entities and 24 individuals. Gold purchase has increased by 56 percent or 1.2 ton from the year end of 2010.
Source: The Bank of Mongolia
Risk management of Foreign exchange reserves
The Bank of Mongolia ensures safety and liquidity of the foreign exchange reserves while conducting foreign exchange reserves management. Only after these obligations are fulfi lled, the Bank of Mongolia may conduct income earning operations with the foreign exchange reserves.
In the reporting year, the Risk Management Unit set composition of reserves appropriate for the Bank of Mongolia’s risk appetite. As part of the overall strategy, parameters for currency holding, allocation of assets, permissible range of investment instruments and duration requirements were established. In addition, the Risk Management Unit set quarterly credit and market risk limits, compliance of which were monitored daily through valuation of reserves, assessment of market risks and reported on global fi nancial market developments on a regular basis.
The turmoil in fi nancial markets triggered by the debt crisis of the Euro area continued throughout the year 2011. In order to preserve the safety and the liquidity of the reserves, the Bank of Mongolia invested in monetary gold, deposits at central banks and international fi nancial institutions, US and German Government bills, and BIS short-term debt instruments. The Bank of Mongolia continued its policy of collateralizing all investments regardless of the credit rating of the customer.
In the reporting year the benchmark rates of the major central banks as the Federal Reserve Bank and European Central Bank were at their historically low levels. Consequently, the Bank of Mongolia invested mainly in short-term instruments to manage the interest rate risk.
With foreign exchange reserves increasing, the Bank of Mongolia continued building its capacity in reserves management through cooperation with different central banks and external managers. In this respect, Bank of Mongolia joined the Reserves Advisory and Management Program in 2011; a capacity building and reserves management program offered by the World Bank Treasury to central banks.
Figure 55
Gold Purchase by the Bank of Mongolia /kg/

Banking Sector Development
59ANNUAL REPORT 2011
4.1 Key performance indicators in the banking sector
There are total of 14 commercial banks in Mongolia as of the end of 2011, with 1.9 million depositors and 606 thousand borrowers operating through their 1310 branches and units. The reporting year saw the great many progresses as evidenced by the growth of economic activities, increase in capital fl ows as well as in the deposits of households and private sectors which resulted in the widespread lending.
Assets for the banking sector as a whole totaled MNT 9.2 trillion, an increase of MNT 3 trillion from the previous year that accounted for 77.8 percent of GDP. Due to 48.2 percent increase of total liabilities in the banking sector at the end of 2011, the investments by banks in particular, the balance of loans outstanding grew to MNT 5.4 trillion, an increase of 75.4 percent or MNT 2.3 trillion from last year. Although the decline of 3.7 percentage points in the share of NPL in total loans to 3.1 percent was partly due to the sharp increase of lending, the NPL in absolute terms declined to MNT 176 billion by MNT 42.1 billion. In comparison to the previous year, the ratio of liquid assets over total assets decreased by 11.9 percent to 32.2 percent whereas the ratio of liquid assets over the short-term liabilities equaled 37.6 percent, down by 15.7 percentage points.
The total liabilities reached MNT 8.3 trillion, an increase of 48.2 percent or MNT 2.7 trillion from last year, the most of which was the growth in the deposits by private sectors and individuals. Of this growth, the majority that is - MNT 2.2 trillion or the 80.9 percent was comprised by core deposits. As the measure to ensure the smooth transitioning from the blanket guarantee scheme currently being enforced by “The law on bank’s deposit guarantee” which was passed on November 25th, 2008 by the parliament to the limited deposit insurance scheme, the preparatory works are underway.
Banks’ total revenues reached MNT 1 trillion, an increase of 56.6 percent or MNT 366.2 billion while total expenditures amounted to MNT 0.8 trillion, up by 43.3 percent or MNT 239.8 billion at the end of 2011. The favorable banks’ profi tability estimates were driven majorly by 45 percent increase of interest income relative to last year. Returns on assets and equity, relative to last year, grew by 1 and 7 percentage points and reached 2.9 percent and 18.2 percent respectively. Based on the comparisons that the domestic profi tability estimates were higher than its regional counterparts, it could be inferred that the profi tability of banking industry in Mongolia is generally higher.
Âàëþòûí õàíøèéí áîäëîãî,íººöèéí óäèðäëàãà4BANKING SECTOR DEVELOPMENT

Banking Sector Development
60 ANNUAL REPORT 2011
Source: Bank of Mongolia
Source: Bank of Mongolia
Source: Bank of Mongolia Source: Bank of Mongolia
WHD-Western hemisphere countries, ED-emerging and developing economies, OECD-organization for economic cooperation and development, G20-group of 20 countries, EUR- European countries, APD-Àsian and pacifi c countries
Figure 56
Total assets
Figure 57
Total loans outstanding and asset
quality
Figure 58
Return on assets
Figure 59
Return on equity

Banking Sector Development
61ANNUAL REPORT 2011
4.2 Asset and liability composition of the banking sector
In terms of the assets composition, the high quality liquid assets and cash accounted for the 22.1 percent, short-term investments were 12.3 percent, loans outstanding amounted to 59.1 percent and the remaining 6.5 percent constituted other assets where with respect to the maturity structure, 36 percent was allocated for assets up to 1 month, 28 percent was for 1 month to 1 year, 28 percent was for 1-5 years and the 9 percent was invested in 5 years or more maturity assets respectively.
In regards to the quality of the total loans outstanding, 95.6% or MNT 5.2 trillion was classifi ed as performing, 1.3% or MNT 72.6 billion as past due, while the remaining 3.1% or MNT 167.6 billion were of non-performing category. In terms of loans fi nancing to the various economic sectors, wholesale and trade amounted to 17 percent or MNT 929.7 billion, 14.3 percent or MNT 778.4 billion was to the real estate, 11.7 percent or MNT 636.2 billion to the construction, 11.5 percent or the MNT 624.2 billion to the manufacturing sectors respectively while the mining sector borrowed the 11.3 percent of the total loans or MNT 613.6 billion. As to the asset quality, NPL ratio was mainly higher for the mining (6.5%), manufacturing (5.6%), storage and transportation (4.1%), the construction (3.1%) and agriculture and animal husbandry (3%) sectors.
Source: Bank of Mongolia
As for the total liabilities structure, 47.8 percent comprised savings, 24.8 percent amounted to current accounts, banking capital was 10.3 percent, 9.4 percent was from other liabilities and the interbank credit where the funding from other fi nancial institutions constituted 5.6 percent. By the end of 2011, the liabilities with maturity up to 1 month had the share of 56 percent in total liabilities, down by 2 percentage points and those with maturity more than 1 year rose by 4 percentage points to 12 percent of the total liabilities from the previous year.
The surge-in capital infl ows led to the increase of current accounts of the private sectors in particular drove total current assets to grow by 34.2 percent or MNT 582.3 billion to MNT 2.3 trillion from last year. Total savings amounted to MNT 4.4 trillion at the end of 2011, up from the previous year by 56.6 percent or MNT 1.6 trillion. Of which, time deposits from individuals grew by MNT 586.2 billion to MNT 2.1 trillion while demand deposits grew up by MNT 340.2 billion and totaled MNT 1.2 trillion. The major factor for the expanding
Figure 60
Non-performing loans ratio across countries (in percent)
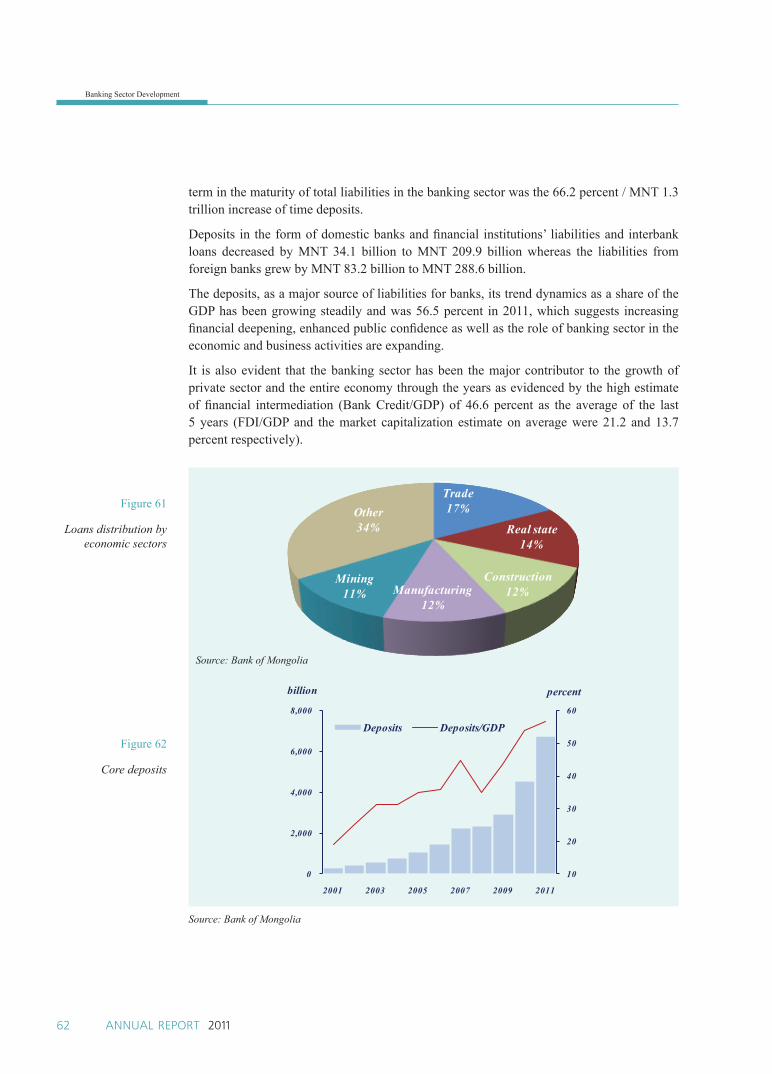
Banking Sector Development
62 ANNUAL REPORT 2011
term in the maturity of total liabilities in the banking sector was the 66.2 percent / MNT 1.3 trillion increase of time deposits.
Deposits in the form of domestic banks and fi nancial institutions’ liabilities and interbank loans decreased by MNT 34.1 billion to MNT 209.9 billion whereas the liabilities from foreign banks grew by MNT 83.2 billion to MNT 288.6 billion.
The deposits, as a major source of liabilities for banks, its trend dynamics as a share of the GDP has been growing steadily and was 56.5 percent in 2011, which suggests increasing fi nancial deepening, enhanced public confi dence as well as the role of banking sector in the economic and business activities are expanding.
It is also evident that the banking sector has been the major contributor to the growth of private sector and the entire economy through the years as evidenced by the high estimate of fi nancial intermediation (Bank Credit/GDP) of 46.6 percent as the average of the last 5 years (FDI/GDP and the market capitalization estimate on average were 21.2 and 13.7 percent respectively).
Source: Bank of Mongolia
Source: Bank of Mongolia
Figure 61
Loans distribution by economic sectors
Figure 62
Core deposits
Banking Sector Development
63ANNUAL REPORT 2011
4.3 Prudential norms in the banking sector
In accordance with “The regulation on Setting and Monitoring Prudential Ratios to Commercial Banks” approved by the Bank of Mongolia Governor’s decree 460 on 30 July 2010, the prudential norms encapsulating capital adequacy, liquidity, foreign exchange risk and credit concentration are calculated.
Capital adequacy
As of 2011, the total capital in the banking sector reached MNT 945.5 billion, up by 49.7 percent or MNT 313.8 billion whereas the risk-weighted assets grew by 65.8 percent or MNT 2.5 trillion and reached MNT 6.3 trillion. The capital adequacy ratio (CAR), as calculated based on the “The regulation on Setting and Monitoring Prudential Ratios to Commercial Banks” approved by the Bank of Mongolia Governor’s decree 460 on 30 July 2010, on a systemic level equaled 14.9 percent by the end of the year. The estimate, compared to the performance of the previous year had declined by 1.3 percentage points while the Tier 1 capital adequacy ratio also declined by 0.9 percentage points to 11 percent. Although the estimates of CAR and Tier I ratio are well above the minimum requirements by the Bank of Mongolia by 2.9 and 5 percentage points respectively, the growth rates of the capital are not enough to catch up the growth rate of the risky asset. Thus as a counter-policy measures such as the phase-in arrangements of strict minimum capital requirement, particularly that of the tier 1 capital ratio, the launch and the compliance of the new liquidity indicators as well as the tighter capital requirements for systemically important banks were taken to moderate the asset growth in relation to the potential risks in the system.
Liquidity
With amendments made on 4 April 2011 by the Governor’s 213th decree in “The Regulation on Setting and Monitoring Prudential Ratios to Commercial Banks” the minimum liquidity ratio requirement was set at 18 percent which was subsequently raised to 25 percent following the Governor’s 691st decree on November 25th of the same year to be complied by all banks from January 25th, 2012. By the end of the reporting year, the liquidity ratio in the banking sector as a whole reached 39 percent, up by 3 percentage points from the previous year. The liquid assets of the banks totaled MNT 3.2 trillion as of the year end of 2011, an increase of MNT 0.5 trillion from the previous year and 68.3 percent of which consisted of central bank bills, government bonds as well as deposits placed at the Bank of Mongolia.
Prudential norms on foreign currency operations
As required by the regulation, the ratio of net foreign currency open position to the capital shall be within +/- 15 percent for a single currency and within +/- 40 percent for total net open positions ratio by all banks. The prudential norms of foreign currency positions were 0.3 percent for a single currency and 4.6 percent for total net open positions as of the year end which are indicative of the compliance of the minimum requirement set by the regulation.
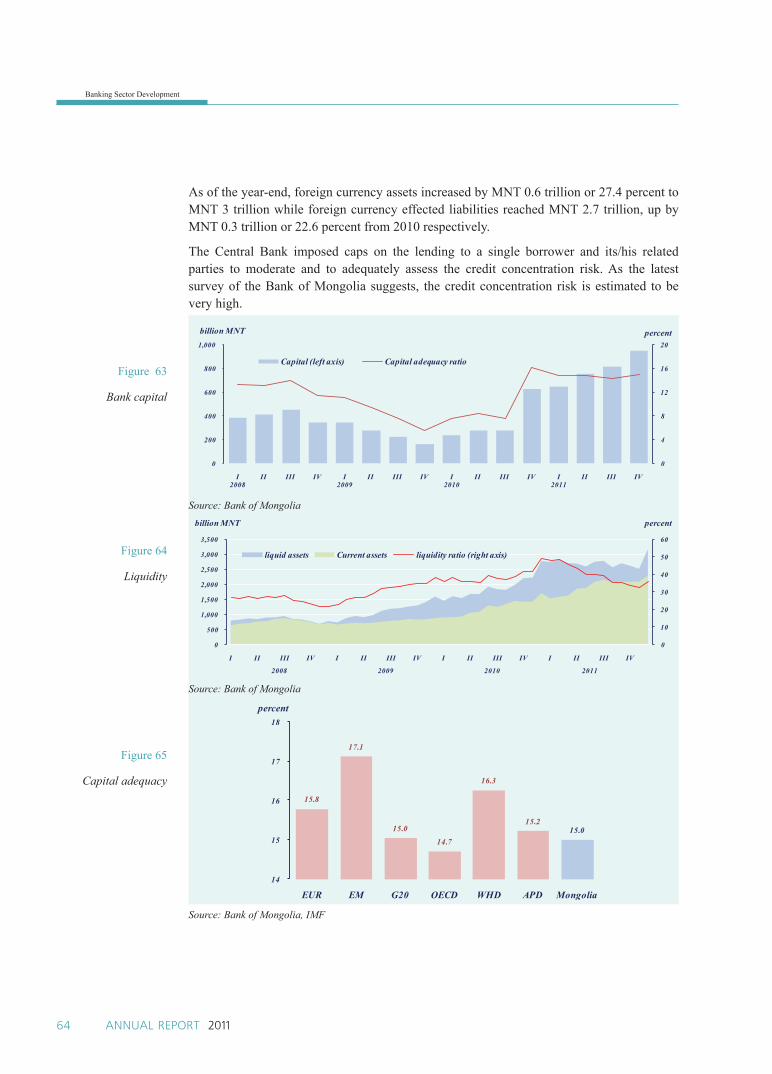
Banking Sector Development
64 ANNUAL REPORT 2011
As of the year-end, foreign currency assets increased by MNT 0.6 trillion or 27.4 percent to MNT 3 trillion while foreign currency effected liabilities reached MNT 2.7 trillion, up by MNT 0.3 trillion or 22.6 percent from 2010 respectively.
The Central Bank imposed caps on the lending to a single borrower and its/his related parties to moderate and to adequately assess the credit concentration risk. As the latest survey of the Bank of Mongolia suggests, the credit concentration risk is estimated to be very high.
Source: Bank of Mongolia
Source: Bank of Mongolia
Source: Bank of Mongolia, IMF
Figure 63
Bank capital
Figure 64
Liquidity
Figure 65
Capital adequacy

Banking Sector Development
65ANNUAL REPORT 2011
4.4 Banking supervision
As the common feature for most of its developing counterparts, the majority of fi nancial activities in Mongolia, about 95 percent in terms of the total assets are constituted by the banking sector. As the roles of banks in the fi nancial sectors are expanding in terms of launching the latest technologies and new fi nancial services and products, there is a renewed awareness for strengthening the current supervisory environment and for banking institutions to adequately identify and manage the risks for their daily operations, promote the corporate governance issues, which would lead to adequately defi ning their operational policy going forward.
Progresses made in the fi elds of supervisory review process
The decision to implement the selected number of macro-prudential policy instruments on banks was made after thoroughly analyzing the purported effectiveness of those instruments on the banking and fi nancial context of Mongolia. As such, the minimum liquidity ratio was set at 18 percent on April 8th, 2011 by 231st decree of the Governor of the Bank of Mongolia, which was later raised to 25 percent by 691st decree of the Governor on November, 25th of the same year. Moreover, the additional capital requirements for systemically important banks were set by 726th and 762nd decree of the Governor in 2011. The capital requirements for all banks were also set to be raised in accordance with the predetermined phase-in arrangements of the capital calibration framework in which the Tier-I and the total banking capital adequacy ratios shall reach 9 percent and 12 percent respectively by June 30th, 2013. In so doing, the Article 2.6.1 in the “The regulation on setting and monitoring prudential ratios to commercial banks” was amended in that, provided the bank makes the investment directly or through third parties in the form of equity of other banks and non-bank fi nancial institutions, the 75 percent of the invested amount to be deducted from the Tier-I capital whereas the remainder to be deducted from the Tier-II capital of the bank. The capital calibration plan to raise the capital adequacy ratio for systemically important banks by additional 2 percent was also imposed and the monitoring of the compliance is well underway.
As a response to strengthen the banks’ resilience to withstand potential loss and enhancing the liability of the bank shareholders, the minimum paid-in capital for banks was doubled by its previous requirement to MNT 16.0 billion in 2011 by the 404th Governor’s decree of the Bank of Mongolia. This paid-in capital requirement was to be fully complied by May 1st, 2013 and at present, seven banks which had failed to meet the requirement had issued their capital restoration plans where their implementation along with its compliance are being supervised by the Bank of Mongolia.
In order to ensure the transparency and the credibility in the banking industry, the adequate level of surveillance and the supervision are being enforced for banks’ compliance of Article 38 of the Banking law for the timely disclosure of their fi nancial statements and other relevant information to the public and the further measures of fi ne-tuning the disclosure practice are being considered.

Banking Sector Development
66 ANNUAL REPORT 2011
Moreover, the project to upgrade and extend the prior accounting and recording software system by the JICA of Japan was complete and the application started from November of 2011. As a result, the major progress has been made in the supervisory review process by the BOM, in particular in the off-site surveillance area where the set of functions of the system had been extended in which the fi nancial statements and other indicators were now possible to be automatically computed by the system – the majority of which were handled manually in the past. The parliament passed “The law on bank’s deposit guarantee” on November 25th, 2008 to ensure the fi nancial stability and strengthen the public confi dence in the banking sector and thus far the positive impacts had followed from the enforcement of the law in that, the steady increase in the total liabilities of banks are being achieved. The validity of the law was set for 4 years and thus there is a need for maintaining the fi nancial stability, protecting the depositors’ stake as well as ensuring the stable fl ows of the banks’ liabilities by the time the law expires. Thus, by the end of 2010 the working group composed of the Bank of Mongolia, Ministry of Finance, Financial Regulatory Commission along with the representatives from other relevant authorities was established and had drafted the “Law on deposit insurance” and submitted to the Financial stability council for review after which the process of presenting the draft law to the Mongolian parliament was initiated. If approved and passed, the would-be law could allow for the implementation of the internationally accepted limited deposit insurance scheme and thus the ground work and related technical arrangements of the scheme are currently being carried out.
The working group established in 2011 by the 53rd Governor’s decree, for creating the adequate legal framework of the enforcement of the collateral and the recovery of the loans extended in a timely manner is currently operating. To this end, the Bank of Mongolia is cooperating with the lawyers from Mongolian Bankers’ association as well as the technical assistance from Asian development bank and World Bank to draft the potential amendments proposal on the pertinent legislations.
It was rendered inevitable to form the system of consolidated supervision since the recent trends show that as the scale and scope of business entities expand, an increasing number of fi nancial conglomerates with a bank being one of its affi liate are emerging. Thus, the Bank of Mongolia drafted the regulation for consolidated supervision and further plans to implement it with the collaboration of Financial Regulatory Commission.
The memorandum of understanding with “KAMCO”, the asset management corporation of South Korea is planned to be made following the thorough research and analysis of its operation and activities by the Bank of Mongolia. Furthermore, preparatory works for developing close to state-of-the-art infrastructure for toxic assets recovery and the drafting of its legislations are in progress.
Within its objectives of promoting banks’ participations in the capital markets, ensuring the steady growth of bank returns and providing the fi nancial services for bank customers with favorable conditions in terms of lower interest rates with longer maturity, the Bank of Mongolia had granted permission for some banks to issue bonds on the international market.
The following works for expanding the operations of credit information bureau, increasing its effectiveness and improving the quality and contents of the data and information in the
Banking Sector Development
67ANNUAL REPORT 2011
bureau are being carried out. Of which:
• The Bank of Mongolia, as one of the working group member for drafting of “The Law on Credit information”, has focused more on the provisions in regards to ensuring the confi dentiality and safety of the information stored and facilitating the activities and operations of information service provider institutions. Subsequently, the draft law was approved on October 20th, 2011 and became effective from January 1st, 2012.
• For the purpose of extending the current scope of the credit information bureau, the working group by the Bank of Mongolia had been established to incorporate the information and the data from all non-bank fi nancial institutions along with the credit and savings unions. To this end, the testing of the software Micro Finance 1.0 was carried out in collaboration with Financial Regulatory Commission and was subsequently launched. Thus, as of the reporting year, data and information of the total of 34 micro-fi nance institutions, including 31 non-bank fi nancial institutions, 2 credits and savings union and 1 fi nancial leasing company were available for information exchange on the bureau.
• The particular attention has been given to the matter of including credit information of the individuals and the companies which are unregistered to the creditor institutions in the bureau by initiating work of incorporating the credit data stored in the landline phone companies, tax authority, social health and insurance organization, and several mobile phone operators to the bureau.
Supervisory process on banks
Under the directive approved by Bank of Mongolia Governor, total of 14 scheduled, full-scope on-site supervision which comprised the areas on capital adequacy, fi nancial standings, solvency level and the activities of banks were carried out, the results of which were then presented to the board of directors of the Bank of Mongolia for review and the compliance of the resolution by the board of directors are being monitored accordingly. In reporting year, 11 full-scope, 4 partial on-site inspections on banks as well as the partial supervision regarding the interbank loans and deposits activities were conducted.
The inspections detected numerous violations and breaches in the forms of falsely classifying the credit and its equivalents assets against the provisions of the regulation, insuffi cient loan loss provision, failure to accrue loan interest accordingly, violation of the prudential ratio limits, false submission of the fi nancial statements and the information incorporated on the credit information bureau, absence of the independent member on the board of directors and the failure of registering required legal documents and the submission of consolidated fi nancial statements as the fi nancial conglomerate to the Bank of Mongolia. As the countermeasures to these breaches, banks in questions were obliged to prepare the capital restoration plans followed by their implementation after the review of the Bank of Mongolia, raise Tier-I capital parallel to the asset growth, curb and lower the non-performing assets, comply with the single borrower and the bank’s related party limits, improve profi tability indicators, restrict taking deposits until the suffi cient amount of capital was restored, continuous monitoring of their fi nancial standings, restriction of the loan origination and extension by banks and the compliance and the fulfi llments were monitored accordingly.

Banking Sector Development
68 ANNUAL REPORT 2011
The proper off-site surveillance within the permissible legislations, were carried out through assessing and determining the compliance of the prudential and other mandatory indicators by banks from the monthly submitted fi nancial statements and other pertinent information and thus enhancing the market discipline across the sector.
The mid-term supervisory program for some undercapitalized banks has been implemented and the compliance was thoroughly reviewed on a monthly basis through which resulted in the robust capital adequacy and liquidity indicators.
Moreover, the banks currently under receivership are being undertaken and managed by the special supervisory unit until the winding-up of those banks are fi nalized.
As the step to apply the best international practices for effective corporate governance and to ensure transparency as well as to protect the interests of small shareholders, the compliance of the “Regulation on the implementation of the principles for corporate governance” was closely monitored twice a year whilst also the quality of the bank management and IT risk management status were routinely assessed by on-site inspections.
The appointment process of the independent board members of banks were, according to the “Regulation on the nomination, appointment and the dismissal of the independent board member of the bank” approved jointly by the Bank of Mongolia Governor, Minister of Finance and the Chairman of the Financial Regulatory Commission, were fulfi lled by all banks after strictly demanding and monitoring them to comply with the regulation.
Aside from the abovementioned projects and works done, in reporting year the endeavors such as organizing and conducting the seminars and training with other departments and institutions, reconciliation of the balances of current accounts by some state and budget offi ces as well as appointment of the offi cial analyst to the cases for some banks, where necessary, were carried out.

Communication
69ANNUAL REPORT 2011
The Bank of Mongolia’s communications initiatives in 2011 focused on several key areas including the economic outlook, monetary policy soundness for the better accountability and credibility.
Accomplishing the initiatives, some strategic actions which have increased the understanding of the central bank’s main objective, transparency, resilience of the monetary and budgetary policies were carried out through various channels involving press conferences, meetings, workshops, interviews, lectures, and articles.
Promoting the ‘Draft on Monetary Policy Guidelines’
Within promoting and interpreting the ‘Draft on Monetary Policy Guidelines for 2012’ to the Parliament, Government, press, and the public, the Bank of Mongolia held the open discussion cooperating with the Mongolian Banking Association and the Association of Parliament Journalists. Therefore, statement from the governor in accordance with the draft on guideline was published on the daily papers for the public understanding.
Monetary popilcy decision making and press conference
The Bank of Mongolia launched monthly press conferences. Announcing the press conference schedule brought not only the achievement to expect the Central bank actions, but also the infl uence on decision making process of banking and fi nancial sector.
The press conferences comprises two sessions: explanantions on background considerations of monetary policy decision and Q&A part. The monetary policy statements are also communicated in the Bank of Mongolia website immediately after the conferences.
Bank of Mongolia Publications
The Annual Report 2010, the Draft on Monetary Policy Guidelines for 2012, and the Research Book’6 were released in the year of 2011.
Improving the website
The Bank of Mongolia has given substantially more weight in improving the website and began launching the wholly renewed one in April of 2011. ‘Financial Information Unit’, ‘Payment Systems’, and ‘Financial Stability’, many more signifi cant areas are newly added as well as the list on ‘Monetary Policy’ was now become specifi cally developed.
Therefore, the Bank of Mongolia substantially proclaimed the public about the independence, accountability, transparency, credibility of the central bank via using the website.
The Bank of Mongolia products including researches, reports, and statistics were being informed through the website. For instance, the research on SME, and the quarterly reports on loans of banks, mortgage, deposits were started being anounced to the public.
Áàíêíû ñàëáàðûí õºãæèë5COMMUNICATION

Communication
70 ANNUAL REPORT 2011

Payment and Settlement System
71ANNUAL REPORT 2011
6.1 Payment and settlement system
Within the purpose to strengthen fi nancial stability by ensuring the safety and effi ciency, as well as, continuous operation in payment and settlement system, the Bank of Mongolia has improved its legal basis, carried out transactions through large and small value payment systems and Centralized payment card network, provided real time settlement and fi nality and maintained a high degree of security and operational reliability in consistent with internationally accepted standards and core principles.
To promote the usage of non cash payment instruments and mobile banking services, and to support the development of national platform by using technological innovation, the Bank of Mongolia has continued to implement the ‘Transformational Mobile Banking’ project. Together with the relevant authorities in banking, fi nancial and IT industries, including payment system participants, the Bank of Mongolia has developed a draft of the “Policy on mobile banking and e-money services”.
Since the SCHCD connected to Banksuljee system in October 2010, the large value payment system is handling not only interbank payments, but also transactions related to securities settlement. It allowed the opportunity to introduce the T+3 settlement system and to conduct securities clearing and settlement through the Bank of Mongolia by discarding the previous prefund system.
6.2 Interbank payments
Table 16. The number and amount of interbank payments for 2008-2011, quarterly (number in thousands, amount in billion MNT)
2008 2009 2010 2011number amount number amount number amount number amount
I quarter 499.9 2.4 502.0 1.7 693.8 2.2 798.9 3.7growth (%) 32.0 70.4 0.4 -29.1 38.2 25.8 15.1 68.2II quarter 633.6 2.8 715.9 1.8 908.9 3.0 1,077.5 5.4growth (%) 31.2 49.6 13.0 -35.6 27.0 69.6 18.5 80.0III quarter 494.3 2.6 626.2 1.9 801.9 3.4 903.6 6.0growth (%) 20.0 47.0 26.7 -24.4 28.1 74.2 12.7 73.5IY quarter 624.2 2.9 800.3 2.5 983.1 4.7 1,139.3 8.3growth (%) 14.2 -0.4 28.2 -13.6 22.8 86.2 15.9 76.6Total 2 252 10.7 2 644.4 7.9 3,387.7 13.2 3 919.3 23.4growth (%) 23.6 34.4 17.4 -25.4 28.1 66.5 15.7 77.3Source: Bank of Mongolia
The amount of interbank payments compared to the previous year decreased by 25.4% in 2009, whereas in 2010 and 2011 it has increased by 66.5% and 77.3% correspondingly. However, the number of interbank payments has increased each year by 17.4% in 2009, 28.1% in 2010 and 15.7% in 2011 respectively.
6PAYMENT AND SETTLEMENT SYSTEM

Payment and Settlement System
72 ANNUAL REPORT 2011
Source: Bank of Mongolia
The amount of interbank payments for 2008-2011 has increased quickly while the number of payments has increased slowly during these periods. The highest number and amount of interbank payments are usually settled in the fourth quarter, whereas the lowest are transferred in the first quarter.
6.3 Payment Cards
The Savings bank joined the Centralized payment card network as a direct participant.
Table 17. Payment card usage for 2009-2011Number of card holders Number of card users
2009 20102011
2009 20102011
Totalof
which in provinces
Growth (%) Total
of which in provinces
Growth (%)
1,885,103.0 1,538,336.0 2,169,838.0 852,401.0 41.1 476,230.0 670,887.0 440,177.0 102,489.0 -34.4
Source: Bank of Mongolia
In comparing to the previous year, the number of card holders has desreased in 2010, however it has increased by 41.1% in 2011. Due to the money granted from the Human development fund to the citizens of Mongolia, which was passed through the banks, the number of card holders increased dramatically. The number of card users compared to the previous year has increased in 2010, whereas it has decreased by 34.4% in 2011. It shows that not every card holder is unaccustomed to use his/her payment cards as non-cash payment instrument.
Table 18. Number of devices
2009 2010 2011 Growth by % 2010/2011
POS 3,754.0 4,418.0 5,624.0 27.3POB 1,186.0 1,576.0 2,354.0 49.4ATM 292.0 367.0 634.0 72.8Imprinter 417.0 412.0 373.0 -9.5
Source: Bank of Mongolia
Along with the expansion of payment cards usage, the number of devices has been
Figure 66
The number and amount of interbank
payments

Payment and Settlement System
73ANNUAL REPORT 2011
increasing every year. Among the devices, ATM has the highest growth which is 72.8 percent compared to the previous year.
Table 19. Number and amount of POS, POB and ATM payments(number in millions, amount in billion MNT)
2009 2010 2011 Growth by % 2010/2011
POS Amount 100.3 233.8 448.8 92.0Number 1.4 2.7 5.9 118.5
POB Amount 453.5 376.5 515.5 36.9Number 3.2 2.2 2.2 -
ÀÒÌ Amount 874.9 1,541.5 2,603.8 68.9Number 15.3 22.1 36.7 66.1
Total Amount 1,428.7 2,151.8 3,568.1 65.8Number 19.8 26.9 44.8 66.5
Source: Bank of Mongolia
The ATM is the most widely used devise in payment card system. However, the amount and number of POS payment have showed the highest increases in 2011 which are 118% and 92% respectively compared to the previous year.
Source: Bank of Mongolia
Figure 67
The amount of POS, POB and ATM payments (billion MNT)

Payment and Settlement System
74 ANNUAL REPORT 2011

Other Activities of the Bank of Mongolia
75ANNUAL REPORT 2011
The Central bank of Mongolia includes 7 departments, 2 independent units, 17 branches and a representative offi ce in London, United Kingdom. Considering the request from the Mongolian Banking Association /MBA/ and the Banking & Financial Academy, the Banking Training Center transmitted to the MBA under the Article 28.1.6 of the law on Central bank (Bank of Mongolia) and the decision of Board of Directors.
For the reporting year, the Bank of Mongolia employs 398 staff, of which 54% is male and 46% is female as well as 72.4% of the total employees is core staff working at the head offi ce. The 59% of the bank’s employees are the economists, supervisors, and accountants. The 71.4% of total employees having degrees on economics, accountancy, business administration, and legislation show that the workforce is profi cient enough to implement the bank policy and strategy. Undertaking the operations from organizing community activities to improving capacity to strengthen the staff, the number of profi cient staff was increased by 10%.
The Bank of Mongolia quarterly promoted the employees as evaluating the outgrowth of the workers and adjusted the issues to increase the salary, improve the working condition, and dissolve the welfare and housing conditions by relating with the alleged budget.
During the reporting year, the 100th anniversary of the establishment of banking and fi nancial organisation was occurred along with the 2220th anniversary of the establishment of Hunnu Empire, 805th anniversary of the establishment of Ikh Mongol Uls, and the 90th anniversary of People’s Revolution. In accordance with celebrating these highly exclusive anniversaries, the Bank of Mongolia actively participated the working group of celebrations.
Foreign relation
The Bank of Mongolia has active relationship with approximately 70 fi nancial institutions and other organizations all over the world. Bank of Mongolia continues developing its cooperation with various international fi nancial institutions and expanded relationship with other central banks to learn from their successful experiences. In this regard Bank of Mongolia organized following activities in 2011:
• April 2011: Offi cial visit of Deputy Governor to the Bank of Thailand to strengthen cooperation between the Bank of Mongolia and Bank of Thailand
• May 2011: Offi cial visit of the Governor of the National Bank of Cambodia to the Bank of Mongolia to sign the Memorandum of Understanding in encouraging bilateral cooperation
• May 2011: Offi cial visit of the Governor of the People’s Bank of China to the Bank of Mongolia on to sign bilateral SWAP agreement
• June 2011: Offi cial visit of The Bank of Mongolia delegation to People’s Bank of China to discuss SWAP agreement framework and further cooperation
• August 2011: Offi cial visit of the Governor of the Bank of Korea to the Bank of Mongolia to sign the Memorandum of Understanding in promoting bilateral cooperation and mutual assistance
• Open bachelor and master degree study program at Korean Universities for offi cials from Bank of Mongolia
Òºëáºð òîîöîîíû ñèñòåì7OTHER ACTIVITIES OF THE BANK OF MONGOLIA

Other Activities of the Bank of Mongolia
76 ANNUAL REPORT 2011
• September 2011: MOU signing ceremony between the Bank of Mongolia and Korean Service Commission in promoting benefi cial cooperation.
• September 2011: Signing ceremony of Agreement on bilateral cooperation between the Bank of Mongolia and the Central Bank of the Republic of Turkey in Washington
As a member country Bank of Mongolia participates in activities of International Bank of Economic Co-operation and International Investment Bank and its main role is to oversee two banks activities and to demonstrate strong commitment to economic cooperation.
As a SEACEN member country the Bank of Mongolia organizes SEACEN seminar biennially in Ulaanbaatar. The Governor of the Bank of Mongolia regularly participates in the SEACEN annual Governors Conference. The Bank of Mongolia organizes next SEACEN Governors Conference in Mongolia in November 2012.
Information technology
In the reporting year, the Bank of Mongolia has worked by providing reliable, stable and fail-safe operations of the information technology systems within the organization.
The Bank of Mongolia has continued to extend interbank electronic money market system and developed in-house new application software systems, like government bond trading and swap and forward exchange systems for banks. Therefore some major upgrades to current application software systems of internal operations have been developed and introduced.
In order to mitigate further possible risks of information technology systems, IT team have achieved some success in area of the information system safety, database replications and centralized monitoring.
Internal Audit
The Internal Audit Department of the Bank of Mongolia (IAD) carried out activities in accordance with the long term audit program for 2007-2011 and the annual audit plan for 2011. Audit assignments were focused towards monitoring the compliance of activities of Departments, Branches and other structures of the Bank of Mongolia on the implementation of the State Monetary Policy with Mongolian legislation; prevention and management of potential and actual risks; providing recommendations and instructions to bank governance and management, aimed to correction and elimination of the detected shortcomings. During the reporting year, IAD conducted planned and unplanned assignments, evaluated risks, covering all operational areas of six departments and all branches. IAD also supervised the implementation of audit recommendations. Internal Audit Department reported the audit outcome results to Supervisory Board and Board of Directors for follow-up decisions.
IAD also constantly takes efforts to develop the audit policy and regulations, planning and implementation procedures of audit examinations as well as enhance skills and
practices of IAD employees.

Other Activities of the Bank of Mongolia
77ANNUAL REPORT 2011
Combating money laundering and financing of terrorism
As the main body for ensuring the compliance of the Law on Combating Money Laundering and Financing of Terrorism, the Financial Information Unit (FIU) has constantly monitored AML/CFT compliance of reporting entities that are subject to Article 4 of the law, including banks and non-bank fi nancial institutions in 2011. FIU conducted on-site supervision on 12 banks and 3 non-bank fi nancial institutions. Accordingly, the state supervisor’s notices were issued for 14 breaches detected by inspections and 87 assignments were given to reporting entities to take corresponding actions within a specifi c time period. Most of these breaches were involved with inadequate compliance of know your customer requirements as stipulated in the law and failure to implement adequate measures to detect and inform suspicious transactions at the appropriate level.
In 2011, FIU received 474,880 Cash transaction reports (CTRs) of 20 million togrogs /or equivalent foreign currency/ or above conducted in cash, 49,221 Foreign settlement transaction reports (FSTRs) of 20 million togrogs /or equivalent foreign currency/ or above that include foreign settlement and transfers, and 71 Suspicious transaction reports (STRs) that are suspected of money laundering or fi nancing of terrorism. As a result, FIU collected a total of 1,227,917 CTRs, 52,145 FSTRs, and 158 STRs in its database as sum of all the years. This database is used for undertaking research on typologies and trends of money laundering and terrorist fi nancing (ML/FT) to identify vulnerable sectors and activities that have high risk of being used for ML/FT, to assist law enforcement authorities to detect proceeds of money laundering and other associated predicate crimes, and to conduct tactical analysis of suspicious transactions. In addition, FIU received a total of 10,042 Cross border cash transportation reports (declarations of crossing the border with 5 million togrogs /or equivalent foreign currency/ or above in cash) from the General Customs Offi ce since 2009 up to date and imported those reports into its database.
One of the main functions of FIU is to analyze suspicious transactions received from reporting entities and to disseminate fi nancial intelligence to law enforcement authorities for further investigation if there are reasonable grounds to suspect that transactions are related to money laundering and terrorist fi nancing offences. Within this framework of duty, FIU conducted analysis on 57 STRs and disseminated 21 reports to law enforcement agencies for further investigation in 2011 while it carried out analysis on a total of 106 STRs and transmitted a total of 95 reports to law enforcement agencies since its establishment.
With the purpose of enhancing the effectiveness of cooperation on fi ghting ML/FT, supporting foreign counterparts and domestic law enforcement authorities in conducting analysis on suspicious activities, and detecting proceeds of money laundering and associated predicate offences, FIU is now cooperating with 130 foreign Financial Intelligence Units (FIUs) through Egmont community and 4 domestic law enforcement agencies along with 3 domestic competent regulatory authorities. Within the scope of sharing information related to ML/FT with both foreign and domestic counterparts, in 2011 alone, FIU responded to 137 information requests out of 150 made by domestic law enforcement authorities and replied to 11 information requests out of 22 made by foreign FIUs. Since its establishment up to date, FIU responded a total of 306 information requests out of 328 made by domestic law enforcement authorities and replied to 15 information

Other Activities of the Bank of Mongolia
78 ANNUAL REPORT 2011
requests out of 35 made by foreign FIUs respectively.
Increasing awareness of reporting entities and competent authorities to improve their knowledge and understanding of AML/CFT issues is an equally important function of FIU in terms of sustaining effective AML/CFT system in Mongolia. In this regard, FIU organized 13 training workshops and seminars for 625 offi cials from banks, non-bank fi nancial institutions, and other relevant organizations in 2011 and conducted a total of 27 training workshops and seminars for 1,178 offi cials as sum of all the years respectively.
Development of Banking legislation
The year 2011 was exclusive year to development of banking legislation. This year Parliament approved The Development Bank Law, revised Company Law, Loan Information Law and amendments to the Central Bank Law. The draft amendments to the Blanket Guarantee Law were approved by the Parliament on 10 February 2011.
The Development Bank Law
The purpose of this law is to establish and govern legal grounds for operational principles, management, organization and scope od activities of Development Bank of Mongolia.
The Development Bank shall be engaged in the following activities:
1/ disbursing and obtaining loans;
2 /engaging in international and domestic transactions for accounts of borrowers;
3 /issuing loan guarantee and warranty on its behalf;
4/ issuance, sales and purchase of securities;
5/ sales, purchase and placement in deposits of foreign currencies;
6/ sales of loans, sales and purchase of other financial instruments;
7/ other activities, that are not prohibited by laws, for the purpose of prudently implementing asset and liability management.
The Development Bank shall provide loans to finance large scale development projects and programs of Mongolia approved by the State Ikh Khural and the list of projects and programs to be financed shall be approved by spring session of the State Ikh Khural on an annual basis.
Company Law /revised/
Following amendments were approved:
1/ Type and from of the company 2/ supervision system of company 3/ Legislation ground for public organization to participate in internal issue
and activity of company pursuant to ground state in law was clarified.
It shall be facilitated that environment for company governance is developed and is met international standards, after implementation of best practice for company governance is reflected in law particularly.
Moreover, concept of company embodiment as well as arrangement to present

Other Activities of the Bank of Mongolia
79ANNUAL REPORT 2011
consolidated statement was development and arrangement for result and responsibilities that exist from relations among head and subsidiary company and their activities.
Loan Information Law
This Law was adopted on October 20, 2011 and it is dedicated to arrange relations, including developing loan database, processing, saving, protecting, and using loan information, serving as loan information to customers, and granting, terminating, and supervising special licenses to carry out activity of loan information.
It was important step to assess and conclude risk of financial sector to make chance to prevent from that risk transmit from one sector to another sector, to strengthen responsibility system, and to facilitate fair competition, after the adoption of loan information and legislation ground is developed, which is dedicated for developing, using, and supervising database of cash payment related to payment that arise among banks, non-banking financial entities, credit unions, and citizens, public and private legal bodies which are state in this law and relevant contract.
Amendments to the Law on Central Bank and Banking Law
Supervision system for Banking shareholders and bank shall be improved; system of loan database shall be developed; its information sufficiency shall be enhanced; terminologies of relevant laws shall be unified, after amendment is made in Law on Central Bank and Banking Law relating to above-mentioned laws.

Other Activities of the Bank of Mongolia
80 ANNUAL REPORT 2011

Other Activities of the Bank of Mongolia
81ANNUAL REPORT 2011
No. Date Decree No. Title Main description
1. 2011.01.20 42Regulation on Registration of
Banking regulation
The regulation on Ragistration of Banking regulation is to develop database on Banking regulation that is regulating Bank activities.
2. 2011.01.31 65
General condition of the Bank of
Mongolia Service fee
Inter bank current account tarnsfer for currency of debt, and cashbox, relative, saving accounting service and they adopt for ardency of condition.
3. 2011.02.01 70
List of togrog’s exchange rate
against other foreign currencies and precious metals
Desined new list of BOM’s reference rates for togrog against US dollar and other currencies. The reference rate is calcuated as the average of the buying and selling rates from the 4 pm previous day to 4 pm current day’s transactions reported by commercial banks.
4. 2011.04.05 200 Code of conduct for Banking employee
This Code is code of conduct which sets standards of good banking practice for us to follow when dealing with persons who are, or who may become, our individual and small business customers and their guarantors.
5. 2011.04.20 245
Interbank Low Value Payment
Regulation, Master Agreement on
interbank low value payment
Inter-bank low-value payments will be conducted via shared fi nancial network on the real-time basis. The Bank of Mongolia Switch Clearing Center will be responsible for the uninterrupted reliable operation of this shared fi nancial network.
6. 2011.07.08 404 Bank’s minimum capital
Bank’s minimum capital revised into 16 /sixteen/ billion tugrug.
7. 2011.08.25 488Amendment to the Minimum capital
reserve requirment
Minimum capital reserve requirement for turgug and foreign currency have revised.
8. 2011.09.29 553 Regulation on Payment card
States that all interbank card payments regardless its payment volume should be regulated and executed under the “Interbank Low Value Payment Regulation”. Under this regulation payment card procedure principles, licence and related responsibilities have regulated.
9. 2011.10.07 572Procedure for swap agreement of MNT and Chinese CNY
Negotiations on the bilateral currency swap agreement between the Bank of Mongolia and the Peoples’s Bank of China. The MNT and CHY swap procedure has arranged in order to promote stability and liquidity in domestic fi nancial market.
10. 2011.10.07 573
Regulation on conducting offsite
supervision for AML/CFT reporting
entities
Report to reporting entities and competent authorities on measures taken by the Financial Information Unit according to the information received on suspicious and cash transactions on a regularly basis. develop the methodology for checking information related to money laundering and fi nancing of terrorism, monitoring and detecting suspicious transactions, inform reporting entities of the outcome, and supervise the compliance
11. 2011.10.25 613 To approve Central bank policy rate New policy rate has approved.
Òºâ áàíêíû áóñàä ¿éë àæèëëàãàà8SUMMARY OF POLICY AND PROCEDURES APPROVED BY THE BANK OF MONGOLIA IN
YEAR 2011

Other Activities of the Bank of Mongolia
82 ANNUAL REPORT 2011
12. 2011.11.25 691 Liquidity ratio
To assess with precision the prudential ratios and liquidity of commercial banks and control its optimal level and to undertake the enforcement measure.
13. 2011.12.14 726
Amendment to the regulation on Setting and
Monitoring Prudential Ratios to commercial banks
Minimum prudentiol ratio has approved.
14. 2011.12.27 750 Foreign payment order form Foreign payment order form has approved.

83ANNUAL REPORT 2011
Bank of MongoliaNotes to the Financial Statements
31 December 20119ÀUDITED FINANCIAL STATEMENT
BOARD OF DIRECTORS’ RESPONSIBILITY STATEMENT
The Bank’s Board of Directors is responsible for the preparation of the fi nancial statements.
The fi nancial statements of the Bank of Mongolia (“the Bank”) have been prepared to comply with International Financial Reporting Standards. The Board of Directors is responsible for ensuring that these fi nancial statements present fairly the fi nancial position of the Bank as at 31 December 2011 and of its fi nancial performance and its cash fl ows for the year then ended.
The Board of Directors has responsibility for ensuring that the Bank keeps proper accounting records which disclose with reasonable accuracy the fi nancial position of the Bank and which enable them to ensure that the fi nancial statements comply with the requirements set out in Note 2 thereto.
The Board of Directors also has a general responsibility for taking actions which are reasonably open to the Board to safeguard the assets of the Bank and to prevent and detect fraud and other irregularities.
The Board of Directors consider that, in preparing the fi nancial statements on pages on 1 to 57, the appropriate policies have been used, consistently applied, and supported by reasonable and prudent judgements and estimates, and that all applicable accounting standards have been followed.
Signed in accordance with the resolution of the Board of Directors:
L. PUREVDORJGovernor, Bank of Mongolia
83ANNUAL REPORT 2011

84 ANNUAL REPORT 2011
Bank of MongoliaNotes to the Financial Statements
31 December 2011
84 ANNUAL REPORT 2011

85ANNUAL REPORT 2011
Bank of MongoliaNotes to the Financial Statements
31 December 2011
85ANNUAL REPORT 2011

86 ANNUAL REPORT 2011
Bank of MongoliaNotes to the Financial Statements
31 December 2011
In millions of Mongolian Tugriks Note 31 December 31 December 1 January Assets 2011 2010 (restated) 2010 (restated) Cash in hand 44,505 14,609 47,749Due from foreign fi nancial institutions 7 2,244,580 1,097,256 933,789Financial investments available-for-sale 8 212,540 1,087,375 421,759Financial investments - held to maturity 9 - 72,702 -Reverse repurchase agreements 10 678,496 491,280 469,933Gold bullion and precious metals 11 268,085 125,433 63,388Government securities 12 155,276 53,044 170,000Loans to local banks 13 340,581 130,391 166,988Premises, equipment and intangible assets 14 26,003 25,568 23,966Other assets 15 6,148 2,397 1,149 TOTAL ASSETS 3,976,214 3,100,055 2,298,721
LIABILITIESCash in circulation 713,351 519,692 371,832Central bank bills 16 879,113 1,100,997 392,512Liabilities due to government organizations 17 1,170,890 822,381 722,492Deposits from local banks 18 1,015,230 640,730 541,638Liabilities due to foreign parties 19 105,412 95,235 112,195Other liabilities 20 58,072 66,527 49,548 TOTAL LIABILITIES 3,942,068 3,245,562 2,190,217
EQUITYCharter capital 21 5,000 5,000 5,000Accumulated loss (91,799) (34,331) -General reserve - - 29,961Other reserves 21 120,945 (116,176) 73,543 TOTAL EQUITY 34,146 (145,507) 108,504
TOTAL LIABILITIES AND EQUITY 3,976,214 3,100,055 2,298,721
Approved for issue and signed on behalf of the Managing Board on 7 June 2012.
_________________ __________________
86
Bank of MongoliaStatement of Financial Position
___________________________ _______________________________________________________________________________________________________________________________________________________________________________________________________________________________________________________________________________________________________________________________________________________________________________________________________________________________________________________ ______________________________________________________________________________ ___________________________________________________________________________________________________________________________________________________________________________________________________________________________
L.Purevdorj Governor
M. AmgalanDirector of Payment and Accounting Department
The notes set out on pages 6 to 57 form an integral part of these fi nancial statements.
ANNUAL REPORT 2011

87ANNUAL REPORT 2011
Bank of MongoliaNotes to the Financial Statements
31 December 2011
87
The notes set out on pages 6 to 57 form an integral part of these fi nancial statements.
Bank of MongoliaStatement of Comprehensive Income
In millions of Mongolian Tugriks Note 2011 2010
Interest income 22 19,669 11,751Interest expense 22 (118,981) (70,709)
Net interest expense (99,312) (58,958)
Net gain from trading of gold and precious metals 23 43,430 12,189Foreign exchange translation gains less losses/(losses net of gains) 24 252,306 (198,319)Commission income 2,002 1,069Other operating income 603 746Release of impairment provision, net 25 3,536 9,794Administrative and other operating expenses 26 (22,933) (20,326)
PROFIT/(LOSS) FOR THE YEAR 179,632 (253,805)
Other comprehensive income:Net gain/(loss) on available-for-sale fi nancial instruments:- Gain on fair value changes 21 21- Transfer to profi t and loss upon disposal - (227)
Other comprehensive income/(loss) for the year 21 (206)
TOTAL COMPREHENSIVE INCOME/(LOSS) FOR THE YEAR 179,653 (254,011)
ANNUAL REPORT 2011

88 ANNUAL REPORT 2011
Bank of MongoliaNotes to the Financial Statements
31 December 2011
88
Bank of MongoliaStatement of Changes in Equity
In millions of Mongolian Tugriks Note Charter capital
Accumulated loss
General reserve
Otherreserves Total equity
Balance at 1 January 2010 5,000 - 29,961 73,543 108,504
Loss for the year - (253,805) - - (253,805)Other comprehensive loss - - - (206) (206)
Total comprehensive loss for 2010 - (253,805) - (206) (254,011)
Transfer to other reserves from retained earnings 24 - 183,170 (183,170) -
Transfer to other reserves from retained earnings - 5,792 (5,792) -
Transfer of revaluation surplus for building disposed - 551 (551) -
Transfer from general reserves to retained earnings 21 - 29,961 (29,961) - -
Balance at 31 December 2010 5,000 (34,331) - (116,176) (145,507)
Profi t for the year - 179,632 - - 179,632Other comprehensive income - - - 21 21
Total comprehensive income for 2011 - 179,632 - 21 179,653
Transfer to other reserves from retained earnings 24 - (222,769) - 222,769 -
Transfer to other reserves from retained earnings 23 - (14,331) - 14,331 -
Balance at 31 December 2011 5,000 (91,799) - 120,945 34,146
Transfers from retained earnings (accumulated loss) to other reserves in 2011 and 2010 relate to transfer of unrealized foreign exchange differences and unrealized gains and losses on gold bullion (Note 2).
The notes set out on pages 6 to 57 form an integral part of these fi nancial statements.
ANNUAL REPORT 2011

89ANNUAL REPORT 2011
Bank of MongoliaNotes to the Financial Statements
31 December 2011
89
Bank of MongoliaStatement of Cash Flows
In millions of Mongolian Tugriks Note 2011 2010 (restated)
Profi t/(loss) for the year: 179,632 (253,805)Adjustment for:Unrealised gain on revaluation of gold 23 (14,331) (6,458)Unrealised (gain)/loss on foreign currency translation 24 (222,769) 183,170Depreciation of property, equipment and intangible assets 14 1,525 2,403Gain on disposal of property and equipment - (2)Loss on disposal of Ministry of Finance securities - 1,000Property and equipment written off 4 231Reversal of impairment losses on loans to local banks 25 (17,375)(Reversal)/charge of impairment losses on other assets 25 (3,536) 7,581Interest income on impaired loan - (492)Provision for social development fund 4,000 1,500Interest income 22 (19,669) (11,751)Interest expense 22 118,981 70,709
Cash fl ows from operating activities before changes in operating assets and liabilities 43,837 (23,289)
Net increase in gold bullion and precious metals (128,321) (55,587)Net increase in reverse repurchase agreements (149,132) (46,112)Net (increase)/decrease in due from foreign fi nancial institutions (70) 205Net (increase)/decrease in loans to local banks (209,899) 46,170Net (increase)/decrease in government securities (98,161) 115,956Net decrease/(increase) in other assets 2,965 (809)Net (decrease)/increase in Central Bank bills (230,656) 704,189Net increase in liabilities to foreign parties 16,057 1,492Net increase/(decrease) in deposits of governmental organizations 15,192 (113,808)Net (decrease)/increase in deposits of local banks (68,632) 153,348Net (decrease)/increase in other liabilities (12,494) 15,479
Net cash (used in)/from operating activities before interest (819,314) 797,234
Interest received 12,418 10,137Interest paid (109,680) (66,413)
Net cash (used in)/from operating activities (916,576) 740,958
Cash fl ows from investing activitiesAcquisition of premises, equipment and intangible assets (1,966) (4,814)Acquisition of fi nancial instruments available for sale (209,455) (1,143,109)Proceeds from sale of fi nancial instruments available for sale 1,096,047 418,964Acquisition of fi nancial instruments held to maturity - (72,702)Proceeds from sale of fi nancial instruments held to maturity 72,702 -Proceeds from disposal of premises, equipment andintangible assets 2 580
Net cash from/(used in) investing activities 957,330 (801,081)
The notes set out on pages 6 to 57 form an integral part of these fi nancial statements.
ANNUAL REPORT 2011

90 ANNUAL REPORT 2011
Bank of MongoliaStatement of Cash Flows
In millions of Mongolian Tugriks Note 2011 2010 (restated)
Cash fl ows from fi nancing activitiesIncrease of cash in circulation 193,659 147,860Net cash from fi nancing activities 193,659 147,860
Effect of exchange rate changes on cash and cash equivalents 128,828 (76,934)
Net increase in cash and cash equivalents 363,241 10,803Cash and cash equivalents at the beginning of the year 6 420,833 410,030
Cash and cash equivalents at the end of the year 6 784,074 420,833

91ANNUAL REPORT 2011
Bank of MongoliaNotes to the Financial Statements – 31
December 2011
1. Introduction
The Bank of Mongolia (the "BOM" or the “Bank”) is the central bank of Mongolia and operates in accordance with the Constitution of Mongolia, the Law on Central Bank (Bank of Mongolia), and other laws of Mongolia. The Bank was established under a resolution by the Government of Mongolia dated 2 June 1924.
All operations of the BOM are conducted in Mongolia. The BOM system includes 17 regional offi ces throughout Mongolia and its representative offi ce in London, England.
In accordance with the legislation, the primary function of the BOM is ensuring the stability of the national currency of Mongolia and to promote balanced and sustained development of the national economy, through maintaining stability of fi nance markets and banking system.
The BOM does not aim to earn profi ts. The fi nancial results of the BOM's activities, as well as the structure of its assets, liabilities and equity are defi ned by the functions of the BOM as a special central government authority.
In accordance with the Law on Central Bank (Bank of Mongolia), the main functions of the BOM are as follows:
• issue of national currency of Mongolia and organisation of its circulation;• formulation and implementation of monetary policy by regulating money supply in the economy;• acting as depository of the Government of Mongolia (the “Government” or the “State”);• exercising banking regulation and supervision;• organization of interbank payments and settlements;• holding and management of the State’s reserves of foreign currency;• acting as a lender of the last resort for banks and organising a system of refi nancing;• representing Mongolia in other central banks, international banks and other credit institutions where co-
operation is maintained between the central banks;• exercising other functions in fi nancial and credit areas within the competence defi ned by the Law.
According to the Law, the BOM provides loans to banks to support their liquidity, buys and sells securities in the secondary market, buys and sells foreign currency valuables, precious metals, sells commemorative coins made of precious and non-precious metals in the domestic and foreign markets, performs operations of servicing of the Government debt in respect of placement of Government securities, their redemption and interest payments, maintains accounts of the Government and other government institutions, including accounts of the Ministry of Finance (fi scal agent of the Government of Mongolia), accounts of international organisations and conducts other operations necessary for the performance of its functions.
The charter capital of the BOM is fully owned by the Government of Mongolia.
In accordance with the Law, the main task of the BOM Council (Board) is to develop principles of monetary policy and exercise control over implementation of the monetary policy. In addition, the BOM Council approves annually the BOM budget of income and expenditure for the next year, approves annual fi nancial statements of the BOM, report on fulfi lment of the BOM budget of income and expenditure and distribution of profi t for the reporting year, as well as performs other functions according to its authority defi ned by the Mongolian legislation.
Registered address and place of business. The Bank’s registered address is: Baga Toiruu 9, Ulaanbaatar 46, Mongolia.
Presentation currency. These fi nancial statements are presented in Mongolian Tugriks (“MNT”), rounded to millions.
92 ANNUAL REPORT 2011
Bank of MongoliaNotes to the Financial Statements
31 December 2011
2. Summary of Signifi cant Accounting Policies
Basis of preparation. These fi nancial statements have been prepared in accordance with International Financial Reporting Standards (“IFRS”) under the historical cost convention, as modifi ed by the initial recognition of fi nancial instruments based on fair value, and by the revaluation of premises and available-for-sale fi nancial assets, and fi nancial instruments categorised as at fair value through profi t or loss. The principal accounting policies applied in the preparation of these fi nancial statements are set out below. These policies have been consistently applied to all the periods presented, unless otherwise stated (refer to Note 4).Financial instruments - key measurement terms. Depending on their classifi cation fi nancial instruments are carried at fair value, cost, or amortised cost as described below.Fair value is the amount for which an asset could be exchanged, or a liability settled, between knowledgeable, willing parties in an arm’s length transaction. Fair value is the current bid price for fi nancial assets and current asking price for fi nancial liabilities which are quoted in an active market. For assets and liabilities with offsetting market risks, the Bank may use mid-market prices as a basis for establishing fair values for the offsetting risk positions and apply the bid or asking price to the net open position as appropriate. A fi nancial instrument is regarded as quoted in an active market if quoted prices are readily and regularly available from an exchange or other institution and those prices represent actual and regularly occurring market transactions on an arm’s length basis. Valuation techniques such as discounted cash fl ows models or models based on recent arm’s length transactions or consideration of fi nancial data of the investees are used to fair value certain fi nancial instruments for which external market pricing information is not available. Valuation techniques may require assumptions not supported by observable market data. Disclosures are made in these fi nancial statements if changing any such assumptions to a reasonably possible alternative would result in signifi cantly different profi t, income, total assets or total liabilities.Cost is the amount of cash or cash equivalents paid or the fair value of the other consideration given to acquire an asset at the time of its acquisition and includes transaction costs. Measurement at cost is only applicable to investments in equity instruments that do not have a quoted market price and whose fair value cannot be reliably measured, refer to Note 8. Transaction costs are incremental costs that are directly attributable to the acquisition, issue or disposal of a fi nancial instrument. An incremental cost is one that would not have been incurred if the transaction had not taken place. Transaction costs include fees and commissions paid to agents (including employees acting as selling agents), advisors, brokers and dealers, levies by regulatory agencies and securities exchanges, and transfer taxes and duties. Transaction costs do not include debt premiums or discounts, fi nancing costs or internal administrative or holding costs. Amortised cost is the amount at which the fi nancial instrument was recognised at initial recognition less any principal repayments, plus accrued interest, and for fi nancial assets less any write-down for incurred impairment losses. Accrued interest includes amortisation of transaction costs deferred at initial recognition and of any premium or discount to maturity amount using the effective interest method. Accrued interest income and accrued interest expense, including both accrued coupon and amortised discount or premium (including fees deferred at origination, if any), are not presented separately and are included in the carrying values of related items in the statement of fi nancial position.The effective interest method is a method of allocating interest income or interest expense over the relevant period so as to achieve a constant periodic rate of interest (effective interest rate) on the carrying amount. The effective interest rate is the rate that exactly discounts estimated future cash payments or receipts (excluding future credit losses) through the expected life of the fi nancial instrument or a shorter period, if appropriate, to the net carrying amount of the fi nancial instrument. The effective interest rate discounts cash fl ows of variable interest instruments to the next interest re-pricing date except for the premium or discount which refl ects the credit spread over the fl oating rate specifi ed in the instrument, or other variables that are not reset to market rates. Such premiums or discounts are amortised over the whole expected life of the instrument. The present value calculation includes all fees paid or received between parties to the contract that are an integral part of the effective interest rate.

93ANNUAL REPORT 2011
Bank of MongoliaNotes to the Financial Statements
31 December 2011
2. Summary of Signifi cant Accounting Policies (Continued)
Initial recognition of fi nancial instruments. Derivatives are initially recorded at fair value. All other fi nancial instruments are initially recorded at fair value plus transaction costs. Fair value at initial recognition is best evidenced by the transaction price. A gain or loss on initial recognition is only recorded if there is a difference between fair value and transaction price which can be evidenced by other observable current market transactions in the same instrument or by a valuation technique for which inputs include only data from observable markets.All purchases and sales of fi nancial assets that require delivery within the time frame established by regulation or market convention (“regular way” purchases and sales) are recorded at trade date, which is the date that the Bank commits to deliver a fi nancial asset. All other purchases are recognised when the entity becomes a party to the contractual provisions of the instrument.Derecognition of fi nancial assets. The Bank derecognises fi nancial assets when (a) the assets are redeemed or the rights to cash fl ows from the assets otherwise expired or (b) the Bank has transferred the rights to the cash fl ows from the fi nancial assets or entered into a qualifying pass-through arrangement while (i) also transferring substantially all the risks and rewards of ownership of the assets or (ii) neither transferring nor retaining substantially all risks and rewards of ownership but not retaining control. Control is retained if the counterparty does not have the practical ability to sell the asset in its entirety to an unrelated third party without needing to impose restrictions on the sale.Cash and cash equivalents. For the purposes of reporting cash fl ows refl ecting changes in both foreign and domestic liquidity, cash and cash equivalents include items which are readily convertible to known amounts of cash and which are subject to an insignifi cant risk of changes in value. Cash and cash equivalents include fi nancial assets, which are on demand or maturing within three months and which are available for use at short notice, as well as demand deposits of government organisations and local banks, denominated in local currency. Refer to Note 6. Financial assets that cannot be freely converted into cash due to insuffi cient liquidity or due to restrictions on their use are excluded from cash and cash equivalents. Cash and cash equivalents are carried at amortised cost using the effective interest method.Gold bullion and precious metals. Gold bullion consists of the stocks of gold bars and silver of international standard held in foreign banks. Gold bullion represents a part of international reserves. Gold bullion is recorded in physical weight in troy ounces and is valued in Tugrik at the offi cial exchange rate of the BOM. The offi cial exchange rate is calculated based on information on gold prices determined (fi xed) by participants of the London Bullion Market Association in US dollars translated into MNT at the BOM offi cial MNT/US dollar exchange rate. Apart from holding gold as gold bullion, the Bank purchases unrefi ned gold from producers and companies in Mongolia and trades in gold (refer to Note 11).Gold billion is measured in the statement of fi nancial position at its fair value and revaluation is performed daily. The fair value is determined by taking into consideration the market value of gold. Revaluation gain or loss is recognised in the profi t or loss. Annually, unrealised gain or loss on fair value changes is transferred from the retained earnings to “Precious Metal Valuation Reserve” within other reserves in equity. Other precious metals (gold, other scrap metal and bars, silver ore), coins and cultural valuables are held in the Bank’s Central Vault. Other precious metals are recognised as inventory and are carried at lower of cost and net realisable value. Transactions in foreign currency. The functional currency of the Bank is the national currency of Mongolia, Mongolian Tugriks (MNT). Monetary assets and liabilities denominated in foreign currency are initially recorded at the offi cial exchange rates of Tugrik to foreign currencies at the date of settlement – the date of initial recognition of assets and liabilities. Subsequently they are re-valued after each change in the offi cial exchange rate. Monetary assets and liabilities in foreign currency are recorded at the offi cial exchange rates of Tugrik to foreign currencies at the reporting date.Non-monetary assets denominated in foreign currency are recorded at historical cost (at the offi cial exchange rate of Tugrik to foreign currencies at the date when the asset was acquired) or last revalued to fair value.
94 ANNUAL REPORT 2011
Bank of MongoliaNotes to the Financial Statements
31 December 2011
2. Summary of Signifi cant Accounting Policies (Continued)
The principal offi cial exchange rates of Tugrik to foreign currencies used for translating monetary balance sheet items were:
31 December 2011 (MNT)
31 December 2010 (MNT)
USD 1 1,396.37 1,257.18SDR 1 2,137.00 1,936.10EUR 1 1,806.76 1,679.97
Due from foreign fi nancial institutions. These balances are recorded when the BOM advances foreign currency funds to counterparty banks with no intention of trading the resulting unquoted non-derivative receivable due on fi xed or determinable dates. These items are classifi ed as loans and receivables for IFRS measurement purposes. They are initially recorded at fair value plus transaction costs and are subsequently recorded at amortised cost using effective interest method.
Loans to banks and government securities. Loans to banks and other borrowers (such as Ministry of Finance) are recorded when the BOM advances money to originate an unquoted non-derivative receivable from a counterparty bank or other borrower due on fi xed or determinable dates and has no intention of trading the receivable. These items (including government securities issued by the Ministry of Finance) are classifi ed as loans and receivables for IFRS measurement purposes. They are initially recorded at fair value plus transaction costs and are subsequently recorded at amortised cost using effective interest method.
Sale and repurchase agreements and lending of securities. Sale and repurchase agreements (“repo agreements”) which effectively provide a lender’s return to the counterparty are treated as secured fi nancing transactions. Securities sold under such sale and repurchase agreements are not derecognised. The securities are not reclassifi ed in the statement of fi nancial position unless the transferee has the right by contract or custom to sell or repledge the securities, in which case they are reclassifi ed as repurchase receivables.
Securities purchased under agreements to resell (“reverse repo agreements”) which effectively provide a lender’s return to the Bank are recorded as due from foreign fi nancial institutions or loans to local banks, as appropriate. The difference between the sale and repurchase price is treated as interest income and accrued over the life of repo agreements using the effective interest method.
Financial investments held to maturity. Financial investments held to maturity are debt securities traded in an active market with fi xed or determinable payments and fi xed maturity which the BOM has both the intent and ability to hold to maturity. Management determines the classifi cation of investment securities held to maturity at their initial recognition and reassesses the appropriateness of that classifi cation at the end of each reporting period. Investment securities held to maturity are carried at amortised cost.
Impairment of fi nancial assets carried at amortised cost. Impairment losses are recognised in profi t or loss when incurred as a result of one or more events ("loss events") that occurred after the initial recognition of the fi nancial asset and which have an impact on the estimated future cash fl ows of the fi nancial asset or group of fi nancial assets that can be reliably estimated.
The objective evidence of impairment of fi nancial assets is information on the following loss events:
• the borrower experiences signifi cant fi nancial diffi culties;• breach of contract by the borrower;• possibility of bankruptcy or other fi nancial reorganisation of the borrower;• the lender, for economic or legal reasons relating to the borrower's fi nancial diffi culty, granting to the borrower
a concession that the lender would not otherwise consider (such as a change in interest rate or extension of payment terms);
• observable data indicating that there is a measurable decrease in the estimated future

95ANNUAL REPORT 2011
Bank of MongoliaNotes to the Financial Statements
31 December 2011
2. Summary of Signifi cant Accounting Policies (Continued)
Due to relatively small number of debtors (customers and other debtors) the Bank performs individual assessment on all fi nancial assets i.e. the BOM assesses whether objective evidence of impairment exists individually for all receivables and other fi nancial assets.
Impairment losses are recognized through an allowance account to write down the asset’s carrying amount to the present value of expected cash fl ows (which exclude future credit losses that have not been incurred) discounted at the original effective interest rate of the asset. If, in a subsequent period, the amount of the impairment loss decreases and the decrease can be related objectively to an event occurring after the impairment has been recognised, the previously recognised impairment loss is reversed by adjusting the allowance account through profi t or loss.
When impaired fi nancial assets are renegotiated or their terms otherwise modifi ed because of fi nancial diffi culties of the borrower, impairment is measured using the original effective interest rate before the modifi cation of terms. Where loans are issued at fl oating rates of interest, impairment is measured using the current effective interest rate.
Uncollectible assets are written off against the related impairment loss provision after all the necessary procedures to recover the asset have been completed.
Financial investments available for sale. Financial investments available for sale include debt securities and equity investments (investments into share capital of companies which are not associates or subsidiaries), which the BOM intends to hold for an indefi nite period of time. Debt securities are initially recorded at fair value plus transaction costs and are subsequently measured at fair value. Interest income on available-for-sale debt securities is calculated using the effective interest method and recognised in profi t or loss for the year. All other elements of changes in the fair value are recognised in other comprehensive income until the investment is derecognised or impaired, at which time the cumulative gain or loss is reclassifi ed from other comprehensive income to profi t or loss for the year.
Equity investments are initially recorded at cost and are subsequently measured at cost less provision for impairment, as their fair value cannot be reliably determined, refer to Note 8.
Impairment losses are recognised in profi t or loss for the year when incurred as a result of one or more events (“loss events”) that occurred after the initial recognition of investment securities available for sale. A signifi cant or prolonged decline in the fair value of an equity security below its cost is an indicator that it is impaired. The cumulative impairment loss – measured as the difference between the acquisition cost and the current fair value, less any impairment loss on that asset previously recognised in profi t or loss – is reclassifi ed from other comprehensive income to profi t or loss for the year.
Derivative fi nancial instruments. Derivative fi nancial instruments, primarily include foreign exchange contracts such as forward rate agreements, made with local commercial banks. Derivative fi nancial instruments represent fi nancial instruments at fair value through profi t or loss and are carried at their fair value. All derivative instruments are carried as assets when fair value is positive and as liabilities when fair value is negative. Changes in the fair value of derivative instruments are included in profi t or loss for the year. The Bank does not apply hedge accounting.
Other assets. Other assets mainly consist of receivables and prepayments. Receivables are accounted for on an accruals basis and are carried at amortised cost. Receivables are recorded when due under the agreement. Prepayments are recorded on the payment date and are charged to the statement of comprehensive income when the services are provided. If the Bank has objective evidence that the receivable will not be collected the Bank recognises impairment by setting up an allowance account decreasing the net carrying value of the receivable and prepayments to its recoverable amount. The impairment is recorded in profi t or loss. The Bank collects evidence of impairment of receivables using the same methods and estimations as those applied to impairment of fi nancial assets carried at amortized cost.

96 ANNUAL REPORT 2011
Bank of MongoliaNotes to the Financial Statements
31 December 2011
2 .Summary of Signifi cant Accounting Policies (Continued)
Premises and equipment. Premises are stated at re-valued amounts, as described below, less accumulated depreciation and provision for impairment, where required.
Premises owned by the Bank are initially measured at cost. Premises are subject to regular revaluations, with suffi cient regularity to ensure that the carrying amount does not differ materially from that which would be determined using fair value at the end of the reporting period. Increases in the carrying amount arising on revaluation are credited to other comprehensive income and increase the revaluation surplus in equity. Decreases that offset previous increases of the same asset are recognised in other comprehensive income and decrease the previously recognised revaluation surplus in equity; all other decreases are charged to profi t or loss for the year. The revaluation reserve for premises and equipment included in equity is transferred directly to accumulated defi cit or retained earnings when the surplus is realised. Management believes that carrying amounts of premises as of 31 December 2011 and 31 December 2010 are not materially different from their fair values.
Equipment owned by the Bank is stated at cost less depreciation and provision for impairment, where required. Costs of minor repairs and maintenance are expensed when incurred. Costs of replacing major parts or components of premises and equipment items are capitalised and the replaced part is retired.
At the end of each reporting period management assesses whether there is any indication of impairment of premises and equipment. If any such indication exists, management estimates the recoverable amount, which is determined as the higher of an asset’s fair value less costs to sell and its value in use. The carrying amount is reduced to the recoverable amount and the impairment loss is recognised in profi t or loss for the year (to the extent it exceeds the previous revaluation surplus in equity, in case of premises). An impairment loss recognised for an asset in prior years is reversed if there has been a change in the estimates used to determine the asset’s value in use or fair value less costs to sell.
Gains and losses on disposals determined by comparing proceeds with carrying amount are recognised in profi t or loss for the year (within other operating income or expenses).
Depreciation. Construction in progress is not depreciated. Depreciation on other items of premises and equipment is calculated using the straight-line method to allocate their cost to their residual values over their estimated useful lives:
Useful lives in yearsPremises 25 – 60 years Furniture and offi ce equipment 8 – 10 yearsComputers and technical equipment 5 – 10 years Motor vehicles 6 – 8 years
The residual value of an asset is the estimated amount that the Bank would currently obtain from disposal of the asset less the estimated costs of disposal, if the asset were already of the age and in the condition expected at the end of its useful life. The assets’ residual values and useful lives are reviewed, and adjusted if appropriate, at the end of each reporting period.
Intangible assets. The Bank’s intangible assets have defi nite useful lives and primarily include capitalised computer software licenses.
Computer software licenses acquired are capitalised on the basis of the costs incurred to acquire and bring them to use.
Intangible assets are amortised using the straight-line method over their useful lives:
Useful lives in yearsComputer software (core banking software) 3 years

97ANNUAL REPORT 2011
Bank of MongoliaNotes to the Financial Statements
31 December 2011
2. Summary of Signifi cant Accounting Policies (Continued)
Cash in circulation. The amount of banknotes and coins in circulation represents the nominal value of banknotes and coins that can be used as payment instruments and were issued into circulation by the BOM after the introduction of Tugrik into circulation in September 1993. The banknotes and coins in circulation are recorded as a liability at their nominal value when cash is issued by the BOM to banks and clients of the BOM. Cash in national currency held in the BOM's vaults and cash offi ces is not included in banknotes and coins in circulation.
Central bank bills. Central bank bills issued by the BOM are initially recorded at fair value and subsequently are measured at amortised cost using the effective interest method. Amortised cost is calculated by taking into account any discount or premium on the issue and costs that are an integral part of the effective interest rate.
Loans received. Loans received by the BOM are carried at amortised cost using effective interest method. Loans received mostly relate to long-term loans obtained from the Ministry of Finance, which relate to programmes fi nanced by the Government of Germany (KfW) and Asian Development Bank (ADB) and are included in Liabilities due to government organizations (Note 17). Loans received also include loan due to HSBC (Note 19), which is included in ‘Liabilities due to foreign parties’.
Liabilities due to foreign parties. Liabilities due to foreign parties are initially recorded at fair value and subsequently are measured at amortised cost using effective interest method. Refer to Note 19.
Liabilities due to government organizations. Accounts of the Government and other government institutions are non-derivative liabilities to the Government or other customers and are carried at amortised cost.
Deposits from local banks. Accounts of banks are recorded when money is advanced to the BOM by counterparty banks. The non-derivative liability is carried at amortised cost.
Provisions for liabilities and charges. Provisions for liabilities and charges are non-fi nancial liabilities of uncertain timing or amount. They are accrued when the Bank has a present legal or constructive obligation as a result of past events, it is probable that an outfl ow of resources embodying economic benefi ts will be required to settle the obligation, and a reliable estimate of the amount of the obligation can be made.
Trade and other payables. Trade payables are accrued when the counterparty has performed its obligations under the contract and are carried at amortised cost.
Operations with International Monetary Fund. The BOM acts as a depository of the Government of Mongolia in the relationship of Mongolia with the International Monetary Fund (IMF). The Ministry of Finance acts as the fi scal agent of Mongolia. Thus, claims of Mongolia on and liabilities to the IMF in respect of funds received from IMF are not recognised in the fi nancial statements of the BOM, as they represent assets and liabilities of the Ministry of Finance. These items are recorded as off-balance sheet items. Such items include IMF quota contributions, Stand-by Arrangement loan and Poverty Reduction Growth Facility (PRGF), refer to Note 27.
The IMF asset balances recognised in these fi nancial statements include holdings of Special Drawing Rights (SDR), refer to Note 7. Liabilities to the IMF include liabilities for allocation of SDRs, as well as balances on IMF accounts No. 1 and No. 2. IMF account No. 1 is used for IMF transactions including quota subscription payments, purchase and repurchase of funds. Account No. 2 is used for settlements with the IMF in Mongolian currency. Refer to Note 19.
Assets and liabilities denominated in SDRs are translated into Tugrik at the BOM offi cial exchange rate of Tugrik to SDR at the balance sheet date. The offi cial exchange rate of Tugrik to SDR is calculated based on information on the exchange rate of SDR to USD set by the IMF and the BOM offi cial MNT/USD exchange rate.

98 ANNUAL REPORT 2011
Bank of MongoliaNotes to the Financial Statements
31 December 2011
2. Summary of Signifi cant Accounting Policies (Continued)
Interest received in respect of SDR holdings is disclosed as interest income and charges paid in respect of use of SDR allocations are disclosed as interest and fee expense, as appropriate, in the statement of comprehensive income.
Charter capital. Charter capital (fund) is classifi ed as equity. Refer to Note 21.
General reserve. General reserve includes only such portions of net income accumulated over years over which the Bank has full rights to utilize them. This reserve fund does not include amounts that were distributed to the State budget in the past or which can be distributed in the future, as these portions have been already transferred to the Government in respective years. Refer to Note 21.
Other reserves. Other reserves consist of unrealized foreign exchange translation gains and losses, unrealized revaluation gains and losses on gold bullion and precious metals (silver), revaluation reserve (related to buildings), and reserve for available for sale fi nancial investments. Refer to Note 21. In accordance with its policies, the Bank transfers unrealized foreign exchange translation gains and losses and unrealized revaluation gains and losses on gold bullion and precious metals, previously recognised through profi t or loss, to other reserves as of each year end.
Offsetting. Financial assets and liabilities are offset and the net amount is reported in the balance sheet only when there is a legally enforceable right to offset the recognised amounts, and there is an intention to either settle on a net basis, or to realise the asset and settle the liability simultaneously.
Credit related commitments. The Bank enters into credit related commitments, which include letters of credit and the arrangement with the People’s Bank of China (central bank of China, “PBC”), which in substance represents a credit facility (line) provided by PBC in Yuan to the BOM and credit facility in MNT by BOM to PBC (refer to Note 27).
At the end of each reporting period, the commitments are measured at the higher of (i) the remaining unamortised balance of the amount at initial recognition and (ii) the best estimate of expenditure required to settle the commitment at the end of each reporting period. In cases where the fees are charged periodically in respect of an outstanding undrawn commitment, they are recognised as revenue on a time proportion basis over the respective commitment period.
Income and expense recognition. Interest income and expense are recorded in profi t or loss of income on an accrual basis using the effective interest method for all debt instruments, except for debt securities at fair value through profi t or loss. This method defers, as part of interest income or expense, all fees paid or received between the parties to the contract that are an integral part of the effective interest rate, transaction costs and all other premiums or discounts.
All other fees, commissions and other income and expense items are generally recorded on an accrual basis by reference to completion of the specifi c transaction assessed on the basis of the actual service provided (received) as a proportion of the total services to be provided.
Expenses for money issuance. The BOM purchases Mongolian national currency banknotes and coins. Prepayments associated with the banknotes and coins purchases are within “Other assets” and charged to the BOM's expenses when produced banknotes and coins are transferred by printing companies to the Central Vault of the BOM.
Staff costs and related contributions. Wages, salaries and other salary related expenses (including paid annual leave and sick leave, bonuses, and non-monetary benefi ts) are recognized as an expense in the year in which the associated services are rendered by the Bank’s employees. Short term accumulating compensated absences such as paid annual leave are recognized when services are rendered by employees that increase their entitlement to future compensated absences. Short term non-accumulating compensated absences such as sick leave are recognized when absences occur.

99ANNUAL REPORT 2011
Bank of MongoliaNotes to the Financial Statements
31 December 2011
2. Summary of Signifi cant Accounting Policies (Continued)
Long-term employee benefi ts. Based on its internal regulations, the Bank is obliged to pay defi ned number of salaries (depending on the number of years of work in BOM prior to the retirement) to its employees when they retire. Related liability is included in Social Development Fund (Note 20). Management believes that Social Development Fund as of 31 December 2011 and 31 December 2010 is suffi cient to cover these liabilities and short-term liabilities for which this fund is created and that amount of recognised liability for retirement benefi ts is not materially different from the amount of present value of the defi ned benefi t obligation at the balance sheet date less adjustments for unrecognised actuarial gains or losses and past service costs.
Income taxes. In accordance with Economic Entity and Organization Income Tax Law of Mongolia, the BOM is exempted from income tax.
Restatements. In 2011, the management performed a detailed analysis of the Bank's role in relationship between Mongolia and International Monetary Fund (IMF). As a result of this analysis, management considered necessary to change its accounting policy for operations with the IMF. Further, management has reconsidered the contractual relationship with ADB and KfW with regard to loan agreements signed by ADB and KfW (as lenders) and the Government of Mongolia (as borrower). Also, defi nition of cash and cash equivalents has been reconsidered to take into account the Bank’s role as issuer of national currency. As a result, the following adjustments, including reclassifi cations, were made in these fi nancial statements in accordance with IAS 8 "Accounting policies, changes in accounting estimates and errors”.
• IMF related balances. Certain IMF related balances recognized in the accounts of the Bank and IFRS fi nancial statements for year ended 31 December 2010 and previous years (IMF quota contribution, stand-by arrangement loan from IMF, and loans received under PRGF) do not meet defi nition of assets and liabilities per IFRS Framework, given that the Bank has no contractual rights and obligations with regard to acquisitions of IMF funds. The Ministry of Finance acts as a fi scal agent of the Government of Mongolia, it has signed promissory notes issued to IMF in respect of settlement of quota and acquisitions of IMF funds under PRGF and Stand-by arrangements, and thus it has the obligation toward IMF with regard to acquisitions of IMF funds. Thus, these amounts are recorded as off-balance sheet items in these fi nancial statements (Note 27).
• Amounts due to the Ministry of Finance with regard to loans from Asian Development Bank (ADB) and Government of Germany (KfW). Management concluded that BOM does not have any obligations to ADB and KfW, with regard to loan agreements signed by ADB and KfW (as lenders) and the Government of Mongolia (as borrower), but has an obligation to the Ministry of Finance with regard to these loans. Thus, related balances, which were presented as ‘Liabilities due to foreign parties’ in the fi nancial statements for the year ended 31 December 2010 and previous years, are presented as ‘Liabilities due to government organizations’ in these fi nancial statements. Refer to Note 17.
• Defi nition of cash and cash equivalents. Management has reconsidered defi nition of cash and cash equivalents for the purposes of the Statement of Cash Flows and decided to change its accounting policy on cash and cash equivalents to take into account the Bank’s role as issuer of national currency. Thus, the following additional items are included within cash and cash equivalents in these fi nancial statements, apart from items included in the fi nancial statements for year ended 31 December 2010: special drawing rights holdings and demand deposits of government organisations and local banks, denominated in local currency (Note 6).
Reclassifi cations. Where necessary corresponding fi gures have been adjusted to conform to the presentation of the current year amounts. The following reclassifi cation has been made in these fi nancial statements:
• Administrative and other operating expenses. Management has reconsidered the presentation of ‘Other operating expenses’. ‘Other operating expenses’ was presented as a separate line item in Statement of Comprehensive Income for the year 2010 and previous years and was presented within ‘Administrative and other operating expenses’ in these fi nancial statements.

100 ANNUAL REPORT 2011
Bank of MongoliaNotes to the Financial Statements
31 December 2011
2. Summary of Signifi cant Accounting Policies (Continued)
The impact of the above restatements on the Statement of Financial Position as of 31 December 2010 is presented below:
I n millions of M ongolian Tugriks31 December 2010
(as previously reported)
Restatements 31 December 2010 (restated)
AssetsDue from foreign fi nancial institutions 1,457,584 (360,328) 1,097,256Loans to Ministry of Finance 247,230 (247,230) -
LiabilitiesLiabilities due to government organizations 802,966 19,415 822,381Liabilities due to foreign parties 722,207 (626,972) 95,235
The above restatements and reclassifi cations had no material impact on the Statement of Comprehensive Income for the year ended 31 December 2010.
The impact of the above restatements and reclassifi cations on the Statement of Financial Position as of 1 January 2010 is presented below:
In millions of Mongolian Tugriks
1 January 2010 (as previously
reported)
Restatements 1 January 2010 (restated)
AssetsDue from foreign fi nancial institutions 1,271,630 (337,841) 933,789Loans to Ministry of Finance 262,755 (262,755) -
LiabilitiesLiabilities due to government organizations 698,227 24,265 722,492Liabilities due to foreign parties 737,056 (624,861) 112,195
The restatements and reclassifi cations in the statement of fi nancial position had an impact on information in notes 7, 17 and 19 and had no impact on any other captions in the statement of fi nancial position and related note disclosures.
The third statement of fi nancial position as of 1 January 2010 is presented in these fi nancial statements as a result of the restatements and changes in presentation. This requirement to present the additional opening statement of fi nancial position, when the entity has made a restatement or reclassifi cation, extends to the information in the related notes. Management considered materiality from the perspective of the users of fi nancial statements, as well as absence of detailed information, and concluded that it is suffi cient for the Bank to present such information on the face of the Statement of Financial Position and in extended disclosures within this note. The omission of third balances in those notes that have not been impacted by a restatement or a reclassifi cation is, therefore, in management’s view, not material.

101ANNUAL REPORT 2011
Bank of MongoliaNotes to the Financial Statements
31 December 2011
2. Summary of Signifi cant Accounting Policies (Continued)
Apart from the change of accounting policy on cash and cash equivalents, management decided to make certain other improvements in the Statement of Cash Flows in these fi nancial statements. The impact of the change in accounting policy for cash and cash equivalents and changes in presentation on the Statement of Cash Flows for year ended 31 December 2010 is presented below:
In millions of Mongolian TugriksYear ended 31
December 2010 (as previously reported)
Restatements/presentation
improvements
Year ended 31 December 2010
(restated)Cash fl ows from operating activities 27,430 713,528 740,958Cash fl ows from investing activities (4,234) (796,847) (801,081)Cash fl ows from fi nancing activities 126,732 21,128 147,860Effect of exchange rate changes on cash and cash equivalents - (76,934) (76,934)
Cash and cash equivalents at the beginning of the year 870,174 (460,144) 410,030
Cash and cash equivalents at the end of the year 1,020,102 (599,269) 420,833
Amendments of the fi nancial statements after issue. The Bank’s management has the power to amend the fi nancial statements after issue.
3. Critical Accounting Estimates, and Judgements in Applying Accounting Policies
The Bank makes estimates and assumptions that affect the amounts recognised in the fi nancial statements and the carrying amounts of assets and liabilities within the next fi nancial year. Estimates and judgements are continually evaluated and are based on management’s experience and other factors, including expectations of future events that are believed to be reasonable under the circumstances. Management also makes certain judgements, apart from those involving estimations, in the process of applying the accounting policies. Judgements that have the most signifi cant effect on the amounts recognised in the fi nancial statements and estimates that can cause a signifi cant adjustment to the carrying amount of assets and liabilities within the next fi nancial year include:
Initial recognition of borrowings from the Ministry of Finance and loans to local banks. The Bank has borrowings due to the Ministry of Finance in the amount of MNT 20,793 million (2010: MNT 19,425 million), which relate to the borrowings received by the Ministry of Finance on behalf of the Government of Mongolia, under inter-state project fi nancing from the Government of Germany (KfW) and Asian Development Bank. These resources are subject to a very low interest ranging from 0.75% to 1% p.a. and were conditional on lending to selected sectors of economy or for other specifi ed purposes at low rates. Management have considered whether gains should arise on initial recognition of such instruments. In making this judgement management made a conclusion that these borrowings should be considered as instruments of a special purpose market represented by inter-state project fi nancing aimed to serve the public interest that is often provided at just a token or even free of charge. Further, the funding from these institutions was also available at low interest rates to certain Mongolian banks commercial banks for selected sectors or specifi c purposes. As a result, no initial recognition gains should be recognized.
As a result of such fi nancing, the Bank is able to advance funds to eligible banks at advantageous rates. Management have considered whether losses should arise on initial recognition of such instruments. As the transactions are with unrelated parties, management’s judgement is that this lending is at the market rates and no initial recognition losses should arise. In making this judgement management also considered that these instruments are a separate market segment.

102 ANNUAL REPORT 2011
Bank of MongoliaNotes to the Financial Statements
31 December 2011
3. Critical Accounting Estimates, and Judgements in Applying Accounting Policies (Continued)
Impairment of loans to local banks. The Bank regularly reviews its loan portfolio to assess impairment. In determining whether an impairment loss should be recorded, the Bank makes judgements as to whether there is any observable data indicating that there is a measurable decrease in the estimated future cash fl ows. As disclosed in Note 13, due to signifi cant uncertainty the Bank is not able to estimate with suffi cient reliability future expected cash fl ows for the purposes of calculating provision for impairment and fair value disclosure of loans related to Anod Bank totalling MNT 102,000 million as of 31 December 2011 (2010: MNT 120,000 million). The Bank's management is of the opinion that these loans are recoverable from the Government of Mongolia. The Bank is currently awaiting the issuance of a government bond by the Ministry of Finance, which will be used for repayment of receivables due from Anod Bank. The issuance of this government bond is expected to be approved by the Parliament of Mongolia during 2012. However, given that the terms of the bond would be determined only after its issue is approved by the Parliament and that no information is currently available about preliminary arrangements, there is high uncertainty about amounts and timing of future cash fl ows related to these receivables.
Control over banks under receivership. Management applies judgement to determine whether the substance of the relationship between Bank of Mongolia and banks under receivership indicates that these banks are controlled by Bank of Mongolia and, hence, should be consolidated by Bank of Mongolia. In making this judgement Management takes into account the following:
the receiver is appointed by Bank of Mongolia following the requirements of the Law; the receiver effectively acts in a fi duciary capacity and has narrow objective to wind up the bank and there are
no any strategic decisions to be made; the receiver acts within the prescribed legal framework and the order of priority of liabilities is also set by the
legislation, therefore the receiver cannot use its power specifi cally with the aim to infl uence benefi ts attributable to Bank of Mongolia;
although Bank of Mongolia may issue loans to banks under receivership, these loans are provided effectively on behalf of the Government as it is the Government's responsibility under the Law to guarantee repayment of customer deposits; therefore Management believes that the benefi ts receivable by Bank of Mongolia from such loans will be ultimately in the form of Government bonds.
Based on above, although Bank of Mongolia has power to govern activities of banks under receivership, it can not use that power to infl uence its own benefi ts as those benefi ts are independent from performance of banks under receivership. Therefore management believes that these banks should not be consolidated into these fi nancial statements.
4. Adoption of New or Revised Standards and Interpretations
Certain new standards and interpretations became effective for the Bank from 1 January 2011:
Classifi cation of Rights Issues - Amendment to IAS 32 (issued on 8 October 2009; effective for annual periods beginning on or after 1 February 2010). The amendment exempts certain rights issues of shares with proceeds denominated in foreign currencies from classifi cation as fi nancial derivatives. The amendment did not have impact on these fi nancial statements.
Amendment to IAS 24, Related Party Disclosures (issued in November 2009 and effective for annual periods beginning on or after 1 January 2011). IAS 24 was revised in 2009 by: (a) simplifying the defi nition of a related party, clarifying its intended meaning and eliminating inconsistencies; and by (b) providing a partial exemption from the disclosure requirements for government-related entities. The bank utilised the amendment in IAS 24 on ‘partial exemption from the disclosure requirement for government-related entities’ and individually immaterial transactions with government-related entities were not disclosed in these fi nancial statements.
IFRIC 19, Extinguishing Financial Liabilities with Equity Instruments (effective for annual periods beginning on or after 1 July 2010). This IFRIC clarifi es the accounting when an entity renegotiates the terms of its debt with the result that the liability is extinguished through the debtor issuing its own equity instruments to the creditor. A gain or loss is recognised in profi t or loss based on the fair value of the equity instruments compared to the carrying amount of the debt. IFRIC 19 did not have impact on these fi nancial statements.

103ANNUAL REPORT 2011
Bank of MongoliaNotes to the Financial Statements
31 December 2011
4. Adoption of New or Revised Standards and Interpretations (Continued)
Prepayments of a Minimum Funding Requirement – Amendment to IFRIC 14 (effective for annual periods beginning on or after 1 January 2011). This amendment will have a limited impact as it applies only to companies that are required to make minimum funding contributions to a defi ned benefi t pension plan. It removes an unintended consequence of IFRIC 14 related to voluntary pension prepayments when there is a minimum funding requirement. IFRIC 14 did not have impact on these fi nancial statements.
Limited exemption from comparative IFRS 7 disclosures for fi rst-time adopters - Amendment to IFRS 1 (effective for annual periods beginning on or after 1 July 2010). Existing IFRS preparers were granted relief from presenting comparative information for the new disclosures required by the March 2009 amendments to IFRS 7, Financial Instruments: Disclosures. This amendment to IFRS 1 provides fi rst-time adopters with the same transition provisions as included in the amendment to IFRS 7. The amendment did not have impact on these fi nancial statements.
Improvements to International Financial Reporting Standards (issued in May 2010 and effective from 1 January 2011). The improvements consist of a mixture of substantive changes and clarifi cations in the following standards and interpretations: IFRS 1 was amended (i) to allow previous GAAP carrying value to be used as deemed cost of an item of property, plant and equipment or an intangible asset if that item was used in operations subject to rate regulation, (ii) to allow an event driven revaluation to be used as deemed cost of property, plant and equipment even if the revaluation occurs during a period covered by the fi rst IFRS fi nancial statements and (iii) to require a fi rst-time adopter to explain changes in accounting policies or in the IFRS 1 exemptions between its fi rst IFRS interim report and its fi rst IFRS fi nancial statements; IFRS 3 was amended (i) to require measurement at fair value (unless another measurement basis is required by other IFRS standards) of non-controlling interest that are not present ownership interest or do not entitle the holder to a proportionate share of net assets in the event of liquidation, (ii) to provide guidance on acquiree’s share-based payment arrangements that were not replaced or were voluntarily replaced as a result of a business combination and (iii) to clarify that the contingent considerations from business combinations that occurred before the effective date of revised IFRS 3 (issued in January 2008) will be accounted for in accordance with the guidance in the previous version of IFRS 3; IFRS 7 was amended to clarify certain disclosure requirements, in particular (i) by adding an explicit emphasis on the interaction between qualitative and quantitative disclosures about the nature and extent of fi nancial risks, (ii) by removing the requirement to disclose the carrying amount of renegotiated fi nancial assets that would otherwise be past due or impaired, (iii) by replacing the requirement to disclose the fair value of collateral by a more general requirement to disclose its fi nancial effect, and (iv) by clarifying that an entity should disclose the amount of foreclosed collateral held at the reporting date and not the amount obtained during the reporting period; IAS 1 was amended to clarify the requirements for the presentation and content of the statement of changes in equity; IAS 27 was amended by clarifying the transition rules for amendments to IAS 21, 28 and 31 made by the revised IAS 27 (as amended in January 2008); IAS 34 was amended to add additional examples of signifi cant events and transactions requiring disclosure in a condensed interim fi nancial report, including transfers between the levels of fair value hierarchy, changes in classifi cation of fi nancial assets or changes in business or economic environment that affect the fair values of the entity’s fi nancial instruments; and IFRIC 13 was amended to clarify measurement of fair value of award credits. These amendments did not have material impact on these fi nancial statements.
The fi nancial effect of collateral is required to be disclosed by the amendments to IFRS 7 by disclosing collateral values separately for (i) those fi nancial assets where collateral and other credit enhancements are equal to, or exceed, carrying value of the asset (“over-collateralized assets”) and (ii) those fi nancial assets where collateral and other credit enhancements are less than the carrying value of the asset (“under-collateralized assets”). This amendment resulted in additional disclosures in these fi nancial statements. Refer to Note 13.
Unless otherwise described above, the new standards and interpretations did not signifi cantly affect the Bank’s fi nancial reporting.

104 ANNUAL REPORT 2011
Bank of MongoliaNotes to the Financial Statements
31 December 2011
5. New Accounting Pronouncements
Certain new standards and interpretations have been published that are mandatory for the Bank’s accounting periods beginning on or after 1 January 2012 or later and which the Bank has not early adopted:
IFRS 9, Financial Instruments: Classifi cation and Measurement. IFRS 9, issued in November 2009, replaces those parts of IAS 39 relating to the classifi cation and measurement of fi nancial assets. IFRS 9 was further amended in October 2010 to address the classifi cation and measurement of fi nancial liabilities and in December 2011 to (i) change its effective date to annual periods beginning on or after 1 January 2015 and (ii) add transition disclosures. Key features of the standard are as follows:
Financial assets are required to be classifi ed into two measurement categories: those to be measured subsequently at fair value, and those to be measured subsequently at amortised cost. The decision is to be made at initial recognition. The classifi cation depends on the entity’s business model for managing its fi nancial instruments and the contractual cash fl ow characteristics of the instrument. An instrument is subsequently measured at amortised cost only if it is a debt instrument and both (i) the objective
of the entity’s business model is to hold the asset to collect the contractual cash fl ows, and (ii) the asset’s contractual cash fl ows represent payments of principal and interest only (that is, it has only “basic loan features”). All other debt instruments are to be measured at fair value through profi t or loss. All equity instruments are to be measured subsequently at fair value. Equity instruments that are held for trading
will be measured at fair value through profi t or loss. For all other equity investments, an irrevocable election can be made at initial recognition, to recognise unrealised and realised fair value gains and losses through other comprehensive income rather than profi t or loss. There is to be no recycling of fair value gains and losses to profi t or loss. This election may be made on an instrument-by-instrument basis. Dividends are to be presented in profi t or loss, as long as they represent a return on investment. Most of the requirements in IAS 39 for classifi cation and measurement of fi nancial liabilities were carried
forward unchanged to IFRS 9. The key change is that an entity will be required to present the effects of changes in own credit risk of fi nancial liabilities designated at fair value through profi t or loss in other comprehensive income.
While adoption of IFRS 9 is mandatory from 1 January 2015, earlier adoption is permitted. The Bank is considering the implications of the standard, the impact on the Bank and the timing of its adoption by the Bank.
Disclosures – Transfers of Financial Assets – Amendments to IFRS 7 (issued in October 2010 and effective for annual periods beginning on or after 1 July 2011). The amendment requires additional disclosures in respect of risk exposures arising from transferred fi nancial assets. The amendment includes a requirement to disclose by class of asset the nature, carrying amount and a description of the risks and rewards of fi nancial assets that have been transferred to another party yet remain on the entity's balance sheet. Disclosures are also required to enable a user to understand the amount of any associated liabilities, and the relationship between the fi nancial assets and associated liabilities. Where fi nancial assets have been derecognised but the entity is still exposed to certain risks and rewards associated with the transferred asset, additional disclosure is required to enable the effects of those risks to be understood. The amendment is not expected to have any impact on the Bank's fi nancial statements.
Severe Hyperinfl ation and Removal of Fixed Dates for First-time Adopters – Amendments to IFRS 1 (issued in December 2010 and effective for annual periods beginning on or after 1 July 2011). The amendment regarding severe hyperinfl ation creates an additional exemption when an entity that has been subject to severe hyperinfl ation resumes presenting or presents for the fi rst time, fi nancial statements in accordance with IFRS. The exemption allows an entity to elect to measure certain assets and liabilities at fair value; and to use that fair value as the deemed cost in the opening IFRS statement of fi nancial position.

105ANNUAL REPORT 2011
Bank of MongoliaNotes to the Financial Statements
31 December 2011
5. New Accounting Pronouncements (Continued)
Recovery of Underlying Assets – Amendments to IAS 12 (issued in December 2010 and effective for annual periods beginning on or after 1 January 2012). The amendment introduced a rebuttable presumption that an investment property carried at fair value is recovered entirely through sale. This presumption is rebutted if the investment property is held within a business model for which the objective is to consume substantially all of the economic benefi ts embodied in the investment property over time, rather than through sale. SIC-21, Income Taxes – Recovery of Revalued Non-Depreciable Assets, which addresses similar issues involving non-depreciable assets measured using the revaluation model in IAS 16, Property, Plant and Equipment, was incorporated into IAS 12 after excluding from its scope investment properties measured at fair value. The Bank does not expect the amendments to have any material effect on its fi nancial statements.
IFRS 13, Fair value measurement (issued in May 2011 and effective for annual periods beginning on or after 1 January 2013), aims to improve consistency and reduce complexity by providing a precise defi nition of fair value and a single source of fair value measurement and disclosure requirements for use across IFRSs. Management is currently assessing the impact of the new standard on the Bank’s fi nancial statements.
The IASB has also amended IFRS 1 to eliminate references to fi xed dates for one exception and one exemption, both dealing with fi nancial assets and liabilities. The fi rst change requires fi rst-time adopters to apply the derecognition requirements of IFRS prospectively from the date of transition, rather than from 1 January 2004. The second amendment relates to fi nancial assets or liabilities where the fair value is established through valuation techniques at initial recognition and allows the guidance to be applied prospectively from the date of transition to IFRS rather than from 25 October 2002 or 1 January 2004. This means that a fi rst-time adopter may not need to determine the fair value of certain fi nancial assets and liabilities at initial recognition for periods prior to the date of transition. IFRS 9 has also been amended to refl ect these changes.
IFRS 10, Consolidated fi nancial statements (issued in May 2011 and effective for annual periods beginning on or after 1 January 2013), replaces all of the guidance on control and consolidation in IAS 27 “Consolidated and separate fi nancial statements” and SIC-12 “Consolidation - special purpose entities”. IFRS 10 changes the defi nition of control so that the same criteria are applied to all entities to determine control. This defi nition is supported by extensive application guidance. The new standard is not expected to have material impact on the Bank's fi nancial statements.
IFRS 11, Joint arrangements (issued in May 2011 and effective for annual periods beginning on or after 1 January 2013), replaces IAS 31 “Interests in Joint Ventures” and SIC-13 “Jointly Controlled Entities - Non-Monetary Contributions by Ventures”. Changes in the defi nitions have reduced the “types” of joint arrangements to two: joint operations and joint ventures. The existing policy choice of proportionate consolidation for jointly controlled entities has been eliminated. Equity accounting is mandatory for participants in joint ventures. The new standard is not expected to have material impact on the Bank's fi nancial statements.
IFRS 12, Disclosure of interest in other entities (issued in May 2011 and effective for annual periods beginning on or after 1 January 2013), applies to entities that have an interest in a subsidiary, a joint arrangement, an associate or an unconsolidated structured entity; it replaces the disclosure requirements currently found in IAS 28 “Investments in associates”. IFRS 12 requires entities to disclose information that helps fi nancial statement readers to evaluate the nature, risks and fi nancial effects associated with the entity’s interests in subsidiaries, associates, joint arrangements and unconsolidated structured entities. To meet this objective, there is a new requirement to disclose signifi cant judgments and assumptions in determining whether an entity controls, jointly controls or signifi cantly infl uences its interests in other entities. As a consequence of these changes IAS 27 is renamed “Separate fi nancial statements”. It continues to be a standard dealing solely with separate fi nancial statements. The existing guidance for separate fi nancial statements is unchanged. The new standard is not expected to have material impact on the Bank's fi nancial statements.
Amendment to IAS 19, Employee benefi ts (issued in June 2011 and effective for annual periods beginning on or after 1 January 2013). The amendment makes signifi cant changes to the recognition and measurement of defi ned benefi t pension expense and termination benefi ts. The amendment also changes disclosures for all employee benefi ts. The Bank does not expect the amendments to have any material effect on its fi nancial statements.

106 ANNUAL REPORT 2011
Bank of MongoliaNotes to the Financial Statements
31 December 2011
5. New Accounting Pronouncements (Continued)
Amendment to IAS 1, Presentation of fi nancial statements (issued in June 2011 and effective for annual periods beginning on or after 1 July 2012). The amendment requires the entities to separate items presented in other comprehensive income into two groups, based on whether or not they may be recycled to profi t or loss in the future. The amendment also changes the title for the statement of comprehensive income to ‘statement of profi t or loss and other comprehensive income’. The Bank is currently assessing the impact of the amended standard on disclosures in its fi nancial statements.
IAS 27, Separate Financial Statements, (revised in May 2011 and effective for annual periods beginning on or after 1 January 2013), was changed and its objective is now to prescribe the accounting and disclosure requirements for investments in subsidiaries, joint ventures and associates when an entity prepares separate fi nancial statements. The guidance on control and consolidated fi nancial statements was replaced by IFRS 10, Consolidated Financial Statements. The Bank does not expect any impact of the amended standard on its fi nancial statements.
IAS 28, Investments in Associates and Joint Ventures, (revised in May 2011 and effective for annual periods beginning on or after 1 January 2013). The amendment of IAS 28 resulted from the Board’s project on joint ventures. When discussing that project, the Board decided to incorporate the accounting for joint ventures using the equity method into IAS 28 because this method is applicable to both joint ventures and associates. With this exception, other guidance remained unchanged. The Bank does not expect any impact of the amended standard on its fi nancial statements.
Disclosures—Offsetting Financial Assets and Financial Liabilities - Amendments to IFRS 7 (issued in December 2011 and effective for annual periods beginning on or after 1 January 2013). The amendment requires disclosures that will enable users of an entity’s fi nancial statements to evaluate the effect or potential effect of netting arrangements, including rights of set-off. The Bank is currently assessing the impact of the amended standard on disclosures in its fi nancial statements.
Offsetting Financial Assets and Financial Liabilities - Amendments to IAS 32 (issued in December 2011 and effective for annual periods beginning on or after 1 January 2014). The amendment added application guidance to IAS 32 to address inconsistencies identifi ed in applying some of the offsetting criteria. This includes clarifying the meaning of ‘currently has a legally enforceable right of set-off’ and that some gross settlement systems may be considered equivalent to net settlement. The Bank is currently assessing the impact of the amended standard on disclosures in its fi nancial statements.
IFRIC 20, Stripping Costs in the Production Phase of a Surface Mine, (issued in October 2011 and effective for annual periods beginning on or after 1 January 2013). The interpretation clarifi es that benefi ts from the stripping activity are accounted for in accordance with the principles of IAS 2, Inventories, to the extent that they are realised in the form of inventory produced. To the extent the benefi ts represent improved access to ore, the entity should recognise these costs as a ‘stripping activity asset’ within non-current assets, subject to certain criteria being met. The Bank does not expect the amendments to have any effect on its fi nancial statements.
Unless otherwise described above the new standards and interpretations are not expected to signifi cantly affect the Bank’s fi nancial statements.

107ANNUAL REPORT 2011
Bank of MongoliaNotes to the Financial Statements
31 December 2011
6. Cash and Cash Equivalents
In millions of Mongolian Tugriks Note 31 December 2011
31 December 2010
1 January 2009
Cash in hand 44,505 14,609 47,749Due from foreign fi nancial institutions:- Short term deposits in foreign currency 7 2,059,287 958,852 749,334- Demand deposits 7 87,290 46,641 73,091- Special drawing rights holdings 7 97,153 90,983 110,379
Liabilities due to government organizations (in national currency) 17 (858,660) (508,668) (311,538)
Demand account of banks (in national currency) 18 (645,501) (181,584) (258,985)
Total cash and cash equivalents 784,074 420,833 410,030
The above balances are presented as cash and cash equivalents for the purposes of the Statement of Cash Flows.
The credit quality of fi nancial assets that represent cash and cash equivalents may be summarised, based on the lowest of the ratings assigned by Standard and Poor’s, Fitch Ratings and Moody’s, as follows at 31 December 2011. When counterparty is a central bank or international fi nancial institution, which is not rated (such as Bank for International Settlements – BIS), its rating is equivalent to the country credit rating. Cash on hand and special drawing rights holdings in IMF do not expose the Bank to credit risk.
In millions of Mongolian Tugriks Demand deposits Short term deposits inforeign currency
Neither past due nor impaired - AAA rated 37,364 58,720- from AA- to AA+ rated 49,926 2,000,567
Total due from foreign fi nancial institutions included in cash and cash equivalents, excluding special drawing rights holdings 87,290 2,059,287
An analysis by credit quality of cash and cash equivalents balances may be summarised, based on the lowest of the ratings assigned by Standard and Poor’s, Fitch Ratings and Moody’s, as follows at 31 December 2010:
In millions of Mongolian Tugriks Demand deposits Short term deposits inforeign currency
Neither past due nor impaired - AAA rated 32,509 -- from AA- to AA+ rated 14,132 958,852
Total due from foreign fi nancial institutions included in cash and cash equivalents, excluding special drawing rights holdings 46,641 958,852
The geographical analysis, credit risk analysis, currency risk analysis, interest rate risk analysis, and maturity analysis are disclosed in Note 28.

108 ANNUAL REPORT 2011
Bank of MongoliaNotes to the Financial Statements
31 December 2011
7. Due from Foreign Financial Institutions
In millions of Mongolian Tugriks 31 December 2011
31 December 2010 (restated)
1 January 2010 (restated)
Short term deposits in foreign currency 2,059,287 958,852 749,334Demand deposits 87,290 46,641 73,091Restricted cash 590 530 554Special drawing rights holdings 97,153 90,983 110,379World Bank subscription 256 247 427Other subscriptions 4 3 4
Total due from foreign fi nancial institutions 2,244,580 1,097,256 933,789
For more information on restated balances, refer to Note 2.
Short term deposits in foreign currency. This balance represents short term time deposits with foreign Central Banks and other fi nancial institutions which are denominated in USD and Euro with initial maturity periods up to 90 days (2010: 89 days).
Demand deposits. This balance represents current account deposits with foreign central banks and other fi nancial institutions which are non-interest bearing.
Restricted cash. This balance represents an amount of CHF 397,703, MNT equivalent being MNT 590 million (2010: MNT 530 million), which is blocked by the District Court of Zurich at the request of third parties. For details on this litigation refer to Note 27.
Special Drawing Rights Holdings. This balance represents the Bank's holding of special drawing rights to supplement existing reserve assets related to the subscription to International Monetary Fund. The amount is stated in SDR 45.5 million (2010: SDR 47.2 million) and is interest bearing.
World Bank subscription. This balance represents the deposits and quota at the World Bank, as part of the condition to be a member of the World Bank group. This amount is matched by a corresponding liability (see Note 19) and is non-interest bearing.
All balances are neither past due nor impaired and management believes that they are fully recoverable, as funds are placed in the central banks of OECD countries and other reputable international institutions. Given that most of these balances represent cash and cash equivalents, their credit quality based on ratings of international rating agencies is disclosed in Note 6. Remaining balance relates to special drawing rights holdings in IMF and World Bank subscriptions, which do not expose the Bank to credit risk, and restricted cash balances, which are not material, in management’s view.
None of these balances are collateralised. Management believes that fair value of these balances approximates carrying value. The geographical analysis, credit risk analysis, currency risk analysis, interest rate risk analysis, and maturity analysis are disclosed in Note 28.
8. Financial Investments – Available for Sale
In millions of Mongolian Tugriks 31 December 2011
31 December 2010
Debt securities available for sale:Bonds of Bank for International Settlements denominated in US dollars 209,456 1,084,291
Equity securities available for sale:Equity investments at cost 3,084 3,084
Total fi nancial instruments available for sale 212,540 1,087,375

109ANNUAL REPORT 2011
Bank of MongoliaNotes to the Financial Statements
31 December 2011
8. Financial Investments – Available for Sale (Continued)
Bonds of the Bank for International Settlements (BIS) represent quoted debt securities and thus are measured at fair value, which is based on market price of the bonds. All of the bonds are of short-term nature with three month maturity and bear interest rate and yield of approximately 0,3% per annum. The Bank invests into these securities due to their low credit risk and due to high reputation of the BIS. Accordingly, these investments are considered to be neither past due nor impaired. These bonds are not collateralised. For more information refer to Note 29.
Unquoted equities represent investments in Mongolian Mortgage Corporation, International Investment Bank and International Bank of Economic Co-operation. The investments are recorded at cost due to the absence of quoted market price. There is no market for these investments and the Bank intends to hold them on a long term basis. Management believes that fair value of these investments is not materially different from their carrying values.
Based on available information, management believes that there is no need for recognition of impairment for these investments as of 31 December 2011 and 31 December 2010.
Credit quality of investment securities that expose the Bank to credit risk (i.e. debt securities) is based on ratings of international rating agencies. Given that BIS has no individual rating, the rating equivalent to the credit rating of the country of the issuer has been used. Accordingly, as of 31 December 2011 and 31 December 2010, debt securities available for sale (issued by BIS) were AAA rated, based on the lowest of the ratings assigned by Standard and Poor’s, Fitch Ratings and Moody’s
9. Financial Investments – Held to Maturity
In millions of Mongolian Tugriks 31 December 2011 31 December 2010
Foreign bonds at amortised cost - 72,702
Total fi nancial instruments held to maturity - 72,702
As of 31 December 2010, the Bank invested into bonds issued by Royal Bank of Canada (MNT 44,470 million) and Bank of Nova Scotia (MNT 28,232 million). All of the bonds were of short-term nature and matured in 2011. Thus, management believes that fair value of these bonds as of 31 December 2010 approximated their carrying value. For more information refer to Note 29. Bonds were not collateralised.
All bonds were considered neither past due nor impaired and were AAA rated as of 31 December 2010, based on the lowest of the ratings assigned by Standard and Poor’s, Fitch Ratings and Moody’s.
10. Reverse Repurchase Agreement
In millions of Mongolian Tugriks 31 December 2011 31 December 2010
Reverse repurchase agreements 678,496 491,280
Total reverse repurchase agreements 678,496 491,280
The Bank entered into Automatic Investment Programme arrangement in respect of its deposit account held with Federal Reserve Bank of New York. Under this programme, amounts exceeding minimum balance of USD 100,000 are to be invested in Repurchase Agreement Pool (“repo pool”) of Federal Reserve Bank of New York. As at 31 December 2011 the funds invested in repo pool amounted to USD 485.9 million (equivalent of MNT 678,496 million). These investments have one month maturity and carry interest rate of 0.12% per annum. Though related investments are effectively collateralised, there is no clear identifi cation of securities purchased using this pool based on the investment program. For more information refer to Note 28.

110 ANNUAL REPORT 2011
Bank of MongoliaNotes to the Financial Statements
31 December 2011
10. Reverse Repurchase Agreement (Continued)
All reverse repurchase agreements were considered neither past due nor impaired and were AA+ rated as of 31 December 2011 and 31 December 2010, based on the lowest of the ratings assigned by Standard and Poor’s, Fitch Ratings and Moody’s.
11. Gold Bullion and Precious Metals
In millions of Mongolian Tugriks 31 December 2011 31 December 2010
At valuationGold bullion 245,564 115,042Silver 383 148
At costGold and silver ore 19,289 7,392Coins and cultural valuables 2,849 2,851
Total gold bullion and precious metals 268,085 125,433
The Bank holds gold bullion in the Bank of England and Scotia Mocatta. Other items (silver, gold and silver ore, and coins and cultural valuables) are held in the Bank’s central vault. These items include gold purchased from miners, which is held in the Bank’s Central Vault before sending for refi nement. After refi nement, gold is traded or delivered to the Bank of England and Scottia Mocatta as gold bullion.
12. Government Securities
In millions of Mongolian Tugriks 31 December 2011 31 December 2010
Ministry of Finance securities, at amortised cost 155,276 53,044
Total government securities 155,276 53,044
As of 31 December 2011 the Bank has invested in the following government securities issued by the Ministry of Finance:
bonds related to Zoos Bank with outstanding amount of MNT 24,182 million (2010: outstanding amount of MNT 21,887 million). bonds issued for fi nancing mortgage loans for civil servants by the Government with outstanding amount of
MNT 30,000 million (2010: MNT 30,000 million). bonds issued for supporting SMEs and cashmere industry by the Government with outstanding amount of MNT
100,000 million (2010: nil). The remaining amounts as of 31 December 2011 and 31 December 2010 represent accrued interest. On 26 March 2010, the Ministry of Finance of Mongolia has issued government bonds of MNT 33 billion to replace the loan to a local bank (Zoos Bank) issued in prior years, which was under receivership. The bonds bear nominal interest of 0.1% per annum with maturity period of 4-6 years, whereas the interest of loan issued to Zoos Bank was 10%. The bond as at 26 March 2010 was recorded at fair value using the original effective interest rate on the underlying loan of 10% p.a., which approximates market rate of government bonds at the time of initial recognition. As at 31 of December 2011 and 31 December 2010 the bond was recorded at amortised cost in the statement of fi nancial position.
The securities for fi nancing mortgage loans of civil servants are issued for a period of 5 years and bear interest of 7.8% per annum. No provision is considered necessary, as there were no problems in collection of these receivables.

111ANNUAL REPORT 2011
Bank of MongoliaNotes to the Financial Statements
31 December 2011
12. Government Securities (Continued)
Bonds issued for supporting SMEs and cashmere industry have the following terms: 2 year maturity and interest rate of 12.25% per annum. These bonds were issued in December 2011. No provision is considered necessary, as there were no problems in collection of these receivables.
These securities are measured at amortised cost. All of the above balances are considered neither past due nor impaired and were BB-rated as of 31 December 2011 and 31 December 2010, based on the lowest of the ratings assigned by Standard and Poor’s, Fitch Ratings and Moody’s. None of government securities are collateralised. For more information on related party transactions refer to Note 31. Fair value of these securities is disclosed in Note 29.
13.Loans to Local Banks
In millions of Mongolian Tugriks 31 December 2011 31 December 2010
Reverse sale and repurchase agreements 223,244 -Loans related to Anod Bank 102,000 120,000Loans in local currency 11,029 5,389Loans in foreign currency 5,233 5,927
Total loans to local banks before provision for impairment 341,506 131,316
Less: Provision for loan impairment (925) (925)
Total loans to local banks 340,581 130,391
Reverse repurchase agreements. Reverse repurchase agreements represent short term loans to local banks secured by Central Bank bills (refer to Note 16) to resell at a certain date in the future at a fi xed price. The maturity of these instruments is up to one month and they bear interest rate of 16.5% per annum. These balances are considered neither past due nor impaired, as all of them were recovered in 2012.
Loans related to Anod Bank. The Bank has signed the loan agreement with the Receivership of Anod Bank on 12 December 2008 in order to provide short-term liquidity to Anod Bank, which has been put under receivership. The main purpose of the loan was to fi nance required amount of money to recover customer deposits of Anod Bank in accordance with Blanket Guarantee Law, which states that the Government of Mongolia guarantees that citizens’ deposits placed in the Mongolian commercial banks are recoverable and will be returned to citizens in the case of the default or bankruptcy of commercial bank.
The loan agreement represents a credit line with maximum amount of MNT 147.9 billion. Based on the agreement Anod Bank can request tranches, while total outstanding amount should not exceed this limit. Each tranche should be returned within 6 months from its origination. The interest rate is equivalent to the interest rate of 7 day Central Bank bills, which was 9.75% p.a. at the time of the origination of this loan arrangement. Based on the agreement, interest shall be accrued every 90 days and deducted directly from the current account of Anod Bank. The loans to Anod Bank under this arrangement are collateralized by Anod Bank’s loans issued to customers in the amount of MNT 186.3 billion. The fi rst tranche was disbursed immediately upon signing of the Agreement, on 12 December 2008.
Due to diffi culties faced in collection of these loans, maturity date of loans was extended from 6 months to 12 months, based on the Appendix to the agreement dated 28 July 2009. Further, no contractual interest was accrued for the loans since 2009, while recoveries during 2010 and 2011 were not signifi cant. Consequently, no new loans were approved during 2010 and 2011 and the Bank has started negotiation process with the Government of Mongolia and the Ministry of Finance related to recovery of these loans.

112 ANNUAL REPORT 2011
Bank of MongoliaNotes to the Financial Statements
31 December 2011
13. Loans to Local Banks (Continued)
Management is of the opinion that these loans are recoverable from the Government of Mongolia. The Bank is currently awaiting the issuance of a government bond by the Ministry of Finance, which will be used for repayment of receivables due from Anod Bank. The issuance of this government bond is expected to be approved by the Parliament of Mongolia during 2012. For this reason, during 2010 the Bank has released the impairment provision previously recorded on these loans as management cannot estimate provision due to uncertain timing of cash fl ows.
Loans in foreign currency. The loans in foreign currency consist mainly of loans disbursed to local banks to promote small and medium scale companies in the amount of MNT 4,525 million (2010: MNT 5,304 million) and loans for improving commercial banks' systems and enhancing capability of banking specialists in the amount MNT of 657 million (2010: MNT 621 million). The remaining amounts refer to accrued interest.
Loans disbursed to local banks for further on-lending to Mongolian enterprises to promote small and medium scale companies were made available under two separate programmes by the Government of Germany through KfW. For more details on these programmes and related BOM’s liabilities to the Ministry of Finance, refer to Note 17. The loans under both programmes bear interest at the rate ranging from 1.25% to 1.75% (2010: 1.25% to 1.75%) per annum and are not backed by any security. The loans under both programmes are disbursed through three local banks to the borrowers which meet specifi c criteria set by KfW. Accordingly, the repayment terms for each disbursed loan vary according to the date of disbursement. The Bank’s credit risk does not depend on the repayments of these funds by the borrowers, as BOM has the right to automatically withdraw funds from the accounts of commercial banks with BOM when repayments are due. For management’s judgements related to these loans refer to Note 3.
Loans for improving commercial banks' systems and enhancing capability of banking specialists are provided by the Bank to commercial banks to fi nance the training conducted by DAI (Thailand) Limited Company for bank staff at the Banking Training Centre in accordance with the agreement signed between Mongolia and the Asian Development Bank. Repayment period of this loan is 14 years.
Loans in local currency. The loans in local currency, including accrued interest, consist of a loan to a local commercial bank in the amount of MNT 4,667 million (2010: MNT 4,667 million), overnight placement (loan) to another local bank in the amount of MNT 5,000 million (2010: nil), and loans to local banks related to the program of Asian Development Bank (ADB) in the amount of MNT 1,362 million (2010: MNT 685 million). The remaining amounts relate to accrued interest.
The loan to a local bank, which originated on conversion of the Bank’s collaterised loan to Anod Bank, bears interest at a rate of 12.25% per annum and has 3 years maturity. The loan is not collateralised. No problems in collection of this loan were encountered.
The Bank has made overnight placement with a local bank as of 31 December 2011 in the amount of MNT 5,000 million at interest rate of 21.25% per annum.
The loans related to ADB programmes were disbursed to various local banks in Mongolia, for the further on-lending to Mongolian enterprises. The funding was made available under two separate programmes by the Asian Development Bank to create more job opportunities for the people of Mongolia and to develop the agricultural sector in the country. The loans under the fi rst programme bear interest at the rate of 10% (2009: 10%) per annum and the repayment terms for each disbursed loan vary according to the date of disbursement. The loans under the second programme bear interest at the rate of 5.5% (2009: 5.5%) per annum with the maturity of up to one year for each loan disbursed. As in case of KfW programmes, the Bank’s credit risk does not depend on the repayments of these funds by the borrowers, as BOM has right to automatically withdraw funds from the accounts of commercial banks with BOM when repayments are due. For management’s judgements related to these loans refer to Note 3.

113ANNUAL REPORT 2011
Bank of MongoliaNotes to the Financial Statements
31 December 2011
13. Loans to Local Banks (Continued)
There were no movements in provision for loan impairment during 2011. Movements in the provision for loan impairment during 2010 are as follows:
In millions of Mongolian TugriksReverse sale
and repurchase agreements
Loans related to Anod Bank
Loans in local
currency
Loans in foreign
currency Total
Provision for loan impairment at1 January 2010 - 18,300 13,161 - 31,461
Replacement of loans related to Zoos Bank with government bond (Note 12) - - (13,161) - (13,161)
Provision for/(reversal of) impairment during the year (Note 25) - (18,300) 925 - (17,375)
Provision for impairment at 31 December 2010 - - 925 - 925
Impairment provision on loans related to Zoos Bank was written off when these loans were derecognized. Related receivables were replaced by government securities during 2010, refer to Note 12.
Analysis by credit quality of loans outstanding at 31 December 2011 is as follows:
In millions of Mongolian TugriksReverse sale
and repurchase agreements
Loans related to Anod Bank
Loans in local
currencyLoans in
foreign currency
Total
Neither past due nor impaired - BB- 200,486 - 5,000 3,711 209,197- B+ - - 5,020 - 5,020- Unrated 22,758 - 1,009 1,522 25,289
Total neither past due nor Impaired 223,244 - 11,029 5,233 239,506
Loans determined to be individually impaired- over 360 days overdue - 102,000 - - 102,000
Total individually impaired loans - 102,000 - - 102,000
Less impairment provision - - (925) - (925)
Total loans to local banks 223,244 102,000 10,104 5,233 340,581

114 ANNUAL REPORT 2011
Bank of MongoliaNotes to the Financial Statements
31 December 2011
13. Loans to Local Banks (Continued)
Analysis by credit quality of loans outstanding at 31 December 2010 is as follows:
In millions of Mongolian TugriksReverse sale
and repurchase agreements
Loans related to Anod Bank
Loans in local currency
Loans in foreign
currency Total
Neither past due nor impaired - BB- - - - 2,885 2,885- B+ - - 4,667 - 4,667- Unrated - - 722 3,042 3,764
Total neither past due nor Impaired - - 5,389 5,927 11,316
Loans determined to be individually impaired- over 360 days overdue - 120,000 - - 120,000
Total individually impaired loans - 120,000 - - 120,000
Less impairment provision - - (925) - (925)
Total loans to local banks - 120,000 4,464 5,927 130,391
As disclosed in Note 28, the biggest Mongolian commercial banks are rated by international rating agencies. The analysis above was prepared based on the lowest of ratings assigned by international rating agencies. In case of unrated Mongolian commercial banks, the Bank considers fi nancial conditions of related commercial bank based on the recent fi nancial information, compliance with prudential ratios, and other information available for assessing credit quality of related assets.
Information about collateral at 31 December 2011 is as follows:
In millions of Mongolian TugriksReverse sale
and repurchase agreements
Loans related to Anod Bank
Loans in local currency
Loans in foreign
currency Total
Unsecured - - 11,029 5,233 16,262Loans collateralised by: - Central bank bills 223,244 - - - 223,244 - Commercial loans - 102,000 - - 102,000
Collateralised loans 223,244 102,000 - - 325,244
Total loans to local banks before provision for impairment 223,244 102,000 11,029 5,233 341,506
Reverse sale and repurchase agreements are collateralised by Central bank bills issued to respective banks, which are disclosed within Note 16. These fi nancial instruments are considered to be over-collateralised. Carrying amount of Central bank bills approximates the carrying amount of reverse sale and repurchase agreements as of 31 December 2011, in accordance with the Bank’s procedure. Information on the collateral on loans related to Anod Bank is disclosed below.

115ANNUAL REPORT 2011
Bank of MongoliaNotes to the Financial Statements
31 December 2011
13. Loans to Local Banks (Continued)
Information about collateral at 31 December 2010 is as follows:
In millions of Mongolian TugriksReverse sale
and repurchase agreements
Loans related to Anod Bank
Loans in local currency
Loans in foreign
currency Total
Unsecured - - 5,389 5,927 11,316Loans collateralised by: - Commercial loans - 120,000 - - 120,000
Collateralised loans - 120,000 - - 120,000
Total loans to local banks before provision for impairment - 120,000 5,389 5,927 131,316
Though based on the terms of the Agreement with Receivership of Anod Bank, related loans are collateralised by the loan portfolio of Anod Bank, as disclosed above, management believes that relevant government bonds that are planned to be issued by the Ministry of Finance after the Parliament’s approval will represent valid collateral for these loans as those bonds will replace loans issued to Anod Bank, though no formal agreement is currently in place. Given that Anod Bank is currently in liquidation, management is not able to assess recoverable amount of loan portfolio of Anod Bank and consequently the fi nancial effect of collateral with suffi cient reliability.

116 ANNUAL REPORT 2011
Bank of MongoliaNotes to the Financial Statements
31 December 2011
14. Property, Equipment and Intangible Assets
In millions of Mongolian Tugriks Buildings/ premises
Const-ruction in
progress
Offi ce and computer
equipment
Total premises and equipment
Intangible assets Total
Cost or valuation at 31 December 2009 22,734 33 7,231 29,998 66 30,064
Accumulated depreciation/amortisation (2,632) - (3,461) (6,093) (5) (6,098)
Carrying amount at 31 December 2009 20,102 33 3,770 23,905 61 23,966
Additions 1,360 104 1,339 2,803 2,011 4,814Disposals (576) - (2) (578) - (578)Write-offs (2) - (229) (231) - (231)Depreciation/amortization charge (note 26) (370) - (941) (1,311) (1,092) (2,403)
Carrying amount at 31 December 2010 20,514 137 3,937 24,588 980 25,568
Cost or valuation at 31 December 2010 23,516 137 8,339 31,992 2,077 34,069
Accumulated depreciation/amortisation (3,002) - (4,402) (7,404) (1,097) (8,501)
Carrying amount at 31 December 2010 20,514 137 3,937 24,588 980 25,568
Additions 404 396 987 1,787 179 1,966Disposals - - (2) (2) - (2)Write-offs - - (4) (4) - (4)Depreciation/amortisation charge (note 26) (384) - (986) (1,370) (155) (1,525)
Carrying amount at 31 December 2011 20,534 533 3,932 24,999 1,004 26,003
Cost or valuation at 31 December 2011 23,920 533 9,320 33,773 2,256 36,029
Accumulated depreciation/amortisation (3,386) - (5,388) (8,774) (1,252) (10,026)
Carrying amount at 31 December 2011 20,534 533 3,932 24,999 1,004 26,003

117ANNUAL REPORT 2011
Bank of MongoliaNotes to the Financial Statements
31 December 2011
14. Property, Equipment and Intangible Assets (Continued)
In accordance with the regulations effective in Mongolia, the Bank is obliged to perform revaluation of buildings once in fi ve year period. The last valuation was performed as of 31 December 2008 by independent appraisers Property Appraisal Centre LLC. Management believes that carrying amounts as of 31 December 2011 and 31 December 2010 approximate fair value of buildings.
If average prices would be 20% higher compared to prices taken into account in the current carrying value, the carrying value of buildings and revaluation reserve within other reserves would increase by approximately MNT 4,106 million as of 31 December 2011 (MNT 4,103 million as of 31 December 2010). If average prices would be 20% lower compared to prices taken into account in the current carrying value, carrying value of buildings and the Bank’s revaluation reserve would decrease by approximately MNT 4,106 million as of 31 December 2011 (MNT 4,103 million as of 31 December 2010). Management believes that an overall decrease in value of the Bank’s buildings is unlikely under the current economic conditions, while any potential increase in value of buildings (leading to increase in fi xed assets and equity) would not have material impact on the fi nancial statements from the perspective of users of fi nancial information.
Had the re-valued buildings been carried at historical cost, the net book value of the buildings that would have been included in the fi nancial statements of the Bank as at 31 December 2011 would have been MNT 5,704 million (2010: 5,865 million).
A building with carrying value of MNT 1,666 million (2010: MNT 1,696 million) has been pledged as security for borrowings as referred in Note 19.
15. Other Assets
In millions of Mongolian Tugriks 31 December 2011 31 December 2010
Other fi nancial assetsReceivables from companies 43,946 43,932Claims on foreign fi nancial institutions 12,208 10,985Interest receivables due from the Ministry of Finance 3,177 -
Less: Provision for impairment (56,154) (54,917)
Other non-fi nancial assetsPrepaid expenses 870 2,036Other 2,101 361
Total other assets 6,148 2,397
Receivables from companies include receivables due from gold producing companies that have not fulfi lled their obligations under the gold option contracts entered into with the Bank in prior years. These receivables amount to MNT 26,769 million (2010: MNT 24,240 million), are considered impaired and thus they are fully provided for. The Bank no longer enters into gold option contracts. Remaining balances due from companies are also considered impaired and fully provided as of 31 December 2011 and 31 December 2010.
These outstanding balances in prior years had resulted in non-compliance of Article 23 of the Law on Central Bank which states that it is prohibited for the Bank to take deposits from or extend credit or provide settlement services to individuals or legal entities other than the Government of Mongolia and banks. As in previous years, management believes that this case of non-compliance has no adverse consequences on the Bank’s operations.
Claims on foreign fi nancial institutions are considered to be non-recoverable and thus fully provided, as related foreign institutions are no longer operating.
118 ANNUAL REPORT 2011
Bank of MongoliaNotes to the Financial Statements
31 December 2011
15. Other Assets (Continued)
Interest receivables due from the Ministry of Finance represent outstanding interest receivables on loan issued in 2011; the principle of loan was repaid as at 31 December 2011 and interest receivables on loan were collected in February 2012. Thus, the Bank considers these receivables past due but not impaired. Other assets mainly consist of prepayments, advances to staff, consumable materials and stationary supplies.Movements in the provision for impairment of other fi nancial assets during 2011 and 2010 are as follows:
In millions of Mongolian Tugriks 31 December 2011 31 December 2010
At 1 January 54,917 47,369Translation of provisions denominated in foreign currency 4,773 (33)Provision charge for impairment (Note 25) - 8,028Recoveries of impairment provision (Note 25) (3,536) (447)
At 31 December 56,154 54,917
16. Central Bank Bills
In millions of Mongolian Tugriks 31 December
2011 31 December
2010
Central Bank bills issued 879,113 1,100,997
Total Central Bank bills issued 879,113 1,100,997
This represents Bank of Mongolia bills issued by the Bank to local banks. Such bills have maturities between 7 days to 24 weeks (2010: 7 days to 12 weeks) and bear interest rates ranging from 10.4% to 16.25% as of 31 December 2011 (2010: from 8.5% to 12.9%). The Bank uses Central Bank Bills to withdraw from the economy excessive cash to control infl ation.
17. Liabilities Due to Government Organisations
In millions of Mongolian Tugriks 31 December 2011 31 December 2010 (restated)
1 January 2010 (restated)
Liabilities to the Ministry of Finance related to borrowings - Government of Germany (KfW) 13,741 12,920 16,446 - Asian Development Bank (ADB) 7,055 6,506 7,819Current accounts of Ministry of Finance 1,150,094 802,955 698,227
Total liabilities due to government organizations 1,170,890 822,381 722,492
Ministry of Finance accounts. This relates to various current accounts that the Ministry of Finance (“MOF”) maintains with the Bank.
Liabilities due to the Ministry of Finance related to borrowings from international organisations. These liabilities relate to the borrowing agreements signed by the Government of Mongolia with KfW (acting on behalf of the Government of Germany) and Asian Development Bank (ADB). The Ministry of Finance of Mongolia acts as fi scal agent with regard to these agreements, while the Bank of Mongolia acts as project executing agency.

119ANNUAL REPORT 2011
Bank of MongoliaNotes to the Financial Statements
31 December 2011
17. Liabilities Due to Government Organisations (Continued)
The loans received from the Government of Germany under the credit programme for small and medium enterprises (SMEs) are made available under two separate programmes in 1995 and 2003. The loans under both programmes are denominated in Euro with maturity of 40 years and bear interest at 0.75% per annum (2010: 0.75% per annum). The repayment of loan principal will commence in 2012.
The loans received from the ADB are mainly for purposes of reducing poverty in Mongolia by developing and promoting private enterprises, and providing training and consultancy to the Government, non-government organisations and local banks. The related agreements were signed in 1994 and 1997 and related loans bear interest ranging from 1% to 1.5% per annum (2010: 1% to 1.5% per annum) and have maturity ranging from 30 to 40 years.
The Bank has no obligations toward KfW and ADB, as the Ministry of Finance acts as a fi scal agent of the Government of Mongolia. However, the Bank, as project executing agency, was responsible for channelling funds to commercial banks, which further channelled funds to fi nal customers (borrowers) who meet specifi ed criteria by KfW and ADB. However, the Bank has liabilities to the Ministry of Finance related to these agreements. Based on the arrangement between the MOF and BOM, the BOM has borrowed related funds from the MOF under the same conditions, as in agreement with KfW and ADB. Further, BOM also acts as a depository i.e. it is responsible for settling payments from the account of the Ministry of Finance with regard to KfW. Loans issued to local banks from these funds are disclosed in Note 13. For management’s judgement related to these liabilities to MOF and loans to local banks, refer to Note 3.
Balances and transactions with related parties are disclosed in Note 31.
18.Deposits from Local Banks
In millions of Mongolian Tugriks 31 December 2011 31 December 2010
Correspondent accounts: - in national currency 645,501 181,584 - in foreign currency 369,729 459,146
Total deposits from local banks 1,015,230 640,730
This balance mainly consists of various deposit accounts and obligatory reserves of local banks maintained with the Bank, calculated as a percentage of their eligible liabilities to deposit holders.
19.Liabilities Due to Foreign Parties
In millions of Mongolian Tugriks 31 December 2011
31 December 2010 (restated)
1 January 2010 (restated)
SecuredLoan from HSBC, London 565 677 977
UnsecuredInternational Monetary Fund ("IMF"): - IMF No.1 account 272 272 272 - IMF No.2 account 6 6 7 - Allocation of Special Drawing Rights ("SDR") 104,197 93,927 110,304Subscription to World Bank 256 247 427Subscription to IDA 34 34 34Current account of WorldBank 77 72 174Current account of ADB 5 - -
Total liabilities to foreign parties 105,412 95,235 112,195

120 ANNUAL REPORT 2011
Bank of MongoliaNotes to the Financial Statements
31 December 2011
19. Liabilities Due to Foreign Parties (Continued)
Loan from HSBC, London. This balance represents a 10 year term loan from HSBC, London for the purpose of funding the acquisition of a property. The repayment of loan principal had commenced in 2005 and bears interest at 1.75% above HSBC’s base rate per annum. The loan is secured by a building as referred in Note 14.
Allocations of Special Drawing Rights. IMF member countries are allocated SDR in proportion to their subscription to the IMF. The allocation represents a dormant liability of the Bank to the IMF, against which assets are received in SDR Holdings from the IMF as referred in Note 7. The net accumulation of the allocation was MNT 104,197 million (2010: MNT 93,927 million) equivalent to SDR 48.757 million (2010: SDR 48.757 million).
Subscription to World Bank and IDA. The balance represents the Bank’s subscription obligations to World Bank and IDA.
20. Other Liabilities
In millions of Mongolian Tugriks 31 December 2011 31 December 2010
Other fi nancial liabilitiesInitial capital contribution for local banks 3,000 16,700Deposits by non-banking entities 4,061 -Other payables 6,653 12,258
Other liabilitiesSocial development fund 8,740 5,581Provision for claims under documentary letter of credit issued 35,618 31,988
Total other liabilities 58,072 66,527
Initial capital contributions relate to special purpose accounts for the purpose of increase of share capital of Mongolian commercial banks. These accounts have restricted use i.e. they are used only for making investments in respective banks. Initial capital contributions as of 31 December 2011 represent share capital increase of Savings Bank, which was approved in January 2012. As of 31 December 2010 this amount related to special purpose accounts of local banks, which participate in establishing of Development Bank of Mongolia.
Based on its internal regulations, the Bank allocates certain funds to the Social development fund which is used for improving living and working conditions of the Bank’s employees. These funds are used for payment of retirement benefi ts to the Bank’s employees, fi nancing construction of apartments for the Bank’s employees, help to employees in need etc. Management believes that allocated funds in social development fund are suffi cient as of 31 December 2011 and 31 December 2010. Related expenses are disclosed in Note 26.
Deposits by non-banking entities relate to deposits from the government organisation Central Depository. Decrease in other payables (i.e. other fi nancial liabilities) relate to accruals for purchase of equipment as of 31 December 2010, which were subsequently settled in 2011.
Provision for claims under documentary letter of credit issued relates to the litigation which was initiated in 2008. Management believes that losses would be incurred with regard to this litigation and has made a provision in 2009 accordingly. There were no movements in provision during 2010 and 2011 apart from the impact of foreign exchange fl uctuations. For more details on this litigation refer to Note 27. Related letters of credit are included in the amount of export letters of credit disclosed in Note 27.

121ANNUAL REPORT 2011
Bank of MongoliaNotes to the Financial Statements
31 December 2011
21. Charter Fund and Other Reserves
In millions of Mongolian Tugriks 31 December 2011
31 December 2010
Charter fund 5,000 5,000
The Bank is wholly owned by the Government of Mongolia. The Charter Fund represents the capital of the Bank.In accordance with the Law on Central Bank (Bank of Mongolia), at least 40% of the Bank’s net income has to be allocated to its General Reserve Fund, while the remaining amount (i.e. maximum 60% of net income) can be transferred to the State Budget account. Thus, general reserve fund includes only such portions of net income accumulated over years (40% of annual net income or higher percentage), over which the Bank had full rights to utilize them. This reserve fund does not include amounts that were distributed to the State budget in the past or which can be distributed in the future, as these portions have been already transferred to the Government in respective years.
Other reserves comprise the following:
In millions of Mongolian Tugriks 31 December 2011 31 December 2010
Foreign currency revaluation fund 92,326 (130,443)Revaluation reserve for precious metals 20,789 6,458Revaluation reserve for fi xed assets 7,788 7,788Revaluation fund for fi nancial investments available-for-sale 42 21
Total other reserves 120,945 (116,176)
As of 31 December 2010, the Bank has decided to transfer the amount of general reserve to retained earnings after taking into consideration of substantial loss incurred during the year. Information on movements in other reserves is disclosed within Statement of changes in equity.
For more details on other reserves, refer to Note 2.
22. Interest Income and Expense
In millions of Mongolian Tugriks 2011 2010
Interest incomeDue from foreign fi nancial institutions 6,796 1,910Loans to local banks 5,533 1,150Government securities - at amortised cost 4,975 5,194Financial investments - available-for-sale 2,152 2,333Other interest income 213 1,164
Total interest income 19,669 11,751
Interest expenseCentral Bank bills 114,938 65,679Liabilities due to government organizations 3,841 4,199Other interest expense 202 831
Total interest expense 118,981 70,709
Net interest expense (99,312) (58,958)

122 ANNUAL REPORT 2011
Bank of MongoliaNotes to the Financial Statements
31 December 2011
23. Net Gain from Trading of Gold and Precious MetalsIn millions of Mongolian Tugriks 2011 2010
Gain on gold trading 22,503 4,286Unrealized gain on revaluation of gold 14,331 6,458Other precious metals trading 6,827 1,528Transportation and refi ning cost (231) (83)
Net gain from trading of gold and precious metals 43,430 12,189
24. Foreign Exchange Gains Less Losses
In millions of Mongolian Tugriks 2011 2010
Unrealised gain/(loss) on translation of foreign exchange 222,769 (183,170)Realised gain/(loss) on translation of foreign exchange 25,243 (15,675)Gain on foreign currency trading 4,173 623Other foreign exchange gain/(loss) 121 (97)
Foreign exchange gains less losses 252,306 (198,319)
25. Release of Impairment Provision
In millions of Mongolian Tugriks Note 2011 2010 Other assets 15 3,536 (7,581)Loans to local banks 13 - 17,375
Total recovery of impairment loss 3,536 9,794
26. Administrative and Other Operating Expenses
In millions of Mongolian Tugriks Note 2011 2010
Staff cost 8,268 4,780Cost of printing banknotes 6,203 3,282Legal and professional fees 3,060 3,376Depreciation and amortization of property, equipment and intangible assets 14 1,525 2,403
Telecommunication expenses 900 760Security expenses 605 489Membership and professional fees 497 390Transportation and business trip 384 385Utilities 384 347Training expenses 339 948Advertising expenses 155 280Property, plant and equipment written-off 46 231Other operating expenses 567 2,655
Total administrative and other operating expenses 22,933 20,326

123ANNUAL REPORT 2011
Bank of MongoliaNotes to the Financial Statements
31 December 2011
26. Administrative and Other Operating Expenses (Continued)
Staff costs consist of expenses for Social Development Fund in the amount of MNT 4,000 million (2010: MNT 1,500 million), net salaries and bonuses of MNT 3,581 million for 2011 (2010: MNT 2,728 million), and social contributions of MNT 652 million (2010: 518 MNT thousand). Included in social security contributions are pension contributions of MNT 415 million (2010: MNT 330 million). Remaining amounts refer to business trips costs.
27. Contingencies and Commitments
Legal proceedings. From time to time and in the normal course of business, claims against the Bank may be received. Since 2008, the Bank acts as defendant in the legal proceedings held in Swiss and German courts in connection with the payments allegedly due under the issued documentary letters of credit to two fi nancial institutions, which operate in these countries. Though the Bank has been vigorously defending its position in these cases, taking into account its contractual obligations under the issued letters of credit, the Bank has created provision in the amount of its full exposure (including interest) in 2009. Related provision amounts to MNT 35,618 million as of 31 December 2011 (2010: MNT 31,988 million), refer to Note 20.
With regard to these letters of credit, the Bank has initiated litigations against certain individuals and corporations in the United States District Court for the Southern District of Florida for breach of law and other offences (such as fraudulent misrepresentation, negligent misrepresentation, breach of contract, indemnifi cation, unjust enrichment etc.). The amount of claims against these individuals and corporations signifi cantly exceeds the amount of claims against the Bank outlined above. Though the outcome of these proceedings is likely to be favorable for the Bank, there is not suffi cient certainty about the recoverability of these receivables from defendants. Thus, the Bank has not recognized receivables related to these claims in these fi nancial statements, though the Bank makes the best efforts to recover claimed amounts.
Management is not aware of any other legal proceedings as of 31 December 2011, in which the Bank acts as defendant and which could result in material losses to the Bank. Thus, management believes that no provision, apart from the provision related to the above claims connected with issued letters of credit, is necessary in these fi nancial statements.
IMF related balances. Although the Bank has received certain funds from the IMF and further transferred them to relevant accounts opened within the Bank (e.g. accounts of the Ministry of Finance), the following IMF related balances do not meet defi nition of assets and liabilities under IFRS Framework, given that the Bank has no contractual rights and obligations with regard to purchases of related IMF funds. Such funds include IMF quota contribution, stand-by arrangement loan from IMF, and loans received under Poverty Reduction and Growth Facility (“PRGF”). These funds are the responsibility of the Government of Mongolia rather than of a central bank. Given that the Ministry of Finance acts as a fi scal agent of Mongolia, it has signed promissory notes issued to IMF in respect of settlement of quota and purchases of IMF funds under stand-by arrangement, the Ministry of Finance has the obligation toward IMF with regard to purchases of these IMF funds.

124 ANNUAL REPORT 2011
Bank of MongoliaNotes to the Financial Statements
31 December 2011
27. Contingencies and Commitments (Continued)
As a result of the analysis of the Bank’s role in the relationship with IMF, management considered necessary to change its accounting policy for operations with the IMF in 2011 and related balances are presented as off-balance sheet items in these fi nancial statements. The resulting restatements made in these fi nancial statements are disclosed in Note 2.
In millions of SDRs 31 December 2011
31 December 2010 (restated)
1 January 2010 (restated)
Balances of the Government of Mongolia due from other institutions IMF quota subscription 50.96 50.96 50.96
Balances of the Government of Mongolia due to IMFIMF securities accounts: -issued in settlement of IMF quota 50.96 50.96 50.96-purchase of funds under stand-by arrangement 122.64 122.64 122.64Loans received under PRGF (not covered by securities) 3.26 5.70 8.73
Total balances due to IMF 176.86 179.30 182.33
IMF quota subscription. The quota balance is a special type asset which represents Mongolia’s subscription as a member of the IMF. Quotas vary based on the economic size of each country and are determined by the Board of Governors of the IMF. The quota determines a member’s voting power in the Fund, the limits of access to the fi nancial resources of the Fund and a participant’s share in the allocation of SDRs, the Fund’s unit of account. The major part of Mongolia’s quota was paid in the form of non-interest-bearing promissory notes issued to the IMF by the Ministry of Finance, the remainder being credited to the IMF accounts No 1 and No 2 (Note 19). As at 31 December 2011 Mongolia’s quota in the IMF amounted to SDR 51.1 million (2010: SDR 51.1 million), which is equivalent to MNT 109,201 million as of 31 December 2011. Included in this amount is reserve tranche position of SDR 0.14 million (2010: SDR 0.14 million) or MNT 300 million as at 31 December 2011, which represents an asset of the Bank of Mongolia. The quota does not earn interest. Given that quota subscription was paid through issue of promissory notes by Ministry of Finance, these amounts represent assets of the Ministry of Finance and represent off-balance sheet items of the Bank.
IMF securities issued. Total IMF securities accounts as of 31 December 2011 amounted to SDR 173.6 million (2010: SDR 173.61 million) which was equivalent to MNT 370,983 million at the offi cial foreign exchange rate as of 31 December 2011 (Note 2). This amount represents IMF’s holdings of Mongolia’s currency and include promissory notes issued in settlement of quota as described above (SDR 50.96 million, which was equivalent to MNT 108,901 million as of 31 December 2011) and holdings arising from use of IMF credit, i.e. promissory notes issued in settlement of purchase of IMF funds under Stand-by arrangement (SDR 122.64 million, which was equivalent to MNT 262,082 million as of 31 December 2011).
The stand-by arrangement represent loans granted to Mongolia by IMF under the stabilization economic programme and bear interest at SDR rate increased by 1% p.a. These loans are disbursed under an 18 month arrangement, subject to monitoring of performance criteria and completion of programme reviews. The loans and repayments are denominated in Special Drawing Rights (“SDR”). Total approved amount of the stand-by arrangement loan is SDR 153.3 million, out of which SDR 122.64 million has been drawn as of 31 December 2011 (2010: SDR 122.64 million), which is equivalent to MNT 262,082 million as of 31 December 2011. The arrangement was approved on 1 April 2009 and expired on 1 October 2010.
Loans received under the Poverty Reduction and Growth Facility (“PRGF” or formerly known as Enhanced Structural Adjustment Facility) are loans granted by the IMF to the Government of Mongolia with a maturity period of 10 years and bear interest at the rate of 0.5% (2010: 0.5%) p.a. These loans are disbursed under a three-year arrangement, subject to monitoring of performance criteria and completion of programme reviews. The loans and repayments are denominated in SDRs. These loans represent an obligation of the Ministry of Finance, which acts as fi scal agent of Mongolia. These loans amounted to SDR 3.26 million as of 31 December 2011, which is equivalent to MNT 6,967 million based on the offi cial foreign exchange rate as of 31 December 2011.

125ANNUAL REPORT 2011
Bank of MongoliaNotes to the Financial Statements
31 December 2011
27. Contingencies and Commitments (Continued)
Credit related commitments. The Bank enters into certain credit related commitments, which are deemed to be of importance for the country (e.g. exporting goods and/or services) and/or when such arrangements are requested by the Government of Mongolia or its institutions. The primary purpose of these instruments is to ensure that funds are available to the Government or other relevant parties in these arrangements as required.
Issued letters of credit represent irrevocable assurances that the Bank will make payments in the event that the party requesting this arrangement cannot meet its obligations to third parties and carry the same credit risk as loans. Commitments to extend credit represent unused portions of authorisations to extend credit in the form of loans or letters of credit. With respect to credit risk on commitments to extend credit, the Bank is potentially exposed to loss in an amount equal to the total unused commitments. However, the likely amount of loss is less than the total unused commitments due to low counterparty risk, as outlined below. Outstanding credit related commitments are as follows:
In millions of Mongolian Tugriks31 December
201131 December
2010
Undrawn credit lines - People’s Bank of China 554,075 -Export letters of credit 73,688 66,603
Total credit related commitments 627,763 66,603
The Bank has entered into “Chinese Yuan / Mongolian Tugrug Bilateral Currency Swap Arrangement between the People’s Bank of China and the Bank of Mongolia” in May 2011. Both central banks agreed to establish a bilateral currency swap arrangement for the purpose of promoting bilateral trade for economic development of the two countries, and providing short-term liquidity for stabilization of fi nancial markets.
Based on the agreement, the People’s Bank of China (PBoC) and BOM may, from time to time, conduct transactions involving the purchase and sale, and subsequent repurchase and resale, of CNY (Chinese Yuan) against MNT and of MNT against CNY. For these purposes, each central bank has opened a special non-interest bearing account in its national (home) currency for the other party: PBoC has opened account for BOM in CNY while the BOM opened an account in MNT.
Central banks can use this money for fi nancing trade between the two countries, for providing short-term liquidity for stabilization of fi nancial markets, and for other purposes agreed upon by both parties. Based on the agreement, the period of use of funds (i.e. usage period) can be three or six months. Each usage is made upon the request of one bank and approval of the other bank. The maximum amounts requested for use are limited to the opened limit of CNY 5 billion when BOM is the requesting party and MNT 1 trillion when PBoC is the requesting party. The bank using funds is obliged to pay interest for the used amount on the date of repayment at interest rates specifi ed by the Agreement. In the case of BOM requests for use of CNY, the interest rate is equivalent to 200 basis points plus the Shanghai Interbank Offered Rate (“SHIBOR”) for CNY deposits with corresponding usage period. In the case PBoC requests for use of MNT, the interest rate is equivalent to the Interbank MNT Weighted Rate with corresponding usage period.
As of 31 December 2011, BOM has made an initial purchase of CNY funds of CNY 2.5 billion and sale of MNT to PBoC in the equivalent amount. Thus, its special account with PBoC was debited by this amount, which can be further used if requests for usage of funds are submitted to and approved by PBoC. No requests for usage of funds were made during 2011. Given that initial purchase represents opening of credit limit which can be used upon further requests, the related amount of CNY 2.5 billion (MNT 554,075 million) represents the Bank’s credit related commitment as of 31 December 2011.
During the fi rst quarter of 2012, the Bank has requested fi rst usage. Further, credit limit was increased based on bilateral agreement. Refer to Note 33.

126 ANNUAL REPORT 2011
Bank of MongoliaNotes to the Financial Statements
31 December 2011
27. Contingencies and Commitments (Continued)
Export letters of credit are mainly issued to the Government of Mongolia with regard to export arrangements. Further, the recorded amount also includes letters of credit subject to the litigations that are currently held in the Swiss, German and US courts, as disclosed in these fi nancial statements. The Bank has recognised provision for material losses that could be incurred with regard to these legal proceedings (Note 20).
The Bank’s management believes that fair value of letters of credit and credit line commitments is not material as of 31 December 2011 and 31 December 2010, apart from the recognised provision for litigation related to letters of credit. The total outstanding contractual amount of undrawn credit lines and letters of credit does not necessarily represent future cash requirements, as these fi nancial instruments may expire or terminate without being funded.
28. Financial Risk Management
Risk is inherent in the Bank’s activity, however it is managed through a process of ongoing identifi cation, measurement and monitoring, subject to risk limits and other controls. This process of risk management is critical to the Bank’s management to pursue its monetary policy (including control of infl ation), fi nancial stability and business continuity of Mongolian banking operations. At certain times, the Bank may be overly exposed to certain risks and/or take disadvantageous positions of fulfi lling its primary objectives and responsibilities, which are typical for central banks and consequently the Bank may incur unexpected fi nancial losses, e.g. losses from translation of foreign currency balances. Such fi nancial losses could be incurred with regard to all fi nancial risks.
From the fi nancial point of view, the Bank is exposed to credit risk, liquidity risk and market risk. In addition, it is also subjected to operational, reputation and legal risks. Currently, the Bank has a decentralized risk management process. Each department is responsible for the independent control of risks, including monitoring the risk of exposures against their activities. Those risks which are unique to the Bank as the central bank in Mongolia are monitored through the Bank’s strategic planning process. In addition, the Bank actively explores the possibility of setting up a Risk Committee which would have the overall responsibility for the development of the risk strategy and implementing principles, frameworks, policies and limits, as well as for making relevant decisions related to monitoring and managing risks. At present, the Investment Committee is responsible for development of risk strategy and making decisions on relevant limits, while the Risk Management Unit and International Economic Department are in charge of implementing principles, frameworks, policies and limits.
Risk Management Structure. The Board of Directors is ultimately responsible for identifying and controlling risks; however, there are separate independent bodies responsible for managing and monitoring risks.
Board of Directors. The Board of Directors is responsible for the overall risk management approach and for approving the risk strategies and principles. Further, it provides recommendations on risk management related issues to the Governor and the First Deputy Governor of the Bank.
Supervisory Board. The Supervisory Board has been established outside of the Bank’s internal organization in order to maintain an external supervisory role and has the responsibility to monitor the overall risk process within the Bank.
Investment Committee. The Investment Committee is a key body responsible for risk management in the Bank. As such, the Committee is responsible for offering recommendations on the area of risk management policy to the Governor and the Board of Directors. It consists of the First Deputy Governor, Deputy Governor, Director of Risk Management Unit, Director of International Economic Department and Director of Payment and Accounting Department.
The Investment Committee approves the “Annual Investment Policy” and determines acceptable levels of risk. Based on the acceptable risk, the Investment Committee proposes the structure of the State foreign currency reserve for the Governor’s approval. The Committee’s proposal defi nes the currency composition of foreign currency reserves and its acceptable variation, asset allocation and its acceptable variance, duration of investments, eligible instruments, counterparties and the counterparty limits. Limits over the foreign currency reserve are approved by the Governor on a quarterly basis and represent the key method used in managing foreign currency risk, as well as credit risk, liquidity risk and interest rate risk.

127ANNUAL REPORT 2011
Bank of MongoliaNotes to the Financial Statements
31 December 2011
28. Financial Risk Management (Continued)
The risks related to the Bank’s foreign currency assets (reserves) are a key area of focus, given the proportion of foreign currency reserves in the Bank’s total assets. Thus, the activities of the Investment Committees and departments involved in the risk management process are mainly focused on monitoring and managing risks related to foreign currency reserves. However, the Investment Committee is also responsible for monitoring the activities of the Risk Management Unit and other responsible departments which address fi nancial risks related to the Bank’s fi nancial assets and liabilities, and overall compliance with the Bank’s investment policy. The methods used in managing fi nancial risks are further outlined below. Risk management unit. The Risk Management Unit ("RMU") is responsible for implementing and maintaining foreign exchange reserve management and other risk related procedures to ensure an independent control process. RMU is responsible for monitoring compliance with strategic benchmark for foreign exchange reserve management, risk principles, policies and limits. In addition, RMU also ensures the complete capture of risk measures related to the foreign exchange reserves and reporting system.According to the Regulation on State Foreign Exchange Reserve Management, the objectives of reserve management are subordinated to the Bank’s monetary and foreign exchange policies. The main objectives in holding foreign reserves are to:
• Support monetary policy;• Control excessive volatility of the foreign exchange market;• Guarantee payment of government foreign exchange debt;• Use as a liquidity buffer in the event of national disaster or emergency.
Risk management of foreign reserves contributes to these objectives by strategically managing and controlling the exposure to fi nancial and operational risks. The Bank determines strategy for asset selection and allocation to control exposures to external risks. This involves establishing parameters for the currency holding and composition necessary to maintain the ready availability of convertible currencies, the permissible range of investment instruments that meet liquidity and security requirements, and duration requirements for limiting exposure to interest rate risk.International Economic Department. International Economic Department is responsible for general implementation of the investment policy through its specifi c units. The Director of International Economic Department monitors and manages the general structure of the asset portfolio, including asset composition, instruments, counterparties, maturity, as well as limits over the foreign currency reserve.Internal Audit. The Bank’s internal audit mission is to examine and evaluate the adequacy and effectiveness of the risk management system in its activities toward the accomplishment of the Bank's objectives, and fulfi lment of policies and plans. Internal Audit Department ("IAD") charter determines its duties to examine the effectiveness of all levels of risk management in planning, organization, coordination and controlling the implementation of the policies and procedures adopted by the Bank, examining the compliance of operations and systems with laws, regulations as well as integrity, and security of fi nancial and operational information. IAD carries out general risk assessment and further assessment focused on specifi c issues.. General risk assessment is undertaken during the development of long-term and annual audit plans to ensure proper allocation of audit resources according to the degree of risk, while assessment focuses on particular issues at the specifi c level. IAD of the Bank has carried out activities in accordance with long-term audit program for 2007-2011 and annual audit plan for 2011. Priorities for audits are determined by applying criteria which refl ect potential and actual degree of risk to which each area of operation is exposed. For these purposes certain criteria are developed and appropriate weights are assigned to each type of criteria in relation to the activities audited. The weighted scores are totalled for each operational area and the degree of risk is classifi ed as high, medium and low accordingly.The evaluation of internal control system is also a very important aspect of internal audit work. The evaluation is aimed at ensuring the existence of adequate procedures and competent performance, as well as reliability of fi nancial reporting system and compliance of all activities with applicable laws and regulations. IAD reports about fi ndings and its recommendations administratively to the Governor, and functionally to the Supervisory Board. After each assessment, IAD discusses the results with management of the Bank, as well as undertaking follow-up reviews on the actions taken by management.

128 ANNUAL REPORT 2011
Bank of MongoliaNotes to the Financial Statements
31 December 2011
28. Financial Risk Management (Continued)
Credit Risk. Credit risk is the risk that the Bank will incur a loss because its customers, clients or counterparties failed to discharge their contractual obligations. Exposure to credit risk results from the Bank’s lending and other transactions with counterparties, which give rise to fi nancial assets. Credit risk is managed and controlled through proper selection of investment assets, credit quality of investment assets and setting limits on the amount of investment per investment asset. Limits on the level of credit risk by type of investment and counterparty are approved regularly by management. Such risks are monitored on a revolving basis and subject to an annual or more frequent review.
The credit quality of the Bank’s fi nancial assets is primarily monitored based on the assigned ratings of international rating agencies, including country ratings if related foreign institution (such as central bank) is not individually rated. The Bank has fully suspended trading with certain parties without considering their ratings due to instability of international fi nancial markets, which could lead to a system risk, if counterparty risk is not properly addressed.
In order to minimize credit risk, foreign exchange reserves are invested in securities issued by the AAA- rated Governments (i.e. central banks) and international institutions. The credit risk on foreign currency deposits and money market instruments is limited by transacting with counterparties rated “AA-” or above by internationally recognized rating agencies. The minimum rating is taken when a counterparty has ratings from more than one rating agency.
For domestic monetary policy operations, the Bank actively uses collateral to reduce its exposure to credit risk. According to the Regulation on Central Bank Refi nancing, the main types of collateral used when fi nancial instruments are issued to Mongolian commercial banks are as follows:
1. Central Bank bills;2. Short-term government securities;3. Government securities issued by the OECD members and accepted by the Bank;4. Liquid securities of AAA rating issued by recognized foreign fi nancial institution;5. Promissory notes of fi nancial institutions accepted by the Bank;6. Time deposits at the Bank and foreign banks.
The eligible borrowing banks have to meet all prudential ratios set by the Bank. If the borrowing local bank breaches one of the prudential ratios, the Bank terminates the refi nancing operation in order to limit total exposure to the borrowing bank.
Given that the biggest Mongolian commercial banks are rated by international rating agencies, fi nancial assets due from local banks are also monitored on this basis. In case of unrated Mongolian commercial bank, the Bank considers fi nancial conditions of related commercial bank based on the recent fi nancial information, compliance with prudential ratios, and other information available by the Banking Supervision Department and other relevant departments for assessing credit quality of related assets. At present, the Bank does not use internal credit rating systems for assessing credit quality of fi nancial assets due from commercial banks.
In addition, all counterparties have credit limits, which are set taking into consideration their ratings, capital, and other factors. The credit limits are set quarterly by the Investment Committee and compliance with the limits is monitored daily. In order to monitor its credit risk, the Bank also monitors the aging of its fi nancial assets, particularly loans to commercial banks and other fi nancial assets (refer to Notes 13 and 15). Any signifi cant exposures against customers with deteriorating creditworthiness are reported to and reviewed by the Board of Directors, which also makes decisions on necessary actions.

129ANNUAL REPORT 2011
Bank of MongoliaNotes to the Financial Statements
31 December 2011
28. Financial Risk Management (Continued)
As disclosed in Note 27, the Bank enters into certain credit related commitments, which are deemed to be of importance for the country (e.g. exporting goods and/or services) and/or when such arrangements are requested by the Government of Mongolia or its institutions. The primary purpose of these instruments is to ensure that funds are available to the Government or other relevant parties in these arrangements as required. Issued letters of credit represent irrevocable assurances that the Bank will make payments in the event that the party requesting this arrangement cannot meet its obligations to third parties and expose the Bank to similar risks to loans, which are mitigated by the same control processes and policies. Commitments to extend credit represent unused portions of authorisations to extend credit and relate to the arrangement with the People’s Bank of China (Note 27). Based on analysis performed, the Bank’s management believes that counterparty risk in case of this arrangement is low.
The Bank’s maximum exposure to credit risk is refl ected in the carrying amounts of monetary fi nancial assets in the statement of fi nancial position. The credit risk is mitigated by collateral as disclosed in Note 10 and 13. For letters of credit and commitments to extend credit, the maximum exposure to credit risk is the amount of the commitment (Note 27).
Market risk. Market risk is the risk that the fair value or future cash fl ows of fi nancial instruments will fl uctuate due to changes in market variables such as interest rates or foreign exchange rates. When assessing market risk, as well as liquidity risk, management’s main considerations also include intervention needs, structure of the import and current liabilities to foreign parties. The Bank manages and monitors this risk element using sensitivity analyses. Except for the concentrations within foreign currencies, the Bank has no signifi cant concentration of market risk. The Bank is not signifi cantly exposed to other price risk.
Currency risk. Currency risk is the risk that the value of a fi nancial investment will fl uctuate due to changes in foreign exchange rates. Currency risk is managed through diversifi cation of foreign currency portfolio and determination of the below parameters:
foreign currencies subject to management; maximum share of the managed currency in related assets denominated in foreign currencies for foreign currency
reserve and short-term and long-term investment portfolio.
Limits over the foreign currency reserve are approved by Governor on quarterly basis, based on the proposal of Investment Committee. The proposed limits are based on the “Annual Investment Policy”, which defi nes acceptable levels of risk.
Positions are monitored on a daily basis to ensure positions are maintained within established limits. A method of value-at-risk (VaR) is applied to assess the currency risk. RMU assesses the 10-day VaR at 99% confi dence level on daily basis and reports to management. Further, sensitivity analysis is used.
The following table indicates the currencies and SDRs to which the Bank had signifi cant exposure at 31 December 2011 and 31 December 2010 on its monetary assets and liabilities.

130 ANNUAL REPORT 2011
Bank of MongoliaNotes to the Financial Statements
31 December 2011
28. Financial Risk Management (Continued)
In millions of Mongolian Tugriks Monetary fi nancial assets
Monetary fi nancial liabilities
Net balance sheet position
2011
US Dollars 2,504,922 (556,915) 1,948,007Mongolian Tugriks 493,691 (3,116,908) (2,623,217)Euros 507,486 (104,728) 402,758SDRs 97,153 (111,530) (14,377)Other 72,559 (7,629) 64,930
Total 3,675,811 (3,897,710) (221,899)
2010
US Dollars 2,223,740 (690,663) 1,533,077Mongolian Tugriks 177,473 (2,339,887) (2,162,414)Euros 388,736 (70,969) 317,767SDRs 90,983 (100,711) (9,728)Other 62,391 (5,763) 56,628
Total 2,943,323 (3,207,993) (264,670)
The following table presents sensitivities of profi t or loss and equity to reasonably possible changes in exchange rates of foreign currencies and SDRs applied at the end of the reporting period relative to the functional currency of the Bank, with all other variables held constant. A negative amount in the table refl ects a potential net reduction in profi t or loss while a positive amount refl ects a net potential increase.
In millions of Mongolian Tugriks At 31 December 2011 Impact on profi t or loss
At 31 December 2010 Impact on profi t or loss
US Dollars strengthening by 20% 389,601 306,615US Dollars weakening by 20% (389,601) (306,615)Euro strengthening by 20% 80,552 63,553Euro weakening by 20% (80,552) (63,553)SDRs strengthening by 20% (2,875) (1,946)SDRs weakening by 20% 2,875 1,946Other strengthening by 20% 12,986 11,326Other weakening by 20% (12,986) (11,326)
The exposure was calculated only for monetary balances denominated in currencies other than the functional currency of the Bank and monetary balances denominated in SDRs.
Interest rate risk. Interest rate risk arises from the possibility that changes in interest rates will affect future cash fl ows or the fair values of fi nancial instruments. The main objective when managing the interest rate risk is to maintain stable return on investments while not exceeding the risk levels that can be undertaken per investment policies.
Assets and liabilities of the Bank are predominantly fi xed rate, which signifi cantly reduces exposure to interest rate risk. Further, in strategic benchmark development process the Bank sets duration requirements for its foreign reserve portfolio in order to limit exposure to interest rate risk. The duration requirement is monitored on a daily basis. The duration of the investment is assessed through the application of horizon analysis. The Bank uses a one-year investment horizon, defi ned negative return as minimum return and up to 5% of acceptable variance of negative return for calculation of prudential duration.

131ANNUAL REPORT 2011
Bank of MongoliaNotes to the Financial Statements
31 December 2011
28. Financial Risk Management (Continued)
The table below summarises the Bank’s exposure to interest rate risks. The table presents the aggregated amounts of the Bank’s fi nancial assets and liabilities at carrying amounts, categorised by the earlier of contractual interest repricing or maturity dates:
In millions of Mongolian Tugriks
Demand and less than
1 month
From 1 to 6 months
From 6 to 12 months
Over 12 months
Total interest bearing
Non-interest bearing Total
31 December 2011Total fi nancial assets 1,119,330 2,043,754 1,114 266,387 3,430,585 248,570 3,679,155Total fi nancial liabilities (582,302) (259,826) (36,953) (27,511) (906,592) (2,991,118) (3,897,710) Net interest sensitivity gap at 31 December 2011
537,028 1,783,928 (35,839) 238,876 2,523,993 (2,742,548) (218,555)
31 December 2010Total fi nancial assets 1,651,357 951,142 - 183,435 2,785,934 160,723 2,946,657Total fi nancial liabilities (336,498) (656,496) (321,603) (19,426) (1,334,023) (1,873,970) (3,207,993) Net interest sensitivity gap at 31 December 2010
1,314,859 294,646 (321,603) 164,009 1,451,911 (1,713,247) (261,336)
Management believes that the Bank’s exposure to interest rate risk is not signifi cant given that all interest bearing assets and liabilities are at fi xed interest rates, apart from SDR holdings (Note 7), SDR allocation and loan from HSBC (Note 19). Therefore, the fi nancial result for 2011 and 2010 is not signifi cantly affected by the changes in interest rates, as net interest sensitivity gap arising from interest bearing assets and liabilities at variable interest rates is not signifi cant. Further, the value of fi nancial investments available for sale would not be signifi cantly affected by the changes in market interest rates.
The Bank monitors interest rates for its fi nancial instruments. The table below summarises interest rates at the respective reporting date based on reports reviewed by key management personnel. For quoted securities, the interest rates represent yields to maturity based on market quotations at the reporting date.
2011 2010In % p.a. MNT USD EURO Other MNT USD EURO Other
AssetsDue from foreign fi nancial institutions - 0.16% 0.33% 0.56% - 0.28% 0.62% 0.46%Financial investments available-for-sale - 0.28% - - - 0.18% 0.57% -Financial investments - held to maturity - - - - - 0.18% - -Reverse repurchase agreements - 0.12% - - - 0.29% - -Government securities 8.97% - - - 3.77% - - -Loans to local banks 16.20% 5.50% 1.25% - 10.30% 5.50% 1.25% -
LiabilitiesCentral bank bills 12.25% - - - 11.00% - - -Liabilities due to government organizations - 3.00% 0.75% 1.28% - 3.00% 0.75% 1.28%
Liabilities due to foreign parties - - - 1.35% - - - 1.35%
The sign “-“ in the table above means that the Bank does not have the respective assets or liabilities in the corresponding currency.

132 ANNUAL REPORT 2011
Bank of MongoliaNotes to the Financial Statements
31 December 2011
28. Financial Risk Management (Continued)
Geographical risk concentrations. The geographical concentration of the Bank’s fi nancial assets and liabilities at 31 December 2011 is set out below:
In millions of Mongolian Tugriks Mongolia OECD IMF Non-OECD Total
AssetsCash in hand 44,505 - - - 44,505Due from foreign fi nancial institutions - 2,147,427 97,153 - 2,244,580Financial investments available-for-sale 490 209,456 - 2,594 212,540Reverse repurchase agreements - 678,496 - - 678,496Government securities 155,276 - - - 155,276Loans to local banks 340,581 - - - 340,581Other fi nancial assets 3,177 - - - 3,177
Total fi nancial assets 544,029 3,035,379 97,153 2,594 3,679,155
LiabilitiesCash in circulation 713,351 - - - 713,351Central bank bills 879,113 - - - 879,113Liabilities due to government organizations 1,170,890 - - - 1,170,890Deposits from local banks 1,015,230 - - - 1,015,230Liabilities due to foreign parties - 1,218 104,194 - 105,412Other fi nancial liabilities 13,714 - - - 13,714
Total fi nancial liabilities 3,792,298 1,218 104,194 - 3,897,710
Net balance sheet position as 31 December 2011 (3,248,269) 3,034,161 (7,041) 2,594 (218,555)
Credit related commitments (Note 27) 73,688 - - 554,075 627,763

133ANNUAL REPORT 2011
Bank of MongoliaNotes to the Financial Statements
31 December 2011
28. Financial Risk Management (Continued)
The geographical concentration of the Bank’s fi nancial assets and liabilities at 31 December 2010 is set out below:
In millions of Mongolian Tugriks Mongolia OECD IMF Non-OECD Total
AssetsCash in hand 14,609 - - - 14,609Due from foreign fi nancial institutions - 1,006,273 90,983 - 1,097,256Financial investments available-for-sale 490 1,084,291 - 2,594 1,087,375Financial investments - held to maturity - 72,702 - - 72,702Reverse repurchase agreements - 491,280 - - 491,280Government Securities 53,044 - - - 53,044Loans to local banks 130,391 - - - 130,391
Total fi nancial assets 198,534 2,654,546 90,983 2,594 2,946,657
LiabilitiesCash in circulation 519,692 - - - 519,692Central bank bills 1,100,997 - - - 1,100,997Liabilities due to government organizations 822,381 - - - 822,381Deposits from local banks 640,730 - - - 640,730Liabilities due to foreign parties - 1,309 93,926 - 95,235Other fi nancial liabilities 28,958 - - - 28,958
Total fi nancial liabilities 3,112,758 1,309 93,926 - 3,207,993
Net balance sheet position as 31 December 2010 (2,914,224) 2,653,237 (2,943) 2,594 (261,336)
Credit related commitments (Note 27) 66,603 - - - 66,603
Other risk concentrations. Management monitors concentrations of credit risk through obtaining reports listing exposures to borrowers per counterparty limits, which are disclosed above. The Bank did not have any such signifi cant risk concentrations as of 31 December 2011 and 31 December 2010.
Liquidity risk. Liquidity risk is the risk that the Bank will be unable to meet its payment obligations when they fall due under normal and stress circumstances. Liquidity risk of foreign currency is the main area of risk faced by the Bank. With respect to the classical investment triad (safety–liquidity-return), the investment policy of the Bank is maximizing returns which ought to be considered only if all the liquidity and safety requirements are met. In circumstances of high import dependence, constant supply requirement of Government external debt servicing, volatility of demand and supply of foreign exchange in the domestic market, liquidity is the most important concern of foreign exchange reserve management. In order to manage liquidity risk, the Bank divided its foreign reserve portfolio into two sub-portfolios:
The Short-term Investment Portfolio (including the cash management or liquidity portfolio): This portfolio is used for purposes of debt servicing and smooth functioning of the foreign exchange market. It consists of cash, overnights and demand deposits. It is also invested in time deposits, highly liquid money market instruments (commercial papers) and securities ranging from a week to twelve month maturity and commodities (monetary gold).
The Long-term Investment Portfolio: This portfolio is invested in medium to long-term high liquid instruments including government bonds and securities.
The Investment Committee proposes the limits for foreign exchange portfolio. In order to minimize the liquidity risk, the following asset structure is followed in accordance with the regulation on State Foreign Exchange Reserve Management:
Not less than 10% of total assets with short-term maturity (i.e. maturity up to 1 year) shall be placed as current accounts and cash in foreign currency;
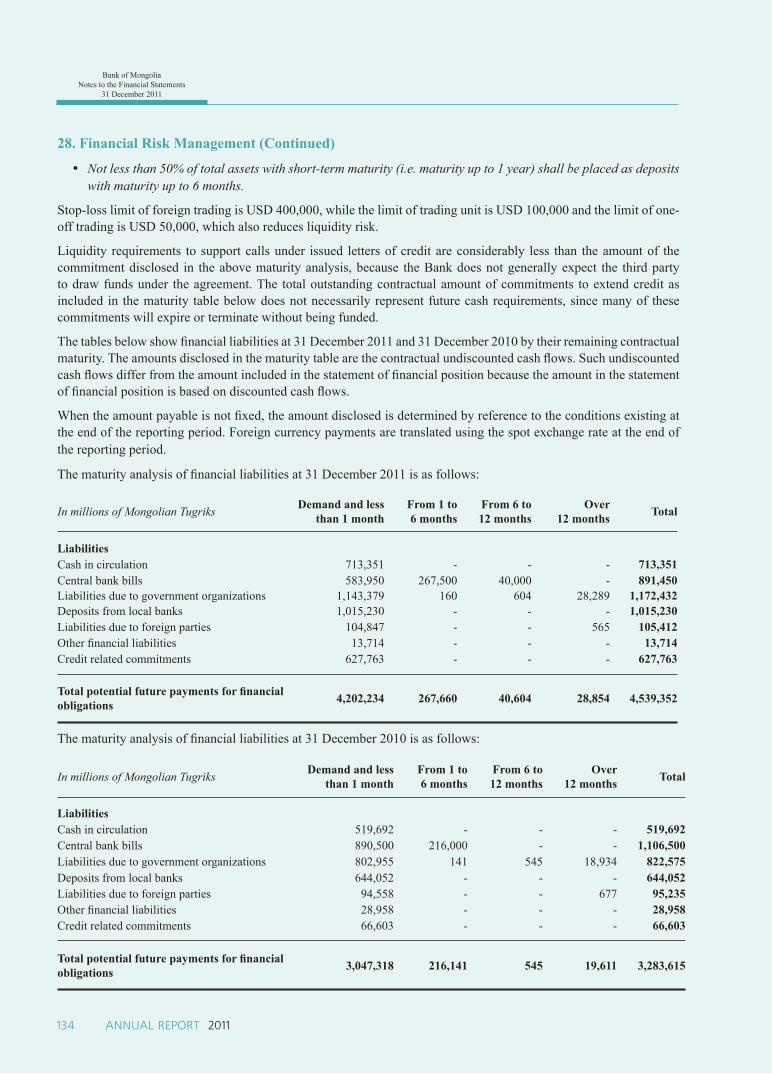
134 ANNUAL REPORT 2011
Bank of MongoliaNotes to the Financial Statements
31 December 2011
28. Financial Risk Management (Continued)
Not less than 50% of total assets with short-term maturity (i.e. maturity up to 1 year) shall be placed as deposits with maturity up to 6 months.
Stop-loss limit of foreign trading is USD 400,000, while the limit of trading unit is USD 100,000 and the limit of one-off trading is USD 50,000, which also reduces liquidity risk.
Liquidity requirements to support calls under issued letters of credit are considerably less than the amount of the commitment disclosed in the above maturity analysis, because the Bank does not generally expect the third party to draw funds under the agreement. The total outstanding contractual amount of commitments to extend credit as included in the maturity table below does not necessarily represent future cash requirements, since many of these commitments will expire or terminate without being funded.
The tables below show fi nancial liabilities at 31 December 2011 and 31 December 2010 by their remaining contractual maturity. The amounts disclosed in the maturity table are the contractual undiscounted cash fl ows. Such undiscounted cash fl ows differ from the amount included in the statement of fi nancial position because the amount in the statement of fi nancial position is based on discounted cash fl ows.
When the amount payable is not fi xed, the amount disclosed is determined by reference to the conditions existing at the end of the reporting period. Foreign currency payments are translated using the spot exchange rate at the end of the reporting period.
The maturity analysis of fi nancial liabilities at 31 December 2011 is as follows:
In millions of Mongolian Tugriks Demand and less than 1 month
From 1 to 6 months
From 6 to 12 months
Over 12 months Total
LiabilitiesCash in circulation 713,351 - - - 713,351Central bank bills 583,950 267,500 40,000 - 891,450Liabilities due to government organizations 1,143,379 160 604 28,289 1,172,432Deposits from local banks 1,015,230 - - - 1,015,230Liabilities due to foreign parties 104,847 - - 565 105,412Other fi nancial liabilities 13,714 - - - 13,714Credit related commitments 627,763 - - - 627,763
Total potential future payments for fi nancial obligations 4,202,234 267,660 40,604 28,854 4,539,352
The maturity analysis of fi nancial liabilities at 31 December 2010 is as follows:
In millions of Mongolian Tugriks Demand and less than 1 month
From 1 to 6 months
From 6 to 12 months
Over 12 months Total
LiabilitiesCash in circulation 519,692 - - - 519,692Central bank bills 890,500 216,000 - - 1,106,500Liabilities due to government organizations 802,955 141 545 18,934 822,575Deposits from local banks 644,052 - - - 644,052Liabilities due to foreign parties 94,558 - - 677 95,235Other fi nancial liabilities 28,958 - - - 28,958Credit related commitments 66,603 - - - 66,603
Total potential future payments for fi nancial obligations 3,047,318 216,141 545 19,611 3,283,615
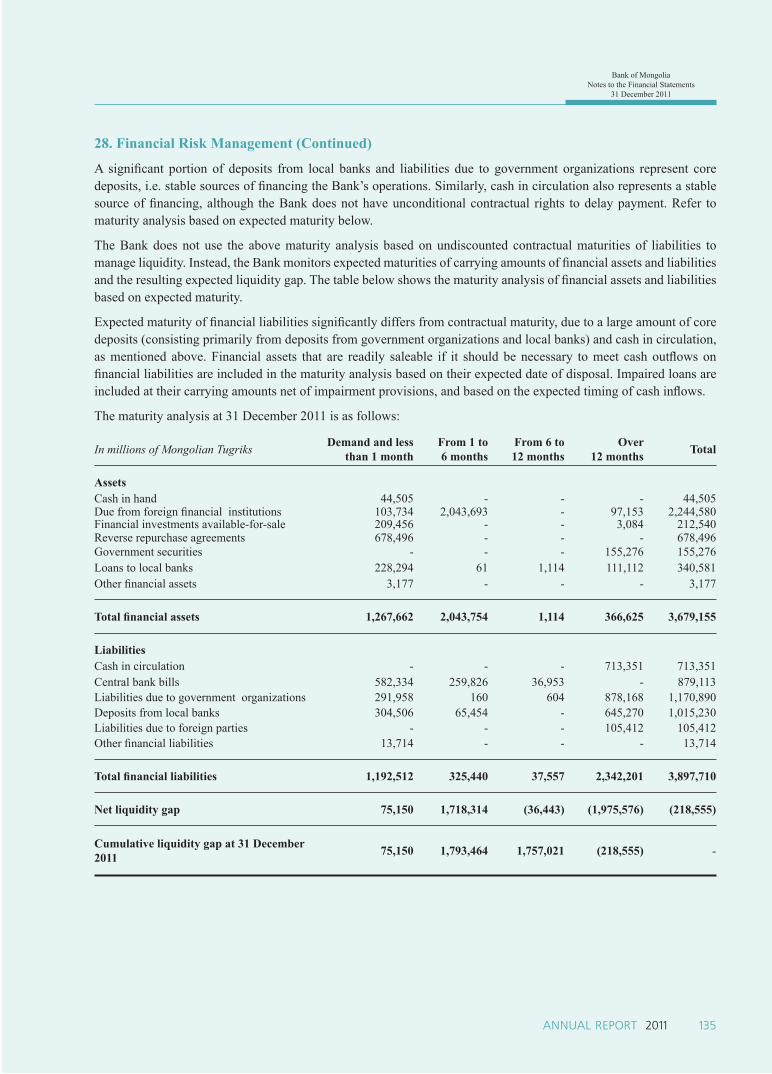
135ANNUAL REPORT 2011
Bank of MongoliaNotes to the Financial Statements
31 December 2011
28. Financial Risk Management (Continued)
A signifi cant portion of deposits from local banks and liabilities due to government organizations represent core deposits, i.e. stable sources of fi nancing the Bank’s operations. Similarly, cash in circulation also represents a stable source of fi nancing, although the Bank does not have unconditional contractual rights to delay payment. Refer to maturity analysis based on expected maturity below.
The Bank does not use the above maturity analysis based on undiscounted contractual maturities of liabilities to manage liquidity. Instead, the Bank monitors expected maturities of carrying amounts of fi nancial assets and liabilities and the resulting expected liquidity gap. The table below shows the maturity analysis of fi nancial assets and liabilities based on expected maturity.
Expected maturity of fi nancial liabilities signifi cantly differs from contractual maturity, due to a large amount of core deposits (consisting primarily from deposits from government organizations and local banks) and cash in circulation, as mentioned above. Financial assets that are readily saleable if it should be necessary to meet cash outfl ows on fi nancial liabilities are included in the maturity analysis based on their expected date of disposal. Impaired loans are included at their carrying amounts net of impairment provisions, and based on the expected timing of cash infl ows.
The maturity analysis at 31 December 2011 is as follows:
In millions of Mongolian Tugriks Demand and less than 1 month
From 1 to 6 months
From 6 to 12 months
Over 12 months Total
AssetsCash in hand 44,505 - - - 44,505Due from foreign fi nancial institutions 103,734 2,043,693 - 97,153 2,244,580Financial investments available-for-sale 209,456 - - 3,084 212,540Reverse repurchase agreements 678,496 - - - 678,496Government securities - - - 155,276 155,276Loans to local banks 228,294 61 1,114 111,112 340,581Other fi nancial assets 3,177 - - - 3,177
Total fi nancial assets 1,267,662 2,043,754 1,114 366,625 3,679,155
LiabilitiesCash in circulation - - - 713,351 713,351Central bank bills 582,334 259,826 36,953 - 879,113Liabilities due to government organizations 291,958 160 604 878,168 1,170,890Deposits from local banks 304,506 65,454 - 645,270 1,015,230Liabilities due to foreign parties - - - 105,412 105,412Other fi nancial liabilities 13,714 - - - 13,714
Total fi nancial liabilities 1,192,512 325,440 37,557 2,342,201 3,897,710
Net liquidity gap 75,150 1,718,314 (36,443) (1,975,576) (218,555)
Cumulative liquidity gap at 31 December 2011 75,150 1,793,464 1,757,021 (218,555) -

136 ANNUAL REPORT 2011
Bank of MongoliaNotes to the Financial Statements
31 December 2011
28. Financial Risk Management (Continued)
The maturity analysis at 31 December 2010 is as follows:
In millions of Mongolian Tugriks Demand and less than 1 month
From 1 to 6 months
From 6 to 12 months
Over 12 months Total
AssetsCash in hand 14,609 - - - 14,609Due from foreign fi nancial institutions 55,131 951,142 - 90,983 1,097,256Financial investments available-for-sale 1,084,291 - - 3,084 1,087,375Financial investments - held to maturity 72,702 - - - 72,702Reverse repurchase agreements 491,280 - - - 491,280Government securities - - - 53,044 53,044Loans to local banks - - - 130,391 130,391
Total fi nancial assets 1,718,013 951,142 - 277,502 2,946,657
LiabilitiesCash in circulation - - - 519,692 519,692Central bank bills 122,898 656,496 321,603 - 1,100,997Liabilities due to government organizations 204,909 141 545 616,786 822,381Deposits from local banks 431,869 27,277 - 181,584 640,730Liabilities due to foreign parties - - - 95,235 95,235Other fi nancial liabilities 28,958 - - - 28,958
Total fi nancial liabilities 788,634 683,914 322,148 1,413,297 3,207,993
Net liquidity gap 929,379 267,228 (322,148) (1,135,795) (261,336) Cumulative liquidity gap at 31 December 2010 929,379 1,196,607 874,459 (261,336) -

137ANNUAL REPORT 2011
Bank of MongoliaNotes to the Financial Statements
31 December 2011
29. Fair Value of Financial Instruments
Fair value is the amount at which a fi nancial instrument could be exchanged in a current transaction between willing parties, other than in a forced sale or liquidation, and is best evidenced by an active quoted market price. Where quoted market prices are not available, the Bank used valuation techniques. The fair value of fl oating rate instruments that are not quoted in an active market was estimated to be equal to their carrying amount. The fair value of unquoted fi xed interest rate instruments was estimated based on estimated future cash fl ows expected to be received discounted at current interest rates for new instruments with similar credit risk and remaining maturity. Fair value of fi nancial instruments carried at amortised cost, which have short term maturities approximates their carrying value.
(a) Fair values of fi nancial instruments carried at amortised cost.
Fair values of fi nancial instruments carried at amortised cost are as follows:
2011 2010
In millions of Mongolian Tugriks Carrying value Fair value Carrying value Fair value
FINANCIAL ASSETS CARRIED AT AMORTISED COSTCash in hand 44,505 44,505 14,609 14,609Due from foreign fi nancial institutions- Short term deposits in foreign currency 2,059,287 2,059,287 958,852 958,852- Demand deposits 87,290 87,290 46,641 46,641- Restricted cash 590 590 530 530- Special drawing rights holdings 97,153 97,153 90,983 90,983- World Bank subscription 256 256 247 247- Other subscriptions 4 4 3 3Financial investments - held to maturity - - 72,702 72,702Reverse repurchase agreements 678,496 678,496 491,280 491,280Government securities 155,276 151,907 53,044 49,068Loans to local banks- Reverse sale and repurchase agreements 223,244 223,244 - -- Loans related to Anod Bank 102,000 102,000 120,000 120,000- Loans in local currency 10,104 10,104 4,464 4,464- Loans in foreign currency 5,233 5,233 5,927 5,927Other fi nancial assets 3,177 3,177 - -
TOTAL FINANCIAL ASSETS CARRIED AT AMORTISED COST 3,466,615 3,463,246 1,859,282 1,855,306
As disclosed in Note 13, management cannot estimate the amount of impairment provision on loans related to Anod Bank due to uncertain timing of cash fl ows. Similarly, fair value of these loans cannot be estimated with suffi cient reliability due to uncertain timing of cash fl ows from the loans and uncertainties affecting the fi nancial effect of collateral. For more details refer to Note 13. For the purposes of this disclosure, management has decided to present fair value in the amount of carrying amount of these loans.

138 ANNUAL REPORT 2011
Bank of MongoliaNotes to the Financial Statements
31 December 2011
29. Fair Value of Financial Instruments (Continued)
2011 2010
In millions of Mongolian Tugriks Carrying value Fair value Carrying
value Fair value
FINANCIAL LIABILITIES CARRIED AT AMORTISED COSTCash in circulation 713,351 713,351 519,692 519,692Central bank bills 879,113 879,113 1,100,997 1,100,997Liabilities due to government organizations
- Liabilities to the Ministry of Finance related to borrowings 20,796 20,796 19,426 19,426
- Current accounts of Ministry of Finance 1,150,094 1,150,094 802,955 802,955Deposits from local banks- Correspondent accounts in national currency 645,501 645,501 181,584 181,584- Correspondent accounts in foreign currency 369,729 369,729 459,146 459,146Liabilities due to foreign parties- Loan from HSBC, London 565 565 677 677- International Monetary Fund ("IMF"): 104,475 104,475 94,205 94,205- Subscription to World Bank 256 256 247 247- Subscription to IDA 34 34 34 34- Current account of WorldBank 77 77 72 72- Current account of ADB 5 5 - -Other fi nancial liabilities- Initial capital contributions for local banks 3,000 3,000 16,700 16,700- Deposits by non-banking entities 4,061 4,061 - -- Other payables 6,653 6,653 12,258 12,258
TOTAL FINANCIAL LIABILITIES CARRIED AT AMORTISED COST 3,897,710 3,897,710 3,207,993 3,207,993
Discount rates used depend on currency, maturity of the instrument and credit risk of the counterparty and were as follows:
In % 2011 2010
FINANCIAL ASSETSDue from foreign fi nancial institutions 0.01% to 0.6% p.a. 0.03% to 0.6% p.a.Financial investments available-for-sale 0.28% to 0.38% p.a. 0.18% to 0.69% p.a.Reverse repurchase agreements 0.12% p.a. 0.29% p.a.Government securities 0.1% to 7.8% p.a. 0.1% to 12.25% p.a.Loans to local banks 1.25% to 5.5% p.a. 1.25% to 16.2% p.a.
FINANCIAL LIABILITIESCentral bank bills 10.41% to 16.25% p.a. 8.5% to 12.94% p.a.Liabilities due to government organizations 0.75% to 3% p.a. 0.75% to 3% p.a.
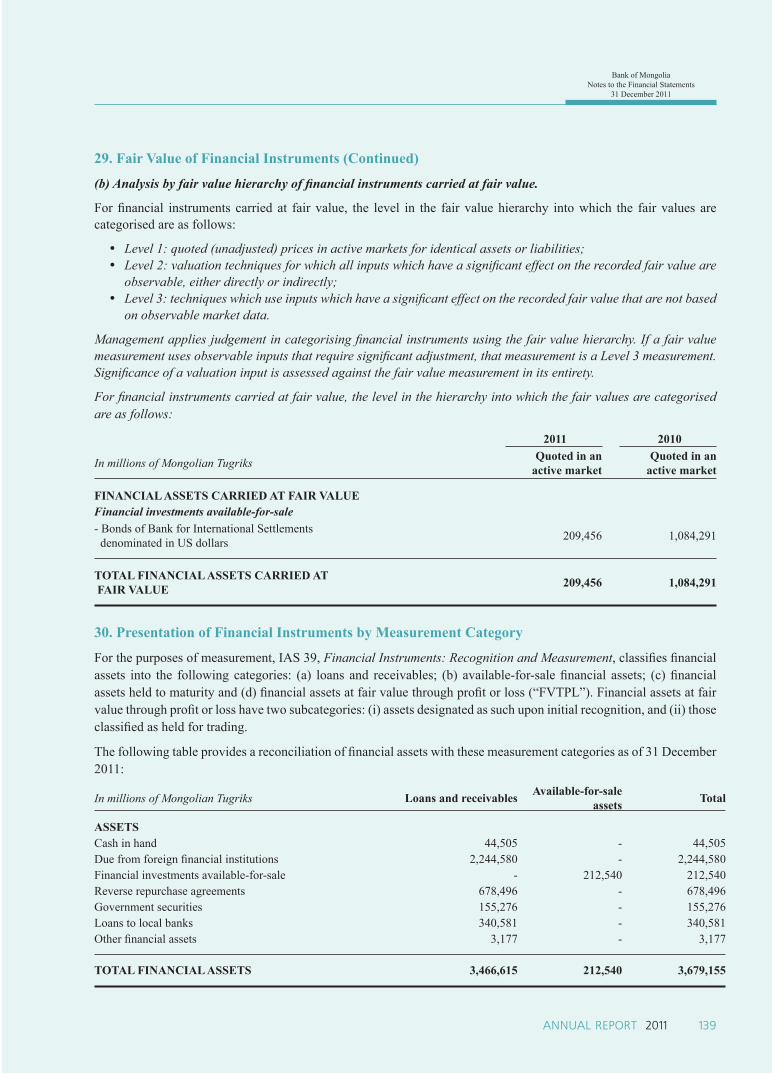
139ANNUAL REPORT 2011
Bank of MongoliaNotes to the Financial Statements
31 December 2011
29. Fair Value of Financial Instruments (Continued)
(b) Analysis by fair value hierarchy of fi nancial instruments carried at fair value.
For fi nancial instruments carried at fair value, the level in the fair value hierarchy into which the fair values are categorised are as follows:
Level 1: quoted (unadjusted) prices in active markets for identical assets or liabilities; Level 2: valuation techniques for which all inputs which have a signifi cant effect on the recorded fair value are
observable, either directly or indirectly; Level 3: techniques which use inputs which have a signifi cant effect on the recorded fair value that are not based
on observable market data.
Management applies judgement in categorising fi nancial instruments using the fair value hierarchy. If a fair value measurement uses observable inputs that require signifi cant adjustment, that measurement is a Level 3 measurement. Signifi cance of a valuation input is assessed against the fair value measurement in its entirety.
For fi nancial instruments carried at fair value, the level in the hierarchy into which the fair values are categorised are as follows:
2011 2010
In millions of Mongolian Tugriks Quoted in an active market
Quoted in an active market
FINANCIAL ASSETS CARRIED AT FAIR VALUEFinancial investments available-for-sale- Bonds of Bank for International Settlements denominated in US dollars 209,456 1,084,291
TOTAL FINANCIAL ASSETS CARRIED AT FAIR VALUE 209,456 1,084,291
30. Presentation of Financial Instruments by Measurement Category
For the purposes of measurement, IAS 39, Financial Instruments: Recognition and Measurement, classifi es fi nancial assets into the following categories: (a) loans and receivables; (b) available-for-sale fi nancial assets; (c) fi nancial assets held to maturity and (d) fi nancial assets at fair value through profi t or loss (“FVTPL”). Financial assets at fair value through profi t or loss have two subcategories: (i) assets designated as such upon initial recognition, and (ii) those classifi ed as held for trading.
The following table provides a reconciliation of fi nancial assets with these measurement categories as of 31 December 2011:
In millions of Mongolian Tugriks Loans and receivables Available-for-sale assets Total
ASSETSCash in hand 44,505 - 44,505Due from foreign fi nancial institutions 2,244,580 - 2,244,580Financial investments available-for-sale - 212,540 212,540Reverse repurchase agreements 678,496 - 678,496Government securities 155,276 - 155,276Loans to local banks 340,581 - 340,581Other fi nancial assets 3,177 - 3,177
TOTAL FINANCIAL ASSETS 3,466,615 212,540 3,679,155

140 ANNUAL REPORT 2011
Bank of MongoliaNotes to the Financial Statements
31 December 2011
30. Presentation of Financial Instruments by Measurement Category (Continued)
The following table provides a reconciliation of fi nancial assets with the measurement categories at 31 December 2010. The amounts below are adjusted for effect of restatements or reclassifi cations.
In millions of Mongolian Tugriks Loans and receivables
Available-for-sale assets
Held to maturity Total
ASSETSCash in hand 14,609 - - 14,609Due from foreign fi nancial institutions 1,097,256 - - 1,097,256Financial investments available-for-sale - 1,087,375 - 1,087,375Financial investments - held to maturity - - 72,702 72,702Reverse repurchase agreements 491,280 - - 491,280Government securities 53,044 - - 53,044Loans to local banks 130,391 - - 130,391
TOTAL FINANCIAL ASSETS 1,786,580 1,087,375 72,702 2,946,657
As of 31 December 2011 and 31 December 2010 all of the Bank’s fi nancial liabilities were carried at amortised cost.
31. Related Party Transactions
Parties are generally considered to be related if the parties are under common control or one party has the ability to control the other party or can exercise signifi cant infl uence over the other party in making fi nancial or operational decisions. In considering each possible related party relationship, attention is directed to the substance of the relationship, not merely the legal form.
As of 31 December 2011 and 31 December 2010, the Bank has disclosed balances and transactions with the following related parties: Government (which includes organizations, such as Ministry of Finance, which management is appointed by the central government) and a local commercial bank State Bank, which is fully owned and controlled by the Government. As disclosed in Notes 3 and 13, the loan to Anod Bank was provided by the Bank of Mongolia on behalf of the Government. Therefore this transaction is considered as related party transaction in accordance with IFRS requirements.
As disclosed in Note 4, the Bank utilised the amendment in IAS 24 on ‘partial exemption from the disclosure requirement for government-related entities’. Thus, individually immaterial transactions with government-related entities were not disclosed in these fi nancial statements.
At 31 December 2011, the outstanding balances with related parties were as follows:
In millions of Mongolian Tugriks Government State Bank
Government securities (contractual interest rate: 0.10% -12.25 % p.a.) 155,276 -Loans to local banks (contractual interest rate: 9.75% p.a.) 102,000 -Other assets 3,177 -Central bank bills (contractual interest rate:12.25 % -16.24% p.a.) 51,173 -Deposits from local banks - 22,489
Liabilities due to government organizations (contractual interest rate: 0.75% - 1.25% p.a.) 1,170,890 -

141ANNUAL REPORT 2011
Bank of MongoliaNotes to the Financial Statements
31 December 2011
31. Related Party Transactions (Continued)
At 31 December 2010, the outstanding balances with related parties were as follows:
In millions of Mongolian Tugriks Government State Bank
Government securities (contractual interest rate: 0.10% - 7.8% p.a.) 53,044 -Loans to local banks (contractual interest rate: 9.75% p.a.) 120,000 -Central bank bills (contractual interest rate: 10.00%-10.9% p.a.) 61,669 -Deposits from local banks - 8,131
Liabilities due to government organizations (contractual interest rate: 0.75% - 1.25% p.a.) 822,381 -
The income and expense items with related parties for the year 2011 were as follows:
In millions of Mongolian Tugriks Government State Bank
Interest income 8,152 -Interest expense 3,841 4,520Commission income - 241
The income and expense items with related parties for the year 2010 were as follows:
In millions of Mongolian Tugriks Government State Bank
Interest income 5,194 -Interest expense 4,199 1,587Commission income - 270
Key management compensation is presented below:
In millions of Mongolian Tugriks 2011 2010
Salaries and wages 276 223Benefi ts in-kind 56 42Social and pension fund contribution 46 40

142 ANNUAL REPORT 2011
Bank of MongoliaNotes to the Financial Statements
31 December 2011
32. Capital Management
The capital of the Bank comprises the residual value of the Bank’s assets after deduction of all its liabilities. The Bank’s objectives when managing capital are to maintain an appropriate level of capital to ensure economic independence of the Bank and ability to perform its functions. The Bank considers total capital under management to be equity shown in the statement of fi nancial position as disclosed in these fi nancial statements.
No external capital requirements exist for the Bank as the central bank. The Law on Central Bank (Bank of Mongolia) defi nes the minimum amount of statutory capital (charter fund) and minimum portion of annual net income which needs to be allocated to the Bank’s equity. As disclosed in Note 21, statutory capital of the Bank was MNT 5,000 thousand (31 December 2010: MNT 5,000 thousand), which represents the minimum amount defi ned by the Law. Also, the Law states that at least 40% of the Bank’s net income has to be allocated to the Bank’s equity, while the remaining amount (i.e. maximum 60% of net income) can be transferred to the State Budget account. Refer to Note 21. The Bank has realised net loss for the year ended 31 December 2010. Thus, no transfers were made to the State Budget during 2011.
Article 38 of the Law stipulates that, if a defi cit of the Central Bank arises, the Parliament shall make a decision whether the Government has to issue securities in order to cover the difference in the amount of the net defi cit. Thus, the Government has no obligation to fund a net defi cit of the Bank. However, issuance of government bonds for covering a defi cit is a possibility which could be used by the Parliament, if covering a defi cit is necessary to enable the Bank to perform its functions and continue its operations.
According to the Article 37 of the Law, the revaluation fund of the Bank should include the following:
differences resulting from the foreign currency revaluation of assets and liabilities that are held in gold and in foreign currency due to fl uctuations of foreign exchange rate of Mongolian Tugrik;
differences resulting from the revaluation of fi xed assets (i.e. buildings).
According to the article 37 of the Law, the differences resulting from the revaluation of foreign currency denominated assets and liabilities and gold should not be included in the determination of net income of the Bank.
As a result, the Bank has established a foreign currency revaluation fund, revaluation reserve for precious metals and revaluation reserve for fi xed assets, refer to Note 21.
33. Events After the End of the Reporting Period
In March 2012, the Bank has signed the Amendment to “Chinese Yuan / Mongolian Tugrug Bilateral Currency Swap Arrangement between the People’s Bank of China and the Bank of Mongolia” (Note 27). Based on this addendum, the limit for purchase and sale of currencies has increased to CNY 10 billion when the Bank is the requesting party and MNT 2 trillion when People’s Bank of China is the requesting party.
Further, based on this agreement, from February 2012 onward the Bank has requested for use and received a total amount of CNY 665 million, which was distributed to Mongolian commercial banks primarily through foreign currency auctions.

Statictical Appendix
143ANNUAL REPORT 2011 143
10STATICTICAL APPENDIX19
9920
0020
0120
0220
0320
0420
0520
0620
0720
0820
0920
1020
111
Rea
l GD
P gr
owth
3.2
1.1
1.0
4.0
5.5
10.6
6.2
8.6
10.2
8.9
-1.3
6.4
17.3
GD
P, c
urre
nt p
rices
, bill
ions
of t
ogro
g92
5.3
1018
.911
15.6
1240
.814
61.2
1910
.925
24.3
3715
.045
99.5
6555
.665
90.6
8414
.510
829.
7Infl a
tion
10.0
8.1
8.0
1.6
4.7
11.0
9.5
6.0
15.1
23.2
1.9
14.3
9.4
Mon
etar
y su
rvey
(bill
ions
of t
ogro
g)
Mon
ey (M
2)22
0.2
258.
833
1.1
470.
170
3.3
847.
011
40.1
1536
.524
01.2
2270
.028
80.0
4680
.064
12.3
Net
fore
ign
asse
ts16
7.5
201.
722
0.2
308.
525
6.3
311.
057
0.2
1131
.813
52.0
683.
515
33.3
2739
.330
67.4
Net
dom
estic
cre
dit
116.
684
.812
9.3
200.
051
4.6
647.
376
9.0
745.
413
29.5
2062
.019
37.9
2430
.042
71.0
Mon
ey (M
2)/G
DP
23.8
25.4
29.7
37.9
48.1
44.3
45.2
41.4
52.2
34.6
43.7
55.6
59.2
Loan
s/G
DP
8.4
6.6
12.1
18.7
30.3
31.8
34.1
32.9
28.9
31.5
29.4
28.9
39.4
Dep
osits
/GD
P11
.49.
112
.117
.624
.927
.027
.526
.832
.420
.428
.232
.835
.9D
epos
its92
.713
4.6
218.
436
3.5
516.
869
3.4
995.
414
89.7
1338
.918
56.4
2756
.238
90.3
Ban
ks' t
otal
loan
s77
.566
.813
5.1
231.
444
2.1
606.
885
9.9
1223
.320
56.1
2635
.626
55.0
3264
.856
41.2
Non
-per
form
ing
loan
s39
.214
.69.
111
.721
.139
.149
.560
.068
.118
8.7
462.
037
4.4
330.
0B
anks
' loa
n ra
te37
.730
.331
.826
.625
.624
.021
.620
.017
.118
.618
.715
.313
.8B
anks
' dep
osit
rate
19.8
13.8
13.2
14.0
14.0
13.2
12.6
13.5
13.4
13.6
212
.910
.710
.5C
BB
ill's
wei
ghte
d av
erag
e ra
te11
.48.
68.
69.
911
.515
.84.
86.
49.
914
.810
.811
.014
.3
Bala
nce
of p
aym
ents
(mill
ions
of U
.S. d
olla
rs)
Expo
rts f
.o.b
454.
253
5.8
523.
252
3.9
627.
387
2.1
1068
.615
45.2
1950
.725
34.5
1885
.428
99.2
4780
.4Im
ports
f.o
.b-5
67.1
676.
069
3.1
752.
882
6.9
901.
010
97.4
1356
.720
03.1
3147
.021
37.7
3277
.965
26.9
Cur
rent
acc
ount
-57.
8-6
9.9
-61.
7-1
05.1
-98.
763
.484
.230
6.3
171.
8-7
21.9
-341
.8-8
86.7
-275
8.6
Cur
rent
acc
ount
/GD
P -6
.4-7
.2-6
.1-9
.4-8
.33.
94.
08.
24.
4-1
3.7
-5.2
-10.
5-2
5.5
Net
inte
rnat
iona
l res
erve
s 15
5.9
190.
920
6.7
225.
912
9.0
163.
629
8.0
687.
397
5.3
637.
211
45.3
2091
.222
57.9
In
wee
ks o
f im
ports
14.3
14.7
15.5
15.6
8.1
9.5
14.2
26.4
25.5
10.6
27.9
33.3
18.0
Togr
og ra
te a
gain
st U
.S. d
olla
r (ye
arly
ave
rage
)10
70.4
1076
.510
97.7
1110
.411
46.5
1185
.412
05.3
1179
.611
70.4
1166
.114
37.9
1355
.912
65.5
Gen
eral
gov
ernm
ent b
udge
t (bi
llion
s of t
ogro
g)
Tota
l rev
enue
and
gra
nt25
4.7
351.
043
9.3
477.
053
5.8
697.
483
1.4
1360
.418
80.5
2156
.419
93.0
3122
.544
00.6
C
urre
nt re
venu
e24
7.8
346.
243
0.0
469.
752
6.4
690.
582
7.2
1354
.118
56.0
2136
.119
65.5
3078
.341
41.3
Tota
l exp
endi
ture
and
net
lend
ing
364.
742
9.7
489.
955
0.5
616.
571
3.8
750.
312
37.0
1653
.024
62.0
2321
.630
80.7
4792
.0
Cur
rent
exp
endi
ture
251.
031
4.1
366.
841
5.3
446.
352
5.9
589.
098
2.3
1317
.817
49.5
1792
.122
56.3
3234
.4O
vera
ll ba
lanc
e-1
09.9
-78.
7-5
0.6
-73.
4-8
0.7
-16.
581
.112
3.4
227.
5-3
05.7
-328
.641
.8-3
91.4
Ove
rall
bala
nce/
GD
P-1
1.9
-7.7
-4.5
-5.9
-5.5
-0.9
3.2
3.3
4.9
-4.7
-5.0
0.50
-3.6
1
1 1Pr
elim
inar
y 2 W
eigh
ted
aver
age
rate
of d
epos
its si
nce
end
of 2
008
Mai
n E
cono
mic
Indi
cato
rs
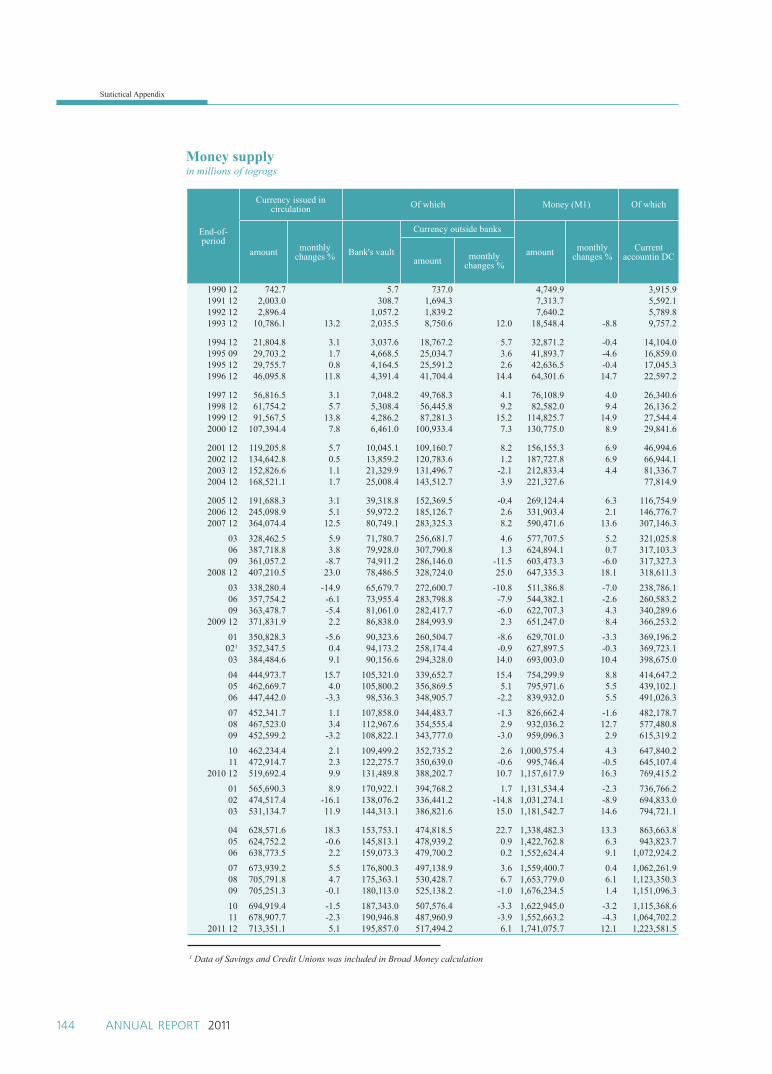
Statictical Appendix
144 ANNUAL REPORT 2011
End-of-period
Currency issued in circulation Of which Money (M1) Of which
amount monthly changes % Bank's vault
Currency outside banks
amount monthly changes %
Current accountin DCamount monthly
changes %
1990 12 742.7 5.7 737.0 4,749.9 3,915.91991 12 2,003.0 308.7 1,694.3 7,313.7 5,592.11992 12 2,896.4 1,057.2 1,839.2 7,640.2 5,789.81993 12 10,786.1 13.2 2,035.5 8,750.6 12.0 18,548.4 -8.8 9,757.2
1994 12 21,804.8 3.1 3,037.6 18,767.2 5.7 32,871.2 -0.4 14,104.01995 09 29,703.2 1.7 4,668.5 25,034.7 3.6 41,893.7 -4.6 16,859.01995 12 29,755.7 0.8 4,164.5 25,591.2 2.6 42,636.5 -0.4 17,045.31996 12 46,095.8 11.8 4,391.4 41,704.4 14.4 64,301.6 14.7 22,597.2
1997 12 56,816.5 3.1 7,048.2 49,768.3 4.1 76,108.9 4.0 26,340.6 1998 12 61,754.2 5.7 5,308.4 56,445.8 9.2 82,582.0 9.4 26,136.21999 12 91,567.5 13.8 4,286.2 87,281.3 15.2 114,825.7 14.9 27,544.42000 12 107,394.4 7.8 6,461.0 100,933.4 7.3 130,775.0 8.9 29,841.6
2001 12 119,205.8 5.7 10,045.1 109,160.7 8.2 156,155.3 6.9 46,994.62002 12 134,642.8 0.5 13,859.2 120,783.6 1.2 187,727.8 6.9 66,944.12003 12 152,826.6 1.1 21,329.9 131,496.7 -2.1 212,833.4 4.4 81,336.72004 12 168,521.1 1.7 25,008.4 143,512.7 3.9 221,327.6 77,814.9
2005 12 191,688.3 3.1 39,318.8 152,369.5 -0.4 269,124.4 6.3 116,754.92006 12 245,098.9 5.1 59,972.2 185,126.7 2.6 331,903.4 2.1 146,776.72007 12 364,074.4 12.5 80,749.1 283,325.3 8.2 590,471.6 13.6 307,146.3
03 328,462.5 5.9 71,780.7 256,681.7 4.6 577,707.5 5.2 321,025.806 387,718.8 3.8 79,928.0 307,790.8 1.3 624,894.1 0.7 317,103.309 361,057.2 -8.7 74,911.2 286,146.0 -11.5 603,473.3 -6.0 317,327.3
2008 12 407,210.5 23.0 78,486.5 328,724.0 25.0 647,335.3 18.1 318,611.3
03 338,280.4 -14.9 65,679.7 272,600.7 -10.8 511,386.8 -7.0 238,786.106 357,754.2 -6.1 73,955.4 283,798.8 -7.9 544,382.1 -2.6 260,583.209 363,478.7 -5.4 81,061.0 282,417.7 -6.0 622,707.3 4.3 340,289.6
2009 12 371,831.9 2.2 86,838.0 284,993.9 2.3 651,247.0 8.4 366,253.2
01 350,828.3 -5.6 90,323.6 260,504.7 -8.6 629,701.0 -3.3 369,196.2021 352,347.5 0.4 94,173.2 258,174.4 -0.9 627,897.5 -0.3 369,723.103 384,484.6 9.1 90,156.6 294,328.0 14.0 693,003.0 10.4 398,675.0
04 444,973.7 15.7 105,321.0 339,652.7 15.4 754,299.9 8.8 414,647.205 462,669.7 4.0 105,800.2 356,869.5 5.1 795,971.6 5.5 439,102.106 447,442.0 -3.3 98,536.3 348,905.7 -2.2 839,932.0 5.5 491,026.3
07 452,341.7 1.1 107,858.0 344,483.7 -1.3 826,662.4 -1.6 482,178.708 467,523.0 3.4 112,967.6 354,555.4 2.9 932,036.2 12.7 577,480.809 452,599.2 -3.2 108,822.1 343,777.0 -3.0 959,096.3 2.9 615,319.2
10 462,234.4 2.1 109,499.2 352,735.2 2.6 1,000,575.4 4.3 647,840.211 472,914.7 2.3 122,275.7 350,639.0 -0.6 995,746.4 -0.5 645,107.4
2010 12 519,692.4 9.9 131,489.8 388,202.7 10.7 1,157,617.9 16.3 769,415.2
01 565,690.3 8.9 170,922.1 394,768.2 1.7 1,131,534.4 -2.3 736,766.202 474,517.4 -16.1 138,076.2 336,441.2 -14.8 1,031,274.1 -8.9 694,833.003 531,134.7 11.9 144,313.1 386,821.6 15.0 1,181,542.7 14.6 794,721.1
04 628,571.6 18.3 153,753.1 474,818.5 22.7 1,338,482.3 13.3 863,663.805 624,752.2 -0.6 145,813.1 478,939.2 0.9 1,422,762.8 6.3 943,823.706 638,773.5 2.2 159,073.3 479,700.2 0.2 1,552,624.4 9.1 1,072,924.2
07 673,939.2 5.5 176,800.3 497,138.9 3.6 1,559,400.7 0.4 1,062,261.908 705,791.8 4.7 175,363.1 530,428.7 6.7 1,653,779.0 6.1 1,123,350.309 705,251.3 -0.1 180,113.0 525,138.2 -1.0 1,676,234.5 1.4 1,151,096.3
10 694,919.4 -1.5 187,343.0 507,576.4 -3.3 1,622,945.0 -3.2 1,115,368.611 678,907.7 -2.3 190,946.8 487,960.9 -3.9 1,552,663.2 -4.3 1,064,702.2
2011 12 713,351.1 5.1 195,857.0 517,494.2 6.1 1,741,075.7 12.1 1,223,581.5
1 Data of Savings and Credit Unions was included in Broad Money calculation
Money supplyin millions of togrogs

Statictical Appendix
145ANNUAL REPORT 2011
Money supplycontinued
End-of-period
Quasi money Of which Money (M2)
amount monthly changes %
Time depositin DC
Of whichTime deposits
in FCCurrent account
in FC amount monthly changes %
Individuals Corporations
1990 12 883.2 726.3 726.3 - 157.0 5,633.11991 12 2,601.1 1,996.9 1,553.3 443.6 604.2 9,914.81992 12 5,412.1 4,430.2 2,985.7 1,444.5 112.5 869.4 13,052.31993 12 24,215.8 10.6 10,103.1 7,969.6 2,133.5 2,378.0 11,734.7 42,764.2 1.2
1994 12 43,905.8 -2.6 28,937.5 25,287.3 3,650.2 3,474.1 11,494.2 76,777.0 -1.71995 09 62,986.3 8.5 38,070.1 35,188.9 2,881.2 11,528.6 13,387.6 104,880.0 2.81995 12 59,408.1 -4.7 38,529.1 36,602.7 1,926.4 8,233.1 12,645.9 102,044.6 -2.91996 12 64,093.7 -4.0 35,164.2 33,819.1 1,345.1 11,006.8 17,922.7 128,395.3 4.5
1997 12 93,956.6 13.0 44,673.8 42,892.7 1,781.1 13,795.6 35,487.2 170,065.5 8.8 1998 12 84,667.6 -0.5 44,840.1 42,044.5 2,795.6 14,468.6 25,358.9 167,249.6 4.21999 12 105,341.3 -1.6 45,052.3 43,257.9 1,794.4 24,925.9 35,363.2 220,167.0 6.32000 12 128,067.7 2.1 59,004.3 54,125.9 4,878.4 33,681.9 35,381.5 258,842.6 5.4
2001 12 174,908.9 3.0 87,590.4 79,321.6 8,268.7 47,017.1 40,301.5 331,064.3 4.82002 12 282,397.8 3.8 147,211.7 137,182.7 10,029.0 71,147.8 64,038.2 470,125.6 5.02003 12 490,499.0 15.8 240,280.1 228,133.5 12,146.6 123,253.9 126,965.0 703,332.4 12.12004 12 625,704.9 -0.2 300,976.4 287,894.4 13,082.0 216,434.0 108,294.5 847,032.4 0.9
2005 12 871,014.4 1.6 426,033.6 399,980.0 26053.6* 245,675.0 199,305.8 1140138.8* 2.72006 12 1,204,590.0 -4.5 692,483.4 647,774.2 44,709.3 302,921.7 209,184.9 1,536,493.3 -3.12007 12 1,810,778.1 5.6 1,113,729.7 1,014,880.8 98,848.9 375,987.2 321,061.2 2,401,249.7 7.4
03 1,877,439.7 0.5 1,149,303.5 1,065,250.8 84,052.8 422,249.3 305,886.9 2,455,147.2 1.606 1,939,790.0 2.3 1,092,859.0 986,760.4 106,098.7 456,723.0 390,208.0 2,564,684.1 1.909 1,921,537.3 -0.7 1,111,986.0 982,604.1 129,381.9 451,975.6 357,575.8 2,525,010.7 -2.0
2008 12 1,622,666.1 -4.2 898,692.5 829,539.3 69,153.1 440,199.5 283,774.2 2,270,001.4 1.3
03 1,841,171.2 4.3 966,546.7 890,798.6 75,748.1 526,807.9 347,816.7 2,352,558.1 1.606 1,894,865.5 2.7 982,461.0 921,066.3 61,394.8 568,226.2 344,178.2 2,439,247.6 1.409 2,030,707.4 3.2 1,072,211.9 1,004,645.2 67,566.7 580,759.1 377,736.4 2,653,414.7 3.5
2009 12 2,228,786.8 5.4 1,234,289.7 1,125,607.8 108,681.9 622,133.6 372,363.5 2,880,033.9 6.1
01 2,241,310.1 0.6 1,240,788.9 1,139,173.9 101,614.9 607,118.3 393,402.9 2,871,011.1 -0.3021 2,353,955.3 5.0 1,366,290.1 1,264,587.7 101,702.3 592,424.6 395,240.6 2,981,852.7 3.903 2,281,480.3 -3.1 1,374,391.0 1,281,022.3 93,368.8 550,546.3 356,542.9 2,974,483.3 -0.2
04 2,408,657.9 5.6 1,363,602.5 1,264,842.2 98,760.2 609,930.8 435,124.7 3,162,957.8 6.305 2,458,107.6 2.1 1,411,151.3 1,314,434.6 96,716.7 601,651.7 445,304.6 3,254,079.2 2.906 2,683,675.2 9.2 1,467,080.2 1,376,782.3 90,297.9 602,923.0 613,672.0 3,523,607.2 8.3
07 2,716,472.8 1.2 1,528,049.7 1,427,431.8 100,617.9 626,028.2 562,394.9 3,543,135.2 0.608 2,725,373.0 0.3 1,553,856.7 1,444,402.0 109,454.7 610,734.0 560,782.3 3,657,409.2 3.209 2,892,619.1 6.1 1,610,067.7 1,500,538.0 109,529.7 664,484.0 618,067.3 3,851,715.3 5.3
10 2,872,484.9 -0.7 1,656,273.0 1,547,737.4 108,535.6 647,780.3 568,431.6 3,873,060.3 0.611 2,953,792.9 2.8 1,759,160.8 1,641,120.7 118,040.1 631,437.6 563,194.5 3,949,539.3 2.0
2010 12 3,522,363.5 19.6 2,001,596.0 1,835,395.4 166,200.6 754,620.1 766,147.4 4,679,981.4 18.8
01 3,673,919.9 4.3 2,236,593.2 1,947,921.4 288,671.8 829,272.3 608,054.4 4,805,454.3 2.702 3,836,157.5 4.4 2,311,625.7 2,016,739.1 294,886.6 842,059.1 682,472.6 4,867,431.6 1.303 3,773,586.1 -1.6 2,338,658.1 2,068,784.6 269,873.5 792,974.6 641,953.4 4,955,128.8 1.8
04 4,012,030.3 6.3 2,363,348.0 2,094,155.4 269,192.6 859,476.7 789,205.6 5,350,512.6 8.005 4,006,154.0 -0.1 2,434,478.5 2,166,378.3 268,100.1 849,213.7 722,461.9 5,428,916.9 1.506 4,219,933.5 5.3 2,555,476.5 2,282,435.6 273,040.9 850,500.2 813,956.8 5,772,557.8 6.3
07 4,360,991.7 3.3 2,641,049.8 2,350,471.9 290,577.9 866,835.6 853,106.3 5,920,392.4 2.608 4,249,456.1 -2.6 2,680,172.2 2,379,244.6 300,927.6 865,361.4 703,922.6 5,903,235.1 -0.309 4,377,634.3 3.0 2,778,679.9 2,440,373.9 338,306.0 893,335.5 705,619.0 6,053,868.9 2.6
10 4,455,359.6 1.8 2,843,670.9 2,497,040.3 346,630.6 901,189.0 710,499.8 6,078,304.6 0.411 4,560,531.7 2.4 2,809,589.6 2,460,719.4 348,870.2 1,004,914.2 746,027.8 6,113,194.9 0.6
2011 12 4,671,183.6 2.4 2,912,432.3 2,586,648.3 325,784.0 977,902.4 780,849.0 6,412,259.3 4.9
1 Data of Savings and Credit Unions was included in Broad Money calculation

Statictical Appendix
146 ANNUAL REPORT 2011
Deposit Corporations Monetary Surveyin millions of togrogs
End-of-period Net foreignassets
Domesticcredit (net)
Of which
GeneralGovernment
Of which:
CentralGovernment
LocalGovernment
1991 12 495.4 10,971.2 -1,883.71992 12 -27.0 16,078.2 -3,051.71993 12 23,395.7 24,460.3 -7,143.41994 12 29,699.3 49,190.3 -3,773.1
1995 09 42,796.8 49,646.7 -14,688.91995 12 51,709.7 45,494.7 -17,227.81996 12 73,733.6 90,240.4 19,920.31997 12 135,437.2 67,635.4 13,352.1
1998 12 96,557.5 136,062.0 41,460.01999 12 167,541.5 116,635.6 34,555.72000 12 201,696.9 84,831.1 17,171.22001 12 220,165.7 129,259.5 -6,829.1
2002 12 308,507.4 200,027.4 -32,439.32003 12 256,341.5 514,615.2 96,687.32004 12 311,005.2 647,305.1 40,506.5 45,022.0 -4,515.6
2005 12 570,198.7 769,004.62 -90,847.2 -87,822.4 -3,024.92006 12 1,131,772.5 745,404.8 -477,882.5 -470,640.1 -7,242.42007 12 1,352,046.2 1,329,532.9 -726,528.0 -719,606.1 -6,921.9
03 1,297,695.4 1,603,434.8 -732,494.0 -724,161.0 -8,333.006 1,223,350.9 1,753,657.0 -805,776.0 -794,838.7 -10,937.309 1,035,442.0 1,928,681.0 -788,177.6 -776,727.4 -11,450.2
2008 12 683,478.2 2,061,976.5 -573,575.1 -566,471.1 -7,104.0
03 696,315.7 2,169,795.5 -501,931.0 -495,236.0 -6,695.006 944,242.6 1,977,766.1 -581,163.6 -574,386.6 -6,777.109 1,250,760.3 1,930,001.0 -700,933.7 -690,570.6 -10,363.0
2009 121 1,532,827.5 1,937,874.3 -717,126.1 -709,477.0 -7,649.1
01 1,549,683.2 1,989,667.8 -684,776.7 -676,642.2 -8,134.5022 1,569,011.8 2,096,576.2 -619,174.9 -611,919.4 -7,255.503 1,441,851.9 2,139,661.1 -628,887.2 -623,329.0 -5,558.2
04 1,651,075.5 2,079,478.2 -685,392.9 -677,573.6 -7,819.405 1,644,686.8 2,184,974.2 -667,743.2 -660,415.8 -7,327.406 1,801,207.9 2,283,798.6 -598,830.8 -591,589.6 -7,241.2
07 1,801,553.6 2,302,072.3 -669,921.0 -660,553.5 -9,367.508 1,921,080.2 2,256,881.9 -765,162.7 -757,056.4 -8,106.309 2,099,024.3 2,298,844.8 -786,507.3 -778,518.8 -7,988.5
10 2,120,248.5 2,253,429.7 -836,860.8 -829,641.2 -7,219.611 2,151,707.9 2,216,315.7 -896,178.6 -887,616.9 -8,561.7
2010 12 2,739,285.7 2,429,981.1 -834,796.9 -828,917.2 -5,879.7
01 2,666,682.5 2,611,222.8 -829,042.3 -821,162.2 -7,880.102 2,731,118.9 2,637,578.4 -888,724.7 -880,054.7 -8,670.003 2,618,912.3 2,734,749.6 -996,082.0 -988,369.0 -7,712.9
04 2,920,282.0 2,951,367.3 -1,022,511.7 -1,008,053.3 -14,458.505 2,697,019.9 3,195,242.3 -1,051,576.6 -1,034,400.8 -17,175.906 2,949,693.7 3,380,151.7 -1,172,639.7 -1,161,741.9 -10,897.8
07 3,064,096.1 3,458,332.7 -1,223,066.5 -1,203,839.6 -19,226.908 2,890,864.9 3,585,761.8 -1,285,041.0 -1,267,576.9 -17,464.109 3,041,323.7 3,699,454.1 -1,359,623.3 -1,350,632.8 -8,990.5
10 3,059,841.8 3,699,329.9 -1,522,578.4 -1,514,016.6 -8,561.811 3,005,462.5 3,840,801.2 -1,597,937.7 -1,588,186.5 -9,751.2
2011 12 3,067,439.5 4,270,983.8 -1,370,249.9 -1,362,960.6 -7,289.3
1 From December 2008 the Settlement on PRGF loan was included in Net Domestic Credit, particularly in Claims on Government2 Data of Savings and Credit Unions was included in Broad Money calculation

Statictical Appendix
147ANNUAL REPORT 2011
Deposit Corporations Monetary Surveycontinued
End-of-period Other fi nancialcorporations
Publiccorporations
Privatecorporations Individuals Other Unclassifi ed
loans Total assets
1991 12 9,779.6 3,075.3 0.0 11,466.61992 12 12,204.2 6,925.7 0.0 16,051.21993 12 21,744.4 9,859.3 0.0 47,856.01994 12 12,193.3 40,638.0 132.1 78,889.6
1995 09 8,892.2 55,297.8 145.6 92,443.51995 12 10,883.3 51,653.5 185.7 97,204.41996 12 14,520.3 22,851.9 32,947.9 163,974.01997 12 11,713.0 28,112.6 14,457.7 203,072.6
1998 12 18,295.6 43,667.5 32,638.9 232,619.51999 12 8,564.5 31,408.6 42,106.7 284,177.12000 12 6,281.5 45,482.9 15,895.6 286,528.02001 12 10,402.0 114,670.4 11,016.2 349,425.2
2002 12 12,184.9 203,567.2 16,714.5 508,534.82003 12 16,203.6 365,024.4 36,700.0 770,956.72004 12 455.1 13,125.7 365,057.9 210,931.1 17,228.9 958,310.2
2005 12 498.8 34,169.2 489,064.7 321,606.8 14,512.4 1,339,203.32006 12 1,597.1 36,731.6 659,019.3 507,570.0 18,369.3 1,877,177.32007 12 2,828.5 27,331.8 1,166,149.5 838,778.5 20,972.4 2,681,579.0
03 5,723.8 31,726.2 1,287,578.5 987,330.7 23,569.6 2,901,130.306 8,520.5 10,977.9 1,472,125.9 1,031,501.6 36,307.1 2,977,007.809 4,442.2 19,053.9 1,556,911.6 1,090,062.8 46,388.1 2,964,123.0
2008 12 3,412.1 34,794.6 1,570,398.9 1,013,694.2 13,251.7 2,745,454.7
03 4,039.9 26,158.4 1,672,342.0 963,525.9 5,660.2 2,866,111.306 3,767.8 20,199.9 1,653,214.5 875,248.8 6,498.8 2,922,008.709 4,274.1 24,402.5 1,663,783.5 924,277.4 14,197.1 3,180,761.3
2009 12 4,711.2 20,429.4 1,716,253.8 904,892.3 8,713.7 3,470,701.8
01 3,827.1 20,422.8 1,720,862.3 920,916.9 8,415.5 3,539,350.9021 4,942.8 19,615.3 1,724,255.4 953,654.9 13,282.6 3,665,587.903 12,013.7 16,948.8 1,760,220.7 964,035.3 15,329.8 3,581,513.0
04 11,883.5 16,589.3 1,754,070.2 972,219.7 10,108.4 3,730,553.705 10,470.7 15,245.7 1,815,477.0 1,001,587.6 9,936.5 3,829,661.006 11,354.6 15,592.9 1,806,502.8 1,038,929.1 10,250.0 4,085,006.4
07 10,436.2 32,651.1 1,844,147.8 1,075,174.1 9,584.2 4,103,626.008 11,083.2 34,614.5 1,789,347.8 1,177,478.7 9,520.5 4,177,962.109 11,745.6 37,686.6 1,808,074.9 1,218,394.9 9,450.1 4,397,869.1
10 11,778.3 38,336.0 1,797,039.9 1,233,809.4 9,326.8 4,373,678.211 12,458.1 36,873.6 1,783,352.2 1,270,186.9 9,623.5 4,368,023.6
2010 12 14,067.6 17,073.9 1,854,774.6 1,369,232.5 9,629.5 5,169,266.8
01 13,711.5 16,598.0 1,909,018.9 1,491,117.4 9,819.4 5,277,905.302 13,252.8 15,756.6 1,999,058.5 1,488,750.3 9,484.9 5,368,697.203 14,479.0 13,029.5 2,099,485.9 1,596,083.2 7,753.9 5,353,661.9
04 13,580.2 16,163.3 2,226,969.0 1,709,263.3 7,903.3 5,871,649.405 15,444.4 15,421.2 2,393,198.6 1,815,285.5 7,469.3 5,892,262.206 14,951.3 16,160.3 2,568,669.9 1,944,813.6 8,196.1 6,329,845.4
07 13,720.4 23,953.4 2,637,482.9 1,998,308.4 7,934.2 6,522,428.808 15,631.8 26,441.7 2,685,825.7 2,134,699.7 8,203.7 6,476,626.609 18,284.0 27,143.3 2,770,747.4 2,234,430.6 8,472.1 6,740,777.8
10 16,503.3 26,225.8 2,861,279.8 2,309,733.5 8,165.9 6,759,171.811 17,704.3 41,716.2 2,969,558.6 2,401,950.0 7,809.8 6,846,263.7
2011 12 17,469.1 60,646.0 3,104,543.2 2,452,685.0 5,890.4 7,338,423.3
1 Data of Savings and Credit Unions was included in Broad Money calculation

Statictical Appendix
148 ANNUAL REPORT 2011
Deposit Corporations Monetary Surveycontinued
End-of-period Money Quasi-Money Government lending loans Other items (net) Total liabilities
1991 12 7,313.7 2,601.2 1,551.7 11,466.61992 12 7,640.2 5,412.1 2,998.9 16,051.21993 12 18,548.4 24,215.8 5,091.8 47,856.01994 12 32,871.2 43,905.8 2,112.6 78,889.6
1995 09 41,893.7 62,986.3 -12,436.5 92,443.51995 12 42,636.5 59,408.2 -4,840.3 97,204.41996 12 64,301.6 64,093.7 35,578.7 163,974.01997 12 76,108.9 93,956.6 33,007.1 203,072.6
1998 12 82,582.0 84,667.6 65,369.9 232,619.51999 12 114,825.7 105,341.3 64,010.1 284,177.12000 12 130,775.0 128,067.7 27,685.4 286,528.02001 12 156,155.3 174,908.9 18,360.9 349,425.2
2002 12 187,727.8 282,397.8 38,409.2 508,534.82003 12 212,833.4 490,499.0 67,624.3 770,956.72004 12 221,327.6 625,704.9 111,277.8 958,310.2
2005 12 269,124.4 871,014.4 17,272.7 181,791.8 1,339,203.32006 12 331,903.4 1,204,590.0 18,765.0 321,918.9 1,877,177.32007 12 590,471.6 1,810,778.1 17,620.0 262,709.3 2,681,579.0
03 577,707.5 1,877,439.7 17,574.0 428,409.1 2,901,130.306 624,894.1 1,939,790.0 16,260.0 396,063.6 2,977,007.809 603,473.3 1,921,537.3 16,790.9 422,321.4 2,964,123.0
2008 12 647,335.3 1,622,666.2 18,122.4 457,330.8 2,745,454.7
03 511,386.8 1,841,171.2 20,449.5 493,103.7 2,866,111.306 544,382.1 1,894,865.5 19,879.3 462,881.8 2,922,008.709 622,707.3 2,030,707.4 20,421.0 506,925.7 3,180,761.3
2009 12 651,247.0 2,228,786.8 20,201.7 570,466.3 3,470,701.8
01 629,701.0 2,241,310.1 19,995.3 648,344.5 3,539,350.9021 627,897.5 2,353,955.3 19,177.2 664,557.9 3,665,587.903 693,003.0 2,281,480.3 18,075.6 588,954.2 3,581,513.0
04 754,299.9 2,408,657.9 17,786.0 549,809.9 3,730,553.705 795,971.6 2,458,107.6 16,923.1 558,658.7 3,829,661.006 839,932.0 2,683,675.2 16,456.8 544,942.5 4,085,006.4
07 826,662.4 2,716,472.8 17,251.7 543,239.1 4,103,626.008 932,036.2 2,725,373.0 16,247.5 504,305.4 4,177,962.109 959,096.3 2,892,619.1 17,499.9 528,653.9 4,397,869.1
10 1,000,575.4 2,872,484.9 19,034.8 481,583.1 4,373,678.211 995,746.4 2,943,893.7 17,873.9 410,509.6 4,368,023.6
2010 12 1,157,617.9 3,522,363.5 17,781.0 471,504.4 5,169,266.8
01 1,131,534.4 3,673,919.9 18,171.1 454,279.9 5,277,905.302 1,031,274.1 3,836,157.5 18,453.8 482,811.8 5,368,697.203 1,181,542.7 3,773,586.1 17,856.7 380,676.4 5,353,661.9
04 1,338,482.3 4,012,030.3 19,530.3 501,606.6 5,871,649.405 1,422,762.8 4,006,154.0 16,854.6 446,490.7 5,892,262.206 1,552,624.4 4,219,933.5 17,181.1 540,106.4 6,329,845.4
07 1,559,400.7 4,360,991.7 17,153.5 584,882.9 6,522,428.808 1,653,779.0 4,249,456.1 17,083.4 556,308.1 6,476,626.609 1,676,234.5 4,377,634.3 16,657.5 670,251.4 6,740,777.8
10 1,622,945.0 4,455,359.6 17,419.3 663,447.8 6,759,171.811 1,552,663.2 4,560,531.7 17,064.5 716,004.4 6,846,263.7
2011 12 1,741,075.7 4,671,183.6 17,133.5 909,030.4 7,338,423.3
1 Data of Savings and Credit Unions was included in Broad Money calculation

Statictical Appendix
149ANNUAL REPORT 2011
Balance sheet of Monetary Authorities (for Monetary Survey)in millions of togrogs
End-of-period Foreign Assets
Claims on
Total assetsGeneralGovernment
ublic corporations
Private corporations
Non-Bank fi nancial
corporationsBanks
1991 12 1,989.0 82.0 0.0 2.8 1,528.5 3,602.31992 12 2,212.3 0.0 0.0 1.3 6,152.7 8,366.31993 12 25,615.6 759.2 0.0 9.2 6,637.3 33,021.31994 12 42,589.0 6,405.3 0.0 6.5 10,374.9 59,375.7
1995 09 48,137.4 1,513.3 0.0 8.1 8,713.5 58,372.31995 12 54,544.5 433.7 0.0 1.5 7,739.5 62,719.21996 12 67,811.4 38,361.2 5,513.4 0.1 1,712.4 113,398.51997 12 113,769.2 23,979.6 3,908.3 0.0 3,092.8 144,749.9
1998 12 114,166.1 26,120.9 8,960.1 0.0 5,631.5 154,878.61999 12 173,895.5 24,234.4 4,565.4 0.0 6,651.2 209,346.62000 12 209,409.6 19,658.8 903.2 0.0 4,777.0 234,748.62001 12 227,993.2 13,570.5 867.6 0.0 150.3 7,347.6 249,929.2
2002 12 301,875.6 0.0 866.6 0.0 150.3 8,038.0 310,930.52003 12 237,578.1 164,216.0 556.2 0.0 12,688.7 415,039.02004 12 252,331.8 105,300.0 0.0 0.0 22,331.5 379,963.3
2005 12 414,620.6 99,372.9 0.0 0.0 17,743.8 531,737.32006 12 838,510.5 34,443.8 0.0 0.0 18,191.3 891,145.62007 12 1,173,166.2 0.0 0.0 0.0 18,549.7 1,191,715.9
03 1,178,447.8 0.0 0.0 0.0 21,282.6 1,199,730.406 1,133,869.4 0.0 0.0 0.0 16,774.4 1,150,643.809 1,012,420.1 0.0 0.0 0.0 53,526.4 1,065,946.5
2008 12 836,153.7 25,563.5 0.0 0.0 243,076.9 1,104,794.0
03 796,730.1 87,471.2 0.0 0.0 234,104.9 1,118,306.206 1,126,806.0 254,144.2 0.0 0.0 152,501.5 1,533,451.609 1,517,945.3 227,935.9 0.0 0.0 156,188.1 1,902,069.3
2009 12 1,917,594.4 432,755.2 0.0 0.0 198,448.4 2,548,798.0
01 1,898,660.0 432,428.2 0.0 0.0 191,328.9 2,522,417.102 1,842,478.8 345,810.0 0.0 0.0 199,276.6 2,387,565.403 1,784,423.2 398,850.3 0.0 0.0 171,068.3 2,354,341.7
04 1,931,053.1 306,883.4 0.0 0.0 161,224.4 2,399,160.905 1,917,379.6 309,028.0 0.0 0.0 159,741.3 2,386,148.906 1,945,617.6 311,712.6 0.0 0.0 157,739.6 2,415,069.8
07 2,001,427.4 329,235.8 0.0 0.0 158,061.4 2,488,724.708 2,094,258.2 318,177.4 0.0 0.0 153,567.7 2,566,003.309 2,199,418.9 327,109.1 0.0 0.0 154,207.9 2,680,735.9
10 2,375,193.3 321,963.2 0.0 0.0 154,011.4 2,851,167.911 2,354,477.0 309,956.3 0.0 0.0 132,937.9 2,797,371.3
2010 12 2,875,159.1 311,387.4 0.0 0.0 131,316.3 3,317,862.9
01 2,900,211.6 312,937.8 0.0 0.0 127,748.5 3,340,898.002 2,911,904.1 316,024.4 0.0 0.0 128,222.8 3,356,151.303 2,808,410.8 304,755.0 0.0 0.0 128,006.5 3,241,172.3
04 2,920,295.4 420,128.4 0.0 0.0 141,296.1 3,481,719.905 2,981,787.3 413,191.9 0.0 0.0 124,219.8 3,519,199.006 3,207,373.9 318,203.1 0.0 0.0 215,392.2 3,740,969.1
07 3,342,648.1 379,786.0 0.0 0.0 149,869.0 3,872,303.108 3,257,375.9 418,127.5 0.0 0.0 118,420.1 3,793,923.409 3,339,171.1 417,115.4 0.0 0.0 118,242.9 3,874,529.4
10 3,423,519.4 422,804.5 0.0 0.0 126,422.8 3,972,746.711 3,332,082.9 418,865.1 0.0 0.0 131,076.9 3,882,024.9
2011 12 3,422,564.1 429,351.8 0.0 0.0 341,506.1 4,193,422.0

Statictical Appendix
150 ANNUAL REPORT 2011
Balance sheet of Monetary Authorities (for Monetary Survey)continued
End-of-period Monetary base
Of whichTime Savings &
Foreign currencydeposits
Currency outside banks
Bank's cash Banks' deposits
Private corporations
deposits
Public corporations
deposits
1991 12 2,068.1 1,694.3 308.7 37.8 0.0 27.3 0.11992 12 5,316.2 1,839.2 1,057.2 2,408.6 0.0 11.21993 12 14,277.1 8,750.6 2,035.5 3,450.4 40.6 0.01994 12 29,139.1 18,767.2 3,037.6 7,334.3 0.0 0.0
1995 09 35,430.5 25,034.7 3,886.4 6,509.4 0.0 0.01995 12 37,507.7 25,591.2 4,141.9 7,774.6 0.0 0.01996 12 51,210.2 41,704.4 4,391.4 5,114.41997 12 63,017.1 49,768.3 7,048.2 6,200.6
1998 12 74,778.7 56,445.8 5,308.4 13,024.51999 12 112,073.6 87,281.3 4,286.2 20,506.12000 12 132,932.4 100,933.4 6,461.0 25,538.02001 12 143,785.4 109,160.7 10,045.1 24,579.6
2002 12 175,305.4 120,783.6 13,859.2 40,662.62003 12 200,795.5 131,496.7 21,329.9 47,968.82004 12 234,905.4 143,512.7 25,008.4 66,384.3
2005 12 281,236.3 152,369.5 39,318.8 89,548.02006 12 381,792.0 185,126.7 59,931.8 136,733.52007 12 535,047.7 283,325.3 80,695.9 171,026.5
03 447,109.3 256,681.7 71,723.1 118,704.406 505,056.2 307,790.8 79,868.9 117,396.509 512,573.6 286,146.0 74,853.2 151,574.4
2008 12 633,682.0 328,724.0 78,431.5 226,526.5
03 587,775.2 272,600.7 65,620.1 249,554.406 749,832.2 283,798.8 73,901.0 392,132.309 658,907.5 282,417.7 81,011.2 295,478.6
2009 12 733,060.9 284,993.9 86,783.7 361,283.4
01 626,879.8 260,504.7 90,168.6 276,206.502 663,152.9 258,174.4 92,527.5 312,451.003 678,070.5 294,328.0 88,523.7 295,218.7
04 745,982.6 339,652.7 103,686.8 302,643.205 712,997.6 356,869.5 103,974.4 252,153.706 838,829.6 348,905.7 97,028.9 392,895.0
07 773,709.3 344,483.7 106,355.5 322,870.108 738,649.3 354,555.4 111,421.3 272,672.509 778,315.0 343,777.0 107,371.2 327,166.8
10 807,334.9 352,735.2 108,047.7 346,552.011 772,744.6 350,639.0 120,918.8 301,186.8
2010 12 945,477.3 388,202.7 130,144.9 427,129.7
01 893,825.3 394,768.2 169,247.2 329,810.002 849,045.5 336,441.2 136,565.1 376,039.203 1,019,193.8 386,821.6 142,800.9 489,571.2
04 1,163,836.5 474,818.5 152,242.9 536,775.105 1,272,422.6 478,939.2 144,106.2 649,377.306 1,259,892.1 479,700.2 157,363.2 622,828.7
07 1,328,566.2 497,138.9 175,095.2 656,332.208 1,289,789.1 530,428.7 173,792.3 585,568.109 1,398,844.0 525,138.2 178,534.5 695,171.3
10 1,484,223.5 507,576.4 185,771.2 790,875.911 1,516,592.5 487,960.9 189,041.9 839,589.8
2011 12 1,659,753.3 517,494.2 193,967.0 948,292.1

Statictical Appendix
151ANNUAL REPORT 2011
Balance sheet of Monetary Authorities (for Monetary Survey)continued
End-of-period
Central Bank bills
(net)Foreign
liabilitiesLong-term
foreign liabilities
GeneralGovernment
depositsGovernmentlending loans
Capital accounts
Other items (net)
Total liabilities
1991 12 0.0 10.7 784.4 3,070.4 -2,331.4 3,602.31992 12 0.0 13.9 1,201.8 3,264.3 -1,429.9 8,366.31993 12 1,500.0 15,219.8 7,790.9 638.6 1,479.9 -7,885.0 33,021.31994 12 2,106.0 25,632.2 7,054.6 2,465.1 3,047.0 -10,068.3 59,375.7
1995 09 605.0 21,099.4 14,779.9 4,038.9 6,933.7 -24,515.1 58,372.31995 12 830.0 21,587.2 14,176.2 1,649.5 8,339.5 -21,370.9 62,719.21996 12 0.0 28,711.7 11,121.4 8,388.0 15,342.7 -1,375.5 113,398.51997 12 19,055.0 32,501.3 3,659.2 12,819.9 25,295.0 -11,597.6 144,749.9
1998 12 11,697.0 36,551.3 2,908.1 40,082.5 -11,139.0 154,878.61999 12 21,200.0 43,952.9 4,821.7 37,843.8 -10,545.4 209,346.62000 12 21,080.0 55,057.8 17,940.0 42,815.4 -35,077.1 234,748.62001 12 50,000.0 51,342.2 16,930.5 41,152.0 -53,280.8 249,929.2
2002 12 61,000.0 47,610.0 33,516.6 33,357.1 -39,858.7 310,930.52003 12 79,500.0 86,878.2 91,713.9 41,156.1 -85,004.7 415,039.02004 12 69,247.1 1 53,431.7 53,025.8 32,033.9 -62,680.6 379,963.3
2005 12 125,713.2 42,901.8 3,181.0 90,298.2 17,272.7 45,930.7 -74,796.5 531,737.32006 12 70,845.1 35,821.7 5,099.1 405,129.0 18,765.0 36,796.1 -63,102.5 891,145.62007 12 103,424.8 29,604.1 6,065.7 606,580.3 17,620.0 108,427.0 -215,053.7 1,191,715.9
03 95,299.9 29,913.7 5,898.5 567,741.6 17,574.0 157,044.9 -120,851.3 1,199,730.406 63,941.8 27,402.6 5,816.0 528,287.6 16,260.0 147,559.2 -143,679.5 1,150,643.809 41,181.9 25,126.2 5,595.0 504,819.8 16,790.9 104,152.9 -144,293.9 1,065,946.5
2008 12 119,786.0 25,563.5 5,666.0 208,445.7 18,122.4 157,961.7 -64,433.2 1,104,794.0
03 126,730.3 26,324.0 6,126.7 193,338.9 20,449.5 247,872.1 -90,310.4 1,118,306.206 143,996.1 194,144.2 5,881.8 312,564.0 19,879.3 220,811.1 -113,657.1 1,533,451.609 356,599.2 227,935.9 115,671.1 415,728.5 20,421.0 222,673.8 -115,867.7 1,902,069.3
2009 12 392,511.8 262,755.2 116,540.9 698,141.9 20,201.7 224,493.0 101,092.6 2,548,798.0
01 512,803.8 262,428.2 116,740.8 766,409.8 19,995.3 231,662.6 -14,503.3 2,522,417.102 532,378.9 255,975.7 113,820.9 599,116.8 19,177.2 210,500.3 -6,557.3 2,387,565.403 492,724.7 269,849.7 106,522.6 655,818.0 18,075.6 134,978.5 -1,697.8 2,354,341.7
04 443,658.3 267,880.1 106,094.7 671,062.9 17,786.0 130,763.0 15,933.4 2,399,160.905 504,084.8 263,981.6 104,538.9 657,491.8 16,923.1 124,082.0 2,049.2 2,386,148.906 556,581.7 262,363.5 103,872.6 607,363.1 16,456.8 106,955.9 -77,353.3 2,415,069.8
07 526,269.7 266,186.7 105,300.9 690,296.2 17,251.7 106,836.4 2,873.8 2,488,724.708 650,765.3 254,824.4 100,818.2 783,006.0 16,247.5 38,315.9 -16,623.2 2,566,003.309 660,294.5 263,753.4 104,947.4 796,211.3 17,499.9 79,406.6 -19,692.3 2,680,735.9
10 872,857.3 258,607.5 103,217.2 823,137.3 19,034.8 26,378.7 -59,399.7 2,851,167.911 959,170.0 246,595.0 98,445.4 863,296.4 17,873.9 -50,725.6 -110,028.4 2,797,371.3
2010 12 1,100,996.9 247,230.3 98,876.7 802,965.9 17,781.0 -37,974.7 142,509.4 3,317,862.9
01 1,251,019.2 249,910.0 99,947.0 757,009.0 18,171.1 -63,410.8 134,427.2 3,340,898.002 1,328,762.0 252,792.5 100,372.5 809,474.9 18,453.8 -44,138.8 41,388.9 3,356,151.303 1,173,327.5 241,520.3 96,474.4 931,327.3 17,856.7 -153,101.9 -85,425.7 3,241,172.3
04 1,011,441.7 256,918.7 103,020.4 1,064,534.2 19,530.3 -28,860.1 -108,701.7 3,481,719.905 1,041,369.9 249,979.4 100,242.1 1,066,198.4 16,854.6 -96,423.3 -131,444.7 3,519,199.006 1,147,448.7 254,987.8 102,183.4 1,145,038.8 17,181.1 -54,544.4 -131,218.5 3,740,969.1
07 1,115,600.2 256,567.9 102,821.7 1,212,113.3 17,153.5 -60,799.8 -99,719.8 3,872,303.108 1,001,408.4 255,121.3 102,240.5 1,329,947.9 17,083.4 -72,546.3 -129,120.9 3,793,923.409 880,864.3 254,106.5 102,443.6 1,375,442.0 16,657.5 -35,169.8 -118,658.7 3,874,529.4
10 699,055.5 259,792.7 105,283.2 1,527,145.8 17,419.3 17,062.0 -137,235.3 3,972,746.711 550,248.2 262,016.0 106,074.2 1,534,446.5 17,064.5 69,983.1 -174,400.2 3,882,024.9
2011 12 879,112.6 269,039.8 109,313.1 1,143,379.1 17,133.5 144,617.9 -28,927.2 4,193,422.0

Statictical Appendix
152 ANNUAL REPORT 2011
Balance sheet of Other depository corporations (for Monetary Survey)in millions of togrogs
End-of-period Reserves Central Bank
billsForeignassets
Claims on
GeneralGovernment
¯¿íýýñ: Of which: Áóñàä ñàíõ¿¿ãèéí áàéãóóëëàãà
Other fi nancial
corporations
CentralGovernment
Îðîí íóòãèéíòºñºâLocal
Government1991 12 345.5 3,214.6 5.01992 12 3,023.5 2,090.6 99.91993 12 5,690.3 1,500.0 16,325.2 232.71994 12 10,319.1 2,106.0 17,271.4 737.4
1995 09 11,593.9 605.0 23,553.8 1,563.51995 12 12,531.2 830.0 25,412.1 642.61996 12 6,851.1 0.0 43,254.0 12,534.81997 12 13,456.7 19,055.0 66,415.6 35,450.8
1998 12 17,920.6 11,697.0 26,115.7 38,328.41999 12 24,167.2 21,203.9 41,710.6 39,268.82000 12 31,996.5 22,846.7 53,211.3 40,059.52001 12 34,606.2 49,904.7 52,338.6 32,457.8
2002 12 54,500.5 60,995.0 70,715.8 30,742.62003 12 69,464.8 75,989.3 157,070.1 46,905.02004 12 88,486.5 69255.6 1 165,806.3 31,225.8 31,225.8 455.1
2005 12 126,032.7 125,677.9 256,492.7 3,167.1 3,167.1 498.8 2006 12 190,204.6 70,813.9 410,185.2 4,887.4 4,887.4 1,597.1 2007 12 251,712.4 102,798.4 423,587.1 24,102.2 24,102.2 2,828.5
03 192,361.8 95,095.9 418,158.1 12,055.6 12,055.6 5,723.8 06 198,414.7 63,328.4 453,862.4 6,260.2 6,260.2 8,520.5 09 229,614.5 41,088.1 432,265.0 7,550.3 7,550.3 4,442.2
2008 12 304,507.1 119,723.3 294,472.1 2,503.9 2,503.9 3,412.1
03 315,174.5 126,712.2 410,285.9 3,060.4 3,060.4 4,039.9 06 466,039.8 143,993.5 431,398.8 3,331.0 3,331.0 3,767.8 09 376,575.3 356,697.2 445,918.4 4,295.0 4,295.0 4,274.1
2009 12 628,426.0 392,215.0 405,127.7 9,185.9 9,185.9 4,711.2
01 439,212.0 512,936.1 381,768.5 76,818.8 76,818.8 3,827.1 02 470,444.5 532,589.7 449,896.2 77,702.4 77,702.4 4,942.8 03 465,768.5 492,134.4 367,457.9 78,820.9 78,820.9 12,013.7
04 509,264.5 442,576.3 437,822.7 164,297.5 164,297.5 11,883.5 05 453,067.6 502,878.9 438,490.4 143,278.7 143,278.7 10,470.7 06 524,140.2 555,346.0 553,985.3 109,608.8 109,608.8 11,354.6
07 557,492.8 526,061.0 490,134.6 109,891.5 109,891.5 10,436.2 08 462,201.8 650,663.6 479,584.6 110,456.8 110,456.8 11,083.2 09 525,648.5 660,234.7 552,922.2 119,342.5 119,342.5 11,745.6
10 518,518.5 873,359.7 576,959.3 120,949.4 120,949.4 11,778.3 11 453,277.8 960,949.4 595,313.6 119,608.1 119,608.1 12,458.1
2010 12 770,995.4 1,102,827.6 655,876.3 79,024.9 79,024.9 14,067.6
01 717,364.3 1,252,806.4 559,945.4 55,259.2 55,259.2 13,711.5 02 638,058.7 1,330,484.9 632,122.8 55,400.2 55,400.2 13,252.8 03 632,359.0 1,174,606.2 568,495.1 55,581.4 55,581.4 14,479.0
04 689,753.3 1,012,924.1 831,833.6 56,158.4 56,158.4 13,580.2 05 781,424.3 1,042,558.0 545,432.1 56,254.9 56,254.9 15,444.4 06 781,371.6 1,148,551.0 603,253.9 86,227.7 86,227.7 14,951.3
07 830,458.5 1,117,131.5 592,104.1 106,580.7 106,580.7 13,720.4 08 759,395.5 1,001,922.0 493,173.8 213,837.5 213,837.5 15,631.8 09 873,726.5 881,299.6 589,879.0 218,710.1 218,710.1 18,284.0
10 980,147.1 699,346.3 562,116.8 244,285.0 244,285.0 16,503.3 11 1,028,631.6 550,580.5 617,019.0 268,870.8 268,870.8 17,704.3
2011 12 1,145,260.6 879,793.8 711,145.1 275,270.5 275,270.5 17,469.1
1 Data of Savings and Credit Unions was included in Broad Money calculation

Statictical Appendix
153ANNUAL REPORT 2011
Balance sheet of Other depository corporations (for Monetary Survey)continued
End-of-period Publiccorporations
Privatecorporations Individuals Other Unclassifi ed
loans Total assets
1991 12 9,779.6 3,072.5 16,417.21992 12 12,204.2 6,924.4 24,342.61993 12 21,744.4 9,850.1 55,342.71994 12 12,193.3 40,631.5 132.1 83,390.8
1995 09 8,892.2 55,289.7 145.6 101,643.71995 12 10,883.3 51,652.0 185.7 102,136.91996 12 9,006.9 22,851.8 32,947.9 127,446.51997 12 7,804.7 28,112.6 14,457.7 184,753.1
1998 12 9,335.5 43,667.5 32,638.9 179,703.61999 12 3,999.1 31,408.6 42,106.7 203,865.02000 12 5,378.3 45,482.9 15,895.6 214,870.82001 12 9,534.4 114,670.4 10,865.9 304,377.9
2002 12 11,318.3 203,567.2 16,564.2 448,403.72003 12 15,647.4 365,024.4 36,700.0 766,800.92004 12 13,125.7 365,057.9 210,931.1 17,228.9 892,317.2
2005 12 34,169.2 489,064.7 321,606.8 14,512.4 1,371,222.22006 12 36,731.6 659,019.3 507,570.0 18,369.3 1,899,378.52007 12 27,331.8 1,166,149.5 838,778.5 20,972.4 2,858,261.0
03 31,726.2 1,287,578.5 987,330.7 23,569.6 3,053,600.306 10,977.9 1,472,125.9 1,031,501.6 36,307.1 3,281,298.709 19,053.9 1,556,911.6 1,090,062.8 46,388.1 3,427,376.6
2008 12 34,794.6 1,570,398.9 1,013,694.2 13,251.7 3,356,758.0
03 26,158.4 1,672,342.0 963,525.9 5,660.2 3,526,959.606 20,199.9 1,653,214.5 875,248.8 6,498.8 3,603,692.809 24,402.5 1,663,783.5 924,277.4 14,197.1 3,814,420.7
2009 12 20,429.4 1,716,253.8 904,892.3 8,713.7 4,089,955.1
01 20,422.8 1,720,862.3 920,916.9 8,415.5 4,085,179.902 19,615.3 1,724,255.4 953,654.9 13,282.6 4,246,383.703 16,948.8 1,760,220.7 964,035.3 15,329.8 4,172,729.9
04 16,589.3 1,754,070.2 972,219.7 10,108.4 4,318,832.105 15,245.7 1,815,477.0 1,001,587.6 9,936.5 4,390,433.006 15,592.9 1,806,502.8 1,038,929.1 10,250.0 4,625,709.7
07 32,651.1 1,844,147.8 1,075,174.1 9,584.2 4,655,573.208 34,614.5 1,789,347.8 1,177,478.7 9,520.5 4,724,951.609 37,686.6 1,808,074.9 1,218,394.9 9,450.1 4,943,500.0
10 38,336.0 1,797,039.9 1,233,809.4 9,326.8 5,180,077.411 36,873.6 1,783,352.2 1,270,186.9 9,623.5 5,241,643.3
2010 12 17,073.9 1,854,774.6 1,369,232.5 9,629.5 5,873,502.2
01 16,598.0 1,909,018.9 1,491,117.4 9,819.4 6,025,640.402 15,756.6 1,999,058.5 1,488,750.3 9,484.9 6,182,369.603 13,029.5 2,099,485.9 1,596,083.2 7,753.9 6,161,873.3
04 16,163.3 2,226,969.0 1,709,263.3 7,903.3 6,564,548.605 15,421.2 2,393,198.6 1,815,285.5 7,469.3 6,672,488.206 16,160.3 2,568,669.9 1,944,813.6 8,196.1 7,172,195.5
07 23,953.4 2,637,482.9 1,998,308.4 7,934.2 7,327,674.008 26,441.7 2,685,825.7 2,134,699.7 8,203.7 7,339,131.609 27,143.3 2,770,747.4 2,234,430.6 8,472.1 7,622,692.5
10 26,225.8 2,861,279.8 2,309,733.5 8,165.9 7,707,803.611 41,716.2 2,969,558.6 2,401,950.0 7,809.8 7,903,840.8
2011 12 60,646.0 3,104,543.2 2,452,685.0 5,890.4 8,652,703.7
1 Data of Savings and Credit Unions was included in Broad Money calculation

Statictical Appendix
154 ANNUAL REPORT 2011
Balance sheet of Other depository corporations (for Monetary Survey)continued
End-of-period
Current accountin DC
Total deposits,current account
in FC
Foreignliabilities
Long-termforeign liabilities
General Government
deposits
1991 12 5,592.1 2,601.1 4,708.2 1,971.0 1,186.31992 12 5,789.8 5,412.1 4,316.0 3,809.5 1,949.81993 12 9,757.2 24,215.8 3,325.3 1,303.5 7,496.71994 12 14,104.0 43,905.8 4,528.9 397.5 8,450.7
1995 09 16,859.0 62,986.3 7,795.0 0.0 13,726.81995 12 17,045.3 59,408.2 6,659.7 0.0 16,654.61996 12 22,597.2 64,093.7 8,620.1 0.0 22,587.71997 12 26,340.6 93,956.6 12,246.3 0.0 33,258.4
1998 12 26,136.2 84,667.6 7,173.0 12,800.4 20,081.21999 12 27,544.4 105,341.3 4,111.7 5,682.5 24,125.82000 12 29,841.6 128,067.7 1,693.0 4,173.2 24,607.12001 12 46,994.6 174,908.9 2,220.1 6,603.8 35,926.8
2002 12 66,944.1 282,397.8 4,755.2 11,718.8 29,665.32003 12 81,336.7 490,499.0 7,328.5 44,100.0 22,719.82004 12 77,814.9 625,704.9 44,827.4 8,873.8 42,993.6
2005 12 116,754.9 871,014.4 43,775.8 11,056.1 103,089.02006 12 146,776.7 1,204,590.0 68,501.0 7,501.4 112,084.72007 12 307,146.3 1,810,778.1 202,962.6 6,074.8 144,049.9
03 321,025.8 1,877,439.7 255,828.2 7,270.1 176,808.006 317,103.3 1,939,790.0 323,763.8 7,398.7 283,748.609 317,327.3 1,921,537.3 368,351.7 10,170.2 290,908.1
2008 12 318,611.3 1,622,666.2 407,335.3 8,582.8 393,196.7
03 238,786.1 1,841,171.2 470,254.0 7,995.6 399,123.806 260,583.2 1,894,865.5 404,002.4 9,933.7 526,074.809 340,289.6 2,030,707.4 344,133.9 25,362.4 517,436.1
2009 12 366,253.2 2,228,786.8 385,141.9 25,456.6 460,925.3
01 369,196.2 2,241,310.1 325,968.7 25,607.6 427,613.902 369,723.1 2,353,955.3 328,073.1 25,493.6 443,570.503 398,675.0 2,281,480.3 308,207.7 25,449.2 450,740.4
04 414,647.2 2,408,657.9 318,338.8 25,486.9 485,510.905 439,102.1 2,458,107.6 317,270.2 25,392.5 462,558.106 491,026.3 2,683,675.2 306,689.7 25,469.2 412,789.1
07 482,178.7 2,716,472.8 293,449.0 25,071.7 418,752.208 577,480.8 2,725,373.0 278,715.8 18,404.3 410,790.809 615,319.2 2,892,619.1 268,090.6 16,525.3 436,747.7
10 647,840.2 2,872,484.9 454,249.4 15,830.0 456,636.111 645,107.4 2,943,893.7 437,326.4 15,715.9 462,446.7
2010 12 769,415.2 3,522,363.5 424,894.9 20,747.8 422,243.3
01 736,766.2 3,673,919.9 423,378.3 20,239.2 440,230.402 694,833.0 3,836,157.5 434,780.0 24,963.0 450,674.303 794,721.1 3,773,586.1 397,106.0 22,892.9 425,091.0
04 863,663.8 4,012,030.3 456,065.1 15,842.8 434,264.405 943,823.7 4,006,154.0 461,767.0 18,211.1 454,825.006 1,072,924.2 4,219,933.5 482,392.0 21,370.7 432,031.6
07 1,062,261.9 4,360,991.7 484,067.5 27,199.0 497,319.908 1,123,350.3 4,249,456.1 475,514.8 26,808.2 587,058.109 1,151,096.3 4,377,634.3 504,202.1 26,974.2 620,006.8
10 1,115,368.6 4,455,359.6 535,993.8 24,724.7 662,522.111 1,064,702.2 4,560,531.7 548,715.8 26,833.3 751,227.1
2011 12 1,223,581.5 4,671,183.6 658,809.2 29,107.7 931,493.11 Data of Savings and Credit Unions was included in Broad Money calculation

Statictical Appendix
155ANNUAL REPORT 2011
Balance sheet of Other depository corporations (for Monetary Survey)continued
End-of-period
Of which
Credits fromCentral bank
Capitalaccounts
Other items(net) Total liabilitiesCentral
Governmentdeposits
Central Government
deposits
1991 12 1,522.6 1,687.9 -2,852.0 16,417.21992 12 6,287.6 2,641.8 -5,864.0 24,342.61993 12 5,390.9 7,291.8 -3,438.5 55,342.71994 12 10,151.8 12,784.2 -10,932.1 83,390.8
1995 09 9,134.2 15,105.1 -23,962.7 101,643.71995 12 7,401.9 16,998.1 -22,030.9 102,136.91996 12 10,890.1 -13,538.2 12,195.9 127,446.51997 12 762.5 16,770.0 1,418.7 184,753.1
1998 12 4,459.0 7,061.1 17,325.1 179,703.61999 12 2,074.8 4,565.4 30,419.0 203,865.02000 12 0.0 29,947.6 -3,459.4 214,870.82001 12 4,094.5 47,173.0 -13,543.9 304,377.9
2002 12 4,326.9 61,289.3 -12,693.8 448,403.72003 12 12,839.3 110,392.5 -2,415.0 766,800.92004 12 38,478.0 4,515.6 23,838.2 167,101.1 -98,836.5 892,317.2
2005 12 100,064.2 3,024.9 18,149.8 207,075.7 306.4 1,371,222.22006 12 104,842.2 7,242.4 19,092.3 294,780.0 46,052.5 1,899,378.52007 12 137,127.9 6,921.9 18,935.9 376,385.6 -8,072.2 2,858,261.0
03 168,475.0 8,333.0 21,353.0 404,061.1 -10,185.5 3,053,600.306 272,811.3 10,937.3 16,902.0 426,620.7 -34,028.4 3,281,298.709 279,457.9 11,450.2 53,033.2 479,801.3 -13,752.6 3,427,376.6
2008 12 386,092.7 7,104.0 227,137.5 340,566.4 38,661.8 3,356,758.0
03 392,428.7 6,695.0 230,817.9 359,061.8 -20,250.9 3,526,959.606 519,297.7 6,777.1 151,439.9 323,391.9 33,401.3 3,603,692.809 507,073.1 10,363.0 156,126.2 249,819.4 150,545.6 3,814,420.7
2009 12 453,276.2 7,649.1 199,243.8 230,212.1 193,935.4 4,089,955.1
01 419,479.4 8,134.5 191,254.6 219,361.4 284,867.4 4,085,179.902 436,315.0 7,255.5 199,303.2 264,594.9 261,670.1 4,246,383.703 445,182.2 5,558.2 182,542.6 263,691.1 261,943.8 4,172,729.9
04 477,691.5 7,819.4 161,186.4 267,770.6 237,233.3 4,318,832.105 455,230.7 7,327.4 159,696.7 267,397.9 260,907.9 4,390,433.006 405,547.9 7,241.2 157,739.6 295,498.7 252,821.8 4,625,709.7
07 409,384.7 9,367.5 158,059.7 290,255.9 271,333.2 4,655,573.208 402,684.5 8,106.3 156,553.6 290,172.5 267,460.7 4,724,951.609 428,759.2 7,988.5 154,185.6 295,613.9 264,398.7 4,943,500.0
10 449,416.5 7,219.6 160,986.8 313,104.9 258,945.0 5,180,077.411 453,885.0 8,561.7 132,905.9 380,901.1 223,346.2 5,241,643.3
2010 12 416,363.6 5,879.7 140,320.8 393,541.1 179,975.5 5,873,502.2
01 432,350.3 7,880.1 127,639.8 395,171.8 208,294.7 6,025,640.402 442,004.3 8,670.0 129,575.5 400,061.3 211,325.1 6,182,369.603 417,378.1 7,712.9 127,853.5 421,699.4 198,923.3 6,161,873.3
04 419,805.9 14,458.5 144,117.0 427,674.8 210,890.4 6,564,548.605 437,649.1 17,175.9 134,213.9 452,934.7 200,558.8 6,672,488.206 421,133.8 10,897.8 215,363.7 516,906.8 211,273.0 7,172,195.5
07 478,093.0 19,226.9 154,698.1 519,921.1 221,214.9 7,327,674.008 569,594.0 17,464.1 128,284.6 543,773.2 204,886.3 7,339,131.609 611,016.3 8,990.5 128,054.5 576,711.7 238,012.6 7,622,692.5
10 653,960.3 8,561.8 139,188.2 592,591.9 182,054.7 7,707,803.611 741,475.9 9,751.2 131,045.2 640,337.2 180,448.2 7,903,840.8
2011 12 924,203.8 7,289.3 408,265.1 688,911.4 41,352.1 8,652,703.7
1 Data of Savings and Credit Unions was included in Broad Money calculation

Statictical Appendix
156 ANNUAL REPORT 2011
Consumer price indexin percent
End-
of-p
erio
d 3
Food
& n
on-a
lcoh
olic
be
vera
ges
Of which
Alco
holic
bev
erag
es, t
obac
co
Clo
thin
g, f
ootw
ear a
nd c
loth
s
Food
Of which
Non
-alc
ohol
ic b
ever
ages
Brea
d, fl
our,
cere
als
Mea
t and
mea
t pr
oduc
ts
Milk
dai
ry p
rodu
cts,
& e
ggs
Suga
r, ja
m, c
andy
, an
d ch
ocol
ate
Vege
tabl
es
Oils
& fa
ts
2005.12=1002005
121 41.08 39.52 9.92 16.51 3.55 1.61 4.12 2.27 1.56 2.26 12.38
03 42.51 40.94 9.92 17.12 3.63 1.62 4.61 2.21 1.57 2.26 12.6306 46.70 45.09 10.11 20.67 3.31 1.97 4.72 2.20 1.61 2.28 12.7009 42.73 41.10 10.18 19.07 3.23 1.88 4.07 2.22 1.63 2.29 12.86
2006 12 41.96 40.31 10.25 16.39 3.75 1.87 4.12 2.25 1.65 2.41 13.28
03 45.45 43.83 10.28 19.32 3.79 1.84 4.46 2.21 1.62 2.32 13.0706 50.72 49.08 10.41 24.34 3.33 1.84 4.76 2.28 1.64 2.32 12.6609 52.17 50.47 12.95 21.79 3.57 1.84 5.08 3.23 1.70 2.41 13.01
2007 12 52.26 50.55 13.87 19.75 4.47 1.87 4.75 3.66 1.72 2.38 13.56
03 60.57 58.73 14.99 24.72 5.22 1.98 5.63 3.72 1.85 2.51 13.8006 77.03 75.13 19.97 32.57 5.25 2.11 8.36 4.29 1.90 2.52 14.7309 71.39 69.28 19.78 26.93 5.14 2.22 8.04 4.50 2.11 2.58 16.01
2008 12 65.08 62.96 18.77 21.84 6.03 2.23 7.01 4.41 2.12 2.59 17.10
03 69.62 67.34 19.12 24.40 6.38 2.51 9.09 4.39 2.28 2.85 16.7306 73.07 70.78 19.15 27.65 5.61 2.73 8.43 4.27 2.29 3.11 16.7109 66.15 63.79 19.21 21.30 5.30 3.05 7.71 4.24 2.36 3.15 17.39
2009 12 64.76 62.34 18.85 20.14 6.37 3.04 6.96 4.18 2.42 3.17 17.71
03 76.10 73.60 18.74 29.03 6.99 3.42 8.37 4.08 2.50 3.21 18.3606 86.61 84.15 18.96 40.39 6.20 3.19 8.26 3.99 2.46 3.23 18.2009 76.11 73.68 20.39 27.81 5.92 3.45 8.84 4.00 2.42 3.25 18.93
2010 12 78.07 75.64 20.76 28.93 7.00 3.41 8.23 4.03 2.43 3.43 19.86
2010.12=1002010
122 30.03 28.61 8.26 10.11 3.40 1.09 2.95 1.45 1.42 3.69 12.17
01 31.50 30.08 8.26 11.34 3.55 1.09 3.02 1.46 1.42 3.77 12.2502 31.60 30.17 8.23 11.45 3.52 1.09 3.05 1.46 1.43 3.78 12.3903 30.72 29.28 8.24 10.58 3.48 1.09 3.06 1.45 1.44 3.78 12.51
04 30.22 28.78 8.20 10.16 3.42 1.09 3.07 1.44 1.44 3.79 12.7405 31.32 29.89 8.27 11.26 3.34 1.08 3.13 1.42 1.43 3.80 12.7106 31.70 30.26 8.28 11.28 3.23 1.08 3.59 1.41 1.44 3.80 12.90
07 32.26 30.82 8.29 11.62 3.16 1.08 3.86 1.42 1.44 3.79 12.9508 31.88 30.44 8.29 11.55 3.12 1.08 3.58 1.43 1.44 3.79 13.2209 31.70 30.27 8.28 11.66 3.19 1.08 3.21 1.47 1.43 3.79 13.67
10 31.30 29.86 8.28 11.35 3.33 1.10 2.89 1.46 1.43 3.79 14.2211 31.46 30.01 8.26 11.29 3.49 1.10 2.95 1.47 1.45 3.80 14.46
2011 12 32.31 30.87 8.28 11.91 3.61 1.12 3.03 1.47 1.45 3.80 14.41
Source: Monthly Statistical Bulletin, NSO1Since April 2006 the items in consumer basket were extended to 287 and prices of December 2005 was taken as the base period.2Since January 2012 consumer basket was extended from 287 to 329 items and prices of December 2010 was taken as the base period.

Statictical Appendix
157ANNUAL REPORT 2011
Consumer price indexcontinued
End-of-period 3
Of which
Housing,water,
electricity,and fuels
Of which
Furn
ishi
ngs,
hou
seho
ld e
quip
men
t &
tool
s
Med
ical
car
e &
serv
ices
Tran
spor
t
Clothing,cloth
Men'sclothing
Women'sclothing
Children'sclothing Footwear
Wat
er su
pply
& m
isce
llane
ous
serv
ices
Elec
tric
ity, g
as a
nd o
ther
fuel
s
2005.12=1002005 121 8.11 3.26 2.93 1.11 4.27 13.40 4.24 7.60 4.30 1.62 8.71
03 8.46 3.47 3.07 1.10 4.17 13.12 4.78 6.73 4.34 1.64 9.3506 8.44 3.40 3.09 1.13 4.26 13.01 4.78 6.67 4.37 1.64 9.4209 8.58 3.45 3.14 1.17 4.29 14.38 5.18 7.61 4.45 1.66 9.63
2006 12 8.84 3.54 3.21 1.22 4.45 14.70 5.18 7.91 4.64 1.77 9.57
03 8.73 3.50 3.20 1.18 4.32 13.69 5.34 6.60 4.66 1.77 9.6006 8.41 3.37 3.05 1.14 4.26 13.37 5.34 6.70 4.73 1.79 9.7909 8.68 3.49 3.07 1.27 4.33 14.91 5.34 7.67 4.98 2.01 10.12
2007 12 8.96 3.58 3.10 1.35 4.60 15.73 5.37 8.41 5.22 2.10 10.59
03 9.19 3.66 3.19 1.39 4.62 15.53 5.37 8.15 5.51 2.18 10.9106 9.95 3.98 3.55 1.49 4.78 15.65 5.37 8.11 5.76 2.52 11.1109 10.82 4.42 3.73 1.69 5.19 19.30 5.80 10.93 5.95 2.70 15.05
2008 12 11.35 4.62 3.91 1.76 5.74 18.45 5.83 9.90 5.99 2.68 14.17
03 11.29 4.63 3.85 1.75 5.44 17.78 5.83 9.28 6.17 2.70 13.8806 11.47 4.79 3.99 1.73 5.24 17.47 5.87 9.04 6.29 2.91 13.0809 12.09 4.97 4.09 1.89 5.30 17.90 5.89 9.39 6.37 2.95 14.02
2009 12 12.17 4.97 4.14 1.93 5.54 17.74 5.90 9.23 6.37 3.06 14.06
03 12.37 5.07 4.22 1.94 5.99 17.68 6.29 8.81 6.37 3.07 14.1906 12.49 5.20 4.22 1.96 5.72 18.40 6.29 9.66 6.45 3.11 14.2809 13.11 5.46 4.32 2.19 5.82 19.54 7.32 9.63 6.50 3.12 14.25
2010 12 13.38 5.57 4.40 2.21 6.48 19.96 7.32 9.96 6.66 3.17 14.32
2010.12=1002010 122 8.87 3.27 3.54 1.53 3.30 14.07 2.17 6.63 3.51 3.00 12.58
01 8.93 3.31 3.55 1.53 3.32 13.90 2.17 6.40 3.52 3.00 12.5802 9.04 3.31 3.61 1.57 3.35 13.82 2.17 6.35 3.53 3.01 12.7403 9.10 3.34 3.63 1.58 3.41 13.62 2.17 6.21 3.53 3.01 12.74
04 9.26 3.42 3.69 1.63 3.47 13.52 2.17 6.02 3.57 3.02 12.8205 9.20 3.41 3.65 1.62 3.51 14.40 2.27 6.56 3.59 3.03 12.8006 9.32 3.43 3.68 1.68 3.58 14.28 2.28 6.41 3.63 3.04 13.73
07 9.34 3.43 3.70 1.69 3.61 14.26 2.28 6.33 3.63 3.04 14.0208 9.60 3.49 3.85 1.73 3.62 14.58 2.28 6.47 3.68 3.04 14.1209 9.98 3.54 4.09 1.80 3.69 15.99 2.28 7.83 3.69 3.05 14.12
10 10.42 3.79 4.20 1.82 3.80 16.03 2.28 7.83 3.73 3.05 14.1411 10.51 3.82 4.20 1.87 3.95 16.08 2.28 7.83 3.73 3.05 14.18
2011 12 10.46 3.85 4.12 1.87 3.96 16.09 2.28 7.83 3.70 3.05 14.18
1Since April 2006 the items in consumer basket were extended to 287 and prices of December 2005 was taken as the base period.2Since January 2012 consumer basket was extended from 287 to 329 items and prices of December 2010 was taken as the base period.
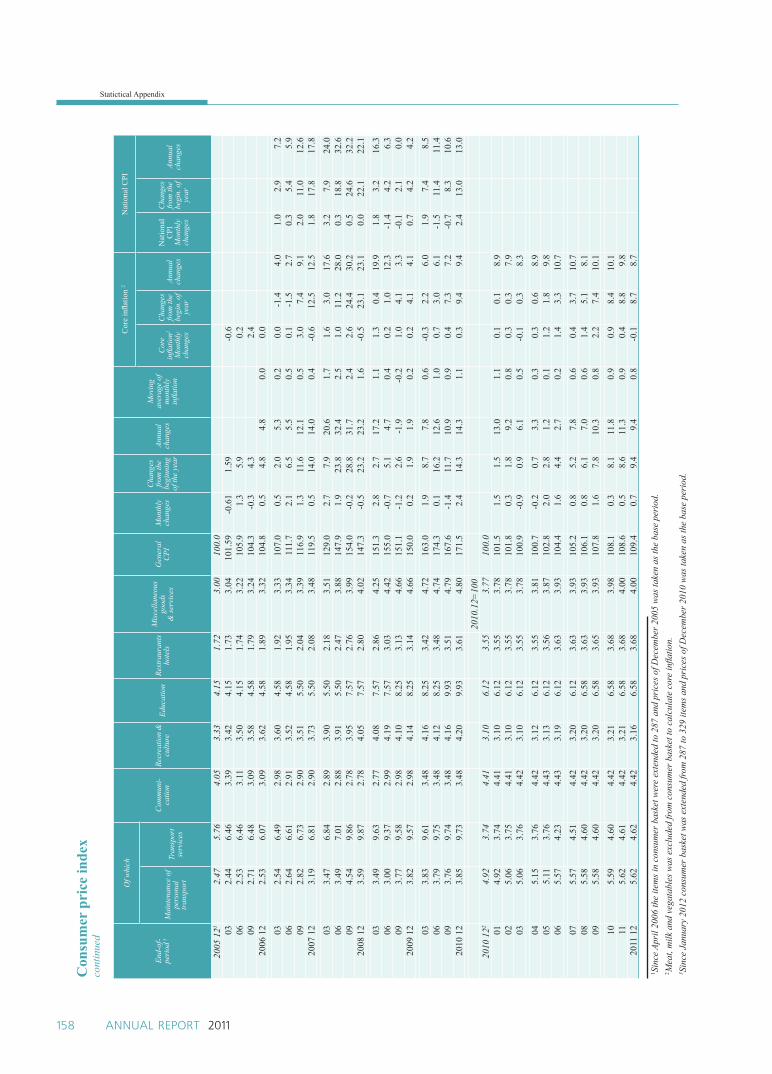
Statictical Appendix
158 ANNUAL REPORT 2011
Con
sum
er p
rice
inde
xco
ntin
ued
End-
of-
peri
od 3
Of w
hich
Com
mun
i-ca
tion
Recr
eatio
n &
cultu
reEd
ucat
ion
Rest
raur
ants
hote
lsM
isce
llane
ous
good
s&
serv
ices
Gen
eral
C
PIM
onth
lych
ange
s
Cha
nges
fro
m th
ebe
ginn
ing
of th
e ye
ar
Annu
al
chan
ges
Mov
ing
aver
age
ofm
onth
lyinfl a
tion
Cor
e infl a
tion
2N
atio
nal C
PI
Cor
e infl a
tion2
Mon
thly
chan
ges
Cha
nges
fro
m th
ebe
gin.
of
year
Annu
alch
ange
s
Nat
iona
l C
PIM
onth
lych
ange
s
Cha
nges
fro
m th
ebe
gin.
of
year
Annu
alch
ange
sM
aint
enan
ce o
fpe
rson
al
tran
spor
tTr
ansp
ort
serv
ices
2005
121
2.47
5.76
4.05
3.33
4.15
1.72
3.00
100.
003
2.44
6.46
3.39
3.42
4.15
1.73
3.04
101.
59-0
.61
1.59
-0.6
062.
536.
463.
113.
504.
151.
743.
2210
5.9
1.3
5.9
0.2
092.
716.
483.
093.
584.
581.
793.
2410
4.3
-0.3
4.3
2.4
2006
12
2.53
6.07
3.09
3.62
4.58
1.89
3.32
104.
80.
54.
84.
80.
00.
0
032.
546.
492.
983.
604.
581.
923.
3310
7.0
0.5
2.0
5.3
0.2
0.0
-1.4
4.0
1.0
2.9
7.2
062.
646.
612.
913.
524.
581.
953.
3411
1.7
2.1
6.5
5.5
0.5
0.1
-1.5
2.7
0.3
5.4
5.9
092.
826.
732.
903.
515.
502.
043.
3911
6.9
1.3
11.6
12.1
0.5
3.0
7.4
9.1
2.0
11.0
12.6
2007
12
3.19
6.81
2.90
3.73
5.50
2.08
3.48
119.
50.
514
.014
.00.
4-0
.612
.512
.51.
817
.817
.8
033.
476.
842.
893.
905.
502.
183.
5112
9.0
2.7
7.9
20.6
1.7
1.6
3.0
17.6
3.2
7.9
24.0
063.
497.
012.
883.
915.
502.
473.
8814
7.9
1.9
23.8
32.4
2.5
1.0
11.2
28.0
0.3
18.8
32.6
094.
549.
862.
783.
957.
572.
763.
9915
4.0
-0.2
28.8
31.7
2.4
2.6
24.4
30.2
0.5
24.6
32.2
2008
12
3.59
9.87
2.78
4.05
7.57
2.80
4.02
147.
3-0
.523
.223
.21.
6-0
.523
.123
.10.
022
.122
.1
033.
499.
632.
774.
087.
572.
864.
2515
1.3
2.8
2.7
17.2
1.1
1.3
0.4
19.9
1.8
3.2
16.3
063.
009.
372.
994.
197.
573.
034.
4215
5.0
-0.7
5.1
4.7
0.4
0.2
1.0
12.3
-1.4
4.2
6.3
093.
779.
582.
984.
108.
253.
134.
6615
1.1
-1.2
2.6
-1.9
-0.2
1.0
4.1
3.3
-0.1
2.1
0.0
2009
12
3.82
9.57
2.98
4.14
8.25
3.14
4.66
150.
00.
21.
91.
90.
20.
24.
14.
10.
74.
24.
2
033.
839.
613.
484.
168.
253.
424.
7216
3.0
1.9
8.7
7.8
0.6
-0.3
2.2
6.0
1.9
7.4
8.5
063.
799.
753.
484.
128.
253.
484.
7417
4.3
0.1
16.2
12.6
1.0
0.7
3.0
6.1
-1.5
11.4
11.4
093.
769.
743.
484.
169.
933.
514.
7916
7.6
-1.4
11.7
10.9
0.9
0.4
7.3
7.2
-0.7
8.3
10.6
2010
12
3.85
9.73
3.48
4.20
9.93
3.61
4.80
171.
52.
414
.314
.31.
10.
39.
49.
42.
413
.013
.0
2010
.12=
100
2010
122
4.92
3.74
4.41
3.10
6.12
3.55
3.77
100.
001
4.92
3.74
4.41
3.10
6.12
3.55
3.78
101.
51.
51.
513
.01.
10.
10.
18.
902
5.06
3.75
4.41
3.10
6.12
3.55
3.78
101.
80.
31.
89.
20.
80.
30.
37.
903
5.06
3.76
4.42
3.10
6.12
3.55
3.78
100.
9-0
.90.
96.
10.
5-0
.10.
38.
3
045.
153.
764.
423.
126.
123.
553.
8110
0.7
-0.2
0.7
3.3
0.3
0.3
0.6
8.9
055.
113.
764.
433.
136.
123.
563.
8710
2.8
2.0
2.8
1.2
0.1
1.2
1.8
9.8
065.
574.
234.
433.
196.
123.
633.
9310
4.4
1.6
4.4
2.7
0.2
1.4
3.3
10.7
075.
574.
514.
423.
206.
123.
633.
9310
5.2
0.8
5.2
7.8
0.6
0.4
3.7
10.7
085.
584.
604.
423.
206.
583.
633.
9310
6.1
0.8
6.1
7.0
0.6
1.4
5.1
8.1
095.
584.
604.
423.
206.
583.
653.
9310
7.8
1.6
7.8
10.3
0.8
2.2
7.4
10.1
105.
594.
604.
423.
216.
583.
683.
9810
8.1
0.3
8.1
11.8
0.9
0.9
8.4
10.1
115.
624.
614.
423.
216.
583.
684.
0010
8.6
0.5
8.6
11.3
0.9
0.4
8.8
9.8
2011
12
5.62
4.62
4.42
3.16
6.58
3.68
4.00
109.
40.
79.
49.
40.
8-0
.18.
78.
7
1 Sin
ce A
pril
2006
the
item
s in
cons
umer
bas
ket w
ere
exte
nded
to 2
87 a
nd p
rice
s of D
ecem
ber 2
005
was
take
n as
the
base
per
iod.
2 Mea
t, m
ilk a
nd v
egat
able
s was
exc
lude
d fro
m c
onsu
mer
bas
ket t
o ca
lcul
ate
core
infl a
tion.
3 Sin
ce J
anua
ry 2
012
cons
umer
bas
ket w
as e
xten
ded
from
287
to 3
29 it
ems a
nd p
rice
s of D
ecem
ber 2
010
was
take
n as
the
base
per
iod.
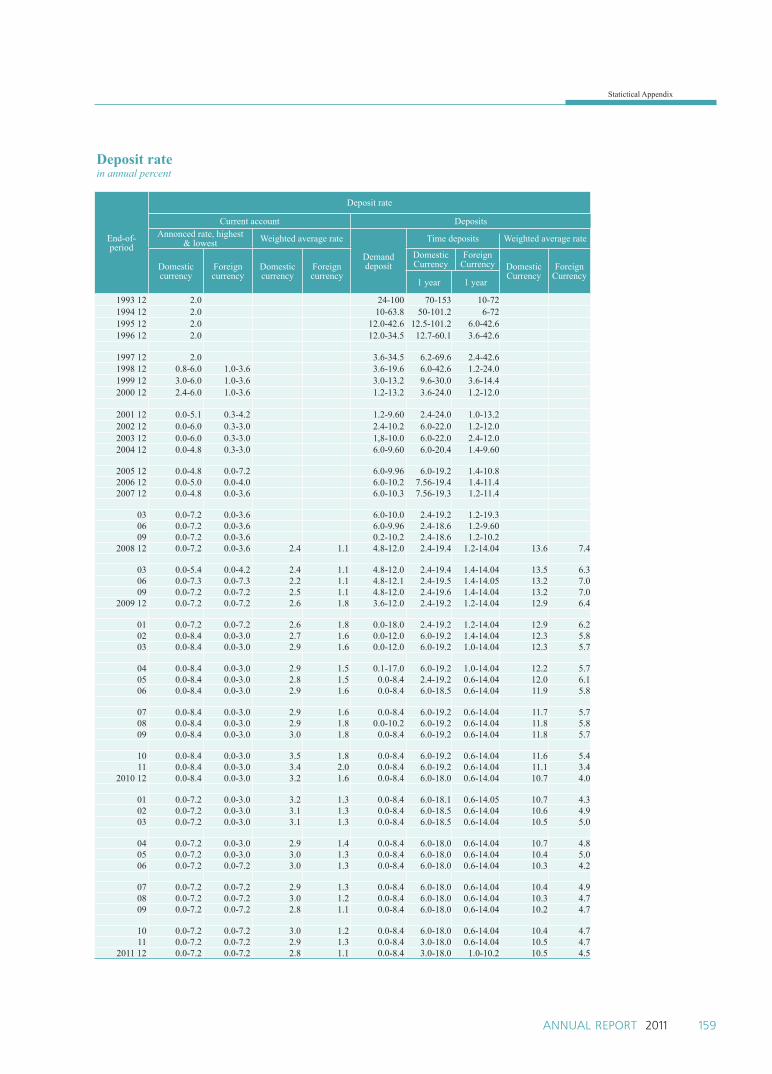
Statictical Appendix
159ANNUAL REPORT 2011
Deposit rate in annual percent
End-of-period
Deposit rate
Current account DepositsAnnonced rate, highest
& lowest Weighted average rate
Demanddeposit
Time deposits Weighted average rate
Domesticcurrency
Foreigncurrency
Domesticcurrency
Foreigncurrency
Domestic Currency
Foreign Currency Domestic
CurrencyForeign
Currency1 year 1 year
1993 12 2.0 24-100 70-153 10-721994 12 2.0 10-63.8 50-101.2 6-721995 12 2.0 12.0-42.6 12.5-101.2 6.0-42.61996 12 2.0 12.0-34.5 12.7-60.1 3.6-42.6
1997 12 2.0 3.6-34.5 6.2-69.6 2.4-42.61998 12 0.8-6.0 1.0-3.6 3.6-19.6 6.0-42.6 1.2-24.01999 12 3.0-6.0 1.0-3.6 3.0-13.2 9.6-30.0 3.6-14.42000 12 2.4-6.0 1.0-3.6 1.2-13.2 3.6-24.0 1.2-12.0
2001 12 0.0-5.1 0.3-4.2 1.2-9.60 2.4-24.0 1.0-13.22002 12 0.0-6.0 0.3-3.0 2.4-10.2 6.0-22.0 1.2-12.02003 12 0.0-6.0 0.3-3.0 1,8-10.0 6.0-22.0 2.4-12.02004 12 0.0-4.8 0.3-3.0 6.0-9.60 6.0-20.4 1.4-9.60
2005 12 0.0-4.8 0.0-7.2 6.0-9.96 6.0-19.2 1.4-10.82006 12 0.0-5.0 0.0-4.0 6.0-10.2 7.56-19.4 1.4-11.42007 12 0.0-4.8 0.0-3.6 6.0-10.3 7.56-19.3 1.2-11.4
03 0.0-7.2 0.0-3.6 6.0-10.0 2.4-19.2 1.2-19.306 0.0-7.2 0.0-3.6 6.0-9.96 2.4-18.6 1.2-9.6009 0.0-7.2 0.0-3.6 0.2-10.2 2.4-18.6 1.2-10.2
2008 12 0.0-7.2 0.0-3.6 2.4 1.1 4.8-12.0 2.4-19.4 1.2-14.04 13.6 7.4
03 0.0-5.4 0.0-4.2 2.4 1.1 4.8-12.0 2.4-19.4 1.4-14.04 13.5 6.306 0.0-7.3 0.0-7.3 2.2 1.1 4.8-12.1 2.4-19.5 1.4-14.05 13.2 7.009 0.0-7.2 0.0-7.2 2.5 1.1 4.8-12.0 2.4-19.6 1.4-14.04 13.2 7.0
2009 12 0.0-7.2 0.0-7.2 2.6 1.8 3.6-12.0 2.4-19.2 1.2-14.04 12.9 6.4
01 0.0-7.2 0.0-7.2 2.6 1.8 0.0-18.0 2.4-19.2 1.2-14.04 12.9 6.202 0.0-8.4 0.0-3.0 2.7 1.6 0.0-12.0 6.0-19.2 1.4-14.04 12.3 5.803 0.0-8.4 0.0-3.0 2.9 1.6 0.0-12.0 6.0-19.2 1.0-14.04 12.3 5.7
04 0.0-8.4 0.0-3.0 2.9 1.5 0.1-17.0 6.0-19.2 1.0-14.04 12.2 5.705 0.0-8.4 0.0-3.0 2.8 1.5 0.0-8.4 2.4-19.2 0.6-14.04 12.0 6.106 0.0-8.4 0.0-3.0 2.9 1.6 0.0-8.4 6.0-18.5 0.6-14.04 11.9 5.8
07 0.0-8.4 0.0-3.0 2.9 1.6 0.0-8.4 6.0-19.2 0.6-14.04 11.7 5.708 0.0-8.4 0.0-3.0 2.9 1.8 0.0-10.2 6.0-19.2 0.6-14.04 11.8 5.809 0.0-8.4 0.0-3.0 3.0 1.8 0.0-8.4 6.0-19.2 0.6-14.04 11.8 5.7
10 0.0-8.4 0.0-3.0 3.5 1.8 0.0-8.4 6.0-19.2 0.6-14.04 11.6 5.411 0.0-8.4 0.0-3.0 3.4 2.0 0.0-8.4 6.0-19.2 0.6-14.04 11.1 3.4
2010 12 0.0-8.4 0.0-3.0 3.2 1.6 0.0-8.4 6.0-18.0 0.6-14.04 10.7 4.0
01 0.0-7.2 0.0-3.0 3.2 1.3 0.0-8.4 6.0-18.1 0.6-14.05 10.7 4.302 0.0-7.2 0.0-3.0 3.1 1.3 0.0-8.4 6.0-18.5 0.6-14.04 10.6 4.903 0.0-7.2 0.0-3.0 3.1 1.3 0.0-8.4 6.0-18.5 0.6-14.04 10.5 5.0
04 0.0-7.2 0.0-3.0 2.9 1.4 0.0-8.4 6.0-18.0 0.6-14.04 10.7 4.805 0.0-7.2 0.0-3.0 3.0 1.3 0.0-8.4 6.0-18.0 0.6-14.04 10.4 5.006 0.0-7.2 0.0-7.2 3.0 1.3 0.0-8.4 6.0-18.0 0.6-14.04 10.3 4.2
07 0.0-7.2 0.0-7.2 2.9 1.3 0.0-8.4 6.0-18.0 0.6-14.04 10.4 4.908 0.0-7.2 0.0-7.2 3.0 1.2 0.0-8.4 6.0-18.0 0.6-14.04 10.3 4.709 0.0-7.2 0.0-7.2 2.8 1.1 0.0-8.4 6.0-18.0 0.6-14.04 10.2 4.7
10 0.0-7.2 0.0-7.2 3.0 1.2 0.0-8.4 6.0-18.0 0.6-14.04 10.4 4.711 0.0-7.2 0.0-7.2 2.9 1.3 0.0-8.4 3.0-18.0 0.6-14.04 10.5 4.7
2011 12 0.0-7.2 0.0-7.2 2.8 1.1 0.0-8.4 3.0-18.0 1.0-10.2 10.5 4.5

Statictical Appendix
160 ANNUAL REPORT 2011
Loan rate in percent
End of period
Central bank's bills rate
Policy raterate
Weighted average
rate
Period
3 days 7 days 8 days 1 week 2 weeks 4 weeks 12 weeks 13 weeks
28 weeks
180 days
1993 12 120-3001994 12 72-2641995 12 72-1501996 12 72-109
1997 12 45.0-50.01998 12 23.31999 12 11.42000 12 8.6 8.5 8.5 10.5 5.0
2001 12 8.6 6.8 8.1 8.8 13.72002 12 9.9 10.0 7.6 10.9 11.42003 12 11.5 9.2 9.9 11.9 13.72004 12 15.75 15.47 15.49 15.79 15.90 15.96
2005 12 4.75 1.88 4.44 3.65 3.80 9.132006 12 6.42 5.09 7.39 10.052007 12 8.40 9.85 8.40 11.50 12.62
03 9.75 11.25 9.75 14.35 15.0806 9.75 15.42 9.75 17.98 16.0609 10.25 16.06 10.25 13.85 16.68
2008 12 9.75 14.78 9.75 17.77 16.73
03 14.00 13.59 14.00 19.82 16.4406 11.50 16.48 11.50 16.34 13.8209 10.00 11.95 10.00 11.91
2009 12 10.00 10.82 10.00 10.95
01 10.00 10.45 10.00 11.0502 10.00 10.36 10.00 9.9903 10.00 10.03 10.00 10.47
04 10.00 10.03 10.00 9.8105 11.00 10.24 111.00 10.9106 11.00 10.87 10.86 11.11
07 11.00 11.27 10.97 11.6108 11.00 11.21 10.87 11.6809 11.00 11.01 10.50 11.17
10 11.00 10.07 9.02 10.7011 11.00 10.44 11.00 9.65
2010 12 11.00 10.99 10.99 10.22
01 11.00 10.77 10.82 10.6302 11.00 10.93 10.96 10.8103 11.00 10.81 11.00 10.50
04 11.50 10.95 10.98 10.86 14.1005 11.50 11.37 11.40 11.27 12.5106 11.50 11.65 11.49 11.72 12.59
07 11.50 11.67 11.49 11.72 12.5508 11.75 11.63 11.5 11.63 12.4009 11.75 11.77 11.75 11.62 12.43
10 12.25 12.23 11.82 12.29 12.8911 12.25 13.22 12.25 13.68 13.12
2011 12 12.25 14.25 12.25 15.28 13.72
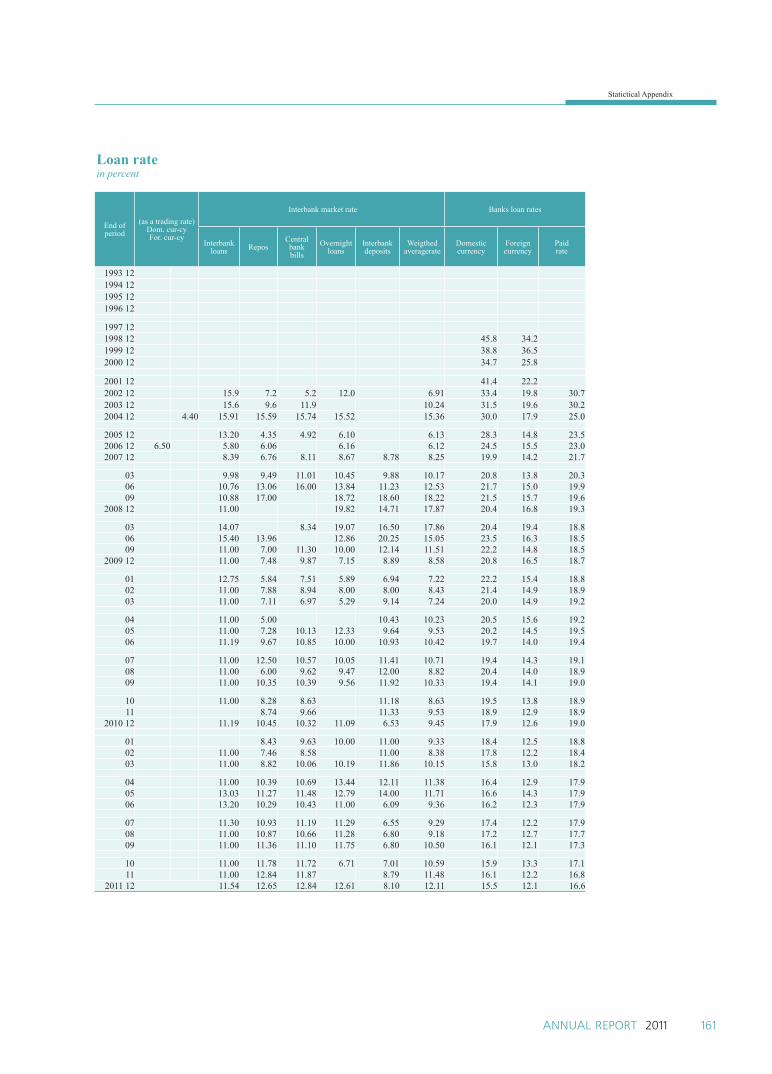
Statictical Appendix
161ANNUAL REPORT 2011
Loan rate in percent
End ofperiod
(as a trading rate)Dom. cur-cyFor. cur-cy
Interbank market rate Banks loan rates
Interbank loans Repos
Central bank bills
Overnight loans
Interbankdeposits
Weigthed averagerate
Domesticcurrency
Foreign currency
Paid rate
1993 121994 121995 121996 12
1997 121998 12 45.8 34.21999 12 38.8 36.52000 12 34.7 25.8
2001 12 41.4 22.22002 12 15.9 7.2 5.2 12.0 6.91 33.4 19.8 30.72003 12 15.6 9.6 11.9 10.24 31.5 19.6 30.22004 12 4.40 15.91 15.59 15.74 15.52 15.36 30.0 17.9 25.0
2005 12 13.20 4.35 4.92 6.10 6.13 28.3 14.8 23.52006 12 6.50 5.80 6.06 6.16 6.12 24.5 15.5 23.02007 12 8.39 6.76 8.11 8.67 8.78 8.25 19.9 14.2 21.7
03 9.98 9.49 11.01 10.45 9.88 10.17 20.8 13.8 20.306 10.76 13.06 16.00 13.84 11.23 12.53 21.7 15.0 19.909 10.88 17.00 18.72 18.60 18.22 21.5 15.7 19.6
2008 12 11.00 19.82 14.71 17.87 20.4 16.8 19.3
03 14.07 8.34 19.07 16.50 17.86 20.4 19.4 18.806 15.40 13.96 12.86 20.25 15.05 23.5 16.3 18.509 11.00 7.00 11.30 10.00 12.14 11.51 22.2 14.8 18.5
2009 12 11.00 7.48 9.87 7.15 8.89 8.58 20.8 16.5 18.7
01 12.75 5.84 7.51 5.89 6.94 7.22 22.2 15.4 18.802 11.00 7.88 8.94 8.00 8.00 8.43 21.4 14.9 18.903 11.00 7.11 6.97 5.29 9.14 7.24 20.0 14.9 19.2
04 11.00 5.00 10.43 10.23 20.5 15.6 19.205 11.00 7.28 10.13 12.33 9.64 9.53 20.2 14.5 19.506 11.19 9.67 10.85 10.00 10.93 10.42 19.7 14.0 19.4
07 11.00 12.50 10.57 10.05 11.41 10.71 19.4 14.3 19.108 11.00 6.00 9.62 9.47 12.00 8.82 20.4 14.0 18.909 11.00 10.35 10.39 9.56 11.92 10.33 19.4 14.1 19.0
10 11.00 8.28 8.63 11.18 8.63 19.5 13.8 18.911 8.74 9.66 11.33 9.53 18.9 12.9 18.9
2010 12 11.19 10.45 10.32 11.09 6.53 9.45 17.9 12.6 19.0
01 8.43 9.63 10.00 11.00 9.33 18.4 12.5 18.802 11.00 7.46 8.58 11.00 8.38 17.8 12.2 18.403 11.00 8.82 10.06 10.19 11.86 10.15 15.8 13.0 18.2
04 11.00 10.39 10.69 13.44 12.11 11.38 16.4 12.9 17.905 13.03 11.27 11.48 12.79 14.00 11.71 16.6 14.3 17.906 13.20 10.29 10.43 11.00 6.09 9.36 16.2 12.3 17.9
07 11.30 10.93 11.19 11.29 6.55 9.29 17.4 12.2 17.908 11.00 10.87 10.66 11.28 6.80 9.18 17.2 12.7 17.709 11.00 11.36 11.10 11.75 6.80 10.50 16.1 12.1 17.3
10 11.00 11.78 11.72 6.71 7.01 10.59 15.9 13.3 17.111 11.00 12.84 11.87 8.79 11.48 16.1 12.2 16.8
2011 12 11.54 12.65 12.84 12.61 8.10 12.11 15.5 12.1 16.6

Statictical Appendix
162 ANNUAL REPORT 2011
Exchange rates on foreign exchange marketTogrog against foreign currency
End-of-period
USD
EUR SEK BGN HUF CZK KRW JPY CNY GBP HKD RUB CHFend-of-period
monthly average
1993 12 396.51 395.03 3.55 592.70 51.32 275.011994 12 414.09 413.00 4.12 48.60 639.77 53.51 0.12 310.991995 12 473.62 473.48 4.63 56.94 731.27 61.23 0.10 409.531996 12 693.51 692.76 0.82 5.98 83.57 1,172.48 89.64 0.12 514.28
1997 12 813.16 811.95 0.49 6.28 98.21 1,358.14 104.93 0.14 565.931998 12 902.00 891.86 0.74 7.71 108.96 1,508.05 116.45 42.65 656.721999 12 1,072.37 1,070.39 1,086.85 0.95 10.42 129.53 1,734.56 137.99 39.95 676.152000 12 1,097.00 1,097.00 1,006.61 0.89 9.74 132.52 1,615.11 140.66 39.18 659.53
2001 12 1,102.00 1,101.29 973.60 0.83 8.39 133.10 1,598.60 141.30 36.20 657.302002 12 1,125.00 1,124.09 1,169.40 128.00 599.30 5.00 37.30 0.94 9.38 135.90 1,804.00 144.30 35.40 804.002003 12 1,168.00 1,170.30 1,460.20 160.60 746.50 5.60 44.90 0.98 10.92 141.10 2,073.40 150.50 39.90 935.702004 12 1,209.00 1,211.77 1,647.40 183.20 842.40 6.70 54.00 1.16 11.65 146.10 2,320.90 155.50 43.40 1,067.70
2005 12 1,221.00 1,226.68 1,449.10 153.82 741.20 5.80 50.10 1.21 10.37 151.30 2,103.70 157.50 42.50 930.102006 12 1,165.00 1,164.84 1,535.30 169.83 785.00 6.10 55.80 1.25 9.81 149.20 2,290.90 149.80 44.30 955.002007 12 1,169.97 1,170.22 1,717.16 181.49 877.99 6.78 64.49 1.25 10.33 160.18 2,337.54 149.99 47.68 1,032.58
03 1,168.17 1,170.84 1,841.68 196.03 941.54 7.17 72.88 1.18 11.69 166.58 2,329.74 150.12 49.67 1,170.7506 1,158.12 1,159.22 1,823.23 193.81 932.13 7.64 75.73 1.11 10.88 168.78 2,296.20 148.44 49.39 1,133.1909 1,146.10 1,148.24 1,643.95 169.34 840.55 6.79 67.02 0.96 10.79 167.43 2,074.02 147.47 46.31 1,036.86
2008 12 1,267.51 1,228.97 1,786.75 163.07 913.52 6.67 67.20 1.01 14.04 185.25 1,837.19 163.55 43.12 1,202.57
03 1,524.07 1,562.95 2,009.71 182.97 1,027.52 6.53 73.22 1.10 15.84 222.94 2,157.63 196.65 44.60 1,325.8506 1,435.49 1,428.56 2,012.13 184.23 1,029.06 7.28 77.43 1.12 15.03 210.08 2,371.79 185.22 45.93 1,318.9009 1,426.01 1,418.47 2,078.84 202.92 1,062.84 7.71 82.52 1.20 15.89 208.85 2,261.65 184.00 47.35 1,376.39
2009 12 1,442.84 1,446.52 2,071.34 200.66 1,058.97 7.59 78.45 1.24 15.66 211.35 2,295.77 186.05 47.67 1,392.03
01 1,455.70 1,455.09 2,031.94 198.42 1,038.97 7.48 77.43 1.25 16.14 213.23 2,352.56 187.39 47.87 1,384.6702 1,449.82 1,446.08 1,966.10 201.61 1,005.25 7.27 75.70 1.25 16.22 212.38 2,211.63 186.77 48.24 1,343.5503 1,367.10 1,412.82 1,847.43 189.20 944.52 6.97 72.74 1.21 14.77 200.28 2,057.90 176.07 46.51 1,288.87
04 1,372.46 1,382.64 1,812.75 188.05 926.84 6.74 70.86 1.23 14.59 201.05 2,088.88 176.71 46.90 1,263.8305 1,384.85 1,387.24 1,710.29 177.07 874.61 6.23 66.72 1.16 15.16 202.73 2,009.28 177.82 45.36 1,199.7306 1,368.65 1,380.33 1,671.94 175.42 854.87 5.82 64.78 1.12 15.43 201.42 2,058.31 175.82 43.82 1,258.47
07 1,353.49 1,365.63 1,766.85 186.99 903.35 6.21 71.35 1.14 15.67 199.83 2,116.05 174.27 44.78 1,304.9508 1,301.80 1,325.13 1,657.45 176.62 847.53 5.85 66.99 1.09 15.29 191.37 2,026.71 167.33 42.44 1,264.6209 1,325.59 1,324.81 1,804.39 197.21 922.60 6.53 73.34 1.16 15.85 198.16 2,097.08 170.88 43.61 1,358.12
10 1,283.38 1,306.77 1,778.83 189.45 909.49 6.51 72.18 1.14 15.91 192.26 2,040.96 165.45 41.66 1,297.7211 1,246.69 1,274.15 1,658.16 179.28 847.54 5.94 66.99 1.08 14.87 187.09 1,950.38 160.59 39.88 1,247.63
2010 12 1,256.47 1,234.08 1,662.31 184.92 849.94 5.95 65.63 1.11 15.42 190.21 1,949.35 161.43 41.35 1,332.84
01 1,245.46 1,256.42 1,696.81 191.22 867.58 6.19 69.97 1.11 15.18 188.82 1,977.17 159.78 41.81 1,322.9902 1,254.51 1,253.41 1,726.58 195.97 882.84 6.34 70.56 1.11 15.36 190.87 2,019.45 161.04 43.36 1,352.4303 1,195.27 1,228.45 1,695.61 189.93 866.92 6.37 69.08 1.09 14.43 182.51 1,928.99 153.54 42.03 1,305.02
04 1,258.47 1,219.90 1,867.44 209.28 954.80 7.07 77.44 1.18 15.43 193.84 2,097.55 161.96 45.87 1,442.2105 1,245.35 1,235.71 1,974.36 201.92 917.32 6.73 73.29 1.15 15.26 192.20 2,056.88 160.11 44.55 1,465.5506 1,258.64 1,257.29 1,821.06 198.71 930.98 6.85 74.91 1.18 15.66 194.72 2,011.87 161.73 45.16 1,507.99
07 1,251.25 1,246.93 1,785.66 196.42 913.02 6.62 73.77 1.19 16.13 194.30 2,038.10 160.53 45.13 1,560.8408 1,248.67 1,238.63 1,805.58 196.94 923.20 6.64 74.97 1.17 16.30 195.80 2,037.52 160.19 43.15 1,537.8709 1,285.64 1,259.89 1,738.76 187.65 889.07 5.93 70.47 1.09 16.77 201.35 2,002.19 165.01 40.01 1,426.35
10 1,297.67 1,291.94 1,822.06 201.71 931.83 6.06 73.82 1.17 16.47 204.23 2,081.72 167.07 43.07 1,492.0011 1,340.90 1,323.42 1,779.58 193.35 909.92 5.70 69.33 1.17 17.19 210.36 2,083.96 172.18 42.69 1,451.90
2011 12 1,396.37 1,374.20 1,806.76 202.11 923.62 5.82 70.12 1.21 18.00 221.63 2,155.30 179.72 43.44 1,484.08

Statictical Appendix
163ANNUAL REPORT 2011
Exchange rates on foreign exchange marketcontinued
End-of-period EGP CAD AUD THB IDR MYR SGD XAU XAG SDR REER NEER
1993 12 298.28 549.621994 12 295.08 602.191995 12 347.61 708.531996 12 506.86 999.35
1997 12 567.27 1,095.061998 12 582.16 547.97 24.73 0.11 237.68 543.18 257,761.60 4,446.86 1,271.241999 12 730.75 691.09 28.52 0.15 282.20 642.41 308,574.47 5,651.60 1,473.722000 12 720.81 608.56 26.10 0.12 288.68 634.84 300,358.60 5,062.66 1,426.96 100.00 100.00
2001 12 691.00 559.70 24.90 0.11 290.00 595.90 306,080.50 4,937.00 1,382.40 109.21 103.432002 12 242.80 720.60 634.90 26.00 0.13 296.10 647.60 393,187.50 5,298.80 1,519.20 104.61 100.652003 12 188.80 892.60 872.10 29.50 0.14 307.40 686.40 485,537.60 6,926.20 1,729.00 99.29 92.332004 12 197.70 999.00 936.70 31.00 0.13 318.20 738.40 528,151.70 8,263.50 1,875.00 98.77 85.91
2005 12 212.40 1,048.30 892.60 29.80 0.12 323.00 733.10 625,152.00 10,897.40 1,751.80 107.00 86.562006 12 204.00 1,004.20 923.20 32.30 0.13 330.70 760.20 738,959.50 15,034.30 1,751.20 109.18 86.652007 12 211.66 1,194.58 1,024.02 34.75 0.12 352.61 808.74 969,437.14 17,204.41 1,833.66 111.64 81.59
03 213.85 1,148.53 1,073.08 37.06 0.13 365.57 845.67 1,101,467.49 21,313.26 1,923.56 113.40 78.6706 216.47 1,146.37 1,112.08 34.49 0.13 354.87 849.15 1,064,428.09 20,110.75 1,883.26 129.45 79.0209 210.10 1,099.68 936.53 33.64 0.12 332.54 799.06 996,181.43 14,859.06 1,800.26 139.34 81.81
2008 12 229.41 1,027.82 875.03 38.68 0.11 363.86 878.75 1,110,719.01 13,765.16 1,973.04 131.39 80.01
03 270.31 1,217.50 1,034.77 42.88 0.13 416.93 1,001.39 1,412,508.08 20,292.99 2,279.37 110.74 66.2606 256.29 1,242.42 1,151.84 42.13 0.14 405.73 986.15 1,349,073.50 20,161.46 2,226.47 118.71 69.4309 259.32 1,316.18 1,245.69 42.44 0.15 408.48 1,005.37 1,414,815.89 23,022.93 2,254.10 114.62 69.07
2009 12 262.86 1,376.89 1,288.38 43.26 0.15 421.08 1,027.96 1,581,641.21 24,593.21 2,264.28 109.61 67.07
01 266.34 1,366.28 1,298.70 43.93 0.16 426.58 1,036.60 1,574,630.69 23,545.95 2,265.91 111.38 66.9202 264.08 1,368.01 1,287.08 43.86 0.16 426.07 1,029.26 1,610,532.55 23,371.10 2,217.30 116.42 67.7703 248.43 1,342.20 1,257.12 42.28 0.15 418.39 977.30 1,519,873.43 23,828.55 2,076.31 120.80 68.95
04 246.89 1,360.29 1,270.62 42.45 0.15 428.09 999.86 1,602,347.05 24,807.21 2,067.63 125.71 70.2005 244.67 1,318.15 1,181.90 42.56 0.15 420.54 987.49 1,681,069.42 25,640.50 2,037.54 133.10 71.3506 240.61 1,310.65 1,176.29 42.22 0.15 421.71 981.57 1,690,351.18 25,395.30 2,025.05 135.14 72.26
07 237.41 1,308.54 1,216.45 41.95 0.15 425.56 994.26 1,583,008.07 23,814.66 2,059.54 129.25 72.0008 228.23 1,241.52 1,170.51 41.62 0.14 414.85 961.66 1,610,001.15 24,929.47 1,966.86 134.04 73.7809 232.61 1,288.92 1,286.88 43.51 0.15 429.90 1,006.75 1,737,450.81 29,017.17 2,048.65 131.17 73.57
10 222.24 1,255.81 1,249.56 42.82 0.14 412.63 987.79 1,719,376.27 30,698.45 2,014.34 128.67 73.3711 215.84 1,225.49 1,209.10 41.33 0.14 396.09 948.13 1,703,726.55 33,828.93 1,921.45 133.31 75.70
2010 12 216.45 1,256.91 1,277.58 41.67 0.14 407.48 972.01 1,775,574.30 38,674.15 1,926.40 140.56 78.26
01 212.63 1,246.33 1,239.79 40.12 0.14 406.81 970.21 1,665,049.25 34,791.93 1,948.27 138.91 75.6302 213.12 1,284.83 1,275.40 41.00 0.14 411.11 986.33 1,773,249.89 42,082.54 1,969.04 137.32 75.0503 200.36 1,231.09 1,235.13 39.51 0.14 395.00 948.55 1,706,427.22 45,139.37 1,970.04 136.46 75.85
04 211.61 1,321.78 1,374.82 42.09 0.14 424.37 1,026.02 1,929,089.79 60,784.10 2,038.30 134.87 75.5805 209.36 1,283.14 1,333.33 41.09 0.15 413.60 1,010.84 1,917,403.13 48,082.96 1,983.82 136.08 74.4606 210.83 1,302.74 1,350.21 40.92 0.15 416.35 1,023.37 1,898,947.93 43,800.67 2,010.41 137.30 73.18
07 210.01 1,315.17 1,367.43 42.07 0.15 421.94 1,037.52 2,017,822.06 49,355.56 2,003.85 139.71 73.5508 209.75 1,277.67 1,333.64 41.67 0.15 418.60 1,038.05 2,282,568.76 51,576.31 2,008.29 140.91 74.2509 215.52 1,231.81 1,252.79 41.32 0.15 403.09 991.62 2,092,359.82 39,726.28 2,014.91 141.71 74.60
10 217.36 1,300.27 1,371.18 42.26 0.15 423.04 1,040.80 2,224,375.08 44,756.64 2,072.35 137.97 73.1811 223.33 1,295.49 1,335.60 42.97 0.15 422.26 1,033.53 2,294,212.86 42,419.37 2,073.35 135.24 71.32
2011 12 231.54 1,368.72 1,417.11 44.26 0.15 439.66 1,073.84 2,177,583.16 38,574.72 2,137.00 132.56 69.17

Statictical Appendix
164 ANNUAL REPORT 2011
Copyright © 2022 FDOKUMEN