Private Equity and Venture Capital as Funding Alternatives to Small and Middle Enterprises in Brazil
Upload
khangminh22Category
view
3download
0
1

Venture Capital Bank B.S.C.(c)
Venture Capital Bank BuildingBuilding 247Road 1704, Block 317Diplomatic Area
P.O. Box 11755, ManamaKingdom of BahrainTel: +973 1751 8888Fax: +973 1751 8880
www.vc-bank.com
Licensed as an Islamic Wholesale Bank by the CBB

Vision, Mission, Values and Corporate Profile 3Chairman’s Statement 4Board of Directors 6Shari’ah Supervisory Board 8CEO’s Report 10Executive Management 12Investment Review 14Investment Placement 24Operations & Support Review 26Corporate Governance 27 Consolidated Financial Statements 39 Basel II - Pillar 3 Disclosures 93
CONTENTS
CORPORATE PROFILEVenture Capital Bank (VCBank) is the first Islamic investment bank in the GCC and MENA region to specialise in small-to-medium enterprises (SMEs)and venture capital investment opportunities. Incorporated in the Kingdom of Bahrain in October 2005, VCBank operates under an Islamic wholesale banking licence from the Central Bank of Bahrain. With an authorised capital of USD 500 million and paid up capital of USD 250 million, the Bank benefits from the financial backing and support of a prominent group of regional shareholders; an experienced team of industry professionals; and a close-knit network of strategic partners, business associates and allies.
VCBank offers clients a broad array of superior services and unique investment opportunities across a number of promising asset classes in the GCC and MENA markets. The Bank is active in four principal areas: venture capital and business development, private equity, real estate, and financial advisory.
VCBank is uniquely positioned to lead the development of the nascent venture capital industry in the region by providing unmatched levels of support for fundamentally strong and undervalued small-to-medium enterprises (SMEs) that lack the necessary resources for growth and expansion.
VISIONOur vision is to be the leading regional Islamic venture capital based investment bank, helping to drive business growth, and supporting the social and economic development of the GCC and MENA region.
We aim to maximise shareholders’ value and clients’ wealth, and to add a new dimension to the Islamic banking industry.
MISSIONOur mission is to create a pioneering business model and take a leadership role in institutionalising investment in the regional venture capital market.
By forging enduring strategic partnerships, we aim to provide support and encouragement for the growth and development of the under-served small-to-medium enterprises (SMEs) sector in the GCC and MENA region, which lacks the necessary resources for growth and expansion.
VALUESOur values of performance, innovation, client focus, teamwork, and compliance with the rules and principles of Islamic Shari’ah, guide us in our personal and professional behaviour.
Our adoption of international standards and global best practice govern the way we manage the operations of the Bank across all areas of activity.
VCBANK VISION, MISSION, VALUES AND CORPORATE PROFILE
4 VCBANK Annual Report 2011
In the Name of Allah, the Most Beneficent, the Most Merciful, Prayers and Peace be upon our Prophet Mohammed, His Companions and Relatives.
On behalf of the Board of Directors, it is my privilege to present the annual report of Venture Capital Bank (VCBank) for the year ended 31 December 2011. Even more challenging than 2010, this proved to be another extremely difficult year for the investment banking industry and our Bank.
The numerous challenges facing the Bank during 2011 ranged from the ongoing global economic downturn and financial crisis to the Eurozone sovereign debt issue, the Arab Spring, and regional geo-political tensions. The value of most asset classes fell, and international and regional markets witnessed unprecedented levels of volatility.
These issues had a serious impact on business sentiment and investor confidence, with the regional investment banking sector being noticeably affected. The number of investment deals during the year decreased, and they also took much longer to close. Being MENA-focused, the Bank was particularly affected by the consequences of regional political events, with one portfolio company based in Libya being forced to shut down operations for most of the year.In the light of such turbulent and uncertain market conditions, the Board took a very close look at all our investment projects and made a prudent decision to book conservative provisions for 2011 in order to protect the balance sheet.
These were more severe than recommended by the auditors, since we were determined to clear the investment portfolio of all potential impairments, both short and long term. As a result, we are reporting total impairment provisions of USD 35.2 million and fair value losses of USD 22.9 million for 2011, mostly related to real estate assets or the Arab Spring countries. Consequently, the Bank recorded a net loss of USD 58.7 million for 2011, compared with a net loss of USD 47.6 million for the previous year.
This loss should not be interpreted as a negative reflection of the Bank’s financial position or capabilities. Strongly capitalised at USD 250 million, with liquid assets of USD 14 million, and currently unleveraged, VCBank is a financially strong and solid institution. At the end of 2011, our capital adequacy ratio was 37 per cent, considerably higher than the minimum requirement of the Central Bank of Bahrain, while assets under management had risen to USD 810 million.
Importantly, the Bank also continued to demonstrate its ability to book new business despite adverse market conditions. During 2011, we launched and placed two
CH
AIR
MA
N’S
STA
TEM
ENT
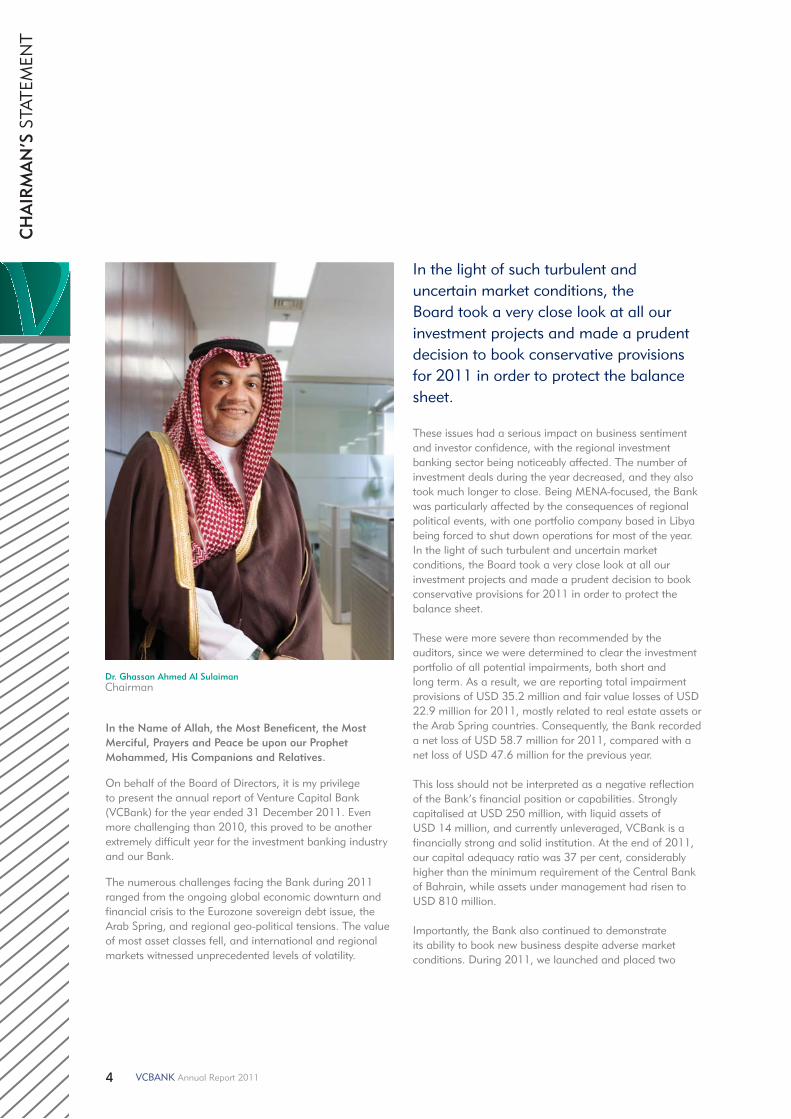
In the light of such turbulent and uncertain market conditions, the Board took a very close look at all our investment projects and made a prudent decision to book conservative provisions for 2011 in order to protect the balance sheet.
5SOWING THE SEEDS OF SUCCESS
important new investment offerings that complement our distinct competencies in agribusiness and shipping. At the same time, we maintained a reasonable rate of growth in our venture capital and private equity portfolios, and adopted a pragmatic and professional approach to managing our real estate portfolio.
Nevertheless, with the investment banking industry undergoing a paradigm shift, and with external events increasingly beyond our control, we recognised the need to review our strategy and business model, in order to ensure the future viability of the Bank. Accordingly, the Board and Management took part in a series of strategic workshops towards the end of the year. We looked at how other international and regional investment banks have adapted to the aftermath of the global financial crisis, and studied their new business models to see how these could be customised for the Bank. We fully realise that we are not strong enough to swim against the tide, and need to adapt to new market dynamics. The elements of our new strategy include reducing costs, utilising our assets more effectively, operating more efficiently, and focusing on a few select sectors and geographies to minimise risk. We expect to make a decision on our new strategy and business model during the first quarter of 2012.
However, we also recognised the need for decisive action to address the immediate situation. As a result of constructive dialogue between the Board and Management, we took the difficult decision to reduce the headcount by an initial 35 per cent, looked at other areas where costs could be reduced, and reviewed our asset classes and geographic presence on a case-by-case basis. We also further strengthened our corporate governance and risk management framework. In line with our commitment to protect our shareholders and investors, and the image of the Bank, we called off one particular deal which had been partially placed, and refunded investors, due to uncertain market conditions.
Looking ahead, we have a cautiously optimistic outlook for 2012. The Bank has a strong management team, a supportive Board, a healthy pipeline of deals, and a clean portfolio. Provided there is no repetition of the uncontrollable surprises that marked 2011, and assuming a return to social and political stability in the MENA region, the Bank is in good shape to seize new business opportunities and return to profitability. However,
given the prospect of continued economic and market unpredictability, both globally and regionally, we fully expect 2012 to be another very challenging year.
On behalf of the Board of Directors, I extend my sincere appreciation to His Majesty the King of Bahrain, His Royal Highness the Prime Minister, and His Royal Highness the Crown Prince, for their wise leadership and reform programme, and their encouragement for the Islamic banking sector. My thanks are also due to the Central Bank of Bahrain and other Government institutions for their continued support, professional advice and assistance during the year.
I would also like to express my gratitude to our shareholders, clients and business partners for their loyalty and support; to our Shari’ah Supervisory Board for their guidance and supervision; and to the Bank’s management and staff for their highly valued dedication and professionalism.
May Allah guide us on the proper path, and lead us to the realisation of our goals for the future success of the Bank.
Dr. Ghassan Ahmed Al SulaimanChairman of the Board

6 VCBANK Annual Report 2011
BO
AR
D O
F D
IREC
TOR
S
Dr. Ghassan Ahmed Al SulaimanChairman - Kingdom of Saudi Arabia
Abdulfatah MohammedRafei MarafieDeputy Chairman - State of Kuwait
Abdullatif Mohamed JanahiBoard Member & Chief Executive Officer - Kingdom of Bahrain
Ali Mousa Al MousaBoard Member - State of Kuwait
Marwan Ahmad Al GhurairBoard Member - United Arab Emirates
Saleh Mohammed Al ShanfariBoard Member - Sultanate of Oman

7SOWING THE SEEDS OF SUCCESS
Nedhal Saleh Al AujanBoard Member - Kingdom of Bahrain
Mohammed Bin Sulaiman AbanumayBoard Member - Kingdom of Saudi Arabia
Ibrahim Hamad Al BabtainBoard Member - Kingdom of Saudi Arabia
Ajlan Abdulaziz Al AjlanBoard Member - Kingdom of Saudi Arabia
Sulaiman Ibrahim Al HudaithiBoard Member - Kingdom of Saudi Arabia
Abdulhadi Treheeb Al ShahwaniBoard Member - State of Qatar

8 VCBANK Annual Report 2011
SHA
RI’A
H S
UPE
RV
ISO
RY
BO
AR
D
9
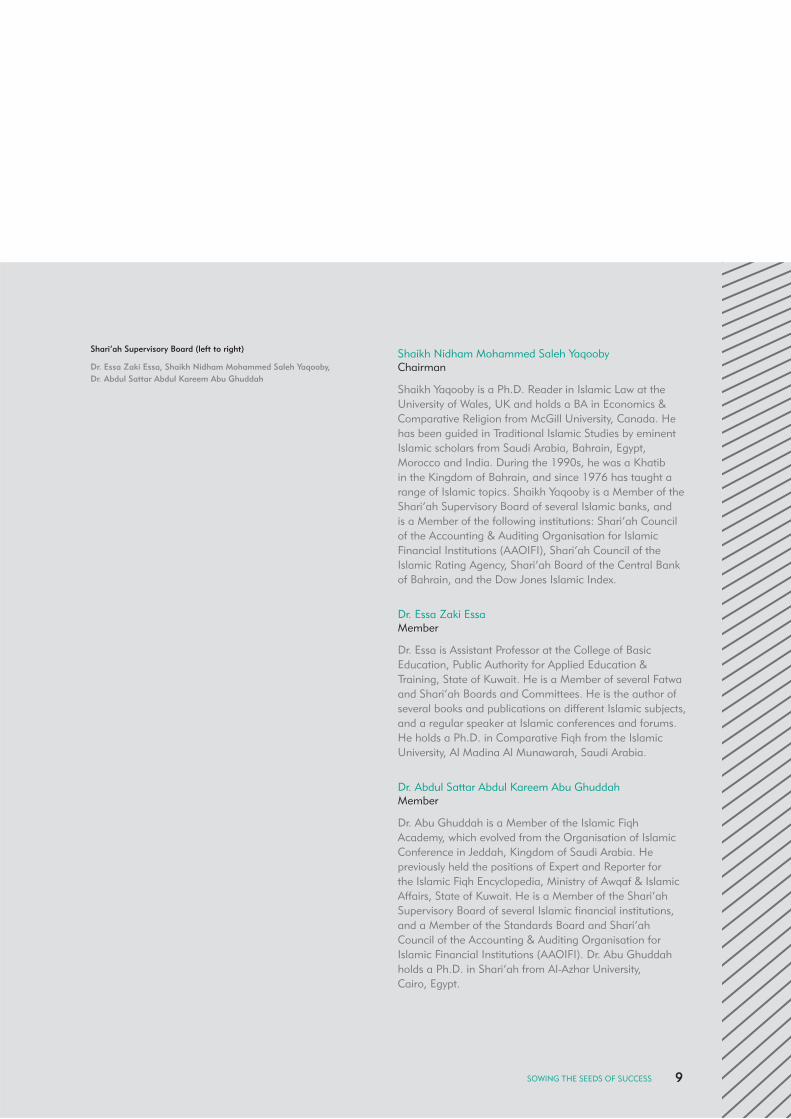
Shari’ah Supervisory Board (left to right)
Dr. Essa Zaki Essa, Shaikh Nidham Mohammed Saleh Yaqooby,Dr. Abdul Sattar Abdul Kareem Abu Ghuddah
Shaikh Nidham Mohammed Saleh YaqoobyChairman
Shaikh Yaqooby is a Ph.D. Reader in Islamic Law at the University of Wales, UK and holds a BA in Economics & Comparative Religion from McGill University, Canada. He has been guided in Traditional Islamic Studies by eminent Islamic scholars from Saudi Arabia, Bahrain, Egypt, Morocco and India. During the 1990s, he was a Khatib in the Kingdom of Bahrain, and since 1976 has taught a range of Islamic topics. Shaikh Yaqooby is a Member of the Shari’ah Supervisory Board of several Islamic banks, and is a Member of the following institutions: Shari’ah Council of the Accounting & Auditing Organisation for Islamic Financial Institutions (AAOIFI), Shari’ah Council of the Islamic Rating Agency, Shari’ah Board of the Central Bank of Bahrain, and the Dow Jones Islamic Index.
Dr. Essa Zaki EssaMember
Dr. Essa is Assistant Professor at the College of Basic Education, Public Authority for Applied Education & Training, State of Kuwait. He is a Member of several Fatwa and Shari’ah Boards and Committees. He is the author of several books and publications on different Islamic subjects, and a regular speaker at Islamic conferences and forums. He holds a Ph.D. in Comparative Fiqh from the Islamic University, Al Madina Al Munawarah, Saudi Arabia.
Dr. Abdul Sattar Abdul Kareem Abu GhuddahMember
Dr. Abu Ghuddah is a Member of the Islamic Fiqh Academy, which evolved from the Organisation of Islamic Conference in Jeddah, Kingdom of Saudi Arabia. He previously held the positions of Expert and Reporter for the Islamic Fiqh Encyclopedia, Ministry of Awqaf & Islamic Affairs, State of Kuwait. He is a Member of the Shari’ah Supervisory Board of several Islamic financial institutions, and a Member of the Standards Board and Shari’ah Council of the Accounting & Auditing Organisation for Islamic Financial Institutions (AAOIFI). Dr. Abu Ghuddah holds a Ph.D. in Shari’ah from Al-Azhar University, Cairo, Egypt.
SOWING THE SEEDS OF SUCCESS
10 VCBANK Annual Report 2011
CEO
’S R
EPO
RT
In the name of Allah, the Most Beneficent, the Most Merciful, Prayers and Peace be upon our Prophet Moham-med, His Companions and Relatives.
Without exception, 2011 was an extremely challenging year for the regional investment banking sector. With the global financial and economic turmoil showing no signs of abating, investors continued to adopt a very cautious, risk-averse approach. For VCBank in particular, as an Islamic investment bank headquartered in Bahrain and focused on the MENA region, we were affected by the domino effect of the Arab Spring and the unrest in Bahrain during the year. With investors increasingly uncertain about the future, it proved to be extremely difficult to arrange and place new investment offerings.
Given such a scenario, the Board and Management met together towards the end of 2011 to review the Bank’s strategy and business model. These initially served us well, but for the past three years of our six-year history, we have been operating under the shadow of a severe global financial crisis and economic downturn, combined with the regional social unrest and geo-political tensions that have marked most of 2011. During this period the investment banking sector in the region has been reinventing itself in line with changing market dynamics, and we decided that we needed to do the same. Accordingly, we identified key areas that needed addressing. These included optimising the balance sheet, reducing our cost base, refocusing our investment activities, and restructuring the organisation to improve efficiency and maximise synergies.
In line with this strategic realignment, we took a number of initial remedial steps. We reduced our headcount by a third, mostly through voluntary resignations, carrying out this exercise in a most considerate and caring manner; and we eliminated all unnecessary operating costs. While these measures resulted in a 25 per cent reduction of total expenses in 2011, the full benefit will only be realised in 2012. At the same time, we reviewed our investment port-folio by asset class, sector and geography, and associated risks. Our future investment strategy will entail focusing on key sectors in which we have built particular expertise, such as healthcare, agribusiness, oil and gas, and shipping; and on more economically and politically stable markets in the MENA region. Most importantly, we booked extremely conservative provisions against impairments, providing for all possible circumstances, so as to rule out any future sur-prises. We then developed plans to restructure the existing three autonomous investment divisions into one integrated division, in order to improve operating efficiency and staff motivation, and provide more resources for private equity investment activities.
By drawing upon our investment track record, and the enduring relationships we have developed with our investor base, we were successful in arranging and placing two significant deals in 2011.
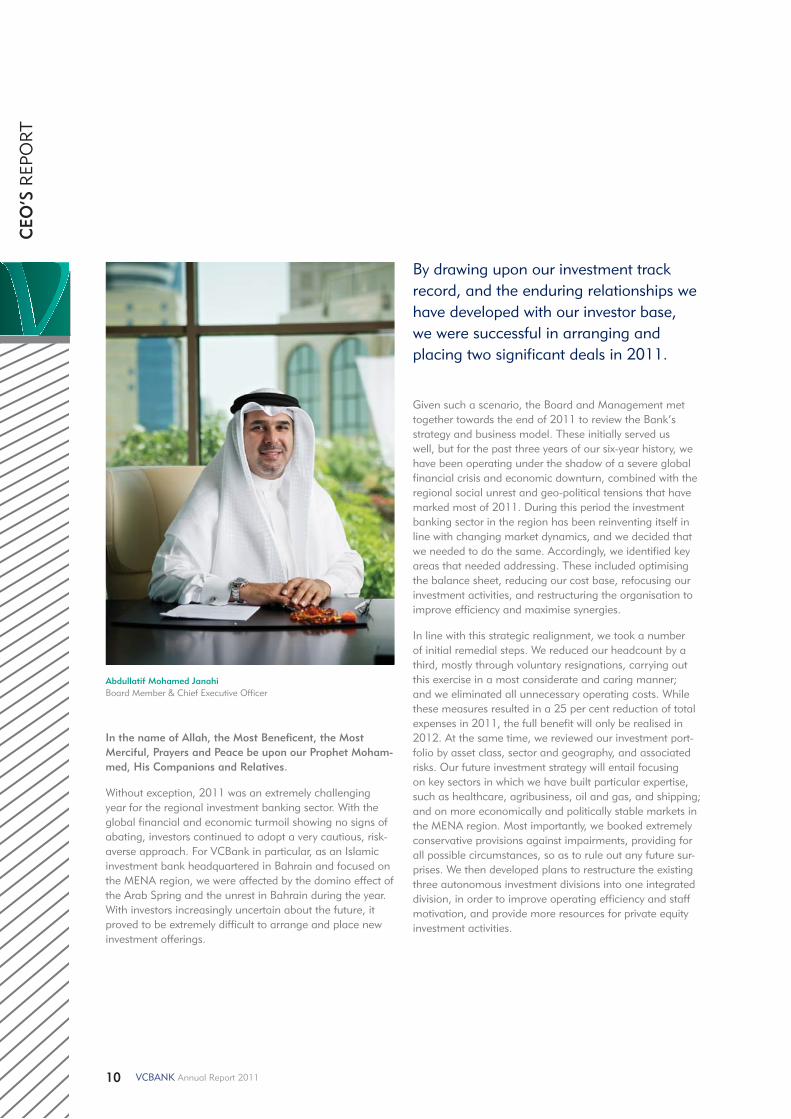
Abdullatif Mohamed JanahiBoard Member & Chief Executive Officer
11SOWING THE SEEDS OF SUCCESS
By drawing upon our investment track record, and the enduring relationships we have developed with our investor base, we were successful in arranging and placing two significant deals in 2011. The first was SHIPCO, a USD 33.5 million shipping capital lease project, entailing a capital lease through sale and leaseback on a bareboat basis of three one-year-old Supramax 57,000 dwt bulk carriers. The lessee is an international provider of marine transportation services, currently operating its own fleet of seven Supramax vessels. It is also the world’s largest transporter of rice, which is a staple, recession-proof consumable commodity.
In a second deal valued at USD 93.7 million, VCBank took an indirect investment in 65 per cent of the shares of Göknur Foods Import Export Trading & Distribution Company in Turkey. Established in 1993, Göknur is the largest fruit juice concentrate and fruit puree producer and exporter in Turkey, with a 50 per cent market share. Politically and socially stable, Turkey has posted a remarkable economic performance over the past eight years. Underlying the successful placement of these deals is our experience in the regional agribusiness and shipping sectors, marked by key investments such as Jordan Al Abyad Fertilizers & Chemicals Company (JAFCCO), and Lemissoler Maritime Company.
While the performance of some of our portfolio companies were affected during the year – such as Challenger Limited, an oil and gas drilling company operating in Libya, due to the Libyan crisis; and Lemissoler Maritime Company, due the downturn in international trade – others performed extremely well. For example, Qatar Engineering & Construction Company (QCon), a leading engineering, procurement and construction (EPC) contracting company, benefited from the increased project activity in Qatar, and returned its first dividend in 2011 of 14 per cent. SHIPCO also successfully distributed dividends in 2011. In another important development, Saudi Venture Capital Investment Company (SVCIC) obtained a business commencement licence from Saudi Arabia’s Capital Market Authority in June 2011. The company, which invests in small and medium enterprises in Saudi Arabia, has been active in sourcing investment opportunities for 2012. We will maximise the synergies between SVCIC and VCBank to benefit from the huge business potential that Saudi Arabia has to offer.
The actions that we have taken in 2011 will result in VCBank becoming a leaner, more efficient and focused institution, backed by strong underlying financial fundamentals. This will enable us to continue to protect the interests of all stakeholders, and focus on advancing our realigned strategic objectives and business goals. The decision to book very conservative provisions, and post a loss for the year, will enable VCBank to start 2012 in a much stronger position. With a clean balance sheet, healthy portfolio, adequate liquidity, and a strong deal pipeline, we are well placed to take advantage of emerging new business opportunities, and return to profitability.
Our outlook for the MENA region remains positive. Overall, it is forecast to grow by just under 5 per cent in the near-term, while the combined GCC economic growth rate for 2012 is forecast at four per cent. The GCC economies have illustrated their ability to weather the worst consequences of the global financial crisis and grow at a faster rate than the global average. The rising trend of oil prices has strengthened the robust underlying macroeconomic fundamentals and demographics of the GCC, and the long-term economic outlook remains positive. In Bahrain, the transparent response by His Majesty King Hamad to the unrest last year, together with the Government’s commitment to continued reforms, has laid the foundations for the restoration of dialogue, and a return to political stability and social harmony. According to the IMF, Bahrain’s economy is expected to grow by 3.6 per cent in 2012, driven by high oil prices and a recovery in the tourism and financial sectors. Given these factors, we are cautiously optimistic for the Bank’s prospects in 2012.
In conclusion, on behalf of the management and staff of VCBank, I would like to express my sincere appreciation for the continued support, confidence, trust and encouragement that we have received from all our stakeholders throughout 2011. This has inspired us with greater confidence to face yet another challenging year in 2012.
Abdullatif Mohamed JanahiBoard Member & Chief Executive Officer

12 VCBANK Annual Report 2011
EXEC
UT
IVE
MA
NA
GEM
ENT
1 2
43
6 7 5
1 - Abdullatif Mohamed Janahi Board Member and Chief Executive Officer
Chairman of the Executive Management CommitteeMember of Finance & Investment Committee
2 - Dr. Khalid Abdulla Ateeq Deputy CEO - Operations & Support
3 - Faisal A. Aziz Al Abbasi Chief Investment Officer
Private Equity & Financial Advisory
4 - Saad Abdulla Al Khan Acting Chief Investment Officer - Real Estate
5 - Santhosh Jacob Karipat Executive Director - Financial Control
6 - Najwa Abdulla Mohanna Executive Director - Operations & Support
7 - Mohamed Jassim Al Shaikh Director - Investment Placement

NURTURING TALENT & POTENTIAL

14 VCBANK Annual Report 2011
NEW INVESTMENTS IN 2011
SHIPCO
This USD 33.5 million shipping capital lease project entails a capital lease through sale and leaseback on a bareboat basis of three one-year-old Supramax 57,000 dwt bulk carriers. The individual price tag of USD 28.3 million of these vessels is well below the market value for comparable five-year-old Supramax bulk carriers. Headquartered in Greece, the lessee is a fast-growing provider of marine transportation services, currently operating its own fleet of seven Supramax vessels, and managing a fleet of 180 charter vessels.
Since 1984, the lessee has established long-term relationships with 20 international blue-chip companies, including reputed names in the commodities space such as BHP Bilton, Glencore and Louis Dreyfus. The lessee is the world’s largest transporter of rice, which is a staple, recession-proof consumable commodity; and also transports other commodities such as grains, fertilisers and cement. Total tonnage transported has more than doubled since 2002 to 8.35 million metric tons (MMT) in 2010, and this is forecast to rise to 10 MMT in 2011. During the worst crisis to hit the shipping sector – from 2008 to 2010 – the
lessee remained profitable. Total net revenue in 2010 was USD 19.85 million, with net operating income of USD 14.10 million. At the end of the year, total assets stood at USD 299.13 million, with total equity of USD 81.47 million.
GoknurIn a deal valued at USD 93.7 million, VCBank has taken an indirect investment in 65 per cent of the shares of Goknur Foods Import Export Trading & Distribution Company in Turkey. Established in 1993, Goknur is the largest fruit juice concentrate and fruit puree producer and exporter in Turkey, with a 50 per cent market share.
The Company owns 5,000 acres of farmland, which has been recently converted to certified organic fruit orchards. It exports to over 60 countries worldwide, with a focus on Europe, USA and Russia; and its client base includes leading international brands such as Coca Cola, Pepsi Cola, Sun Top, Hero and Smuckers.
Goknur has outgrown its competitors due to cost discipline and vertical integration initiatives. These include setting
INV
EST
MEN
T R
EVIE
WPR
IVAT
E EQ
UIT
Y &
FIN
AN
CIA
L A
DV
ISO
RY
Despite the impact of the continued global financial crisis and economic downturn, and the political and social unrest across the MENA region during 2011, VCBank’s private equity portfolio performed relatively well during the year. This illustrates the success of the Bank’s strategy to source and invest in undervalued or underfunded companies, which are seeking access to capital and additional technical and operational support to facilitate growth and expansion, across a range of sectors in the MENA region. The Bank continued to adopt a cautious approach to new investment opportunities, focusing on sectors with high growth potential in stable economies, and finalised two such new investments in 2011.

15SOWING THE SEEDS OF SUCCESS
up its own steam and wind turbines, barrel production facility, petrol station and production of compost and dried kernels. Profitable for the past five years, Goknur reported a net profit of USD 12.4 million in 2010. The Company’s expansion plans include establishing a depot in the US, acquiring additional farmland, and constructing a second production plant. This expansion capacity will provide opportunities for penetrating the Middle East market. Turkey has posted a remarkable performance over the past eight years. Inflation has drastically decreased, while GDP has more than tripled. The country is the largest Islamic economy and the 16th largest economy globally. It is also one of the largest fruit producers in the world.
EXISTING INVESTMENTS UPDATE
MENA SMEs Fund I
Established in 2006, this fund made its last capital call in 2010 and then closed following its investment in QCon. The Fund has performed relatively well since inception, and at the end of 2011, the NAV per share stood at USD 47.02, a decrease of USD 2.98 per share or less than
6 per cent from the original NAV. The Fund’s portfolio companies are Challenger Limited, JAFCCO, ITWorx and QCon. Progress of these companies during 2011 is reported separately below. The Fund plans to engineer exits during 2012.
Challenger Limited
Libya-based Challenger is a provider of contract oil and gas land drilling and workover services, operating primarily in the MENA region. Due to the political situation in Libya during 2011, oil production dropped from 1.7 million barrels per day (MBPD) to 300,000 MPBD. None of Challenger’s oil rigs were operational during the first half of the year, but all assets were safeguarded. Following the fall of the Gaddafi regime and the resumption of oil production, six out of thirty of the Company’s rigs were re-appointed by Libya’s Arabian Gulf Oil Company (AGOCO), which is Challenger’s largest client. AGOCO has indicated that it will require more workover rigs as against drilling rigs, for which Challenger is negotiating leased rigs to meet the demand.
Challenger Limited SHIPCO
Goknur

16 VCBANK Annual Report 2011
JAFCCO
The rebound in demand for fertilizers during 2010 continued during 2011, which helped to increase the profitability of Jordan Al Abyad Fertilizers & Chemicals Company (JAFCCO). With four of the five planned production lines of the Company’s new expansion project commencing operations in 2011 and producing on plan, JAFCCO was able to benefit from a huge worldwide demand for fertilizers. Technical issues were discovered during the commissioning phase of the fifth line, preventing it from coming on stream as planned. However, these are being addressed by the EPC contractor through an action plan agreed with JAFCCO’s management.
ITWorx Company
ITWorx is one of the largest software outsourcing firms in Egypt, with offices in Saudi Arabia, the UAE, Qatar and the US. The Company continued to operate profitably in 2011, and secured a number of important new contracts. These include a social eLearning programme for Durham County Council in the UK; a data warehouse solution for the Principal Bank for Development & Agriculture Credit in
Egypt; and a research tool project for ictQatar. In addition, the Company successfully renewed its schools contract with the Supreme Council for Information & Communications Technology in Qatar. A successful capital increase during the year will be used to reinforce the commercial presence of ITWorx in the MENA region, and accelerate product research and development in Education and Corporate Go-To-Markets.
QCon
Qatar Engineering & Construction Company (QCon) is a leading engineering, procurement and construction (EPC) contracting company. It specialises in projects and plant maintenance for the oil and gas, petrochemicals, fertilizers, power and other industrial infrastructure sectors in Qatar. Established in 1975, QCon has built a dominant position, and a high reputation for quality and safety, in the niche segments in which it operates. During 2011, the company won a number of new contracts with companies including Qatargas, Qatar Fertilizer Company and Oryx GTL. Following the positive financial results of QCon, the investors have received 14% dividend on their investment for the year ended 31 December 2010.
INV
EST
MEN
T R
EVIE
WPR
IVAT
E EQ
UIT
Y &
FIN
AN
CIA
L A
DV
ISO
RY
(co
ntd.
)
JAFCCO
QCon SVCIC

17SOWING THE SEEDS OF SUCCESS
Lemissoler Maritime Company
Taking into consideration the collapse of the shipping sector as a result of the global economic recession, Lemissoler Maritime Company has performed reasonably well. In an environment where vessel valuations were dropping and many major charterers were collapsing causing most shipping companies in the world to incur sizable losses, the Company posted a good level of revenue and profitability, while preserving its liquidity and the value of its assets. Lemissoler operates a fleet of 12 specialised commercial vessels and container ships under a diverse portfolio of long-term, fixed-rate time charters with blue-chip clients.
SVCIC
The Saudi Venture Capital Investment Company (SVCIC) obtained a business commencement licence from the Kingdom’s Capital Market Authority in June 2011. Located at offices in Riyadh, the company is now fully operational, with management and operations teams in place. The company, which invests in small and medium enterprises in Saudi Arabia, has been active in sourcing business opportunities for 2012.
House of Development
During 2011, information security solutions provider, House of Development (HoD), continued to implement its major TASDEEQ contract with Jeddah Chamber of Commerce in Saudi Arabia for a major electronic certification and document verification project. In the US, where it operates from an office in New York, HoD refined its business offering under the Indorse Technologies brand. The company’s US client base includes major companies such as Microsoft, BSkyB and Coca Cola. HoD maintained its focus on R&D during the year, developing and patenting a number of unique technologies in the information security space.
ITWorx Company Lemissoler Maritime Company
18 VCBANK Annual Report 2011
NEW INVESTMENTS IN 2011
vBuildings Company
The Venture Capital Bahrain Fund invested in vBuildings Company, a smart building and grid solutions business. The Company was established by two Bahrain-based entrepreneurs to provide innovative solutions to utility and telecom companies, and real estate developers and managers. It designs, sources and implements competitive smart building services and smart grid solutions built on flexible IT platforms and a robust electromechanical infrastructure. VCFund’s investment will be used by vBuildings to expand in-house delivery capabilities to deliver current projects, and secure more business in the rapidly growing MENA market.
EXISTING INVESTMENTS
The Liquidity Programme
This first-of-its-kind Shari’ah-compliant short-term liquidity programme completed its second year in 2011, and continued to meet its objectives. A second offering was well received and fully subscribed. To date, the Programme has not needed to draw on its facilities with liquidity providers. Providing a profit rate of between 4 and 6 per cent, the short-term trust certificates of the programme are backed by the prime asset of Venture Capital Bank Building.
German Orthopaedic Hospital
Since opening in 2010, this specialist hospital has quickly earned a reputation for world class orthopaedic treatment and surgery in Bahrain and the wider GCC market, especially the Eastern Province of Saudi Arabia and Kuwait. Patients no longer need to travel to Germany for specialist treatment, and agreements signed by the hospital to date include the General Organisation for Youth and Sports (GOYS) for the treatment of players of Bahrain’s national sports teams. Forecast to break even in 2012, the German Orthopaedic Hospital has been recognised by a growing number of insurance companies for orthopaedic treatment. Discussions are taking place for a similar hospital to be established in Saudi Arabia at Riyadh. The hospital serves to illustrate the distinct ability of VCBank to identify a lucrative captive market, with the potential for replication in other GCC countries.
INV
EST
MEN
T R
EVIE
WV
ENTU
RE
CA
PITA
L &
BU
SIN
ESS
DEV
ELO
PMEN
T
During 2011, despite the challenging socio-economic environment in the MENA region, VCBank’s unique venture capital and business development portfolio posted a successful performance. The Bank continued to implement its strategy of harnessing the potential of largely untapped business opportunities in the GCC and MENA markets which, if leveraged effectively, can provide a stable stream of alternative investment opportunities for investors. Access to venture capital investments not only offers clients opportunities in an under-invested niche asset class, but also enables them to play a positive role in channelling funds towards investment opportunities that stimulate real economic growth and further develop regional economies.

19SOWING THE SEEDS OF SUCCESS
Royal Maternity Hospital
Key developments during 2011 include completion of the schematic design of this specialist medical facility, and the appointment of project managers, architectural, engineering and medical equipment consultants, and interior designers. The main contractor will be appointed shortly, with construction planned to commence in early 2012. Based on a proven international model for ‘healthcare and hospitality’, the Royal Maternity Hospital will provide world-class basic and advanced healthcare
services for women and children. The initial focus will be on the provision of comprehensive maternity services, extending to prenatal and postnatal care, in addition to gynaecology.
Royal Maternity Hospital
German Orthopaedic Hospital

20 VCBANK Annual Report 2011
INV
EST
MEN
T R
EVIE
WV
ENTU
RE
CA
PITA
L &
BU
SIN
ESS
DEV
ELO
PMEN
T (c
ontd
.)
Venture Capital Fund Bahrain
This dedicated SME fund, which provides ‘smart capital’ for local entrepreneurs, invested in vBuildings Company – a Bahrain-based smart building and grid solutions business – in 2011. This follows previous investments in the Dutch Delight chocolate company and Dar Al Wasmi furniture factory. The Fund has also identified further new investment opportunities in the healthcare, retail, industrial and services sectors. VCBank is planning to replicate this Fund in other promising MENA markets in collaboration with local development banks.
The Lounge
This specialist serviced offices company, launched in Bahrain in 2008, has made excellent progress, despite difficult market conditions. With an 80 per cent occupancy rate, the company achieved profitability in 2011, despite operating in a very competitive and price-sensitive market. The Lounge illustrates the venture capital approach of VCBank in successfully seeding a new concept in Bahrain, and then replicating it elsewhere in the MENA region.
GLOREI
The Global Omani Development & Investment Company (GLOREI) provides VCBank with an investment platform for opportunities in Oman. The company has successfully executed deals in the hospitality and logistics sectors, as well as certain sub-sectors of real estate, such as serviced offices. A number of new projects in the Sultanate have also been identified. GLOREI’s ‘Khawr Awqad’ project in Oman received the Cityscape ‘Best Environmental Project’ award.
Bayan Real Estate Development Company
This Company, which focuses on demand-driven, non-speculative real estate projects in Saudi Arabia, is currently executing a number of deals in the Kingdom’s Eastern Province. Its debut project – Gardinia Aziziyah – is progressing well. This integrated residential district comprises villas of different designs, specifications and prices; and community facilities such as mosques, schools, medical centres and retail outlets. Gardinia offers middle-income families the opportunity of owning a high quality and affordable home.
Dutch Delight
Bayan Real Estate Development CompanyDar Al Wasmi vBuildings

21SOWING THE SEEDS OF SUCCESS
The SR 800 million project, which covers an area of 625,000 square metres, is located in the Aziziyah area of Al Khobar, close to Half Moon Beach and Prince Mohammed bin Fahd University. Founded by leading companies and private investors from Saudi Arabia, Kuwait and Bahrain, Bayan Real Estate Development Company has been profitable since its establishment in 2007.
Gulf Projects Company
The Company is the part-owner and operator of Venture Capital Bank Building in the Diplomatic Area of Manama in Bahrain. This successful mixed-use commercial, retail and car parking complex is operating near to 100 per cent capacity. The Venture Capital Bank Building is the prime asset for the short-term trust certificates of VCBank’s Liquidity Programme.
Mozon Investment Holding Company
Mozon provides VCBank with an investment platform for opportunities in Morocco. The Lounge – a specialist serviced offices company launched in Bahrain in 2008 – has been successfully replicated in Casablanca. Mozon also completed investments in the education and affordable housing sectors during 2011, and has identified a number of new business opportunities.
The Lounge The Liquidity Programme

22 VCBANK Annual Report 2011
EXISTING PORTFOLIO
Jeddah Regeneration Project
VCBank is one of the founding members of the City Centre Development Company (CCDC) that was assigned the mandate by the Municipality of Jeddah for developing a master plan and economic model for the regeneration of the Jeddah Central District, which extends over an area of six million square metres. This multi-billion urban renewal project is intended to transform the district into a vibrant and dynamic metropolis that ranks with the best in the world.
Private enterprise and the public sector have joined forces to create a new environment characterised by modern infrastructure and amenities, architecture that reflects the city’s proud heritage, and landscaped public places – which will support Jeddah’s bustling economy. The master plan has been endorsed by His Majesty King Abdulla Bin Abdulaziz Al Saud, and CCDC has been formally appointed as the master developer. CCDC will partner with the municipality to form the development company (JCDC) which will undertake the actual development task of the waterfront area, being the pilot area where this mega development will commence.
Jebel Ali Labour Accommodation
Construction of three labour accommodation complexes within the Jebel Ali Industrial Area in the UAE is on track for completion in early 2012. As well as overseeing execution of the final project stages, VCBank continued its marketing campaign to secure tenants. The complexes, which comply with the latest UAE regulations for labour accommodation, will provide high quality accommodation and supporting amenities for over 4,000 workers.
One Bahrain
The land for this Shari’ah-compliant hospitality and residential project, located on the prestigious Reef Island development off the north coast of Manama, was acquired through a joint-venture with a Bahraini partner during 2008. One Bahrain is an up-market residential development split into two components: serviced apartments, and residential units for sale to end-users. During 2011, the Bank held discussions with a renowned international potential operator for the serviced residence element of the project.
INV
EST
MEN
T R
EVIE
WR
EAL
ESTA
TE
Given the challenging operating environment in 2011, which continued to impact the real estate sector, VCBank did not initiate any new projects during the year. The Bank focused primarily on managing its existing real estate investment portfolio, while continuing its advisory role in structuring and coordinating various elements of real estate projects. The Bank is actively pursuing opportunities in the MENA region in demand-driven and end-user based segments of the market such as affordable housing. At the same time, VCBank has identified a number of attractive alternative investment opportunities in the international market. These include stable and mature developed markets such as the UK, and high potential emerging economies such as Turkey.

23SOWING THE SEEDS OF SUCCESS
Difaaf
This architecturally distinguished real estate development consists of two high-rise residential towers strategically located on Reef Island, off the north coast of Manama in Bahrain. The land has been purchased, designs drawn up, and preliminary construction works, such as piling works, completed.
Great Harbour
Great Harbour was established to undertake a mixed-use development on a plot measuring over 35,000 square metres in the Hidd Area, Bahrain. It is a unique seafront plot with excellent development potential. It is also located along the new Sheikh Khalifa Park which was opened in late 2011.
Jeddah Regeneration Project
Difaf
One Bahrain

24 VCBANK Annual Report 2011
It was an even tougher and more challenging year for the regional investment banking industry in 2011. The global financial crisis and economic downturn continued to impact the GCC, while political and social unrest across the MENA region, including Bahrain, added a new dimension of risk and uncertainty during the year. This seriously affected investor confidence, with investors taking a very cautious, risk-averse approach to new investment opportunities.
INV
EST
MEN
T P
LAC
EMEN
T
VCBank was also faced with increasing competition, not just from other investment banks, but also from regional commercial banks and stock markets, and international players. However, the team was able to enhance relationships with strategic, institutional, corporate and private investors by building upon the Bank’s successful investment achievements to date, including the past three years which was a particularly difficult period for the global banking sector.
Despite challenging market conditions, the Bank’s placement team was successful in placing three new investment opportunities during the year. These comprised
two new offerings – SHIPCO and Göknur – and a second offering for The Liquidity Programme, all of which were successfully completed.
During 2011, the Bank’s high-calibre placement team further enhanced its reputation for technical ability, quality, speed, and professionalism. The team maintained a close relationship with its clients through regular visits across the GCC. Since the inception of VCBank six years ago, the team has successfully placed all of the Bank’s investment offerings in venture capital and business development, private equity, and real estate.

CULTIVATING BUSINESS GROWTH

26 VCBANK Annual Report 2011
OPE
RAT
ION
S &
SU
PPO
RT
R
EVIE
W
TREASURY
Given the ongoing impact of the global financial crisis, the key focus of the Treasury team in 2011 continued to be the management of the Bank’s liquidity, closely monitoring exposures and profit rate risks, and securing funding for VCBank and its portfolio companies. Treasury also acts as a cash manager for portfolio companies, helping to manage their liquidity and monitor the VCBank Liquidity Programme (Trust Certificates) in conjunction with the external programme manager and custodian.
OPERATIONS
During 2011 the Operations team continued to provide critical back office support to all areas of the Bank. This includes responsibility for murabaha contracts, transaction processing and settlement through SWIFT, reconciliations, and support for investment project documentation. In addition, the team continued to enhance cross-functional working relationships between Financial Control, Treasury and Investment Administration.
HUMAN RESOURCES & ADMINISTRATION
The Bank continued to invest in human resource develop-ment and training in 2011, with a focus on enhancing professional qualifications. A number of staff completed the one-year Tamkeen Career Progression Programme, which is designed to increase the knowledge and capabilities of employees, and support the Bank’s succession planning policy. The HR Policy & Procedures Manual was updated, and revised job descriptions for all staff were finalised.
The Bank supported the Waqf Fund’s placement programme for graduates from the Bahrain Institute of Banking & Finance, providing two students with training and work experience, and recruiting one of them after a one year training period. The Bank also hosted one student from the Ministry of Labour’s trainee programme, who was subsequently recruited. VCBank also provided several university students with summer internships. The HR team continued to provide recruitment and staff orientation consultancy services for the recently-established Saudi
Venture Capital Investment Company in Riyadh; while on the administration side, the Shareholders and Investors Support team participated in the testing of a new Client Relations Management system, which will enable VCBank to enhance the level of service to its shareholders and investors.
INFORMATION TECHNOLOGY
During the year, the IT team continued to identify and implement the most efficient and cost-effective way to provide support for the Bank and its portfolio companies. Key achievements in 2011 include commencing implementation of a new online Disaster Recovery Site; final testing with real data of the new Client Relations Management system; installing IT systems for SVCIC; and updating the IT Policy & Procedures Manual. Information Security was given priority during the year, with the introduction of new security procedures, and raising the awareness and understanding of staff on the issue of security. In addition, the Bank’s Information Security Officer achieved accreditation as a Certified Ethical hacker.
FINANCIAL CONTROL
During 2011, the Bank continued to upgrade and enhance its financial control processes and procedures with a view to improving VCBank’s financial control capability. This has enhanced the ability of the Financial Control team to provide senior management with timely financial reports to aid decision-making; and also in the preparation of quarterly and annual consolidated financial statements in line with the latest regulatory requirements.
CORPORATE COMMUNICATIONS
VCBank maintained the quality and timeliness of external and internal communications with its stakeholders in 2011. Main communication delivery channels include a corporate website and corporate brochure, newsletter, annual report, and regular announcements in the local media. The Corporate Communications team also continued to provide consultancy services for portfolio companies.
VCBank’s operations and support division adopts the highest standards of ethical and professional conduct, working to provide all the necessary support to facilitate core business activities. The key objectives of this division is to provide superior services and effective support to the other divisions in the Bank with the highest level of integrity. The division is now a vital element in the creation of value for the entire Bank’s operation, by enhancing the returns of the operations and at the same time reducing the level of risks to which the operations are exposed, and controlling the operational expenses by embracing a cost reduction policy.
27SOWING THE SEEDS OF SUCCESS
VCBank is committed to upholding the highest standards of corporate governance in compliance with relevant governing laws and regulations and global best practice. Accordingly, the Bank has put in place a robust and comprehensive Corporate Governance Framework aimed at ensuring operational effectiveness while protecting the rights and interests of all stakeholders. The framework has been reviewed and updated in line with the Nine Principles of the Kingdom of Bahrain’s Corporate Governance Code, which was issued by the Ministry of Industry & Commerce in March 2010, and embraced by the Central Bank of Bahrain in its High-Level Controls Module in October 2010.
CO
RPO
RAT
E G
OV
ERN
AN
CE
KEY ASPECTS OF VCBANK’S CORPORATE GOVERNANCE FRAMEWORK:
1- Comprehensive Charters and Job Descriptions that clearly articulate the roles, responsibilities and the mandate of the Board of Directors, Board Committees, the Executive Management and the Control Functions.
2- A comprehensive set of Policy and Procedures Manuals, including Internal Discretionary Authority Limits; Code of Conduct, Ethics & Conflict of Interests Policy; Whistle Blowing Policy; Investment Companies Governance Framework; Directors’ Independence Policy; and Board Committees Minutes of Meeting Policy.
3- Effective and independent Board oversight through the formation of five independent Board Committees; and through the Bank’s Control Functions, with clear and direct reporting lines.
4- A reputable and independent Shari’ah Supervisory Board.
5- A comprehensive annual Self-assessment and Evaluation of the Board and its Committees.
6- An effective set of Policies and Procedures to govern the activities of the Bank’s Business Units and Support functions.
7- An up-to-date and adequate formal Succession Plan for the Bank’s key positions.
KEY DEVELOPMENTS IN 2011
During 2011, VCBank continued to strengthen its corporate governance framework, and introduced new initiatives aimed at promoting enhanced corporate governance practices, with particular emphasis on increasing the awareness and understanding of the directors, management and staff on this important topic.
Specific initiatives introduced during the year include the following:
• The Bank’s Corporate Governance Framework was reviewed and updated in line with the requirements of the High Level Controls Module of the Central Bank of Bahrain (CBB).
• The Gap Analysis Report on the Bank’s compliance with CBB requirements was updated and submitted to the CBB.
• Several new Policies were developed and implemented, including:
- Investment Companies’ Governance Framework
- Directors’ Independence Policy
- Board Committees Minutes of Meeting Policy
BOARD OF DIRECTORS
The Board is responsible for the stewardship of the Bank’s business and affairs on behalf of the shareholders, with a view to enhancing long-term shareholder value whilst taking into account the interests of other stakeholders, and maintaining high standards of transparency and accountability. The Board comprises 12 members, all of whom are independent non-executive Directors except for the CEO. Board members and their profiles are listed on pages 33 to 35 of this annual report.

28 VCBANK Annual Report 2011
BOARD COMMITTEES
The Board is supported by 5 Board Committees: Nomination & Remuneration Committee, Corporate Governance Committee, Audit Committee, Risk Committee, and Finance & Investment Committee. Membership of the Board Committees is listed in the following table:
Board Committees Member Name Member Position
Finance & Investment Committee
Dr. Ghassan Ahmed Al SulaimanAbdulfatah MohammedRafei MarafieAbdullatif Mohamed JanahiSaleh Mohammed Al ShanfariMohammed Bin Sulaiman AbanumayAjlan Abdulaziz Al Ajlan
ChairmanDeputy ChairmanMemberMemberMemberMember
Corporate Governance Committee
Abdulfatah MohammedRafei MarafieDr. Ghassan Ahmed Al SulaimanMarwan Al GhurairMohammed Al Sarhan
ChairmanDeputy ChairmanMemberNon-Board Member
Audit Committee Nedhal Saleh Al AujanSulaiman Ibrahim Al HudaithiJawaher Al Mudhahki
ChairmanDeputy ChairmanNon-Board Member
Risk Committee Ali Mousa Al MousaIbrahim Hamad Al BabtainAbdulhadi Treheeb Al Shahwani
ChairmanDeputy ChairmanMember
Nomination & Remuneration Committee
Dr. Ghassan Ahmed Al SulaimanAbdulfatah MohammedRafei MarafieSaleh Mohammed Al Shanfari
ChairmanDeputy ChairmanMember
Nomination & Remuneration Committee
The mandate of the Nomination & Remuneration Committee is to assist the Board of Directors in establishing a fair and transparent nominations process for the appointment and remuneration of directors, other Board Committees and the Chief Executive Officer, and remuneration of the Executive Management team.
Corporate Governance Committee
The mandate of the Corporate Governance Committee is to assist the Board of Directors in fulfilling its responsibilities of corporate governance and oversight over the Bank’s compliance with legal and regulatory requirements and Shari’ah rules.
CO
RPO
RAT
E G
OV
ERN
AN
CE
(con
td.)
29SOWING THE SEEDS OF SUCCESS
Finance & Investment Committee
The mandate of the Finance & Investment Committee is to oversee the financial and investment affairs of the Bank, including asset and liability management in coordination with the Executive Management Committee.
Audit Committee
The Audit Committee is mandated with oversight responsibilities on financial reporting, internal control and risk management, internal and external audit, and adherence to Shari’ah rules and principles.
Risk Committee
The mandate of the Risk Committee is to maintain oversight of the Bank’s risk management framework, including its Basel II framework, covering all risks faced by the Bank as well as its control environment.
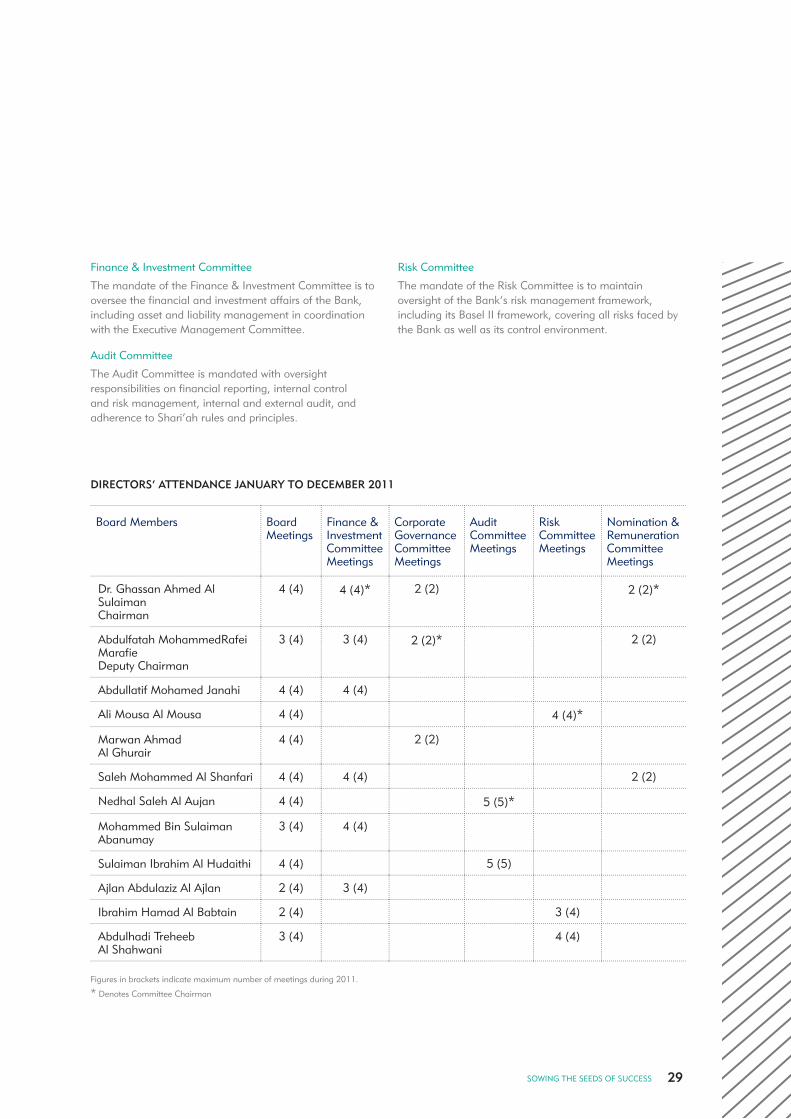
DIRECTORS’ ATTENDANCE JANUARY TO DECEMBER 2011
Board Members BoardMeetings
Finance &InvestmentCommitteeMeetings
CorporateGovernanceCommittee Meetings
AuditCommitteeMeetings
RiskCommitteeMeetings
Nomination &RemunerationCommitteeMeetings
Dr. Ghassan Ahmed Al SulaimanChairman
4 (4) 4 (4)* 2 (2) 2 (2)*
Abdulfatah MohammedRafei MarafieDeputy Chairman
3 (4) 3 (4) 2 (2)* 2 (2)
Abdullatif Mohamed Janahi 4 (4) 4 (4)
Ali Mousa Al Mousa 4 (4) 4 (4)*
Marwan Ahmad Al Ghurair
4 (4) 2 (2)
Saleh Mohammed Al Shanfari 4 (4) 4 (4) 2 (2)
Nedhal Saleh Al Aujan 4 (4) 5 (5)*
Mohammed Bin Sulaiman Abanumay
3 (4) 4 (4)
Sulaiman Ibrahim Al Hudaithi 4 (4) 5 (5)
Ajlan Abdulaziz Al Ajlan 2 (4) 3 (4)
Ibrahim Hamad Al Babtain 2 (4) 3 (4)
Abdulhadi TreheebAl Shahwani
3 (4) 4 (4)
Figures in brackets indicate maximum number of meetings during 2011.
* Denotes Committee Chairman

30 VCBANK Annual Report 2011
DIRECTORS’ REMUNERATION
The Nominations & Remunerations Committee assists the Board in establishing a fair and transparent nomination and remuneration process for the appointment and remuneration of its Directors and Board Committee members. This Committee is guided by the Nomination & Remuneration Committee Charter, which forms part of the Bank’s overall Corporate Governance Framework.
The remuneration of Directors is a formula-based approach, based on the Bank’s profitability level and the number of Board meetings attended by each Director. It also reflects the extent of responsibilities of each Director. Total remuneration includes Directors’ membership in one or more of the Board’s committees. The actual remuneration of VCBank’s Board of Directors and the Bank’s policy are disclosed in the Bank’s annual report. This disclosure policy supports the Bank’s assurance to its stakeholders that sufficient disclosure is provided in relation to the Bank’s remuneration policies.
BOARD AND BOARD COMMITTEES DEVELOPMENT
Board Development
The annual training plan for Board members includes workshops designed to enable them to carry out their supervisory and observation roles and responsibilities. These include important topics such as corporate governance, compliance and risk management. Board Members also attend an annual strategy workshop with the Executive Management team to review the Bank’s strategic plan and objectives.
Board Evaluation
The Bank has in place a comprehensive Board Evaluation Programme, which is designed to help them identify areas for improvement and reinforce their responsibilities. The programme comprises three phases of self assessment: at a Board level, at a Board Committee level, and at an Individual Director level.
SHARI’AH SUPERVISORY BOARD
Composed of eminent Shari’ah scholars, the Bank’s Shari’ah Supervisory Board is entrusted with the duty of directing, reviewing and supervising the activities of the Bank in order to ensure that they are in compliance with the rules and principles of Islamic Shari’ah. Members of Shari’ah Supervisory Board and their profiles are listed on page 9 of this annual report.
MANAGEMENT
The Chief Executive Officer (CEO) is delegated by the Board of Directors with responsibility for the day-to-day management of the Bank. The CEO is supported by a well-qualified and experienced Executive Management team. Executive Managers and their profiles are listed on pages 36 and 37 of this annual report.
Executive Management Committee
The Executive Management Committee comprises the members of the Executive Management team. The Committee is responsible for assisting the CEO in overseeing day-to-day operations of the Bank; monitoring the performance of business lines and departments in relation to strategy, policies, targets and limits; and conducting investment decisions as delegated by the Board of Directors under the Discretionary Authority Limits (DAL), in addition to asset and liability management in coordination with the Finance & Investment Committee.
STRATEGY STATEMENT
VCBank is the first Islamic investment bank in the MENA region to specialise in small-to-medium enterprises (SMEs) capital investment opportunities. Offering clients a broad range of superior products and services across a number of promising asset classes in the region, the Bank is active in venture capital and business development, private equity, financial advisory, and real estate. VCBank is uniquely positioned to lead the development of the nascent venture capital industry in the region by providing unmatched levels of support for fundamentally strong, undervalued small-to-medium enterprises (SMEs) that lack the necessary resources for growth and expansion. The Bank’s strategy and business model is currently under review.
CODE OF CONDUCT
The Bank has developed a Code of Conduct which contains rules on professional conduct and ethical behaviour that are applicable to the directors and employees of the Bank. The Code is designed to guide all directors and employees in fulfilling their responsibilities and obligations towards the Bank’s stakeholders, in compliance with all applicable laws and regulations. The Code is posted on the bank’s website.
CO
RPO
RAT
E G
OV
ERN
AN
CE
(con
td.)

31SOWING THE SEEDS OF SUCCESS
SHAREHOLDER / INVESTOR COMMUNICATION & AWARENESS
The Board is committed to communicating with its shareholders and investors in a professional, transparent, accurate and timely manner, and adopts a number of different ways through which to promote greater understanding and dialogue with all stakeholders. These include the Annual General Meeting, annual reports and quarterly financial reports, corporate website and brochure, and regular announcements in the local media. In addition, VCBank issues a newsletter twice a year to keep shareholders, investors and staff up to date with the Bank’s projects, investments, business developments and other activities. The newsletter also includes regular articles to enhance awareness about corporate governance, compliance and risk management.
GOVERNANCE CONTROL FUNCTIONS
As well as undertaking their specific responsibilities, the Compliance, Risk Management, Internal Audit, and Shari’ah Coordination & Review departments work closely together in assisting the Board and Executive Management of the Bank to uphold the highest standards of corporate governance.
Compliance
Compliance is most effective in a corporate culture that emphasises high standards of honesty and integrity, and where the Board and Executive Management lead by example. At VCBank, compliance is recognised as the personal responsibility of all staff, not just the Compliance function. Compliance with regulatory requirements and internal policies and procedures is an ongoing process, and considered as an integral part of the Bank’s culture. VCBank is committed to complying fully with the rules and regulations of the Central Bank of Bahrain, the Ministry of Industry and Commerce, and other applicable laws and regulations and international best practices. The Bank continuously strives to improve the level of compliance in conducting its business by actively educating staff to increase awareness of compliance issues and principles.
The Bank’s Compliance department acts as a central point for all regulatory compliance as well as compliance with the Bank’s internal policies and procedures. The department is independent from other business activities, and performs its compliance-specific responsibilities along
with other limited activities as defined by the CBB, such as Anti-Money Laundering. The Compliance department reports functionally to the Corporate Governance Committee and administratively to the CEO, to ensure that the Bank’s compliance objectives are achieved in the highest professional and ethical standard. The department performs its activities under a well-established Compliance Framework which is articulated by a comprehensive Compliance Manual approved by the Bank’s Board. The primary purpose of the manual is to facilitate the establishment of a robust compliance culture within VCBank, and to enable the Bank to discharge it duties toward all regulatory authorities’ requirements and ensure appropriate management of the Bank’s compliance risk.
Anti-Money Laundering
VCBank’s anti-money laundering measures are based on three main pillars:
1- The Ethical pillar, by actively taking part in the fight against financial crime.
2- The Professional pillar, by preventing the Bank and its products to be used as a channel for money laundering and terrorist financing by recycling the proceeds of crime.
3- The Legal pillar, by complying with Kingdom of Bahrain’s legislation and regulations pertaining to Anti-Money Laundering (AML) and Combating Terrorist Financing (CTF).
The Bank’s AML Manual has been developed in line with Central Bank of Bahrain guidance, and the requirements stipulated in the Financial Crime Module of the CBB Rulebook Volume 2 – Islamic Banks; international best practices promoted by the Financial Action Task Force (FATF), with 40 recommendation on money laundering and 9 special recommendations on terrorist financing; and Basel Committee guidance on Customer Due Diligence. The manual provides a comprehensive set of AML policies and procedures that set out detailed requirements relating to customer identification, customer due diligence, ongoing due diligence and monitoring, reporting SAR, combating the financing of terrorism, record keeping, and staff education and training.

32 VCBANK Annual Report 2011
The Bank’s compliance with the anti-money laundering regulations is monitored by its Money Laundering Reporting Officer (MLRO) and Deputy MLRO; and independently assessed, both internally and externally, by Internal Audit and the Bank’s external Auditors on an annual basis. In addition, the CBB performs periodic inspections and follows up on the Bank’s compliance with anti-money laundering regulations.
Risk Management
The Risk Management Department reports directly to the Risk Committee of the Board and administratively to the Chief Executive Officer. The primary objectives of the department are to develop an integrated risk management framework for the Bank, establish minimum risk management standards for the entire organisation, and instil a culture whereby all employees are individual owners of risks. The department continuously reviews and assesses the Bank’s risk management policy, processes and procedures; provides advice to strengthen the Bank’s internal controls; formally identifies the key risks to which the Bank is exposed; and develops various initiatives to manage, monitor and minimise such risks. The department is also responsible for the development of a risk management and internal capital adequacy assessment framework, which incorporates a capital allocation process to ensure that the Bank manages its capital in accordance with standards prescribed by the Central Bank of Bahrain.
Internal Audit
The Internal Audit department reports directly to the Audit Committee of the Board, and administratively to the Chief Executive Officer. The department is responsible for evaluating and providing assurance to the Board of Directors and Executive Management on the effectiveness of the Bank’s control, risk management and governance processes. This involves reviewing the effectiveness and efficiency of all business processes and their compliance with the Bank’s policies, standards and procedures, and all applicable laws and regulations. In addition, the department audits the activities of all portfolio companies for which the Bank has a fiduciary responsibility. The department conducts its audits in accordance with the audit plan approved by the Audit Committee. This plan is developed using a risk-based methodology which also considers any risks identified by the Risk Management function, the Executive Management and external Auditors. Regular reports on Internal Audit activities are presented to the Audit Committee. The Internal Audit department also provides management and staff with preventive advice and guidance.
Shari’ah Coordination and Review
The Shari’ah Coordination and Review department reports directly to the Bank’s Shari’ah Supervisory Board and administratively to the Chief Executive Officer. The department adopts a unique continuous review methodology rather an annual retrospective Shari’ah audit, with all transactions and deals being reviewed, even if there are precedents. The department is proactively involved in the development of new products and investments, follows up on investment project activities such as sub-transactions, and monitors Treasury transactions and Operations payments on a daily basis. The department plays an important role in communicating all transactions, structures and documentations of every business plan to the Shari’ah Supervisory Board in order to make sure that the Bank’s activities are in full compliance with the rules and principles of Islamic Shari’ah.
Governance Training and Awareness
The Compliance, Risk Management, Internal Audit, and Shari’ah Coordination & Review departments work closely with the Human Resources department to coordinate an education, training and awareness programme, which covers all aspects of corporate governance, for directors, management and staff.
Compliance with CBB Governance Requirements
As required by the CBB, VCBank conducted a detailed gap analysis on its compliance with the governance requirements stipulated in the CBB’s High Level Control Module of its Rulebook Volume 2 – Islamic Banks. The gap analysis revealed a high level of compliance with the Nine Principles, Rules & Guidance of the Corporate Governance Code of the Kingdom of Bahrain, along with its Rules and Guidance. At the Guidance level, which is subject to the ‘Comply or Explain’ mechanism, the Bank is not in full compliance with the two guidances listed below. However, it should be noted that in order to comply with CBB objectives, VCBank implemented alternative internal arrangements as explained below.
Guidance HC-7.2.4: The Bank should maintain a website with a dedicated section on describing shareholders’ right to participate and vote at each shareholders meeting; posting documents relating to the meetings; and establishing electronic means for communicating with shareholders, including the appointment of proxies.
CO
RPO
RAT
E G
OV
ERN
AN
CE
(con
td.)
33SOWING THE SEEDS OF SUCCESS
VCBank’s Explanation: The Bank does maintain an updated website, which is currently subject to a complete renovation and expected to be finalised soon. Communication with the shareholders is currently handled through the CRM system; however, due to the Bank’s current shareholding size, there is no urgent need to implement an electronic system for handling the appointment of shareholders’ proxies. The current manual approach is considered sufficient for the time being, but the Bank will take this issue into consideration for future improvement.
Guidance HC-9.2.4b: The Corporate Governance Committee (CGC) shall consist of at least three members, one of which should be from the Shari’ah Supervisory Board (SSB).
VCBank’s Explanation: It is worth noting that VCBank established a dedicated Corporate Governance Committee well in advance of CBB requirements, due to its commitment to promote good governance. While the CGC committee does not include a member from the Shari’ah Supervisory Board, the Bank believes that this Guidance from the CBB can be achieved through an alternative internal arrangement. This entails providing the SSB with an agenda in advance of CGC Committee meetings. Based on that, the SSB and the Bank’s Shari’ah Reviewer have the full right to attend the Committee meetings. In addition, the minutes of the meeting will be shared with the Bank’s SSB for greater transparency.
BOARD MEMBERS’ PROFILES
Dr. Ghassan Ahmed Al SulaimanChairman
Kingdom of Saudi ArabiaIndependent and Non-Executive DirectorAppointed 6 October 200533 years experience
VCBank Committees: Chairman of Finance & Investment Committee; Chairman of Nomination & Remuneration Committee; Deputy Chairman of Corporate Governance Committee.Chairman: Ghassan Ahmad Al Sulaiman Development Co. Ltd.; Ghassan Ahmed Al Sulaiman Trading (GAAT); Ghassan Ahmad Al Sulaiman Furniture Co. Ltd (IKEA); SME Council related to Chamber of Commerce and Industry of Jeddah; City Centre Development Co. (CCDC); Saudi Venture Capital Investment Co. (SVCIC); Unizah Investment Company; Almathaaq Development Co. Ltd; Altalea Trading Co.; Delta United Company Ltd.Member of the Board: Bin Sulaiman Holding Co.; Arabian Cement Co; Savola Group; Almaghrabi Hospitals Co.; Namaa Co.
Abdulfatah MohamadRafie MarafieDeputy Chairman
State of KuwaitIndependent and Non-Executive DirectorAppointed 6 October 200532 years experience
VCBank Committees: Chairman of Corporate Governance Committee; Deputy Chairman of Nomination & Remuneration Committee; Deputy Chairman of Finance & Investment Committee. Chairman and Managing Director of the Commercial Real Estate Company (Al-Tijaria).Chairman, General Manager & Chairman of the Executive Committee: Mozon Holding CompanyChairman: Al Durrat Al Tijaria Co. Board Member & Member of the Investment Committee: Public Institution for Social SecurityBoard Member & Chairman of the Executive Committee: Bayan Realty Co.Board Member: Amar Finance & Leasing Co; Omran Al Bahrain; Fund of Awqaf for Social & Scientific Development of Kuwait Awqaf Public FoundationMember of the Supervision Committee: to elect half of the Kuwait Chamber of Commerce & Industry MembersMember of the Board of Trustees: the State Prize of the Knowledge Economy in the Centre of Excellence in Management, College of Administrative, Kuwait University.Member of Advisory Council: College of Business Administrative Kuwait UniversityBoard Member & Founder: the Kuwait Islamic Scientific SocietyTreasurer: Real Estate Association
34 VCBANK Annual Report 2011
Abdullatif Mohamed JanahiBoard Member
Kingdom of Bahrain Chief Executive Officer Appointed 6 October 2005 29 years experience
VCBank Committees: Chairman of the Executive Management Committee; Member of Finance & Investment CommitteeChairman: Oasis Middle East Holding Company; Lemissoler Maritime Company; World Development Company; Gulf Projects Company; Venture Capital Fund Bahrain; Al Jazira Plastic Company; German Orthopaedic Hospital.Deputy Chairman: Challenger Oil Drilling Company; Jordan Al Abyad Fertilizers and Chemicals Company (JAFCCO).Board Member: GLOREI in Oman & Chairman of their Investment Committee; Bayan Realty Company (formerly ASAS Company) in Saudi Arabia; Mozon Holding Company in Morocco.
Ali Mousa Al MousaBoard Member
State of KuwaitIndependent and Non-Executive DirectorAppointed 6 October 200540 years experience
VCBank Committees: Chairman of Risk Committee.Chairman & Managing Director Securities Group Company.Board Member: Saudi Venture Capital Investment CompanyEx-Vice Chairman: Themar International Holding Co. Ex-Board Member: Industrial Bank of Kuwait.Ex-Deputy Governor-Central Bank of Kuwait.Ex-Minister of Planning and the Minister of State for Administrative Development, State of Kuwait.
Marwan Ahmad Al GhurairBoard Member
United Arab EmiratesIndependent and Non-Executive DirectorAppointed 6 October 200522 years experience
VCBank Committees: Member of Corporate Governance Committee. Chairman: Fanan Investments; Fanan Food Trading; and Dubai National School.
Saleh Mohammed Al ShanfariBoard Member
Sultanate of OmanIndependent and Non-Executive DirectorAppointed 6 October 200524 years experience
VCBank Committees: Member of Finance & Investment Committee.Director: Global Omani Investment Company; and Industrial Systems Corporation.Chairman: Global Computer Services Company; Asaffa Foods; Asaffa Meat Processing Company.Board Member: Global Mining Company; Global Gypsum Company; Omani Integrated Logistic, Global Omani Real Estate Development Company (Glorei); Alrawabi Group-UAE, Synergy-Kuwait, Arab Poultry Production and Processing-Sudan.Oman Chamber of Commerce (SME, Food Security, Industrial Development Committees); Omani-UAE Joint Business Council; and Omani-Sudan Business Council.
Nedhal Saleh Al AujanBoard Member
Kingdom of BahrainIndependent and Non-ExecutiveAppointed 6 October 200529 years experience
VCBank Committees: Chairman of Audit Committee.Chief Executive Officer: Bahrain Development Bank. Chairman: Gulf Diabetes Specialist Centre, Arabian Taxi Company.Board Member: Bahrain Telecommunication Company (Batelco); Retail Arabia; Gulf Membrane & Coating Industries; Chairman of the Executive Committee of Bahrain Business Incubator Centre.
Mohammed Bin Sulaiman AbanumayBoard Member
Kingdom of Saudi ArabiaIndependent and Non-ExecutiveAppointed 4 March 200833 years experience
VCBank Committees: Member of Finance & Investment Committee.Chief Executive Officer: Abanumay Ind. Corp. Vice Chairman: Saudi Venture Capital Investment CompanyBoard Member: SABIC; Malath Insurance CompanyMember: MENA Fund Investment Committee.
CO
RPO
RAT
E G
OV
ERN
AN
CE
(con
td.)

35SOWING THE SEEDS OF SUCCESS
Sulaiman Ibrahim Al HudaithiBoard Member
Kingdom of Saudi ArabiaIndependent and Non-ExecutiveAppointed 4 March 200929 years experience
VCBank Committees: Deputy Chairman of Audit Committee.Managing Director: Jeddah Commercial Investment Company. Board Member: Saudi Research & Marketing Group; Saudi Printing and Packaging Company; Aseer Trading, Tourism & Manufacturing Co. Saudi Specialised Laboratories Company; Al Madaen Star Group; Saudi Shipping and Maritime Services Company and Saudi Venture Capital Investment Company (SVCIC).
Ajlan Abdulaziz Al AjlanBoard Member
Kingdom of Saudi ArabiaIndependent and Non-ExecutiveAppointed 4 March 200935 years experience
VCBank Committees: Member of Finance & Investment Committee.Chairman: Ajlan and Bros.; Ajlan Bin Abdulaziz Al Ajlan & Bros.; Abdulaziz Alajlan Sons For Commercial & Real Estate Investment Co; Nomou Real Estate Development Co.; International Fashion Co. Ltd.; and Fashion Co. Ltd. for Trade & Real Estate.Board Member: Riyadh Chamber of Commerce and Industry and Saudi Venture Capital Investment Company (SVCIC).
Ibrahim Hamad Al BabtainBoard Member
Kingdom of Saudi ArabiaIndependent and Non-ExecutiveAppointed 4 March 200927 years experience
VCBank Committees: Deputy Chairman of Risk Committee.Chairman: Al Babtain Power and Telecom Company; J Equity Partners Bahrain.Vice Chairman: Al Babtain Holding Investment Company.Executive Director: Al Mouwasat Medical Company; and Al Maktaba Marketing Company.Board Member: Al Babtain Holding Company; and Al Babtain Contracting Company; Al Mouwasat Medical Company; Al Maktaba Company; Al Babtain Power and Telecom Company Egypt; Mushed Company.
Abdulhadi Treheeb Al ShahwaniBoard Member
State of QatarIndependent and Non-ExecutiveAppointed 4 March 200932 years experience
VCBank Committees: Member of Risk Committee.Chairman: Al Shahwani Group of Companies including: Bin Nayfa Al Shahwani International; Hadi Sons Group; Al Hadi Cars & Heavy Equipments; Gulf Fire Fighting Foam Factory; Qatar Fire Extinguishers Factory; and Shahwani Fire Protection & Technical Services.
36 VCBANK Annual Report 2011
EXECUTIVE MANAGEMENT PROFILES
Abdullatif Mohamed JanahiBoard Member & Chief Executive OfficerChairman of the Executive Management CommitteeMember of Finance & Investment CommitteeJoined VCBank in 200529 years experience
The originator of the VCBank initiative and one of its key founders, Mr. Janahi served as the Executive Director of the Incorporating Committee of the Bank. He is the Chairman of Oasis Middle East Holding Company, an investment holding company that was responsible for originating, structuring and exiting the Blue City project in the Sultanate of Oman, one of the Middle East’s major real estate development projects. He is also the Chairman of Lemissoler Maritime Company, World Development Company, Gulf Projects Company, Venture Capital Fund Bahrain, Al Jazira Plastic Company and German Orthopaedic Hospital. Mr. Janahi is Deputy Chairman of Challenger Oil Drilling Company, Jordan Al Abyad Fertilizers and Chemicals Company (JAFCCO), and Board Member of GLOREI in Oman as well as the Chairman of their Investment Committee. Mr. Janahi is also Board Member of Bayan Realty Company (formerly ASAS Company) in Saudi Arabia and Mozon Holding Company in Morocco.
Previously, Mr. Janahi was one of the key founders and a Director of the Incorporating Committee of International Investment Bank, a Bahrain-based Islamic investment bank. Prior to that, Mr. Janahi was a member of the senior management of Assurance & Business Advisory with Arthur Andersen in Bahrain. Mr. Janahi holds a B.Sc. in Accounting from the University of Bahrain, an M.Sc. in Accounting & Finance from Leicester Business School, De-MontFort University (UK) and is a Fellow of the Chartered Institute of Management Accountants in the UK.
Dr. Khalid Abdulla AteeqDeputy CEOOperations & SupportMember of the Executive Management CommitteeJoined VCBank in 200532 years experience
Dr. Ateeq has over 26 years experience in banking, finance, auditing and accounting. Prior to joining VCBank he was Executive Director of Banking Supervision at
the Central Bank of Bahrain (CBB), where he was responsible for the licensing, inspection and supervision of financial institutions, ensuring that all banks and financial institutions, either operating or incorporated in Bahrain, complied with promulgated laws and regulations. Before joining the CBB, he was Assistant Professor at the University of Bahrain. In addition, through his diversified exposure, Dr. Ateeq served in senior posts with a number of reputable banks and firms. He holds a Ph.D. in Philosophy of Accounting from the UK.
Faisal A. Aziz Al AbbasiChief Investment OfficerPrivate Equity & Financial AdvisoryMember of the Executive Management CommitteeJoined VCBank in 200513 years experience
Through his 13 years of working in the financial sector, Mr. Al Abbasi has gained extensive experience in private equity and investment banking, working with several leading financial institutions in the Middle East. Prior to joining VCBank, he was a senior member of the Middle East Private Equity team at Bank Al Khair (formerly Unicorn Investment Bank). Previously, he worked in the Direct Investment Group at Kuwait Finance House Bahrain, and the Investment Division of BBK. Mr. Al Abbasi holds a B.Sc. degree in Accounting from the University of Bahrain.
Saad Abdulla Al KhanActing Chief Investment OfficerReal EstateMember of the Executive Management CommitteeJoined VCBank in 200714 years experience
Mr. Saad Al Khan has 14 years experience in the field of Islamic banking. Prior to joining VCBank, he was Senior Manager of Investments & Marketing at AlBaraka Islamic Bank (AIB). During his time at AIB, he gained extensive knowledge of Islamic investment banking activities, and was successful in establishing a broad network of regional relationships, especially in the UAE. Mr. Al Khan holds a B.Sc. in Accounting from the University of Bahrain.
CO
RPO
RAT
E G
OV
ERN
AN
CE
(con
td.)

37SOWING THE SEEDS OF SUCCESS
Santhosh Jacob KaripatExecutive Director – Financial ControlMember of the Executive Management CommitteeJoined VCBank in 200630 years experience
Mr. Santhosh Jacob Karipat has extensive experience in accounting, financial analysis and investment valuations, auditing and internal controls and general management advisory services gained from working for over 20 years with ‘Big Four’ accountancy firms in the UK and the Middle East. Prior to joining VCBank, he was Director, Audit & Ad-visory Services with KPMG Bahrain. Previously, he worked with Deloitte & Touche in Riyadh and Jeddah, Kingdom of Saudi Arabia, and with Coopers & Lybrand in the UK.
A Chartered Accountant (Institute of Chartered Account-ants in England & Wales), Mr. Karipat holds an M.Sc. degree in Management Science (specialising in Business Finance) from the University of Manchester Institute of Sci-ence and Technology (UMIST), UK.
Najwa Abdulla MohannaExecutive Director - Operations & SupportMember of the Executive Management CommitteeJoined VCBank in 200627 years experience
Mrs. Najwa Mohanna joined VCBank in 2006 as Head of Human Resources & Support, in addition to the responsi-bility for Shareholder & Investor Support Department. She was then promoted to an Executive Director, Operations & Support. She played a key role in the establishment and operations of Saudi Venture Capital Investment Company. Before joining the Bank, Mrs. Mohanna worked at Bahrain Petroleum Company (Bapco), where she held a number of senior positions. Her various responsibilities included work-ing in both the Management and Financial Departments, such as Reporting & Profit Analysis, Costing & Budgetting, International Sales, Cash & Bank payroll etc. At Bapco, she was also a key player of the Strategic and Business Plan-ning Programme, and a key contributor to various merger projects. Mrs. Mohanna is a Certified Public Accountant (CPA) from the Oregon State Board of Accountancy, USA.
Mohamed Jassim Al ShaikhDirector – Investment PlacementJoined VCBank in 200610 years experience
In line with the Bank’s succession planning policy, Mr. Mohamed Jassim Al Shaikh has been identified to be the successor to Mr. Masood Ahmed Al-Bastaki, Head of Placement, who gave notice of his intention to retire in late 2011. Mr. Al Shaikh is currently supervising the Placement Team. Prior to joining VCBank, he held senior placement and private banking positions with Kuwait Finance House - Bahrain and Taib Bank, respectively.
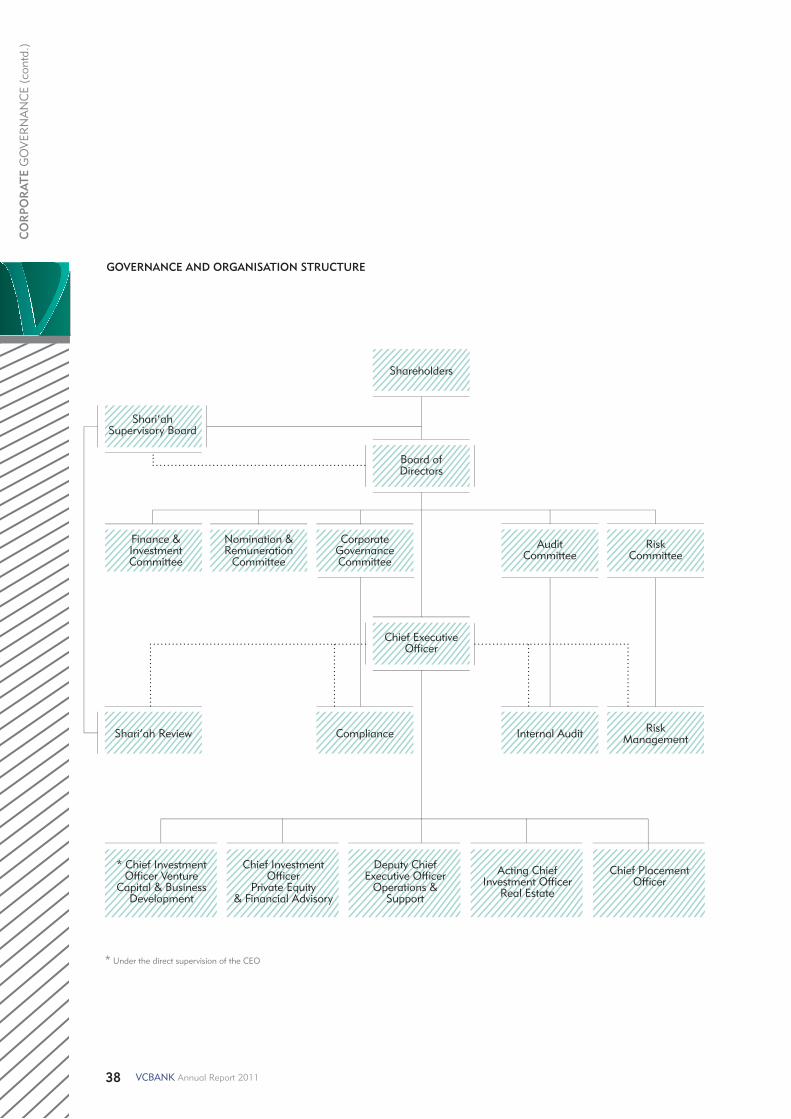
38 VCBANK Annual Report 2011
GOVERNANCE AND ORGANISATION STRUCTURE
Shari’ahSupervisory Board
Shareholders
Board ofDirectors
Chief ExecutiveOfficer
AuditCommittee
RiskCommittee
Finance & Investment Committee
Nomination &Remuneration
Committee
CorporateGovernanceCommittee
Shari’ah Review
* Chief InvestmentOfficer Venture
Capital & Business Development
Chief InvestmentOfficer
Private Equity& Financial Advisory
Deputy ChiefExecutive Officer
Operations & Support
Acting ChiefInvestment Officer
Real Estate
Chief PlacementOfficer
Compliance Internal Audit Risk Management
* Under the direct supervision of the CEO
CO
RPO
RAT
E G
OV
ERN
AN
CE
(con
td.)
CONTENTS
Shari’ah Supervisory Board Report 40
Independent Auditors’ Report to the Shareholders 41
Consolidated Statement of Financial Position 42
Consolidated Statement of Income 43
Consolidated Statement of Comprehensive Income 44
Consolidated Statement of Changes in Equity 45
Consolidated Statement of Cash Flows 46
Consolidated Statement of Changes inOff-Balance Sheet Equity of InvestmentAcount holders 47
Consolidated Statement of Sources and Uses ofZakah Fund 48
Notes to the Consolidated Financial Statements 49
CONSOLIDATED FINANCIAL STATEMENTS
40
CO
NSO
LID
ATED
FIN
AN
CIA
L ST
ATEM
ENTS
SHARI’AH SUPERVISORY BOARD REPORT
41
INDEPENDENT AUDITORS’ REPORT TO THE SHAREHOLDERS OF VENTURE CAPITAL BANK B.S.C. (C)
REPORT ON THE CONSOLIDATED FINANCIAL STATEMENTS
We have audited the accompanying consolidated financial statements of Venture Capital Bank B.S.C. (c) (‘the Bank’) and its subsidiaries (together ‘the Group’), which comprise the consolidated statement of financial position as at 31 December 2011, and the consolidated statements of income, comprehensive income, cash flows, changes in equity, changes in off-balance sheet equity of investment account holders and sources and uses of Zakah Fund for the year then ended, and a summary of significant accounting policies and other explanatory information.
BOARD OF DIRECTORS’ RESPONSIBILITY FOR THE CONSOLIDATED FINANCIAL STATEMENTS
The Board of Directors is responsible for the preparation and fair presentation of these consolidated financial statements in accordance with International Financial Reporting Standards and with the Financial Accounting Standards issued by the Accounting and Auditing Organisation for Islamic Financial Institutions, and for such internal control the Board of Directors determines is necessary to enable the preparation of consolidated financial statements that are free from material misstatement, whether due to fraud or error.
AUDITORS’ RESPONSIBILITY
Our responsibility is to express an opinion on these consolidated financial statements based on our audit. We conducted our audit in accordance with International Standards on Auditing. Those standards require that we comply with ethical requirements and plan and perform the audit to obtain reasonable assurance whether the consolidated financial statements are free from material misstatement.
An audit involves performing procedures to obtain audit evidence about the amounts and disclosures in the consolidated financial statements. The procedures selected depend on the auditors’ judgement, including the assessment of the risks of material misstatement of the consolidated financial statements, whether due to fraud or error. In making those risk assessments, the auditors consider internal control relevant to the entity’s preparation and fair presentation of the consolidated financial statements in order to design audit procedures that are appropriate in the circumstances, but not for the purpose of expressing an opinion on the effectiveness of the entity’s internal control. An audit also includes evaluating
the appropriateness of accounting policies used and the reasonableness of accounting estimates made by the Board of Directors, as well as evaluating the overall presentation of the consolidated financial statements.
We believe that the audit evidence we have obtained is sufficient and appropriate to provide a basis for our audit opinion.
OPINION
In our opinion the consolidated financial statements present fairly, in all material respects, the financial position of the Group as of 31 December 2011, and its financial performance and cash flows for the year then ended in accordance with International Financial Reporting Standards and the Financial Accounting Standards issued by the Accounting and Auditing Organisation for Islamic Financial Institutions.
REPORT ON OTHER REGULATORY REQUIREMENTS
As required by the Bahrain Commercial Companies Law and the Central Bank of Bahrain (‘CBB’) Rule Book (Volume 2), we report that:
a) the Group has maintained proper accounting records and the consolidated financial statements are in agreement therewith; and
b) the financial information contained in the Report of the Board of Directors is consistent with the consolidated financial statements.
We are not aware of any violations of the Bahrain Commercial Companies Law, the Central Bank of Bahrain and Financial Institutions Law, the CBB Rule Book (Volume 2 and applicable provisions of Volume 6) and CBB directives, or the terms of the Bank’s memorandum and articles of association during the year ended 31 December 2011 that might have had a material adverse effect on the business of the Bank or on its financial position. Satisfactory explanations and information have been provided to us by management in response to all our requests.
29 February 2012
Manama, Kingdom of Bahrain

42
CO
NSO
LID
ATED
FIN
AN
CIA
L ST
ATEM
ENTS
The attached notes form part of these consolidated financial statements.
CONSOLIDATED STATEMENT OF FINANCIAL POSITION31 December 2011
2011 2010Note USD ‘000 USD ‘000
ASSETSBalances with banks 3,286 2,672 Placements with financial institutions 8 10,652 11,267 Investments 9 112,954 135,396 Investments in associates and joint venture accounted under the equity
method 10 29,474 31,677 Investment property 11 9,130 9,130 Receivable from investment banking services 12 6,550 13,837 Funding to project companies 13 5,839 20,975 Other assets 14 9,673 11,942 Property and equipment 15 10,977 12,350 TOTAL ASSETS 198,535 249,246
LIABILITIESIslamic financing payable 8,631 44 Employee accruals 6,323 5,785 Other liabilities 16 3,865 3,715 Total liabilities 18,819 9,544
EQUITYShare capital 17 250,000 250,000 Share premium 17 28,429 28,429 Unvested shares of employee share ownership plan (22,764) (22,764)Statutory reserve 17 10,414 10,414 Investment fair value reserve 17 628 2,229 Employee share ownership plan reserve 5,349 5,064 Accumulated losses (92,340) (33,670)Total equity 179,716 239,702 TOTAL LIABILITIES AND EQUITY 198,535 249,246
OFF STATEMENT OF FINANCIAL POSITION ITEMSEquity of investment account holders 16,846 16,219
Dr. Ghassan Al SulaimanChairman
Abdullatif M. JanahiBoard Member
and Chief Executive Officer
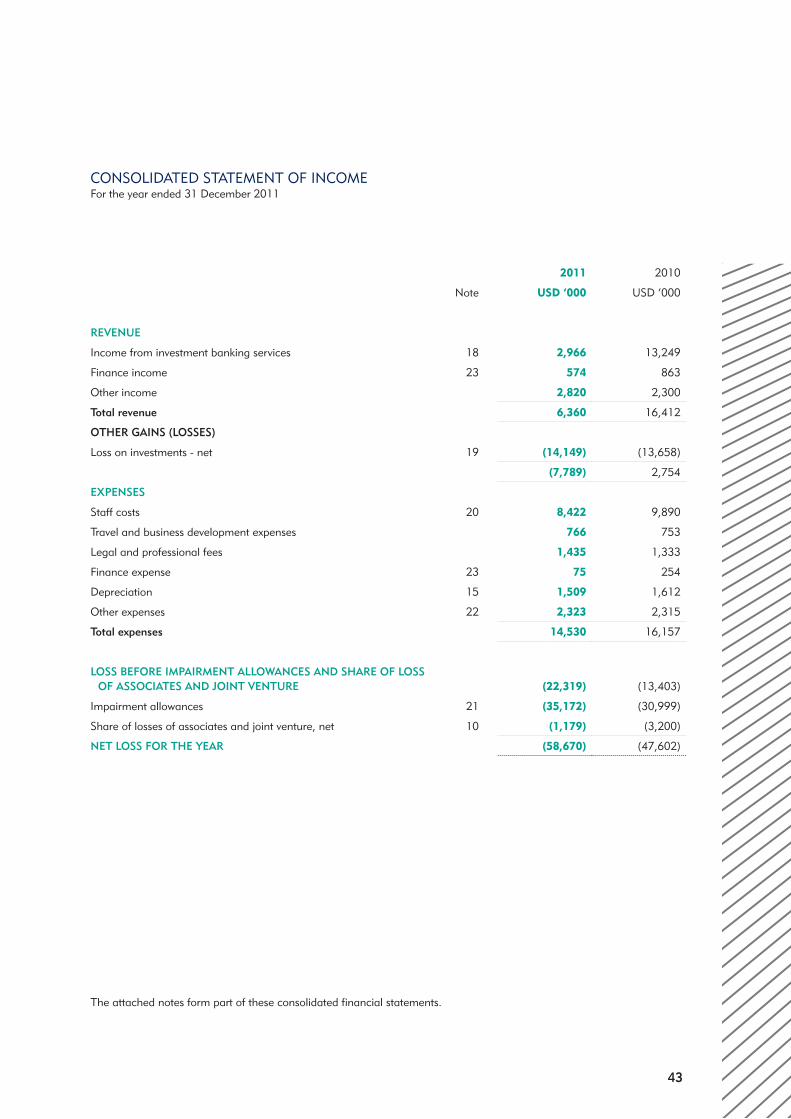
43
The attached notes form part of these consolidated financial statements.
CONSOLIDATED STATEMENT OF INCOMEFor the year ended 31 December 2011
2011 2010
Note USD ‘000 USD ‘000
REVENUE
Income from investment banking services 18 2,966 13,249
Finance income 23 574 863
Other income 2,820 2,300
Total revenue 6,360 16,412
OTHER GAINS (LOSSES)
Loss on investments - net 19 (14,149) (13,658)
(7,789) 2,754
EXPENSES
Staff costs 20 8,422 9,890
Travel and business development expenses 766 753
Legal and professional fees 1,435 1,333
Finance expense 23 75 254
Depreciation 15 1,509 1,612
Other expenses 22 2,323 2,315
Total expenses 14,530 16,157
LOSS BEFORE IMPAIRMENT ALLOWANCES AND SHARE OF LOSS OF ASSOCIATES AND JOINT VENTURE (22,319) (13,403)
Impairment allowances 21 (35,172) (30,999)
Share of losses of associates and joint venture, net 10 (1,179) (3,200)
NET LOSS FOR THE YEAR (58,670) (47,602)

44
CO
NSO
LID
ATED
FIN
AN
CIA
L ST
ATEM
ENTS
The attached notes form part of these consolidated financial statements.
CONSOLIDATED STATEMENT OF COMPREHENSIVE INCOMEFor the year ended 31 December 2011
2011 2010
Note USD ‘000 USD ‘000
LOSS FOR THE YEAR (58,670) (47,602)
Other comprehensive (loss) income
Recycling of gain on sale of available-for-sale investments to the consolidated statement of income 19 (867) -
Changes in fair value of available-for-sale investments 9 (734) 733
Other comprehensive (loss) income for the year (1,601) 733
TOTAL COMPREHENSIVE LOSS FOR THE YEAR (60,271) (46,869)
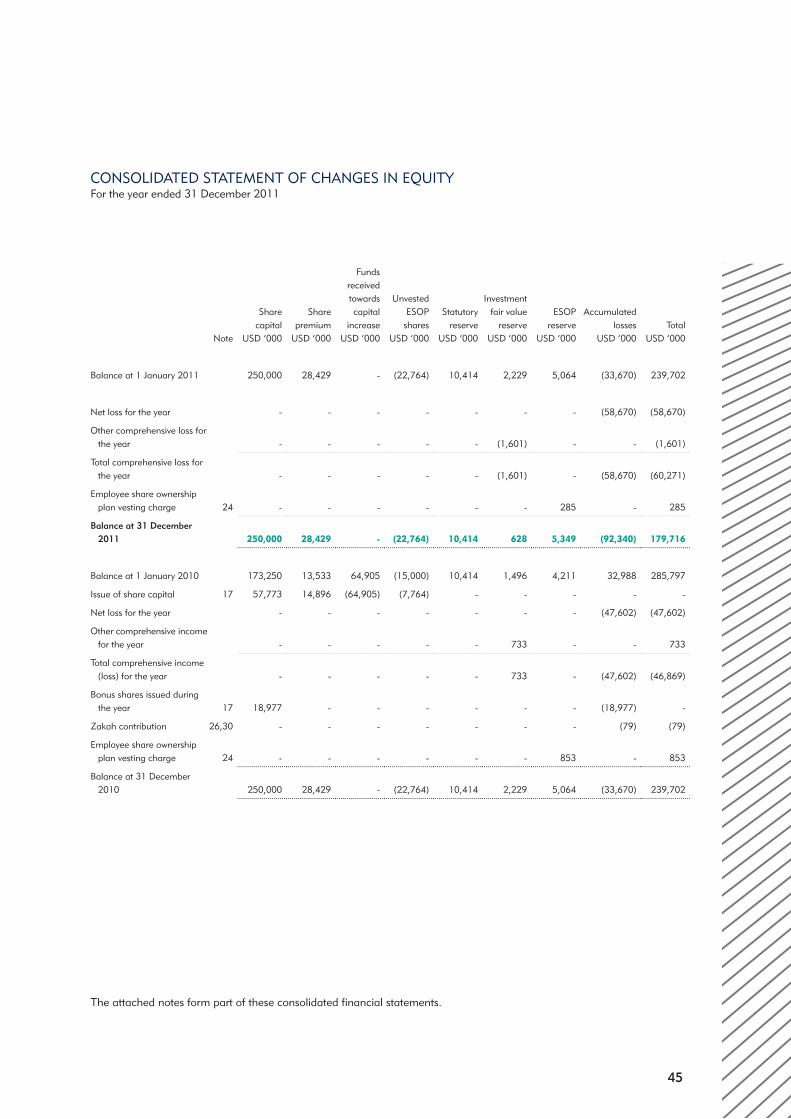
45
The attached notes form part of these consolidated financial statements.
CONSOLIDATED STATEMENT OF CHANGES IN EQUITYFor the year ended 31 December 2011
Note
Share capital
USD ‘000
Share premium
USD ‘000
Funds received towards capital
increaseUSD ‘000
Unvested ESOP
sharesUSD ‘000
Statutory reserve
USD ‘000
Investment fair value
reserveUSD ‘000
ESOPreserve
USD ‘000
Accumulatedlosses
USD ‘000Total
USD ‘000
Balance at 1 January 2011 250,000 28,429 - (22,764) 10,414 2,229 5,064 (33,670) 239,702
Net loss for the year - - - - - - - (58,670) (58,670)
Other comprehensive loss for the year - - - - - (1,601) - - (1,601)
Total comprehensive loss for the year - - - - - (1,601) - (58,670) (60,271)
Employee share ownership plan vesting charge 24 - - - - - - 285 - 285
Balance at 31 December 2011 250,000 28,429 - (22,764) 10,414 628 5,349 (92,340) 179,716
Balance at 1 January 2010 173,250 13,533 64,905 (15,000) 10,414 1,496 4,211 32,988 285,797
Issue of share capital 17 57,773 14,896 (64,905) (7,764) - - - - -
Net loss for the year - - - - - - - (47,602) (47,602)
Other comprehensive income for the year - - - - - 733 - - 733
Total comprehensive income (loss) for the year - - - - - 733 - (47,602) (46,869)
Bonus shares issued during the year 17 18,977 - - - - - - (18,977) -
Zakah contribution 26,30 - - - - - - - (79) (79)
Employee share ownership plan vesting charge 24 - - - - - - 853 - 853
Balance at 31 December 2010 250,000 28,429 - (22,764) 10,414 2,229 5,064 (33,670) 239,702
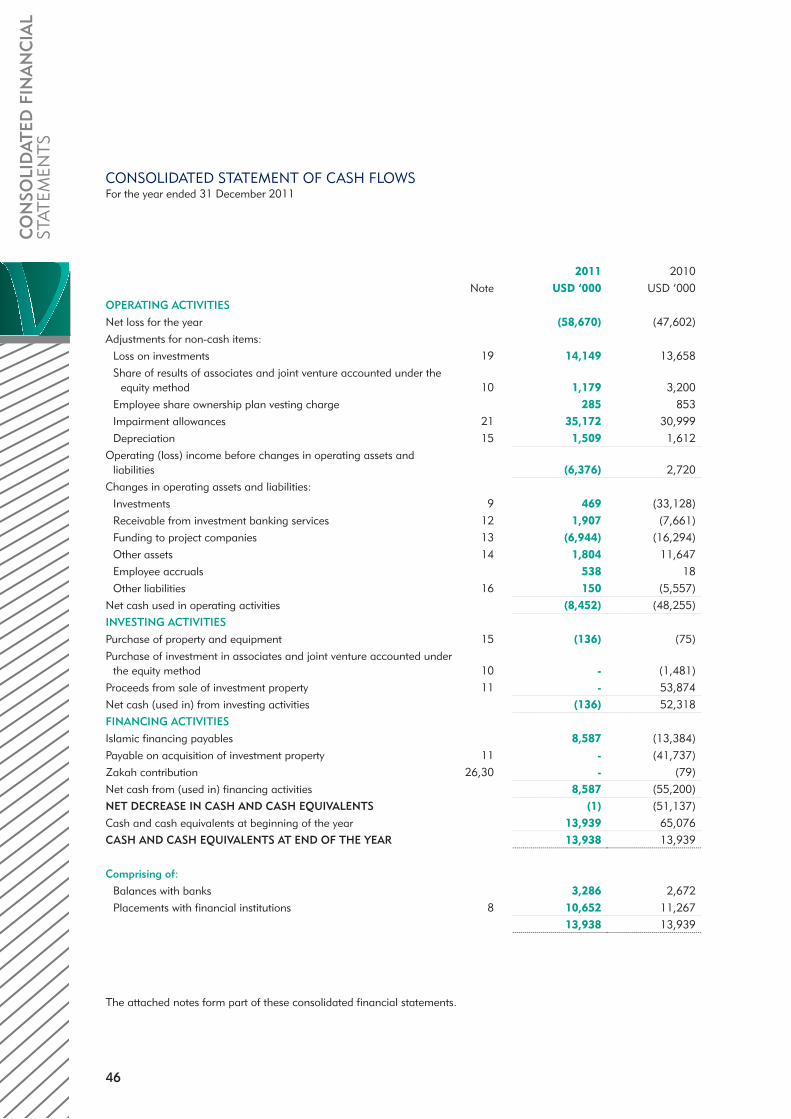
46
CO
NSO
LID
ATED
FIN
AN
CIA
L ST
ATEM
ENTS
The attached notes form part of these consolidated financial statements.
CONSOLIDATED STATEMENT OF CASH FLOWSFor the year ended 31 December 2011
2011 2010Note USD ‘000 USD ‘000
OPERATING ACTIVITIESNet loss for the year (58,670) (47,602)Adjustments for non-cash items:
Loss on investments 19 14,149 13,658 Share of results of associates and joint venture accounted under the
equity method 10 1,179 3,200 Employee share ownership plan vesting charge 285 853 Impairment allowances 21 35,172 30,999 Depreciation 15 1,509 1,612
Operating (loss) income before changes in operating assets and liabilities (6,376) 2,720
Changes in operating assets and liabilities: Investments 9 469 (33,128)Receivable from investment banking services 12 1,907 (7,661)Funding to project companies 13 (6,944) (16,294)Other assets 14 1,804 11,647 Employee accruals 538 18 Other liabilities 16 150 (5,557)
Net cash used in operating activities (8,452) (48,255)INVESTING ACTIVITIESPurchase of property and equipment 15 (136) (75)Purchase of investment in associates and joint venture accounted under
the equity method 10 - (1,481)Proceeds from sale of investment property 11 - 53,874 Net cash (used in) from investing activities (136) 52,318 FINANCING ACTIVITIESIslamic financing payables 8,587 (13,384)Payable on acquisition of investment property 11 - (41,737)Zakah contribution 26,30 - (79)Net cash from (used in) financing activities 8,587 (55,200)NET DECREASE IN CASH AND CASH EQUIVALENTS (1) (51,137)Cash and cash equivalents at beginning of the year 13,939 65,076 CASH AND CASH EQUIVALENTS AT END OF THE YEAR 13,938 13,939
Comprising of:Balances with banks 3,286 2,672 Placements with financial institutions 8 10,652 11,267
13,938 13,939

47
The attached notes form part of these consolidated financial statements.
CONSOLIDATED STATEMENT OF CHANGES IN OFF-BALANCE SHEET EQUITY OF INVESTMENT ACCOUNT HOLDERSFor the year ended 31 December 2011
Movements during the year
2011
Balance
as at 1
January
Investment /
withdrawal
Fair value
movement /
(impairment)
Gross
income
Dividends
paid
Bank’s fees
as an agent
Balance
as at 31
December
USD ‘000 USD ‘000 USD ‘000 USD ‘000 USD ‘000 USD ‘000 USD ‘000
GCC Pre IPO Fund 3,878 (266) (2) 71 - - 3,681
VCBank Investment Projects
Mudarabah 12,341 - - 886 - (62) 13,165
Balance as at 31 December 2011 16,219 (266) (2) 957 - (62) 16,846
2010
GCC Pre IPO Fund 4,471 - (595) 2 - - 3,878
VCBank Investment Projects
Mudarabah 12,308 - - 887 (792) (62) 12,341
Balance as at 31 December 2010 16,779 - (595) 889 (792) (62) 16,219
2011 2010
USD ‘000 USD ‘000
Investment in equities 3,679 3,681
Funds in short term murabaha 13,167 12,538
Total 16,846 16,219
The GCC Pre-lPO Fund targets investments in selected GCC equities in the pre-lPO stage with the primary objective of benefiting from the potential market gains expected to arise from their IPOs. Investors nominate the specific equities they wish to participate in from a pool of GCC Pre-IPO equities, specifying the amounts in each, and receive all returns less the Bank’s fee of 20% over a 10% simple return.
The VCBank Investment Projects Mudarabah provides an opportunity for investors to earn attractive returns from providing liquidity financing to selected investment projects from the portfolio of projects promoted by the Group.

48
CO
NSO
LID
ATED
FIN
AN
CIA
L ST
ATEM
ENTS
The attached notes form part of these consolidated financial statements.
CONSOLIDATED STATEMENT OF SOURCES AND USES OF ZAKAH FUND For the year ended 31 December 2011
2011 2010
Note USD ‘000 USD ‘000
Sources of Zakah Fund
Contribution by the Group 26, 30 - 79
Total sources of Zakah Fund - 79
Uses of Zakah Fund
Contributions to charitable organisations 26, 30 - 79
Total uses of Zakah Fund - 79
Undistributed Zakah Fund at 31 December - -

49
1 INCORPORATION AND ACTIVITIES
Incorporation
Venture Capital Bank B.S.C. (c) (“the Bank”) was incorporated in the Kingdom of Bahrain on 26 September 2005 as a closed shareholding company under commercial registration (CR) number 58222 issued by the Ministry of Industry and Commerce. The Bank is licensed as a wholesale Islamic bank by the Central Bank of Bahrain (“CBB”) and is subject to the regulations and supervision of the CBB.
Activities
The principal activities of the Bank comprise venture capital, real estate and private equity investment transactions and related investment advisory services. The Bank conducts all its activities in compliance with Islamic Shari’ah under the guidance and supervision of the Bank’s Shari’ah Supervisory Board, and in compliance with applicable laws and regulations.
The consolidated financial statements comprise the financial statements of the Bank and its subsidiary companies (together, “the Group”). Refer to note 6 for details of the Bank’s subsidiaries.
These consolidated financial statements were approved by the Bank’s Board of Directors on 29 February 2012.
2 BASIS OF PREPARATION
Statement of compliance
The consolidated financial statements of the the Group have been prepared in accordance with both the Financial Accounting Standards (FAS) issued by the Accounting and Auditing Organisation (AAOIFI) for Islamic Financial Institutions and International Financial Reporting Standards (IFRS) and in conformity with Bahrain Commercial Companies Law, the Central Bank of Bahrain and Financial Institutions Law, the CBB Rule Book (Volume 2 and applicable provisions of Volume 6) and CBB directives, and the terms of the Bank’s memorandum and articles of association.
Accounting convention
The consolidated financial statements have been prepared under the historical cost convention as modified for the re-measurement at fair value of investment securities, and are presented in United States Dollars (USD) which is the functional currency of the Group. All values are rounded off to the nearest thousand (USD 000’s) unless otherwise indicated.
Basis of consolidation
A subsidiary is an entity that the Group has the power to control so as to obtain economic benefits and therefore excludes those held in a fiduciary capacity. The financial statements of the subsidiary are prepared for the same reporting period as the Bank, using consistent accounting policies.
Subsidiaries are consolidated from the date of acquisition, being the date on which the Group obtains control and continue to be consolidated until the date that such control ceases.
All intra-group balances, transactions, income and expenses and profit and losses are eliminated in full.
Non-controlling interests represent the portion of profit or loss and net assets not owned, directly or indirectly, by the Group and are presented separately in the consolidated statements of income and comprehensive income and within equity, separately from the parent shareholders’ equity.
NOTES TO THE CONSOLIDATED FINANCIAL STATEMENTSFor the year ended 31 December 2011
50
CO
NSO
LID
ATED
FIN
AN
CIA
L ST
ATEM
ENTS
NOTES TO THE CONSOLIDATED FINANCIAL STATEMENTS (CONTINUED)For the year ended 31 December 2011
3 SIGNIFICANT ACCOUNTING JUDGEMENTS AND ESTIMATES
The preparation of these consolidated financial statements requires management to make judgements, estimates and assumptions that affect the reported amounts in the consolidated financial statements. However, uncertainty about these assumptions and estimates could result in outcomes that require a material adjustment to the carrying amount of the asset or liability affected in future periods. The most significant judgements and estimates are discussed below:
Going concern
The Group’s management has made an assessment of the Group’s ability to continue as a going concern and is satisfied that the Group has the resources to continue in business for the foreseeable future. Furthermore, the management is not aware of any material uncertainties that may cast significant doubt upon the Group’s ability to continue as a going concern. Therefore, the consolidated financial statements continue to be prepared on a going concern basis.
Classification of investments
Management decides on acquisition of a financial asset whether it should be classified as “fair value through profit and loss”, “available-for-sale” or “held to maturity”. The classification of each investment reflects the management’s intention in relation to each investment and is subject to different accounting treatments based on such classification.
Fair value of financial instruments
Fair value estimates are made at a specific point in time, based on market conditions and information about the investee companies/funds. These estimates involve uncertainties and matters of significant judgement and therefore, cannot be determined with precision. There is no certainty about future events (such as continued operating profits and financial strengths). It is reasonably possible, based on existing knowledge, that outcomes within the next financial year that are different from assumptions could require a material adjustment to the carrying amount of the investments.
Details of estimates and related sensitivity analysis are disclosed in notes 35 and 36.
Impairment on assets carried at amortised cost
Judgement by management is required in the estimation of the amount and timing of future cash flows when determining the impairment loss. In estimating these cash flows, the Group makes judgements about the liquidity of the project, evidence of deterioration in the financial health of the project, impacts of delays in execution and the net realisable value of any underlying assets. These estimates are based on assumptions about a number of factors and actual results may differ, resulting in future changes to the allowance. Each asset is assessed on its merits, and the strategy to recover and estimate of cash flows considered recoverable are independently evaluated by the Risk Management Department and approved by the Finance & Investment Committee.
Impairment of available-for-sale investments
The Group records impairment charges on available-for-sale equity investments when there has been a significant or prolonged decline in the investment’s fair value compared to cost. The determination of what is ‘significant’ or ‘prolonged’ requires judgement and is assessed for each investment separately. In case of quoted equity securities, the Group considers a decline of more than 30% in the fair value below cost to be significant and considers a decline below cost which persists for more than six months as prolonged. In making this judgement, the Group evaluates, among other factors, historical share price movements and duration and extent to which the fair value of an investment is less than its cost.
Where fair values are not readily available and the investments are carried at cost, the recoverable amount of such investment is estimated to test for impairment. A significant portion of the Group’s available-for-sale investments comprise investments in long-term real estate development projects. In making a judgement of impairment, the Group evaluates

51
among other factors, evidence of deterioration in the financial health of the project, impacts of delays in execution, industry and sector performance, changes in technology, and operational and financing cash flows. It is reasonably possible, based on existing knowledge, that the current assessment of impairment could require a material adjustment to the carrying amount of the investments within the next financial year due to significant changes in the assumptions underlying such assessments.
Consolidation of special purpose entities (SPEs)
The Group sponsors the formation of SPEs primarily for the purpose of allowing clients to hold investments. The Group provides nominee, corporate administration, investment management and advisory services to these SPEs, which involve the Group making decisions on behalf of such entities. The Group administers and manages these entities on behalf of its clients, who are by and large third parties and are the economic beneficiaries of the underlying investments. The Group does not consolidate SPEs that it does not have the power to control. In determining whether the Group has the power to control an SPE, judgements are made about the objectives of the SPE’s activities, its exposure to the risks and rewards, as well as about the Group’s intention and ability to make operational decisions for the SPE and whether the Group derives benefits from such decisions.
4 PROSPECTIVE CHANGES IN ACCOUNTING POLICIES
New standards and amendments issued but not yet effective
Standards issued but not yet effective up to the date of issuance of the Group’s consolidated financial statements are listed below. This listing is of standards and interpretations issued, which the Group reasonably expects to be applicable at a future date. The Group intends to adopt those standards (where applicable) when they become effective:
IAS 1 Financial Statement Presentation
The amendments becomes effective for annual periods beginning on or after 1 July 2012 and require that an entity present separately, the items of other comprehensive income that would be reclassified (or recycled) to profit or loss in the future if certain conditions are met (for example, upon de-recognition or settlement), from those that would never be reclassified to profit or loss. The amendment affects presentation only, therefore, will have no impact on the Group’s financial position or performance.
IAS 19 Employee Benefits
The IASB has issued numerous amendments to IAS 19, which are effective for annual periods beginning on or after 1 January 2013. These include the elimination of the corridor approach and recognising all actuarial gains and losses in other comprehensive income as they occur; immediate recognition of all past service costs; and replacement of interest cost and expected return on plan assets with a net interest amount that is calculated by applying the discount rate to the net defined benefit liability (asset); and certain clarifications and re-wording. The Group is currently assessing the full impact of these amendments.
IFRS 9 Financial Instruments
IFRS 9 as issued reflects the first phase of the IASB’s work on the replacement of IAS 39 and applies to classification and measurement of financial assets and financial liabilities as defined in IAS 39.
It replaces the parts of IAS 39 that relate to the classification and measurement of financial instruments. IFRS 9 requires financial assets to be classified into two measurement categories: those measured as at fair value and those measured at amortised cost. The determination is made at initial recognition. The classification depends on the entity’s business model for managing its financial instruments and the contractual cash flow characteristics of the instrument.
52
CO
NSO
LID
ATED
FIN
AN
CIA
L ST
ATEM
ENTS
NOTES TO THE CONSOLIDATED FINANCIAL STATEMENTS (CONTINUED)For the year ended 31 December 2011
4 PROSPECTIVE CHANGES IN ACCOUNTING POLICIES (CONTINUED)
New standards and amendments issued but not yet effective (continued)
IFRS 9 Financial Instruments (continued)
For financial liabilities, the standard retains most of the IAS 39 requirements. The main change is that, in cases where the fair value option is taken for financial liabilities, the part of a fair value change due to an entity’s own credit risk is recorded in other comprehensive income rather than the statement of income, unless this creates an accounting mismatch.
It also includes those paragraphs of IAS 39 dealing with how to measure fair value and accounting for derivatives embedded in a contract that contains a host that is not a financial asset, as well as the requirements of IFRIC 9 Reassessment of Embedded Derivatives.
The IASB issued amendments to IFRS 9 that defer the mandatory effective date from 1 January 2013 to 1 January 2015 with early application continuing to be permitted. In subsequent phases, the IASB will address hedge accounting and impairment of financial assets.
The Group will quantify the effect of adoption of this standard, in conjunction with the other phases, when issued, to present a comprehensive picture.
IFRS 10 Consolidated Financial Statements
IFRS 10 introduces a new approach to determining which investees should be consolidated and provides a single consolidation model that identifies control as the basis for consolidation for all types of entities.
An investor controls an investee when:- it is exposed or has rights to variable returns from its involvement with that investee;- it has the ability to affect those returns through its power over that investee; and- there is a link between power and returns.
Control is re-assessed as facts and circumstances change.
IFRS 10 replaces IAS 27 Consolidated and Separate Financial Statements and SIC-12 Consolidation - Special Purpose Entities. IFRS 10 is effective for annual periods beginning on or after 1 January 2013 and earlier application is permitted. The Group is currently assessing the full impact of this new standard.
IFRS 11 Joint Arrangements
IFRS 11 establishes principles for the financial reporting by parties to a joint arrangement and improves on IAS 31 by establishing principles that are applicable to the accounting for all joint arrangements.
IFRS 11 classifies joint arrangements into two types – joint operations and joint ventures; and defines joint control as the contractually agreed sharing of control of an arrangement, which exists only when decisions about the relevant activities (i.e. activities that significantly affect the returns of the arrangement) require the unanimous consent of the parties sharing control.
IFRS 11 supersedes IAS 31 Interests in Joint Ventures and SIC-13 Jointly Controlled Entities – Non-monetary Contributions by Venturers. IFRS 11 is effective for annual periods beginning on or after 1 January 2013 and earlier application is permitted. The Group is currently assessing the full impact of this new standard.
IFRS 12 Disclosure of Interests in Other Entities
IFRS 12 combines, enhances and replaces the disclosure requirements for subsidiaries, joint arrangements, associates and unconsolidated structured entities. As a consequence of these new IFRSs, the IASB also issued, amended and retitled IAS 27 Separate Financial Statements and IAS 28 Investments in Associates and Joint Ventures.

53
IFRS 12 aims to provide information to enable users to evaluate:- the nature of, and risks associated with, an entity’s interests in other entities; and- the effect of those interests on the entity’s financial position, financial performance and cash flows.
IFRS 12 is effective for annual periods beginning on or after 1 January 2013 and earlier application is permitted. The Group is currently assessing the full impact of this new standard.
IFRS 13 Fair Value Measurement
IFRS 13 replaces the fair value measurement guidance contained in individual IFRSs with a single source of fair value measurement guidance. It defines fair value, establishes a framework for measuring fair value and sets out disclosure requirements for fair value measurements. It explains how to measure fair value when it is required or permitted by other IFRSs. IFRS 13 does not extend the use of fair value accounting but provides guidance on how it should be applied where its use is already required or permitted by other standards within IFRSs.
IFRS 13 is effective for annual periods beginning on or after 1 January 2013 and earlier application is permitted. The Group is currently assessing the full impact of this new standard.
IAS 27 Separate Financial Statements (as revised in 2011)
IAS 27 (2011) supersedes IAS 27 (2008). As a consequence of the new IFRS 10 and IFRS 12 aforementioned, IAS 27 (2011) carries forward the existing accounting and disclosure requirements for separate financial statements, with some minor clarifications.
IAS 27 (2011) is effective for annual periods beginning on or after 1 January 2013 and earlier application is permitted. The Group does not present separate financial statements.
IAS 28 Investments in Associates and Joint Ventures (as revised in 2011)
IAS 28 (2011) supersedes IAS 28 (2008). As a consequence of the new IFRS 11 and IFRS 12 aforementioned, IAS 28 has been renamed IAS 28 Investments in Associates and Joint Ventures, and describes the application of the equity method to investments in joint ventures in addition to associates.
IAS 28 (2011) is effective for annual periods beginning on or after 1 January 2013 and earlier application is permitted. The Group is currently assessing the full impact of this revised standard.
5 SUMMARY OF SIGNIFICANT ACCOUNTING POLICIES
5.1 New and amended standards and interpretations effective as of 1 January 2011
The accounting policies adopted are consistent with those of the previous financial year, except for the following new and amended IFRS and IFRIC interpretations effective as of 1 January 2011:
IAS 24 Related Party Disclosures (amendment)
The IASB has issued an amendment to IAS 24 that clarifies the identification of related party relationships, particularly in relation to significant influence or joint control. The new definitions emphasise a symmetrical view on related party relationship as well as clarifying in which circumstances persons and key management personnel affect related party relationships of an entity. Secondly, the amendment introduces an exemption from the general related party disclosure requirements for transactions with a government and entities that are controlled, jointly controlled or significantly influenced by the same government as the reporting entity. The adoption of the amendment did not have any impact on the financial position or performance of the Group.
54
CO
NSO
LID
ATED
FIN
AN
CIA
L ST
ATEM
ENTS
NOTES TO THE CONSOLIDATED FINANCIAL STATEMENTS (CONTINUED)For the year ended 31 December 2011
5 SUMMARY OF SIGNIFICANT ACCOUNTING POLICIES (continued)
5.1 New and amended standards and interpretations effective as of 1 January 2011 (continued)
IAS 32 Financial Instruments: Presentation (amendment)
The amendment alters the definition of a financial liability in IAS 32 to enable entities to classify rights issues and certain options or warrants as equity instruments. The amendment is applicable if the rights are given pro-rata to all of the existing owners of the same class of an entity’s non-derivative equity instruments, to acquire a fixed number of the entity’s own equity instruments for a fixed amount in any currency. The amendment has had no effect on the financial position or performance of the Group as the Group has not issued these type of instruments.
IFRS 7 Financial Instruments: Disclosures (amendment)
These amendments introduced new disclosure requirements for transfers of financial assets, including disclosures for:
- financial assets that are not de-recognised in their entirety; and
- financial assets that are de-recognised in their entirety but for which the entity retains continuing involvement.
The amendment has had no effect on the disclosures made by the Group as the Group has not issued these types of instruments.
Improvements to IFRSs
In May 2010, the Board issued its third omnibus of amendments to its standards, primarily with a view to removing inconsistencies and clarifying wording. There are separate transitional provisions for each standard. The adoption of the following amendments resulted in changes to accounting policies, but did not have any impact on the financial position or performance of the Group.
- IFRS 3 Business Combinations: The measurement options available for non-controlling interest (NCI) have been amended. Only components of NCI that constitute a present ownership interest that entitles their holder to a proportionate share of the entity’s net assets in the event of liquidation must be measured at either fair value or at the present ownership instruments’ proportionate share of the acquiree’s identifiable net assets. All other components are to be measured at their acquisition date fair value.
- IFRS 7 Financial Instruments – Disclosures: The standard was amended to simplify the disclosures required, by reducing the volume of disclosures around collateral held and improving disclosures by requiring qualitative information to put the quantitative information in context.
- IAS 1 Presentation of Financial Statements: The amendment clarifies that an analysis of each component of other comprehensive income may be presented either in the consolidated statement of changes in equity or in the notes to the consolidated financial statements.
Other amendments resulting from improvements to IFRSs to the following standards did not have any impact on the accounting policies, financial position or performance of the Group:
- IFRS 3 Business Combinations (Contingent consideration arising from business combination prior to adoption of IRS 3 (as revised in 2008);
- IFRS 3 Business Combinations (Un-replaced and voluntarily replaced share-based payment award);
- IAS 27 Consolidated and Separate Financial Statements;
- IAS 34 Interim Financial Reporting; and
- IFRIC 19 Extinguishing Financial Liabilities with Equity Instruments.

55
5.2 Significant accounting policies
(a) Foreign currency transactions
(i) Functional and presentation currency
Items included in the consolidated financial statements are measured using the currency of the primary economic environment in which the entity operates (the functional currency). The consolidated financial statements are presented in US Dollars, which is the Bank’s functional and presentation currency.
(ii) Transactions and balances
Transactions in foreign currencies are initially recorded at the functional currency rate prevailing at the date of the transaction. Monetary assets and liabilities denominated in foreign currencies are retranslated at the functional currency spot rate of exchange ruling at the consolidated statement of financial position date. All differences are taken to the consolidated statement of income.
Non-monetary items that are measured in terms of historical cost in a foreign currency are translated using the exchange rates as at the dates of the initial transactions and are not subsequently restated. Non-monetary items measured at fair value in a foreign currency are translated using the exchange rates at the date when the fair value was determined and the differences are included in equity as part of the fair value adjustment of the respective items. Fair value differences arising from investments in associates denominated in a foreign currency are taken to “foreign currency translation reserve” forming part of equity.
(iii) Group companies
The Group does not have significant investments in foreign operations with functional currency different from the presentation currency of the Group. The functional currency of the majority of the Group’s entities are either US Dollars or currencies which are effectively pegged to the US Dollar, and hence, the translation of the financial statements of Group entities that have a functional currency different from the presentation currency do not result in significant exchange differences.
(b) Financial assets and liabilities
(i) Recognition and de-recognition
Financial assets of the Group comprise cash and balances with banks, placements with financial institutions, investments (other than associates and joint venture that are equity accounted), receivable from investment banking services, funding to project companies and other assets. Financial liabilities of the Group comprise Islamic financing payables, employee accruals and other liabilities. All financial assets (except investment securities) and financial liabilities are recognised on the date at which they are originated. Investment securities are recognised at the trade date i.e. the date that the Group contracts to purchase or sell the asset, at which date the Group becomes party to the contractual provisions of the instrument.
A financial asset or liability is initially measured at fair value which is the value of the consideration given (in the case of an asset) or received (in the case of a liability).
A financial asset (or, where applicable a part of a financial asset or part of a group of similar financial assets) is de-recognised when:
(i) the right to receive cash flows from the asset has expired;
(ii) the Group retains the right to receive cash flows from the asset, but has assumed an obligation to pay them in full without material delay to a third party under a ‘pass through’ arrangement; or
(iii) the Group has transferred its rights to receive cash flows from the asset and either (a) has transferred substantially all the risks and rewards of the asset, or (b) has neither transferred nor retained substantially all the risks and rewards of the asset, but has transferred control of the asset.

56
CO
NSO
LID
ATED
FIN
AN
CIA
L ST
ATEM
ENTS
NOTES TO THE CONSOLIDATED FINANCIAL STATEMENTS (CONTINUED)For the year ended 31 December 2011
5 SUMMARY OF SIGNIFICANT ACCOUNTING POLICIES (continued)
5.2 Significant accounting policies (continued)
(b) Financial assets and liabilities (continued)
(i) Recognition and de-recognition (continued)
When the Group has transferred its rights to receive cash flows from an asset and has neither transferred nor retained substantially all the risks and rewards of the asset nor transferred control of the asset, the asset is recognised to the extent of the Group’s continuing involvement in the asset.
The Group de-recognises a financial liability when its contractual obligations are discharged, cancelled or expired.
(ii) Classification of financial assets and liabilities
The Group classifies financial assets under the following IAS 39 categories: financial assets at fair value through profit or loss; loans and receivables; held-to-maturity; and available-for-sale financial assets. Except for investment securities, the Group classifies all other financial assets as loans and receivables. All of the financial liabilities of the Group are classified at amortised cost. Management determines the classification of its financial instruments at initial recognition.
(iii) Measurement principles
Financial assets and liabilities are measured either at fair value, amortised cost or in certain cases carried at cost.
Fair value measurement Fair value is the amount for which an asset could be exchanged, or a liability settled, between knowledgeable,
willing parties in an arm’s length transaction on the measurement date.
When available, the Group measures the fair value of an instrument using quoted prices in an active market for that instrument. A market is regarded as active if quoted prices are readily and regularly available and represent actual and regularly occurring market transactions on an arm’s length basis. If a market for a financial instrument is not active, the Group establishes fair value using a valuation technique. Valuation techniques include using recent arm’s length transactions between knowledgeable, willing parties (if available), discounted cash flow analysis and other valuation models with accepted economic methodologies for pricing financial instruments.
Amortised cost The amortised cost of a financial asset or liability is the amount at which the financial asset or liability is
measured at initial recognition, minus principal repayments, plus or minus the cumulative amortisation using the effective profit method of any difference between the initial amount recognised and the maturity amount, minus any reduction for impairment. The calculation of the effective profit rate includes all fees and points paid or received that are an integral part of the effective profit rate.
(c) Investments
The Group classifies its investments, excluding investment in subsidiaries and equity accounted associates and joint ventures, in the following categories: fair value through profit or loss; held-to-maturity; and available-for-sale.
(i) Classification
Investments carried at fair value through profit or loss are financial assets that are either held for trading or which upon initial recognition are designated as such by the Group.
57
An investment is classified as held for trading if it is acquired principally for the purpose of selling or repurchasing it in the near term or is part of a portfolio of identified financial instruments that are managed together and for which there is evidence of a recent actual pattern of short-term profit-taking. These include investments in quoted equities.
The Group designates investments as fair value through profit or loss at inception only when it is managed, evaluated and reported internally on a fair value basis. These include certain private equity investments, including investments in certain associates and joint ventures.
Held-to-maturity investments are investments with fixed or determinable payments and fixed maturity that the Group has the positive intent and ability to hold to maturity, and which are not designated as at fair value through profit or loss or as available-for-sale. The Group currently does not hold any held-to-maturity investments.
Available-for-sale investments are financial assets that are not investments carried at fair value through profit or loss or held-to-maturity or loans and receivables. These include investments in certain quoted and unquoted equity securities.
(ii) Initial recognition
Investments are initially recognised at fair value, plus transaction costs for all financial assets not carried at fair value through profit or loss. Transaction costs on investments carried at fair value through profit or loss are expensed in the statement of income when incurred.
(iii) Subsequent measurement
Subsequent to initial recognition, investments at fair value through profit or loss and available-for-sale investments are re-measured to fair value. Gains and losses arising from a change in the fair value of investments carried at fair value through profit or loss are recognised in the consolidated statement of income in the period in which they arise. Gains and losses arising from a change in the fair value of available-for-sale investments are recognised in the consolidated statement of comprehensive income and presented in ‘Investment fair value reserve’ within equity. When available-for-sale investments are sold, impaired, collected or otherwise disposed of, the cumulative gain or loss previously recognised in equity is transferred to the consolidated statement of income.
Held-to-maturity investments are carried at amortised cost less any impairment allowances. Available-for-sale investments which do not have a quoted market price or other appropriate methods from which to derive reliable fair values are stated at cost less impairment allowances.
(iv) Fair value measurement principles
The determination of fair value for investments depends on the accounting policy as set out below:
(i) For investments quoted in an active market, fair value is determined by reference to quoted market prices;
(ii) For investments in unit funds, fair value is determined based on the latest net asset value provided by the fund manager; and
(iii) For unquoted investments, where the fair values cannot be derived from active markets, they are determined using a variety of valuation techniques that include the use of mathematical models. The inputs to these models are derived from observable market data where possible, but where observable market data are not available, judgement is required to establish fair values. The judgements include considerations of liquidity and model inputs such as expected cash flows, expected scale of activity, EBITDA multiples and discount rates.

58
CO
NSO
LID
ATED
FIN
AN
CIA
L ST
ATEM
ENTS
NOTES TO THE CONSOLIDATED FINANCIAL STATEMENTS (CONTINUED)For the year ended 31 December 2011
5 SUMMARY OF SIGNIFICANT ACCOUNTING POLICIES (continued)
5.2 Significant accounting policies (continued)
(c) Investments (continued)
(iv) Fair value measurement principles (continued)
For certain investments, the Group uses proprietary models, which usually are developed from recognised valuation models for fair valuation. Some or all of the inputs into these models may not be market observable, but are estimated based on assumptions. Inputs to valuation techniques reasonably represent market expectations and measures of the risk-return factors inherent in the financial instrument. Valuation adjustments are recorded to allow for bid-ask spreads, liquidity risks, as well as other factors. Management believes that these valuation adjustments are necessary and appropriate to fairly state the values of these investments.
(v) Impairment of investments
On each reporting date, the Group assesses whether there is objective evidence that investments not carried at fair value through profit or loss are impaired. Impairment is assessed on an individual basis for each investment and is reviewed twice a year. The Group does not perform a collective assessment of impairment of its investments as the risk and credit characteristics of each investment exposure is considered to be different.
In case of available-for-sale equity securities carried at fair value, a significant or prolonged decline in the fair value of the security below its cost is objective evidence of impairment resulting in recognition of an impairment loss. If any such evidence exists for available-for-sale investments, the cumulative loss – measured as the difference between the acquisition cost and the current fair value, less any impairment loss on that financial asset previously recognised in profit or loss – is removed from equity and recognised in the consolidated statement of income. Impairment losses recognised in the consolidated statement of income on equity instruments are not subsequently reversed through the consolidated statement of income.
For available-for-sale investments carried at cost, the Group makes an assessment of whether there is an objective evidence of impairment for each investment by assessment of financial and other operating and economic indicators. Impairment is recognised if the estimated recoverable amount is assessed to be below the cost of the investment.
(d) Other financial assets carried at amortised cost
All other financial assets are classified as loans and receivables and are carried at amortised cost less impairment allowances. Impairment loss is measured as the difference between the carrying amount of the financial asset and the present value of estimated cash flows discounted at the assets’ original effective profit rate. Losses, if any, are recognised in the consolidated statement of income and reflected in an allowance account against the respective financial asset.
(e) Investment in associates accounted under the equity method
The Group’s investment in its associates are accounted for using the equity method. An associate is an entity in which the Group has significant influence.
Under the equity method, the investments in associates are carried on the consolidated statement of financial position at cost plus post acquisition changes in the Group’s share of net assets of the associate. Goodwill relating to the associates is included in the carrying amount of the investment and is neither amortised nor individually tested for impairment.
The consolidated statement of income reflects the Group’s share of the results of operations of the associates. When there has been a change recognised directly in the equity of the associate, the Group recognises its

59
share of any changes and discloses this, when applicable, in the consolidated statement of changes in equity. Unrealised gains and losses resulting from transactions between the Group and the associate are eliminated to the extent of the interest in the associate.
The Group’s share of profit of associates is shown on the face of the consolidated statement of income. This is the profit attributable to equity holders of the associates and, therefore, is profit after tax and non-controlling interests in the subsidiaries of the associates.
The financial statements of the associates are prepared for the same reporting period as the Group. When necessary, adjustments are made to bring the accounting policies in line with those of the Group.
After application of the equity method, the Group determines whether it is necessary to recognise an additional impairment loss on its investment in its associates. The Group determines at each reporting date whether there is any objective evidence that the investment in the associate is impaired. If this is the case, the Group calculates the amount of impairment as the difference between the recoverable amount of the associate and its carrying value and recognises the amount in ‘Share of loss of associates and joint venture’ in the consolidated statement of income.
Upon loss of significant influence over the associate, the Group measures and recognises any retaining investment at its fair value. Any difference between the carrying amount of the associate upon loss of significant influence and the fair value of the retained investment and proceeds from disposal is recognised in profit or loss.
(f) Investment in a joint venture accounted under the equity method
The Group has an interest in a joint venture, which is a jointly controlled entity, whereby the venturers have a contractual arrangement that establishes joint control over the economic activities of the entity. The agreement requires unanimous agreement for financial and operating decisions among the venturers. The Group recognises its interest in the joint venture using the equity method. The Group presents its aggregate share of profit or loss from the jointly controlled entity accounted under the equity method on the face of the consolidated statement of income in ‘Share of loss of associates and joint venture’.
Adjustments are made in the Group’s consolidated financial statements to eliminate the Group’s share of intragroup balances, transactions and unrealised gains and losses on such transactions between the Group and its joint venture. Losses on transactions are recognised immediately if the loss provides evidence of a reduction in the net realisable value of current assets or an impairment loss.
Upon loss of joint control, the Group measures and recognises its remaining investment at its fair value. Any difference between the carrying amount of the former joint controlled entity upon loss of joint control and the fair value of the remaining investment and proceeds from disposal are recognised in the consolidated statement of income. When the remaining investment constitutes significant influence, it is accounted for as investment in an associate and accounted under the equity method.
(g) Investment property
Properties that are held for long-term rental yields or for capital appreciation or both, and that are not occupied by the entities in the Group, are classified as investment properties and are accounted for under the cost method net of accumulated depreciation. Investment property comprises freehold land and building.
Properties may be partially occupied by the Group, with the remainder being held for rental income or capital appreciation. If part of the property that is occupied by the Group can be sold separately, the Group accounts for the portions separately. The portion that is owner-occupied is accounted for under IAS 16 “Property, Plant and Equipment”, and the portion that is held for rental income or capital appreciation or both is treated as investment property under IAS 40 “Investment Property”. The portions that require allocation between self-occupied property and investment property are determined based on the relative area of the property.

60
CO
NSO
LID
ATED
FIN
AN
CIA
L ST
ATEM
ENTS
NOTES TO THE CONSOLIDATED FINANCIAL STATEMENTS (CONTINUED)For the year ended 31 December 2011
5 SUMMARY OF SIGNIFICANT ACCOUNTING POLICIES (continued)
5.2 Significant accounting policies (continued)
(g) Investment property (continued)
Investment properties are measured initially at cost, including transaction costs. Subsequent expenditure is included in the asset’s carrying amount only when it is probable that future economic benefits associated with the item will flow to the Group and the cost of the item can be measured reliably. All other repairs and maintenance costs are charged to the consolidated statement of income during the financial period in which they are incurred.
(h) Cash and cash equivalents
For the purpose of the consolidated statement of cash flows, cash and cash equivalents comprise cash and balances with banks and placements with financial institutions with original maturities of ninety days or less.
(i) Property and equipment
Property and equipment is stated at cost, net of accumulated depreciation. Depreciation is computed using the straight-line method to write-off the cost of the assets over the following estimated useful lives. Land is not depreciated. Residual values and useful lives are reviewed, and adjusted if appropriate, at each reporting date.
Office building 40 years Office equipment 4 years Furniture and fixtures 5 years Motor vehicles 4 years
(j) Impairment of non-financial assets
The Group assesses at each reporting date whether there is an indication that an asset may be impaired. If any indication exists, or when annual impairment testing for an asset is required, the Group estimates the asset’s recoverable amount. An asset’s recoverable amount is the higher of an asset’s or cash-generating unit’s (CGU) fair value less costs to sell and its value in use. Where the carrying amount of an asset or CGU exceeds its recoverable amount, the asset is considered impaired and is written down to its recoverable amount.
In assessing value in use, the estimated future cash flows are discounted to their present value using a pre-tax discount rate that reflects current market assessments of the time value of money and the risks specific to the asset. In determining fair value less costs to sell, an appropriate valuation model is used. These calculations are corroborated by valuation multiples, quoted share prices for publicly traded subsidiaries or other available fair value indicators.
For assets excluding goodwill, an assessment is made at each reporting date as to whether there is any indication that previously recognised impairment losses may no longer exist or may have decreased. If such indication exists, the Bank estimates the asset’s or CGU’s recoverable amount. A previously recognized impairment loss is reversed only if there has been a change in the assumptions used to determine the asset’s recoverable amount since the last impairment loss was recognised. The reversal is limited so that the carrying amount of the asset does not exceed its recoverable amount, nor exceeds the carrying amount that would have been determined, net of depreciation, had no impairment loss been recognised for the asset in prior years. Such reversal is recognised in the consolidated statement of income. Impairment losses relating to goodwill cannot be reversed in future periods.
(k) Islamic financing payable
Islamic financing payables are initially measured at fair value plus transaction costs, and subsequently measured at their amortised cost using the effective profit rate method. Finance expense is recognised in the consolidated statement of income on a time-apportioned basis at the effective profit rate.

61
(l) Financial guarantees
Financial guarantees are contracts that require the Group to make specified payments to reimburse the holder for a loss it incurs because a specified debtor fails to make payment when due in accordance with the terms of a debt instrument. A financial guarantee contract is recognised from the date of its issue. The liability arising from a financial guarantee contract is recognised at the present value of any expected payment, when a payment under the guarantee has become probable. The Group only issues financial guarantees to support its development projects and investee entities.
(m) Dividends and Board remuneration
Dividends to shareholders and board remuneration are recognised as liabilities in the period in which they are approved by the shareholders at the Bank’s Annual General Meeting.
(n) Share capital and statutory reserve
Ordinary shares issued by the Bank are classified as equity. The Group classifies capital instruments as financial liabilities or equity instruments in accordance with the substance of the contractual terms of the instruments. Incremental costs directly attributable to the issue of an equity instrument are deducted from the initial measurement of the equity instruments.
Treasury shares
The amount of consideration paid including all directly attributable costs incurred in connection with the acquisition of the treasury shares are recognised in equity. Consideration received on sale of treasury shares is presented in the financial statements as a change in equity. No gain or loss is recognised on the Group’s consolidated statement of income on the sale of treasury shares.
Statutory reserve
The Bahrain Commercial Companies Law 2001 requires that 10% of the annual profit be appropriated to a statutory reserve which is normally distributable only on dissolution. Appropriations may cease when the reserve reaches 50% of the paid up share capital.
(o) Revenue recognition
Income from investment banking services
Income from investment banking services comprise income from investment advisory and structuring income, advisory fee, placement and arrangement fee and other fees arising from related activities, as further explained below:
(i) Investment advisory and structuring income
Investment advisory and structuring income is recognised when the service is provided and income is earned. This is usually when the Group has performed all significant acts in relation to a transaction and it is highly probable that the economic benefits from the transaction will flow to the Group.
(ii) Fee income
Fee income is recognised when earned and the related services are performed and / or upon achieving required performance.
(iii) Income from placements with financial institutions
Income from placements with financial institutions is recognised on a time-apportioned basis over the period of the related contract.
Dividend income
Dividend income is recognised when the right to receive payment is established.

62
CO
NSO
LID
ATED
FIN
AN
CIA
L ST
ATEM
ENTS
NOTES TO THE CONSOLIDATED FINANCIAL STATEMENTS (CONTINUED)For the year ended 31 December 2011
5 SUMMARY OF SIGNIFICANT ACCOUNTING POLICIES (continued)
5.2 Significant accounting policies (continued)
(p) Operating leases
Payments made under operating leases are recognised in the consolidated statement of income on a straight-line basis over the term of the lease.
(q) Off-balance sheet equity of investment account holders
Off-balance sheet equity of investment account holders represent assets acquired using funds provided by holders of restricted investment accounts and managed by the Group as an investment manager based on either a mudaraba contract or agency contract. The restricted investment accounts are exclusively restricted for investment in specified projects as directed by the investment account holders. Assets that are held in such capacity are not included as assets of the Group in the consolidated financial statements.
(r) Employee benefits
(i) Short-term benefits
Short-term employee benefit obligations are measured on an undiscounted basis and are expensed as the related service is provided. A provision is recognised for the amount expected to be paid under short-term cash bonus or profit-sharing plans if the Group has a present legal or constructive obligation to pay this amount as a result of past service provided by the employee and the obligation can be estimated reliably.
(ii) Post employment benefits
Pensions and other social benefits for Bahraini employees are covered by the Social Insurance Organisation for Bahrain (SIO) scheme, which is a “defined contribution scheme” in nature under IAS 19 ‘Employee Benefits’, and to which employees and employers contribute monthly on a fixed-percentage-of-salaries basis. Contributions by the Bank are recognised as an expense in consolidated statement of income when they are due.
Employees are also entitled to leaving indemnities payable based on length of service and final remuneration. Provision for this unfunded commitment, which is a “defined benefit scheme” in nature under IAS 19, has been made by calculating the notional liability had all employees left at the date of the statement of financial position. Any increase or decrease in the benefit obligation is recognised in the consolidated statement of income.
(iii) Share based payment transactions
The Group has established an employee share ownership plan (ESOP) under which employees are entitled to purchase units in the ESOP on a deferred payment basis. Each unit carries the rights to benefits of ownership of one share of the Bank upon completion of a five year service lock-in period. The cost to the Group, representing the fair value of the units offered, is recognised as an expense in the consolidated statement of income over the vesting period, with corresponding increase in the ESOP reserve recognised as a separate component of the consolidated statement of changes in equity. The amount recognised as an expense is adjusted to reflect the number of share awards for which the related service conditions are expected to be met, such that the amount ultimately recognised as an expense is based on the number of share awards that meet the related service conditions at the vesting date.

63
(s) Provisions A provision is recognised if, as a result of a past event, the Group has a present legal or constructive obligation that can
be estimated reliably, and it is probable that an outflow of economic benefits will be required to settle the obligation.
(t) Segment reporting The Group primarily operates as an investment bank and its lines of business comprise venture capital, private
equity and real estate. At present the Group’s revenue is reviewed by lines of business and the expenses and results are reviewed at a Group level and therefore no separate operating segment results and other disclosures are provided in these consolidated financial statements.
(u) Zakah In the absence of appointment of the Bank to pay Zakah on behalf of the shareholders, the responsibility of
payment of Zakah is on individual shareholders of the Group.
(v) Offsetting financial instruments Financial assets and financial liabilities are offset, and the net amount reported in the consolidated statement of
financial position, if and only if there is a legally enforceable or religious right (based on Shari’ah) to set off the recognised amounts and the Group intends to settle on a net basis.
(w) Trade and settlement date accounting All “regular way” purchases and sales of financial assets are recognised on the trade date, i.e. the date that the
Group commits to purchase or sell the asset.
6 INVESTMENT IN SUBSIDIARIESKey subsidiaries of the Group, all of which have 31 December as their year end, are listed below. There is no change in the percentage holding of the subsidiaries during the year and all of them are wholly owned.
Name of subsidiary Year of incorporation
Country of incorporation
Principal activities
Gulf Projects Company W.L.L. 1998 Kingdom of Bahrain To own an interest in and operate the VCBank Building.
MENA SME Fund Manager Limited 2006 Cayman Islands Fund manager to MENA SME Fund 1 LP.
Lime Restaurant Management and Catering Services Co. W.L.L.
2007 Kingdom of Bahrain To own, operate and manage restaurant and catering services companies.
The Lounge Serviced Offices Company W.L.L. 2007 Kingdom of Bahrain To own, operate and manage serviced offices in Bahrain and regionally.
VCBank ESOP S.P.C. 2008 Kingdom of Bahrain To hold employee share ownership plan shares on behalf of the employees of the Bank.
Tatweer Consultancy Co. W.L.L. 2010 Kingdom of Bahrain To provide training and management consultancy services.

64
CO
NSO
LID
ATED
FIN
AN
CIA
L ST
ATEM
ENTS
NOTES TO THE CONSOLIDATED FINANCIAL STATEMENTS (CONTINUED)For the year ended 31 December 2011
7 CLASSIFICATION OF FINANCIAL INSTRUMENTS
The Group’s financial instruments have been classified for the purpose of measurement under International Accounting Standard 39: Financial Instruments: Recognition and Measurement as follows:
At 31 December 2011
Fair value through profit
on lossUSD ‘000
Available-for-sale
USD ‘000
Amortised cost / costUSD ‘000
Total2011
USD ‘000
ASSETS
Balances with banks - - 3,286 3,286
Placements with financial institutions - - 10,652 10,652
Investments 72,175 40,779 - 112,954
Receivable from investment banking services - - 6,550 6,550
Funding to project companies - - 5,839 5,839
Other assets - - 9,673 9,673
TOTAL FINANCIAL ASSETS 72,175 40,779 36,000 148,954
Equity of investment account holders - 3,679 13,167 16,846
At 31 December 2010
Fair value through profit on loss
USD ‘000
Available-for-sale
USD ‘000
Amortised cost / costUSD ‘000
Total2010
USD ‘000
ASSETS
Balances with banks - - 2,672 2,672
Placements with financial institutions - - 11,267 11,267
Investments 86,206 49,190 - 135,396
Receivable from investment banking services - - 13,837 13,837
Funding to project companies - - 20,975 20,975
Other assets - - 11,942 11,942
TOTAL FINANCIAL ASSETS 86,206 49,190 60,693 196,089
Equity of investment account holders - 3,681 12,538 16,219
At 31 December 2011, all the financial liabilities of the Group are classified under ‘amortised cost’. (2010: all liabilities classified at ‘amortised cost’.)
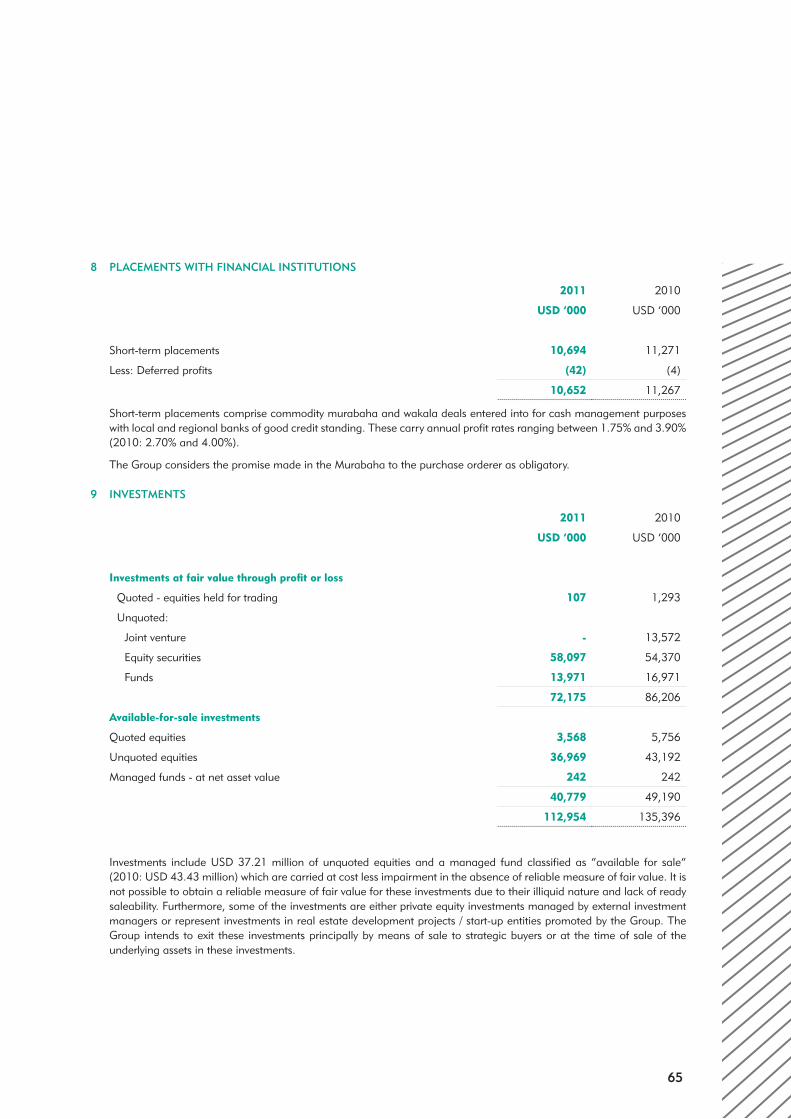
65
8 PLACEMENTS WITH FINANCIAL INSTITUTIONS
2011 2010
USD ‘000 USD ‘000
Short-term placements 10,694 11,271
Less: Deferred profits (42) (4)
10,652 11,267
Short-term placements comprise commodity murabaha and wakala deals entered into for cash management purposes with local and regional banks of good credit standing. These carry annual profit rates ranging between 1.75% and 3.90% (2010: 2.70% and 4.00%).
The Group considers the promise made in the Murabaha to the purchase orderer as obligatory.
9 INVESTMENTS
2011 2010
USD ‘000 USD ‘000
Investments at fair value through profit or loss
Quoted - equities held for trading 107 1,293
Unquoted:
Joint venture - 13,572
Equity securities 58,097 54,370
Funds 13,971 16,971
72,175 86,206
Available-for-sale investments
Quoted equities 3,568 5,756
Unquoted equities 36,969 43,192
Managed funds - at net asset value 242 242
40,779 49,190
112,954 135,396
Investments include USD 37.21 million of unquoted equities and a managed fund classified as “available for sale” (2010: USD 43.43 million) which are carried at cost less impairment in the absence of reliable measure of fair value. It is not possible to obtain a reliable measure of fair value for these investments due to their illiquid nature and lack of ready saleability. Furthermore, some of the investments are either private equity investments managed by external investment managers or represent investments in real estate development projects / start-up entities promoted by the Group. The Group intends to exit these investments principally by means of sale to strategic buyers or at the time of sale of the underlying assets in these investments.
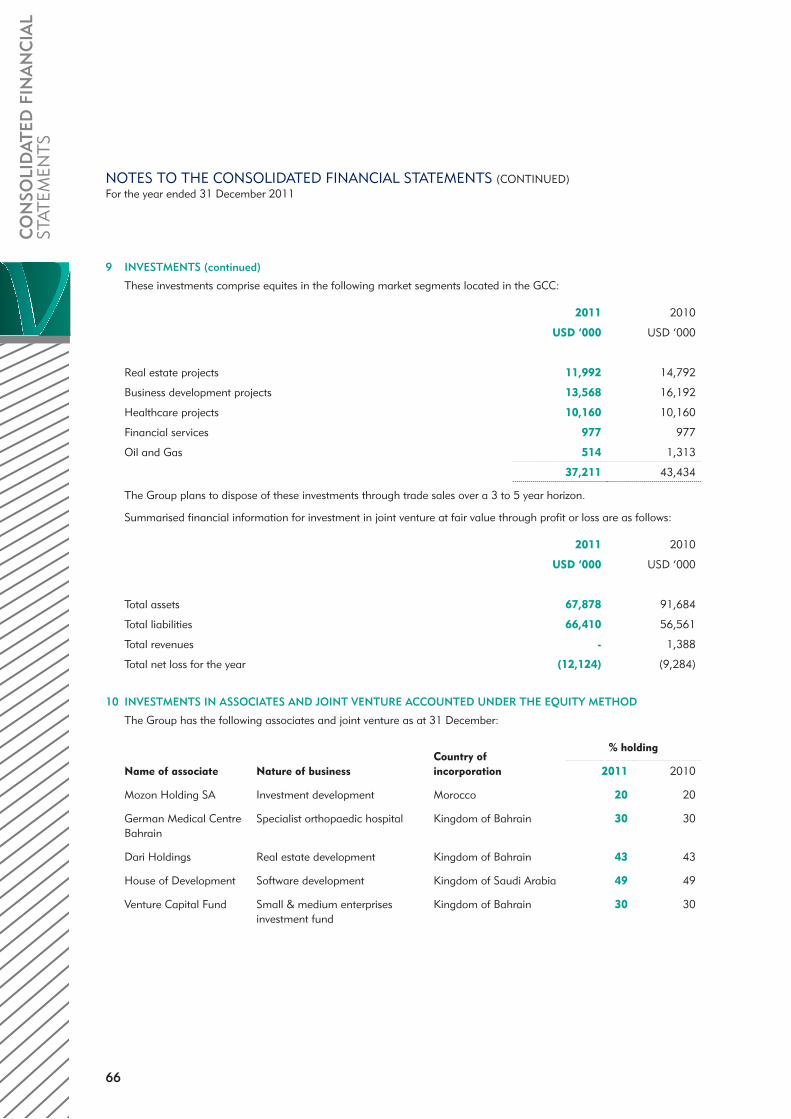
66
CO
NSO
LID
ATED
FIN
AN
CIA
L ST
ATEM
ENTS
NOTES TO THE CONSOLIDATED FINANCIAL STATEMENTS (CONTINUED)For the year ended 31 December 2011
9 INVESTMENTS (continued)
These investments comprise equites in the following market segments located in the GCC:
2011 2010
USD ‘000 USD ‘000
Real estate projects 11,992 14,792
Business development projects 13,568 16,192
Healthcare projects 10,160 10,160
Financial services 977 977
Oil and Gas 514 1,313
37,211 43,434
The Group plans to dispose of these investments through trade sales over a 3 to 5 year horizon.
Summarised financial information for investment in joint venture at fair value through profit or loss are as follows:
2011 2010
USD ‘000 USD ‘000
Total assets 67,878 91,684
Total liabilities 66,410 56,561
Total revenues - 1,388
Total net loss for the year (12,124) (9,284)
10 INVESTMENTS IN ASSOCIATES AND JOINT VENTURE ACCOUNTED UNDER THE EQUITY METHOD
The Group has the following associates and joint venture as at 31 December:
Name of associate Nature of businessCountry ofincorporation
% holding
2011 2010
Mozon Holding SA Investment development Morocco 20 20
German Medical Centre Bahrain
Specialist orthopaedic hospital Kingdom of Bahrain 30 30
Dari Holdings Real estate development Kingdom of Bahrain 43 43
House of Development Software development Kingdom of Saudi Arabia 49 49
Venture Capital Fund Small & medium enterprises investment fund
Kingdom of Bahrain 30 30
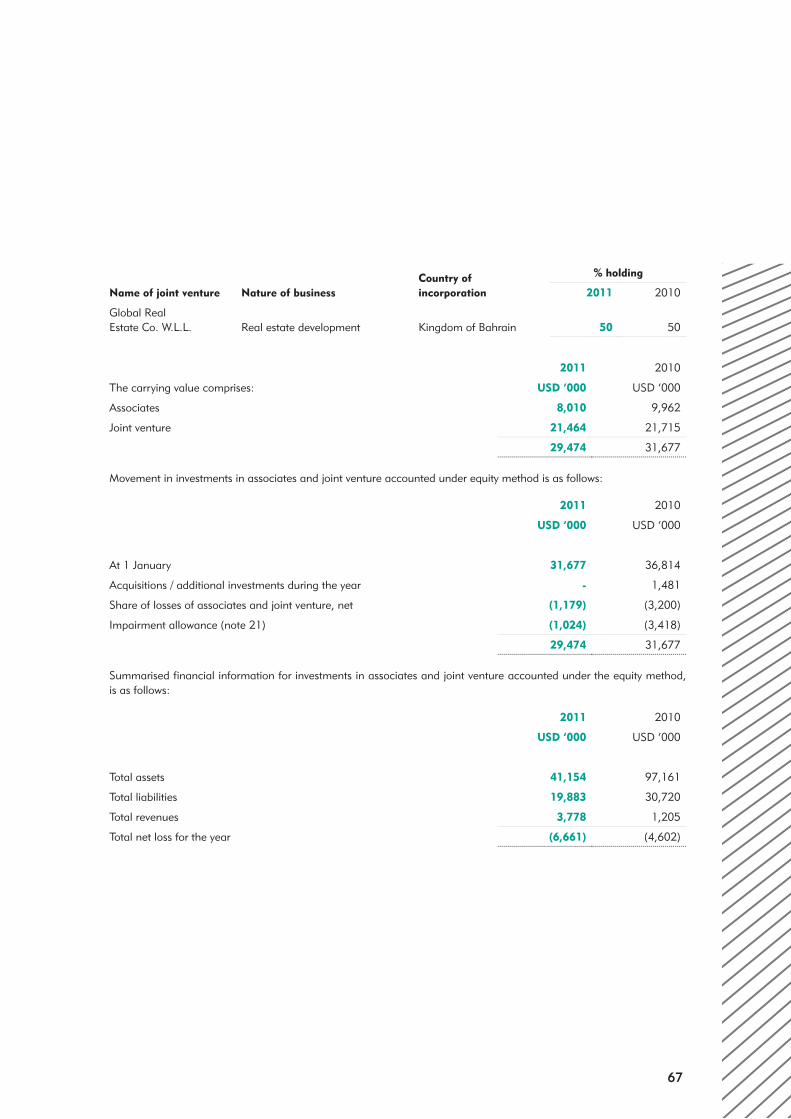
67
Name of joint venture Nature of businessCountry ofincorporation
% holding
2011 2010
Global Real Estate Co. W.L.L. Real estate development Kingdom of Bahrain 50 50
2011 2010
The carrying value comprises: USD ‘000 USD ‘000
Associates 8,010 9,962
Joint venture 21,464 21,715
29,474 31,677
Movement in investments in associates and joint venture accounted under equity method is as follows:
2011 2010
USD ‘000 USD ‘000
At 1 January 31,677 36,814
Acquisitions / additional investments during the year - 1,481
Share of losses of associates and joint venture, net (1,179) (3,200)
Impairment allowance (note 21) (1,024) (3,418)
29,474 31,677
Summarised financial information for investments in associates and joint venture accounted under the equity method, is as follows:
2011 2010
USD ‘000 USD ‘000
Total assets 41,154 97,161
Total liabilities 19,883 30,720
Total revenues 3,778 1,205
Total net loss for the year (6,661) (4,602)

68
CO
NSO
LID
ATED
FIN
AN
CIA
L ST
ATEM
ENTS
NOTES TO THE CONSOLIDATED FINANCIAL STATEMENTS (CONTINUED)For the year ended 31 December 2011
11 INVESTMENT PROPERTY
This relates to land located in the Kingdom of Bahrain. The land is carried at cost. The fair value of the land as at 31 December 2011 is approximately USD 17.34 million (31 December 2010: USD 17.95 million). The fair value was determined based on a valuation by an independent external valuer.
12 RECEIVABLE FROM INVESTMENT BANKING SERVICES
2011 2010
USD ‘000 USD ‘000
Gross receivables 16,759 18,666
Less: impairment allowance (10,209) (4,829)
6,550 13,837
Movement in impairment allowance for receivables from investment banking services is as follows:
2011 2010
USD ‘000 USD ‘000
At 1 January 4,829 1,080
Charge for the year (note 21) 5,380 3,749
At 31 December 10,209 4,829
13 FUNDING TO PROJECT COMPANIES
2011 2010
USD ‘000 USD ‘000
Gross funding 38,406 31,462
Less: impairment allowances (32,567) (10,487)
5,839 20,975
These receivables include funding provided to projects and investments promoted by the Group. The financing facilities are generally free of profit and do not have specific terms of repayment, but are expected to be recovered in full in the course of project development and on realisation of cash flows from sale of the underlying assets and their operations.
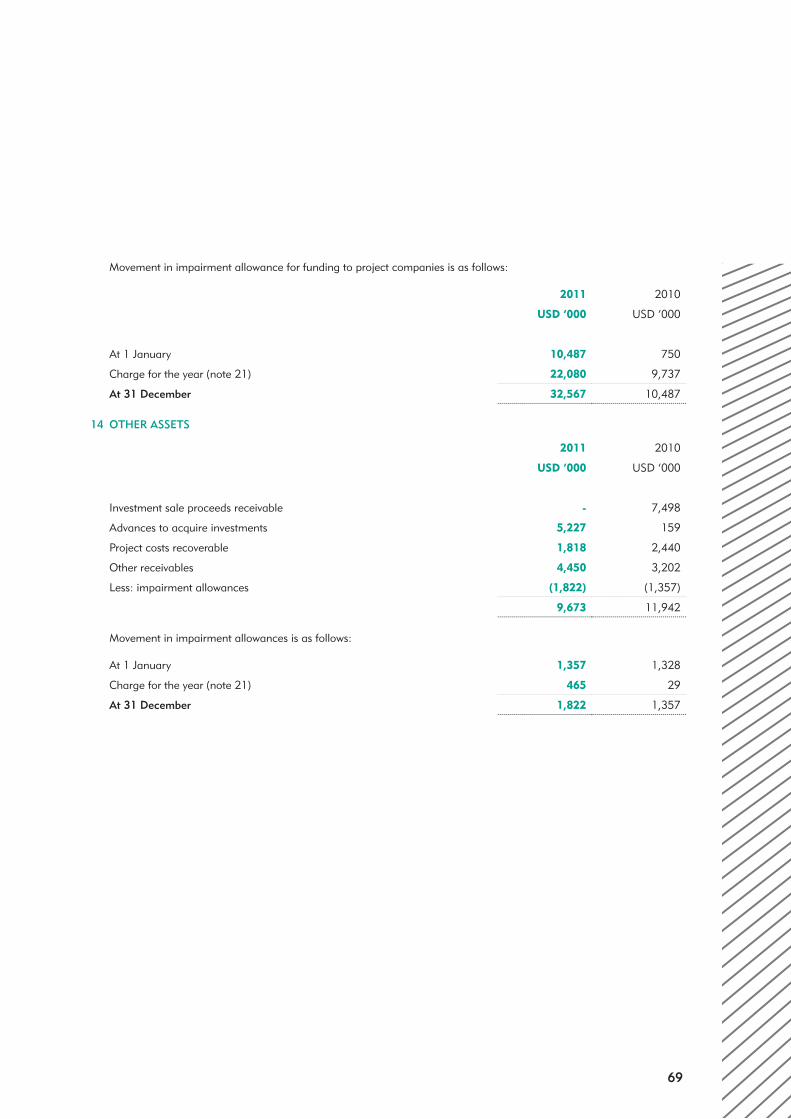
69
Movement in impairment allowance for funding to project companies is as follows:
2011 2010
USD ‘000 USD ‘000
At 1 January 10,487 750
Charge for the year (note 21) 22,080 9,737
At 31 December 32,567 10,487
14 OTHER ASSETS
2011 2010
USD ‘000 USD ‘000
Investment sale proceeds receivable - 7,498
Advances to acquire investments 5,227 159
Project costs recoverable 1,818 2,440
Other receivables 4,450 3,202
Less: impairment allowances (1,822) (1,357)
9,673 11,942
Movement in impairment allowances is as follows:
At 1 January 1,357 1,328
Charge for the year (note 21) 465 29
At 31 December 1,822 1,357
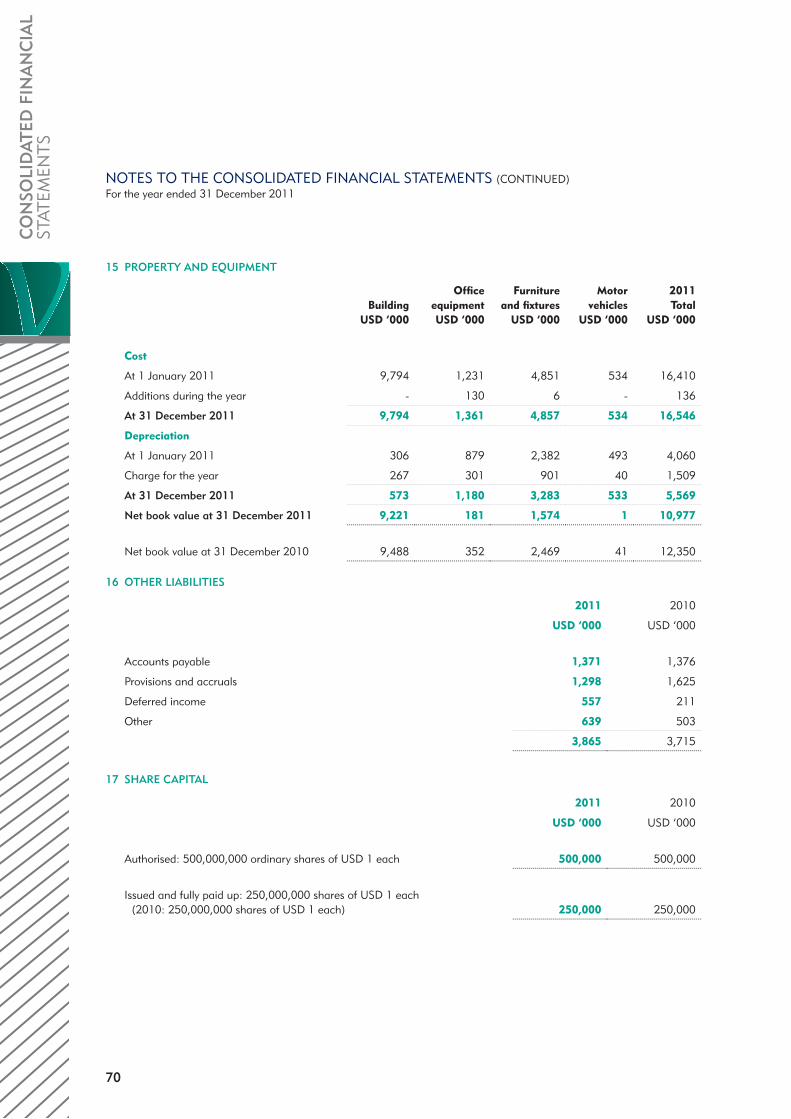
70
CO
NSO
LID
ATED
FIN
AN
CIA
L ST
ATEM
ENTS
NOTES TO THE CONSOLIDATED FINANCIAL STATEMENTS (CONTINUED)For the year ended 31 December 2011
15 PROPERTY AND EQUIPMENT
BuildingUSD ‘000
Office equipmentUSD ‘000
Furniture and fixtures
USD ‘000
Motor vehicles
USD ‘000
2011Total
USD ‘000
Cost
At 1 January 2011 9,794 1,231 4,851 534 16,410
Additions during the year - 130 6 - 136
At 31 December 2011 9,794 1,361 4,857 534 16,546
Depreciation
At 1 January 2011 306 879 2,382 493 4,060
Charge for the year 267 301 901 40 1,509
At 31 December 2011 573 1,180 3,283 533 5,569
Net book value at 31 December 2011 9,221 181 1,574 1 10,977
Net book value at 31 December 2010 9,488 352 2,469 41 12,350
16 OTHER LIABILITIES
2011 2010
USD ‘000 USD ‘000
Accounts payable 1,371 1,376
Provisions and accruals 1,298 1,625
Deferred income 557 211
Other 639 503
3,865 3,715
17 SHARE CAPITAL
2011 2010
USD ‘000 USD ‘000
Authorised: 500,000,000 ordinary shares of USD 1 each 500,000 500,000
Issued and fully paid up: 250,000,000 shares of USD 1 each (2010: 250,000,000 shares of USD 1 each) 250,000 250,000
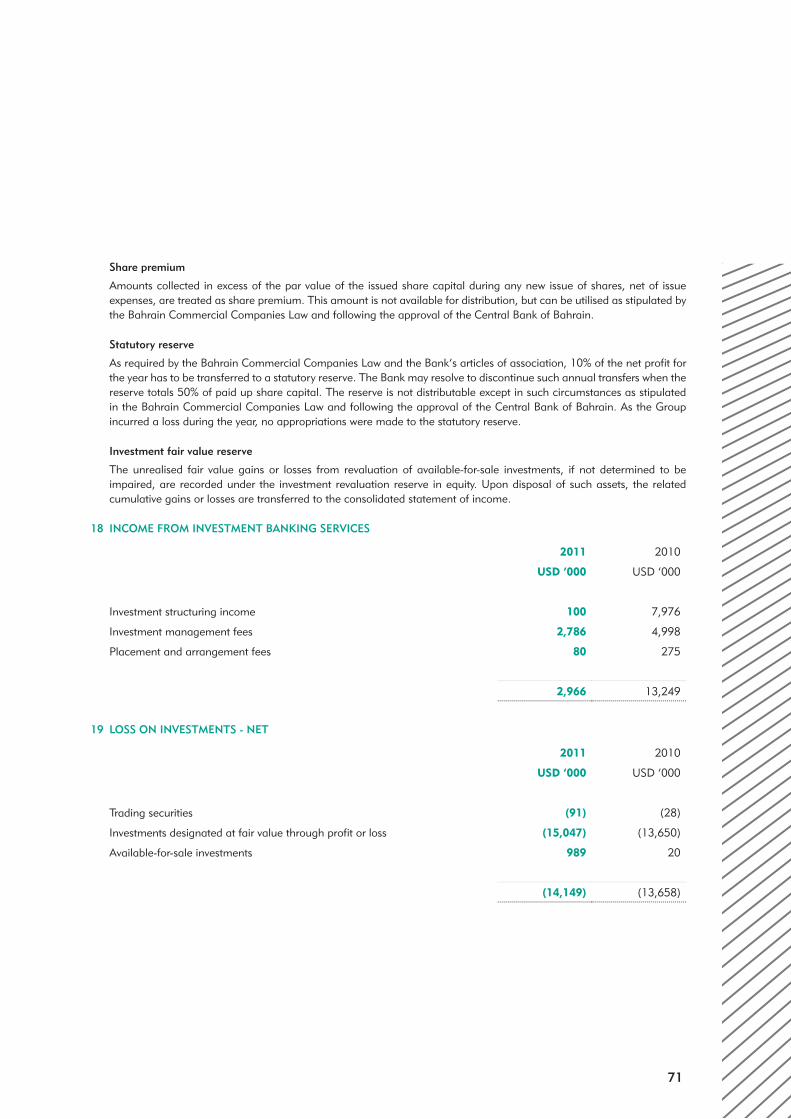
71
Share premium
Amounts collected in excess of the par value of the issued share capital during any new issue of shares, net of issue expenses, are treated as share premium. This amount is not available for distribution, but can be utilised as stipulated by the Bahrain Commercial Companies Law and following the approval of the Central Bank of Bahrain.
Statutory reserve
As required by the Bahrain Commercial Companies Law and the Bank’s articles of association, 10% of the net profit for the year has to be transferred to a statutory reserve. The Bank may resolve to discontinue such annual transfers when the reserve totals 50% of paid up share capital. The reserve is not distributable except in such circumstances as stipulated in the Bahrain Commercial Companies Law and following the approval of the Central Bank of Bahrain. As the Group incurred a loss during the year, no appropriations were made to the statutory reserve.
Investment fair value reserve
The unrealised fair value gains or losses from revaluation of available-for-sale investments, if not determined to be impaired, are recorded under the investment revaluation reserve in equity. Upon disposal of such assets, the related cumulative gains or losses are transferred to the consolidated statement of income.
18 INCOME FROM INVESTMENT BANKING SERVICES
2011 2010
USD ‘000 USD ‘000
Investment structuring income 100 7,976
Investment management fees 2,786 4,998
Placement and arrangement fees 80 275
2,966 13,249
19 LOSS ON INVESTMENTS - NET
2011 2010
USD ‘000 USD ‘000
Trading securities (91) (28)
Investments designated at fair value through profit or loss (15,047) (13,650)
Available-for-sale investments 989 20
(14,149) (13,658)

72
CO
NSO
LID
ATED
FIN
AN
CIA
L ST
ATEM
ENTS
NOTES TO THE CONSOLIDATED FINANCIAL STATEMENTS (CONTINUED)For the year ended 31 December 2011
19 LOSS ON INVESTMENTS - NET (continued)
Details of gains (losses) by type of investments are as follows:
2011Trading
USD ‘000
Designated at fair value
USD ‘000
Available- for-sale
USD ‘000Total
USD ‘000
Fair value gains - 7,589 - 7,589
Fair value losses (131) (22,872) - (23,003)
Profit on sale 21 - 867 888
Dividends 19 236 122 377
(91) (15,047) 989 (14,149)
2010Trading
USD ‘000
Designatedat fairvalue
USD ‘000
Available-for-sale
USD ‘000Total
USD ‘000
Fair value gains - - - -
Fair value losses (58) (15,100) - (15,158)
Profit on sale - - - -
Dividends 30 1,450 20 1,500
(28) (13,650) 20 (13,658)
20 STAFF COSTS
2011 2010
USD ‘000 USD ‘000
Salaries and benefits 6,756 8,919
Social insurance expenses 760 964
Severance costs 900 -
Other staff expenses 6 7
8,422 9,890

73
21 IMPAIRMENT ALLOWANCES
2011 2010
USD ‘000 USD ‘000
Available for sale investments 6,223 14,066
Investment in associates and joint venture (note 10) 1,024 3,418
Receivable from investment banking services (note 12) 5,380 3,749
Funding to project companies (note 13) 22,080 9,737
Other assets (note 14) 465 29
35,172 30,999
22 OTHER EXPENSES
2011 2010
USD ‘000 USD ‘000
Rent and office expenses 1,698 1,691
Publicity, conferences and promotion 226 192
Board and Shari’ah expenses 347 408
Other 52 24
2,323 2,315
23 FINANCE INCOME AND EXPENSE
2011 2010
USD ‘000 USD ‘000
Finance income
Income from placements with financial institutions 429 787
Funding to project companies 145 76
574 863
Finance expense
Murabaha expense (75) (254)
Net finance income 499 609
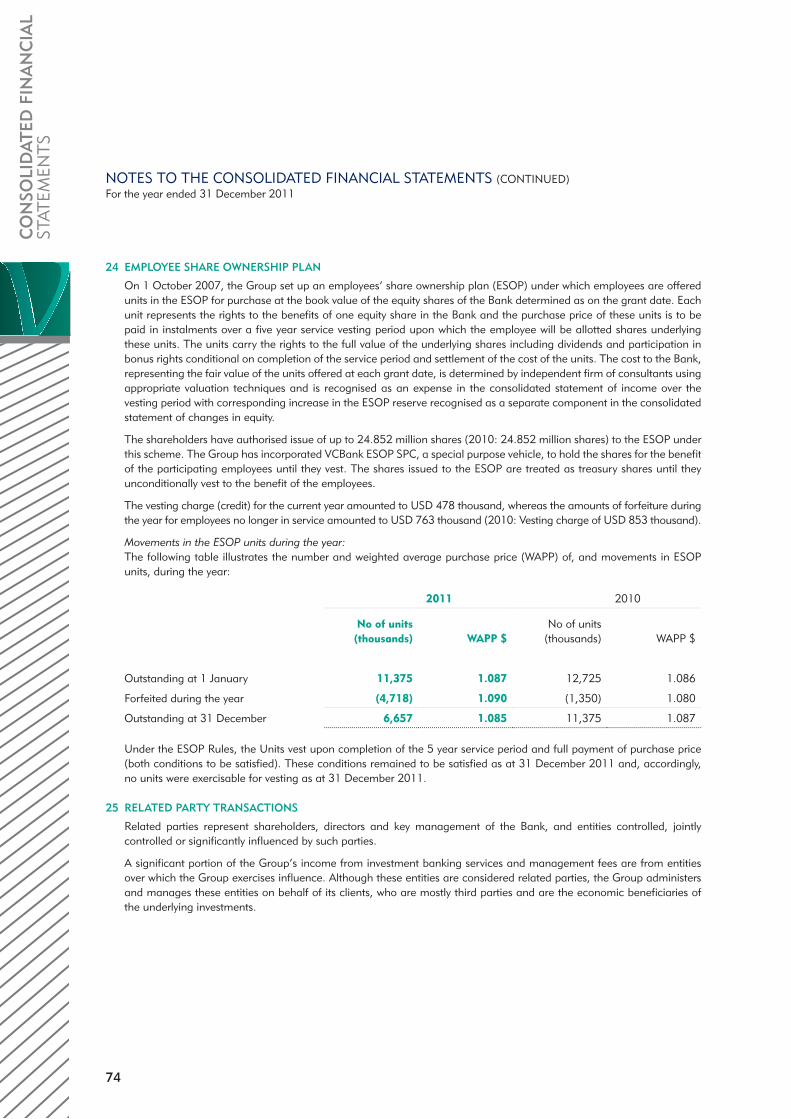
74
CO
NSO
LID
ATED
FIN
AN
CIA
L ST
ATEM
ENTS
NOTES TO THE CONSOLIDATED FINANCIAL STATEMENTS (CONTINUED)For the year ended 31 December 2011
24 EMPLOYEE SHARE OWNERSHIP PLAN
On 1 October 2007, the Group set up an employees’ share ownership plan (ESOP) under which employees are offered units in the ESOP for purchase at the book value of the equity shares of the Bank determined as on the grant date. Each unit represents the rights to the benefits of one equity share in the Bank and the purchase price of these units is to be paid in instalments over a five year service vesting period upon which the employee will be allotted shares underlying these units. The units carry the rights to the full value of the underlying shares including dividends and participation in bonus rights conditional on completion of the service period and settlement of the cost of the units. The cost to the Bank, representing the fair value of the units offered at each grant date, is determined by independent firm of consultants using appropriate valuation techniques and is recognised as an expense in the consolidated statement of income over the vesting period with corresponding increase in the ESOP reserve recognised as a separate component in the consolidated statement of changes in equity.
The shareholders have authorised issue of up to 24.852 million shares (2010: 24.852 million shares) to the ESOP under this scheme. The Group has incorporated VCBank ESOP SPC, a special purpose vehicle, to hold the shares for the benefit of the participating employees until they vest. The shares issued to the ESOP are treated as treasury shares until they unconditionally vest to the benefit of the employees.
The vesting charge (credit) for the current year amounted to USD 478 thousand, whereas the amounts of forfeiture during the year for employees no longer in service amounted to USD 763 thousand (2010: Vesting charge of USD 853 thousand).
Movements in the ESOP units during the year:The following table illustrates the number and weighted average purchase price (WAPP) of, and movements in ESOP units, during the year:
2011 2010
No of units(thousands) WAPP $
No of units(thousands) WAPP $
Outstanding at 1 January 11,375 1.087 12,725 1.086
Forfeited during the year (4,718) 1.090 (1,350) 1.080
Outstanding at 31 December 6,657 1.085 11,375 1.087
Under the ESOP Rules, the Units vest upon completion of the 5 year service period and full payment of purchase price (both conditions to be satisfied). These conditions remained to be satisfied as at 31 December 2011 and, accordingly, no units were exercisable for vesting as at 31 December 2011.
25 RELATED PARTY TRANSACTIONS
Related parties represent shareholders, directors and key management of the Bank, and entities controlled, jointly controlled or significantly influenced by such parties.
A significant portion of the Group’s income from investment banking services and management fees are from entities over which the Group exercises influence. Although these entities are considered related parties, the Group administers and manages these entities on behalf of its clients, who are mostly third parties and are the economic beneficiaries of the underlying investments.
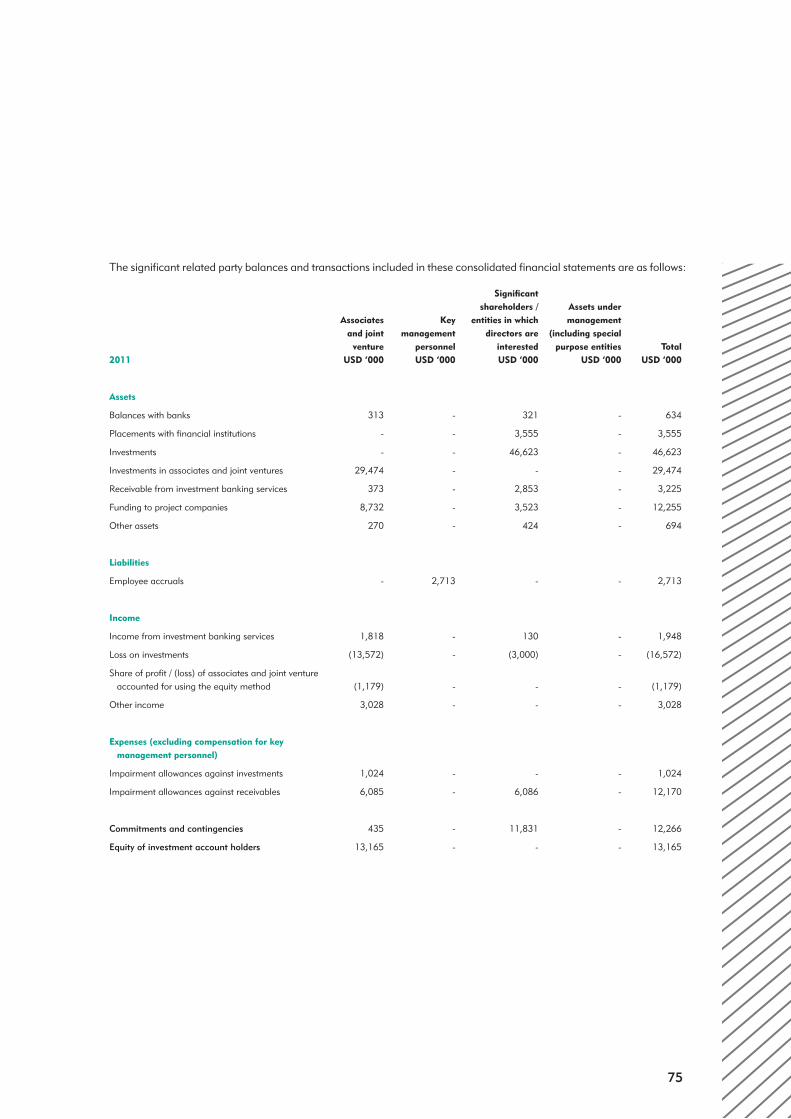
75
The significant related party balances and transactions included in these consolidated financial statements are as follows:
2011
Associates and joint
ventureUSD ‘000
Key management
personnelUSD ‘000
Significant shareholders /
entities in which directors are
interestedUSD ‘000
Assets under management
(including special purpose entities
USD ‘000Total
USD ‘000
Assets
Balances with banks 313 - 321 - 634
Placements with financial institutions - - 3,555 - 3,555
Investments - - 46,623 - 46,623
Investments in associates and joint ventures 29,474 - - - 29,474
Receivable from investment banking services 373 - 2,853 - 3,225
Funding to project companies 8,732 - 3,523 - 12,255
Other assets 270 - 424 - 694
Liabilities
Employee accruals - 2,713 - - 2,713
Income
Income from investment banking services 1,818 - 130 - 1,948
Loss on investments (13,572) - (3,000) - (16,572)
Share of profit / (loss) of associates and joint venture accounted for using the equity method (1,179) - - - (1,179)
Other income 3,028 - - - 3,028
Expenses (excluding compensation for key management personnel)
Impairment allowances against investments 1,024 - - - 1,024
Impairment allowances against receivables 6,085 - 6,086 - 12,170
Commitments and contingencies 435 - 11,831 - 12,266
Equity of investment account holders 13,165 - - - 13,165
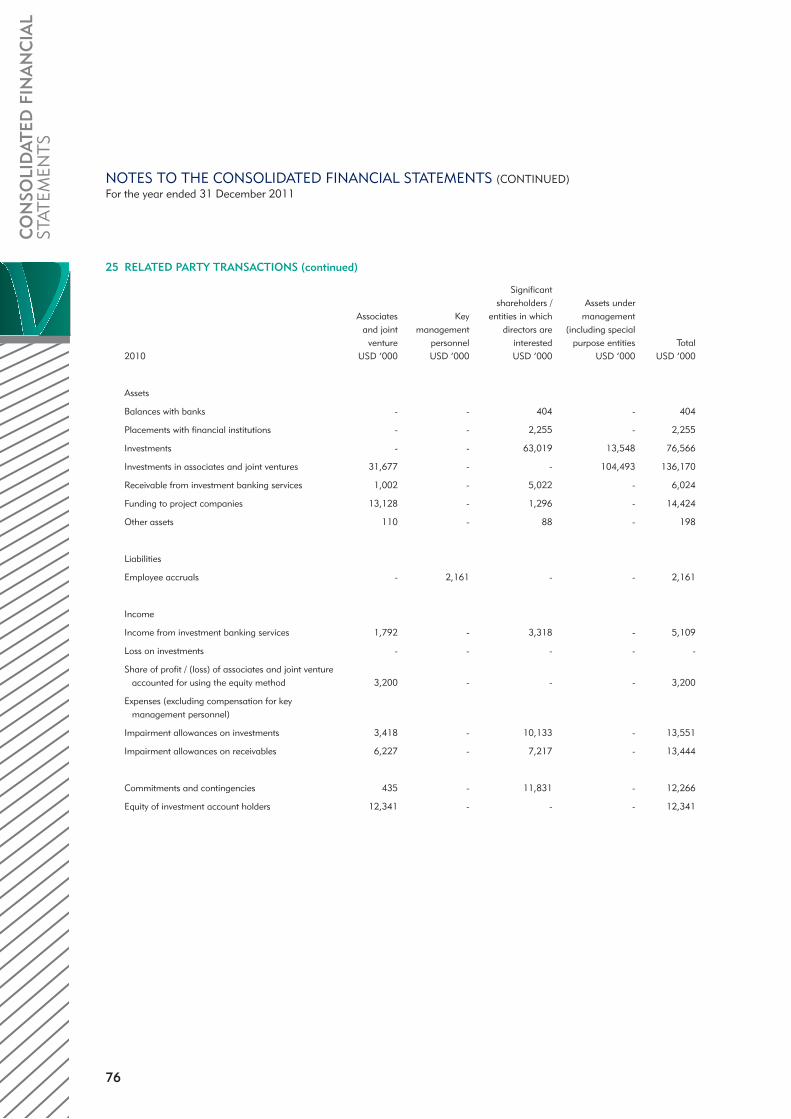
76
CO
NSO
LID
ATED
FIN
AN
CIA
L ST
ATEM
ENTS
NOTES TO THE CONSOLIDATED FINANCIAL STATEMENTS (CONTINUED)For the year ended 31 December 2011
25 RELATED PARTY TRANSACTIONS (continued)
2010
Associates and joint
ventureUSD ‘000
Key management
personnelUSD ‘000
Significant shareholders /
entities in which directors are
interestedUSD ‘000
Assets under management
(including special purpose entities
USD ‘000Total
USD ‘000
Assets
Balances with banks - - 404 - 404
Placements with financial institutions - - 2,255 - 2,255
Investments - - 63,019 13,548 76,566
Investments in associates and joint ventures 31,677 - - 104,493 136,170
Receivable from investment banking services 1,002 - 5,022 - 6,024
Funding to project companies 13,128 - 1,296 - 14,424
Other assets 110 - 88 - 198
Liabilities
Employee accruals - 2,161 - - 2,161
Income
Income from investment banking services 1,792 - 3,318 - 5,109
Loss on investments - - - - -
Share of profit / (loss) of associates and joint venture accounted for using the equity method 3,200 - - - 3,200
Expenses (excluding compensation for key management personnel)
Impairment allowances on investments 3,418 - 10,133 - 13,551
Impairment allowances on receivables 6,227 - 7,217 - 13,444
Commitments and contingencies 435 - 11,831 - 12,266
Equity of investment account holders 12,341 - - - 12,341
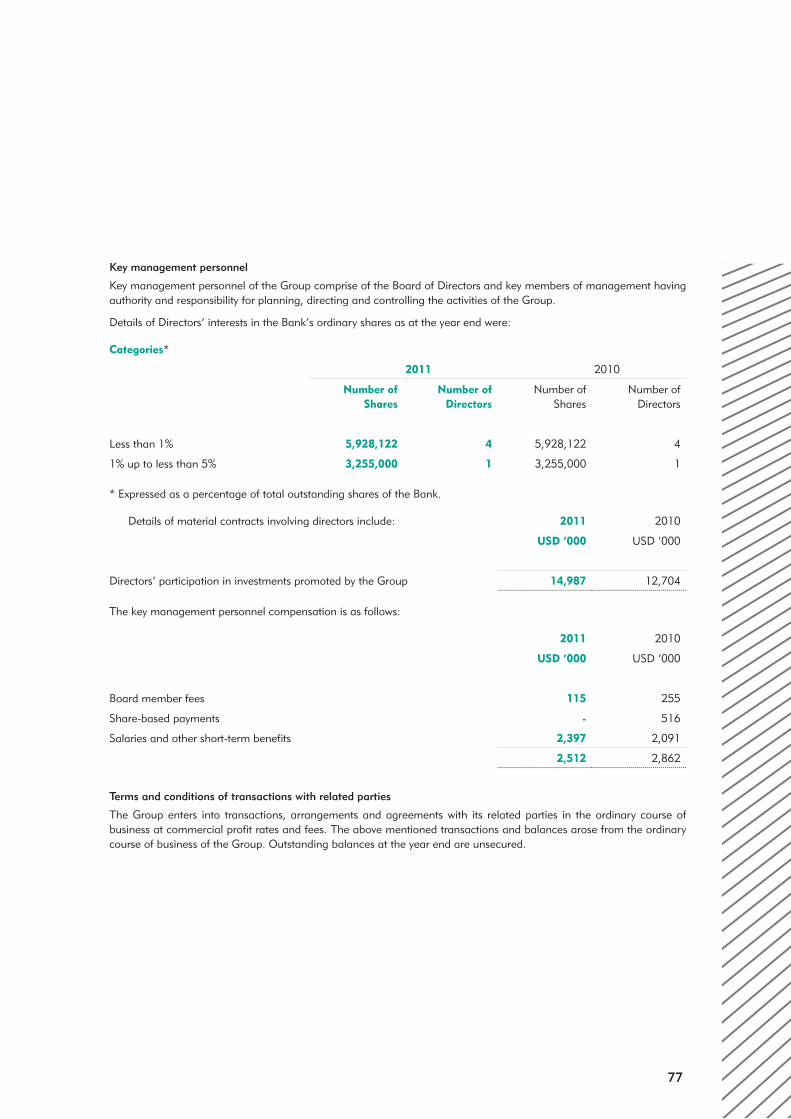
77
Key management personnel
Key management personnel of the Group comprise of the Board of Directors and key members of management having authority and responsibility for planning, directing and controlling the activities of the Group.
Details of Directors’ interests in the Bank’s ordinary shares as at the year end were:
Categories*
2011 2010
Number ofShares
Number ofDirectors
Number of Shares
Number ofDirectors
Less than 1% 5,928,122 4 5,928,122 4
1% up to less than 5% 3,255,000 1 3,255,000 1
* Expressed as a percentage of total outstanding shares of the Bank.
Details of material contracts involving directors include: 2011 2010
USD ‘000 USD ‘000
Directors’ participation in investments promoted by the Group 14,987 12,704
The key management personnel compensation is as follows:
2011 2010
USD ‘000 USD ‘000
Board member fees 115 255
Share-based payments - 516
Salaries and other short-term benefits 2,397 2,091
2,512 2,862
Terms and conditions of transactions with related parties
The Group enters into transactions, arrangements and agreements with its related parties in the ordinary course of business at commercial profit rates and fees. The above mentioned transactions and balances arose from the ordinary course of business of the Group. Outstanding balances at the year end are unsecured.

78
CO
NSO
LID
ATED
FIN
AN
CIA
L ST
ATEM
ENTS
NOTES TO THE CONSOLIDATED FINANCIAL STATEMENTS (CONTINUED)For the year ended 31 December 2011
26 ZAKAH
In accordance with the Articles of Association, the Bank is not required to collect or pay Zakah on behalf of the shareholders or of its off-balance sheet equity accounts holders. However, the Bank is required to calculate and notify individual shareholders of their pro-rata share of Zakah on each share held in the Bank. Zakah payable by the shareholders is computed by the Bank based on the method prescribed by the Bank’s Shari’ah Supervisory Board. Zakah payable by the shareholders in respect of each share for the year ended 31 December 2011 is US cents 0.0828 for every share held (31 December 2010: US cents 0.4843 for every share held). Investors should be aware that the ultimate responsibility of calculating and paying the Zakah due on them is their sole responsibility.
27 EARNINGS PROHIBITED BY SHARI’AH
The Group is committed to avoid recognising any income generated from non-Islamic sources. Accordingly, all non-Islamic income is credited to a charity account where the Group uses these funds for charitable means. There were no earnings from non-Islamic sources during the year (2010: nil).
28 SHARI’AH SUPERVISORY BOARD
The Group’s Shari’ah Supervisory Board consists of three Islamic scholars who review the Group’s compliance with general Shari’ah principles and specific fatwas, rulings and guidelines issued. Their review includes examination of evidence relating to the documentation and procedures adopted by the Group to ensure that its activities are conducted in accordance with Islamic Shari’ah principles.
29 SOCIAL RESPONSIBILITY
The Group discharges its social responsibilities through donations to charitable causes and organisations.
30 PROPOSED APPROPRIATIONS
The Board of Directors of the Bank propose the following appropriations, subject to the approval of the shareholders at the Annual General Meeting:
2011 2010
USD ‘000 USD ‘000
Zakah - 79

79
31 MATURITY PROFILE
The table below shows the maturity profile of the Group’s assets and liabilities and unrecognised commitments on the basis of their expected maturities. The amount of cash flows on these instruments may vary significantly from this analysis. For contractual maturity of financial liabilities refer note 35 (c).
2011
No fixedmaturity
USD ‘000
Up to 3months
USD ‘000
3 to 6months
USD ‘000
6 monthsto 1 year
USD ‘000
Totalup to
1 yearUSD ‘000
1 to 3years
USD ‘000
Over 3years
USD ‘000Total
USD ‘000
Assets
Balances with banks - 3,286 - - 3,286 - - 3,286
Placements with financial institutions - 10,652 - - 10,652 - - 10,652
Investments 112,954 - - - - - - 112,954
Investments in associates and joint venture 29,474 - - - - - - 29,474
Investment property 9,130 - - - - - - 9,130
Receivable from investment banking services - 33 763 1,981 2,777 2,238 1,535 6,550
Funding to project companies - - 283 4,112 4,395 - 1,444 5,839
Other assets - 4,531 4,242 675 9,448 137 88 9,673
Property and equipment 10,977 - - - - - - 10,977
Total assets 162,535 18,502 5,288 6,768 30,558 2,375 3,067 198,535
Liabilities
Islamic financing payables - 8,631 - - 8,631 - - 8,631
Employee accruals - 900 - - 900 - 5,423 6,323
Other liabilities 19 598 811 1,199 2,608 1,134 104 3,865
Total liabilities 19 10,129 811 1,199 12,139 1,134 5,527 18,819
Net liquidity gap 162,516 8,373 4,477 5,569 18,419 1,241 (2,460) 198,135
Cumulative liquidity gap 162,516 170,889 175,366 180,935 199,354 200,595 198,135 -

80
CO
NSO
LID
ATED
FIN
AN
CIA
L ST
ATEM
ENTS
NOTES TO THE CONSOLIDATED FINANCIAL STATEMENTS (CONTINUED)For the year ended 31 December 2011
31 MATURITY PROFILE (continued)
2010
No fixedmaturity
USD ‘000
Up to 3months
USD ‘000
3 to 6months
USD ‘000
6 monthsto 1 year
USD ‘000
Totalup to
1 yearUSD ‘000
1 to 3years
USD ‘000
Over 3years
USD ‘000Total
USD ‘000
Assets
Balances with banks - 2,672 - - 2,672 - - 2,672
Placements with financial institutions - 11,267 - - 11,267 - - 11,267
Investments 135,396 - - - - - - 135,396
Investments in associates and joint venture 31,677 - - - - - - 31,677
Investment property 9,130 - - - - - - 9,130
Receivable from investment banking services - 4,792 450 1,021 6,263 4,774 2,800 13,837
Funding to project companies - 3,868 4,911 1,000 9,779 11,196 - 20,975
Other assets - 10,810 306 84 11,200 742 - 11,942
Property and equipment 12,350 - - - - - - 12,350
Total assets 188,553 33,409 5,667 2,105 41,181 16,712 2,800 249,246
Liabilities
Islamic financing payables - - 44 - 44 - - 44
Employee accruals - - - - - 2,096 3,689 5,785
Other liabilities - 3,715 - - 3,715 - - 3,715
Total liabilities - 3,715 44 - 3,759 2,096 3,689 9,544
Net liquidity gap 188,553 29,694 5,623 2,105 37,422 14,616 (889) 277,124
Cumulative liquidity gap 188,553 218,247 223,870 225,975 263,397 278,013 277,124 -

81
32 CONCENTRATION OF ASSETS, LIABILITIES, COMMITMENTS AND EQUITY OF INVESTMENT ACCOUNT HOLDERS
a) Industry sector
2011
Trading andManufacturing
USD ‘000
Banks andfinancial
InstitutionsUSD ‘000
Real estate
USD ‘000
Oil and Gas
USD ‘000
Health care
USD ‘000Technology
USD ‘000Shipping
USD ‘000Other
USD ‘000Total
USD ‘000
Assets
Balances with banks - 3,286 - - - - - - 3,286
Placements with financial institutions - 10,652 - - - - - - 10,652
Investments 35,370 22,265 12,091 6,200 10,160 - 11,728 15,140 112,954
Investment in associates and joint ventures accounted under the
equity method - 4,319 21,723 - 1,673 - - 1,759 29,474
Investment property - - 9,130 - - - - - 9,130
Receivable from investment banking services 450 1,350 1,536 - 304 - 1,702 1,208 6,550
Funding to project companies 1,120 283 1,443 - 2,993 - - - 5,839
Other assets 319 2,750 96 104 136 13 5,228 1,027 9,673
Property and equipment - - 9,188 - - - - 1,789 10,977
Total assets 37,259 44,905 55,207 6,304 15,266 13 18,658 20,923 198,535
Liabilities
Financing payables - 8,631 - - - - - - 8,631
Employee accruals - - - - - - - 6,323 6,323
Other liabilities 141 23 - - - - - 3,701 3,865
Total liabilities 141 8,654 - - - - - 10,024 18,819
Commitments and contingencies 10,513 37,260 15,321 - - - - - 63,094
Equity of investment account holders - 3,097 13,165 - - - - 584 16,846
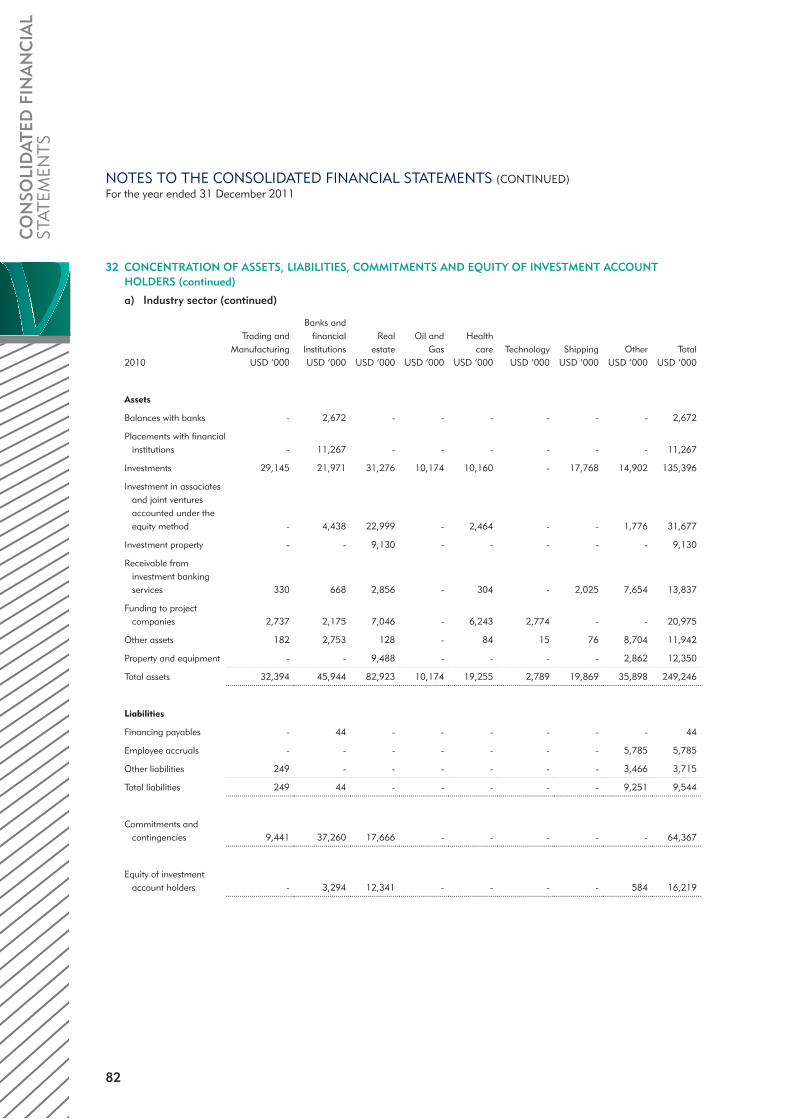
82
CO
NSO
LID
ATED
FIN
AN
CIA
L ST
ATEM
ENTS
NOTES TO THE CONSOLIDATED FINANCIAL STATEMENTS (CONTINUED)For the year ended 31 December 2011
32 CONCENTRATION OF ASSETS, LIABILITIES, COMMITMENTS AND EQUITY OF INVESTMENT ACCOUNT HOLDERS (continued)
a) Industry sector (continued)
2010
Trading andManufacturing
USD ‘000
Banks andfinancial
InstitutionsUSD ‘000
Real estate
USD ‘000
Oil and Gas
USD ‘000
Health care
USD ‘000TechnologyUSD ‘000
ShippingUSD ‘000
OtherUSD ‘000
TotalUSD ‘000
Assets
Balances with banks - 2,672 - - - - - - 2,672
Placements with financial institutions - 11,267 - - - - - - 11,267
Investments 29,145 21,971 31,276 10,174 10,160 - 17,768 14,902 135,396
Investment in associates and joint ventures accounted under the equity method - 4,438 22,999 - 2,464 - - 1,776 31,677
Investment property - - 9,130 - - - - - 9,130
Receivable from investment banking services 330 668 2,856 - 304 - 2,025 7,654 13,837
Funding to project companies 2,737 2,175 7,046 - 6,243 2,774 - - 20,975
Other assets 182 2,753 128 - 84 15 76 8,704 11,942
Property and equipment - - 9,488 - - - - 2,862 12,350
Total assets 32,394 45,944 82,923 10,174 19,255 2,789 19,869 35,898 249,246
Liabilities
Financing payables - 44 - - - - - - 44
Employee accruals - - - - - - - 5,785 5,785
Other liabilities 249 - - - - - - 3,466 3,715
Total liabilities 249 44 - - - - - 9,251 9,544
Commitments and contingencies 9,441 37,260 17,666 - - - - - 64,367
Equity of investment account holders - 3,294 12,341 - - - - 584 16,219

83
(b) Geographic region
The following table shows the assets and liabilities of the Group, classified into geographical regions based on the domicile of the entity for the year ended 31 December:
2011
GCCcountriesUSD ‘000
OtherMENA
countriesUSD ‘000
EuropeUSD ‘000
Cayman / AmericasUSD ‘000
TotalUSD ‘000
Assets
Balances with banks 3,286 - - - 3,286
Placement with financial institutions 10,652 - - - 10,652
Investments 62,417 24,838 11,728 13,971 112,954
Investment in associates and joint venture accounted under the equity method 27,716 1,758 - - 29,474
Investment property 9,130 - - - 9,130
Receivable from investment banking services 3,171 450 1,702 1,227 6,550
Funding to project companies 4,719 1,120 - - 5,839
Other assets 4,027 280 5,278 88 9,673
Property and equipment 10,977 - - - 10,977
Total assets 136,095 28,446 18,708 15,286 198,535
Liabilities
Financing payable 8,631 - - - 8,631
Employee accruals 6,323 - - - 6,323
Other liabilities 3,865 - - - 3,865
Total liabilities 18,819 - - - 18,819
Commitments and contingencies 52,581 10,513 - - 63,094
Equity of investment account holders 16,846 - - - 16,846
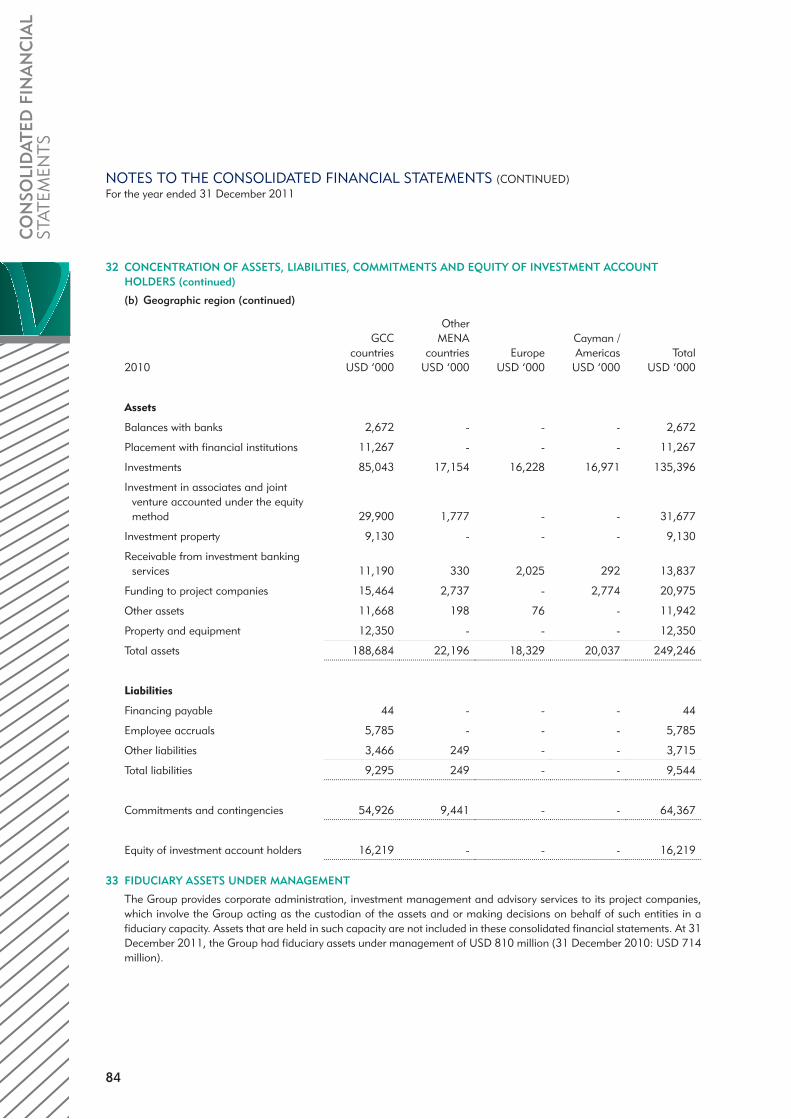
84
CO
NSO
LID
ATED
FIN
AN
CIA
L ST
ATEM
ENTS
NOTES TO THE CONSOLIDATED FINANCIAL STATEMENTS (CONTINUED)For the year ended 31 December 2011
32 CONCENTRATION OF ASSETS, LIABILITIES, COMMITMENTS AND EQUITY OF INVESTMENT ACCOUNTHOLDERS (continued)
(b) Geographic region (continued)
2010
GCCcountries
USD ‘000
OtherMENA
countriesUSD ‘000
EuropeUSD ‘000
Cayman / Americas
USD ‘000Total
USD ‘000
Assets
Balances with banks 2,672 - - - 2,672
Placement with financial institutions 11,267 - - - 11,267
Investments 85,043 17,154 16,228 16,971 135,396
Investment in associates and joint venture accounted under the equity method 29,900 1,777 - - 31,677
Investment property 9,130 - - - 9,130
Receivable from investment banking services 11,190 330 2,025 292 13,837
Funding to project companies 15,464 2,737 - 2,774 20,975
Other assets 11,668 198 76 - 11,942
Property and equipment 12,350 - - - 12,350
Total assets 188,684 22,196 18,329 20,037 249,246
Liabilities
Financing payable 44 - - - 44
Employee accruals 5,785 - - - 5,785
Other liabilities 3,466 249 - - 3,715
Total liabilities 9,295 249 - - 9,544
Commitments and contingencies 54,926 9,441 - - 64,367
Equity of investment account holders 16,219 - - - 16,219
33 FIDUCIARY ASSETS UNDER MANAGEMENT
The Group provides corporate administration, investment management and advisory services to its project companies, which involve the Group acting as the custodian of the assets and or making decisions on behalf of such entities in a fiduciary capacity. Assets that are held in such capacity are not included in these consolidated financial statements. At 31 December 2011, the Group had fiduciary assets under management of USD 810 million (31 December 2010: USD 714 million).

85
34 COMMITMENTS AND CONTINGENCIES
The Group has issued financial guarantees totalling USD 21.95 million (2010: USD 22.51 million) in respect of a number of its investee companies on which no losses are expected. The Group also had commitments to finance of USD 37.26 million (31 December 2010: 37.26 million) and commitments to invest of USD 3.88 million (31 December 2010: USD 4.60 million).
35 RISK MANAGEMENT AND CAPITAL ADEQUACY
The Group has an internal risk management function to oversee risk management and ensure the maintenance of an adequate capital base in line with best practice and in compliance with the regulations of the Central Bank of Bahrain. The Risk Committee of the Board has the overall responsibility for this function, which is managed by the Management’s Executive Committee through the Risk Management Department.
The Risk Management Department independently identifies and evaluates risks in respect of each investment proposal, and periodically monitors and measures risks at investment and statement of financial position level. The Head of Risk Management is the secretary to the Risk Committee of the Board and has access to the Board of Directors.
The Group is exposed to credit risk, concentration risk, liquidity risk, and market risk (which comprises equity price risk, profit rate risk and currency risk), in addition to operational risk. The Group’s approach to monitoring, measuring and managing these risks are discussed below.
a) Credit risk
Credit risk is the risk that the counterparty to a financial instrument does not discharge its obligations on due dates and cause the other party to incur a financial loss. The Group’s credit risk arises mainly from balances with banks, placements with financial institutions, receivable from investment banking services, funding to project companies and certain other assets like advances to acquire investments, project costs recoverable and other receivables.
The Group has put in place policies and procedures for managing credit risks to ensure that risks are accurately assessed, properly approved and regularly monitored. Formal credit limits are applied at counterparty and single obligor level. Overall exposures, including large exposures, are evaluated on a monthly basis to ensure a broad diversification of risk by counterparties and concentration limits by geography and industry.
Credit-related commitments risks
In the course of its business, the Group may extend to its investment project companies guarantees which may require the Group to make payments on their behalf. Such payments are collected from the projects based on the terms of the guarantee. They expose the Group to risks similar to financing contracts and these are mitigated by the same control processes and policies.
Maximum exposure to credit risk
The maximum exposure of credit risk on the financial assets of the Group is the carrying value of the financial assets as at 31 December 2011. The Group does not hold collateral against any of its exposures as at 31 December 2011 (31 December 2010: nil).
Past due
The Group’s receivables are generally free of profit and do not have specific terms of repayment, but are expected to be recovered in full in the course of project development and on realisation of cash flows from sale of the underlying assets and their operations. The Group does not consider these as past due based on the expected cash flows of the project companies. For expected timelines of recovery of these balances please refer to note 31.
Impaired financial assets
Impaired financial assets are those for which the Group determines that it is probable that it will be unable to collect all principal and profit due according to the contractual terms of the exposure. Impairment is assessed on an individual basis for each exposure.
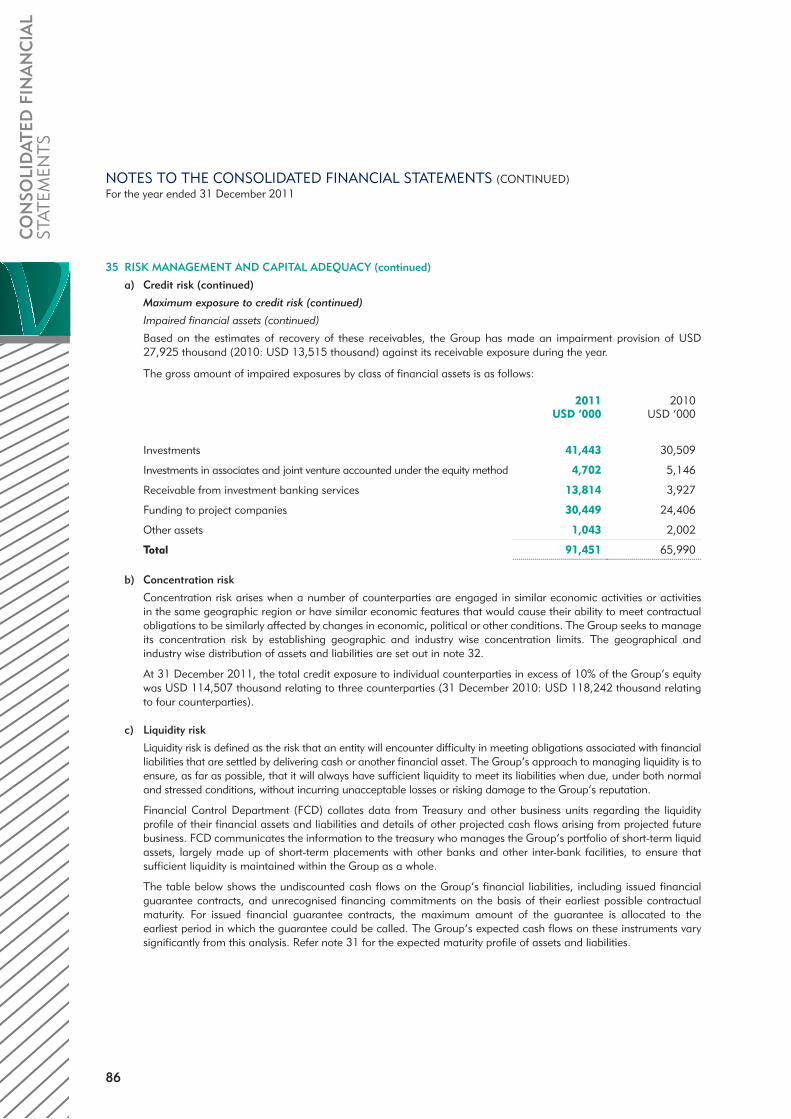
86
CO
NSO
LID
ATED
FIN
AN
CIA
L ST
ATEM
ENTS
NOTES TO THE CONSOLIDATED FINANCIAL STATEMENTS (CONTINUED)For the year ended 31 December 2011
35 RISK MANAGEMENT AND CAPITAL ADEQUACY (continued)
a) Credit risk (continued)
Maximum exposure to credit risk (continued)
Impaired financial assets (continued)
Based on the estimates of recovery of these receivables, the Group has made an impairment provision of USD 27,925 thousand (2010: USD 13,515 thousand) against its receivable exposure during the year.
The gross amount of impaired exposures by class of financial assets is as follows:
2011USD ‘000
2010USD ‘000
Investments 41,443 30,509
Investments in associates and joint venture accounted under the equity method 4,702 5,146
Receivable from investment banking services 13,814 3,927
Funding to project companies 30,449 24,406
Other assets 1,043 2,002
Total 91,451 65,990
b) Concentration risk
Concentration risk arises when a number of counterparties are engaged in similar economic activities or activities in the same geographic region or have similar economic features that would cause their ability to meet contractual obligations to be similarly affected by changes in economic, political or other conditions. The Group seeks to manage its concentration risk by establishing geographic and industry wise concentration limits. The geographical and industry wise distribution of assets and liabilities are set out in note 32.
At 31 December 2011, the total credit exposure to individual counterparties in excess of 10% of the Group’s equity was USD 114,507 thousand relating to three counterparties (31 December 2010: USD 118,242 thousand relating to four counterparties).
c) Liquidity risk
Liquidity risk is defined as the risk that an entity will encounter difficulty in meeting obligations associated with financial liabilities that are settled by delivering cash or another financial asset. The Group’s approach to managing liquidity is to ensure, as far as possible, that it will always have sufficient liquidity to meet its liabilities when due, under both normal and stressed conditions, without incurring unacceptable losses or risking damage to the Group’s reputation.
Financial Control Department (FCD) collates data from Treasury and other business units regarding the liquidity profile of their financial assets and liabilities and details of other projected cash flows arising from projected future business. FCD communicates the information to the treasury who manages the Group’s portfolio of short-term liquid assets, largely made up of short-term placements with other banks and other inter-bank facilities, to ensure that sufficient liquidity is maintained within the Group as a whole.
The table below shows the undiscounted cash flows on the Group’s financial liabilities, including issued financial guarantee contracts, and unrecognised financing commitments on the basis of their earliest possible contractual maturity. For issued financial guarantee contracts, the maximum amount of the guarantee is allocated to the earliest period in which the guarantee could be called. The Group’s expected cash flows on these instruments vary significantly from this analysis. Refer note 31 for the expected maturity profile of assets and liabilities.

87
Gross undiscounted cash flows
2011
Up to 3months
USD ‘000
3 to 6months
USD ‘000
6 monthsto 1 year
USD ‘000
1 to 3years
USD ‘000
Over 3years
USD ‘000
Carryingamount
USD ‘000
Liabilities
Islamic financing payables 8,631 - - - - 8,631
Employee accruals 900 - - - 5,423 6,323
Other liabilities 617 811 1,199 1,134 104 3,865
Total financial liabilities 10,148 811 1,199 1,134 5,527 18,819
Commitments and contingencies - 9,806 12,708 9,315 31,265 63,094
Equity of investment account holders 2 - 13,165 3,679 - 16,846
Gross undiscounted cash flows
2010
Up to 3months
USD ‘000
3 to 6months
USD ‘000
6 months to 1 year
USD ‘000
1 to 3years
USD ‘000
Over 3years
USD ‘000
Carryingamount
USD ‘000
Liabilities
Islamic financing payables - 44 - - - 44
Employee accruals - - - 2,096 3,689 5,785
Other liabilities 3,715 - - - - 3,715
Total financial liabilities 3,715 44 - 2,096 3,689 9,544
Commitments and contingencies - - - 15,695 48,672 64,367
Equity of investment account holders 197 - 12,341 3,681 - 16,219
d) Market risk
Market risk is the risk that changes in market prices, such as profit rate, equity prices, foreign exchange rates and credit spreads will affect the Group’s income or the value of its holdings of financial instruments. Market risk comprises four types of risk: currency risk, profit rate risk, equity price risk and other price risk. The objective of market risk management is to manage and control market risk exposures within acceptable parameters, while optimising the return on risk.
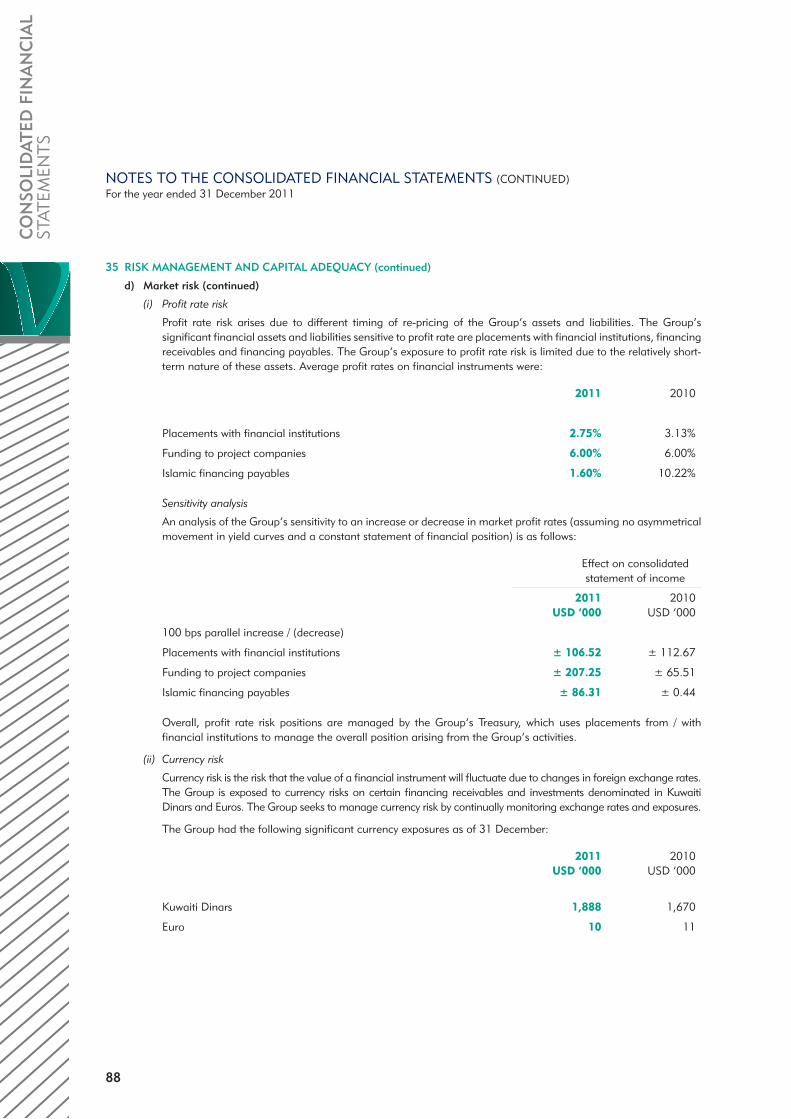
88
CO
NSO
LID
ATED
FIN
AN
CIA
L ST
ATEM
ENTS
NOTES TO THE CONSOLIDATED FINANCIAL STATEMENTS (CONTINUED)For the year ended 31 December 2011
35 RISK MANAGEMENT AND CAPITAL ADEQUACY (continued)
d) Market risk (continued)
(i) Profit rate risk
Profit rate risk arises due to different timing of re-pricing of the Group’s assets and liabilities. The Group’s significant financial assets and liabilities sensitive to profit rate are placements with financial institutions, financing receivables and financing payables. The Group’s exposure to profit rate risk is limited due to the relatively short-term nature of these assets. Average profit rates on financial instruments were:
2011 2010
Placements with financial institutions 2.75% 3.13%
Funding to project companies 6.00% 6.00%
Islamic financing payables 1.60% 10.22%
Sensitivity analysis
An analysis of the Group’s sensitivity to an increase or decrease in market profit rates (assuming no asymmetrical movement in yield curves and a constant statement of financial position) is as follows:
Effect on consolidated statement of income
2011USD ‘000
2010USD ‘000
100 bps parallel increase / (decrease)
Placements with financial institutions ± 106.52 ± 112.67
Funding to project companies ± 207.25 ± 65.51
Islamic financing payables ± 86.31 ± 0.44
Overall, profit rate risk positions are managed by the Group’s Treasury, which uses placements from / with financial institutions to manage the overall position arising from the Group’s activities.
(ii) Currency risk
Currency risk is the risk that the value of a financial instrument will fluctuate due to changes in foreign exchange rates. The Group is exposed to currency risks on certain financing receivables and investments denominated in Kuwaiti Dinars and Euros. The Group seeks to manage currency risk by continually monitoring exchange rates and exposures.
The Group had the following significant currency exposures as of 31 December:
2011USD ‘000
2010USD ‘000
Kuwaiti Dinars 1,888 1,670
Euro 10 11

89
The table below indicates the currencies to which the Group had significant exposure at 31 December 2011 and 31 December 2010 on its monetary assets and liabilities. The analysis calculates the effect of a reasonably possible movement of the currency rate against the US Dollar with all other variables held constant on the consolidated statement of income (due to the fair value of currency sensitive non-trading monetary assets and liabilities) and equity. A negative amount on the table below represents a potential net reduction in the consolidated statements of income or equity, while a positive amount reflects a net potential increase.
2011 2010
Change incurrency
rates
Effect onprofit
USD ‘000
Effect onequity
USD ‘000
Effect onprofit
USD ‘000
Effect onequity
USD ‘000
Kuwaiti Dinars +10% 57 132 34 133
Euro +10% 1 - 1 -
Kuwaiti Dinars -10% (189) - (167) -
Euro -10% (1) - (1) -
(iii) Other price risk
The Group’s available-for-sale equity investments carried at cost are exposed to risk of changes in equity values. Refer note 3 for significant estimates and judgements in relation to impairment assessment of available-for-sale equity investments carried at cost. The Group manages exposure to other price risks by actively monitoring the performance of the equity securities. The performance assessment is performed on a half yearly basis and is reported to the Board Finance & Investment Committee.
(iv) Equity price risk
Equity price risk is the risk that the fair value of equities decreases as a result of changes in the value of individual companies’ shares. The effect on equity, as a result of a change in fair value of trading equity instruments and equity instruments held as available-for-sale, due to a reasonably possible change in equity indices or net asset values, with all other variables held constant, is as follows:
2011 2010
Effect onprofit
USD ‘000
Effect onequity
USD ‘000
Effect onprofit
USD ‘000
Effect onequity
USD ‘000
Trading securities +1% 1 - 13 -
Available-for-sale +1% - 38 - 60
Trading securities -1% (1) - (13) -
Available-for-sale -1% (13) (25) (13) (47)
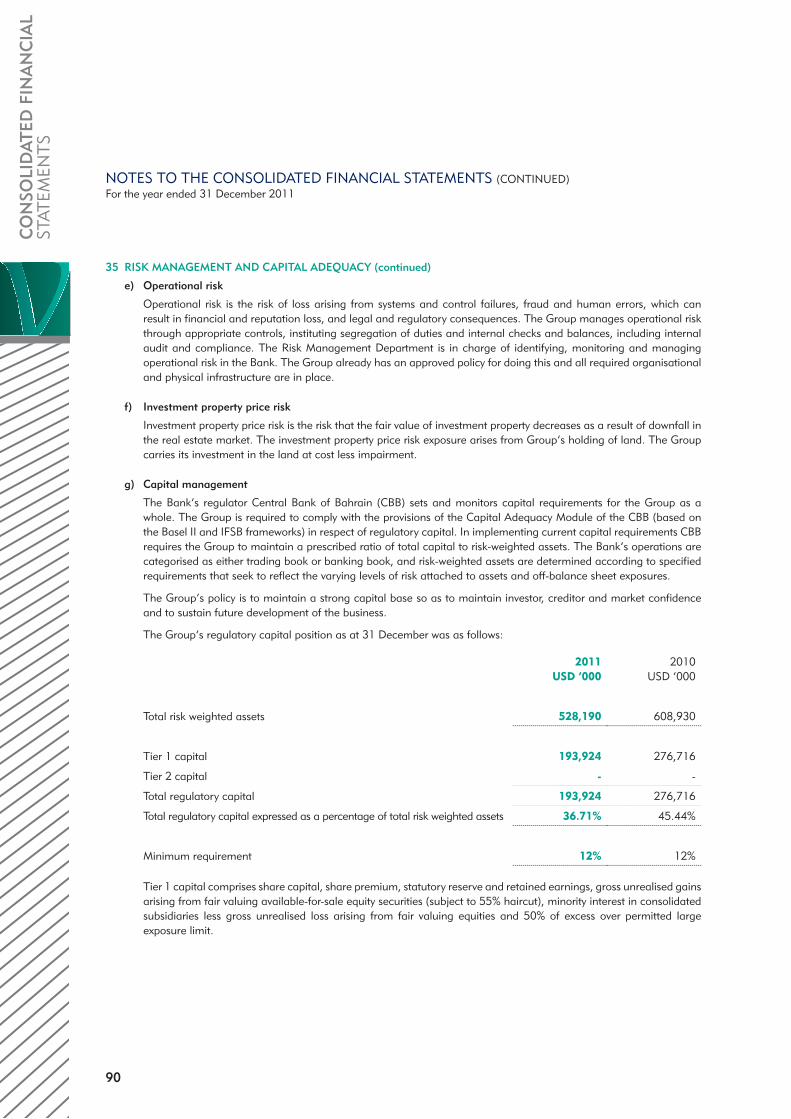
90
CO
NSO
LID
ATED
FIN
AN
CIA
L ST
ATEM
ENTS
NOTES TO THE CONSOLIDATED FINANCIAL STATEMENTS (CONTINUED)For the year ended 31 December 2011
35 RISK MANAGEMENT AND CAPITAL ADEQUACY (continued)
e) Operational risk
Operational risk is the risk of loss arising from systems and control failures, fraud and human errors, which can result in financial and reputation loss, and legal and regulatory consequences. The Group manages operational risk through appropriate controls, instituting segregation of duties and internal checks and balances, including internal audit and compliance. The Risk Management Department is in charge of identifying, monitoring and managing operational risk in the Bank. The Group already has an approved policy for doing this and all required organisational and physical infrastructure are in place.
f) Investment property price risk
Investment property price risk is the risk that the fair value of investment property decreases as a result of downfall in the real estate market. The investment property price risk exposure arises from Group’s holding of land. The Group carries its investment in the land at cost less impairment.
g) Capital management
The Bank’s regulator Central Bank of Bahrain (CBB) sets and monitors capital requirements for the Group as a whole. The Group is required to comply with the provisions of the Capital Adequacy Module of the CBB (based on the Basel II and IFSB frameworks) in respect of regulatory capital. In implementing current capital requirements CBB requires the Group to maintain a prescribed ratio of total capital to risk-weighted assets. The Bank’s operations are categorised as either trading book or banking book, and risk-weighted assets are determined according to specified requirements that seek to reflect the varying levels of risk attached to assets and off-balance sheet exposures.
The Group’s policy is to maintain a strong capital base so as to maintain investor, creditor and market confidence and to sustain future development of the business.
The Group’s regulatory capital position as at 31 December was as follows:
2011USD ‘000
2010USD ‘000
Total risk weighted assets 528,190 608,930
Tier 1 capital 193,924 276,716
Tier 2 capital - -
Total regulatory capital 193,924 276,716
Total regulatory capital expressed as a percentage of total risk weighted assets 36.71% 45.44%
Minimum requirement 12% 12%
Tier 1 capital comprises share capital, share premium, statutory reserve and retained earnings, gross unrealised gains arising from fair valuing available-for-sale equity securities (subject to 55% haircut), minority interest in consolidated subsidiaries less gross unrealised loss arising from fair valuing equities and 50% of excess over permitted large exposure limit.
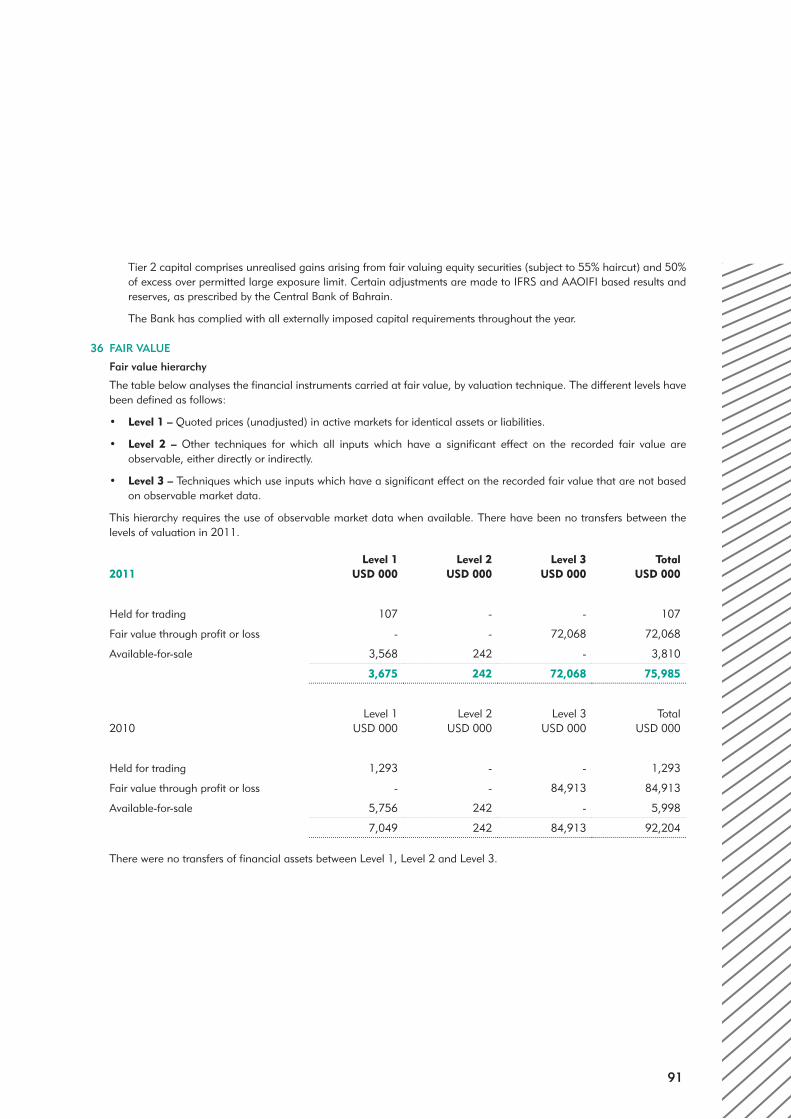
91
Tier 2 capital comprises unrealised gains arising from fair valuing equity securities (subject to 55% haircut) and 50% of excess over permitted large exposure limit. Certain adjustments are made to IFRS and AAOIFI based results and reserves, as prescribed by the Central Bank of Bahrain.
The Bank has complied with all externally imposed capital requirements throughout the year.
36 FAIR VALUE
Fair value hierarchy
The table below analyses the financial instruments carried at fair value, by valuation technique. The different levels have been defined as follows:
• Level 1 – Quoted prices (unadjusted) in active markets for identical assets or liabilities.
• Level 2 – Other techniques for which all inputs which have a significant effect on the recorded fair value are observable, either directly or indirectly.
• Level 3 – Techniques which use inputs which have a significant effect on the recorded fair value that are not based on observable market data.
This hierarchy requires the use of observable market data when available. There have been no transfers between the levels of valuation in 2011.
2011Level 1
USD 000Level 2
USD 000Level 3
USD 000Total
USD 000
Held for trading 107 - - 107
Fair value through profit or loss - - 72,068 72,068
Available-for-sale 3,568 242 - 3,810
3,675 242 72,068 75,985
2010Level 1
USD 000Level 2
USD 000Level 3
USD 000Total
USD 000
Held for trading 1,293 - - 1,293
Fair value through profit or loss - - 84,913 84,913
Available-for-sale 5,756 242 - 5,998
7,049 242 84,913 92,204
There were no transfers of financial assets between Level 1, Level 2 and Level 3.

92
CO
NSO
LID
ATED
FIN
AN
CIA
L ST
ATEM
ENTS
NOTES TO THE CONSOLIDATED FINANCIAL STATEMENTS (CONTINUED)For the year ended 31 December 2011
36 FAIR VALUE (continued)
Fair value hierarchy (continued)
The following table shows a reconciliation of the opening and closing amount of Level 3 financial assets which are recorded at fair value.
31 December2011
USD 000
31 December2010
USD 000
Balance at 1 January 84,913 75,011
Losses recognised in consolidated statement of income - net (11,301) (15,100)
Investments acquired during the year 2,438 25,002
At 31 December 76,050 84,913
Determining fair value under Level 3 includes use of valuation techniques such as the discounted cash flow model. The future cash flows have been estimated by the management, based on information and discussion with representatives of the management of the investee companies, and based on the latest available audited and un-audited financial statements. Cash flows have been projected for an initial period of between two to five years and then a terminal value has been estimated using a combination of value based on forward multiples and at a perpetual growth rate of up to 2-3% applied on the discounted cash flows of the last year of the estimate. The discount rates used for computing the present value of future cash flows range from 10.75% – 21.7%. The discount rates have been arrived at after considering the risk free rate, expected market premium, country risk and systematic risk underlying each investee company. The Group has also made use of illiquidity and marketability discount where considered appropriate.
The potential income effect of 1% increase in the discount rates, which is a key variable used in the valuation technique, would decrease the fair values by approximately USD 2,231 thousand (31 December 2010: USD 4,278 thousand), whereas a 1% decrease in the discount rate would increase the fair values by approximately USD 2,387 thousand (31 December 2010: USD 4,278 thousand). The potential income effect of 0.5 times change, on either side, in the market multiples, which is a key variable used in the valuation technique, would increase the fair values by approximately USD 4,530 thousand (31 December 2010: 5,362 thousand) or reduce the fair values by approximately USD 4,530 thousand (31 December 2010: USD 5,362 thousand) respectively.
CONTENTS
1 . Introduction 942 . Capital Structure 94 2.1 Capital Base 94 2.2 Group Structure 94 2.3 Review of Financial Performance 94 Capital Adequacy Management Programme 953 . Risk Management 99 3.1 Risk Governance Structure 99 3.5 Credit and Counterparty Credit
Risk Management (PD 1.3.22 + 1.3.26) 101 Securitisation 101 Off-Balance Sheet Items 102 Concentration Risk 102 Market Risk Management 105 Operational Risk Management 105 Legal Risks 105 Shari’ah Compliance 106 Equity Risk in the Banking Book (Investment Risk) 106 Impairment Provisions 106 Unrealised Fair Value Gains (losses) 107 Liquidity Risk Management 107 Profit Margin Rate Risk Management in
the Banking Book 108 Restricted Investment Accounts (RIA)
and Displaced Commercial Risk (DCR) 1094. Board and Executive Management Remuneration 1095. Corporate Governance and Transparency 110
BASEL IIPILLAR 3 DISCLOSURES For the year ended 31 December 2011
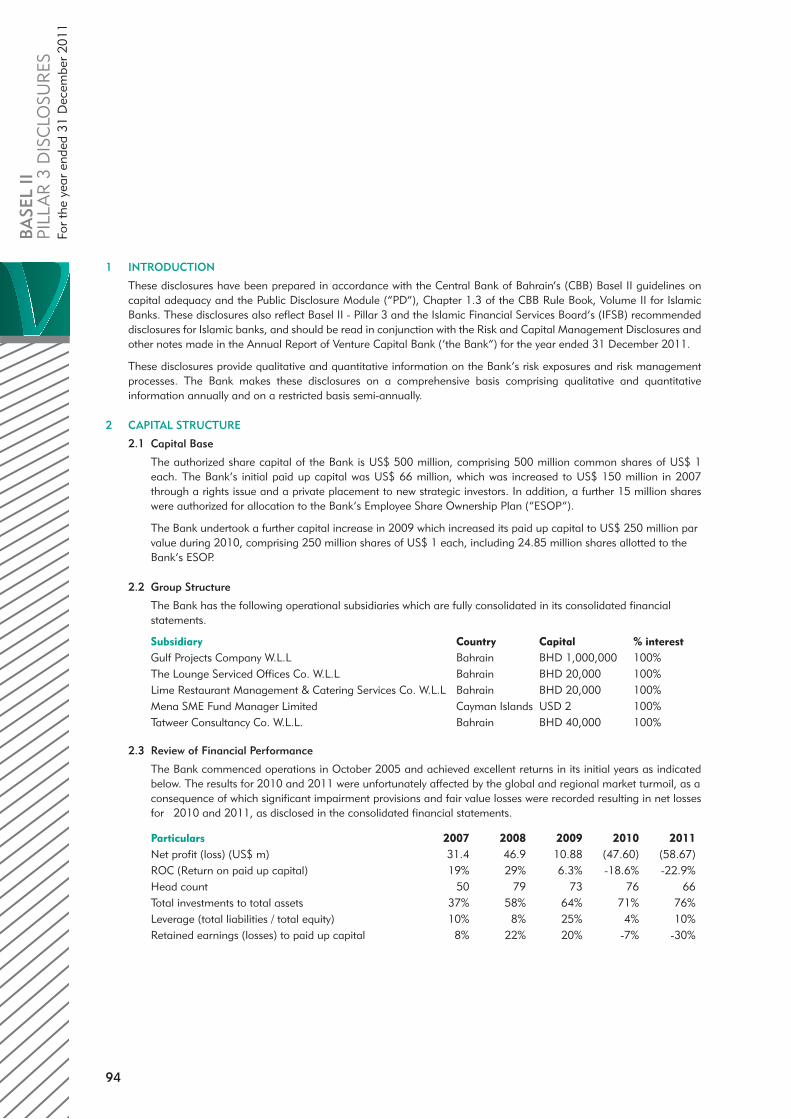
94
BA
SEL
II
PILL
AR
3 D
ISC
LOSU
RES
For
the
year
end
ed 3
1 D
ecem
ber
2011
1 INTRODUCTION
These disclosures have been prepared in accordance with the Central Bank of Bahrain’s (CBB) Basel II guidelines on capital adequacy and the Public Disclosure Module (“PD”), Chapter 1.3 of the CBB Rule Book, Volume II for Islamic Banks. These disclosures also reflect Basel II - Pillar 3 and the Islamic Financial Services Board’s (IFSB) recommended disclosures for Islamic banks, and should be read in conjunction with the Risk and Capital Management Disclosures and other notes made in the Annual Report of Venture Capital Bank (‘the Bank”) for the year ended 31 December 2011.
These disclosures provide qualitative and quantitative information on the Bank’s risk exposures and risk management processes. The Bank makes these disclosures on a comprehensive basis comprising qualitative and quantitative information annually and on a restricted basis semi-annually.
2 CAPITAL STRUCTURE
2.1 Capital Base
The authorized share capital of the Bank is US$ 500 million, comprising 500 million common shares of US$ 1 each. The Bank’s initial paid up capital was US$ 66 million, which was increased to US$ 150 million in 2007 through a rights issue and a private placement to new strategic investors. In addition, a further 15 million shares were authorized for allocation to the Bank’s Employee Share Ownership Plan (“ESOP”).
The Bank undertook a further capital increase in 2009 which increased its paid up capital to US$ 250 million par value during 2010, comprising 250 million shares of US$ 1 each, including 24.85 million shares allotted to the Bank’s ESOP.
2.2 Group Structure
The Bank has the following operational subsidiaries which are fully consolidated in its consolidated financial statements.
Subsidiary Country Capital % interestGulf Projects Company W.L.L Bahrain BHD 1,000,000 100%The Lounge Serviced Offices Co. W.L.L Bahrain BHD 20,000 100%Lime Restaurant Management & Catering Services Co. W.L.L Bahrain BHD 20,000 100%Mena SME Fund Manager Limited Cayman Islands USD 2 100%Tatweer Consultancy Co. W.L.L. Bahrain BHD 40,000 100%
2.3 Review of Financial Performance
The Bank commenced operations in October 2005 and achieved excellent returns in its initial years as indicated below. The results for 2010 and 2011 were unfortunately affected by the global and regional market turmoil, as a consequence of which significant impairment provisions and fair value losses were recorded resulting in net losses for 2010 and 2011, as disclosed in the consolidated financial statements.
Particulars 2007 2008 2009 2010 2011Net profit (loss) (US$ m) 31.4 46.9 10.88 (47.60) (58.67)ROC (Return on paid up capital) 19% 29% 6.3% -18.6% -22.9%Head count 50 79 73 76 66 Total investments to total assets 37% 58% 64% 71% 76%Leverage (total liabilities / total equity) 10% 8% 25% 4% 10%Retained earnings (losses) to paid up capital 8% 22% 20% -7% -30%

95
As shown in the consolidated financial statements, income from investment banking services comprises the main contributor to net income. With the anticipated growth in assets under management, the Bank expects to increase the proportion of recurring income from management fees going forward to provide an increased level of sustainable income.
In this regard, the Bank intends to accelerate its growth by stepping-up investment deal flow and attracting high quality investor in-flows.
Capital Adequacy Management Programme
2.4 The Bank’s capital adequacy management programme ensures that the Bank not only complies with regulatory capital requirements, but also continues to maintain a strong and robust capital base to support its growing lines of business.
2.5 To manage its capital, the Bank employs a risk adjusted measure of capital adequacy (i.e. Capital Adequacy Ratio or “CAR”) based on the local regulatory regime implemented by the CBB that is consistent with the Basel II guidelines issued by the Basel Committee on Banking Supervision’s International Convergence of Capital Measurement and Capital Standards.
2.6 Beginning January 2008, CBB has required all Bahrain banking institutions to implement Pillar 1 of these Basel II guidelines that deals with the maintenance of a minimum level of capital calculated for three major components of risk exposures i.e. credit risk (including investment risks), operational risk and market risk.
2.7 The Bank uses the Standardised Approach to quantify its credit and market risk weighted exposures and the Basic Indicator Approach to measure its operational risk weighted exposures.
(a) Credit risk weighted exposures may be calculated in three different methods of varying degrees of sophistication, namely the Standardised Approach, Foundation Internal Rating Based Approach and Advanced Internal Rating Based Approach. The Bank has adopted the Standardised Approach for credit risk measurement, which uses fixed risk weights for different categories of credit risk.
(b) Market risk weighted exposures may be quantified using the Standardised Approach, which uses fixed capital charges for specific categories of market risk, or the Internal Models Approach subject to prior approval by CBB. The Bank uses the Standardised Approach for market risk measurement.
(c) For operational risk, there are three different approaches - Basic Indicator Approach, Standardised Approach, and Advanced Measurement Approach. The Bank uses the Basic Indicator Approach, which uses the average of the gross income for the past three years as a basis for the calculation of capital charges for operational risk.
2.8 In determining its CAR, the Bank calculates its risk adjusted assets, which are then divided by regulatory eligible capital rather than the equity capital appearing in the Bank’s statement of financial position. Regulatory capital is composed of two elements:
(a) Tier 1 Capital which is the nominal value of paid in capital, audited retained earnings and accumulated reserves arising from the appropriation of current and past years’ income and/or retained earnings less treasury stock, minority interests and negative fair value reserves. Local regulations also require that certain investments or exposures should be deducted from Tier 1 capital.
(b) Tier 2 Capital, which consists of the qualifying portion of subordinated loans and unrealised gains arising on fair valuation. Under the CBB regulations, the aggregate amount of Tier 2 capital eligible for inclusion in the CAR is limited to no more than 100% of Tier 1 Capital.

96
BA
SEL
II
PILL
AR
3 D
ISC
LOSU
RES
For
the
year
end
ed 3
1 D
ecem
ber
2011
2 CAPITAL STRUCTURE (continued)
2.9 As the Bank has no operating branches outside the Kingdom of Bahrain, it is subject only to the capital requirements of the CBB, which currently requires all financial institutions in Bahrain to maintain a 12% minimum CAR.
2.10 The Bank’s capital adequacy position is reviewed and stress tested regularly for various scenarios given the nature of the Bank’s investments in alternative assets. Reports on the Bank’s capital adequacy are filed quarterly with the CBB.
2.11 During 2011, the Bank continued the development and enhancement of its risk management and internal capital adequacy assessment framework. This framework includes a capital allocation process as well as a process description for scenario analysis of the Bank’s strategy. It is envisaged that once the framework is finalised and implemented, quantitative details of capital allocated to each business line as well as a scenario analysis of the Bank’s strategy will be provided.
2.12 As a further step in mitigating risks, the Bank follows a policy of diversification in its activities and seeks to minimise the risk exposure to particular geographical regions, counterparties, instruments and types of business.

97
2.13 The quantitative details of the Bank’s capital adequacy ratio are depicted in the following tables:
Details of eligible capital base USD ‘000 USD ‘000 Tier 1 Tier 2
Issued and fully paid ordinary shares 250,000 Less: Employee stock incentive programme funded by the bank (outstanding) 22,764 Disclosed reserves 44,193 General reserves - Legal / statutory reserves 10,415 Share premium 28,429 Capital redemption reserve - Others 5,349 Retained profit brought forward (27,730)Unrealised gains arising from fair valuing equities (45% only) 6,925 Minority interest in consolidated subsidiaries 49,824 Less:Goodwill - Current interim cumulative net losses 43,388 Unrealised gross losses arising from fair valuing equity securities 35,984 Reciprocal cross-holdings of bank capital (amount originally existed in Tier 1) - Tier 1 Capital before PCD deductions 221,076
Current interim profits (reviewed by external auditors) - Asset revaluation reserve - Property, plant, and equipment (45% only) - Unrealised gains arising from fair valuing equities (45% only) - Profit equalisation reserve - Investment risk reserve - Less: Reciprocal cross-holdings of bank capital (amount originally existed in Tier 2) - Tier 2 Capital before PCD deductions -
Total Available Capital 221,076 Loss: DeductionsUnconsolidated majority-owned or -controlled banking, securities or other
financial entities - Capital shortfall of non-consolidated entities subsidiaries - Significant minority investments in banking, securities and other financial entities
unless pro-rata consolidated - Capital shortfall not pro-rata consolidated significant banking, securities or other
financial entities - Capital shortfall in insurance subsidiaries - Excess amount over materiality thresholds in case of investment in commercial
entities - Investment in insurance entity greater than or equal to 20% - Excess amount over maximum permitted large exposure limit 13,576 13,576 Additional deduction from Tier 1 to absorb deficiency in Tier 2 13,576 Other deductionsTotal Deductions 27,151 13,576
i ii Net Available Capital 193,925 -
Total Eligible Capital (i + ii) 193,925

98
BA
SEL
II
PILL
AR
3 D
ISC
LOSU
RES
For
the
year
end
ed 3
1 D
ecem
ber
2011
2 CAPITAL STRUCTURE (continued)
2.13 (continued)
Table 1: Regulatory eligible capital as at 31 Dec 2011
Details of exposures and capital requirement USD ‘000
Credit risk:Gross
exposuresRisk weighted
exposuresCapital charge
Exposures to banks 9,824 1,967 236 Exposures to corporates 31,174 31,174 3,741 Investments in listed equities in banking book 3,323 3,323 399 Investments in unlisted equities in banking book 151,797 227,695 27,323 Investments in real estate 72,962 145,923 17,511 Other exposures 9,147 9,147 1,098 Total credit risk exposure under standardised approach 278,226 419,229 50,307
Market risk:Trading equities position 107 215 26 Foreign exchange position 1,384 1,384 166 Total market risk under standardised approach 1,491 1,599 192
Operational risk under Basic Indicator Approach (ref. below) 107,363 12,884
Total 528,190 63,383
Total eligible capital - (Tier 1 + Tier 2) 193,925 Total eligible capital - Tier 1 193,925
Total Capital Adequacy Ratio (Tier 1 + Tier 2) 36.7%Tier 1 Capital Adequacy Ratio 36.7%
Capital requirement for Operational Risk (Basic Indicator Approach)
USD ‘0002010 2009 2008
Gross income for prior three years 445- 32,473 82,047 Average of past 3 years gross income (excl. loss years) 57,260 Capital requirement for Operational Risk (15%) 8,589 Risk weighted exposure for Operational Risk 107,363
Total unrealised fair value gains / (losses): 2011 2010 2009 2008 2007
Unrealised fair value (losses)/gains recognised in income (15,413) (15,100) 3,080 9,800 3,625
Unrealised fair value gains/(losses) recognised in equity (648) 2,229 1,496 (85) 180

99
The maximum and minimum values of each category of market risk exposure during the year are detailed in the table below:
Details of market risk weighted exposures
USD ‘000Particulars 31-Mar-11 30-Jun-11 30-Sep-11 31-Dec-11 Maximum MinimumMarket risk exposuresListed equities held for trading 1,171 1,591 1,468 107 1,591 107 Foreign currency exposure 1,768 2,014 1,840 1,384 2,014 1,384
Market risk chargeListed equities held for trading 187 255 235 17 255 17 Foreign currency exposure 141 161 147 111 161 111 Total market risk charge 329 416 382 128 416 128
Market risk weighted exposureListed equities held for trading 2,342 3,182 2,937 215 3,182 215 Foreign currency exposure 1,768 2,014 1,840 1,384 2,014 1,384 Total market risk weighted exposure 4,110 5,196 4,777 1,599 5,196 1,599
Credit risk weight on Islamic financing contracts at 31 Dec 2011, which is representative of the average exposure during the period:
USD ‘000Asset Categories for Credit Risk Credit Exposure Credit Risk Weighted AssetsCommodity Murabaha 2,882 2,882 Qard Hassan 3,136 6,244 Total Islamic financing contracts 6,018 9,126
3. RISK MANAGEMENT
3.1 Risk Governance Structure
As an Islamic investment bank dealing predominantly in alternative assets, the Bank is exposed to various risks in the normal course of its business and these risks include:
(a) Credit and counterparty credit risk (b) Market risk (c) Operational risk (d) Equity risk in the Banking Book (Investment risk) (e) Liquidity risk (f) Profit margin rate risk in the Banking Book (g) Displaced commercial risk (DCR)

100
BA
SEL
II
PILL
AR
3 D
ISC
LOSU
RES
For
the
year
end
ed 3
1 D
ecem
ber
2011
3. RISK MANAGEMENT (continued)
3.2 An understanding of risk-taking and transparency in risk-taking are key elements in the Bank’s business strategy. The Bank maintains a prudent and disciplined approach towards risk taking, and embeds a structured risk management process as an integral part of its decision making practice. This risk management process, which is applicable to the various risks the Bank is exposed to, is divided into three key components comprising the following:
a) Risk Identification and Measurement (i) Procedures for the identification and quantification of risks (ii) The use of quantitative models and qualitative approaches to assess and manage risks
b) Risk Control (i) Clearly defined risk exposure limits (ii) Criteria for risk acceptance based on risk and return as well as other factors (iii) Portfolio diversification and, where possible, other risk mitigation techniques (iv) Robust operating policies and procedures (v) Appropriate Board Committee’s authorization and approval for investment transactions
c) Risk Monitoring and Reporting (i) Ongoing review of exposures and risks by Risk Management Department, including stress testing and
frequent reporting (ii) Periodic internal audits of the control environment
3.3 The Bank’s Board of Directors through its Risk Committee (a sub committee of the Board of Directors) has the responsibility for ensuring the establishment and effective implementation of an integrated risk management framework for the Bank. Further, the Risk Management Department (a department which functionally reports to the Risk Committee) is empowered to independently identify and assess risks that may arise from the Bank’s investing and operating activities; as well as recommend directly to the Executive Management Committee any prevention and mitigation measures as it deems fit. In addition, the Internal Audit Department, which is independent of both operations and the Bank’s investments units, also assists in the risk management process. In particular, the Internal Audit Department is charged with a periodic review of the effectiveness of the Bank’s policies and internal controls, including those relating to the risk management process.
3.4 The Internal Audit Department of the Bank adopts a risk-based audit approach whereby the nature, timing and extent of the audits are determined with regard to the risk relevant to each business or support unit of the Bank. A risk assessment is carried out annually to determine the major risks faced by each business or support unit and accordingly, an annual audit plan is prepared by the Internal Audit Department and approved by the Board’s Audit Committee. The annual plan envisages the coverage, amongst others, of the Risk Management and Compliance Departments.
Detailed operational risk assessments and tests of effectiveness of internal controls designed to mitigate risks (covering each of the risk components as mentioned above) are carried out in accordance with the annual audit plan. A follow up audit to ascertain the status of implementation of observations previously made by internal or external audit is also part of the annual audit plan.
The key findings arising from the work performed by Internal Audit is reported to the Board Audit Committee and senior management of the Bank.

101
3.5 Credit and Counterparty Credit Risk Management (PD 1.3.22 + 1.3.26) Credit risk is defined as the potential that a bank’s borrower or counterparty will fail to meet its obligations in
accordance with agreed terms.
3.6 The Bank is not involved in the granting of credit facilities in the normal course of its business activities. Further, the Bank is not engaged in retail business and therefore does not use credit “scoring” models.
3.7 The credit risk exposures faced by the Bank are in respect of its own short term liquidity related to placements with other financial institutions, and in respect of investment related funding made to projects. The investment related funding exposures arise in the ordinary course of its investment banking activities and are generally transacted without contractual due dates, collateral or other credit risk mitigants. All such exposures are however reviewed periodically for recoverability and specific provision made where necessary having regard to the nature of the item and the assessment of collection. Additionally, during 2011, due to continued negative market conditions a collective impairment provision has also been recorded based on the recommendations of the external auditors and the Central Bank of Bahrain.
3.8 VCBank uses the Standardised Approach under the Basel II framework for measuring its credit risk. As it does not use an internal credit “scoring” system, the Bank depends, where available, on ratings from an External Credit Assessment Institution recognised by the CBB e.g. S&P, Fitch, Moody’s and Capital Intelligence for its bank counterparty exposures. In the absence of such an external rating – e.g. in the case of an investee company, a detailed credit risk assessment of the obligor is performed by the investment team and independently reviewed by the Risk Management Department. In addition, the Bank does not have any credit exposure to a “highly leveraged institution”.
3.9 All lines of counterparty credit limits are subject to annual reaffirmation by the Board of Directors. The limits are also reviewed more frequently as necessary to ensure consistency with the Bank’s investment strategies and to take into account the latest market developments. Given the nature of the Bank’s business, the Bank uses nominal balance sheet amounts including accrued interest and other receivables as its measure of exposure. Overall, the Bank’s Management considers that its policies and procedures constitute a reasonable approach to managing the credit risk in the activities it is engaged in.
Securitisation3.10 The Bank does not generally participate in securitisation activities in relation to credit synthesis; acting as sponsor,
liquidity facility provider, credit enhancement facility provider, swap provider and has not securitised any of its assets and therefore has no recourse obligations under such transactions as defined by the Financial Stability Task Force.However, the Bank has structured and arranged the “Liquidity Programme” which raised a total of US$ 55 million in 2010 through the issuance of Shari’ah compliant 1 year tenor liquidity certificates with early redemption options of 30 days, 90 days and 180 days with attractive yields, which has been more than fully subscribed by investors. These certificates are backed by an 84.61% share in the VCBank Building, a prime commercial property in the Diplomatic Area of Bahrain. The Bank also concluded arrangements with a local Islamic bank to act as a liquidity provider under the Programme to take up early redemptions up to USD 15 million which are not immediately taken up by replacement investors under the Liquidity Programme.
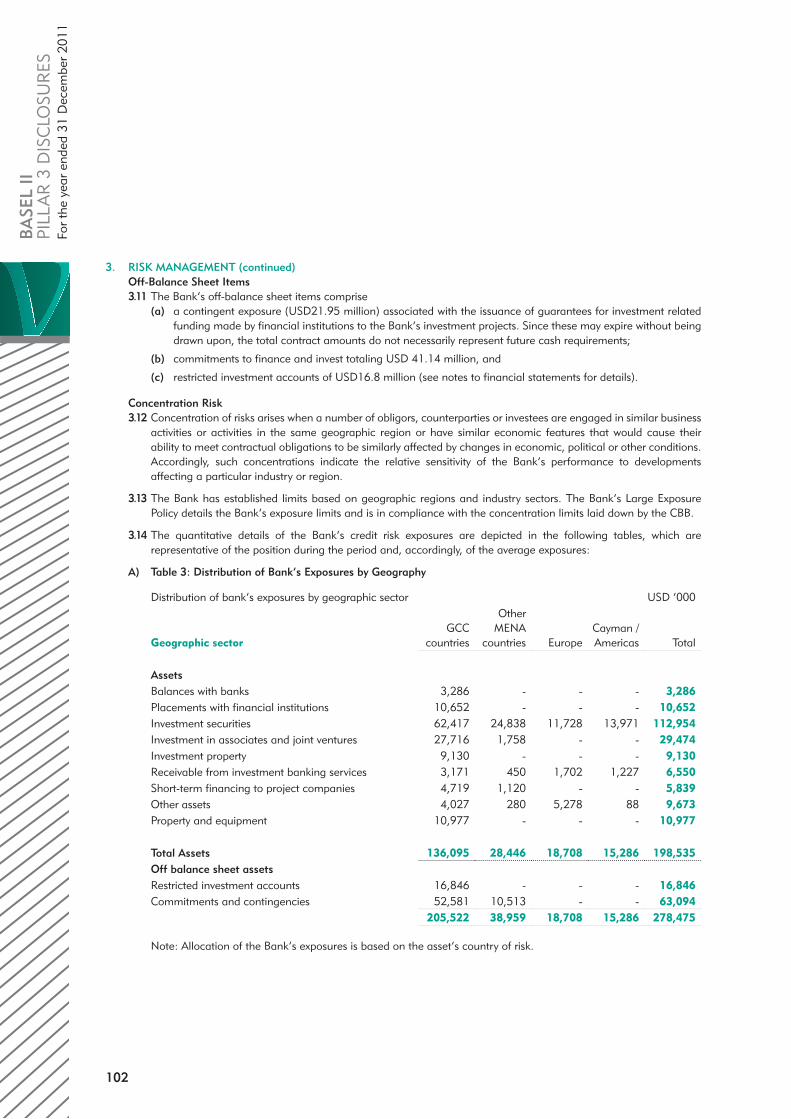
102
BA
SEL
II
PILL
AR
3 D
ISC
LOSU
RES
For
the
year
end
ed 3
1 D
ecem
ber
2011
3. RISK MANAGEMENT (continued)Off-Balance Sheet Items3.11 The Bank’s off-balance sheet items comprise (a) a contingent exposure (USD21.95 million) associated with the issuance of guarantees for investment related
funding made by financial institutions to the Bank’s investment projects. Since these may expire without being drawn upon, the total contract amounts do not necessarily represent future cash requirements;
(b) commitments to finance and invest totaling USD 41.14 million, and
(c) restricted investment accounts of USD16.8 million (see notes to financial statements for details).
Concentration Risk 3.12 Concentration of risks arises when a number of obligors, counterparties or investees are engaged in similar business
activities or activities in the same geographic region or have similar economic features that would cause their ability to meet contractual obligations to be similarly affected by changes in economic, political or other conditions. Accordingly, such concentrations indicate the relative sensitivity of the Bank’s performance to developments affecting a particular industry or region.
3.13 The Bank has established limits based on geographic regions and industry sectors. The Bank’s Large Exposure Policy details the Bank’s exposure limits and is in compliance with the concentration limits laid down by the CBB.
3.14 The quantitative details of the Bank’s credit risk exposures are depicted in the following tables, which are representative of the position during the period and, accordingly, of the average exposures:
A) Table 3: Distribution of Bank’s Exposures by Geography
Distribution of bank’s exposures by geographic sector USD ‘000
Geographic sectorGCC
countries
Other MENA
countries EuropeCayman / Americas Total
AssetsBalances with banks 3,286 - - - 3,286 Placements with financial institutions 10,652 - - - 10,652 Investment securities 62,417 24,838 11,728 13,971 112,954 Investment in associates and joint ventures 27,716 1,758 - - 29,474 Investment property 9,130 - - - 9,130 Receivable from investment banking services 3,171 450 1,702 1,227 6,550 Short-term financing to project companies 4,719 1,120 - - 5,839 Other assets 4,027 280 5,278 88 9,673 Property and equipment 10,977 - - - 10,977
Total Assets 136,095 28,446 18,708 15,286 198,535 Off balance sheet assetsRestricted investment accounts 16,846 - - - 16,846 Commitments and contingencies 52,581 10,513 - - 63,094
205,522 38,959 18,708 15,286 278,475
Note: Allocation of the Bank’s exposures is based on the asset’s country of risk.
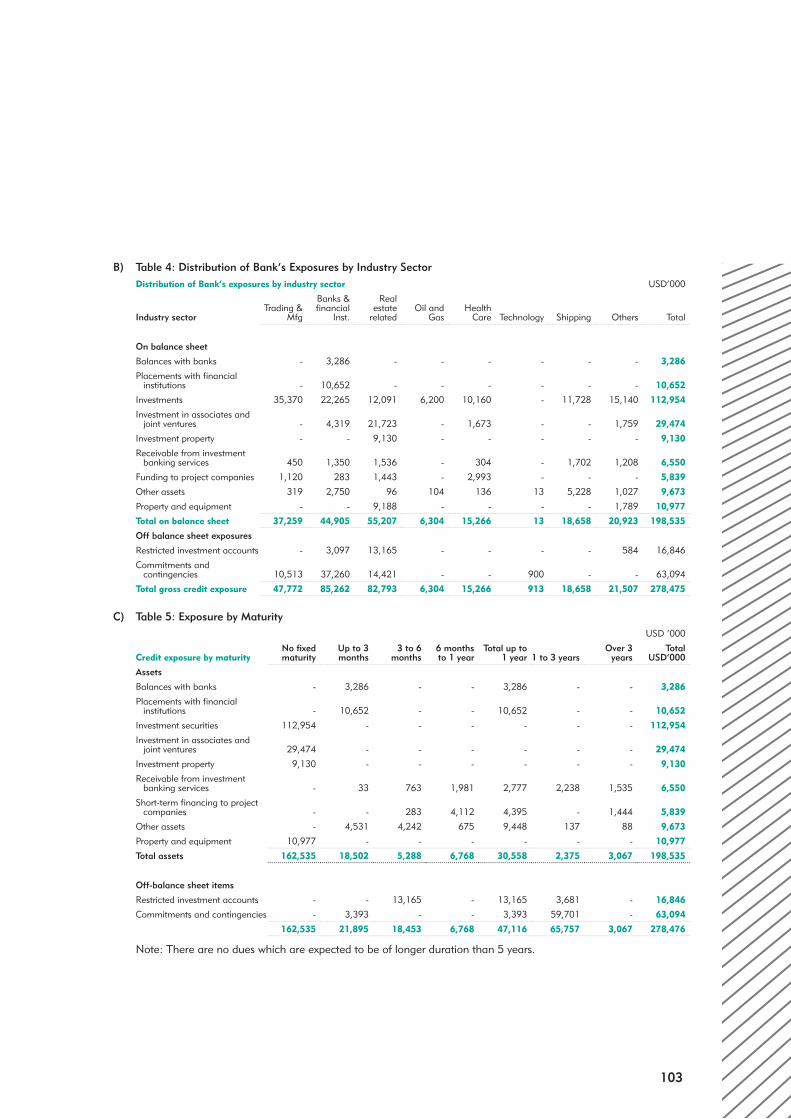
103
B) Table 4: Distribution of Bank’s Exposures by Industry SectorDistribution of Bank’s exposures by industry sector USD’000
Industry sectorTrading &
Mfg
Banks & financial
Inst.
Real estate
relatedOil and
GasHealth
Care Technology Shipping Others Total
On balance sheet
Balances with banks - 3,286 - - - - - - 3,286
Placements with financial institutions - 10,652 - - - - - - 10,652
Investments 35,370 22,265 12,091 6,200 10,160 - 11,728 15,140 112,954
Investment in associates and joint ventures - 4,319 21,723 - 1,673 - - 1,759 29,474
Investment property - - 9,130 - - - - - 9,130
Receivable from investment banking services 450 1,350 1,536 - 304 - 1,702 1,208 6,550
Funding to project companies 1,120 283 1,443 - 2,993 - - - 5,839
Other assets 319 2,750 96 104 136 13 5,228 1,027 9,673
Property and equipment - - 9,188 - - - - 1,789 10,977
Total on balance sheet 37,259 44,905 55,207 6,304 15,266 13 18,658 20,923 198,535
Off balance sheet exposures
Restricted investment accounts - 3,097 13,165 - - - - 584 16,846
Commitments and contingencies 10,513 37,260 14,421 - - 900 - - 63,094
Total gross credit exposure 47,772 85,262 82,793 6,304 15,266 913 18,658 21,507 278,475
C) Table 5: Exposure by MaturityUSD ‘000
Credit exposure by maturity No fixed maturity
Up to 3 months
3 to 6 months
6 months to 1 year
Total up to 1 year 1 to 3 years
Over 3 years
Total USD’000
Assets
Balances with banks - 3,286 - - 3,286 - - 3,286
Placements with financial institutions - 10,652 - - 10,652 - - 10,652
Investment securities 112,954 - - - - - - 112,954
Investment in associates and joint ventures 29,474 - - - - - - 29,474
Investment property 9,130 - - - - - - 9,130
Receivable from investment banking services - 33 763 1,981 2,777 2,238 1,535 6,550
Short-term financing to project companies - - 283 4,112 4,395 - 1,444 5,839
Other assets - 4,531 4,242 675 9,448 137 88 9,673
Property and equipment 10,977 - - - - - - 10,977
Total assets 162,535 18,502 5,288 6,768 30,558 2,375 3,067 198,535
Off-balance sheet items
Restricted investment accounts - - 13,165 - 13,165 3,681 - 16,846
Commitments and contingencies - 3,393 - - 3,393 59,701 - 63,094
162,535 21,895 18,453 6,768 47,116 65,757 3,067 278,476
Note: There are no dues which are expected to be of longer duration than 5 years.

104
BA
SEL
II
PILL
AR
3 D
ISC
LOSU
RES
For
the
year
end
ed 3
1 D
ecem
ber
2011
3. RISK MANAGEMENT (continued)D Related party transactions In the ordinary course of its business the Bank enters into transactions with related parties which are at arm’s
length terms and approved by management. The following table gives an analysis of related party transactions and balances:
Related party transactions
Associatesand joint venture
Keymanagement
personnel
Significantshareholders /
entitiesin whichdirectors
areinterested Total
2011 USD ‘000 USD ‘000 USD ‘000 USD ‘000
AssetsBalances with banks 313 - 321 634 Placements with financial institutions - - 3,555 3,555 Investments - - 46,623 46,623 Investments in associates and joint ventures 29,474 - - 29,474 Receivable from investment banking services 373 - 2,853 3,225 Funding to project companies 8,732 - 3,523 12,255 Other assets 270 - 424 694
LiabilitiesEmployee accruals - 2,713 - 2,713 Payable on acquisition of investment property - - - - Payables - - - -
IncomeIncome from investment banking services 1,818 - 130 1,948 Loss on investments (13,572) - (3,000) (16,572)Share of profit/ (loss) of associates and joint
ventureaccounted for using the equity method (1,179) - - (1,179)Other income 3,028 - - 3,028
Expenses (excluding compensation for key management personnel)
Impairment allowances against investments 1,024 - - 1,024 Impairment allowances against receivables 6,085 - 6,086 12,170
Commitments and contingencies 435 - 11,831 12,266
Equity of investment account holders 13,165 - - 13,165
105
Market Risk Management 3.15 Market risk is defined as the risk of losses in the Bank’s on-balance sheet and off-balance sheet positions arising
from movements in market prices. The risks subject to this requirement are:
(a) Those pertaining to profit-rate related instruments and equities in the trading book; and
(b) Foreign exchange risk and commodities risk throughout the Bank.
3.16 The Bank’s market risk exposures arise predominantly from its trading portfolio of listed equities and a small portfolio of foreign currency denominated assets that are not pegged to the USD. Management opines that the Bank’s market risk is currently not a major source of risk since the Bank’s business strategy does not envisage taking on significant market risk. The Bank measures its market risk exposure using the Standardised Approach under the Basel II framework.
Operational Risk Management 3.17 Operational risk is defined as the risk of direct and indirect losses resulting from inadequate or failed processes, people
and systems or from external events. This definition includes legal risk but excludes strategic and reputational risks. Operational risk differs from other banking risks in that it is not directly taken in return for an expected reward but exists in the natural course of corporate activity, which in turn affects the risk management process.
3.18 The Bank is exposed to operational risk due to the complex nature of its alternative investment products and the intricacy of the documentary, legal and other regulatory requirements that surround such investment transactions. Operational risk emanates from all areas of the Bank from the front office to the back office and support areas and, not just the operations department.
3.19 The Bank uses the Basic Indicator Approach under the Basel II Framework for measuring its operational risk. Currently, the Bank conducts its business from a single location. Accordingly, the number of client relationships and volume of transactions at the Bank are lower than at institutions having multi-location or retail operations.
3.20 Notwithstanding this, the Bank’s operations are conducted according to well-defined process and procedures. These process and procedures include a broad system of internal controls, including segregation of duties and other internal checks, which are designed to prevent either inadvertent staff errors or malfeasance prior to the release of a transaction. The Bank also engages in subsequent monitoring of accounting records, daily reconciliation of cash, bank and securities accounts and other checks to enable it to detect, on a timely basis, any erroneous or improper transactions which may have occurred.
3.21 The Bank is currently enhancing its operational risk management framework that will
(a) help track operational loss events and potential exposures as well as report these on a regular basis; and
(b) improve the Bank’s loss mitigation process and hence, the overall operational risk management framework.
In addition, the Bank is reviewing and updating its Business Continuity Plan to mitigate the risk of loss from business disruption due to unexpected events.
Legal Risks3.22 Legal risk includes the risk of non-compliance with applicable laws or regulations, the illegality or unenforceability
of counterparty obligations under contracts and additional unintended exposure or liability resulting from the failure to structure transactions or contracts properly.
3.23 The Bank’s legal risks are mitigated through legal counsel review of transactions and documentation, as appropriate. Where possible, the Bank uses standard formats for transaction documentation. To prevent potential association with any money laundering activities, the Bank has designed and implemented a comprehensive set of policies and procedures. Adherence to the Bank’s policies and procedures is reinforced through staff training as well as internal and external reviews. As on the reporting date, the Bank has no significant material legal contingencies including pending legal actions.
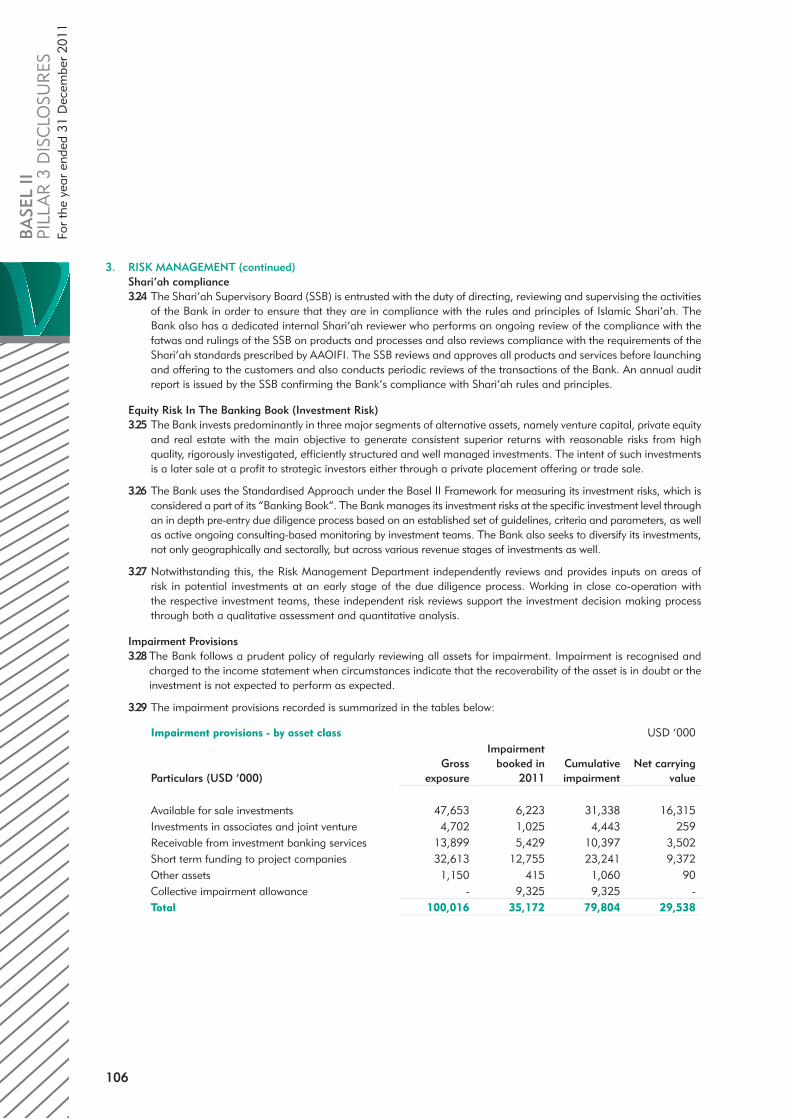
106
BA
SEL
II
PILL
AR
3 D
ISC
LOSU
RES
For
the
year
end
ed 3
1 D
ecem
ber
2011
3. RISK MANAGEMENT (continued)Shari’ah compliance3.24 The Shari’ah Supervisory Board (SSB) is entrusted with the duty of directing, reviewing and supervising the activities
of the Bank in order to ensure that they are in compliance with the rules and principles of Islamic Shari’ah. The Bank also has a dedicated internal Shari’ah reviewer who performs an ongoing review of the compliance with the fatwas and rulings of the SSB on products and processes and also reviews compliance with the requirements of the Shari’ah standards prescribed by AAOIFI. The SSB reviews and approves all products and services before launching and offering to the customers and also conducts periodic reviews of the transactions of the Bank. An annual audit report is issued by the SSB confirming the Bank’s compliance with Shari’ah rules and principles.
Equity Risk In The Banking Book (Investment Risk) 3.25 The Bank invests predominantly in three major segments of alternative assets, namely venture capital, private equity
and real estate with the main objective to generate consistent superior returns with reasonable risks from high quality, rigorously investigated, efficiently structured and well managed investments. The intent of such investments is a later sale at a profit to strategic investors either through a private placement offering or trade sale.
3.26 The Bank uses the Standardised Approach under the Basel II Framework for measuring its investment risks, which is considered a part of its “Banking Book”. The Bank manages its investment risks at the specific investment level through an in depth pre-entry due diligence process based on an established set of guidelines, criteria and parameters, as well as active ongoing consulting-based monitoring by investment teams. The Bank also seeks to diversify its investments, not only geographically and sectorally, but across various revenue stages of investments as well.
3.27 Notwithstanding this, the Risk Management Department independently reviews and provides inputs on areas of risk in potential investments at an early stage of the due diligence process. Working in close co-operation with the respective investment teams, these independent risk reviews support the investment decision making process through both a qualitative assessment and quantitative analysis.
Impairment Provisions3.28 The Bank follows a prudent policy of regularly reviewing all assets for impairment. Impairment is recognised and
charged to the income statement when circumstances indicate that the recoverability of the asset is in doubt or the investment is not expected to perform as expected.
3.29 The impairment provisions recorded is summarized in the tables below:
Impairment provisions - by asset class USD ‘000
Particulars (USD ‘000)Gross
exposure
Impairment booked in
2011Cumulative impairment
Net carrying value
Available for sale investments 47,653 6,223 31,338 16,315 Investments in associates and joint venture 4,702 1,025 4,443 259 Receivable from investment banking services 13,899 5,429 10,397 3,502 Short term funding to project companies 32,613 12,755 23,241 9,372 Other assets 1,150 415 1,060 90 Collective impairment allowance - 9,325 9,325 - Total 100,016 35,172 79,804 29,538

107
Impairment provisions - by industrial sector USD ‘000
Particulars (USD ‘000)Gross
exposure
Impairment booked in
2011Cumulative impairment
Net carrying value
Real estate 60,626 18,056 45,148 15,478 Healthcare 9,556 182 1,482 8,074 Technology 13,264 6,072 13,264 - Oil and gas 6,919 817 4,158 2,761 Transportation 1,750 623 623 1,127 Others 7,902 98 5,804 2,097 Collective impairment allowance - 9,325 9,325 - Total 100,016 35,172 79,804 29,538
Unrealised Fair Value Gains (losses)3.30 The Bank’s investments which are designated at fair value through income are re-valued at every half calendar
year, and the gains / (losses) recognised in the income statement in accordance with the relevant Internal Financial Reporting Standards. The valuations are performed by the Bank’s investment divisions using appropriate internal valuation models with relevant market inputs and assumptions. These valuations are then independently reviewed by the Risk Management Department and the external auditors, and presented to the Board’s Finance & Investment Committee for approval.
Particulars (USD ‘000) 2011 2010 2009 2008 2007 TotalPrivate Equity investments - Fair value (losse)/gain (1,711) - 3,830 3,300 3,108 8,527 Real Estate investments - Fair value (losse)/gain (13,572) (15,100) (750) 6,500 - (22,922)Venture Capital investments - Fair value gains - - - - 518 518Total unrealised fair value (loss)/gain (15,283) (15,100) 3,080 9,800 3,626 (13,877)
Liquidity Risk Management 3.31 Liquidity risk is defined as the risk that the Bank may have insufficient funds to meet its obligations as they fall due
i.e. risk of being unable to satisfy claims without impairment of its financial capital due to mismatches in the timing of cash flows.
3.32 The Bank does not currently have any borrowings other than an insignificant amount of bank financing and routine accounts payables for operating costs. Accordingly, it does not have any significant liquidity risk exposure from borrowings. However, the Bank has extended certain guarantees and undertaken commitments in support of its investment projects as disclosed in Note 34 to the Consolidated Financial Statements.
3.33 Although this gives rise to a level of liquidity funding risk, management carefully monitors liquidity through regular forecasts prepared by the Bank’s Treasury Department in consultation with the business and finance functions of the Bank, including considerations of stress scenarios. The Bank also has a portfolio of quoted equity securities which are available to meet any unexpected shortfalls in funding requirements. Accordingly, management considers that the Bank is not exposed to any significant liquidity funding risk.
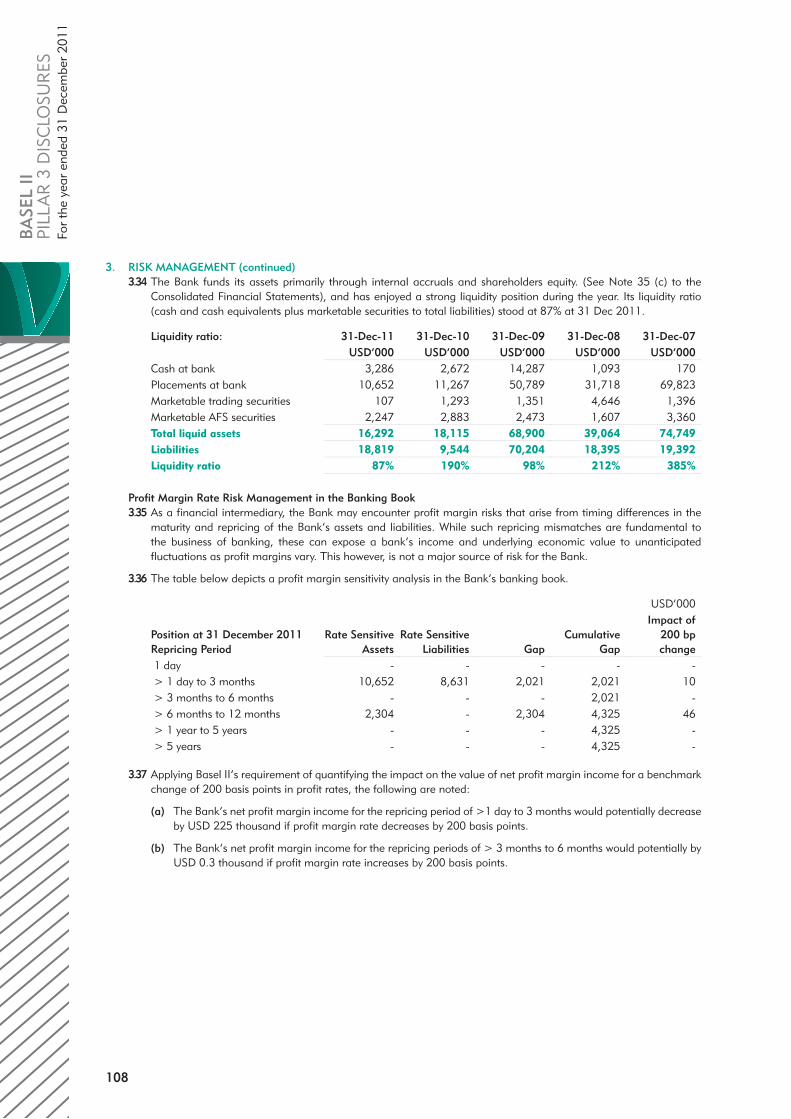
108
BA
SEL
II
PILL
AR
3 D
ISC
LOSU
RES
For
the
year
end
ed 3
1 D
ecem
ber
2011
3. RISK MANAGEMENT (continued)3.34 The Bank funds its assets primarily through internal accruals and shareholders equity. (See Note 35 (c) to the
Consolidated Financial Statements), and has enjoyed a strong liquidity position during the year. Its liquidity ratio (cash and cash equivalents plus marketable securities to total liabilities) stood at 87% at 31 Dec 2011.
Liquidity ratio: 31-Dec-11 31-Dec-10 31-Dec-09 31-Dec-08 31-Dec-07USD’000 USD’000 USD’000 USD’000 USD’000
Cash at bank 3,286 2,672 14,287 1,093 170 Placements at bank 10,652 11,267 50,789 31,718 69,823 Marketable trading securities 107 1,293 1,351 4,646 1,396 Marketable AFS securities 2,247 2,883 2,473 1,607 3,360 Total liquid assets 16,292 18,115 68,900 39,064 74,749 Liabilities 18,819 9,544 70,204 18,395 19,392 Liquidity ratio 87% 190% 98% 212% 385%
Profit Margin Rate Risk Management in the Banking Book 3.35 As a financial intermediary, the Bank may encounter profit margin risks that arise from timing differences in the
maturity and repricing of the Bank’s assets and liabilities. While such repricing mismatches are fundamental to the business of banking, these can expose a bank’s income and underlying economic value to unanticipated fluctuations as profit margins vary. This however, is not a major source of risk for the Bank.
3.36 The table below depicts a profit margin sensitivity analysis in the Bank’s banking book.
USD’000
Position at 31 December 2011Repricing Period
Rate SensitiveAssets
Rate SensitiveLiabilities Gap
CumulativeGap
Impact of 200 bpchange
1 day - - - - - > 1 day to 3 months 10,652 8,631 2,021 2,021 10 > 3 months to 6 months - - - 2,021 - > 6 months to 12 months 2,304 - 2,304 4,325 46 > 1 year to 5 years - - - 4,325 - > 5 years - - - 4,325 -
3.37 Applying Basel II’s requirement of quantifying the impact on the value of net profit margin income for a benchmark change of 200 basis points in profit rates, the following are noted:
(a) The Bank’s net profit margin income for the repricing period of >1 day to 3 months would potentially decrease by USD 225 thousand if profit margin rate decreases by 200 basis points.
(b) The Bank’s net profit margin income for the repricing periods of > 3 months to 6 months would potentially by USD 0.3 thousand if profit margin rate increases by 200 basis points.

109
Restricted Investment Accounts (RIA) and Displaced Commercial Risk (DCR) 3.38 The Bank’s exposure to Displaced Commercial Risk is limited to its Restricted Investment Accounts (RIA) which
comprises the following:
i) The GCC Pre IPO Fund, which was set up in 2006 to invest in the shares of unlisted GCC companies in the pre-IPO stage. The total size of the fund is relatively small with funds under investment of approximately USD 4.5 million.The Bank manages the fund as mudarib, in exchange for a fee of 20% of returns over a 10% simple return.
ii) The VCBank Investment Projects Mudarabah, which was set up in 2009 to provide liquidity financing to selected investment projects of VCBank. The Mudarabah comprises an investment of USD 12 million on which it earns a return of 7% less the Bank’s share of profit as Mudarib of 7% thereof, which is distributed to investors on maturity.
iii)
5 years historical data on RIA 2011 2010 2009 2008 2007USD’000 USD’000 USD’000 USD’000 USD’000
GCC Pre IPO FundNet profit/(loss) 71 (1,406) 129 30 134 Total assets 3,681 3,878 4,471 4,615 5,110 Total equity 3,681 3,878 4,471 4,615 5,110 Return on assets (ROA) 2% -36% 3% 1% 3%Return on equity (ROE) 2% -36% 3% 1% 3%
VCBank Investment Projects Mudarabah
Net Profit 2,105 1,219 331 N/A N/A Total assets 14,105 13,219 12,331 N/A N/A Total equity 13,165 12,341 12,308 N/A N/A Return on assets (ROA) 15% 9% 3% N/A N/A Return on equity (ROE) 16% 10% 3% N/A N/A
3.39 The Bank is aware of its fiduciary responsibilities in management of the RIA investments and has clear policies on discharge of these responsibilities. The summarized financial statements of the RIA’s are also included in the Bank’s audited consolidated financial statements.
4. BOARD AND EXECUTIVE MANAGEMENT REMUNERATION 4.1 The Nomination and Remuneration Committee of the Board assists the Board in determining the remuneration
and compensation of the Board and Executive Management, including executive incentives and employee share ownership plan entitlements.
4.2 Board compensation comprises board remuneration on a formula approach reflecting the Bank’s profitability and participation in Board meetings, and attendance fees per meeting attended.
4.3 Executive Management compensation comprises, in addition to salaries that are in line with industry norms, incentives based on profitability and performance, plus participation in the Bank’s employee share ownership plan, as disclosed in Notes 24 and 25 to the Consolidated Financial Statements.
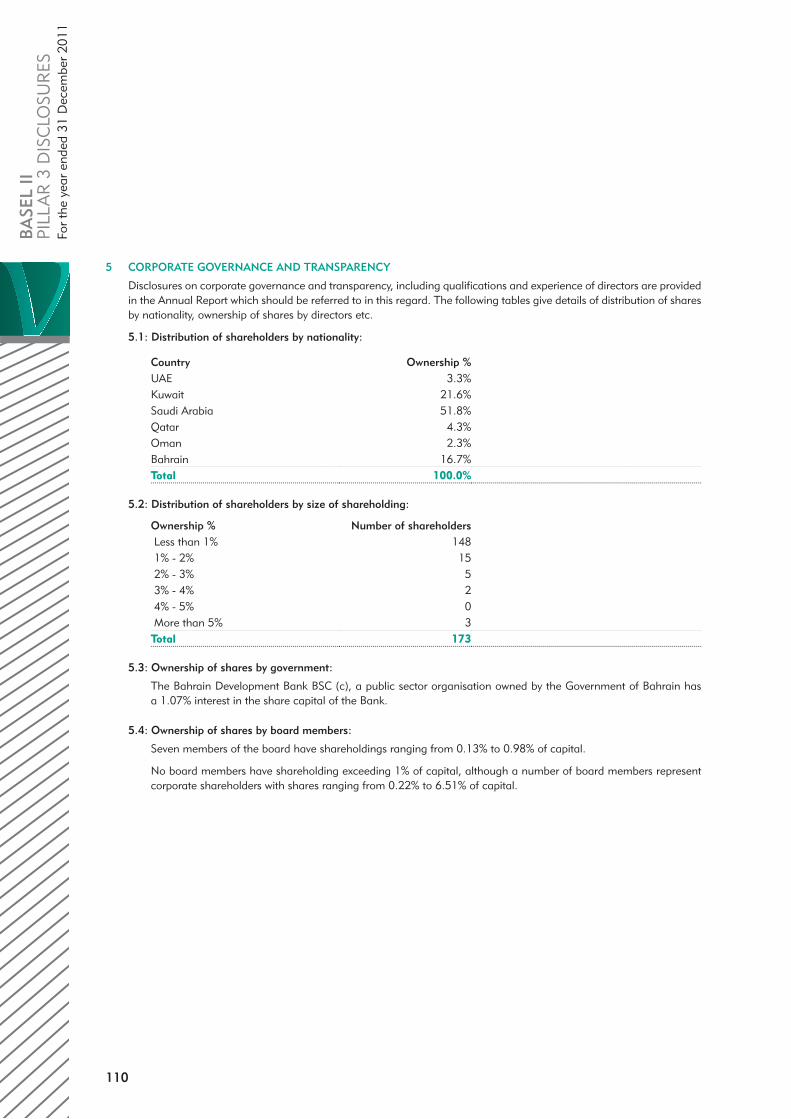
110
BA
SEL
II
PILL
AR
3 D
ISC
LOSU
RES
For
the
year
end
ed 3
1 D
ecem
ber
2011
5 CORPORATE GOVERNANCE AND TRANSPARENCY
Disclosures on corporate governance and transparency, including qualifications and experience of directors are provided in the Annual Report which should be referred to in this regard. The following tables give details of distribution of shares by nationality, ownership of shares by directors etc.
5.1: Distribution of shareholders by nationality:
Country Ownership %UAE 3.3%Kuwait 21.6%Saudi Arabia 51.8%Qatar 4.3%Oman 2.3%Bahrain 16.7%Total 100.0%
5.2: Distribution of shareholders by size of shareholding:
Ownership % Number of shareholders Less than 1% 148 1% - 2% 15 2% - 3% 5 3% - 4% 2 4% - 5% 0 More than 5% 3Total 173
5.3: Ownership of shares by government:
The Bahrain Development Bank BSC (c), a public sector organisation owned by the Government of Bahrain has a 1.07% interest in the share capital of the Bank.
5.4: Ownership of shares by board members:
Seven members of the board have shareholdings ranging from 0.13% to 0.98% of capital.
No board members have shareholding exceeding 1% of capital, although a number of board members represent corporate shareholders with shares ranging from 0.22% to 6.51% of capital.
Copyright © 2022 FDOKUMEN