
Governmental and independent venture capital investments in Europe: A firm-level performance...
54
1 Governmental and independent venture capital investments in Europe: a firm-level performance analysis Douglas J. Cumming a , Luca Grilli b , Samuele Murtinu b * a York University - Schulich School of Business, 4700 Keele Street, Toronto, Ontario M3J 1P3, Canada b Politecnico di Milano, Department of Management, Economics and Industrial Engineering, Via R. Lambruschini 4/b, 20156, Milan, Italy * Corresponding author. Phone: +39 02 2399 2807; fax: +39 02 2399 2710. E-mail addresses: [email protected] (D. Cumming), [email protected] (L. Grilli), [email protected] (S. Murtinu).
Transcript of Governmental and independent venture capital investments in Europe: A firm-level performance...

1
Governmental and independent venture capital
investments in Europe: a firm-level performance
analysis
Douglas J. Cumminga, Luca Grillib, Samuele Murtinub*
a York University - Schulich School of Business, 4700 Keele Street, Toronto, Ontario
M3J 1P3, Canada
b Politecnico di Milano, Department of Management, Economics and Industrial
Engineering, Via R. Lambruschini 4/b, 20156, Milan, Italy
* Corresponding author. Phone: +39 02 2399 2807; fax: +39 02 2399 2710.
E-mail addresses: [email protected] (D. Cumming), [email protected] (L.
Grilli), [email protected] (S. Murtinu).
2
Governmental and independent venture capital
investments in Europe: a firm-level performance
analysis
Abstract
This paper examines the impact of government versus private independent venture capital
(VC) backing on the exit performance of entrepreneurial firms. Our analyses are based on
the VICO dataset, which avoids the coding problems of VC type in the Thompson
Financial SDC dataset. The data indicate that private independent VC-backed companies
have better exit performance than government-backed companies. Mixed-syndicates of
private-independent and governmental VC investors give rise to a higher (but not
statistically different) likelihood of positive exits than that of IVC-backing. Our findings
are not influenced by the composition of the syndicate in terms of size and institutional
heterogeneity. Our results remain stable after controlling for endogeneity concerns,
selection bias, omitted variables bias, legal and institutional differences across countries
and over time through several econometric techniques. Moreover, our results are not
driven by: i) the holding period of the different types of VC investors; ii) the potential
signaling effect of GVC towards IVC investors; iii) the firm's financial structure and net
cash-flow ratio; iv) the investment stage; v) the distance between the VC investor and the
target company.
Keywords: independent venture capital; governmental venture capital; syndication; exit
performance; public-private partnership
1. Introduction
Venture Capital (“VC”) is one of the most tailored financing modes for young high-
tech companies (Gompers and Lerner, 2001; Yung, 2009; Vismara et al., 2012). First,
venture capitalists (“VCs”) provide the financial resources young high-tech companies
lack due to capital market imperfections (Andrieu and Groh, 2012).1 Second, VCs
1 Capital market imperfections are due to some peculiar characteristics of young high-tech companies, such
as: i) the technology-intensive nature of their business model; ii) their lack of reputation; iii) and the
intangible nature of their assets, which cannot be used as collateral when bargaining with banks and other

3
perform coaching (Sahlman, 1990; Groh et al., 2010) and monitoring activities
(Gompers, 1995; Lerner, 1995; Kanniainen and Keuschnigg, 2003, 2004; Wang and
Zhou, 2004; Giot and Schwienbacher, 2007; Hege et al., 2009; Cressy et al., 2007; Dihiya
and Ray, 2012). Third, VCs provide access to business contacts and alliance partners
(Riyanto and Schwienbacher, 2006; Huang et al., 2008; Wang and Wang, 2012a,b).
VC firms are funds in which a management company raises capital from a pool of
limited partners (e.g. university endowments, banks, pension funds, insurance companies,
wealthy individuals, family offices, asset managers), selects target companies and tries to
achieve a profitable exit, usually through an IPO or a trade-sale (Sahlman, 1990;
Gompers and Lerner, 2001; Nahata, 2008; Nahata et al., 2014).
However, due to historical reasons and to the distinctive features of legal and
institutional environments, the supply of VC is extremely different across countries (Groh
et al., 2010; Cumming and Johan, 2013). In particular, the gap suffered from European
Union (EU) Member States in comparison to the United States (US) is not negligible,
both in terms of fundraising and investments. According to an official report of the
European Parliament (2012), in 2010 US funds' fundraising activity reached € 10.1
billion (0.09% of GDP) compared to only € 3.3 billion in Europe (0.03% of GDP). In
terms of investments, the VC amount in the US reached a value of € 11.8 billion (0.11%
of GDP) compared to € 3.5 billion (0.03% of GDP) in Europe. The recent financial crisis
has further "stretched the scissors" (Kraemer-Eis and Lang, 2011).
The scant development of the European VC market has in the recent past resulted in a
series of policy initiatives at the EU level (the most important one is probably the Risk
Capital Action Plan in 1998; European Commission, 1998) directed towards various
playing-level fields (e.g., measures aimed at increasing stock market openness and/or
labor market flexibility, tax incentives) in order to stimulate both the supply and the
demand side of the VC market.
These efforts also led to the emergence of a peculiar feature in the EU context: a
higher presence of governmental VC (GVC, henceforth) funds than in the US (Leleux
and Surlemont, 2003), i.e. VC funds set-up and managed by a company entirely
traditional financial institutions (Berger and Udell, 1998; Carpenter and Petersen, 2002; Denis, 2004;
Bertoni et al., 2013).

4
possessed by governmental (or public administration) bodies.2 The economic rationale
behind the setting up of GVC funds (GVCs, henceforth) is to adopt a “hands-on policy
approach” in the VC market and (try to) alleviate the typical chicken-egg paradox of
markets where the deal flow is scarce because of shortage of VC but the supply of VC is
thin due to the low number of promising business targets.3
Despite the high number of GVCs in Europe (e.g., Biotech Fonds Vlaanderen in
Belgium, SITRA in Finland, CDC Innovation in France, TBG in Germany, Piemontech
in Italy, Axis Participaciones Empresariales in Spain, Scottish Enterprise in the UK), the
extant literature on the impact of GVC on portfolio companies' performance in Europe is
very limited. And to the best of our knowledge, there has not been any attempt in the
corporate finance literature to compare their performance with the one achieved by the
typical 'Silicon Valley style' independent venture capital (IVC) funds operating in the
same European context.
As a matter of fact, many previous works dealing with the issue have used a macro
perspective to explain which country-specific policy (Groh et al., 2010; Cumming and
Johan, 2013) and institutional factors might foster the VC industry in Europe (Cumming
and Johan, 2013). Other works examined the performance of extra-European GVC
programs.4 Finally, very few country-specific studies focused on the impact of GVC on
portfolio companies’ growth performance (e.g., Beuselinck and Manigart, 2000 in
Belgium, or Balboa et al., 2007 in Spain). There are a few exceptions in recent working
papers, but the trouble is that such papers are based on the Thompson Financial SDC
dataset which may misreport fund types (for example, in Canada and Australia, over 50%
of the transactions are reported as being from the wrong fund type). Grilli and Murtinu
(2014a,b) analyze the impact of GVC on the growth performance (in terms of sales and
2 The extant literature lacks a commonly accepted definition of GVC. Examples of definitions are: i) equity
(or equity-like) investments in young firms, or policy measures aimed at favoring other financial
intermediaries to engage in such investments (Gompers and Lerner, 2004); ii) programs that help high-tech
industries through direct VC initiatives and tax policies (Cumming and Johan, 2013); iii) hybrid
public/private funds (Jääskeläinen et al. 2007). In this work, we adopt the criterion followed by the
Thomson One database that classifies the VC funds according to the governance of the fund. 3 Independent venture capital (IVC) investments in Europe as a share of GDP are only 25% of the US ones
(Kelly, 2011).
4 Some examples are OnPoint Technology and In-Q-Tel programs in the US (Mara, 2011), the Yozma
program in Israel (Avnimelech and Teubal, 2006) and the IIF in Australia (Cumming and Johan, 2013).

5
employees) of young high-tech companies located in 7 European countries (Belgium,
Finland, France, Germany, Italy, Spain and the United Kingdom). Using the VICO
database, through several econometric techniques, they showed that GVC-backed
companies would have followed similar growth patterns even without any GVC
investment. Overall, they show that independent (and other typologies of private) VC
funds are more effective than GVCs in spurring the growth of portfolio companies. The
only positive impact exerted by governmental funds is found to be confined to the
syndication with independent (and other private) VC operators, and this result holds only
if specific conditions are met.5
As to this latter aspect, another untapped gap in the extant literature is the lack of
empirical evaluation about the performance, from the investor’s point of view, of mixed
syndicates composed by GVC and IVC funds (IVCs, henceforth) in the European VC
market. This reflects a more general dearth of studies on syndication activities between
different types of VC investors in any geographical context. But the issue is relevant. As
claimed by Gompers and Lerner (2004), VC investors often tend to syndicate their
investments rather than going alone.
Syndication is reputed to be beneficial for several reasons. First, it may improve the
screening process through (at least) a ‘second opinion’ (Gompers and Lerner, 2004;
Casamatta and Haritchabalet, 2007). Second, it may increase capital infusion into the
portfolio company and leverage the coaching potential of investors through the
exploitation of complementary financial and non-financial resources, skills, networks and
industry expertise of syndicate members (Andrieu and Groh, 2012). Third, it leads to a
reduction of the overall portfolio risk (Gompers and Lerner, 2004) and may convey a
signal towards capital markets about the quality of the focal VC-backed company, which
may ultimately have a positive influence on the likelihood of a successful exit (Cumming
and Johan, 2013).
In principle, these benefits (especially the second one of the above-exposed list) could
be particularly pronounced when different types of VC investors join the syndicate
(Bertoni et al., 2013). However, the intrinsic differences between IVC and GVC investors
5 For example, Grilli and Murtinu (2014b) found that the impact of public-private syndication on the sales
growth of high-tech companies is positive and statistically significant (ranging from +62.90% to +63.54%)
but only if the syndicate targets very young companies.

6
might also entail agency and transaction costs (e.g., Wright and Lockett, 2003; Cumming
et al., 2007). These costs should be higher when the objectives of syndicate partners are
incompatible, as might be the case of IVC and GVC investors. As highlighted by Chahine
et al. (2012: p. 180), syndicate members ‘have different objectives which can result in
principal-principal conflicts of interests among members of a VC syndicate’.
Our contribution aims at filling these gaps. Our research questions may be
summarized as follows: i) are GVCs by their own able to lead to a positive exit in
comparison with traditional IVC investors?; ii) how do syndicated investments by GVC
and IVC funds perform?; and iii) do different structures of mixed IVC-GVC syndicates
play a differential effect on the exit performance?
We answer to these research questions through the VICO database, a novel firm-level
longitudinal dataset sponsored by the European Union under the 7° Framework Program
(for more details, see Section 3). The VICO dataset includes 8,370 companies from seven
European countries (Belgium, Finland, France, Germany, Italy, Spain and the UK) out of
which 759 received VC funding between 1994 (or subsequent firm’s foundation year)
and 2004. In the sample used in this work, firms are observed from 1991 (or year of a
firm’s foundation) to 2010 (or year of a firm’s exit from the dataset).
As is customary in the finance literature dealing with VC and exit (e.g., Gompers and
Lerner, 2004; Wang and Wang, 2010, 2012b, Cumming and Johan, 2013), our analysis
hinges on a multinomial logit approach, distinguishing between positive outcomes (IPOs
or trade-sales) and negative ones (liquidations). Our empirical findings highlight a
positive contribution of IVC-backing on the likelihood to reach a positive exit. However,
the impact of GVC is negligible. More interestingly, mixed IVC-GVC syndicated
investments lead to a higher (but not statistically different) likelihood of a positive exit
than that of IVC-backing. This positive impact of IVC-GVC syndicates is not found to be
influenced by the composition of the syndicate in terms of size and institutional
heterogeneity. These results remain stable after controlling for endogeneity concerns,
selection bias and omitted variables bias through several econometric techniques:
multinomial probit models, semi-parametric Cox-type survival models, panel
multinomial logit with random effects, panel probit models on matched samples, and
Instrumental Variables (IV) linear probability models. We also controlled for legal and

7
institutional differences across countries and over time, including accounting
conservatism, accounting disclosure, debt enforcement, regulation of entry, procedural
formalism of dispute resolution and property protection rights, creditor rights, stock
market capitalization, and the European Union convergence. Moreover, our results are
not driven by alternative explanations, such as: i) the holding period of the different types
of VC investors; ii) the potential signaling effect of GVC towards IVC investors; iii) the
firm's financial structure and net cash-flow ratio; iv) the investment stage; and v) the
distance between the VC investor and the target company.
The paper is organized as follows. Section 2 discusses issues associated with stand-
alone GVC investments versus syndicated GVC-IVC investments. Section 3 describes
the data. Section 4 explains the methodology. Section 5 presents the results and
robustness tests. Section 6 tests whether our results are driven by alternative explanations.
Section 7 concludes.
2. Governmental VC Funds and Government-Private Partnerships
In this section we consider three related issues. First, why might GVCs have
differential exit performance results relative to IVCs? Second, why might the syndication
of GVCs and IVCs impact exit performance? Third, why might the structure in terms of
the size and institutional heterogeneity of the syndicate on which GVCs and IVCs operate
influence exited performance?
The venture capital literature has identified three primary reasons why GVCs may
perform worse than IVCs. First, GVCs are created by statute or some other political and
regulatory process, and not through private negotiations among contracting parties. In the
case of limited partnership venture capital funds, for example, institutional investors (as
the limited partners) and the fund manager (as the general partner) contract with each
other to efficiently set the terms upon which the funds will be invested into
entrepreneurial firms. These covenants include terms such as restrictions on the size of
investments, use of debt, co-investment, public disclosure of fund matters, and no-fault
divorce provisions, among other things. These clauses mitigate agency problems in fund
management, and hence facilitate maximization of returns and investee performance.
The frequency of use of these clauses appropriately and efficiently depends on economic,

8
human capital, and institutional conditions (see Gompers and Lerner, 2004 for US
evidence, and Cumming and Johan, 2006, 2013 for international evidence). By contrast,
GVC covenants are determined by regulators, typically have no resemblance to the
covenants used by IVCs, do not vary over time and across fund managers, and are hence
much less efficient than IVC covenants (Cumming and MacIntosh, 2007). Second, GVCs
are believed to have less efficient compensation terms relative to IVCs. IVCs typically
are structured with a 2% fixed fee (based on committed capital) and a 20% performance
fee, with hurdle rates and clawbacks in the event of poor performance. These fee terms
are contractually negotiated and vary depending on economic conditions and the
characteristics and experience of the fund managers (see Gompers and Lerner, 2004, for
US evidence, and Cumming and Johan, 2013, for international evidence). GVCs, by
contrast, are reputed6 to have compensation terms that are comparatively invariant across
managers and funds, and invariant over time. As such, agency problems in effort are
exacerbated among GVCs, and GVCs face employee retention problems among better
fund managers that show promise and generate outside offers. Third, GVCs have a lack
of independence in decision making. IVCs, by contrast, are legally independent by virtue
of the limited partnership structure – limited partners do not get involved in the day-to-
day operation of the fund, otherwise they risk losing their limited liability status. GVCs
are much different, and have been known to face pressure to invest in marginal quality
projects, as well as geographically remote projects. Relatedly, while IVCs regularly
replace founding entrepreneurs as the CEO and have contractual rights to do so
(Cumming, 2008; Cumming and Johan, 2013), GVCs face political pressure to not fire
founding entrepreneurs and risk political problems if they do so. Furthermore, GVCs face
pressure to pursue non-financial related goals, such as employment maximization
(Cumming and MacIntosh, 2007).
There are a number of reasons why GVC-IVC syndicated relations may enhance
performance and overcome the issues identified immediately above. Following the
ordering of the three problems with GVCs identified above, the first issue involves
limited partnership covenants. By syndicating with IVCs, the investee firms financed by
GVCs still enjoy the structural advantages of IVC limited partnerships, which are not
6 Unfortunately there does not exist data or empirical studies on this point. Further research is warranted.

9
compromised by sole financing with a less efficient GVC structure. Second, investee
firms are likewise not compromised by sole financing from GVCs with less efficient
compensation terms, and enjoy the benefits associated with IVC compensation terms. To
the extent that GVC and IVC efforts are substitutable for growing the entrepreneurial
firm, the disadvantages of inefficient GVC compensation can be significantly mitigated.
Third, decision making is independent among IVCs (i.e., not subject to influence from
institutional investors), and not subject to political pressure. This independence mitigates
the agency problems of inefficient decision making associated with political pressure
from government bodies affecting GVC investment decisions. Finally, an advantage of
the GVC-IVC partnership is that the independent sources of networks and contacts that
can help the entrepreneurial firms grow are more expansive than merely an IVC
syndicate. GVCs would be expected to have access to governmental contacts that may
beneficial to the entrepreneurial firm, which could include government-related suppliers
and customers, and enable streamlined and faster regulatory approval of business matters
that are in the entrepreneurial firm’s interest. GVCs enhance IVC value added by
expanding the scope of networks and enabling connections to government-related
suppliers and customers that could expand the investee firm’s set of opportunities to
maximize growth. In short, because political connections are valuable, and because IVCs
can mitigate the cost of inefficient GVC structures, IVC-GVC syndicated partnership are
expected to enable entrepreneurial firms perform better.
Finally, there are a number of reasons why the structure of the syndicate in terms of its
size and institutional heterogeneity on which GVCs and IVCs operate might influence
exited performance. On the negative side there are two factors to consider. First, larger
funds may give rise to diseconomies of scale and limited attention problems where fund
managers sit on too many boards of directors, not maximizing their value-added provided
to any single investee (Cumming and Dai, 2011). Second, there can be free-riding
amongst syndicated VCs, whereby if the effort of one VC is substitutable with that of
another then overall value-added is mitigated as VCs are in conflict with one another in
terms of who is responsible for assisting the investee firm. Nevertheless, there are five
factors to consider on the positive side (each of these positive outcomes is summarized in
Gompers and Lerner, 2004). First, syndication improves decision making and thereby

10
mitigates adverse selection problems, given different individuals with more diverse
backgrounds (as would be expected among individuals among GVCs and IVCs) have
different expertise to carry out more effective due diligence overall. Second, syndication
facilitates improved value added where the effort of different VCs are complementary.
Third, diverse syndicated VCs may collude to overstate the quality of the entrepreneurial
firm and hence maximize exit opportunities in terms of who will buy the entrepreneurial
firm and at what price. Fourth, diversity in syndication enables diversification and risk
sharing, which in turn facilitates investment decisions that may not otherwise have been
made, and hence improves the scope of feasible outcomes. Finally, diversity in syndicates
mitigates hold-up and renegotiation problems vis-à-vis the entrepreneurial firm in each
staged investment round, and hence improves incentives for the entrepreneur to maximize
firm value and exit possibilities.
In sum, prior literature is consistent with the view that GVCs investing by themselves
are expected to have worse exit performance, GVCs syndicated with IVCs are expected
to perform better, and that the size and structure of the syndicate can affect agency
problems amongst VCs and between VCs and entrepreneurs that can in turn affect exit
performance. Below, we test these propositions by examining for the first time the
relation between syndicate structure and exit performance.
3. Data
3.1. Data Collection Procedure
In this work, we use the VICO database. The VICO database represents the final
output of a research project funded by the 7th Framework Programme of the European
Commission. The VICO database includes data on young high-tech VC-backed and non-
VC-backed (but potentially targetable by VC investors) companies that: i) are located in
seven European countries (Belgium, Finland, France, Germany, Italy, Spain and the
United Kingdom); ii) are less than 20 years old in 2010; iii) were borne as independent
firms (i.e., not controlled by other business organizations); and iv) operate in high-tech
(manufacturing and services) industries (see Table 1). The VICO database includes
surviving and non-surviving companies (i.e., companies that ceased operations or were
acquired), whether they are VC-backed companies or not.

11
Overall, the VICO database consists of 8,370 firms, 759 of which are VC-backed (for
a full description of the database, see Bertoni and Martí, 2011). In this work, the observed
time-span is 1991-2010.
As regards the identification of VC-backed companies, several proprietary and
commercial sources were used. Country-specific proprietary sources are the yearbooks of
the Belgium Venture Capital and Finnish Venture Capital Associations, the ZEW
Foundation Panel (Germany), the RITA directory and Private Equity Monitor (Italy), the
José Martí Pellón Database (Spain), and the Library House (now Venture Source, UK).
Commercial sources are the Thomson One database, VCPro-Database, and Zephyr.
Moreover, whenever possible, the data were cross-checked with those available from
public sources (e.g., websites and annual reports of VC investors, press releases and press
clippings, and initial public offering prospectuses).
This data collection process allows us to ensure that the VICO database offers an
extensive representation of the European population of VC-backed companies (for more
details, see European Parliament, 2012). Even though the most popular database in the
VC literature is the Thomson One database, this latter is known to under-represent
investments made by non independent VCs (Ivanov and Xie, 2010: p. 135), especially in
Europe. As common in the VC literature, the VICO dataset includes seed, early-stage,
late-stage and expansion capital investments; while, LBOs, real estate, distressed debt
funds and other private equity investments are not included.
Due to the necessity of a minimum number of post-investment observations to
evaluate the impact of VC on the performance of portfolio companies, the VICO database
includes VC-backed companies which obtained their first round of VC funding between
1994 and 2004 and were less than 10 years old at that time.
For the identification of non-VC-backed companies, we used the Amadeus database.
All available vintage years of Amadeus were used to build the population such that non-
surviving companies are included. Analogously to VC-backed companies, specific
country-specific proprietary sources were used in order to improve the coverage of the
dataset (e.g., Creditreform in Germany, the database of the Union of Italian Chambers of
Commerce in Italy).

12
A complete description and documentation of the procedures and sources used in the
data gathering process and on all of the portfolio company-, investment-, and investor-
level variables included in the VICO dataset, is provided in Bertoni and Martì (2011).
3.2. Descriptive Statistics
To classify companies backed by different types of VC investors, we focus on the year
of the first VC investment. We removed from the dataset companies that received a first
investment by corporate, bank-affiliated and university-sponsored VC investors; or by
VC investors that have missing name, address and/or contact information in the VICO
database. It is worth noting that we removed such companies if and only if corporate,
bank-affiliated and university-sponsored VC investors did not syndicate with IVCs or
GVCs at the time of the first VC investment. We used this criterion to let the
counterfactual of companies not backed by IVCs, GVCs or mixed IVC-GVC syndicates
as clean as possible. Thus, among VC-backed companies, we keep companies that
received a first investment by IVCs, GVCs or a mixed IVC-GVC syndicate. According to
these three “states of nature”, we classify companies as IVC-backed, GVC-backed or
SYND-backed, respectively.7
The breakdown by country and industry of IVC-backed, GVC-backed, and SYND-
backed companies is provided in Table 1.
The representation of IVC-backed companies reflects the development of financial
markets across countries, being larger in the UK (128 IVC-backed companies, 30.48% of
the total IVC-backed companies), followed by Germany (19.76%) and France (13.81%).
The situation is different by looking at the representation of GVC-backed companies,
where Spain has the greatest share (24.41%), followed by Germany (16.54%) and
Finland (16.54%). France has the greatest share of SYND-backed companies (35.48%)
followed by Germany (17.74%) and Belgium (14.52%). Software represents the main
target industry both for IVCs (39.76%) and for GVCs (32.28%). Biotechnology &
Pharmaceutical represents the second target market both for IVCs (18.33% in conjunction
with ICT manufacturing) and GVCs (27.56%). SYND-backed companies show the same
industrial representation of GVC-backed companies: the first industry is software (50%)
7 Our definition of syndication closely adheres to the definition provided by Gompers and Lerner (2004).
Given that our analysis is not at round-level, we implicitly assume that IVCs and GVCs syndicate when
they invest in the same portfolio company in the same year.

13
followed by Biotechnology and Pharmaceutical (24.19%) and ICT manufacturing
(16.13%).
[Table 1 about here]
Table 2 illustrates the distribution of positive (IPOs and trade-sales) and negative
(liquidations) exits according to the type of VC investor at the time of the first VC
investment. The highest percentage of publicly- or privately-traded VC-backed
companies received a first investment by an IVC investor (74.77%), followed by a mixed
IVC-GVC syndicate (14.02%) and a GVC investor (11.21%). In terms of liquidated VC-
backed companies, the highest percentage of them was initially invested by an IVC
investor (69.61%). GVC-backed companies represent more than one fifth of liquidated
VC-backed companies (21.57%). While, SYND-backed companies represent less than
one tenth of liquidated VC-backed companies (8.82%).
[Table 2 about here]
4. Empirical Framework
We compare the effects of IVC-, GVC- and SYND-backing on the probability of a
successful/unsuccessful exit using a multinomial logit model. The use of multinomial
logit models is the most common choice in the literature about the impact of VC on exit
(e.g., Cumming et al., 2006; Cumming, 2008; Cumming and Johan, 2013). We estimate
the following multinomial logit model:8
Exit Type = f(VC backing, VC size, VC diversity, Controls). (1)
8 In order to take into account the panel nature of the VICO database, standard errors are clustered at
portfolio company-level.

14
Exit Type is a categorical variable and assumes three different values: 1 for positive
outcomes (IPOs or trade-sales),9 2 for liquidations, and 0 for the baseline category
(companies that did not go public, were not acquired and are still in operation). The
likelihood to fall in the outcome j is p� = exp�Xβ�� /[1 + ∑ exp�Xβ������ ]. Exit type is
always equal to zero for all companies that did not go public, were not acquired and are
still in operation. For companies that went public or have been acquired, it is zero in all
years prior to the first positive event (IPO or trade-sale), and it equals one in the year of
the first positive exit. It is set to missing in the following years. In the same way, for
liquidated companies, Exit type is zero in all years prior to liquidation, and it equals two
in the year of liquidation. It is set to missing in the following years.
VC backing includes 3 step dummy variables (IVC; GVC; SYND) which switch from 0
to 1 in the year following the first VC investment. Similarly to Chahine et al. (2012), we
include VC size and VC diversity. VC size represents the yearly number of VC investors
backing the young high-tech company at time t-1. VC diversity looks at the VC affiliation
(i.e., independent, corporate, bank-affiliated, university-sponsored, governmental) and
counts the number of sub-groupings of each VC type backing the young high-tech
company at time t-1. Controls includes several classes of variables at portfolio company-
level. First, we include a set of country dummies, (2-digit SIC) industry dummies, and
year dummies. Second, we include the logarithm of firm age (measured by the years
since firm foundation) and its squared term: Age and Age2. Third, following Chahine et
al. (2012), we include a bubble dummy (Bubble) which is equal to 1 whether the first VC
investment was received in the years 1999 or 2000. Moreover, we take into account the
time elapsed since the first VC receipt (proxied by the number of years since the first VC
investment): TimeFromVC. Fourth, we introduce a measure of firm size (Size), proxied
by the logarithm of headcount at time t-1. Fifth, we control for the operative performance
through a measure of profit margin (measured by the ratio net income/sales) at time t-1
(Richard et al., 2009): ProfitMargin. Note that net income and sales value have been
deflated by the Consumer Price Index (source: Eurostat; reference year: 2005). Finally,
9 In the VC literature is quite common to pool together IPOs and trade-sales as positive exits. For instance,
see e.g., Cumming and Dai (2013) and Gompers et al. (2009).
15
we control for the innovative performance through the inclusion of the logarithm of the
patent stock at time t-1 (with yearly depreciation=0.15): PatentStock.
In Table 3, we report some descriptive statistics for IVC-backed, GVC-backed,
SYND-backed and non-VC-backed companies. In terms of VC Size, SYND-backed
companies show on average a higher yearly number of VC investors in their equity (3.3)
than IVC-backed companies (2) and GVC-backed ones (1.4). As to VC diversity, not
surprisingly, SYND-backed companies are on average financed by a higher number of
types of VC investors. The average is slightly higher than 2, meaning that generally when
governmental and independent VC operators syndicate is rare that other typologies of
investor (corporate, bank-affiliated and university-sponsored) join the syndicate. For
IVC-backed companies and GVC-backed ones the mean value of the variable is 1.4 and
1.2, respectively. Age distributions are similar across all companies (around 7 years old).
IVCs are more likely to invest during the bubble period than GVCs: more than (almost)
40% of IVC (SYND)-backed companies received their first VC investment in the period
1999-2000. SYND-backed companies are bigger than other companies: on average,
SYND-backed companies reach a size of about 39 employees, while headcount is 36 for
IVC-backed, 26 for GVC-backed, and 24 for non VC-backed companies. On average,
non VC-backed companies show a higher operating performance than VC-backed
companies (especially if compared to SYND-backed ones). Finally, SYND-backed
companies are on average more innovative (1.9 patents) than GVC-backed companies
(0.7 patents), IVC-backed companies (0.4 patents) and non VC-backed ones (0.2 patents).
[Table 3 around here]
5. Findings
5.1. Results
Results from the multinomial logit estimates are shown in Table 4. In columns I and
III, we show the results related to the likelihood of a positive exit (IPO or trade-sale);
while, in columns II and IV, we show the findings related to the likelihood of a negative
exit (liquidation). In columns I and II, we show the estimates related to the baseline
model. The aim is to estimate the (potentially) different impact of IVC-, GVC-, and

16
SYND-backing on exit, whatever the number/heterogeneity of the investors in the equity
of the focal young high-tech company. In columns III and IV, we insert VC Size and VC
Diversity to investigate: i) what is their role on exit performance; and ii) whether the
baseline results of IVC-, GVC-, and SYND-backing are unchanged or not.
It is worth noting that we report the relative-risk ratios (instead of the estimated
coefficients). This implies that a coefficient greater than 1 must be interpreted as a
positive impact on the focal exit performance. In the same way, a coefficient smaller than
1 must be interpreted as a negative impact on the focal exit performance.10
In column I, our empirical findings highlight the superior ability of IVCs to reach a
positive exit, if compared to GVCs. The impact of IVCs on the likelihood of an IPO or a
trade-sale is positive and statistically significant at 1%. The coefficient of the impact of
GVC is of lower magnitude and it is not statistically significant. SYND-backed
companies have a higher likelihood to reach a positive exit than IVC-backed companies
(and GVC-backed ones). However, the Wald test does not reject the null hypothesis of no
difference between the coefficients of IVC and SYND. The impact of mixed IVC-GVC
syndicates is positive and statistically significant at 1%. In column II, we see that VC-
backing does not influence the likelihood of liquidation, whatever the type of VC-
backing at the time of the first investment.
In column III, we turn to our augmented model that includes VC Size and VC
Diversity. The positive impact of IVC-backing and SYND-backing on the likelihood of a
positive exit is not found to be influenced by syndicate size (VC size) and institutional
heterogeneity (VC diversity). The impact of IVC-backing is still positive and statistically
significant at 1% (the magnitude is slightly lower than that in column I), and the
economic significance is such that an IPO or a trade-sale is 87.3% more likely when an
IVC investor is involved. The coefficient of the impact of GVC is still negligible and of
lower magnitude than that of IVC-backing. Again, SYND-backed companies have a
higher (but not statistically different) likelihood to reach a positive exit than IVC-backed
10
Relative risk ratios offer an immediate interpretation of the magnitude of the effects. For example, a
relative risk ratio of 2 means that on average a one unit increase in the given variable increases twice the
probability of observing the outcome of interest with respect to the baseline category (when the other
variables in the model are held constant) (Wooldridge, 2002). Note that in the main text we also report the
marginal effects for the main variables of interest.

17
companies (and GVC-backed ones). The impact of mixed IVC-GVC syndicates is
positive and statistically significant at 1%, and the marginal effect shows a 117.7%
greater likelihood of a positive exit. The magnitude of the impact is slightly lower than
that in column I. Also the results on liquidation (column IV) are fully in line with those of
column II.
Results on VC Size and VC Diversity are interesting. While they have a negligible
impact on the likelihood of a positive outcome (column III), their impact on liquidation is
dramatic. The higher is the yearly number of VC investors in the equity of the focal
young high-tech company, the lower appears the likelihood of a liquidation. This effect is
statistically significant at 5%. The higher is the heterogeneity of the syndicate - in terms
of different types of VC investors involved - the higher is the likelihood of a liquidation.
This effect is statistically significant at 1% and its magnitude is extremely high (greater
than 6).
[Table 4 around here]
As regards the control variables, we find a positive linear effect of firm age on the
likelihood of a positive exit, while an inverted U-shaped effect on liquidation. Quite
surprisingly, the coefficient of Bubble is always negligible: it seems that the time of the
first VC investment does not exert any statistically significant influence on the exit
outcome. The effect of Size is always statistically significant at 1%: bigger (smaller)
firms are more likely to reach a positive (negative) exit. A higher level of ProfitMargin
positively impacts (at 5%) the likelihood of a positive exit; while, its impact on the
likelihood of liquidation is negligible. The higher is the time elapsed since the first VC
investment, the higher is the likelihood of an IPO or a trade-sale. This effect is
statistically significant at 5% in both columns I and III. This effect is also explored
through the lens of a non-parametric hazard rate analysis performed in Figure 1. On the
horizontal and vertical axes, there are the firm age and the estimated unconditional
likelihood of a positive exit, respectively. The figure shows a quasi-monotonic increasing
positive relationship between the time elapsed since the first VC investment and the
likelihood of an IPO or a trade-sale until the firm age is ten years old. The hazard rate

18
(the instantaneous probability of the positive outcome) maintains high between the age of
ten and thirteen years old and then starts decreasing.11
Finally, the impact of PatentStock
on exit is positive. More specifically, there is a positive and statistically significant effect
(at 5%) on the likelihood of a positive exit in column I. Instead, this effect is only close to
significance (p-value = 0.102) even though is still positive in column III. Conversely, the
effect of a firm’s patent stock on the likelihood of a liquidation is negligible.
[Figure 1 around here]
[Figure 2 around here]
5.2. Selection Bias and Endogeneity Issues
Our results seem to show that private independent VCs (and mixed IVC-GVC
syndicates) are better at developing their portfolio companies than governmental VCs.
However, our multinomial logit approach might not take properly into account selection
and endogeneity issues. Firstly, our results might be driven by a potential sample
selection problem: private independent VCs (and mixed IVC-GVC syndicates) may be
simply better at choosing and funding the most promising entrepreneurial firms.
Secondly, in a competition to fund the best entrepreneurial firms, private independent
VCs (and mixed IVC-GVC syndicates) may be more willing to offer the entrepreneur a
better deal than GVCs do. Lastly, GVCs may systematically target portfolio companies
which are overlooked by IVCs, and so the empirical comparison of IVC-backed and
GVC-backed companies might be misleading (see also Section 6). It is worth noting that
this latter problem should not be relevant in our context because of the presence of mixed
IVC-GVC syndicates. Whatever the source of potential bias, the econometric problem is
related to unobservable (or omitted) variables which explain both the likelihood to
receive VC and the likelihood of exit (either positive or negative), and so a spurious
correlation between the variables of interest (IVC, GVC, SYND, VC size, VC diversity)
11
In Figure 2, we also perform the same non-parametric hazard rate analysis on the estimated unconditional
likelihood of a negative exit. The figure shows a quasi-monotonic increasing positive relationship between
the time elapsed since the first VC investment and the likelihood of a liquidation until the firm age is nine
years old. Then, the hazard rate starts decreasing.

19
and exit might drive our results. To tackle these issues, we put in use five different
identification strategies.
First, similarly to Chemmanur et al. (2011) and Croce et al. (2013), we inserted in our
main specifications (Table 4, columns III and IV) three variables (IVCpre, GVCpre,
SYNDpre), which are dummies that equal 1 in the years prior to the first VC investment -
provided by an independent VC investor, a governmental VC fund or a mixed IVC-GVC
syndicate, respectively - and 0 otherwise. The coefficients of such variables represent the
screening activity performed by IVCs, GVCs and mixed IVC-GVC syndicates,
respectively. We tried several (alternative) model specifications, with the three "VCpre"
dummy variables that equal 1: i) from t-2 to t - with t representing the year of the first VC
investment - and 0 otherwise (Croce et al., 2013); ii) from t-4 to t - with t representing the
VC investment year - and 0 otherwise (Chemmanur et al., 2011); or iii) in all years prior
to the first VC investment. Moreover, we also substituted each "VCpre" dummy variable
with a series of impulse dummies from the year t to 5 years before the first VC funding
(for a similar procedure, see Grilli and Murtinu, 2014a). Whichever the model
specification, our main results are stable and are not influenced by the potentially
different screening activity performed by IVCs, GVCs and mixed IVC-GVC syndicates
(results are available upon request from the authors). The coefficients of the "VCpre"
dummy variables are always smaller than one and statistically significant at 1%,
whichever the type of the VC investor.12
Thus, we found that VC-backed companies are
less likely to have a positive or a negative exit than non-VC-backed companies in the
years before VC funding. This (apparently counter-intuitive) finding is in line with the
evidence based on the VICO dataset (e.g., Croce et al., 2013) and more generally
confirms the findings of other EU-based studies (see Grilli, 2014 for a review), that
12
We performed non-linear tests on the difference among the coefficients of IVCpre, GVCpre, and
SYNDpre. The test statistics reported below refer to the model specification where the three "VCpre"
dummy variables equal 1 in all years prior to the first VC investment. As regards the negative exits, such
differences are never statistically significant: i) IVCpre - GVCpre = 0, P>|z|=0.515; ii) IVCpre - SYNDpre =
0, P>|z|=0.769; iii) SYNDpre - GVCpre = 0, P>|z|=0.976. As regards the positive exits, the tests on the
differences are the following: i) IVCpre - GVCpre = 0, P>|z|=0.030; ii) IVCpre - SYNDpre = 0,
P>|z|=0.615; iii) SYNDpre - GVCpre = 0, P>|z|=0.049. The most relevant issue is that the two statistically
significant differences are negative, i.e. the IVC-backed and SYND-backed companies are less likely to
have a positive exit than GVC-backed companies in the years before the first VC investment. So, the
negligible impact of GVCs on the positive exit performance of their portfolio companies cannot be
explained by the means of their supposed less effective screening activity than the one performed by IVCs
and mixed IVC-GVC syndicates.

20
highlight a modest “pick-winner” function performed by the European VCs compared to
the US counterparts. As explained by Croce et al. (2013, p. 503): 'This difference in
screening abilities between US and European VCs might be explained by the higher level
of development of US VC market (than that of the European VC market) in financing
entrepreneurial firms'. In the same vein, Hege et al. (2003, p.4) claim that: 'venture capital
firms in Europe [...] seem to be still lagging in their capacity to select projects. [...] US
VCs have better screening skills (due to their greater experience) than European ones. It
follows that US VCs are better at sorting out good projects from bad ones'.
Second, we tried to control for the quality of the entrepreneurial firm (especially in the
pre-VC period for VC-backed companies). Following the most up-to-date corporate
finance and entrepreneurial finance literatures, in our main specifications (Table 4,
columns III and IV) we inserted: i) a variable (PastSalesGrowth) capturing the growth in
sales value from the time t-2 to the time t-1 (see Chemmanur et al., 2010 for the use of
past sales growth as a proxy of firm quality); and ii) the ratio between intangible assets
and total assets (ITA) at time t-1 (according to Croce et al., 2013, this variable controls
for the potentially different growth orientation between VC-backed and non-VC-backed
companies before the first VC investment, and among the different types of VC-
backing).13 Results are shown in Table 5. We found a negligible impact of both variables
on the likelihood of both positive and negative exits. This result seems to confirm the low
screening ability of European VCs, whichever the type of VC backing.
[Table 5 around here]
Third, we estimated a multilevel latent variable model for unordered categorical
responses, in which the latent variables are modeled as random effects.14
We used the
same model specification as shown in Eq. (1). The results are shown in Table 6 (columns
I and II) and are in line with those exposed in Table 4 (columns III and IV). In column I,
13 Sales value, total assets and intangible assets have been deflated by the Consumer Price Index (source:
Eurostat; reference year: 2005).
14 For computational problems, we cannot include in our model specification the industry dummies and
country dummies. Instead, year dummies are not included because in this multilevel model each firm-year
observation is a cluster.

21
the impact of IVC-backing is still positive and statistically significant (at 1%) on the
likelihood of a positive exit, as well as the impact of SYND-backing (statistical
significance at 5%). As in Table 4, the magnitude of SYND-backing is greater than that
of IVC-backing, but the Wald test does not reject the null hypothesis of no difference
between the two coefficients. The impact of GVC-backing is still negligible. Also in this
case, syndicate size and institutional heterogeneity do not exert any impact on positive
exit. As regards negative exits (column II), there is no impact of VC-backing per se.
However, as in Table 4, there is a positive impact (statistically significant at 10%) of the
institutional heterogeneity of the syndicate on liquidation. The only exception of these
results when compared to those shown in Table 4 is the negligible impact of the yearly
number of VC investors on the likelihood of a liquidation.
Fourth, for each of the three “states of nature” (IVC-backed, GVC-backed or SYND-
backed companies), we performed a one-to-one propensity score matching without
replacement in the year of the first VC investment to match each VC-backed company to
a similar non-VC-backed twin firm (for applications of matching procedures in the VC
literature, see e.g. Megginson and Weiss, 1991; Chemmanur et al., 2011; Puri and
Zarutskie, 2012; Tian, 2012; Croce et al., 2013).15
In estimating propensity scores, we
resorted to a logit model with the same model specification used by Puri and Zarutskie
(2012): firm age, firm size, country and industry dummies. The only obvious difference is
that we use European countries (and not US regions) as geographic controls.16
Then, we
estimated two panel probit models in which the dependent variables are the likelihood of
a positive exit and the likelihood of a negative exit, respectively. We used the same
model specification as shown in Eq. (1). The results are shown in Table 6 (columns III
and IV) and are in line with those exposed in Table 4 (columns III and IV). As regards
the likelihood of a positive exit, the impact of IVC-backing is positive and statistically
significant (at 1%). In the same way, SYND-backing has a positive and statistically
significant (at 5%) effect. As in Table 4, the Wald test does not reject the null hypothesis
15
We also performed the same matching procedure in the year before the first VC investment. Results are
almost unchanged and are available upon request from the authors.
16 Following the suggestions of Dehejia and Wahba (2002), we randomized our dataset before performing
the matching procedure. We preferred a matching procedure without replacement due to the sufficient
number of non VC-backed companies (Dehejia and Wahba, 2002), which can be used as potential matches
of VC-backed companies.
22
of no difference between the two coefficients, even though the magnitude of SYND-
backing is greater than that of IVC-backing. The impact of GVC-backing is still
negligible. Also in this case, the size and the institutional heterogeneity of the syndicate
do not exert any impact. As regards negative exits (column IV), there is no impact of
IVC-backing and GVC-backing per se. However, there is a positive impact of SYND-
backing on firm liquidation (significant at 5%). This represents the only exception when
comparing these results with those shown in Table 4. As in Table 4, the likelihood of firm
liquidation is impacted negatively by the yearly number of VC investors (statistical
significance at 1%) and positively by the institutional heterogeneity of the syndicate
(statistical significance at 5%).
[Table 6 around here]
Fifth, we resorted to an Instrumental Variables (IV) approach. More specifically, we
estimated two pooled IV linear probability models (for a similar procedure, see Cornelli
et al., 2013) with standard errors clustered at portfolio company-level in which the
dependent variables are the likelihood of a positive exit and the likelihood of a negative
exit, respectively.17 We have two sets of covariates included in first-stage equations,
where these equations capture the three possible VC-backing statuses of entrepreneurial
firms (IVC-, GVC- and SYND-backing): i) a set of control variables which are also
included in second-stage equations; and ii) a set of exclusion restrictions which are not
included in second-stage equations. The control variables are: country dummies, industry
dummies (2-digit SIC), year dummies, Age, Age2, Bubble, TimeFromVC, Size,
ProfitMargin, PatentStock. The exclusion restrictions are: an industry-level (3-digit SIC
code) indicator on the importance of universities and higher education institutes as
sources of external knowledge, calculated as the average value reported by the small
firms (with less than 250 employees) that participated in the Innovation Benchmarking
Survey jointly administered by the University of Cambridge and the Massachusetts
17
The use of an IV probit model is prevented in our context given the discrete nature of our supposedly
endogenous variables (IVC, GVC, SYND). The point is made clear by Wooldridge (2002, p. 472) who also
suggests how linear probability models estimated through a two-stage least squares estimator represent in
our case a reliable method (see also Angrist, 2001).

23
Institute of Technology in 2004 (Science); two industry-level (3-digit SIC code)
indicators reflecting the effectiveness of formal (registration of design, trademarks,
patents, confidentiality agreements, copyright) and informal (secrecy, complexity of
design, lead-time advantage on competitors) mechanisms to protect innovation,
calculated as the average values reported by the small firms (with less than 250
employees) that participated in the Innovation Benchmarking Survey jointly administered
by the University of Cambridge and the Massachusetts Institute of Technology in 2004
(Formal, Informal); the ratio between government expenditures and GDP at country-level
at time t-1 (GovExp_GDP: source: Eurostat); the IVC fundraising at country-level at time
t-1 (IVC_fundraising: source: Thomson One), winsorized at the 1st and 99th percentiles;
the overall equity capital invested at country-level at time t-1 (Equity: source: Thomson
One), winsorized at the 1st and 99th percentiles; the GDP growth at country-level
between time t and time t-1 (GDP_Growth; source: World Bank); the real GDP at
country-level at time t-1 (GDP; source: World Bank), deflated by using the consumer
price index (year 2005 is the reference year; source: Eurostat); and a dummy that equals 1
in the post-bubble period for ICT investments (PostBubble_ICT). It is worth noting that
we employed this fifth identification strategy to estimate our baseline model (Table 4,
columns I and II), because of the difficulty to find exclusion restrictions which acted as
instruments for VC size and VC diversity. The results are shown in Table 6 (columns V
and VI) and are in line with those exposed in Table 4. As regards the likelihood of a
positive exit (column V), the impact of IVC-backing is positive and statistically
significant (at 10%). In the same way, SYND-backing has a positive and statistically
significant (at 10%) effect. As in Table 4, the Wald test does not reject the null
hypothesis of no difference between the coefficients of SYND-backing and IVC-backing.
GVC-backing does not exert a statistically significant impact. As regards negative exits
(column VI), there is still no impact of VC-backing, whatever the type of VC-backing. In
the last rows of Table 6 (columns V and VI), we reported the F statistics related to the
first-stage regressions of the IV procedure. Whatever the dependent variable at the
second-stage, in each first-stage regression the null hypothesis of weak instruments is
rejected: the conventional threshold of 10 (Staiger and Stock, 1997) is always passed.
5.3. Legal and Institutional Issues

24
In our main estimations (Table 4, columns III and IV), we do not account for legal and
institutional differences across countries and over time. However, the countries included
in the VICO dataset are very different with respect to accounting conservatism,
accounting disclosure, debt enforcement, regulation of entry, procedural formalism of
dispute resolution and property protection rights, and creditor rights. In unreported
regressions, we removed the country dummies from our main estimations and added the
following country-level variables: i) an index of accounting conservatism, provided by
Cumming and Walz (2010; Country Earnings Aggressiveness Index in their Table I); ii) a
measure of accounting disclosure in private firms, provided by Cumming and Walz
(2010; Private Firm Accounting Indices in their Table I); iii) an efficiency index of debt
enforcement, provided by Djankov et al. (2008; Efficiency in their Table 2); iv) three
indexes of regulation of entry, provided by Djankov et al. (2002; Number of procedures,
Time, and Cost in their Table II): number of procedures, time and costs that start-ups
must bear before starting their operations; v) an index of procedural formalism of dispute
resolution, provided by Djankov et al. (2003; Formalism index in their Table IIb); and vi)
an index aggregating creditor rights, provided by Djankov et al. (2007; Creditor rights in
their Table 1). We also considered other indices from La Porta et al. (1998). Whichever
the country-level variable employed, the results mirror those exposed in Table 4, in terms
of both sign and magnitude. The impact of each country-level variable is fully in line
with the evidence shown in the most relevant works in the literature on accounting,
financial economics, economics, and political economy.
Furthermore, as shown in Table 1, the countries with the highest percentage of IVC-
backed and GVC-backed companies are the UK and Spain, respectively. In 2010, the
stock market capitalization/GDP ratio is about 85% in Spain, while it is 136% in the UK.
Therefore, everything else being equal, an entrepreneurial firm should have a lower
likelihood of becoming public in Spain than in the UK. Given that IPO is one of the two
indicators of positive exit, we should check if a different degree of development of
financial markets could be responsible for our findings. To test this, from our main
estimations (Table 4, columns III and IV) we removed the country dummies and year
dummies and added the country-level ratio between the stock market capitalization and

25
the GDP at time t (source: World Bank; time period: 1991-2010). Also in this case, the
results are fully in line with those shown in Table 4.
Lastly, during the time period of our study, the European countries included in the
VICO dataset started with national laws that were quite different, but then such laws have
been slowly converging because of the European Union convergence. Thus, from our
main estimations (Table 4, columns III and IV) we removed the country dummies and
year dummies and added an index of economic integration/convergence within the
European Union at time t available for the countries included in the VICO dataset in the
period 1999-2010, provided by König and Ohr (2013; Overall integration in their Table
2). Alternatively, from our main estimations (Table 4, columns III and IV) we substituted
the country dummies and year dummies with their cross-products. As above, whichever
the model specification employed, the results are almost the same as those shown in
Table 4. All estimates are available upon request from the authors.
5.4. Robustness Checks
We performed several checks to test the robustness of our econometric results. Even
though a multinomial logit approach is the most common choice in the literature on VC
and exit (see Section 4), this methodology shows some weaknesses. First, multinomial
logit models hinge on a strong assumption: the irrelevance of independent alternatives
(IIA). To solve this problem, we estimated a multinomial probit regression with the same
model specification as shown in Eq. (1). The results are shown in Table 7 (columns I and
II). It is worth noting that we report the estimated coefficients (instead of the relative-risk
ratios as in Table 4). In column I, as to the variables of interest (IVC, GVC, SYND, VC
size, VC diversity), the results are fully in line with those exposed in Table 4. The impact
of IVC-backing is still positive and statistically significant (at 1%) on the likelihood of a
positive exit, as well as the impact of SYND-backing. This latter is statistically
significant at 5% and its magnitude is higher than that of IVC-backing. As in our main
results, the Wald test does not reject the null hypothesis of no difference between the two
coefficients of IVC and SYND. The impact of GVC-backing on a positive exit is still
negligible. These results on positive exit are not found to be influenced by syndicate size
and institutional heterogeneity. As regards negative exits, in column II we see that VC-
backing has no impact, whatever the type of VC-backing. However, as in Table 4: i) the

26
higher is the yearly number of VC investors backing the focal portfolio company, the
lower appears the likelihood of a liquidation (significant at 5%); ii) the higher is the
institutional heterogeneity of the syndicate, the higher is the likelihood of a liquidation
(significant at 1%).
[Table 7 around here]
Second, even though we clustered the standard errors at portfolio company-level, our
pooled multinomial logit models might not take properly into account the panel nature of
our dataset. So, we estimated two semi-parametric Cox-type survival models, in which
the dependent variables are the hazard rate of a positive exit and the hazard rate of a
negative exit, respectively. Firm age is the random variable to define the time of 'death'
(i.e., first exit in a competing risk scenario). The choice to model non parametrically the
hazard rates is due to their non-monotonic shape. As a matter of fact, the two hazard rates
of positive and negative exits are increasing in the first years since firm foundation and
then decreasing with firm age (see Figure 1 for positive exits and Figure 2 for negative
exits).18
The results are shown in Table 7 (columns III and IV) and are quite in line with
those exposed in Table 4. As regards positive exits (column III), the impact of IVC-
backing is positive and statistically significant (at 1%), as well as the impact of SYND-
backing (significant at 5%). In this case, the magnitude of IVC-backing is slightly greater
than that of SYND-backing. The impact of GVC-backing is still positive (as in Table 4)
but weakly significant (at 10%). Also in this case, results on positive exit are not
influenced by syndicate size and institutional heterogeneity. As regards negative exits
(column IV), there is no impact of VC-backing per se. However, as in our main results,
the yearly number of VC investors lowers the likelihood of a liquidation (statistical
significance at 5%). And, the institutional heterogeneity of the syndicate positively
impacts on the likelihood of a liquidation (statistical significance at 1%). Finally, we
performed other four robustness tests/sensitivity analyses. First, we substituted the
18
By construction, the logarithm of firm age and its squared term (Age and Age2) cannot be included in the
model specification.

27
variable Bubble with the variable Bubble 1998-2000. As shown in Table 8 (columns I and
II), the results are almost unchanged. More interestingly, the impact of the time of the
first VC investment is still negligible. Second, we tried alternative measures of operating
performance. In Table 8, we substituted the variable ProfitMargin with: i) the ratio
between the difference of sales value and payroll expenses and sales value (columns III
and IV); ii) the ratio between EBITDA and total assets (columns V and VI); iii) the ratio
between EBITDA and sales (columns VII and VIII); and iv) ROA - given by the ratio
between net income and total assets - (columns IX and X). Also in this case, the results
are almost unchanged. It is worth noting that sales value, payroll expenses, EBITDA,
total assets and net income have been deflated by the Consumer Price Index (source: Eurostat;
reference year: 2005). Third, in unreported regressions we inserted: i) a dummy variable
that equals 1 whether the focal young high-tech company reports a loss (negative EBIT)
in the year t-1 (Chahine et al., 2012); and ii) the ratio between current assets and total
assets at time t-1 (Chahine et al., 2012). Results are almost unchanged and are available
upon request from the authors. Note that EBIT, current assets and total assets have been
deflated by the Consumer Price Index (source: Eurostat; reference year: 2005). Finally,
according to Petersen (2009), we re-estimated the standard errors of the variables
included in our models through a double-clustering by country and year. Results are
almost unchanged and are available upon request from the authors.
[Table 8 around here]
6. Alternative Explanations
In this Section, we test whether our results (exposed in Table 4) can be driven by: i)
the (potentially different) holding period of the different types of VC investors; ii) a
potential signaling effect of GVC towards IVC investors; iii) the firm's financial structure
and net cash-flow ratio; iv) the investment stage; and v) the distance between the VC
investor and the target company.
6.1. Holding Period
VC investors provide value-adding services to their portfolio companies, and such
services are more valuable when VC investors are actively involved in a firm's

28
management. As claimed by Croce et al. (2013: p. 492): "During the holding period VCs
provide help in defining strategic planning, assistance in management recruitment and
compensation, access to their network of contacts (i.e. banks, suppliers and customers)
and expertise in operational planning [...] all of which become valuable resources for the
portfolio firm". Hence, if different types of VC investors are characterized by different
holding periods, i.e. different types of VC investors systematically hold their equity stake
for different time periods, our results might be driven by our (wrong) assumption to
model IVC, GVC and SYND as 3 step dummy variables which switch "permanently" from
0 to 1 after the first VC investment. For instance, the estimated strong impact of mixed
IVC-GVC syndicates might be related to the longer holding period of such mixed
syndicated investments than that of IVC and GVC investments.
In order to control for this fact, we replaced the above-mentioned 3 step dummy
variables (IVC, GVC, SYND) with 3 dummy variables: i) IVC_holding that equals one for
the years after obtaining the first VC investment by an IVC investor until the end of the
IVC investor's holding period, and zero otherwise; ii) GVC_holding that equals one for
the years after obtaining the first VC investment by a GVC investor until the end of the
GVC investor's holding period, and zero otherwise; and iii) SYND_holding that equals
one for the years after obtaining the first VC investment by a mixed IVC-GVC syndicate
until the end of the mixed IVC-GVC syndicate's holding period, and zero otherwise. The
results are shown in Table 9 (columns I and II) and are in line with those exposed in
Table 4. As regards the column I, the impact of IVC-backing is positive and statistically
significant (at 5%) on the likelihood of a positive exit. In the same way, SYND-backing
has a positive and statistically significant effect (at 1%). As in Table 4, the Wald test does
not reject the null hypothesis of no difference between the coefficients of SYND-backing
and IVC-backing, even though the magnitude of the former is greater than that of the
latter. As in Table 4, the impact of GVC-backing, and the size and the institutional
heterogeneity of the syndicate exert a negligible impact on the likelihood of a positive
exit. As regards the column II, there is no impact of IVC-backing and GVC-backing, but
there is a negative impact of SYND-backing on firm liquidation (significant at 1%). As in
Table 4, the likelihood of firm liquidation is impacted negatively by the yearly number of

29
VC investors (statistical significance at 5%) and positively by the institutional
heterogeneity of the syndicate (statistical significance at 1%).
6.2. Signaling
The negligible impact of GVC investors might be due to the fact that we did not model
properly the dynamics and the interactions between GVC and IVC investors. Some
portfolio companies might be characterized by very high spillovers or they could be too
far from the product market. In both cases, IVCs could not be interested in targeting some
companies. So, GVCs might exert a signaling function (Lerner, 2002) towards IVC
investors that helps such (types of) portfolio companies access capital markets.
In order to take into account the sequence between GVC and IVC investments, we
substituted the step variable GVC with two dummy variables: i) IVC_post that equals one
from the year of a subsequent IVC investment, which occurs after the first GVC
investment, and zero otherwise; and ii) GVC_pre that equals one for the years after
obtaining the first VC investment by a GVC investor until the (potential) receipt of a
subsequent IVC investment, and zero otherwise. The results are shown in Table 9
(columns III and IV) and are in line with those exposed in Table 4. As regards the
positive exits (column III), the impact of IVC-backing is still positive and statistically
significant (at 1%). Also SYND-backing exerts a positive and statistically significant (at
5%) effect, and its magnitude is greater than that associated with the coefficient of IVC-
backing. Also in this case, when performing a Wald test, we cannot reject the null
hypothesis of no difference between the coefficients of SYND-backing and IVC-backing.
Even after splitting GVC-backing to control for (potential) subsequent IVC investments,
the impact of GVC-backing is still negligible. 19 As in Table 4, the size and the
composition of the syndicate exert a negligible impact on the likelihood of a positive exit.
As regards the negative exits (column IV), there is no impact of VC-backing, whatever
the type (and the potential sequence) of VC-backing. As in Table 4, the yearly number of
VC investors exerts a negative impact on the likelihood of firm liquidation (statistical
significance at 5%) and the institutional heterogeneity of the syndicate positively impacts
the likelihood of a negative exit (statistical significance at 1%).
19
This result is in line with the findings of Grilli and Murtinu (2014a), which did not find a signaling effect
exerted by GVCs towards IVCs in Europe in enhancing the growth of their portfolio companies.
30
6.3. Financial Structure and Cash-Flow Ratio
Now we consider the financial structure of portfolio companies. If different types of
VC investors systematically choose companies which show different financial structures
and/or net cash-flow ratios, i.e. GVC investors choose portfolio companies with
more/less availability of capital and/or investment opportunities, our results exposed in
Table 4 might be misleading. To some extent, we added to our model specification - eq.
(1) - two additional variables: i) the ratio between short-term debt and total assets at time
t-1 (DTA); ii) the ratio between net cash flow and total assets at time t-1 (NCFTA). When
computing DTA, we used short-term debt because our sample is composed of young
high-tech companies, and the majority of this debt is represented by bank loans.
Companies with a low value of DTA may suffer from external capital constraints because
of their high information asymmetries towards financial markets (Carpenter and Petersen,
2002), and thus some profitable investments cannot be pursued. As to NCFTA, it should
capture the investment rate of young high-tech companies. In fact, the investment rate of
this type of companies is strongly correlated with their net cash-flow (Bertoni et al.,
2010). The results are shown in Table 10 (columns I and II) and are in line with those
exposed in Table 4. In column I, we see that the impact of IVC-backing is positive and
statistically significant (at 1%) on the likelihood of a positive exit. Also SYND-backing
exerts a positive and statistically significant (very close to 5%) effect, and its magnitude
is greater than that associated with the coefficient of IVC-backing. As in Table 4, we
cannot reject the null hypothesis of no difference between the coefficients of SYND-
backing and IVC-backing. The impact of GVC-backing is still negligible. As in Table 4,
the size and the composition of the syndicate exert a negligible impact on the likelihood
of a positive exit. Conversely, we find a positive and statistically significant effect (at
1%) of DTA on the likelihood of a positive exit. As regards the negative exits (column II),
there is no impact of all types of VC-backing. As in Table 4, the yearly number of VC
investors exerts a negative impact on the likelihood of firm liquidation (statistical
significance at 5%) and the institutional heterogeneity of the syndicate positively impacts
the likelihood of a negative exit (statistical significance at 1%). In this case, the impact of
DTA is negligible. The impact of NCFTA is always negligible, whatever the exit type,
31
even though the sign of the coefficient is the opposite: negative for positive exits and
positive for firm liquidations.
6.4. Investment Stage
Our results in Table 4 might be driven by the stage of the investments engaged by
different (types of) VC investors. If the different types of VC investors systematically
choose companies in different stages of their life and there is a (positive or negative)
correlation between the investment stage and the likelihood of a positive/negative exit,
our main results could be biased. In order to control for this potential source of
endogeneity (i.e., investment stage is an omitted variable), we inserted a dummy variable
(Earlystage) that equals one for the companies which obtained the first VC investment in
the first two years after firm foundation, and zero otherwise. This variable is set to zero
for all non VC-backed companies. The results are shown in Table 10 (columns III and
IV) and are in line with those exposed in Table 4. As regards the likelihood of a positive
exit, both the impacts of IVC-backing and SYND-backing are positive and statistically
significant (at 1%). The magnitude of the latter is greater than that of IVC-backing, but
we cannot reject the null hypothesis of no difference between the two coefficients. The
impact of GVC-backing is still negligible, as well as the size and the composition of the
syndicate. As regards the negative exits (column IV), there is no impact of VC-backing,
whatever the type of VC investor. Still, the yearly number of VC investors exerts a
negative impact (statistically significant at 5%), while the institutional heterogeneity of
the syndicate positively impacts the likelihood of firm liquidation (statistical significance
at 1%). The impact of the investment stage is always positive but negligible, whatever the
exit type.
6.5. Distance
Finally we control for the distance between the VC investors and portfolio companies.
VC investors prefer to target portfolio companies which are located closer (Lerner, 1995).
This way, it is easier for VC investors monitor portfolio companies and perform their
value-adding activities. So, as suggested by Sørensen (2007), distance is not independent
of the investment outcome. Also in this case, if the different types of VC investors
systematically choose companies at a certain distance from their headquarters and there is
an alleged positive/negative correlation between the distance and the likelihood of a

32
positive/negative exit, our results in Table 4 could be biased. In order to control for this
potential omitted variable bias, we inserted a continuous variable (Distance) that
measures the geographic distance between the lead investor of the first VC investment
and the target company (in kilometers). This variable is set to zero for all non VC-backed
companies.20
The results are shown in Table 10 (columns V and VI) and are in line with
those exposed in Table 4. As regards the likelihood of a positive exit (column V), the
impact of IVC-backing is positive and statistically significant at 1%. While, the impact of
SYND-backing is positive and statistically significant (at 5%), and shows a magnitude
greater than that of IVC-backing. Also in this case, we cannot reject the null hypothesis
of no difference between the two coefficients. The impact of GVC-backing is still
negligible, as well as the size and the institutional heterogeneity of the syndicate. As
regards the negative exits (column VI), there is no impact of all types of VC-backing.
Still, the yearly number of VC investors exerts a negative impact (statistically significant
at 5%), while the composition of the syndicate has a positive and statistically significant
impact (at 1%). The impact of the distance is always negligible, whatever the exit type,
even though the sign of the coefficient is the opposite: positive for positive exits and
negative for firm liquidations.
7. Concluding Remarks
Prior research indicates that different types of VC investors have a different impact on
the performance of their portfolio companies. Despite the high presence of GVC funds in
Europe, there is a dearth of contributions evaluating the performance of this specific type
of investor. In this work, using a large representative sample of European VC-backed and
non-VC backed companies observed from 1991 to 2010, we have compared the exit
performance of GVC investors with the one of IVC funds and mixed IVC-GVC
syndicates, controlling for the yearly size and institutional heterogeneity of the
syndicates.
Our econometric results show that IVC-backed companies have a higher likelihood to
reach a positive exit (IPO or trade-sale) than GVC-backed ones. More interestingly,
20
As robustness check, we also set such variable for all non VC-backed companies to the maximum
distance included in the sample. Results are available upon request from the authors.

33
mixed IVC-GVC syndicated investments lead to a higher (but not statistically different)
likelihood of a positive exit than that of IVC-backing. This positive impact of IVC-GVC
syndicates is not found to be influenced by the composition of the syndicate in terms of
size and institutional heterogeneity. Our findings are robust to several robustness checks -
controlling for endogeneity concerns, selection bias, omitted variables bias, legal and
institutional differences across countries and over time through several econometric
techniques - and alternative explanations.
These results have important policy implications. First, our analysis sheds a negative
light on the “go it alone” strategy of the European GVC funds. In doing so, our study
defines precise boundaries on the role of the State as active venture capitalist. In fact,
there is a positive economically and statistically relevant effect on the exit performance
of young high-tech companies when governmental bodies syndicate with IVCs,
whichever the size and the composition of the syndicate. Fortunately, recent European
policy initiatives (e.g., the EU framework programme “Horizon 2020”) seem to go
exactly this way through the pursuit of public-private partnerships. Our findings totally
support this view.
However, our findings also contain a warning for the set-up of this typology of
partnerships. In fact, echoing Chahine et al. (2012), our results indicate that the increase
of the institutional heterogeneity in VC syndicates may increase the odds of portfolio
companies’ liquidation. This is consistent with the fact that heterogeneous investors have
different objectives which may lead to principal-principal conflicts (Colombo et al.,
2014). Therefore, if IVC-GVC syndicates are found to be beneficial on the one side (i.e.,
favoring an exit through an IPO or a trade sale), the government and the independent
venture capital investor should always remind to keep the institutional heterogeneity of
the syndicate at a manageable level in order to limit negative side-effects.
To conclude, this work aimed at offering a general assessment on the performance of
GVCs and IVCs and their syndicated activities in the European VC market. Of course,
much remains to be investigated and several research directions might be undertaken. For
example, future research could deepen the diversity among VC syndicate members,
exploring different dimensions than the institutional one investigated here. An interesting
element to bring into the analysis could be the reputation of VC syndicate members.

34
Furthermore, the heterogeneity of the GVC funds across European countries could be
explored in terms of sources of financing, internal organization, objectives and selection
of portfolio companies. This way, it would be possible to further understand the
conditions under which GVCs play an important role for the development of the VC
market.
Acknowledgements
Financial support from the VICO project financed under the 7th European Framework
Programme (Grant agreement no. 217485) is gratefully acknowledged. We are thankful
to the Managing Editor, the Guest Co-Editor, one anonymous reviewer, Massimo G.
Colombo and all VICO members, to the participants at the Conference on Privatization
"Contracting Issues at the Intersection of the Public and Private Sectors" (7-8 November
2013, Wake Forest University, Winston-Salem, NC, US), and to the participants at the
2014 Financial Management Association (FMA) European Conference (11-13 June 2014,
Maastricht University), for helpful comments and suggestions. Responsibility for any
errors lies solely with the authors.

35
References
Andrieu, G., Groh, A.P., 2012. Entrepreneurs’ finance choice between independent and
bank-affiliated venture capital firms, Journal of Corporate Finance 18, 1143-1167.
Angrist, J., 2001. Estimation of limited endogenous variable models with dummy
endogenous regressors: Simple strategies for empirical practice. Journal of Business and
Economic Statistics 19, 2–16.
Avnimelech, G., and M. Teubal, 2006. Creating venture capital industries that co-evolve
with high tech: Insights from an extended industry life cycle perspective of the Israeli
experience, Research Policy, 35, 1477-1498.
Balboa, M., Martì, J., Zieling N., 2007. Is the Spanish public sector effective in backing
venture capital?. In: Gregoriou, G.N., Kooli, M., Kräussl, R., Kraeussl, R. (Eds.), Venture
capital in Europe. Butterworth-Heinemann, pp. 115-128.
Berger, A.N., and G.F. Udell, 1998. The economics of small business finance: the roles
of private equity and debt markets in the financial growth cycles. Journal of Banking and
Finance. 22, 613-673.
Beuselinck, C., and S. Manigart, 2000. Direct Government Investments in Venture
Capital, Proceedings of RENT XIV, Research in Entrepreneurship and Small Business.
Praag, November 2000, 23-24, 6-10.
Bertoni, F., Colombo, M.G. and Croce, A., 2010. The effect of Venture Capital financing
on the sensitivity to cash flow of firm’s investments. European Financial Management
16(4), 528-551.
Bertoni, F., M.A. Ferrer, and J. Martí, 2013, The Different Role Played by Venture
Capital and Private Equity Investors on the Investment Activity of Their Portfolio Firms,
Small Business Economics, Forthcoming.
Bertoni, F., Martí, J., 2011. Financing Entrepreneurial Ventures in Europe: The VICO
Dataset. Available at SSRN: http://ssrn.com/abstract=1904297.
Casamatta, C,. and C. Haritchabalet, 2007. Experience, screening and syndication in
venture capital investments, Journal of Financial Intermediation, 16, 368-398.
Carpenter, R. E., and B. C. Petersen. 2002. Capital market imperfections, high-tech
investment, and new equity financing, Economic Journal 112, F54-F72.
Chahine, S, I. Filatotchev, and R. Hoskisson, 2012. The effects of venture capital
syndicate diversity on earnings management and performance of IPOs in the US and UK:
An institutional perspective, Journal of Corporate Finance , 18, 179-192.

36
Chemmanur, T.J., He, S., Nandy, D., 2010. The going-public decision and the product
market. Review of Financial Studies 23, 1855–908.
Chemmanur, T.J., Krishnan, K., Nandy, D., 2011. How does venture capital financing
improve efficiency in private firms? A look beneath the surface. Review of Financial
Studies 24, 4037-4090.
Colombo, M.G., Croce, A., Murtinu, S., 2014. Ownership Structure, Horizontal Agency
Costs and the Performance of High-Tech Entrepreneurial Firms. Small Business
Economics 42 (2), 265-282.
Cornelli, F., Kominek, Z., Ljungqvist, A., 2013. Monitoring managers: does it matter?
Journal of Finance 68, 431-481.
Cressy, R., F. Munari, and A. Malipiero, 2007. Playing to their strengths? Evidence that
specialization in the private equity industry confers competitive advantage. Journal of
Corporate Finance 13, 647–669.
Croce, A., Martí, J., Murtinu, S., 2013. The Impact of Venture Capital on the Productivity
Growth of European Entrepreneurial Firms: 'Screening' or 'Value added' Effect?. Journal
of Business Venturing 28 (4), 489-510.
Cumming, D.J., 2008. Contracts and exits in venture capital finance. Review of Financial
Studies 21(5), 1947-1982.
Cumming, D.J., Dai, N., 2011. Limited attention, fund size and the valuation of venture
capital backed companies. Journal of Empirical Finance 18(1), 2-15.
Cumming, D.J., Dai, N., 2013. Why Do Entrepreneurs Switch Lead Venture Capitalists?
Entrepreneurship Theory and Practice 37(5), 999-1017.
Cumming, D.J., Fleming, G., Schwienbacher, A., 2006. Legality and venture capital
exits. Journal of Corporate Finance 12(2), 214–245.
Cumming, D.J., Johan, S.A., 2006. Is it the law or the lawyers? Investment covenants
around the world. European Financial Management 12, 553-574.
Cumming, D.J., and S.A. Johan, 2013. Venture Capital and Private Equity Contracting,
2nd
Edition, Elsevier Science Academic Press.
Cumming, D.J., MacIntosh, J., 2007. Mutual funds that invest in private equity? An
analysis of labour sponsored investment funds. Cambridge Journal of Economics 31,
445-487.

37
Cumming, D. Siegel and M. Wright, 2007. Private Equity, Leveraged Buyouts and
Governance, Journal of Corporate Finance 13(4), 439-460.
Cumming, D.J., Walz, U., 2010. Private Equity Returns and Disclosure Around the
World. Journal of International Business Studies 41, 727–754.
Dehejia, R.H., Wahba, S., 2002. Propensity score-matching methods for nonexperimental
causal studies. Review of Economics and Statistics 84, 151-161.
Denis, D.J., 2004. Entrepreneurial finance : an overview of the issues and evidence,
Journal of Corporate Finance 10, 301-326.
Dihiya, S., and K. Ray, 2012. Staged investments in entrepreneurial financing, Journal of
Corporate Finance 18, 1193-1216.
Djankov, S., Hart, O., McLiesh, C., Shleifer, A., 2008. Debt enforcement around the
world. Journal of Political Economy 116 (6), 1105-1149.
Djankov, S., La Porta, R., Lopez-de-Silanes, F., Shleifer, A., 2002. The regulation of
entry. The Quarterly Journal of Economics CXVII (1), 1-37.
Djankov, S., La Porta, R., Lopez-de-Silanes, F., Shleifer, A., 2003. Courts. The Quarterly
Journal of Economics 118 (2), 453-517.
Djankov, S., McLiesh, C., Shleifer, A., 2007. Private credit in 129 countries. Journal of
Financial Economics 84, 299-329.
European Parliament, 2012. Potential of Venture Capital in the European Union.
Directorate General for Internal Policies. Policy Department A: Economic and Scientific
Policy Industry, Research and Energy.
Giot, P., Schwienbacher, A., 2007. IPOs, Trade Sales and Liquidations: Modelling
Venture Capital Exits Using Survival Analysis. Journal of Banking & Finance, 31 (3),
679-702.
Gompers, P., 1995. Optimal investment, monitoring, and the staging of venture capital.
Journal of Finance 50, 1461-1489.
Gompers, P., Lerner, J., 2001. The venture capital revolution. Journal of Economic
Perspectives 15, 146-168.
Gompers, P.A. and J. Lerner, 2004. The Venture Capital Cycle. 2nd
Ed. Cambridge: MIT
Press.
Gompers, P., Kovner, A., Lerner J., 2009. Specialization and success: evidence from
venture capital. Journal of Economics and Management Strategy 18(3), 817–844.

38
Grilli, L., 2014. High-tech entrepreneurship in Europe: a heuristic firm growth model and
three “(un-)easy pieces” for policy making. Industry and Innovation, forthcoming.
Grilli, L., Murtinu, S. 2014a. Government, venture capital and the growth of European
high-tech entrepreneurial firms. Research Policy, in press. Available at:
http://www.sciencedirect.com/science/article/pii/S0048733314000559.
Grilli, L., Murtinu, S. 2014b. New technology-based firms in Europe: market penetration,
public venture capital and timing of investment. SSRN Working Paper Series,
http://ssrn.com/abstract=1892024.
Groh, A.P., von Liechtenstein, H., Lieser, K., 2010. The European Venture Capital and
Private Equity country attractiveness indices. Journal of Corporate Finance 16, 205–224.
Hege, U., Palomino, F., Schwienbacher, A., 2003. Determinants of Venture Capital
Performance: Europe and the United States. London School of Economics (LSE)
Working Paper No. 001.
Hege, U., Schwienbacher, A., Palomino, F. (2009). Venture Capital Performance: The
Disparity between Europe and the United States. Revue Finance, 30 (1), 7-50.
Huang, R., Z. Shangguan, and D. Zhang, 2008. The networking function of investment
banks: Evidence from private investments in public equity, Journal of Corporate Finance
14, 738-752.
Ivanov, V.I., Xie, F., 2010. Do corporate venture capitalists add value to startup firms?
Evidence from IPOs and acquisitions of VC-backed companies. Financial Management
39, 129-152.
Jääskeläinen, M., M. Maula, and G. Murray, 2007.Profit distribution and compensation
structures in publicly and privately funded hybrid venture capital funds, Research Policy
36, 913-929.
Kanniainen, V., and C. Keuschnigg, 2003. The optimal portfolio of start-up firms in
venture capital finance. Journal of Corporate Finance, 9: 521-534.
Kanniainen, V., & Keuschnigg, C. 2004. Start-up investment with scarce venture capital
support. Journal of Banking and Finance, 28: 1935-1959.
Kelly, R., 2011. The Performance and Prospects of European Venture Capital, European
Investment Fund EIF Research and Market Analysis Working Paper 2011/09.
König, J., Ohr, R., 2013. Different efforts in European economic integration: implications
of the EU index. Journal of Common Market Studies 51 (6), 1074-1090.

39
Kraemer-Eis, H., Lang, F., 2011. European Small Business Finance Outlook 2/2011.
Working Paper 2011/12 EIF Research and Market Analysis.
La Porta, R., Lopez-de-Silanes, F., Shleifer, A., & and Vishny, R. 1998. Law and
finance., Journal of Political Economy, 106, 1113–1155
Leleux, B., and B. Surlemont, 2003. Public versus private venture capital: seeding or
crowding out? A Pan-European analysis. Journal of Business Venturing 18, 81-104.
Lerner, J., 1995. Venture capitalists and the oversight of private firms. Journal of Finance
50, 301-318.
Lerner, J., 2002. When bureaucrats meet entrepreneurs: the design of effective ‘public
venture capital’ programmes. Economic Journal 112, F73-84.
Mara, A., 2011. Maximizing the returns of government venture capital programs.
Defense Horizons 71, 1-11.
Megginson, W.L., Weiss, K.A., 1991. Venture capitalist certification in initial public
offerings. Journal of Finance 46, 879-903.
Nahata, R., 2008. Venture capital reputation and investment performance, Journal of
Financial Economics 90, 127-151.
Nahata, R., Hazaruka, S., & and Tandon, K., 2014. Success in global venture capital
investing: Do institutional and cultural differences matter?, Journal of Financial and
Quantitative Analysis, forthcoming.
Petersen, M.A. 2009. Estimating Standard Errors in Finance Panel Data Sets: Comparing
Approaches. The Review of Financial Studies 22(1): 435-480.
Puri, M., Zarutskie, R., 2012. On the lifecycle dynamics of venture-capital- and non-
venture-capital-financed firms. Journal of Finance 67(6), 2247-2293.
Richard, P.J., Devinney, T.M., Yip, G.S., Johnson, G., 2009. Measuring Organizational
Performance: Towards Methodological Best Practice. Journal of Management 35, 718-
804.
Riyanto, Y.E., Schwienbacher, A. 2006. The Strategic Use of Corporate Venture
Financing for Securing Demand. Journal of Banking & Finance, 30 (10), 2809-2833.
Sahlman, W.A., 1990. The structure and governance of venture capital organizations.
Journal of Financial Economics 27, 473-521.
Sørensen, M., 2007. How Smart Is Smart Money? A Two-Sided Matching Model of
Venture Capital. Journal of Finance, 62(6), 2725-2762.
40
Staiger, D., Stock, J.H., 1997. Instrumental variables regression with weak instruments.
Econometrica 65, 557-586.
Tian, X., 2012. The role of venture capital syndication in value creation for
entrepreneurial firms. Review of Finance 16, 245-283.
Vismara, S., S. Paleari, and J.R. Ritter, 2012. Europe’s second markets for small
companies, European Financial Management 18, 352-388.
Wang, S., and S. Wang, 2010. Cross-border venture capital performance: Evidence from
China. Pacific-Basin Finance Journal 19, 71-97.
Wang, L., and S. Wang, 2012a. Endogenous networks in investment syndication, Journal
of Corporate Finance, 18, 640–663.
Wang, L., and S. Wang, 2012b. Economic freedom and cross-border venture capital
performance, Journal of Empirical Finance, forthcoming.
Wang, S., and H. Zhou, 2004. Staged financing in venture capital: Moral hazard and
risks, Journal of Corporate Finance 10, 131–155.
Wooldridge, J.M., 2002. Econometric Analysis of Cross Section and Panel Data. MIT
Press, Cambridge (USA).
Wright M., Lockett A., 2003. The Structure and Management of Alliances: Syndication
in the Venture Capital Industry. Journal of Management Studies 40(8): 2073-2102.
Yung, C., 2009. Entrepreneurial Financing and Costly Due Diligence, The Financial
Review 44, 137-149.
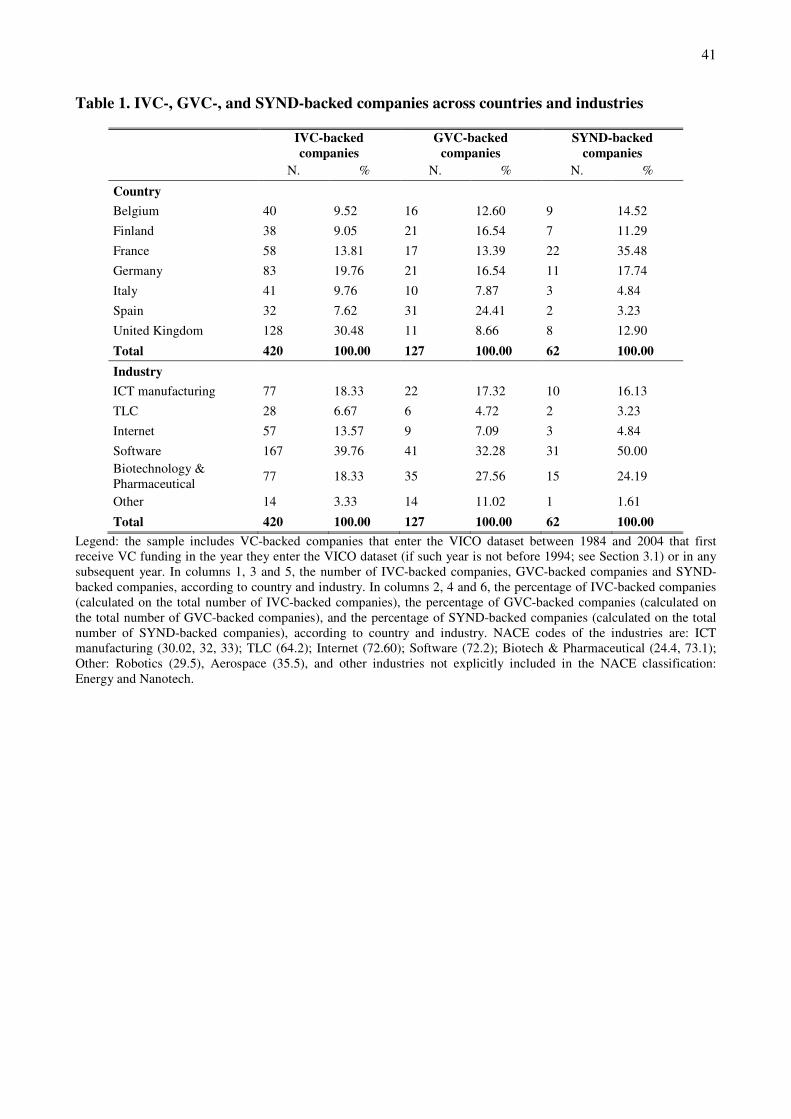
41
Table 1. IVC-, GVC-, and SYND-backed companies across countries and industries
IVC-backed
companies
GVC-backed
companies
SYND-backed
companies
N. % N. % N. %
Country
Belgium 40 9.52 16 12.60 9 14.52
Finland 38 9.05 21 16.54 7 11.29
France 58 13.81 17 13.39 22 35.48
Germany 83 19.76 21 16.54 11 17.74
Italy 41 9.76 10 7.87 3 4.84
Spain 32 7.62 31 24.41 2 3.23
United Kingdom 128 30.48 11 8.66 8 12.90
Total 420 100.00 127 100.00 62 100.00
Industry
ICT manufacturing 77 18.33 22 17.32 10 16.13
TLC 28 6.67 6 4.72 2 3.23
Internet 57 13.57 9 7.09 3 4.84
Software 167 39.76 41 32.28 31 50.00
Biotechnology &
Pharmaceutical 77 18.33 35 27.56 15 24.19
Other 14 3.33 14 11.02 1 1.61
Total 420 100.00 127 100.00 62 100.00
Legend: the sample includes VC-backed companies that enter the VICO dataset between 1984 and 2004 that first
receive VC funding in the year they enter the VICO dataset (if such year is not before 1994; see Section 3.1) or in any
subsequent year. In columns 1, 3 and 5, the number of IVC-backed companies, GVC-backed companies and SYND-
backed companies, according to country and industry. In columns 2, 4 and 6, the percentage of IVC-backed companies
(calculated on the total number of IVC-backed companies), the percentage of GVC-backed companies (calculated on
the total number of GVC-backed companies), and the percentage of SYND-backed companies (calculated on the total
number of SYND-backed companies), according to country and industry. NACE codes of the industries are: ICT
manufacturing (30.02, 32, 33); TLC (64.2); Internet (72.60); Software (72.2); Biotech & Pharmaceutical (24.4, 73.1);
Other: Robotics (29.5), Aerospace (35.5), and other industries not explicitly included in the NACE classification:
Energy and Nanotech.

42
Table 2. Positive and negative exits across types of VC investors
IPOs or trade-sales Liquidations
Binomial
proportions
test
N. % N. % Z
Type of VC investor
IVC 80 74.77 71 69.61 0.8325
GVC 12 11.21 22 21.57 -2.0272**
SYND 15 14.02 9 8.82 1.1775
Total 107 100.00 102 100.00
Legend: the sample includes VC-backed companies that enter the VICO dataset between 1984 and 2004 that first
receive VC funding in the year they enter the VICO dataset (if such year is not before 1994; see Section 3.1) or in any
subsequent year. In columns 1 and 3, the number of companies that positively (went public or were acquired) or
negatively exited, according to the type of VC-backing. In columns 2 and 4, the percentage of companies that positively
exited (calculated on the total number of companies that went public or were acquired) and the percentage of companies
that negatively exited (calculated on the total number of liquidated companies), according to the type of VC-backing. In
column 5, Z statistic of binomial proportions test is reported. For each row, Z is equal to (p1-p2)/√[p*(1-
p)*(1/N1+1/N2)], where x1 is equal to the number of firms that went public or were acquired; x2 is equal to the number
of firms that were liquidated; N1 is equal to the total number of firms that went public or were acquired; N2 is equal to
the total number of firms that were liquidated; p1 is the ratio between the number of firms that went public or were
acquired and the total number of firms that went public or were acquired; p2 is the ratio between the number of firms
that were liquidated and the total number of firms that were liquidated; p is equal to (x1+x2)/(N1+N2). Z can be
approximated with a standard normal distribution given that x1, x2, (N1-x1), and (N2-x2) are all larger than 5.
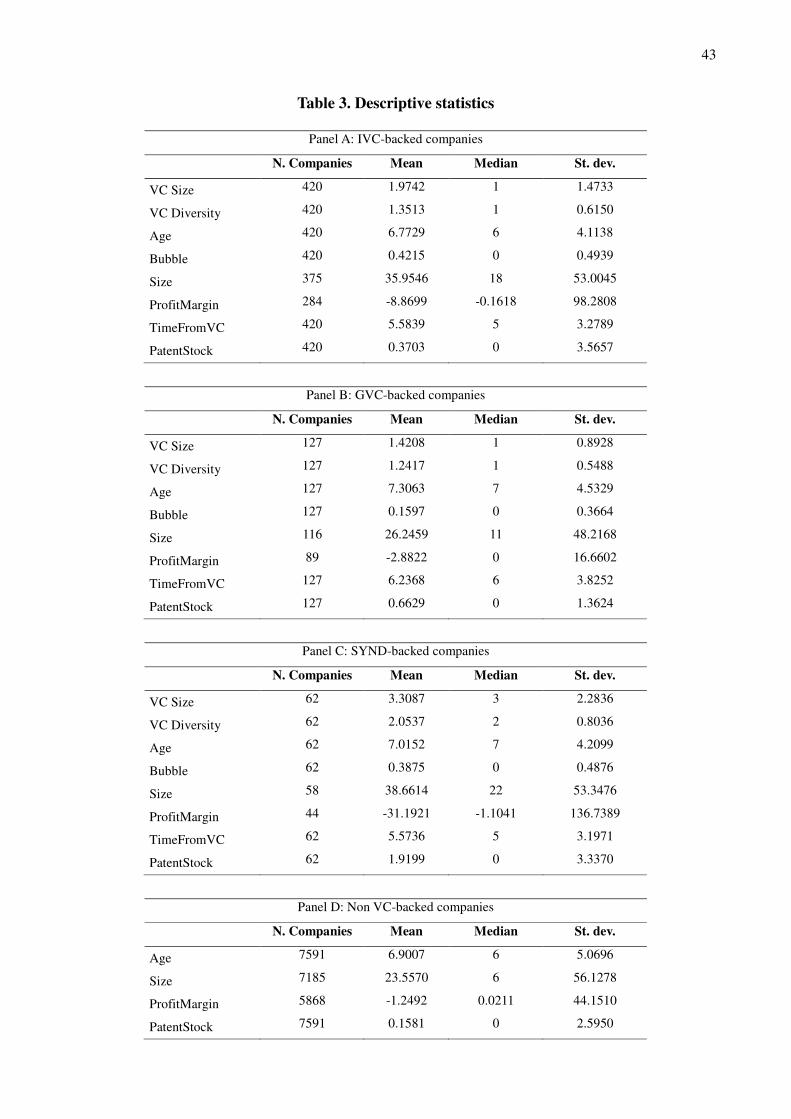
43
Table 3. Descriptive statistics
Panel A: IVC-backed companies
N. Companies Mean Median St. dev.
VC Size 420 1.9742 1 1.4733
VC Diversity 420 1.3513 1 0.6150
Age 420 6.7729 6 4.1138
Bubble 420 0.4215 0 0.4939
Size 375 35.9546 18 53.0045
ProfitMargin 284 -8.8699 -0.1618 98.2808
TimeFromVC 420 5.5839 5 3.2789
PatentStock 420 0.3703 0 3.5657
Panel B: GVC-backed companies
N. Companies Mean Median St. dev.
VC Size 127 1.4208 1 0.8928
VC Diversity 127 1.2417 1 0.5488
Age 127 7.3063 7 4.5329
Bubble 127 0.1597 0 0.3664
Size 116 26.2459 11 48.2168
ProfitMargin 89 -2.8822 0 16.6602
TimeFromVC 127 6.2368 6 3.8252
PatentStock 127 0.6629 0 1.3624
Panel C: SYND-backed companies
N. Companies Mean Median St. dev.
VC Size 62 3.3087 3 2.2836
VC Diversity 62 2.0537 2 0.8036
Age 62 7.0152 7 4.2099
Bubble 62 0.3875 0 0.4876
Size 58 38.6614 22 53.3476
ProfitMargin 44 -31.1921 -1.1041 136.7389
TimeFromVC 62 5.5736 5 3.1971
PatentStock 62 1.9199 0 3.3370
Panel D: Non VC-backed companies
N. Companies Mean Median St. dev.
Age 7591 6.9007 6 5.0696
Size 7185 23.5570 6 56.1278
ProfitMargin 5868 -1.2492 0.0211 44.1510
PatentStock 7591 0.1581 0 2.5950

44
Legend: VC size represents the yearly number of VC investors backing the firm at time t-1. VC diversity looks at the VC affiliation
(i.e., independent, corporate, bank-affiliated, university-sponsored, governmental VC) and counts the number of sub-groupings of
each VC type backing the firm at time t-1. Age is the logarithm of firm age. Bubble is equal to 1 whether the first VC investment was
received in the years 1999 or 2000. Size is the logarithm of headcount at time t-1. ProfitMargin is the ratio net income/sales at time t-
1. TimeFromVC is the time elapsed since the first VC receipt. PatentStock is the logarithm of the patent stock at time t-1 (with yearly
depreciation=0.15). Sales value and net income have been deflated by the Consumer Price Index (source: Eurostat; reference year:
2005).

45
Table 4. Econometric results
IPO/ACQUISITION LIQUIDATION IPO/ACQUISITION LIQUIDATION
I II III IV
IVC 2.7062*** (0.8325) 1.5981 (0.7481) 2.4242*** (0.6858) 1.2484 (0.5613)
GVC 1.6567 (0.9555) 1.5017 (1.0910) 1.5033 (0.8457) 1.1360 (0.7976)
SYND 4.1165*** (2.0384) 2.3809 (1.9250) 3.3304*** (1.5646) 1.5858 (1.3491)
VC Size - - 1.1152 (0.2379) 0.3617** (0.1487)
VC Diversity - - 1.2341 (0.5224) 6.3751*** (3.2190)
Age 4.7677* (4.3825) 7.1608** (6.3788) 4.9140* (4.4499) 7.5333** (6.6663)
Age2 0.7159 (0.1560) 0.5631*** (0.1179) 0.7165 (0.1541) 0.5577*** (0.1161)
Bubble 1.1534 (0.3321) 0.6615 (0.3393) 1.0895 (0.3015) 0.6759 (0.3315)
Size 1.3998*** (0.0803) 0.8877*** (0.0410) 1.4034*** (0.0805) 0.8884** (0.0411)
ProfitMargin 1.0086** (0.0039) 1.0007 (0.0008) 1.0104** (0.0042) 1.0006 (0.0009)
TimeFromVC 1.0876** (0.0438) 0.9984 (0.0648) 1.0930** (0.0412) 1.0091 (0.0592)
PatentStock 1.2648** (0.1484) 0.8147 (0.1667) 1.2147 (0.1445) 0.8103 (0.1661)
Country dummies Yes Yes Yes Yes
Industry dummies Yes Yes Yes Yes
Year dummies Yes Yes Yes Yes
Obs. 37048 37048 37048 37048
Groups 5901 5901 5901 5901
Pseudo R2 0.1354 0.1354 0.1378 0.1378
Log pseudolikelihood -2562.5352 -2562.5352 -2555.5893 -2555.5893
Legend: estimates are derived from multinomial logit regressions with standard errors robust to heteroskedasticity through the Huber-
White method and serial correlation within portfolio companies. In columns I and III, results related to the likelihood of a positive
exit (IPO or trade-sale). In columns II and IV, results related to the likelihood of a negative exit (liquidation). Relative-risk ratios are
reported. IVC is a dummy variable that equals one for the years after obtaining the first VC investment by an IVC investor and zero
otherwise. GVC is a dummy variable that equals one for the years after obtaining the first VC investment by a GVC investor and zero
otherwise. SYND is a dummy variable that equals one for the years after obtaining the first VC investment by a mixed IVC-GVC
syndicate and zero otherwise. VC size represents the yearly number of VC investors backing the firm at time t-1. VC diversity looks
at the VC affiliation (i.e., independent, corporate, bank-affiliated, university-sponsored, governmental VC) and counts the number of
sub-groupings of each VC type backing the firm at time t-1. Age is the logarithm of firm age. Bubble is equal to 1 whether the first
VC investment was received in the years 1999 or 2000. Size is the logarithm of headcount at time t-1. ProfitMargin is the ratio net
income/sales at time t-1. TimeFromVC is the time elapsed since the first VC receipt. PatentStock is the logarithm of the patent stock
at time t-1 (with yearly depreciation=0.15). Sales value and net income have been deflated by the Consumer Price Index (source:
Eurostat; reference year: 2005). Country, industry and time dummies are included in the estimates (coefficients are omitted in the
table). All regressions are estimated with an intercept term. Standard errors in round brackets. * p < .10; ** p < .05; *** p < .01.

46
Table 5. Selection bias and endogeneity issues: firm quality
IPO/ACQUISITION LIQUIDATION IPO/ACQUISITION LIQUIDATION
I II III IV
IVC 2.8796*** (0.8249) 1.3996 (0.6397) 2.3338*** (0.6727) 1.2921 (0.5830)
GVC 1.7039 (0.9739) 1.2374 (0.9065) 1.4727 (0.8321) 1.0974 (0.7649)
SYND 4.0826*** (1.9505) 2.0498 (1.8182) 3.3428*** (1.5494) 1.5535 (1.3189)
VC Size 1.1139 (0.2493) 0.2077** (0.1355) 1.1124 (0.2380) 0.3613** (0.1496)
VC Diversity 1.2344 (0.5530) 11.8638***
(8.7295) 1.2663 (0.5352) 6.3623*** (3.2154)
Age 3.5113 (4.5306) 11.5174**
(12.7117) 4.3238 (3.9234) 8.2027** (7.7567)
Age2 0.7660 (0.2255) 0.5048*** (0.1273) 0.7421 (0.1606) 0.5496*** (0.1219)
Bubble 1.0147 (0.2836) 0.4867 (0.2666) 1.0560 (0.2994) 0.6824 (0.3357)
Size 1.3758*** (0.0825) 0.8788*** (0.0419) 1.3774*** (0.0807) 0.9012** (0.0439)
ProfitMargin 1.0088* (0.0046) 1.0014 (0.0012) 1.0101** (0.0041) 1.0006 (0.0008)
TimeFromVC 1.0817** (0.0419) 1.0067 (0.0624) 1.0957** (0.0419) 1.0117 (0.0595)
PatentStock 1.2024 (0.1454) 0.8015 (0.1717) 1.2186 (0.1482) 0.8232 (0.1684)
PastSalesGrowth 1.0001 (0.0003) 1.0000 (0.0000) - -
ITA - - 1.0456 (0.5589) 1.2456 (0.4513)
Country dummies Yes Yes Yes Yes
Industry dummies Yes Yes Yes Yes
Year dummies Yes Yes Yes Yes
Obs. 32411 32411 36094 36094
Groups 5615 5615 5835 5835
Pseudo R2 0.1334 0.1334 0.1322 0.1322
Log
pseudolikelihood -2389.4234 -2389.4234 -2432.6297 -2432.6297
Legend: estimates are derived from multinomial logit regressions with standard errors robust to heteroskedasticity through the Huber-
White method and serial correlation within portfolio companies. In columns I and III, results related to the likelihood of a positive
exit (IPO or trade-sale). In columns II and IV, results related to the likelihood of a negative exit (liquidation). Relative-risk ratios are
reported. IVC is a dummy variable that equals one for the years after obtaining the first VC investment by an IVC investor and zero
otherwise. GVC is a dummy variable that equals one for the years after obtaining the first VC investment by a GVC investor and zero
otherwise. SYND is a dummy variable that equals one for the years after obtaining the first VC investment by a mixed IVC-GVC
syndicate and zero otherwise. VC size represents the yearly number of VC investors backing the firm at time t-1. VC diversity looks
at the VC affiliation (i.e., independent, corporate, bank-affiliated, university-sponsored, governmental VC) and counts the number of
sub-groupings of each VC type backing the firm at time t-1. Age is the logarithm of firm age. Bubble is equal to 1 whether the first
VC investment was received in the years 1999 or 2000. Size is the logarithm of headcount at time t-1. ProfitMargin is the ratio net
income/sales at time t-1. TimeFromVC is the time elapsed since the first VC receipt. PatentStock is the logarithm of the patent stock
at time t-1 (with yearly depreciation=0.15). PastSalesGrowth is the growth in sales value from the time t-2 to the time t-1. ITA is the
ratio between intangible assets and total assets at time t-1. Sales value, net income, total assets and intangible assets have been
deflated by the Consumer Price Index (source: Eurostat; reference year: 2005). Country, industry and time dummies are included in
the estimates (coefficients are omitted in the table). All regressions are estimated with an intercept term. Standard errors in round
brackets. * p < .10; ** p < .05; *** p < .01.

47
Table 6. Selection bias and endogeneity issues: panel multinomial logit with random effects, panel probit models on matched samples, and
Instrumental Variables (IV) linear probability models
IPO/ACQUISITION LIQUIDATION IPO/ACQUISITION LIQUIDATION IPO/ACQUISITION LIQUIDATION
I II III IV V VI
IVC 0.8457*** (0.3179) 0.1070 (0.4087) 0.7488*** (0.2420) 0.2572 (0.4900) 0.2050* (0.1191) 0.0169 (0.1287)
GVC -0.2966 (0.5478) -0.9518 (0.6813) 0.2322 (0.4641) 0.3247 (0.6595) 0.2626 (0.1952) 0.2729 (0.2592)
SYND 0.9799** (0.4757) -0.0463 (0.8058) 0.7991** (0.3639) 1.3446** (0.5483) 0.5871* (0.3367) 0.5993 (0.4693)
VC Size 0.1311 (0.1764) -0.8125 (0.6321) 0.0620 (0.1497) -2.0097*** (0.6057) - -
VC Diversity 0.1624 (0.3712) 1.5319* (0.7878) 0.0349 (0.2634) 2.1571** (0.8731) - -
Age 1.4455 (0.9990) 3.8022*** (0.8744) 2.5325** (1.1590) 1.5702 (1.6904) 0.0111 (0.0119) 0.0414*** (0.0131)
Age2 -0.2825 (0.2348) -0.9119*** (0.2098) -0.6593** (0.3061) -0.4388 (0.4498) -0.0011 (0.0026) -0.0100*** (0.0029)
Bubble 0.2568 (0.2634) -0.5709 (0.4368) 0.2383 (0.1892) -0.8682* (0.4637) -0.0540 (0.0342) -0.0105 (0.0363)
Size 0.2956*** (0.0513) -0.0914* (0.0466) 0.1113 (0.0959) 0.0412 (0.0881) 0.0020** (0.0008) -0.0015** (0.0007)
ProfitMargin 0.0090 (0.0086) 0.0002 (0.0017) 0.0026 (0.0016) 0.0080 (0.0052) 0.0001** (0.0000) 0.0001 (0.0000)
TimeFromVC 0.1023*** (0.0391) 0.0692 (0.0534) -0.0144 (0.0482) 0.0038 (0.0581) -0.0258 (0.0172) -0.0188 (0.0205)
PatentStock 0.2064* (0.1203) -0.2016 (0.1994) 0.3998** (0.1619) -0.0874 (0.2379) -0.0177 (0.0130) -0.0180 (0.0134)
Country dummies No No Yes Yes Yes Yes
Industry dummies No No Yes Yes Yes Yes
Year dummies No No Yes Yes Yes Yes
Obs. 37048 37048 2783 3203 19353 22537
Groups - - 355 393 - -
Adjusted R2 - - - - - -
Log pseudolikelihood -2859.4617 -2859.4617 - - - -
F(IVC) - - - - 317.39 366.09
F(PVC) - - - - 182.22 200.35
F(SYND) - - - - 61.27 64.88
Legend: estimates are derived from multilevel latent variable models for unordered categorical responses, in which the latent variables are modeled as random effects (columns I and II), panel probit
models after performing separately for IVC-backed, GVC-backed or SYND-backed companies a one-to-one propensity score matching without replacement in the year of the first VC investment
(columns III and IV), and pooled Instrumental Variables (IV) linear probability models with standard errors clustered at portfolio company-level (columns V and VI). In the last rows of the table
(columns V and VI), we reported the F statistics related to the first-stage regressions of the IV procedure. In columns I, III and V, results related to the likelihood of a positive exit (IPO or trade-sale);
in columns II, IV and VI, results related to the likelihood of a negative exit (liquidation). Estimated coefficients (and not relative-risk ratios) are reported. IVC is a dummy variable that equals one for
the years after obtaining the first VC investment by an IVC investor and zero otherwise. GVC is a dummy variable that equals one for the years after obtaining the first VC investment by a GVC
investor and zero otherwise. SYND is a dummy variable that equals one for the years after obtaining the first VC investment by a mixed IVC-GVC syndicate and zero otherwise. VC size represents
the yearly number of VC investors backing the firm at time t-1. VC diversity looks at the VC affiliation (i.e., independent, corporate, bank-affiliated, university-sponsored, governmental VC) and
counts the number of sub-groupings of each VC type backing the firm at time t-1. Age is the logarithm of firm age. Bubble is equal to 1 whether the first VC investment was received in the years
1999 or 2000. Size is the logarithm of headcount at time t-1. ProfitMargin is the ratio net income/sales at time t-1. TimeFromVC is the time elapsed since the first VC receipt. PatentStock is the
logarithm of the patent stock at time t-1 (with yearly depreciation=0.15). Sales value and net income have been deflated by the Consumer Price Index (source: Eurostat; reference year: 2005).
Country, industry and time dummies are included in the estimates (coefficients are omitted in the table). All regressions are estimated with an intercept term. Standard errors in round brackets. * p
< .10; ** p < .05; *** p < .01.

48
Table 7. Robustness checks: methodologies
IPO/ACQUISITION LIQUIDATION IPO/ACQUISITION LIQUIDATION
I II III IV
IVC 0.4851*** (0.1706) 0.1171 (0.2443) 0.1204*** (0.0304) 0.0132 (0.0519)
GVC 0.1650 (0.3248) 0.0704 (0.3686) 0.1091* (0.0571) 0.0161 (0.0814)
SYND 0.7119** (0.2828) 0.3617 (0.4466) 0.1069** (0.0467) 0.0878 (0.0894)
VC Size 0.0553 (0.1324) -0.6206** (0.2592) 0.0332 (0.0206) -0.1438** (0.0634)
VC Diversity 0.1626 (0.2572) 1.1186*** (0.3272) -0.0052 (0.0436) 0.2389*** (0.0713)
Age 1.3109** (0.5453) 1.5809*** (0.5005) - -
Age2 -0.2754** (0.1271)
-0.4273***
(0.1175) - -
Bubble 0.0203 (0.1658) -0.1402 (0.2473) 0.3895 (0.2753) -0.3439 (0.4944)
Size 0.1937*** (0.0300) -0.0492* (0.0251) 0.0282*** (0.0057) -0.0120** (0.0048)
ProfitMargin 0.0056** (0.0026) 0.0004 (0.0005) 0.0008** (0.0003) 0.0001 (0.0001)
TimeFromVC 0.0555** (0.0231) 0.0005 (0.0319) -0.0005 (0.0035) -0.0014 (0.0058)
PatentStock 0.0879 (0.0698) -0.1278 (0.1049) 0.0124 (0.0088) -0.0149 (0.0204)
Country dummies Yes Yes Yes Yes
Industry dummies Yes Yes Yes Yes
Year dummies Yes Yes Yes Yes
Obs. 37048 37048 37069 37069
Groups 5901 5901 5902 5902
Log pseudolikelihood -2555.8908 -2555.8908 -1390.5688 -2050.4489
Legend: estimates are derived from multinomial probit regressions with standard errors robust to heteroskedasticity through the
Huber-White method and serial correlation within portfolio companies (columns I and II) and semi-parametric Cox-type survival
models, in which firm age is the random variable to define the time of 'death', i.e. first exit in a competing risk scenario (columns III
and IV). In columns I and III, results related to the likelihood of a positive exit (IPO or trade-sale); in columns II and IV, results
related to the likelihood of a negative exit (liquidation). Estimated coefficients (and not relative-risk ratios) are reported. IVC is a
dummy variable that equals one for the years after obtaining the first VC investment by an IVC investor and zero otherwise. GVC is a
dummy variable that equals one for the years after obtaining the first VC investment by a GVC investor and zero otherwise. SYND is
a dummy variable that equals one for the years after obtaining the first VC investment by a mixed IVC-GVC syndicate and zero
otherwise. VC size represents the yearly number of VC investors backing the firm at time t-1. VC diversity looks at the VC affiliation
(i.e., independent, corporate, bank-affiliated, university-sponsored, governmental VC) and counts the number of sub-groupings of
each VC type backing the firm at time t-1. Age is the logarithm of firm age. Bubble is equal to 1 whether the first VC investment was
received in the years 1999 or 2000. Size is the logarithm of headcount at time t-1. ProfitMargin is the ratio net income/sales at time t-
1. TimeFromVC is the time elapsed since the first VC receipt. PatentStock is the logarithm of the patent stock at time t-1 (with yearly
depreciation=0.15). Sales value and net income have been deflated by the Consumer Price Index (source: Eurostat; reference year:
2005). Country, industry and time dummies are included in the estimates (coefficients are omitted in the table). All regressions are
estimated with an intercept term. Standard errors in round brackets. * p < .10; ** p < .05; *** p < .01.

49
Table 8. Robustness checks: operationalization of variables
IPO/ACQUISIT
ION
LIQUIDATI
ON
IPO/ACQUISIT
ION
LIQUIDATI
ON
IPO/ACQUISIT
ION
LIQUIDATI
ON
IPO/ACQUISIT
ION
LIQUIDATI
ON
IPO/ACQUISIT
ION
LIQUIDATI
ON
I II III IV V VI VII VIII IX X
IVC 2.4175***
(0.6837)
1.1934
(0.5453)
2.0811***
(0.5782)
1.2457
(0.5711)
1.9398**
(0.5363)
1.2669
(0.4942)
2.0107**
(0.5825)
1.1168
(0.5135)
2.2908***
(0.6165)
1.3967
(0.5410)
GVC 1.4948 (0.8376) 1.1802
(0.8281) 1.0219 (0.6034)
1.2186
(0.8613) 1.1774 (0.6122)
0.8815
(0.5338) 1.2043 (0.6654)
1.0842
(0.7639) 1.4311 (0.7463)
0.9928
(0.5949)
SYND 3.4152***
(1.5623)
1.5269
(1.2940)
2.3985*
(1.1409)
0.8149
(0.8984)
2.3334**
(0.9047)
2.2428
(1.3067)
2.5027**
(1.1670)
1.6238
(1.3725)
3.0371***
(1.1618)
2.2040
(1.2925)
VC Size 1.1120 (0.2363) 0.3579**
(0.1470) 1.1650 (0.2449)
0.3660**
(0.1494)
1.3567**
(0.2053)
0.4351**
(0.1556) 1.2721 (0.2358)
0.2574**
(0.1676) 1.2167 (0.2053)
0.4802***
(0.1352)
VC Diversity 1.2399 (0.5252) 6.4690***
(3.2803) 1.2066 (0.4977)
6.4467***
(3.2410) 0.8483 (0.2656)
3.6391***
(1.4980) 0.9741 (0.3639)
8.1037***
(5.8825) 1.0125 (0.3497)
3.6218***
(1.2690)
Age 4.9096*
(4.4414)
7.5664**
(6.6823) 2.7759 (2.3903)
7.9639**
(6.9511) 2.9758 (2.4465)
8.4043***
(5.8489) 2.6644 (2.3540)
7.0239**
(5.7783)
5.5992**
(4.7017)
8.8671***
(6.5519)
Age2 0.7169 (0.1540)
0.5572***
(0.1157) 0.8035 (0.1635)
0.5671***
(0.1165) 0.8001 (0.1555)
0.5672***
(0.0942) 0.8201 (0.1705)
0.5803***
(0.1128)
0.6951*
(0.1391)
0.5543***
(0.0973)
Bubble - - 1.0591 (0.2931) 0.8183
(0.3923) 0.9130 (0.2506)
0.6430
(0.2714) 0.8820 (0.2583)
0.7082
(0.3525) 1.1464 (0.2962)
0.6353
(0.2672)
Bubble
1998-2000 1.1152 (0.3095)
0.8649
(0.3903) - - - - - - - -
Size 1.4033***
(0.0805)
0.8877***
(0.0411)
1.4637***
(0.0805)
0.8404***
(0.0394)
1.4818***
(0.0807)
0.7587***
(0.0364)
1.4610***
(0.0817)
0.8280***
(0.0390)
1.4339***
(0.0794)
0.7982***
(0.0383)
ProfitMargin 1.0104**
(0.0042)
1.0006
(0.0009) - - - - - - - -
Profitability - - 1.0516**
(0.0222)
1.0031
(0.0028) - - - - - -
EBITDA on
Total Assets - - - - 0.9976 (0.0034)
0.9905**
(0.0040) - - - -
EBITDA on
Sales - - - - - -
1.0060***
(0.0020)
1.0006
(0.0009) - -
ROA - - - - - - - - 0.9950 (0.0039) 0.9924
(0.0051)
TimeFromV
C
1.0922**
(0.0410)
0.9994
(0.0552)
1.0836**
(0.0405)
0.9941
(0.0626)
1.0846**
(0.0393)
1.0307
(0.0515)
1.0892**
(0.0410)
1.0205
(0.0595)
1.0828**
(0.0396)
1.0172
(0.0514)
PatentStock 1.2086 (0.1441) 0.8160
(0.1678) 1.1651 (0.1399)
0.7915
(0.1645)
1.2787**
(0.1472)
0.8406
(0.1616) 1.1805 (0.1457)
0.8301
(0.1663)
1.3070**
(0.1474)
0.8571
(0.1600)
Country
dummies Yes Yes Yes Yes Yes Yes Yes Yes Yes Yes

50
Industry
dummies Yes Yes Yes Yes Yes Yes Yes Yes Yes Yes
Year
dummies Yes Yes Yes Yes Yes Yes Yes Yes Yes Yes
Obs. 37048 37048 37194 37194 41650 41650 36842 36842 42014 42014
Groups 5901 5901 5956 5956 6348 6348 5952 5952 6305 6305
Pseudo R2 0.1377 0.1377 0.1362 0.1362 0.1285 0.1285 0.1340 0.1340 0.1295 0.1295
Log
pseudolikelih
ood
-2555.8849 -2555.8849 -2721.4855 -2721.4855 -3218.7365 -3218.7365 -2726.4466 -2726.4466 -3083.0822 -3083.0822
Legend: estimates are derived from multinomial logit regressions with standard errors robust to heteroskedasticity through the Huber-White method and serial correlation within portfolio companies.
In columns I, III, V, VI and IX, results related to the likelihood of a positive exit (IPO or trade-sale); in columns II, IV, VI, VIII and X, results related to the likelihood of a negative exit (liquidation).
Relative-risk ratios are reported. IVC is a dummy variable that equals one for the years after obtaining the first VC investment by an IVC investor and zero otherwise. GVC is a dummy variable that
equals one for the years after obtaining the first VC investment by a GVC investor and zero otherwise. SYND is a dummy variable that equals one for the years after obtaining the first VC investment
by a mixed IVC-GVC syndicate and zero otherwise. VC size represents the yearly number of VC investors backing the firm at time t-1. VC diversity looks at the VC affiliation (i.e., independent,
corporate, bank-affiliated, university-sponsored, governmental VC) and counts the number of sub-groupings of each VC type backing the firm at time t-1. Age is the logarithm of firm age. Bubble is
equal to 1 whether the first VC investment was received in the years 1999 or 2000. Bubble 1998-2000 is equal to 1 whether the first VC investment was received in the years 1998, 1999 or 2000.
Size is the logarithm of headcount at time t-1. ProfitMargin is the ratio net income/sales at time t-1. Profitability is the ratio (sales - payroll expenses)/sales value at time t-1. EBITDA on Total Assets
is the ratio EBITDA/total assets at time t-1. EBITDA on Sales is the ratio EBITDA/sales at time t-1. ROA is the ratio net income/total assets at time t-1. TimeFromVC is the time elapsed since the
first VC receipt. PatentStock is the logarithm of the patent stock at time t-1 (with yearly depreciation=0.15). Sales value, net income, payroll expenses, EBITDA, and total assets have been deflated
by the Consumer Price Index (source: Eurostat; reference year: 2005). Country, industry and time dummies are included in the estimates (coefficients are omitted in the table). All regressions are
estimated with an intercept term. Standard errors in round brackets. * p < .10; ** p < .05; *** p < .01.

51
Table 9. Alternative explanations
IPO/ACQUISITION LIQUIDATION IPO/ACQUISITION LIQUIDATION
I II III IV
IVC - - 2.4326*** (0.6912) 1.2474 (0.5679)
SYND - - 3.3561** (1.5854) 1.5926 (1.3619)
IVC_holding 3.1178** (1.5444) 1.5119 (0.9269) - -
GVC_holding 1.8014 (2.2024) 1.2014 (1.4575) - -
SYND_holding 6.6730*** (4.7390) 0.0000*** (0.000) - -
GVC_pre - - 1.3704 (0.8153) 0.8894 (0.7532)
IVC_post - - 2.4281 (2.9016) 2.0203 (2.1177)
VC Size 1.1527 (0.2594) 0.3530** (0.1447) 1.1182 (0.2381) 0.3673** (0.1482)
VC Diversity 0.7973 (0.4538) 6.2804*** (3.2851) 1.2223 (0.5165) 6.1923*** (3.1342)
Age 5.2726* (4.7825) 7.5312** (6.6308) 4.9035* (4.4439) 7.4744** (6.6164)
Age2 0.6975* (0.1501) 0.5574*** (0.1154) 0.7168 (0.1543) 0.5588*** (0.1163)
Bubble 1.4005 (0.3654) 0.7018 (0.3389) 1.0898 (0.3022) 0.6755 (0.3327)
Size 1.4208*** (0.800) 0.8877** (0.0412) 1.4031*** (0.0805) 0.8883** (0.0411)
ProfitMargin 1.0111*** (0.0042) 1.0006 (0.0009) 1.0105** (0.0042) 1.0006 (0.0009)
TimeFromVC 1.1612*** (0.0365) 1.0276 (0.0417) 1.0929** (0.0414) 1.0102 (0.0605)
PatentStock 1.2280* (0.1456) 0.8290 (0.1670) 1.2143 (0.1448) 0.8095 (0.1647)
Country dummies Yes Yes Yes Yes
Industry dummies Yes Yes Yes Yes
Year dummies Yes Yes Yes Yes
Obs. 37048 37048 37048 37048
Groups 5901 5901 5901 5901
Pseudo R2 0.1375 0.1375 0.1379 0.1379
Log
pseudolikelihood -2556.4191 -2556.4191 -2555.3026 -2555.3026
Legend: estimates are derived from multinomial logit regressions with standard errors robust to heteroskedasticity through the Huber-
White method and serial correlation within portfolio companies. In columns I and III, results related to the likelihood of a positive
exit (IPO or trade-sale); in columns II and IV, results related to the likelihood of a negative exit (liquidation). Relative-risk ratios are
reported. IVC is a dummy variable that equals one for the years after obtaining the first VC investment by an IVC investor and zero
otherwise. SYND is a dummy variable that equals one for the years after obtaining the first VC investment by a mixed IVC-GVC
syndicate and zero otherwise. IVC_holding is a dummy variable that equals one for the years after obtaining the first VC investment
by an IVC investor until the end of the IVC investor's holding period and zero otherwise. GVC_holding is a dummy variable that
equals one for the years after obtaining the first VC investment by a GVC investor until the end of the GVC investor's holding period
and zero otherwise. SYND_holding is a dummy variable that equals one for the years after obtaining the first VC investment by a
mixed IVC-GVC syndicate until the end of the mixed IVC-GVC syndicate's holding period and zero otherwise. GVC_pre is a
dummy variable that equals one for the years after obtaining the first VC investment by a GVC investor until the (potential) receipt of
a subsequent IVC investment and zero otherwise. IVC_post is a dummy variable that equals one from the year of a subsequent IVC
investment, which occurs after the first GVC investment, and zero otherwise. VC size represents the yearly number of VC investors
backing the firm at time t-1. VC diversity looks at the VC affiliation (i.e., independent, corporate, bank-affiliated, university-
sponsored, governmental VC) and counts the number of sub-groupings of each VC type backing the firm at time t-1. Age is the
logarithm of firm age. Bubble is equal to 1 whether the first VC investment was received in the years 1999 or 2000. Size is the
logarithm of headcount at time t-1. ProfitMargin is the ratio net income/sales at time t-1. TimeFromVC is the time elapsed since the
first VC receipt. PatentStock is the logarithm of the patent stock at time t-1 (with yearly depreciation=0.15). Sales value and net
income have been deflated by the Consumer Price Index (source: Eurostat; reference year: 2005). Country, industry and time
dummies are included in the estimates (coefficients are omitted in the table). All regressions are estimated with an intercept term.
Standard errors in round brackets. * p < .10; ** p < .05; *** p < .01.

52
Table 10. Alternative explanations
IPO/ACQUISITION LIQUIDATION IPO/ACQUISITION LIQUIDATION IPO/ACQUISITION LIQUIDATION
I II III IV V VI
IVC 2.6842*** (0.8834) 1.2520 (0.5779) 2.2065*** (0.6582) 1.1343 (0.4961) 2.6687*** (0.9275) 1.1204 (0.5931)
GVC 2.2899 (1.4248) 1.3860 (0.9855) 1.3253 (0.7757) 0.9823 (0.6747) 1.1063 (0.8189) 1.0843 (0.8501)
SYND 2.9200* (1.6000) 1.9926 (1.7244) 3.3308*** (1.5067) 1.4294 (1.2431) 3.7693** (2.3542) 0.9302 (1.0602)
VC Size 1.2630 (0.2482) 0.2388** (0.1568) 1.0971 (0.2350) 0.3618** (0.1497) 1.0371 (0.2566) 0.3079** (0.1458)
VC Diversity 0.8892 (0.3635) 9.7933*** (7.0612) 1.2222 (0.5164) 6.1190*** (3.1051) 1.2878 (0.6422) 8.9983*** (5.2935)
Age 1.7530 (1.8622) 5.7847 (6.2506) 5.2806* (4.8235) 7.8755** (7.0035) 6.2855** (5.8721) 8.0461** (7.1514)
Age2 0.9188 (0.2305) 0.5884** (0.1473) 0.7199 (0.1559) 0.5552*** (0.1158) 0.6704* (0.1486) 0.5475*** (0.1144)
Bubble 0.9591 (0.3122) 0.5557 (0.3166) 1.0656 (0.2936) 0.6587 (0.3164) 1.2122 (0.3844) 0.6905 (0.3555)
Size 1.4972*** (0.0994) 0.9086* (0.0459) 1.4067*** (0.0807) 0.8888** (0.0411) 1.4271*** (0.0849) 0.8860** (0.0417)
ProfitMargin 1.0093** (0.0047) 1.0002 (0.0005) 1.0114*** (0.0042) 1.0007 (0.0009) 1.0082** (0.0037) 1.0004 (0.0007)
TimeFromVC 1.1063** (0.0470) 1.0212 (0.0597) 1.0577 (0.0405) 0.9805 (0.0649) 1.1058** (0.0522) 1.0406 (0.0710)
PatentStock 1.1640 (0.1530) 0.7180 (0.1615) 1.1854 (0.1432) 0.8028 (0.1649) 1.0737 (0.1375) 0.8173 (0.1694)
DTA 1.0170*** (0.0058) 1.0029 (0.0114) - - - -
NCFTA 0.9895 (0.0073) 1.0599 (0.1222) - - - -
Earlystage - - 1.6900 (0.5791) 1.5280 (0.5747) - -
Distance - - - - 1.0001 (0.0002) 0.9997 (0.0002)
Country dummies Yes Yes Yes Yes Yes Yes
Industry dummies Yes Yes Yes Yes Yes Yes
Year dummies Yes Yes Yes Yes Yes Yes
Obs. 29206 29206 37048 37048 36404 36404
Groups 5164 5164 5901 5901 5788 5788
Pseudo R2 0.1332 0.1332 0.1384 0.1384 0.1408 0.1408
Log pseudolikelihood -2018.5674 -2018.5674 -2553.6367 -2553.6367 -2495.0815 -2495.0815
Legend: estimates are derived from multinomial logit regressions with standard errors robust to heteroskedasticity through the Huber-White method and serial correlation within portfolio companies.
In columns I, III and V, results related to the likelihood of a positive exit (IPO or trade-sale); in columns II, IV and VI, results related to the likelihood of a negative exit (liquidation). Relative-risk
ratios are reported. IVC is a dummy variable that equals one for the years after obtaining the first VC investment by an IVC investor and zero otherwise. GVC is a dummy variable that equals one for
the years after obtaining the first VC investment by a GVC investor and zero otherwise. SYND is a dummy variable that equals one for the years after obtaining the first VC investment by a mixed
IVC-GVC syndicate and zero otherwise. VC size represents the yearly number of VC investors backing the firm at time t-1. VC diversity looks at the VC affiliation (i.e., independent, corporate,
bank-affiliated, university-sponsored, governmental VC) and counts the number of sub-groupings of each VC type backing the firm at time t-1. Age is the logarithm of firm age. Bubble is equal to 1
whether the first VC investment was received in the year 1999 or 2000. Size is the logarithm of headcount at time t-1. ProfitMargin is the ratio net income/sales at time t-1. TimeFromVC is the time
elapsed since the first VC receipt. PatentStock is the logarithm of the patent stock at time t-1 (with yearly depreciation=0.15). DTA is the ratio between short-term debt and total assets at time t-1.
NCFTA is the ratio between net cash flow and total assets at time t-1. Earlystage is a dummy variable that equals one for the companies which obtained the first VC investment in the first two years
after firm foundation and zero otherwise (the variable is set to zero for all non VC-backed companies). Distance measures the geographic distance between the lead investor of the first VC
investment and the target company (in kilometers) (the variable is set to zero for all non VC-backed companies). Sales value, net income, short-term debt, total assets, and net cash flow have been
deflated by the Consumer Price Index (source: Eurostat; reference year: 2005). Country, industry and time dummies are included in the estimates (coefficients are omitted in the table). All
regressions are estimated with an intercept term. Standard errors in round brackets. * p < .10; ** p < .05; *** p < .01.

53
Figure 1. Estimates of the non-parametric hazard function of a positive outcome
Legend: on the horizontal and vertical axes, there are the firm age and the estimated unconditional likelihood of a positive exit,
respectively. The smoothed hazard function is the unconditional instantaneous probability of a positive exit (IPO or trade-sale),
provided that this has not occurred by t. The smoothed hazard function is estimated through a semi-parametric approach (Cox, 1972).
.00
4.0
045
.00
5.0
055
.00
6.0
065
0 5 10 15 20analysis time
Smoothed hazard estimate

54
Figure 2. Estimates of the non-parametric hazard function of a negative outcome
Legend: on the horizontal and vertical axes, there are the firm age and the estimated unconditional likelihood of a negative exit,
respectively. The smoothed hazard function is the unconditional instantaneous probability of a negative exit (liquidation), provided
that this has not occurred by t. The smoothed hazard function is estimated through a semi-parametric approach (Cox, 1972).
.01
.01
2.0
14
.01
6.0
18
0 5 10 15 20analysis time
Smoothed hazard estimate