
Research in Governmental and Nonprofit Accounting
390
-
Upload
khangminh22 -
Category
Documents
-
view
3 -
download
0
Transcript of Research in Governmental and Nonprofit Accounting


RESEARCH IN GOVERNMENTAL
AND NONPROFIT ACCOUNTING

RESEARCH IN GOVERNMENTALAND NONPROFIT ACCOUNTING
Series Editor: Paul A. Copley
Recent Volumes:
Volumes 1–9: Edited by James L. Chan
Volumes 10–11: Edited by Paul A. Copley
RESEARCH IN GOVERNMENTAL AND NONPROFIT
ACCOUNTING VOLUME 12
RESEARCH INGOVERNMENTALAND NONPROFITACCOUNTING
EDITED BY
PAUL A. COPLEYKPMG Professor, School of Accounting,
James Madison University, Harrisonburg, VA, USA
ASSOCIATE EDITOR
EDWARD B. DOUTHETT, JR.School of Management, George Mason University,
Fairfax, VA, USA
United Kingdom – North America – Japan
India – Malaysia – China

JAI Press is an imprint of Emerald Group Publishing Limited
Howard House, Wagon Lane, Bingley BD16 1WA, UK
First edition 2009
Copyright r 2009 Emerald Group Publishing Limited
Reprints and permission service
Contact: [email protected]
No part of this book may be reproduced, stored in a retrieval system, transmitted in any
form or by any means electronic, mechanical, photocopying, recording or otherwise
without either the prior written permission of the publisher or a licence permitting
restricted copying issued in the UK by The Copyright Licensing Agency and in the USA
by The Copyright Clearance Center. No responsibility is accepted for the accuracy of
information contained in the text, illustrations or advertisements. The opinions expressed
in these chapters are not necessarily those of the Editor or the publisher.
British Library Cataloguing in Publication Data
A catalogue record for this book is available from the British Library
ISBN: 978-1-84855-760-4
ISSN: 0884-0741 (Series)
Awarded in recognition ofEmerald’s productiondepartment’s adherence toquality systems and processeswhen preparing scholarlyjournals for print
CONTENTS
LIST OF CONTRIBUTORS ix
EDITORIAL BOARD xi
EDITOR’S COMMENTS xiii
SECTION I: RESEARCH PAPERS
DIFFERENCES IN NON-PROFIT ORGANIZATIONFINANCIAL STATEMENT AND COMPLIANCEAUDIT ASSESSMENTS BETWEEN BIG 5 ANDNON-BIG 5 AUDITORS
Stefanie L. Tate 3
FUNDAMENTAL ANALYSIS OF NOT-FOR-PROFITFINANCIAL STATEMENTS: AN EXAMINATION OFFINANCIAL VULNERABILITY MEASURES
Linda M. Parsons and John M. Trussel 35
THE EFFECT OF THE 150-HOUR EDUCATIONALREQUIREMENTS ON MUNICIPAL AUDIT FEES
Arthur Allen and George Sanders 57
DECOMPOSING THE ELEMENTS OF NONPROFITORGANIZATIONAL PERFORMANCE
Daniel Tinkelman and Bairj Donabedian 75
v

AUDITOR ATTESTATION OF MANAGEMENT’SEVALUATION OF INTERNAL CONTROL:EVIDENCE FROM THE NONPROFIT SECTOR
Thomas E. Vermeer, K. Raghunandan andDana A. Forgione
99
HOSPITAL PERFORMANCE SURROUNDING THEBOND RATING REVISION EVENT
Kreag Danvers 121
DID BOND PRICES REFLECT ACCRUAL BASISAPPROXIMATIONS BEFORE GASB STATEMENTNO. 34?
Jacqueline L. Reck, Ottalee Schiffel and Earl R. Wilson 169
THE ASSOCIATION OF ACCOUNTING MEASURESAND MUNICIPAL BOND INTEREST COST: A TESTOF GASB 14
Barbara A. Chaney 189
THE EFFECT OF GOVERNMENTAL ACCOUNTINGSTANDARDS BOARD STATEMENT 34 ONMUNICIPAL AUDIT FEES
Arthur Allen and George Sanders 215
PUBLICATION RATES OF GOVERNMENTAL ANDNONPROFIT MANUSCRIPTS AMONG TWENTY-FIVELEADING ACADEMIC ACCOUNTING JOURNALS
Paul A. Copley, Bradley M. Roof and Eileen M. Shifflett 233
CONTENTSvi

SECTION II: THEORIES OF NOT-FOR-PROFITACCOUNTING: COMPARISON AND APPLICATION OF
CURRENT AND PROPOSED REPORTING FRAMEWORKSBY TERESA P. GORDON AND SALEHA B. KHUMAWALA
OVERVIEW 249
CHAPTER 1 INTRODUCTION 251
CHAPTER 2 THEORIES OF ACCOUNTING FORNONBUSINESS ENTITIES
265
CHAPTER 3 THE FASB MODEL 283
CHAPTER 4 THE GASB MODEL 297
CHAPTER 5 ANTHONY’S PROPOSEDACCOUNTING MODEL
319
CHAPTER 6 MAUTZ’S PROPOSED ACCOUNTINGMODEL
327
CHAPTER 7 COMPARISON OF FINANCIALSTATEMENTS
337
APPENDIX: SUPPORTING SCHEDULESHIGHLIGHTING DIFFERENCES IN MODELS
355
Contents vii

This page intentionally left blank
LIST OF CONTRIBUTORS
Arthur Allen School of Accountancy, University ofNebraska – Lincoln, NE, USA
Barbara A. Chaney Department of Accounting and Finance,University of Montana, Missoula,MT, USA
Paul A. Copley School of Accounting, James MadisonUniversity, Harrisonburg, VA, USA
Kreag Danvers Department of Accountancy, ClarionUniversity, Clarion, PA, USA
Bairj Donabedian Department of Accounting, PaceUniversity, New York, NY, USA
Dana A. Forgione Department of Accounting, University ofTexas at San Antonio, San Antonio, TX,USA
Teresa P. Gordon Department of Accounting, University ofIdaho, Moscow, ID, USA
Saleha B. Khumawala Department of Accountancy & Taxation,University of Houston, Houston, TX,USA
Linda M. Parsons Culverhouse School of Accountancy,University of Alabama, Tuscaloosa,AL, USA
K. Raghunandan School of Accounting, FloridaInternational University, Miami, FL,USA
Jacqueline L. Reck School of Accountancy, University ofSouth Florida, Tampa, FL, USA
ix
Bradley M. Roof School of Accounting, James MadisonUniversity, Harrisonburg, VA, USA
George Sanders Department of Accounting, WesternWashington University, Bellingham, WA,USA
Ottalee Schiffel Department of Accounting, ValparaisoUniversity, Valparaıso, IN, USA
Eileen M. Shifflett School of Accounting, James MadisonUniversity, Harrisonburg, VA, USA
Stefanie L. Tate Department of Accounting,College of Management, University ofMassachusetts Lowell, Lowell, MA, USA
Daniel Tinkelman Department of Accounting, Taxationand Legal Studies in Business, HofstraUniversity, Hempstead, NY, USA
John M. Trussel School of Business Administration,Dalton State College, Dalton, GA, USA
Thomas E. Vermeer Department of Accounting andManagement Information Systems,University of Delaware, Newark, DE,USA
Earl R. Wilson School of Accountancy,University of Missouri-Columbia,Columbia, MO, USA
LIST OF CONTRIBUTORSx
EDITORIAL BOARD
William BaberGeorgetown University
James ChanUniversity of Illinois, Chicago
Barbara A. ChaneyUniversity of Montana
Edward DouthettGeorge Mason University
Randal ElderSyracuse University
Ehsan FerozUniversity of Washington, Tacoma
Dana A. ForgioneUniversity of Texas, San Antonio
Gary GirouxTexas A&M University
Teresa P. GordonUniversity of Idaho
Rob IngramUniversity of Alabama
Saleha B. KhumawalaUniversity of Houston
Tim LouwersJames Madison University
Barry MarksUniversity of Houston, Clear Lake
Mark RubinMiami University
George SandersWestern Washington University
Daniel TinkelmanHofstra University
xi

This page intentionally left blank
EDITOR’S COMMENTS
I am pleased to present Volume 12 of Research in Governmental andNonprofit Accounting, the only series dedicated exclusively to governmentaland nonprofit accounting and reporting issues. The purpose of Research inGovernmental and Nonprofit Accounting is to stimulate and report high-quality research on a wide range of governmental and nonprofit accountingtopics.
The volume contains 10 research manuscripts, presented in order ofacceptance. In addition, Volume 12 contains a monograph by Gordon andKhumawala describing varying theories of reporting by nonprofit organiza-tions. In my view the monograph is well suited for students studyingaccounting theory.
I am indebted to Ed Douthett for his service as Associate Editor and tomembers of the Editorial Board for serving as reviewers. Most importantly,I extend my sincere thanks to the authors who chose to submit theirmanuscripts to Research in Governmental and Nonprofit Accounting.
This volume is dedicated to the memory of those lost atVirginia Tech, April 16, 2007, andNorthern Illinois, February 14, 2008.
Paul CopleyEditor
xiii

This page intentionally left blank

SECTION I
RESEARCH PAPERS

This page intentionally left blank
DIFFERENCES IN NON-PROFIT
ORGANIZATION FINANCIAL
STATEMENT AND COMPLIANCE
AUDIT ASSESSMENTS BETWEEN
BIG 5 AND NON-BIG 5 AUDITORS
Stefanie L. Tate
ABSTRACT
I investigate whether Big 5 auditors provide better assessments than non-Big 5 auditors in a financial statement and compliance audit setting.While prior studies consistently indicate users of financial statements andcompanies hiring auditors believe there are quality differences betweenauditors, there is little research on how these quality differences translateinto specific differences in auditors’ assessments and judgments. Using adatabase of almost 77,000 compliance and financial statement auditresults for non-profit organizations for fiscal years 1997–2000, I find Big5 auditors report more non-compliance with federal regulations in theform of findings and questioned costs than non-Big 5 auditors, consistentwith audit quality theory. However, in contrast to expectations, and aftercontrolling for the number and extent of errors identified by the auditor,I find Big 5 auditors are less likely, rather than more likely, than non-Big5 auditors to qualify their report on an organization’s compliance with
Research in Governmental and Nonprofit Accounting, Volume 12, 3–33
Copyright r 2009 by Emerald Group Publishing Limited
All rights of reproduction in any form reserved
ISSN: 0884-0741/doi:10.1108/S0884-0741(2009)0000012003
3
federal regulations. In addition, in contrast to expectations, I find Big 5auditors are less likely, rather than more likely, than non-Big 5 auditorsto report significant deficiencies in internal controls.
INTRODUCTION
DeAngelo (1981) hypothesizes that audit firms differentiate themselves onquality and larger audit firms have incentives to provide higher qualityaudits. In addition, much of the audit quality literature indicates that qualitydifferences between Big 5 and non-Big 5 auditors are inferred by both usersof financial statements and companies selecting an auditor. However, fewstudies directly test for the quality differences between auditor types, and theresults from those studies have been mixed (for example, see Krishnan &Schauer, 2000; Copley, 1991; Petroni & Beasley, 1996; Colbert & Murray,1998; O’Keefe, King, & Gaver, 1994). I examine differences in auditassessments made by Big 5 and non-Big 5 auditors in a financial statementand compliance audit setting to identify possible benefits to non-profitorganizations of hiring different types of auditors.
Prior research indicates that Big 5 auditors may restrict management’sability to manipulate earnings (Becker, Defond, Jiambalvo, & Subramanyam,1998; Francis, Maydew, & Sparks, 1999; Davidson & Neu, 1993). However,these studies use indirect measures of earnings manipulation (discretionaryaccruals and differences between forecasted and audited earnings) andconcerns regarding the reliability of these indirect measures limit theinterpretability of the results. In addition, outside of earnings management,there has been little research on differences in auditors’ other assessments andjudgments, and these results have been inconsistent. Without a clearerunderstanding of the actual differences in more diverse auditor assessmentsand judgments, clients, users of financial statements, and regulators cannotproperly assess what effect audit quality should have on their decisions.
I use a database maintained by the United States Federal Clearinghouseof the results of financial statement and compliance audits performed inaccordance with the Office of Management and Budget’s (1997) A-133requirements (A-133 audit). These audits are required for all non-profitorganizations receiving significant funding from federal agencies, andrequire the auditor to issue an opinion on the organization’s financialstatements, schedule of federal awards, and compliance with federalregulations, in addition to providing a report on the organization’s internal
STEFANIE L. TATE4
control structure and identified findings and questioned costs. This analysisextends prior research by investigating judgments made by auditorsoutside of a strictly financial statement setting using multivariate analysis.By investigating the effects of different types of auditors on the reporting ofquestioned costs, I am also able to estimate possible financial costs to anorganization of hiring different types of auditors. Prior studies have beenplagued by the inability to adequately control for client characteristics thatmay influence auditor selection. I control for this self-selection bias byallowing each organization to act as a control for itself, and eliminate theeffects of unobservable organizational factors that stay constant over time.
The results, using almost 77,000 observations from 35,950 different non-profit organizations over a 4-year period from 1997 through 2000, aremixed. Using multivariate regression and controlling for organizationalfactors that do not change over time through the use of different estimationtechniques, I find Big 5 auditors report more questioned costs and morefindings than non-Big 5 auditors, consistent with audit quality theory.However, in contrast to expectations, and after controlling for the numberand extent of errors identified by the auditor, I find Big 5 auditors are lesslikely (rather than more likely) than non-Big 5 auditors to qualify theirreport on an organization’s compliance with federal regulations and are lesslikely (rather than more likely) to report deficiencies in internal controlstructures in the form of reportable conditions.
The remainder of this chapter is laid out as follows. In the next section,I discuss the theory development, followed by background information onA-133 audit requirements. I follow these sections with the hypotheses,methodology, and then the results. I conclude with a discussion on the studylimitations, implications, and future research.
THEORY DEVELOPMENT
DeAngelo (1981) defines audit quality as the ‘‘market-assessed jointprobability that a given auditor will both (a) discover a breach in theclient’s accounting system, and (b) report the breach’’ (p. 186). DeAngelohypothesizes that larger audit firms have more ability to specialize andinnovate through technology, thereby increasing the likelihood they willdiscover a breach in the accounting system. She also contends that largeraudit firms are more independent from their clients, thereby increasing thelikelihood they will report an identified breach. Using these assumptions,DeAngelo hypothesizes that larger firms provide higher quality audits.
Differences in Financial Statement and Compliance Audit Assessments 5
Prior research consistently indicates that companies hiring auditors andusers of financial statements believe there is a difference in auditors. Resultssuggest that organizations select larger auditors when agency costs are high(for example, see DeFond, 1992; Firth & Smith, 1992; Simunic & Stein,1987), and when organizational risk is high (for example, see Datar,Feltham, & Hughes, 1991; Firth & Smith, 1992; Clarkson & Simunic, 1994;Copley, Gaver, & Gaver, 1995; Firth & Liau-Tan, 1998; Lee, Stokes,Taylor, & Walter, 2003).1 In addition, both Craswell, Francis, and Taylor(1995) and Beattie, Goodacre, Pratt, and Stevenson (2001) find that organi-zations are willing to pay a fee premium to larger audit firms. There are alsogenerally consistent results that indicate financial statements audited bylarger audit firms are relied upon more heavily by decision makers thanfinancial statements audited by smaller audit firms (for example, Allen,1994; Balvers, McDonald, & Miller, 1988; Beatty, 1989; Teoh & Wong,1993).
Many measures of quality have been used to test whether larger auditfirms actually provide higher quality audits. Becker et al. (1998) and Franciset al. (1999) investigate the relationship between auditor size and discre-tionary accruals – an indirect measure of earnings management – and findresults consistent with DeAngelo’s hypothesis. However, studies usingearnings forecast errors as a measure of audit quality have not foundconsistent results. Davidson and Neu (1993) and Clarkson (2000)2 findlarger audit firms are associated with lower forecast errors, but Firth andSmith (1992) find no differences between large and small audit firms.
Studies using more direct measures of audit quality have also foundinconsistent results. Colbert and Murray (1998) and O’Keefe et al. (1994)both use external evaluations of the audit performed (unqualified AICPAPrivate Companies Section Peer Review reports and indications ofviolations of generally accepted auditing standards, respectively), and findthat larger audit firms do provide higher quality audits. Krishnan andSchauer (2000) find voluntary health and welfare organizations audited bylarger audit firms have better financial statement disclosures thanorganizations audited by smaller audit firms. However, Copley (1991) doesnot find consistent results that municipalities audited by Big 8 auditors havebetter financial statement disclosures than non-Big 8 audited municipalities.And Petroni and Beasley (1996) were unable to find any difference in theaccuracy of claim loss reserves of property casualty insurers audited by Big 8firms as compared to insurers audited by non-Big 8 firms.
In summary, prior research consistently shows that organizations anddecision makers believe that larger firms provide higher quality audits than
STEFANIE L. TATE6
smaller firms. However, research investigating actual differences in theauditor’s outputs has resulted in inconsistent results, and these studies havefocused mainly on earnings management. The remainder of this chapterseeks to broaden our understanding of the differences in auditor’sjudgments and assessments between larger and smaller firms.
A-133 BACKGROUND
Non-profit organizations that receive greater than $300,0003 in federalfunding (i.e., grants from federal agencies) are required to have an annual orbiennial audit performed in accordance with the Office of Management andBudget’s Circular No. A-133 (A-133 audit). This circular requires theauditor to provide opinions on the organization’s financial statements,schedule of federal awards, and compliance with federal regulations. Theauditor must also provide a report on the organization’s internal controlsystem and a schedule of findings and questioned costs.
I focus on the schedule of findings and questioned costs, the auditors’opinion on the organization’s compliance with federal regulations, and theauditors’ report on the organization’s internal control system, each of whichis discussed later. When an organization receives federal funds, it must agreeto adhere to specific government regulations governing the use of thosefunds. For example, government regulations require non-profits to adequ-ately monitor subrecipients and submit timely reports to their grantingagencies. In addition, government regulations maintain strict regulationsover how grant money may be spent and on what types of expenditures.In the A-133 audit, the auditor must assess the organization’s compliancewith each of the applicable government regulations, noting all instances ofnon-compliance on the schedule of findings and questioned costs. A findingis a specific instance of non-compliance that does not have a direct financialimpact, while a questioned cost would have a financial effect. For instance,not submitting timely progress reports would be considered a finding, whileusing federal money for unallowable expenditures (alcohol, for instance)would be considered a questioned cost.
After all audit procedures are performed, and all findings and questionedcosts are identified, the auditor must form, and provide a report on, theiroverall opinion on the organization’s compliance with federal regulations.In addition, the auditor will review the internal control structure of theorganization and provide a report indicating any significant deficiencies inthe internal controls. This last report is similar to the report an auditor
Differences in Financial Statement and Compliance Audit Assessments 7
would provide to an audit committee or board of directors of a for-profitcorporation when there are reportable conditions or material weaknesses ininternal controls (AICPA, 2006).
HYPOTHESES
If audit quality is defined as the ‘‘market-assessed joint probability that agiven auditor will both (a) discover a breach in the client’s accountingsystem, and (b) report the breach’’ (DeAngelo, 1981, p. 186), higher qualityauditors are expected to find and report more compliance and internalcontrol problems than lower quality auditors, assuming the same rate ofproblems across the auditors’ clients. In an A-133 audit, higher qualityauditors are expected to have a better understanding of all governmentregulations and the requirements for an adequate system of internalcontrols. A higher quality auditor will design and perform more effectiveaudit tests to identify costs that are questionable, policies that are not incompliance with federal regulations, and significant deficiencies in theinternal control structure. In addition, independence is crucial in this type ofaudit since the results of the audit can have a serious impact on a non-profitorganization’s ability to continue managing federal grants. Based onDeAngelo’s theory, higher quality auditors are less likely than lower qualityauditors to be influenced by clients’ desires not to include these issues intheir A-133 reports.
I test DeAngelo’s hypothesis that larger audit firms provide higher qualityaudits using the above measures of quality in the A-133 audit setting.Consistent with prior research, I separate audit firms into two size groups –Big 5 and non-Big 54 – and determine whether the larger audit firms reportmore findings, questioned costs, material non-compliance with federalregulations, and reportable conditions in internal controls.5 The fourhypotheses are:
H1. Big 5 auditors will report more findings than non-Big 5 auditors,ceteris paribus.
H2. Big 5 auditors will report more questioned costs than non-Big 5auditors, ceteris paribus.
H3. Big 5 auditors will report more qualified opinions on an organiza-tion’s compliance with federal regulations than non-Big 5 auditors, ceterisparibus.
STEFANIE L. TATE8
H4. Big 5 auditors will report more reportable conditions in internalcontrol structures than non-Big 5 auditors, ceteris paribus.
METHODOLOGY
Data
The entire contents of the Federal Clearinghouse database were downloadedin November 2000. This database consists of all A-133 audit reports andsummary reports submitted to the Federal Clearinghouse since 1997.6 Forthis study, an organization could have been included in the database up tofour times, assuming they submitted annual reports from 1997 through2000. There were 87,567 organization-years included in the database. And6,611 organization-years were excluded from the database because they didnot receive a complete financial statement audit, did not receive an annualaudit,7 or were audited by a state auditor instead of an independent CPAfirm. Six hundred sixty observations with going concern opinions, and 221observations with no data on the going concern opinion were excluded toeliminate potential effects on the regression models of poor financial health.8
Finally, 3,118 observations were excluded because the organization filedmultiple reports under the same employer identification number (EIN). Anorganization can file multiple A-133 reports under the same EIN fordifferent divisions, departments, or locations that are under the samemanagement. These items have been excluded from the study to reduce thepossibility that year-to-year comparisons do not contain the same reportsfor each EIN. The remaining sample includes 76,957 organization-years ofdata, with each organization in the database for an average of 2.15 years. All76,957 observations are used in the fixed effects models (discussed later).However, an additional 2,628 observations were deleted for use in thechanges models (also discussed later) to ensure that only consecutive yearchanges are included in these models. Fixed effects estimations are notaffected by non-consecutive years.
Models: Hypotheses 1 and 2
Actual findings and questioned costs are all instances of non-compliancewith federal regulations. Identified findings and questioned costs include
Differences in Financial Statement and Compliance Audit Assessments 9
only those costs or client policies that the auditor finds during testwork andreports as not being in compliance with federal regulations. Becauseauditors do not test 100% of all costs charged to every grant, identifiedfindings and questioned costs are not equivalent to the actuals. Identifiedfindings and questioned costs are a function of the extent of testworkperformed by the auditor, the auditors’ understanding of the federalregulations, the effectiveness of the auditors’ tests, and the willingness of theauditor to report those questioned costs. All of these factors togetherrepresent the auditors’ quality. Therefore, identified findings and questionedcosts, which are what is included in the auditors’ reports, and hence thedataset for this study, are expected to be a function of the actual findingsand questioned costs, and auditor quality.
Actual findings and questioned costs are hypothesized to be a function ofthe organization’s familiarity with federal regulations, and the complexityand the number of federal regulations to which an organization is subject.Organizations in their first year of receiving federal funds will have lessexperience with the regulations and will be more likely to make errors. Inaddition, management is less able to monitor all charges and programrequirements as the number and complexity of those programs increase.
Management may be able to mitigate the difficulties in monitoringnumerous programs by instituting effective internal controls. Strong internalcontrols help to ensure that all costs charged to individual grants and allorganizational policies are accurate and meet federal regulations; therefore,indications of weak internal controls may also be indications of environ-ments where higher findings and questioned costs are expected. Externalfactors, including regulatory and economic factors, may also have someimpact on the occurrence of findings and questioned costs.
The theoretical model for H1 and H2 combine those factors that affectthe occurrence of actual findings and questioned costs as discussed earlier,with the quality of the auditor, which affects the identification and reportingof findings and questioned costs. The theoretical model used is
Reported Findings or Questioned Costs ¼ fðAuditor; Familiarity;
Complexity; Internal Controls; Time Specific External FactorsÞ
By replacing the individual constructs included in the model earlier withobservable variables, the actual equations estimated for H1 and H2 become
FINDit ¼ ai þ b1B5it þ b2NEWit þ b3PROGit þ b4LFEDit þ b5RCit
þ b6Y98t þ b7Y99t þ b8Y00t þ �it
STEFANIE L. TATE10
and
QC%it ¼ ai þ b1B5it þ b2NEWit þ b3PROGit þ b4LFEDit þ b5RCit
þ b6Y98t þ b7Y99t þ b8Y00t þ �it
Total number of reported findings (FIND) is the dependent variable forH1. Because questioned costs are limited by the organization’s total federalexpenditures (the maximum amount of costs that can be questioned is equalto the total expenditures charged to federal grants), questioned costs arescaled by the total dollar amount of costs that could be identified by theauditor; questioned costs reported by the auditor as a percent of totalfederal expenditures (QC%)9 is used as the dependent variable for H2.
The construct of interest is the auditor type. Auditors are separated intotwo groups – Big 5 and non-Big 510 – consistent with prior literature testingDeAngelo’s hypothesis. In the fixed effects regressions, the groups weremeasured using a dummy variable (B5) – ‘‘1’’ for Big 5, ‘‘0’’ otherwise. Inthe changes models, the change in Big 5 is modeled using two separatedummy variables – UP and DOWN. UP is coded as ‘‘1’’ for organizationschanging from a non-Big 5 to a Big 5 auditor, and ‘‘0’’ otherwise, whileDOWN is coded as ‘‘1’’ for organizations changing from a Big 5 to a non-Big 5 auditor, and ‘‘0’’ otherwise. This allows for differential effects of goingfrom a Big 5 auditor to a non-Big 5 auditor (theoretically decreasing auditquality) and from a non-Big 5 auditor to a Big 5 auditor (theoreticallyincreasing auditor quality).
Familiarity with federal regulations is measured using the variable NEW.Fiscal year 1997 is the first year the database was maintained and thereforeis the first year any organization can be included in the database. For anyorganization whose first A-133 report in this dataset is after 1997, NEW iscoded as ‘‘1’’ in the first year the information is included, and ‘‘0’’ otherwise.An organization can only be coded as NEW once, and only if the first year itis included in the dataset is after 1997.11 The complexity of federal programsis measured by two variables – the total number of programs for which anorganization receives funding (PROG) and the natural log of total federalexpenditures (LFED).12 The indication of reportable conditions (RC) isincluded to control for the quality of the internal control structure andis included in the model as a dummy variable. In the fixed effects model,RC is coded as ‘‘1’’ if there is an indication of poor internal controls, and‘‘0’’ otherwise. In the changes model, the change in RC is ‘‘�1’’ if theorganization has changed from an indication of material internal control
Differences in Financial Statement and Compliance Audit Assessments 11
problems to no indication of such problems, ‘‘1’’ if the organization haschanged from no material internal control problems to an indication of suchproblems, and ‘‘0’’ for no change in the quality of the internal controlstructure. Year dummies (Y98, Y99, and Y00) are included to control forgeneral regulatory and economic environmental factors that change fromyear to year. A summary of the variable definitions is included in Table 1.
Model: Hypothesis 3
Material non-compliance occurs when an organization does not complywith those regulations that have a material effect on the federal programsunder which they are operating. Auditors form their opinion on whether ornot an organization has material instances of non-compliance by reviewingthe extent and nature of findings and questioned costs identified throughoutthe audit. Given this, actual material non-compliance is expected to beaffected by many of the same factors that affect an organization’s actualfindings and questioned costs discussed earlier.
Similar to the previous discussion, actual material non-compliance doesnot equal reported material non-compliance since the latter is dependent onthe quality of the auditor. I estimate the effects of auditor type on thelikelihood of an organization receiving a qualified opinion on materialcompliance by controlling for those organizational factors that are expectedto affect actual material compliance, while controlling for the level andextent of reported findings and questioned costs. The equation estimated is
MNCit ¼ ai þ b1B5it þ b2NEWit þ b3PROGit þ b4LFEDit þ b5RCit
þ b6FINDit þ b7QC%it þ b8Y98t þ b9Y99t þ b10Y00t þ �it
where MNC is a dummy variable indicating whether there was a qualifiedopinion on compliance with federal regulations. In the fixed effects model,MNC is coded as ‘‘0’’ for an unqualified opinion and ‘‘1’’ otherwise. In thechanges model, the change in MNC is coded as ‘‘�1’’ if the organization hasgone from a qualified opinion to an unqualified opinion, ‘‘1’’ if theorganization has gone from an unqualified opinion to a qualified opinion,and ‘‘0’’ if there has been no change. All other variables are defined as earlierin H1 and H2, and are summarized in Table 1.
STEFANIE L. TATE12
Model: Hypothesis 4
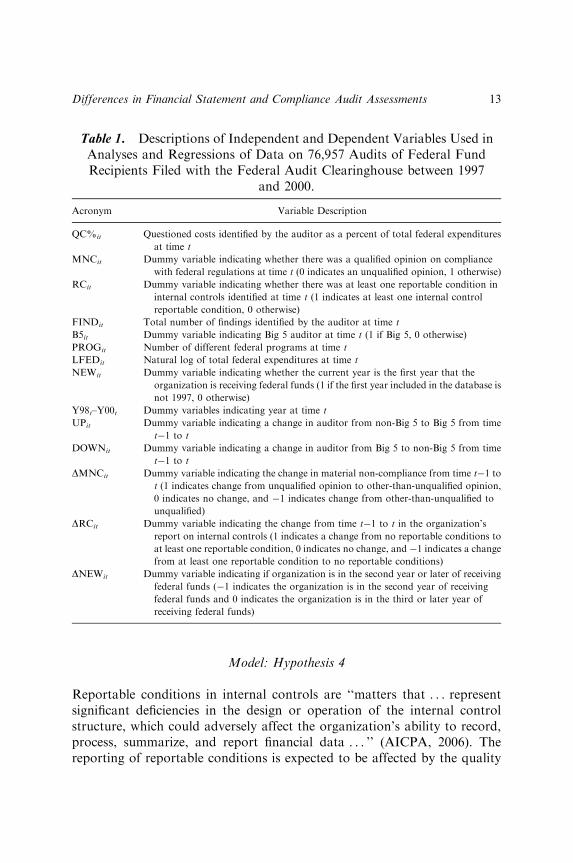
Reportable conditions in internal controls are ‘‘matters that . . . representsignificant deficiencies in the design or operation of the internal controlstructure, which could adversely affect the organization’s ability to record,process, summarize, and report financial data . . . ’’ (AICPA, 2006). Thereporting of reportable conditions is expected to be affected by the quality
Table 1. Descriptions of Independent and Dependent Variables Used inAnalyses and Regressions of Data on 76,957 Audits of Federal FundRecipients Filed with the Federal Audit Clearinghouse between 1997
and 2000.
Acronym Variable Description
QC%it Questioned costs identified by the auditor as a percent of total federal expenditures
at time t
MNCit Dummy variable indicating whether there was a qualified opinion on compliance
with federal regulations at time t (0 indicates an unqualified opinion, 1 otherwise)
RCit Dummy variable indicating whether there was at least one reportable condition in
internal controls identified at time t (1 indicates at least one internal control
reportable condition, 0 otherwise)
FINDit Total number of findings identified by the auditor at time t
B5it Dummy variable indicating Big 5 auditor at time t (1 if Big 5, 0 otherwise)
PROGit Number of different federal programs at time t
LFEDit Natural log of total federal expenditures at time t
NEWit Dummy variable indicating whether the current year is the first year that the
organization is receiving federal funds (1 if the first year included in the database is
not 1997, 0 otherwise)
Y98t–Y00t Dummy variables indicating year at time t
UPit Dummy variable indicating a change in auditor from non-Big 5 to Big 5 from time
t�1 to t
DOWNit Dummy variable indicating a change in auditor from Big 5 to non-Big 5 from time
t�1 to t
DMNCit Dummy variable indicating the change in material non-compliance from time t�1 to
t (1 indicates change from unqualified opinion to other-than-unqualified opinion,
0 indicates no change, and �1 indicates change from other-than-unqualified to
unqualified)
DRCit Dummy variable indicating the change from time t�1 to t in the organization’s
report on internal controls (1 indicates a change from no reportable conditions to
at least one reportable condition, 0 indicates no change, and �1 indicates a change
from at least one reportable condition to no reportable conditions)
DNEWit Dummy variable indicating if organization is in the second year or later of receiving
federal funds (�1 indicates the organization is in the second year of receiving
federal funds and 0 indicates the organization is in the third or later year of
receiving federal funds)
Differences in Financial Statement and Compliance Audit Assessments 13
of the auditor, as well as organizational factors such as the organization’sfamiliarity with federal programs, the complexity and extent of federalregulations, and the external regulatory and economic factors. The equationused to test H4 is
RCit ¼ ai þ b1B5it þ b2NEWit þ b3PROGit þ b4LFEDit þ b5Y98t
þ b6Y99t þ b7Y00t þ �it
where all variables are defined as earlier under H1 and H2, and aresummarized in Table 1.
Model Estimation: Controls for Other Organizational Factors
Organizations select their own auditor. Prior audit quality literatureindicates that certain organizational factors such as risk and extent ofagency costs are associated with the choice of auditor. These organizationalfactors may correlate with the dependent variables included in this study,and it is therefore important to control for these to obtain interpretableresults. Prior studies have controlled for these other factors by using theHeckman (1979) model, which requires that the auditor selection bemodeled first, and then the regression of interest is estimated by includingthe results of the auditor selection model. However, in this study, becausethe same organizations are included in the dataset for a number of years, thedata is analyzed using fixed effects estimation and first differencing estima-tion. Both of these estimation techniques consistently estimate the partialeffects of observed variables, while controlling for unobserved time-constanteffects that may correlate with the variables of interest (Wooldridge, 2002).In other words, all organizational factors that do not change over time arecontrolled for, and therefore should have no effect on the results of thestudy. I contend that because of the short time series of the data (maximumof 4 years), significant organizational factors that could affect the auditorchoice will not change significantly during the period of this study.
RESULTS
Descriptive Statistics
Table 2 presents the descriptive statistics for all of the observations includedin this study. Total federal expenditures vary considerably, from $27,055 to
STEFANIE L. TATE14
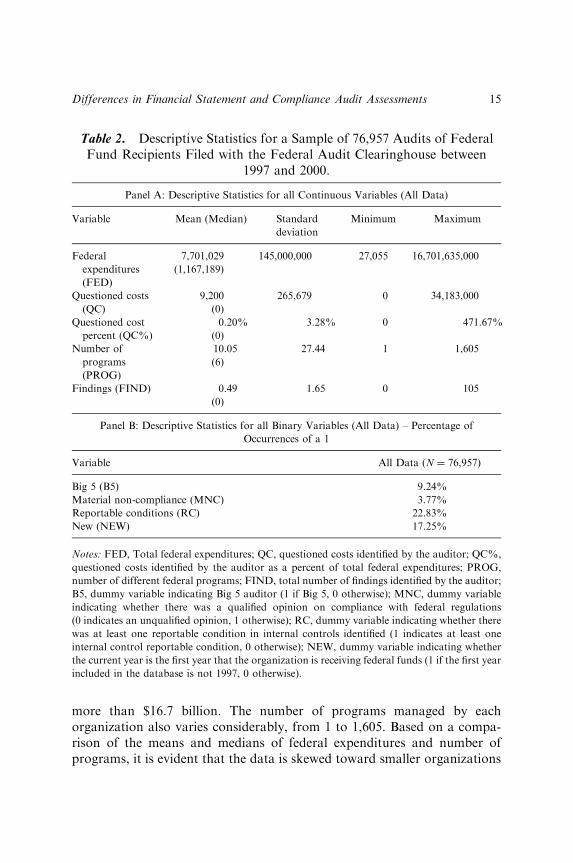
more than $16.7 billion. The number of programs managed by eachorganization also varies considerably, from 1 to 1,605. Based on a compa-rison of the means and medians of federal expenditures and number ofprograms, it is evident that the data is skewed toward smaller organizations
Table 2. Descriptive Statistics for a Sample of 76,957 Audits of FederalFund Recipients Filed with the Federal Audit Clearinghouse between
1997 and 2000.
Panel A: Descriptive Statistics for all Continuous Variables (All Data)
Variable Mean (Median) Standard
deviation
Minimum Maximum
Federal
expenditures
(FED)
7,701,029 145,000,000 27,055 16,701,635,000
(1,167,189)
Questioned costs
(QC)
9,200 265,679 0 34,183,000
(0)
Questioned cost
percent (QC%)
0.20% 3.28% 0 471.67%
(0)
Number of
programs
(PROG)
10.05 27.44 1 1,605
(6)
Findings (FIND) 0.49 1.65 0 105
(0)
Panel B: Descriptive Statistics for all Binary Variables (All Data) – Percentage of
Occurrences of a 1
Variable All Data (N ¼ 76,957)
Big 5 (B5) 9.24%
Material non-compliance (MNC) 3.77%
Reportable conditions (RC) 22.83%
New (NEW) 17.25%
Notes: FED, Total federal expenditures; QC, questioned costs identified by the auditor; QC%,
questioned costs identified by the auditor as a percent of total federal expenditures; PROG,
number of different federal programs; FIND, total number of findings identified by the auditor;
B5, dummy variable indicating Big 5 auditor (1 if Big 5, 0 otherwise); MNC, dummy variable
indicating whether there was a qualified opinion on compliance with federal regulations
(0 indicates an unqualified opinion, 1 otherwise); RC, dummy variable indicating whether there
was at least one reportable condition in internal controls identified (1 indicates at least one
internal control reportable condition, 0 otherwise); NEW, dummy variable indicating whether
the current year is the first year that the organization is receiving federal funds (1 if the first year
included in the database is not 1997, 0 otherwise).
Differences in Financial Statement and Compliance Audit Assessments 15
managing a relatively small number of federal programs. Questioned costsrange from $0 to over $34 million and findings range from 0 to 105. The lowmeans for both questioned costs and findings are due to the large number of‘‘zero’’ observations.
Big 5 firms audited 7,113 observations (9.24%) in this dataset. This is verydifferent from audit quality studies using publicly traded corporations inwhich the majority of observations are audited by the Big 5 audit firms.Almost 4% of the observations (2,901) received a qualified opinion onmaterial compliance with federal regulations (MNC), and 23% of the obser-vations (17,569) had indications of reportable conditions in internalcontrols. The statistics indicate that many of these organizations haveconsiderable problems with their internal control structures, and thereforemay benefit greatly from the external audit.
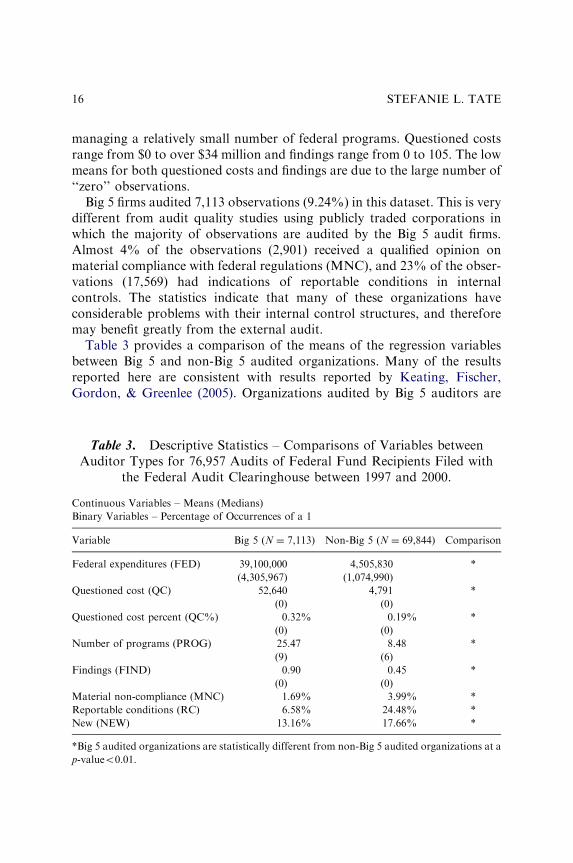
Table 3 provides a comparison of the means of the regression variablesbetween Big 5 and non-Big 5 audited organizations. Many of the resultsreported here are consistent with results reported by Keating, Fischer,Gordon, & Greenlee (2005). Organizations audited by Big 5 auditors are
Table 3. Descriptive Statistics – Comparisons of Variables betweenAuditor Types for 76,957 Audits of Federal Fund Recipients Filed with
the Federal Audit Clearinghouse between 1997 and 2000.
Continuous Variables – Means (Medians)
Binary Variables – Percentage of Occurrences of a 1
Variable Big 5 (N ¼ 7,113) Non-Big 5 (N ¼ 69,844) Comparison
Federal expenditures (FED) 39,100,000 4,505,830 *
(4,305,967) (1,074,990)
Questioned cost (QC) 52,640 4,791 *
(0) (0)
Questioned cost percent (QC%) 0.32% 0.19% *
(0) (0)
Number of programs (PROG) 25.47 8.48 *
(9) (6)
Findings (FIND) 0.90 0.45 *
(0) (0)
Material non-compliance (MNC) 1.69% 3.99% *
Reportable conditions (RC) 6.58% 24.48% *
New (NEW) 13.16% 17.66% *
*Big 5 audited organizations are statistically different from non-Big 5 audited organizations at a
p-valueo0.01.
STEFANIE L. TATE16
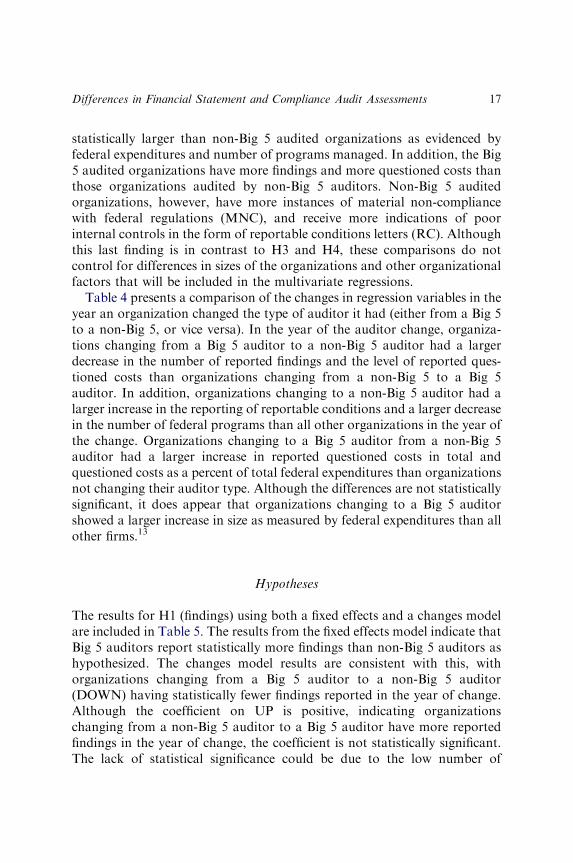
statistically larger than non-Big 5 audited organizations as evidenced byfederal expenditures and number of programs managed. In addition, the Big5 audited organizations have more findings and more questioned costs thanthose organizations audited by non-Big 5 auditors. Non-Big 5 auditedorganizations, however, have more instances of material non-compliancewith federal regulations (MNC), and receive more indications of poorinternal controls in the form of reportable conditions letters (RC). Althoughthis last finding is in contrast to H3 and H4, these comparisons do notcontrol for differences in sizes of the organizations and other organizationalfactors that will be included in the multivariate regressions.
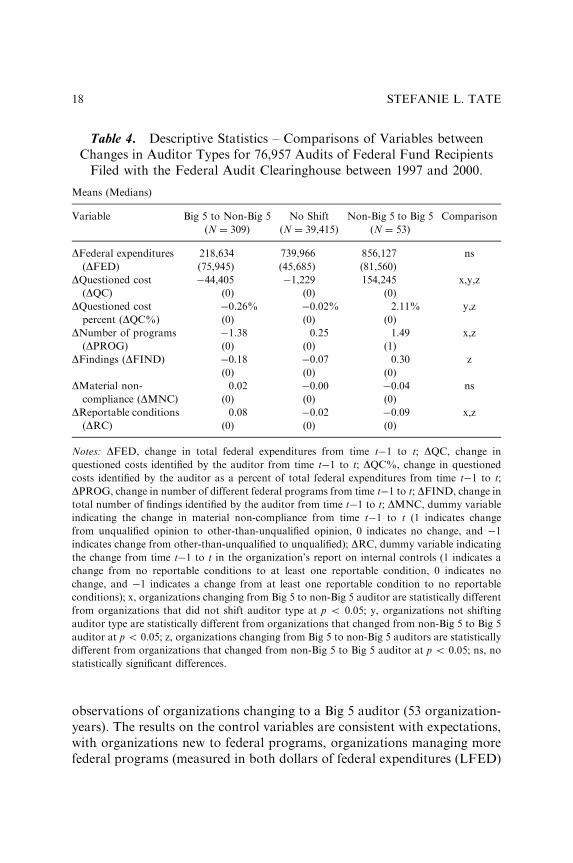
Table 4 presents a comparison of the changes in regression variables in theyear an organization changed the type of auditor it had (either from a Big 5to a non-Big 5, or vice versa). In the year of the auditor change, organiza-tions changing from a Big 5 auditor to a non-Big 5 auditor had a largerdecrease in the number of reported findings and the level of reported ques-tioned costs than organizations changing from a non-Big 5 to a Big 5auditor. In addition, organizations changing to a non-Big 5 auditor had alarger increase in the reporting of reportable conditions and a larger decreasein the number of federal programs than all other organizations in the year ofthe change. Organizations changing to a Big 5 auditor from a non-Big 5auditor had a larger increase in reported questioned costs in total andquestioned costs as a percent of total federal expenditures than organizationsnot changing their auditor type. Although the differences are not statisticallysignificant, it does appear that organizations changing to a Big 5 auditorshowed a larger increase in size as measured by federal expenditures than allother firms.13
Hypotheses
The results for H1 (findings) using both a fixed effects and a changes modelare included in Table 5. The results from the fixed effects model indicate thatBig 5 auditors report statistically more findings than non-Big 5 auditors ashypothesized. The changes model results are consistent with this, withorganizations changing from a Big 5 auditor to a non-Big 5 auditor(DOWN) having statistically fewer findings reported in the year of change.Although the coefficient on UP is positive, indicating organizationschanging from a non-Big 5 auditor to a Big 5 auditor have more reportedfindings in the year of change, the coefficient is not statistically significant.The lack of statistical significance could be due to the low number of
Differences in Financial Statement and Compliance Audit Assessments 17
observations of organizations changing to a Big 5 auditor (53 organization-years). The results on the control variables are consistent with expectations,with organizations new to federal programs, organizations managing morefederal programs (measured in both dollars of federal expenditures (LFED)
Table 4. Descriptive Statistics – Comparisons of Variables betweenChanges in Auditor Types for 76,957 Audits of Federal Fund RecipientsFiled with the Federal Audit Clearinghouse between 1997 and 2000.
Means (Medians)
Variable Big 5 to Non-Big 5
(N ¼ 309)
No Shift
(N ¼ 39,415)
Non-Big 5 to Big 5
(N ¼ 53)
Comparison
DFederal expenditures(DFED)
218,634 739,966 856,127 ns
(75,945) (45,685) (81,560)
DQuestioned cost
(DQC)
�44,405 �1,229 154,245 x,y,z
(0) (0) (0)
DQuestioned cost
percent (DQC%)
�0.26% �0.02% 2.11% y,z
(0) (0) (0)
DNumber of programs
(DPROG)
�1.38 0.25 1.49 x,z
(0) (0) (1)
DFindings (DFIND) �0.18 �0.07 0.30 z
(0) (0) (0)
DMaterial non-
compliance (DMNC)
0.02 �0.00 �0.04 ns
(0) (0) (0)
DReportable conditions
(DRC)
0.08 �0.02 �0.09 x,z
(0) (0) (0)
Notes: DFED, change in total federal expenditures from time t�1 to t; DQC, change in
questioned costs identified by the auditor from time t�1 to t; DQC%, change in questioned
costs identified by the auditor as a percent of total federal expenditures from time t�1 to t;
DPROG, change in number of different federal programs from time t�1 to t; DFIND, change in
total number of findings identified by the auditor from time t�1 to t; DMNC, dummy variable
indicating the change in material non-compliance from time t�1 to t (1 indicates change
from unqualified opinion to other-than-unqualified opinion, 0 indicates no change, and �1
indicates change from other-than-unqualified to unqualified); DRC, dummy variable indicating
the change from time t�1 to t in the organization’s report on internal controls (1 indicates a
change from no reportable conditions to at least one reportable condition, 0 indicates no
change, and �1 indicates a change from at least one reportable condition to no reportable
conditions); x, organizations changing from Big 5 to non-Big 5 auditor are statistically different
from organizations that did not shift auditor type at p o 0.05; y, organizations not shifting
auditor type are statistically different from organizations that changed from non-Big 5 to Big 5
auditor at p o 0.05; z, organizations changing from Big 5 to non-Big 5 auditors are statistically
different from organizations that changed from non-Big 5 to Big 5 auditor at p o 0.05; ns, no
statistically significant differences.
STEFANIE L. TATE18
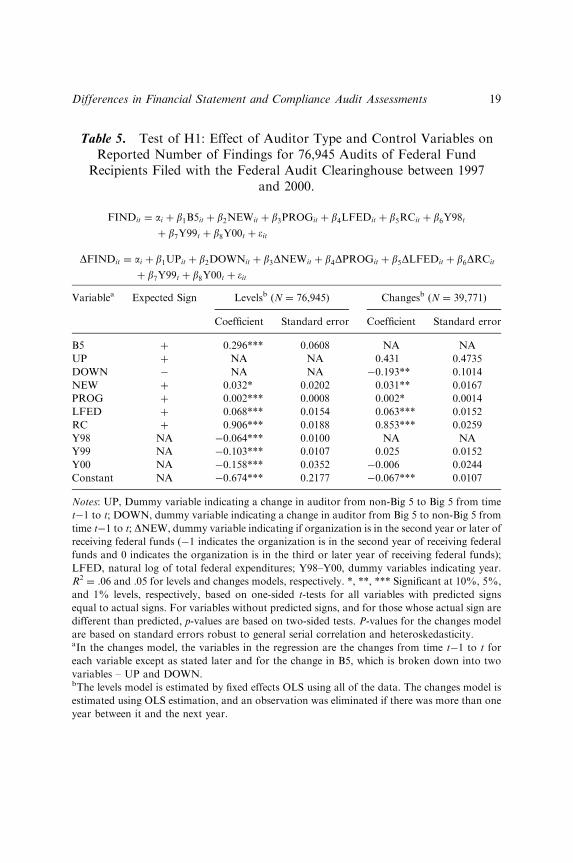
Table 5. Test of H1: Effect of Auditor Type and Control Variables onReported Number of Findings for 76,945 Audits of Federal Fund
Recipients Filed with the Federal Audit Clearinghouse between 1997and 2000.
FINDit ¼ ai þ b1B5it þ b2NEWit þ b3PROGit þ b4LFEDit þ b5RCit þ b6Y98t
þ b7Y99t þ b8Y00t þ �it
DFINDit ¼ ai þ b1UPit þ b2DOWNit þ b3DNEWit þ b4DPROGit þ b5DLFEDit þ b6DRCit
þ b7Y99t þ b8Y00t þ �it
Variablea Expected Sign Levelsb (N ¼ 76,945) Changesb (N ¼ 39,771)
Coefficient Standard error Coefficient Standard error
B5 þ 0.296*** 0.0608 NA NA
UP þ NA NA 0.431 0.4735
DOWN � NA NA �0.193** 0.1014
NEW þ 0.032* 0.0202 0.031** 0.0167
PROG þ 0.002*** 0.0008 0.002* 0.0014
LFED þ 0.068*** 0.0154 0.063*** 0.0152
RC þ 0.906*** 0.0188 0.853*** 0.0259
Y98 NA �0.064*** 0.0100 NA NA
Y99 NA �0.103*** 0.0107 0.025 0.0152
Y00 NA �0.158*** 0.0352 �0.006 0.0244
Constant NA �0.674*** 0.2177 �0.067*** 0.0107
Notes: UP, Dummy variable indicating a change in auditor from non-Big 5 to Big 5 from time
t�1 to t; DOWN, dummy variable indicating a change in auditor from Big 5 to non-Big 5 from
time t�1 to t; DNEW, dummy variable indicating if organization is in the second year or later of
receiving federal funds (�1 indicates the organization is in the second year of receiving federal
funds and 0 indicates the organization is in the third or later year of receiving federal funds);
LFED, natural log of total federal expenditures; Y98–Y00, dummy variables indicating year.
R2¼ .06 and .05 for levels and changes models, respectively. *, **, *** Significant at 10%, 5%,
and 1% levels, respectively, based on one-sided t-tests for all variables with predicted signs
equal to actual signs. For variables without predicted signs, and for those whose actual sign are
different than predicted, p-values are based on two-sided tests. P-values for the changes model
are based on standard errors robust to general serial correlation and heteroskedasticity.aIn the changes model, the variables in the regression are the changes from time t�1 to t for
each variable except as stated later and for the change in B5, which is broken down into two
variables – UP and DOWN.bThe levels model is estimated by fixed effects OLS using all of the data. The changes model is
estimated using OLS estimation, and an observation was eliminated if there was more than one
year between it and the next year.
Differences in Financial Statement and Compliance Audit Assessments 19
and number of federal programs (PROG)), and organizations with report-able conditions (RC) also having more reported findings. The negativecoefficients on the time dummy variables may indicate that organizationsimprove their processes over time, and therefore reduce the number offindings over time.
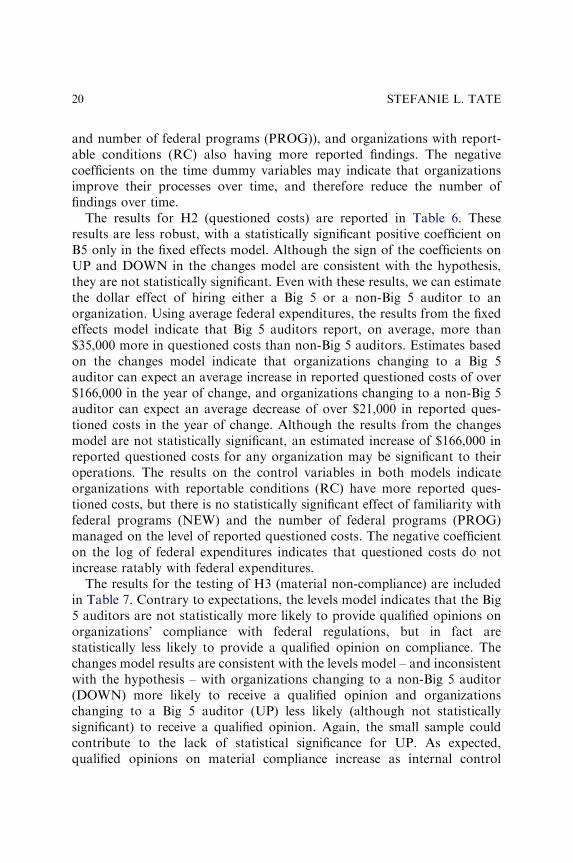
The results for H2 (questioned costs) are reported in Table 6. Theseresults are less robust, with a statistically significant positive coefficient onB5 only in the fixed effects model. Although the sign of the coefficients onUP and DOWN in the changes model are consistent with the hypothesis,they are not statistically significant. Even with these results, we can estimatethe dollar effect of hiring either a Big 5 or a non-Big 5 auditor to anorganization. Using average federal expenditures, the results from the fixedeffects model indicate that Big 5 auditors report, on average, more than$35,000 more in questioned costs than non-Big 5 auditors. Estimates basedon the changes model indicate that organizations changing to a Big 5auditor can expect an average increase in reported questioned costs of over$166,000 in the year of change, and organizations changing to a non-Big 5auditor can expect an average decrease of over $21,000 in reported ques-tioned costs in the year of change. Although the results from the changesmodel are not statistically significant, an estimated increase of $166,000 inreported questioned costs for any organization may be significant to theiroperations. The results on the control variables in both models indicateorganizations with reportable conditions (RC) have more reported ques-tioned costs, but there is no statistically significant effect of familiarity withfederal programs (NEW) and the number of federal programs (PROG)managed on the level of reported questioned costs. The negative coefficienton the log of federal expenditures indicates that questioned costs do notincrease ratably with federal expenditures.
The results for the testing of H3 (material non-compliance) are includedin Table 7. Contrary to expectations, the levels model indicates that the Big5 auditors are not statistically more likely to provide qualified opinions onorganizations’ compliance with federal regulations, but in fact arestatistically less likely to provide a qualified opinion on compliance. Thechanges model results are consistent with the levels model – and inconsistentwith the hypothesis – with organizations changing to a non-Big 5 auditor(DOWN) more likely to receive a qualified opinion and organizationschanging to a Big 5 auditor (UP) less likely (although not statisticallysignificant) to receive a qualified opinion. Again, the small sample couldcontribute to the lack of statistical significance for UP. As expected,qualified opinions on material compliance increase as internal control
STEFANIE L. TATE20
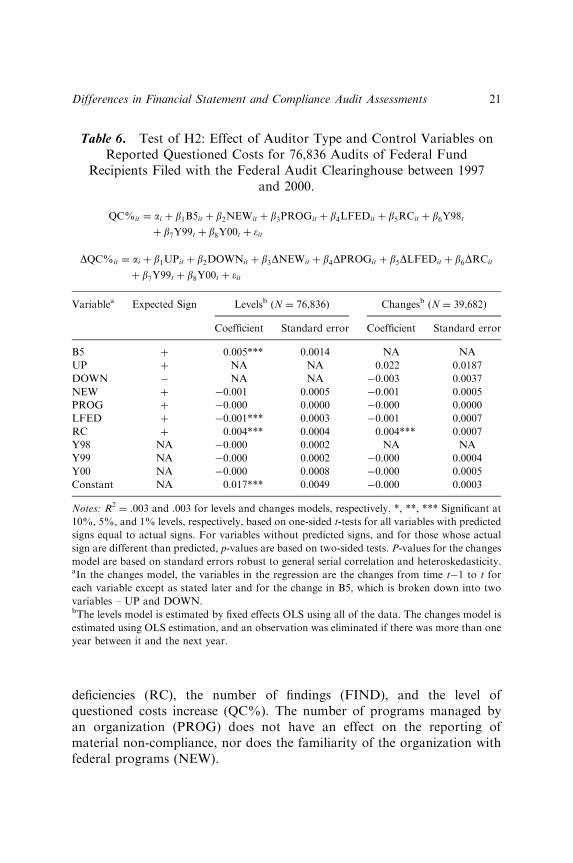
deficiencies (RC), the number of findings (FIND), and the level ofquestioned costs increase (QC%). The number of programs managed byan organization (PROG) does not have an effect on the reporting ofmaterial non-compliance, nor does the familiarity of the organization withfederal programs (NEW).
Table 6. Test of H2: Effect of Auditor Type and Control Variables onReported Questioned Costs for 76,836 Audits of Federal Fund
Recipients Filed with the Federal Audit Clearinghouse between 1997and 2000.
QC%it ¼ ai þ b1B5it þ b2NEWit þ b3PROGit þ b4LFEDit þ b5RCit þ b6Y98t
þ b7Y99t þ b8Y00t þ �it
DQC%it ¼ ai þ b1UPit þ b2DOWNit þ b3DNEWit þ b4DPROGit þ b5DLFEDit þ b6DRCit
þ b7Y99t þ b8Y00t þ �it
Variablea Expected Sign Levelsb (N ¼ 76,836) Changesb (N ¼ 39,682)
Coefficient Standard error Coefficient Standard error
B5 þ 0.005*** 0.0014 NA NA
UP þ NA NA 0.022 0.0187
DOWN � NA NA �0.003 0.0037
NEW þ �0.001 0.0005 �0.001 0.0005
PROG þ �0.000 0.0000 �0.000 0.0000
LFED þ �0.001*** 0.0003 �0.001 0.0007
RC þ 0.004*** 0.0004 0.004*** 0.0007
Y98 NA �0.000 0.0002 NA NA
Y99 NA �0.000 0.0002 �0.000 0.0004
Y00 NA �0.000 0.0008 �0.000 0.0005
Constant NA 0.017*** 0.0049 �0.000 0.0003
Notes: R2¼ .003 and .003 for levels and changes models, respectively. *, **, *** Significant at
10%, 5%, and 1% levels, respectively, based on one-sided t-tests for all variables with predicted
signs equal to actual signs. For variables without predicted signs, and for those whose actual
sign are different than predicted, p-values are based on two-sided tests. P-values for the changes
model are based on standard errors robust to general serial correlation and heteroskedasticity.aIn the changes model, the variables in the regression are the changes from time t�1 to t for
each variable except as stated later and for the change in B5, which is broken down into two
variables – UP and DOWN.bThe levels model is estimated by fixed effects OLS using all of the data. The changes model is
estimated using OLS estimation, and an observation was eliminated if there was more than one
year between it and the next year.
Differences in Financial Statement and Compliance Audit Assessments 21
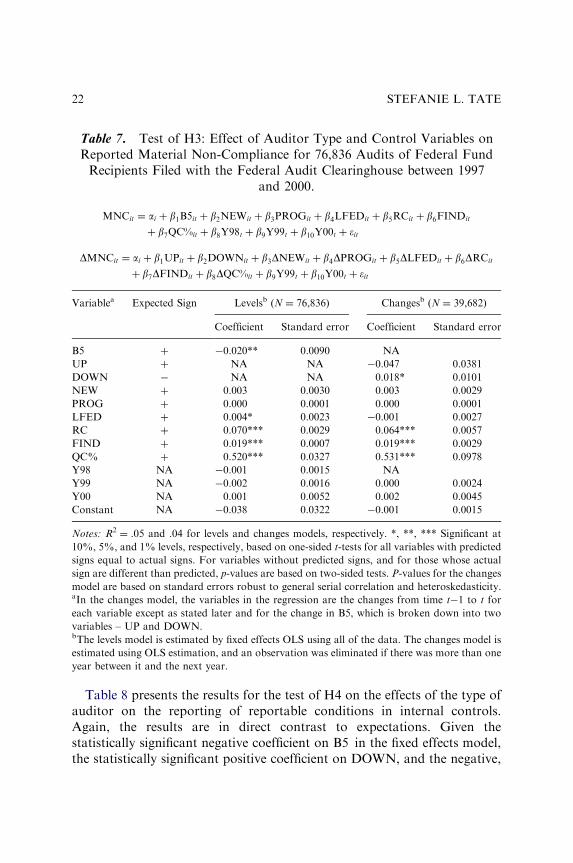
Table 8 presents the results for the test of H4 on the effects of the type ofauditor on the reporting of reportable conditions in internal controls.Again, the results are in direct contrast to expectations. Given thestatistically significant negative coefficient on B5 in the fixed effects model,the statistically significant positive coefficient on DOWN, and the negative,
Table 7. Test of H3: Effect of Auditor Type and Control Variables onReported Material Non-Compliance for 76,836 Audits of Federal FundRecipients Filed with the Federal Audit Clearinghouse between 1997
and 2000.
MNCit ¼ ai þ b1B5it þ b2NEWit þ b3PROGit þ b4LFEDit þ b5RCit þ b6FINDit
þ b7QC%it þ b8Y98t þ b9Y99t þ b10Y00t þ �it
DMNCit ¼ ai þ b1UPit þ b2DOWNit þ b3DNEWit þ b4DPROGit þ b5DLFEDit þ b6DRCit
þ b7DFINDit þ b8DQC%it þ b9Y99t þ b10Y00t þ �it
Variablea Expected Sign Levelsb (N ¼ 76,836) Changesb (N ¼ 39,682)
Coefficient Standard error Coefficient Standard error
B5 þ �0.020** 0.0090 NA
UP þ NA NA �0.047 0.0381
DOWN � NA NA 0.018* 0.0101
NEW þ 0.003 0.0030 0.003 0.0029
PROG þ 0.000 0.0001 0.000 0.0001
LFED þ 0.004* 0.0023 �0.001 0.0027
RC þ 0.070*** 0.0029 0.064*** 0.0057
FIND þ 0.019*** 0.0007 0.019*** 0.0029
QC% þ 0.520*** 0.0327 0.531*** 0.0978
Y98 NA �0.001 0.0015 NA
Y99 NA �0.002 0.0016 0.000 0.0024
Y00 NA 0.001 0.0052 0.002 0.0045
Constant NA �0.038 0.0322 �0.001 0.0015
Notes: R2¼ .05 and .04 for levels and changes models, respectively. *, **, *** Significant at
10%, 5%, and 1% levels, respectively, based on one-sided t-tests for all variables with predicted
signs equal to actual signs. For variables without predicted signs, and for those whose actual
sign are different than predicted, p-values are based on two-sided tests. P-values for the changes
model are based on standard errors robust to general serial correlation and heteroskedasticity.aIn the changes model, the variables in the regression are the changes from time t�1 to t for
each variable except as stated later and for the change in B5, which is broken down into two
variables – UP and DOWN.bThe levels model is estimated by fixed effects OLS using all of the data. The changes model is
estimated using OLS estimation, and an observation was eliminated if there was more than one
year between it and the next year.
STEFANIE L. TATE22
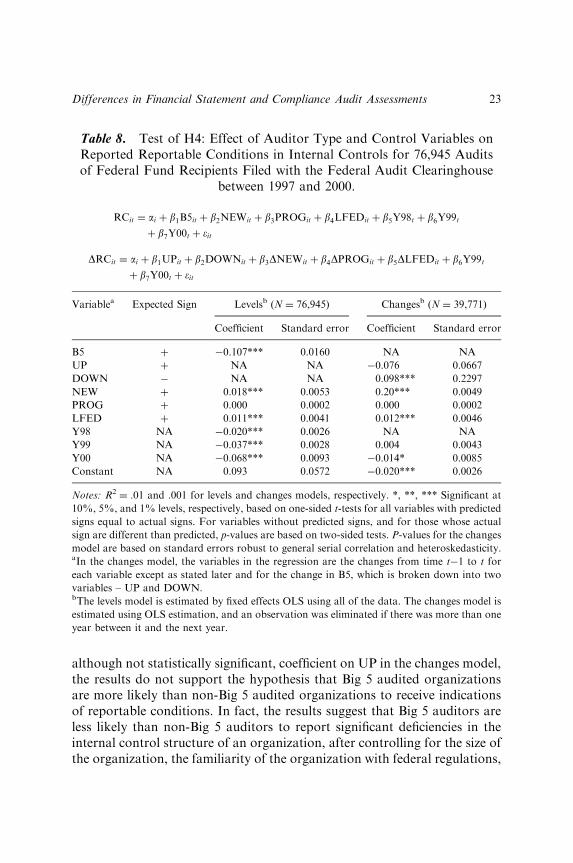
although not statistically significant, coefficient on UP in the changes model,the results do not support the hypothesis that Big 5 audited organizationsare more likely than non-Big 5 audited organizations to receive indicationsof reportable conditions. In fact, the results suggest that Big 5 auditors areless likely than non-Big 5 auditors to report significant deficiencies in theinternal control structure of an organization, after controlling for the size ofthe organization, the familiarity of the organization with federal regulations,
Table 8. Test of H4: Effect of Auditor Type and Control Variables onReported Reportable Conditions in Internal Controls for 76,945 Auditsof Federal Fund Recipients Filed with the Federal Audit Clearinghouse
between 1997 and 2000.
RCit ¼ ai þ b1B5it þ b2NEWit þ b3PROGit þ b4LFEDit þ b5Y98t þ b6Y99t
þ b7Y00t þ �it
DRCit ¼ ai þ b1UPit þ b2DOWNit þ b3DNEWit þ b4DPROGit þ b5DLFEDit þ b6Y99t
þ b7Y00t þ �it
Variablea Expected Sign Levelsb (N ¼ 76,945) Changesb (N ¼ 39,771)
Coefficient Standard error Coefficient Standard error
B5 þ �0.107*** 0.0160 NA NA
UP þ NA NA �0.076 0.0667
DOWN � NA NA 0.098*** 0.2297
NEW þ 0.018*** 0.0053 0.20*** 0.0049
PROG þ 0.000 0.0002 0.000 0.0002
LFED þ 0.011*** 0.0041 0.012*** 0.0046
Y98 NA �0.020*** 0.0026 NA NA
Y99 NA �0.037*** 0.0028 0.004 0.0043
Y00 NA �0.068*** 0.0093 �0.014* 0.0085
Constant NA 0.093 0.0572 �0.020*** 0.0026
Notes: R2¼ .01 and .001 for levels and changes models, respectively. *, **, *** Significant at
10%, 5%, and 1% levels, respectively, based on one-sided t-tests for all variables with predicted
signs equal to actual signs. For variables without predicted signs, and for those whose actual
sign are different than predicted, p-values are based on two-sided tests. P-values for the changes
model are based on standard errors robust to general serial correlation and heteroskedasticity.aIn the changes model, the variables in the regression are the changes from time t�1 to t for
each variable except as stated later and for the change in B5, which is broken down into two
variables – UP and DOWN.bThe levels model is estimated by fixed effects OLS using all of the data. The changes model is
estimated using OLS estimation, and an observation was eliminated if there was more than one
year between it and the next year.
Differences in Financial Statement and Compliance Audit Assessments 23
the complexity of the federal regulations, and other unobserved organiza-tional factors that do not change over time. Larger organizations, asmeasured by the log of federal expenditures (LFED), and organizations newto federal programs are more likely to receive reportable conditionsindications, but the number of programs does not appear to have an effecton the reporting of internal control deficiencies.
Sensitivity Test: Appropriateness of the Size Measure
An organization could conceivably be very large, but only manage a smallnumber of federal programs, and therefore federal expenditures may not bea reasonable proxy for the organization’s size. To determine if this was, onaverage, true I determined the correlation between federal expenditures andproxies for size used in other studies. For a representative sample14 of 494observations from the database, I obtained other financial variables fromthe organizations’ Form 990’s that could be used to measure size, includingtotal assets, total expenditures, and total revenues. The correlations betweenthese other measures and total federal expenditures (the variable used in thisstudy) were all greater than 0.91 and were all highly significant (two tailedp-valueo0.00). Therefore, the measure used appears to be a reasonableproxy for the organization’s size.
Sensitivity Test: Controlling for Size
From Table 3, it is obvious that Big 5 auditors audit larger organizations.The size of the organization is controlled for in three ways in the regressionsreported – the log of federal expenditures and the number of federalprograms are both explicitly included in the regressions and the organiza-tions act as their own controls in both the fixed effects and first differencingmodels. In the fixed effects model all variables are time-demeaned, while inthe first differencing model all variables are differenced over time. Variablesthat stay constant over time will be eliminated from the models, andtherefore if the organization’s size does not change considerably from oneyear to the next, the estimation techniques will serve to control for the effectof size in the regressions.
An additional test was also performed to determine if size is driving theresults obtained. The test included matching observations on average federalexpenditures. Almost 4,000 observations with a Big 5 auditor were matched
STEFANIE L. TATE24
with a non-Big 5-audited organization with similar average federalexpenditures. An organization was considered to be similar if its averagefederal expenditures were within 10% of the average federal expenditures ofthe Big 5-audited observation. Using this matched data the same regressionswere estimated. The results for this matched sample are consistent with thepreviously reported results for each of the hypotheses, except for H3 –material non-compliance. Although the direction of the coefficient on Big 5is negative, it is not statistically significant. This non-significant result maybe due to the small number of observations that had indications of materialnon-compliance – only 187 observations, or less than 3% of the totalsample.
Sensitivity Test: Regression Estimation
The regressions for H1 and H2 were re-estimated using tobit estimation dueto the large number of observations in the dataset that have a zero value.The results from these regressions both indicate a significantly positivecoefficient on B5, indicating that Big 5 auditors report more findings andquestioned costs than non-Big 5 auditors. The tobit estimations cannotcontrol for unobserved organizational factors like the fixed effects andchanges models, and therefore they are not reported in detail in this chapter.
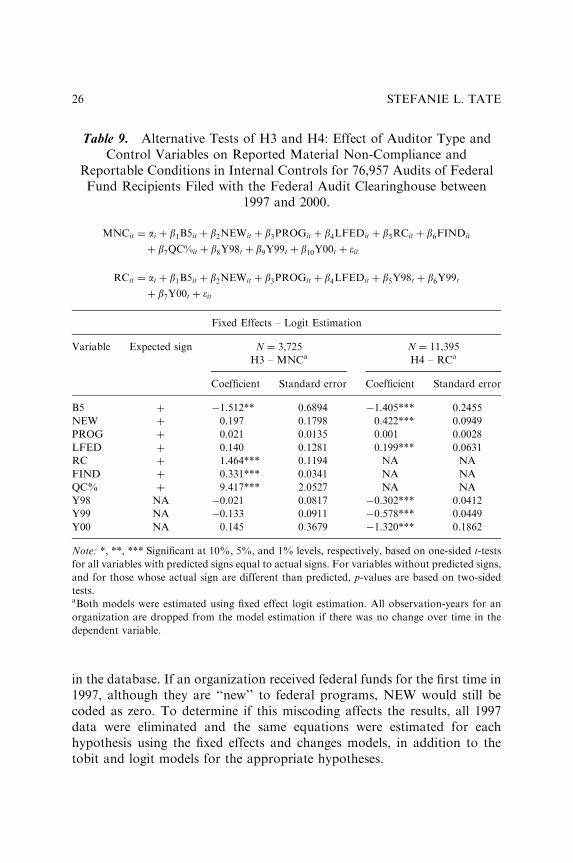
The regressions for H3 and H4 were re-estimated using fixed effects logitestimation and are reported in Table 9. The results for both regressions areconsistent with those found in the fixed effects regression results reportedearlier, with Big 5 auditors reporting less material non-compliance withfederal regulations and less reportable conditions in internal controls thannon-Big 5 auditors. Reportable conditions, number of findings, and ques-tioned costs as a percent of federal expenditures are all positive and stati-stically significant in the material non-compliance regression (MNC – H3),consistent with the results reported in Table 7.
Sensitivity Test: NEW
The variable NEW is used to proxy for the familiarity of the organizationwith federal grant requirements, and is coded as ‘‘1’’ in the first year that anorganization is included in the database if that year is not 1997. NEW iscoded as zero for all organizations in 1997 because that is the first year of thedatabase, and therefore is the first year that all organizations are included
Differences in Financial Statement and Compliance Audit Assessments 25
in the database. If an organization received federal funds for the first time in1997, although they are ‘‘new’’ to federal programs, NEW would still becoded as zero. To determine if this miscoding affects the results, all 1997data were eliminated and the same equations were estimated for eachhypothesis using the fixed effects and changes models, in addition to thetobit and logit models for the appropriate hypotheses.
Table 9. Alternative Tests of H3 and H4: Effect of Auditor Type andControl Variables on Reported Material Non-Compliance and
Reportable Conditions in Internal Controls for 76,957 Audits of FederalFund Recipients Filed with the Federal Audit Clearinghouse between
1997 and 2000.
MNCit ¼ ai þ b1B5it þ b2NEWit þ b3PROGit þ b4LFEDit þ b5RCit þ b6FINDit
þ b7QC%it þ b8Y98t þ b9Y99t þ b10Y00t þ �it
RCit ¼ ai þ b1B5it þ b2NEWit þ b3PROGit þ b4LFEDit þ b5Y98t þ b6Y99t
þ b7Y00t þ �it
Fixed Effects – Logit Estimation
Variable Expected sign N ¼ 3,725 N ¼ 11,395
H3 – MNCa H4 – RCa
Coefficient Standard error Coefficient Standard error
B5 þ �1.512** 0.6894 �1.405*** 0.2455
NEW þ 0.197 0.1798 0.422*** 0.0949
PROG þ 0.021 0.0135 0.001 0.0028
LFED þ 0.140 0.1281 0.199*** 0.0631
RC þ 1.464*** 0.1194 NA NA
FIND þ 0.331*** 0.0341 NA NA
QC% þ 9.417*** 2.0527 NA NA
Y98 NA �0.021 0.0817 �0.302*** 0.0412
Y99 NA �0.133 0.0911 �0.578*** 0.0449
Y00 NA 0.145 0.3679 �1.320*** 0.1862
Note: *, **, *** Significant at 10%, 5%, and 1% levels, respectively, based on one-sided t-tests
for all variables with predicted signs equal to actual signs. For variables without predicted signs,
and for those whose actual sign are different than predicted, p-values are based on two-sided
tests.aBoth models were estimated using fixed effect logit estimation. All observation-years for an
organization are dropped from the model estimation if there was no change over time in the
dependent variable.
STEFANIE L. TATE26
The results from these tests are mixed. The fixed effects and firstdifferencing estimations of the questioned costs regression (H2) andreportable conditions regression (H4) are consistent in magnitude, direction,and significance with those reported in Tables 6 and 8, respectively. Thetobit estimation results for the questioned costs regression are also consistentwith those obtained with all of the data, as is the fixed effects logit regressionfor reportable conditions. The results for the findings regression (H1) usingonly data from 1998 and beyond were not statistically significant for thefixed effects, first differencing or tobit estimations. And the results for thematerial non-compliance regressions (H3) using the reduced dataset wereonly marginally significant (two-tailed p-valueo0.10) for the fixed effectsestimation and not statistically significant for the first differencing or fixed-effects logit estimations, although the estimated coefficient in all of theregressions was consistent in sign with previously reported results.
When the 1997 data is eliminated from the population, the number ofobservations drops from 76,957 to 54,379. In addition, the average numberof years that an organization is included in the database drops from 2.1 withthe 1997 data included, to 1.7 without the 1997 data.15 Both of thesedecreases could account for the inconsistent results found with the smallerdataset. Much of the power for the tests of the hypotheses comes from thelarge number of observations included in the estimation. In addition, boththe fixed effects and changes models rely on organizations remaining in thesample for at least 2 years; any reduction in the average number of years thatan organization is included in the dataset will have detrimental effects on thepower of the tests. Given that the signs of the coefficients in each of theregressions with the reduced dataset are consistent in all models with thoseobtained with the full dataset, the results of this additional analysis indicatethat the potential miscoding of the variable ‘‘NEW’’ does not greatly affectthe results reported earlier(see additional discussion in the following section).
DISCUSSION
As with prior audit quality research, the results of this study are mixed.However, where other studies have found either a significant positiverelationship between audit quality and Big 5 audit firms or no relationship,this study finds a significantly positive relationship for some measures and asignificantly negative relationship for other measures. Big 5 auditors appearto provide higher quality audits if quality is measured by the number of
Differences in Financial Statement and Compliance Audit Assessments 27
findings and questioned costs reported but not if quality is measured as theopinion on material compliance with federal regulations or the reporting ofdeficiencies in the internal control structure. The results on these last twomeasures indicate that not only do Big 5 auditors not report more materialnon-compliance and reportable conditions, they in fact report statisticallyless material non-compliance and fewer reportable conditions thannon-Big 5 auditors. These results, coupled with results found in earlierstudies, indicate a continued need to determine the true nature of therelationship between auditor size and audit quality.
One possible explanation consistent with the results of this study might bethat Big 5 auditors have a different level of materiality than non-Big 5auditors. Since materiality is not considered when reporting identifiedfindings and questioned costs (A-133 regulations require that all itemsidentified must be reported, regardless of magnitude), a higher materialitylimit would not affect the Big 5 auditors’ reporting of findings andquestioned costs. However, for both the opinion on compliance and reporton internal controls, the auditor must assess the materiality of the non-compliance and internal control deficiencies. Big 5 auditors may have ahigher materiality limit, and therefore fewer clients would receive qualifiedopinions on compliance and reportable conditions in internal controls.16
Future studies might investigate the decision processes of auditors in eachfirm type and determine if materiality levels are different.
Another possible explanation for the inconsistent findings is that risk, orsome other correlated factor, is not adequately controlled for, and that theomitted factor has a differential effect on the reporting of findings/questioned costs and the reporting of material non-compliance. Risk in non-profit organizations is a function of revenue generation and diversification,degree of regulation, age of the organization, general economic factors, debtlevels, and liquidity.17 Federal expenditures is one potential measure ofrevenue generation, as all federal expenditures are fully funded by federalgrants. The number of programs provides one measure of the degree ofregulation, since the number of programs is correlated with the number offederal agencies to which an organization reports. The variable ‘‘NEW’’included in the regressions may be one reasonable measure of the age of theorganization, and the year dummies help to control for general economicfactors. Other risk measures related to revenue diversification, debt levels,and liquidity are not controlled for in these analyses because the data wasnot available within the dataset. If any of these risk factors correlate withthe reporting of findings and questioned costs in a significantly differentmanner than they correlate with the reporting of material non-compliance
STEFANIE L. TATE28
and reportable conditions, the results reported could be affected. Futureresearch will need to investigate these other risk factors.
The conflicting findings from this study may also be an indication that weneed to revisit how the audit quality theory suggested by DeAngelo (1981)relates to non-profit organizations. It is not certain that the Big 5/non-Big 5designation has the same quality implications for non-profit organizationsas it does for for-profit corporations. GAAP for non-profit organizations isdifferent than GAAP for for-profit corporations (for example, non-profitorganizations are required to follow Statement of Financial AccountingStandards Nos. 116 and 117, Accounting for Contributions Received andContributions Made and Financial Statements of Not-for-Profit Organiza-tions, respectively, while for-profit corporations are not). The auditrequirements for non-profit organizations receiving federal funds aredifferent and more extensive than those for financial statement audits offor-profit corporations. In addition, the risk structure of non-profitorganizations is different as there are no owners to whom the auditorsreport; therefore the litigation environment is different. And finally, manynon-profit organizations cannot afford to pay the significantly higher feesthat larger audit firms must charge to recover their higher overhead costs. Itis possible that Big 5 audit firms could self-select not to be experts in non-profit auditing given the extensive rules and requirements, and therefore notbe the highest quality audit provider in this industry.
The data used in this study also provides a rich environment for additionalresearch. A large number of organizations in the dataset have poor internalcontrol structures, and may therefore provide an excellent setting to test theeffects of the adequacy of internal controls on organizational performanceor occurrence of fraud. In addition, future research might investigatewhether organizations compensate for their poor internal control structureswhen controlling for agency costs with other techniques, such as having amore active board of directors or selecting higher quality auditors.
NOTES
1. Titman and Trueman (1986) and Thornton and Moore (1993) provideanalytical models that suggest higher risk firms would select lower quality auditors,as opposed to higher quality auditors. Simunic and Stein (1987) find empirical resultsconsistent with this hypothesis, and Feltham, Hughes, and Simunic (1991) find noconsistent significant results. These earlier studies do not control for audit fee, oraudit supply, which can have a significant impact on the results. The later studies thatfind a positive relationship control for the audit supply effect.
Differences in Financial Statement and Compliance Audit Assessments 29
2. Clarkson (2000) is unable to replicate Davidson and Neu’s (1993) results whenadditional measures of client risk are included in the model.
3. In June 2003, the amount was raised to $500,000.4. In another analysis, I split the firms into three categories – Big 5, national, and
other – expecting quality to decrease from Big 5 to national to other. BDO Seidman,Grant Thornton, and McGladrey and Pullen were considered national firms basedon their level of revenues and number of offices. The results are unchanged fromthose reported in this study; national firms act similarly to non-Big 5 firms withrespect to the relationships studied here.
5. Prior studies have also used auditor specialization as a measure of auditquality. In a supplemental analysis, I test three auditor types – market leader, non-market leader Big 5, and non-market leader non-Big 5 – in the regressions. Theoverall comparison between Big 5 and non-Big 5 in that analysis are consistent withthis study. However, the results of comparisons within the Big 5 – between themarket leader and non-market leader Big 5 – depend on the hypothesis tested and thestatistical estimation method used. The detailed results are not included in this study.
6. The database is accessible at http://harvester.census.gov/sac.7. A-133 regulations allow organizations to have only their federal programs
audited and also allow organizations to have a biennial audit.8. All regression analyses were also performed with the 660 going concern
observations included, and the results are unchanged from those reported.9. The absolute value of total questioned costs is used as there are a few
observations where total questioned costs are negative. Negative questioned costscan result from differences between total federal expenditures from federal agencydocumentation and total federal expenditures from the organization’s documenta-tion. This usually occurs when there is a federal reimbursement check in transit.Results do not change when these negative observations are eliminated. In addition,the signs and significance of coefficients are not changed when questioned costsinstead of scaled questioned costs is used to test H2.10. This study spans the period in which Price Waterhouse merged with Coopers
and Lybrand. Organizations audited by either of these two firms, or the merged firm,were coded as being audited by ‘‘PWC.’’11. See additional discussion about the variable NEW and a sensitivity analysis in
the section ‘‘Results.’’12. All regressions were run using other transformations of these two variables,
including the natural log of total programs and total, non-logged federal expenditures.The results for these regressions are consistent with those reported in the tables.13. Pearson correlation coefficients between all of the independent and dependent
variables used in the study were calculated, and many were significant. However, it isnot expected that these significant correlations will introduce a collinearity problemin the analyses.14. The sample was selected using a stratified random sampling technique to
obtain a sample with similar characteristics on the dependent variables as those inthe complete dataset.15. When the 1997 data is deleted, approximately 12,100 of the 54,400
observations represent organizations with only 1 year of data in the remainingdataset. The fixed effects estimation technique time-demeans each observation,
STEFANIE L. TATE30
meaning that the organization average for each variable is subtracted from the actualvariable value. For organizations with only 1 year of data, the average and the actualvalue for each variable is the same, and the time-demeaned values (or values used inthe regression estimation) are zero. Therefore, although these organizations stillremain in the dataset and in the regression, they have no effect on the regressionresults. (Wooldridge, 2000).16. Using only observations that had findings or questioned costs, I performed a
preliminary test of this possibility. I compared average findings and average scaledquestioned costs between Big 5-audited observations and non-Big 5 observationsthat had indications of material noncompliance. For organizations with no ques-tioned costs, average findings for Big 5-audited organizations and non-Big 5-auditedorganizations are 3.21 and 2.65, respectively. These are significantly different atp-value o 0.08. For organizations that had both findings and questioned costs, theaverage findings and scaled questioned costs for Big 5-audited organizations are13.8% and 9.9%, respectively, while they are 4.1% and 7.7%, respectively, for non-Big 5-audited organizations. Average findings are significantly different from oneanother at p-value o 0.00, and although scaled questioned costs are larger for Big 5audited organizations, the difference is not statistically significant. The preliminaryresults do appear to support the notion that Big 5 auditors may have a higherthreshold for determining when noncompliance becomes material.17. These are generally consistent with risk measures in for-profit corporations
that include leverage, growth, debt ratings, age, and asset composition.
ACKNOWLEDGMENT
This study is a product of my dissertation, and I would like to thank mydissertation committee – Kathy Petroni, Chairperson, Joseph Anthony,Alvin Arens, and Jeffrey Wooldridge – for all of their time, effort, andinvaluable guidance in doing this study. I would also like to thank theanonymous reviewer, and workshop participants at the InternationalSymposium on Audit Research, Michigan State University, University ofNew Hampshire, Wright State University, Mississippi State University, andMarshall University for their insightful comments.
REFERENCES
Allen, A. C. (1994). The effect of large-firm audits on municipal bond rating decisions. Auditing:
A Journal of Practice and Theory, 13(Spring), 115–125.
American Institute of Certified Public Accountants (AICPA). (2006). Communicating internal
control related matters identified in an audit. Statement on Auditing Standards No. 112.
New York, NY: AICPA.
Differences in Financial Statement and Compliance Audit Assessments 31
Balvers, R. J., McDonald, B., & Miller, R. E. (1988). Underpricing of new issues and the choice
of auditor as a signal of investment banker reputation. The Accounting Review,
63(October), 605–622.
Beattie, V., Goodacre, A., Pratt, K., & Stevenson, J. (2001). The determinants of audit fees –
Evidence from the voluntary sector. Accounting and Business Research, 31(Autumn),
243–274.
Beatty, R. P. (1989). Auditor reputation and the pricing of initial public offerings. The
Accounting Review, 64(October), 693–709.
Becker, C. L., Defond, M. L., Jiambalvo, J., & Subramanyam, K. R. (1998). The effect of audit
quality on earnings management. Contemporary Accounting Research, 15(Spring), 1–24.
Clarkson, P. M. (2000). Auditor quality and the accuracy of management earnings forecasts.
Contemporary Accounting Research, 17(Winter), 595–622.
Clarkson, P. M., & Simunic, D. A. (1994). The association between audit quality, retained
ownership, and firm-specific risk in U.S. vs. Canadian IPO markets. Journal of
Accounting and Economics, 17, 207–228.
Colbert, G., & Murray, D. (1998). The association between auditor quality and auditor size: An
analysis of small CPA firms. Journal of Accounting, Auditing, and Finance, 13(Spring),
135–150.
Copley, P. A. (1991). The association between municipal disclosure practices and audit quality.
Journal of Accounting and Public Policy, 10, 245–266.
Copley, P. A., Gaver, J. J., & Gaver, K. M. (1995). Simultaneous estimation of the supply and
demand of differentiated audits: Evidence from the municipal audit market. Journal of
Accounting Research, 33(Spring), 137–155.
Craswell, A. T., Francis, J. R., & Taylor, S. L. (1995). Auditor brand name reputations and
industry specializations. Journal of Accounting and Economics, 20(December), 297–322.
Datar, S. M., Feltham, G. A., & Hughes, J. S. (1991). The role of audits and audit quality in
valuing new issues. Journal of Accounting and Economics, 14, 3–49.
Davidson, R. A., & Neu, D. (1993). A note on the association between audit firm size and audit
quality. Contemporary Accounting Research, 9(Spring), 479–488.
DeAngelo, L. E. (1981). Auditor size and audit quality. Journal of Accounting and Economics,
3(December), 183–199.
DeFond, M. L. (1992). The association between changes in client firm agency costs and auditor
switching. Auditing: A Journal of Practice and Theory, 11(Spring), 16–31.
Feltham, G. A., Hughes, J. S., & Simunic, D. A. (1991). Empirical assessment of the impact of
auditor quality on the valuation of new issues. Journal of Accounting and Economics, 14,
375–399.
Firth, M., & Liau-Tan, C. K. (1998). Auditor quality, signaling, and the valuation of initial public
offerings. Journal of Business Finance and Accounting, 25(January/March), 145–165.
Firth, M., & Smith, A. (1992). Selection of auditor firms by companies in the new issue market.
Applied Economics, 24, 247–255.
Francis, J. R., Maydew, E. L., & Sparks, H. C. (1999). The role of Big 6 auditors in the credible
reporting of accruals. Auditing: A Journal of Practice and Theory, 18(Fall), 17–34.
Heckman, J. J. (1979). Sample selection bias as a specification error. Econometrica, 47(January),
153–162.
Keating, E. K., Fischer, M., Gordon, T. P., & Greenlee, J. (2005). The single audit act: How
compliant are nonprofit organizations? Journal of Public Budgeting, Accounting, and
Financial Management, 17(Fall), 285–309.
STEFANIE L. TATE32
Krishnan, J., & Schauer, P. C. (2000). The differentiation of quality among auditors: Evidence
from the not-for-profit sector. Auditing: A Journal of Practice and Theory, 19(Fall), 9–25.
Lee, P., Stokes, D., Taylor, S., & Walter, T. (2003). The association between audit quality,
accounting disclosures and firm-specific risk: Evidence from initial public offerings.
Journal of Accounting and Public Policy, 22(September), 377–400.
Office of Management and Budget. (1997). Circular No. A-133: Audits of states, local
governments, and non-profit organizations. Washington, DC: The Executive Office of the
President.
O’Keefe, T. B., King, R. D., & Gaver, K. M. (1994). Audit fees, industry specialization, and
compliance with GAAS reporting standards. Auditing: A Journal of Practice and Theory,
13(Fall), 41–53.
Petroni, K., & Beasley, M. (1996). Errors in accounting estimates and their relation to audit
firm type. Journal of Accounting Research, 34(Spring), 151–171.
Simunic, D., & Stein, M. (1987). Product differentiation in auditing: Auditor choice in the market
for unseasoned new issues. Research Monograph No. 13. Vancouver, B.C.: Canadian
Certified General Accountants’ Research Foundation.
Teoh, S. H., & Wong, T. J. (1993). Perceived auditor quality and the earnings response
coefficient. The Accounting Review, 68(April), 346–366.
Thornton, D. B., & Moore, G. (1993). Auditor choice and audit fee determinants. Journal of
Business Finance and Accounting, 20(April), 333–349.
Titman, S., & Trueman, B. (1986). Information quality and the valuation of new issues. Journal
of Accounting and Economics, 8, 159–172.
Wooldridge, J. M. (2000). Introductory econometrics: A modern approach. USA: South-Western
College Publishing-Thomson Learning.
Wooldridge, J. M. (2002). Econometric analysis of cross section and panel data. Cambridge, MA:
The MIT Press.
Differences in Financial Statement and Compliance Audit Assessments 33

This page intentionally left blank
FUNDAMENTAL ANALYSIS OF
NOT-FOR-PROFIT FINANCIAL
STATEMENTS: AN EXAMINATION
OF FINANCIAL VULNERABILITY
MEASURES
Linda M. Parsons and John M. Trussel
ABSTRACT
Using data from the Internal Revenue Statistics of Income, we examinefundamental variables to determine whether nonprofit financial ratios arevalue-relevant to financial statement users, specifically donors. We focuson measures of financial vulnerability, defined as an organization’s abilityto continue to operate and provide charitable services in the event ofchanged economic circumstances. The evidence suggests that financialvulnerability measures provide donors with incremental informationbeyond that contained in efficiency ratios.
1. INTRODUCTION
An important function of accounting and financial reporting is to assist inthe analysis and evaluation of organizations. Beginning with the pivotal
Research in Governmental and Nonprofit Accounting, Volume 12, 35–56
Copyright r 2009 by Emerald Group Publishing Limited
All rights of reproduction in any form reserved
ISSN: 0884-0741/doi:10.1108/S0884-0741(2009)0000012004
35
work of Ball and Brown (1968), capital markets research has demonstratedthe usefulness of earnings in explaining stock returns. Lev and Thiagarajan(1993) show that other fundamental variables in financial statements, suchas gross margin and the ratio of inventory to sales, convey incrementalinformation that is useful in analyzing company performance. Using manyof the ratios and measures identified by Lev and Thiagarajan, Abarbanelland Bushee (1997) find that fundamental analysis assists decision-making bymarket participants.
Not-for-profit (NFP) organizations often serve as brokers that collectfunds from donors and grantors and distribute them to the intendedbeneficiaries. Stakeholders, such as donors and grant-making entities, oftenrely on financial reports to assess the operational performance and financialmanagement of charitable organizations (Gordon & Khumawala, 1999).Anthony and Young (2003) contend that financial analysis of nonprofitfinancial reports is valuable for assessing an organization’s financial mana-gement. There is not a profit motive or an ability to reward equitystakeholders, so earnings information is not as useful in a NFP setting as ina for-profit one. It is therefore important to determine which accountingmeasures provide financial statement readers with useful information forevaluating the operations of NFP firms.
To date, NFP researchers have focused almost exclusively on theprogram ratio, which measures the proportion of expenditures that arededicated to an organization’s charitable purpose. A number of studies,starting with Weisbrod and Dominguez (1986), demonstrate the positiverelationship of donations with efficiency measures such as the programratio. This line of research supports the idea that a measure of efficiency,defined as the percentage of total expenditures directed toward thecharitable mission, is important to donors making/giving decisions(Parsons, 2003).
We explore other fundamental variables in NFP financial statements todetermine whether financial measures other than those that gauge efficiencyare useful to financial statement users, specifically donors. We focus onmeasures of financial vulnerability, defined as an organization’s ability tocontinue to operate and provide charitable services in the event ofchanged economic circumstances (e.g., reduction in contributions) (Parsons,2003). The evidence we present suggests that several financial vulnerabilitymeasures are significantly related to the amount of donations raised by thecharitable organizations in our sample. Financial vulnerability measuresprovide incremental information above that contained in efficiencymeasures.
LINDA M. PARSONS AND JOHN M. TRUSSEL36
2. EVALUATING FINANCIAL PERFORMANCE
Weisbrod and Dominguez (1986) were among the first to examine theusefulness of accounting information to donors. They create a measure ofefficiency which indicates the percentage of contributed (and other) resourcesspent on activities other than fundraising. Using data from U.S. Form 990s1
they find that total donations are positively related to the efficiency measure.Using a measure that focuses on expenses that directly benefit the causefor which the charity was established (excluding both fundraising andadministrative costs), studies by Posnett and Sandler (1989), Callen (1994),and Tinkelman (1999) support the findings of Weisbrod and Dominguez(1986). Utilizing a slightly different efficiency ratio that measures admini-strative expenses as a percentage of total expenses less fundraising costs,Greenlee and Brown (1999) also demonstrate that more efficient firmsgenerate greater contributions on average.2
Just as there are times that the earnings number alone does not provide allthe information necessary to analyze for-profit financial statements, theefficiency measure alone may provide limited information about the financialhealth of NFP entities. For example, Baber, Roberts, and Visvanathan (2001)note that interpreting an organization’s efficiency measure is contingent onunderstanding its fundraising strategy. Therefore, we believe financial state-ment analysis can provide additional value to donors who use NFP financialreports to assess management’s stewardship of nonprofit resources.
To identify fundamental variables that may be valuable to donors inanalyzing NFP financial statements, we follow the ‘‘guided search’’approach used by Lev and Thiagarajan (1993, p. 191). Lev and Thiagarajanselect the fundamental variables for their study based on the signals thatfinancial analysts use in their analyses. This selection process differs fromprevious attempts to identify fundamental signals using a statistical search(Ou & Penman, 1989). To identify important variables for NFPs we look tothe recommendations of Anthony (1983) and Tuckman and Chang (1991),as well as to the giving guidelines suggested by charity watchdog groupssuch as the Wise Giving Alliance of the Better Business Bureau, theAmerican Institute of Philanthropy, and Charity Navigator.3
Anthony (1983) asserts that, just like business entities, NFPs mustmaintain positive equity to remain a going concern. In addition to knowingthat a nonprofit organization works efficiently, Anthony suggests thatdonors want to know whether the firm can continue to operate in the futureif faced with economic difficulties. In other words, donors consider anorganization’s financial vulnerability. Tuckman and Chang (1991) are the
Fundamental Analysis of Not-for-Profit Financial Statements 37
first to propose several measures to assess a NFP organization’s financialcondition. Their financial vulnerability measures, which often coincide withthe giving guidance suggested by various watchdog agencies, are defined inthe following paragraphs.
Adequacy of equity or wealth. First, the ratio of net assets to total revenuecan be calculated to determine the adequacy of ‘‘equity.’’ This ratio providesa measure of the wealth of the charity; specifically, it is the number of periodsof revenue a nonprofit currently has on hand. In the event of a temporarydecline in revenues, a firm with greater access to funds faces a lower risk ofcollapse. An organization with a larger measure of wealth is more likely to beable to (a) liquidate existing assets or (b) obtain credit to meet future needs.Without an adequate reserve of funds, a nonprofit firm will be unable tocontinue to operate normally when faced with a reduction in revenues.
While Tuckman and Chang suggest that larger reserves decrease financialvulnerability, some charity watchdog groups warn donors to avoidcharitable organizations that accumulate resources instead of spendingdonations on program services. Both the Better Business Bureau’s WiseGiving Alliance and the American Institute of Philanthropy recommendthat organizations have a reserve of less than three years on hand.4 Using asimilar measure, net assets to total expenses exclusive of fundraisingexpenses, Marudas (2004) predicts a negative relationship between wealthand donations, but finds mixed results on the impact on donations for hissample of nonprofit organizations.5
Revenue concentration. Second, a firm with a greater number of revenuesources is expected to be less susceptible to financial shocks. A firm that isdependent on one or a few revenue providers is vulnerable to declines in theeconomic health or changes in the donation preferences of those providers.To capture the extent of revenue dispersion, Tuckman and Changrecommend computation of an index of revenue concentration similar tothe Herfindahl Index used by economists to measure market concentration.Specifically, Tuckman and Chang define the revenue concentration index asthe summation of the squared percentage share that each revenue sourcerepresents of total revenue. If a single source of revenue exists, the indexequals one. A firm with many sources of revenue has an index closer to zero.
Posnett and Sandler (1989), Tinkelman (1999), and Marudas (2004)examine various revenue sources other than donations, such as those fromgovernment grants and program services, to test the ‘‘crowding out’’ theory,which posits that donors will give less to charities that receive moregovernment grants and program revenues. Their results on whether otherrevenues crowd out or crowd in donations are mixed. Following Tuckman
LINDA M. PARSONS AND JOHN M. TRUSSEL38
and Chang (1991), we examine revenues other than donations in the revenueconcentration variable.
Level of administrative costs. Third, Tuckman and Chang recommendcomputing a ratio of administrative expenses to total expenses. Thismeasure is similar to the efficiency measure used by Greenlee and Brown(1999). Tuckman and Chang reason that a firm with high administrativeexpenses can adjust to revenue reductions by taking steps to cut costs. Whenfaced with a reduction in revenues, an organization with larger overheadcosts has the option to cut those costs instead of reducing the overall level ofprogram services offered. In contrast, a leaner, more efficient firm may haveless ability to economize without cutting program expenditures. Accordingto Tuckman and Chang, NFPs with the lowest ratios are the mostvulnerable to financial crisis.
High administrative ratios may insulate NFP organizations from financialshocks, but several of the charity watchdog agencies encourage donors todemand spending on programs that meets certain minimum levels. TheBetter Business Bureau’s Wise Giving Alliance suggests a program ratio(program expenses divided to total expenses) of at least 65 percent, whileboth the American Institute of Philanthropy and Charity Navigator advisedonors that charities should dedicate at least 60 percent of total expenses toprograms. A high administrative ratio may signal low financial vulnerability,but may result in a program ratio that is below recommended minimums.
Operating margins. Fourth, Tuckman and Chang suggest a measureanalogous to the gross margin ratio used in a business setting. This ratio,called operating margin, is revenues less expenses, divided by revenues. Ahigher operating margin is indicative of a greater potential surplus on which todraw in the event of unexpected financial difficulties. Charity Navigatoradvises donors that to stay in business, charitable organizations need consistentgrowth achieved through positive operating margins. However, charities haveincentives to minimize profits (Trussel, 2003). Reporting profits may result inthe loss of donors (and scrutiny by regulators), as they may perceive that aprofitable organization is not maximizing spending on its charitable purpose.
Borrowing from the bankruptcy models of Altman (1968) and Ohlson(1980), Greenlee and Trussel (2000) include Tuckman and Chang’s (1991)financial vulnerability measures in a logistic regression model used to predictfinancial distress (defined as a decrease in program expenditures for threeconsecutive years). Three of the four vulnerability measures (all except theratio of equity to revenue) are significant in predicting financial distress.6
Trussel and Greenlee (2004) extend Greenlee and Trussel’s (2000)vulnerability prediction model to control for size and sector, as well as to
Fundamental Analysis of Not-for-Profit Financial Statements 39
explore other definitions of financial distress. Financial distress is defined asa significant decrease in net assets over a three-year period.7 Both theadequacy of equity and the operating margin are significant predictors offinancial distress. Trussel (2002) employs a model similar to the Trussel andGreenlee (2004) model on a much larger sample of more than 94,000 organi-zations obtained from the IRS Core Files, which include all tax exemptorganizations required to file a Form 990 or 990-EZ. The coefficients of allvariables are significant with the predicted signs. However, the admini-strative costs variable is not included, as the database from which the sampleis drawn does not contain this information. Also, Trussel drops the equityvariable in favor of the debt to assets ratio.
These studies provide evidence that Tuckman and Chang’s (1991)prescribed measures are useful for certain financial statement users.However, unlike the studies addressing efficiency measures, Trussel andGreenlee (2004) do not determine whether financial vulnerability measuresare significantly related to donations. By examining the association betweenfinancial vulnerability measures and total donations, we bridge the gapbetween the prior accounting studies that focus on efficiency measures andthose that focus on financial vulnerability measures, and determine whetherratios suggested by charity watchdog agencies are value-relevant to donors.
3. RESEARCH QUESTIONS AND DESIGN
3.1. Empirical Specification
Our primary purpose is to explore whether Tuckman and Chang’s (1991)financial vulnerability measures provide useful information, above thatcontained in efficiency measures, to donors making a contribution decision.Therefore, the first model presented is similar to Tinkelman’s (1999) modelto examine the relationship between efficiency measures and directdonations. We exclude the independent variables related to revenue sourcesother than direct donations, since those variables are part of our financialvulnerability model. Model 1 has the following specification:
lnDONit ¼ b0 þ b1 ln PRICEiðt�1Þ þ b2 ln FUNDiðt�1Þ
þ b3 ln SIZEiðt�1Þ þ b4 lnAGEit þ �i(1)
where ei is assumed to be distributed independently and identically.
LINDA M. PARSONS AND JOHN M. TRUSSEL40
We define the dependent variable, DON, as the natural logarithm ofdirect donations to organization i at time t.8 The independent variables fromthe financial statements are measured in the year before the receipt ofdonations because donors will not have access to current year accountingreports when making a current year contribution decision. This approachfollows that used by Weisbrod and Dominguez (1986) and Tinkelman(1999). Tinkelman (1999) and Marudas (2004) use government grants andprogram revenues as additional control variables. We incorporate thesevariables into the revenue concentration variable stated later.
PRICEi is a measure of efficiency for firm i in the year before thedonation. Tinkelman (1999) defines PRICE as the after tax cost to a donorto purchase $1 (or other monetary unit) of output for beneficiaries. Thereare two factors that influence PRICE. First, the donor’s cost to provide $1of charitable output is less than $1 when contributions are tax deductible.The donor’s tax rate is disregarded in this study because it does not varyacross organizations (e.g., Weisbrod & Dominguez, 1986; Tinkelman, 1999;Marudas, 2004).
The second factor that impacts PRICE is the amount of contributionsthat are used for purposes other than providing services, such as generaladministrative and overhead costs or fundraising. Therefore, ignoring taxdeductions, the donor’s cost is greater than $1 because not all of every dollaris used for programs. PRICE is calculated as the reciprocal of the percentageof total expenditures directed to program expenses (the natural logarithm ofthe result is used as in prior studies). The related coefficient is expected to benegative. This implies that donors prefer to contribute to more efficientorganizations.
FUNDi is operationalized as the natural logarithm of fundraisingexpenditures of firm i in the year prior to the donation. Because the naturallogarithm of zero is undefined, we replace each zero value with $1.Fundraising expenditures in the NFP sector act much like advertising in thefor-profit sector, in that they introduce the organization and its output topotential donors. Therefore, total fundraising expenditures are included inthe model as a control variable. This variable is included in the Weisbrodand Dominguez (1986), Tinkelman (1999), and Marudas (2004) models andis positively and significantly related to total donations.
SIZEi is the natural logarithm of total assets of firm i at the end of yeart� 1. Fundraising success may be different for large charitable organiza-tions than for smaller ones. Both Tinkelman (1999) and Trussel andGreenlee (2004) include a control variable for organization size in theirmodels.
Fundamental Analysis of Not-for-Profit Financial Statements 41
AGEi is a proxy for the quality of a firm’s output. It is calculated as thenatural logarithm of the difference between the year of the donation and theyear in which the organization was granted tax-exempt status. Weisbrodand Dominguez (1986), Posnett and Sandler (1989), Callen (1994), andTinkelman (1999) include this control variable in their studies. Except forTinkelman (1999), each study finds a significant and positive relationshipbetween age and total donations.9 Tinkelman (1999) finds that the significantrelationship is positive for small organizations and negative for large ones.
To determine whether the financial vulnerability measures provideadditional useful information to donors, Model 2 adds the financialvulnerability measures suggested by Tuckman and Chang (1991) to Model 1.Model 2 is empirically specified as follows:
lnDONit ¼ l0 þ l1 ln PRICEiðt�1Þ þ l2 lnFUNDiðt�1Þ þ l3 ln SIZEiðt�1Þ
þ l4 lnAGEit þ l5EQUITYiðt�1Þ þ l6CONCENiðt�1Þ
þ l7ADMINiðt�1Þ þ l8MARGINiðt�1Þ þ �i
(2)
where ei is assumed to be distributed independently and identically.EQUITYi is measured as the net assets of firm i divided by its total revenue.
We predict a positive coefficient as evidence that donors reward morefinancially stable NFPs, as measured by equity ratios. A negative coefficientwould support the claim of the charity watchdogs that organizations withlarge fund reserves are viewed less favorably than those that spend currentdonations on the charitable mission. Marudas (2004) finds that wealth or‘‘years of available assets,’’ a variable similar to EQUITY, has a mixed impacton donations. In some sectors, donations are negatively related to wealth;whereas, in others, donations are positively related to wealth.
CONCENi is the revenue concentration index of firm i, which Tuckmanand Chang (1991) calculate as the sum of the squared portion that eachsource of revenue represents of total revenue. A problem with using thismeasurement of revenue concentration in our model is that lagged directdonations are included as a revenue source, which may confound the resultswhen regressed on current period direct donations. Lagged direct donationsare highly correlated with current period direct donations. To rectify thisproblem, we exclude lagged direct donations as a revenue source (and fromtotal revenues, the denominator). This changes the nature of this variablesomewhat to a measure of the concentration of sources of revenue otherthan direct donations.
We predict a negative sign for the related coefficient on CONCEN, whichimplies that more financially stable organizations, defined as those with a
LINDA M. PARSONS AND JOHN M. TRUSSEL42
lower concentration of other revenue sources, receive larger direct donations.This variable includes revenue from government grants and program reve-nues; thus, we do not include these as separate variables as some previousstudies do (e.g., Tinkelman, 1999).
ADMINi is computed as the administrative expense of firm i divided bytotal expenses. We predict a positive coefficient, which implies that morefinancially stable NFPs, defined as those with a greater ability to cut cost inresponse to financial shock without also reducing the level of servicesavailable to beneficiaries, are better able to generate charitable contribu-tions. Tuckman and Chang (1991) and Greenlee and Trussel (2000) demon-strate that leaner firms are more vulnerable to financial shocks. A negativecoefficient is consistent with the findings by Greenlee and Brown (1999) thatADMIN is an efficiency measure and organizations that devote the largestpercentage of their revenues to program services raise the highest amount ofcontributions.10 The watchdog agencies propose to donors that moreefficient organizations (defined as those that spend more on programs andless on administrative costs) are more deserving of contributions.
MARGINi is the operating margin of firm i, which is total revenues lesstotal expenses, divided by total revenues. The coefficient is expected to bepositive, which demonstrates that more financially stable NFPs, defined asthose with the ability to devote a greater portion of each revenue dollar tosurplus, are able to generate a higher level of donations. A positivecoefficient provides evidence to support Charity Navigator’s recommenda-tion that charities need positive margins to achieve the growth necessary foran organization to survive. A negative coefficient would provide evidence ofthe incentive to minimize profits, since donors may perceive that theircontributions are not utilized for current programs (Trussel, 2003).
3.2. Data Collection
We use data from the Internal Revenue Service Statistics of Income (SOI)database developed by the National Center for Charitable Statistics(NCCS).11 The data are obtained and pooled from the 990s for tax years1982–1983 and 1985–1999.12 The SOI database includes information for all501(c)(3) charitable organizations with at least $10 million in assets, and arandom sample of smaller charitable organizations (stratified and weightedby asset level) that are required to file a Form 990 with the IRS.Organizations that are not required to file IRS Form 990, such as religiousorganizations or those with gross receipts less than $25,000, are not
Fundamental Analysis of Not-for-Profit Financial Statements 43
included. The database is biased toward larger organizations, which maylimit our ability to generalize our results to smaller NFP entities.
Marudas and Jacobs (2004) find that a two-way fixed effects model best fitstheir sample data of three sectors in the United States – higher education, hospi-tals, and scientific research nonprofits. They suggest using an error componentsmodel to control for unspecified organization-specific and time-specific factors.However, Marudas (2004) finds that ‘‘the NCCS database appears to containtoo much measurement error to test effectively error components models’’(p. 83). Thus, we follow Marudas (2004) in using pooled cross-sectional datarather than an error components model. However, we control for some time-specific factors. We adjust all data for inflation using the Consumer Price Index,with 1982 as the base year. We also perform the analyses using two dummyvariables suggested by Okten and Weisbrod (2000). The dummy variablesare for the tax years 1984 and 1986, as there were significant changes in tax lawswhich impact incentives to make donations.13 The coefficients for these twoyear variables are not significant for any of our tests, nor do they alter thesignificance of the models or their explanatory power.
3.3. Analysis by Sector
Greenlee and Bukovinsky (1998) propose that an analysis of accountingratios should consider that differences may be due, in part, to the ‘‘industry’’or sector in which the organization operates. Additionally, Hager (2001)suggests that Tuckman and Chang’s (1991) financial vulnerability measuresare not equally useful for all types of charitable organizations. Trussel andGreenlee (2004) find that sector is significant in predicting financial distress.Marudas and Jacobs (2004) and Marudas (2004) find significant differencesin results of their donations models for charities in different sectors.Following Trussel and Greenlee (2004) and Marudas (2004), we use sixcategories of charities, as determined by the National Taxonomy ExemptEntities (NTEE). The six categories are arts, education, human services,public benefit, health, and other.
4. ANALYSES AND RESULTS
Our initial sample is comprised of 163,094 organization-years that providedfinancial information for any two-year period during the reporting period.Organization-years with missing data and outliers, defined as those cases
LINDA M. PARSONS AND JOHN M. TRUSSEL44
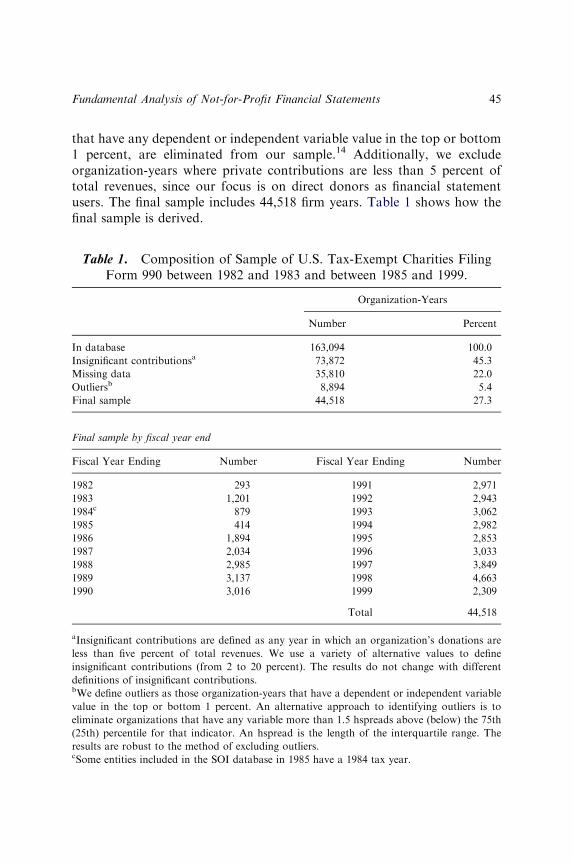
that have any dependent or independent variable value in the top or bottom1 percent, are eliminated from our sample.14 Additionally, we excludeorganization-years where private contributions are less than 5 percent oftotal revenues, since our focus is on direct donors as financial statementusers. The final sample includes 44,518 firm years. Table 1 shows how thefinal sample is derived.
Table 1. Composition of Sample of U.S. Tax-Exempt Charities FilingForm 990 between 1982 and 1983 and between 1985 and 1999.
Organization-Years
Number Percent
In database 163,094 100.0
Insignificant contributionsa 73,872 45.3
Missing data 35,810 22.0
Outliersb 8,894 5.4
Final sample 44,518 27.3
Final sample by fiscal year end
Fiscal Year Ending Number Fiscal Year Ending Number
1982 293 1991 2,971
1983 1,201 1992 2,943
1984c 879 1993 3,062
1985 414 1994 2,982
1986 1,894 1995 2,853
1987 2,034 1996 3,033
1988 2,985 1997 3,849
1989 3,137 1998 4,663
1990 3,016 1999 2,309
Total 44,518
aInsignificant contributions are defined as any year in which an organization’s donations are
less than five percent of total revenues. We use a variety of alternative values to define
insignificant contributions (from 2 to 20 percent). The results do not change with different
definitions of insignificant contributions.bWe define outliers as those organization-years that have a dependent or independent variable
value in the top or bottom 1 percent. An alternative approach to identifying outliers is to
eliminate organizations that have any variable more than 1.5 hspreads above (below) the 75th
(25th) percentile for that indicator. An hspread is the length of the interquartile range. The
results are robust to the method of excluding outliers.cSome entities included in the SOI database in 1985 have a 1984 tax year.
Fundamental Analysis of Not-for-Profit Financial Statements 45
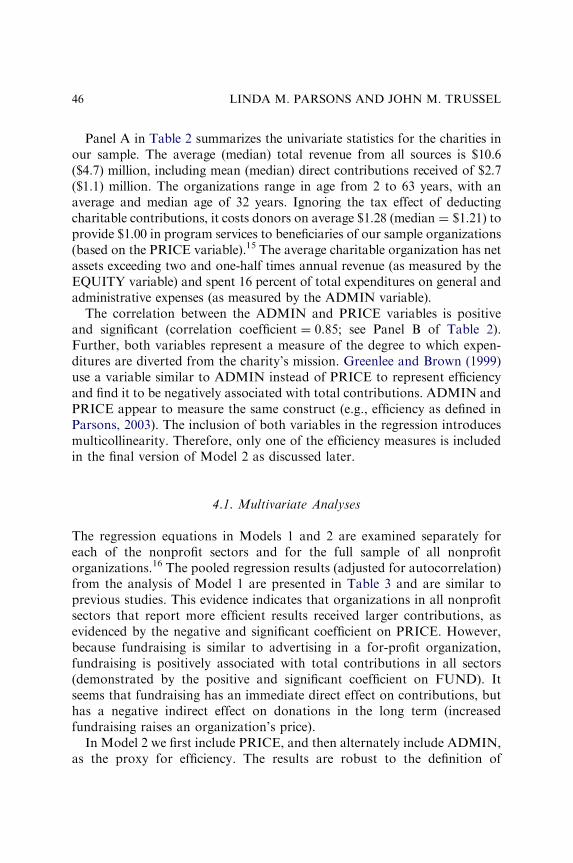
Panel A in Table 2 summarizes the univariate statistics for the charities inour sample. The average (median) total revenue from all sources is $10.6($4.7) million, including mean (median) direct contributions received of $2.7($1.1) million. The organizations range in age from 2 to 63 years, with anaverage and median age of 32 years. Ignoring the tax effect of deductingcharitable contributions, it costs donors on average $1.28 (median ¼ $1.21) toprovide $1.00 in program services to beneficiaries of our sample organizations(based on the PRICE variable).15 The average charitable organization has netassets exceeding two and one-half times annual revenue (as measured by theEQUITY variable) and spent 16 percent of total expenditures on general andadministrative expenses (as measured by the ADMIN variable).
The correlation between the ADMIN and PRICE variables is positiveand significant (correlation coefficient ¼ 0.85; see Panel B of Table 2).Further, both variables represent a measure of the degree to which expen-ditures are diverted from the charity’s mission. Greenlee and Brown (1999)use a variable similar to ADMIN instead of PRICE to represent efficiencyand find it to be negatively associated with total contributions. ADMIN andPRICE appear to measure the same construct (e.g., efficiency as defined inParsons, 2003). The inclusion of both variables in the regression introducesmulticollinearity. Therefore, only one of the efficiency measures is includedin the final version of Model 2 as discussed later.
4.1. Multivariate Analyses
The regression equations in Models 1 and 2 are examined separately foreach of the nonprofit sectors and for the full sample of all nonprofitorganizations.16 The pooled regression results (adjusted for autocorrelation)from the analysis of Model 1 are presented in Table 3 and are similar toprevious studies. This evidence indicates that organizations in all nonprofitsectors that report more efficient results received larger contributions, asevidenced by the negative and significant coefficient on PRICE. However,because fundraising is similar to advertising in a for-profit organization,fundraising is positively associated with total contributions in all sectors(demonstrated by the positive and significant coefficient on FUND). Itseems that fundraising has an immediate direct effect on contributions, buthas a negative indirect effect on donations in the long term (increasedfundraising raises an organization’s price).
In Model 2 we first include PRICE, and then alternately include ADMIN,as the proxy for efficiency. The results are robust to the definition of
LINDA M. PARSONS AND JOHN M. TRUSSEL46
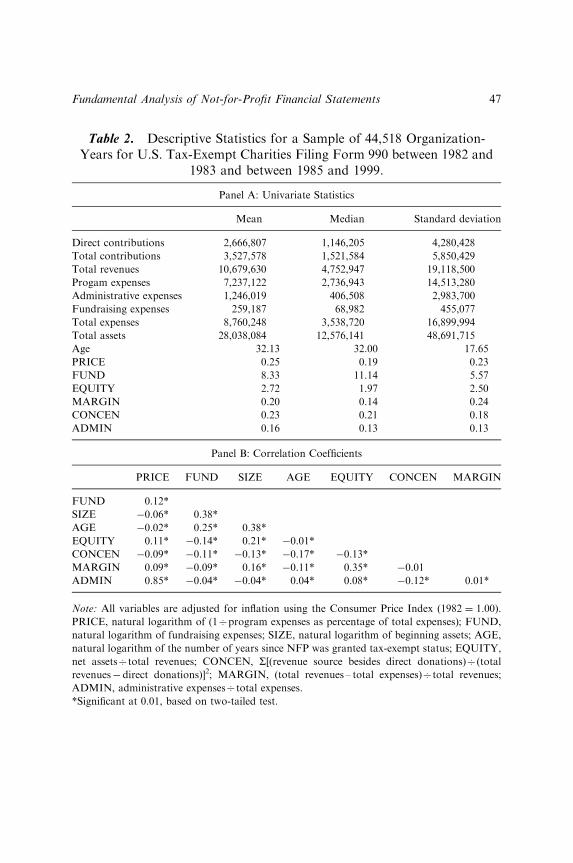
Table 2. Descriptive Statistics for a Sample of 44,518 Organization-Years for U.S. Tax-Exempt Charities Filing Form 990 between 1982 and
1983 and between 1985 and 1999.
Panel A: Univariate Statistics
Mean Median Standard deviation
Direct contributions 2,666,807 1,146,205 4,280,428
Total contributions 3,527,578 1,521,584 5,850,429
Total revenues 10,679,630 4,752,947 19,118,500
Progam expenses 7,237,122 2,736,943 14,513,280
Administrative expenses 1,246,019 406,508 2,983,700
Fundraising expenses 259,187 68,982 455,077
Total expenses 8,760,248 3,538,720 16,899,994
Total assets 28,038,084 12,576,141 48,691,715
Age 32.13 32.00 17.65
PRICE 0.25 0.19 0.23
FUND 8.33 11.14 5.57
EQUITY 2.72 1.97 2.50
MARGIN 0.20 0.14 0.24
CONCEN 0.23 0.21 0.18
ADMIN 0.16 0.13 0.13
Panel B: Correlation Coefficients
PRICE FUND SIZE AGE EQUITY CONCEN MARGIN
FUND 0.12*
SIZE �0.06* 0.38*
AGE �0.02* 0.25* 0.38*
EQUITY 0.11* �0.14* 0.21* �0.01*
CONCEN �0.09* �0.11* �0.13* �0.17* �0.13*
MARGIN 0.09* �0.09* 0.16* �0.11* 0.35* �0.01
ADMIN 0.85* �0.04* �0.04* 0.04* 0.08* �0.12* 0.01*
Note: All variables are adjusted for inflation using the Consumer Price Index (1982 ¼ 1.00).
PRICE, natural logarithm of (1Cprogram expenses as percentage of total expenses); FUND,
natural logarithm of fundraising expenses; SIZE, natural logarithm of beginning assets; AGE,
natural logarithm of the number of years since NFP was granted tax-exempt status; EQUITY,
net assetsCtotal revenues; CONCEN, S[(revenue source besides direct donations)C(total
revenues�direct donations)]2; MARGIN, (total revenues – total expenses)Ctotal revenues;
ADMIN, administrative expensesCtotal expenses.
*Significant at 0.01, based on two-tailed test.
Fundamental Analysis of Not-for-Profit Financial Statements 47
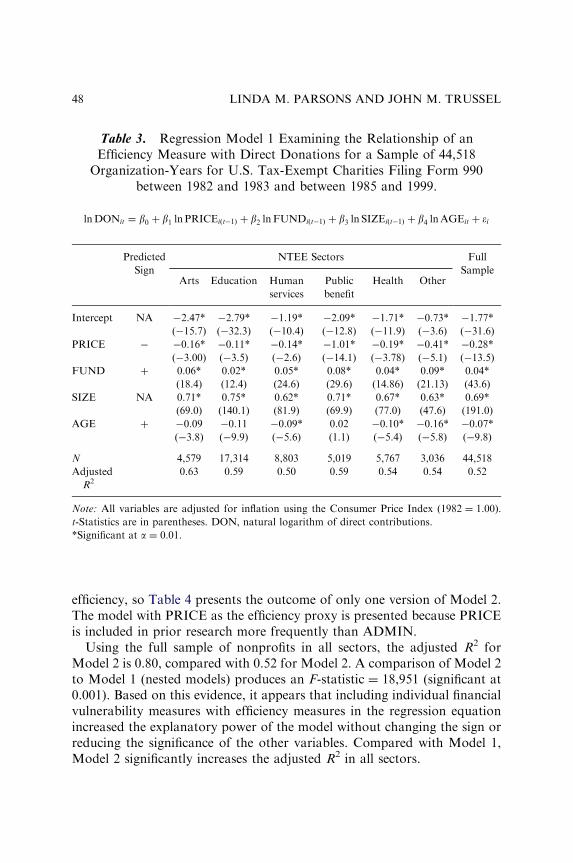
efficiency, so Table 4 presents the outcome of only one version of Model 2.The model with PRICE as the efficiency proxy is presented because PRICEis included in prior research more frequently than ADMIN.
Using the full sample of nonprofits in all sectors, the adjusted R2 forModel 2 is 0.80, compared with 0.52 for Model 2. A comparison of Model 2to Model 1 (nested models) produces an F-statistic ¼ 18,951 (significant at0.001). Based on this evidence, it appears that including individual financialvulnerability measures with efficiency measures in the regression equationincreased the explanatory power of the model without changing the sign orreducing the significance of the other variables. Compared with Model 1,Model 2 significantly increases the adjusted R2 in all sectors.
Table 3. Regression Model 1 Examining the Relationship of anEfficiency Measure with Direct Donations for a Sample of 44,518
Organization-Years for U.S. Tax-Exempt Charities Filing Form 990between 1982 and 1983 and between 1985 and 1999.
lnDONit ¼ b0 þ b1 ln PRICEiðt�1Þ þ b2 ln FUNDiðt�1Þ þ b3 ln SIZEiðt�1Þ þ b4 lnAGEit þ �i
Predicted
Sign
NTEE Sectors Full
SampleArts Education Human
services
Public
benefit
Health Other
Intercept NA �2.47* �2.79* �1.19* �2.09* �1.71* �0.73* �1.77*
(�15.7) (�32.3) (�10.4) (�12.8) (�11.9) (�3.6) (�31.6)
PRICE � �0.16* �0.11* �0.14* �1.01* �0.19* �0.41* �0.28*
(�3.00) (�3.5) (�2.6) (�14.1) (�3.78) (�5.1) (�13.5)
FUND þ 0.06* 0.02* 0.05* 0.08* 0.04* 0.09* 0.04*
(18.4) (12.4) (24.6) (29.6) (14.86) (21.13) (43.6)
SIZE NA 0.71* 0.75* 0.62* 0.71* 0.67* 0.63* 0.69*
(69.0) (140.1) (81.9) (69.9) (77.0) (47.6) (191.0)
AGE þ �0.09 �0.11 �0.09* 0.02 �0.10* �0.16* �0.07*
(�3.8) (�9.9) (�5.6) (1.1) (�5.4) (�5.8) (�9.8)
N 4,579 17,314 8,803 5,019 5,767 3,036 44,518
Adjusted
R20.63 0.59 0.50 0.59 0.54 0.54 0.52
Note: All variables are adjusted for inflation using the Consumer Price Index (1982 ¼ 1.00).
t-Statistics are in parentheses. DON, natural logarithm of direct contributions.
*Significant at a ¼ 0.01.
LINDA M. PARSONS AND JOHN M. TRUSSEL48
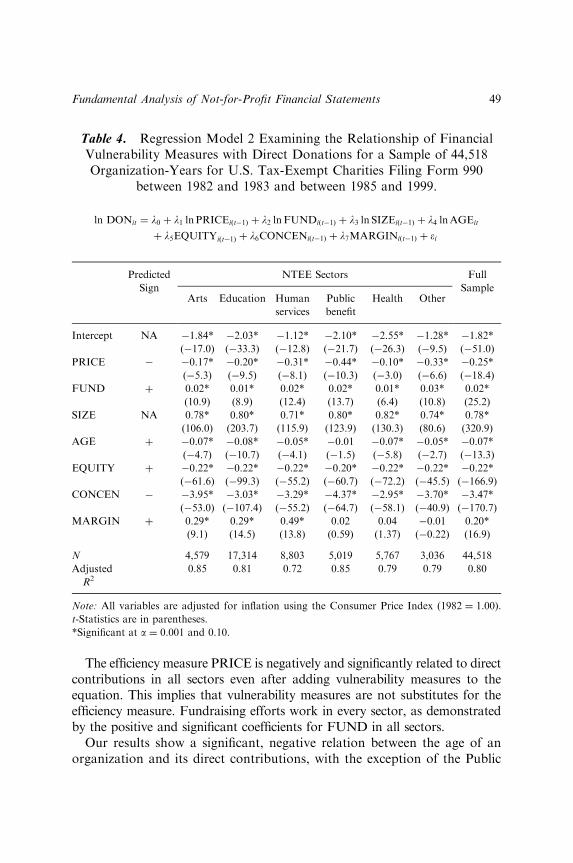
The efficiency measure PRICE is negatively and significantly related to directcontributions in all sectors even after adding vulnerability measures to theequation. This implies that vulnerability measures are not substitutes for theefficiency measure. Fundraising efforts work in every sector, as demonstratedby the positive and significant coefficients for FUND in all sectors.
Our results show a significant, negative relation between the age of anorganization and its direct contributions, with the exception of the Public
Table 4. Regression Model 2 Examining the Relationship of FinancialVulnerability Measures with Direct Donations for a Sample of 44,518Organization-Years for U.S. Tax-Exempt Charities Filing Form 990
between 1982 and 1983 and between 1985 and 1999.
ln DONit ¼ l0 þ l1 ln PRICEiðt�1Þ þ l2 ln FUNDiðt�1Þ þ l3 ln SIZEiðt�1Þ þ l4 lnAGEit
þ l5EQUITYiðt�1Þ þ l6CONCENiðt�1Þ þ l7MARGINiðt�1Þ þ �i
Predicted
Sign
NTEE Sectors Full
SampleArts Education Human
services
Public
benefit
Health Other
Intercept NA �1.84* �2.03* �1.12* �2.10* �2.55* �1.28* �1.82*
(�17.0) (�33.3) (�12.8) (�21.7) (�26.3) (�9.5) (�51.0)
PRICE � �0.17* �0.20* �0.31* �0.44* �0.10* �0.33* �0.25*
(�5.3) (�9.5) (�8.1) (�10.3) (�3.0) (�6.6) (�18.4)
FUND þ 0.02* 0.01* 0.02* 0.02* 0.01* 0.03* 0.02*
(10.9) (8.9) (12.4) (13.7) (6.4) (10.8) (25.2)
SIZE NA 0.78* 0.80* 0.71* 0.80* 0.82* 0.74* 0.78*
(106.0) (203.7) (115.9) (123.9) (130.3) (80.6) (320.9)
AGE þ �0.07* �0.08* �0.05* �0.01 �0.07* �0.05* �0.07*
(�4.7) (�10.7) (�4.1) (�1.5) (�5.8) (�2.7) (�13.3)
EQUITY þ �0.22* �0.22* �0.22* �0.20* �0.22* �0.22* �0.22*
(�61.6) (�99.3) (�55.2) (�60.7) (�72.2) (�45.5) (�166.9)
CONCEN � �3.95* �3.03* �3.29* �4.37* �2.95* �3.70* �3.47*
(�53.0) (�107.4) (�55.2) (�64.7) (�58.1) (�40.9) (�170.7)
MARGIN þ 0.29* 0.29* 0.49* 0.02 0.04 �0.01 0.20*
(9.1) (14.5) (13.8) (0.59) (1.37) (�0.22) (16.9)
N 4,579 17,314 8,803 5,019 5,767 3,036 44,518
Adjusted
R20.85 0.81 0.72 0.85 0.79 0.79 0.80
Note: All variables are adjusted for inflation using the Consumer Price Index (1982 ¼ 1.00).
t-Statistics are in parentheses.
*Significant at a ¼ 0.001 and 0.10.
Fundamental Analysis of Not-for-Profit Financial Statements 49
Benefit sector in which AGE is not significant. This negative coefficient issimilar to one of the results Tinkelman (1999) observed. One possibleexplanation is that age, instead of serving as a proxy for quality, is actually ameasure of the ‘‘trendiness’’ of the cause served by newer NFPs (Tinkelman,1999, p. 149). Another is that achieving greater financial stability in the earlyyears of an organization’s existence is more impressive to donors than beingfinancially healthy after operating for a number of years.
The coefficient for the CONCEN variable is significantly negative, as pre-dicted, for all sectors. Also, as predicted, MARGIN is positively associatedwith total donations, but is significant in only three sectors. This findingprovides limited support for the claim that donors prefer charities that areable to dedicate a larger portion of each donated dollar to programs or apotential surplus. A higher operating margin is indicative of an organizationthat is less susceptible to financial downturns.
The coefficient for EQUITY is negative and significant in all sectors. Thisindicates that donors do not prefer to contribute to charities with large levelsof net assets (measured as a multiple of annual revenues). Charitableorganizations with more equity are in fact less likely to fail in the event of adecline in revenues (Greenlee & Trussel, 2000; Trussel & Greenlee, 2004).However, the evidence here does not support the claim that donors prefernonprofits that accumulate savings. Instead, the result supports theprediction of Marudas (2004) and demonstrates that donors expect theircontributions to be used for the firm’s charitable purpose in the near term.The uproar that emerged in the period after the tragedy of the September 11,2001, terrorist attacks provides additional evidence to support the claim thatdonors consider high reserves to be undesirable. Donors expressed concernthat several charities raised millions of dollars in the immediate aftermath ofthe event, but after one year many families of victims had still not receivedfinancial assistance (Barstow, 2002; Levine, 2001).17
4.2. Robustness Tests
Some of the variables in our models are subject to alternative interpretationsor measurement. In particular, we test alternative measures for DON,EQUITY, FUND, and CONCEN. We test the models to see if they arerobust to alternative measures of these variables. First, we examine thedonations variable. Most studies use direct (i.e., private) donations as thedependent variable (e.g., Posnett & Sandler, 1989; Callen, 1994; Tinkelman,1999; Marudas, 2004). However, Weisbrod and Dominguez (1986) use total
LINDA M. PARSONS AND JOHN M. TRUSSEL50
donations, including government grants and indirect contributions. Usingtotal donations rather than direct donations does not change the tenor ofour results.
Second, we consider alternative interpretations of equity. Our resultsimply that charities that accumulate wealth or net assets (EQUITY), receiveless donations. If the negative coefficient associated with EQUITY is mono-tonic, the implication is that donations are greatest on average fororganizations with the smallest reserves. However, it is possible that donorswould be concerned when reserves are too large (indicating that a nonprofitis not distributing donated funds to the intended beneficiaries) or too small(evidence that the organization is financially vulnerable to changes inrevenues). To allow for changes in the slope of the EQUITY coefficient, weemploy a piecewise linear regression that examines different levels ofEQUITY separately. This is similar to the method Morck, Shleifer, andVishny (1988) used to study the relationship between stock ownership byboard members and market value, which is positive for high and lowownership levels and negative for moderate ownership levels.
We have no ex ante definition of high or low reserves. Therefore, we useseveral alternative definitions. In the first iteration, we divide the samplepopulation of organization-years into thirds (based on the EQUITYmeasure). In the second iteration, we use EQUITY less than zero andmore than three as the cutoffs for low and high reserves, respectively,following the guidelines of the American Institute of Philanthropy. For bothiterations, we estimate the pooled regression results separately for eachcategory of reserves – low, medium, and high. For these two iterations, thecoefficient is negative and significant for EQUITY in all three samplegroups. This implies that the EQUITY coefficient is monotonic.
Third, we consider the FUND variable. Hager (2003) and Krishnan,Yetman, and Yetman (2006) provide evidence that some organizations thatreceive contributions incur fundraising costs but report zero fundraisingexpense, distorting the reported accounting ratios. To determine whetherour results are impacted by organizations that underreport fundraisingexpense, we repeat our regressions after excluding organization-years withzero fundraising expense (N ¼ 38,349 after excluding these organizations).Our results are similar when these organization-years are excluded.
Finally, we include another test of the impact of financial vulnerability ondonations. Lev and Thiagarajan (1993) create an aggregate fundamentalscore that reflects the combined effect of the fundamental signals. Similarly,we calculate an aggregate vulnerability indicator (FV) using the financialvulnerability model developed by Greenlee and Trussel (2000).18 A negative
Fundamental Analysis of Not-for-Profit Financial Statements 51
and significant coefficient on the vulnerability indicator FV is additionalevidence that donors give more, on average, to NFPs that are less likely toexperience financial distress. The results are consistent across all sectors.
5. SUMMARY AND CONCLUSIONS
Understanding how to provide accounting reports with information that isuseful for decision making is important to financial statement users andaccounting regulators. Lev and Thiagarajan (1993) and Abarbanell andBushee (1997) show that fundamental analysis of financial statementsimproves security valuation and earnings prediction in for-profit organiza-tions. We provide evidence that fundamental analysis of NFP financialstatements is useful for donors, grantors, and other financial statement users.
Our results suggest that contributions are positively associated with acharitable organization’s ability to continue to operate and that financialvulnerability measures provide information beyond that supplied byefficiency measures. The incorporation of individual financial vulnerabilitymeasures in a regression model that also includes an efficiency indicatorshows that most of these measures are significantly related to contributions.The results are of interest to nonprofit accounting researchers, financialstatement preparers, watchdog agencies, regulators, current and potentialcontributors, and others interested in analyzing and understanding non-profit financial statements.
Interestingly, lower financial vulnerability is not always associated withincreased giving. For example, though large equity levels protect NFPorganizations from financial shocks and reduce financial vulnerability(Trussel & Greenlee, 2004), donors make fewer contributions, on average, tocharitable organizations with the highest net asset reserves. This impliesdonors expect their contributions to reach beneficiaries in the short term.
Our results indicate that while less efficient nonprofit organizations mayhave greater ability to stay afloat in troubled economic times, donors do notreward inefficiency with increased donations. This finding seems consistentwith the claim that Tuckman and Chang’s (1991) ratio of administrativecosts is a measure of efficiency.
We find support for our prediction that less vulnerable organizations,defined as those with a larger number of revenue sources other than directdonations, receive more direct donations on average than those with fewerrevenue sources. Our results support the claims of Greenlee and Bukovinsky
LINDA M. PARSONS AND JOHN M. TRUSSEL52
(1998) and Hager (2001) that consideration of sector is important whenanalyzing financial information.
NOTES
1. Form 990 is an informational tax filing required by the Internal RevenueService for certain NFP entities.
2. In contrast to Greenlee and Brown (1999), Frumkin and Kim (2001) find nosignificant relationship between administrative ratios and donations. Tinkelman andMankaney (2005) discuss the reasons for the mixed results between these two studies,including the different samples studied and the choice of control variables included inthe models.
3. Charity watchdog groups for the nonprofit sector are similar to financialanalysts for investors, in that they review reports from charitable organizations andrate the charities based on those reports. See the giving guidelines for Better BusinessBureau at http://www.give.org/, for the American Institute of Philanthropy at http://charitywatch.org/, and for Charity Navigator at http://www.charitynavigator.org
4. The Better Business Bureau’s Wise Giving Alliance and the American Instituteof Philanthropy use the ratio of net assets to expenses, which is similar to Tuckmanand Chang’s ‘‘equity’’ ratio.
5. Marudas’ (2004) wealth measurement is similar to the ratio suggested by theAmerican Institute of Philanthropy.
6. Because NFPs rarely file for bankruptcy, Greenlee and Trussel examinealternative proxies for financial distress.
7. Trussel and Greenlee (2004) define significant decrease in net assets as a 20percent decline over three years and as a 50 percent decline over three years. Theirresults are robust to the different definitions of significant decline in net assets.
8. Steinberg (1986) proposes examining the change in donations relative to thechange in expenses. This approach implies that current year donations are, to somedegree, a function of prior years’ donations. However, Tinkelman (1999) suggests thatefficiency tends to be somewhat constant within an organization and that the level offundraising is a better predictor of donation levels. We follow the linear regressionapproach of Weisbrod and Dominguez (1986), Posnett and Sandler (1989), andTinkelman (1999) instead of the first differences approach of Steinberg (1986).According to Tinkelman (1999) ‘‘Price appears to be precisely the kind of stable, organi-zation-specific characteristic that a difference model is designed to screen out’’ and thedifference model ‘‘is not appropriately specified for studying price elasticity’’ (p. 147).
9. Some earlier studies include the interaction term AGE * FUND to determineif organizations experience diminishing returns from fundraising expenditures as afirm becomes established/known in the donor community. The inclusion of thiscontrol variable does not qualitatively change the results.10. Greenlee and Brown (1999) compute administrative ratio as total adminis-
trative expenses divided by total expenses for administrative costs plus programservices (total expenses, excluding fundraising costs).
Fundamental Analysis of Not-for-Profit Financial Statements 53
11. See discussions of the IRS 990 data and the NCCS database in Gordon,Greenlee, and Nitterhouse (1999) and Froelich and Knoepfle (1996).
12. The tax year per the 990 return sometimes differs from the year in which thereturn is included in the SOI database, which is usually the year in which the returnwas filed. We use the tax year per the return to identify the period for the return.13. Though the SOI database does not contain most returns filed in 1984, some
tax returns for tax year 1984 are included in the 1985 SOI database.14. The NCCS suggests that outliers in the database are likely to represent either
(1) errors in the data input process, (2) errors in the 990 forms, or (3) influentialorganizations that can mask financial trends demonstrated in other organizations.Therefore, the NCCS proposes to eliminate outliers when analyzing aggregated data.See a discussion of the database at http://nccs.urban.org/15. Tinkelman (1999) and Marudas (2004) truncate the PRICE variable at $10.
After eliminating outliers, the maximum PRICE in our sample is less than $10.16. We tested our models for multicollinearity using the procedures suggested by
Hair, Anderson, Tatham, and Black (1998), and found that while some multi-collinearity exists, it is not so severe as to impede the interpretation of the regressionresults. Additionally, diagnostic tests indicate no problems of non-normality.17. Using Marudas’ (2004) definition of wealth, net assets divided by total
expenses besides fundraising expenses, does not significantly change the results.18. FV ¼ P(financial vulnerability) ¼ f(EQUITY, CONCEN, ADMIN,MARGIN).
The final logistic regression from Greenlee and Trussel (2000) is: FV ¼ 1/(1þ e�z),where z ¼ �2.81þ .12 EQUITYþ 1.25 CONCEN� 2.26 ADMIN� 3.43 MARGIN.
ACKNOWLEDGMENTS
We thank Charles Barragato, Woods Bowman, Jeff Callen, Andrea Roberts,Daniel Tinkelman, Thomas Vermeer, Kumar Visvanathan, Simon Yang,Qin Yin, Paul Copley (editor), an anonymous reviewer, and workshopparticipants at the 2002 annual meeting of the Association for Research onNonprofit Organizations and Voluntary Action (ARNOVA), the 2003 AAAannual and Mid-Atlantic regional meetings, and George Mason Universityfor their helpful comments on earlier drafts of this chapter.
REFERENCES
Abarbanell, J. S., & Bushee, B. J. (1997). Fundamental analysis, future earnings, and stock
prices. Journal of Accounting Research, 35(1), 1–24.
Altman, E. I. (1968). Financial ratios, discriminant analysis and the prediction of corporate
bankruptcy. Journal of Finance, 23(4), 589–609.
Anthony, R. N. (1983). Tell it like it was: A conceptual framework for financial accounting.
Homewood, IL: Richard D. Irwin, Inc.
LINDA M. PARSONS AND JOHN M. TRUSSEL54
Anthony, R. N., & Young, D. W. (2003). Management control in nonprofit organizations.
Boston, MA: McGraw-Hill Irwin.
Baber, W. R., Roberts, A. A., & Visvanathan, G. (2001). Charitable organizations’ strategies
and program-spending ratios. Accounting Horizons, 15(4), 329–343.
Ball, R., & Brown, P. (1968). An empirical evaluation of accounting income numbers. Journal
of Accounting Research, 6(Autumn), 159–178.
Barstow, D. (2002). Police families demand a say in handling of benefit fund. The New York
Times, March 9, p. 3.
Callen, J. L. (1994). Money donations, volunteering and organizational efficiency. The Journal
of Productivity Analysis, 5, 215–228.
Froelich, K. A., & Knoepfle, T. W. (1996). Internal revenue service 990 data: Fact or fiction?
Nonprofit and Voluntary Sector Quarterly, 25(1), 40–52.
Frumkin, P., & Kim, M. T. (2001). Strategic positioning and the financing of nonprofit
organiztions: If efficiency rewarded in the contributions marketplace? Public Adminis-
tration Review, 61(3), 266–275.
Gordon, T. P., Greenlee, J. S., & Nitterhouse, D. (1999). Tax-exempt organization financial
data: Availability and limitations. Accounting Horizons, 13(2), 113–128.
Gordon, T. P., & Khumawala, S. B. (1999). The demand for not-for-profit financial statements:
A model for individual giving. Journal of Accounting Literature, 18, 31–56.
Greenlee, J. S., & Brown, K. L. (1999). The impact of accounting information on contributions
to charitable organizations. Research in Accounting Regulation, 13, 111–125.
Greenlee, J. S., & Bukovinsky, D. (1998). Financial ratios for use in analytical review of
charitable organizations. The Ohio CPA Journal, (January–March), 32–38.
Greenlee, J. S., & Trussel, J. M. (2000). Predicting the financial vulnerability of charitable
organizations. Nonprofit Management and Leadership, 11(2), 199–210.
Hager, M. A. (2001). Financial vulnerability among arts organizations: A test of the Tuckman–
Chang measures. Nonprofit and Voluntary Sector Quarterly, 30(3), 376–392.
Hager, M. A. (2003). Current practices in allocation of fundraising expenditures. New
Directions for Philanthropic Fundraising: Exploring Measurement and Evaluation Efforts
in Fundraising, 40(Fall), 39–52.
Hair, J. F., Jr., Anderson, R. E., Tatham, R. L., & Black, W. C. (1998). Multivariate data
analysis (5th ed.). Upper Saddle River, NJ: Prentice Hall.
Krishnan, R., Yetman, M. H., & Yetman, R. J. (2006). Expense misreporting in nonprofit
organizations. The Accounting Review, 81(2), 399–420.
Lev, B., & Thiagarajan, S. R. (1993). Fundamental information analysis. Journal of Accounting
Research, 31(2), 190–215.
Levine, S. (2001). Red crossroads; the nation’s best-known charity is under fire for how it
spends September 11 disaster funds. U.S. News and World Report, 131(21), 28.
Marudas, N. (2004). Effects of nonprofit organization wealth and efficiency on private donations to
large nonprofit organizations. Research in Government and Nonprofit Accounting, 11, 71–91.
Marudas, N., & Jacobs, F. (2004). Determinants of charitable donations to large US higher
education, hospital, and scientific research NPOs: New evidence from panel data.
Voluntas, 15(2), 157–179.
Morck, R., Shleifer, A., & Vishny, R. W. (1988). Management ownership and market valuation:
An empirical analysis. Journal of Financial Economics, 20, 293–315.
Ohlson, J. A. (1980). Financial ratios and the probabilistic prediction of bankruptcy. Journal of
Accounting Research, 18(1), 109–131.
Fundamental Analysis of Not-for-Profit Financial Statements 55
Okten, C., & Weisbrod, B. (2000). Determinants of donations in private nonprofit markets.
Journal of Public Economics, 75, 255–272.
Ou, J., & Penman, S. (1989). Financial statement analysis and the prediction of stock returns.
Journal of Accounting and Economics, 11(4), 295–329.
Parsons, L. M. (2003). Is accounting information from nonprofit organizations useful to
donors? A review of charitable giving and value-relevance. Journal of Accounting
Literature, 22, 104–129.
Posnett, J., & Sandler, T. (1989). Demand for charity donations in private non-profit markets.
The case of the U.K. Journal of Public Economics, 40, 187–200.
Steinberg, R. (1986). Should donors care about fundraising? In: S. Rose-Ackerman (Ed.), The
economics of nonprofit institutions: Studies in structure and policy. New York: Oxford
Press University.
Tinkelman, D. (1999). Factors affecting the relation between donations to not-for-profit
organizations and an efficiency ratio. Research in Governmental and Nonprofit
Accounting, 10, 135–161.
Tinkelman, D., & Mankaney, K. (2005). When is administrative efficiency association with
charitable donations? Nonprofit and Voluntary Sector Quarterly, 36(1), 41–64.
Trussel, J. M. (2002). Revisiting the prediction of financial vulnerability. Nonprofit Management
and Leadership, 13(1), 17–31.
Trussel, J. M. (2003). Assessing potential accounting manipulation: The financial characteristics
of charitable organizations with higher than expected program spending ratios.
Nonprofit and Voluntary Sector Quarterly, 32(4), 616–634.
Trussel, J. M., & Greenlee, J. S. (2004). A financial rating system for charitable nonprofit
organizations. Research in Governmental and Nonprofit Accounting, 11, 105–127.
Tuckman, H. P., & Chang, C. F. (1991). A methodology for measuring the financial
vulnerability of charitable nonprofit organizations. Nonprofit and Voluntary Sector
Quarterly, 20(4), 445–460.
Weisbrod, B. A., & Dominguez, N. D. (1986). Demand for collective goods in private nonprofit
markets: Can fundraising expenditures help overcome free-rider behavior? Journal of
Public Economics, 30, 83–96.
LINDA M. PARSONS AND JOHN M. TRUSSEL56
THE EFFECT OF THE 150-HOUR
EDUCATIONAL REQUIREMENTS
ON MUNICIPAL AUDIT FEES
Arthur Allen and George Sanders
ABSTRACT
We examine the effect of the 150-hour educational requirements on auditfees for a sample of cities over a ten-year time span (1989–1999). We findthat audit fees increase substantially in those states that implemented the150-hour requirement. Because the effect of the 150-hour requirement isexpected to affect fees through an increase in accountants’ wages, as asupplemental test, we also test whether the 150-hour requirementincreased accountant’s wages over that time period. We find evidencethat the 150-hour requirement increased accountant’s wages.
1. INTRODUCTION
As of December 31, 2005, 45 states had implemented the 150-houreducational requirement for public accountants with two states (Minnesotaand Virginia) scheduled to implement in 2006. The issue of costs andbenefits of this regulation continues to be debated. Proponents claim thatthe rule will attract higher quality entrants to the profession and betterprepare students (e.g., Novin & Tucker, 1993; Elam, 1996). Detractors claim
Research in Governmental and Nonprofit Accounting, Volume 12, 57–74
Copyright r 2009 by Emerald Group Publishing Limited
All rights of reproduction in any form reserved
ISSN: 0884-0741/doi:10.1108/S0884-0741(2009)0000012005
57
the rule will unnecessarily restrict the supply of entrants, raising the cost ofobtaining an education and the cost of audit services (e.g., Bernard, 1996;Somasundaram, 1998).
We examine one aspect of the debate: Has the 150-hour requirementincreased audit fees? To answer this question, we analyze changes in auditfees for a sample of cities over a ten-year time span (1989–1999). We findevidence that municipal audit fees in states that adopted the 150-hourrequirement increased significantly more than fees in other states. As asupplemental test, we also examine whether the 150-hour requirement hasan effect on accountant’s wages. The results of our models provide evidencethat the 150-hour requirement increased accountant’s wages and the cost ofaudit services. Our findings are important because they bolster the positionof critics and contradict claims made by the proponents of the 150-hourrequirement.
The period under study (1989–1999) coincides not only with changes instate requirements, but also with a relaxation of auditor solicitationrestrictions and other changes in the audit environment. Therefore, ourresults also provide some evidence on the effect of these changes. Weconfirm the findings of prior research (Hackenbrack, Jensen, & Payne, 2000)that auditor solicitation and competitive negotiation restrictions areassociated with higher audit fees. As expected, we find that fees decreasewhen auditor solicitation restrictions are eliminated. Interestingly, we do notfind fees change when the competitive negotiation restrictions are removed.
We elect to test the education and auditor solicitation effects in themunicipal audit market for two reasons. First, auditees are located within aparticular state jurisdiction and are likely to be audited by local auditors orlocal offices of national or regional firms. Thus, audit fees are likely to reflectmarket and regulatory factors within the states such as auditor solicitationrestrictions and CPA licensing requirements. Second, business entities aremore likely to have facilities which are geographically dispersed and auditsmay involve staff from audit firm offices across several states (Copley, 1993).To our knowledge, only two published studies (Hackenbrack et al., 2000;Copley, 1993) have explicitly accounted for the effect of differences in theaudit market within particular states and these authors also use municipalaudit fees to isolate state effects.
The remainder of our chapter is organized as follows. Section 2 discussesprior research on the costs and benefits of the 150-hour requirement includingthe expected impact of the 150-hour requirement on audit fees. Section 3 des-cribes the research design and sample whereas Section 4 presents the results.The final section discusses the limitations and conclusions of the study.
ARTHUR ALLEN AND GEORGE SANDERS58
2. PRIOR RESEARCH
2.1. Adoption of Additional Educational Requirements
In 1969, a committee of the American Institute of Certified PublicAccountants recommended that 150 semester hours of college study beestablished as a minimum educational requirement for public accountants.In 1988, the membership of the AICPA adopted this requirement as aprecondition for membership in the Institute. Hawaii was the first state toadopt the requirement, in 1977, followed by Florida, in 1979. As of 1998, 41states had enacted the rule1 and 15 states had implemented the requirement,potentially imposing additional costs on auditors.
However, no state has passed the 150-hour requirement since 2000, theyear Colorado rescinded its 150-hour requirement. In 2003, Pricewater-houseCoopers (PWC) (PricewaterhouseCoopers, 2003) issued a report,which recommended several alternatives to the 150-hour requirement. Thesealternatives include additional experience requirements and in-housetraining. If implemented, the PWC recommendations would compromisethe 150-hour requirement. Although the 150-hour requirement has beenpassed in a large majority of the states, its effects continue to be debated(e.g., Miller, 2003; Bierstaker, Howe, & Seol, 2004).
The regulation literature (Stigler, 1975; Peltzman, Levine, & Noll, 1989)suggests that barriers to entry result in lower levels of supply of theregulated good or service and higher prices. Anecdotal evidence suggeststhat in states which have an effective 150-hour requirement accounting firmsare paying higher starting salaries for 150-hour graduates. However, firmsare unsure about the effect on billing (e.g., Somasundaram, 1998; Donelan,1999; Frieswick, 2000). A study commissioned by the AICPA from MGT ofAmerica estimates that firms in Florida paid 150-hour graduates an 8.3%premium (cited in Cumming and Rankin (1999)). Lee, Liu, and Wang (1999)demonstrated analytically that adoption of additional educational require-ments increases audit fees. In their model, an increase in educationalrequirements shifts the supply curve for audits down while the demandcurve remains unchanged.
The supply of licensed practitioners may also be related to the likelihoodof adoption of a 150-hour requirement in a given state. Maurizi (1974)modeled the effect of occupational licensing restrictions on the supply andprices of licensed professionals. The model predicts that such restrictionsdecrease supply and increases price. Maurizi empirically examined the effectof occupational restrictions in 18 professions. He found reductions in
150-Hour Educational Requirements on Municipal Audit Fees 59
licensed professionals in eight of these professions including accounting.Roberts and Kurtenbach (1998) studied state adoptions of the 150-hourrequirement in 1995 and Sanders (1999) examined a time series of state leveldata from 1977 to 1995. The studies use different proxies for demand forregulation but both found that states with a relatively larger number ofCPAs adopted the new educational requirements more quickly. Grant,Ciccotello, and Dickie (2002) examined the effectiveness of the educationalrequirements as a barrier to entry and document a sharp decline in thenumber of first-time candidates taking all parts of the CPA exam.2
2.2. Audit Fees
Since the seminal study of audit fees by Simunic (1980), numerous studiesexamined cross-sectional samples to test for factors determining audit fees.Only a few examined longitudinal samples over periods of several years.Maher, Tiessen, Colson, and Broman (1992) examined audit fee changes in asample of 78 firms over the period 1974–1981, concluding that audit feesdecreased by 1.4% in real terms over the period 1974–1977 and 3.9% overthe period 1977–1981. They attributed their result to increasing competitionin the audit market. However, the sample is relatively small, covers a fairlyshort period of time, and addresses only broad, national trends.
Sanders, Allen, and Korte (1995) compared a national sample of 289 cityaudit fees for 1985 and a separate sample of 239 city audit fees for 1989. Thesamples were drawn from cities with populations in excess of 20,000 andincluded 159 cities in common, making possible comparisons of the wholesamples as well as a repeated measures subsample. The authors used both apredictive approach, constructing a fee model for the 1985 fees based onwork on municipal audit fees by Rubin (1988) and Copley, Gaver, andGaver (1995) and a repeated measures design for a subsample of cities forwhich both years were available. The 1985 regression model is used topredict fees for 1989, which are compared to the actual fees for 1989 audits.Results for the whole sample comparison and the repeated measuressubsample are similar. Like the Maher et al. study, Sanders et al. found that,in real terms, fees had declined over the period, but at a slower rate for citiesin the sample than reported for firms by Maher et al. Sanders et al. (1995)did not examine differences in fee changes across states.
The behavior of audit fees over time is of interest because the auditmarket has changed significantly in the last two decades. Prior empiricalresearch suggests that the market has become more competitive (Maheret al., 1992; Elliott, 1998) even while mergers have reduced the number of
ARTHUR ALLEN AND GEORGE SANDERS60
larger firms. However, while individual states reflect national trends, thereare differences in the audit markets within states. For example, changes inAICPA membership numbers for the period 1989–1999, range from a 12%decline in Oklahoma to a 43% increase in Alabama, suggesting that thesupply of CPAs is responding to market factors, which vary by state.
Hackenbrack et al. (2000) examined 675 municipal audits in eight south-eastern states, classifying each as baseline, solicitation restricted and biddingrestricted, based on state regulations, statutes, and Codes of Conduct.Hackenbrack et al. (2000) took advantage of the fact that municipal auditservices tend to be more geographically bound to test for differences in theaudit market within states. Of the eight states examined, one (Florida) had arestriction on negotiating on price for audit services as well as a restrictionon uninvited solicitation of engagements.3 Three states (Louisiana,Mississippi, and Texas) prohibited solicitation only. Hackenbrack et al.follow Chaney, Jeter, and Shaw (1997) in arguing that the solicitation andbidding restrictions restricted price information to audit clients, leading toauditor–auditee misalignment and allowing auditors to collect higher fees inthese markets. Their results are consistent with the assertion. In theirsample, the baseline (unrestricted) states had fees that were only 89.5% ashigh as the solicitation restricted markets and, in the bidding restrictedmarket (Florida), fees were 36.3% higher than baseline.
3. RESEARCH DESIGN
We examine the determinants of audit fees in both 1989 and 1999 for amatched sample of 176 cities with populations in excess of 20,000. We alsoexamine the determinants of the change in audit fees over this time periodfor our matched sample. For each sample, the natural log of audit fees isregressed on various control variables found by prior research to influenceaudit fees, using the following model:
LNðaudit feesÞ ¼ aþ b1ðLNðpopulationÞÞ þ b2ðBig 6Þ þ b3ðbusy seasonÞ
þ b4ðbond ratingÞ þ b5ðno ratingÞ þ b6ðmayorÞ
þ b7ðbannedÞ þ b8ðFloridaÞ þ b9ð150-hourÞ
where
� LN(audit fees) ¼ natural log of audit fees paid.� Big 6 ¼ one (zero) if the municipality’s auditor was (not) one of the Big 6(auditor reputation).
150-Hour Educational Requirements on Municipal Audit Fees 61
� LN(population) ¼ natural log of the 1990 (2000) census estimate of themunicipality’s population for the 1989 (1999) sample (auditee size).� Busy season ¼ one (zero) if the municipality’s fiscal year end is (not)between October 1 and March 31.� Bond rating ¼Moody’s Investor Service general obligation uninsuredbond rating. For the 1999 sample, it is coded 12 for Aaa, 11 for Aa1,10 for Aa2, 9 for Aa3, 8 for A1, 7 for A2, 6 for A3, 5 for Baa1, 4 for Baa2,3 for Baa3, and 0 for no rating. For 1989, it is coed 12 for Aaa, 11 for A1,10 for A, 8 for A1, 7 for A, 5 for Baa1, and 0 for no rating (engagementrisk).� No rating ¼ one (zero) if Moody’s (does not) report a general obligationbond rating for the city (engagement risk).� Mayor ¼ one (zero) if the municipality had a mayoral (other) form ofgovernment.� Banned ¼ one (zero) if the municipality was (not) in a market wheredirect solicitation was banned in 1989.4
� Florida ¼ one (zero) if the municipality is (not) located in Florida, whichbanned both solicitation and competitive negotiation in 1989.� 150-hour ¼ one (zero) if the municipality had (not) adopted the 150-hourrequirement.
The control variables represent factors found by prior literature to beimportant determinants of municipal audit fees (e.g., Rubin, 1988; Copley,1989; Raman & Wilson, 1992; Ward, Elder, & Kattelus, 1994; Copley et al.,1995; Hackenbrack et al., 2000). Prior research examining solicitationrestrictions includes cities from only a few states (Hackenbrack et al., 2000).We use a national sample that contains municipalities from more states thatprohibited direct solicitation. In addition, we use a cross-time design toexamine the effect of the elimination of solicitation and competitivenegotiation restrictions on audit fees. If the solicitation and competitivenegotiation restrictions are causing the increase in audit fees, we expect thatthe Banned and Florida variables will be important in the 1989 sample butnot in the 1999 sample. We also examine whether the changes in audit fees inour matched sample are caused in part by the elimination of the solicitationand competitive negotiation restrictions.
Florida was the only state in our 1989 sample to have implemented the150-hour requirement. Therefore, in our 1989 sample, two of our variables,150-hour and Florida, are perfectly correlated. We do not include the 150-hour variable in the 1989 regression.5 In the 1989 sample, the effect of the
ARTHUR ALLEN AND GEORGE SANDERS62
Florida variables includes both the 150-hour requirement and the auditorsolicitation and negotiation restrictions.
Finally, we examine published survey data for evidence that the 150-houreducational requirement has resulted in increased wages for auditors. Weuse data from the 5th, 6th, and 7th editions of American Salaries & WagesSurvey (ASWS, United States Department of Labor, 2003). To increase thecomparability of the data, we use only ‘‘Accountant & Auditor’’ data thatapplies to an entire state and we only use the ‘‘average wage paid’’ for the5th edition and ‘‘average hourly wage’’ for the 6th and 7th editions. TheASWS collected all wage data from each state’s Bureau of Labor Statistics.The 5th, 6th, and 7th editions had data for year ends 1997, 1999, and 2001,respectively.
Because our State Wages data (see later) is available on an annual basis,we convert the Accountant’s Wages from an hourly basis to an approximateannual wage by multiplying by 2,000 hours. We regress annual Accountant’sWages on variables for the 150-hour requirement, time period, and ameasure of the general level of wages in a state. The State Wages data weregathered from the U.S. Bureau of Labor Statistics for the year 1999. StateWages is an important control variable because it is possible that the 150-hour requirement may have been implemented earlier in states with highwages. Because the data encompass three time periods, we use two timedummy variables (1999 and 2001 with 1997 as the excluded group) tocontrol for the increase in the level of wages over time. We use two 150-hourvariables. The first variable is coded 1 for states that implemented the150-hour requirement within the past 2 years, and 0 otherwise. We use twoyears because the data are spaced two years apart. The second 150-hourvariable is coded 1 for states that implemented the 150-hour requirementmore than 2 years ago.
3.1. City Sample
We collected the 1989 data through a survey of cities with populations inexcess of 20,000 in 1986 (1,002 cities are reported in the County and CityDatabook – Bureau of the Census, 1994). The survey was conducted in 1990.We received 398 usable responses (451 total), for a response rate of 39.7%.The responses were tested for differences between late and early responders.No significant differences were found. Differences in the size distributions ofthe sample and the population are small. The 1999 sample was obtained byresurveying the 398 cities included in the 1989 dataset. This survey was done
150-Hour Educational Requirements on Municipal Audit Fees 63
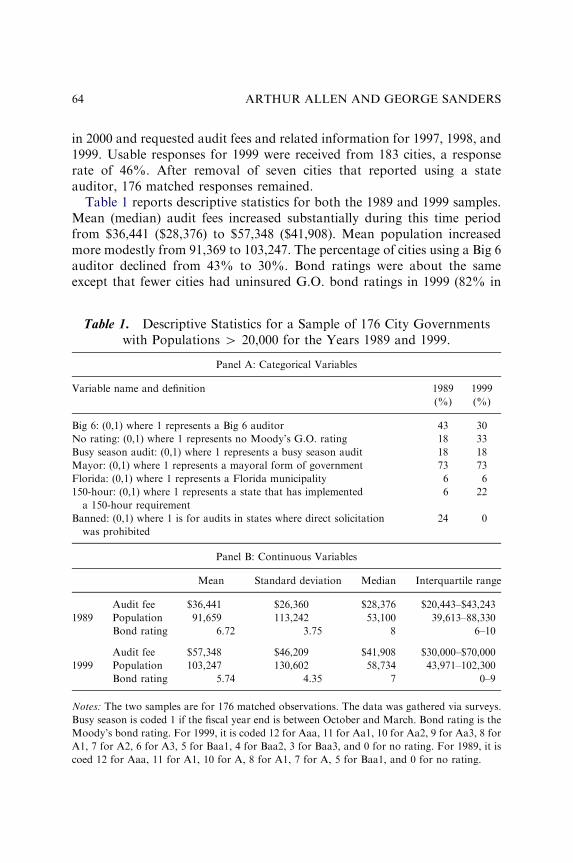
in 2000 and requested audit fees and related information for 1997, 1998, and1999. Usable responses for 1999 were received from 183 cities, a responserate of 46%. After removal of seven cities that reported using a stateauditor, 176 matched responses remained.
Table 1 reports descriptive statistics for both the 1989 and 1999 samples.Mean (median) audit fees increased substantially during this time periodfrom $36,441 ($28,376) to $57,348 ($41,908). Mean population increasedmore modestly from 91,369 to 103,247. The percentage of cities using a Big 6auditor declined from 43% to 30%. Bond ratings were about the sameexcept that fewer cities had uninsured G.O. bond ratings in 1999 (82% in
Table 1. Descriptive Statistics for a Sample of 176 City Governmentswith Populations W 20,000 for the Years 1989 and 1999.
Panel A: Categorical Variables
Variable name and definition 1989
(%)
1999
(%)
Big 6: (0,1) where 1 represents a Big 6 auditor 43 30
No rating: (0,1) where 1 represents no Moody’s G.O. rating 18 33
Busy season audit: (0,1) where 1 represents a busy season audit 18 18
Mayor: (0,1) where 1 represents a mayoral form of government 73 73
Florida: (0,1) where 1 represents a Florida municipality 6 6
150-hour: (0,1) where 1 represents a state that has implemented
a 150-hour requirement
6 22
Banned: (0,1) where 1 is for audits in states where direct solicitation
was prohibited
24 0
Panel B: Continuous Variables
Mean Standard deviation Median Interquartile range
1989
Audit fee $36,441 $26,360 $28,376 $20,443–$43,243
Population 91,659 113,242 53,100 39,613–88,330
Bond rating 6.72 3.75 8 6–10
1999
Audit fee $57,348 $46,209 $41,908 $30,000–$70,000
Population 103,247 130,602 58,734 43,971–102,300
Bond rating 5.74 4.35 7 0–9
Notes: The two samples are for 176 matched observations. The data was gathered via surveys.
Busy season is coded 1 if the fiscal year end is between October and March. Bond rating is the
Moody’s bond rating. For 1999, it is coded 12 for Aaa, 11 for Aa1, 10 for Aa2, 9 for Aa3, 8 for
A1, 7 for A2, 6 for A3, 5 for Baa1, 4 for Baa2, 3 for Baa3, and 0 for no rating. For 1989, it is
coed 12 for Aaa, 11 for A1, 10 for A, 8 for A1, 7 for A, 5 for Baa1, and 0 for no rating.
ARTHUR ALLEN AND GEORGE SANDERS64
1989 vs. 67% in 1999).6 This corresponds to a large increase in the use ofbond insurance, and underlying ratings are not reported for all cities.Florida represents 6% of the sample, and 22% of the cities are located instates that had implemented the 150-hour requirement by 1999. A significantportion of the sample was located in states that banned all direct solicitation(24%) in 1989. In all cases, auditor solicitation restrictions had beenremoved by 1999.
4. REGRESSION ANALYSIS
4.1. Results Related to the 150-Hour Requirement
Table 2 reports the results for the 1989 and 1999 models of audit fees. Themodels are significant and the adjusted R2 are similar to prior research.7
The 1989 model is presented for comparison to the 1999 model and toprovide evidence on other issues (see the following section). In 1989, Floridawas the only state in the sample which had implemented the 150-hourrequirement. As expected, the coefficient for the Florida dummy variable inthe 1989 model is positive and significant indicating that cities in Floridapaid higher fees than cities in other states. However, it is not clear whetherthe higher fees in Florida for 1989 resulted from the 150-hour requirementor other factors such as the restrictions on competitive negotiation (seeHackenbrack et al., 2000).
By 1999, many states had implemented the 150-hour requirement. Our1999 audit fee model includes a dummy variable coded 1 for states that hadimplemented the 150-hour requirement. As expected, the coefficient ispositive and significant, indicating that cities in these states paid higher feesthan cities in other states. However, it is possible that fees are higher in thesestates for reasons unrelated to the 150-hour variables. To address thispossibility, we examine whether audit fees have increased more in the statesthat implemented the 150-hour requirement than in other states.
Table 3 presents the results of a model of the change in the log of auditfees. The results confirm the findings from the 1989 and 1999 models. Auditfees for cities in those states that adopted the 150-hour requirementincreased more than the fees for cities in other states. Together with ourcross-sectional findings, our cross-time results suggest that the 150-hourrequirement is responsible for an increase in municipal audit fees.
We expect that the reason the 150-hour requirement increased audit feeswas because of its effect on auditors’ wages. Panel A of Table 4 presents the
150-Hour Educational Requirements on Municipal Audit Fees 65
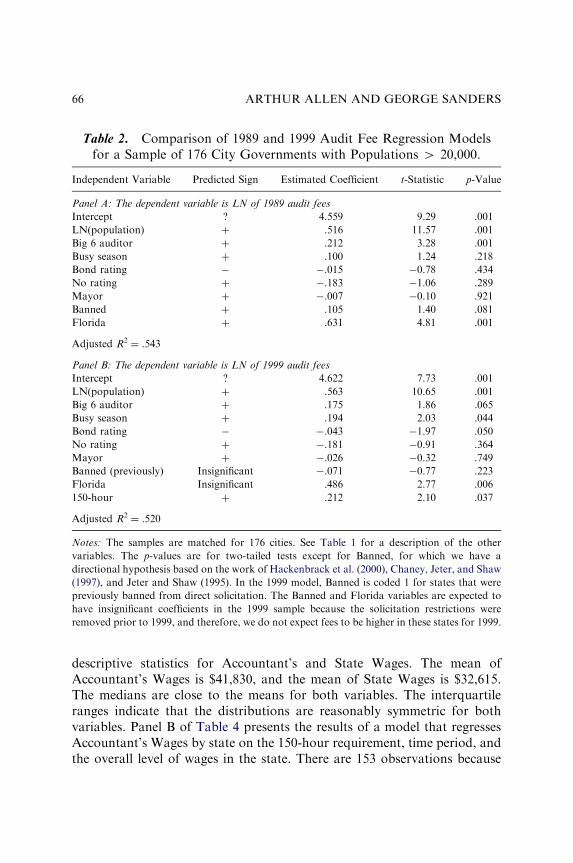
descriptive statistics for Accountant’s and State Wages. The mean ofAccountant’s Wages is $41,830, and the mean of State Wages is $32,615.The medians are close to the means for both variables. The interquartileranges indicate that the distributions are reasonably symmetric for bothvariables. Panel B of Table 4 presents the results of a model that regressesAccountant’s Wages by state on the 150-hour requirement, time period, andthe overall level of wages in the state. There are 153 observations because
Table 2. Comparison of 1989 and 1999 Audit Fee Regression Modelsfor a Sample of 176 City Governments with Populations W 20,000.
Independent Variable Predicted Sign Estimated Coefficient t-Statistic p-Value
Panel A: The dependent variable is LN of 1989 audit fees
Intercept ? 4.559 9.29 .001
LN(population) þ .516 11.57 .001
Big 6 auditor þ .212 3.28 .001
Busy season þ .100 1.24 .218
Bond rating � �.015 �0.78 .434
No rating þ �.183 �1.06 .289
Mayor þ �.007 �0.10 .921
Banned þ .105 1.40 .081
Florida þ .631 4.81 .001
Adjusted R2¼ .543
Panel B: The dependent variable is LN of 1999 audit fees
Intercept ? 4.622 7.73 .001
LN(population) þ .563 10.65 .001
Big 6 auditor þ .175 1.86 .065
Busy season þ .194 2.03 .044
Bond rating � �.043 �1.97 .050
No rating þ �.181 �0.91 .364
Mayor þ �.026 �0.32 .749
Banned (previously) Insignificant �.071 �0.77 .223
Florida Insignificant .486 2.77 .006
150-hour þ .212 2.10 .037
Adjusted R2¼ .520
Notes: The samples are matched for 176 cities. See Table 1 for a description of the other
variables. The p-values are for two-tailed tests except for Banned, for which we have a
directional hypothesis based on the work of Hackenbrack et al. (2000), Chaney, Jeter, and Shaw
(1997), and Jeter and Shaw (1995). In the 1999 model, Banned is coded 1 for states that were
previously banned from direct solicitation. The Banned and Florida variables are expected to
have insignificant coefficients in the 1999 sample because the solicitation restrictions were
removed prior to 1999, and therefore, we do not expect fees to be higher in these states for 1999.
ARTHUR ALLEN AND GEORGE SANDERS66
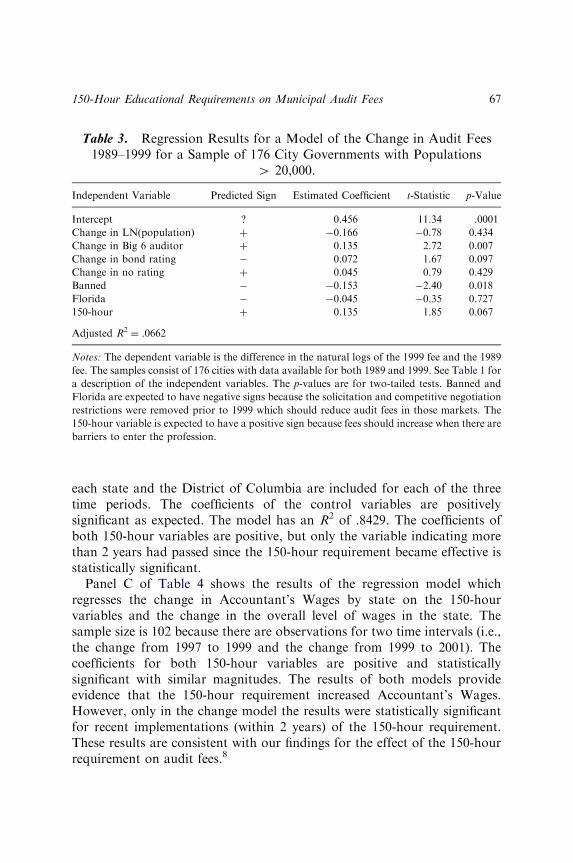
each state and the District of Columbia are included for each of the threetime periods. The coefficients of the control variables are positivelysignificant as expected. The model has an R2 of .8429. The coefficients ofboth 150-hour variables are positive, but only the variable indicating morethan 2 years had passed since the 150-hour requirement became effective isstatistically significant.
Panel C of Table 4 shows the results of the regression model whichregresses the change in Accountant’s Wages by state on the 150-hourvariables and the change in the overall level of wages in the state. Thesample size is 102 because there are observations for two time intervals (i.e.,the change from 1997 to 1999 and the change from 1999 to 2001). Thecoefficients for both 150-hour variables are positive and statisticallysignificant with similar magnitudes. The results of both models provideevidence that the 150-hour requirement increased Accountant’s Wages.However, only in the change model the results were statistically significantfor recent implementations (within 2 years) of the 150-hour requirement.These results are consistent with our findings for the effect of the 150-hourrequirement on audit fees.8
Table 3. Regression Results for a Model of the Change in Audit Fees1989–1999 for a Sample of 176 City Governments with Populations
W 20,000.
Independent Variable Predicted Sign Estimated Coefficient t-Statistic p-Value
Intercept ? 0.456 11.34 .0001
Change in LN(population) þ �0.166 �0.78 0.434
Change in Big 6 auditor þ 0.135 2.72 0.007
Change in bond rating � 0.072 1.67 0.097
Change in no rating þ 0.045 0.79 0.429
Banned � �0.153 �2.40 0.018
Florida � �0.045 �0.35 0.727
150-hour þ 0.135 1.85 0.067
Adjusted R2¼ .0662
Notes: The dependent variable is the difference in the natural logs of the 1999 fee and the 1989
fee. The samples consist of 176 cities with data available for both 1989 and 1999. See Table 1 for
a description of the independent variables. The p-values are for two-tailed tests. Banned and
Florida are expected to have negative signs because the solicitation and competitive negotiation
restrictions were removed prior to 1999 which should reduce audit fees in those markets. The
150-hour variable is expected to have a positive sign because fees should increase when there are
barriers to enter the profession.
150-Hour Educational Requirements on Municipal Audit Fees 67
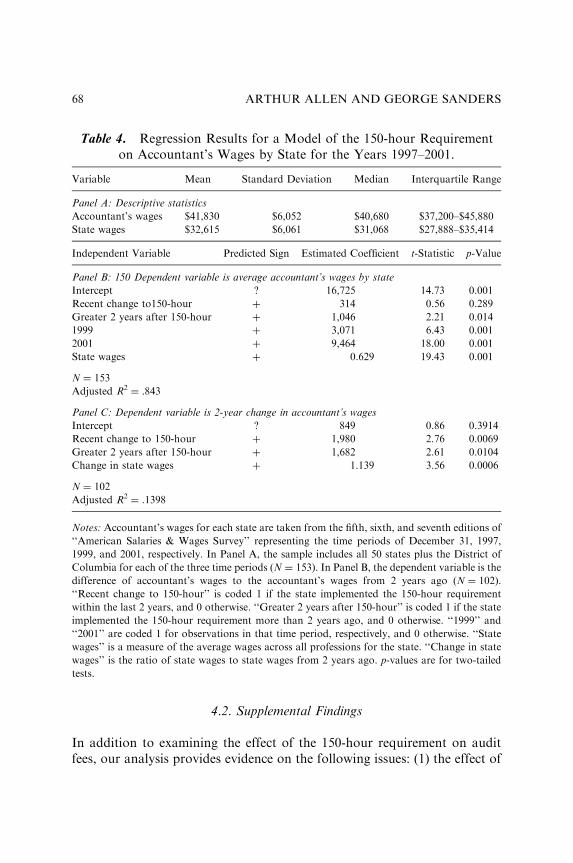
4.2. Supplemental Findings
In addition to examining the effect of the 150-hour requirement on auditfees, our analysis provides evidence on the following issues: (1) the effect of
Table 4. Regression Results for a Model of the 150-hour Requirementon Accountant’s Wages by State for the Years 1997–2001.
Variable Mean Standard Deviation Median Interquartile Range
Panel A: Descriptive statistics
Accountant’s wages $41,830 $6,052 $40,680 $37,200–$45,880
State wages $32,615 $6,061 $31,068 $27,888–$35,414
Independent Variable Predicted Sign Estimated Coefficient t-Statistic p-Value
Panel B: 150 Dependent variable is average accountant’s wages by state
Intercept ? 16,725 14.73 0.001
Recent change to150-hour þ 314 0.56 0.289
Greater 2 years after 150-hour þ 1,046 2.21 0.014
1999 þ 3,071 6.43 0.001
2001 þ 9,464 18.00 0.001
State wages þ 0.629 19.43 0.001
N ¼ 153
Adjusted R2¼ .843
Panel C: Dependent variable is 2-year change in accountant’s wages
Intercept ? 849 0.86 0.3914
Recent change to 150-hour þ 1,980 2.76 0.0069
Greater 2 years after 150-hour þ 1,682 2.61 0.0104
Change in state wages þ 1.139 3.56 0.0006
N ¼ 102
Adjusted R2¼ .1398
Notes: Accountant’s wages for each state are taken from the fifth, sixth, and seventh editions of
‘‘American Salaries & Wages Survey’’ representing the time periods of December 31, 1997,
1999, and 2001, respectively. In Panel A, the sample includes all 50 states plus the District of
Columbia for each of the three time periods (N ¼ 153). In Panel B, the dependent variable is the
difference of accountant’s wages to the accountant’s wages from 2 years ago (N ¼ 102).
‘‘Recent change to 150-hour’’ is coded 1 if the state implemented the 150-hour requirement
within the last 2 years, and 0 otherwise. ‘‘Greater 2 years after 150-hour’’ is coded 1 if the state
implemented the 150-hour requirement more than 2 years ago, and 0 otherwise. ‘‘1999’’ and
‘‘2001’’ are coded 1 for observations in that time period, respectively, and 0 otherwise. ‘‘State
wages’’ is a measure of the average wages across all professions for the state. ‘‘Change in state
wages’’ is the ratio of state wages to state wages from 2 years ago. p-values are for two-tailed
tests.
ARTHUR ALLEN AND GEORGE SANDERS68
competitive negotiation restrictions on audit fees, (2) the effect of direct soli-citation prohibitions on audit fees, (3) the magnitude of changes in municipalaudit fees over the sample period of 1989–1999. Like Hackenbrack et al.(2000), we find that the solicitation restriction (Banned) variable and thecompetitive negotiation variable (Florida) are significantly positive duringthe time period in which market was restricted from both solicitation andcompetitive negotiation (see Table 2, Panel A). However, the results for theFlorida variable in 1989 could be partially driven by the 150-hour require-ment because Florida was the only state in our sample to have implementedthe 150-hour requirement in 1989.
By 1999, all competitive negotiation and solicitation restrictions have beenremoved, but we continue to define Banned as 1 for states that had previouslybanned solicitation. Because these states did not ban solicitation in 1999, weexpect the coefficient for this variable (and Florida) to have insignificantcoefficients in the 1999 model. The purpose of the Banned variable in the1999 model is to confirm that audit fees return to normal after the solici-tation restrictions are removed. In our 1999 model (Table 2, Panel B), theBanned variable is no longer positive or significant; this result confirms thataudit fees return to normal after the solicitation restrictions are removed.Combined with our results for 1989, our results confirm the conclusions ofHackenbrack et al. (2000) that auditor solicitation restrictions increase auditfees. Unexpectedly, Florida municipalities continue to pay a higher audit feein 1999. Our findings are consistent with Johnson, Freeman, and Davies(2003) who found that auditors of Florida local governments charge higherfees than auditors in other states even after the competitive negotiationrestrictions were removed. Johnson et al. (2003) suggest the higher feescharged in Florida are the result of auditors working more hours. Anotherexplanation for higher fees in Florida is the 150-hour licensing requirement.
The results for the change in audit fees model (Table 3) confirm thefindings from the cross-sectional fees models. Fees decreased in thosemarkets that had previously banned auditor solicitation. This resultprovides a cross-time confirmation of Hackenbrack et al.’s cross-sectionalfinding that auditor solicitation restrictions significantly increases audit fees.Our evidence shows that once these restrictions are removed, fees decrease.The auditor solicitation results contrast with the competitive negotiationresults (Florida). Audit fees in Florida did not change significantly(t ¼ �0.35) suggesting that other factors, such as the 150-hour requirement,could have driven Florida’s higher fees.
To compare the magnitude of 1989 and 1999 fees, we fit a regressionmodel to the 1989 observations for the 176 cities for which data is available
150-Hour Educational Requirements on Municipal Audit Fees 69
for 1989 and 1999. The regression coefficients are used to predict 1999 feeswhich are then compared to the actual 1999 fees. The mean difference of0.407 implies a prediction error of 1� e.407 ¼ 50.2%. For comparison, weuse the procedure described by Menon and Williams (2001) and extend theaccounting wage index developed by those authors to 1999. We find that theindex has increased by 32.3% while the CPI has increased 34.4%. The lower95% confidence limit for our fee prediction error is 34.6%. These resultssuggest that fees for our sample have increased more than the CPI, takinginto account population changes and other components of our fee model.
5. CONCLUSIONS
Our results are consistent with a 10-year trend of municipal audit feesincreasing at a rate significantly greater than accounting wages andconsumer prices. These findings are different from those reported byMenon and Williams (2001) who found that, in their sample of privatesector firms, fees did not increase in the 1990s relative to changes inaccountants’ labor costs. Our results for municipalities may reflectdifferences in a market for governmental audits where public accountantsare required to become proficient in the application of accounting,reporting, and auditing standards that differ significantly from those usedby businesses, or they may reflect that cities can be identified with a givenstate more easily than corporations.9
Our findings that the 150-hour requirement affects accountants’ wagesand audit fees supports the Lee et al. (1999) theoretical model. Fees haveincreased more in states that adopted a 150-hour requirement. Our test ofaccountants’ wages provide some evidence that input costs for audits haveincreased in 150-hour states more rapidly than in other states. Unless offsetby production efficiencies, these increased input costs are likely to be drivingincreased audit fees. Prior research has found that the 150-hour requirementrestricts the supply of entrants to the profession (Allen & Woodland, 2006).Critics of the rule have contended that such restrictions to the supply ofCPAs would increase audit costs. Our findings support the assertion madeby critics that the rule increases costs to consumers of audit services. Ourfindings are important because the 150-hour requirement continues to bedebated.
One limitation of our study is that we do not investigate whether the 150-hour requirement has improved the quality of audits. Proponents of the ruleargue that audit quality will be improved because entrants to the profession
ARTHUR ALLEN AND GEORGE SANDERS70
are more highly qualified. To examine whether the 150-hour requirementhas improved the quality of audits, future research will need to compareaudit quality either (1) across states that have and have not implemented the150-hour requirement, or (2) for a single state both before and afterimplementation of the 150-hour requirement. Although audit quality isdifficult to measure, a few studies have employed audit quality proxies in thelocal government sector.10
NOTES
1. The 41 states include Colorado which enacted the rule in 1998 and rescinded itin 2000 before it was implemented.
2. Several studies examined the efforts of CPAs to limit their own numbersincluding Young (1988, 1991) and Colbert and Murray (2003). Young (1988) foundthat when states grade their own exams, pass rates go down during economic slumps.Young (1991) found that ‘‘Restrictive licensing regimes are more likely in stateswhere the interest-group strength of CPAs is high’’ (p. 809). Colbert and Murray(2003) used a case study approach to examine Colorado’s rescission of its 150-hourrequirement. They found that CPAs’ lobbying positions are in their own bestinterest, and they have captured the first level of regulators, the State Boards ofAccountancy.
3. Florida required that during the proposal stage, the auditee would have noknowledge of price so that the audit would be chosen on the basis of quality ratherthan price. Only after the auditor was chosen, the auditor and auditee would negotiatea price. If these negotiations failed, the auditee could entertain other proposals.
4. Information for the Banned variable was obtained from Jeter and Shaw(1995). The most recent information they possessed was 1987. Therefore, Banned ismeasured with error, which will bias the results toward finding no effect.
5. We considered using the number of years since the 150-hour requirement wasadopted instead of a 0/1 variable representing the 150-hour requirement. However,because Florida adopted so much earlier than the other states in our sample, thisnumber of years variable was highly correlated with the Florida variable (R2
¼ .90)in the 1999 sample. When the 150-hour requirement is measured as a 0/1 variable, thecorrelation with the Florida variable is much more modest (R2
¼ .21).6. The regression model results are not sensitive to deleting observations with no
rating or to defining ratings as 0 for no rating, 1 for Ba, 2 for Baa, 3 for A, 4 for Aa,and 5 for Aaa.
7. Collinearity is not a serious problem as evidenced by the variance inflationfactors that are all less than 10 for each variable in every regression model. The resultsof the models are substantially unchanged when either the 5% most influentialobservations are deleted or the observations with studentized residuals greater thantwo. Tests for heteroscedasticity were insignificant for the residuals of each model.
8. Our findings also complement Schaefer and Zimmer’s (2003) study of theeffect of state regulations in the accounting profession on the earnings of individualaccountants.
150-Hour Educational Requirements on Municipal Audit Fees 71
9. We are grateful to the Editor for the latter suggestion.10. For example, Deis and Giroux (1992, 1996) use data from quality control
reviews of Texas independent school districts for the time period 1984–1989. Brownand Raghunandan (1995) use desk reviews and quality control reviews from federalaudits from the period 1990–1993. Copley, Doucet, and Gaver (1994) used data fromquality control reviews collected by the U.S. General Accounting Office for 1985audits. To examine the effect of the 150-hour requirement on audit quality, measuresof audit quality from more recent audits will be required.
ACKNOWLEDGMENT
Financial support from the College of Business and Economics, WesternWashington University, is gratefully acknowledged.
REFERENCES
Allen, A., & Woodland, A. (2006). The 150-hour requirement and the number of CPA exam
candidates, pass rates, and the number passing. Issues in Accounting Education,
21(August), 173–193.
Bernard, V. (1996). The demand for 150-hours: Let the market decide. Issues in Accounting
Education, 11(Spring), 207–209.
Bierstaker, J., Howe, M., & Seol, I. (2004). Accounting major’s perceptions regarding the 150-
hour rule. Issues in Accounting Education, 19(May), 211–227.
Brown, C., & Raghunandan, K. (1995). Audit quality in audits of federal programs by non-
federal auditors. Accounting Horizons, 9(September), 1–10.
Bureau of the Census, Data User Services Division. (1994). County and city data book: Files on
diskette. Washington: The Bureau of the Census.
Chaney, P., Jeter, D., & Shaw, P. (1997). Client–auditor realignment and restrictions on auditor
solicitation. The Accounting Review, 72(July), 433–453.
Colbert, G., & Murray, D. (2003). The economic theory of regulation and sunset reviews of
public accountancy laws: The role of political ideology. Research in Accounting
Regulation, 16, 105–119.
Copley, P. (1989). The determinants of local government audit fees: Additional evidence.
Research in Governmental and Nonprofit Accounting, 5, 27–56.
Copley, P. (1993). An assessment of the potential effect of big eight firm mergers on competition
in the market for audit services. Advances in Accounting, 11, 185–205.
Copley, P., Doucet, M., & Gaver, K. (1994). A simultaneous equations analysis of quality
control review outcomes and engagement fees for audits of recipients of federal financial
assistance. The Accounting Review, 69(January), 244–256.
Copley, P., Gaver, J., & Gaver, K. (1995). Simultaneous estimation of the supply and demand
of differentiated audits: Evidence from the municipal audit market. Journal of
Accounting Research, 33(Spring), 137–156.
Cumming, J., & Rankin, L. (1999). 150-hours: A look back. Journal of Accountancy, 187(4), 53–56.
ARTHUR ALLEN AND GEORGE SANDERS72

Deis, D., & Giroux, G. (1992). Determinants of audit quality in the public sector. The
Accounting Review, 67(July), 462–479.
Deis, D., & Giroux, G. (1996). The effect of auditor changes on audit fees, audit hours, and
audit quality. Journal of Accounting and Public Policy, 15(Spring), 55–76.
Donelan, J. G. (1999). The 150-hour education requirement: Implications for recruiting acc-
ounting graduates. The Ohio CPA, 58(4), 41–44.
Elam, R. (1996). Is the 150-hour requirement really progress? Issues in Accounting Education,
11(Spring), 205–206.
Elliott, R. K. (1998). Assurance services and the audit heritage. Auditing: A Journal of Practice &
Theory, 17(Supplement), 1–7.
Frieswick, K. (2000). Where have all the CPAs gone? CFO: The Magazine for Senior Financial
Executives, 16(14), 101–104.
Grant, T. C., Ciccotello, C. S., & Dickie, M. (2002). Barriers to professional entry: How
effective is the 150-hour rule? Journal of Accounting and Public Policy, 21(1), 71–93.
Hackenbrack, K., Jensen, K. L., & Payne, J. L. (2000). The effect of a bidding restriction on the
audit services market. Journal of Accounting Research, 38(2), 355–374.
Johnson, L. E., Freeman, R. J., & Davies, S. P. (2003). Local government audit procure-
ment requirements, audit effort, and audit fees. Research in Accounting Regulation, 16,
197–207.
Lee, C. J., Liu, C., & Wang, T. (1999). The 150-hour rule. Journal of Accounting and Economics,
27, 203–228.
Maher, M. W., Tiessen, P., Colson, R., & Broman, A. J. (1992). Competition and audit fees.
The Accounting Review, 67(1), 199–211.
Maurizi, A. (1974). Occupational licensing and the public interest. Journal of Political Economy,
82(2), 399–413.
Menon, K., & Williams, D. D. (2001). Long term trends in audit fees. Auditing: A Journal of
Practice & Theory, 20(1), 115–136.
Miller, P. (2003). The five-year program debate continues: An updated analysis of the supply of
and demand for master’s degrees in accounting. Issues in Accounting Education, 18(3),
211–220.
Novin, A. M., & Tucker, J. M. (1993). The composition of the 150-hour accounting
programs: The public accountants’ point of view. Issues in Accounting Education, 8(2),
273–291.
Peltzman, S., Levine, M. E., & Noll, R. G. (1989). The economic theory of regulation after a
decade of deregulation. Brookings Papers on Economic Activity, 1–59.
PricewaterhouseCoopers. (2003). Educating for the public trust: The PricewaterhouseCoopers
position on accounting education. New York: PricewaterhouseCoopers LLP.
Raman, K. K., & Wilson, E. R. (1992). An empirical investigation of the market for ‘single
audit’ services. Journal of Accounting and Public Policy, 11(4), 271–295.
Roberts, R. W., & Kurtenbach, J. M. (1998). State regulation and professional accounting
education reform. Journal of Accounting and Public Policy, 17(3), 209–226.
Rubin, M. A. (1988). Contracting for municipal audits. Government Accountants Journal, 37(1),
25–29.
Sanders, G., Allen, A., & Korte, L. (1995). Municipal audit fees: Has increased competition
made a difference? Auditing: A Journal of Practice & Theory, 14(1), 105–114.
Sanders, G. D. (1999). Regulation of accountants: A test of the Stigler-Peltzman theory.
Research in Accounting Regulation, 13, 81–96.
150-Hour Educational Requirements on Municipal Audit Fees 73
Schaefer, J., & Zimmer, M. (2003). Professional regulation and labor market outcomes for
accountants: Evidence from the Current Population Survey, 1984–2000. Research in
Accounting Regulation, (16), 87–104.
Simunic, D. A. (1980). The pricing of audit services: Theory and evidence. Journal of Accounting
Research, 18(1), 161–190.
Somasundaram, M. (1998). Many beans, few counters: ‘‘Accounting giants fear new law,
tougher schooling will create CPA shortage’’. Crain’s Chicago Business, (November),
3–5.
Stigler, G. J. (1975). The theory of economic regulation. In: The citizen and the state (pp. 114–141).
Chicago and London: The University of Chicago Press.
United States Department of Labor. (2003). Available at http://www.bls.gov/news.release/
annpay.t01.htm
Ward, D. D., Elder, R. J., & Kattelus, S. C. (1994). Determinants of municipal audit fees. The
Accounting Review, 69(2), 399–411.
Young, S. D. (1988). The economic theory of regulation: evidence from the uniform CPA
examination. The Accounting Review, 63(2), 283–291.
Young, S. D. (1991). Interest group politics and the licensing of public accountants.
The Accounting Review, 66(4), 809–817.
ARTHUR ALLEN AND GEORGE SANDERS74
DECOMPOSING THE ELEMENTS OF
NONPROFIT ORGANIZATIONAL
PERFORMANCE
Daniel Tinkelman and Bairj Donabedian
ABSTRACT
We outline an analytical framework, containing both financial and non-financial measures, to highlight the factors needed to evaluate nonprofitorganizational performance. Similar in structure to the Dupont frame-work, which disaggregates return on equity, our framework disaggregatescurrent standardized efficiency – equal to the number of standardized unitsof program service produced in a particular period per dollar of revenue –into component factors. Analyzing this framework provides insight intoboth the relevance and the limitations of using such financial measures asthe fund-raising ratio to judge nonprofit organizational performance.
1. INTRODUCTION
We develop an integrated framework, incorporating both financial andnonfinancial measures, to demonstrate the usefulness and limitations offinancial ratio analysis in evaluating nonprofit organizations’ performance.This is a timely issue because nonprofit organizations are under considerable
Research in Governmental and Nonprofit Accounting, Volume 12, 75–98
Copyright r 2009 by Emerald Group Publishing Limited
All rights of reproduction in any form reserved
ISSN: 0884-0741/doi:10.1108/S0884-0741(2009)0000012006
75
pressure to demonstrate their accountability. The surges of donationsfollowing the September 11, 2001, attacks, the tsunami in 2004, andHurricane Katrina in 2005 all brought increased public attention to therelative performance of different agencies. At the same time, the well-knowncorporate accounting scandals were reducing public trust in reportedfinancial statements and in auditors.
Our framework may be used as a basis for rational discussion amongmanagers, donors, board members, and others who seek to understand theperformance of nonprofit organizations. It links together, on a theoreticallevel, many of the issues and trade-offs faced by nonprofit organizations,including
� Should they save donations, or spend now?� If they do spend now, how should they allocate their spending betweencurrent programs, current administration, and additional fund-raising,which may help provide future funding?� When they spend on programs, how should they balance the quantity andquality of services, or how should the organization balance spending onone kind of program against spending on other programs?
The benefit of our framework is to show explicitly the relationships amongthese factors.
At present, managers cannot ‘‘plug numbers’’ into our framework, andobtain exact results, because some of the variables are not currentlymeasured. This reduces, but does not eliminate, the usefulness of ourmodel. One benefit of our model is that it clearly indicates areas wheremeasurements need to be improved, and serves as support to future researchand standard-setting. Further, we argue that a model that is not fullymeasurable can still be a useful guide to action. For example, much ofcurrent auditing practice is guided by the audit risk model, even though inpractice auditors do not put cardinal measures on such concepts as‘‘inherent risk’’ and ‘‘control risk.’’ They still use the model to decide, forexample, that strong controls and low inherent risk in an area, even if notprecisely measurable, will allow them to reduce substantive testing in thatarea. Similarly, economists consider the theoretical concept of ‘‘utility’’useful even though cardinal measures of utility are unavailable.
Our framework is analogous to the well-known Dupont framework foranalyzing businesses’ return on equity (ROE) by decomposing the ROEratio into ratios for profitability, turnover, and leverage. We decompose ameasure of current efficiency into factors measuring: (1) relative programquality; (2) efficiency in producing units of output per dollar of program
DANIEL TINKELMAN AND BAIRJ DONABEDIAN76
spending; (3) efficiency in devoting spending to programs, as opposed tosupporting services; and (4) efficiency in terms of devoting current revenuesto support current operations.
Current operations should not be the sole measure of nonprofit efficiency.When an organization decides to save, rather than spend, in a period, it isdeferring the production of charitable outputs to future periods. When itspends on fund-raising, it is making a kind of capital investment, which canproduce future donations. Thus, there may be a multiplier effect of currentspending on fund-raising. We expand our model to include longer-termefficiency measures that incorporate the deferred and possible multipliereffects of current fund-raising efforts.
Because the nonprofit sector is not focused on generating profits forinvestors, bottom-line income is not an effective performance measure. Wepropose measuring performance, for conceptual purposes, as the ability ofthe organization to accomplish services of standardized quality per dollarof revenues. This measure relates financial inputs to both quantities andqualities of service outputs, which can be broadly defined. Consistent withBehn’s (2003) categorization scheme for performance measures, measuresrelating outcomes to inputs are conceptually appropriate for purposes ofevaluation and budget. We believe our framework gives insight intomanagement trade-offs, even where they cannot be measured precisely.
Examination of this framework has several benefits. First, it clarifies thetrade-offs that exist between various factors that affect overall performance.We believe the greatest practical use of our framework will be within organi-zations, serving as a basis for judging alternative budgets and for evaluatingperformance over time. Second, it may in some circumstances be adaptedfor use at a program level, and serve as an internal performance evaluationtool, or as a tool for grantors to evaluate the relative performance of granteeorganizations within narrowly defined sectors.1 Third, it puts the usefulnessof the program spending ratio, and the related fund-raising ratio, intoperspective. Fourth, it focuses attention on areas where further research onperformance measures is needed. In particular, the accounting professionneeds to develop systems to measure and report program outputs, and to findways to index measures of different kinds of programmatic output. Managersneed methods of evaluating the relative desirability of providing differenttypes of service, and different quality levels. While efforts to measure serviceefforts and accomplishments are ongoing, with the Governmental AccountingStandards Board (GASB) taking a leadership role (cf. GASB, 2003), theseefforts are generally focused on individual output measures rather thanmethods of summarizing types of outputs or assessing trade-offs.
Decomposing the Elements of Nonprofit Organizational Performance 77
The issue of evaluating nonprofit performance has enormous practicalimportance due to the size of the sector. Not-for-profit organizations in 2004received donations totaling nearly $250 billion (AAFRC, 2005). Given thelarge size of the sector, the allocation of resources to effective organizationsand away from ineffective organizations is clearly important to nonprofitmanagers and directors, donors and prospective donors, and regulators.
To assess organizational effectiveness, measures are needed not only offinancial inputs, but of the physical amounts and quality of services provi-ded. To assess efficiency, one must measure the amount of effective servicesprovided per dollar, which requires consideration of financial inputs andphysical outputs. Financial measures only provide partial solutions to theproblem.
So far, the nonprofit and accounting literature do not contain adequate orgeneral measures of effectiveness. The Financial Accounting Standards Board(FASB), in its Statement of Accounting Concepts 4, noted that such measureswere needed (FASB, 1980). The GASB has devoted considerable attentionto the issue (cf. GASB, 2003). Studies of organizational effectiveness in thenonprofit literature use a range of different performance measures, includingsummarizing questionnaires seeking evaluations of performance by informedpersons; using ratios of program costs to donations, or to total expenses;revenue growth; and program spending growth (Forbes, 1998). The lackof generally accepted performance measures has also seriously impairedacademic studies of nonprofit organizational behavior (Parsons, 2003). Onecomplicating factor is that nonprofit organizations have multiple constitu-encies, with differing goals and preferred performance measures (D’Aunno,1992; Herman & Renz, 1997; Murray & Tassie, 1994).
Currently, nonprofit organizations are frequently rated by external partiesbased only on such financial ratios as the ratio of administrative costs tototal expenses, or the ratio of fund-raising costs to donations. We suggestthat such financial ratios are considered by donors, not because they providean adequate and complete measure of organizational performance, butbecause they represent partial measures, and no complete measures have sofar been developed. Some organizations use ‘‘balanced scorecards’’ (Kaplan& Norton, 1992) to ensure both financial and nonfinancial measures areconsidered for internal evaluation purposes. We compare the use of ourmeasure to the balanced scorecard in Section 4.
Section 2 discusses the accounting-based measures that are commonly usedto judge nonprofit organizations and their limitations. Section 3 presents anintegrated framework for judging performance. Section 4 discusses theimplications of the framework and concludes.
DANIEL TINKELMAN AND BAIRJ DONABEDIAN78
2. THE USE OF ACCOUNTING-BASED
FINANCIAL RATIOS
It is common for donors and regulators to use certain accounting measuresto judge nonprofit performance. For example, donors readily use data fromthe IRS Form 990 or from state regulators to compute the percentage ofexpenses (or revenues) the organization devotes to fund-raising expenses,administrative expenses, and programs. Survey evidence from the Council ofBetter Business Bureaus suggests that many donors desire financial data toguide their donation decisions (Council of Better Business Bureaus, 2003).Various authors provide guidance in interpreting these ratios.2 Someauthors have also used accounting data to compute the ‘‘price’’ to thedonor of obtaining a dollar of spending on programs. See Weisbrodand Dominguez (1986), Posnett and Sandler (1989), Khanna, Posnett,and Sandler (1995), Okten and Weisbrod (2000), Tinkelman (1999), andMarudas and Jacobs (2004).
Accounting standard-setters devote considerable attention to definingfunctional categories of expenses, in the belief that donors and regulatorsfind such categories helpful. The work of the National Health Council(1964) is an early example. More recent pronouncements include FASB(1980) Statement of Accounting Concepts No. 3, FASB Statements 116 and117 (FASB 1993a, 1993b), and various AICPA pronouncements (AICPA,1978, 1987, 1994, 1998, 2002).
A recent court case focused increased attention on accounting measuresof nonprofit organizational efficiency. The US Supreme Court, in the 2003case ofMadigan v. Telemarketing Associates, ruled that a telemarketer couldbe prosecuted for fraud for misrepresenting a particular financial ratio, theratio of fund-raising expenses to donations. This case attracted enormousattention among charitable organizations, professional fund-raisers, watch-dog agencies, and state regulators. Charitable organizations and profes-sional fund-raisers argued strongly that the fund-raising ratio was poorlydefined, inconsistently measured, and a misleading and inadequate measureof organizational performance. Because fraud, by definition, must involvemisrepresentation or omission of a material fact, the Court was in effectbeing asked to opine on whether the fund-raising ratio was an importantfact. When the Court held that the State of Illinois could bring a fraudaction against the telemarketer, it implicitly endorsed the relevance andmateriality of the fund-raising ratio to donors.
The use of ratios by regulators to evaluate organizations has real-world con-sequences. The US Supreme Court recognized that nonprofit organizations
Decomposing the Elements of Nonprofit Organizational Performance 79
could legitimately vary in the fraction of their funds spent on fund-raising, andbarred states from prosecuting organizations simply because fund-raisinglevels are high. The Court noted that such restrictions would tend to penalizeorganizations that promoted unpopular causes, or combined fund-raising andeducational efforts. However, various other parties are quick to judgeorganizations by this ratio. For example, in 2003 the Better Business Bureau/Wise Giving Alliance, an important public watchdog group, changed itsstandards of acceptable spending by nonprofit organizations to require thatorganizations spend no more than 35% of their funds on fund-raising.3 Itsprevious standard was 50%. The change in standards is likely to damage someorganizations’ reputations and fund-raising abilities. Other organizations, tostay in compliance, are likely to reduce their fund-raising efforts, at the cost ofdecreasing their total funds available to fund programs. The NonprofitOverhead Cost Project of the Urban Institute suggests that skimping onadministrative overhead can reduce the effectiveness of organizations (UrbanInstitute, 2004a).
There is also evidence that donors use financial ratios to determine theirallocations of charitable gifts. Studies that find significant associations ofdonations with one or more ratios include Weisbrod and Dominguez (1986),Posnett and Sandler (1989), Callen (1994), Stout (1997), Khanna et al.(1995), Tinkelman (1999, and 2004), Greenlee and Brown (1999), Okten andWeisbrod (2000), Marudas (2003), and Marudas and Jacobs (2004). Theevidence is mixed. Steinberg (1983, 1986a, 1986b) did not find a relationshipbetween donations and the ratios of either administrative or fund-raisingcosts to donations in his analysis of IRS data from the 1970s. (However, seeTinkelman (1999) regarding the model used for this testing.) Frumkin andKim (2001) find no relationship between donations and an administrativecost ratio.
Since accounting ratios are being used as performance measures, it isimportant to consider if they are relevant and reliable. Several majorcategories of objections have been raised.4 For our purposes, the mostsignificant objection is that accounting ratios are incomplete performancemeasures, in that they fail to consider the quantity and quality of serviceoutputs, or organizational strategy. For example, organizations reliant onfoundation grants have different fund-raising ratios than organizations relianton direct-mail campaigns to individuals (Baber, Roberts, & Visvanathan,2001). The ratios also focus only on the current period, and thus omit futurebenefits from current spending or from current saving. In some cases, thecurrent period’s fund-raising should be considered an investment in donorrelationships, which should not all be expensed in the current period.
DANIEL TINKELMAN AND BAIRJ DONABEDIAN80
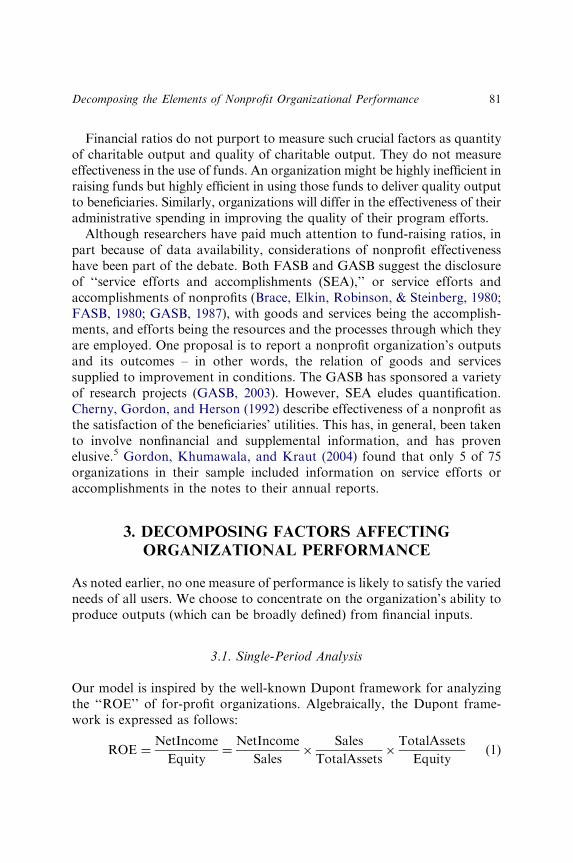
Financial ratios do not purport to measure such crucial factors as quantityof charitable output and quality of charitable output. They do not measureeffectiveness in the use of funds. An organization might be highly inefficient inraising funds but highly efficient in using those funds to deliver quality outputto beneficiaries. Similarly, organizations will differ in the effectiveness of theiradministrative spending in improving the quality of their program efforts.
Although researchers have paid much attention to fund-raising ratios, inpart because of data availability, considerations of nonprofit effectivenesshave been part of the debate. Both FASB and GASB suggest the disclosureof ‘‘service efforts and accomplishments (SEA),’’ or service efforts andaccomplishments of nonprofits (Brace, Elkin, Robinson, & Steinberg, 1980;FASB, 1980; GASB, 1987), with goods and services being the accomplish-ments, and efforts being the resources and the processes through which theyare employed. One proposal is to report a nonprofit organization’s outputsand its outcomes – in other words, the relation of goods and servicessupplied to improvement in conditions. The GASB has sponsored a varietyof research projects (GASB, 2003). However, SEA eludes quantification.Cherny, Gordon, and Herson (1992) describe effectiveness of a nonprofit asthe satisfaction of the beneficiaries’ utilities. This has, in general, been takento involve nonfinancial and supplemental information, and has provenelusive.5 Gordon, Khumawala, and Kraut (2004) found that only 5 of 75organizations in their sample included information on service efforts oraccomplishments in the notes to their annual reports.
3. DECOMPOSING FACTORS AFFECTING
ORGANIZATIONAL PERFORMANCE
As noted earlier, no one measure of performance is likely to satisfy the variedneeds of all users. We choose to concentrate on the organization’s ability toproduce outputs (which can be broadly defined) from financial inputs.
3.1. Single-Period Analysis
Our model is inspired by the well-known Dupont framework for analyzingthe ‘‘ROE’’ of for-profit organizations. Algebraically, the Dupont frame-work is expressed as follows:
ROE ¼NetIncome
Equity¼
NetIncome
Sales�
Sales
TotalAssets�
TotalAssets
Equity(1)
Decomposing the Elements of Nonprofit Organizational Performance 81
Intuitively, the Dupont framework decomposes the overall ROE measureinto factors for profitability (net income per dollar of sales), turnover (salesper dollar of assets available to managers), and leverage (assets per dollar ofequity). Analysis of these three factors yields a deeper understanding of howbusinesses achieve a given level of ROE. It also helps managers intelligentlydecide how to trade-off different aspects of performance. For example, itmay make sense in some cases to reduce prices, thus reducing profitabilityper dollar of sales, if the lower prices yield a sufficient increase in assetturnover. Judging management only on one dimension, such as turnover,would yield an incomplete assessment of how management’s efforts affectreturns.
The performance of nonprofit organizations can, in theory, be analyzedusing an analogous series of ratios. First, we define effectiveness in terms ofthe charitable outputs actually produced. A given organization may producea variety of outputs. For example, an international relief organization mayprovide both food and medical aid. It is conceptually necessary to convertthe actual units of output to some standardized index to sum the totaloutput. We define CSE as current standardized efficiency, equal to thenumber of standardized units of program service produced in a particularperiod per dollar of revenue. Then, in a one-period setting, we can treat CSEas the product of four factors, as follows:
CSE ¼CSU
AU�
AU
PE�
PE
TE�
TE
TR(2)
where CSU is the current standardized units (i.e., the number ofstandardized units of output quality produced in the current period); AUthe actual units (i.e., the actual number of units of output produced); PE theprogram expenses, in dollars, in the current period; TE the total expenses inthe current period; and TR the total revenues in the current period.6
We define the first factor, CSU/AU, as the ‘‘Program Quality Index.’’ It isa measure of how the actual units produced compare to a standard qualityindex. An international relief organization that ships many tons of suppliesoverseas would have a high level of actual units delivered, but if thesupplies were spoiled, or inappropriate to the needs of the population, thesupplies would only correspond to a low level of standardized tonsof supplies.
The concept of Current Standardized Units is an important one for anyorganization with multiple outputs. Deciding what relative values to placeon differing outputs will force management to very clearly determine itspriorities. Determining the best way of standardizing units is likely to be the
DANIEL TINKELMAN AND BAIRJ DONABEDIAN82
most difficult part of applying our model. Organizations are likely to have tosettle upon rules of thumb to try to make differing program outputs, anddiffering program qualities, comparable.7
We call the second factor, AU/PE, the ‘‘Program Output Index.’’ Itmeasures how many units of output the organization obtains for each dollarexpended. An international aid organization that buys food cheaply fromfarmers would have a higher program output index than one that pays retailprices for food.
The third factor, PE/TE, is the ‘‘Program Spending Ratio.’’ It measuresthe fraction of the current year spending devoted to programs, rather thanto administrative or fund-raising expenses. It is clearly related to the fund-raising ratio. It is also related to ‘‘Price’’ in academic writing (see Parsons,2003). An organization spending a large percentage of its revenues onprograms would have a high PE/TE.8
The fourth factor, TE/TR, is the ‘‘Current Spending Factor.’’ It measuresthe extent to which current revenues are expended in the current period, asopposed to being saved for use in future periods. This term captures theamount of funds devoted to reserves.
This framework puts both the usefulness, and the limitations, of accountingratio analysis of nonprofit organizations into perspective. In its entirety itcaptures numerous dimensions of a nonprofit’s activities. An organizationdevoted to delivering meals to the elderly will be measured first on theProgram Quality Index: how does the quality of its meals and the timelinessof their delivery compare with an objective standard. Second, it would beevaluated on the basis of the Program Output Index: how efficient is theorganization in obtaining meals from suppliers. Third, it would be assessedaccording to the Program Spending Ratio: how effective is the nonprofit inutilizing its contributions for meals programs rather than for fund-raising oradministration. Finally, the Current Spending Factor would capture thedegree to which revenues are being spent on current meals programs, ratherthan being saved for future meals programs.
Clearly, certain ratios are relevant to the overall assessment ofeffectiveness. All other things held constant, organizations that save less,and devote higher proportions of their spending to program expenses, willhave higher Current Spending Factors and higher Program SpendingRatios. They will therefore be more effective in delivering services in thecurrent period. Thus, it is not surprising that various studies, cited earlier,find associations between donations and measures of ratios similar to theprogram expense ratio, nor that Marudas (2003) finds an inverse relationbetween donations and amounts of reported accumulated savings.
Decomposing the Elements of Nonprofit Organizational Performance 83
However, it is unreasonable to expect all other things to be constant. Theframework indicates that the two accounting ratios, the Program SpendingRatio and the Current Spending Factor, explain only part of the story.Measures of quality and quantity of output are outside the scope of the twoaccounting ratios.
Just as a for-profit manager may trade off such factors as profit marginand turnover to achieve higher ROE, a nonprofit or governmental managermay logically make trade-offs both within and among the four componentsof CSE. For example, choosing to produce more of one output and less ofanother is a choice among products that together make up CurrentStandardized Units. Managers weigh the relative values of the two outputsto make rational choices. Increasing output quantity at the expense ofoutput quality is a trade-off between two different components of CSE,namely the Program Quality Index and the Program Output Index. Lessobviously, there will be cases where increasing dollars spent on currentprograms, and decreasing spending on current administration, may result inlower, not higher, levels of CSU. In this case, the greater program spendinghas the direct mathematical effect of raising the Program Spending Ratio.However, if there is inadequate administrative infrastructure, the organiza-tion may have trouble maintaining production of output (AU) andmaintaining output quality (as measured by the ratio of CSU to AU). Thehigher Program Spending ratio may be more than offset by declines in theProgram Quality Index and the Program Output Index.
In our formulation, an increase in fund-raising at the expense of programspending reduces CSE. However, another trade-off should be recognized,because more fund-raising may raise additional current year donations,meaning more services can be delivered, albeit at lower per-dollareffectiveness levels. An organization may decide it is better to feed 10,000hungry people than 1,000, even if the food is delivered marginally lessefficiently or effectively per person served or per dollar spent. As noted later,the analysis for the multiperiod setting must also recognize the possiblefuture multiplier effect of current fund-raising.
We have included a hypothetical numerical example of the application ofthis framework in the appendix.
3.2. Multi-Period Analysis
To expand the analysis beyond a single period, we consider two morefactors. First, funds saved in the first period may vary in the degree to which
DANIEL TINKELMAN AND BAIRJ DONABEDIAN84
they are spent on programs in subsequent periods. Second, fund-raisingexpenditures in the first period may raise donations in subsequent periods,which will support additional program expenditures. As noted earlier, whileaccounting standards expense all fund-raising spending in the currentperiod, some probably represents an investment in future relations withdonors.
We define the number of Deferred Standardized Units (DSU) as theprogram units produced in future periods by the expenditure of fundsraised, and saved, in the initial period. The funds saved in the initialperiod ¼ total revenues (TR) – total expenditures (TE). The savings result inincremental funding available in future years, designated as IF. We candefine DSE (deferred standardized efficiency) mathematically as follows,where D indicates the change in the variable
DSE ¼X1t¼1
1
ð1þ iÞtDDSUt
DAUt�
DAUt
DPEt�
DPEt
IFt�
IFt
ðTR0 � TE0Þ�ðTR0 � TE0Þ
TR0
� �
(3)
In this formulation, the deferred standard units are the product of sixfactors, including, from left to right:
� a discounting factor;� a Program Quality Index (DDSU/DAU);� a Program Output Index (DAU/DPE);� a Program Spending Ratio, expressed as the change in programexpenditure each future year as a fraction of the incremental funding, IF;� a Savings Usage Index, expressed as incremental funding divided by theoriginal savings; and� the original level of savings as a fraction of initial period revenues.
The parts of this model that differ from the single-period setting are theoriginal level of savings, the Savings Usage Index, and discounting. Forthere to be deferred benefits, there must first be savings. The original savingslevel represents that part of year zero revenue, which was not spent in yearzero. (To the extent the year zero revenue is spent in year zero, it increasesthe measure of CSE. If expenses exceed revenues in year zero, the originalsavings level will be negative, and future periods will produce fewer unitsdue to the need to pay-off the year zero deficit.) Then, the savings must beused to generate benefits in some later year. The Savings Usage Index, forsome subsequent year j measures the portion of the original savings that is
Decomposing the Elements of Nonprofit Organizational Performance 85
spent in year j, which would be the incremental funding in year j, divided bythe original savings. Thus, the combination of original savings, and theSavings Usage Index for a subsequent year, determines the extra amount offunds the organization will spend in that year. Since the spending isdeferred, a discount factor is applied.
The other three terms in this model (the Program Quality Index, theProgram Output Index, and the Program Spending Ratio) are all identicalto the corresponding terms in the one-period setting. They measure theextent to which: extra money spent is used on programs, extra spending onprograms produces extra output, and extra output can be categorized asstandard-quality output.
We also need to consider the multiplier effect induced because spendingon fund-raising efforts in the initial period, FR0, may induce futuredonations, DONt, which may in turn be spent on programs in futureperiods. If we define this additional level of output as MSU, for MultiplierStandardized Units, then the Multiplier Standardized Efficiency (MSE) iscomputed as follows:
MSE ¼X1t¼1
1
ð1þ iÞtDMSUt
DAUt�
DAUt
DPEt�
DPEt
DDONt�
DDONt
FR0�
FR0
TR0
� �(4)
This equation uses similar terms and logic as the previous model. Theintuition is that the effect of the first period expenditure on fund-raising onfuture charitable output depends upon
� the organization’s focus on fund-raising in period zero (FR0/TR0, or thefund-raising ratio);� the productivity of the fund-raising efforts in raising future donations(DDON/FR0);� the use of incremental donations for incremental program spending (DPE/DDON);9
� the organization’s efficiency in converting spending on programs to actualunits of output (DAU/DPE); and� the organization’s ability to achieve proper output quality (DMSU/DAU).
In this model, a high fund-raising ratio will have two effects. First, higherspending on fund-raising will, all other things being equal, mean reducedprogram spending. This reduces CSE. However, fund-raising has a positiveeffect on future program service delivery.
DANIEL TINKELMAN AND BAIRJ DONABEDIAN86
While MSE is defined as an infinite sum, there are reasons to believe thatin practice only a short horizon will be appropriate, except possibly for giftsin whole or in part restricted to future use, such as endowment gifts. First, ifdonors have high preferences for current expenditures, the applicablediscount rate will be high. Second, much fund-raising is either direct mail ortelephone, not long-term brand-building, and so the incremental donationsinduced are all likely to come from short periods after the fund-raisingexpenditures.10 Also, if the ratio of donations to fund-raising becomes lessthan one, standard multiplier analysis comes into play, and the result will bebounded.
Putting the results of Eqs. (2), (3), and (4) together, the total standardizedoutput (TSU) of an organization can be expressed as the sum of the currentunits, the future units made possible by savings, and the future units inducedby the multiplier effect of fund-raising expenditures, or, mathematically
TSU ¼ CSUþDSUþMSU (5)
The total standardized efficiency is found by dividing the total number ofstandardized units by the total revenue of the organizations, or adding thethree efficiency measures, so
TSE ¼ TSU=TR ¼ ðCSUþDSUþMSUÞ=TR ¼ CSEþDSEþMSE
(6)
While our analysis is performed using average data for each period, onecould readily convert the analysis to a marginal basis. In theory, it would becorrect to save when the marginal deferred standardized efficiency exceedsthe sum of the marginal current and multiplier standardized efficiencymeasures.
4. DISCUSSION AND CONCLUSION
The issue of evaluating nonprofit organizational performance is a difficultone. Traditional financial measures alone are clearly inadequate. One waythat some organizations attempt to incorporate both financial and non-financial measures in performance evaluations is through use of the ‘‘balancedscorecard’’ (Kaplan & Norton, 1992). A balanced scorecard is typically madeup of 15–20 measures, divided among the 4 areas: performance for customers,
Decomposing the Elements of Nonprofit Organizational Performance 87
traditional financial measures, internal processes, and innovation andimprovement activities (Kaplan & Norton, 1993). The measures are chosenby management to represent key performance measures, and are measuredand reported separately. The development, communication, and use of thesemeasures requires considerable time and management involvement, but hasthe benefit of forcing managers to consider key drivers of performance intheir organization. Kaplan and Norton (1996) cite as one of their examplesa bank that took 30 months to implement a balanced scorecard system.
Our framework addresses most of the same areas as the balancedscorecard, but is conceptually more tightly integrated. Clearly, our modelincorporates traditional financial measures of efficiency. Our emphasis onstandardized quality and on quantity of desired outputs overlaps with thebalanced scorecard areas of performance for customers and internalprocesses. While our framework does not explicitly have goals for learningand innovation, we believe organizations attempting to improve perfor-mance, and studying the disaggregated factors of our framework, will havetools to learn from their experience. What makes our model more integratedis its focus on arriving at a single indexed score. An issue in using balancedscorecards for such purposes as compensation is how to weight the variousmeasures. The measures in the balanced scorecard can be quite diverse,including such factors as the number of hours spent with prospectsdiscussing new work (Kaplan & Norton, 1993), and no natural weighting oraggregation method presents itself. In our framework the disaggregatedmeasures fall into a logical sequence.
The decomposition of factors affecting efficiency presented here, whilesomewhat oversimplified, serves to bring out some of the complexities ofmeasuring the efficiency of not-for-profit organizations. While there may becircumstances where our framework can be applied numerically, we believeits greater value is to focus attention on managerial trade-offs and on areaswhere research is needed. In practice, we expect it is most likely to be usedinternally within organizations. The difficulties of arriving at objectivelysupportable relative weights for various outputs are likely to limit the useof the framework by outsiders seeking to compare organizations. Oneexception might be grantors seeking to compare organizations providingnarrowly defined types of services.
The framework for measuring efficiency in this chapter contains both termsthat are currently reported and terms that are not currently measured. Termsthat are currently reported, or calculable easily from financial statements,include total expenses; total revenues; total program expenses; current yearrevenues not expended; and the degree to which current year spending
DANIEL TINKELMAN AND BAIRJ DONABEDIAN88
exceeds current year revenues, and is thus a draw-down of prior savings.Terms that are not currently reported include actual units of output; an indexto convert actual units of output to a standard quality index; measures ofincremental donations induced by prior year fund-raising efforts; measures ofincremental program spending funded by these incremental donations; andthe planned year of expenditure of saved donations.
Based on this framework, the decision-usefulness of the particularfinancial ratios can be seen in context. For example, the ratio of programexpenditures to total revenues is a relevant ratio. Ceteris paribus, a higherratio does indicate a more efficient organization in the current period.
However, we can also see what factors may cause a single-minded focuson the program ratio to be misleading. For example, overspending onprograms may result in unfavorable quality due to a lack of adequateoverall administrative leadership. Alternatively, low spending on programsin a current year may be indicative, not of inefficiency, but of an orga-nization’s prudent decision to save, expecting future years’ productivity orquality to be better than the current year’s. As a third example, an organi-zation with a favorable fund-raising function may properly exploit a highmarginal return on fund-raising to induce high future donations, in theconfidence that high current diversion of funds to fund-raising efforts willresult in larger future programs.
For the framework to be used in a numeric form, more research is needed.In particular, methods of measuring quantities and qualities of actualoutputs are required, as well as a system for computing indices to allowmeasurement of outputs of organizations with a variety of different outputs.There may be some situations where market forces give some evidence ofthese measures. For example, one could conceive of a situation wherefamine relief in the form of bags of grain and other foodstuffs is provided toan area, which also has a functioning market supplying food to those peoplewho can afford to pay. Then the local market prices could help determinethe relative values of the various physical food deliveries.
Given the difficulty of the task of arriving at generally usable quality andquantity measures, it is likely that this model will be applied in a subjective,judgmental form. In some ways, the situation is analogous to that in auditing,where auditors consider the effects of control risk, inherent risk, anddetection risk on audit risk even though they are rarely able to computecardinal measures of any of these theoretical constructs. Our frameworkprovides for clear discussions of the trade-offs organizations must make.While organizations may not be able to precisely measure ‘‘standardizedoutputs,’’ using this framework may force managers to ask the hard questions
Decomposing the Elements of Nonprofit Organizational Performance 89
needed to make rational trade-offs. Which outputs are most valuable? Whatlevel of quality can we sacrifice to serve more people? Does spending nowmake sense, or should we wait?
The framework can also help skeptical financial statement users framequestions in an organized fashion for evaluating performance. If, for example,an organization announces it has exceeded its goals of units of service in threeareas, but fallen short on one, the framework would raise various questions.How important was the one area, versus the three, in terms of ‘‘standardizedunits?’’ Did the goals include quality standards, and, if not, was qualitycompromised to obtain the outputs? How costly per unit was the achievementof the goals? Did the achievement come at the expense of future efforts?
NOTES
1. We discuss later some of the issues involved in arriving at measures ofstandardized units of output. These issues are less critical when the framework isused internally, or by grantors operating in a narrowly defined area of service.
2. See, for example, Swords (2001) and Schmidt (2002).3. See the standards for assessing organizational performance, on www.give.org.4. Other criticisms involve the inaccuracy of the measures; the freedom
organizations have to use differing cost allocation methods; the volatility of theratios as responses to fund-raising appeals change over time; the inaccuracy of IRSdata; and the failure of accounting measures to capture the marginal relations ofdonations to program spending. See Grimes (1977) for an early critique of the use offund-raising ratios, and Association of Fundraising Professionals (2003, p. 4) for amore recent critique. See Steinberg (1986a, 1986b) regarding the importance of usingmarginal data. See Froelich and Knoepfle (1996) and Gordon, Greenlee, andNitterhouse (1999) for discussions of limitations in the data. The Urban Institute’sNonprofit Overhead Cost Project noted that the functional classification of expenses,particularly personnel expenses, was a low priority for nonprofit organizations, andthey reported that ‘‘obvious functional expense reporting errors occur in auditedfinancial statements and Forms 990 even when the documents are prepared byauditors and CPAs’’ (Urban Institute, 2004b). Some studies, analogous to theearnings management literature, suggest that nonprofit managers may deliberatelymisallocate expenses to ‘‘manage’’ ratios to more favorable levels. For example,Greenlee and Gordon (1998) found numerous cases where Pennsylvania charitiesthat used professional fund-raising consultants reported spending zero on fund-raising costs. See also Krishnan, Yetman, and Yetman (2003), Khalaf (1992), Trussel(2003), and Yetman (2003).
5. The funding sources of many nonprofits are also a blend of the donative andthe commercial (O’Hagan & Purdy, 1993, p. 157), depending, for example, onpatrons and on ticket sales, on benefactors and on hospital revenues. But for thepurpose of this study, the commercial aspect of nonprofits will be regarded asconstant; only the donative will vary.
DANIEL TINKELMAN AND BAIRJ DONABEDIAN90
6. We measure all financial variables on the accrual basis. The informationavailable to outside donors generally comes from either financial statements or theIRS Form 990, which are generally prepared on the accrual basis. Second, accrualaccounting uses the matching principle to try to meaningfully match expendituresagainst related operating revenues. Thus, the cost of a capital expenditure would bespread over its useful life under the accrual basis.
7. Such issues arise in other areas of economic measurement. For example,government efforts to measure inflation must first settle upon some basket of goodsconsidered representative, and use those goods to create an index. Then, over time,the Consumer Price Index must take into account changes in the qualities of thegoods in the index as well as changes in their prices.
8. To the extent an organization manipulates its expense allocation process, theamount reported as program expenses might misrepresent the actual usage of funds.However, the positive effect on the Program Spending Ratio would be offset by thenegative effect on the Program Output Index.
9. This model ignores second-order multiplier effects arising when some fundsraised in subsequent periods are used to raise still more funds.10. The literature on advertising also suggests that most advertising has limited
long-term impact. See Ehrlich and Fisher (1982).
ACKNOWLEDGMENT
We wish to acknowledge the comments of the editor, the anonymousreferee, Robert Lipe and participants at the 2004 ARNOVA Conference.
REFERENCES
AAFRC Trust for Philanthropy. (2005). Giving USA 2005.
AICPA. (1978). Statement of Position 78-10, Accounting principles and reporting practices for
certain nonprofit organizations. New York, NY: AICPA.
AICPA. (1987). Statement of Position No. 87-2, Accounting for joint costs of informational
materials and activities of not-for-profit organizations that include a fund-raising appeal.
New York, NY: AICPA.
AICPA. (1994). Audit and Accounting Guide, Audits of certain nonprofit organizations. New
York, NY: AICPA.
AICPA. (1998). Statement of Position No. 98-2, Accounting for costs of activities of not-for-
profit organizations and state and local entities that include fund-raising. New York, NY:
AICPA.
AICPA. (2002). AICPA Audit and Accounting Guide, Not-for-profit organizations. New York,
NY: AICPA.
Association of Fundraising Professionals, Association of Direct Response Fundraising
Counsel, Council for Advancement and Support of Education, the Direct Marketing
Association and the Direct Marketing Association’s Nonprofit Federation, Direct
Marketing Association of Washington, Direct Marketing Fundraisers’ Association,
Decomposing the Elements of Nonprofit Organizational Performance 91
National Catholic Development Conference, National Health Council in support of
Respondents. (2003). Case of Ryan v. Telemarketing Associates, Inc. et al, Supreme
Court of the United States, No. 01-1806, decided May 2003.
Baber, W. R., Roberts, A. A., & Visvanathan, G. (2001). Charitable organizations’ strategies
and program-spending ratios. Accounting Horizons, 15(4), 329–343.
Behn, R. D. (2003). Why measure performance? Different purposes require different measures.
Public Administration Review, 63(5), 586–606.
Brace, P., Elkin, R., Robinson, D., & Steinberg, H. (1980). Reporting of service efforts and
accomplishments. Stamford, CT: FASB.
Callen, J. (1994). Money donations, volunteering and organizational efficiency. The Journal of
Productivity Analysis, 5(October), 215–228.
Cherny, J., Gordon, A., & Herson, R. (1992). Accounting – A social institution: A unified theory
for the measurement of the profit and nonprofit sector. New York: Quorum Books.
Council of Better Business Bureaus, Inc and the BBB Wise Giving Alliance. (2003). Amicus
Curiae brief in the Supreme Court Case of Ryan v. Telemarketing Associates, Inc., Case
No. 01-1806.
D’Aunno, T. (1992). The effectiveness of human service organizations: A comparison of
models. In: Y. Hasenfeld (Ed.), Human Services as Complex Organizations. Newbury
Park: Sage Publications.
Ehrlich, I., & Fisher, I. (1982). The derived demand for advertising: A theoretical and empirical
investigation. AERO, 72(June), 366–388.
FASB. (1980). Statement of Accounting Concepts No. 3, Objectives of financial reporting by
nonbusiness organizations. Stamford, CT: FASB.
FASB. (1993). Statement of Financial Accounting Standards No. 116, Accounting for
contributions received and contributions made. Stamford, CT: FASB.
FASB. (1993). Statement of Financial Accounting Standard No. 117. Financial statements of
not-for-profit organizations.
Forbes, D. (1998). Measuring the unmeasurable: Empirical studies off nonprofit organiza-
tional effectiveness from 1977 to 1997. Nonprofit and Voluntary Sector Quarterly,
27, 183–202.
Froelich, K. A., & Knoepfle, T. W. (1996). Internal revenue service 990 data: Fact or fiction?
Nonprofit and Voluntary Sector Quarterly, 25(1), 40–52.
Frumkin, P., & Kim, M. T. (2001). Strategic positioning and the financing of nonprofit
organizations: Is efficiency rewarded in the contributions marketplace? Public
Administration Review, 61(May), 266–275.
GASB. (1987). Concepts Statement No. 1,Objectives of financial reporting. Stamford, CT: GASB.
GASB. (2003). Reporting performance information: Suggested criteria for effective communica-
tion (August). Special report. Norwalk, CT: GASB.
Gordon, T., Greenlee, J., & Nitterhouse, D. (1999). Tax-exempt financial data: Availability and
limitations. Accounting Horizons, 13(June), 113–128.
Gordon, T., Khumawala, S., & Kraut, M. (2004). Reporting to donors: Best practices for
financial reporting in conjunction with annual reports, November. Working Paper. 33rd
ARNOVA Conference.
Greenlee, J. S., & Brown, K. L. (1999). The impact of accounting information on contributions
to charitable organizations. Research in Accounting Regulation, 13, 111–125.
Greenlee, J. S., & Gordon, T. P. (1998). The impact of professional solicitors on fund-raising in
charitable organizations. Nonprofit and Voluntary Sector Quarterly, 27(3), 277–299.
DANIEL TINKELMAN AND BAIRJ DONABEDIAN92
Grimes, A. J. (1977). The fundraising percentage as a quantitative standard for regulation of
public charities, with particular emphasis on voluntary health and welfare organizations.
In: Research papers sponsored by the commission on private philanthropy and public needs.
Washington, DC: U.S. Deparment of the Treasury.
Herman, RD., & Renz, D. O. (1997). Multiple constituencies and the social construction of
nonprofit organization effectiveness.Nonprofit and Voluntary Sector Quarterly, 26, 185–206.
Kaplan, R. S., & Norton, D. P. (1992). The balanced scorecard – Measures that drive
performance. Harvard Business Review (January–February), 71–79.
Kaplan, R. S., & Norton, D. P. (1993). Putting the balanced scorecard to work. Harvard
Business Review (September–October), 134–142.
Kaplan, R. S., & Norton, D. P. (1996). Using the balanced scorecard as a strategic management
system. Harvard Business Review, 74(1), 75–86.
Khalaf, R. (1992). The accounting games charities play. Forbes (October 26), 252–254.
Khanna, J., Posnett, J., & Sandler, T. (1995). Charity donations in the UK: New evidence based
on panel data. Journal of Public Economics, 56, 257–272.
Krishnan, R., Yetman, M., & Yetman, R. (2003). Financial disclosure management by nonprofit
organizations, September 30. Working paper. Available at http://ssrn.com/abstract ¼
319581.
Marudas, N. (2003). Effects of nonprofit organization wealth and efficiency on private
donations to large nonprofit organizations. Research in Governmental and Nonprofit
Accounting, 11, 71–91.
Marudas, N., & Jacobs, F. (2004). Determinants of charitable donations to large U.S. higher
education, hospital, and scientific research NPOs: New evidence from panel data.
Voluntas, 15(2), 157–179.
Murray, V., & Tassie, R. (1994). Evaluating the effectiveness of nonprofit organizations. In:
R. D. Herman (Ed.), The Jossey-Bass handbook of nonprofit leadership and management.
San Francisco: Jossey-Bass Publishers.
National Health Council. (1964). Standards of accounting and financial reporting for voluntary
health and welfare organizations. National Health Council.
O’Hagan, J., & Purdy, M. (1993). The theory of non-profit organizations: An application to a
performing arts enterprise. The Economic and Social Review, 24, 155–167.
Okten, C., & Weisbrod, B. A. (2000). Determinants of donations in private nonprofit markets.
Journal of Public Economics, 75, 255–272.
Parsons, L. (2003). Is accounting information from nonprofit organizations useful to donors?
A review of charitable giving and value-relevance. Journal of Accounting Literature, 22,
104–129.
Posnett, J., & Sandler, T. (1989). Demand for charity donations in private nonprofit markets:
The case of the U. K. Journal of Public Economics, 40, 187–200.
Schmidt, A. W., Jr. (2002). Guide for the responsible donor. From Guidestar web site. Accessed
on January 7. Available at http://www.guidestar.org/learn/articles.stm.
Steinberg, R. (1983). Two essays on the nonprofit sector. Doctoral Dissertation, University of
Pennsylvania.
Steinberg, R. (1986a). Should donors care about fundraising? In: S. Rose-Ackerman (Ed.), The
economics of nonprofit organizations – Studies in structure and policy (pp. 346–364). New
York: Oxford University Press.
Steinberg, R. (1986b). The revealed objective functions of nonprofit firms. Rand Journal of
Economics, 17(4), 508–526.
Decomposing the Elements of Nonprofit Organizational Performance 93
Stout, W. D. (1997). Materiality and nonprofit organizations: An empirical investigation of
materiality thresholds of financial statement users. Doctoral Dissertation, University of
South Florida.
Swords, P. (2001). How to read the Form 990 & find out what it means. Available at http://
www.guidestar.org/learn/articles.stm.
Tinkelman, D. (1999). Factors affecting the relation between donations to not-for-profit
organizations and an efficiency ratio. Research in Government and Nonprofit Accounting,
10, 135–161.
Tinkelman, D. (2004). Using non-profit organization-level financial data to infer managers’
fund-raising strategies. Journal of Public Economics, 88, 2181–2192.
Trussel, J. (2003). Assessing potential accounting manipulation: The financial characteristics of
charitable organizations with higher than expected program-spending ratios. Nonprofit
and Voluntary Sector Quarterly, 32(4), 616–634.
Urban Institute, Center on Philanthropy of Indiana University. (2004a). Getting what we pay
for: Low overhead limits nonprofit effectiveness, August. Nonprofit Overhead Cost
Project Brief No. 3.
Urban Institute, Center on Philanthropy of Indiana University. (2004b). The Quality of
Financial Reporting by Nonprofits: Findings and Implications, August.
Weisbrod, B. A., & Dominguez, N. D. (1986). Demand for collective goods in private nonprofit
markets: Can fund-raising expenditures help overcome free-rider behavior? Journal of
Public Economics, 30, 83–95.
Yetman, R. (2003). Nonprofit taxable activities, production complementarities, and joint cost
allocations. National Tax Journal, 56(4), 789–799.
APPENDIX. APPLYING THE ANALYTICAL
FRAMEWORK TO A HYPOTHETICAL
ORGANIZATION
In this appendix, we apply our analytical framework to a hypotheticalnonprofit organization for a single period. The mission of the Tropical Anti-Polio Institute (‘‘TAPI’’) is to inoculate residents of a tropical countryagainst polio. TAPI buys vaccines on the open market, and uses its staff andequipment to distribute and administer the drugs free to patients.
Baseline Scenario
The following facts describe the budgeted operations of TAPI.
� Budgeted revenues are $10 million and budgeted expenses are $9.5million, leaving $0.5 million to be saved for use in future years.� It has budgeted $1 million for administrative overhead and fund-raising;and $8.5 million for programs.
DANIEL TINKELMAN AND BAIRJ DONABEDIAN94
� Of the $8.5 million in program spending, $5.5 million will be spent onvaccines.� The remaining $3 million is budgeted for program staff salaries,transportation, refrigeration of the vaccines, and other necessary costsof fulfilling its mission.� The wholesale cost of the vaccines is $5 per dose, so TAPI plans to buy 1.1million doses. Each dose is expected to be actually delivered to a patient.� There is approximately a 90% chance that a dose will provide immunity.Thus, the 1.1 million doses will actually immunize approximately 1 millionpeople.
CSE in this case can be measured directly as the ratio of peopleimmunized to dollars of revenue. Revenue ¼ $10 million, and 1 millionpeople were immunized. This reduces to 0.100 immunizations per dollar ofrevenue.
CSE can also be measured indirectly, as the product of four factors:
� The Program Quality Index is the ratio of current standardized units ofoutput (CSU) to Actual Units (AU). Here, the standardized unit wouldbe 1 million patients immunized. The actual units would be 1.1 milliondoses delivered. CSU/AU ¼ 1 million/1.1 million, or approximately 0.909immunizations per doses delivered.� The Program Output Index is the ratio of actual units (AU) of output tothe program expenses (PE). Here, 1.1 million doses were delivered, and$8.5 million was spent on programs. The program output index wouldequal 1.1/8.5, or about 0.129 actual doses delivered per dollar of programexpense.� The Program Spending Ratio is the ratio of program expenses to totalexpenses. In this case, the ratio ¼ $8.5 million/$9.5 million of totalspending. This reduces to 0.895 dollars of program spending pertotal spending.� The Current Spending Factor is the total expenses in the period dividedby total revenues. In this case, the Current Spending Factor ¼ $9.5million divided by $10 million in revenues, or 0.950.
These four factors could be combined as follows:
CSE¼ 0.909 immunizations per dose� 0.129 dose per program dollars spent� 0.895 program dollars per total dollars spent� 0.950 total dollars spent per dollars of revenue
Decomposing the Elements of Nonprofit Organizational Performance 95
The units of the intermediate terms cancel out, and the result (ignoringrounding) is CSE ¼ 0.100 immunization per dollar of revenue, the same aswhat was computed directly.
It is clear from this model that certain decisions are ‘‘no-brainers.’’ Forexample, if TAPI could buy and administer the same drugs for half the per-dose price, the Program Output Index would rise, no other factor would beaffected, and CSE would improve. If TAPI could obtain vaccines with abetter than 90% effectiveness rate, for the same price, its Program QualityIndex would rise, no other factor would be affected, and CSE wouldimprove.
Other managerial decisions are more complex, since they involve trade-offs between current and future effects, or between the four componentratios in the current period. The following two alternative scenarios explorethese issues.
Alternative Scenario 1: Change Savings Assumption
What would be the effect of increasing the savings from $500,000 to $1million?
Current spending must decrease from $9.5 million to $9 million, so theCurrent Spending Factor falls from 9.5/10 to 9.0/10. If nothing else changedthis would reduce CSE by about 5%. However, the ultimate impact on CSEdepends on how spending is cut.
If the entire cut is from fund-raising or administrative expenses, and ifthere was so much slack in these areas that the cuts in spending have noimpact on current revenues or on outputs, then CSE would end upunchanged. The program spending ratio would increase from 8.5/9.5 to 8.5/9.0,exactly compensating for the reduction in the Current Spending Factor.(The other two ratios would be unchanged.)
If the entire cut is from vaccine purchases, then only 1 million doses canbe bought, and these doses will only immunize about 900,000 people. CSEfalls from 0.10 to 0.09, since $10 million in revenues now results in only900,000 immunizations, not 1 million. In this case, three ratios are allaffected in the same direction. The Current Spending Factor falls fromabout 0.95 to 0.90, as discussed earlier. The Program Spending Ratio fallsslightly from 8.5 million/9.5 million (or 0.895) to 8 million/9 million, or0.889. The Program Output Index is a third contributor to the decliningefficiency. Since we have assumed the same staff and program supportservices are now being used to deliver fewer vaccines, the delivery process is
DANIEL TINKELMAN AND BAIRJ DONABEDIAN96
less efficient. The Program Output Index falls from 1.1 million doses/$8.5million in program expense (or 0.129) to 1 million doses/$8 million inprogram expense (or 0.125). The Program Quality Index is unaffected, andremains 0.90.
CSE now ¼ 0:90 � 0:889 � 0:125 � 0:90 ¼ 0:090
The impact on CSE from the decision to increase savings by 5% of totalrevenues ranges from no effect (if administrative and fund-raising can be cutwithout adverse effects) to a fall of 10% (from 0.100 to 0.095). Whether themanager should actually increase the savings also depends on the expectedfuture benefits from spending the saved funds in the coming years.
Alternative Scenario 2: Changing the Administrative Structure to Improvethe Vaccine’s Efficacy
The efficacy of many vaccines depends upon how they are stored andhandled. We assume in this scenario that TAPI is considering changes to itsadministrative structure that will allow it to do better purchasing ofvaccines, to train its workers better, and to have better control over thehandling of the drugs. Would TAPI be justified in asking a donor for aspecial grant of $1,000,000 to fund administrative infrastructure improve-ments, if it could increase the rate of successful inoculation per dosedelivered from 90% to 95%?
Assume that all the assumptions in the baseline case are still valid, exceptthat total revenues now equal $11 million, administrative and fund-raisingspending total $2 million, and the rate of successful inoculation is 95%.Would CSE rise or fall?
We first compute CSE directly. Total revenues, the denominator, are now$11 million. The same total number of doses of vaccine is delivered, 1.1million. However, now 1,045,000 people, not 1 million, have beensuccessfully immunized. CSE now equals 0.095, or about 5% worse thanthe level of 0.100 in the base scenario.
Why did CSE decline? The increases in the Program Quality Index from0.90 to 0.95 and in the Current Spending Index (from 9.5/10 to 10.5/11) weremore than offset by a larger decline in the Program Spending Ratio as theorganization spent a larger proportion of its funds on administration. TheProgram Output Index is unchanged.
Decomposing the Elements of Nonprofit Organizational Performance 97

Should the donor be unhappy? On the one hand, more people have beenimmunized, which is a good thing. However, if the donor could have madethe same donation to an organization with a CSE of 0.100, then the $1million donation would have immunized more people.
Could the managers have made other trade-offs to maintain CSE at 0.100while increasing administrative spending by $1 million? With this example,an increase in the effectiveness of the vaccine to 100% would result in a CSEof exactly 0.100. This means that the most additional extra spending thatcould be justified by an increase in the Program Quality Index is $1,000,000.Additional administrative costs might also be justified by improvements inthe Program Output Index. Better administration might result in elimina-tions of inefficiencies in the delivery of vaccines. Reducing savings, andusing the funds on programs, would also improve current efficiency, albeitat the expense of future years.
DANIEL TINKELMAN AND BAIRJ DONABEDIAN98
AUDITOR ATTESTATION OF
MANAGEMENT’S EVALUATION OF
INTERNAL CONTROL: EVIDENCE
FROM THE NONPROFIT SECTOR
Thomas E. Vermeer, K. Raghunandan and
Dana A. Forgione
ABSTRACT
Section 404 of the Sarbanes–Oxley Act (SOX), which requires SECregistrants to include a management report on internal control and auditorattestation of such a report, has elicited strong opposition from registrants.Although not required, some nonprofits voluntarily have their auditorattest to management’s evaluation of internal control. Using surveyresponses from chief financial officers of large nonprofit organizations, weexamine factors associated with voluntary auditor attestation of manage-ment’s evaluation of internal control over financial reporting. Our resultsindicate that auditor attestation is more likely for nonprofits that have ahigher proportion of audit committee members with financial expertise andare in the education sector, but less likely for nonprofits with greaterrestricted funds. Overall, the evidence supports the notion that nonprofitorganizations respond differently to the voluntary use of auditorattestation depending on their resource dependency and other individual
Research in Governmental and Nonprofit Accounting, Volume 12, 99–119
Copyright r 2009 by Emerald Group Publishing Limited
All rights of reproduction in any form reserved
ISSN: 0884-0741/doi:10.1108/S0884-0741(2009)0000012007
99
characteristics. Given the ongoing controversy and efforts to change themandatory internal control reporting required by SOX, the evidence in thischapter can be useful to ground arguments in empirical evidence.
AUDITOR ATTESTATION OF MANAGEMENT’S
EVALUATION OF INTERNAL CONTROL: EVIDENCE
FROM THE NONPROFIT SECTOR
Section 404 of the Sarbanes–Oxley Act (SOX, 2002) requires SECregistrants to include in annual reports (a) a management report on internalcontrol and (b) auditor attestation of the report. Section 404 has becomearguably the most controversial issue of SOX. Faced with vociferousopposition from companies, the SEC has thrice postponed the implementa-tion date of the internal control reporting requirement (SEC, 2004a, 2004b,2004c, 2005c).1 In addition, the SEC hosted a roundtable to ‘‘evaluate theimplementation’’ of Section 404 (Solomon, 2005) and formed an advisorycommittee to deal with problems related to implementation of Section 404on smaller companies (SEC, 2004d, 2005a, 2005b).
SOX is applicable only for SEC registrants. However, other entities – suchas nonprofit organizations – have started to voluntarily subject themselves tothe standards mandated by SOX, including the internal control reportingrequirements (Wall Street Journal, 2005). We examine auditor attestation ofmanagement evaluation of internal control over financial reporting fornonprofit organizations. We first provide empirical evidence about the extentof such auditor attestation of management’s evaluation of internal control.We then examine the factors associated with nonprofits’ voluntary use ofauditor attestation of management’s evaluation of internal control.
Issues related to internal control and governance in nonprofit organiza-tions has recently attracted the attention of legislators. For example, effortsare under way in the U.S. Senate and in some state legislatures to enactlegislation that would bring some elements of SOX to nonprofit organiza-tions (U.S. Senate, 2004; Hempel & Borrus, 2004). However, internalcontrol related issues within nonprofit entities have received little attentionfrom researchers. Given the growing role of nonprofits in the U.S. economy,there is a need for improved understanding of extant internal controlpractices in the nonprofit sector.2 We fill this void in the literature using datafrom a survey of 126 chief financial officers of nonprofit organizations aswell as financial information from the GuideStar database to examine the
THOMAS E. VERMEER ET AL.100
auditor attestation of management’s evaluation of internal control at largenonprofit organizations.
Examining factors associated with the voluntary use of auditor attestationover internal control reports by nonprofit organizations is particularlyrelevant given recent developments related to internal control reporting.Given that SOX has mandated internal control reporting by all SECregistrants and the ensuing controversy, it is useful to examine auditorinvolvement with internal control reporting in a setting where suchinvolvement is voluntary. Although there are many differences betweenSEC registrants and nonprofit organizations, evidence from an alternativesetting (such as nonprofits) can shed light on incentives of organizations toinvolve the auditor in internal control reporting. Given the ongoing debateand efforts to change the mandatory internal control reporting requiredunder SOX, evidence about voluntary internal control reporting can beuseful to ground the arguments in empirical evidence.
Our investigation also adds to the research streams of two other areas ofinterest to accountants and auditors. First, empirical evidence about auditcommittees at nonprofit organizations is sparse.3 We provide valuableempirical evidence about the association between the characteristics of auditcommittees and voluntary choices related to the use of the external auditor.Second, we contribute to the literature on voluntary disclosures by providingevidence about the association between auditor attestation of internal controlreports and economic and governance characteristics of organizations.
BACKGROUND AND HYPOTHESES
Legislators, regulators, and private sector bodies are interested in thereporting on internal control by management and the auditor. TheCommission on Auditors’ Responsibilities (Cohen Commission, 1978) andthe National Commission on Fraudulent Financial Reporting (TreadwayCommission, 1987) both recommended that the SEC require (a) registrants toinclude a management report on internal control and (b) auditor attestationof such an internal control report. The SEC proposed a rule in 1988 thatrequired registrants to include a report on management’s responsibilities forinternal control, but did not subsequently implement such a rule.4
Congress enacted SOX as law in the aftermath of the Enron andWorldCom failures. Section 404 of SOX requires the SEC to ‘‘prescriberules requiring each annual report . . . to contain an internal control report[from management], which shall . . . contain an assessment, as of the end
Auditor Attestation of Management’s Evaluation of Internal Control 101
of the most recent fiscal year of the issuer, of the effectiveness of theinternal control structure and procedures of the issuer for financialreporting.’’ In addition, SOX requires that ‘‘with respect to the internalcontrol assessment . . . each [PCAOB] registered public accounting firm thatprepares or issues the audit report for the issuer shall attest to, and reporton, the assessment made by the management of the issuer.’’
The requirements of SOX do not currently apply to nonprofit entities, withtwo limited exceptions.5 However, nonprofit organizations also haveexperienced financial scandals and problems related to controls leading toreduced public confidence in charities (Salmon, 2002). Recent problems innonprofit organizations led to proposals from legislators and state regulatorsto extend the provisions of SOX to nonprofits (NCNA, 2004; U.S. Senate,2004; Higgins, 2005). The Finance Committee of the U.S. Senate held hearingson accountability and charity reform as a prelude to enacting legislationrelated to the governance and auditing of nonprofit organizations (U.S.Senate, 2004; Wells, 2005). Hempel and Borrus (2004) noted that ‘‘at least 13states are mulling new laws that apply Sarbanes–Oxley-type regulations to[nonprofits].’’ Of particular interest is proposed legislation in Massachusettsand New York that seeks Section 404 type internal control reportingregulations for nonprofits that exceed certain size thresholds (NCNA, 2004).
Audit partners from the Big 4 note that SOX ‘‘raises the bar in general’’and that nonprofit entities would want to voluntarily comply with the newlegal provisions related to audit committees (McCarthy, 2003; Tieman,2003). Some nonprofit trustees, who are executives from large corporations,are asking whether voluntary compliance with the provisions of SOX ‘‘couldsend a good short-hand message to donors and regulators about theintegrity of their nonprofit’’ (TACS, 2004). Along these lines, anecdotalevidence indicates that some nonprofit organizations have started tovoluntarily comply with the provisions of SOX (Wall Street Journal, 2005).
In light of the aforementioned, we examine factors associated withnonprofit organizations’ voluntary use of the auditor to attest on manage-ment’s evaluation of internal control. We develop testable hypothesesrelated to such voluntary use of auditor attestation based on resourcedependency and other organizational characteristics.
Resource Dependency Hypotheses
There is a long literature related to voluntary disclosures by corporations.6
The theoretical framework used in such research is based on the notion
THOMAS E. VERMEER ET AL.102
that the demand for voluntary disclosures arises from information asym-metry and agency costs between an entity’s (insider) managers and resource-providers (outsider); hence, voluntary disclosures are likely to be related tothe economic and governance characteristics of organizations (Healy &Palepu, 2001).
Given the absence of ‘‘owners’’ or residual-claimants and the fact that theobjectives of nonprofits are not well defined, the standard principal-agencyframework must be adapted for nonprofit organizations. Prior research inmanagement suggests that the resource dependency approach can be anappropriate framework to examine voluntary disclosures in the nonprofitsetting (Pfeffer & Salancik, 1978). Some prior studies use the resourcedependency approach to examine a variety of issues related to how nonprofitsand their boards operate (e.g., Anheier, Toepler, & Sokolowski, 1997;Hillman & Dalziel, 2003; Miller-Millesen, 2003; Peng & Kellogg, 2003). Weadopt the resource dependency framework to explain the voluntary use ofauditor attestation of management’s report on internal control by nonprofitorganizations.
Specifically, we posit that differences in the composition of resourcesreceived from outsiders would be associated with differences in the perceiveddemand for voluntary internal control disclosures. From the perspective of anonprofit organization, the primary benefit associated with an auditor’sreporting on internal control would likely involve more favorableconsideration by external parties of requests for resources. Nonprofitsreceive a significant amount of funding from governmental grants, donorcontributions, and creditor financing. These sources of funding placerestrictions on the use of their funds, which lead to the need for monitoring.Thus, our first four hypotheses are based on the need for monitoring bygovernments, donors, and creditors.
Governmental GrantsNonprofits that receive governmental grants are subject to additionalreporting and internal control requirements by the governments thatprovide funding. These additional requirements compel nonprofits toimplement additional monitoring mechanisms. Nonprofits recognize thatadditional monitoring mechanisms help them demonstrate to their fundingsources that they are fiscally responsible for government resources.Legislators, the media, and the public often scrutinize organizations thatreceive governmental grants. These parties are concerned whether theorganization is using the funds for the intended purpose. Several studiesfound that the receipt of government grants is associated with nonprofits’
Auditor Attestation of Management’s Evaluation of Internal Control 103
structure, board of directors, and operational policies (e.g., Gronbjerg, 1993;Smith & Lipsky, 1993; Froelich, 1999; Chaves, Stephens, & Galaskiewicz,2004). Hence, we expect a direct relationship between the demand formonitoring and the receipt of governmental grants. This leads to the firsthypothesis.
H1. Nonprofits that receive government grants will be more likely to haveauditor attestation of management’s evaluation of internal control.
OMB (1997) circular A-133 requires that nonfederal entities that receive$300,000 or more in one year in federal awards have a single audit or aprogram specific audit.7 Among other requirements, the Single Audit Actrequires an auditor to report on internal control over federal programs.8
There are many differences between an auditor reporting on internalcontrol in a Single Audit and an auditor issuing a separate attestation reporton management’s evaluation of internal control over financial reporting. Thedifferences relate to the type of assurance provided, scope of the engagement,and types of controls that are evaluated.
First, in a Single Audit, an auditor is not expressing an opinion onmanagement’s assertions related to internal control but is reporting on theunderstanding of internal control obtained, the control risk assessment made,and any reportable conditions and material weaknesses found. In contrast, ina separate attestation report, an auditor provides a positive assuranceregarding management’s assessment and the effectiveness of internal controlover financial reporting. Second, in a Single Audit, the scope of the evaluationof internal control only applies to controls that could have a direct andmaterial effect on a major program; it does not apply to controls unrelated tofederal awards. In a separate attestation engagement, an auditor reports onall controls that have a material effect on financial reporting. Third, in anattestation engagement, an auditor is evaluating controls over financialreporting; in a Single Audit, an auditor focuses solely on controls that have adirect and material effect on major programs.
Nevertheless, given the auditor’s involvement with internal control in aSingle Audit, it is plausible that entities subject to a Single Audit would bemore likely to have voluntary auditor attestation of management’sevaluation of internal control. This leads to the second hypothesis.
H2. Nonprofits that are subject to a Single Audit will be more likelyto have auditor attestation of management’s evaluation of internalcontrol.
THOMAS E. VERMEER ET AL.104
DebtThe existence of debt leads to demand for monitoring mechanisms (Jensen &Meckling, 1976). For example, Chow (1982) finds that debt level is associatedwith the voluntary purchase of audit services, while DeFond (1992) finds thatchanges in leverage are positively correlated with changes in audit firmquality. Auditor attestation of management’s evaluation of internal controlsignals to creditors that the financial reporting process is more reliable andhence the financial statements are more credible. This leads to the thirdhypothesis.
H3. Nonprofits that have long-term debt will be more likely to haveauditor attestation of management’s evaluation of internal control.
Restricted Donor FundsDonors can stipulate restrictions related to the expenditure of the donatedassets as to purpose or time (temporarily restricted net assets) or can stipulatethat the assets be held in perpetuity (permanently restricted net assets).Donors that place restrictions on the time and use of donated assets are morelikely to scrutinize nonprofit organizations to ensure their donations are usedfor their intended purposes.9 Conversely, if the intent of the auditorattestation is to convince potential donors to give to the nonprofit, then anorganization that already has significant resources would be less likely to usean auditor’s attestation of management’s evaluation of internal control.Hence, we do not predict a directional association between fund balances andthe use of the auditor for attesting on management’s evaluation of internalcontrol. This leads to the fourth hypothesis (in the null form).
H4. There is no association between the proportion of their net assets inthe form of restricted funds and auditor attestation of management’sevaluation of internal control.
Governance Hypotheses
Good corporate governance could enhance disclosure quality (i.e., govern-ance characteristics and voluntary disclosure quality can be complements).As discussed later, extant research related to the association betweencorporate audit committees and other monitoring mechanisms supportssuch a perspective. We consider the following audit committee relatedcharacteristics: independence, financial expertise, and diligence (number of
Auditor Attestation of Management’s Evaluation of Internal Control 105
meetings). We examine audit committee characteristics rather than boardcharacteristics because the audit committee has historically been chargedwith oversight of the financial reporting process, including interactions withthe auditor.
Audit Committee IndependenceRegulators and legislators have recently directed attention to improving thefunctioning of audit committees by addressing audit committee composition(e.g., BRC, 1999; SEC, 1999, 2003; SOX, 2002). Such initiatives related toaudit committee composition have concentrated on two issues: indepen-dence and expertise. The composition of audit committees is also importantin the nonprofit sector, particularly given the emphasis on board members’independence and diligence that are the focus of recent legislative efforts toimprove the governance of nonprofit organizations (NCNA, 2004).
Section 301 of SOX reflects legislators’ concerns about audit committeemember independence, and mandates that all members of the audit committeemust be independent. Evidence from prior research suggests that there is apositive association between the presence of independent audit committeemembers and a variety of outcomes related to financial reporting, includingearnings management (Klein, 2002; Bedard, Chtourou, & Courteau, 2004),absence of fraud or restatements (McMullen & Raghunandan, 1996; Beasley,Carcello, Hermanson, & Lapides, 2000; Abbott, Parker, & Peters, 2004), andaudit reports (Carcello & Neal, 2000). We posit that nonprofit boards thathave independent directors would be more likely to voluntarily use the auditorfor attesting on management’s evaluation of internal control. This leads to thefifth hypothesis.
H5. Nonprofits that have independent directors on the audit committeewill be more likely to have auditor attestation of management’sevaluation of internal control.
Audit Committee ExpertiseSection 407 of SOX mandates SEC registrants to disclose whether the auditcommittee has at least one financial expert. Prior research finds thatcorporate audit committees that have at least one member with accountingand finance expertise are (a) more likely to understand auditor judgmentsand be more supportive of auditor judgments (DeZoort, 1998; DeZoort,Hermanson, Archambeault, & Houston, 2003), (b) less likely to have
THOMAS E. VERMEER ET AL.106
financial reporting problems (McMullen & Raghunandan, 1996), and(c) less likely to have suspicious external auditor switches (Archambeault &DeZoort, 2001). DeFond, Hann, and Hu (2005) find that firms that add afinancial expert to their audit committee experience a significant positivestock price reaction. We expect that audit committee members with financialexpertise will be more concerned with the quality of the financial reportingsystem, and will seek to signal the quality of the system by having theauditor attest to management’s evaluation of internal control. This leads tothe sixth hypothesis.
H6. Nonprofits that have financial experts on the audit committee will bemore likely to have auditor attestation of management’s evaluation ofinternal control.
Audit Committee DiligencePrior researchers examining issues related to audit committees have usedthe number of meetings of the committee during a year as a proxy forthe diligence of the committee (DeZoort, Hermanson, Archambeault, &Reed, 2002). Evidence from prior research suggests that more frequentcorporate audit committee meetings are associated with reduced likelihoodof (a) financial reporting problems, fraud, or restatements (McMullen &Raghunandan, 1996; Beasley et al., 2000; Abbott et al., 2004) and(b) suspicious auditor switches (Archambeault & DeZoort, 2001). Weexpect that audit committees that are more diligent will also be more likelyto voluntarily purchase auditor attestation of management’s internal controlevaluation. This leads to the seventh hypothesis.
H7. Audit committee meeting frequency is positively associated withauditor attestation of management’s evaluation of internal control.
Auditor Type Hypothesis
The external auditor provides yet another monitoring mechanism, and thereis a significant amount of literature that suggests that organizations respondto the need for greater monitoring by hiring a Big 4 auditor.10 DeFond andFrancis (2005) noted that different monitoring mechanisms can be viewed assubstitutes rather than complements. If the use of a Big 4 auditor and thevoluntary purchase of auditor attestation services are substitute monitoring
Auditor Attestation of Management’s Evaluation of Internal Control 107
mechanisms, then nonprofits that use a Big 4 auditor would be less likely tovoluntarily purchase auditor attestation of management’s evaluation ofinternal control. However, Big 4 audit partners are reluctant to beassociated with a client not following best practices (Bryan-Low, 2003;Hindo & Sager, 2003). Such reluctance may be related to concerns aboutlitigation risk or the adverse publicity surrounding governance failures.Hence, Big 4 auditors may insist on greater involvement in internal control,including attesting management’s evaluation of internal control. Given theaforementioned competing arguments, we do not make a directionalprediction for relationship between the type of auditor and auditorattestation of management’s evaluation of internal control. This leads tothe eighth hypothesis (in the null form).
H8. Auditor type is not associated with auditor attestation of manage-ment’s evaluation of internal control.
Entity Characteristics Hypothesis
Compared with other nonprofit organizations, hospitals and educationalinstitutions have greater complexity in their governance structures andoperations. For example, most hospitals are involved with the extensive anddifficult regulations of Medicare and Medicaid programs. Similarly,educational institutions deal with extensive regulations related to mostaspects of their accounting, funding, and operations. Thus, we expect theseadditional complexities will cause an increase in the demand for monitoringmechanisms. This leads to the ninth hypothesis.
H9. Nonprofits that are hospitals or universities will be more likely tohave auditor attestation of management’s evaluation of internal control.
Almost all research related to accounting and auditing includes entity sizeas a control variable, and we also include nonprofit size as a variable in ouranalysis. Larger nonprofits are more complex and more likely to be thefocus of attention from the media and the public, so larger organizations aremore apt to incorporate stronger monitoring mechanisms. Conversely,larger organizations are also more likely to have better governance andmonitoring mechanisms (Klein, 2002), suggesting that larger nonprofitswould require less alternative monitoring mechanisms. Hence, we includesize as a control variable in the analysis but do not make a directionalprediction for organizational size.
THOMAS E. VERMEER ET AL.108
MODEL
We use the following model to test our hypotheses:
ATST ¼ b0 þ b1 �GRANT þ b2 � SNGLADþ b3 �RESFND
þ b4 � BONDSþ b5 �ACINDþ b6 �ACFXP
þ b7 �ACMEETþ b8 � BIG4þ b9 �HOSPTL
þ b10 �UNIVþ b11 � SIZE
The variables are defined as follows: ATST equals 1 if the nonprofitvoluntarily has the auditor issuing an attest report on management’sevaluation of internal control, else 0; GRANT equals 1 if nonprofit reportedgovernment grants, else 0;11 SNGLAD equals 1 if nonprofit subject toSingle Audit, else 0;12 RESFND equals ratio of temporarily restrictedplus permanently restricted fund balance to total fund balance; BONDSequals 1 if nonprofit reported tax-exempt bond liabilities, else 0;13
ACIND equals 1 if all members of audit committee are independent,else 0; ACFXP equals proportion of audit committee members that are aCPA or other financial expert; ACMEET equals number of audit committeemeetings per year; BIG4 equals 1 if audited by Big 4 accounting firm, else 0;HOSPTL equals 1 if nonprofit is a hospital, else 0; UNIV equals 1 ifnonprofit is a university or college, else 0; and SIZE equals natural log oftotal revenues.14
DATA
We obtained the names, addresses, and related financial information for the1,000 largest (based on total revenues) nonprofits from GuideStar, Inc.GuideStar collects data on more than 850,000 IRS-recognized nonprofits.GuideStar obtains their financial information from the IRS Forms 990/990EZ and the IRS Business Master Files. For these nonprofits, we mailed aquestionnaire to their CFO. Of the 1,000 largest nonprofits, we receivedinformation from 144 chief financial officers (response rate of 14.4percent).15 Some of the responses had missing data or deleted the controlnumber used in the return envelope. After deleting these respondents, oursample has 126 usable responses. The usable sample includes 66 hospitals,accounting for 52 percent of the observations; universities and collegesconstitute another 24 percent (30 of 126) of the sample. About 53 of the 126
Auditor Attestation of Management’s Evaluation of Internal Control 109
organizations (42 percent) in our sample indicated that they requestedauditor attestation of management’s evaluation of internal control overfinancial reporting.16
We performed two tests to address nonresponse bias. First, we collectedour data in two mailings (July and September of 2004). Thus, we added anearly/late respondent variable to each model but this variable is insignificantin any of the models and has no impact on the results. Second, we alsodetermined whether the sample of 126 respondents in this study differ in anydimension from the other 874 of the largest 1,000 nonprofits. We observedno significant difference between the groups for any of the variablesincluded in this study (p W 0.50 in every instance). These results mitigateconcerns about nonresponse bias.
RESULTS
As noted in Table 1, the mean (median) revenues are $265 ($185) million,while the mean (median) total assets of the sample are $505 million ($227million). The data also indicate that the sample is skewed, so we use thenatural log of revenues in our subsequent analyses. A little more than halfthe sample observations received government grants, while 61 percent of thesample reported tax-exempt bond liabilities. The mean (median) ratio oftemporarily restricted plus permanently restricted fund balance to total fundbalance is 0.14 (0.04). As can be expected from the nature of the sample(selected from the 1,000 largest nonprofit organizations), 82 percent of thesample nonprofits have a Big 4 auditor.
Only one of the correlations exceeds 0.40 (the correlation betweenRESFND and SNGLAD is 0.52), indicating that multicollinearity is not aproblem. This is confirmed by an examination of variation inflation factors,none of which exceeds 2.9.
Table 2 provides the results from univariate tests (t-test for continuousvariables and chi-square test for dichotomous variables) comparing thenonprofit organizations groups with and without an auditor attestation ofmanagement’s evaluation of internal control. The tests suggest thatorganizations with auditor attestation have a higher proportion of theiraudit committee members as financial experts. In addition, organizationswith auditor attestation are less likely to have a Big 4 auditor. However,since the relation between firm characteristics and auditor attestation ofmanagement’s evaluation of internal control is multivariate in nature, theseunivariate results should be interpreted with caution.
THOMAS E. VERMEER ET AL.110
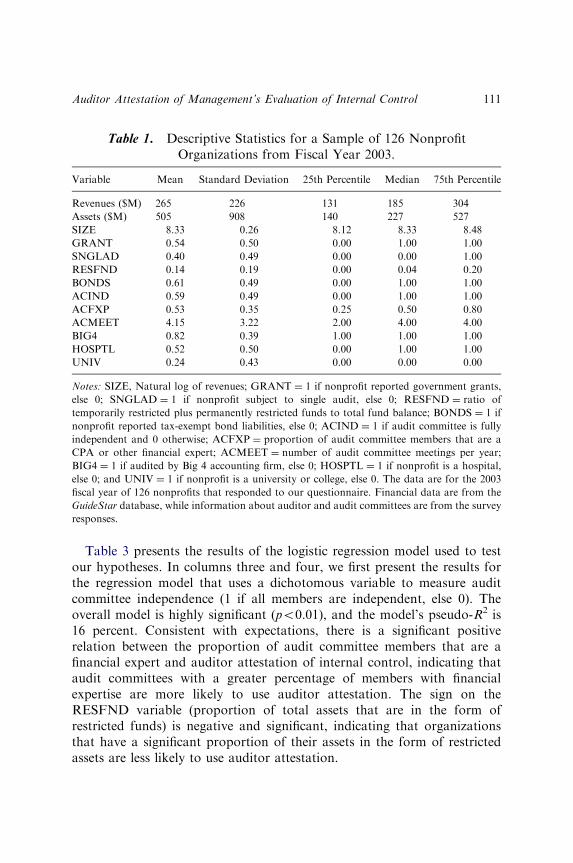
Table 3 presents the results of the logistic regression model used to testour hypotheses. In columns three and four, we first present the results forthe regression model that uses a dichotomous variable to measure auditcommittee independence (1 if all members are independent, else 0). Theoverall model is highly significant (po0.01), and the model’s pseudo-R2 is16 percent. Consistent with expectations, there is a significant positiverelation between the proportion of audit committee members that are afinancial expert and auditor attestation of internal control, indicating thataudit committees with a greater percentage of members with financialexpertise are more likely to use auditor attestation. The sign on theRESFND variable (proportion of total assets that are in the form ofrestricted funds) is negative and significant, indicating that organizationsthat have a significant proportion of their assets in the form of restrictedassets are less likely to use auditor attestation.
Table 1. Descriptive Statistics for a Sample of 126 NonprofitOrganizations from Fiscal Year 2003.
Variable Mean Standard Deviation 25th Percentile Median 75th Percentile
Revenues ($M) 265 226 131 185 304
Assets ($M) 505 908 140 227 527
SIZE 8.33 0.26 8.12 8.33 8.48
GRANT 0.54 0.50 0.00 1.00 1.00
SNGLAD 0.40 0.49 0.00 0.00 1.00
RESFND 0.14 0.19 0.00 0.04 0.20
BONDS 0.61 0.49 0.00 1.00 1.00
ACIND 0.59 0.49 0.00 1.00 1.00
ACFXP 0.53 0.35 0.25 0.50 0.80
ACMEET 4.15 3.22 2.00 4.00 4.00
BIG4 0.82 0.39 1.00 1.00 1.00
HOSPTL 0.52 0.50 0.00 1.00 1.00
UNIV 0.24 0.43 0.00 0.00 0.00
Notes: SIZE, Natural log of revenues; GRANT ¼ 1 if nonprofit reported government grants,
else 0; SNGLAD ¼ 1 if nonprofit subject to single audit, else 0; RESFND ¼ ratio of
temporarily restricted plus permanently restricted funds to total fund balance; BONDS ¼ 1 if
nonprofit reported tax-exempt bond liabilities, else 0; ACIND ¼ 1 if audit committee is fully
independent and 0 otherwise; ACFXP ¼ proportion of audit committee members that are a
CPA or other financial expert; ACMEET ¼ number of audit committee meetings per year;
BIG4 ¼ 1 if audited by Big 4 accounting firm, else 0; HOSPTL ¼ 1 if nonprofit is a hospital,
else 0; and UNIV ¼ 1 if nonprofit is a university or college, else 0. The data are for the 2003
fiscal year of 126 nonprofits that responded to our questionnaire. Financial data are from the
GuideStar database, while information about auditor and audit committees are from the survey
responses.
Auditor Attestation of Management’s Evaluation of Internal Control 111
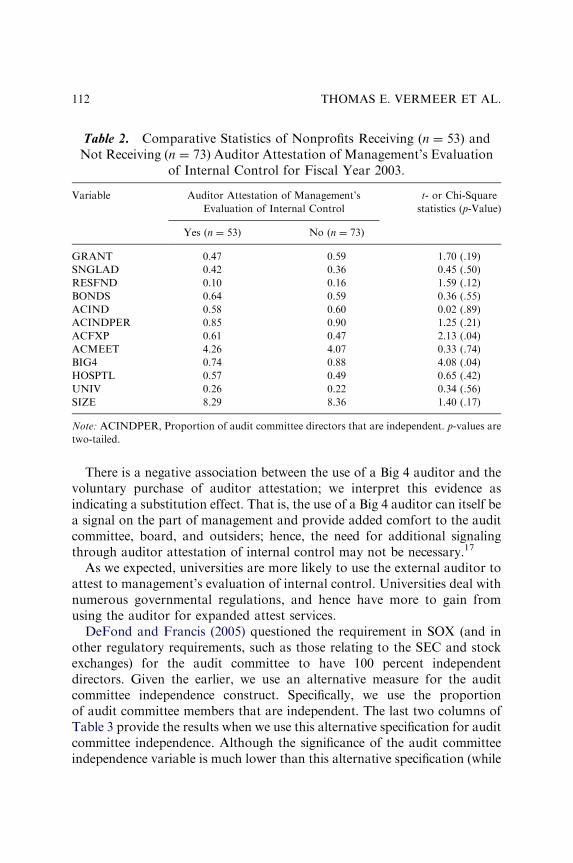
There is a negative association between the use of a Big 4 auditor and thevoluntary purchase of auditor attestation; we interpret this evidence asindicating a substitution effect. That is, the use of a Big 4 auditor can itself bea signal on the part of management and provide added comfort to the auditcommittee, board, and outsiders; hence, the need for additional signalingthrough auditor attestation of internal control may not be necessary.17
As we expected, universities are more likely to use the external auditor toattest to management’s evaluation of internal control. Universities deal withnumerous governmental regulations, and hence have more to gain fromusing the auditor for expanded attest services.
DeFond and Francis (2005) questioned the requirement in SOX (and inother regulatory requirements, such as those relating to the SEC and stockexchanges) for the audit committee to have 100 percent independentdirectors. Given the earlier, we use an alternative measure for the auditcommittee independence construct. Specifically, we use the proportionof audit committee members that are independent. The last two columns ofTable 3 provide the results when we use this alternative specification for auditcommittee independence. Although the significance of the audit committeeindependence variable is much lower than this alternative specification (while
Table 2. Comparative Statistics of Nonprofits Receiving (n ¼ 53) andNot Receiving (n ¼ 73) Auditor Attestation of Management’s Evaluation
of Internal Control for Fiscal Year 2003.
Variable Auditor Attestation of Management’s
Evaluation of Internal Control
t- or Chi-Square
statistics (p-Value)
Yes (n ¼ 53) No (n ¼ 73)
GRANT 0.47 0.59 1.70 (.19)
SNGLAD 0.42 0.36 0.45 (.50)
RESFND 0.10 0.16 1.59 (.12)
BONDS 0.64 0.59 0.36 (.55)
ACIND 0.58 0.60 0.02 (.89)
ACINDPER 0.85 0.90 1.25 (.21)
ACFXP 0.61 0.47 2.13 (.04)
ACMEET 4.26 4.07 0.33 (.74)
BIG4 0.74 0.88 4.08 (.04)
HOSPTL 0.57 0.49 0.65 (.42)
UNIV 0.26 0.22 0.34 (.56)
SIZE 8.29 8.36 1.40 (.17)
Note: ACINDPER, Proportion of audit committee directors that are independent. p-values are
two-tailed.
THOMAS E. VERMEER ET AL.112
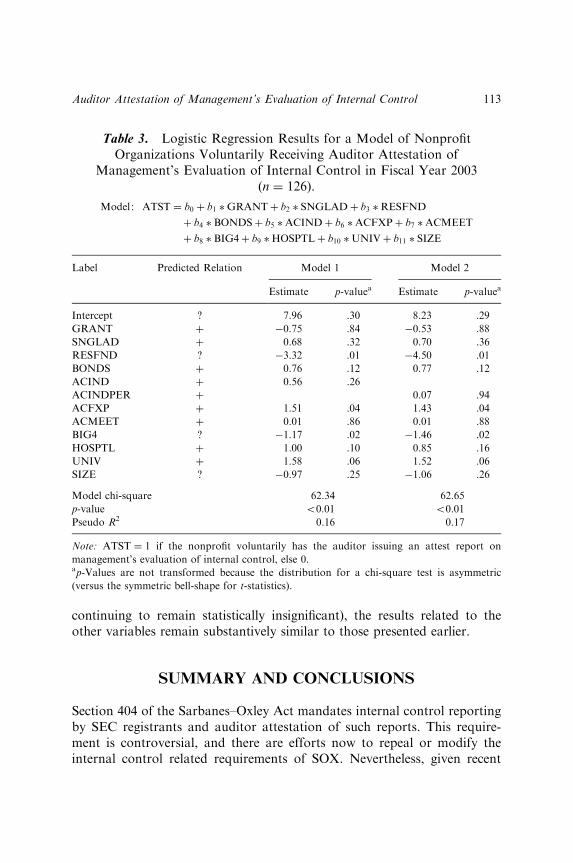
continuing to remain statistically insignificant), the results related to theother variables remain substantively similar to those presented earlier.
SUMMARY AND CONCLUSIONS
Section 404 of the Sarbanes–Oxley Act mandates internal control reportingby SEC registrants and auditor attestation of such reports. This require-ment is controversial, and there are efforts now to repeal or modify theinternal control related requirements of SOX. Nevertheless, given recent
Table 3. Logistic Regression Results for a Model of NonprofitOrganizations Voluntarily Receiving Auditor Attestation of
Management’s Evaluation of Internal Control in Fiscal Year 2003(n ¼ 126).
Model : ATST ¼ b0 þ b1 �GRANTþ b2 � SNGLADþ b3 �RESFND
þ b4 � BONDSþ b5 �ACINDþ b6 �ACFXPþ b7 �ACMEET
þ b8 � BIG4þ b9 �HOSPTLþ b10 �UNIVþ b11 � SIZE
Label Predicted Relation Model 1 Model 2
Estimate p-valuea Estimate p-valuea
Intercept ? 7.96 .30 8.23 .29
GRANT þ �0.75 .84 �0.53 .88
SNGLAD þ 0.68 .32 0.70 .36
RESFND ? �3.32 .01 �4.50 .01
BONDS þ 0.76 .12 0.77 .12
ACIND þ 0.56 .26
ACINDPER þ 0.07 .94
ACFXP þ 1.51 .04 1.43 .04
ACMEET þ 0.01 .86 0.01 .88
BIG4 ? �1.17 .02 �1.46 .02
HOSPTL þ 1.00 .10 0.85 .16
UNIV þ 1.58 .06 1.52 .06
SIZE ? �0.97 .25 �1.06 .26
Model chi-square 62.34 62.65
p-value o0.01 o0.01
Pseudo R2 0.16 0.17
Note: ATST ¼ 1 if the nonprofit voluntarily has the auditor issuing an attest report on
management’s evaluation of internal control, else 0.ap-Values are not transformed because the distribution for a chi-square test is asymmetric
(versus the symmetric bell-shape for t-statistics).
Auditor Attestation of Management’s Evaluation of Internal Control 113
well-publicized governance failures and other abuses at some large non-profits, legislators are considering extending similar requirements to thenonprofit sector (U.S. Senate, 2004; Higgins, 2005; Wells, 2005).
Some nonprofits voluntarily include a management report on internalcontrol and auditor attestation of this report. Given that recent controversiessurrounding the mandatory internal control reporting requirements of SOX,we examine factors associated with the voluntary use of auditor attestationof management’s internal control evaluation by nonprofit organizations.Our data are based on survey responses from 126 chief financial officersand financial data from the Guidestar database. For the nonprofits in oursample, we find that 42 percent indicated that they requested auditorattestation of management’s evaluation of internal control over financialreporting.
We use the resource dependency framework, governance characteristics,auditor type, and entity characteristics to develop our hypotheses related tononprofits’ voluntary use of auditor attestation of management’s report oninternal control. Our multivariate results suggest that the proportion of auditcommittee members that are financial experts and the type of nonprofit arepositively associated with a nonprofit’s voluntary use of auditor attestationof management’s report on internal control. The composition of the fundbalance and the use of a Big 4 auditor are negatively associated with theinclusion of auditor attestation of management’s report on internal control.Thus, the voluntary use of auditor attestation over management’s evaluationof internal control by nonprofit organizations varies depending on resourcedependency and other characteristics of the organization.
Our findings support the position that internal control reporting can beuseful as a voluntary signaling mechanism, and provide useful empiricalevidence in the context of the current debate related to the mandatoryinternal control requirements under SOX as well as similar legislation underconsideration for nonprofits. Our results also add to the growing stream ofresearch related to voluntary disclosures by organizations.
The findings of this chapter are subject to certain limitations. As withmost survey-based studies, our results may be impacted by nonresponsebias. However, we did not find any difference between early and laterespondents and did not observe any significant differences between therespondents and nonrespondents for any of the variables examined in thisstudy. Further, the results of this study are based on a survey of 126 of the1,000 largest nonprofits in the United States; our findings may not extend tosmaller nonprofits, or nonprofits in other countries. Future research should
THOMAS E. VERMEER ET AL.114
examine if similar results are obtained for smaller nonprofits or fornonprofits in other countries.
NOTES
1. Accelerated filers, defined as a U.S. company with equity market capitaliza-tion over $75 million and has filed at least one annual report with the SEC, mustcomply with Section 404 for the first fiscal year ending on or after November 15,2004. All others must comply with Section 404 for its first fiscal year ending on orafter July 15, 2007 (SEC, 2004a, 2005c, 2005d).
2. Nonprofit organizations account for (a) 5.8 percent of all organizationsin the country, (b) 6.7 percent of national income, and (c) 7.1 percent ofthe workforce (Independent Sector, 2002). The data are for 1998. Comparabledata for later years are not available in the 2002 (latest) version of the NonprofitAlmanac.
3. Vermeer, Raghunandan, and Forgione (2006) examine the composition ofnonprofit audit committees and factors associated with their composition.
4. Beginning in 1993, insured depository institutions with $500 million or morein total assets are required by the FDIC to report on internal control over financialreporting and to obtain auditor attestation of those reports.
5. The two exceptions are the provisions relating to document destruction andwhistle-blower protection.
6. See, for example, Lang and Lundholm (1993), Frankel, McNichols, andWilson (1995), Botosan (1997), and Healy, Hutton, and Palepu (1999).
7. The requirements of Circular A-133 are applicable only for federal grants. Incontrast, our data include grants from federal, state and local governments. Thethreshold increases to $500,000 for fiscal years after December 31, 2003.
8. It is important to recognize that reporting on internal control under the SingleAudit Act does not include issuing an opinion on management’s evaluation ofinternal controls (OMB, 1997).
9. Donors may also be concerned with nonprofits that fail to use their donatedassets and accumulate the funds (Chang & Tuckman, 1990).10. See, for example, Francis and Wilson (1988) and DeFond (1992). We use the
phrase Big 4 for expositional convenience, since evidence from prior researchprimarily relates to the period when the firms were known as the Big 8.11. From discussions with certain nonprofits, we include a dichotomous measure
since the amount of grants can differ significantly from year to year. Thus, using acontinuous measure of grants would be less appropriate if the nonprofit had eitherreceived (or, expected to receive) significant governmental grants in the recent past(near future). As expected, the results with this alternative measure (i.e., continuousmeasure for the grant variable) were less significant.12. SNGLAD is a subset of the GRANT variable and we obtain substantially
similar results if either of these variables is omitted.13. We get substantively similar results if we use the ratio of bonds outstanding to
total assets.
Auditor Attestation of Management’s Evaluation of Internal Control 115
14. Results related to our hypotheses are similar if we use log of total assets as themeasure of size.15. DeZoort et al. (2003) mentioned the problems in obtaining responses from
high-ranking corporate officials, and suggested that response rates around 15 percentare reasonable.16. It is possible that some nonprofits have a management report on internal
control without having auditor attestation of such a report. However, the usefulnessof such unattested reports is questionable. In our questionnaire, we did not ask ifthe organization had a management report on internal control without auditorattestation.17. Such a substitution effect is more plausible in the relatively less-litigious
environment of nonprofits. In the context of for-profit public companies, the supplyside incentives related to the auditor may be higher leading to a positive associationbetween the use of a Big 4 auditor and auditor attestation of internal control.
REFERENCES
Abbott, L., Parker, S., & Peters, G. (2004). Audit committee characteristics and restatements:
A study of the efficacy of certain Blue Ribbon Committee recommendations. Auditing:
A Journal of Practice & Theory, 23(March), 69–87.
Anheier, H. K., Toepler, S., & Sokolowski, S. (1997). The implications of government funding
of non-profit organizations: Three propositions. International Journal of Public Sector
Management, (June), 190–213.
Archambeault, D., & DeZoort, F. T. (2001). Auditor opinion shopping and the audit
committee: An analysis of suspicious auditor switches. International Journal of Auditing,
5(March), 33–52.
Beasley, M. S., Carcello, J. V., Hermanson, D. R., & Lapides, P. D. (2000). Fraudulent financial
reporting: Consideration of industry traits and corporate governance mechanisms.
Accounting Horizons, 14(December), 441–454.
Bedard, J., Chtourou, S. M., & Courteau, L. (2004). The effect of audit committee expertise,
independence, and activity on aggressive earnings management. Auditing: A Journal of
Practice & Theory, 23(2), 13–35.
Blue Ribbon Committee (BRC). (1999). Report of the Blue Ribbon Committee on improving the
effectiveness of corporate audit committees. New York Stock Exchange and National
Association of Securities Dealers.
Botosan, C. A. (1997). Disclosure level and the cost of equity capital. The Accounting Review,
72(July), 323–350.
Bryan-Low, C. (2003). Accounting firms aim to dispel cloud of corporate fraud. Wall Street
Journal, (May 27), p. C1.
Carcello, J. V., & Neal, T. L. (2000). Audit committee composition and auditor reporting. The
Accounting Review, 75(October), 453–467.
Chang, C., & Tuckman, H. (1990). Why do nonprofit managers accumulate surpluses, and how
much do they accumulate? Nonprofit Management and Leadership, (2), 117–135.
Chaves, M., Stephens, L., & Galaskiewicz, J. (2004). Does government funding suppress
nonprofits’ political activity? American Sociological Review, (April), 292–316.
THOMAS E. VERMEER ET AL.116
Chow, C. W. (1982). The demand for external auditing: Size, debt, and ownership influences.
The Accounting Review, 57(April), 272–291.
Commission on Auditors’ Responsibilities (Cohen Commission). (1978). Report of the
commission on auditors’ responsibilities. New York, NY: AICPA.
DeFond, M. (1992). The association between changes in client firm agency costs and auditor
switching. Auditing: A Journal of Practice and Theory, (Spring), 16–31.
DeFond, M., & Francis, J. R. (2005). Audit research after Sarbanes–Oxley. Auditing: A Journal
of Practice and Theory, 24(Supplement), 5–30.
DeFond, M., Hann, R. N., & Hu, X. (2005). Does the market value financial expertise on audit
committees of boards of directors? Journal of Accounting Research, 43(May), 153–193.
DeZoort, T. (1998). An analysis of experience effects on audit committee members’ judgments.
Accounting, Organizations & Society, (January), 1–22.
DeZoort, T., Hermanson, D. R., Archambeault, D., & Reed, S. (2002). Audit committee
effectiveness: A synthesis of the empirical audit committee literature. Journal of
Accounting Literature, 21, 38–75.
DeZoort, T., Hermanson, D. R., & Houston, R. W. (2003). Audit committee support for
auditors: The effects of materiality justification and accounting precision. Journal of
Accounting and Public Policy, 22(2), 175–199.
Francis, J. R., & Wilson, E. R. (1988). Auditor changes: A joint test of theories relating to
agency costs and auditor differentiation. The Accounting Review, (October), 663–682.
Frankel, R., McNichols, M., & Wilson, G. P. (1995). Discretionary disclosure and external
financing. The Accounting Review, 70(January), 135–150.
Froelich, K. A. (1999). Diversification of revenue strategies: Evolving resource dependence in
nonprofit organizations. Nonprofit and Voluntary Sector Quarterly, 28, 246–268.
Gronbjerg, KA. (1993). Understanding nonprofit funding: Managing revenues in social services
and community development organizations. San Francisco, CA: Jossey-Bass.
Healy, P. M., Hutton, A. P., & Palepu, K. G. (1999). Stock performance and intermediation
changes surrounding sustained increases in disclosure. Contemporary Accounting
Research, 16(Fall), 485–520.
Healy, P. M., & Palepu, K. G. (2001). Information asymmetry, corporate disclosure, and the
capital markets: A review of the empirical disclosure literature. Journal of Accounting
and Economics, 31(September), 405–440.
Hempel, J., & Borrus, A. (2004). Now the nonprofits need cleaning up: Cozy boardrooms at
colleges and charities face increasing government scrutiny. Business Week, June 21.
Higgins, H. R. (2005). Death by bureaucracy. Wall Street Journal, (April 4), p. A15.
Hillman, A. J., & Dalziel, T. (2003). Boards of directors and firm performance: Integrating
agency and resource dependence perspectives. Academy of Management Review, (23),
383–396.
Hindo, B., & Sager, I. (2003). Audit clients get the heave-ho. Business Week, (December 1), p. 7.
Independent Sector. (2002). Nonprofit almanac and desk reference. Washington, DC:
Independent Sector.
Jensen, M., & Meckling, W. (1976). Theory of the firm: Managerial behavior, agency costs and
ownership structure. Journal of Financial Economics, 3, 305–360.
Klein, A. (2002). Economic determinants of audit committee independence. The Accounting
Review, (April), 435–452.
Lang, M., & Lundholm, R. (1993). Cross-sectional determinants of analyst ratings of corporate
disclosure. Journal of Accounting Research, 31(Autumn), 246–271.
Auditor Attestation of Management’s Evaluation of Internal Control 117
McCarthy, J. (2003). Sarbanes–Oxley: How will it affect nonprofits and higher education
institutions? New York, NY: PricewaterhouseCoopers.
McMullen, D., & Raghunandan, K. (1996). Audit committees and financial reporting problems.
Journal of Accountancy, (August), 79–81.
Miller-Millesen, J. L. (2003). Understanding the behavior of nonprofit boards of directors: A
theory-based approach. Nonprofit and Voluntary Sector Quarterly, (December), 521–547.
National Commission on Fraudulent Financial Reporting (Treadway Commission). (1987).
Report of the national commission on fraudulent financial reporting. NewYork, NY: AICPA.
National Council of Nonprofit Associations (NCNA). (2004). State corporate governance
proposals and bills: 2004. Washington, DC: NCNA.
Office of Management and Budget (OMB). (1997). Circular A-133: Audits of states, local
governments and non-profit organizations. Washington, DC: OMB.
Peng, T., & Kellogg, J. L. (2003). Partners, resources, and management mechanisms of
interorganizational collaborative ties in non-profit organizations. Journal of American
Academy of Business, (September), 291–298.
Pfeffer, J., & Salancik, G. (1978). The external control of organizations: A resource dependence
perspective. New York, NY: Harper and Row.
Salmon, J. L. (2002). Nonprofits show losses in the public’s trust: Surveys find changes since
terror attacks. The Washington Post, (September 9), p. A02.
Sarbanes–Oxley Act (SOX). (2002). Public Law No. 107–204. Washington, DC: GPO.
Securities and Exchange Commission (SEC). (1999). Audit committee disclosure. Release No.
34-42266. Washington, DC: GPO.
Securities and Exchange Commission (SEC). (2003). Final rule: Standards related to listed
company audit committees. SEC Release Nos. Nos. 33-8330; 34-47654. Washington,
DC: GPO.
Securities and Exchange Commission (SEC). (2004a). Management’s report on internal control
over financial reporting and certification of disclosure in exchange act periodic reports. SEC
Release No. 33-8392. Washington, DC: GPO.
Securities and Exchange Commission (SEC). (2004b). Temporary postponement of the final
phase-in period for acceleration of periodic report filing dates. SEC Release No. 33-8507.
Washington, DC: GPO.
Securities and Exchange Commission (SEC). (2004c). Order under Section 36 of the securities
exchange act of 1934 granting an exemption from specified provisions of exchange Rules
13a-1 and 15d-1. SEC Release No. 34-50754. Washington, DC: GPO.
Securities and Exchange Commission (SEC). (2004d). SEC establishes advisory committee to
examine impact of Sarbanes–Oxley Act on smaller public companies. SEC Press Release
No. 2004-174. Washington, DC: GPO.
Securities and Exchange Commission (SEC). (2005a). Commission announces roundtable
on internal control reporting requirements. SEC Press Release No. 2005-13. Washington,
DC: GPO.
Securities and Exchange Commission (SEC). (2005b). Commission seeks feedback and announces
date of roundtable on implementation of Sarbanes–Oxley internal control provisions. SEC
Press Release No. 2005-20. Washington, DC: GPO.
Securities and Exchange Commission (SEC). (2005c). Management’s report on internal control
over financial reporting and certification of disclosures in exchange act periodic reports of
non-accelerated filers and foreign private issuers. SEC Release No. 33-8545. Washington,
DC: GPO.
THOMAS E. VERMEER ET AL.118
Securities and Exchange Commission (SEC). (2005d).Management’s report on internal control over
financial reporting and certification of disclosure in exchange act periodic reports of
companies that are not accelerated filers. SEC Release No. 33-8618. Washington, DC: GPO.
Smith, S. R., & Lipsky, M. (1993).Nonprofits for hire: The welfare state in the age of contracting.
Cambridge, MA: Harvard University Press.
Solomon, D. (2005). SEC to host talks on contentious rule. Wall Street Journal, (February 8),
p. A3.
Technical Assistance for Community Services (TACS). (2004). Nonprofit questions and
answers. Available at http://www.tacs.org/qa/qa.asp?tpID ¼ 23
Tieman, J. (2003). Not-for-profits are likely to adopt new fiscal rules. Modern Health-
care, (June 2), 6.
U.S. Senate. (2004). Exempt status reforms: Staff discussion draft. Senate Finance Committee.
Washington, DC: U.S. Senate.
Vermeer, T. E., Raghunandan, K., & Forgione, D. A. (2006). The composition of nonprofit
audit committees. Accounting Horizons, 20(March), 75–90.
Wall Street Journal. (2005). Bids and offers, March 11, p. C4.
Wells, R. (2005). Senate hearing probes tax abuse by charity groups. Wall Street Journal,
(April 6), p. D2.
Auditor Attestation of Management’s Evaluation of Internal Control 119

This page intentionally left blank
HOSPITAL PERFORMANCE
SURROUNDING THE BOND
RATING REVISION EVENT
Kreag Danvers
ABSTRACT
I investigate managerial responses to hospital bond rating revisions byscrutinizing the consistency of performance measures across pre- to post-revision intervals. Multinomial logistic regression results for a nationalsample of nonprofit hospitals reveal that downgraded hospital managersinitiate preemptive profitability improvements, and post hoc liquidityincreases, to signal short-term credit stability. However, managers do notfavorably change other measures, such as those relating to efficiency andcapacity costs, to support long-term solvency. Policy implications arisefrom a managerial focus on short-term responses, which may not avertfuture increases in hospitals’ cost of capital, or decreases in accessibilityof debt financing. Upgraded hospitals, however, report sharply decreasingpost-revision profitability. These findings caution rating analysts andbondholders to closely monitor pre- to post-revision performance of ratingupgrades, which may not reflect analyst performance expectations.
Research in Governmental and Nonprofit Accounting, Volume 12, 121–168
Copyright r 2009 by Emerald Group Publishing Limited
All rights of reproduction in any form reserved
ISSN: 0884-0741/doi:10.1108/S0884-0741(2009)0000012008
121
1. INTRODUCTION
I examine changes in hospital performance across pre- to post-revisionintervals and document managerial responses to the bond rating revisionevent. Pre-revision analyses provide insight regarding factors that aredifferentially associated with the likelihood of upward and downward creditrevisions by rating analysts, as well as a context for examining post-revisionchanges. More significantly, I investigate organizational responses to therevision event by examining the extent to which managers change financialand operating characteristics in the periods proximate to the event.
Restricted access to equity financing motivates nonprofit hospitals toissue rated revenue bonds. A revenue bond is a particular type of municipalbond that nonprofit hospitals issue for project financing, whereby the bondissuer pledges to bondholders the revenues generated by the project. Sincenonprofit hospitals comprise approximately 85 percent of the 5,000hospitals in the United States, they represent a significant industry segment(Healthcare Financial Management Association, 2001). In fact, Pallarito(1999) recently noted that the nonprofit health care sector issued a record$32.6 billion in tax-exempt bonds during 1998.
Within an unstable health care environment the cost and availability ofcapital are important strategic considerations for hospital managers (Beith& Goldreich, 2000). Indeed, Wheeler, Smith, Rivenson, and Reiter (2000)found in a series of interviews that almost all nonprofit hospital chieffinancial officers consider a high bond rating crucial to their capitalstructure policies. Moreover, tax subsidies make revenue bonds the leastcostly source of capital for these hospitals (Payne, 1995). Thus, relative tofor-profit organizations, access to debt financing is more critical to nonprofithospitals, which causes the industry to be highly sensitive to initial bondratings and subsequent revisions.
Some consequences of bond rating revisions include changes to hospitals’cost of capital and their ability to obtain debt financing in capital markets.Thus a good credit rating often represents the difference between obtaininglower-cost financing in the public capital market, more expensive private-placement financing, or possibly no debt financing at all (Picker, 1991). Interms of economic importance, the cost of a downgrade for a typical revenuebond issuer may include millions of dollars in extra interest expense as wellas higher debt-service reserve requirements (Palm, 1988).
To illustrate, a 30-year, $30 million bond issue with an ‘‘A’’ rating willtypically yield about 75 basis points less than a similar one with a ‘‘BBB-’’rating, which costs almost $6 million more over the bond amortization.
KREAG DANVERS122
Applying this 75 basis point differential to the average long-term debtoutstanding for this study’s sample (long-term debt averages $49 and $87million for downgrades and upgrades, respectively), the costs (benefits)for a downgraded (upgraded) hospital ranges from $367,500 to $652,500annually.
Since many nonprofit hospitals achieve fairly low profitability levels, adifferential interest cost of this magnitude could mean the differencebetween profit and loss. In addition, debt-service reserve funds that oftenequal 1 year of debt service would be greater for a lower-rated bond, andportfolio managers may be prohibited from holding speculative grade bonds(Palm, 1988).
In addition, credit ratings are used as an executive labor market signalsabout management quality and can affect compensation, both of whichstrengthen the incentives for managers to secure better ratings. For example,Williams (2005) discussed how a hospital administrator’s leadership wascritical to Littleton Regional Hospital’s (New Hampshire) financial recoveryand credit rating. Wyatt-Johnson and Bennett (2004) also observed thatmanagerial compensation within nonprofit health systems is converging tothe for-profit sector, with 90 percent of major medical center CEOs receivingsome form of incentive compensation. Such factors provide managers withstrong incentives to respond to rating revisions.
While managerial responses to the revision event have not been examinedfor either corporate or nonprofit entities, the unique nonprofit hospitalsector presents an optimal research setting to examine this issue. Policyimplications relate to the ability of nonprofit hospitals to maintain financialstability and capital market access, and that creditworthiness should beevaluated across a broad time frame – at least 3 years or more before andafter a rating revision. My findings also suggest that implementingmandatory nonfinancial performance measure reporting, such as forhospital quality, would enhance performance evaluation, thus improvingbond market efficiency.
I examine managerial responses by scrutinizing the consistency offinancial and nonfinancial performance measures across pre- to post-revision intervals. My analysis considers the interactions of analystexpectations, rating revision actions as well as responses to such actions.Managers of downgraded hospitals are expected to change financial andoperating characteristics in response to, or in anticipation of, downwardrating revisions to signal credit stability, and to preserve compensationlevels. Likely organizational responses include improvements to controllableperformance dimensions, such as profitability and liquidity. For example,
Hospital Performance Surrounding the Bond Rating Revision Event 123
Greater Southeast Healthcare System in Washington, DC, announced a lay-off of 250 employees to reduce operating costs in the same week that a bondrating agency lowered its rating (Gardner, 1998).
Conversely, opportunistic managers are likely to seek rating upgrades toobtain a lower cost of capital to increase facility size and enhance theircompensation. In this case, profitability performance for upgraded hospitalscould deteriorate across subperiods as pre-upgrade profitability is max-imized. Thus the revision event motivates managers to change performancemeasures to achieve low-cost financing, maintain capital market access, andincrease compensation levels.
Multinomial logistic regression results for a national sample of nonprofithospitals are consistent with these expectations. Specifically, results indicatefavorable changes to profitability and liquidity in downgraded hospitals,but unfavorable profitability changes in upgraded hospitals, relative to no-change control groups. For downgraded hospitals, decreases in staffingalso suggest quality deterioration that could have negative long-termfinancial solvency implications. Observable declines in profitability forupgraded hospitals caution rating analysts to closely monitor the sub-sequent performance of upgrades to ensure consistency with expectations.These results show that managers can respond either in anticipation of, or inresponse to, this important nonregulatory event.
The remaining sections are organized as follows. Section 2 presents priorresearch and motivation. Section 3 describes the research method, revisionprocess, hypotheses, and sample selection. Section 4 presents models andtests, and Section 5 discusses results along with a sensitivity analysis. Section6 summarizes the findings and provides concluding remarks.
2. PRIOR RESEARCH AND MOTIVATION
2.1. Bond Ratings and Accounting Information
Studies examine the relationships of bond rating changes to either accountinginformation or market reactions in municipal and corporate settings (e.g.,Raman, 1981; Copeland & Ingram, 1982; Ingram, Raman, & Wilson, 1989;Green, 1990). McCue, Renn, and Pillari (1990) studied hospital bond ratingchanges and found that pre-downgrade utilization and liquidity areassociated with different types of downgrades. In addition, Danvers (2003)examined rating agency’s explanations that accompany changes in credit
KREAG DANVERS124
ratings for nonprofit hospitals and finds significant differences in agency-citedperformance dimensions, such as profitability, liquidity, service-mix, capitalstructure, and market share, across upward and downward revisions.
In their study of hospital performance, Zeller, Stanko, and Cleverley(1996) identified seven key financial performance factors, which include:(1) profitability, (2) fixed asset efficiency, (3) capital structure, (4) fixed assetage, (5) working capital efficiency, (6) liquidity, and (7) debt coverage.Watkins’ extension of Zeller et al. (1996) focused on certain nonfinancialmeasures (e.g., utilization and capital efficiency) that are not routinelyreported in financial statements but have incremental value in explainingbond rating levels. Such findings are consistent with other studies thatsuggest hospital financial disclosures are deficient and call for improvedreporting of nonfinancial information.
Deficiencies in financial reporting within the nonprofit hospital sectormostly focus on untimely reporting, inadequate disclosure, and notreporting relevant nonfinancial items, rather than a lack of financialreporting, per se. Indeed, Pallarito (1998) stated that hospitals are veryreluctant to voluntarily disclose information, notwithstanding incentives forgreater disclosure.
Moreover, Sengupta (1998) found that corporate firms with higher-quality financial disclosure experience lower effective bond interest costs,which is accentuated with increasing uncertainty about the firm’s prospects.Since nonprofit hospitals operate with a high degree of uncertainty due toongoing changes in third-party payment mechanisms, the cost of externalfinancing for nonprofit hospitals might be mitigated through more completefinancial disclosure, particularly with regard to relevant, nonfinancialoperating information.
2.2. Managerial Responses to External Events
Relevant research also examines hospital responses to governmental eventssuch as state or federal regulatory changes (e.g., Soderstrom, 1993; Barniv,Danvers, & Healy, 2000; Lynch, 2003). These studies generally find thathospital managers respond to external events through modifying operatingand financial characteristics. Although a bond rating revision is nonregu-latory in nature, it is nonetheless an important external event that canimpose significant costs on hospitals and induce hospital responses. Suchresponses are expected to be most clearly detectable for hospitals with creditrating downgrades.
Hospital Performance Surrounding the Bond Rating Revision Event 125
2.2.1. Benchmarking and Rating DowngradesRelatively few articles relate to management’s sensitivity to voluntary orinvoluntary benchmarking. Most notably, Evans, Hwang, Nagarajan, andShastri (1997) document responses by Pennsylvania hospitals to involuntarybenchmarking. They find that state-mandated hospital disclosures ofperformance information induce poorly performing hospitals to improvewithin 2 years subsequent to the disclosure requirement. In an analogousmanner, rating agencies effectively create a benchmarking scheme when theyevaluate the relative credit risk of bond issues and render revision decisions.Indeed, Standard & Poor’s Creditweek – Public Finance Criteria (1997)emphasized that management factors are a key area wherein the agencyassesses the team’s ability to effectively monitor and control resourcesthrough effective budgeting, cash management, and credit policies.
Ratings and related revisions thus represent a type of voluntarybenchmarking sought by the bond issuer and organizational responsesshould be expected. For example, Wallace (1986) discovered that decisionsby municipalities to initially contract for an audit reflect the unit leader’sdesire to improve the bond rating. In addition, Fisher and Fisher (1993)examine the association between auditor switching and bond rating changesand suggest that management is sensitive to changes in bond ratings.
Through the rating benchmarking scheme, credit agencies perform amonitoring function, which spurs management initiatives to enhanceoperational effectiveness (Wakeman, 1990). In the case of rating down-grades, organizations can signal credit stability by improving closelymonitored performance dimensions, such as profitability and liquidity.Finally, hospital managers may decrease length-of-stay, which Evans,Hwang, and Nagarajan (2001) identified as a significant determinant ofhospital costs, to convey cost-effective behavior.
2.3. Opportunism and Rating Upgrades
Conversely, managers may actively seek rating upgrades to reduce the costof capital and ensure financing for future capital projects that can positivelyaffect managerial recognition and compensation. Managers are alsomotivated to attain specific earnings thresholds, such as generating positiveprofits, sustaining recent performance, and meeting analyst expectationsbecause financial statement users, including rating agencies, promote the useof performance thresholds (Degeorge, Patel, & Zeckhauser, 1999). Suchmotivations may also induce earnings management behavior by managers.
KREAG DANVERS126
Both bond rating upgrades and higher stock prices in for-profit corpora-tions effectively reduce the cost of external financing and create incentivesfor managers to be opportunistic. For example, Erickson and Wang (1999)found that acquiring firms overstate earnings immediately before a stockswap announcement to reduce the cost of buying a target firm. In addition,Loughran and Ritter (1995) found that market returns for initial public offe-rings and seasoned equity offerings decline subsequent to the offering event.
Louis (2004) explained acquiring firms’ post-merger underperformancethrough identifying post-merger reversals, within 1 year after mergerannouncement, of pre-merger earnings management. Finally, Jain and Kini(1994) observed significant declines in profitability, along with increases incapital expenditures that are likely a result of issuers’ investments of IPOproceeds, during post-initial-public-offering (post-IPO) subperiods. Possibleexplanations for post-IPO profitability deterioration include managerialincentives to invest in nonvalue maximizing projects and increase perquisiteconsumption, as well as managerial window-dressing of financial statementsbefore going public. Similarly, Loughran and Ritter (1997) found thatreturn on assets for firms conducting seasoned equity offerings (SEOs) peaksat the time of offering, but decreases by one-half within 4 years of theoffering, relative to a matched control group of nonissuers.
2.4. Managerial Compensation Arrangements
Through maintaining, or improving, access to external financing, hospitalmanagers can increase their organization’s size, which is positively associatedwith management compensation (Pink & Leatt, 1991). Moreover, Eldenburgand Krishnan (2003) found a positive relationship between hospitalprofitability and CEO compensation, which is consistent with Brickley andVan Horn (2002) who identified significant associations between profitabilityand CEO compensation, as well as turnover, in nonprofit hospitals.
Such linkages between profitability performance and managerial compensa-tion also create incentives to manage earnings through the use of discretionaryaccruals (Eldenburg & Vines, 2004). Managers may seek rating upgradesthrough pre-upgrade earnings management, or window-dressing. Indeed,Robbins, Turpin, and Polinsky (1993) found that the existence of managementcompensation plans in nonprofit hospitals is positively associated withincome-increasing accounting choices. Such managerial actions to manipulateearnings to achieve a rating upgrade, or misallocate resources by consum-ing perquisites, would result in post-upgrade performance declines. Indeed,
Hospital Performance Surrounding the Bond Rating Revision Event 127
Forgione (1999) indicated that external monitoring provides strong incentivesto nonprofit managers to behave similar to for-profit managers.
In sum, prior research examines corporate and municipal rating changes,hospital financial disclosure, and responses to state or federal governmentregulations, including involuntary benchmarking schemes. Further studiesidentify relatively strong pre-IPO and pre-SEO operating performance,but weaker post-transaction performance. In addition, managers in bothnonprofit and for-profit organizations are similarly concerned with minimi-zing the cost of capital and managing financial performance, particularlyprofitability, to maximize compensation.
I examine the extent to which managers change financial and nonfinancialcharacteristics during periods surrounding bond rating revisions. Responsesto this important event should be most evident within the nonprofit hospitalindustry, where bond issuance is the primary source of external financing.The significant implications associated with revision actions for nonprofitorganizations are relevant to creditors, bondholders, rating agencies,managers, policymakers, and scholars.
3. RESEARCH METHOD
3.1. Rating Revision Process
3.1.1. Standard and Poor’s Rating SurveillanceStandard and Poor (S&P) performs two levels of ratings review within itssurveillance process that could lead to a rating action. First, S&P conductsan annual ‘‘financial’’ review for all ratings, which primarily relies uponaudited financial statements and supplemental operational information(Standard & Poor’s Creditweek – Public Finance Criteria, 1997). While thefirst-level, financial review is cursory and focuses on ‘‘red flag’’ items, it maybe sufficient for S&P to affirm a rating.
Discussions with an S&P health care analyst reveal a limited number of‘‘red flag’’ variables, which include operating income, cash levels, admissions(volume), and organizational changes. The rating agency’s request forsupplemental information also implies that current financial statementdisclosure is inadequate, as indicated in Section 2. For example, informationitems not routinely disclosed in financial statements include nonfinancialaccounting information such as productivity measures (e.g., FTEs peradjusted occupied bed), utilization statistics, payer-mix information, case-mix index, and significant operational changes.
KREAG DANVERS128
Although primary market analysts participate in surveillance activities,secondary-market analysts perform the majority of surveillance reviews. Afairly small number of rating analysts cover a wide range of bond ratings asthere are approximately 24 analysts in the secondary market surveillancesection who monitor more than 13,000 municipal issues in the PublicFinance Department. This equates to an average surveillance of more than500 issues per analyst (Standard & Poor’s Creditweek – Viewpoint onSecondary Markets, 1996).
Indications of credit risk changes revealed during the financial reviewmay trigger a second-level, ‘‘comprehensive’’ review through which S&Pconducts further inquiry to determine whether a rating revision is appro-priate. The comprehensive review may also occur periodically based onindustry sector and bond rating level. For instance, health care issues thatare rated Aþ or higher are likely to receive a comprehensive review every 3years, while for securities rated BBB or lower a comprehensive review issupposed to occur annually (Standard & Poor’s Creditweek – Public FinanceCriteria, 1997).
Beyond the information used in a financial review, a comprehensivereview includes additional financial analyses, evaluation of and commu-nication with management, and consideration of economic factors.Additionally, the review process reflects other variables such as marketinterest and visibility along with sector trends, debt amount, and materialevents (Standard & Poor’s Creditweek – Public Finance Criteria, 1997).Possible outcomes of the comprehensive review include affirmation ofthe current rating, a change in rating, or placement of the rated debton the S&P Creditwatch listing. The issuer is also permitted to undertake anappeal before revision; however, this appeal process is not further addressedhere.
The annual review process may result in approximately 5 percent of allmunicipal securities receiving a rating revision in any given year (Standard &Poor’s Creditweek – Public Finance Criteria, 1997). This estimate relates toS&P rating changes during the 5-year period 1991–1996. A typical timetablefor the annual review process is graphically depicted in Fig. 1. As shown,there is an initial lag of approximately 3–4 months following fiscal year-endfor the issuer’s independent audit to be completed. An additional monthlapses for the rating agency to receive audited financial and otherinformation. Finally, a few more weeks are required to perform a first-leveland, if necessary, a second-level review before affirming or revising the rating.
In sum, an analyst’s review is driven by the annual reporting cycle and iscompleted somewhere between 22 and 28 weeks following fiscal year-end.
Hospital Performance Surrounding the Bond Rating Revision Event 129
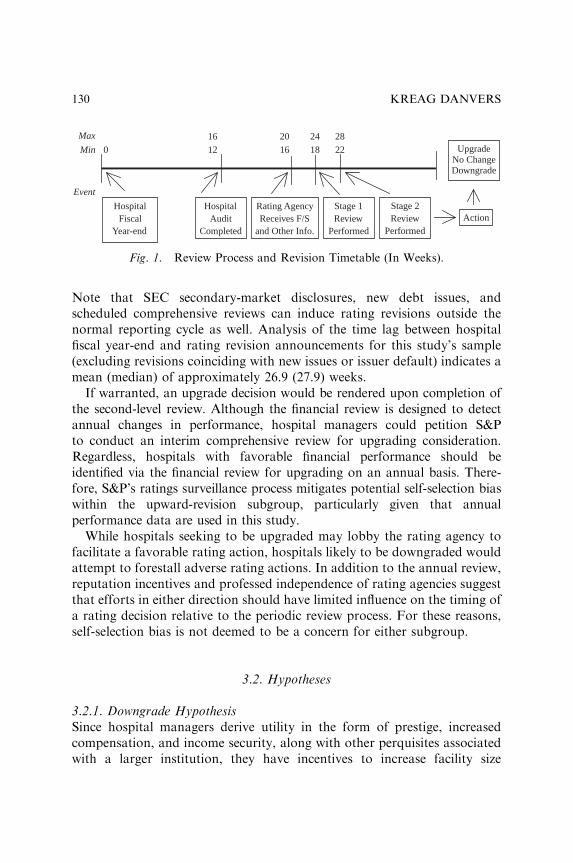
Note that SEC secondary-market disclosures, new debt issues, andscheduled comprehensive reviews can induce rating revisions outside thenormal reporting cycle as well. Analysis of the time lag between hospitalfiscal year-end and rating revision announcements for this study’s sample(excluding revisions coinciding with new issues or issuer default) indicates amean (median) of approximately 26.9 (27.9) weeks.
If warranted, an upgrade decision would be rendered upon completion ofthe second-level review. Although the financial review is designed to detectannual changes in performance, hospital managers could petition S&Pto conduct an interim comprehensive review for upgrading consideration.Regardless, hospitals with favorable financial performance should beidentified via the financial review for upgrading on an annual basis. There-fore, S&P’s ratings surveillance process mitigates potential self-selection biaswithin the upward-revision subgroup, particularly given that annualperformance data are used in this study.
While hospitals seeking to be upgraded may lobby the rating agency tofacilitate a favorable rating action, hospitals likely to be downgraded wouldattempt to forestall adverse rating actions. In addition to the annual review,reputation incentives and professed independence of rating agencies suggestthat efforts in either direction should have limited influence on the timing ofa rating decision relative to the periodic review process. For these reasons,self-selection bias is not deemed to be a concern for either subgroup.
3.2. Hypotheses
3.2.1. Downgrade HypothesisSince hospital managers derive utility in the form of prestige, increasedcompensation, and income security, along with other perquisites associatedwith a larger institution, they have incentives to increase facility size
Max 16 20 24Min 0 12 16 18
Event
HospitalFiscal
Year-end
HospitalAudit
Completed
Rating AgencyReceives F/S
and Other Info.
Stage 1Review
Performed
Stage 2Review
Performed
UpgradeNo ChangeDowngrade
Action
2822
Fig. 1. Review Process and Revision Timetable (In Weeks).
KREAG DANVERS130
(Cohodes & Kinkead, 1984; Pink & Leatt, 1991). At a minimum, nonprofithospital managers are expected to pursue actions consistent with a‘‘quantity–quality maximization’’ decision-making model (Cohodes &Kinkead, 1984). Quantity–quality maximization is a special case of thegeneral utility-maximizing model and assumes that hospital managementmaximizes and balances the quantity and quality of services provided.Inadequate financial reporting within the nonprofit hospital sector couldalso facilitate managerial efforts to maximize perquisites (e.g., Mensah &Chiang, 1996).
Given that facility investments are largely financed through tax-exemptbonds, it is critical for hospitals to maintain low-cost access to bondmarkets. In addition, operating self-sufficiency requires nonprofit hospitalsto achieve minimum levels of economic performance, including the ability tomeet scheduled debt service payments. Clearly, obtaining a higher creditrating, or not sustaining a credit downgrade, are key financial objectives forhospital managers (Beith & Goldreich, 2000).
In the case of hospitals with weakening financial performance that are atrisk of being downgraded, managers may attempt to signal credit stabilitythrough influencing short-term controllable factors. In particular, profit-ability is a key income statement indicator for nonprofit hospitals and isclosely monitored by bond rating agencies (Standard & Poor’s Creditweek –Municipal Finance Criteria, 1995). Key financial measures that S&P routi-nely monitors include excess margin, days cash on hand, days in accountsreceivable, and debt to capitalization (Standard & Poor’s Creditweek –Municipal Finance Criteria, 1995).
Although a rating downgrade is not as severe as debt covenant violationor bankruptcy, similar responses may occur. For example, Defond andJiambalvo (1994) found abnormal accruals for firms that violated debtcovenants in the year before violation, and Sweeney (1994) indicated thatmanagers of firms approaching default respond with income-increasing,accounting changes. In addition, Rosner (2003) found that when bankruptfirms that do not appear to be distressed approach bankruptcy, they reportsignificantly greater income-increasing accruals relative to control firmsduring nongoing-concern years. Burgstahler and Eames (2003) suggestedthat analysts cannot consistently identify firms that engage in earningsmanagement to avoid small losses. Within the health care industry, Mensah,Considine, and Oakes (1994) examined accounting conservatism andearnings management by HMOs in the accrual of incurred, but not reported,expenses. They found that such expenses were systematically understated byfinancially weaker HMOs in an effort to minimize regulatory costs.
Hospital Performance Surrounding the Bond Rating Revision Event 131
Profitability measures are also associated with managerial compensationwithin nonprofit hospitals (Brickley & Van Horn, 2002; Eldenburg &Krishnan, 2003). Since managers can readily influence profitability throughreducing discretionary expenses and implementing income-increasingaccounting accruals and methods, changes to profitability are expected tobe the primary performance measure influenced by managerial actions.Thus, the most immediate management reaction to pending or actual ratingrevisions may be to make income-increasing accounting choices.
In addition, S&P scrutinizes days in accounts receivable, and a relatedmeasure, days cash on hand. Since reduced days in accounts receivable canpositively impact cash levels, an important liquidity response should bemore readily revealed through changes in receivables, which could precedechanges in cash levels. Moreover, decreases to accounts receivable suggestsrelatively more efficient cash conversion and effective managerial control.Thus, although pre-revision changes in net accounts receivable should begreater for downgrades, post-downgrade managerial distress responses areexpected to accelerate receivables conversion and improve liquidity. Forother financial dimensions, such as financial leverage, facility age, andcapital expenditures, managers are not expected to initiate changes withinone or two fiscal periods. Relatively higher long-term debt to capitalizationand facility age, along with lower turnover and capital expenditure levels areexpected across both subperiods for downgrades.
In sum, potential consequences of a rating downgrade include a highercost of capital and debt service costs, diminished ability to obtain additionaldebt financing, and reduced managerial compensation. Given such punitiveimplications, profitability and liquidity improvements are expected for thedowngrade subgroup as managers attempt to influence the probabilitydistribution of future rating revisions by signaling credit stability to ratinganalysts and creditors. This first ‘‘downgrade distress’’ hypothesis isformally stated as follows:
H1. Managers of downgraded hospitals signal credit stability byreversing pre-revision profitability and liquidity performance.
As managers strive to avoid downgrades they can undertake such actionseither in expectation of, or in response to, the revision such that responsescan reasonably be expected in advance of the actual downgrade action. Aresponse in advance of an actual rating revision announcement is consistentwith the S&P rating surveillance process, which includes prior notification ofreview to the issuer along with follow-up reviews and analyses by ratinganalysts.
KREAG DANVERS132
This process suggests that hospital managers have opportunities torespond before a downgrade is actually issued. However, since the primarypurpose of notification is to permit an appeal by presenting new, ormitigating, information to be considered by the agency, prior notification ofpossible downgrade typically occurs too late for managers of downgradedhospitals to take any meaningful action in managing appropriate decisionvariables. Hospitals that actually experience a downgrade would likely havebeen unsuccessful in managing decision variables in the prior period. ThusH1 examines whether hospital managers improve either real (value-added)or reported (accounting-based) performance across the pre- to post-revisionsubperiods.
3.2.2. Upgrade HypothesisFor debt issues, bond rating upgrades, similar to higher stock prices,effectively reduce the cost of external financing. Consistent with the behaviorof for-profit firms that seek to reduce their cost of equity capital (e.g., Jain &Kini, 1994; Erickson & Wang, 1999; Loughran & Ritter, 1997) nonprofitmanagers could initiate pre-upgrade actions to secure higher bond ratings toreduce the cost of debt capital. Since bond rating surveillance occurs on anannual basis, and organizations can petition for a comprehensive review tobe upgraded at any time, managers exercise some degree of control over thetiming of both bond rating revisions and stock issuance.
Bond rating upgrades facilitate hospital expansion opportunities andimprove profitability through reducing interest costs, both of which can posi-tively impact management compensation (Pink & Leatt, 1991; Eldenburg &Krishnan, 2003). Thus, the analysis for upgrades focuses on profitability,which is the performance dimension most readily influenced by opportuni-stic actions such as the use of discretionary accruals to manage earnings(Leone & Van Horn, 2003; Eldenburg & Vines, 2004).
When managers successfully improve pre-upgrade profitability throughshort-term, earnings management actions, post-revision profitability willnecessarily deteriorate. This expectation is similar to acquiring firms’ post-merger underperformance within 1 year after merger announcement (Louis,2004). Other performance measures are not as readily managed in the shortterm and not as directly tied to managerial compensation (e.g., days cash onhand, long-term debt to capitalization, and facility age).
Managers cannot consistently increase profitability over time, as thehospital will tend toward a profitability plateau and show statisticalinsignificance with respect to the revision event. However, decreases, ornegative changes, to profitability will show negative statistical associations
Hospital Performance Surrounding the Bond Rating Revision Event 133
in subsequent periods. To the extent that managers improve pre-upgradeprofitability through undertaking short-term earnings management actions,post-upgrade profitability will necessarily deteriorate, which will reflect apositive (negative) association of return on assets to the revision event in thepre-revision (post-revision) subperiod. This ‘‘managerial opportunism’’hypothesis for upgrades is formally stated as follows:
H2. Managers of upgraded hospitals increase pre-revision profitabilityperformance, but show post-revision profitability decreases.
Thus H2 examines whether hospital managers increase reported pre-revision performance with post-revision deterioration.
3.3. Sample Selection
3.3.1. Revision SampleRating revision announcements are compiled from Standard & Poor’sCreditweek (1991–1995) for all rated nonprofit hospitals in the United Statesfrom 1991 to 1995. The data source for hospital-specific performancemeasures is the Merritt Research Healthcare Database (2001), a credit andinvestment analysis database. The database is a product of Merritt ResearchServices, LLC, Cedar Rapids, Iowa, and contains annual audited financialstatement and operational information for more than 1,600 hospitals andsystems from all 50 states and the District of Columbia. Rating actionspertain to fixed-rate, tax-exempt, hospital revenue bonds as reported inStandard & Poor’s CreditWeek – Municipal Bond Ratings: Revisions.
However, certain types of revisions are excluded from the sample sincethey do not reflect changes in the underlying credit of the issuer. Forexample, rating changes for credit-enhanced issues represent either additionor deletion of credit enhancement, or changes in the rating of the creditfacility backing the issue, and are thus excluded. Panel A of Table 1 showsthat from an initial 260 revision announcements identified during the 5-yearperiod, 222 are matched to hospitals in the database by name, location, andbond issue. This sample represents approximately 30 percent of the hospitalsin the Merritt database with nonenhanced ratings.
Ownership and service types may influence results where, for instance,limited administrative funding for district hospitals can lower performancedue to difficulty in recruiting and retaining top management. Service typeand control codes from the AHA (1996) Guide to the Health-Care Field areused to further exclude 10 proprietary, governmental, or special-service type
KREAG DANVERS134
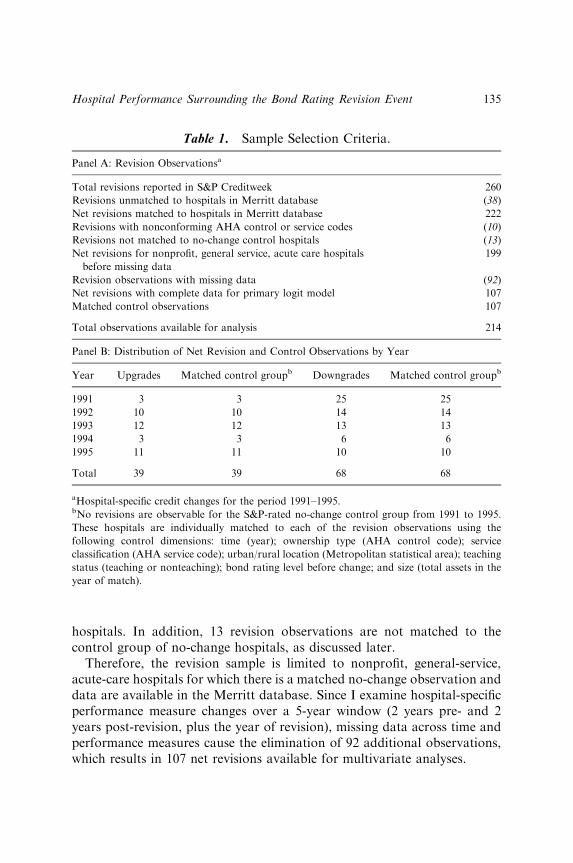
hospitals. In addition, 13 revision observations are not matched to thecontrol group of no-change hospitals, as discussed later.
Therefore, the revision sample is limited to nonprofit, general-service,acute-care hospitals for which there is a matched no-change observation anddata are available in the Merritt database. Since I examine hospital-specificperformance measure changes over a 5-year window (2 years pre- and 2years post-revision, plus the year of revision), missing data across time andperformance measures cause the elimination of 92 additional observations,which results in 107 net revisions available for multivariate analyses.
Table 1. Sample Selection Criteria.
Panel A: Revision Observationsa
Total revisions reported in S&P Creditweek 260
Revisions unmatched to hospitals in Merritt database (38)
Net revisions matched to hospitals in Merritt database 222
Revisions with nonconforming AHA control or service codes (10)
Revisions not matched to no-change control hospitals (13)
Net revisions for nonprofit, general service, acute care hospitals
before missing data
199
Revision observations with missing data (92)
Net revisions with complete data for primary logit model 107
Matched control observations 107
Total observations available for analysis 214
Panel B: Distribution of Net Revision and Control Observations by Year
Year Upgrades Matched control groupb Downgrades Matched control groupb
1991 3 3 25 25
1992 10 10 14 14
1993 12 12 13 13
1994 3 3 6 6
1995 11 11 10 10
Total 39 39 68 68
aHospital-specific credit changes for the period 1991–1995.bNo revisions are observable for the S&P-rated no-change control group from 1991 to 1995.
These hospitals are individually matched to each of the revision observations using the
following control dimensions: time (year); ownership type (AHA control code); service
classification (AHA service code); urban/rural location (Metropolitan statistical area); teaching
status (teaching or nonteaching); bond rating level before change; and size (total assets in the
year of match).
Hospital Performance Surrounding the Bond Rating Revision Event 135
Panel B of Table 1 shows that downgrades (68) substantially outnumberupgrades (39), which closely correspond to the proportions for the initial260 announced revisions. Although financial reviews are performedannually, no rating changes are observed for a total of 504 S&P-ratedhospitals over the sample period. After missing data items and screening fornonconforming service and control types, 274 no-change hospitals areavailable for matching to revision observations.
3.3.2. Control SampleSince the health care industry is in constant flux, many factors can affecthospital performance. In addition, I use interrupted time series tests toexamine managerial responses, which necessitates a control sample to ruleout competing explanations, such as mean reversion. Thus it is necessary toincorporate appropriate controls to reflect this environment. Implementingcontrols for time is critical given ongoing industry changes.
Controls for location are also needed since rural hospital performancetends to differ relative to that of urban hospitals. Moreover, the mission ofteaching hospitals, which includes a physician education component, isbroader than for those designated as nonteaching. Bond rating levels beforethe revision event are used to control for differences in historicalperformance. Finally, while large, urban teaching organizations may havea large asset base, they often have high indigent populations and weakfinancial conditions as well. These factors increase the importance ofincluding a size-control variable.
Thus for each revision observation, a no-change control hospital is closelymatched on the following dimensions: year, ownership type (AHA controlcode), service classification (AHA service code), location (MetropolitanStatistical Area), teaching status, bond rating level before change, and size(total assets). Owing to missing performance measure data across regressionmodels, revision observations are rematched, as necessary, for each of themodels that include a different nonfinancial measure.
The sizable no-change group (n ¼ 274) facilitates matching of the no-change, control subsamples to the revision subsamples across all dimen-sions. Matching on time, ownership, and service is performed withoutexception. With few exceptions, location and teaching status matches arealso completed. Finally, hospitals are matched on bond rating (all withinone rating level) and size (on the average, within 15 percent of total assets).
Rating levels for control hospitals are not, on the average, higher or lowerthan levels for event hospitals. For the upgrade sample, 35 of the 39 (90percent) are identically matched to a control hospital on pre-revision bond
KREAG DANVERS136
rating level, while for downgrades 57 of the 68 (84 percent) are identicallymatched. Remaining revision observations are matched within twogradations (e.g., Aþ and A�). The majority of bond rating levels arebetween Aþ and BBB for both revision samples (32 revisions/82 percent forupgrades and 52 revisions/76 percent for downgrades). Overall, the controlsubsample very closely reflects the corresponding revision subsample, whichsubstantially strengthens the rigor of empirical tests.
4. MODELS AND TESTS
Based on the revision observation sample from 1991 through 1995, this analysisuses performance data from 1989 through 1997 with the hospital-specific yearsdetermined by the revision event year. The time span of 5 years surrounding therevision event, including the revision year (t ¼ 0) as well as 2 years pre- and 2years post-revision, undergo examination. A 5-year window (t�2, tþ2) compe-nsates for lags in reporting, analysis, and initiation of revision actions. In addi-tion, rating agencies examine trends of variables, which suggest that managersconsider more than one fiscal period of performance as well.
However, it becomes problematic to associate performance measures tothe revision event beyond this 5-year window. For each revision observa-tion, changes in performance measures are examined for each of the 2 yearsprior (t�1 and t�2) as well as the 2 years subsequent (tþ1 and tþ2) to therevision event, relative to the year of revision (year t). Model (1) is amultinomial logit model, which is the primary multivariate specification thatis separately estimated for each year across pre- to post-revision subperiods.Firm subscripts are suppressed for presentation.
DRATINGt ¼ b0j þ b1jDROAtþm þ b2jDCASHtþm þ b3jDARDtþm
þ b4jDLTDtþm þ b5jDPPAtþm þ b6jDTOVtþm
þ b7jDCAPEXtþm þ b8jLTAStþm þ b9jTEACH
þ b10jLOCATIONþ bð1991�1994ÞjYEARþ �tþm ð1Þ
Where, DRATINGt is a rating revision for hospital i at time t ¼ 0, which isequal to 0, 1, or 2 (upgrade, matched no-change or downgrade, or n ¼ 3outcomes); and m ¼ �2, �1, þ1, or þ2 fiscal years relative to the revisionevent; and j ¼ n�1 estimated coefficients for revision subgroups.
The multinomial logit provides estimated coefficients for each of n�1groups, where n is the total number of values, or outcomes, that the
Hospital Performance Surrounding the Bond Rating Revision Event 137
dependent variable can assume. The matched no-change hospitals comprisethe reference (control) group for the regressions, which along with therevision observations, are used to determine the probability that hospital i isassociated with revision outcome j. Thus the multinomial logit provides amore lucid examination of the effects of each variable on the likelihood ofupgrade versus downgrade, relative to an ordered logit specification.
The logit tests can be viewed as a reverse regression approach since thehospitals’ response is actually the ‘‘Y ’’ variable and the rating change eventis the ‘‘X,’’ or explanatory variable. Because there are multiple possibleresponses, the reverse regression is estimated with responses on the right-hand side. This approach relies on statistical associations in a multipleregression framework, rather than direct tests for cause and effect relations.
Supplemental regression models include the primary model’s financialmeasures, but incrementally incorporate one nonfinancial measure forexamination. Missing data for nonfinancial measures substantially reducethe number of available observations, which constrains potential analyses.For this reason, each nonfinancial measure is added individually to theprimary model and the window of examination is restricted to (t�1, tþ1) tomaximize usable observations.
Hence the basic research question, which relates to managerial responsesacross both revision categories, is examined through analyzing theconsistency of pre- to post-revision changes in performance, relative to amatched control group. Copeland and Ingram (1982) used an analogousapproach for general obligation bonds, but their objective related morespecifically to the usefulness of the ratings process and the timeliness andreliability of accounting information for predicting rating changes. Themultinomial logistic regressions are used to study these multivariaterelationships and test the hypotheses.
4.1. Response Variable and Performance Measures
The response variable (DRATING) for the multinomial logistic regressionsis the bond rating revision announced by S&P. Within a three-levelregression model, the matched control group is the reference event, andcoefficients for independent variables are estimated for each revision eventgroup, relative to the reference event. Independent variables consist offinancial statement and nonfinancial measures reflecting hospital perfor-mance dimensions that influence analysts to issue rating actions, some ofwhich are subject to short-term managerial influence.
KREAG DANVERS138
Performance measures are selected from previous hospital financial-ratioand bond rating studies (e.g., Zeller et al., 1996; Watkins, 2000), along withthose monitored by S&P’s CreditWeek. Recall that Zeller et al. (1996) foundseven factors of hospital performance including profitability, fixed assetefficiency, capital structure, fixed asset age, working capital efficiency,liquidity, and debt coverage. In addition, Watkins (2000) uses profitability,capital structure, asset productivity, inpatient utilization, and laborproductivity measures in explaining hospital bond rating levels.
Moreover, HCIA, Inc. and Deloitte & Touche, LLP (1995) stated thatoccupancy rate, admissions and outpatient visits, Medicare and Medicaidrevenue percentages, long-term debt to capitalization, debt service coverage,days in net accounts receivable, days cash on hand, operating and totalprofit margins, full-time equivalents (FTEs) personnel per 100 adjusteddischarges, and discharges per bed are indicators of hospital creditworthi-ness. In my study, missing observations for certain nonfinancial items limitthe multivariate analyses that can be performed.
With the exception of levels data presented in Table 2 (and the size-control variable), all performance measure data are presented as firstdifferences since incremental changes in selected measures are likely to causeshifts in credit risk and influence incremental changes in ratings. Indeed,S&P (1995) examines income statement, balance sheet and cash flow trends,or changes, when performing credit evaluations. In addition, a first-difference specification for the explanatory variables tends to mitigatemulticollinearity, better controls for correlated, omitted-variable bias(Dunbar & Phillips, 1997), reduces nonstationarity of the financialmeasures, and ameliorates simultaneity bias, relative to a levels specifica-tion. The first-difference specification thus helps to reduce nonstationa-rity that arises from the bond rating process, particularly with respect tochanges in the economic environment and rating grade level (Iskandar,1991).
Again, upgraded (downgraded) hospitals cannot consistently increase(decrease) performance over extended time periods. For example, when anupgraded hospital achieves a significantly positive change in pre-revisionprofitability in a particular year, the hospital’s inability to maintainprofitability improvements (i.e., changes that are approximately zero)will show statistical insignificance in later periods. Conversely, decreases,or negative changes, in performance will show negative statistical asso-ciations in subsequent periods. The primary model includes the sevenfinancial statement measures, as well as the control variables, discussedfurther later.
Hospital Performance Surrounding the Bond Rating Revision Event 139
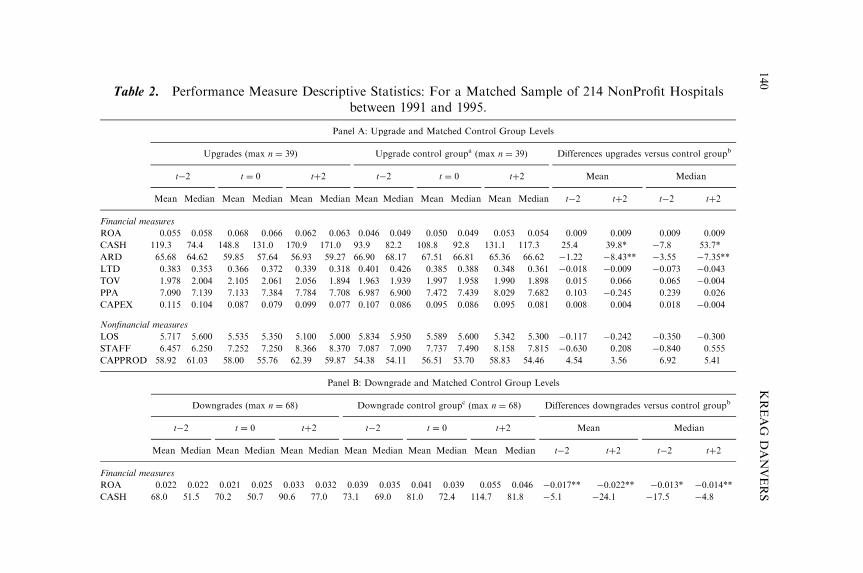
Table 2. Performance Measure Descriptive Statistics: For a Matched Sample of 214 NonProfit Hospitalsbetween 1991 and 1995.
Panel A: Upgrade and Matched Control Group Levels
Upgrades (max n ¼ 39) Upgrade control groupa (max n ¼ 39) Differences upgrades versus control groupb
t�2 t ¼ 0 tþ2 t�2 t ¼ 0 tþ2 Mean Median
Mean Median Mean Median Mean Median Mean Median Mean Median Mean Median t�2 tþ2 t�2 tþ2
Financial measures
ROA 0.055 0.058 0.068 0.066 0.062 0.063 0.046 0.049 0.050 0.049 0.053 0.054 0.009 0.009 0.009 0.009
CASH 119.3 74.4 148.8 131.0 170.9 171.0 93.9 82.2 108.8 92.8 131.1 117.3 25.4 39.8* �7.8 53.7*
ARD 65.68 64.62 59.85 57.64 56.93 59.27 66.90 68.17 67.51 66.81 65.36 66.62 �1.22 �8.43** �3.55 �7.35**
LTD 0.383 0.353 0.366 0.372 0.339 0.318 0.401 0.426 0.385 0.388 0.348 0.361 �0.018 �0.009 �0.073 �0.043
TOV 1.978 2.004 2.105 2.061 2.056 1.894 1.963 1.939 1.997 1.958 1.990 1.898 0.015 0.066 0.065 �0.004
PPA 7.090 7.139 7.133 7.384 7.784 7.708 6.987 6.900 7.472 7.439 8.029 7.682 0.103 �0.245 0.239 0.026
CAPEX 0.115 0.104 0.087 0.079 0.099 0.077 0.107 0.086 0.095 0.086 0.095 0.081 0.008 0.004 0.018 �0.004
Nonfinancial measures
LOS 5.717 5.600 5.535 5.350 5.100 5.000 5.834 5.950 5.589 5.600 5.342 5.300 �0.117 �0.242 �0.350 �0.300
STAFF 6.457 6.250 7.252 7.250 8.366 8.370 7.087 7.090 7.737 7.490 8.158 7.815 �0.630 0.208 �0.840 0.555
CAPPROD 58.92 61.03 58.00 55.76 62.39 59.87 54.38 54.11 56.51 53.70 58.83 54.46 4.54 3.56 6.92 5.41
Panel B: Downgrade and Matched Control Group Levels
Downgrades (max n ¼ 68) Downgrade control groupc (max n ¼ 68) Differences downgrades versus control groupb
t�2 t ¼ 0 tþ2 t�2 t ¼ 0 tþ2 Mean Median
Mean Median Mean Median Mean Median Mean Median Mean Median Mean Median t�2 tþ2 t�2 tþ2
Financial measures
ROA 0.022 0.022 0.021 0.025 0.033 0.032 0.039 0.035 0.041 0.039 0.055 0.046 �0.017** �0.022** �0.013* �0.014**
CASH 68.0 51.5 70.2 50.7 90.6 77.0 73.1 69.0 81.0 72.4 114.7 81.8 �5.1 �24.1 �17.5 �4.8
KREAG
DANVERS
140
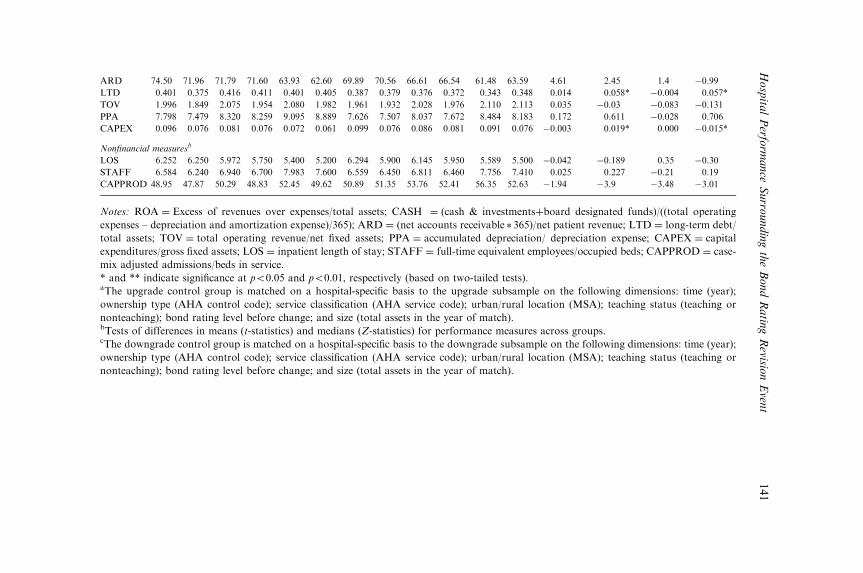
ARD 74.50 71.96 71.79 71.60 63.93 62.60 69.89 70.56 66.61 66.54 61.48 63.59 4.61 2.45 1.4 �0.99
LTD 0.401 0.375 0.416 0.411 0.401 0.405 0.387 0.379 0.376 0.372 0.343 0.348 0.014 0.058* �0.004 0.057*
TOV 1.996 1.849 2.075 1.954 2.080 1.982 1.961 1.932 2.028 1.976 2.110 2.113 0.035 �0.03 �0.083 �0.131
PPA 7.798 7.479 8.320 8.259 9.095 8.889 7.626 7.507 8.037 7.672 8.484 8.183 0.172 0.611 �0.028 0.706
CAPEX 0.096 0.076 0.081 0.076 0.072 0.061 0.099 0.076 0.086 0.081 0.091 0.076 �0.003 0.019* 0.000 �0.015*
Nonfinancial measuresb
LOS 6.252 6.250 5.972 5.750 5.400 5.200 6.294 5.900 6.145 5.950 5.589 5.500 �0.042 �0.189 0.35 �0.30
STAFF 6.584 6.240 6.940 6.700 7.983 7.600 6.559 6.450 6.811 6.460 7.756 7.410 0.025 0.227 �0.21 0.19
CAPPROD 48.95 47.87 50.29 48.83 52.45 49.62 50.89 51.35 53.76 52.41 56.35 52.63 �1.94 �3.9 �3.48 �3.01
Notes: ROA ¼ Excess of revenues over expenses/total assets; CASH ¼ (cash & investmentsþboard designated funds)/((total operating
expenses – depreciation and amortization expense)/365); ARD ¼ (net accounts receivable * 365)/net patient revenue; LTD ¼ long-term debt/
total assets; TOV ¼ total operating revenue/net fixed assets; PPA ¼ accumulated depreciation/ depreciation expense; CAPEX ¼ capital
expenditures/gross fixed assets; LOS ¼ inpatient length of stay; STAFF ¼ full-time equivalent employees/occupied beds; CAPPROD ¼ case-
mix adjusted admissions/beds in service.
* and ** indicate significance at po0.05 and po0.01, respectively (based on two-tailed tests).aThe upgrade control group is matched on a hospital-specific basis to the upgrade subsample on the following dimensions: time (year);
ownership type (AHA control code); service classification (AHA service code); urban/rural location (MSA); teaching status (teaching or
nonteaching); bond rating level before change; and size (total assets in the year of match).bTests of differences in means (t-statistics) and medians (Z-statistics) for performance measures across groups.cThe downgrade control group is matched on a hospital-specific basis to the downgrade subsample on the following dimensions: time (year);
ownership type (AHA control code); service classification (AHA service code); urban/rural location (MSA); teaching status (teaching or
nonteaching); bond rating level before change; and size (total assets in the year of match).
Hospita
lPerfo
rmance
Surro
undingtheBondRatin
gRevisio
nEven
t141
4.1.1. Financial Statement Measures
� ROA ¼ excess of revenues over expenses/total assets (see AICPA Guide2003, pp. 163–183, for financial statement presentations and definitions).ROA, which includes nonoperating revenue and expenses, measures theprofitability dimension (Zeller et al., 1996; Watkins, 2000; Brickley & VanHorn, 2002). Since a positive relationship between profitability and creditrating is expected, the first difference of return on assets (DROA) shouldbe greater (less) for upgrades (downgrades) in the pre-revision subperiod,but DROA is expected to decrease (increase) for upgrades (downgrades).Debt service coverage undergoes examination as well, but a highcorrelation with ROA, combined with a relatively larger number ofmissing observations for this measure in the database, precludes its use asa financial measure.� CASH ¼ (cash and investmentsþboard designated funds)/((total operat-ing expenses – depreciation and amortization expense)/365). Zeller et al.(1996) used this measure. Owing to a positive expectation between cashand credit rating, the first difference (DCASH) of days cash on handshould be greater (less) for upgrades (downgrades) across both subperiods.Given the credit analysis emphasis of the database, reported cash andinvestments includes amounts in affiliated foundations. As previouslynoted, governmental hospitals, which can have off-balance sheet cashbalances that are held and managed by a central municipal treasuryfunction, are excluded from the sample.� ARD ¼ (net accounts receivable * 365)/net patient revenue (McCue et al.,1990; HCIA, Inc. and Deloitte & Touche, LLP, 1995). Since higher days inreceivables suggest inefficient cash conversion and less liquidity, the changein days in net accounts receivable (DARD) should be less (greater) forupgrades (downgrades) in the pre-revision subperiod. Managerial responsesby downgraded hospitals to accelerate receivables conversion and improvecash levels suggest that DARD will become less for downgrades. Since thehospital industry maintains substantial receivable levels due to the third-party payer system, a substantial receivables investment more adverselyimpacts liquidity for the hospital industry than many other sectors. Forexample, in 1994 hospitals maintained a median of 69 days in receivables(HCIA, Inc. and Deloitte & Touche, LLP, 1995). Decreases in receivablessuggest that more effective managerial controls are in place.� LTD ¼ long-term debt/total assets (McCue et al., 1990; HCIA, Inc. andDeloitte & Touche, LLP, 1995). Financial leverage should be negativelyrelated to credit rating and the first difference (DLTD) of this capital
KREAG DANVERS142
structure measure should be less (greater) for upgrades (downgrades)across subperiods.� PPA ¼ accumulated depreciation/depreciation expense. PPA measuresfacility age (Zeller et al., 1996). Relatively newer facilities will have a loweraverage property and plant age, which is more attractive from a creditrating perspective. Thus the change in estimated average plant age(DPPA) is anticipated to be less (greater) for upgrades (downgrades) inboth subperiods.� TOV ¼ total operating revenue/net fixed assets (Zeller et al., 1996;Watkins, 2000). Turnover measures the efficient use of net fixed assets,which should positively influence credit ratings. Therefore, the change inthe fixed asset turnover (DTOV) should be greater (less) for upgrades(downgrades) in both subperiods.� CAPEX ¼ capital expenditures/gross fixed assets. CAPEX measurescapital expenditures (Zeller et al., 1996; Barniv et al., 2000). Credit ratingtends to be positively associated with capital expenditures that maintainor upgrade hospital facilities and the change in capital expenditures(DCAPEX) is expected to be greater (less) for upgrades (downgrades) inboth subperiods. Post-revision, positive (negative) reinforcements forupgrades (downgrades) are consistent with Jain and Kini (1994) due tochanges in hospitals’ ability to obtain debt financing.
To summarize, managerial responses for downgrades are expected forROA and ARD, while only changes in ROA are expected for upgrades.However, several of the performance measures are likely to not be changedby managers in the short term (e.g., financial leverage and facilityinvestment). As previously indicated, additional variables are included inthe regression equations to control for the effects of size, teaching status,urban location, and year of revision. These variables are presented later.
4.1.2. Control Variable Definitions
� LTAS is the natural log of total assets. LTAS further controls for sizeeffects. Adjusted patient days and hospital beds were also considered foruse as size-control measures, but extensive missing data precluded theiruse in matching the control groups and in estimating the major logisticregressions. The size-control variable should be greater (less) for upgrades(downgrades).� TEACH is a dummy variable to control for teaching status. TEACH isassigned a value of one for teaching hospitals and is zero otherwise. Since
Hospital Performance Surrounding the Bond Rating Revision Event 143
high costs, overspecialization, and high numbers of uninsured createstress for teaching hospitals (Montague & Pitman, 1996), TEACH shouldbe less (greater) for upgrades (downgrades).� LOCATION is a dummy variable to control for urban versus rural location,which assumes the value of one when a hospital is located in a metropolitanstatistical area (MSA) and is zero otherwise. Since rural hospitals tend toperform better than urban hospitals (MEDPAC, 2001), LOCATIONshould be less (greater) for upgrades (downgrades). MEDPAC’s (2001)analysis of the financial performance of rural hospitals indicates that totalmargin is greater for rural over urban hospitals for every year throughoutthe 1990s, which includes the sample period examined in this study.� YEAR is the dummy control variables for year of revision event. YEARtakes the value of one for the year of revision (or matched year) and iszero otherwise.
The usefulness of financial statement data is enhanced when supplemen-ted by relevant operating statistics. Recall that S&P requests supplementaloperating information, in addition to audited financial statements, as part ofthe annual rating review process. Market competition, managed care payermix, and other nonfinancial measures are considered for use in this study,but due to a high frequency of missing data it could not be implemented.Indirect proxies were used for hospital payer mix, which can haveperformance consequences through affecting cash flow and liquidity andthus bias against finding the hypothesized results.
In addition to the primary model consisting of the seven financial statementmeasures and the four control variables presented earlier, differences in thefollowing nonfinancial measures are examined across revision subperiods. Tocontrol for omitted variables problems, each nonfinancial measure isincrementally examined within the context of the primary financial model.Nonfinancial performance improvements are expected only for the down-graded subsample due to their distressed situations and the necessity ofmanagers to undertake real operational improvements. On the contrary, anopportunistic orientation for the upgraded group suggests no significantchanges in nonfinancial performance measures across subperiods.
4.1.3. Nonfinancial Measures
� LOS is the length-of-stay. The change in this efficiency measure (DLOS)reflects hospitals’ ability to control costs (Evans et al., 2001). Payment perdiagnosis under the prospective payment system creates incentives forhospitals to reduce the LOS. More effective cost control by upgraded
KREAG DANVERS144
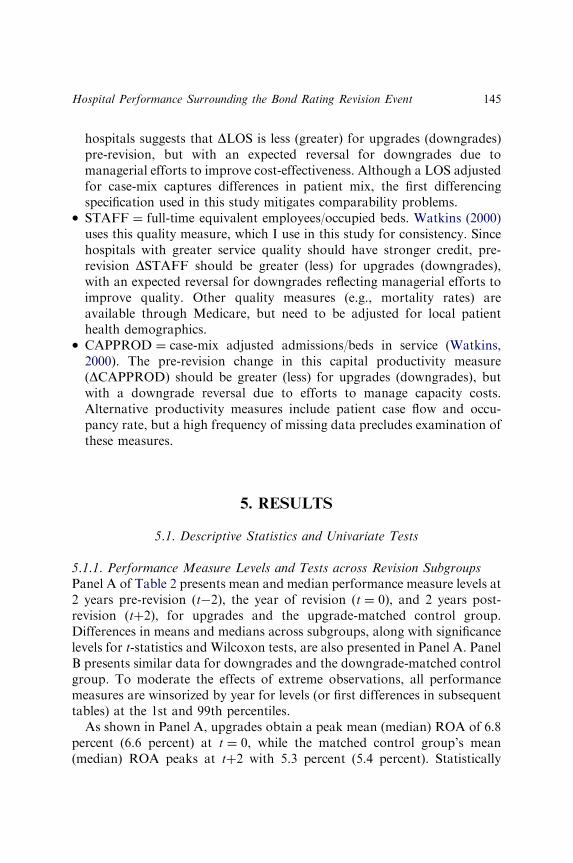
hospitals suggests that DLOS is less (greater) for upgrades (downgrades)pre-revision, but with an expected reversal for downgrades due tomanagerial efforts to improve cost-effectiveness. Although a LOS adjustedfor case-mix captures differences in patient mix, the first differencingspecification used in this study mitigates comparability problems.� STAFF ¼ full-time equivalent employees/occupied beds. Watkins (2000)uses this quality measure, which I use in this study for consistency. Sincehospitals with greater service quality should have stronger credit, pre-revision DSTAFF should be greater (less) for upgrades (downgrades),with an expected reversal for downgrades reflecting managerial efforts toimprove quality. Other quality measures (e.g., mortality rates) areavailable through Medicare, but need to be adjusted for local patienthealth demographics.� CAPPROD ¼ case-mix adjusted admissions/beds in service (Watkins,2000). The pre-revision change in this capital productivity measure(DCAPPROD) should be greater (less) for upgrades (downgrades), butwith a downgrade reversal due to efforts to manage capacity costs.Alternative productivity measures include patient case flow and occu-pancy rate, but a high frequency of missing data precludes examination ofthese measures.
5. RESULTS
5.1. Descriptive Statistics and Univariate Tests
5.1.1. Performance Measure Levels and Tests across Revision SubgroupsPanel A of Table 2 presents mean and median performance measure levels at2 years pre-revision (t�2), the year of revision (t ¼ 0), and 2 years post-revision (tþ2), for upgrades and the upgrade-matched control group.Differences in means and medians across subgroups, along with significancelevels for t-statistics and Wilcoxon tests, are also presented in Panel A. PanelB presents similar data for downgrades and the downgrade-matched controlgroup. To moderate the effects of extreme observations, all performancemeasures are winsorized by year for levels (or first differences in subsequenttables) at the 1st and 99th percentiles.
As shown in Panel A, upgrades obtain a peak mean (median) ROA of 6.8percent (6.6 percent) at t ¼ 0, while the matched control group’s mean(median) ROA peaks at tþ2 with 5.3 percent (5.4 percent). Statistically
Hospital Performance Surrounding the Bond Rating Revision Event 145
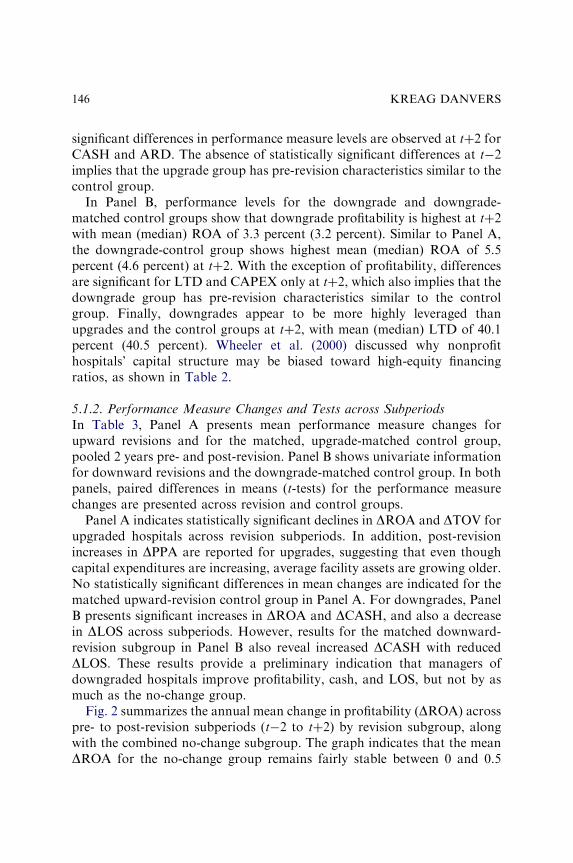
significant differences in performance measure levels are observed at tþ2 forCASH and ARD. The absence of statistically significant differences at t�2implies that the upgrade group has pre-revision characteristics similar to thecontrol group.
In Panel B, performance levels for the downgrade and downgrade-matched control groups show that downgrade profitability is highest at tþ2with mean (median) ROA of 3.3 percent (3.2 percent). Similar to Panel A,the downgrade-control group shows highest mean (median) ROA of 5.5percent (4.6 percent) at tþ2. With the exception of profitability, differencesare significant for LTD and CAPEX only at tþ2, which also implies that thedowngrade group has pre-revision characteristics similar to the controlgroup. Finally, downgrades appear to be more highly leveraged thanupgrades and the control groups at tþ2, with mean (median) LTD of 40.1percent (40.5 percent). Wheeler et al. (2000) discussed why nonprofithospitals’ capital structure may be biased toward high-equity financingratios, as shown in Table 2.
5.1.2. Performance Measure Changes and Tests across SubperiodsIn Table 3, Panel A presents mean performance measure changes forupward revisions and for the matched, upgrade-matched control group,pooled 2 years pre- and post-revision. Panel B shows univariate informationfor downward revisions and the downgrade-matched control group. In bothpanels, paired differences in means (t-tests) for the performance measurechanges are presented across revision and control groups.
Panel A indicates statistically significant declines in DROA and DTOV forupgraded hospitals across revision subperiods. In addition, post-revisionincreases in DPPA are reported for upgrades, suggesting that even thoughcapital expenditures are increasing, average facility assets are growing older.No statistically significant differences in mean changes are indicated for thematched upward-revision control group in Panel A. For downgrades, PanelB presents significant increases in DROA and DCASH, and also a decreasein DLOS across subperiods. However, results for the matched downward-revision subgroup in Panel B also reveal increased DCASH with reducedDLOS. These results provide a preliminary indication that managers ofdowngraded hospitals improve profitability, cash, and LOS, but not by asmuch as the no-change group.
Fig. 2 summarizes the annual mean change in profitability (DROA) acrosspre- to post-revision subperiods (t�2 to tþ2) by revision subgroup, alongwith the combined no-change subgroup. The graph indicates that the meanDROA for the no-change group remains fairly stable between 0 and 0.5
KREAG DANVERS146
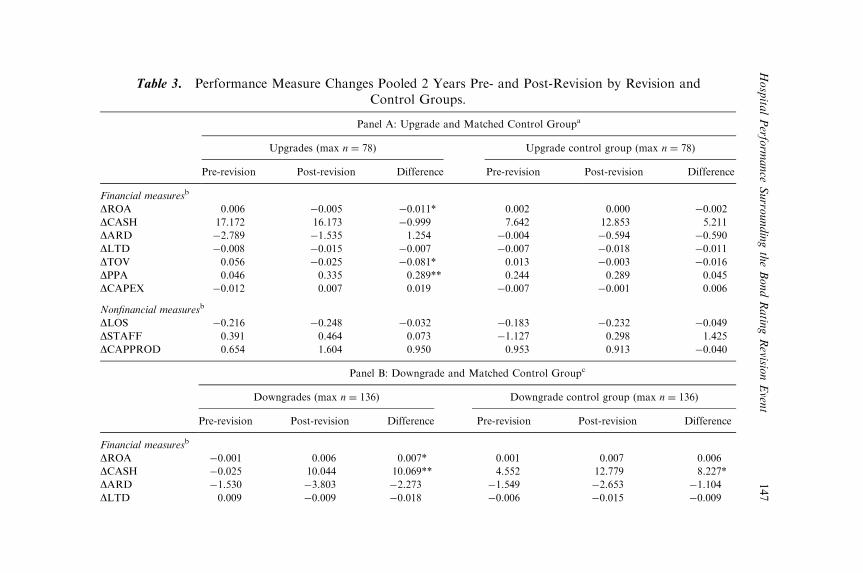
Table 3. Performance Measure Changes Pooled 2 Years Pre- and Post-Revision by Revision andControl Groups.
Panel A: Upgrade and Matched Control Groupa
Upgrades (max n ¼ 78) Upgrade control group (max n ¼ 78)
Pre-revision Post-revision Difference Pre-revision Post-revision Difference
Financial measuresb
DROA 0.006 �0.005 �0.011* 0.002 0.000 �0.002
DCASH 17.172 16.173 �0.999 7.642 12.853 5.211
DARD �2.789 �1.535 1.254 �0.004 �0.594 �0.590
DLTD �0.008 �0.015 �0.007 �0.007 �0.018 �0.011
DTOV 0.056 �0.025 �0.081* 0.013 �0.003 �0.016
DPPA 0.046 0.335 0.289** 0.244 0.289 0.045
DCAPEX �0.012 0.007 0.019 �0.007 �0.001 0.006
Nonfinancial measuresb
DLOS �0.216 �0.248 �0.032 �0.183 �0.232 �0.049
DSTAFF 0.391 0.464 0.073 �1.127 0.298 1.425
DCAPPROD 0.654 1.604 0.950 0.953 0.913 �0.040
Panel B: Downgrade and Matched Control Groupc
Downgrades (max n ¼ 136) Downgrade control group (max n ¼ 136)
Pre-revision Post-revision Difference Pre-revision Post-revision Difference
Financial measuresb
DROA �0.001 0.006 0.007* 0.001 0.007 0.006
DCASH �0.025 10.044 10.069** 4.552 12.779 8.227*
DARD �1.530 �3.803 �2.273 �1.549 �2.653 �1.104
DLTD 0.009 �0.009 �0.018 �0.006 �0.015 �0.009
Hospita
lPerfo
rmance
Surro
undingtheBondRatin
gRevisio
nEven
t147
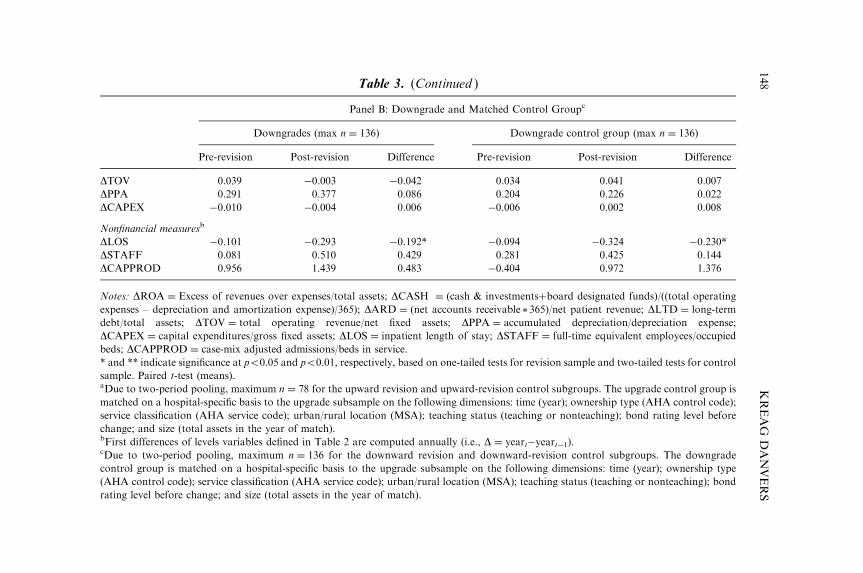
Table 3. (Continued )
Panel B: Downgrade and Matched Control Groupc
Downgrades (max n ¼ 136) Downgrade control group (max n ¼ 136)
Pre-revision Post-revision Difference Pre-revision Post-revision Difference
DTOV 0.039 �0.003 �0.042 0.034 0.041 0.007
DPPA 0.291 0.377 0.086 0.204 0.226 0.022
DCAPEX �0.010 �0.004 0.006 �0.006 0.002 0.008
Nonfinancial measuresb
DLOS �0.101 �0.293 �0.192* �0.094 �0.324 �0.230*
DSTAFF 0.081 0.510 0.429 0.281 0.425 0.144
DCAPPROD 0.956 1.439 0.483 �0.404 0.972 1.376
Notes: DROA ¼ Excess of revenues over expenses/total assets; DCASH ¼ (cash & investmentsþboard designated funds)/((total operating
expenses – depreciation and amortization expense)/365); DARD ¼ (net accounts receivable * 365)/net patient revenue; DLTD ¼ long-term
debt/total assets; DTOV ¼ total operating revenue/net fixed assets; DPPA ¼ accumulated depreciation/depreciation expense;
DCAPEX ¼ capital expenditures/gross fixed assets; DLOS ¼ inpatient length of stay; DSTAFF ¼ full-time equivalent employees/occupied
beds; DCAPPROD ¼ case-mix adjusted admissions/beds in service.
* and ** indicate significance at po0.05 and po0.01, respectively, based on one-tailed tests for revision sample and two-tailed tests for control
sample. Paired t-test (means).aDue to two-period pooling, maximum n ¼ 78 for the upward revision and upward-revision control subgroups. The upgrade control group is
matched on a hospital-specific basis to the upgrade subsample on the following dimensions: time (year); ownership type (AHA control code);
service classification (AHA service code); urban/rural location (MSA); teaching status (teaching or nonteaching); bond rating level before
change; and size (total assets in the year of match).bFirst differences of levels variables defined in Table 2 are computed annually (i.e., D ¼ yeart�yeart�1).cDue to two-period pooling, maximum n ¼ 136 for the downward revision and downward-revision control subgroups. The downgrade
control group is matched on a hospital-specific basis to the upgrade subsample on the following dimensions: time (year); ownership type
(AHA control code); service classification (AHA service code); urban/rural location (MSA); teaching status (teaching or nonteaching); bond
rating level before change; and size (total assets in the year of match).
KREAG
DANVERS
148
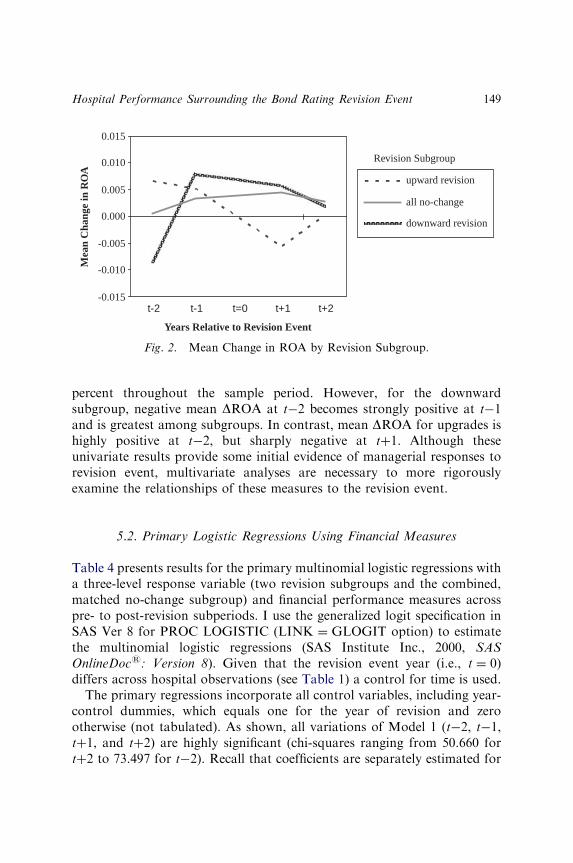
percent throughout the sample period. However, for the downwardsubgroup, negative mean DROA at t�2 becomes strongly positive at t�1and is greatest among subgroups. In contrast, mean DROA for upgrades ishighly positive at t�2, but sharply negative at tþ1. Although theseunivariate results provide some initial evidence of managerial responses torevision event, multivariate analyses are necessary to more rigorouslyexamine the relationships of these measures to the revision event.
5.2. Primary Logistic Regressions Using Financial Measures
Table 4 presents results for the primary multinomial logistic regressions witha three-level response variable (two revision subgroups and the combined,matched no-change subgroup) and financial performance measures acrosspre- to post-revision subperiods. I use the generalized logit specification inSAS Ver 8 for PROC LOGISTIC (LINK ¼ GLOGIT option) to estimatethe multinomial logistic regressions (SAS Institute Inc., 2000, SASOnlineDocs: Version 8). Given that the revision event year (i.e., t ¼ 0)differs across hospital observations (see Table 1) a control for time is used.
The primary regressions incorporate all control variables, including year-control dummies, which equals one for the year of revision and zerootherwise (not tabulated). As shown, all variations of Model 1 (t�2, t�1,tþ1, and tþ2) are highly significant (chi-squares ranging from 50.660 fortþ2 to 73.497 for t�2). Recall that coefficients are separately estimated for
-0.015
-0.010
-0.005
0.000
0.005
0.010
0.015
t-2 t-1 t=0 t+1 t+2
Years Relative to Revision Event
Mea
n C
hang
e in
RO
A
upward revision
all no-change
downward revision
Revision Subgroup
Fig. 2. Mean Change in ROA by Revision Subgroup.
Hospital Performance Surrounding the Bond Rating Revision Event 149
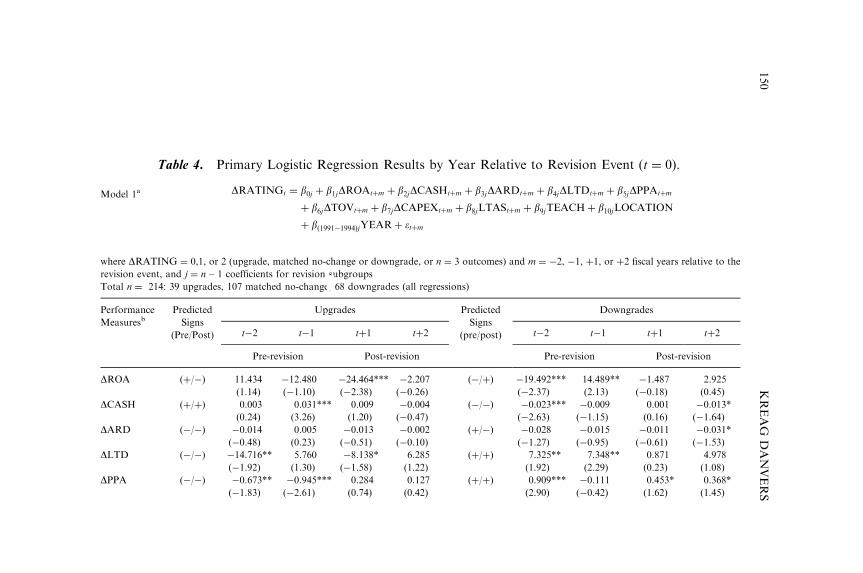
Table 4. Primary Logistic Regression Results by Year Relative to Revision Event (t ¼ 0).
Model 1a DRATINGt ¼ b0j þ b1jDROAtþm þ b2jDCASHtþm þ b3jDARDtþm þ b4jDLTDtþm þ b5jDPPAtþm
þ b6jDTOVtþm þ b7jDCAPEXtþm þ b8jLTAStþm þ b9jTEACHþ b10jLOCATION
þ bð1991�1994ÞjYEARþ �tþm
where DRATING ¼ 0,1, or 2 (upgrade, matched no-change or downgrade, or n ¼ 3 outcomes) and m ¼ �2, �1, þ1, or þ2 fiscal years relative to the
revision event, and j ¼ n – 1 coefficients for revision subgroups
Total n ¼ 214: 39 upgrades, 107 matched no-change, 68 downgrades (all regressions)
Performance
MeasuresbPredicted
Signs
(Pre/Post)
Upgrades Predicted
Signs
(pre/post)
Downgrades
t�2 t�1 tþ1 tþ2 t�2 t�1 tþ1 tþ2
Pre-revision Post-revision Pre-revision Post-revision
DROA (þ/�) 11.434 �12.480 �24.464*** �2.207 (�/þ) �19.492*** 14.489** �1.487 2.925
(1.14) (�1.10) (�2.38) (�0.26) (�2.37) (2.13) (�0.18) (0.45)
DCASH (þ/þ) 0.003 0.031*** 0.009 �0.004 (�/�) �0.023*** �0.009 0.001 �0.013*
(0.24) (3.26) (1.20) (�0.47) (�2.63) (�1.15) (0.16) (�1.64)
DARD (�/�) �0.014 0.005 �0.013 �0.002 (þ/�) �0.028 �0.015 �0.011 �0.031*
(�0.48) (0.23) (�0.51) (�0.10) (�1.27) (�0.95) (�0.61) (�1.53)
DLTD (�/�) �14.716** 5.760 �8.138* 6.285 (þ/þ) 7.325** 7.348** 0.871 4.978
(�1.92) (1.30) (�1.58) (1.22) (1.92) (2.29) (0.23) (1.08)
DPPA (�/�) �0.673** �0.945*** 0.284 0.127 (þ/þ) 0.909*** �0.111 0.453* 0.368*
(�1.83) (�2.61) (0.74) (0.42) (2.90) (�0.42) (1.62) (1.45)
KREAG
DANVERS
150
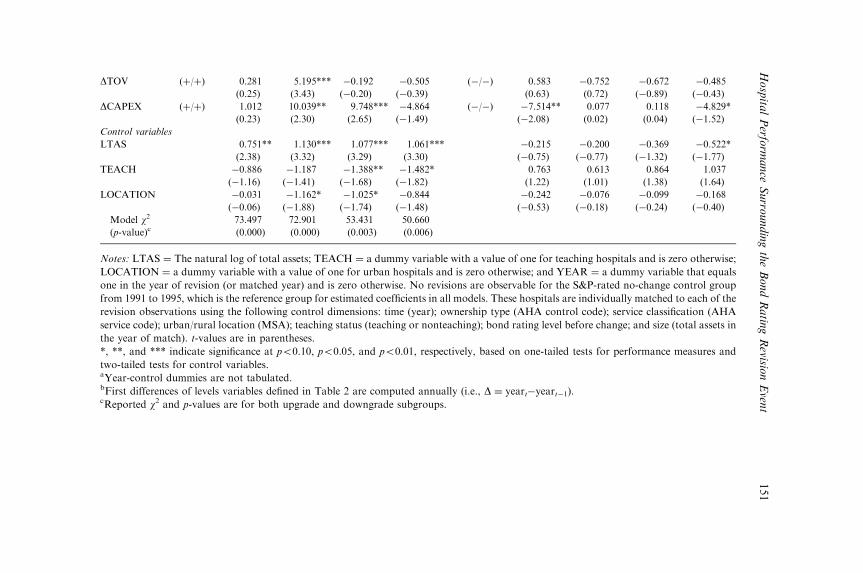
DTOV (þ/þ) 0.281 5.195*** �0.192 �0.505 (�/�) 0.583 �0.752 �0.672 �0.485
(0.25) (3.43) (�0.20) (�0.39) (0.63) (0.72) (�0.89) (�0.43)
DCAPEX (þ/þ) 1.012 10.039** 9.748*** �4.864 (�/�) �7.514** 0.077 0.118 �4.829*
(0.23) (2.30) (2.65) (�1.49) (�2.08) (0.02) (0.04) (�1.52)
Control variables
LTAS 0.751** 1.130*** 1.077*** 1.061*** �0.215 �0.200 �0.369 �0.522*
(2.38) (3.32) (3.29) (3.30) (�0.75) (�0.77) (�1.32) (�1.77)
TEACH �0.886 �1.187 �1.388** �1.482* 0.763 0.613 0.864 1.037
(�1.16) (�1.41) (�1.68) (�1.82) (1.22) (1.01) (1.38) (1.64)
LOCATION �0.031 �1.162* �1.025* �0.844 �0.242 �0.076 �0.099 �0.168
(�0.06) (�1.88) (�1.74) (�1.48) (�0.53) (�0.18) (�0.24) (�0.40)
Model w2 73.497 72.901 53.431 50.660
(p-value)c (0.000) (0.000) (0.003) (0.006)
Notes: LTAS ¼ The natural log of total assets; TEACH ¼ a dummy variable with a value of one for teaching hospitals and is zero otherwise;
LOCATION ¼ a dummy variable with a value of one for urban hospitals and is zero otherwise; and YEAR ¼ a dummy variable that equals
one in the year of revision (or matched year) and is zero otherwise. No revisions are observable for the S&P-rated no-change control group
from 1991 to 1995, which is the reference group for estimated coefficients in all models. These hospitals are individually matched to each of the
revision observations using the following control dimensions: time (year); ownership type (AHA control code); service classification (AHA
service code); urban/rural location (MSA); teaching status (teaching or nonteaching); bond rating level before change; and size (total assets in
the year of match). t-values are in parentheses.
*, **, and *** indicate significance at po0.10, po0.05, and po0.01, respectively, based on one-tailed tests for performance measures and
two-tailed tests for control variables.aYear-control dummies are not tabulated.bFirst differences of levels variables defined in Table 2 are computed annually (i.e., D ¼ yeart�yeart�1).cReported w2 and p-values are for both upgrade and downgrade subgroups.
Hospita
lPerfo
rmance
Surro
undingtheBondRatin
gRevisio
nEven
t151
each pre- or post-revision year, relative to the revision event year. Also, notethat only one model w2 and p-value are presented for each time period forboth subgroups since the multinomial logistic regression provides n�1estimated coefficients for the n subgroups (i.e., the estimated coefficients forboth upgrades and downgrades are generated by the same regression).
For the upgrade group at t�2, the estimated coefficients for DLTD andDPPA are significantly less (and significantly greater for the control variableLTAS), relative to the no-change group. This indicates that hospitals havegreater reductions than the control group in financial leverage and facility ageat two periods before upgrade. Moving to one period before upgrade (t�1),DCASH, DTOV, and DCAPEX are significantly greater than the controlgroup, as predicted, while the negative DPPA becomes more significant(control variables LTAS and LOCATION are significant as well at t�1).
For downgrades at t�2, DROA, DCASH, and DCAPEX are significantlyless, relative to the no-change group. Conversely, DLTD and DPPA aregreater for downgrades, as expected, and DLTD continues to be greater fordowngrades at t�1. More importantly, at one period before the downgradeevent, DROA for downgrades becomes significantly greater. Although apositive managerial response is expected for downward revisions, thisprofitability response is clearly detectable before the actual downgrade beingissued. This suggests that managers initiate preemptive profitabilityimprovements in an attempt to forestall the actual downgrade rating action.
On the whole, upgraded hospitals have greater pre-revision changes incash, turnover, and capital expenditures, but smaller changes in financialleverage and facility age, relative to the control group. Downgradedhospitals reveal pre-revision changes that are less for profitability, cash, andcapital expenditures, but greater for financial leverage and facility age.Although profitability changes for the downgraded group are initially less att�2, managers undertake profitability increases at t�1 to signal financialstability and avoid the actual downgrade action, along with its punitiveimplications. This increase to profitability represents a short-term,preemptive response to preserve the pre-downgrade credit rating.
Subsequent to revision, DROA for upgraded hospitals is significantly lessat tþ1, which indicates post-upgrade performance deterioration. This strongnegative change to profitability in the period immediately following upgradesuggests that managerial actions are related to the observed deterioration inprofitability performance. As expected, DCAPEX continues to be greaterfor upgrades one period following the upgrade event (the control variable,TEACH, also becomes significant in expected directions in the post-revisionregressions).
KREAG DANVERS152
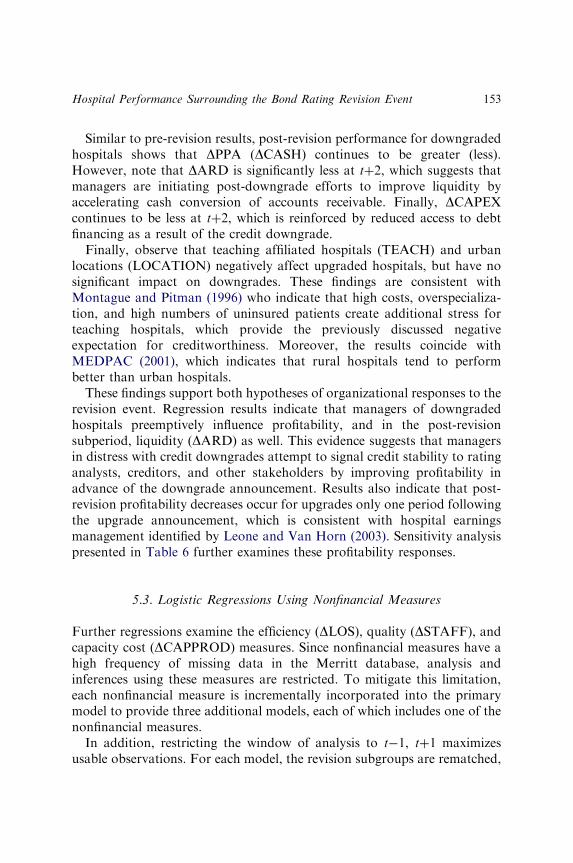
Similar to pre-revision results, post-revision performance for downgradedhospitals shows that DPPA (DCASH) continues to be greater (less).However, note that DARD is significantly less at tþ2, which suggests thatmanagers are initiating post-downgrade efforts to improve liquidity byaccelerating cash conversion of accounts receivable. Finally, DCAPEXcontinues to be less at tþ2, which is reinforced by reduced access to debtfinancing as a result of the credit downgrade.
Finally, observe that teaching affiliated hospitals (TEACH) and urbanlocations (LOCATION) negatively affect upgraded hospitals, but have nosignificant impact on downgrades. These findings are consistent withMontague and Pitman (1996) who indicate that high costs, overspecializa-tion, and high numbers of uninsured patients create additional stress forteaching hospitals, which provide the previously discussed negativeexpectation for creditworthiness. Moreover, the results coincide withMEDPAC (2001), which indicates that rural hospitals tend to performbetter than urban hospitals.
These findings support both hypotheses of organizational responses to therevision event. Regression results indicate that managers of downgradedhospitals preemptively influence profitability, and in the post-revisionsubperiod, liquidity (DARD) as well. This evidence suggests that managersin distress with credit downgrades attempt to signal credit stability to ratinganalysts, creditors, and other stakeholders by improving profitability inadvance of the downgrade announcement. Results also indicate that post-revision profitability decreases occur for upgrades only one period followingthe upgrade announcement, which is consistent with hospital earningsmanagement identified by Leone and Van Horn (2003). Sensitivity analysispresented in Table 6 further examines these profitability responses.
5.3. Logistic Regressions Using Nonfinancial Measures
Further regressions examine the efficiency (DLOS), quality (DSTAFF), andcapacity cost (DCAPPROD) measures. Since nonfinancial measures have ahigh frequency of missing data in the Merritt database, analysis andinferences using these measures are restricted. To mitigate this limitation,each nonfinancial measure is incrementally incorporated into the primarymodel to provide three additional models, each of which includes one of thenonfinancial measures.
In addition, restricting the window of analysis to t�1, tþ1 maximizesusable observations. For each model, the revision subgroups are rematched,
Hospital Performance Surrounding the Bond Rating Revision Event 153
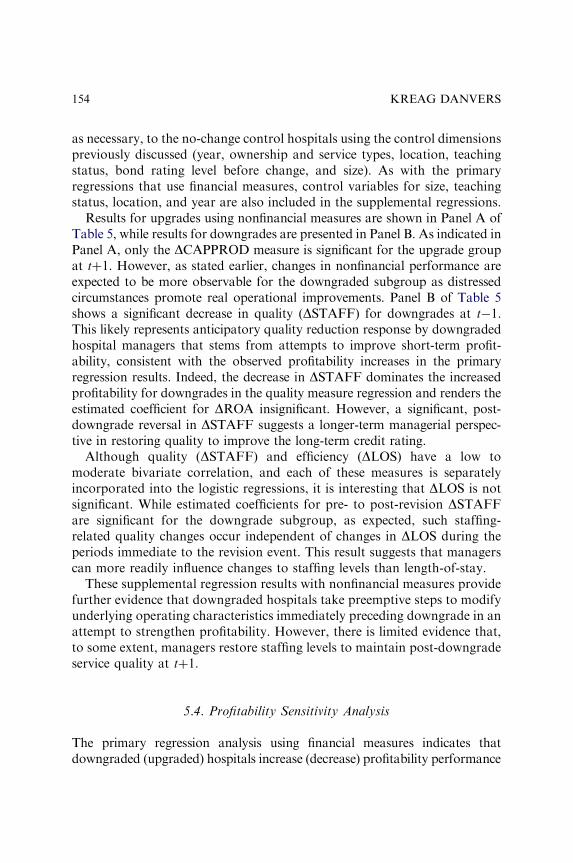
as necessary, to the no-change control hospitals using the control dimensionspreviously discussed (year, ownership and service types, location, teachingstatus, bond rating level before change, and size). As with the primaryregressions that use financial measures, control variables for size, teachingstatus, location, and year are also included in the supplemental regressions.
Results for upgrades using nonfinancial measures are shown in Panel A ofTable 5, while results for downgrades are presented in Panel B. As indicated inPanel A, only the DCAPPROD measure is significant for the upgrade groupat tþ1. However, as stated earlier, changes in nonfinancial performance areexpected to be more observable for the downgraded subgroup as distressedcircumstances promote real operational improvements. Panel B of Table 5shows a significant decrease in quality (DSTAFF) for downgrades at t�1.This likely represents anticipatory quality reduction response by downgradedhospital managers that stems from attempts to improve short-term profit-ability, consistent with the observed profitability increases in the primaryregression results. Indeed, the decrease in DSTAFF dominates the increasedprofitability for downgrades in the quality measure regression and renders theestimated coefficient for DROA insignificant. However, a significant, post-downgrade reversal in DSTAFF suggests a longer-term managerial perspec-tive in restoring quality to improve the long-term credit rating.
Although quality (DSTAFF) and efficiency (DLOS) have a low tomoderate bivariate correlation, and each of these measures is separatelyincorporated into the logistic regressions, it is interesting that DLOS is notsignificant. While estimated coefficients for pre- to post-revision DSTAFFare significant for the downgrade subgroup, as expected, such staffing-related quality changes occur independent of changes in DLOS during theperiods immediate to the revision event. This result suggests that managerscan more readily influence changes to staffing levels than length-of-stay.
These supplemental regression results with nonfinancial measures providefurther evidence that downgraded hospitals take preemptive steps to modifyunderlying operating characteristics immediately preceding downgrade in anattempt to strengthen profitability. However, there is limited evidence that,to some extent, managers restore staffing levels to maintain post-downgradeservice quality at tþ1.
5.4. Profitability Sensitivity Analysis
The primary regression analysis using financial measures indicates thatdowngraded (upgraded) hospitals increase (decrease) profitability performance
KREAG DANVERS154
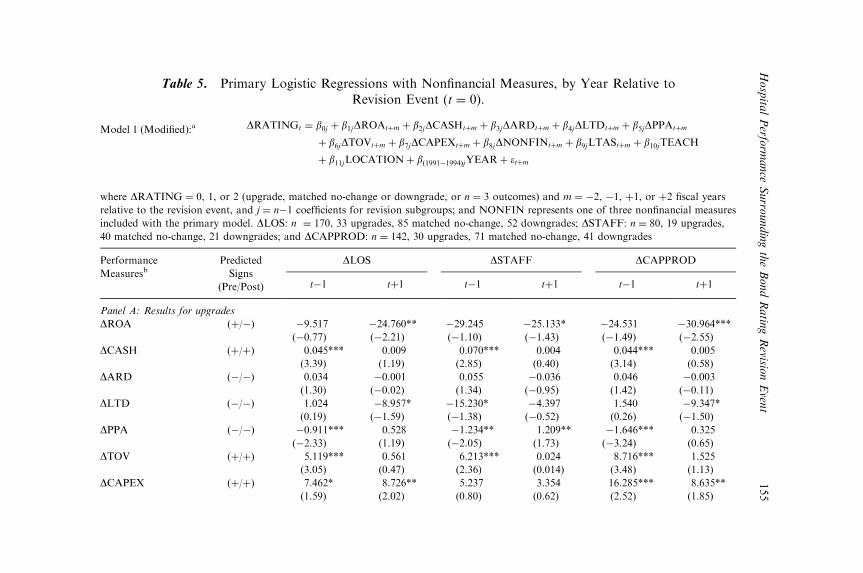
Table 5. Primary Logistic Regressions with Nonfinancial Measures, by Year Relative toRevision Event (t ¼ 0).
Model 1 (Modified):a DRATINGt ¼ b0j þ b1jDROAtþm þ b2jDCASHtþm þ b3jDARDtþm þ b4jDLTDtþm þ b5jDPPAtþm
þ b6jDTOVtþm þ b7jDCAPEXtþm þ b8jDNONFINtþm þ b9jLTAStþm þ b10jTEACH
þ b11jLOCATIONþ bð1991�1994ÞjYEARþ �tþm
where DRATING ¼ 0, 1, or 2 (upgrade, matched no-change or downgrade, or n ¼ 3 outcomes) and m ¼ �2, �1, þ1, or þ2 fiscal years
relative to the revision event, and j ¼ n�1 coefficients for revision subgroups; and NONFIN represents one of three nonfinancial measures
included with the primary model. DLOS: n ¼ 170, 33 upgrades, 85 matched no-change, 52 downgrades; DSTAFF: n ¼ 80, 19 upgrades,
40 matched no-change, 21 downgrades; and DCAPPROD: n ¼ 142, 30 upgrades, 71 matched no-change, 41 downgrades
Performance
MeasuresbPredicted
Signs
(Pre/Post)
DLOS DSTAFF DCAPPROD
t�1 tþ1 t�1 tþ1 t�1 tþ1
Panel A: Results for upgrades
DROA (þ/�) �9.517 �24.760** �29.245 �25.133* �24.531 �30.964***
(�0.77) (�2.21) (�1.10) (�1.43) (�1.49) (�2.55)
DCASH (þ/þ) 0.045*** 0.009 0.070*** 0.004 0.044*** 0.005
(3.39) (1.19) (2.85) (0.40) (3.14) (0.58)
DARD (�/�) 0.034 �0.001 0.055 �0.036 0.046 �0.003
(1.30) (�0.02) (1.34) (�0.95) (1.42) (�0.11)
DLTD (�/�) 1.024 �8.957* �15.230* �4.397 1.540 �9.347*
(0.19) (�1.59) (�1.38) (�0.52) (0.26) (�1.50)
DPPA (�/�) �0.911*** 0.528 �1.234** 1.209** �1.646*** 0.325
(�2.33) (1.19) (�2.05) (1.73) (�3.24) (0.65)
DTOV (þ/þ) 5.119*** 0.561 6.213*** 0.024 8.716*** 1.525
(3.05) (0.47) (2.36) (0.014) (3.48) (1.13)
DCAPEX (þ/þ) 7.462* 8.726** 5.237 3.354 16.285*** 8.635**
(1.59) (2.02) (0.80) (0.62) (2.52) (1.85)
Hospita
lPerfo
rmance
Surro
undingtheBondRatin
gRevisio
nEven
t155
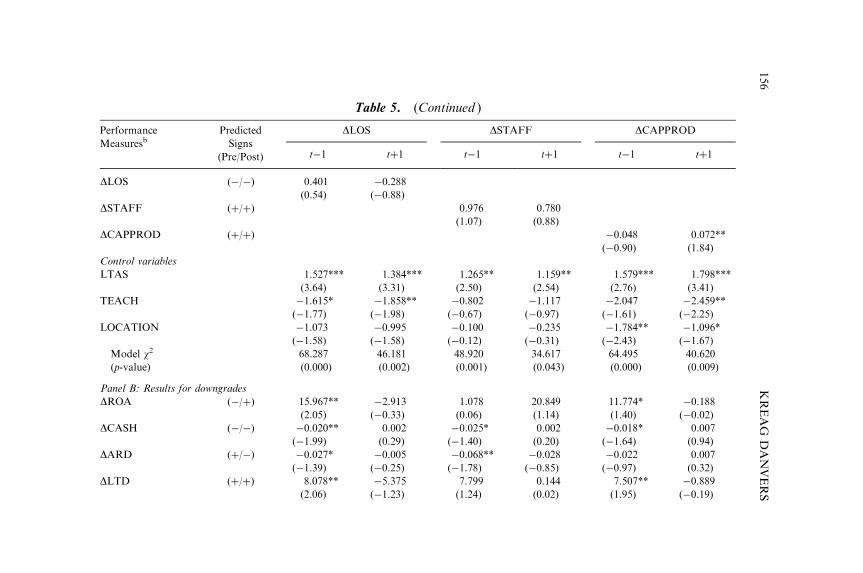
DLOS (�/�) 0.401 �0.288
(0.54) (�0.88)
DSTAFF (þ/þ) 0.976 0.780
(1.07) (0.88)
DCAPPROD (þ/þ) �0.048 0.072**
(�0.90) (1.84)
Control variables
LTAS 1.527*** 1.384*** 1.265** 1.159** 1.579*** 1.798***
(3.64) (3.31) (2.50) (2.54) (2.76) (3.41)
TEACH �1.615* �1.858** �0.802 �1.117 �2.047 �2.459**
(�1.77) (�1.98) (�0.67) (�0.97) (�1.61) (�2.25)
LOCATION �1.073 �0.995 �0.100 �0.235 �1.784** �1.096*
(�1.58) (�1.58) (�0.12) (�0.31) (�2.43) (�1.67)
Model w2 68.287 46.181 48.920 34.617 64.495 40.620
(p-value) (0.000) (0.002) (0.001) (0.043) (0.000) (0.009)
Panel B: Results for downgrades
DROA (�/þ) 15.967** �2.913 1.078 20.849 11.774* �0.188
(2.05) (�0.33) (0.06) (1.14) (1.40) (�0.02)
DCASH (�/�) �0.020** 0.002 �0.025* 0.002 �0.018* 0.007
(�1.99) (0.29) (�1.40) (0.20) (�1.64) (0.94)
DARD (þ/�) �0.027* �0.005 �0.068** �0.028 �0.022 0.007
(�1.39) (�0.25) (�1.78) (�0.85) (�0.97) (0.32)
DLTD (þ/þ) 8.078** �5.375 7.799 0.144 7.507** �0.889
(2.06) (�1.23) (1.24) (0.02) (1.95) (�0.19)
Table 5. (Continued )
Performance
MeasuresbPredicted
Signs
(Pre/Post)
DLOS DSTAFF DCAPPROD
t�1 tþ1 t�1 tþ1 t�1 tþ1
KREAG
DANVERS
156
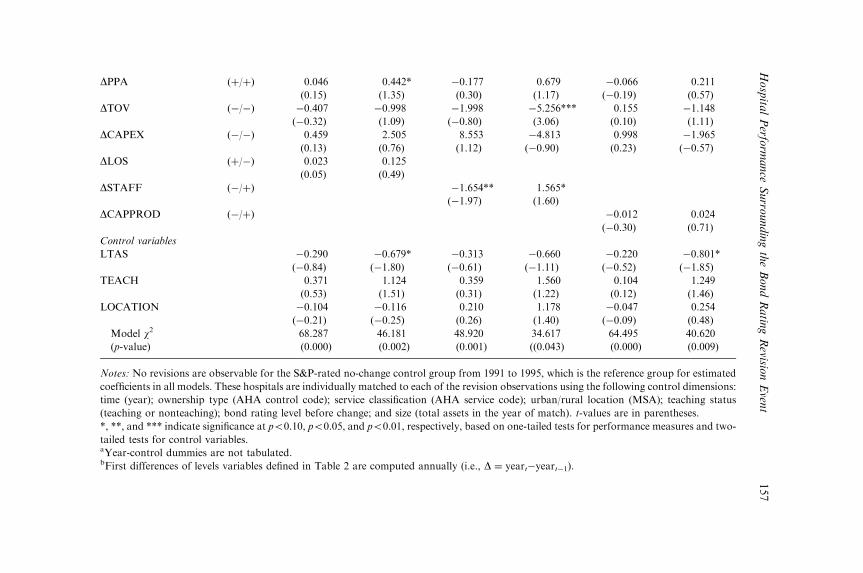
DPPA (þ/þ) 0.046 0.442* �0.177 0.679 �0.066 0.211
(0.15) (1.35) (0.30) (1.17) (�0.19) (0.57)
DTOV (�/�) �0.407 �0.998 �1.998 �5.256*** 0.155 �1.148
(�0.32) (1.09) (�0.80) (3.06) (0.10) (1.11)
DCAPEX (�/�) 0.459 2.505 8.553 �4.813 0.998 �1.965
(0.13) (0.76) (1.12) (�0.90) (0.23) (�0.57)
DLOS (þ/�) 0.023 0.125
(0.05) (0.49)
DSTAFF (�/þ) �1.654** 1.565*
(�1.97) (1.60)
DCAPPROD (�/þ) �0.012 0.024
(�0.30) (0.71)
Control variables
LTAS �0.290 �0.679* �0.313 �0.660 �0.220 �0.801*
(�0.84) (�1.80) (�0.61) (�1.11) (�0.52) (�1.85)
TEACH 0.371 1.124 0.359 1.560 0.104 1.249
(0.53) (1.51) (0.31) (1.22) (0.12) (1.46)
LOCATION �0.104 �0.116 0.210 1.178 �0.047 0.254
(�0.21) (�0.25) (0.26) (1.40) (�0.09) (0.48)
Model w2 68.287 46.181 48.920 34.617 64.495 40.620
(p-value) (0.000) (0.002) (0.001) ((0.043) (0.000) (0.009)
Notes: No revisions are observable for the S&P-rated no-change control group from 1991 to 1995, which is the reference group for estimated
coefficients in all models. These hospitals are individually matched to each of the revision observations using the following control dimensions:
time (year); ownership type (AHA control code); service classification (AHA service code); urban/rural location (MSA); teaching status
(teaching or nonteaching); bond rating level before change; and size (total assets in the year of match). t-values are in parentheses.
*, **, and *** indicate significance at po0.10, po0.05, and po0.01, respectively, based on one-tailed tests for performance measures and two-
tailed tests for control variables.aYear-control dummies are not tabulated.bFirst differences of levels variables defined in Table 2 are computed annually (i.e., D ¼ yeart�yeart�1).
Hospita
lPerfo
rmance
Surro
undingtheBondRatin
gRevisio
nEven
t157
in anticipation of, or in response to, the revision event. Additionalmultivariate analysis is conducted to further examine this phenomenon.Specifically, this sensitivity analysis examines elements of ROA to ascertainwhether changes in major revenue and expense items explain the profitabilityeffects associated with the revision event. By definition, the profitabilitymeasure (ROA) is equivalent to Margin*Turnover. In this sensitivity analysis,margin is expressed as excess revenue over expenses (or net income)/totaloperating revenue. Turnover, as defined earlier, continues to be used in thesensitivity regression. To separate margin into its major constituents,additional financial measures are required.
� SALEXP ¼ salary expense/total operating revenue. SALEXP measures ahospital’s ability to control labor resources relative to total operatingrevenue. The first difference (DSALEXP) should be less (greater) forupgrades (downgrades) in the pre-revision subperiod. However, manage-rial responses should result in DSALEXP that is greater (less) forupgrades (downgrades).� OTHEXP ¼ (total operating expense–salary, depreciation and interestexpenses)/total operating revenue. OTHEXP measures managerial con-trol of other operating expenses relative to total operating revenue. Thepre-revision first difference (DOTHEXP) should be less (greater) forupgrades (downgrades), but with reversals, it is expected for it to begreater (less) for upgrades (downgrades).� OTHREV ¼ nonpatient revenue/total revenue. OTHREV measures thesum of other operating revenue plus nonoperating revenue (e.g.,investment earnings and gift shops) relative to total revenue. Thismeasure reflects managerial efforts to obtain revenue from diversified,nonpatient sources and should be positively associated with credit ratings.Thus the first difference (DOTHREV) should be greater (less) forupgrades (downgrades) across both subperiods.
These supplemental measures are incorporated with the turnover measureand control variables, which results in Model 2
DRATINGt ¼ b0j þ b1jDTOVtþm þ b2jDSALEXPtþm þ b3jDOTHEXPtþm
þ b4jDOTHREVtþm þ b5jLTAStþm þ b6jTEACH
þ b7jLOCATIONþ bð1991�1994ÞjYEARþ �tþm ð2Þ
Where, DRATINGt is a rating revision for hospital i at time t ¼ 0, which isequal to 0, 1, or 2 (upgrade, matched no-change, or downgrade, or n ¼ 3
KREAG DANVERS158
outcomes); and m ¼ �2, �1, þ1, or þ2 fiscal years relative to the revisionevent; and j ¼ n�1 coefficients for revision subgroups.
Similar to the nonfinancial regressions, for each revision subgroup theprofitability sensitivity sample is rematched, as necessary, to no-changecontrol hospitals using the dimensions previously indicated. In addition, thecontrol variables LTAS, TEACH, LOCATION, and YEAR (not tabulated)are incorporated into the regressions. As Table 6 reveals, all pre- and post-revision models are significant (chi-squares ranging from 16.387 for tþ1 to19.640 for t�1). At t�2, upgrades reflect weak reductions in other operatingexpenses, along with positive changes in turnover at t�1 (consistent with theresults presented in Table 4). However, the profitability sensitivity does notexplain the ROA decreases for upgrades at tþ1 observed in the primaryregression.
As expected, DSALEXP for downgrades is greater than the controlsubgroup at t�2. However, in anticipation of the rating downgrade, salaryexpense becomes significantly less for downgrades at t�1, relative to the no-change group. This supports earlier results (indicated in Table 4) andprovides additional evidence of a distress response by hospital managers.Further analyses of the profitability measure for the downgraded groupshow that the level mean ROA increases 1.83 percentage points, from 1.17percent (t�1) to 3.00 percent (tþ1). Moreover, salary expense as apercentage of total operating revenue decreases 1.70 percentage points,from 51.3 percent (t�1) to 49.6 percent (tþ1). Thus, improved profitabilityperformance for downgrades largely results from decreased salary expenseacross the pre- to post-revision intervals. These findings are also consistentwith those obtained earlier for the nonfinancial regressions, which reflectdecreases in pre-revision quality (DSTAFF) at t�1.
Even though downgrades also realize significant reductions in otheroperating expenses (DOTHEXP) at t�1, nonsignificance at tþ1 could reflecta shift toward outsourcing of noncore service (labor-related) activities as acost-saving measure. Therefore, managerial reaction to downgrades focuseson short-term cost reduction and liquidity improvements, partly at theexpense of quality. However, responses reveal little impact on measures suchas length-of-stay that are essential to maintaining long-term financialsolvency.
The sensitivity analysis for upgrades is unable to explain the profitabilityreversal observed at tþ1. To the extent that an earnings plateau has beenreached, statistically insignificant associations between profitability and therevision event should be observed. It is unlikely that a profitability plateauwould result in performance changes that indicate a strong decrease only
Hospital Performance Surrounding the Bond Rating Revision Event 159
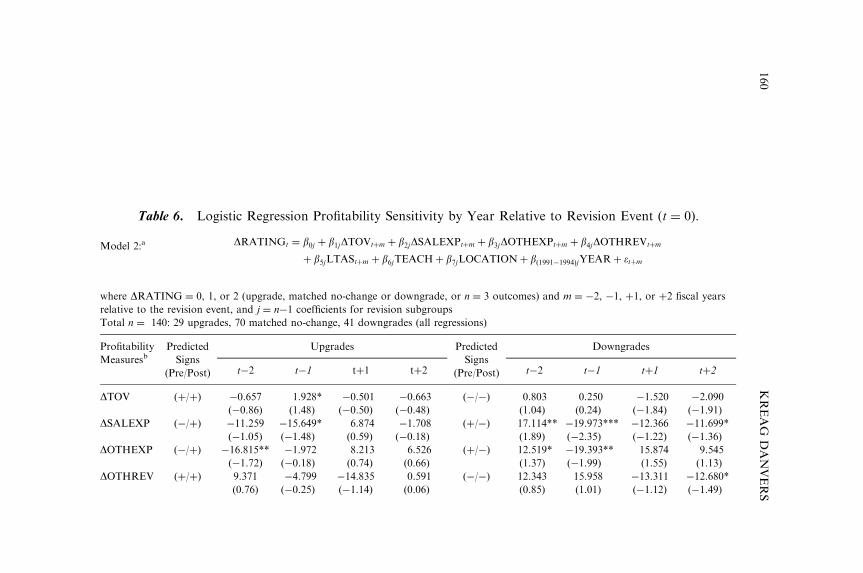
Table 6. Logistic Regression Profitability Sensitivity by Year Relative to Revision Event (t ¼ 0).
Model 2:a DRATINGt ¼ b0j þ b1jDTOVtþm þ b2jDSALEXPtþm þ b3jDOTHEXPtþm þ b4jDOTHREVtþm
þ b5jLTAStþm þ b6jTEACHþ b7jLOCATIONþ bð1991�1994ÞjYEARþ �tþm
where DRATING ¼ 0, 1, or 2 (upgrade, matched no-change or downgrade, or n ¼ 3 outcomes) and m ¼ �2, �1, þ1, or þ2 fiscal years
relative to the revision event, and j ¼ n�1 coefficients for revision subgroups
Total n ¼ 140: 29 upgrades, 70 matched no-change, 41 downgrades (all regressions)
Profitability
MeasuresbPredicted
Signs
(Pre/Post)
Upgrades Predicted
Signs
(Pre/Post)
Downgrades
t�2 t�1 tþ1 tþ2 t�2 t�1 tþ1 tþ2
DTOV (þ/þ) �0.657 1.928* �0.501 �0.663 (�/�) 0.803 0.250 �1.520 �2.090
(�0.86) (1.48) (�0.50) (�0.48) (1.04) (0.24) (�1.84) (�1.91)
DSALEXP (�/þ) �11.259 �15.649* 6.874 �1.708 (þ/�) 17.114** �19.973*** �12.366 �11.699*
(�1.05) (�1.48) (0.59) (�0.18) (1.89) (�2.35) (�1.22) (�1.36)
DOTHEXP (�/þ) �16.815** �1.972 8.213 6.526 (þ/�) 12.519* �19.393** 15.874 9.545
(�1.72) (�0.18) (0.74) (0.66) (1.37) (�1.99) (1.55) (1.13)
DOTHREV (þ/þ) 9.371 �4.799 �14.835 0.591 (�/�) 12.343 15.958 �13.311 �12.680*
(0.76) (�0.25) (�1.14) (0.06) (0.85) (1.01) (�1.12) (�1.49)
KREAG
DANVERS
160
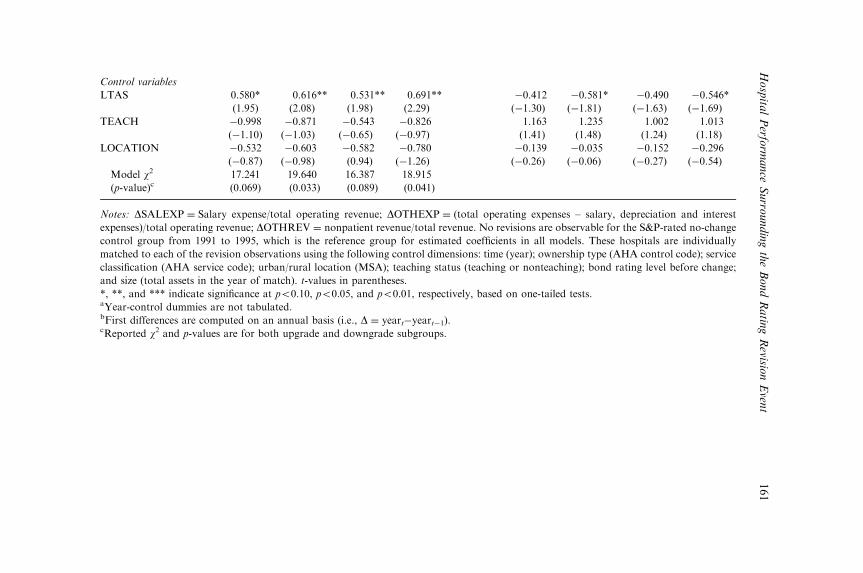
Control variables
LTAS 0.580* 0.616** 0.531** 0.691** �0.412 �0.581* �0.490 �0.546*
(1.95) (2.08) (1.98) (2.29) (�1.30) (�1.81) (�1.63) (�1.69)
TEACH �0.998 �0.871 �0.543 �0.826 1.163 1.235 1.002 1.013
(�1.10) (�1.03) (�0.65) (�0.97) (1.41) (1.48) (1.24) (1.18)
LOCATION �0.532 �0.603 �0.582 �0.780 �0.139 �0.035 �0.152 �0.296
(�0.87) (�0.98) (0.94) (�1.26) (�0.26) (�0.06) (�0.27) (�0.54)
Model w2 17.241 19.640 16.387 18.915
(p-value)c (0.069) (0.033) (0.089) (0.041)
Notes: DSALEXP ¼ Salary expense/total operating revenue; DOTHEXP ¼ (total operating expenses – salary, depreciation and interest
expenses)/total operating revenue; DOTHREV ¼ nonpatient revenue/total revenue. No revisions are observable for the S&P-rated no-change
control group from 1991 to 1995, which is the reference group for estimated coefficients in all models. These hospitals are individually
matched to each of the revision observations using the following control dimensions: time (year); ownership type (AHA control code); service
classification (AHA service code); urban/rural location (MSA); teaching status (teaching or nonteaching); bond rating level before change;
and size (total assets in the year of match). t-values in parentheses.
*, **, and *** indicate significance at po0.10, po0.05, and po0.01, respectively, based on one-tailed tests.aYear-control dummies are not tabulated.bFirst differences are computed on an annual basis (i.e., D ¼ yeart�yeart�1).cReported w2 and p-values are for both upgrade and downgrade subgroups.
Hospita
lPerfo
rmance
Surro
undingtheBondRatin
gRevisio
nEven
t161
one period following upgrade. Such an immediate, negative response wouldbe caused by managerial action around the revision event, rather thanreversion to the mean over time.
Further supplemental analysis that incorporates a depreciation measurein the profitability regression indicates that changes in depreciation expenseare not significantly associated with upgrades. The mean depreciationexpense, as a percentage of total operating revenue, is 5.68 percent at t�1,5.93 percent at t ¼ 0 and 5.99 percent at tþ1, which indicates slight, but notsubstantial increases in depreciation for upgrades. Similar changes indepreciation are observed for the no-change control group. This slightincrease in depreciation expenses would not be due to the use of accelerateddepreciation measures since hospitals typically use straight-line depre-ciation for regulatory and financial reporting purposes. The use of straight-line depreciation for tax-exempt property and Medicare reporting isfurther explained by Green and Baker (1981) and Beggan and McNulty(1991).
In sum, managers anticipate the downward revision and focus onincreasing profitability through short-term cost-reduction efforts, but partlyat the loss of quality (i.e., staffing). Managers also prompt improvements toreceivables collections within two periods following downgrade. Finally,upgraded hospitals have unfavorable post-revision changes in profitability,which reflects reversals of pre-revision actions. These results for upwardrevisions are consistent with prior studies in corporate finance (e.g., Jain &Kini, 1994; Loughran & Ritter, 1997), which find that for-profit firms haveincentives to overstate earnings before stock-based transactions, but thenreveal post-transaction profitability reversals. Overall, my results supportthe notion that managers have incentives to change performance measuresduring the periods immediate to the revision event.
6. SUMMARY AND CONCLUSIONS
I examine managerial behavior in response to a major external event byanalyzing responses to the bond rating revision event across pre- to post-revision intervals. In addition to being an important issue to hospitalmanagers and policymakers, this research may help rating analysts andbondholders better understand managerial behavior and organizationalresponses to widely used rating benchmarks. My findings also enhance ourknowledge of the similarities between nonprofit and for-profit organizationsand related managerial motivations.
KREAG DANVERS162
Multinomial logistic regression results for a national sample of nonprofithospitals indicate that pre-revision changes in profitability, cash, long-termdebt, facility age, asset turnover, and capital expenditures are useful to explainrevisions from the control group. The relevant performance dimensionsidentified in this study closely correspond to the seven hospital performancefactors established by Zeller et al. (1996) and are included in S&P’s not-for-profit hospital ratios and are similar to those cited by McCue et al. (1990) andHCIA, Inc. and Deloitte & Touche, LLP (1995). In addition, Watkins (2000)finds that profitability, capital structure, and inpatient utilization measuresare important in explaining hospital bond rating levels.
More importantly, results reveal that downgraded hospital managersinitiate improvements to pre-revision profitability, and post-revisionliquidity, to signal credit stability. While quality changes are evident 1 yearbefore downgrade, reductions in receivables are not detected until post-revision, which suggests that improving the cash conversion cycle requiresmore time for managers to implement relative to staff-reduction. Thusmanagerial efforts to reduce salary and other operating expenses appear todrive the increases in profitability for downgrades. In fact, downgradedhospitals achieve more than a 1.8 percent improvement in return on assetswithin the (t–1, tþ1) interval relative to the revision event.
However, decreases in quality accompany these cost reductions, whichcould have adverse consequences for patient outcomes and satisfaction. Froma financial disclosure perspective, it may be desirable for users to have thesenonfinancial information elements routinely available in financial statements.This finding further supports those (e.g., Sherman, 1986; Mensah & Chiang,1996; Watkins, 2000; Danvers, 2003) who argue for enhanced hospitalfinancial statement disclosure requirements. Timely financial reporting, alongwith improved disclosure of nonfinancial information such as quality andpatient outcomes, could improve the quality of hospital financial disclosureand reduce the effective cost of capital.
Since managers do not favorably change efficiency and capacity costmeasures that are necessary to support long-term solvency, short-term cost-reduction responses are not likely to be sufficient to avert future increases inthe cost of capital or reduced capital market access. A direct implication ofmore limited ability to obtain debt financing is that the observed reductionsin capital expenditures for downgrades will be perpetuated, which threatensthe long-term survivability of affected nonprofit hospitals.
Conversely, sharply decreasing changes in profitability reported only oneperiod following upgrade suggest that managerial opportunism occursaround the revision action. A profitability sensitivity analysis does not
Hospital Performance Surrounding the Bond Rating Revision Event 163
explain managerial actions related to post-upgrade changes in profitability.One possible explanation for the relative deterioration in profitability forupgrades is that pre-revision earnings management actions undergo post-upgrade reversal. Thus, future research that rigorously examines earningsmanagement within the context of bond rating revisions would providegreater insight regarding this phenomenon.
Moreover, the analysis suggests that managers change financial andnonfinancial measures in response to a significant nonregulatory event,which is consistent with quality benchmarking responses identified by Evanset al. (1997). The results are consistent with prior studies that find hospitalreactions to regulatory events (e.g., Barniv et al., 2000). Results also supportForgione (1999) and Eldenburg and Krishnan (2003) such that nonprofitsector managers have strong incentives to concentrate on profitabilityperformance, similar to that of for-profit organizations.
My results are in line with prior corporate studies of for-profit firms (e.g.,Jain & Kini, 1994; Loughran & Ritter, 1997), which identify incentives tooverstate pre-stock issuance earnings with post-transaction profitabilityreversals. Moreover, the significance of turnover for bond rating revisiondecisions is consistent with early corporate bankruptcy prediction studies,such as Altman (1968), where a main predictive driver was asset turnover.
This research also increases analysts’ knowledge of how organizationsrespond to their rating actions. While managers at downgraded hospitalsinitiate changes to signal short-term credit stability, analysts andbondholders are cautioned to closely monitor the post-revision performanceof recently upgraded issuers. In particular, they should note that relativelystrong pre-upgrade performance could merely be transitory, or be caused bymanagerial actions that are not sustainable, and thus do not reflect analystperformance expectations.
Certain limitations restrict further inferences from this research. First,Medicare began a 10-year transition from cost-based to prospective-payment-based system of capital cost reimbursement effective 1991.Although my model captures some of the salient factors (e.g., location,asset age, teaching, and size), a possible increase in unexplained variancestemming from this regulatory change biases against finding hypothesizedresults. The results might have been stronger were it is possible to morefinely control for the prospective payment transition. In addition, my studydoes not directly control for Medicare and Medicaid percentages ordisproportionate share payments. The use of indirect proxies also biasesagainst finding the hypothesized results. Finally, I do not explicitly control
KREAG DANVERS164
for hospital chain membership, which could affect financial resourcesavailable to the hospital and thus bond ratings.
ACKNOWLEDGMENTS
I very much appreciate helpful comments from anonymous reviewers andPaul Copley, editor. I am truly grateful to my dissertation chairman, RanBarniv, for his ongoing guidance and support, and thank members of mydissertation committee, Joanne Healy and Randy Mount for their valuableinput. I also appreciate helpful comments from participants at the 2000annual meeting of the American Accounting Association and researchassistance from Pradip Haldar and Pavel Nikolov. Finally, I am indebted toMerritt Research Services for providing the Merritt Research Healthcaredatabase.
REFERENCES
Altman, E. I. (1968). Financial ratios, discriminant analysis and the prediction of corporate
bankruptcy. The Journal of Finance, 23(4), 589–609.
American Hospital Association (AHA). (1996). Guide to the health-care field. Chicago:
American Hospital Association.
American Institute of Certified Public Accountants (AICPA). (2003).Health care organizations:
AICPA audit and accounting guide. New York: AICPA, Inc.
Barniv, R., Danvers, K., & Healy, J. (2000). The impact of medicare capital prospective
payment regulation on hospital capital expenditures. Journal of Accounting and Public
Policy, 19(1), 9–40.
Beggan, J. F., & McNulty, L. K. (1991). Restrictions on depreciation where tax-exempt entities
are involved. Topics in Health Care Financing, 18(1), 62–69.
Beith, C., & Goldreich, M. (2000). The hospital blue chips. Health Forum Journal, 43(3), 12–15.
Brickley, J. A., & Horn, R. L. (2002). Managerial incentives in nonprofit organizations:
Evidence from hospitals. Journal of Law and Economics, 45(1), 227–249.
Burgstahler, D. C., & Eames, M. J. (2003). Earnings management to avoid losses and earnings
decreases: Are analysts fooled? Contemporary Accounting Research, 20(2), 253–294.
Cohodes, D. R., & Kinkead, B. M. (1984). Hospital capital formation in the 1980s. Baltimore:
The Johns Hopkins University Press.
Copeland, R. M., & Ingram, R. W. (1982). The association between municipal accounting
information and bond rating changes. Journal of Accounting Research, 20(2), 275–289.
Danvers, K. (2003). An examination of rating agency explanations for credit rating changes in
the hospital sector. Journal of Public Budgeting, Accounting & Financial Management,
15(2), 176–201.
Defond, M. L., & Jiambalvo, J. (1994). Debt covenant violation and manipulation of accruals.
Journal of Accounting and Economics, 17(1,2), 145–176.
Hospital Performance Surrounding the Bond Rating Revision Event 165
Degeorge, F., Patel, J., & Zeckhauser, R. (1999). Earnings management to exceed thresholds.
The Journal of Business, 72(1), 1–33.
Dunbar, A. E., & Phillips, J. (1997). The effect of tax policy on charitable contributions: The
case of nonitemizing taxpayers. The Journal of the American Taxation Association,
19 (Suppl.), 1–20.
Eldenburg, L., & Krishnan, R. (2003). Public versus private governance: A study of incentives
and operational performance. Journal of Accounting and Economics, 35(3), 377–404.
Eldenburg, L., & Vines, C. C. (2004). Nonprofit classification decisions in response to a change
in accounting rules. Journal of Accounting and Public Policy, 23(1), 1–22.
Erickson, M., & Wang, S. (1999). Earnings management by acquiring firms in stock for stock
merger. Journal of Accounting and Economics, 27(2), 149–176.
Evans, J. H., III., Hwang, Y., & Nagarajan, N. (2001). Management control and hospital cost
reduction: Additional evidence. Journal of Accounting and Public Policy, 20(1), 3–88.
Evans, J. H., III., Hwang, Y., Nagarajan, N., & Shastri, K. (1997). Involuntary benchmarking
and quality improvement: The effect of mandated public disclosures on hospitals.
Journal of Accounting, Auditing & Finance, 12(3), 315–346.
Fisher, S. A., & Fisher, D. M. (1993). Independent auditor switching and changes in corporate
bond ratings. Journal of Applied Business Research, 9(2), 50–54.
Forgione, D. A. (1999). Health care accounting research: A review of the professional literature,
models, data, and research opportunities. In: P. A. Copley (Ed.), Research in governmental
and nonprofit accounting (Vol. 10, pp. 163–199). Greenwich, CT: JAI Press.
Gardner, J. (1998). The other shoe drops. Modern Healthcare, 28(49), 24.
Green, R., & Baker, T. (1981). Paging Dr. Adam Smith. Forbes, 127(8), 152.
Green, S. L. (1990). The effects of altering the amount of data in governmental financial reports
on analysts’ predictions of bond ratings. In: J. L. Chan & J. M. Patton (Eds), Research in
governmental and nonprofit accounting (Vol. 6, pp. 3–33). Greenwich, CT: JAI Press.
HCIA, Inc. and Deloitte & Touche, LLP. (1995). The comparative performance of U.S.
hospitals: The Sourcebook. Baltimore.
Healthcare Financial Management Association. (2001). Not-for-profit, for-profit hospital ratings
studied, 55(6), 21.
Ingram, R. W., Raman, K. K., & Wilson, E. R. (1989). The information in governmental
annual reports: A contemporaneous price reaction approach. The Accounting Review,
64(2), 250–268.
Iskandar, M. (1991). Evidence of nonstationarity in the bond rating process for newly issued
bonds: A note. Journal of Applied Business Research, 8(1), 124–128.
Jain, B. A., & Kini, O. (1994). The post-issue operating performance of IPO firms. The Journal
of Finance, 49(5), 1699–1726.
Leone, A., & Van Horn, R. (2003). Earnings management in not-for-profit institutions: Evidence
from hospitals. Working Paper. University of Rochester.
Loughran, T., & Ritter, J. R. (1995). The new issues puzzle. The Journal of Finance, 50(1), 23–51.
Loughran, T., & Ritter, J. R. (1997). The operating performance of firms conducting seasoned
equity offerings. The Journal of Finance, 52(5), 1823–1850.
Louis, H. (2004). Earnings management and the market performance of acquiring firms.
Journal of Financial Economics, 74(1), 121.
Lynch, L. J. (2003). The effect of medicare capital prospective payment regulation: Additional
evidence from hospital financing decisions. Journal of Accounting and Public Policy,
22(2), 151–173.
KREAG DANVERS166
McCue, M. J., Renn, S. C., & Pillari, G. D. (1990). Factors affecting credit rating downgrades
of hospital revenue bonds. Inquiry, 27(3), 242–254.
MEDPAC. (2001). Financial performance of rural hospitals and the value of special payment
policies, June. Report to the Congress, Medicare in Rural America.
Mensah, Y. M., & Chiang, C. C. (1996). The informativeness of operating statements for
commercial nonprofit enterprises. Journal of Accounting and Public Policy, 15(3), 219–246.
Mensah, Y. M., Considine, J. M., & Oakes, L. (1994). Statutory insolvency regulations
and earnings management in the prepaid health-care industry. The Accounting Review,
69(1), 70–95.
Merritt Research Healthcare Database. (2001). Merritt Research Services LLC. Cedar Rapids, IA.
Montague, J., & Pitman, H. (1996). Finance: Teaching hospitals face credit crunch. Hospitals
and Health Networks, 70(4), 24.
Pallarito, K. (1998). The price of secrecy. Modern Healthcare, 28(50), 37, 41.
Pallarito, K. (1999). 1998 bond sales shatter record. Modern Healthcare, 29(3), 37–39.
Palm, K. S. (1988). Credit ratings at nation’s hospitals slipping. Modern Healthcare, 18(4),
18–19, 22.
Payne, C. T. (1995). Strategic capital planning for healthcare organizations. Chicago: Probus
Publishing Company.
Picker, I. (1991). The ratings game. Institutional Investor, 25(9), 73–77.
Pink, G. H., & Leatt, P. (1991). Are managers compensated for hospital financial performance?
Health Care Management Review, 16(3), 37–45.
Raman, K. K. (1981). Financial reporting and municipal bond rating changes. The Accounting
Review, 56(4), 910–926.
Robbins, W. A., Turpin, R., & Polinsky, P. (1993). Economic incentives and accounting choice
strategy by nonprofit hospitals. Financial Accountability & Management, 9(3), 159–175.
Rosner, R. L. (2003). Earnings manipulation in failing firms. Contemporary Accounting
Research, 20(2), 361–408.
Sengupta, P. (1998). Corporate disclosure quality and the cost of debt. The Accounting Review,
73(4), 459–474.
Sherman, D. H. (1986). Interpreting hospital performance with financial statement analysis. The
Accounting Review, 61(3), 526–550.
Soderstrom, N. S. (1993). Hospital behavior under medicare incentives. Journal of Accounting
and Public Policy, 12(2), 155–185.
Standard & Poor’s Creditweek. (1991–1995). New York, NY: The McGraw-Hill Co.
Standard & Poor’s Creditweek – Municipal Finance Criteria. (1995). New York, NY: The
McGraw-Hill Co.
Standard & Poor’s Creditweek – Public Finance Criteria. (1997). New York, NY: The McGraw-
Hill Co.
Standard & Poor’s Creditweek – Viewpoint on Secondary Markets. (1996). New York, NY: The
McGraw-Hill Co.
Sweeney, A. P. (1994). Debt-covenant violations and managers’ accounting responses. Journal
of Accounting and Economics, 17(3), 281–308.
Wakeman, L. M. (1990). The real function of bond rating agencies. In: C. Smith (Ed.), The
modern theory of corporate finance (2nd ed.). New York: McGraw-Hill.
Wallace, W. A. (1986). The timing of initial independent audits of municipalities: An empirical
analysis. In: J. L. Chan (Ed.), Research in governmental and nonprofit accounting (Vol. 2,
pp. 3–51). Greenwich, CT: JAI Press.
Hospital Performance Surrounding the Bond Rating Revision Event 167

Watkins, A. L. (2000). Hospital financial ratio classification patterns revisited: Upon
considering nonfinancial information. Journal of Accounting and Public Policy, 19(1),
73–95.
Wheeler, J., Smith, D. G., Rivenson, H. L., & Reiter, K. L. (2000). Capital structure strategy in
health care systems. Journal of Health Care Finance, 26(4), 42–52.
Williams, S. (2005). In his blood. Modern Healthcare, 35(3), 28–29.
Wyatt-Johnson, C., & Bennett, C. J. (2004). Calibrating executive compensation. Trustee, 57(3),
12–14, 19–20.
Zeller, T. L., Stanko, B. B., & Cleverley, W. O. (1996). A revised classification pattern of
hospital financial ratios. Journal of Accounting and Public Policy, 15(2), 161–182.
KREAG DANVERS168
DID BOND PRICES REFLECT
ACCRUAL BASIS
APPROXIMATIONS BEFORE GASB
STATEMENT NO. 34?
Jacqueline L. Reck, Ottalee Schiffel and
Earl R. Wilson
ABSTRACT
Using information reported in pre-Statement No. 34 financial reports, weemploy bond pricing regression models to test whether approximationsof accrual information are incrementally associated with new issueborrowing costs after controlling for the effects of traditional modifiedaccrual, fund-based information. Our results suggest that even beforeGASB Statement No. 34 was issued, bond analysts utilized government-wide economic resources measures to determine interest costs on newmunicipal bond issues.
INTRODUCTION
In June 1999, the Governmental Accounting Standards Board (GASB)issued Statement No. 34: Basic Financial Statements – and Management’s
Research in Governmental and Nonprofit Accounting, Volume 12, 169–187
Copyright r 2009 by Emerald Group Publishing Limited
All rights of reproduction in any form reserved
ISSN: 0884-0741/doi:10.1108/S0884-0741(2009)0000012009
169
Discussion and Analysis – for State and Local Governments that vastly alteredthe reporting requirements for state and local governments. The impetus forthe change was the Board’s belief that financial statements should provideusers with additional entity-wide information that could be used to betterassess a government’s financial condition. To that end, GASB required thatfinancial information for government activities be reported not only on amodified accrual basis (with a focus on sources and uses of funds) but alsoon the accrual basis. By using accrual accounting, governments are able toprovide information from an economic perspective; wherein the governmentis considered as a single economic unit composed of both current and non-current assets and liabilities.
The implementation of the reporting model was controversial, withgovernmental accounting professionals arguing that accrual informationwould not provide sufficient value to financial statement users to justify itshigh cost to preparers. While accrual information may indeed provide morecomplete, objective, and comparable information, particularly about thelong-term effects of financial policy, little empirical evidence exists that suchinformation is useful. Our finding that accrual information has incrementalvalue over traditional modified accrual information helps address thequestion of whether accrual information is useful. Interestingly, our resultsare based on data from the period prior to GASB Statement No. 34,indicating that accrual information was already being impounded by users.Therefore, the question raised by our research is whether the more preciseinformation provided by Statement No. 34 increases the usefulness ofaccrual information.
We assess whether net interest costs of new bond issues reflect accrualinformation in addition to the modified accrual information reported ingovernmental fund financial statements in periods prior to GASB StatementNo. 34 implementation. Our results differ from Plummer, Hutchison, andPatton (2007), who found that it is the balance sheet information thathas incremental value. We find that accrual operating information hasincremental value relative to modified accrual operating information.Neither modified accrual nor accrual balance sheet information appears tobe significantly relevant in determining net interest costs for new bondissues.
The next section provides theory and develops the hypothesis. The Designand Sample Selection section presents the research design and describesthe sample. A results section is then presented, followed by a sectioncontaining a discussion and concluding remarks.
JACQUELINE L. RECK ET AL.170
THEORY AND HYPOTHESIS DEVELOPMENT
In issuing Statement No. 34, GASB (1999) argued that users need financialinformation prepared using both the modified accrual and the accrual basisof accounting. The modified accrual basis of accounting, long used bygovernments, provides users with information concerning compliance andspending control. GASB identifies modified accrual accounting as helpingusers assess the current financial position of the entity and whether the entityhas operated within its means – fiscal accountability. However, the modifiedaccrual basis of accounting only recognizes revenue when it is availablefor current period spending and reports costs incurred as expenditures.Under GASB Statement No. 34, accrual accounting recognizes revenues inthe reporting period in which an exchange transaction occurs or, in the caseof non-exchange transactions, such as taxes, when GASB specified non-exchange requirements are met. The recognition criteria do not require thatthe revenue be available for current period spending. Under accrualaccounting, costs are reported as expenses in the reporting period in whichthe costs are used to provide goods or services, as opposed to the period inwhich the costs are incurred. Additionally, under GASB Statement No. 34,accrual accounting requires reporting related to non-current assets andliabilities that was not previously required; for example, recording ofinfrastructure and the depreciation of capital assets.
GASB Statement No. 34 asserts that the accrual basis of accounting helpsusers understand the long-term effect that current decisions have on futureperformance, and thus the ability to meet future obligations. Based on theGASB’s assertion and prior corporate research we expect, even in thepresence of modified accrual information, that accrual information will berelevant in pricing municipal bonds. Furthermore, while precise accrualmeasures were not available before GASB Statement No. 34, a number ofaccrual approximations could be made in the pre-Statement No. 34 period.If accrual information is of value in pricing municipal bonds, we expect thatsuch accrual approximations are incorporated into bond prices. Therefore,we hypothesize that:
In the pre-GASB Statement No. 34 period, accrual accounting information is associated
with net interest costs on new bond issues, after controlling for the effects of modified
accrual information.
Further, we expect a directional association between accrual financialinformation and net interest cost, specifically that favorable accrual
Did Bond Prices Reflect Accrual Approximations? 171
information is associated with lower net interest cost while unfavorableinformation is associated with higher cost.
Since governments reported using the modified accrual basis beforeGASB Statement No. 34, and continue to use modified accrual subsequentto GASB Statement No. 34, the question of interest is whether accrualinformation provides value to users in the presence of modified accrualinformation. Indeed, it is the GASB’s belief that accrual informationsupplements modified accrual information, not supplants the information.Prior municipal bond market research (see reviews by Ingram, Raman, &Wilson, 1987; Reck, Wilson, Gotlob, & Lawrence, 2004) provides evidenceon the usefulness of modified accrual accounting information in pricing newissues. Therefore, relying on the GASB’s belief and prior research, weanticipate that financial accounting measures based on modified accrualaccounting will also be significant to the market.
DESIGN AND SAMPLE SELECTION
Empirical Models
We develop regression models in which interest cost (IntCost) is regressedon financial and control variables that represent bond-specific attributesand market factors known to affect interest costs on municipal bonds.Interest cost is measured as the net, or true, interest cost aggregated acrossthe various maturities of each serial bond issue in our sample of municipalgeneral obligation bonds. Net interest cost has been used for decades in theprimary market for municipal bonds as a measure for evaluating competingbids from underwriters. It is calculated by averaging the interest cost acrossall maturities of bonds in a serial issue, weighted by the total dollar amountmaturing in each year. For approximately 36 percent of bond issues in oursample for which true interest cost is not reported, we control for differencesby including an indicator control variable in the model.
Table 1 describes the variables used in the regression models. In additionto TIC_Dum, we include three other bond-specific variables (AvgMaturity,Insured, and LowRating) to control for their effects on interest costs. Bondswith higher average term to maturity (AvgMaturity) are more susceptibleto both interest rate and default risk and thus require higher interest rates.Many governments purchase bond insurance to reduce borrowing costs.Insured bonds (Insured) reflect the bond rating of the insurer, rather thanthe government. Bonds with lower bond ratings demand higher yields to
JACQUELINE L. RECK ET AL.172
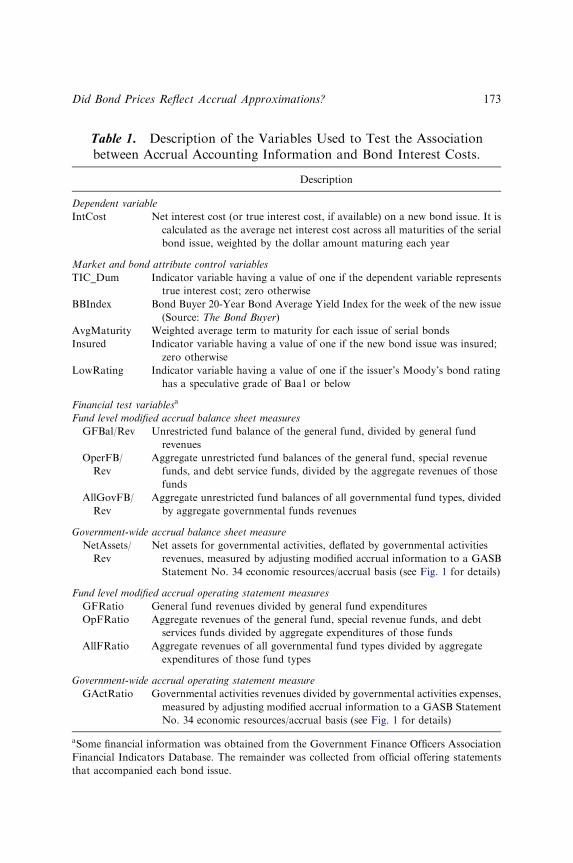
Table 1. Description of the Variables Used to Test the Associationbetween Accrual Accounting Information and Bond Interest Costs.
Description
Dependent variable
IntCost Net interest cost (or true interest cost, if available) on a new bond issue. It is
calculated as the average net interest cost across all maturities of the serial
bond issue, weighted by the dollar amount maturing each year
Market and bond attribute control variables
TIC_Dum Indicator variable having a value of one if the dependent variable represents
true interest cost; zero otherwise
BBIndex Bond Buyer 20-Year Bond Average Yield Index for the week of the new issue
(Source: The Bond Buyer)
AvgMaturity Weighted average term to maturity for each issue of serial bonds
Insured Indicator variable having a value of one if the new bond issue was insured;
zero otherwise
LowRating Indicator variable having a value of one if the issuer’s Moody’s bond rating
has a speculative grade of Baa1 or below
Financial test variablesa
Fund level modified accrual balance sheet measures
GFBal/Rev Unrestricted fund balance of the general fund, divided by general fund
revenues
OperFB/
Rev
Aggregate unrestricted fund balances of the general fund, special revenue
funds, and debt service funds, divided by the aggregate revenues of those
funds
AllGovFB/
Rev
Aggregate unrestricted fund balances of all governmental fund types, divided
by aggregate governmental funds revenues
Government-wide accrual balance sheet measure
NetAssets/
Rev
Net assets for governmental activities, deflated by governmental activities
revenues, measured by adjusting modified accrual information to a GASB
Statement No. 34 economic resources/accrual basis (see Fig. 1 for details)
Fund level modified accrual operating statement measures
GFRatio General fund revenues divided by general fund expenditures
OpFRatio Aggregate revenues of the general fund, special revenue funds, and debt
services funds divided by aggregate expenditures of those funds
AllFRatio Aggregate revenues of all governmental fund types divided by aggregate
expenditures of those fund types
Government-wide accrual operating statement measure
GActRatio Governmental activities revenues divided by governmental activities expenses,
measured by adjusting modified accrual information to a GASB Statement
No. 34 economic resources/accrual basis (see Fig. 1 for details)
aSome financial information was obtained from the Government Finance Officers Association
Financial Indicators Database. The remainder was collected from official offering statements
that accompanied each bond issue.
Did Bond Prices Reflect Accrual Approximations? 173
compensate for their higher assessed default risk. To control for this effect,we include an indicator variable, LowRating, to indicate if a bond issuehas a speculative Moody’s grade of Baa1 or less. Finally, interest costs onnew bond issues tend to rise and fall with changes in market interest ratesfor municipal bonds. Thus, we include the Bond Buyer 20-Year BondAverage Yield Index (BBIndex) for the same week as each new bond issuein our sample.
The modified accrual basis of accounting is used for reporting govern-mental funds – general fund (the primary governmental fund), specialrevenue funds, debt service funds, and capital projects funds.1 All but thecapital projects fund are considered operating type funds. Wilson (1990)summarizes prior research on the impact of varying levels of aggregation offinancial information on bond decisions. His findings suggest that manyanalysts find aggregated operating fund information helpful, but expressconcerns about obscuring general fund information. A minority of Wilson’srespondents indicated that fully aggregated information – both operatingand capital information combined – would be useful in making bondinvestment decisions. Because the relative usefulness of different aggregationlevels has not been clearly established by prior research, we test theincremental value relevance of accrual governmental accounting informa-tion relative to traditional modified accrual information using threealternative levels of aggregation for the modified accrual information:(1) general fund information only, (2) all governmental operating funds(general fund and aggregate of all special revenue and debt service funds),and (3) all governmental funds (i.e., governmental operating funds pluscapital projects funds). For each of these three alternative models, balancesheet ratios and operating statement ratios reflecting both modified andaccrual bases of accounting are included as test variables.2
IntCost ¼ a0 þ b1TIC_Dumþ b2BBIndexþ b3AvgMaturity
þ b4Insuredþ b5LowRating
þ g6GFBal=Revþ g7NetAssets=Rev
þ g8GFRatioþ g9GActRatioþ m ð1Þ
IntCost ¼ a0 þ b1TIC_Dumþ b2BBIndexþ b3AvgMaturity
þ b4Insuredþ b5LowRating
þ g6OpFB=Revþ g7NetAssets=Rev
þ g8OpFRatioþ g9GActRatioþ m ð2Þ
JACQUELINE L. RECK ET AL.174
IntCost ¼ a0 þ b1TIC_Dumþ b2BBIndexþ b3AvgMaturity
þ b4Insuredþ b5LowRating
þ g6AllGovFB=Revþ g7NetAssets=Rev
þ g8AllFRatioþ g9GActRatioþ m ð3Þ
All variables are described in Table 1. In these models, the variables withb coefficients are bond-specific and market control variables and thosewith g coefficients are test variables. The ordinary least squares error term ineach model is m. Variables corresponding to coefficients g6 and g7 representmodified and accrual balance sheet ratios, respectively. Variables corre-sponding to coefficients g8 and g9 represent modified and accrual operatingstatement ratios, respectively. If coefficients g7 and g9 differ significantlyfrom zero, the hypothesis that accrual information is incrementally relevantin pricing municipal bonds will be supported.
Sample
Our sample consists of 72 general obligation bond issues made by 42 citiesduring 1996–1998. The sample represents cities for which bond issue datawere available from the Thompson Municipal Data Services databaseand for which all required financial data were provided by either theGovernment Finance Officers Association (GFOA) Financial IndicatorsDatabase or from official offering statements obtained directly from theissuing governments. Cities less than 25,000 in population are excluded fromthe sample as bond data are unavailable for these cities. Cities with morethan 1 million are also excluded. Although only 72 observations are used inthe study, these issuers are located in 22 different states, representingvarying geographic regions of the United States.
The data for the dependent variable and the control variables wereobtained from the Thompson Municipal TM3 Database, a subscriptionservice of the Thompson Municipal Group. Financial test variables wereobtained primarily from the GFOA’s annual Financial Indicators Data-bases for the years 1994–1998. Data needed to calculate the values of theeconomic resources test variables NetAssets/Rev and GActRatio wereobtained from both the GFOA databases and official offering statementsobtained from the issuers. The components used to estimate the accrual testvariables NetAssets/Rev and GActRatio are shown on Fig. 1.3 Since beforethe implementation of GASB Statement No. 34 governments did not report
Did Bond Prices Reflect Accrual Approximations? 175
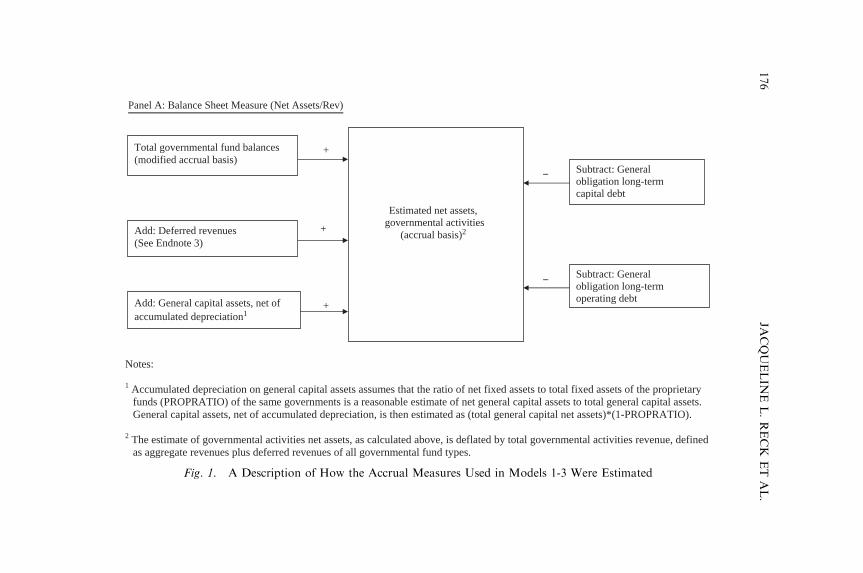
Panel A: Balance Sheet Measure (Net Assets/Rev)
+
−
−
+
+
Total governmental fund balances (modified accrual basis)
Estimated net assets, governmental activities
(accrual basis)2Add: Deferred revenues (See Endnote 3)
Add: General capital assets, net of accumulated depreciation1
Subtract: General obligation long-term capital debt
Subtract: General obligation long-term operating debt
Notes:
1 Accumulated depreciation on general capital assets assumes that the ratio of net fixed assets to total fixed assets of the proprietary funds (PROPRATIO) of the same governments is a reasonable estimate of net general capital assets to total general capital assets. General capital assets, net of accumulated depreciation, is then estimated as (total general capital net assets)*(1-PROPRATIO).
2 The estimate of governmental activities net assets, as calculated above, is deflated by total governmental activities revenue, defined as aggregate revenues plus deferred revenues of all governmental fund types.
Fig. 1. A Description of How the Accrual Measures Used in Models 1-3 Were Estimated
JACQUELIN
EL.RECK
ET
AL.
176
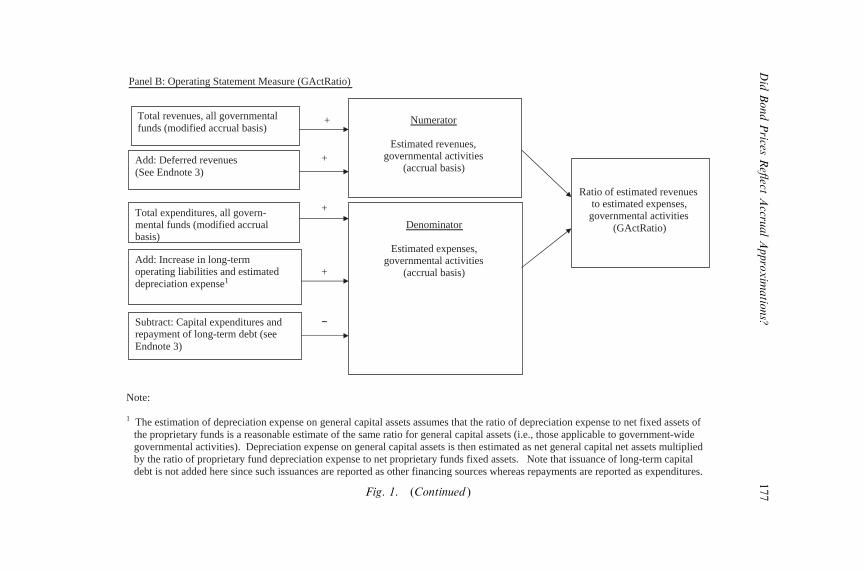
Panel B: Operating Statement Measure (GActRatio)
+
+
+
+
−
Total revenues, all governmental funds (modified accrual basis)
Numerator
Estimated revenues, governmental activities
(accrual basis) Add: Deferred revenues (See Endnote 3)
Add: Increase in long-term operating liabilities and estimated depreciation expense1
Ratio of estimated revenues to estimated expenses, governmental activities
(GActRatio) Denominator
Estimated expenses, governmental activities
(accrual basis)
Total expenditures, all govern-mental funds (modified accrual basis)
Subtract: Capital expenditures and repayment of long-term debt (see Endnote 3)
Note:
1 The estimation of depreciation expense on general capital assets assumes that the ratio of depreciation expense to net fixed assets of the proprietary funds is a reasonable estimate of the same ratio for general capital assets (i.e., those applicable to government-wide governmental activities). Depreciation expense on general capital assets is then estimated as net general capital net assets multiplied by the ratio of proprietary fund depreciation expense to net proprietary funds fixed assets. Note that issuance of long-term capital debt is not added here since such issuances are reported as other financing sources whereas repayments are reported as expenditures.
Fig. 1. (Continued )
Did
BondPrices
Reflect
Accru
alApproxim
atio
ns?
177

depreciation on their general capital assets, we estimate depreciation for thegovernment-wide operating results variable (GActRatio) by multiplyingthe book value of governmental assets by a depreciation ratio derived fromdepreciable proprietary fund assets, assuming that the ratio would be areasonable approximation for depreciable governmental activity assets.
RESULTS
Descriptive Statistics
Table 2, Panel A, provides descriptive statistics for all variables used in theregressions. The Bond Buyer 20-Year Bond Average Yield Index of 5.348percent is somewhat higher than the average interest cost for bonds in oursample, primarily because the Bond Buyer’s index is calculated for bonds oflonger average maturity. The average maturity for bonds in our sample isslightly more than 10 years, ranging from 3 to 18.6 years. Over a third of thebonds in our sample are insured, automatically conferring a Moody’s Aaabond rating for those bonds. Reflecting the favorable national economyduring the late 1990s, only 1.4 percent of our sample has a bond ratingbelow an A rating, a level considered to be somewhat speculative, thoughstill an investment grade rating.
The balance sheet test variables also reflect the prevailing favorablefinancial conditions of the late 1990s.4 Significantly, not a single city had ageneral fund balance less than the five percent that is usually regarded asa ‘‘red flag’’ to credit analysts.
Operating statement measures reflect similarly positive financial results.Revenues exceed expenditures in the general fund by an average 4.8 percent(see variable GFRatio) and total operating revenues exceed total operatingexpenditures by 2.8 percent (OpFRatio). When deferred revenues areincluded, total governmental revenues measured on the accrual basis, exceedtotal governmental expenses, including those for pensions and estimateddepreciation expense, by 31.2 percent (GActRatio).
Table 2, Panel B, provides descriptive statistics for the various componentmeasures used to estimate the two government-wide test variablesNetAssets/Rev and GActRatio. As shown, deferred revenues, repaymentof debt principal, and estimated depreciation expense are relatively minoradjustments to governmental fund revenues and expenditures in estimatingthe two government-wide test variables. Finally, Table 3 presents bivariatecorrelations for all continuous variables used in the regression.
JACQUELINE L. RECK ET AL.178
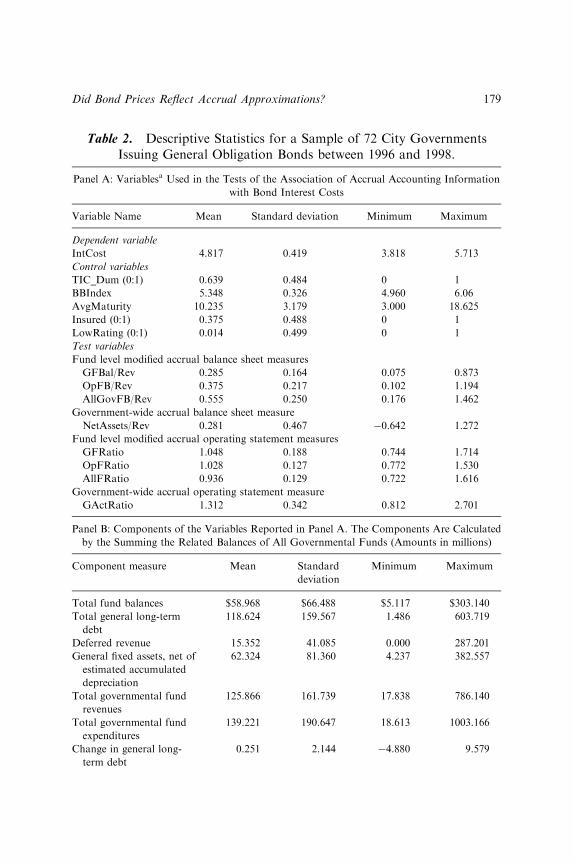
Table 2. Descriptive Statistics for a Sample of 72 City GovernmentsIssuing General Obligation Bonds between 1996 and 1998.
Panel A: Variablesa Used in the Tests of the Association of Accrual Accounting Information
with Bond Interest Costs
Variable Name Mean Standard deviation Minimum Maximum
Dependent variable
IntCost 4.817 0.419 3.818 5.713
Control variables
TIC_Dum (0:1) 0.639 0.484 0 1
BBIndex 5.348 0.326 4.960 6.06
AvgMaturity 10.235 3.179 3.000 18.625
Insured (0:1) 0.375 0.488 0 1
LowRating (0:1) 0.014 0.499 0 1
Test variables
Fund level modified accrual balance sheet measures
GFBal/Rev 0.285 0.164 0.075 0.873
OpFB/Rev 0.375 0.217 0.102 1.194
AllGovFB/Rev 0.555 0.250 0.176 1.462
Government-wide accrual balance sheet measure
NetAssets/Rev 0.281 0.467 �0.642 1.272
Fund level modified accrual operating statement measures
GFRatio 1.048 0.188 0.744 1.714
OpFRatio 1.028 0.127 0.772 1.530
AllFRatio 0.936 0.129 0.722 1.616
Government-wide accrual operating statement measure
GActRatio 1.312 0.342 0.812 2.701
Panel B: Components of the Variables Reported in Panel A. The Components Are Calculated
by the Summing the Related Balances of All Governmental Funds (Amounts in millions)
Component measure Mean Standard
deviation
Minimum Maximum
Total fund balances $58.968 $66.488 $5.117 $303.140
Total general long-term
debt
118.624 159.567 1.486 603.719
Deferred revenue 15.352 41.085 0.000 287.201
General fixed assets, net of
estimated accumulated
depreciation
62.324 81.360 4.237 382.557
Total governmental fund
revenues
125.866 161.739 17.838 786.140
Total governmental fund
expenditures
139.221 190.647 18.613 1003.166
Change in general long-
term debt
0.251 2.144 �4.880 9.579
Did Bond Prices Reflect Accrual Approximations? 179
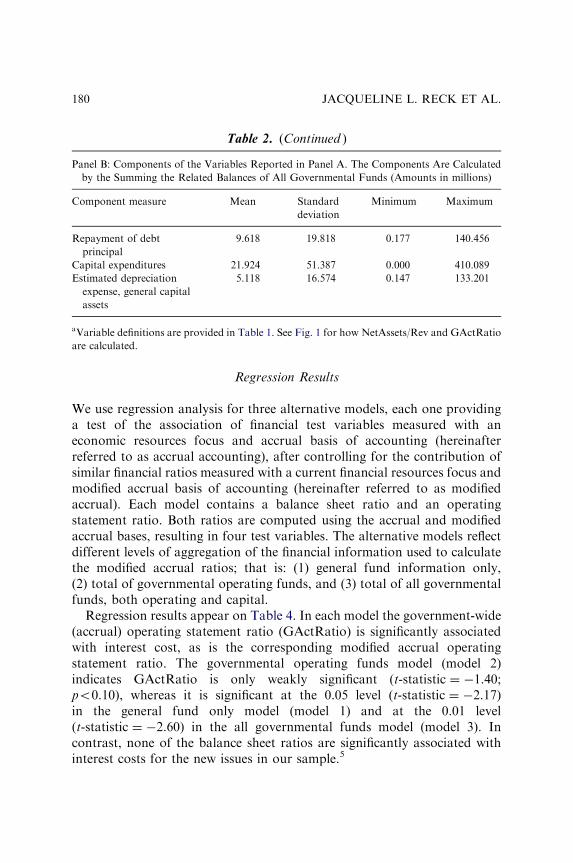
Regression Results
We use regression analysis for three alternative models, each one providinga test of the association of financial test variables measured with aneconomic resources focus and accrual basis of accounting (hereinafterreferred to as accrual accounting), after controlling for the contribution ofsimilar financial ratios measured with a current financial resources focus andmodified accrual basis of accounting (hereinafter referred to as modifiedaccrual). Each model contains a balance sheet ratio and an operatingstatement ratio. Both ratios are computed using the accrual and modifiedaccrual bases, resulting in four test variables. The alternative models reflectdifferent levels of aggregation of the financial information used to calculatethe modified accrual ratios; that is: (1) general fund information only,(2) total of governmental operating funds, and (3) total of all governmentalfunds, both operating and capital.
Regression results appear on Table 4. In each model the government-wide(accrual) operating statement ratio (GActRatio) is significantly associatedwith interest cost, as is the corresponding modified accrual operatingstatement ratio. The governmental operating funds model (model 2)indicates GActRatio is only weakly significant (t-statistic ¼ �1.40;po0.10), whereas it is significant at the 0.05 level (t-statistic ¼ �2.17)in the general fund only model (model 1) and at the 0.01 level(t-statistic ¼ �2.60) in the all governmental funds model (model 3). Incontrast, none of the balance sheet ratios are significantly associated withinterest costs for the new issues in our sample.5
Table 2. (Continued )
Panel B: Components of the Variables Reported in Panel A. The Components Are Calculated
by the Summing the Related Balances of All Governmental Funds (Amounts in millions)
Component measure Mean Standard
deviation
Minimum Maximum
Repayment of debt
principal
9.618 19.818 0.177 140.456
Capital expenditures 21.924 51.387 0.000 410.089
Estimated depreciation
expense, general capital
assets
5.118 16.574 0.147 133.201
aVariable definitions are provided in Table 1. See Fig. 1 for how NetAssets/Rev and GActRatio
are calculated.
JACQUELINE L. RECK ET AL.180
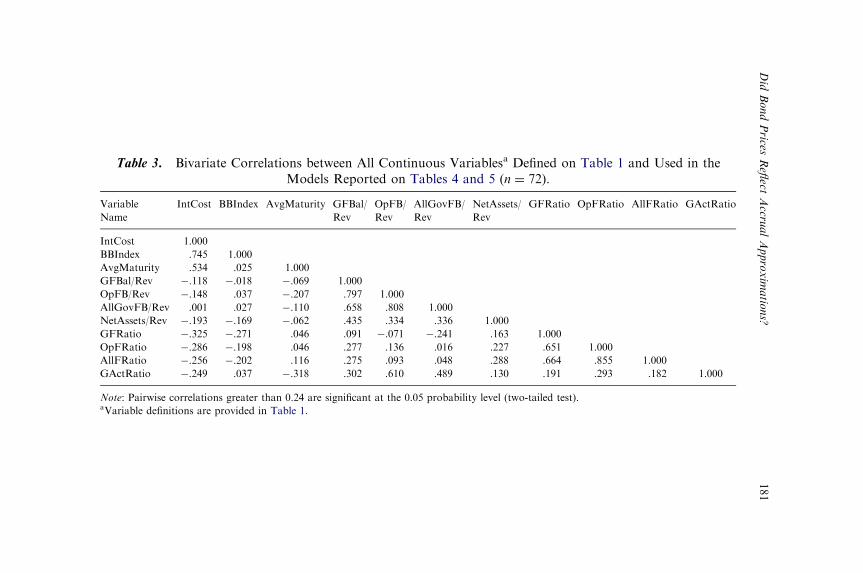
Table 3. Bivariate Correlations between All Continuous Variablesa Defined on Table 1 and Used in theModels Reported on Tables 4 and 5 (n ¼ 72).
Variable
Name
IntCost BBIndex AvgMaturity GFBal/
Rev
OpFB/
Rev
AllGovFB/
Rev
NetAssets/
Rev
GFRatio OpFRatio AllFRatio GActRatio
IntCost 1.000
BBIndex .745 1.000
AvgMaturity .534 .025 1.000
GFBal/Rev �.118 �.018 �.069 1.000
OpFB/Rev �.148 .037 �.207 .797 1.000
AllGovFB/Rev .001 .027 �.110 .658 .808 1.000
NetAssets/Rev �.193 �.169 �.062 .435 .334 .336 1.000
GFRatio �.325 �.271 .046 .091 �.071 �.241 .163 1.000
OpFRatio �.286 �.198 .046 .277 .136 .016 .227 .651 1.000
AllFRatio �.256 �.202 .116 .275 .093 .048 .288 .664 .855 1.000
GActRatio �.249 .037 �.318 .302 .610 .489 .130 .191 .293 .182 1.000
Note: Pairwise correlations greater than 0.24 are significant at the 0.05 probability level (two-tailed test).aVariable definitions are provided in Table 1.
Did
BondPrices
Reflect
Accru
alApproxim
atio
ns?
181
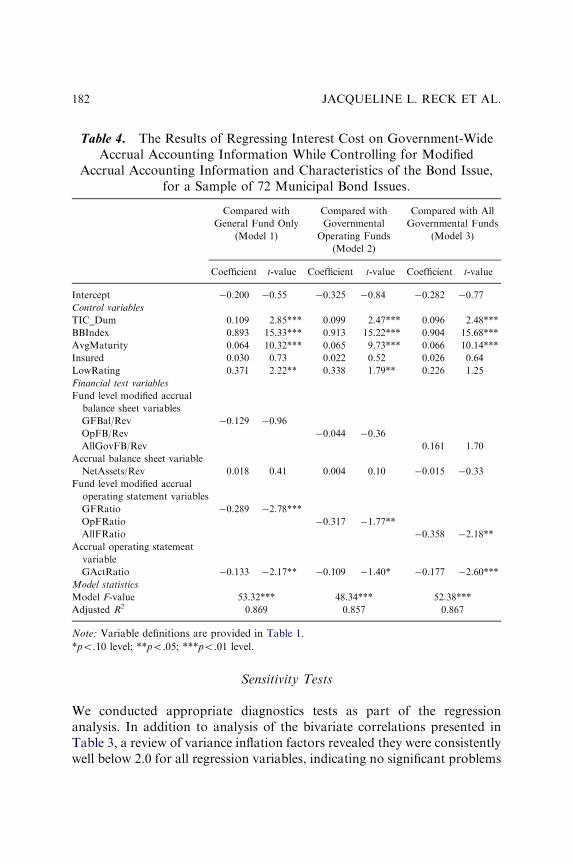
Sensitivity Tests
We conducted appropriate diagnostics tests as part of the regressionanalysis. In addition to analysis of the bivariate correlations presented inTable 3, a review of variance inflation factors revealed they were consistentlywell below 2.0 for all regression variables, indicating no significant problems
Table 4. The Results of Regressing Interest Cost on Government-WideAccrual Accounting Information While Controlling for Modified
Accrual Accounting Information and Characteristics of the Bond Issue,for a Sample of 72 Municipal Bond Issues.
Compared with
General Fund Only
(Model 1)
Compared with
Governmental
Operating Funds
(Model 2)
Compared with All
Governmental Funds
(Model 3)
Coefficient t-value Coefficient t-value Coefficient t-value
Intercept �0.200 �0.55 �0.325 �0.84 �0.282 �0.77
Control variables
TIC_Dum 0.109 2.85*** 0.099 2.47*** 0.096 2.48***
BBIndex 0.893 15.33*** 0.913 15.22*** 0.904 15.68***
AvgMaturity 0.064 10.32*** 0.065 9.73*** 0.066 10.14***
Insured 0.030 0.73 0.022 0.52 0.026 0.64
LowRating 0.371 2.22** 0.338 1.79** 0.226 1.25
Financial test variables
Fund level modified accrual
balance sheet variables
GFBal/Rev �0.129 �0.96
OpFB/Rev �0.044 �0.36
AllGovFB/Rev 0.161 1.70
Accrual balance sheet variable
NetAssets/Rev 0.018 0.41 0.004 0.10 �0.015 �0.33
Fund level modified accrual
operating statement variables
GFRatio �0.289 �2.78***
OpFRatio �0.317 �1.77**
AllFRatio �0.358 �2.18**
Accrual operating statement
variable
GActRatio �0.133 �2.17** �0.109 �1.40* �0.177 �2.60***
Model statistics
Model F-value 53.32*** 48.34*** 52.38***
Adjusted R2 0.869 0.857 0.867
Note: Variable definitions are provided in Table 1.
*po.10 level; **po.05; ***po.01 level.
JACQUELINE L. RECK ET AL.182
with multicollinearity. In addition, White (1980) tests revealed no instancesof significant heteroskedasticity. Only one observation was deemed to be apossible outlier (having a studentized range greater than 3.0). Dropping thatobservation resulted in even stronger associations than those reported inTable 4 for the operating ratio test variables.
To determine whether the results are sensitive to our sample or that arelatively few observations might be driving the results, we ran regressionson 25 subsamples for which 10 percent of the observations were randomlyomitted. Results showing the averages of the 25 subsample regressions arepresented in Table 5. The results are similar to those reported for the mainsample in Table 4. For the general fund only model (column 1), GFRatiowas significant (alpha ¼ 0.05) in 24 of the 25 models run, while GActRatiowas significant in 20 of the 25 models. Of the balance sheet variables,only one subsample indicated any significant (alpha ¼ 0.05) balance sheetvariables. The results for the governmental operating fund models(column 2) were not as strong, with 12 of the 25 models yielding asignificant (alpha ¼ 0.05) OpFRatio and 3 yielding a significant GActRatio.None of the balance sheet variables were significant in the 25 modelruns. For all governmental funds (column 3), AllFRatio was significant(alpha ¼ 0.05) in 23 of the 25 model runs, and GActRatio was significant inall 25 runs. AllGovFB/Rev was significant in 10 of the 25 runs, butNetAssets/Rev was not significant in any of the runs.
DISCUSSION
We examine whether borrowing costs of general obligation municipal bondsreflect information about the economic resources of the municipality as awhole on an accrual basis, in addition to traditional financial informationabout current financial resources on the modified accrual basis. Evidencethat approximations of accrual, economic resources financial informationwere reflected in borrowing costs before issuance of GASB StatementNo. 34 would be consistent with the GASB’s conclusions that financialstatement users need information on all assets and liabilities of thegovernment as a whole, not just levels and flows of current financialresources assigned to particular funds.
Approximations of accrual balance sheet and operating statement ratiosare included in a regression model along with ratios of modified accrualbalance sheet and operating statement measures. Three alternative regres-sion models are estimated, corresponding to alternative levels of aggregation
Did Bond Prices Reflect Accrual Approximations? 183
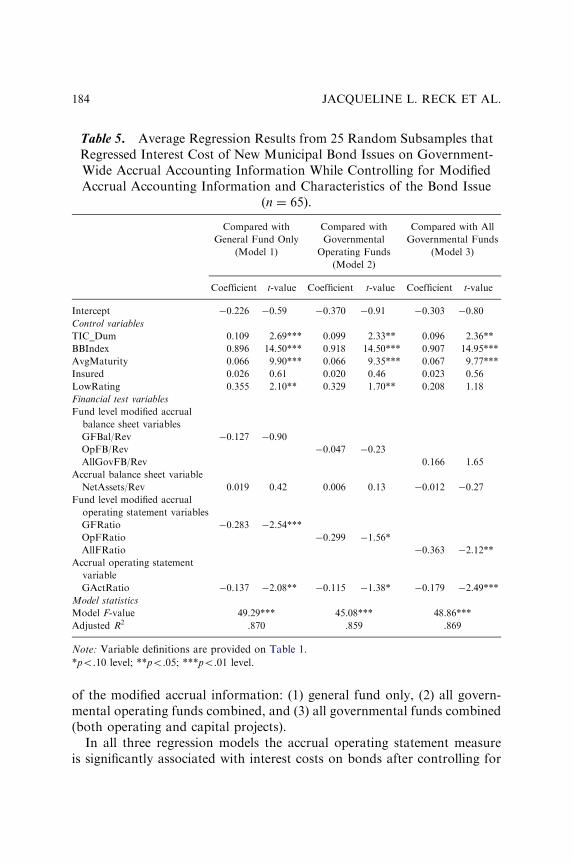
of the modified accrual information: (1) general fund only, (2) all govern-mental operating funds combined, and (3) all governmental funds combined(both operating and capital projects).
In all three regression models the accrual operating statement measureis significantly associated with interest costs on bonds after controlling for
Table 5. Average Regression Results from 25 Random Subsamples thatRegressed Interest Cost of New Municipal Bond Issues on Government-Wide Accrual Accounting Information While Controlling for ModifiedAccrual Accounting Information and Characteristics of the Bond Issue
(n ¼ 65).
Compared with
General Fund Only
(Model 1)
Compared with
Governmental
Operating Funds
(Model 2)
Compared with All
Governmental Funds
(Model 3)
Coefficient t-value Coefficient t-value Coefficient t-value
Intercept �0.226 �0.59 �0.370 �0.91 �0.303 �0.80
Control variables
TIC_Dum 0.109 2.69*** 0.099 2.33** 0.096 2.36**
BBIndex 0.896 14.50*** 0.918 14.50*** 0.907 14.95***
AvgMaturity 0.066 9.90*** 0.066 9.35*** 0.067 9.77***
Insured 0.026 0.61 0.020 0.46 0.023 0.56
LowRating 0.355 2.10** 0.329 1.70** 0.208 1.18
Financial test variables
Fund level modified accrual
balance sheet variables
GFBal/Rev �0.127 �0.90
OpFB/Rev �0.047 �0.23
AllGovFB/Rev 0.166 1.65
Accrual balance sheet variable
NetAssets/Rev 0.019 0.42 0.006 0.13 �0.012 �0.27
Fund level modified accrual
operating statement variables
GFRatio �0.283 �2.54***
OpFRatio �0.299 �1.56*
AllFRatio �0.363 �2.12**
Accrual operating statement
variable
GActRatio �0.137 �2.08** �0.115 �1.38* �0.179 �2.49***
Model statistics
Model F-value 49.29*** 45.08*** 48.86***
Adjusted R2 .870 .859 .869
Note: Variable definitions are provided on Table 1.
*po.10 level; **po.05; ***po.01 level.
JACQUELINE L. RECK ET AL.184
the modified accrual operating statement measures. Our results indicatethat regardless of level of fund aggregation, the aggregate accrual operatinginformation is significantly associated with new issue prices. The findingthat highly aggregated approximations of accrual information are usefulin the pre-GASB Statement No. 34 periods is of interest given thatmore precise aggregated accrual data are reported under the GASBStatement No. 34 reporting model. In each model, the modified accrualmeasures are also significantly associated with bond interest costs. However,none of the balance sheet measures are associated with bond interest costs.
The key point, however, is that even before such information wasexplicitly required by GASB Statement No. 34, bond analysts appeared toestimate and incorporate estimates of government-wide economic resourcesmeasures in their bond pricing decisions. If, as our results imply, users wereimpounding estimates of accrual information before the issuance of GASBStatement No. 34, the question becomes whether more precise accrualmeasures offered by Statement No. 34 further add to the usefulness offinancial information in pricing of bonds.
The results of Plummer et al. (2007) indicate that GASB Statement No. 34information is useful; however, they do not control for whether theinformation is more useful than accrual estimations that may have beenmade before the implementation of Statement No. 34. Thus, they are unableto answer the question posed by our research – does Statement No. 34further add to the usefulness of financial information? Additionally, thePlummer et al. study finds balance sheet accrual information to be useful,not operating statement accrual information.
It should be pointed out that in addition to the use of accrual measurestaken from pre- versus post-Statement No. 34 periods, there are a number ofother factors that are different between our study and the Plummer et al.study that may make it difficult to compare the results of the two studies.Among these factors are different time periods, different samples(municipalities versus school districts), and different credit users. Ratherthan using bond credit ratings (Plummer et al., 2007), we use the net interestcosts of new bond issues. In general, a yield-based measure is preferable to acategorical measure since it provides a continuous measure of usefulnesswithin bond rating categories.
The results of our study provide benchmark knowledge about theimportance of accrual basis information to financial statement usersbefore GASB Statement No. 34. Results from our study, combined withsomewhat conflicting results between our study and the Plummer et al.study indicate that as additional data become available further research
Did Bond Prices Reflect Accrual Approximations? 185
is needed to more completely understand the impact of GASB StatementNo. 34.
NOTES
1. With the implementation of GASB Statement No. 34 an additionalgovernmental fund type was created – permanent funds.2. The balance sheet and operating statement test variables used in our study are
similar to those used in many of the governmental capital markets studies reviewedin Ingram et al. (1987) and Reck et al. (2004). There is no extant theory that predictswhich financial variables would be preferred. The test variables selected representboth point in time (balance sheet) measures and change or flow (operating statement)measures. Moreover, they permit comparable construction using both currentfinancial resources/modified accrual and economic resources/accrual measures.3. Deferred revenue used in calculating both NetAssets/Rev and GActRatio is a
somewhat noisy measure as is the estimated depreciation expense. During the periodstudied, few governments provided sufficient information to determine the sources ofdeferred revenues (e.g., how much related to property taxes, intergovernmentalgrants, special assessments, and other sources). In the case of property taxes, we wereunable to determine whether the deferral would have applied to both governmentalfunds and the government-wide level, since deferral occurs at both levels if taxreceivables are recorded before the year for which the taxes are levied. In the case ofspecial assessments, deferrals generally occur in the governmental funds but not atthe government-wide level. Because of the complexity of how deferred revenuespotentially affect our calculations of NetAssets/Rev and GActRatio, we test both aworst-case measure that assumes all deferred revenues originate in the current year(as reported in Tables 4 and 5) and an alternative measure assuming no change indeferred revenues during the year. In addition, the alternative tests eliminate theestimated depreciation expense from the calculation of GActRatio. As reported inEndnote 5, the overall results are minimally affected by the alternative measures.This is not surprising, since deferred revenues and estimated depreciation expenseonly amount to 12.2 and 4.1 percent of total governmental revenues, respectively.4. For example, Reck and Wilson (2006) report that for their sample of 595 new
issues that occurred during the relatively weak economy of the 1980s, unreservedgeneral fund balances averaged only 13.6 percent of annual revenues compared with20.7 percent during the 1990s when the national and state economies were muchstronger. Operating surpluses (excess of general fund revenues over general fundexpenditures deflated by general fund revenues) were seven times larger in the 1990sthan in the 1980s (8.4 percent compared to 1.2 percent).5. In addition to the comparative accrual, modified accrual models reported in
Table 4, we also tested models that include only the modified accrual ratios. Theresults of those regressions reflect generally strong negative associations between theratio of revenues to expenditures of each model (GFRatio, OpFRatio andAllFRatio) and interest costs (po.01), but insignificant associations for the balancesheet measures (GFBal/Rev, OpFB/Rev, and AllGovFB/Rev). Also, we tested the
JACQUELINE L. RECK ET AL.186
models described in Tables 4 and 5 with the somewhat noisy component measuresfor deferred revenues and capital use charge omitted from the calculation of thegovernment-wide test measures NetAssets/Rev and GActRatio. The overall resultsare substantially the same as reported. In model 2, the significance level forGActRatio increased from .10 to the .05 level. In model 3, the significance level forthis variable decreased from .01 to just below the .05 level. The results for model 1were unchanged.
ACKNOWLEDGMENT
The financial assistance provided by the University of South Florida isgratefully acknowledged. We would like to thank workshop participantsat the University of South Florida, Paul Copley, and two anonymousreviewers for their helpful comments.
REFERENCES
Governmental Accounting Standards Board (GASB). (1999). Statement No. 34 of the
Governmental Accounting Standards Board: Basic financial statements – and management’s
discussion and analysis – for state and local governments. Norwalk, CT: Governmental
Accounting Standards Board.
Ingram, R. W., Raman, K. K., & Wilson, E. R. (1987). Governmental capital markets research
in accounting: A review. Research in Governmental and Nonprofit Accounting, 3, 111–132.
Plummer, E., Hutchison, P. D., & Patton, T. K. (2007). GASB No. 34’s governmental financial
reporting model: Evidence on its information relevance. The Accounting Review, 82(1),
205–240.
Reck, J. L., & Wilson, E. R. (2006). Information transparency and pricing in the municipal
bond secondary market. Journal of Accounting and Public Policy, 25(1), 1–31.
Reck, J. L., Wilson, E. R., Gotlob, D., & Lawrence, C. M. (2004). Governmental capital
markets research in accounting: A review, extension, and directions for future research.
Research in Governmental and Nonprofit Accounting, 11, 1–33.
White, H. (1980). A heteroskedasticity-consistent covariance matrix estimator and a direct test
of heteroskedasticity. Econometrica, 48, 817–838.
Wilson, E. R. (1990). Financial reporting by state and local governments: A survey of preferences
among alternative formats. Norwalk, CT: Governmental Accounting Standards Board.
Did Bond Prices Reflect Accrual Approximations? 187

This page intentionally left blank
THE ASSOCIATION OF
ACCOUNTING MEASURES AND
MUNICIPAL BOND INTEREST
COST: A TEST OF GASB 14
Barbara A. Chaney
ABSTRACT
Using a sample of general obligation municipal bonds issued between 1995and 1997, I test the relation between accounting measures and bond yieldsfor the purpose of determining whether component unit information isconsidered in the pricing of bonds. In so doing, I test the relativeusefulness of different entity definitions. I find that municipal bond yieldsare most closely associated with financial measures of the governmentcombined with all of its component units. My results provide support forthe provisions of GASB Statement 14 requiring inclusion of componentunit information in governmental financial reports. In addition, I find thatthe bond market differentially weights the accounting information ofcomponent units included under different GASB 14 criteria, suggestingthat the disaggregated reporting format allowed by GASB 14 is useful forcollecting and processing information.
Research in Governmental and Nonprofit Accounting, Volume 12, 189–213
Copyright r 2009 by Emerald Group Publishing Limited
All rights of reproduction in any form reserved
ISSN: 0884-0741/doi:10.1108/S0884-0741(2009)0000012010
189
1. INTRODUCTION
Identification of the reporting entity is one of the most fundamentalreporting decisions. It is an issue shared by business, private not-for-profit,and public-sector organizations. Presently, business enterprises follow theguidelines of FASB Statement 94, Consolidation of All Majority-OwnedSubsidiaries (FASB, 1987), which requires consolidation of all subsidiariesin which the reporting entity owns a (nontemporary) majority interest.1
Within the public sector, guidance is provided by GASB Statement 14, TheFinancial Reporting Entity (GASB, 1991). The provisions of GASBStatement 14 differ from those governing private-sector entities in tworespects. First, the definition of the reporting entity is based primarily on theconcept of elected officials’ accountability for quasi-government organiza-tions rather than control via ownership. The result is that the financialreport may include organizations (i.e., component units) that are legallyseparate, but financially or administratively linked to a state or local govern-ment. Second, most component units are included in the financial reportthrough discrete presentation rather than consolidation.
Discrete presentation entails reporting financial data in one or morecolumns separate from the financial data of the primary government. Itallows a user to either include or exclude component units’ informationwhen evaluating a government’s financial condition. From a researchperspective, discrete presentation permits testing the relative usefulness ofalternative entity definitions through observing which aggregations of thefinancial information are most closely associated with economic decisions.In this respect, my study is similar to studies of geographic or segmentdisclosures.
In the analysis that follows, I use the opportunity provided by discretepresentation to determine whether component unit financial information isconsidered in pricing general obligation (GO) bonds issued by municipalgovernments. In so doing, I provide evidence useful in assessing therequirements of GASB Statement 14 for inclusion and discrete presentationof component unit financial information. I calculate financial conditionmeasures for the general fund alone, as well as for aggregations of thegovernment with its component units, and use them as explanatory variablesin a municipal bond pricing model. My test of the relative usefulness ofdifferent entity definitions to the municipal bond market is based on acomparison of the explanatory power of the model using financial measuresderived from varying combinations of the primary government and itscomponent units. I find that municipal bond yields are most strongly
BARBARA A. CHANEY190
associated with financial measures of the government combined with all itscomponent units. This supports the definition of the governmental financialreporting entity provided by GASB 14.
Additionally, I find that accounting measures derived from control-related component units have less influence on bond prices than accountingmeasures derived from the primary government and the financially relatedcomponent units. However, even though I find that the bond market weightsthe disaggregated pieces of information differently, I do not find that theexplanatory power of the disaggregated model is significantly better orworse than an aggregated model of the government and its component units.
The results provide policy implications for the GASB. They suggest thatthe municipal bond market benefits from GASB 14’s overall entity definitionin that the market uses fully aggregated financial data to evaluate bond issues.This affirms the GASB’s decision to include component unit information inthe government-wide financial statements of the financial reporting model(GASB Statement 34, Basic Financial Statements-and Management’s Discus-sion and Analysis-for State and Local Governments (GASB, 1999)). Inaddition, the GASB is currently revisiting GASB 14 as part of a routineevaluation of the effectiveness of its recent standards. I provide evidence thatshould be an useful input for the GASB’s consideration.
2. BACKGROUND ON THE GOVERNMENTAL
ENTITY ISSUE
For decades the traditional form of government has been augmented withquasi-government organizations sometimes referred to as public authorities(e.g., the Port Authority of New York and New Jersey was created in 1921).Public authorities are legally separate from the governments that createthem and are separate from the traditional business-type activities of aprimary government, such as water and sewer operations, which are notlegally separate from the primary government and are accounted for inenterprise funds. Public authorities serve public purposes in a unique way byincorporating some of the organizational characteristics of the private sectorinto government and avoiding some of the hindrances of governmentbureaucracy. For example, a public authority can often provide a publicservice, such as operate a park or library, more efficiently by bypassing rigidgovernmental requirements, such as competitive bidding procedures anddebt limitations.
The Association of Accounting Measures and Municipal Bond Interest Cost 191
Public authorities are created by governments, thereby raising a publicinterest issue. In a 1989 Boston magazine cover story titled ‘‘The ShadowGovernment,’’ public authorities are described as ‘‘an invisible governmentthat functions with little oversight by elected officials . . . they are . . .making too many decisions on the public’s behalf out of the public’s sightand beyond the public’s control.’’ Concerns such as these prompted theGASB to examine the standards for including public authorities in thefinancial reports of state and local governments.
The GASB’s financial reporting entity project began with a sponsoredresearch study in which Patton (1987) interviewed bond raters, insurers, andanalysts. He found that an important concern when evaluating GO bonds isthe potential for a financial drain on a bond issuer by a component unit.This was in contrast to the concerns of preparers of governmental financialstatements, who were interested in whether a government has oversightresponsibility for a component unit (such as control over the budgetapproval process). Thus, bond raters and insurers expressed a preference forfinancial factors, rather than control factors, in determining when to includea component unit. The resulting standard, GASB 14, requires the inclusionof both control-related and financially related component units.
Patton’s (1987) research suggests the display and disclosure provisions ofGASB 14 facilitate the market’s valuation of new bond issues. That is,investors and creditors could use the discrete presentation reporting format tocreate an accounting entity that is most closely correlated with their concerns(e.g., an entity comprised of the primary government and its financiallyrelated component units). If this is true, investors and creditors may ignore ordiscount the control-related component units if they are perceived to beunrelated to the default risk on debt of the primary government.
GASB 14 requires that most component units be displayed separatelyfrom the primary government (the core government underlying the entity)and that disclosures describe the relationship between the primarygovernment and its component units. Inclusion is warranted if the primarygovernment exceeds a certain level of accountability for the component unit.Under GASB 14 there are three ways of assessing accountability:
� The first criterion is financial in nature. It specifies inclusion when aprimary government appoints a voting majority of the component unit’sgoverning body and either bears a financial burden or receives a financialbenefit from the component unit. The primary government may haveguaranteed the component unit’s debt or agreed to subsidize its opera-tions, for example.
BARBARA A. CHANEY192
� The second specifies inclusion when the primary government appoints avoting majority of the component unit’s governing body and is able toimpose its will on the organization. The primary government may havethe power to hire and fire the component unit’s management, for example.� The third criterion specifies inclusion when a component unit is ‘‘fiscallydependent’’ on the primary government for approval of its budget, itsbond issues, or its tax levy.2
The second and third criteria are control-oriented. The first criterion aloneappears to satisfy the needs of the bond market even though the third criterion‘‘sounds’’ financial. Fiscal dependency is, in concept, control over the pursestrings rather than control over the purse. The organizations for which theprimary government is determined to be sufficiently accountable are includedin the governmental entity as component units. The financial position andresults of operations of most component units are presented in a columnseparate from those of the primary government and disclosures describewhether the component units are included for financial or control reasons.
To date, governmental empirical research concerning entity issues islimited to surveys of various constituency groups, including preparers(Shoulders, 1982; Patton, 1987), users (Jones et al., 1985) and auditors(Engstrom, 1985). My study is the first to empirically examine whether theGASB 14 inclusion criteria and provision for discrete presentation are usefulin evaluating the interest cost of new GO debt issues. In the section thatfollows, I develop hypotheses suitable for testing whether the interest cost ofGO bonds reflect the financial condition of component units as well as theprimary government. Evidence that interest costs are more stronglyassociated with financial measures when component units are includedsupports current GASB standards requiring inclusion of these componentunits. Evidence that interest costs are most strongly associated withaccounting measures when component unit information is separatelypresented or that component unit information is differentially weightedsupports current GASB standards requiring discrete presentation.
3. DEVELOPMENT OF HYPOTHESES
Both public- and private-sector accounting standards assume that inclusionof related organizations is useful to the readers of the financial statements.In the private sector, Tosh and Rue (1988) examined companies with anunconsolidated finance subsidiary.3 They measure the relations between the
The Association of Accounting Measures and Municipal Bond Interest Cost 193
parent’s systematic risk and the debt ratio of the parent company alone anda consolidated debt ratio that includes the debt of the finance subsidiary.Because only the latter is significant, Tosh and Rue conclude that financesubsidiaries should be consolidated with their parent. I improve on Toshand Rue’s research design by including a formal test (i.e., Vuong statistic) ofthe relative explanatory power between various entity configurations.
The first hypothesis examines whether the interest cost on new GO bondissues is more closely associated with accounting information of the combinedfinancial reporting entity than of the primary government alone. The purpose isto determine whether the GASB’s overall definition of the combined financialreporting entity provides information that is useful to the bond market.
H1. The interest cost on new GO bond issues is more closely associatedwith accounting variables of the combined financial reporting entity thanaccounting variables of the primary government alone.
Bond investors are only one of the three groups of financial statementusers the GASB considers when setting accounting standards. The othertwo groups, citizens and legislative oversight bodies, are acknowledged to beequally important (GASB Concepts Statement 1, Objectives of FinancialReporting (GASB, 1987)). Therefore, the definition of the combinedfinancial reporting entity promulgated by the GASB may not be perfectlyconsistent with the bond market’s needs. Patton (1987) suggests investorsand creditors mainly consider component units with financial relationshipsto the government (through subsidies, guarantees, etc.), while citizens andlegislative oversight bodies are more concerned with control-related factors.If this is true, I expect the bond market to focus on an entity defined byfinancial relationships rather than control relationships.
This suggests two additional hypotheses. An aggregation of the primarygovernment and its financially related component units is expected to berelatively more useful than (a) the primary government alone and (b) anaggregation of the combined financial reporting entity.
H2a. The interest cost on new GO bond issues is more closely associatedwith accounting variables of an entity composed of the primarygovernment and its financially related component units than accountingvariables of the primary government alone.
H2b. The interest cost on new GO bond issues is more closely associatedwith accounting variables of an entity composed of the primarygovernment and its financially related component units than accountingvariables of the combined financial reporting entity.
BARBARA A. CHANEY194
3.1. Municipal Bond Market
Municipal bonds are either GO or revenue debt. GO bonds are secured bythe taxing authority of the issuing government and are closely associatedwith the general government. GO bonds are relatively homogeneouscompared to revenue bonds, which are structured in myriad ways andissued by a variety of governments and quasi-governments. GO bonds aremost appropriate for my study because I am interested in the effect ofincluding component unit information on economic evaluations of theoverall governmental entity.
Most municipal bond studies use yield or interest cost in lieu of bondprice as the valuation measure of a new bond issue. A bond’s price is thepresent value of expected future cash flows:
Pit ¼XTt¼1
Cit
ð1þ RitÞt
� �
where Pit is the price of bond i at time t, Cit the expected cash flow (interestfor periods 1 through T and principal at time T), and Rit the discount rate oryield associated with bond i at time t. ‘‘For all practical purposes, boththeoretically and empirically, bond prices and yields are two sides of thesame coin.’’ (Ingram & Wilson, 1999, p. 6). The interest cost measuresnormally used to compare bids submitted by underwriters (NIC and TIC)are standardized in the industry. NIC (net interest cost) is an averageinterest cost. I use TIC (true interest cost) because it is an average effectiveinterest rate and is superior to NIC because it considers the time value ofmoney. See, for example, Simonsen, Robbins, and Jump (2005).
4. RESEARCH DESIGN
I test each hypothesis using a relative information content approach bycreating two nonnested models and determining which model has greaterexplanatory power. The models are nonnested because one model is not asubset of the other. This is true even though the combined financialreporting entity’s accounting variables are mathematically equal to theprimary government’s plus the component units’ accounting variables. Themodels focus on two different aggregations, not on the components ofinformation within the aggregations.4
The Association of Accounting Measures and Municipal Bond Interest Cost 195
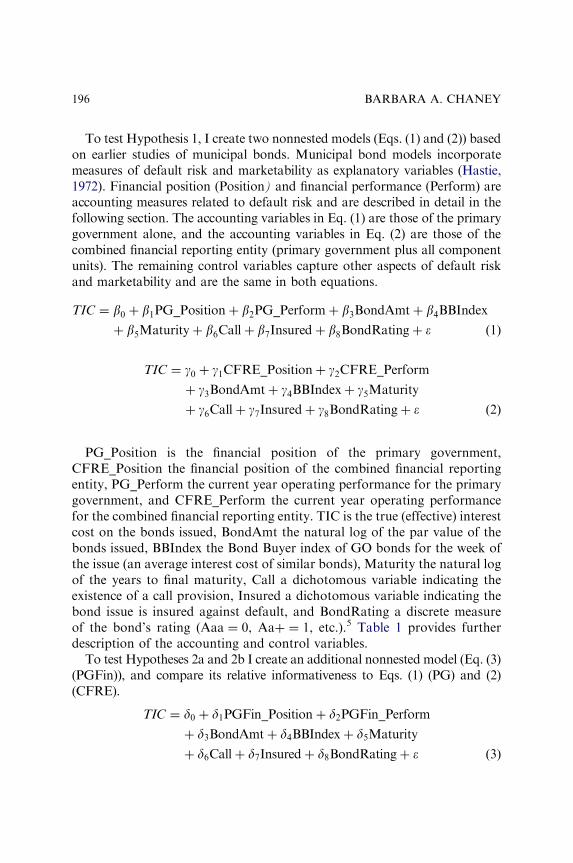
To test Hypothesis 1, I create two nonnested models (Eqs. (1) and (2)) basedon earlier studies of municipal bonds. Municipal bond models incorporatemeasures of default risk and marketability as explanatory variables (Hastie,1972). Financial position (Position) and financial performance (Perform) areaccounting measures related to default risk and are described in detail in thefollowing section. The accounting variables in Eq. (1) are those of the primarygovernment alone, and the accounting variables in Eq. (2) are those of thecombined financial reporting entity (primary government plus all componentunits). The remaining control variables capture other aspects of default riskand marketability and are the same in both equations.
TIC ¼ b0 þ b1PG_Positionþ b2PG_Performþ b3BondAmtþ b4BBIndex
þ b5Maturityþ b6Callþ b7Insuredþ b8BondRatingþ � ð1Þ
TIC ¼ g0 þ g1CFRE_Positionþ g2CFRE_Perform
þ g3BondAmtþ g4BBIndexþ g5Maturity
þ g6Callþ g7Insuredþ g8BondRatingþ � ð2Þ
PG_Position is the financial position of the primary government,CFRE_Position the financial position of the combined financial reportingentity, PG_Perform the current year operating performance for the primarygovernment, and CFRE_Perform the current year operating performancefor the combined financial reporting entity. TIC is the true (effective) interestcost on the bonds issued, BondAmt the natural log of the par value of thebonds issued, BBIndex the Bond Buyer index of GO bonds for the week ofthe issue (an average interest cost of similar bonds), Maturity the natural logof the years to final maturity, Call a dichotomous variable indicating theexistence of a call provision, Insured a dichotomous variable indicating thebond issue is insured against default, and BondRating a discrete measureof the bond’s rating (Aaa ¼ 0, Aaþ ¼ 1, etc.).5 Table 1 provides furtherdescription of the accounting and control variables.
To test Hypotheses 2a and 2b I create an additional nonnested model (Eq. (3)(PGFin)), and compare its relative informativeness to Eqs. (1) (PG) and (2)(CFRE).
TIC ¼ d0 þ d1PGFin_Positionþ d2PGFin_Perform
þ d3BondAmtþ d4BBIndexþ d5Maturity
þ d6Callþ d7Insuredþ d8BondRatingþ � ð3Þ
BARBARA A. CHANEY196
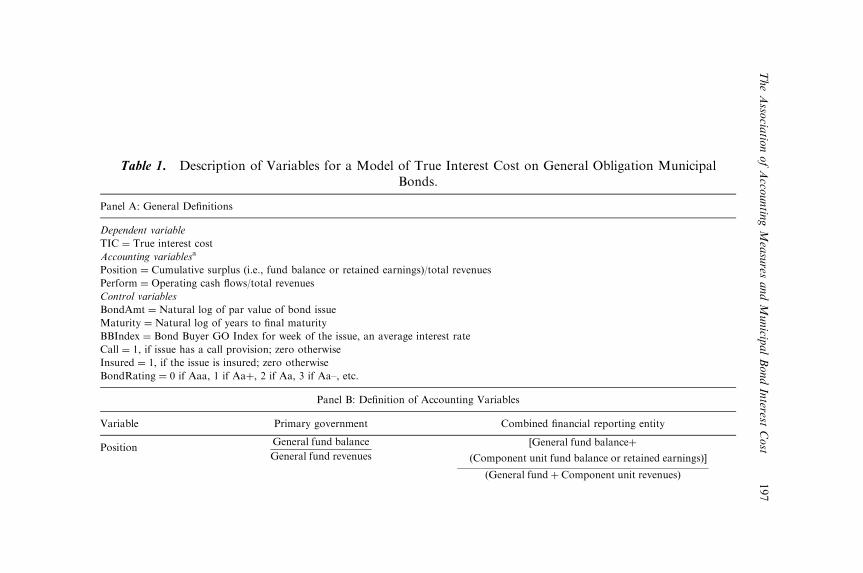
Table 1. Description of Variables for a Model of True Interest Cost on General Obligation MunicipalBonds.
Panel A: General Definitions
Dependent variable
TIC ¼ True interest cost
Accounting variablesa
Position ¼ Cumulative surplus (i.e., fund balance or retained earnings)/total revenues
Perform ¼ Operating cash flows/total revenues
Control variables
BondAmt ¼ Natural log of par value of bond issue
Maturity ¼ Natural log of years to final maturity
BBIndex ¼ Bond Buyer GO Index for week of the issue, an average interest rate
Call ¼ 1, if issue has a call provision; zero otherwise
Insured ¼ 1, if the issue is insured; zero otherwise
BondRating ¼ 0 if Aaa, 1 if Aaþ, 2 if Aa, 3 if Aa–, etc.
Panel B: Definition of Accounting Variables
Variable Primary government Combined financial reporting entity
PositionGeneral fund balance
General fund revenues
½General fund balanceþ
ðComponent unit fund balance or retained earningsÞ�
ðGeneral fundþ Component unit revenuesÞ
TheAsso
ciatio
nofAcco
untin
gMeasures
andMunicip
alBondInterest
Cost
197
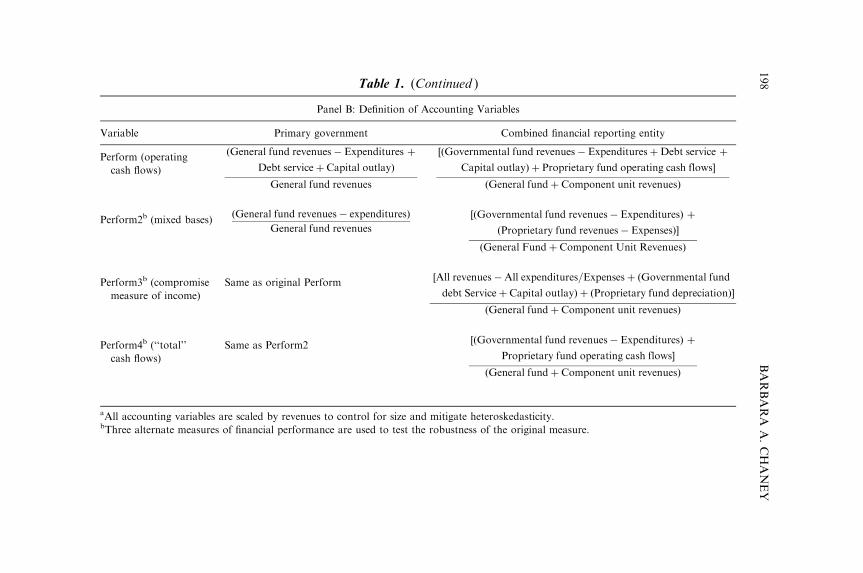
Table 1. (Continued )
Panel B: Definition of Accounting Variables
Variable Primary government Combined financial reporting entity
Perform (operating
cash flows)
ðGeneral fund revenues� Expenditures þ
Debt serviceþCapital outlayÞ
General fund revenues
½ðGovernmental fund revenues� ExpendituresþDebt service þ
Capital outlayÞ þ Proprietary fund operating cash flows�
ðGeneral fundþ Component unit revenuesÞ
Perform2b (mixed bases)ðGeneral fund revenues� expendituresÞ
General fund revenues
½ðGovernmental fund revenues� ExpendituresÞ þ
ðProprietary fund revenues� ExpensesÞ�
ðGeneral Fundþ Component Unit RevenuesÞ
Perform3b (compromise
measure of income)
Same as original Perform½All revenues�All expenditures=Expensesþ ðGovernmental fund
debt ServiceþCapital outlayÞ þ ðProprietary fund depreciationÞ�
ðGeneral fundþ Component unit revenuesÞ
Perform4b (‘‘total’’
cash flows)
Same as Perform2½ðGovernmental fund revenues� ExpendituresÞ þ
Proprietary fund operating cash flows�
ðGeneral fundþ Component unit revenuesÞ
aAll accounting variables are scaled by revenues to control for size and mitigate heteroskedasticity.bThree alternate measures of financial performance are used to test the robustness of the original measure.
BARBARA
A.CHANEY
198
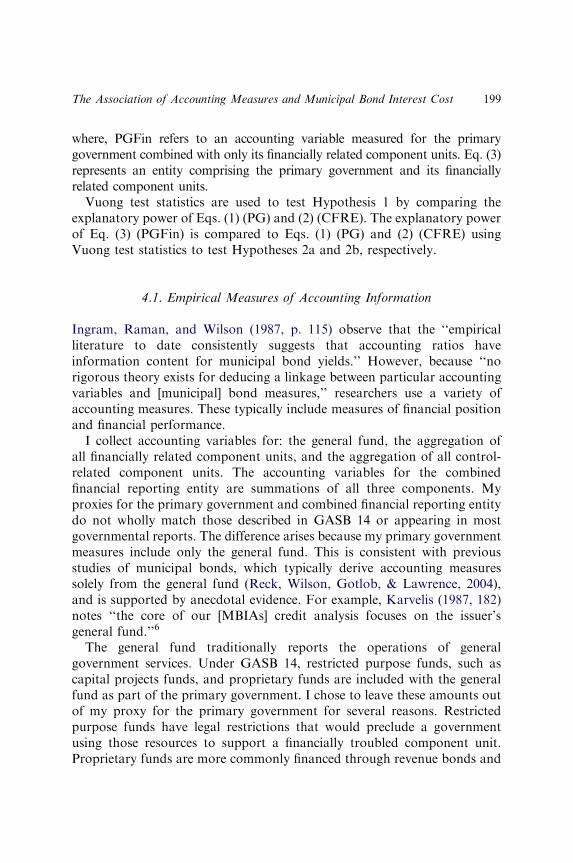
where, PGFin refers to an accounting variable measured for the primarygovernment combined with only its financially related component units. Eq. (3)represents an entity comprising the primary government and its financiallyrelated component units.
Vuong test statistics are used to test Hypothesis 1 by comparing theexplanatory power of Eqs. (1) (PG) and (2) (CFRE). The explanatory powerof Eq. (3) (PGFin) is compared to Eqs. (1) (PG) and (2) (CFRE) usingVuong test statistics to test Hypotheses 2a and 2b, respectively.
4.1. Empirical Measures of Accounting Information
Ingram, Raman, and Wilson (1987, p. 115) observe that the ‘‘empiricalliterature to date consistently suggests that accounting ratios haveinformation content for municipal bond yields.’’ However, because ‘‘norigorous theory exists for deducing a linkage between particular accountingvariables and [municipal] bond measures,’’ researchers use a variety ofaccounting measures. These typically include measures of financial positionand financial performance.
I collect accounting variables for: the general fund, the aggregation ofall financially related component units, and the aggregation of all control-related component units. The accounting variables for the combinedfinancial reporting entity are summations of all three components. Myproxies for the primary government and combined financial reporting entitydo not wholly match those described in GASB 14 or appearing in mostgovernmental reports. The difference arises because my primary governmentmeasures include only the general fund. This is consistent with previousstudies of municipal bonds, which typically derive accounting measuressolely from the general fund (Reck, Wilson, Gotlob, & Lawrence, 2004),and is supported by anecdotal evidence. For example, Karvelis (1987, 182)notes ‘‘the core of our [MBIAs] credit analysis focuses on the issuer’sgeneral fund.’’6
The general fund traditionally reports the operations of generalgovernment services. Under GASB 14, restricted purpose funds, such ascapital projects funds, and proprietary funds are included with the generalfund as part of the primary government. I chose to leave these amounts outof my proxy for the primary government for several reasons. Restrictedpurpose funds have legal restrictions that would preclude a governmentusing those resources to support a financially troubled component unit.Proprietary funds are more commonly financed through revenue bonds and
The Association of Accounting Measures and Municipal Bond Interest Cost 199
my analysis is limited to GO issues. Also relevant to my analysis is the factthat including these amounts in the financial measures of the primarygovernment would necessarily also include them in the financial measures ofthe combined financial reporting entity. Therefore, they would not beincremental to my measures and unlikely to affect comparisons.
Consistent with prior bond market research, the primary government’sfinancial position (PG_Position) is measured as unreserved general fundbalance.7 This amount represents the net assets of the fund that are notlegally restricted for a specific purpose. The general fund is a governmentalfund type, which uses the modified accrual basis of accounting and focuseson the flow of financial resources. The most significant differences betweenmodified accrual and accrual accounting are in the treatment of long-termassets and debt. Neither is recorded in the balance sheet of governmentalfunds. Capital outlays for assets and principal payments on debt arerecorded as expenditures in the operating statement of the governmentalfund making the cash outlay. I measure the primary government’s financialperformance (PG_Perform) as an approximation of operating cash flows. Itis measured as general fund revenues less expenditures, with the capitaloutlay and debt principal payments added back.8
Financial position and financial performance are collected for thefinancially and control-related component units, separately. Depending onthe nature of their operations and the intent of the government, componentunits may use either the accrual or modified accrual basis of accounting.Financial position is measured as unreserved fund balance if the componentunit uses the modified accrual basis or retained earnings if the componentunit uses the accrual basis. Financial performance is again measured asan operating cash flow measure. Financial performance is measured asrevenues minus expenditures, with capital outlays and debt principalpayments added back for component units using the modified accrual basisand as cash flows from operating activities for component units using theaccrual basis.
The operating cash flow measure of financial performance attempts toeliminate the differences in measurement between the modified accrual andaccrual bases. Because the differences are not so easily dismissed, I explorethree alternative measures in sensitivity tests. In one alternative I ignorethe differences in measurement bases by taking revenues minus eitherexpenditures or expenses. In another, I loosely convert modified accrualmeasures to full accrual. In the last, I use an alternative cash flow measure.The test results are robust to the various measures of financial performance.See Table 1 for details of the alternative measures.
BARBARA A. CHANEY200
5. SAMPLE AND RESULTS
The sample population was identified (using Security Data Company’s(SDC) Municipal New Issues Database, now part of Thomson FinancialSecurities Data) as cities that issued GO bonds between July 1, 1995, andSeptember 25, 1997. The bonds are GO with the proceeds used for generalgovernment purposes. The usage requirement eliminates special-purposebonds, such as Industrial Development Bonds, whose valuation might beaffected by specific factors not modeled in this study. In addition, the bondsare new financings rather than issued to refund existing debt. The issues arelong-term (greater than 1 year maturity) with a par value equal to or greaterthan $1 million. Most importantly, a true interest cost is available.
More than 750 new issues meet the initial screening parameters. However,to insure independence of observations, only one bond issue per issuer isincluded in the sample. After omitting duplicate issuers, the initial sampleincludes 600 GO bond issues. The most discerning parameter affecting thesample size, however, is the requirement that the city has one or morediscretely presented component units. I requested Comprehensive AnnualFinancial Reports (CAFRs) by contacting the finance officers of cities withpopulations in excess of 15,000 because small cities are much less likely toinclude a component unit in their financial reporting entity. I ultimatelyobtained CAFRs for 97 cities that include at least one component unit.Table 2 presents descriptive statistics for the sample.
The SDC database provides the dependent variable and control variablesfor the study, and the accounting variables are obtained from CAFRsreleased before the bond issue. I use the most recent CAFR preceding thebond issue to derive accounting measures. Cities do not usually provideinterim financial information, and there is typically a reporting lag betweenthe fiscal year end and the CAFR’s release date. Therefore, an issue’s officialstatement often includes annual financial information that is at least threemonths dated. For example, the official statement of a December 1995 bondissue would include June 30, 1995, annual financial information.
5.1. Statistical Tests of Nonnested Models
I test which of two nonnested models is relatively more informative with aVuong (1989) likelihood ratio test. Other tests of nonnested models, such asCox–Pesaran (Pesaran, 1974), lack the power to distinguish between modelsthat both have incremental explanatory power. As a result, the Cox–Pesaran
The Association of Accounting Measures and Municipal Bond Interest Cost 201
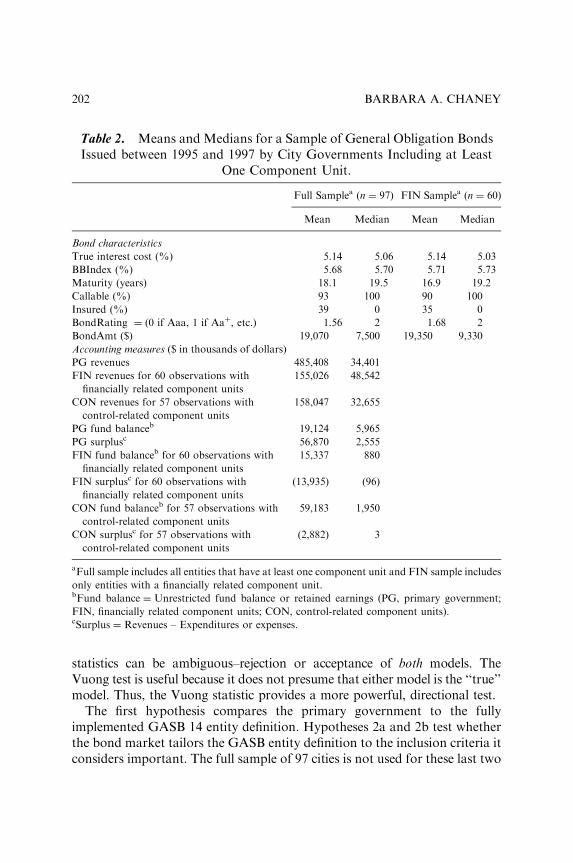
statistics can be ambiguous–rejection or acceptance of both models. TheVuong test is useful because it does not presume that either model is the ‘‘true’’model. Thus, the Vuong statistic provides a more powerful, directional test.
The first hypothesis compares the primary government to the fullyimplemented GASB 14 entity definition. Hypotheses 2a and 2b test whetherthe bond market tailors the GASB entity definition to the inclusion criteria itconsiders important. The full sample of 97 cities is not used for these last two
Table 2. Means and Medians for a Sample of General Obligation BondsIssued between 1995 and 1997 by City Governments Including at Least
One Component Unit.
Full Samplea (n ¼ 97) FIN Samplea (n ¼ 60)
Mean Median Mean Median
Bond characteristics
True interest cost (%) 5.14 5.06 5.14 5.03
BBIndex (%) 5.68 5.70 5.71 5.73
Maturity (years) 18.1 19.5 16.9 19.2
Callable (%) 93 100 90 100
Insured (%) 39 0 35 0
BondRating ¼ (0 if Aaa, 1 if Aaþ, etc.) 1.56 2 1.68 2
BondAmt ($) 19,070 7,500 19,350 9,330
Accounting measures ($ in thousands of dollars)
PG revenues 485,408 34,401
FIN revenues for 60 observations with
financially related component units
155,026 48,542
CON revenues for 57 observations with
control-related component units
158,047 32,655
PG fund balanceb 19,124 5,965
PG surplusc 56,870 2,555
FIN fund balanceb for 60 observations with
financially related component units
15,337 880
FIN surplusc for 60 observations with
financially related component units
(13,935) (96)
CON fund balanceb for 57 observations with
control-related component units
59,183 1,950
CON surplusc for 57 observations with
control-related component units
(2,882) 3
aFull sample includes all entities that have at least one component unit and FIN sample includes
only entities with a financially related component unit.bFund balance ¼ Unrestricted fund balance or retained earnings (PG, primary government;
FIN, financially related component units; CON, control-related component units).cSurplus ¼ Revenues – Expenditures or expenses.
BARBARA A. CHANEY202
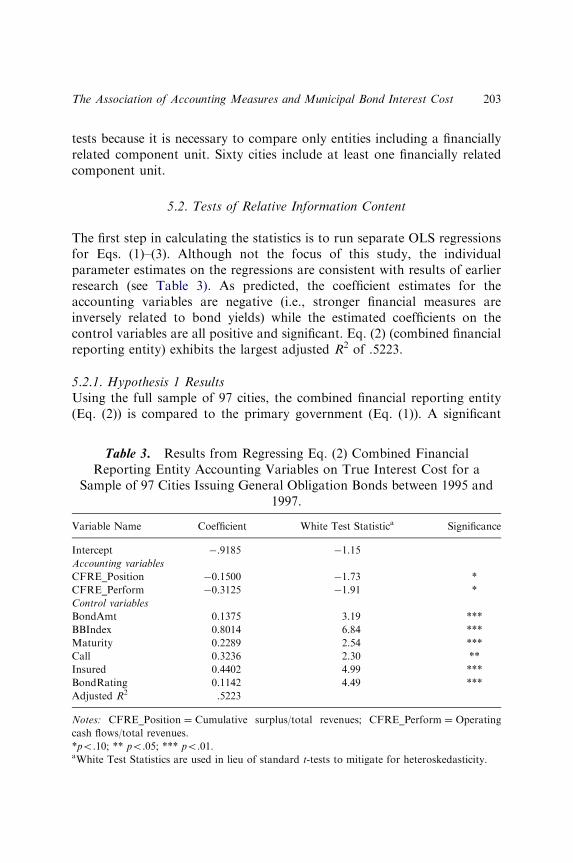
tests because it is necessary to compare only entities including a financiallyrelated component unit. Sixty cities include at least one financially relatedcomponent unit.
5.2. Tests of Relative Information Content
The first step in calculating the statistics is to run separate OLS regressionsfor Eqs. (1)–(3). Although not the focus of this study, the individualparameter estimates on the regressions are consistent with results of earlierresearch (see Table 3). As predicted, the coefficient estimates for theaccounting variables are negative (i.e., stronger financial measures areinversely related to bond yields) while the estimated coefficients on thecontrol variables are all positive and significant. Eq. (2) (combined financialreporting entity) exhibits the largest adjusted R2 of .5223.
5.2.1. Hypothesis 1 ResultsUsing the full sample of 97 cities, the combined financial reporting entity(Eq. (2)) is compared to the primary government (Eq. (1)). A significant
Table 3. Results from Regressing Eq. (2) Combined FinancialReporting Entity Accounting Variables on True Interest Cost for a
Sample of 97 Cities Issuing General Obligation Bonds between 1995 and1997.
Variable Name Coefficient White Test Statistica Significance
Intercept �.9185 �1.15
Accounting variables
CFRE_Position �0.1500 �1.73 *
CFRE_Perform �0.3125 �1.91 *
Control variables
BondAmt 0.1375 3.19 ***
BBIndex 0.8014 6.84 ***
Maturity 0.2289 2.54 ***
Call 0.3236 2.30 **
Insured 0.4402 4.99 ***
BondRating 0.1142 4.49 ***
Adjusted R2 .5223
Notes: CFRE_Position ¼ Cumulative surplus/total revenues; CFRE_Perform ¼ Operating
cash flows/total revenues.
*po.10; ** po.05; *** po.01.aWhite Test Statistics are used in lieu of standard t-tests to mitigate for heteroskedasticity.
The Association of Accounting Measures and Municipal Bond Interest Cost 203
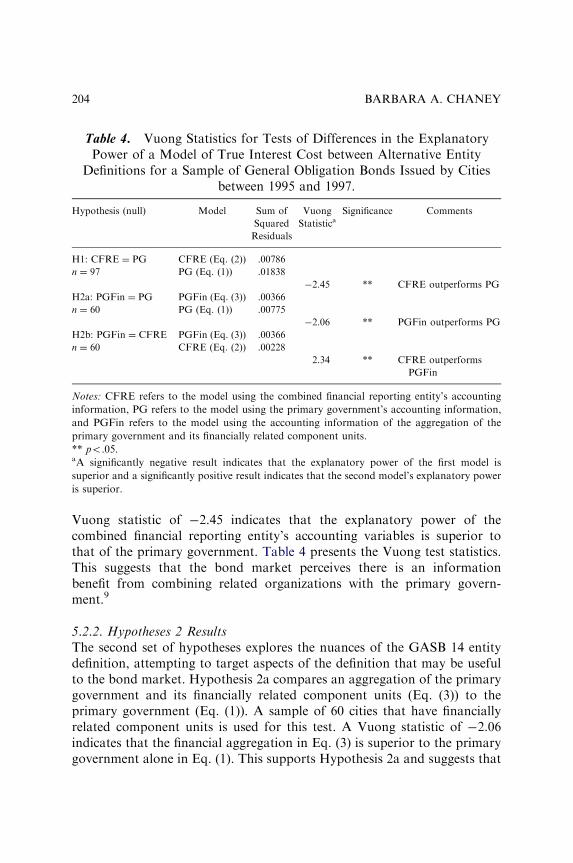
Vuong statistic of �2.45 indicates that the explanatory power of thecombined financial reporting entity’s accounting variables is superior tothat of the primary government. Table 4 presents the Vuong test statistics.This suggests that the bond market perceives there is an informationbenefit from combining related organizations with the primary govern-ment.9
5.2.2. Hypotheses 2 ResultsThe second set of hypotheses explores the nuances of the GASB 14 entitydefinition, attempting to target aspects of the definition that may be usefulto the bond market. Hypothesis 2a compares an aggregation of the primarygovernment and its financially related component units (Eq. (3)) to theprimary government (Eq. (1)). A sample of 60 cities that have financiallyrelated component units is used for this test. A Vuong statistic of �2.06indicates that the financial aggregation in Eq. (3) is superior to the primarygovernment alone in Eq. (1). This supports Hypothesis 2a and suggests that
Table 4. Vuong Statistics for Tests of Differences in the ExplanatoryPower of a Model of True Interest Cost between Alternative Entity
Definitions for a Sample of General Obligation Bonds Issued by Citiesbetween 1995 and 1997.
Hypothesis (null) Model Sum of
Squared
Residuals
Vuong
StatisticaSignificance Comments
H1: CFRE ¼ PG CFRE (Eq. (2)) .00786
n ¼ 97 PG (Eq. (1)) .01838
�2.45 ** CFRE outperforms PG
H2a: PGFin ¼ PG PGFin (Eq. (3)) .00366
n ¼ 60 PG (Eq. (1)) .00775
�2.06 ** PGFin outperforms PG
H2b: PGFin ¼ CFRE PGFin (Eq. (3)) .00366
n ¼ 60 CFRE (Eq. (2)) .00228
2.34 ** CFRE outperforms
PGFin
Notes: CFRE refers to the model using the combined financial reporting entity’s accounting
information, PG refers to the model using the primary government’s accounting information,
and PGFin refers to the model using the accounting information of the aggregation of the
primary government and its financially related component units.
** po.05.aA significantly negative result indicates that the explanatory power of the first model is
superior and a significantly positive result indicates that the second model’s explanatory power
is superior.
BARBARA A. CHANEY204
the bond market includes the accounting information of financially relatedcomponent units when evaluating a primary government’s GO bond issue.
However, the result for Hypothesis 2a may only be reflecting the patternsuggested by Hypothesis 1, namely that any type of inclusion andaggregation is useful to the bond market. To test whether the bond marketis discriminating between the financially related and control-relatedcomponent units, Hypothesis 2b compares the aggregation of the primarygovernment and its financially related component units (Eq. (3)) to thecombined financial reporting entity (Eq. (2)).
In this comparison of 60 cities, I unexpectedly found that full aggregationis preferred.10 The aggregation of the primary government and its financiallyrelated component units is rejected (Vuong statistic of 2.34) in favor of thecombined financial reporting entity. The result for Hypothesis 2b suggeststhat the bond market does not ignore control-related component units whenvaluing a municipal new issue. This is contrary to what the bond marketrepresentatives suggested in Patton’s (1987) interviews.
However, the test of Hypothesis 2b is not precise enough to determineconclusively that the bond market does not make distinctions between theprimary government and the different types of component units. It indicatesthat full aggregation is relatively more informative than partial aggregation,but it cannot rule out the possibility that bond investors differentially weightfinancial information of the primary government, financially relatedcomponent units, and control-related component units. If the financialinformation of the primary government and its component units is valueddifferently, discrete presentation provides a benefit. I test this in the sectionthat follows.
5.3. Tests of the Usefulness of Discrete Presentation
Discrete presentation is useful if presentation of disaggregated informationprovides details that complement the aggregated totals used to pricemunicipal bonds. Each disaggregated piece may be weighted differently bythe bond market based on the importance of the underlying relationship tothe default risk of the GO bonds. I present a series of additional hypothesesbased on these relationships.
H3a. In a model of true interest cost, the accounting variables of theprimary government are weighted more than the accounting variables ofthe control-related component units.
The Association of Accounting Measures and Municipal Bond Interest Cost 205
H3b. In a model of true interest cost, the accounting variables of thefinancially related component units are weighted more than theaccounting variables of the control-related component units.
I test the hypotheses using the following equation:
TIC ¼ a0 þ k1PG_Positionþ k2Fin_Positionþ k3Con_Position
þ l1PG_Performþ l2Fin_Performþ l3Con_Perform
þ a1BondAmtþ a2BBIndexþ a3Maturityþ a4Callþ a5Insured
þ a6BondRatingþ � ð4Þ
In Eq. (4), financial position and performance are measured separately forthe primary government (PG_Position, PG_Perform), the financially relatedcomponent units (Fin_Position, Fin_Perform), and the control-relatedcomponent units (Con_Position, Con_Perform). Eq. (4) is a disaggregatedmodel. It is similar to Eq. (2) in that the financial position and performancemeasures in Eq. (2) (CFRE_Position, CFRE_Perform) are the sum of thethree measures from Eq. (4) and represent the financial position andperformance of the combined financial reporting entity. Revenue of thecombined entity is used to scale all accounting variables.
I compare the two sets of three coefficient estimates of Eq. (4) (k1, k2, k3and l1, l2, l3) for differences in relative weights. If the financial informationof the primary government and its component units are valued equivalently,disclosure of the sum is sufficient (Jennings, 1990). A finding of significantdifferences in some or all of the estimated coefficients (F-statistics) in Eq. (4)indicates that investors value the components differently from each otherand supports the GASB’s provision for discrete presentation.
Another means to test the usefulness of discrete presentation is tocompare the explanatory power of the disaggregated financial information(Eq. (4)) with financial information aggregated for the combined financialreporting entity (Eq. (2)).11 I test whether Eq. (4) has greater explanatorypower than Eq. (2) under the following hypothesis:
H4. The true interest cost on new GO bond issues is more closelyassociated with disaggregated accounting variables than accountingvariables of the combined financial reporting entity.
The results of testing Hypotheses 3 and 4 are summarized in Table 5.12
Panel A presents tests of differences in the estimated coefficients for theprimary government, the financially related component units, and the
BARBARA A. CHANEY206
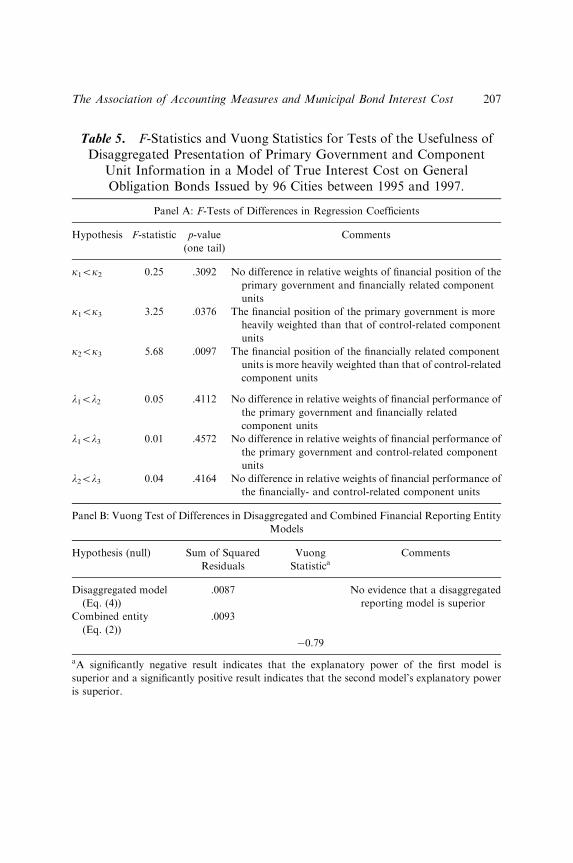
Table 5. F-Statistics and Vuong Statistics for Tests of the Usefulness ofDisaggregated Presentation of Primary Government and Component
Unit Information in a Model of True Interest Cost on GeneralObligation Bonds Issued by 96 Cities between 1995 and 1997.
Panel A: F-Tests of Differences in Regression Coefficients
Hypothesis F-statistic p-value
(one tail)
Comments
k1ok2 0.25 .3092 No difference in relative weights of financial position of the
primary government and financially related component
units
k1ok3 3.25 .0376 The financial position of the primary government is more
heavily weighted than that of control-related component
units
k2ok3 5.68 .0097 The financial position of the financially related component
units is more heavily weighted than that of control-related
component units
l1ol2 0.05 .4112 No difference in relative weights of financial performance of
the primary government and financially related
component units
l1ol3 0.01 .4572 No difference in relative weights of financial performance of
the primary government and control-related component
units
l2ol3 0.04 .4164 No difference in relative weights of financial performance of
the financially- and control-related component units
Panel B: Vuong Test of Differences in Disaggregated and Combined Financial Reporting Entity
Models
Hypothesis (null) Sum of Squared
Residuals
Vuong
StatisticaComments
Disaggregated model
(Eq. (4))
.0087 No evidence that a disaggregated
reporting model is superior
Combined entity
(Eq. (2))
.0093
�0.79
aA significantly negative result indicates that the explanatory power of the first model is
superior and a significantly positive result indicates that the second model’s explanatory power
is superior.
The Association of Accounting Measures and Municipal Bond Interest Cost 207
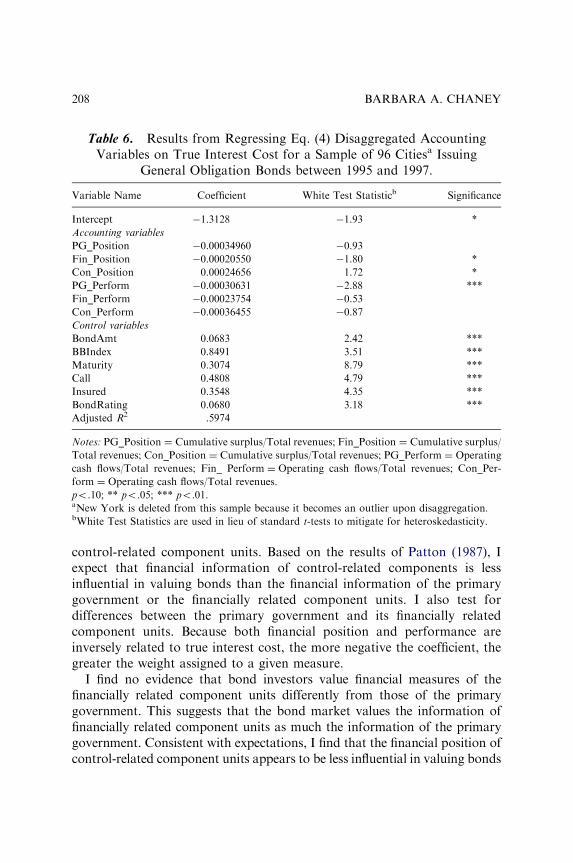
control-related component units. Based on the results of Patton (1987), Iexpect that financial information of control-related components is lessinfluential in valuing bonds than the financial information of the primarygovernment or the financially related component units. I also test fordifferences between the primary government and its financially relatedcomponent units. Because both financial position and performance areinversely related to true interest cost, the more negative the coefficient, thegreater the weight assigned to a given measure.
I find no evidence that bond investors value financial measures of thefinancially related component units differently from those of the primarygovernment. This suggests that the bond market values the information offinancially related component units as much the information of the primarygovernment. Consistent with expectations, I find that the financial position ofcontrol-related component units appears to be less influential in valuing bonds
Table 6. Results from Regressing Eq. (4) Disaggregated AccountingVariables on True Interest Cost for a Sample of 96 Citiesa Issuing
General Obligation Bonds between 1995 and 1997.
Variable Name Coefficient White Test Statisticb Significance
Intercept �1.3128 �1.93 *
Accounting variables
PG_Position �0.00034960 �0.93
Fin_Position �0.00020550 �1.80 *
Con_Position 0.00024656 1.72 *
PG_Perform �0.00030631 �2.88 ***
Fin_Perform �0.00023754 �0.53
Con_Perform �0.00036455 �0.87
Control variables
BondAmt 0.0683 2.42 ***
BBIndex 0.8491 3.51 ***
Maturity 0.3074 8.79 ***
Call 0.4808 4.79 ***
Insured 0.3548 4.35 ***
BondRating 0.0680 3.18 ***
Adjusted R2 .5974
Notes: PG_Position ¼ Cumulative surplus/Total revenues; Fin_Position ¼ Cumulative surplus/
Total revenues; Con_Position ¼ Cumulative surplus/Total revenues; PG_Perform ¼ Operating
cash flows/Total revenues; Fin_ Perform ¼ Operating cash flows/Total revenues; Con_Per-
form ¼ Operating cash flows/Total revenues.
po.10; ** po.05; *** po.01.aNew York is deleted from this sample because it becomes an outlier upon disaggregation.bWhite Test Statistics are used in lieu of standard t-tests to mitigate for heteroskedasticity.
BARBARA A. CHANEY208
than the financial position of either the primary government or the financiallyrelated component units. No differences are observed among the coefficientson measures of current period financial performance. This result holds eventhough the primary government’s financial performance is significant.13
Panel B presents a Vuong statistic comparing the disaggregated model(Eq. (4)) to that of the combined reporting entity (Eq. (2)). While the modelcontaining disaggregated financial information appears to explain more ofthe variation in true interest cost, the differences in explanatory abilitybetween the disaggregated and combined models is not significant. Theresult is that I have conflicting evidence regarding the usefulness of discretepresentation – significant differences among the coefficients using F-statisticsbut insignificant differences in explanatory power using the Vuong test. (Theregression results of Eq. (4) are presented in Table 6 and are generallyrepresentative of the OLS regression results of the other equations.)
The difference in outcomes of testing Hypotheses 3 and 4 is likely theresult of a limited sample size. The F-test is designed for finite samples, whilethe Vuong test is based on asymptotic theory. Accordingly, the distribu-tional properties of Vuong are not well known for limited samples, such asours. In this setting, the F-statistic provides a better test and the results ofVuong tests should be interpreted with caution.14
6. CONCLUSION
Under GASB Statement 14, The Financial Reporting Entity, the financialreports of state and local governments are required to include quasi-government organizations that are administratively or financially linked tothe primary government. Unlike the private sector, the financial statementsof these component units are discretely presented. This enables a financialstatement user to selectively include component units when evaluating agovernment’s financial condition. I use the opportunity provided by discretepresentation to determine whether component unit financial information isconsidered in pricing GO bonds issued by municipal governments. Myanalysis provides evidence useful in assessing the requirements of GASB 14for the inclusion and discrete presentation of component units in municipalreports.
I observe that the true interest cost on newly issued bonds is more closelyassociated with the accounting information of the GASB 14 combinedfinancial reporting entity than the accounting information of the primarygovernment alone. Further, I find that the true interest cost is more strongly
The Association of Accounting Measures and Municipal Bond Interest Cost 209
associated with the combined financial reporting entity than an aggregationof the primary government and its financially related component units. Thissupports the GASB’s overall definition of the financial reporting entity.
Additionally, I test whether the bond market distinguishes between theaccounting information of financially related and control-related compo-nent units. I find evidence that the financial information of component unitsincluded for control-related reasons is not valued as strongly as financialinformation of the primary government or its financially related componentunits. This supports the GASB’s requirement for discrete presentation ofcomponent unit information.
My results have policy implications for the GASB because it is currentlyrevisiting GASB 14 as part of an agenda project to examine the effectivenessof the standard. I find support for the entity definition provided by GASB14 and evidence supporting discrete presentation. In addition, my resultssupport the GASB 34 requirement that component units be included in thegovernment-wide financial statements.
NOTES
1. In 1999 the FASB issued an Exposure Draft, Consolidated FinancialStatements: Purpose and Policy, which would require consolidation based on effectivecontrol rather than ownership. However, the Board has not issued a final statementon consolidation policy. Instead, the Board has focused its efforts on consolidationprocedures (e.g., eliminating pooling of interest accounting via Statement 141 andrevising the accounting for goodwill via Statement 142) and harmonizing businesscombination accounting with the International Accounting Standards Board.
2. Some examples of component units include the city of Atlanta’s RecreationAuthority, which operated a stadium, sports arena, and the Atlanta Zoo. It is acomponent unit because Atlanta promised to help fund any deficiencies in principaland interest payments on construction bonds (i.e., a financial burden to the city). TheCity of San Mateo can impose its will on the Children and Families FirstCommission because the City Board of Supervisors may remove appointedcommission members at will. Although the City of Baton Rouge does not guaranteethe debt of the Fire Protection District or subsidize its operations, the District isfiscally dependent on the City because the City Council approves the district’s taxrates and charges.
3. The Financial Accounting Standards Board (FASB) issued Statement 94,Consolidation of All Majority-owned Subsidiaries, in late 1987, requiring corporationsto begin consolidating their finance subsidiaries in 1988. Before this standard, financesubsidiaries were not consolidated because the corporation’s and the subsidiary’soperations are ‘‘nonhomogeneous.’’ Tosh and Rue (1988) use financial reports issuedprior to FASB Statement 94.
BARBARA A. CHANEY210
4. Biddle, Seow, and Siegel (1995) and Jennings (1990) discuss the differencebetween relative information content and incremental information content tests.
5. The amounts paid for bond insurance are deducted from the net proceeds incalculating TIC and increase the effective interest rate, similar to bond discounts.Bonds are insured in the interest of marketability to assure AAA rating. Thedichotomous Insured variable is necessary to capture the interest cost effect betweena bond’s insured rating and its ‘‘natural’’ rating in the absence of insurance. Resultsusing separate indicator variables for different bond ratings (AAA, AA, A) in placeof the single variable, BondRating, are not qualitatively different.
6. The Municipal Bond Investors Assurance (MBIA) Corporation is the largestprovider of municipal bond insurance. In 1993, it insured 36.7% of municipal newissues that were insured (Zipf, 1995).
7. Wilson (1983) uses a qualitative variable to indicate the existence of a generalfund deficit. Wallace (1981) uses the natural log of general fund deficit, while Wilsonand Howard (1984) replicate Wallace using general fund balance, regardless ofwhether it is a deficit or surplus. Reck et al (2004) measure general fund balancescaled by revenues.
8. Wilson (1983) uses current operating deficit (revenues less than expenditures).Wallace (1981) uses total revenues minus expenditures and Wilson and Howard(1984) use the square root of general fund revenue.
9. All results are robust to alternative measures of Perform (financial performance),the inclusion of long-term debt as a variable, and limiting the sample to observationswhere the component units’ revenues are not less than 1% of general fund revenues.10. The sample of 60 cities with financially related component units is not the ideal
sample for this test. A sample of cities with both financially related and control-related component units would provide stronger results. I use the sample of 60because I only have 22 cities including both types of component units, and thatsample size is too small for statistical evaluation. For the observations with nocontrol-related component units, I am essentially comparing the primary govern-ment to the combined financial reporting entity. Because using the sample of 60biases against finding statistically significant results, I feel comfortable using theconceptually inferior sample of 60.11. In a similar design, Barth, Cram, and Nelson (2001) use Vuong statistics to
compare the components of net income to the aggregate amount.12. Regression results in the disaggregated equations are relatively sensitive to an
outlier in the data. Tables 5 and 6 report results after dropping the largestobservation (New York City) from the sample.13. An alternative formulation of the model uses the combined financial reporting
entity accounting measures rather than the primary government in Eq. (4) (seeJennings, 1990 for a discussion of alternative expression of linear transformations).Tests (F-statistics) of differences among coefficients lead to comparable conclusionsas those reported. However, this alternative formulation is not suitable for follow uptesting with the Vuong statistic because the two equations under evaluation would nolonger be nonnested.14. A similar caution is appropriate for my earlier tests (Hypotheses 1 and 2).
However, in those cases the results of the Vuong test are corroborated by significantcoefficients on accounting variables in the disaggregated model (Eq. (4)).
The Association of Accounting Measures and Municipal Bond Interest Cost 211
REFERENCES
Barth, M. E., Cram, D. P., & Nelson, K. K. (2001). Accruals and the prediction of future cash
flows. The Accounting Review, 76, 27–58.
Biddle, G. C., Seow, G. S., & Siegel, A. F. (1995). Relative versus incremental information
content. Contemporary Accounting Research, 12, 1–23.
Engstrom, J. H. (1985). The governmental reporting entity. Journal of Accounting, Auditing and
Finance (Summer), 305–318.
Financial Accounting Standards Board (FASB). (1987). Statement no. 94, consolidation of all
majority-owned subsidiaries. Stamford, CT: FASB.
Governmental Accounting Standards Board (GASB). (1987). Concepts statement no. 1,
objectives of financial reporting. Stamford, CT: GASB.
Governmental Accounting Standards Board (GASB). (1991). Statement no. 14, the financial
reporting entity. Norwalk, CT: GASB.
Governmental Accounting Standards Board (GASB). (1999). Statement no. 34, basic financial
statements � and management’s discussion and analysis � for state and local governments.
Norwalk, CT: GASB.
Hastie, K. L. (1972). Determinants of municipal bond yields. Journal of Finance and
Quantitative Analysis, 7, 1729–1748.
Ingram, R. W., Raman, K. K., & Wilson, E. R. (1987). Governmental capital markets research
in accounting: A review. Research in Governmental and Nonprofit Accounting, 3, 111–126.
Ingram, R. W., & Wilson, E. R. (1999). Information intermediation and seasoned municipal
bond yields. Research in Governmental and Nonprofit Accounting, 10, 1–31.
Jennings, R. (1990). A note on interpreting ‘‘incremental information content’’. The Accounting
Review, 65, 925–932.
Jones, D. B., Scott, R. B., Kimbro, L., & Ingram, R. (1985). The needs of users of governmental
financial reports. Stamford, CT: GASB.
Karvelis, L. J. (1987). The use and usefulness of governmental financial reports: The perspective
of municipal investors. Research in Governmental and Nonprofit Accounting, 3, 175–188.
Patton, J. M. (1987). An empirical study of governmental financial reporting entity issues.
Stamford, CT: GASB.
Pesaran, H. (1974). On the general problem of model selection. Review of Economic Studies, 41,
153–171.
Reck, J. L., Wilson, E. R., Gotlob, D., & Lawrence, C. M. (2004). Government capital markets
research in accounting: A review, extension, and directions for future research. Research
in Governmental and Nonprofit Accounting, 11, 1–34.
Shoulders, C. D. (1982). Criteria for identifying the municipal organizational reporting entity.
DBA dissertation, Texas Tech University.
Simonsen, B., Robbins, M. D., & Jump, B., Jr. (2005). State rules about the use of net interest
cost and true interest cost for calculating municipal bond interest rates. Municipal
Finance Journal, 26, 1–25.
Tosh, D. E., & Rue, J. C. (1988). The effects of unconsolidated finance subsidiary debt on
market estimates of systematic risk. Journal of Accounting Literature, 7, 157–173.
Vuong, Q. H. (1989). Likelihood ratio tests for model selection and non-nested hypotheses.
Econometrica, 57, 307–333.
Wallace, W. A. (1981). The association between municipal market measures and selected
financial reporting practices. Journal of Accounting Research, 19, 502–520.
BARBARA A. CHANEY212

Wilson, E. R. (1983). Fiscal performance and municipal bond borrowing costs. Public
Budgeting and Finance, 3(Winter), 28–41.
Wilson, E. R., & Howard, T. P. (1984). The association between municipal market measures
and selected financial reporting practices: Additional evidence. Journal of Accounting
Research, 22, 207–224.
Zipf, R. (1995). How municipal bonds work. New York: New York Institute of Finance.
The Association of Accounting Measures and Municipal Bond Interest Cost 213

This page intentionally left blank
THE EFFECT OF GOVERNMENTAL
ACCOUNTING STANDARDS
BOARD STATEMENT 34 ON
MUNICIPAL AUDIT FEES
Arthur Allen and George Sanders
ABSTRACT
We examined the change in audit fees after adoption of GASB 34 for asample of 350 cities, correcting for audit fee inflation unrelated to GASB34. We found that the mean (median) fee change for 2002 adopters was 4.9(2.9) percentage points higher than for non-adopters. The mean (median)fee increase for 2003 adopters, smaller cities, was 11.6% (8.6%) over thenon-adoption year fee increase. Overall, we found that the adoption ofStatement 34 increased mean (median) fees approximately 9% (5%) forall cities, but that the effect was significantly larger for small cities.Overall, we documented an increase in fees associated with adoption that isboth statistically and practically significant.
INTRODUCTION
For fiscal years beginning after June 30, 2001, state and local governmentswere required to begin implementing Governmental Accounting Standards
Research in Governmental and Nonprofit Accounting, Volume 12, 215–232
Copyright r 2009 by Emerald Group Publishing Limited
All rights of reproduction in any form reserved
ISSN: 0884-0741/doi:10.1108/S0884-0741(2009)0000012011
215
Board (GASB) Statement 34: ‘‘Basic Financial Statements – and Manage-ment’s Discussion and Analysis for State and Local Governments.’’ Theeffective date of GASB 34 was 1 year later for organizations with annualrevenues between $10 million and $100 million, and 2 years later fororganizations with annual revenues less than $10 million. GASB 34mandated profound changes to the financial reporting model and requirednumerous additional disclosures to be made in the financial reports. Thisadditional information is likely to impose costs on issuers. The GASBbelieves the new financial statements and disclosures will prove useful todecision makers and exceed the costs of implementing the new standard. Asnoted by Copley et al. (1997), while ‘‘there is little reason to expect thesereforms to increase citizen use of governmental financial reports’’ somebenefits may be derived indirectly from changes in the behavior ofgovernmental decision makers.
Researchers have looked at the benefits of implementing GASB 34 (e.g.,Plummer, Hutchinson, & Patton, 2007), but there is little researchexamining its costs. Our purpose is to provide initial empirical evidenceon one aspect of the cost side of this argument: the additional cost ofobtaining an audit. To our knowledge, other than surveys of preparers’expectations before implementation, no study provides empirical evidenceon the costs of GASB 34. Our study, therefore, complements other researchwhich examines the decision usefulness of GASB 34 financial statements(e.g., Plummer et al., 2007).
The GASB seeks information regarding the costs and benefits of newstandards. Unless the GASB carefully balances costs and benefits, it may losebroad support. While GASB 34 had many supporters (e.g., Saaco, 2000), itwas a controversial pronouncement because many perceived the benefits to besmall (e.g., Anthony & Newberry, 2000) and its costs large. These views wereparticularly prevalent among preparers. The GFOA and other groups arenow objecting to the GASBs Service Efforts and Accomplishments agenda. InDecember 2006, the GFOAs executive board recommended to the FinancialAccounting Foundation (FAF) that the GASB be eliminated. More recently,Texas gave its local governments the choice of whether to follow GASBStatement 45 Accounting and Financial Reporting by Employers forPostemployment Benefits Other Than Pensions (Barkin, 2007). These pressuresmoved the GASB to issue a White Paper (2006) to defend the need forgovernments to have separate accounting and financial reporting standards.1
The next section describes the reporting requirements of GASB 34 that areexpected to lead to higher costs. The section ‘‘Data and Methods’’ describesthe data and empirical methods. The ‘‘Results’’ section presents the results.
ARTHUR ALLEN AND GEORGE SANDERS216
The final section provides conclusions and discusses the implications of thechapter.
NEW REPORTING REQUIREMENTS
The GASB Implementation Guide for Statement 34 describes Statement 34as, ‘‘one of the most comprehensive financial reporting standards in thehistory of standards setting . . . ’’ (GASB, 2000, Preface). Additionalreporting requirements mandated by GASB 34 include the following:
� Amanagement’s discussion and analysis is required to provide readers with‘‘an objective and easily readable analysis of the government’s financialperformance for the year’’ (GASB, 1999).� An additional set of financial statements, called government-widestatements, are required that are accrual-based and that consolidateinformation across funds. These statements focus on economic resourcesrather than the more limited focus on financial resources used by fund-based financial statements.� Budgetary schedule are now required as part of the Required Supple-mental Information (RSI).2
Infrastructure reporting was one of the most controversial requirementsbecause of its perceived costs. Infrastructure assets must be capitalized, anddepreciation is required unless the government elects to use the modifiedapproach.3 The AICPA (2007) Accounting and Audit Guide: State and LocalGovernments (AAG-SLG, Chap. 7, para. 7.58) requires the auditor toexamine evidence for the existence or occurrence of capital assets andrelated accounts, for the completeness of the records for capital assets andaccumulated depreciation, for rights and obligations affecting the entity’scapital assets, that capital assets and related accounts are reported at properamounts, and that they are properly classified, described, and disclosed.Because records for historical costs may be unavailable, GASB 34allows governments to estimate costs. In that case, Chapter 7, para. 79 ofthe AAG-SLG requires that auditors consider obtaining evidence concern-ing the reasons why historical cost could not be determined. Clearly, thescope of the attest function with respect to capital assets has expandedsignificantly.
The modified approach also requires considerable additional informationincluding a complete inventory of infrastructure, setting required conditionlevels and regular measurement of these condition levels. If the modified
The Effect of Governmental Accounting Standards Board Statement 34 217
approach is elected, the AAG-SLG (Chap. 7, para. 60) requires that theauditor obtain evidence that the asset management system and thedocumentation of the condition of assets comply with applicable GAAP.
Another example of the complications facing auditors is the treatment ofinterfund activities. In the government-wide financial statements manyinterfund transactions must be eliminated. The AAG-SLG notes thatrecords may not provide sufficient information to eliminate internalactivities and balances. Auditors are advised to consider the materiality ofany GAAP departure and consider a scope limitation (Chap. 9, para. 9.27).
A Standard and Poor’s survey (Hume, 2000) of preparers estimated thatGASB 34 would cost cities $35,000–500,000 to implement because, it ‘‘willrequire state and local governments to make major changes in theiraccounting systems.’’ (Hyman Grossman, Standard and Poor’s managingdirector for public finance, quoted by Hume (2000)). The GovernmentFinance Officers’ Association (GFOA) was sufficiently concerned aboutcosts that at one point they recommended members consider the costs andbenefits of infrastructure reporting before implementing the infrastructurereporting requirements of the statement (Hume, 1999).
Engstrom and Tidrick (2001) identified ten issues auditors must contendwith to audit GASB 34 statements. Del Vecchio, Johnson, and Magner(2007) found that preparers had concerns about the difficulty and cost aboutseveral aspects of GASB 34 implementation including the cost of gatheringinformation for capital assets, the procedures for recording transactions forgovernmental fund and government-wide statements, the development ofthe MD&A, and the reconciliation between the fund and government-widefinancial statements. The preparers in Del Vecchio et al.’s survey had‘‘reservations about whether the benefits to be realized by GASB 34 exceedits implementation costs.’’
Since GASB 34 has been implemented, there has been little researchaddressing whether the concerns of preparers have been realized. Combinedwith evidence on the decision usefulness of GASB 34 from other studies, ourevidence on its additional costs will provide information to the GASB, otherpolicy makers, and their constituents on the relative costs and benefits of thissignificant, and potentially burdensome governmental accounting standard.
DATA AND METHODS
We collected our data through a survey of cities with populations in excessof 20,000 as of the 2000 census. We received 350 usable responses for the
ARTHUR ALLEN AND GEORGE SANDERS218
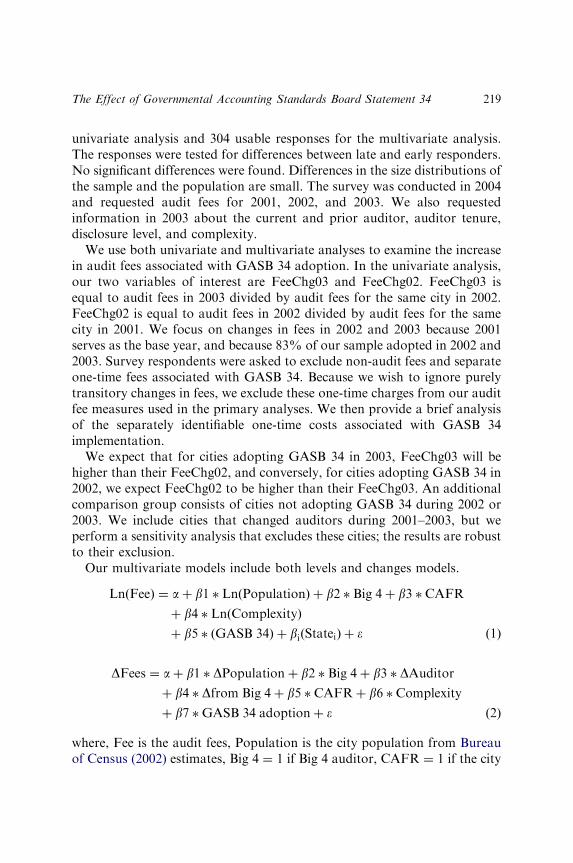
univariate analysis and 304 usable responses for the multivariate analysis.The responses were tested for differences between late and early responders.No significant differences were found. Differences in the size distributions ofthe sample and the population are small. The survey was conducted in 2004and requested audit fees for 2001, 2002, and 2003. We also requestedinformation in 2003 about the current and prior auditor, auditor tenure,disclosure level, and complexity.
We use both univariate and multivariate analyses to examine the increasein audit fees associated with GASB 34 adoption. In the univariate analysis,our two variables of interest are FeeChg03 and FeeChg02. FeeChg03 isequal to audit fees in 2003 divided by audit fees for the same city in 2002.FeeChg02 is equal to audit fees in 2002 divided by audit fees for the samecity in 2001. We focus on changes in fees in 2002 and 2003 because 2001serves as the base year, and because 83% of our sample adopted in 2002 and2003. Survey respondents were asked to exclude non-audit fees and separateone-time fees associated with GASB 34. Because we wish to ignore purelytransitory changes in fees, we exclude these one-time charges from our auditfee measures used in the primary analyses. We then provide a brief analysisof the separately identifiable one-time costs associated with GASB 34implementation.
We expect that for cities adopting GASB 34 in 2003, FeeChg03 will behigher than their FeeChg02, and conversely, for cities adopting GASB 34 in2002, we expect FeeChg02 to be higher than their FeeChg03. An additionalcomparison group consists of cities not adopting GASB 34 during 2002 or2003. We include cities that changed auditors during 2001–2003, but weperform a sensitivity analysis that excludes these cities; the results are robustto their exclusion.
Our multivariate models include both levels and changes models.
LnðFeeÞ ¼ aþ b1 � LnðPopulationÞ þ b2 � Big 4þ b3 � CAFR
þ b4 � LnðComplexityÞ
þ b5 � ðGASB 34Þ þ biðStateiÞ þ � ð1Þ
DFees ¼ aþ b1 � DPopulationþ b2 � Big 4þ b3 � DAuditor
þ b4 � Dfrom Big 4þ b5 � CAFRþ b6 � Complexity
þ b7 �GASB 34 adoptionþ � ð2Þ
where, Fee is the audit fees, Population is the city population from Bureauof Census (2002) estimates, Big 4 ¼ 1 if Big 4 auditor, CAFR ¼ 1 if the city
The Effect of Governmental Accounting Standards Board Statement 34 219
prepares a CAFR under GASB guidelines, Complexity equals one plus thenumber of adjusting journal entries required by the auditor, GASB 34 ¼ 1 ifGASB 34 has been adopted by that year, Statei are a series of indicatorvariables coded 1 if the city is located in state i, DPopulation is the currentyear’s population divided by prior year’s population, DAuditor ¼ 1 if theauditor has changed in the current year, Dfrom Big 4 ¼ 1 if the auditorswitched away from a Big 4 auditor in the current year, GASB 34adoption ¼ 1 if the city adopted GASB 34 in the current year.
Model 1 is run separately for each of the three year’s audit fees. Formodel 2, separate models are run for the 2003/2002 change in fees and the2002/2001 change in fees. Because we collected data from a single survey,there are limitations to some of the above variables. For the 2001 and 2002models, CAFR and Complexity are proxied by the 2003 survey responses;we do not measure changes in these variables. Because we requestedinformation about only the most recent auditor change, we assume thatcities that switched auditors in 2003 did not switch auditors in 2002. Becauseonly two cities switched to a Big 4 auditor, we do not include an indicatorvariable for cities switching to a Big 4 auditor.
We expect that the coefficients on the GASB 34 and GASB 34 adoptionvariables will be positive indicating that GASB 34 adopters pay higher feesand have larger fee increases. Because the levels’ models make comparisonsbetween adopters and non-adopters, they do not directly address whetherfees increase after GASB 34 adoption. However, a significant differencebetween adopters and non-adopters in a levels’ regression is evidenceconsistent with fee increases due to GASB 34 adoption. The change modelsprovide more direct evidence of fee increases. The advantage of themultivariate analysis is that it explicitly controls for factors known to affectaudit fees. The advantage of the univariate analysis is that each city is itsown control; the change in fees for each city is compared for the GASB 34adoption year to the non-GASB 34 adoption year.
RESULTS
Univariate Analysis
Table 1 contains descriptive statistics. Panel A of Table 1 consists of citiesthat adopted in 1999 (one city), 2000 (one city), and 2001 (19 cities). Thesamples for Panel B, C, and D consist of cities that adopted GASB 34 in2002, 2003, and 2004, respectively. We will refer to our two control groups as
ARTHUR ALLEN AND GEORGE SANDERS220
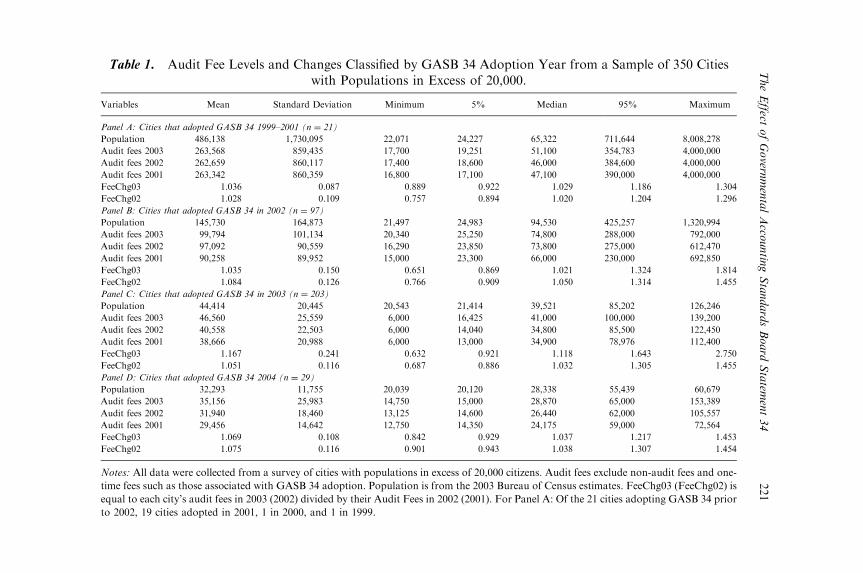
Table 1. Audit Fee Levels and Changes Classified by GASB 34 Adoption Year from a Sample of 350 Citieswith Populations in Excess of 20,000.
Variables Mean Standard Deviation Minimum 5% Median 95% Maximum
Panel A: Cities that adopted GASB 34 1999–2001 (n ¼ 21)
Population 486,138 1,730,095 22,071 24,227 65,322 711,644 8,008,278
Audit fees 2003 263,568 859,435 17,700 19,251 51,100 354,783 4,000,000
Audit fees 2002 262,659 860,117 17,400 18,600 46,000 384,600 4,000,000
Audit fees 2001 263,342 860,359 16,800 17,100 47,100 390,000 4,000,000
FeeChg03 1.036 0.087 0.889 0.922 1.029 1.186 1.304
FeeChg02 1.028 0.109 0.757 0.894 1.020 1.204 1.296
Panel B: Cities that adopted GASB 34 in 2002 (n ¼ 97)
Population 145,730 164,873 21,497 24,983 94,530 425,257 1,320,994
Audit fees 2003 99,794 101,134 20,340 25,250 74,800 288,000 792,000
Audit fees 2002 97,092 90,559 16,290 23,850 73,800 275,000 612,470
Audit fees 2001 90,258 89,952 15,000 23,300 66,000 230,000 692,850
FeeChg03 1.035 0.150 0.651 0.869 1.021 1.324 1.814
FeeChg02 1.084 0.126 0.766 0.909 1.050 1.314 1.455
Panel C: Cities that adopted GASB 34 in 2003 (n ¼ 203)
Population 44,414 20,445 20,543 21,414 39,521 85,202 126,246
Audit fees 2003 46,560 25,559 6,000 16,425 41,000 100,000 139,200
Audit fees 2002 40,558 22,503 6,000 14,040 34,800 85,500 122,450
Audit fees 2001 38,666 20,988 6,000 13,000 34,900 78,976 112,400
FeeChg03 1.167 0.241 0.632 0.921 1.118 1.643 2.750
FeeChg02 1.051 0.116 0.687 0.886 1.032 1.305 1.455
Panel D: Cities that adopted GASB 34 2004 (n ¼ 29)
Population 32,293 11,755 20,039 20,120 28,338 55,439 60,679
Audit fees 2003 35,156 25,983 14,750 15,000 28,870 65,000 153,389
Audit fees 2002 31,940 18,460 13,125 14,600 26,440 62,000 105,557
Audit fees 2001 29,456 14,642 12,750 14,350 24,175 59,000 72,564
FeeChg03 1.069 0.108 0.842 0.929 1.037 1.217 1.453
FeeChg02 1.075 0.116 0.901 0.943 1.038 1.307 1.454
Notes: All data were collected from a survey of cities with populations in excess of 20,000 citizens. Audit fees exclude non-audit fees and one-
time fees such as those associated with GASB 34 adoption. Population is from the 2003 Bureau of Census estimates. FeeChg03 (FeeChg02) is
equal to each city’s audit fees in 2003 (2002) divided by their Audit Fees in 2002 (2001). For Panel A: Of the 21 cities adopting GASB 34 prior
to 2002, 19 cities adopted in 2001, 1 in 2000, and 1 in 1999.
TheEffect
ofGovern
mentalAcco
untin
gStandardsBoard
Statem
ent34
221
the early and late adopter groups (shown in Panels A and D, respectively).The control groups are not critical to our inferences because in subsequentanalyses, we compare audit fee inflation for each city in its GASB 34adoption year to that same city’s inflation in its non-adoption year. However,the control group will indicate whether there are large differences in audit feeinflation in 2003 compared to 2002. Audit Fee Inflation is measured as theaudit fees of the current year divided by audit fees in the prior year.
Mean population in the early (late) adopter group is 486,138 (32,293) withmedian population of 65,322 (28,338). In the early adopter group, meanFeeChg03 and FeeChg02 is 1.036 and 1.029, respectively; median FeeChg03and FeeChg02 is 1.029 and 1.020. In the late adopter group, mean FeeChg03and FeeChg02 is 1.069 and 1.075, respectively; median FeeChg03 andFeeChg02 is 1.037 and 1.038. Fees increased more for late adopters, whichare much smaller cities. For both early and late adopters, fee increases in2003 were similar to those in 2002. When the two groups are combined(unreported), mean FeeChg03 and FeeChg02 are both 1.055. We concludethat for cities not implementing GASB 34 in 2002 or 2003, audit fee inflationin 2002 is quite similar to that in 2003.
Panels B and C show the same variables in Panels A and D, but Panels Band C consist of cities that adopted GASB 34 in 2002 and 2003, respectively.Mean and median populations of the 2002 adopters (145,730 and 94,530,respectively) are much larger than the 2003 adopters (44,414 and 39,521,respectively). This was expected because GASB 34 allowed smaller cities toadopt later. For cities adopting GASB 34 in 2002, the mean and median ofFeeChg03 was 1.035 and 1.021, respectively, while the mean and medianFeeChg02 was 1.084 and 1.050, respectively. Mean audit fee inflation was 4.9(1.084–1.035) percentage points higher in the adoption year, and thisdifference is statistically significant (p-value ¼ .032).4 Median audit feeinflation was 2.9 (1.050–1.021) percentage points higher during the adoptionyear than in the non-adoption year, and this was also statistically significant(p-value ¼ .004 with signed-rank test). For the 2002 adoption group, 2002fee inflation was much higher than the early adoption (8.4% vs. 2.8%), and2003 fee inflation was about the same (3.5% vs. 3.6%).
For cities adopting GASB 34 in 2003 (Panel C), the mean and median ofFeeChg03 was 1.167 and 1.118, respectively, while the mean and medianFeeChg02 was 1.051 and 1.032, respectively. Mean audit fee inflation was11.6 (1.167–1.051) percentage points higher in the adoption year whilemedian audit fee inflation was 8.6 (1.118 – 1.032) percentage points higherduring the adoption year than in the non-adoption year. Both of thesedifferences are statistically significant at the .001 level. Audit fee inflation for
ARTHUR ALLEN AND GEORGE SANDERS222

the 2003 adoption group in 2002 (5.1%) was about half way between that ofthe early adoption group (2.8%) and the late adoption group (7.5%). Auditfee inflation for the 2003 adoption group (16.7%) was much higher thanboth control group’s 2003 inflation (3.6% and 6.9%).
Our results suggest that audit fee inflation was much higher during theyear GASB 34 was adopted regardless of whether the adoption year was2002 or 2003. A more direct measure of how much higher is computed as theaudit fee inflation in the adoption year minus inflation in the non-adoptionyear when measured at the city level. This measure (G34INFLATE) allowsus to combine all cities that adopted GASB 34 during 2002 or 2003 insteadof comparing means across different samples. For our 300 observationswhich adopted in 2002 or 2003, the mean and median of G34INFLATE is.094 and .055 (not reported), respectively. The mean and median ofG34INFLATE is significantly greater than zero (p-valueo0.001). WhenG34INFLATE is winsorized at 5% and 95%, the mean is reduced to .092.
Our univariate results suggest that GASB 34 increased audit fees by anaverage of 9%, while the median increase in fees was 5.5%. However, thesize of this effect was much larger for cities that adopted GASB 34 in 2003compared to 2002, with an average (median) increase in fees of 11.6 (8.6)percentage points instead of 4.9 (2.9) percentage points. The most obviousexplanation for this result is that GASB 34 had a disproportionate effect onsmaller cities. Larger cities may have already been collecting more of theadditional information required by GASB 34. Smaller cities may rely moreon their auditors to help them finalize changes to their accounting system.Another explanation is that the 2002 adopter group contained smaller citiesthat voluntarily adopted early. These cities had their systems in place early,and were easy to audit in comparison to those cities that waited until theywere required to adopt.
We also examine the likelihood that audit fees will increase more in theGASB 34 adoption year than in the non-adoption year. There are 287observations in our sample which adopted GASB 34 in 2002 or 2003 andhad at least one annual change in audit fees (13 cities had no change in fees).For the 2002 GASB 34 adoption group, 64.8% increased their fees more in2002 than in 2003. For the 2003 GASB 34 adoption group, 69.4% increasedtheir fees more in 2003 than in 2002.
Respondents were asked to separately report one-time fees associatedwith GASB 34 implementation, and these fees have been excluded from ourmain analyses. Most governments (246) reported no one-time feesassociated with GASB 34 adoption. Of those cities reporting a one-timefee (104), the mean amount of that fee was $14,807. As a percentage of
The Effect of Governmental Accounting Standards Board Statement 34 223
ongoing audit fees, these one-time fees average 10.1% for the 2003adopters and 3.6% for the 2002 adopters. These results are similar to thoseof the main analysis. GASB 34 had a disproportionate impact on smallercities.
Supplemental Univariate Analysis
Our discussion thus far has focused on mean and median of audit feechanges. Of potential concern is the effect that extreme observations mayhave on our results. To examine the effect of extreme observations on themagnitudes of the mean fee change differences, we winsorized observationsat 5% and 95%. As an alternative to winsorizing, we also delete the highestand lowest 5% of the observations. The results of these analyses are shownin Table 2. Table 2 also displays a column for mean FeeChg03 minus meanFeeChg02. For the control groups, shown in Panels A and D, FeeChg03 isnot significantly different from FeeChg02, and these tests remain insignif-icant after winsorizing or deleting extreme observations.
For the 2002 GASB 34 adoption group, the mean of FeeChg02 is .049greater than the mean of FeeChg03 (as previously discussed). Winsorizing at5% and 95% increases that difference to .053 while deleting the highest andlowest 5% increases that difference to .057. For the 2002 GASB adoptiongroup, reducing the effect of outliers increases the magnitude of the differencein Audit Fee Inflation during 2002 relative to Fee Inflation in 2003.
For the 2003 GASB 34 adoption group, the mean of FeeChg02 is .116greater than the mean of FeeChg03 (as previously discussed). Winsorizing at5% and 95% decreases that difference to .109, while deleting the lowest andhighest 5% of the observations decreases that difference to .102. For the2003 GASB adoption group, reducing the effect of outliers decreases themagnitude of the difference in Audit Fee Inflation during 2002 relative toinflation in 2003 by 0.7–1.4 percentage points.
Multivariate Models
Table 3 provides descriptive statistics for the sample of cities analyzed usingmultivariate models. The sample size is reduced to 304 observations becauseof incomplete survey responses to the client complexity and disclosure levelquestions. The level of audit fees and population are consistent with thosedescribed in the previous section. Client complexity is the number of
ARTHUR ALLEN AND GEORGE SANDERS224
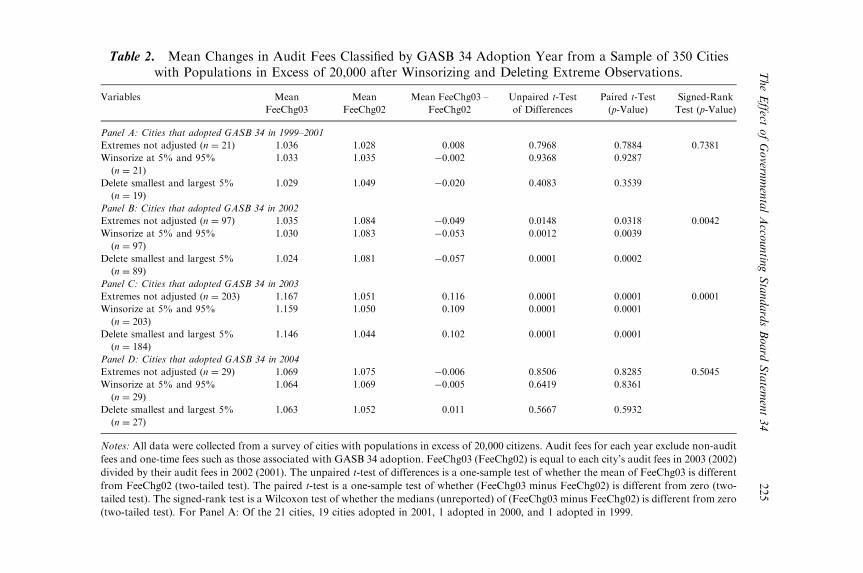
Table 2. Mean Changes in Audit Fees Classified by GASB 34 Adoption Year from a Sample of 350 Citieswith Populations in Excess of 20,000 after Winsorizing and Deleting Extreme Observations.
Variables Mean
FeeChg03
Mean
FeeChg02
Mean FeeChg03 –
FeeChg02
Unpaired t-Test
of Differences
Paired t-Test
(p-Value)
Signed-Rank
Test (p-Value)
Panel A: Cities that adopted GASB 34 in 1999–2001
Extremes not adjusted (n ¼ 21) 1.036 1.028 0.008 0.7968 0.7884 0.7381
Winsorize at 5% and 95%
(n ¼ 21)
1.033 1.035 �0.002 0.9368 0.9287
Delete smallest and largest 5%
(n ¼ 19)
1.029 1.049 �0.020 0.4083 0.3539
Panel B: Cities that adopted GASB 34 in 2002
Extremes not adjusted (n ¼ 97) 1.035 1.084 �0.049 0.0148 0.0318 0.0042
Winsorize at 5% and 95%
(n ¼ 97)
1.030 1.083 �0.053 0.0012 0.0039
Delete smallest and largest 5%
(n ¼ 89)
1.024 1.081 �0.057 0.0001 0.0002
Panel C: Cities that adopted GASB 34 in 2003
Extremes not adjusted (n ¼ 203) 1.167 1.051 0.116 0.0001 0.0001 0.0001
Winsorize at 5% and 95%
(n ¼ 203)
1.159 1.050 0.109 0.0001 0.0001
Delete smallest and largest 5%
(n ¼ 184)
1.146 1.044 0.102 0.0001 0.0001
Panel D: Cities that adopted GASB 34 in 2004
Extremes not adjusted (n ¼ 29) 1.069 1.075 �0.006 0.8506 0.8285 0.5045
Winsorize at 5% and 95%
(n ¼ 29)
1.064 1.069 �0.005 0.6419 0.8361
Delete smallest and largest 5%
(n ¼ 27)
1.063 1.052 0.011 0.5667 0.5932
Notes: All data were collected from a survey of cities with populations in excess of 20,000 citizens. Audit fees for each year exclude non-audit
fees and one-time fees such as those associated with GASB 34 adoption. FeeChg03 (FeeChg02) is equal to each city’s audit fees in 2003 (2002)
divided by their audit fees in 2002 (2001). The unpaired t-test of differences is a one-sample test of whether the mean of FeeChg03 is different
from FeeChg02 (two-tailed test). The paired t-test is a one-sample test of whether (FeeChg03 minus FeeChg02) is different from zero (two-
tailed test). The signed-rank test is a Wilcoxon test of whether the medians (unreported) of (FeeChg03 minus FeeChg02) is different from zero
(two-tailed test). For Panel A: Of the 21 cities, 19 cities adopted in 2001, 1 adopted in 2000, and 1 adopted in 1999.
TheEffect
ofGovern
mentalAcco
untin
gStandardsBoard
Statem
ent34
225
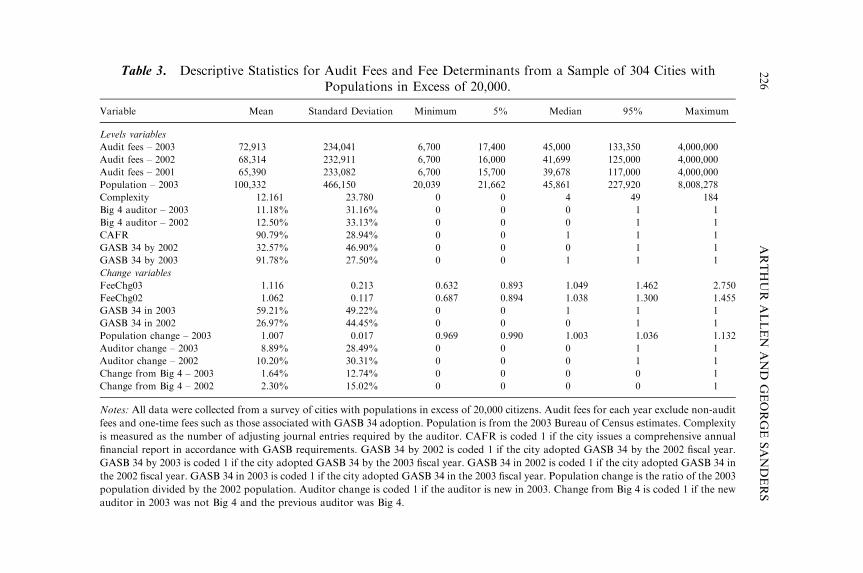
Table 3. Descriptive Statistics for Audit Fees and Fee Determinants from a Sample of 304 Cities withPopulations in Excess of 20,000.
Variable Mean Standard Deviation Minimum 5% Median 95% Maximum
Levels variables
Audit fees – 2003 72,913 234,041 6,700 17,400 45,000 133,350 4,000,000
Audit fees – 2002 68,314 232,911 6,700 16,000 41,699 125,000 4,000,000
Audit fees – 2001 65,390 233,082 6,700 15,700 39,678 117,000 4,000,000
Population – 2003 100,332 466,150 20,039 21,662 45,861 227,920 8,008,278
Complexity 12.161 23.780 0 0 4 49 184
Big 4 auditor – 2003 11.18% 31.16% 0 0 0 1 1
Big 4 auditor – 2002 12.50% 33.13% 0 0 0 1 1
CAFR 90.79% 28.94% 0 0 1 1 1
GASB 34 by 2002 32.57% 46.90% 0 0 0 1 1
GASB 34 by 2003 91.78% 27.50% 0 0 1 1 1
Change variables
FeeChg03 1.116 0.213 0.632 0.893 1.049 1.462 2.750
FeeChg02 1.062 0.117 0.687 0.894 1.038 1.300 1.455
GASB 34 in 2003 59.21% 49.22% 0 0 1 1 1
GASB 34 in 2002 26.97% 44.45% 0 0 0 1 1
Population change – 2003 1.007 0.017 0.969 0.990 1.003 1.036 1.132
Auditor change – 2003 8.89% 28.49% 0 0 0 1 1
Auditor change – 2002 10.20% 30.31% 0 0 0 1 1
Change from Big 4 – 2003 1.64% 12.74% 0 0 0 0 1
Change from Big 4 – 2002 2.30% 15.02% 0 0 0 0 1
Notes: All data were collected from a survey of cities with populations in excess of 20,000 citizens. Audit fees for each year exclude non-audit
fees and one-time fees such as those associated with GASB 34 adoption. Population is from the 2003 Bureau of Census estimates. Complexity
is measured as the number of adjusting journal entries required by the auditor. CAFR is coded 1 if the city issues a comprehensive annual
financial report in accordance with GASB requirements. GASB 34 by 2002 is coded 1 if the city adopted GASB 34 by the 2002 fiscal year.
GASB 34 by 2003 is coded 1 if the city adopted GASB 34 by the 2003 fiscal year. GASB 34 in 2002 is coded 1 if the city adopted GASB 34 in
the 2002 fiscal year. GASB 34 in 2003 is coded 1 if the city adopted GASB 34 in the 2003 fiscal year. Population change is the ratio of the 2003
population divided by the 2002 population. Auditor change is coded 1 if the auditor is new in 2003. Change from Big 4 is coded 1 if the new
auditor in 2003 was not Big 4 and the previous auditor was Big 4.
ARTHUR
ALLEN
AND
GEORGE
SANDERS
226
adjusting journal entries required by the auditor. Mean (median) complexityis 12.161 (4) with 29% of the cities reporting no required journal entries.More than 91% of our sample prepared a CAFR in 2003. By the year 2002(2003), 32.57% (91.78%) of the sample had adopted GASB 34.
Because we measure changes over a single year, the change in populationand auditors were modest. For brevity, Table 3 omits population in 2001 and2002 as well as the change in population for 2002. The mean (median)increase in population was 0.7% (0.3%) in 2003. In 2003 (2002), 8.89%(10.20%) of the sample cities changed auditors. In 2001, 45 of the 304 samplecities employed a Big 4 auditor (14.8%). In 2002, seven cities (2.3%) switchedaway from a Big 4 auditor, but no city switched to a Big 4, leaving 38 cities(12.5%) with a Big 4. In 2003, one city switched to a Big 4 auditor, and fivecities (1.64%) switched away from a Big 4, leaving 34 cities (11.18%) with aBig 4 auditor. Because so few cities switched to a Big 4 auditor, we includevariables only for cities that switched away from a Big 4 auditor.
Table 4 reports three audit fee models, with a separate model for 2001,2002, and 2003 audit fees. In each case, log of audit fees is the dependentvariable. The independent variables are client size (population), Big 4auditor, CAFR, Complexity, and a 0:1 variable indicating whether GASB34 has been adopted by that year. There are also indicator variables for eachstate. The adjusted R2 in each model is at least 64.7% which is comparableto prior municipal audit fee models. An examination of model assumptions(e.g., normal error terms) revealed no violations of the assumptions.
The GASB by year variables measure whether GASB 34 was adoptedduring the year examined. The GASB 34 variable is statistically significantonly in the year 2001. In other words, cities which had adopted GASB 34 by2001 paid more audit fees than other cities after controlling for client size,complexity, auditor, and disclosure levels. The GASB 34 variable coefficientsfor 2002 and 2003 are .065 and .072, respectively, Although economicallymeaningful (about a 7% increase in fees), these coefficients are notstatistically significant. The results from the levels’ models regressionsprovide marginal evidence consistent with the assertion that GASB 34increases audit fees. A more direct test of this assertion is to examine year-to-year audit fee changes at the time of adoption.
Table 5 reports models of the change in audit fees. The dependent variablein the first model is the ratio of each city’s 2002 audit fees divided by its 2001fees. The dependent variable in the second model is the ratio of each city’s2003 audit fees divided by its 2002 fees. Because GASB 34 is adopted in asingle year, each model examines only a single year’s change in fees. Theindependent variables are change in population, Big 4 auditor, auditor
The Effect of Governmental Accounting Standards Board Statement 34 227
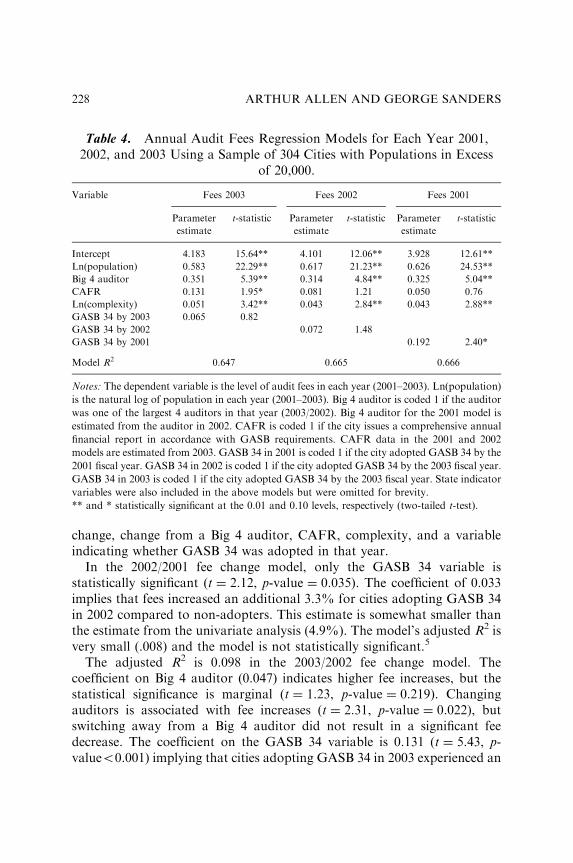
change, change from a Big 4 auditor, CAFR, complexity, and a variableindicating whether GASB 34 was adopted in that year.
In the 2002/2001 fee change model, only the GASB 34 variable isstatistically significant (t ¼ 2.12, p-value ¼ 0.035). The coefficient of 0.033implies that fees increased an additional 3.3% for cities adopting GASB 34in 2002 compared to non-adopters. This estimate is somewhat smaller thanthe estimate from the univariate analysis (4.9%). The model’s adjusted R2 isvery small (.008) and the model is not statistically significant.5
The adjusted R2 is 0.098 in the 2003/2002 fee change model. Thecoefficient on Big 4 auditor (0.047) indicates higher fee increases, but thestatistical significance is marginal (t ¼ 1.23, p-value ¼ 0.219). Changingauditors is associated with fee increases (t ¼ 2.31, p-value ¼ 0.022), butswitching away from a Big 4 auditor did not result in a significant feedecrease. The coefficient on the GASB 34 variable is 0.131 (t ¼ 5.43, p-valueo0.001) implying that cities adopting GASB 34 in 2003 experienced an
Table 4. Annual Audit Fees Regression Models for Each Year 2001,2002, and 2003 Using a Sample of 304 Cities with Populations in Excess
of 20,000.
Variable Fees 2003 Fees 2002 Fees 2001
Parameter
estimate
t-statistic Parameter
estimate
t-statistic Parameter
estimate
t-statistic
Intercept 4.183 15.64** 4.101 12.06** 3.928 12.61**
Ln(population) 0.583 22.29** 0.617 21.23** 0.626 24.53**
Big 4 auditor 0.351 5.39** 0.314 4.84** 0.325 5.04**
CAFR 0.131 1.95* 0.081 1.21 0.050 0.76
Ln(complexity) 0.051 3.42** 0.043 2.84** 0.043 2.88**
GASB 34 by 2003 0.065 0.82
GASB 34 by 2002 0.072 1.48
GASB 34 by 2001 0.192 2.40*
Model R2 0.647 0.665 0.666
Notes: The dependent variable is the level of audit fees in each year (2001–2003). Ln(population)
is the natural log of population in each year (2001–2003). Big 4 auditor is coded 1 if the auditor
was one of the largest 4 auditors in that year (2003/2002). Big 4 auditor for the 2001 model is
estimated from the auditor in 2002. CAFR is coded 1 if the city issues a comprehensive annual
financial report in accordance with GASB requirements. CAFR data in the 2001 and 2002
models are estimated from 2003. GASB 34 in 2001 is coded 1 if the city adopted GASB 34 by the
2001 fiscal year. GASB 34 in 2002 is coded 1 if the city adopted GASB 34 by the 2003 fiscal year.
GASB 34 in 2003 is coded 1 if the city adopted GASB 34 by the 2003 fiscal year. State indicator
variables were also included in the above models but were omitted for brevity.
** and * statistically significant at the 0.01 and 0.10 levels, respectively (two-tailed t-test).
ARTHUR ALLEN AND GEORGE SANDERS228
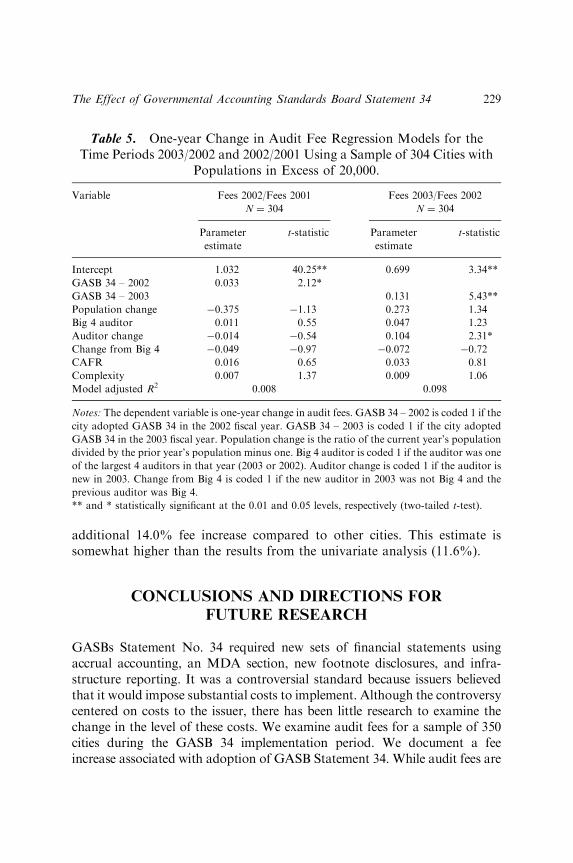
additional 14.0% fee increase compared to other cities. This estimate issomewhat higher than the results from the univariate analysis (11.6%).
CONCLUSIONS AND DIRECTIONS FOR
FUTURE RESEARCH
GASBs Statement No. 34 required new sets of financial statements usingaccrual accounting, an MDA section, new footnote disclosures, and infra-structure reporting. It was a controversial standard because issuers believedthat it would impose substantial costs to implement. Although the controversycentered on costs to the issuer, there has been little research to examine thechange in the level of these costs. We examine audit fees for a sample of 350cities during the GASB 34 implementation period. We document a feeincrease associated with adoption of GASB Statement 34. While audit fees are
Table 5. One-year Change in Audit Fee Regression Models for theTime Periods 2003/2002 and 2002/2001 Using a Sample of 304 Cities with
Populations in Excess of 20,000.
Variable Fees 2002/Fees 2001 Fees 2003/Fees 2002
N ¼ 304 N ¼ 304
Parameter
estimate
t-statistic Parameter
estimate
t-statistic
Intercept 1.032 40.25** 0.699 3.34**
GASB 34 – 2002 0.033 2.12*
GASB 34 – 2003 0.131 5.43**
Population change �0.375 �1.13 0.273 1.34
Big 4 auditor 0.011 0.55 0.047 1.23
Auditor change �0.014 �0.54 0.104 2.31*
Change from Big 4 �0.049 �0.97 �0.072 �0.72
CAFR 0.016 0.65 0.033 0.81
Complexity 0.007 1.37 0.009 1.06
Model adjusted R2 0.008 0.098
Notes: The dependent variable is one-year change in audit fees. GASB 34 – 2002 is coded 1 if the
city adopted GASB 34 in the 2002 fiscal year. GASB 34 – 2003 is coded 1 if the city adopted
GASB 34 in the 2003 fiscal year. Population change is the ratio of the current year’s population
divided by the prior year’s population minus one. Big 4 auditor is coded 1 if the auditor was one
of the largest 4 auditors in that year (2003 or 2002). Auditor change is coded 1 if the auditor is
new in 2003. Change from Big 4 is coded 1 if the new auditor in 2003 was not Big 4 and the
previous auditor was Big 4.
** and * statistically significant at the 0.01 and 0.05 levels, respectively (two-tailed t-test).
The Effect of Governmental Accounting Standards Board Statement 34 229
likely a small proportion of total financial reporting costs, the size of the auditfee changes suggests significant changes in overall reporting costs.
We find that the adoption of Statement 34 increased mean (median) feesapproximately 9% (5%) for all cities, but that the effect was much larger forcities adopting in 2003. The mean (median) fee change for 2002 adopterswas 4.9 (2.9%) percentage points higher than for non-adopters. The mean(median) fee increase for 2003 adopters, smaller cities, was 11.6 (8.6)percentage points over the non-adoption year fee increase. It appears thatsmaller governments were affected disproportionately. One possibleexplanation for this is that smaller governments are more reliant on theirexternal auditors for compliance and for developing the needed information.
The GASB provided two provisions to reduce the cost of GASB 34 onsmaller governments: smaller governments were given more time toimplement, and the smallest group of governments (revenues less than $10million) were not required to retroactively report infrastructure assets.Despite these provisions, our results suggest that smaller governments mayhave been disproportionately affected.
To separate the one-time costs from ongoing increases in audit fees, weasked respondents to exclude one-time implementation costs from otheraudit fees. However, we examine fees for only a few years surroundingimplementation of GASB 34, and therefore, we are unable to rule out thepossibility that the incremental costs of GASB 34 that we document aretemporary. An interesting direction for future research is to examine auditfees over a longer time period to determine to what extent the incrementalcosts of GASB 34 are permanent.
NOTES
1. The Financial Accounting Foundation, at a meeting on May 22, 2007,unanimously reaffirmed the GASB as the financial accounting standard setting bodyfor state and local governments (Financial Accounting Foundation, 2007).2. The audit scope does not always include the RSI. Even if the engagement is to
opine on the financial statements alone, the auditor is required to perform limitedprocedures according to AU Section 558.07.3. A modified approach that, as an alternative to depreciation, may be used for
infrastructure. This approach requires considerable additional information includinga complete inventory of infrastructure, setting required condition levels, and regularmeasurement of these condition levels.4. Results are similar if audit fees are deflated by population before computing the
percentage change in fees.
ARTHUR ALLEN AND GEORGE SANDERS230
5. Because client size has been a consistently strong predictor of audit fees in priorresearch, it is somewhat surprising that the change in client size variable isinsignificantly related to change in fees. We believe the explanation is that ouranalysis examines fee changes over a single year while prior municipal audit feechange studies use longer time periods. Jensen and Payne (2005) compare audit feesacross a 6-year period: 1992 and 1998. Sanders, Allen, and Korte (1995) compareaudit fees across a 4-year period: 1989–1985. Longer time periods have the advantageof allowing greater variation in the independent variables.
REFERENCES
American Institute of Certified Public Accountants. (2007). AICPA audit and accounting guide:
State and local governments. Available at https://www.cpa2biz.com
Anthony, R. N., & Newberry, S. M. (2000). GASB 34 should be revised. Government
Accountant’s Journal, 49(1), 36–38.
Barkin, R. (2007). The buck stopped here. American City and County, 122(10), 36–41.
Bureau of the Census. (2002). Census 2000 Summary File 3. U.S. Census Bureau. Available at
http://www2.census.gov/census_2000/datasets/Summary_File_3/. Accessed September 4,
2006.
Copley, P. A., Cheng, R. A., Harris, J. E., Icerman, R. C., Johnson, W. L., Smith, G. R., Smith,
K. A., Wrege, W. T., & Yahr, R. (1997). The new governmental reporting model: Is it a
‘‘field of dreams’’? Accounting Horizons, 11(3), 91–101.
Del Vecchio, S. D., Johnson, G. G., & Magner, N. R. (2007). GASB 34 and its implementation:
Perspectives of government accounting and finance officials. Academy of Accounting and
Financial Studies Journal, 11, 1–11.
Engstrom, J. H., & Tidrick, D. E. (2001). Audit issues related to GASB statement no. 34. Public
Budgeting and Finance, 21(3), 63–78.
Financial Accounting Foundation. (2007). Letter from Robert E. Denham, Chairman and
President, Financial Accounting Foundation to Jeffrey Esser, Executive Director and
chief Executive Officer, Government Finance Officers Association. FAF. Available at
http://www.fasb.org/faf/FAF_GFOA.pdf. Accessed July 9, 2008.
Governmental Accounting Standards Board (GASB). (1999). Basic financial statements � and
management’s discussion and analysis for statement and local governments no. 34.
Available in GARS (Governmental Accounting Research System), original pronounce-
ments (December 31, 2007).
Governmental Accounting Standards Board (GASB). (2000). Guide to implementation of GASB
statement 34 on basic financial statements � and management’s discussion and analysis �
for state and local governments- questions and answers. Available in GARS (Govern-
mental Accounting Research System), original pronouncements (December 31, 2007).
Governmental Accounting Standards Board (GASB). (2006). GASB White paper: Why
governmental accounting is – and should be – different. Available at http://www.gasb.org/
white_paper_mar_2006.html
Hume, L. (1999). GFOA board adopts resolution on GASB infrastructure proposal. Bond
Buyer, 328(30648), 32.
Hume, L. (2000). In S&P survey, governments project the costs of GASB 34. Bond Buyer,
334(31015), 1–2.
The Effect of Governmental Accounting Standards Board Statement 34 231

Jensen, K. L., & Payne, J. L. (2005). The introduction of price competition in a municipal audit
market. Auditing: A Journal of Practice & Theory, 24(2), 137–152.
Plummer, E., Hutchinson, P. D., & Patton, T. K. (2007). GASB no. 34’s governmental financial
reporting model: Evidence on its information relevance. The Accounting Review, 82(1),
205–240.
Saaco, J. (2000). GASB statement 34: Part of changing political and global market pressures.
Government Accountant’s Journal, 49(1), 20–21.
Sanders, G., Allen, A., & Korte, L. (1995). Municipal audit fees: Has increased competition
made a difference? Auditing: A Journal of Practice & Theory, 14(1), 105–114.
ARTHUR ALLEN AND GEORGE SANDERS232
PUBLICATION RATES OF
GOVERNMENTAL AND
NONPROFIT MANUSCRIPTS
AMONG TWENTY-FIVE LEADING
ACADEMIC ACCOUNTING
JOURNALS
Paul A. Copley, Bradley M. Roof and
Eileen M. Shifflett
ABSTRACT
We examined publication rates of governmental and nonprofit accountingand reporting manuscripts among 25 leading academic accountingjournals for the 10-year period ending in 2005. Overall, we found thatgovernmental and nonprofit manuscripts constitute approximately 3% ofthe publications appearing in the leading journals. However, the frequencyof publication varies considerably among these journals.
We also examined the distribution of governmental and nonprofitpublications across subject matter. Our analysis confirms that financialaccounting topics are the dominant subject matter in academic journals
Research in Governmental and Nonprofit Accounting, Volume 12, 233–246
Copyright r 2009 by Emerald Group Publishing Limited
All rights of reproduction in any form reserved
ISSN: 0884-0741/doi:10.1108/S0884-0741(2009)0000012012
233
(both overall and among governmental and nonprofit manuscripts) butthat nonprofit taxation and governmental and nonprofit auditing andmanagerial manuscripts are published. We found no publications ofaccounting education articles specific to the teaching of governmental ornonprofit accounting or reporting.
We examined the frequency of publication of manuscripts dealing withgovernmental and nonprofit topics among 25 leading accounting journals.Our purpose is threefold:
1. identify journals most likely to publish in these areas,2. examine the frequency of publication by topic area among published
governmental and nonprofit manuscripts, and3. identify opportunities and trends within the publication of governmental
and nonprofit topics.
Our descriptive analysis has the potential to be useful to a variety ofstakeholders. Scholars currently conducting research in this area mayreadily identify those journals most likely to publish governmental ornonprofit manuscripts. Faculty seeking promotion can compare publicationrates with their institution’s journal expectations and decide whether topursue research in governmental or nonprofit topics. Tenure reviewcommittees may use the analysis to identify ‘‘best in area’’ publicationoutlets. Finally, researchers may use our analysis of governmental andnonprofit subject matter to identify research opportunities in undevelopedareas.
We believe our analysis, which examines actual publication rates,complements an earlier study examining perceived publication rates amonggovernmental and nonprofit researchers. Lowensohn and Samelson (2006)surveyed members of specialized interest sections of the AmericanAccounting Association for the purpose of identifying journals perceivedby section members to be consistent publishers of high quality research intheir area. Among these were members of the Government and Nonprofit(GNP) section. Lowensohn and Samelson reported that members of theGNP section are notably different than most other sections in that fewerthan 9% perceived any of the accounting discipline’s top tier journals asconsistent publishers of their manuscripts. Our analysis provides a means toevaluate the accuracy of these perceptions.
PAUL A. COPLEY ET AL.234
1. METHODOLOGY
1.1. Journal Selection
We use the journal list provided by Glover, Prawitt, and Wood (2006) becauseit is the most recently published ranking and because the authors found theirlist to be consistent with four earlier studies of rankings of accounting journals.Glover, Prawitt, and Wood ranked journals based on a survey of AmericanAccounting Association members and rankings used by the Financial Timesto rate business schools. The journals are presented in four categories: top 3,top 6 (4 through 6), top 15 (7 through 15), and top 25 (16 through 25). Journalsare presented in alphabetical order within each of the four categories.1
All of the journals appearing in the Glover, Prawitt, and Wood study areintended primarily for academic audiences. Therefore our findings shouldnot be interpreted as representative of journals in general, especially thosedirected to practitioners. Nine of the journals specialize in a single subjectmatter, including two that specialize in issues related to accountingeducation. Three of the journals are mixed discipline: Journal of BusinessFinance and Accounting and Review of Quantitative Finance and Accountingpublish the majority of manuscripts in the area of finance, while NationalTax Journal is commonly listed among the leading economics journals.
Two of the journals listed by Glover, Prawitt, and Wood are also identifiedin the Lowensohn and Samelson (2006) survey of members of the AmericanAccounting Association’s GNP section as consistent outlets for governmentaland nonprofit manuscripts. Journal of Accounting and Public Policy andResearch in Governmental and Nonprofit Accounting received the highestratings among members of the GNP section. Lowensohn and Samelsonreported that two other journals were cited by ten or more GNP sectionrespondents: Journal of Government Financial Management and Journal ofPublic Budgeting, Accounting and Financial Management. We elected not toinclude these in our analysis because neither journal appears among publishedrankings of the top 50 journals. In the case of Journal of Government FinancialManagement, the journal is published by the Association of GovernmentAccountants and is intended primarily for a practitioner audience.
1.2. Manuscript Classification
We examined every volume of the 25 journals published in calendar years1996–2005 and classified each manuscript. Editors’ comments, discussants’
Publication Rates of Governmental and Nonprofit Manuscripts 235
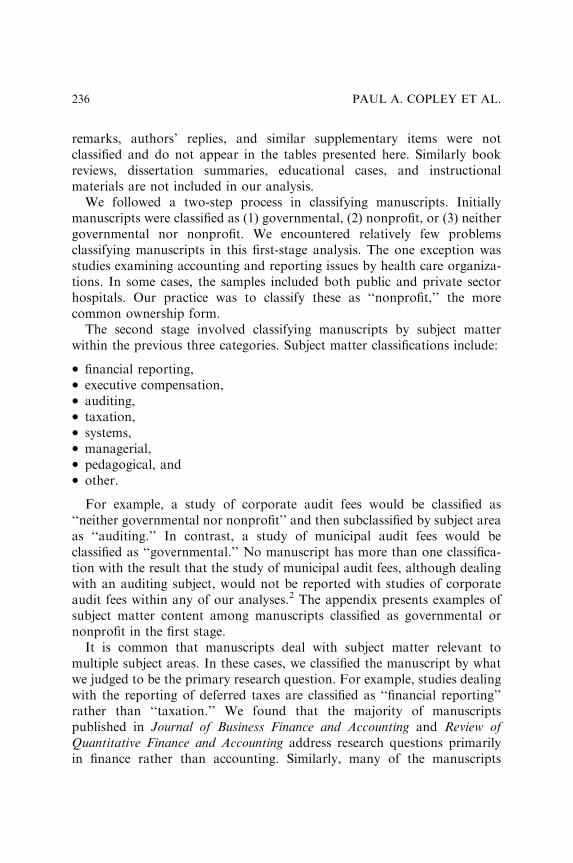
remarks, authors’ replies, and similar supplementary items were notclassified and do not appear in the tables presented here. Similarly bookreviews, dissertation summaries, educational cases, and instructionalmaterials are not included in our analysis.
We followed a two-step process in classifying manuscripts. Initiallymanuscripts were classified as (1) governmental, (2) nonprofit, or (3) neithergovernmental nor nonprofit. We encountered relatively few problemsclassifying manuscripts in this first-stage analysis. The one exception wasstudies examining accounting and reporting issues by health care organiza-tions. In some cases, the samples included both public and private sectorhospitals. Our practice was to classify these as ‘‘nonprofit,’’ the morecommon ownership form.
The second stage involved classifying manuscripts by subject matterwithin the previous three categories. Subject matter classifications include:
� financial reporting,� executive compensation,� auditing,� taxation,� systems,� managerial,� pedagogical, and� other.
For example, a study of corporate audit fees would be classified as‘‘neither governmental nor nonprofit’’ and then subclassified by subject areaas ‘‘auditing.’’ In contrast, a study of municipal audit fees would beclassified as ‘‘governmental.’’ No manuscript has more than one classifica-tion with the result that the study of municipal audit fees, although dealingwith an auditing subject, would not be reported with studies of corporateaudit fees within any of our analyses.2 The appendix presents examples ofsubject matter content among manuscripts classified as governmental ornonprofit in the first stage.
It is common that manuscripts deal with subject matter relevant tomultiple subject areas. In these cases, we classified the manuscript by whatwe judged to be the primary research question. For example, studies dealingwith the reporting of deferred taxes are classified as ‘‘financial reporting’’rather than ‘‘taxation.’’ We found that the majority of manuscriptspublished in Journal of Business Finance and Accounting and Review ofQuantitative Finance and Accounting address research questions primarilyin finance rather than accounting. Similarly, many of the manuscripts
PAUL A. COPLEY ET AL.236
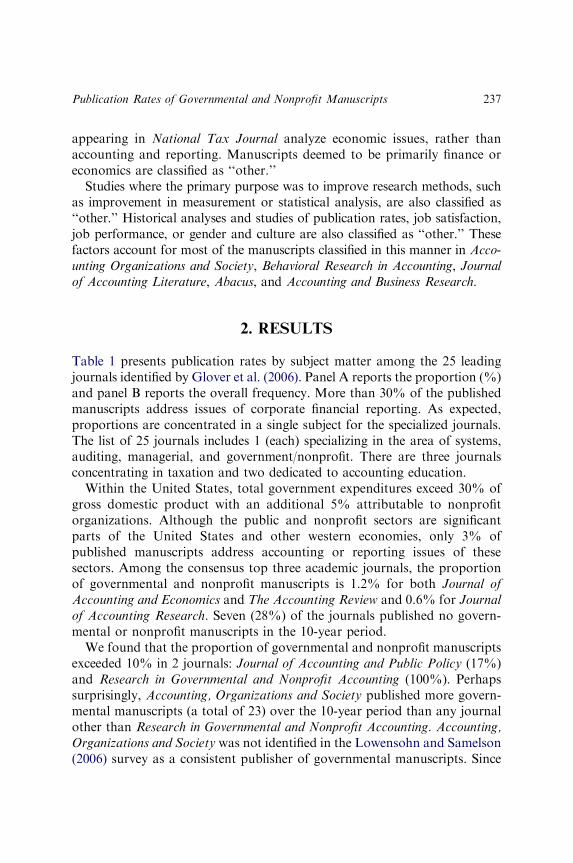
appearing in National Tax Journal analyze economic issues, rather thanaccounting and reporting. Manuscripts deemed to be primarily finance oreconomics are classified as ‘‘other.’’
Studies where the primary purpose was to improve research methods, suchas improvement in measurement or statistical analysis, are also classified as‘‘other.’’ Historical analyses and studies of publication rates, job satisfaction,job performance, or gender and culture are also classified as ‘‘other.’’ Thesefactors account for most of the manuscripts classified in this manner in Acco-unting Organizations and Society, Behavioral Research in Accounting, Journalof Accounting Literature, Abacus, and Accounting and Business Research.
2. RESULTS
Table 1 presents publication rates by subject matter among the 25 leadingjournals identified by Glover et al. (2006). Panel A reports the proportion (%)and panel B reports the overall frequency. More than 30% of the publishedmanuscripts address issues of corporate financial reporting. As expected,proportions are concentrated in a single subject for the specialized journals.The list of 25 journals includes 1 (each) specializing in the area of systems,auditing, managerial, and government/nonprofit. There are three journalsconcentrating in taxation and two dedicated to accounting education.
Within the United States, total government expenditures exceed 30% ofgross domestic product with an additional 5% attributable to nonprofitorganizations. Although the public and nonprofit sectors are significantparts of the United States and other western economies, only 3% ofpublished manuscripts address accounting or reporting issues of thesesectors. Among the consensus top three academic journals, the proportionof governmental and nonprofit manuscripts is 1.2% for both Journal ofAccounting and Economics and The Accounting Review and 0.6% for Journalof Accounting Research. Seven (28%) of the journals published no govern-mental or nonprofit manuscripts in the 10-year period.
We found that the proportion of governmental and nonprofit manuscriptsexceeded 10% in 2 journals: Journal of Accounting and Public Policy (17%)and Research in Governmental and Nonprofit Accounting (100%). Perhapssurprisingly, Accounting, Organizations and Society published more govern-mental manuscripts (a total of 23) over the 10-year period than any journalother than Research in Governmental and Nonprofit Accounting. Accounting,Organizations and Society was not identified in the Lowensohn and Samelson(2006) survey as a consistent publisher of governmental manuscripts. Since
Publication Rates of Governmental and Nonprofit Manuscripts 237
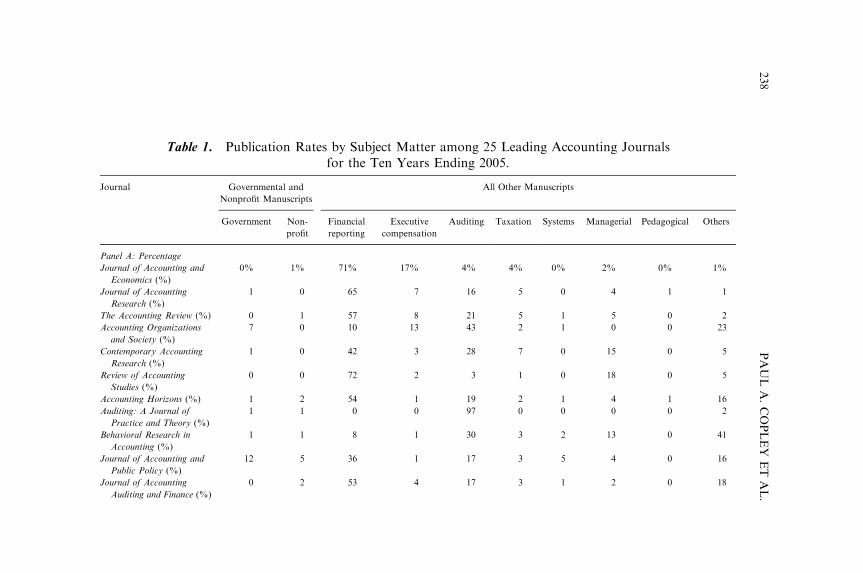
Table 1. Publication Rates by Subject Matter among 25 Leading Accounting Journalsfor the Ten Years Ending 2005.
Journal Governmental and
Nonprofit Manuscripts
All Other Manuscripts
Government Non-
profit
Financial
reporting
Executive
compensation
Auditing Taxation Systems Managerial Pedagogical Others
Panel A: Percentage
Journal of Accounting and
Economics (%)
0% 1% 71% 17% 4% 4% 0% 2% 0% 1%
Journal of Accounting
Research (%)
1 0 65 7 16 5 0 4 1 1
The Accounting Review (%) 0 1 57 8 21 5 1 5 0 2
Accounting Organizations
and Society (%)
7 0 10 13 43 2 1 0 0 23
Contemporary Accounting
Research (%)
1 0 42 3 28 7 0 15 0 5
Review of Accounting
Studies (%)
0 0 72 2 3 1 0 18 0 5
Accounting Horizons (%) 1 2 54 1 19 2 1 4 1 16
Auditing: A Journal of
Practice and Theory (%)
1 1 0 0 97 0 0 0 0 2
Behavioral Research in
Accounting (%)
1 1 8 1 30 3 2 13 0 41
Journal of Accounting and
Public Policy (%)
12 5 36 1 17 3 5 4 0 16
Journal of Accounting
Auditing and Finance (%)
0 2 53 4 17 3 1 2 0 18
PAULA.COPLEY
ET
AL.
238
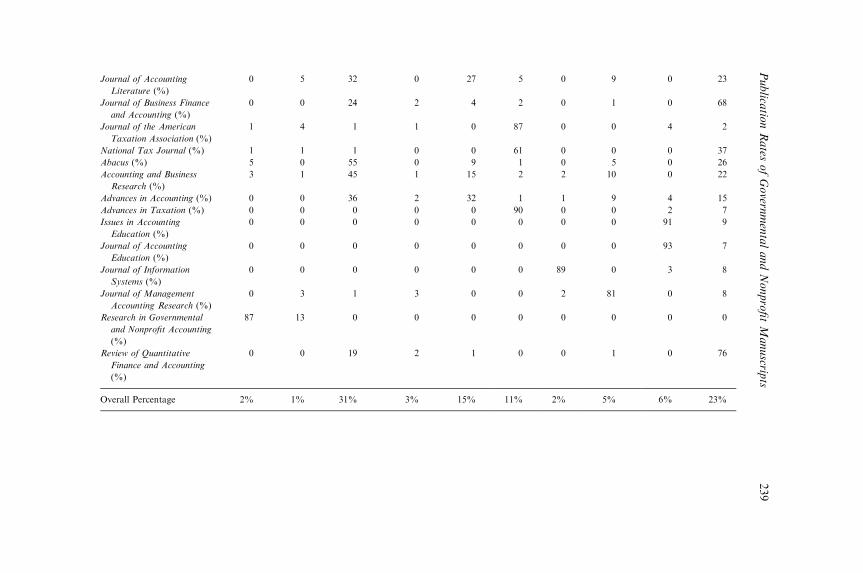
Journal of Accounting
Literature (%)
0 5 32 0 27 5 0 9 0 23
Journal of Business Finance
and Accounting (%)
0 0 24 2 4 2 0 1 0 68
Journal of the American
Taxation Association (%)
1 4 1 1 0 87 0 0 4 2
National Tax Journal (%) 1 1 1 0 0 61 0 0 0 37
Abacus (%) 5 0 55 0 9 1 0 5 0 26
Accounting and Business
Research (%)
3 1 45 1 15 2 2 10 0 22
Advances in Accounting (%) 0 0 36 2 32 1 1 9 4 15
Advances in Taxation (%) 0 0 0 0 0 90 0 0 2 7
Issues in Accounting
Education (%)
0 0 0 0 0 0 0 0 91 9
Journal of Accounting
Education (%)
0 0 0 0 0 0 0 0 93 7
Journal of Information
Systems (%)
0 0 0 0 0 0 89 0 3 8
Journal of Management
Accounting Research (%)
0 3 1 3 0 0 2 81 0 8
Research in Governmental
and Nonprofit Accounting
(%)
87 13 0 0 0 0 0 0 0 0
Review of Quantitative
Finance and Accounting
(%)
0 0 19 2 1 0 0 1 0 76
Overall Percentage 2% 1% 31% 3% 15% 11% 2% 5% 6% 23%
Publica
tionRates
ofGovern
mentalandNonprofitManuscrip
ts239
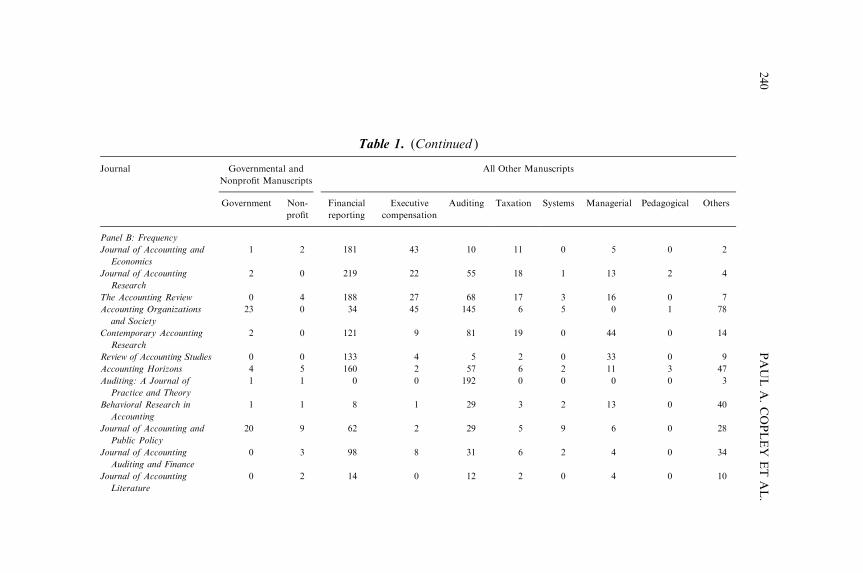
Table 1. (Continued )
Journal Governmental and
Nonprofit Manuscripts
All Other Manuscripts
Government Non-
profit
Financial
reporting
Executive
compensation
Auditing Taxation Systems Managerial Pedagogical Others
Panel B: Frequency
Journal of Accounting and
Economics
1 2 181 43 10 11 0 5 0 2
Journal of Accounting
Research
2 0 219 22 55 18 1 13 2 4
The Accounting Review 0 4 188 27 68 17 3 16 0 7
Accounting Organizations
and Society
23 0 34 45 145 6 5 0 1 78
Contemporary Accounting
Research
2 0 121 9 81 19 0 44 0 14
Review of Accounting Studies 0 0 133 4 5 2 0 33 0 9
Accounting Horizons 4 5 160 2 57 6 2 11 3 47
Auditing: A Journal of
Practice and Theory
1 1 0 0 192 0 0 0 0 3
Behavioral Research in
Accounting
1 1 8 1 29 3 2 13 0 40
Journal of Accounting and
Public Policy
20 9 62 2 29 5 9 6 0 28
Journal of Accounting
Auditing and Finance
0 3 98 8 31 6 2 4 0 34
Journal of Accounting
Literature
0 2 14 0 12 2 0 4 0 10
PAULA.COPLEY
ET
AL.
240
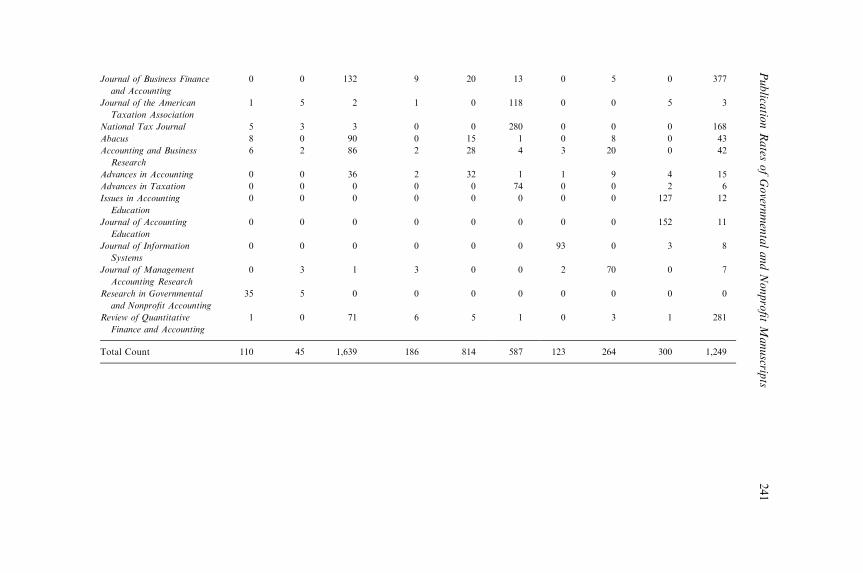
Journal of Business Finance
and Accounting
0 0 132 9 20 13 0 5 0 377
Journal of the American
Taxation Association
1 5 2 1 0 118 0 0 5 3
National Tax Journal 5 3 3 0 0 280 0 0 0 168
Abacus 8 0 90 0 15 1 0 8 0 43
Accounting and Business
Research
6 2 86 2 28 4 3 20 0 42
Advances in Accounting 0 0 36 2 32 1 1 9 4 15
Advances in Taxation 0 0 0 0 0 74 0 0 2 6
Issues in Accounting
Education
0 0 0 0 0 0 0 0 127 12
Journal of Accounting
Education
0 0 0 0 0 0 0 0 152 11
Journal of Information
Systems
0 0 0 0 0 0 93 0 3 8
Journal of Management
Accounting Research
0 3 1 3 0 0 2 70 0 7
Research in Governmental
and Nonprofit Accounting
35 5 0 0 0 0 0 0 0 0
Review of Quantitative
Finance and Accounting
1 0 71 6 5 1 0 3 1 281
Total Count 110 45 1,639 186 814 587 123 264 300 1,249
Publica
tionRates
ofGovern
mentalandNonprofitManuscrip
ts241
Accounting, Organizations and Society is consistently ranked among the topsix accounting journals, our findings suggest the perception that top journalsare not open to governmental manuscripts is not wholly accurate.
Table 2 presents the frequency of governmental and nonprofit manu-scripts published in 25 leading journals by subject matter. Manuscriptsaddressing financial reporting issues constitute the largest proportion(43%), followed by managerial (22%) and auditing (17%). Notable is theabsence of any published manuscripts examining educational issues ingovernmental and nonprofit accounting.3
This analysis is also useful in identifying the contribution of Accounting,Organizations and Society in publishing governmental manuscripts. Most ofthe governmental manuscripts published by the journal are classified asmanagerial (65%). Although it is difficult to characterize these, mostcommonly the manuscripts deal with measuring the cost of public services,the effect of privatizing public services, and budgeting.
Our final analysis is presented in Table 3. This table provides separatepanels for governmental and nonprofit manuscripts. It also facilitates acomparison of the five-year periods ending in 2000 and 2005. Panel A presentsan analysis of governmental manuscripts by subject matter. To be expected,there are no manuscripts in the area of taxation. In most areas, there is littlechange between the two time periods. The higher number of financial repor-ting manuscripts in the 1996–2000 period is attributable to a special issue ofResearch in Governmental and Nonprofit Accounting (Vol. 9, 1996) thatpublished 12 manuscripts classified as ‘‘financial.’’ These manuscripts provideddescriptive analyses of governmental accounting practices in varying countries.
Panel B provides a similar analysis of nonprofit manuscripts. Comparisonbetween the two time periods reveals an increase in the frequency ofnonprofit manuscripts being published. This increase is largely attributableto the increase in the number of manuscripts examining the taxation andtax-reporting requirements of nonprofit entities. The 1996 Taxpayer Bill ofRights Act and 1999 IRS rules interpreting the Act’s reporting requirementshave almost certainly contributed to this increase by providing greateraccess to Form 990 data.
3. DISCUSSION
There is a common perception among accounting academics of a biasamong leading academic journals against governmental and nonprofitmanuscripts. This perception is documented in survey results of AmericanAccounting Association members collected by Lowensohn and Samelson
PAUL A. COPLEY ET AL.242
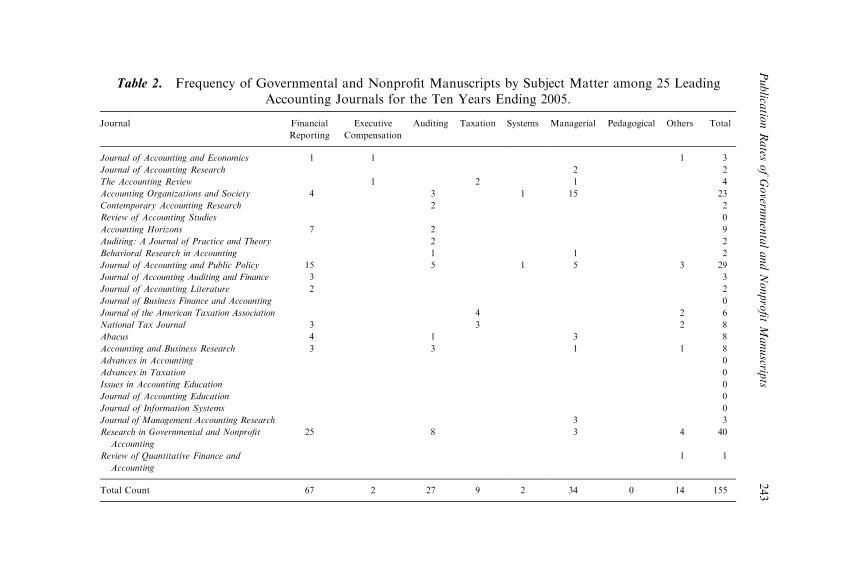
Table 2. Frequency of Governmental and Nonprofit Manuscripts by Subject Matter among 25 LeadingAccounting Journals for the Ten Years Ending 2005.
Journal Financial
Reporting
Executive
Compensation
Auditing Taxation Systems Managerial Pedagogical Others Total
Journal of Accounting and Economics 1 1 1 3
Journal of Accounting Research 2 2
The Accounting Review 1 2 1 4
Accounting Organizations and Society 4 3 1 15 23
Contemporary Accounting Research 2 2
Review of Accounting Studies 0
Accounting Horizons 7 2 9
Auditing: A Journal of Practice and Theory 2 2
Behavioral Research in Accounting 1 1 2
Journal of Accounting and Public Policy 15 5 1 5 3 29
Journal of Accounting Auditing and Finance 3 3
Journal of Accounting Literature 2 2
Journal of Business Finance and Accounting 0
Journal of the American Taxation Association 4 2 6
National Tax Journal 3 3 2 8
Abacus 4 1 3 8
Accounting and Business Research 3 3 1 1 8
Advances in Accounting 0
Advances in Taxation 0
Issues in Accounting Education 0
Journal of Accounting Education 0
Journal of Information Systems 0
Journal of Management Accounting Research 3 3
Research in Governmental and Nonprofit
Accounting
25 8 3 4 40
Review of Quantitative Finance and
Accounting
1 1
Total Count 67 2 27 9 2 34 0 14 155
Publica
tionRates
ofGovern
mentalandNonprofitManuscrip
ts243
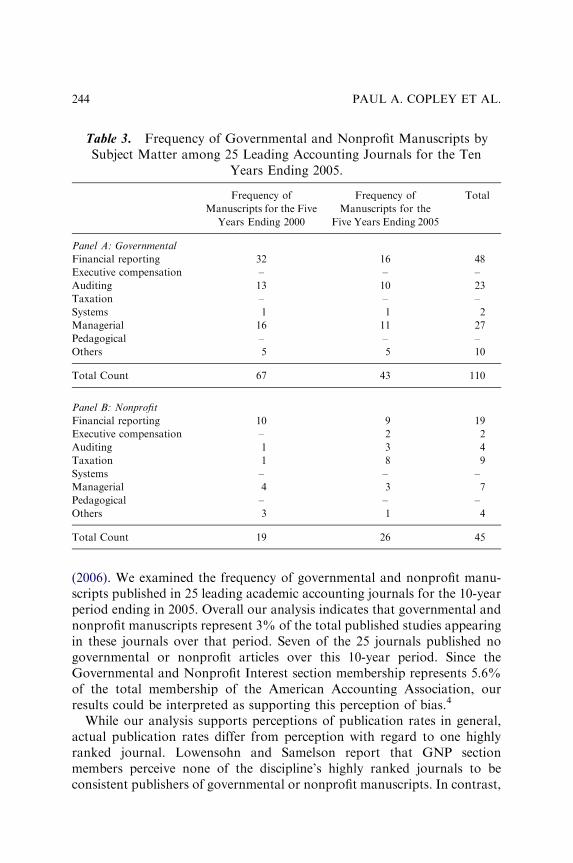
(2006). We examined the frequency of governmental and nonprofit manu-scripts published in 25 leading academic accounting journals for the 10-yearperiod ending in 2005. Overall our analysis indicates that governmental andnonprofit manuscripts represent 3% of the total published studies appearingin these journals over that period. Seven of the 25 journals published nogovernmental or nonprofit articles over this 10-year period. Since theGovernmental and Nonprofit Interest section membership represents 5.6%of the total membership of the American Accounting Association, ourresults could be interpreted as supporting this perception of bias.4
While our analysis supports perceptions of publication rates in general,actual publication rates differ from perception with regard to one highlyranked journal. Lowensohn and Samelson report that GNP sectionmembers perceive none of the discipline’s highly ranked journals to beconsistent publishers of governmental or nonprofit manuscripts. In contrast,
Table 3. Frequency of Governmental and Nonprofit Manuscripts bySubject Matter among 25 Leading Accounting Journals for the Ten
Years Ending 2005.
Frequency of
Manuscripts for the Five
Years Ending 2000
Frequency of
Manuscripts for the
Five Years Ending 2005
Total
Panel A: Governmental
Financial reporting 32 16 48
Executive compensation – – –
Auditing 13 10 23
Taxation – – –
Systems 1 1 2
Managerial 16 11 27
Pedagogical – – –
Others 5 5 10
Total Count 67 43 110
Panel B: Nonprofit
Financial reporting 10 9 19
Executive compensation – 2 2
Auditing 1 3 4
Taxation 1 8 9
Systems – – –
Managerial 4 3 7
Pedagogical – – –
Others 3 1 4
Total Count 19 26 45
PAUL A. COPLEY ET AL.244

our analysis finds that Accounting, Organizations and Society publishedmore governmental manuscripts (a total of 23) over the 10-year period thanany journal other than Research in Governmental and Nonprofit Accounting.
Although the information we compiled is not suitable for multivariate anal-ysis, we hope the descriptive analysis appearing in our tables provides benefit toindividuals performing or evaluating research in the governmental and non-profit areas. Although 18 of the 25 journals examined published some govern-mental and nonprofit manuscripts, only 3 journals published at a rate exceeding1 manuscript per year. Clearly those journals should be the focus of scholarsconducting research in these areas. Untenured faculty at institutions thatreward publications in the top 3 journals (to the exclusion of all others) shouldview governmental and nonprofit research as perilous. Untenured facultyat institutions with a broader definition of scholarship may use our anal-ysis to build a case to have certain journals classified as ‘‘best in area’’ journals.Finally, we hope that our analysis reveals areas of neglect in the governmentaland nonprofit bodies of knowledge that will attract future research.
NOTES
1. The tables presented here display journals in the same order as Glover, Prawitt,and Wood.2. Totals by subject matter may be obtained by summing the subject matter
columns of Table 1 (Panel B) for manuscripts that are neither governmental nornonprofit with the subject matter columns of Table 2 for manuscripts that aregovernmental or nonprofit.3. Recall that cases and instructional resources are not included in our analysis.4. We would like to express our appreciation to Roland LaTulip, AAA Director of
Finance and Administration for providing membership information.
ACKNOWLEDGMENT
We are indebted to Ed Douthett for his comments and to Marilla Showalterwho provided research assistance with this project.
REFERENCES
Glover, S. M., Prawitt, D. F., &Wood, D. A. (2006). Publication records of faculty promoted at the
top 75 accounting research programs. Issues in Accounting Education, 21(August), 195–218.
Lowensohn, S., & Samelson, D. P. (2006). An examination of faculty perceptions of academic
journal quality within five specialized areas of accounting research. Issues in Accounting
Education, 21(August), 219–239.
Publication Rates of Governmental and Nonprofit Manuscripts 245
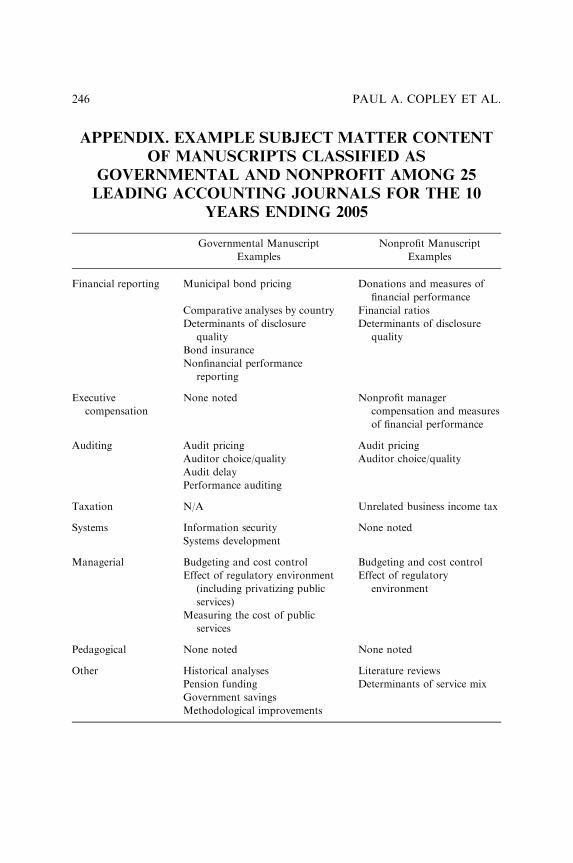
APPENDIX. EXAMPLE SUBJECT MATTER CONTENT
OF MANUSCRIPTS CLASSIFIED AS
GOVERNMENTAL AND NONPROFIT AMONG 25
LEADING ACCOUNTING JOURNALS FOR THE 10
YEARS ENDING 2005
Governmental Manuscript
Examples
Nonprofit Manuscript
Examples
Financial reporting Municipal bond pricing Donations and measures of
financial performance
Comparative analyses by country Financial ratios
Determinants of disclosure
quality
Determinants of disclosure
quality
Bond insurance
Nonfinancial performance
reporting
Executive
compensation
None noted Nonprofit manager
compensation and measures
of financial performance
Auditing Audit pricing Audit pricing
Auditor choice/quality Auditor choice/quality
Audit delay
Performance auditing
Taxation N/A Unrelated business income tax
Systems Information security None noted
Systems development
Managerial Budgeting and cost control Budgeting and cost control
Effect of regulatory environment
(including privatizing public
services)
Effect of regulatory
environment
Measuring the cost of public
services
Pedagogical None noted None noted
Other Historical analyses Literature reviews
Pension funding Determinants of service mix
Government savings
Methodological improvements
PAUL A. COPLEY ET AL.246

SECTION II
THEORIES OF
NOT-FOR-PROFIT ACCOUNTING:
COMPARISON AND APPLICATION
OF CURRENT AND PROPOSED
REPORTING FRAMEWORKS
BY TERESA P. GORDON AND
SALEHA B. KHUMAWALA

This page intentionally left blank
OVERVIEW
The role of not-for-profit entities has been well recognized in modernsocieties. Yet, the theoretical development of accounting for governmentaland not-for-profit entities does not have the depth that is present in theoriesrelevant to for-profit entities. Contributing to this state of affairs is the lackof consensus as to why nongovernmental and not-for-profit organizationsexist. We begin by describing the various theories that have been proposedand attempt to develop a framework that takes into account the underlyingeconomic and social foundations unique to this ‘‘third sector.’’ In the UnitedStates, two standard setting bodies have jurisdiction over not-for-profitentities. Commercial and not-for-profit entities share a single standardsetting body, the Financial Accounting Standards Board (FASB) thatrecognizes the need for somewhat different concepts and reports forcommercial and not-for-profit organizations. Separately, the GovernmentalAccounting Standards Board (GASB) determines accounting principles andprocedures for state and local governmental entities and its prescribedaccounting differs from that of the FASB. Finally, two substantiallycomplete alternate frameworks have been proposed in the accountingliterature by Robert Anthony and Robert Mautz.
To illustrate these alternative approaches, we compare, analyze, andevaluate the existing and proposed accounting concepts that give rise todifferences between commercial, governmental, and not-for-profit account-ing practices in a theoretical framework that considers the unique economicand social characteristics of the not-for-profit sector. A set of economicevents relevant to a museum is developed and financial statements areprepared in accordance with the various models. Key elements unique tothis sector such as contributions, collections, depreciation, and endowmentscan all be readily illustrated in the context of a museum.
This case study analysis permits an assessment of the different approachesas a step toward determining which standards might best serve the needs ofthe users of not-for-profit financial statements. The financial statements are
249

evaluated based on criteria commonly espoused in the literature includingdecision usefulness, stewardship, and public accountability.
Our discussion is organized as follows:Chapter 1 – IntroductionChapter 2 – Theories of Accounting for Nonbusiness EntitiesChapter 3 – The FASB Model with exampleChapter 4 – The GASB Model with exampleChapter 5 – Anthony’s Proposed Accounting ModelChapter 6 – Mautz’s Proposed Accounting ModelChapter 7 – Comparison of Financial StatementsAppendix: Transactions underlying the example
TERESA P. GORDON AND SALEHA B. KHUMAWALA250
CHAPTER 1
INTRODUCTION
Charitable organizations are part of a varied population of entities thatoperate somewhere between the market and the state. Variously described asnonprofit, not-for-profit (NFP), tax-exempt, eleemosynary, or nongovern-mental, these organizations play an important role in civil society andconstitute a ‘‘third sector,’’ also known as the independent sector, the volun-tary sector, philanthropic sector, or the social sector of the economy. Morerecently the term ‘‘civil society organization’’ (CSO) is used by a growingnumber of organizations (Glasius, Kaldor, & Anheier, 2005). Despite its sizeand its important role in democracy, this third or voluntary sector remainsthe ‘‘lost continent’’ on the social landscape of modern society (Salamon &Anheier, 1999). Likewise, the financial accounting and reporting needs oforganizations in this sector have taken a backseat to those of commercialand governmental entities. This monograph draws together the varioustheories and approaches to NFP accounting and evaluates the relevance ofthe various frameworks to financial statement users.
Theories and concepts relevant to accounting for governmental and NFPorganizations do not have the depth that is present in literature and researchregarding commercial or for-profit entities. Sunder (1999, p. 4) observes thatresearch in the NFP sector occupies a mere 1 percent of professors’ time. Inthe United States, the Financial Accounting Standards Advisory Committee(FASAC) rarely puts NFP accounting issues as priority items that need theattention of the Financial Accounting Standards Board (FASB). On theinternational scene, there are bodies dedicated to establishing globallyaccepted standards for commercial accounting, the International Account-ing Standards Board (IASB), and for public sector or governmental entities,the International Public Sector Accounting Standards Board (IPSASB).There is, as yet, no international standard setting organization with a focuson the unique needs of charitable organizations and other voluntaryassociations. We argue NFP organizations are no longer the private sector’spoor cousins since they constitute a significant ‘‘industry’’ group for whichthere is little coherent accounting theory. Theories regarding the existence
251
and purpose of a voluntary sector separate and distinct from privatecommerce and government are set forth to lay a foundation from which theunique characteristics of these entities can be examined.
1.1. GROWTH AND DEVELOPMENT
OF THE VOLUNTARY SECTOR
In the United States, NFP organizations are established under the laws of thevarious states. They exist to provide a public benefit within a private entitythat does not operate to earn a profit and which lacks ownership interest thatcan be redeemed, transferred, or sold. Additionally, a NFP organization isconsidered to be tax-exempt if such status has been applied for and grantedby the Internal Revenue Service (IRS). In 2006, there were over 1.9 millionnonprofit organizations in the United States (IRS, 2006).1 These organiza-tions are sometimes referred to as the independent sector to emphasize theirunique role in society, distinct from government and business; whereas othertypes of nonprofit organizations benefit the private, social, or economicinterests of their members – 501(c)(3) organizations must benefit the broadpublic interest. In recognition of this service, Congress and state legislaturesprovide that contributions made to 501(c)(3) nonprofits are tax-deductibleon the donors’ personal or corporate tax returns.
Tax-exempt, NFP entities have grown to significant economic power inthe United States. From 1987 to 2006, the number of charitableorganizations registering with the IRS has grown at double the rate of thebusiness sector (Independent Sector, 2007). When compared to other sectorsof the economy, the nonprofit sector accounts for 5.2 percent of grossdomestic product (GDP) and 8.3 percent of wages and salaries paid in theUnited States. In 2006, individuals donated $295 billion in charitablecontributions (twice the amount given in 1996) and 12.9 billion hours ofvolunteer labor (Wing, Pollak, & Blackwood, 2008). In addition, founda-tions gave $36.4 billion and corporations gave $12.7 billion (approximately0.08 percent of corporate sales). In 2005, NFPs filing returns reported $1.6trillion in revenues and $3.4 trillion in assets (Wing et al., 2008). Thefinances of nonprofit organizations also grew at a healthy rate from 1995 to2005. Although the U.S. GDP increased by 35 percent over this period afteradjusting for inflation, revenues and assets of NFPs increased by at least 54percent with assets showing an increase of approximately 77.1 percent(Wing et al., 2008). The revenues of NFP organizations come from a variety
TERESA P. GORDON AND SALEHA B. KHUMAWALA252
of sources. For nonprofit institutions serving households (NPISHs), thesingle most important source of revenue is dues and fees charged for serviceswhich accounted for 69.7 percent of total 2006 revenues. The remainingsources include contributions and grants at 25.9 percent and income fromassets held at 4.5 percent of total revenues (Wing et al., 2008).
In other countries, NFP organizations are more commonly callednongovernmental organizations or NGOs. NGOs are legally constitutednonprofit organizations created to provide services or advocate publicpolicy on a local, national, or international level and have no participationor representation by any government. In their study of 35 countries forwhich data was available, Salamon and Anheier (1999) found that thenonprofit sector accounted for a cumulative total of 39.5 million full-timeworkers. Putting these figures into context, they conclude that if thenonprofit sector in these countries was a separate national economy, itsexpenditures would make it the seventh largest economy in the world.Anheier, Glasius, & Kaldor (2001) places the number of internationallyoperating NGOs at 40,000. National numbers are even higher. For example,the Russian Duma found that more than 450,000 NGOs operate in Russiaand there may be as many as 600,000 other NGOs working in the countrywithout official registration (Flounders, 2006). Since India became indepen-dent in 1947, the number of NGOs in India has multiplied with estimatesranging from one to two million NGOs in operation (Sooryamoorthy &Gangrade, 2001). In Kenya alone, some 240 NGOs come into existenceevery year (NonprofitExpert.com, 2007). The United Nations DevelopmentProgramme estimates that 250 million people in developing countriesaround the world are helped in some way by the work of NGOs (Kabir,2000).
NFP organizations and voluntary action are at least as ancient as marketsand states and may predate both (Lohmann, 1992, p. 87). However, therecognition of the existence of a voluntary sector is relatively recent andremains dependent, to some extent, on the legal system of particularcountries. In the United States, recognition of nongovernmental entities thatserve the public interest developed in the latter part of the 18th century andthe early part of the 19th century and coincided with the changing views onreligious freedom and the separation of church and state (Neem, 2003).During this early period, most NFP corporations were small and received asubstantial portion of their support from a few wealthy donors. The numberof private NFP corporations grew gradually during the early 20th centurywith an estimated 50,000 tax-exempt charitable organizations by 1950.However, the economics were changing as smaller contributions from the
Introduction 253
middle class became essential to the survival of many NFP agencies(Figlewicz, Anderson, & Strupeck, 1985). Explosive growth following WorldWar II also led to increasing congressional concern regarding tax policy. Atthat point in time, little academic research had been done on any aspect ofphilanthropy.
The establishment of the Commission on Private Philanthropy and PublicNeeds (known as the Filer Commission) in 1973 was the first step toward abroad recognition of the growing importance and influence of the estimated700,000 charitable organizations, which existed at that time (Hall, 1995).Research in the area was also enhanced by the formation of the Associationof Voluntary Action Scholars at about the same time (Smith, 2003).
1.2. THEORIES OF THE VOLUNTARY SECTOR
The increased interests in private NFP entities during the latter part of the20th century led to the development of a number of theories to explain whythese organizations are created, supported, and survive. The early theorieswere generally grounded in economics with the idea that NFP entities existbecause of market or government failures. Unfortunately, most functionaldefinitions explain what is not included and focus on how NFP entitiesdiffer from proprietary or governmental entities rather than positivedescriptions of what they are and do. An overview of various theories ispresented in the paragraphs that follow.
Weisbrod (1975, 1977) offers the first economic theory by suggesting thatNFPs serve as private providers of public goods, as economists define theterm.2 He argues that government entities provide public goods at the levelthat satisfies the median voter. The NFP entity steps in to meet the needs ofindividuals that prefer a different level or mix of public goods. This publicgoods theory is incomplete since many NFP organizations provide privategoods that benefit specific individuals. Examples include many types ofhealth care organizations (hospitals, nursing homes, etc.) as well aseducational institutions at all levels from pre-school to private colleges.
Contract failure theory was first discussed by Nelson and Krashinsky(1973) in the context of child care services and more fully developed byHansmann (1980). Hansmann argues that NFP entities arise in situationswhere consumers are unable to accurately evaluate the quantity or quality ofservices provided. Consumers prefer the NFP form since they know thatthose who control the entity cannot personally benefit from providing lowquality services. The lack of owners and the nondistribution constraint
TERESA P. GORDON AND SALEHA B. KHUMAWALA254
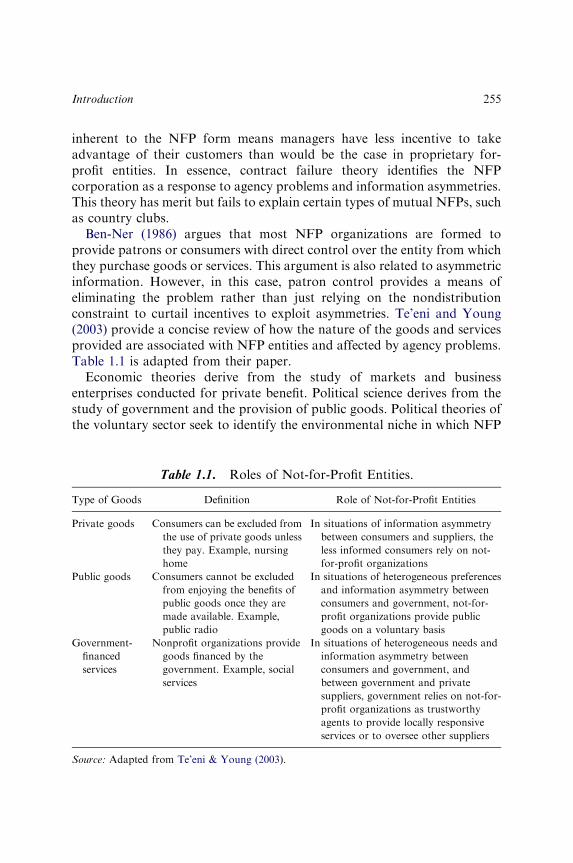
inherent to the NFP form means managers have less incentive to takeadvantage of their customers than would be the case in proprietary for-profit entities. In essence, contract failure theory identifies the NFPcorporation as a response to agency problems and information asymmetries.This theory has merit but fails to explain certain types of mutual NFPs, suchas country clubs.
Ben-Ner (1986) argues that most NFP organizations are formed toprovide patrons or consumers with direct control over the entity from whichthey purchase goods or services. This argument is also related to asymmetricinformation. However, in this case, patron control provides a means ofeliminating the problem rather than just relying on the nondistributionconstraint to curtail incentives to exploit asymmetries. Te’eni and Young(2003) provide a concise review of how the nature of the goods and servicesprovided are associated with NFP entities and affected by agency problems.Table 1.1 is adapted from their paper.
Economic theories derive from the study of markets and businessenterprises conducted for private benefit. Political science derives from thestudy of government and the provision of public goods. Political theories ofthe voluntary sector seek to identify the environmental niche in which NFP
Table 1.1. Roles of Not-for-Profit Entities.
Type of Goods Definition Role of Not-for-Profit Entities
Private goods Consumers can be excluded from
the use of private goods unless
they pay. Example, nursing
home
In situations of information asymmetry
between consumers and suppliers, the
less informed consumers rely on not-
for-profit organizations
Public goods Consumers cannot be excluded
from enjoying the benefits of
public goods once they are
made available. Example,
public radio
In situations of heterogeneous preferences
and information asymmetry between
consumers and government, not-for-
profit organizations provide public
goods on a voluntary basis
Government-
financed
services
Nonprofit organizations provide
goods financed by the
government. Example, social
services
In situations of heterogeneous needs and
information asymmetry between
consumers and government, and
between government and private
suppliers, government relies on not-for-
profit organizations as trustworthy
agents to provide locally responsive
services or to oversee other suppliers
Source: Adapted from Te’eni & Young (2003).
Introduction 255
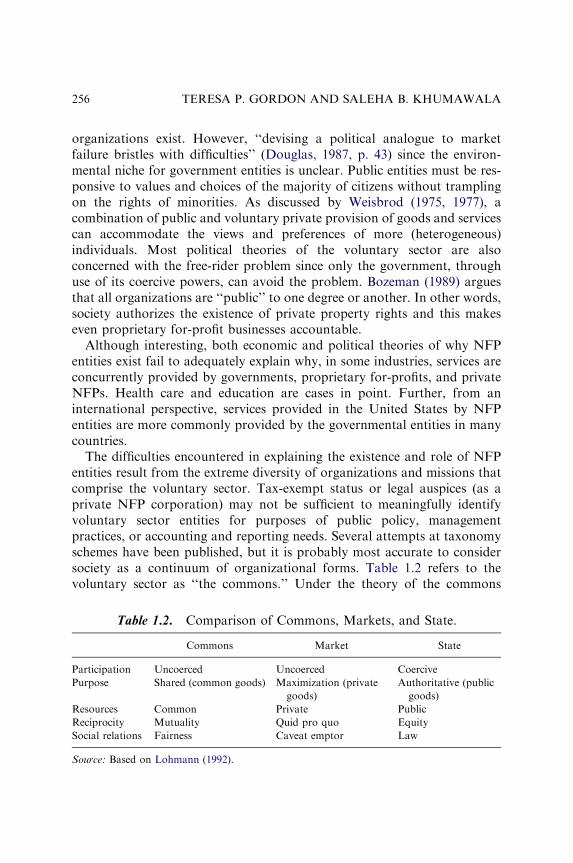
organizations exist. However, ‘‘devising a political analogue to marketfailure bristles with difficulties’’ (Douglas, 1987, p. 43) since the environ-mental niche for government entities is unclear. Public entities must be res-ponsive to values and choices of the majority of citizens without tramplingon the rights of minorities. As discussed by Weisbrod (1975, 1977), acombination of public and voluntary private provision of goods and servicescan accommodate the views and preferences of more (heterogeneous)individuals. Most political theories of the voluntary sector are alsoconcerned with the free-rider problem since only the government, throughuse of its coercive powers, can avoid the problem. Bozeman (1989) arguesthat all organizations are ‘‘public’’ to one degree or another. In other words,society authorizes the existence of private property rights and this makeseven proprietary for-profit businesses accountable.
Although interesting, both economic and political theories of why NFPentities exist fail to adequately explain why, in some industries, services areconcurrently provided by governments, proprietary for-profits, and privateNFPs. Health care and education are cases in point. Further, from aninternational perspective, services provided in the United States by NFPentities are more commonly provided by the governmental entities in manycountries.
The difficulties encountered in explaining the existence and role of NFPentities result from the extreme diversity of organizations and missions thatcomprise the voluntary sector. Tax-exempt status or legal auspices (as aprivate NFP corporation) may not be sufficient to meaningfully identifyvoluntary sector entities for purposes of public policy, managementpractices, or accounting and reporting needs. Several attempts at taxonomyschemes have been published, but it is probably most accurate to considersociety as a continuum of organizational forms. Table 1.2 refers to thevoluntary sector as ‘‘the commons.’’ Under the theory of the commons
Table 1.2. Comparison of Commons, Markets, and State.
Commons Market State
Participation Uncoerced Uncoerced Coercive
Purpose Shared (common goods) Maximization (private
goods)
Authoritative (public
goods)
Resources Common Private Public
Reciprocity Mutuality Quid pro quo Equity
Social relations Fairness Caveat emptor Law
Source: Based on Lohmann (1992).
TERESA P. GORDON AND SALEHA B. KHUMAWALA256
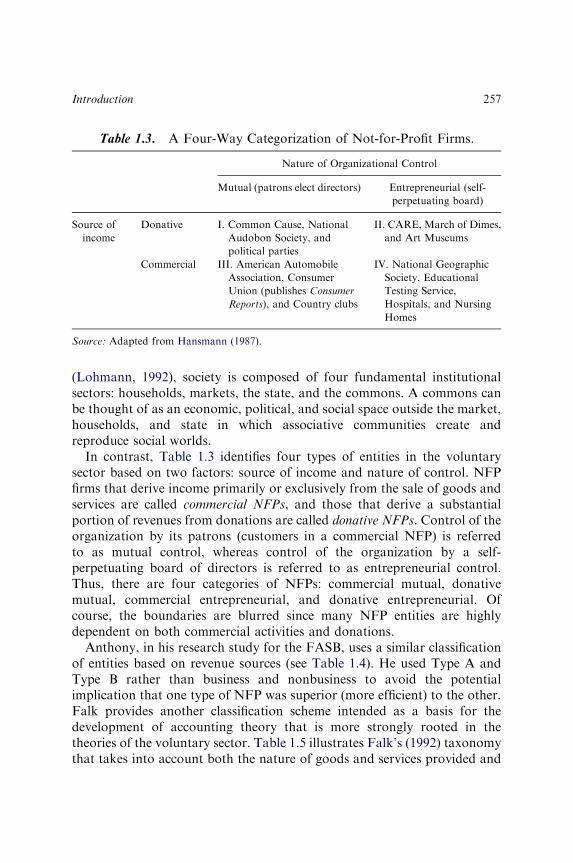
(Lohmann, 1992), society is composed of four fundamental institutionalsectors: households, markets, the state, and the commons. A commons canbe thought of as an economic, political, and social space outside the market,households, and state in which associative communities create andreproduce social worlds.
In contrast, Table 1.3 identifies four types of entities in the voluntarysector based on two factors: source of income and nature of control. NFPfirms that derive income primarily or exclusively from the sale of goods andservices are called commercial NFPs, and those that derive a substantialportion of revenues from donations are called donative NFPs. Control of theorganization by its patrons (customers in a commercial NFP) is referredto as mutual control, whereas control of the organization by a self-perpetuating board of directors is referred to as entrepreneurial control.Thus, there are four categories of NFPs: commercial mutual, donativemutual, commercial entrepreneurial, and donative entrepreneurial. Ofcourse, the boundaries are blurred since many NFP entities are highlydependent on both commercial activities and donations.
Anthony, in his research study for the FASB, uses a similar classificationof entities based on revenue sources (see Table 1.4). He used Type A andType B rather than business and nonbusiness to avoid the potentialimplication that one type of NFP was superior (more efficient) to the other.Falk provides another classification scheme intended as a basis for thedevelopment of accounting theory that is more strongly rooted in thetheories of the voluntary sector. Table 1.5 illustrates Falk’s (1992) taxonomythat takes into account both the nature of goods and services provided and
Table 1.3. A Four-Way Categorization of Not-for-Profit Firms.
Nature of Organizational Control
Mutual (patrons elect directors) Entrepreneurial (self-
perpetuating board)
Source of
income
Donative I. Common Cause, National
Audobon Society, and
political parties
II. CARE, March of Dimes,
and Art Museums
Commercial III. American Automobile
Association, Consumer
Union (publishes Consumer
Reports), and Country clubs
IV. National Geographic
Society, Educational
Testing Service,
Hospitals, and Nursing
Homes
Source: Adapted from Hansmann (1987).
Introduction 257
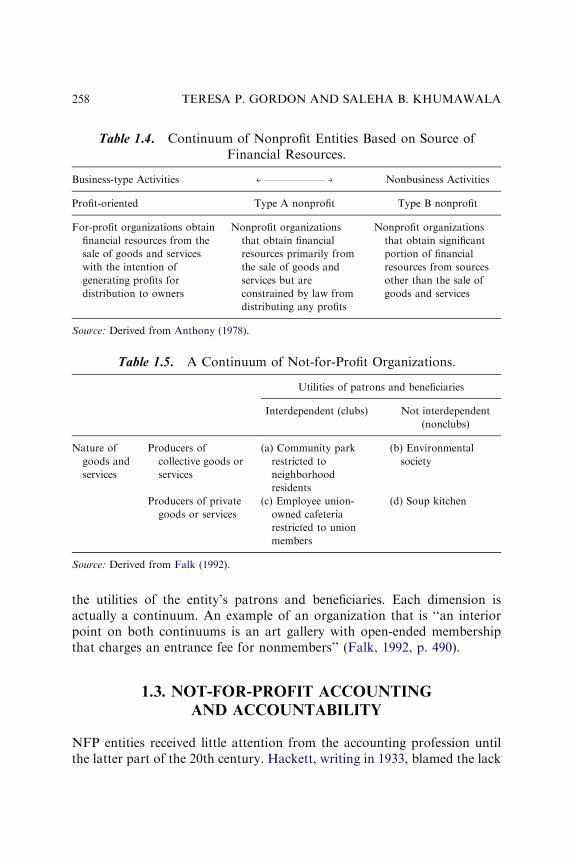
the utilities of the entity’s patrons and beneficiaries. Each dimension isactually a continuum. An example of an organization that is ‘‘an interiorpoint on both continuums is an art gallery with open-ended membershipthat charges an entrance fee for nonmembers’’ (Falk, 1992, p. 490).
1.3. NOT-FOR-PROFIT ACCOUNTING
AND ACCOUNTABILITY
NFP entities received little attention from the accounting profession untilthe latter part of the 20th century. Hackett, writing in 1933, blamed the lack
Table 1.4. Continuum of Nonprofit Entities Based on Source ofFinancial Resources.
Business-type Activities Nonbusiness Activities
Profit-oriented Type A nonprofit Type B nonprofit
For-profit organizations obtain
financial resources from the
sale of goods and services
with the intention of
generating profits for
distribution to owners
Nonprofit organizations
that obtain financial
resources primarily from
the sale of goods and
services but are
constrained by law from
distributing any profits
Nonprofit organizations
that obtain significant
portion of financial
resources from sources
other than the sale of
goods and services
Source: Derived from Anthony (1978).
Table 1.5. A Continuum of Not-for-Profit Organizations.
Utilities of patrons and beneficiaries
Interdependent (clubs) Not interdependent
(nonclubs)
Nature of
goods and
services
Producers of
collective goods or
services
(a) Community park
restricted to
neighborhood
residents
(b) Environmental
society
Producers of private
goods or services
(c) Employee union-
owned cafeteria
restricted to union
members
(d) Soup kitchen
Source: Derived from Falk (1992).
TERESA P. GORDON AND SALEHA B. KHUMAWALA258
of development of governmental and institutional accounting on inadequateeducation. He pointed to the American Institute of Certified Public Accoun-tants (AICPA) predecessor’s (American Institute of Accountants) lack ofinterest as demonstrated by the rarity of coverage of governmental andnonprofit accounting questions on the professional examinations. By 1948,Morey was able to report that the majority of recent exams had included atleast one question on governmental accounting so that ‘‘no candidate for theCPA certificate can safely undertake to sit at one of these examinationswithout a reasonable understanding of this subject’’ (Morey, 1948, p. 233).
Historically, the accounting profession allowed nonprofit and govern-mental organizations to develop accounting practices which it would thenreview and endorse. Henke (1972) offers two reasons for this approach.First, he contends that limited amount of resources had been committed toNFP enterprises, which purportedly caused accountants to give much lessattention to their accounting practices vis-a-vis profit-oriented enterprises.Second, the profession ‘‘has not really faced up to the problem of trying toconvey to constituent groups of these organizations the data which woulddisclose the operational stewardship of the management of these entities’’(Henke, 1972, p. 52).
Gross (1977) suggests that the accounting profession’s continued apathywas due to (1) the low profile of nonbusiness organizations, (2) the belief byoutsiders that the organizations were performing fairly well, (3) the minimallegal risks for nonbusiness audits, and (4) low audit fees charged because theaudits were considered a community service. A decade later, Fetterman(1988, p. 24) was ‘‘struck by the fact that NFP organizations do not have alow profile; they have no profile’’ in the proposed auditing standards issuedby the AICPA in 1987.
In the 1960s, there were several attempts in self-regulation that led toindustry accounting manuals. Standards of Accounting and FinancialReporting for Voluntary Health and Welfare Organizations (the ‘‘blackbook’’) published by the National Health Council and the National SocialWelfare Assembly in 1964 was one of the first. Other associations developedguidelines for hospitals, museums, and colleges and universities.3 TheAICPA published a related audit guide, Audits of Voluntary Health andWelfare Organizations, in 1967, followed by similar audit guides forhospitals in 1972 and colleges and universities in 1973 (AICPA, 1972, 1973).The various rules embodied in the industry manuals and audit guides werenot standardized for private NFPs until 1993 when the FASB issuedstatements 116 and 117 (FASB, 1993a, 1993b) and for public sector NFPswhen the GASB issued statements 34 and 35 (GASB, 1999a, 1999b).
Introduction 259
1.4. ORGANIZATION OF THIS MONOGRAPH
The voluntary sector has unique accountability requirements because theentities are not governed by the market forces of supply and demand thatdiscipline proprietary for-profit firms nor the political power of voters whodiscipline and restrain the actions of governments. Thus, accountability is aparticularly sensitive issue for charitable organizations. The brief discussionof voluntary sector theories in this chapter provides the foundation onwhich we explore whether unique characteristics of these NFP entitiesrequire special accounting and reporting standards.
Certainly, there are special sets of transactions that do not apply tocommercial enterprises: nonreciprocal contributions and permanentlyrestricted endowments. In addition, resource providers often place restric-tions on funds to be used by governments and private NFP entities and thisraises issues regarding the timing of revenue recognition and whetherrestricted funds must be accounted for and disclosed separately. Govern-ments were often criticized for presenting detailed information for categoriesof assets and liabilities subject to different restrictions or laws and for theirfailure to aggregate financial information sufficiently to provide the readerwith a clear overall picture. Lengthy disclosures of various funds andrestrictions become too confusing to be useful. These and other specialindustry characteristics may or may not justify the creation of separatedefinitions, concepts, and reports for NFP entities.
Comparing the financial statements of nonbusiness organizations is mademore difficult when there are differences in accounting standards betweenpublic and private NFP entities. Flexibility to tell one’s story may be acherished right in some jurisdictions, but the available accounting choicesthat organizations have under even a single set of standards can lead tocomparability problems for financial statement users. However, imposing amodel useful in one sector to organizations with inherently differentcharacteristics and needs may create unnecessary costs and fail to provideinformation useful for managers, donors, taxpayers, and other stakeholders.Chapter 2 in Section II explores these and other theoretical issues inmore depth.
Chapters 4 through 6 in Section II examine alternative frameworks. Ineach chapter, financial statements based on the same set of economictransactions and events are prepared in accordance with the alternativeapproaches. Chapters 3 and 4 in Section II describe the development ofaccounting standards in the United States for private NFP entities andpublic governmental entities, respectively. The FASB’s model, based on its
TERESA P. GORDON AND SALEHA B. KHUMAWALA260
conceptual framework, constitutes currently acceptable practice for non-governmental NFP organizations in the United States. It focuses ondecision usefulness and emphasizes the measurement of assets and liabilitiesrather than current operations. The GASB’s model, which constitutescurrently acceptable practice for U.S. state and local governments, requirespresentation of financial information from both a short-term fundingperspective and a long-term entity-wide perspective.
Chapters 5 and 6 in Section II present the conceptual frameworks(theories) developed by Robert Anthony and Robert Mautz. Anthony’sconceptual framework focuses on the activity statement and the measure-ment of operating performance. The primary difference between Anthony’sproposal and FASB’s conceptual frameworks is that Anthony discusses thatthere should be few differences between business and nonbusinessaccounting and believes that the focus and emphasis of such reportingshould be on the operating (or income) statement rather than the balancesheet.
In contrast, the model proposed by Mautz not only abandons thebusiness model for all value-transferring and cost-sharing activitiesconducted by governmental and NFP entities, but also adds two newelements to the dialogue: ‘‘service facilities’’ and ‘‘commitments.’’ Hisfinancial statements include prospective information not envisioned in anyof the other theories because Mautz believes that users of NFP financialstatements need this information to answer key questions about an entity.
Chapter 7 in Section II analyzes the existing and proposed theories forNFP accounting and evaluates them based on criteria including steward-ship, decision usefulness, and public accountability and presents ourconclusions. The transition to the use of international financial reportingstandards by publicly traded companies may impact not only the existingNFP accounting standards but also lead to new standard setting bodies andprocesses. Our hope is that this comparison of alternative reporting modelsfor NFP organizations and the delineation of relevant concepts can facilitatethe discussions that will arise.
NOTES
1. The Internal Revenue Code defines over 27 categories of organizations exemptfrom federal income taxes, including private country clubs, labor unions, businessassociations, fraternal organizations, and many others (IRS, 2006). The majority ofthese organizations – approximately 1.5 million of them – make up the independent
Introduction 261
sector, of which 1.4 million are 501(c)(3)s (public charities, private foundations, andreligious congregations) and 501(c)(4)s (social welfare/advocacy organizations).2. A public good has two characteristics. First, it costs no more to provide it for
many people than it costs to provide it to a single person because one person’senjoyment does not preclude enjoyment by others. Second, there is no easy way toprevent others from enjoying the good once it has been provided to one person orgroup. Examples include national defense, public television, and water pollutioncontrols.3. For example, the National Association of College and University Business
Officers (NACUBO) added a section to their manual that dealt with accounting andreporting issues in 1974.
REFERENCES
American Institute of Certified Public Accountants (AICPA). (1967). Audits of voluntary health
and welfare organizations. (Industry Audit Guide). New York: American Institute of
Certified Public Accountants.
American Institute of Certified Public Accountants (AICPA). (1972). Hospital audit guide.
(Industry Audit Guide). New York: American Institute of Certified Public Accountants.
American Institute of Certified Public Accountants (AICPA). (1973). Audits of colleges and
universities. (Industry Audit Guide). New York: American Institute of Certified Public
Accountants.
Anheier, H., Glasius, M., & Kaldor, M. (2001). Global civil society. New York: Oxford
University Press.
Anthony, R. N. (1978). Financial accounting in nonbusiness organizations: An exploratory study
of conceptual issues. Stamford: Conn. Financial Accounting Standards Board.
Ben-Ner, A. (1986). Nonprofit organizations: Why do they exist in market economies? In:
S. Rose-Ackerman (Ed.), The economics of nonprofit institutions: Studies in structure &
policy. New York, NY: Oxford University Press.
Bozeman, B. (1989). All organizations are public: Bridging public and private organizational
theories. San Francisco: Jossey-Bass.
Douglas, J. (1987). Political theories of nonprofit organization. In: W. W. Powell (Ed.), The
nonprofit sector: A research handbook. New Haven: Yale University Press.
Falk, H. (1992). Towards a framework for not-for-profit accounting. Contemporary Accounting
Research, 8(2), 468–499.
Fetterman, A. L. (1988). Update on not-for-profit accounting and reporting. The CPA Journal,
58(March), 22, 24–26, 28–29.
Figlewicz, R. E., Anderson, D. T., & Strupeck, C. D. (1985). The evolution and current state of
financial accounting concepts and standards in the nonbusiness sector. Accounting
Historians Journal, 12(1), 73–98.
Financial Accounting Standards Board (FASB). (1993a). Statement of financial accounting
standards no. 116 – Accounting for contributions received and made. Norwalk, CT:
Financial Accounting Standards Board.
Financial Accounting Standards Board (FASB). (1993b). Statement of financial accounting
standards no. 117 – Financial statements of not-for-profit organizations. Norwalk, CT:
Financial Accounting Standards Board.
TERESA P. GORDON AND SALEHA B. KHUMAWALA262
Flounders, S. (2006). 450,000 NGOs in Russia. Available at http://www.workers.org/2006/
world/ngos-0216/. Accessed on February 6.
Glasius, M., Kaldor, M., & Anheier, H. (Eds). (2005). Global civil society 2006/7. London: Sage.
Governmental Accounting Standards Board (GASB). (1999a). Statement 34. Basic financial
statements- and management’s discussion and analysis-for state and local governments.
Norwalk, CT: Governmental Accounting Standards Board.
Governmental Accounting Standards Board (GASB). (1999b). Statement 35. Basic financial
statements – and management’s discussion and analysis – for public colleges and
universities – an amendment of GASB statement no. 34. Norwalk, CT: Governmental
Accounting Standards Board.
Gross, M. J., Jr. (1977). Nonprofit accounting: The continuing revolution. Journal of
Accountancy, 143(6), 66–74.
Hackett, R. P. (1933). Recent developments in governmental and institutional accounting.
The Accounting Review, 8(2), 122–127.
Hall, P. D. (1995). Theories and institutions. Nonprofit and Voluntary Sector Quarterly, 24(1),
5–13.
Hansmann, H. B. (1980). The role of nonprofit enterprise. The Yale Law Journal, 89(5),
835–901.
Hansmann, H. B. (1987). Economic theories of nonprofit organizations. In: W. W. Powell (Ed.),
The nonprofit sector: A research handbook. New Haven: Yale University Press.
Henke, E. O. (1972). Performance evaluation for not-for-profit organizations. Journal of
Accountancy, 133(6), 51–55.
Independent Sector. (2007). Facts and figures about charitable organizations. Available at
http://www.independentsector.org/programs/research/Charitable_Fact_Sheet.pdf. Accessed
on January 4, 2007.
Internal Revenue Service. (2006). Tax-exempt organization and other entities listed on the
exempt organization business master file, by type of organization and internal revenue
code section, Fiscal Years 2002–2005. Internal Revenue Service Data Book 2006.
Kabir, E. A. K. M. (2000). How NGOs serve the disadvantaged: Some pertinent questions.
Independent (Bangladesh), April 2. Available at www.globalpolicy.org/ngos/disadv.htm.
Accessed on October 3, 2007.
Lohmann, R. A. (1992). The commons: New perspectives on nonprofit organizations and
voluntary action. San Francisco, CA: Jossey-Bass.
Morey, L. (1948). Trends in governmental accounting. The Accounting Review, 23(3),
227–234.
Neem, J. N. (2003). Politics and the origins of the nonprofit corporation in Massachusetts
and New Hampshire, 1780–1820. Nonprofit and Voluntary Sector Quarterly, 32(3),
344–365.
Nelson, R., & Krashinsky, M. (1973). Two major issues of public policy: Public policy and
organization of supply. In: R. Nelson & D. Young (Eds), Public subsidy for day care of
young children. Lexington, MA: D. C. Heath & Co.
NonprofitExpert.com. NGOs – Nongovernmental organizations. Available at http://www.
nonprofitexpert.com/ngo.htm. Retrieved on September 05, 2007.
Salamon, L. M., & Anheier, H. K. (1999). Civil society in comparative perspective. In: L. M.
Salamon, H. K. Anheier, R. List, S. Toepler, S. W. Sokolowski and Associations (eds),
Global civil society: Dimensions of the nonprofit sector. Baltimore, MD: Center for Civil
Society Studies, Johns Hopkins University.
Introduction 263
Smith, D. H. (2003). A history of ARNOVA. Nonprofit and Voluntary Sector Quarterly, 32(3),
458–472.
Sooryamoorthy, R., & Gangrade, K. D. (2001). NGOs in India: A cross-sectional study.
London: Greenwood Press.
Sunder, S. (1999). A theory of accounting and controls for organizations producing public-versus
private-goods. Working Paper, School of Management, Yale University.
Te’eni, D., & Young, D. R. (2003). The changing role of nonprofits in the network economy.
Nonprofit and Voluntary Sector Quarterly, 32(3), 397–414.
Weisbrod, B. A. (1975). Toward a theory of the voluntary nonprofit sector in a three-sector
economy. In: E. S. Phelps (Ed.), Altruism, morality, and economic theory (pp. 171–195).
New York: Russell Sage Foundation.
Weisbrod, B. A. (1977). The voluntary nonprofit sector. Lexington, MA: D.C. Heath & Co.
Wing, K. T., Pollak, T. H., & Blackwood, A. (2008). The nonprofit almanac 2008. Washington,
DC: The Urban Institute Press.
TERESA P. GORDON AND SALEHA B. KHUMAWALA264
CHAPTER 2
THEORIES OF ACCOUNTING FOR
NONBUSINESS ENTITIES
Systematic record keeping is one of several institutions necessary to sustainlarge group coordination. In fact, the road to modern civilizations was in partbuilt on improvements in and additions to institutions like recordkeeping(Basu & Waymire, 2006). However, accounting theories or frameworks are afairly recent phenomenon. Even the algebraic relationship among accountswas not explicitly discussed until the 19th century (Peragallo, 1938; Brown &Johnston, 1963). During the last half of the 1800s, the equality of accountsprovided a foundation for a ‘‘science of accounts’’ (McMillan, 1988) mindsetand gave rise to many theoretical debates such as the proprietary versus entityviews toward accounting (Littleton, 1933). The desire for a theory of accountingeventually led to the 1973 initiation of a conceptual framework project bythe newly formed FASB (Storey & Storey, 1998). However, there were anumber of earlier attempts (Previts, 1984) that provide insights to help under-stand both where we have been and were we might be heading. Clearly the topicof ‘‘accounting theory’’ is relevant in the first decade of the 21st century asFASB and the IASB attempt to reach consensus on a conceptual framework.
This chapter presents selected theoretical concepts that interact to determinevarious avenues that have been taken or proposed for government and NFPaccounting and reporting issues. We briefly introduce the origins of keyconcepts that serve as the foundation for the various proposals. Consistentwith terminology in FASB’s Concept Statement No. 4 (1980), we use the term‘‘nonbusiness’’ to encompass both NFP and governmental entities.
2.1. OBJECTIVES OF REPORTING: STEWARDSHIP
AND DECISION USEFULNESS
Chapter 1 in Section II discusses a number of theories intended to explainthe existence of NFP entities and how they differ from business or
265
government. The public goods theory addresses the rise of nonprofitorganizations in response to governmental undersupply of public and quasi-public goods. In contrast, the trust-related theories are based on infor-mation problems inherent in the goods or services provided and the trustdilemmas associated with them. The advantage that nonprofit organizationshave over for-profit firms is the signal of trustworthiness that arises from thenondistribution constraint. In contrast to theories that emphasize aspects ofdemand for services, entrepreneurship theories explain the existence ofnonprofit organizations from a supply-side perspective.
Choosing appropriate accounting and reporting objectives depends on theprimary audience for the information. It also depends on whether onebelieves that for-profit business entities are fundamentally different fromgovernments and/or charitable NFP entities providing public goods. In theUnited States, the pattern has generally been away from a narrowly focusedstewardship objective toward a notion of decision usefulness. This sectiondiscusses the associations among the concepts shown in Fig. 2.1 beginningwith the nature of goods and services.
2.1.1. The Nature of Goods and Services
NFP and governmental entities provide a wide range of goods and services.Some are clearly public goods like defense, whereas others benefit bothindividuals and society at large such as education. The nature of the goodsand services provided as well as the reciprocal or nonreciprocal nature oftransactions suggests potential differences in accounting and reportingbetween governmental and NFP entities and their for-profit counterparts.The GASB argues that government accounting is and should be different(GASB, 2006). Anthony (1989) argues that government and NFP entities donot need conceptual frameworks different from one appropriate for for-profit entities, although taxes and donations warrant additional considera-tion. In other words, government and NFP entities would be treated like aspecialized industry with modifications to general standards only whenwarranted by specific circumstances. This is also the perspective of FASBas it deals with standard setting for NFPs. As discussed in Chapter 6 inSection II, Mautz (1989) would apply a different conceptual approach basedon the nature of activities: commercial activities should be treated the sameregardless of the form of the entity. Accordingly, his position on thequestion appears to be generally consistent with that of GASB.
TERESA P. GORDON AND SALEHA B. KHUMAWALA266
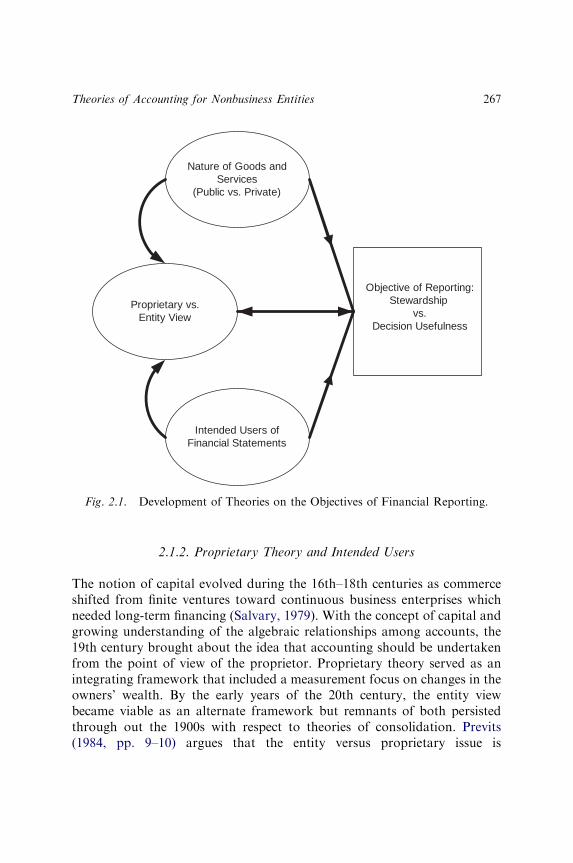
2.1.2. Proprietary Theory and Intended Users
The notion of capital evolved during the 16th–18th centuries as commerceshifted from finite ventures toward continuous business enterprises whichneeded long-term financing (Salvary, 1979). With the concept of capital andgrowing understanding of the algebraic relationships among accounts, the19th century brought about the idea that accounting should be undertakenfrom the point of view of the proprietor. Proprietary theory served as anintegrating framework that included a measurement focus on changes in theowners’ wealth. By the early years of the 20th century, the entity viewbecame viable as an alternate framework but remnants of both persistedthrough out the 1900s with respect to theories of consolidation. Previts(1984, pp. 9–10) argues that the entity versus proprietary issue is
Proprietary vs. Entity View
Nature of Goods and Services
(Public vs. Private)
Intended Users of Financial Statements
Objective of Reporting:Stewardship
vs.Decision Usefulness
Fig. 2.1. Development of Theories on the Objectives of Financial Reporting.
Theories of Accounting for Nonbusiness Entities 267
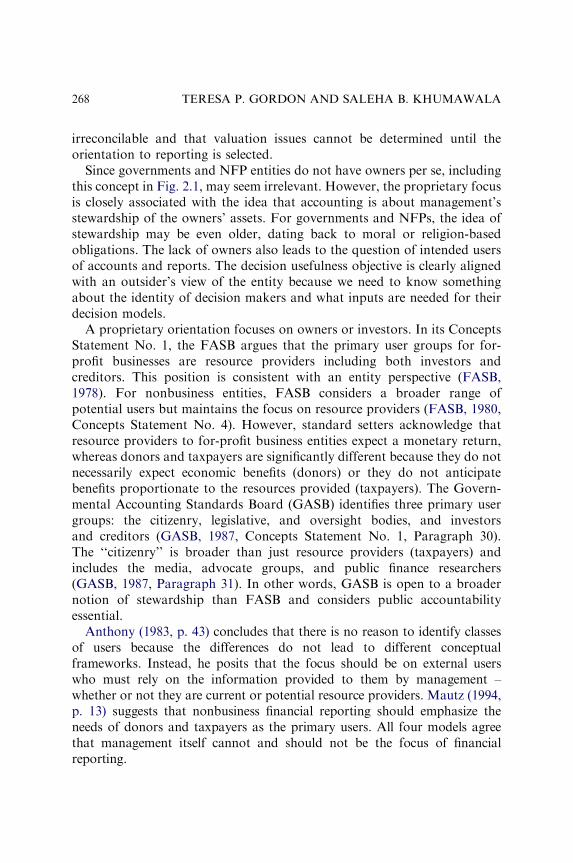
irreconcilable and that valuation issues cannot be determined until theorientation to reporting is selected.
Since governments and NFP entities do not have owners per se, includingthis concept in Fig. 2.1, may seem irrelevant. However, the proprietary focusis closely associated with the idea that accounting is about management’sstewardship of the owners’ assets. For governments and NFPs, the idea ofstewardship may be even older, dating back to moral or religion-basedobligations. The lack of owners also leads to the question of intended usersof accounts and reports. The decision usefulness objective is clearly alignedwith an outsider’s view of the entity because we need to know somethingabout the identity of decision makers and what inputs are needed for theirdecision models.
A proprietary orientation focuses on owners or investors. In its ConceptsStatement No. 1, the FASB argues that the primary user groups for for-profit businesses are resource providers including both investors andcreditors. This position is consistent with an entity perspective (FASB,1978). For nonbusiness entities, FASB considers a broader range ofpotential users but maintains the focus on resource providers (FASB, 1980,Concepts Statement No. 4). However, standard setters acknowledge thatresource providers to for-profit business entities expect a monetary return,whereas donors and taxpayers are significantly different because they do notnecessarily expect economic benefits (donors) or they do not anticipatebenefits proportionate to the resources provided (taxpayers). The Govern-mental Accounting Standards Board (GASB) identifies three primary usergroups: the citizenry, legislative, and oversight bodies, and investorsand creditors (GASB, 1987, Concepts Statement No. 1, Paragraph 30).The ‘‘citizenry’’ is broader than just resource providers (taxpayers) andincludes the media, advocate groups, and public finance researchers(GASB, 1987, Paragraph 31). In other words, GASB is open to a broadernotion of stewardship than FASB and considers public accountabilityessential.
Anthony (1983, p. 43) concludes that there is no reason to identify classesof users because the differences do not lead to different conceptualframeworks. Instead, he posits that the focus should be on external userswho must rely on the information provided to them by management –whether or not they are current or potential resource providers. Mautz (1994,p. 13) suggests that nonbusiness financial reporting should emphasize theneeds of donors and taxpayers as the primary users. All four models agreethat management itself cannot and should not be the focus of financialreporting.
TERESA P. GORDON AND SALEHA B. KHUMAWALA268
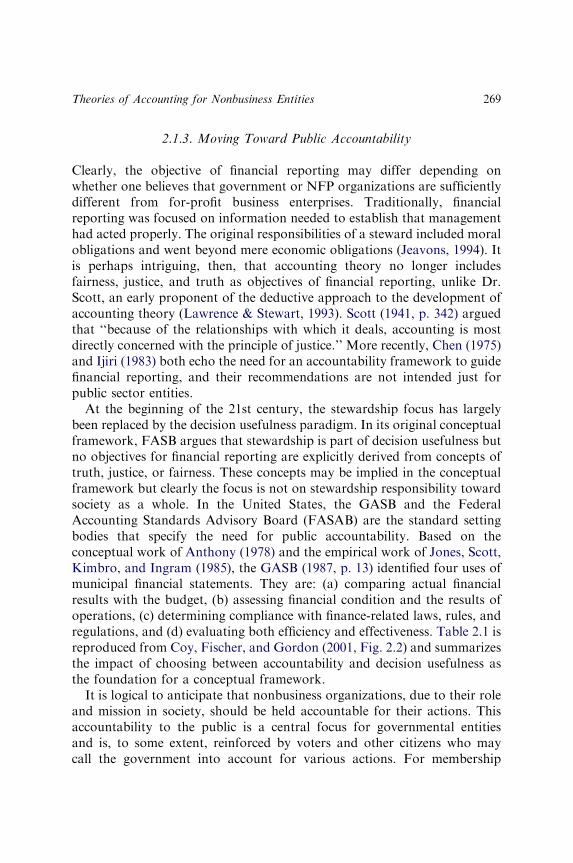
2.1.3. Moving Toward Public Accountability
Clearly, the objective of financial reporting may differ depending onwhether one believes that government or NFP organizations are sufficientlydifferent from for-profit business enterprises. Traditionally, financialreporting was focused on information needed to establish that managementhad acted properly. The original responsibilities of a steward included moralobligations and went beyond mere economic obligations (Jeavons, 1994). Itis perhaps intriguing, then, that accounting theory no longer includesfairness, justice, and truth as objectives of financial reporting, unlike Dr.Scott, an early proponent of the deductive approach to the development ofaccounting theory (Lawrence & Stewart, 1993). Scott (1941, p. 342) arguedthat ‘‘because of the relationships with which it deals, accounting is mostdirectly concerned with the principle of justice.’’ More recently, Chen (1975)and Ijiri (1983) both echo the need for an accountability framework to guidefinancial reporting, and their recommendations are not intended just forpublic sector entities.
At the beginning of the 21st century, the stewardship focus has largelybeen replaced by the decision usefulness paradigm. In its original conceptualframework, FASB argues that stewardship is part of decision usefulness butno objectives for financial reporting are explicitly derived from concepts oftruth, justice, or fairness. These concepts may be implied in the conceptualframework but clearly the focus is not on stewardship responsibility towardsociety as a whole. In the United States, the GASB and the FederalAccounting Standards Advisory Board (FASAB) are the standard settingbodies that specify the need for public accountability. Based on theconceptual work of Anthony (1978) and the empirical work of Jones, Scott,Kimbro, and Ingram (1985), the GASB (1987, p. 13) identified four uses ofmunicipal financial statements. They are: (a) comparing actual financialresults with the budget, (b) assessing financial condition and the results ofoperations, (c) determining compliance with finance-related laws, rules, andregulations, and (d) evaluating both efficiency and effectiveness. Table 2.1 isreproduced from Coy, Fischer, and Gordon (2001, Fig. 2.2) and summarizesthe impact of choosing between accountability and decision usefulness asthe foundation for a conceptual framework.
It is logical to anticipate that nonbusiness organizations, due to their roleand mission in society, should be held accountable for their actions. Thisaccountability to the public is a central focus for governmental entitiesand is, to some extent, reinforced by voters and other citizens who maycall the government into account for various actions. For membership
Theories of Accounting for Nonbusiness Entities 269
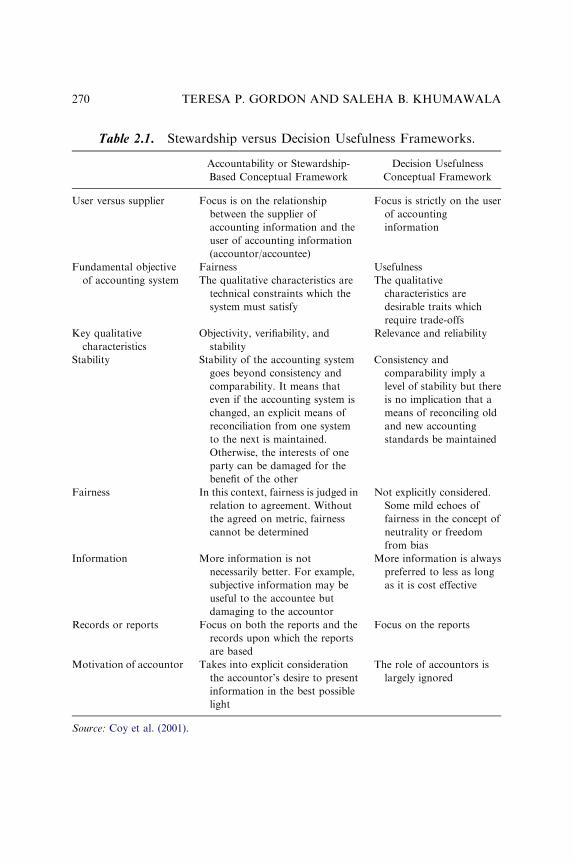
Table 2.1. Stewardship versus Decision Usefulness Frameworks.
Accountability or Stewardship-
Based Conceptual Framework
Decision Usefulness
Conceptual Framework
User versus supplier Focus is on the relationship
between the supplier of
accounting information and the
user of accounting information
(accountor/accountee)
Focus is strictly on the user
of accounting
information
Fundamental objective
of accounting system
Fairness Usefulness
The qualitative characteristics are
technical constraints which the
system must satisfy
The qualitative
characteristics are
desirable traits which
require trade-offs
Key qualitative
characteristics
Objectivity, verifiability, and
stability
Relevance and reliability
Stability Stability of the accounting system
goes beyond consistency and
comparability. It means that
even if the accounting system is
changed, an explicit means of
reconciliation from one system
to the next is maintained.
Otherwise, the interests of one
party can be damaged for the
benefit of the other
Consistency and
comparability imply a
level of stability but there
is no implication that a
means of reconciling old
and new accounting
standards be maintained
Fairness In this context, fairness is judged in
relation to agreement. Without
the agreed on metric, fairness
cannot be determined
Not explicitly considered.
Some mild echoes of
fairness in the concept of
neutrality or freedom
from bias
Information More information is not
necessarily better. For example,
subjective information may be
useful to the accountee but
damaging to the accountor
More information is always
preferred to less as long
as it is cost effective
Records or reports Focus on both the reports and the
records upon which the reports
are based
Focus on the reports
Motivation of accountor Takes into explicit consideration
the accountor’s desire to present
information in the best possible
light
The role of accountors is
largely ignored
Source: Coy et al. (2001).
TERESA P. GORDON AND SALEHA B. KHUMAWALA270
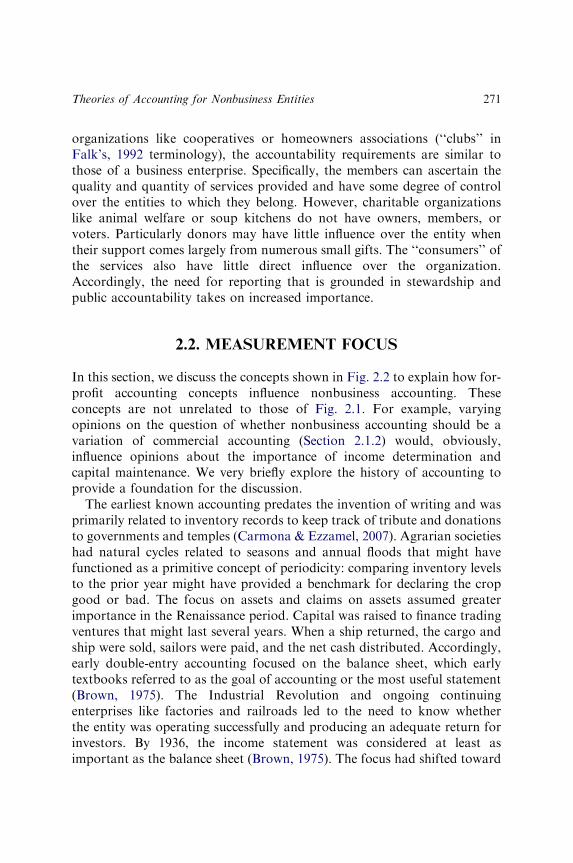
organizations like cooperatives or homeowners associations (‘‘clubs’’ inFalk’s, 1992 terminology), the accountability requirements are similar tothose of a business enterprise. Specifically, the members can ascertain thequality and quantity of services provided and have some degree of controlover the entities to which they belong. However, charitable organizationslike animal welfare or soup kitchens do not have owners, members, orvoters. Particularly donors may have little influence over the entity whentheir support comes largely from numerous small gifts. The ‘‘consumers’’ ofthe services also have little direct influence over the organization.Accordingly, the need for reporting that is grounded in stewardship andpublic accountability takes on increased importance.
2.2. MEASUREMENT FOCUS
In this section, we discuss the concepts shown in Fig. 2.2 to explain how for-profit accounting concepts influence nonbusiness accounting. Theseconcepts are not unrelated to those of Fig. 2.1. For example, varyingopinions on the question of whether nonbusiness accounting should be avariation of commercial accounting (Section 2.1.2) would, obviously,influence opinions about the importance of income determination andcapital maintenance. We very briefly explore the history of accounting toprovide a foundation for the discussion.
The earliest known accounting predates the invention of writing and wasprimarily related to inventory records to keep track of tribute and donationsto governments and temples (Carmona & Ezzamel, 2007). Agrarian societieshad natural cycles related to seasons and annual floods that might havefunctioned as a primitive concept of periodicity: comparing inventory levelsto the prior year might have provided a benchmark for declaring the cropgood or bad. The focus on assets and claims on assets assumed greaterimportance in the Renaissance period. Capital was raised to finance tradingventures that might last several years. When a ship returned, the cargo andship were sold, sailors were paid, and the net cash distributed. Accordingly,early double-entry accounting focused on the balance sheet, which earlytextbooks referred to as the goal of accounting or the most useful statement(Brown, 1975). The Industrial Revolution and ongoing continuingenterprises like factories and railroads led to the need to know whetherthe entity was operating successfully and producing an adequate return forinvestors. By 1936, the income statement was considered at least asimportant as the balance sheet (Brown, 1975). The focus had shifted toward
Theories of Accounting for Nonbusiness Entities 271
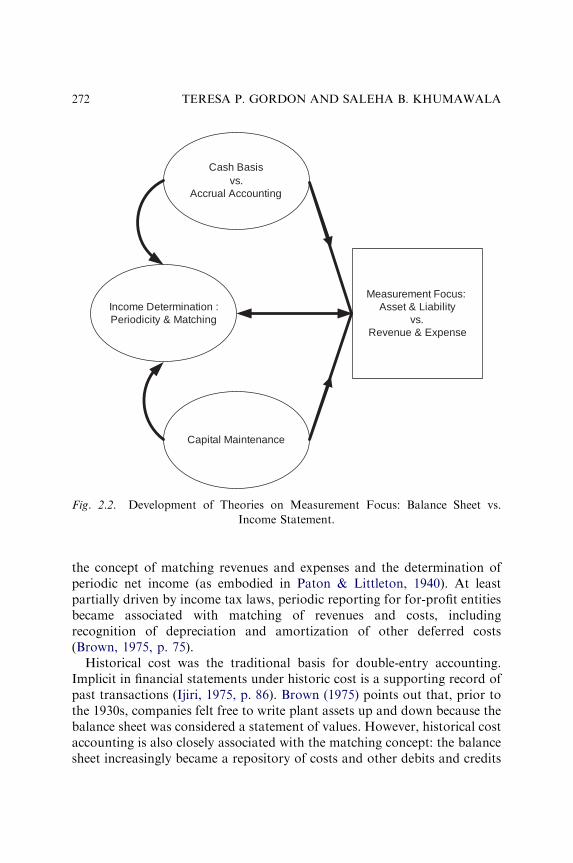
the concept of matching revenues and expenses and the determination ofperiodic net income (as embodied in Paton & Littleton, 1940). At leastpartially driven by income tax laws, periodic reporting for for-profit entitiesbecame associated with matching of revenues and costs, includingrecognition of depreciation and amortization of other deferred costs(Brown, 1975, p. 75).
Historical cost was the traditional basis for double-entry accounting.Implicit in financial statements under historic cost is a supporting record ofpast transactions (Ijiri, 1975, p. 86). Brown (1975) points out that, prior tothe 1930s, companies felt free to write plant assets up and down because thebalance sheet was considered a statement of values. However, historical costaccounting is also closely associated with the matching concept: the balancesheet increasingly became a repository of costs and other debits and credits
Income Determination : Periodicity & Matching
Measurement Focus:Asset & Liability
vs.Revenue & Expense
Capital Maintenance
Cash Basisvs.
Accrual Accounting
Fig. 2.2. Development of Theories on Measurement Focus: Balance Sheet vs.
Income Statement.
TERESA P. GORDON AND SALEHA B. KHUMAWALA272
that had not yet appeared on the profit and loss statement. Thus the balancesheet became less useful as attention shifted to measuring revenues andexpenses. The underlying reason is the inherent articulation of the financialstatements produced under double-entry bookkeeping. Currently the focusof reporting has been shifting back toward direct measurement of assets andliabilities under FASB’s conceptual framework.
2.2.1. Income Determination and Accrual Accounting
Nonbusiness entities, like commercial businesses, have continuity ofexistence that makes periodic reporting necessary. For colleges anduniversities, Bruegman and Brighton (1963, p. 769) argue that the academicyear provides a natural time span that serves to match revenues and costswithout any real need for accruals. A similar assertion might be made forentities that make annual assessments of taxes. However, even if true incertain circumstances, the choice of an ‘‘accounting period’’ is probably asarbitrary for most nonbusiness entities as it would be for a for-profitcorporation. Theoretically, information about what has transpired eachyear is desirable for stewardship, public accountability, or decisionusefulness objectives. All models examined in Chapters 3 through 6 inSection II provide some type of statement that resembles a traditional profitand loss report. The purpose is not to show a profit or surplus per se, but toprovide financial statement readers information useful in determiningwhether there had been erosion in capital or net assets.
Pye (1957, p. 618) argues that one of the differences between business andnonbusiness entities is the ‘‘inverted aspects of the purpose of costs andrevenue.’’ In commercial accounting, a cost outlay generally precedes therealization of revenue. In nonbusiness accounting, costs are typicallyincurred to provide services but there can be no outlay unless revenue hasbeen secured (Herbert, 1948). This ‘‘inversion’’ is related to the traditionalemphasis on cash or a modified cash basis for nonbusiness accounting. Sincenonbusiness goods and services cannot be provided unless resources areavailable, balance sheets emphasized liquidity by segregating currentunrestricted funds from less liquid endowment or plant funds. The use offund accounting is a matter of stewardship over sets of assets that arerestricted or unavailable for immediate use. Reporting on a fund basis,however, led to lengthy and (often) confusing financial statements. None ofthe models presented in Chapters 3 through 6 in Section II use fund
Theories of Accounting for Nonbusiness Entities 273
reporting although Anthony’s model (Chapter 5) has remnants (i.e., thereare separate operating statements and contributed capital statements).
The debate over the fundamental elements that should be measured isdiscussed in Storey and Storey (1998). It is closely related to historic debateson whether income statements should be all-inclusive (clean surplus) orfocus on current operating performance with some changes in assets orliabilities reported only on the balance sheet (dirty surplus) (Kiger &Williams, 1977).1 Under the influential Paton and Littleton monograph(1940), the focus was on measurement of revenues and expenses to determinenet income. FASB’s conceptual framework project made assets andliabilities the controlling definitions (FASB, 1985, Concepts Statement No.6) and defined comprehensive income (the all-inclusive approach to incomestatements). This was a fundamental change from the earlier emphasis onaccounting as a process of measuring and matching revenues and expenses.Under the asset-liability approach, revenues and expenses are indirectlymeasured as changes in assets and liabilities. Of the models explored in laterchapters, only Anthony argues that the controlling definitions are revenuesand costs: revenues and expenses should be directly measured.
For nonbusiness entities, Pye (1957) argues that matching revenues andexpenses provides no indication of achievement. Although measurement ofearnings is not the goal of nonbusiness accounting, users desire informationon performance during a period. FASB Statement 117 permits intermediatesubtotals on the statement of activities but has not defined the meaning ofoperating versus nonoperating revenues and expenses. The lack of ameaningful operating measure is one of the ongoing criticisms of the FASBmodel: There is no way to answer the question, ‘‘Do operating revenuescover operating expenses?’’ (Herzlinger, 1996, p. 103). This key questioncould, arguably, be answered if statements were prepared under the Anthonyor Mautz models. Unlike FASB, the GASB does provide an operatingmeasure in its examples of college and university financial statements(GASB, 1999b, Statement No. 35) but it is almost always negative by defini-tion since appropriations and gifts are considered nonoperating.
2.2.2. Capital Maintenance
The determination of periodic income cannot be isolated from capitalmaintenance. The concept of capital maintenance originated in theearly 19th century (Salvary, 1979, pp. 366–369) as partnerships gave wayto joint-stock companies. Disclosure of a balance sheet on a periodic basis
TERESA P. GORDON AND SALEHA B. KHUMAWALA274
was a monitoring system made explicit in the British Joint Stock CompaniesAct of 1844. In response to the need to measure income, the early 20thcentury brought debates on whether capital maintenance should be based onmonetary amounts or preservation of productive capacity (Lee, 1983). Thedebate is still relevant today as we move ever further from historical coststoward notions of ‘‘fair value’’ accounting that embody concepts of currentcost and replacement costs.
In its original conceptual framework, FASB specifically endorsed mainte-nance of financial capital rather than physical capital (FASB, 1984,Concepts Statement No. 5, Paragraph 45). Anthony also endorses main-tenance of financial equity for both business and nonbusiness entities andconsiders the process equivalent to what GASB refers to as interperiodequity (Anthony 1989, pp. 45–46). Anthony argues that FASB’s ‘‘changes innet assets’’ for not-for-profit entities is not an equivalent concept becauseit mixes income from operations with changes in contributed capital(permanently restricted net assets). GASB (2007) is still developing itsconceptual framework, but its definition of assets in Concepts StatementNo. 4 hints that maintenance of service capacity might be a future directionrelevant to intergenerational equity. In contrast, Mautz (1994) makes adistinction between assets and service facilities. Only the former is measuredand could enter into the concept for ‘‘maintenance of net assets.’’ AlthoughMautz’s Statement of Commitments could be used to project expendituresneeded to maintain service capacity, his Statement of Net Assets could onlybe used as an indication of the maintenance of financial or operating equity.
2.2.3. Depreciation and Heritage Assets
The Industrial Revolution led to major investments in plant and equipment,which in turn led to recognition that such assets require maintenance andeventual replacement. However, the concept of recognizing a provision fordepreciation did not arise until the middle of the 19th century and it wasoriginally related to valuation. Early authorities argued that no depreciationin value would occur if assets were properly maintained and replaced.However, recognition of depreciation expense became increasingly impor-tant as part of income determination. Courts in both the United States andthe United Kingdom decided that depreciation expense or maintenanceexpenses, but not both, were permissible (Woodward, 1956). To a largeextent, our current ideas for recognizing periodic depreciation expense arethe result of income tax laws.
Theories of Accounting for Nonbusiness Entities 275
Nonbusiness entities may also have substantial investments in propertyand equipment (termed ‘‘capital assets’’ by governments). Since incomemeasurement is not necessarily the focus of nonbusiness accounting,recognition of depreciation (and even the related assets) was not consideredparticularly relevant for many years. In addition, assets like parks andbridges are unlikely to be sold and therefore have no realistic market value.Municipal accounting began to diverge from commercial accounting in theearly part of the 20th century because it would be difficult to taxcitizens enough to cover both debt retirement and depreciation on thesame capital assets (Potts, 1982). By the 1940s, it had become commonpractice to keep track of capital assets in a separate ‘‘account group.’’ EarlyNFP accounting practices also tended to keep land, buildings, andequipment at original historical cost in a separate fund. Exceptions weremade for income-producing assets like dormitories that were depreciated(e.g., Morey, 1932, p. 57; Frisbee, 1930, p. 220). In general, it was felt thatincluding the value of plant assets among liquid assets would be misleadingrather than beneficial. However, systematic allocation of long-lived assetshad reached most NFP organizations by the 1970s. The American Instituteof Certified Public Accountant’s (AICPA) audit guides for hospitals (1972),and voluntary health and welfare organizations (AICPA, 1967) bothrequired organizations to record depreciation on long-lived tangible assets.The college and university audit guide (AICPA, 1973) permitted but did notrequire depreciation on institutional assets. The AICPA (1978), Statementof Position 78-10, which covered all other not-for-profit organizations,required depreciation on long-lived assets other than landmarks, monu-ments, cathedrals, historical treasures, etc. Except for enterprise funds,governmental units were not required to recognize depreciation expenseuntil GASB Statement No. 34 (GASB, 1999a) was phased in over the firstfew years of the 21st century.
For nonbusiness accounting, heritage assets are particularly troublesome.These are assets with historical, artistic, scientific, or environmental qualitiesthat are held and maintained because of their contribution to knowledgeand culture. Examples include national parks, archeological sites, andmuseum collections of art or artifacts. Valuation is difficult because many ofthese artifacts are unique. The Rosetta Stone that led to the decipherment ofEgyptian hieroglyphs is an extreme example discussed in the InternationalPublic Sector Accounting Standards Board’s (2006) consultation paper onheritage assets. The historical cost of this priceless artifact some twocenturies after its 1801 acquisition by the British Museum would have littlerelevance. In many cases, the cost to estimate current value of collections
TERESA P. GORDON AND SALEHA B. KHUMAWALA276
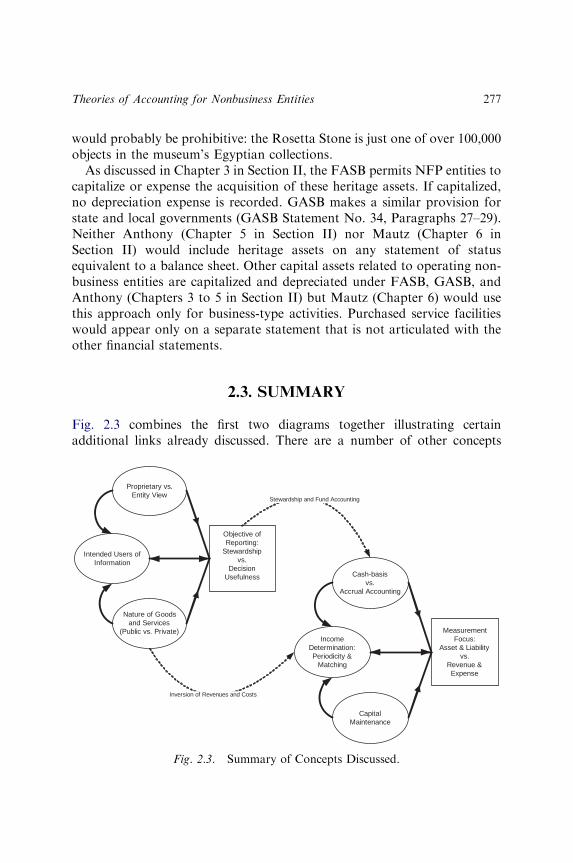
would probably be prohibitive: the Rosetta Stone is just one of over 100,000objects in the museum’s Egyptian collections.
As discussed in Chapter 3 in Section II, the FASB permits NFP entities tocapitalize or expense the acquisition of these heritage assets. If capitalized,no depreciation expense is recorded. GASB makes a similar provision forstate and local governments (GASB Statement No. 34, Paragraphs 27–29).Neither Anthony (Chapter 5 in Section II) nor Mautz (Chapter 6 inSection II) would include heritage assets on any statement of statusequivalent to a balance sheet. Other capital assets related to operating non-business entities are capitalized and depreciated under FASB, GASB, andAnthony (Chapters 3 to 5 in Section II) but Mautz (Chapter 6) would usethis approach only for business-type activities. Purchased service facilitieswould appear only on a separate statement that is not articulated with theother financial statements.
2.3. SUMMARY
Fig. 2.3 combines the first two diagrams together illustrating certainadditional links already discussed. There are a number of other concepts
Intended Users of Information
Proprietary vs. Entity View
Nature of Goods and Services
(Public vs. Private)
Objective of Reporting:
Stewardship vs.
Decision Usefulness
Income Determination: Periodicity &
Matching
Cash-basisvs.
Accrual Accounting
Capital Maintenance
Measurement Focus:
Asset & Liability vs.
Revenue & Expense
Stewardship and Fund Accounting
Inversion of Revenues and Costs
Fig. 2.3. Summary of Concepts Discussed.
Theories of Accounting for Nonbusiness Entities 277
that could be discussed including uniformity, conservatism, and materiality.However, the concepts illustrated in Fig. 2.3 are ones that help us discuss thesimilarities and differences between existing and proposed alternativeframeworks for NFP accounting. The FASB model is based on a decisionusefulness framework with a focus on direct measurement of assets andliabilities that produces an all-inclusive statement of activities. The GASBmodel is based on a public accountability framework that retains elements ofboth accrual and cash-basis procedures. The Anthony model focuses onmatching and measurement of revenues and expenses with a careful dis-tinction between operating performance and changes in contributed capital.The target audience for statements prepared under the Mautz model is tax-payers and donors. The focus is on current operating performance with fore-casts of future costs. As we compare the example statements in each chapter,we refer back to some of the underlying concepts that led to the differences.
NOTE
1. For-profit accounting eventually developed a dual presentation that is intendedto provide both through the addition of a statement of comprehensive income (SFASNo. 130, FASB 1997).
REFERENCES
American Institute of Certified Public Accountants (AICPA). (1967). Audits of voluntary health
and welfare organizations. (Industry Audit Guide). New York: American Institute of
Certified Public Accountants.
American Institute of Certified Public Accountants (AICPA). (1972). Hospital audit guide.
(Industry Audit Guide). New York: American Institute of Certified Public Accountants.
American Institute of Certified Public Accountants (AICPA). (1973). Audits of colleges and
universities. (Industry Audit Guide). New York: American Institute of Certified Public
Accountants.
American Institute of Certified Public Accountants (AICPA). (1978). Statement of position
78–10. Accounting principles and reporting practices for certain nonprofit organizations.
New York: American Institute of Certified Public Accountants.
Anthony, R. N. (1978). Financial accounting in nonbusiness organizations: An exploratory study
of conceptual issues. Stamford, CT: Financial Accounting Standards Board.
Anthony, R. N. (1983). Tell it like it was: A conceptual framework for financial accounting.
Homewood, IL: Richard D. Irwin, Inc.
Anthony, R. N. (1989). Should business and nonbusiness accounting be different? Boston, MA:
Harvard Business School Press.
Basu, S., & Waymire, G. B. (2006). Recordkeeping and human evolution. Accounting Horizons,
20(3), 201–229.
TERESA P. GORDON AND SALEHA B. KHUMAWALA278
Brown, C. D. (1975). The emergence of income reporting. International Journal of Accounting,
10(1), 85–107. (Reprinted in E. N. Coffman, R. H. Tondkar and G. J. Previts (eds.)
Historical Perspectives of Selected Financial Accounting Topics. Homewood, IL: Irwin,
1993, pp. 59–79).
Brown, R. G., & Johnston, K. S. (1963). Paciolo on accounting. New York: McGraw-Hill
Book Co.
Bruegman, D. C., & Brighton, G. D. (1963). Institutional accounting – How it differs from
commercial accounting. The Accounting Review, 38(4), 764–770.
Carmona, S., & Ezzamel, M. (2007). Accounting and accountability in ancient civilizations:
Mesopotamia and ancient Egypt. Accounting, Auditing & Accountability Journal, 20(2),
177–209.
Chen, R. S. (1975). Social and financial stewardship. The Accounting Review, 50(3), 533–543.
Coy, D., Fischer, M., & Gordon, T. G. (2001). Beyond decision usefulness: A new approach
for college and university annual reports. Critical Perspectives on Accounting, 12(1),
1–34.
Falk, H. (1992). Towards a framework for not-for-profit accounting. Contemporary Accounting
Research, 8(2), 468–499.
Financial Accounting Standards Board (FASB). (1978). Statement of financial accounting
concepts (SFAC) No. 1 – Objectives of financial reporting by nonbusiness organizations.
Norwalk, CT: Financial Accounting Standards Board.
Financial Accounting Standards Board (FASB). (1980). Statement of financial accounting
concepts (SFAC) No. 4 – Objectives of financial reporting by nonbusiness organizations.
Norwalk, CT: Financial Accounting Standards Board.
Financial Accounting Standards Board (FASB). (1984). Statement of financial accounting
concepts (SFAC) No. 5 – Objectives of financial reporting by nonbusiness organizations.
Norwalk, CT: Financial Accounting Standards Board.
Financial Accounting Standards Board (FASB). (1985). Statement of financial accounting
concepts (SFAC) No. 6 – Elements of financial statements. Norwalk, CT: Financial
Accounting Standards Board.
Financial Accounting Standards Board (FASB). (1997). Statement of financial accounting
standards (SFAS) No. 130 – Reporting comprehensive income. Norwalk, CT: Financial
Accounting Standards Board.
Frisbee, I. N. (1930). Problems in presenting the financial condition of an endowed college or
university. The Accounting Review, 5(3), 215–222.
Governmental Accounting Standards Board (GASB). (1987). Concepts statement No. 1 –
Objectives of financial reporting (May). Norwalk, CT: Governmental Accounting
Standards Board.
Governmental Accounting Standards Board (GASB). (1999a). Statement 34. Basic financial
statements – and management’s discussion and analysis – for state and local governments
(June). Norwalk, CT: Governmental Accounting Standards Board.
Governmental Accounting Standards Board (GASB). (1999b). Statement 35. Basic financial
statements – and management’s discussion and analysis – for public colleges and
universities – an amendment of GASB statement No. 34. Norwalk, CT: Governmental
Accounting Standards Board.
Governmental Accounting Standards Board (GASB). (2006).Why governmental accounting and
financial reporting is – and should be – different. White Paper. Available at www.gasb.org
8/1/07.
Theories of Accounting for Nonbusiness Entities 279
Governmental Accounting Standards Board (GASB). (2007). Concepts statement No. 4 –
Elements of financial statements. Norwalk, CT: Governmental Accounting Standards
Board.
Herbert, L. (1948). Comparison between governmental and general accounting. The Accounting
Review, 23(4), 397–400.
Herzlinger, R. E. (1996). Can public trust in nonprofits and governments be restored? Harvard
Business Review, 74(2), 97–107.
Ijiri, Y. (1975). Theory of accounting measurement. Studies in Accounting Research No. 10.
Sarasota, FL: American Accounting Association.
Ijiri, Y. (1983). On the accountability-based conceptual framework of accounting. Journal of
Accounting and Public Policy, 2, 75–81.
International Public Sector Accounting Standards Board (IPSASB). (2006). Accounting for
Heritage Assets under the Accrual Basis of Accounting. Consultation Paper. Available
at http://www.ifac.org/PublicSector/ProjectHistory.php?ProjID ¼ 0061. Accessed on
8/2/07.
Jeavons, T. H. (1994). Stewardship revisited: Secular and sacred views of governance and
management. Nonprofit and Voluntary Sector Quarterly, 23(2), 107–122.
Jones, D., Scott, R., Kimbro, I., & Ingram, R. (1985). The needs of users of governmental
financial reports. Norwalk, CT: Governmental Accounting Standards Board.
Kiger, J. E., & Williams, J. R. (1977). An emerging concept of income presentation. Accounting
Historians Journal, 4(2), 63–77. (Reprinted in E. N. Coffman, R. H. Tondkar and G. J.
Previts (eds.) Historical Perspectives of Selected Financial Accounting Topics. Home-
wood, IL: Irwin, 1993, 80–93).
Lawrence, C., & Stewart, J. P. (1993). DR Scott’s conceptual framework. Accounting Historians
Journal, 20(2), 95–117.
Lee, T. A. (1983). The early debate on financial and physical capital. Accounting Historians
Journal, 10(1), 25–50. (Reprinted in E. N. Coffman, R. H. Tondkar and G. J. Previts
(eds.) Historical Perspectives of Selected Financial Accounting Topics. Homewood, IL:
Irwin, 1993, 195–218).
Littleton, A. C. (1933). Socialized accounts. The Accounting Review, 8(4), 267–272.
Mautz, R. K. (1989). Not-for-profit financial reporting: Another view. Journal of Accountancy,
168(2), 60–66.
Mautz, R. K. (1994). Financial reporting for nonprofit organizations: A fresh look. New York,
NY: Garland Publishing, Inc.
McMillan, J. H. (1988). Beyond value-added education: Improvement alone is not enough.
Journal of Higher Education, 59(5), 564–579.
Morey, L. (1932). Accounting procedures for universities and colleges. The Accounting Review,
7(2), 54–60.
Paton, W. A., & Littleton, A. C. (1940). An introduction to corporate accounting standards.
Sarasota, FL: American Accounting Association.
Peragallo, E. (1938). Origin and evolution of double entry bookkeeping. New York, NY:
American Institute of Publishing Company.
Potts, J. H. (1982). A brief history of property and depreciation accounting in municipal
accounting. Accounting Historians Journal, 9(1), 25–37.
Previts, G. J. (1984). Frameworks of American financial accounting thought: An historical
perspective to 1973. Accounting Historians Journal, 11(2), 1–17.
TERESA P. GORDON AND SALEHA B. KHUMAWALA280

Pye, M. L. (1957). Income determination and the non-profit institution. The Accounting Review,
32(4), 612–621.
Salvary, S. C. W. (1979). Tracing the development of a conceptual framework of accounting-a
Western European and North American linkage: A partial examination. In: E.
N. Coffman (Ed.), The Academy of Accounting Historians Working Paper Series,
(Vol. II, pp. 358–388).
Scott, DR. (1941). The basis for accounting principles. The Accounting Review, 16(4), 341–349.
Storey, R. K., & Storey, S. (1998). The framework of financial accounting standards. Special
report. Norwalk, CT: Financial Accounting Standards Board.
Woodward, P. D. (1956). Depreciation-the development of an accounting concept. The
Accounting Review, 31(1), 71–76. (Reprinted in E. N. Coffman, R. H. Tondkar and G. J.
Previts (eds.) Historical Perspectives of Selected Financial Accounting Topics. Home-
wood, IL: Irwin, 1993, 119–126).
Theories of Accounting for Nonbusiness Entities 281

This page intentionally left blank
CHAPTER 3
THE FASB MODEL
In the United States, private not-for-profit (NFP) accounting standards arecurrently established by the Financial Accounting Standards Board (FASB)while the accounting standards for NFP entities owned or controlled bystate and local governments are established by the GovernmentalAccounting Standards Board (GASB). This chapter briefly describes thehistorical developments that produced the current private NFP standardsand highlights key aspects of the standards including issues of particularrelevance to museums. The chapter ends with an illustrative example of thefinancial statements for a museum.
3.1. DEVELOPMENT OF NFP ACCOUNTING IN THE
UNITED STATES
The 1970s ushered in an era characterized by the ‘‘public right to know.’’The Commission on Private Philanthropy and Public Needs (formed in1973, it is often referred to as the Filer Commission) was the first steptoward a broad recognition of the growing importance and influence of thissector. The major recommendation with respect to accounting was that asingle set of uniform principles be developed for all nonbusiness organiza-tions. With many voices demanding change, the accounting profession andthe American Institute of Certified Public Accountants (AICPA) establisheda committee to develop accounting guidance for NFP organizations notcovered by the three existing audit guides. As a result of their work, theAmerican Institute of Certified Public Accountants (AICPA) Statement ofPosition (SOP) 78–10 was issued in 1978.
In the same year, the FASB accepted responsibility for nonbusinessaccounting in addition to its responsibility for business accounting. Its firstofficial action was the issuance of Statement of Financial AccountingStandards (SFAS) No. 32 in September 1979. This stopgap standard madethe existing audit guides and the AICPA SOP documents related to NFP
283
organizations ‘‘preferable accounting practices’’ pending the release of finalFASB standards on NFP accounting.
FASB’s formidable task was to reduce the wide range of practices alreadyin use. The four accounting guides differed from each other in 35 majorways (Anthony, 1989). FASB’s first step was Statement of FinancialAccounting Concepts (SFAC) No. 4 on the objectives of financial reportingby nonbusiness organizations issued in 1980. However, governmentsobjected to being under FASB’s jurisdiction and this ultimately led to thecreation of the GASB in 1984 to address the special concerns of state andlocal governmental entities. FASB retained jurisdiction over the accountingstandards for private NFP organizations. This controversial split inresponsibility meant that certain industry groups such as health care andhigher education might end up with different rules to follow depending onwhether they were for-profit, governmental, or NFP organizations.
In 1985, FASB incorporated NFP organizations into the ‘‘elements’’portion of its conceptual framework (SFAC No. 6). However, the conceptstatements do not establish accounting principles, which organizations mustfollow. They are intended to help FASB resolve accounting issues. With thecompletion of the conceptual framework, FASB was ready to add NFPorganizations to its agenda. In March 1986, five areas of inconsistentpractice were identified: (1) recognition of depreciation, (2) accounting forcontributions, (3) matters of financial statement display, (4) accounting forinvestments, and (5) consolidation issues for NFP organizations.
The initial topic to be resolved was depreciation. In August 1987, FASBissued its first standard that changed existing practices for NFP organiza-tions. SFAS No. 93 required NFP organizations to record depreciationexpense on most capital assets and was controversial enough that SFAS No.99 (issued September 1988) delayed its implementation date for a year and ahalf (to fiscal years beginning in 1990).
Nearly six years passed before other NFP standards were finalized.FASB’s major effort in establishing NFP accounting standards areembodied in Statements No. 116 and 117 (issued June 1993), which coverrecognition of contributions and financial statement format, respectively(FASB, 1993a). The fourth agenda item to be resolved was accounting forinvestments held by NFP organizations. SFAS No. 124 (issued November,1995) prescribes fair value accounting for investments in marketable equitysecurities and all debt securities. In June 1999, the Board resolved anotherrevenue recognition issue with the issuance of SFAS No. 136 – Transfers ofassets to a not-for-profit organization or charitable trust that raises or holdscontributions for others.
TERESA P. GORDON AND SALEHA B. KHUMAWALA284
The final agenda item on consolidation policies and procedures waspart of a proposed standard that would cover both for-profit and NFPentities. However in November 1999, the Board decided to undertake aproject on combinations of NFP organizations separate from its businesscombination project. In October 2006, the FASB issued two exposure draftsintended to improve the accounting and disclosures for mergers andacquisitions (M&A) by NFP organizations. The proposals reflect theBoard’s commitment to meet the reporting needs of the NFP communityand to ensure that financial statement users have access to decision-usefulinformation.
3.2. KEY ASPECTS OF THE FASB MODEL
FASB’s position appears to be that NFP accounting should differ from for-profit accounting only when justified by specific transactions or situationsthat warrant special consideration. Most standards are applicable to bothfor-profit and NFP entities including accounting for contingencies, leases,pensions, and other postretirement benefits.
So far, FASB has addressed three measurement issues unique to NFPentities. SFAS No. 116 provides guidance for accounting and reporting forcontributions. A key phrase used in this statement is ‘‘unconditionalpromise to give.’’ In general, contributions (both pledged and those actuallyreceived) are to be recorded as revenues by the recipient in the periodpromised. Contributions are classified as unrestricted unless the donorspecifies otherwise. Two types of restrictions are defined. Permanentrestrictions such as endowment fund contributions do not expire.Temporary restrictions are satisfied by the passage of time or by actionsof the organization, such as providing a program in accordance with thedonor’s wishes. When the support and revenues accounts are closed at theend of the period, the balance sheet accounts for unrestricted, temporarilyrestricted, or permanently restricted net assets are increased. After SFASNo. 116 was implemented, an issue arose as to whether organizations thatraise money on behalf of another entity should be able to recognize thedonations as revenue. In SFAS No. 136, the FASB decided that when anorganization accepts contributions from a donor and agrees to transfer theassets to, or use them on behalf of, a specific beneficiary, then it should notrecognize the donation as revenue or the subsequent distribution as anexpense.
The FASB Model 285
Regarding expense measurement, FASB decided that certain long-livedassets of cultural and historic interest do not need to be depreciated (SFASNo. 93). These are the same assets for which NFPs have a recognition choiceunder SFAS No. 116. Such assets may be capitalized or expensed.
The presentation of financial statements is governed by SFAS No. 117,which describes reporting formats, but does not state how the elements onthe statements should be valued. The main focus of the statements preparedunder this standard is the institution as a whole. Although considerableflexibility is permitted, the standard is intended to increase uniformity andcomparability. Under SFAS No. 117, reporting by fund type is not required.For most NFP organizations, there are three required statements: statementof financial position, statement of activities, and statement of cash flow.NFPs classified as voluntary health and welfare organizations are alsorequired to report a statement of functional expense that details the types ofexpenses (salaries, postage, etc.) included in the functional categories forprograms, fundraising, and management and general.
The statement of financial position reports the NFP entity’s assets andliabilities. The difference between the assets and liabilities is classified asunrestricted, temporarily restricted, and permanently restricted net assets.Assets and liabilities are classified as current and noncurrent or displayed inorder of nearness to conversion to cash (for assets) or nearness of maturityand use of cash (for liabilities). Long-lived assets are generally reported asnet of accumulated depreciation, although certain types of assets that do notdepreciate over time would be reported at historical cost (or estimated valueat date of donation).1
The statement of activities reports the change in net assets during theperiod. In this statement, separate columns or sections are used to displaythe changes by the three net asset classes. Revenues are presented bycategories such as contributions, government grants, and program servicefees in the appropriate column while expenses are reported only in theunrestricted column or section. Generally, expenses are categorized asprograms, fundraising, and management and general instead of ‘‘natural’’categories like salaries and rent. The immediate recognition of contributionsplus a requirement that expenses reduce unrestricted net assets makes itnecessary to recognize a reclassification of net assets when timing orprogram restrictions are satisfied. This ‘‘net assets released from restric-tions’’ item appears in the revenue section as a positive number in theunrestricted column and a negative number in the temporarily restrictedcolumn. Instead of a statement of activities, the equivalent information mayalso be provided in a two-statement format that presents unrestricted
TERESA P. GORDON AND SALEHA B. KHUMAWALA286
revenues and expenses in the first and other changes in each category of netassets in a second statement.
The required statement of cash flows is almost identical to the statementof cash flows prepared by business entities. The direct method is encouragedbut not required, and a schedule reconciling cash provided by operations tothe change in net assets must be included when the direct method is used.Permanently restricted contributions and contributions restricted for long-term purposes are included under ‘‘financing activities.’’ Noncash contribu-tions of long-lived assets or securities would be disclosed along with anyother noncash financing and investing activities.
3.3. THE FASB MODEL IN PRACTICE
Critics of the FASB model are largely concerned with the consequences ofthe current rules for temporarily restricted contributions. Anthony suggeststhat it would be less confusing to defer recognition of temporarily restrictedcontributions until the period when the restrictions have been satisfied(Anthony, 1989, 1995). This would better match revenues and expenses toprovide an indicator of how well the NFP has been managed financially. Forexample, capital gifts can disguise operating losses because the revenues arerecognized but there is no corresponding expense when the equipment orfacilities are acquired. Noncash in-kind contributions can lead to similarissues. An increase in inventory as the result of a donation, for example,might cause a food bank to show a surplus (increase in net assets) thatundermines its ability to raise the cash needed to pay salaries.2
FASB standards permit flexibility in display. For example, Fischer,Gordon, Greenlee, and Keating (2004) report that NFP colleges anduniversities often report a portion of investment income in a nonoperatingsection. Some of the institutions reported unrestricted contributions in bothoperating and nonoperating sections of the statement of activities. Thevarious presentations make comparability between organizations challen-ging since the footnotes may not clearly describe the criteria used. FASB’sdeliberate decision to not specify ‘‘what goes where’’ when an intermediatemeasure is reported was reaffirmed when it issued SFAS No. 158 onaccounting for pensions and other postretirement benefits (FASB, 2006).However, Health Care Organizations must report the other comprehensiveincome items outside the operating measure specified by the AICPA Auditand Accounting Guide, Health Care Organizations. All other NFPs may put
The FASB Model 287
the amounts where they please as long as they are on a separate line and notcommingled with expenses. Thus, a ‘‘gap’’ in uniformity for NFPaccounting and reporting is beginning to appear, reminiscent of thesituation before 1993 when generally accepted accounting principles(GAAP) differed depending on which AICPA audit guide was being used.
The required reporting of expenses by function (FASB, 1993b, Paragraph26) is a significant issue for both users and preparers of NFP financialstatements. FASB provides very limited guidance on cost accounting issuesof any type. However, good cost accounting is essential for the accurateclassification and reporting of expenses among program, fundraising andadministrative activities. Numerous studies based on Internal RevenueService (IRS) Form 990 data suggest that misreporting of expenses is widespread (e.g., Wing, Gordon, Hager, Pollak, & Rooney, 2006 and Krishnan,Yetman, & Yetman, 2006).
3.4. EXAMPLE FINANCIAL STATEMENTS
Many NFP organizations (churches, universities, etc.) own and maintainhistoric buildings and other artifacts of cultural and aesthetic value.Museums provide a unique opportunity to study some important issuesrelevant to nonbusiness organizations, namely, the capitalization anddepreciation of certain types of assets. The capital assets of a museum aredifferent in three ways from the capital assets typically held by business andother nonbusiness organizations (Peacock & Godfrey, 1976). First, the stockof artifacts is generally large in comparison to annual additions. Second, alarge portion of the artifacts is donated rather than purchased, and finally,many of the donated items are subject to implicit or explicit contractualrestrictions, which limit the ability of the institution to change thecomposition of its collection of artifacts. These artifacts, which are artistic,scientific, cultural, or historic in value are maintained for the benefit ofpresent and future generations, regardless of any particular ‘‘market value’’that could be assigned to the artifacts. Furthermore, the value of thesecollections is not ‘‘consumed’’ as visitors enjoy the exhibits.
To illustrate the FASB accounting standards for NFPs, we first obtainedthe financial statements of a major art museum. By analysis of the financialstatements, we re-created the underlying transactions with some simplifica-tions (e.g., to shorten the list of endowments). The results are representativeof the original figures, although we disguised the museum’s identity byrenaming programs and endowments. A complete description of all
TERESA P. GORDON AND SALEHA B. KHUMAWALA288
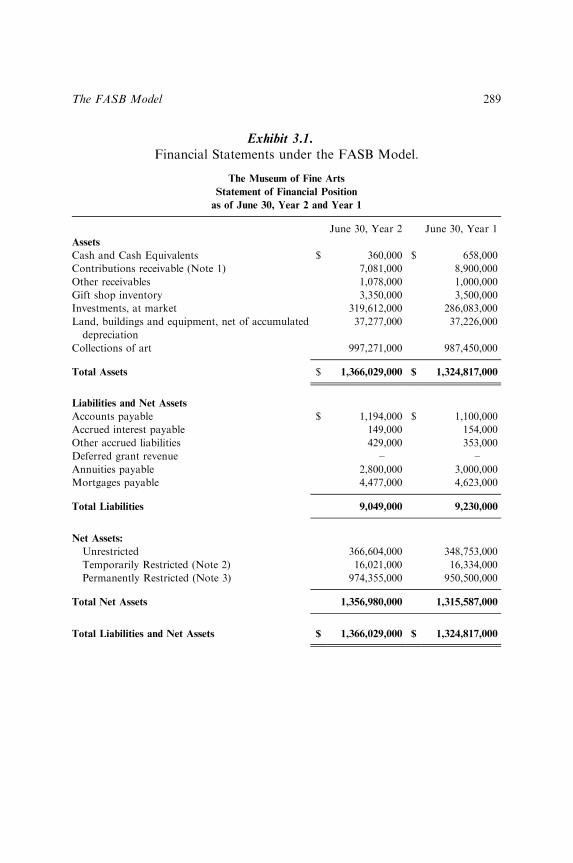
Exhibit 3.1.Financial Statements under the FASB Model.
The Museum of Fine Arts
Statement of Financial Position
as of June 30, Year 2 and Year 1
June 30, Year 2 June 30, Year 1
Assets
Cash and Cash Equivalents $ 360,000 $ 658,000
Contributions receivable (Note 1) 7,081,000 8,900,000
Other receivables 1,078,000 1,000,000
Gift shop inventory 3,350,000 3,500,000
Investments, at market 319,612,000 286,083,000
Land, buildings and equipment, net of accumulated
depreciation
37,277,000 37,226,000
Collections of art 997,271,000 987,450,000
Total Assets $ 1,366,029,000 $ 1,324,817,000
Liabilities and Net Assets
Accounts payable $ 1,194,000 $ 1,100,000
Accrued interest payable 149,000 154,000
Other accrued liabilities 429,000 353,000
Deferred grant revenue – –
Annuities payable 2,800,000 3,000,000
Mortgages payable 4,477,000 4,623,000
Total Liabilities 9,049,000 9,230,000
Net Assets:
Unrestricted 366,604,000 348,753,000
Temporarily Restricted (Note 2) 16,021,000 16,334,000
Permanently Restricted (Note 3) 974,355,000 950,500,000
Total Net Assets 1,356,980,000 1,315,587,000
Total Liabilities and Net Assets $ 1,366,029,000 $ 1,324,817,000
The FASB Model 289
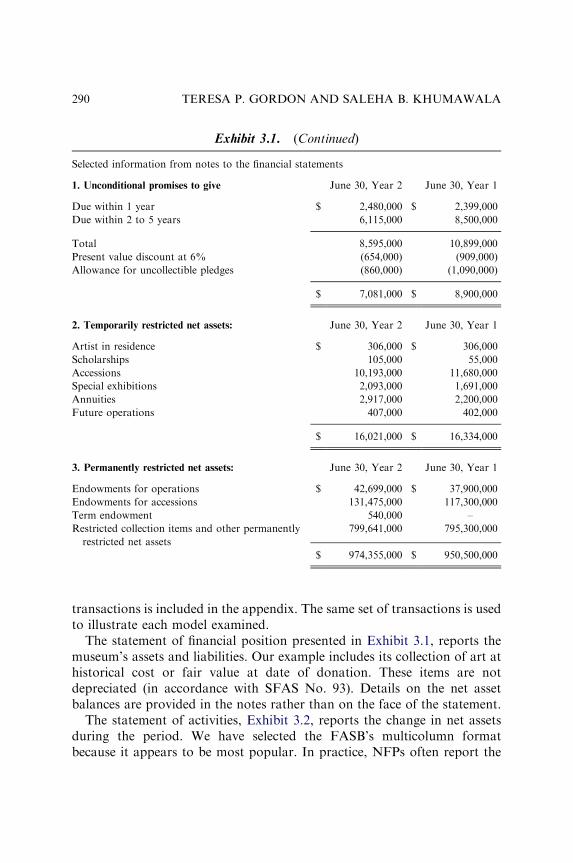
transactions is included in the appendix. The same set of transactions is usedto illustrate each model examined.
The statement of financial position presented in Exhibit 3.1, reports themuseum’s assets and liabilities. Our example includes its collection of art athistorical cost or fair value at date of donation. These items are notdepreciated (in accordance with SFAS No. 93). Details on the net assetbalances are provided in the notes rather than on the face of the statement.
The statement of activities, Exhibit 3.2, reports the change in net assetsduring the period. We have selected the FASB’s multicolumn formatbecause it appears to be most popular. In practice, NFPs often report the
Selected information from notes to the financial statements
1. Unconditional promises to give June 30, Year 2 June 30, Year 1
Due within 1 year $ 2,480,000 $ 2,399,000
Due within 2 to 5 years 6,115,000 8,500,000
Total 8,595,000 10,899,000
Present value discount at 6% (654,000) (909,000)
Allowance for uncollectible pledges (860,000) (1,090,000)
$ 7,081,000 $ 8,900,000
2. Temporarily restricted net assets: June 30, Year 2 June 30, Year 1
Artist in residence $ 306,000 $ 306,000
Scholarships 105,000 55,000
Accessions 10,193,000 11,680,000
Special exhibitions 2,093,000 1,691,000
Annuities 2,917,000 2,200,000
Future operations 407,000 402,000
$ 16,021,000 $ 16,334,000
3. Permanently restricted net assets: June 30, Year 2 June 30, Year 1
Endowments for operations $ 42,699,000 $ 37,900,000
Endowments for accessions 131,475,000 117,300,000
Term endowment 540,000 –
Restricted collection items and other permanently
restricted net assets
799,641,000 795,300,000
$ 974,355,000 $ 950,500,000
Exhibit 3.1. (Continued)
TERESA P. GORDON AND SALEHA B. KHUMAWALA290
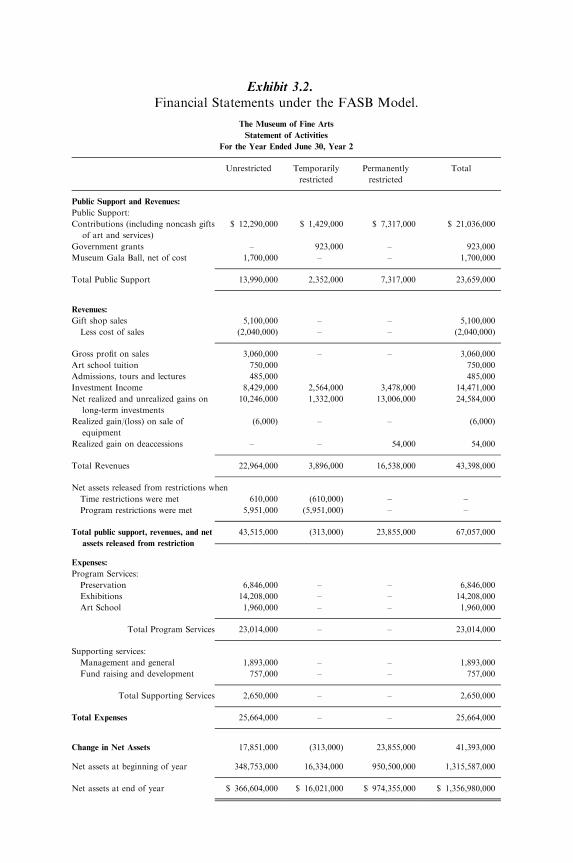
Exhibit 3.2.Financial Statements under the FASB Model.
The Museum of Fine Arts
Statement of Activities
For the Year Ended June 30, Year 2
Unrestricted Temporarily
restricted
Permanently
restricted
Total
Public Support and Revenues:
Public Support:
Contributions (including noncash gifts
of art and services)
$ 12,290,000 $ 1,429,000 $ 7,317,000 $ 21,036,000
Government grants – 923,000 – 923,000
Museum Gala Ball, net of cost 1,700,000 – – 1,700,000
Total Public Support 13,990,000 2,352,000 7,317,000 23,659,000
Revenues:
Gift shop sales 5,100,000 – – 5,100,000
Less cost of sales (2,040,000) – – (2,040,000)
Gross profit on sales 3,060,000 – – 3,060,000
Art school tuition 750,000 750,000
Admissions, tours and lectures 485,000 485,000
Investment Income 8,429,000 2,564,000 3,478,000 14,471,000
Net realized and unrealized gains on
long-term investments
10,246,000 1,332,000 13,006,000 24,584,000
Realized gain/(loss) on sale of
equipment
(6,000) – – (6,000)
Realized gain on deaccessions – – 54,000 54,000
Total Revenues 22,964,000 3,896,000 16,538,000 43,398,000
Net assets released from restrictions when
Time restrictions were met 610,000 (610,000) – –
Program restrictions were met 5,951,000 (5,951,000) – –
Total public support, revenues, and net
assets released from restriction
43,515,000 (313,000) 23,855,000 67,057,000
Expenses:
Program Services:
Preservation 6,846,000 – – 6,846,000
Exhibitions 14,208,000 – – 14,208,000
Art School 1,960,000 – – 1,960,000
Total Program Services 23,014,000 – – 23,014,000
Supporting services:
Management and general 1,893,000 – – 1,893,000
Fund raising and development 757,000 – – 757,000
Total Supporting Services 2,650,000 – – 2,650,000
Total Expenses 25,664,000 – – 25,664,000
Change in Net Assets 17,851,000 (313,000) 23,855,000 41,393,000
Net assets at beginning of year 348,753,000 16,334,000 950,500,000 1,315,587,000
Net assets at end of year $ 366,604,000 $ 16,021,000 $ 974,355,000 $ 1,356,980,000

Exhibit 3.3.Financial Statements under the FASB Model.
The Museum of Fine Arts
Statement of Cash Flows
For the year ended June 30, Year 2
Cash Flows from operating activities:
Cash received from contributors $ 12,215,000
Grants received 845,000
Net receipts from Gala Ball 1,700,000
Gift shop receipts 5,100,000
Other operating revenues 1,235,000
Interest and dividends received 8,429,000
Purchase of gift shop merchandise (1,796,000)
Cash paid to employees (11,000,000)
Cash paid to other suppliers (11,671,000)
Grants and scholarships paid (520,000)
Interest expense paid (462,000)
Net cash provided by operating activities $ 4,075,000
Cash flows used by investing activities:
Purchase of equipment (1,861,000)
Purchase of investments (58,824,000)
Purchase of artwork for collections (8,128,000)
Proceeds from deaccessions 361,000
Proceeds from the sale of investments 49,879,000
Proceeds from the sale of property 4,000
Net cash used by investing activities $ (18,569,000)
Cash flows from financing activities:
Proceeds from contributions restricted for
Investment in endowment-accessions 2,000,000
Investment in endowment-operations 6,000,000
Investment in term endowment 500,000
Other financing activities:
Investment income restricted for perm additions to collections 5,746,000
Interest and dividends restricted for reinvestment 296,000
Payments of annuity obligations (200,000)
Payments on notes payable (146,000)
Net cash provided by financing activities $ 14,196,000
Net increase in cash and cash equivalents (298,000)
Cash and cash equivalents, beginning of year 658,000
Cash and cash equivalents, end of year $ 360,000
TERESA P. GORDON AND SALEHA B. KHUMAWALA292
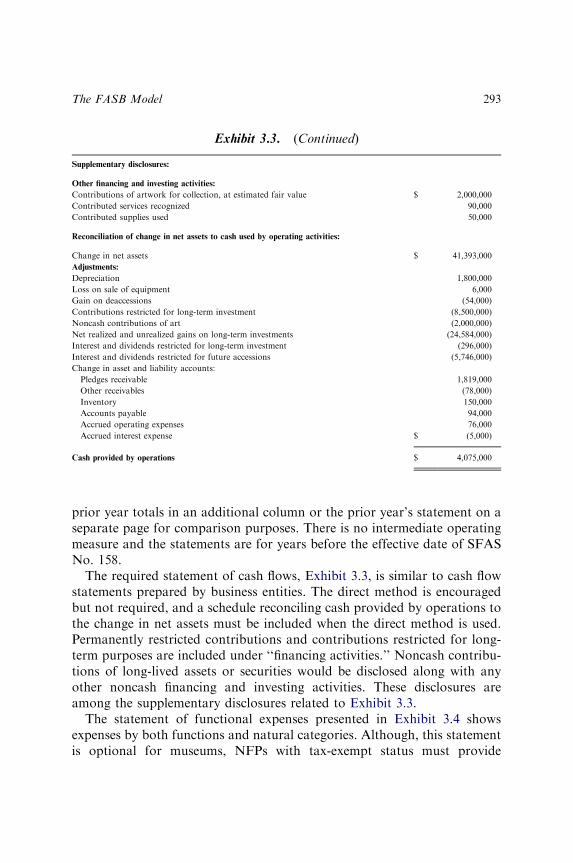
prior year totals in an additional column or the prior year’s statement on aseparate page for comparison purposes. There is no intermediate operatingmeasure and the statements are for years before the effective date of SFASNo. 158.
The required statement of cash flows, Exhibit 3.3, is similar to cash flowstatements prepared by business entities. The direct method is encouragedbut not required, and a schedule reconciling cash provided by operations tothe change in net assets must be included when the direct method is used.Permanently restricted contributions and contributions restricted for long-term purposes are included under ‘‘financing activities.’’ Noncash contribu-tions of long-lived assets or securities would be disclosed along with anyother noncash financing and investing activities. These disclosures areamong the supplementary disclosures related to Exhibit 3.3.
The statement of functional expenses presented in Exhibit 3.4 showsexpenses by both functions and natural categories. Although, this statementis optional for museums, NFPs with tax-exempt status must provide
Supplementary disclosures:
Other financing and investing activities:
Contributions of artwork for collection, at estimated fair value $ 2,000,000
Contributed services recognized 90,000
Contributed supplies used 50,000
Reconciliation of change in net assets to cash used by operating activities:
Change in net assets $ 41,393,000
Adjustments:
Depreciation 1,800,000
Loss on sale of equipment 6,000
Gain on deaccessions (54,000)
Contributions restricted for long-term investment (8,500,000)
Noncash contributions of art (2,000,000)
Net realized and unrealized gains on long-term investments (24,584,000)
Interest and dividends restricted for long-term investment (296,000)
Interest and dividends restricted for future accessions (5,746,000)
Change in asset and liability accounts:
Pledges receivable 1,819,000
Other receivables (78,000)
Inventory 150,000
Accounts payable 94,000
Accrued operating expenses 76,000
Accrued interest expense $ (5,000)
Cash provided by operations $ 4,075,000
Exhibit 3.3. (Continued)
The FASB Model 293
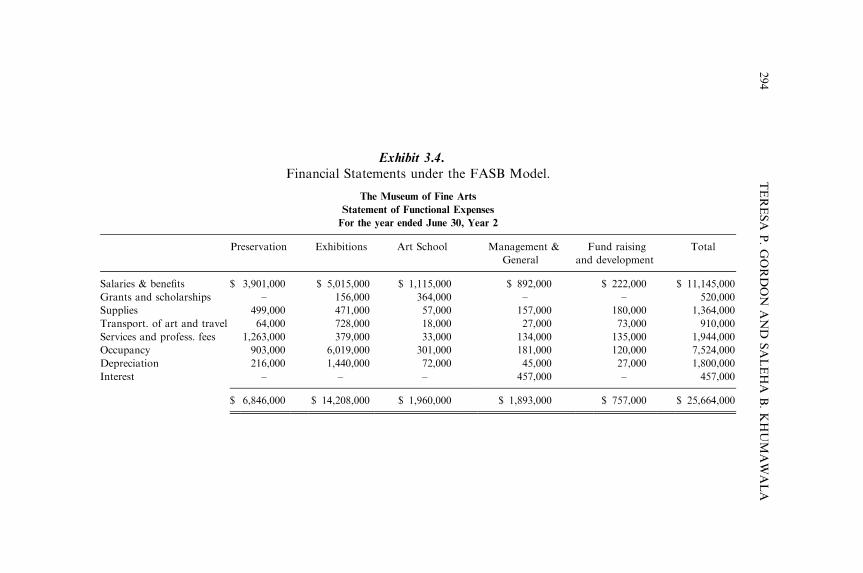
Exhibit 3.4.Financial Statements under the FASB Model.
The Museum of Fine Arts
Statement of Functional Expenses
For the year ended June 30, Year 2
Preservation Exhibitions Art School Management &
General
Fund raising
and development
Total
Salaries & benefits $ 3,901,000 $ 5,015,000 $ 1,115,000 $ 892,000 $ 222,000 $ 11,145,000
Grants and scholarships – 156,000 364,000 – – 520,000
Supplies 499,000 471,000 57,000 157,000 180,000 1,364,000
Transport. of art and travel 64,000 728,000 18,000 27,000 73,000 910,000
Services and profess. fees 1,263,000 379,000 33,000 134,000 135,000 1,944,000
Occupancy 903,000 6,019,000 301,000 181,000 120,000 7,524,000
Depreciation 216,000 1,440,000 72,000 45,000 27,000 1,800,000
Interest – – – 457,000 – 457,000
$ 6,846,000 $ 14,208,000 $ 1,960,000 $ 1,893,000 $ 757,000 $ 25,664,000
TERESA
P.GORDON
AND
SALEHA
B.KHUMAWALA
294
equivalent information in their IRS Form 990. The IRS recognizes that thestatement is useful in evaluating the reasonableness of cost allocations.
NOTES
1. See SFAS No. 93, Paragraph 6. Museums can choose to capitalize or notcapitalize their collections and this choice would apply to both donated andpurchased items (see SFAS No. 116, Paragraphs 11, 26 and 27).2. These are two examples from a major study of NFP costs conducted by the
Urban Institute and Indiana University (see http://nccsdataweb.urban.org/FAQ/index.php?category=40). Among the papers available on the web site is SpecialIssues in Nonprofit Financial Reporting: A Guide for Financial Professionals (2004),which offers suggestions on ways the identified issues might be ameliorated throughchoices in existing GAAP. Showing an intermediate ‘‘operating’’ subtotal on thestatement of activities is among the possibilities suggested.
REFERENCES
American Institute of Certified Public Accountants (AICPA). (1978). Statement of position no.
78–10: Accounting principles and reporting practices for certain nonprofit organizations.
New York: American Institute of Certified Public Accountants.
Anthony, R. N. (1989). Should business and nonbusiness accounting be different? Boston:
Harvard Business School Press.
Anthony, R. N. (1995). The nonprofit accounting mess. Accounting Horizons, 9(2), 44–53.
Financial Accounting Standards Board (FASB). (1979). Statement of financial accounting
standards (SFAS) no. 32 – Specialized accounting and reporting principles and practices in
AICPA statements of position and guides on accounting and auditing matters. Norwalk,
CT: Financial Accounting Standards Board.
Financial Accounting Standards Board (FASB). (1980). Statement of financial accounting
concepts (SFAC) no. 4 – Objectives of financial reporting by nonbusiness organizations.
Norwalk, CT: Financial Accounting Standards Board.
Financial Accounting Standards Board (FASB). (1985). Statement of financial accounting
concepts (SFAC) no. 6 – Elements of financial statements. Norwalk, CT: Financial
Accounting Standards Board.
Financial Accounting Standards Board (FASB). (1987). Statement of financial accounting
standards (SFAS) no. 93 – Recognition of depreciation by not-for-profit organizations.
Norwalk, CT: Financial Accounting Standards Board.
Financial Accounting Standards Board (FASB). (1988). Statement of financial accounting
standards (SFAS) no. 99 – Deferral of effective date of recognition of depreciation by not-
for-profit organizations. Norwalk, CT: Financial Accounting Standards Board.
Financial Accounting Standards Board (FASB). (1993a). Statement of financial accounting
standards no. 116 – Accounting for contributions received and made. Norwalk, CT:
Financial Accounting Standards Board.
The FASB Model 295

Financial Accounting Standards Board (FASB). (1993b). Statement of financial accounting
standards no. 117 – Financial statements of not-for-profit organizations. Norwalk, CT:
Financial Accounting Standards Board.
Financial Accounting Standards Board (FASB). (1995). Statement of financial accounting
standards (SFAS) no. 124 – Accounting for certain investments held by not-for-profit
organizations. Norwalk, CT: Financial Accounting Standards Board.
Financial Accounting Standards Board (FASB). (1999). Statement of financial accounting
standards (SFAS) no. 136 – Transfers of assets to a not-for-profit organization or
charitable trust that raises or holds contributions for others. Norwalk, CT: Financial
Accounting Standards Board.
Financial Accounting Standards Board (FASB). (2006). Statement of financial accounting
standards (SFAS) no. 158 – Employers’ accounting for defined benefit pension and other
postretirement plans – an amendment of FASB statements no. 87, 88, 106, and 132(R).
Norwalk, CT: Financial Accounting Standards Board.
Fischer, M., Gordon, T. P., Greenlee, J., & Keating, E. K. (2004). Measuring operations: An
analysis of the financial statements of U.S. private colleges and universities. Financial
Accountability and Management, 20(2), 0267–4424, 125–151.
Krishnan, R., Yetman, M. H., & Yetman, R. J. (2006). Expense misreporting in nonprofit
organizations. The Accounting Review, 81(2), 399–420.
Peacock, A. T., & Godfrey, C. (1976). The economics of museums and galleries. In: M. Blaug
(Ed.), Economics of the arts (pp. 189–204). Boulder, CO: Westview Press.
Urban Institute and Indiana University. (2004). Special issues in nonprofit accounting: A guide
for financial professionals. Available at http://nccsdataweb.urban.org/FAQ/index.php?
category=40 (accessed April 21, 2009).
Wing, K., Gordon, T., Hager, M., Pollak, T., & Rooney, P. (2006). Functional expense
reporting for nonprofits: The profession’s next scandal? The CPA Journal, 76(8), 14–18.
TERESA P. GORDON AND SALEHA B. KHUMAWALA296
CHAPTER 4
THE GASB MODEL
In the United States, accounting standards are established by three independentstandards-setting bodies with defined lines of authority: the Federal Account-ing Standards Advisory Board (FASAB), the Financial Accounting StandardsBoard (FASB), and the Governmental Accounting Standards Board (GASB).This arrangement recognizes the environmental differences for each category ofentities under the standards setters’ jurisdiction. The development of accou-nting standards for private not-for-profit entities by the FASB was discussed inChapter 3 of Section II. The development of accounting standards for state andlocal governmental entities is discussed in this chapter.1
4.1. DEVELOPMENT OF GOVERNMENTAL
ACCOUNTING IN THE UNITED STATES
In the late 19th century, local government accounting in the United Stateswas in a chaotic state with little uniformity. Auditing of records and accrualaccounting were both rare. Even budgeting was infrequently performed(Fleischman & Marquette, 1987, pp. 83–84). The period between 1890 and1920 saw a number of major reforms in the structure and conduct ofcity government with concurrent improvements in accounting systems. By1908, the use of budgetary accounts in municipal accounting was fairlywidespread and continued to evolve through the efforts of individualsincluding Frederick Cleveland and Lloyd Morey (Potts, 1977). In the earlyyears of the 20th century, a special committee of the National MunicipalLeague began to propound accounting standards for municipal accountingthat were followed by a growing number of cities. In 1913, the influentialHandbook of Municipal Accounting was published by the New York Bureauof Municipal Research (Morey, 1948, p. 227). The first textbook onmunicipal accounting was published the following year (Eggleston, 1914).By 1924, about 15 percent of surveyed universities had specialized courseson governmental accounting (Hackett, 1933).
297
The 1930s brought substantial increases in government expenditures dueto social programs intended to offset the effects of the Great Depression,including unemployment compensation and projects funded by the WorksProgress Administration and the Public Works Administration (Chatters,1939). Several studies of cities had shown defects in accounting systems,including the lack of balance sheets by fund (Hackett, 1933). In cooperationwith various national associations of public accountants and public financeofficials, the Municipal Finance Officers Association (MFOA)2 created theNational Committee on Municipal Accounting (NCMA) in 1934. In 1936,the Committee issued NCMA Bulletin No. 6 Municipal AccountingStatements. This document became the prototype for the widely used‘‘Blue Book.’’ Since 1968, the Blue Book is officially titled GovernmentalAccounting, Auditing, and Financial Reporting (GAAFR). Althoughmunicipal accounting for cities with more than 10,000 residents continuedto improve, improvements at the state government level were spotty andcounty governments fell even further behind (Chatters, 1939). In time, thewidespread recognition and acceptance of municipal accounting principlesled to improvements in state government accounting in the 1940s. Smalltowns, school districts, and counties continued to be deficient (Morey, 1948).
Following World War II, the National Committee on GovernmentalAccounting replaced the NCMA and published the 1951 version of the BlueBook (Gauthier, 2001). The various reforms in governmental accountingtended to bring practices into closer alignment with those used by businessentities. In fact, Hylton (1957, p. 52) argued that the failure to use accrualaccounting for fixed assets was the only major barrier to doing away withthe need for separate accounting principles for governmental entities.
The National Committee on Governmental Accounting was replaced bythe National Council on Governmental Accounting (NCGA) in 1974. Aswith its predecessors, the NCGA was sponsored by the MFOA but, ratherthan revise the Blue Book, it chose to issue its own authoritative guidancethrough statements and interpretations. The Blue Book became an‘‘unofficial’’ guide for implementation of the authoritative standards of theNCGA and later the GASB (Gauthier, 2001).
Under the NCGA and its predecessors, governmental entities used fundaccounting to segregate restricted resources, and thus the financial state-ments were prepared with a stewardship focus that required multiple fundsto assure proper control over government resources. Depreciation was notrecognized in government fund types and neither fixed assets nor long-termliabilities were reported on the balance sheets. Proprietary fund types(enterprise and internal service) used accrual accounting including depreciation
TERESA P. GORDON AND SALEHA B. KHUMAWALA298
expense. The reporting tended to be voluminous and there were manydifferences between governmental and for-profit accounting standards.
By 1980, the FASB had concluded that a single integrated conceptualframework for financial accounting and reporting would adequately serveboth business and nonbusiness organizations. However, governmentalorganizations preferred a dedicated standard setting process and a separatestandard-setting body for governmental entities was already in thediscussion stage at the Financial Accounting Foundation (FAF). Accord-ingly, FASB deferred its decision on whether Concepts Statement No.4,‘‘Objectives of Financial Reporting by Nonbusiness Organizations’’ (FASB,1980) would apply to local governments. In 1984, the GASB became areality, operating under the FAF in a manner parallel to the FASB.
The original division of responsibilities made GASB’s statements ‘‘mostauthoritative’’ for state and local government entities. However, if GASBhad no statement on a particular topic, state and local government entitieswere directed to follow FASB standards, as the ‘‘next most authoritative’’source. During the period 1984–1991, this jurisdictional split causeddifficulties. Whenever FASB issued a new pronouncement (even if FASBhad not considered the governmental environment nor intended the rules toapply to governmental entities), GASB was forced to consider the need toissue a ‘‘negative’’ standard instructing state and local governments to notfollow the new FASB rules. For example, when FASB issued SFAS No. 93‘‘Recognition of Depreciation by Not-for-Profit Organizations’’ in August,1987, GASB acted promptly to exempt government-controlled institutions(GASB Statement No. 8, January 1988).
By 1989 (the time of its mandated five-year review), GASB had completedtwo codifications, ten statements, and one concepts statement in addition tonumerous research reports, discussion memorandums, and exposure drafts.As a result of the review, the FAF clarified the jurisdictional lines betweenits two standard-setting bodies. GASB and FASB were to have primaryauthority and responsibility for the organizations within their respectivejurisdictions. Accordingly, state and local governments had to follow GASBrules but would not have to follow new FASB pronouncements (issued afterNovember 1989) unless instructed to do so by GASB.
This new arrangement clarified the situation for auditors and others but thedivided jurisdiction for standard setting has the potential to be a continuingproblem for certain industries. Preparers and users of financial statements ofcolleges and universities, hospitals, museums, and social service organizationsmust be aware of the differences in the standards for governmental andprivate institutions. FASB’s standards on not-for-profit accounting apply to
The GASB Model 299
private colleges, museums, and so forth, while comparable governmentalinstitutions follow GASB’s standards. Likewise, FASB’s standards on for-profit accounting apply to many for-profit health care organizations, whileprivate not-for-profit hospitals follow not-for-profit standards and govern-mental health care entities follow GASB’s standards. All these differentstandards complicate comparisons among similar organizations. If FASB andGASB standards had turned out to be similar or if the two boards hadcoordinated their efforts, the comparability problem would have been lessproblematic. Since differences exist and appear to be expanding, users may beconfused. Before the jurisdictional split, most decision makers who usedcollege and university financial statements expressed a strong preference forhaving one set of accounting standards that would apply to both private andpublic institutions of higher education (Engstrom, 1988).
4.2. KEY ASPECTS OF THE GASB MODEL
Since its inception in 1984, the GASB worked to create a new financialreporting model for state and local government entities. The long awaitedmodel for government accounting is largely embodied in GASB StatementNo. 34, published in 1999.
GASB (1999a), Statement No. 34 is not based on a comprehensive conce-ptual framework. However, the GASB continues to work on its frameworkand added Concepts Statement No. 4 in 2007. Elements of Financial Statementsdefines the basic elements of state and local government financial statements.The definitions of assets and liabilities are different than those described byFASB. For example, the GASB definition of assets is based on service capacityrather than economic resources and some of the GASB elements are unique.3
As with the FASB conceptual framework, the GASB’s concepts statementsprovide a foundation to guide the Board’s future development of accountingand financial reporting standards. Over time, newly formulated concepts maylead to additional changes in the governmental reporting model.
4.2.1. Presentation of Financial Information – The Dual Perspective
Owing to political pressures that always accompany due process standardsetting efforts, the road to the new reporting model was lengthy and theoutcome not uniformly welcomed. The GASB determined that thetraditional focus on stewardship was still appropriate and necessary.
TERESA P. GORDON AND SALEHA B. KHUMAWALA300
Therefore, the familiar fund-based statements (with some modifications) arestill prepared and reported. However, a new accrual-basis entity-wide setof financial statements was added. The combination of these two sets ofdistinctly different financial statements is referred to as a ‘‘dual perspective.’’
The first perspective comprises the traditional fund statements to provide adetailed presentation of the financial position of the funds using a modified-accrual basis and current financial resources measurement focus. The fundsperspective includes two financial statements: the balance sheet and thestatement of revenues, expenditures, and changes in fund balances. Thesestatements focus on currently spendable resources, claims requiring currentlyspendable resources, and changes in the currently spendable resources.
The second perspective, referred to as the government-wide financialstatements, provides a condensed consolidated view. This set of statementsis prepared on the accrual basis of accounting (similar to commercialaccounting principles) and includes both long-term assets and liabilities.There are two required government-wide financial statements: the statementof net assets and the statement of activities. Together, they presentinformation about the reporting government as a whole, distinguishingbetween the total primary government and its discreetly presentedcomponent units as well as between the primary government’s governmentalactivities and business-type activities. These aggregated financial statementsfocus on total (economic) resources and the change in total resources ratherthan the traditional focus on currently spendable (financial) resources.
A reconciliation is required to explain the differences between thestatement of revenues, expenditures, and changes in fund balance and thestatement of activities. A second reconciliation is provided to explainthe differences between the balance sheet and the statement of net assets.Consequently, the two perspectives are considered to be one set of basicfinancial statements under GASB Statement No. 34.
4.2.2. Revenue Recognition and Net Asset Classes
GASB issued Statement No. 33 on revenue recognition for nonexchangetransactions (including contributions) in 1998.4 Although there is no one-to-one mapping of terms between the FASB (1993a), Statement No. 116 andGASB (1998), Statement No. 33, Gordon, Khumawala, and Parsons (2002)clarify the differences in terminology. Table 4.1 compares FASB’s terms tothe equivalent GASB terms and Table 4.2 compares the revenue recognitioncriteria (tables are derived from Gordon et al., 2002).
The GASB Model 301
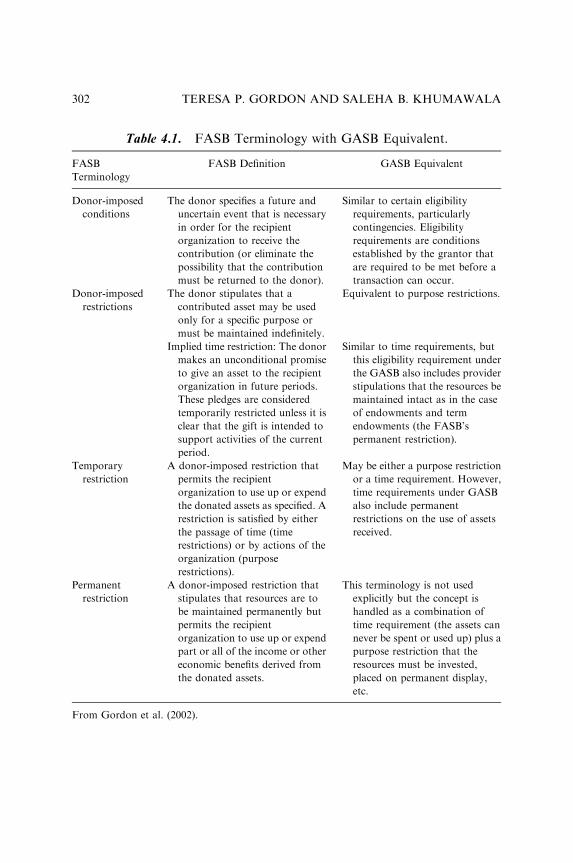
Table 4.1. FASB Terminology with GASB Equivalent.
FASB
Terminology
FASB Definition GASB Equivalent
Donor-imposed
conditions
The donor specifies a future and
uncertain event that is necessary
in order for the recipient
organization to receive the
contribution (or eliminate the
possibility that the contribution
must be returned to the donor).
Similar to certain eligibility
requirements, particularly
contingencies. Eligibility
requirements are conditions
established by the grantor that
are required to be met before a
transaction can occur.
Donor-imposed
restrictions
The donor stipulates that a
contributed asset may be used
only for a specific purpose or
must be maintained indefinitely.
Equivalent to purpose restrictions.
Implied time restriction: The donor
makes an unconditional promise
to give an asset to the recipient
organization in future periods.
These pledges are considered
temporarily restricted unless it is
clear that the gift is intended to
support activities of the current
period.
Similar to time requirements, but
this eligibility requirement under
the GASB also includes provider
stipulations that the resources be
maintained intact as in the case
of endowments and term
endowments (the FASB’s
permanent restriction).
Temporary
restriction
A donor-imposed restriction that
permits the recipient
organization to use up or expend
the donated assets as specified. A
restriction is satisfied by either
the passage of time (time
restrictions) or by actions of the
organization (purpose
restrictions).
May be either a purpose restriction
or a time requirement. However,
time requirements under GASB
also include permanent
restrictions on the use of assets
received.
Permanent
restriction
A donor-imposed restriction that
stipulates that resources are to
be maintained permanently but
permits the recipient
organization to use up or expend
part or all of the income or other
economic benefits derived from
the donated assets.
This terminology is not used
explicitly but the concept is
handled as a combination of
time requirement (the assets can
never be spent or used up) plus a
purpose restriction that the
resources must be invested,
placed on permanent display,
etc.
From Gordon et al. (2002).
TERESA P. GORDON AND SALEHA B. KHUMAWALA302
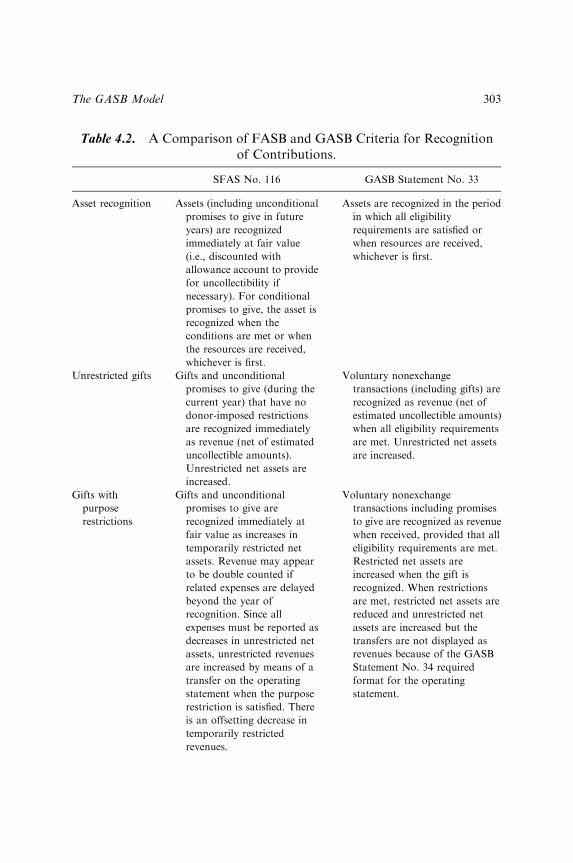
Table 4.2. A Comparison of FASB and GASB Criteria for Recognitionof Contributions.
SFAS No. 116 GASB Statement No. 33
Asset recognition Assets (including unconditional
promises to give in future
years) are recognized
immediately at fair value
(i.e., discounted with
allowance account to provide
for uncollectibility if
necessary). For conditional
promises to give, the asset is
recognized when the
conditions are met or when
the resources are received,
whichever is first.
Assets are recognized in the period
in which all eligibility
requirements are satisfied or
when resources are received,
whichever is first.
Unrestricted gifts Gifts and unconditional
promises to give (during the
current year) that have no
donor-imposed restrictions
are recognized immediately
as revenue (net of estimated
uncollectible amounts).
Unrestricted net assets are
increased.
Voluntary nonexchange
transactions (including gifts) are
recognized as revenue (net of
estimated uncollectible amounts)
when all eligibility requirements
are met. Unrestricted net assets
are increased.
Gifts with
purpose
restrictions
Gifts and unconditional
promises to give are
recognized immediately at
fair value as increases in
temporarily restricted net
assets. Revenue may appear
to be double counted if
related expenses are delayed
beyond the year of
recognition. Since all
expenses must be reported as
decreases in unrestricted net
assets, unrestricted revenues
are increased by means of a
transfer on the operating
statement when the purpose
restriction is satisfied. There
is an offsetting decrease in
temporarily restricted
revenues.
Voluntary nonexchange
transactions including promises
to give are recognized as revenue
when received, provided that all
eligibility requirements are met.
Restricted net assets are
increased when the gift is
recognized. When restrictions
are met, restricted net assets are
reduced and unrestricted net
assets are increased but the
transfers are not displayed as
revenues because of the GASB
Statement No. 34 required
format for the operating
statement.
The GASB Model 303
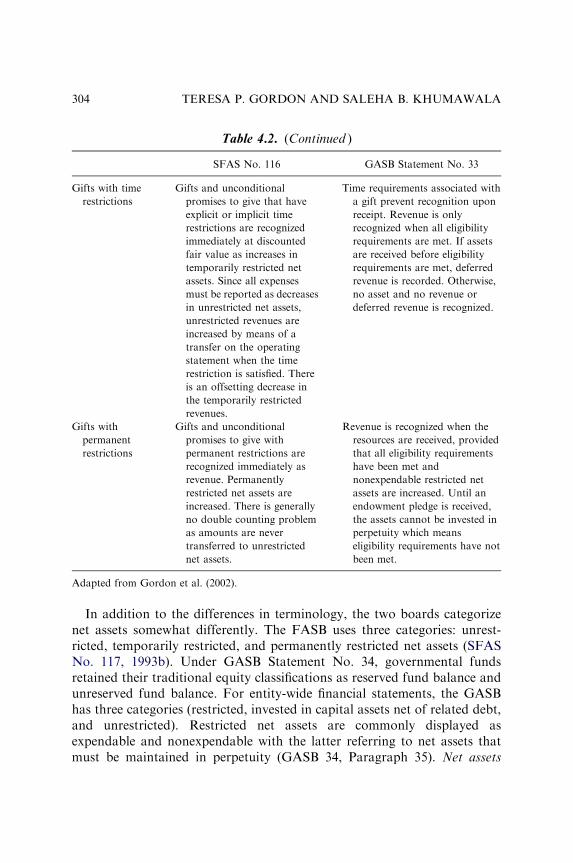
In addition to the differences in terminology, the two boards categorizenet assets somewhat differently. The FASB uses three categories: unrest-ricted, temporarily restricted, and permanently restricted net assets (SFASNo. 117, 1993b). Under GASB Statement No. 34, governmental fundsretained their traditional equity classifications as reserved fund balance andunreserved fund balance. For entity-wide financial statements, the GASBhas three categories (restricted, invested in capital assets net of related debt,and unrestricted). Restricted net assets are commonly displayed asexpendable and nonexpendable with the latter referring to net assets thatmust be maintained in perpetuity (GASB 34, Paragraph 35). Net assets
Table 4.2. (Continued )
SFAS No. 116 GASB Statement No. 33
Gifts with time
restrictions
Gifts and unconditional
promises to give that have
explicit or implicit time
restrictions are recognized
immediately at discounted
fair value as increases in
temporarily restricted net
assets. Since all expenses
must be reported as decreases
in unrestricted net assets,
unrestricted revenues are
increased by means of a
transfer on the operating
statement when the time
restriction is satisfied. There
is an offsetting decrease in
the temporarily restricted
revenues.
Time requirements associated with
a gift prevent recognition upon
receipt. Revenue is only
recognized when all eligibility
requirements are met. If assets
are received before eligibility
requirements are met, deferred
revenue is recorded. Otherwise,
no asset and no revenue or
deferred revenue is recognized.
Gifts with
permanent
restrictions
Gifts and unconditional
promises to give with
permanent restrictions are
recognized immediately as
revenue. Permanently
restricted net assets are
increased. There is generally
no double counting problem
as amounts are never
transferred to unrestricted
net assets.
Revenue is recognized when the
resources are received, provided
that all eligibility requirements
have been met and
nonexpendable restricted net
assets are increased. Until an
endowment pledge is received,
the assets cannot be invested in
perpetuity which means
eligibility requirements have not
been met.
Adapted from Gordon et al. (2002).
TERESA P. GORDON AND SALEHA B. KHUMAWALA304
invested in capital assets net of related debt are comprised of capital assets(including restricted capital assets), reduced by the balance of borrowingsattributable to the acquisition of capital assets.
4.3. EXAMPLE FINANCIAL STATEMENTS
The illustrative financial statements are prepared using the set oftransactions that we developed in Chapter 3 of Section II for a not-for-profit museum but under the assumption that the museum is public and doesits accounting in accordance with GASB standards. Special-purposegovernments that operate and budget multiple programs are required topresent separate financial statements under GASB Statement No. 34. Therequired set of statements differs depending on whether the special-purposegovernment has several government-type activities or has both business- andgovernment-type activities (Paragraphs 135–137). If a special-purposegovernment has only business-type activities, it reports following enterprisefund practices (Paragraph 138). We illustrate both approaches in the nextsections since, in practice, we have observed museums reporting as special-purpose entities engaged in governmental activities as well as special-purpose entities engaged in business activities.5
4.3.1. General-Purpose Government Reporting
If the museum were engaged in governmental activities it would report thesame statements required of a general-purpose government like a city orcounty. Under this model, there are two statements prepared from an entity-wide perspective plus two statements prepared from a funds perspective.GASB Statement No. 34 shows a variety of possible formats for both theentity-wide and funds-based statements.
The two statements prepared with the entity-wide perspective arepresented in Exhibits 4.1 and 4.2. The statement of net assets is essentiallya balance sheet prepared on the accrual basis. Exhibit 4.1 follows a formatsimilar to illustration A-3 in GASB Statement No. 34. The statement ofactivities consolidates the activities of the various fund types but follows theaccrual basis instead of the modified accrual basis of accounting. The formatshown is similar to illustration B-3 in GASB Statement No. 34. We selectedthis example because it provides information similar to that found in acombination of a FASB statement of activities and a statement of functionalexpenses. This makes the accounting differences between our illustrations of
The GASB Model 305
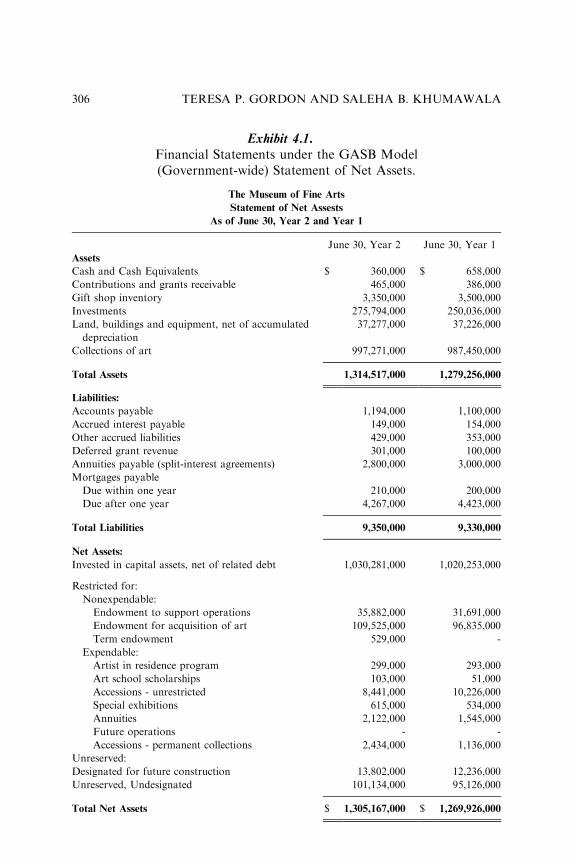
Exhibit 4.1.Financial Statements under the GASB Model(Government-wide) Statement of Net Assets.
The Museum of Fine Arts
Statement of Net Assests
As of June 30, Year 2 and Year 1
June 30, Year 2 June 30, Year 1
Assets
Cash and Cash Equivalents $ 360,000 $ 658,000
Contributions and grants receivable 465,000 386,000
Gift shop inventory 3,350,000 3,500,000
Investments 275,794,000 250,036,000
Land, buildings and equipment, net of accumulated
depreciation
37,277,000 37,226,000
Collections of art 997,271,000 987,450,000
Total Assets 1,314,517,000 1,279,256,000
Liabilities:
Accounts payable 1,194,000 1,100,000
Accrued interest payable 149,000 154,000
Other accrued liabilities 429,000 353,000
Deferred grant revenue 301,000 100,000
Annuities payable (split-interest agreements) 2,800,000 3,000,000
Mortgages payable
Due within one year 210,000 200,000
Due after one year 4,267,000 4,423,000
Total Liabilities 9,350,000 9,330,000
Net Assets:
Invested in capital assets, net of related debt 1,030,281,000 1,020,253,000
Restricted for:
Nonexpendable:
Endowment to support operations 35,882,000 31,691,000
Endowment for acquisition of art 109,525,000 96,835,000
Term endowment 529,000 -
Expendable:
Artist in residence program 299,000 293,000
Art school scholarships 103,000 51,000
Accessions - unrestricted 8,441,000 10,226,000
Special exhibitions 615,000 534,000
Annuities 2,122,000 1,545,000
Future operations - -
Accessions - permanent collections 2,434,000 1,136,000
Unreserved:
Designated for future construction 13,802,000 12,236,000
Unreserved, Undesignated 101,134,000 95,126,000
Total Net Assets $ 1,305,167,000 $ 1,269,926,000
TERESA P. GORDON AND SALEHA B. KHUMAWALA306
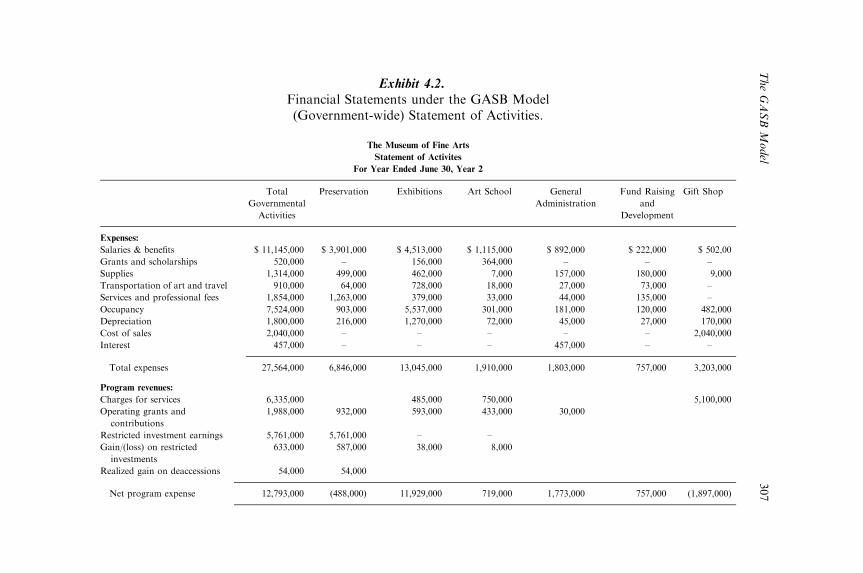
Exhibit 4.2.Financial Statements under the GASB Model(Government-wide) Statement of Activities.
The Museum of Fine Arts
Statement of Activites
For Year Ended June 30, Year 2
Total
Governmental
Activities
Preservation Exhibitions Art School General
Administration
Fund Raising
and
Development
Gift Shop
Expenses:
Salaries & benefits $ 11,145,000 $ 3,901,000 $ 4,513,000 $ 1,115,000 $ 892,000 $ 222,000 $ 502,00
Grants and scholarships 520,000 – 156,000 364,000 – – –
Supplies 1,314,000 499,000 462,000 7,000 157,000 180,000 9,000
Transportation of art and travel 910,000 64,000 728,000 18,000 27,000 73,000 –
Services and professional fees 1,854,000 1,263,000 379,000 33,000 44,000 135,000 –
Occupancy 7,524,000 903,000 5,537,000 301,000 181,000 120,000 482,000
Depreciation 1,800,000 216,000 1,270,000 72,000 45,000 27,000 170,000
Cost of sales 2,040,000 – – – – – 2,040,000
Interest 457,000 – – – 457,000 – –
Total expenses 27,564,000 6,846,000 13,045,000 1,910,000 1,803,000 757,000 3,203,000
Program revenues:
Charges for services 6,335,000 485,000 750,000 5,100,000
Operating grants and
contributions
1,988,000 932,000 593,000 433,000 30,000
Restricted investment earnings 5,761,000 5,761,000 – –
Gain/(loss) on restricted
investments
633,000 587,000 38,000 8,000
Realized gain on deaccessions 54,000 54,000
Net program expense 12,793,000 (488,000) 11,929,000 719,000 1,773,000 757,000 (1,897,000)
TheGASBModel
307

General revenues:
Grants and contributions not
restricted to specific
programs
10,950,000
Contributions to endowment 8,500,000
Fair value of donated artwork 2,000,000
Investment earnings
(unrestricted)
8,429,000
Investment income restricted to
annuities and term
endowments
281,000
Gain/(loss) on investments not
restricted to specific
programs
6,974,000
Gain/(loss) on endowment
investments and annuities
9,206,000
Gain/(loss) on disposal of
equipment
(6,000)
Museum Gala Ball, net of costs 1,700,000
Total general revenues 48,034,000
Transfers
Change in net assets 35,241,000
Net assets - beginning 1,269,926,000
Net assets - ending $ 1,305,167,000
Exhibit 4.2. (Contuinued )
Total
Governmental
Activities
Preservation Exhibitions Art School General
Administration
Fund Raising
and
Development
Gift Shop
TERESA
P.GORDON
AND
SALEHA
B.KHUMAWALA
308
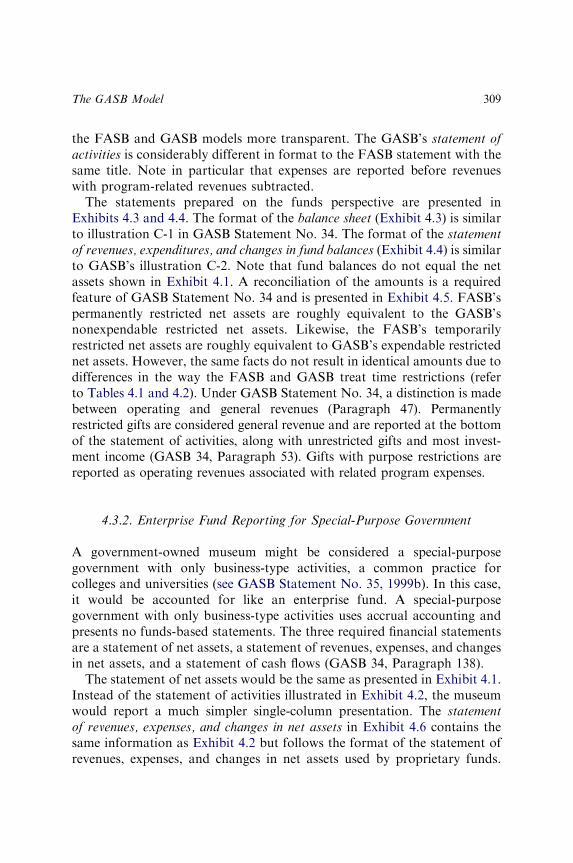
the FASB and GASB models more transparent. The GASB’s statement ofactivities is considerably different in format to the FASB statement with thesame title. Note in particular that expenses are reported before revenueswith program-related revenues subtracted.
The statements prepared on the funds perspective are presented inExhibits 4.3 and 4.4. The format of the balance sheet (Exhibit 4.3) is similarto illustration C-1 in GASB Statement No. 34. The format of the statementof revenues, expenditures, and changes in fund balances (Exhibit 4.4) is similarto GASB’s illustration C-2. Note that fund balances do not equal the netassets shown in Exhibit 4.1. A reconciliation of the amounts is a requiredfeature of GASB Statement No. 34 and is presented in Exhibit 4.5. FASB’spermanently restricted net assets are roughly equivalent to the GASB’snonexpendable restricted net assets. Likewise, the FASB’s temporarilyrestricted net assets are roughly equivalent to GASB’s expendable restrictednet assets. However, the same facts do not result in identical amounts due todifferences in the way the FASB and GASB treat time restrictions (referto Tables 4.1 and 4.2). Under GASB Statement No. 34, a distinction is madebetween operating and general revenues (Paragraph 47). Permanentlyrestricted gifts are considered general revenue and are reported at the bottomof the statement of activities, along with unrestricted gifts and most invest-ment income (GASB 34, Paragraph 53). Gifts with purpose restrictions arereported as operating revenues associated with related program expenses.
4.3.2. Enterprise Fund Reporting for Special-Purpose Government
A government-owned museum might be considered a special-purposegovernment with only business-type activities, a common practice forcolleges and universities (see GASB Statement No. 35, 1999b). In this case,it would be accounted for like an enterprise fund. A special-purposegovernment with only business-type activities uses accrual accounting andpresents no funds-based statements. The three required financial statementsare a statement of net assets, a statement of revenues, expenses, and changesin net assets, and a statement of cash flows (GASB 34, Paragraph 138).
The statement of net assets would be the same as presented in Exhibit 4.1.Instead of the statement of activities illustrated in Exhibit 4.2, the museumwould report a much simpler single-column presentation. The statementof revenues, expenses, and changes in net assets in Exhibit 4.6 contains thesame information as Exhibit 4.2 but follows the format of the statement ofrevenues, expenses, and changes in net assets used by proprietary funds.
The GASB Model 309

Exhibit 4.3.Financial Statements under the GASB Model
Balance Sheet (Fund basis).
The Museum of Fine Arts
Balance Sheet
As of June 30, Year 2 and Year 1
General and Special
Purpose
Expendable Funds
Non
Expendable
Funds
June 30,
Year 2 Total
June 30,
Year 1 Total
Assets
Cash and cash equivalents $ 360,000 $ – $ 720,000 $ 658,000
Other receivables (grants) 158,000 316,000 200,000
Due from other funds – – –
Gift shop inventory 3,350,000 6,700,000 3,500,000
Investments, at market 127,424,000 148,370,000 403,218,000 250,036,000
Total Assets 131,292,000 148,370,000 410,954,000 254,394,000
Liabilities:
Accounts payable 1,194,000 – 2,388,000 1,100,000
Other accrued liabilities 429,000 858,000 353,000
Deferred grant revenue 301,000 602,000 100,000
Total Liabilities 1,924,000 – 3,848,000 1,553,000
Fund balances:
Restricted for:
Nonexpendable:
Endowment to support
operations
35,882,000 35,882,000 31,691,000
Endowment for acquisition
of art
109,525,000 109,525,000 96,835,000
Term endowment 529,000 529,000 –
Expendable:
Artist in residence program 299,000 598,000 293,000
Art school scholarships 76,000 152,000 24,000
Accessions – general 8,269,000 16,538,000 10,136,000
Special exhibitions 507,000 1,014,000 465,000
Annuities 4,922,000 9,844,000 4,545,000
Future operations – – –
Accessions – permanent – 2,434,000 2,434,000 1,136,000
Reserved for inventories 3,350,000 6,700,000 3,500,000
Reserved for future construction 13,802,000 27,604,000 12,236,000
Unrestricted 98,143,000 196,286,000 91,980,000
Total Fund Balances 129,368,000 148,370,000 407,106,000 252,841,000
Total Liabilities and Fund
Balances
$ 131,292,000 $ 148,370,000 $ 410,954,000 $ 254,394,000
TERESA P. GORDON AND SALEHA B. KHUMAWALA310
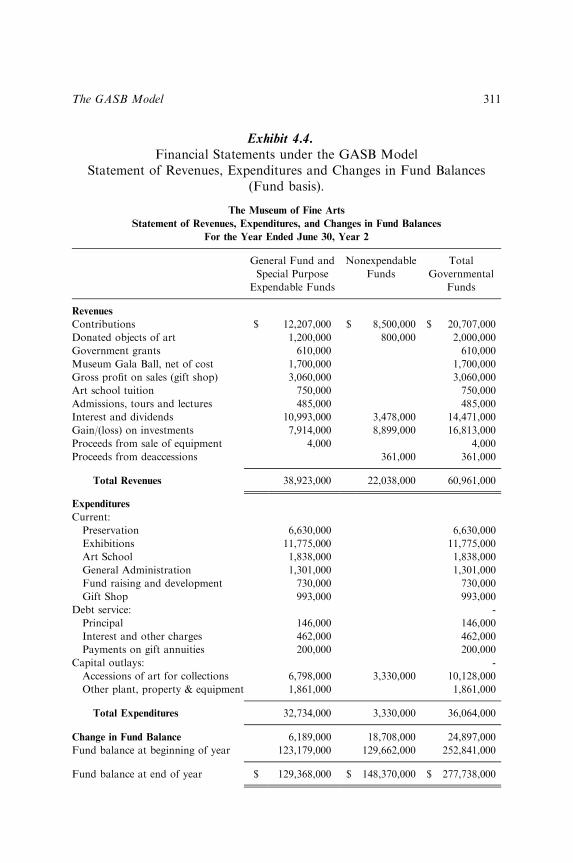
Exhibit 4.4.Financial Statements under the GASB Model
Statement of Revenues, Expenditures and Changes in Fund Balances(Fund basis).
The Museum of Fine Arts
Statement of Revenues, Expenditures, and Changes in Fund Balances
For the Year Ended June 30, Year 2
General Fund and
Special Purpose
Expendable Funds
Nonexpendable
Funds
Total
Governmental
Funds
Revenues
Contributions $ 12,207,000 $ 8,500,000 $ 20,707,000
Donated objects of art 1,200,000 800,000 2,000,000
Government grants 610,000 610,000
Museum Gala Ball, net of cost 1,700,000 1,700,000
Gross profit on sales (gift shop) 3,060,000 3,060,000
Art school tuition 750,000 750,000
Admissions, tours and lectures 485,000 485,000
Interest and dividends 10,993,000 3,478,000 14,471,000
Gain/(loss) on investments 7,914,000 8,899,000 16,813,000
Proceeds from sale of equipment 4,000 4,000
Proceeds from deaccessions 361,000 361,000
Total Revenues 38,923,000 22,038,000 60,961,000
Expenditures
Current:
Preservation 6,630,000 6,630,000
Exhibitions 11,775,000 11,775,000
Art School 1,838,000 1,838,000
General Administration 1,301,000 1,301,000
Fund raising and development 730,000 730,000
Gift Shop 993,000 993,000
Debt service: -
Principal 146,000 146,000
Interest and other charges 462,000 462,000
Payments on gift annuities 200,000 200,000
Capital outlays: -
Accessions of art for collections 6,798,000 3,330,000 10,128,000
Other plant, property & equipment 1,861,000 1,861,000
Total Expenditures 32,734,000 3,330,000 36,064,000
Change in Fund Balance 6,189,000 18,708,000 24,897,000
Fund balance at beginning of year 123,179,000 129,662,000 252,841,000
Fund balance at end of year $ 129,368,000 $ 148,370,000 $ 277,738,000
The GASB Model 311

Exhibit 4.5.Financial Statements under the GASB Model Reconciliation Schedules.
The Museum of Fine Arts
Reconciliation of the Statement of Revenues, Expenditures, and Changes in
Fund Balances of Government Funds to the Statement of Activities
Year ended June 30, Year 2
General Fund and
Special Purpose
Expendable Funds
Nonexpendable
Funds
Total
Governmental
Funds
Change in fund balance for year
(from Statement of Revenues,
Expenditures and Changes in
Fund Balances)
$ 6,189,000 $ 18,708,000 $ 24,897,000
Amounts reported in the statement of
activities are different from amounts
reported in the statement of
revenues, expenditures and changes
in fund balance are different
because:
Government funds report capital
outlays as expenditures. However,
in the statement of activities, the
cost of those assets is allocated
over their estimated useful lives as
depreciation expense. This is the
amount by which capital outlays
exceed depreciation in the current
period.
6,859,000 3,330,000 10,189,000
In the statement of activities, only
the gain or loss on the sale of
plant, property, equipment and
collections is reported. In
government funds, the proceeds
of the sale increase financial
resources, thus the change in net
assets differs from the change in
fund balance by the cost of the
assets sold.
(10,000) (307,000) (317,000)
Repayment of bond principal and
other long-term debt is an
expenditure of the government
funds, but the repayment reduces
long-term liabilities in the
statement of net assets. This is the
reduction of principal during the
year.
146,000 – 146,000
TERESA P. GORDON AND SALEHA B. KHUMAWALA312
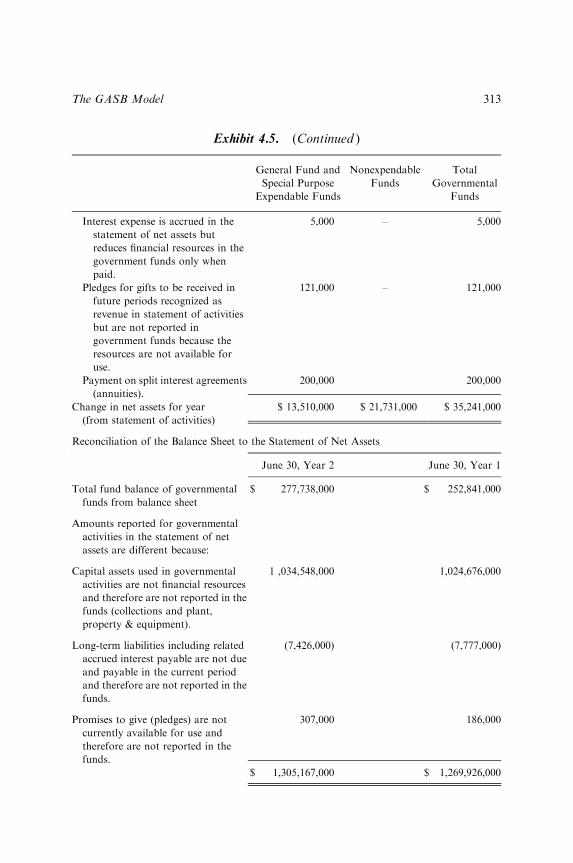
Interest expense is accrued in the
statement of net assets but
reduces financial resources in the
government funds only when
paid.
5,000 – 5,000
Pledges for gifts to be received in
future periods recognized as
revenue in statement of activities
but are not reported in
government funds because the
resources are not available for
use.
121,000 – 121,000
Payment on split interest agreements
(annuities).
200,000 200,000
Change in net assets for year
(from statement of activities)
$ 13,510,000 $ 21,731,000 $ 35,241,000
Reconciliation of the Balance Sheet to the Statement of Net Assets
June 30, Year 2 June 30, Year 1
Total fund balance of governmental
funds from balance sheet
$ 277,738,000 $ 252,841,000
Amounts reported for governmental
activities in the statement of net
assets are different because:
Capital assets used in governmental
activities are not financial resources
and therefore are not reported in the
funds (collections and plant,
property & equipment).
1 ,034,548,000 1,024,676,000
Long-term liabilities including related
accrued interest payable are not due
and payable in the current period
and therefore are not reported in the
funds.
(7,426,000) (7,777,000)
Promises to give (pledges) are not
currently available for use and
therefore are not reported in the
funds.
307,000 186,000
$ 1,305,167,000 $ 1,269,926,000
Exhibit 4.5. (Continued )
General Fund and
Special Purpose
Expendable Funds
Nonexpendable
Funds
Total
Governmental
Funds
The GASB Model 313
Exhibit 4.6.Financial Statements under the GASB Model
Statement of Revenues, Expenses and Changes in Net Assets(Enterprise Fund).
The Museum of Fine Arts
Statement of Revenues Expenses and Changes in Net Assets
For Year ended June 30, Year 2
REVENUES
Operating revenues:
Charges for services $ 6,335,000
Operating grants and contributions 1,988,000
Restricted investment earnings 5 ,761,000
Gain/(loss) on restricted investments 633,000
Realized gain on deaccessions 54,000
Total operating revenues 14,771,000
EXPENSES
Salaries & benefits 11,145,000
Grants and scholarships 520,000
Supplies 1,314,000
Transportation of art and travel 910,000
Services and professional fees 1,854,000
Occupancy 7,524,000
Depreciation 1,800,000
Cost of sales 2,040,000
Interest 457,000
Total expenses 27,564,000
Operating income (loss) (12,793,000)
NONOPERATING REVENUES (EXPENSES)
Grants and contributions not restricted to specific programs 10,950,000
Investment earnings (unrestricted) 8,429,000
Gain/(loss) on investments not restricted to specific
Programs 6,974,000
Gain/(loss) on endowment investments and annuities 9,206,000
Gain/(loss) on disposal of equipment (6,000)
Museum Gala Ball, net of costs 1,700,000
Net nonoperating revenues 37,253,000
Income before other revenues, expenses, gains, or losses 24,460,000
Contributions to endowment 8,500,000
Fair value of donated artwork 2,000,000
Investment income restricted to annuities and term endowments 281,000
Change in net assets 35,241,000
Net assets – beginning 1,269,926,000
Net assets – ending $ 1,305,167,000
Note: This statement is Exhibit 4.2 restated in the format used by a special-purpose government
with only business-type activities (i.e., enterprise fund accounting). A statement of net assets
would also be presented and would be essentially the same as Exhibit 4.1. The third required
statement for an enterprise fund is a statement of cash flows (see Exhibit 4.7).

Exhibit 4.7.Financial Statements under the GASB ModelStatement of Cash Flows (Enterprise Fund).
The Museum of Fine Arts
Statement of Cash Flows
For the year ended June 30, Year 2
Cash Flows from operating activities:
Cash received as contributions and grants $ 13,060,000
Net receipts from Gala Ball 1,700,000
Cash from sales, admissions, and other program fees 6,335,000
Purchase of gift shop merchandise (1,796,000)
Cash paid to employees (11,000,000)
Cash paid to other suppliers (11,671,000)
Grants and scholarships paid (520,000)
Net cash provided by operating activities (3,892,000)
Cash flows from capital and related financing activities:
Proceeds from contributions restricted for
Investment in endowment - accessions 2,000,000
Investment in endowment - operations 6,000,000
Investment in term endowment 500,000
Investment income restricted for permanent additions to collections 5,746,000
Interest and dividends restricted for reinvestment 296,000
Proceeds from deaccessions 361,000
Proceeds from the sale of property 4,000
Payments of annuity obligations (200,000)
Principal paid on capital debt (146,000)
Interest paid on capital debt (462,000)
Purchase of equipment (1,861,000)
Purchase of artwork for collections (8,128,000)
Net cash provided by capital and related financing activities 4,110,000
Cash flows from investing activities:
Purchase of investments (58,824,000)
Proceeds from the sale of investments 49,879,000
Interest and dividends received 8,429,000
Net cash used by investing activities (516,000)
Net increase in cash and cash equivalents (298,000)
Cash and cash equivalents, beginning of year 658,000
Cash and cash equivalents, end of year $ 360,000
The GASB Model 315
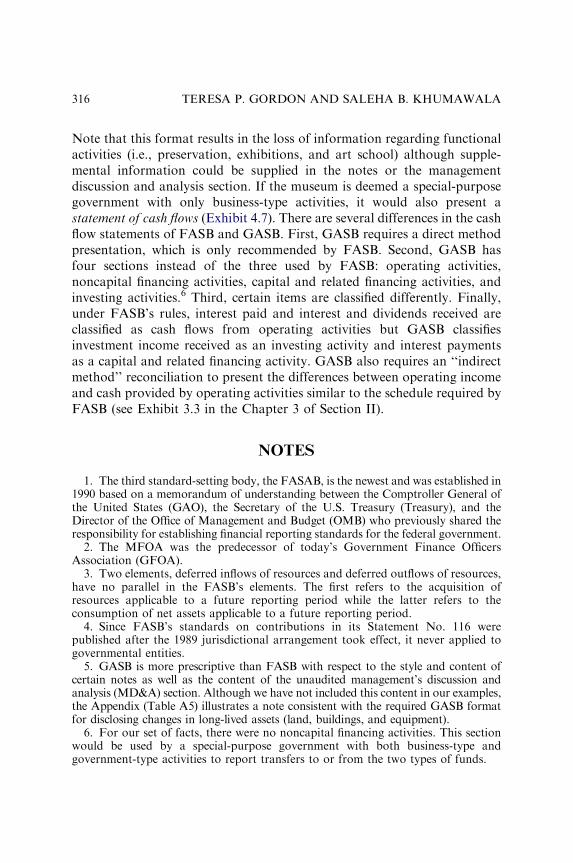
Note that this format results in the loss of information regarding functionalactivities (i.e., preservation, exhibitions, and art school) although supple-mental information could be supplied in the notes or the managementdiscussion and analysis section. If the museum is deemed a special-purposegovernment with only business-type activities, it would also present astatement of cash flows (Exhibit 4.7). There are several differences in the cashflow statements of FASB and GASB. First, GASB requires a direct methodpresentation, which is only recommended by FASB. Second, GASB hasfour sections instead of the three used by FASB: operating activities,noncapital financing activities, capital and related financing activities, andinvesting activities.6 Third, certain items are classified differently. Finally,under FASB’s rules, interest paid and interest and dividends received areclassified as cash flows from operating activities but GASB classifiesinvestment income received as an investing activity and interest paymentsas a capital and related financing activity. GASB also requires an ‘‘indirectmethod’’ reconciliation to present the differences between operating incomeand cash provided by operating activities similar to the schedule required byFASB (see Exhibit 3.3 in the Chapter 3 of Section II).
NOTES
1. The third standard-setting body, the FASAB, is the newest and was established in1990 based on a memorandum of understanding between the Comptroller General ofthe United States (GAO), the Secretary of the U.S. Treasury (Treasury), and theDirector of the Office of Management and Budget (OMB) who previously shared theresponsibility for establishing financial reporting standards for the federal government.2. The MFOA was the predecessor of today’s Government Finance Officers
Association (GFOA).3. Two elements, deferred inflows of resources and deferred outflows of resources,
have no parallel in the FASB’s elements. The first refers to the acquisition ofresources applicable to a future reporting period while the latter refers to theconsumption of net assets applicable to a future reporting period.4. Since FASB’s standards on contributions in its Statement No. 116 were
published after the 1989 jurisdictional arrangement took effect, it never applied togovernmental entities.5. GASB is more prescriptive than FASB with respect to the style and content of
certain notes as well as the content of the unaudited management’s discussion andanalysis (MD&A) section. Although we have not included this content in our examples,the Appendix (Table A5) illustrates a note consistent with the required GASB formatfor disclosing changes in long-lived assets (land, buildings, and equipment).6. For our set of facts, there were no noncapital financing activities. This section
would be used by a special-purpose government with both business-type andgovernment-type activities to report transfers to or from the two types of funds.
TERESA P. GORDON AND SALEHA B. KHUMAWALA316

REFERENCES
Chatters, C. H. (1939). Present and future of governmental accounting. The Accounting Review,
14(1), 48–51.
Eggleston, D. C. (1914). Municipal accounting. New York: The Ronald Press Co.
Engstrom, J. H. (1988). Information needs of college and university decision makers. Norwalk,
CT: Governmental Accounting Standards Board.
Financial Accounting Standards Board (FASB). (1980). Statement of financial accounting
concepts no. 4 – Objectives of financial reporting by nonbusiness organizations. Norwalk,
CT: Financial Accounting Standards Board.
Financial Accounting Standards Board (FASB). (1993a). Statement of financial accounting
standards no. 116 – Accounting for contributions received and contributions made.
Norwalk, CT: Financial Accounting Standards Board.
Financial Accounting Standards Board (FASB). (1993b). Statement of financial accounting
standards no.117 – Financial statements of not-for-profit organizations. Norwalk, CT:
Financial Accounting Standards Board.
Fleischman, R. K., & Marquette, R. P. (1987). Municipal accounting reform c. 1900: Ohio’s
progressive accountants. Accounting Historians Journal, 14(1), 83–94.
Gauthier, S. J. (2001). Then and now: 65 years of the Blue Book. Government Finance Review,
17(3), 9–10.
Gordon, T. P., Khumawala, S. B., & Parsons, L. M. (2002). Donor restricted contributions: The
standard setters FASB and GASB versus the users. Academy of Accounting and Financial
Studies Journal, 6(2), 77–90.
Governmental Accounting Standards Board (GASB). (1988). Statement no. 8: Applicability of
FASB statement No. 93 – Recognition of depreciation by not-for-profit organizations, to
certain state and local governmental entities. Norwalk, CT: Governmental Accounting
Standards Board.
Governmental Accounting Standards Board (GASB). (1998). Statement no. 33: Accounting and
financial reporting for nonexchange transactions. Norwalk, CT: Governmental Account-
ing Standards Board.
Governmental Accounting Standards Board (GASB). (1999a). Statement no. 34: Basic financial
statements-and management’s discussion and analysis-for state and local governments.
Norwalk, CT: Governmental Accounting Standards Board.
Governmental Accounting Standards Board (GASB). (1999b). Statement no. 35: Basic financial
statements – and management’s discussion and analysis – for public colleges and
universities: An amendment of GASB statement no. 34. Norwalk, CT: Governmental
Accounting Standards Board.
Hackett, R. P. (1933). Recent developments in governmental and institutional accounting.
The Accounting Review, 9(2), 122–127.
Hylton, D. P. (1957). Needed: More informative and understandable financial statements from
governmental units. The Accounting Review, 32(1), 51–54.
Morey, L. (1948). Trends in governmental accounting. The Accounting Review, 23(3), 227–234.
Potts, J. H. (1977). The evolution of budgetary accounting theory and practice in municipal
accounting from 1879. Accounting Historians Journal, 4(1), 89–100.
The GASB Model 317

This page intentionally left blank
CHAPTER 5
ANTHONY’S PROPOSED
ACCOUNTING MODEL
The late Professor Robert N. Anthony, was a leading critic of the FASB’smodel for NFP accounting. He was ‘‘an impenitent believer in the primacyof the income statement and the matching approach to income’’ (Solomons,1995, p. 43). Anthony’s (1995) commentary on the ‘‘nonprofit accountingmess’’ in which he delineates his philosophical differences with FASB is bestunderstood in light of his own conceptual framework for accounting, the1983 book entitled, Tell It Like It Was. In Should Business and NonbusinessAccounting Be Different? he makes his position on nonbusiness accountingmore explicit (Anthony, 1989).1 Anthony’s framework encompasses bothprofit-oriented and NFP entities.2
5.1. KEY ASPECTS OF THE MODEL
Anthony’s premises (1983, Premises 8A, 8B, 15, and 16) make clear hisstrong preference for directly measuring income rather than directlymeasuring assets and liabilities. In explaining his preference, Anthony(1983, pp. 70–71) provides the analogy of an oil well. The directmeasurement approach would be able to measure exactly the amount ofoil and gas removed from the well during a period even though the amountunderground at the beginning and end of the period can only be estimated.The asset/liability approach would calculate income by measuring thedifference in the amount of oil in the ground at the end of the period ascompared to the beginning of the period.
Additionally, Anthony is a strong proponent of the entity approach(Assets ¼ Equities) rather than the proprietary approach (Assets-Liabili-ties ¼ Owners’ Equity). This is consistent with his rationale for the majorchange he proposes for commercial accounting practices: the recognition ofinterest expense on contributed shareholder capital (Concept 4.02). The
319
balance sheet amount for shareholders’ equity would be the sum of the fundsoriginally contributed plus accrued interest (Concept 4.01). Anthony wouldnot, however, accrue interest on ‘‘entity equity’’ (retained earnings) and this isa major source of equity on the balance sheet of NFP organizations.
The relevance of Anthony’s emphasis on the primacy of the incomestatement may not be immediately apparent in the context of NFPorganizations. In Anthony’s view the measurement of revenues and expensesis just as important for nonbusinesses as for business entities, although theinterpretation differs. The performance of a business can be ascertained bythe extent to which revenues exceed expenses by a satisfactory margincompared to the resources invested. According to Anthony, the primaryeconomic goal of a nonbusiness organization is ‘‘to provide a satisfactoryamount of services with available resources or to provide a specified amountof services with reasonably few resources’’ (Premise 5). For NFPorganizations, revenues in excess of expenses may mean that more servicescould have been provided. However, even if revenues exactly equal expensesin a NFP organization, financial accounting information alone is unable toshow whether the economic goal has been achieved. Nevertheless, revenuesequal to or slightly greater than expenses are necessary for the maintenanceof nonprofit entity equity which is essential to long-term survival andavoidance of bankruptcy. Using Anthony’s concepts (including interest onshareholders’ equity), both business and nonbusiness organizations havemaintained their equity if revenues equal expenses.
According to Anthony, the only significant difference between businessand nonbusiness organizations that should be recognized is the fact thatnonbusiness organizations receive ‘‘capital from contributors rather thanfrom equity investors’’ (1989, p. 1). Anthony discusses the ‘‘allegeddifferences’’ between business and nonbusiness organizations and concludesthat there is no need for a different set of principles. Accordingly, it is notsurprising that Anthony’s framework would require nonbusiness organiza-tions to use accrual accounting rather than expenditures or disbursements.His framework would also require that depreciation expense be recorded.Anthony explicitly rejects the argument that cash-based reports are morereliable than reports that attempt to measure income. However, headvocates the limited use of fund accounting. Anthony claims the use oftwo funds, operating and nonoperating, is appropriate for all accountingentities. These funds separate information about the status and flow ofcontributed capital from information regarding operating results. Otherfunds could be used for internal control purposes, but would not necessarilybe reported in financial statements.
TERESA P. GORDON AND SALEHA B. KHUMAWALA320
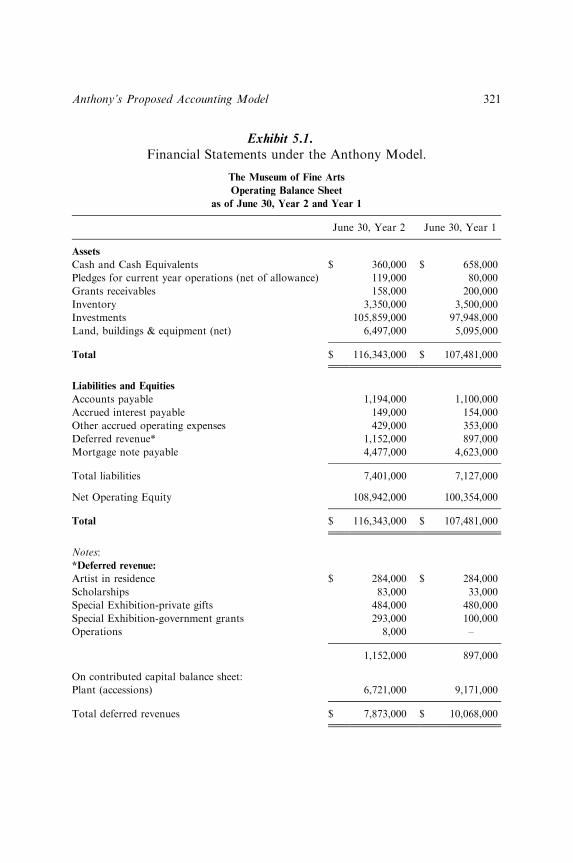
Exhibit 5.1.Financial Statements under the Anthony Model.
The Museum of Fine Arts
Operating Balance Sheet
as of June 30, Year 2 and Year 1
June 30, Year 2 June 30, Year 1
Assets
Cash and Cash Equivalents $ 360,000 $ 658,000
Pledges for current year operations (net of allowance) 119,000 80,000
Grants receivables 158,000 200,000
Inventory 3,350,000 3,500,000
Investments 105,859,000 97,948,000
Land, buildings & equipment (net) 6,497,000 5,095,000
Total $ 116,343,000 $ 107,481,000
Liabilities and Equities
Accounts payable 1,194,000 1,100,000
Accrued interest payable 149,000 154,000
Other accrued operating expenses 429,000 353,000
Deferred revenue* 1,152,000 897,000
Mortgage note payable 4,477,000 4,623,000
Total liabilities 7,401,000 7,127,000
Net Operating Equity 108,942,000 100,354,000
Total $ 116,343,000 $ 107,481,000
Notes:
*Deferred revenue:
Artist in residence $ 284,000 $ 284,000
Scholarships 83,000 33,000
Special Exhibition-private gifts 484,000 480,000
Special Exhibition-government grants 293,000 100,000
Operations 8,000 –
1,152,000 897,000
On contributed capital balance sheet:
Plant (accessions) 6,721,000 9,171,000
Total deferred revenues $ 7,873,000 $ 10,068,000
Anthony’s Proposed Accounting Model 321
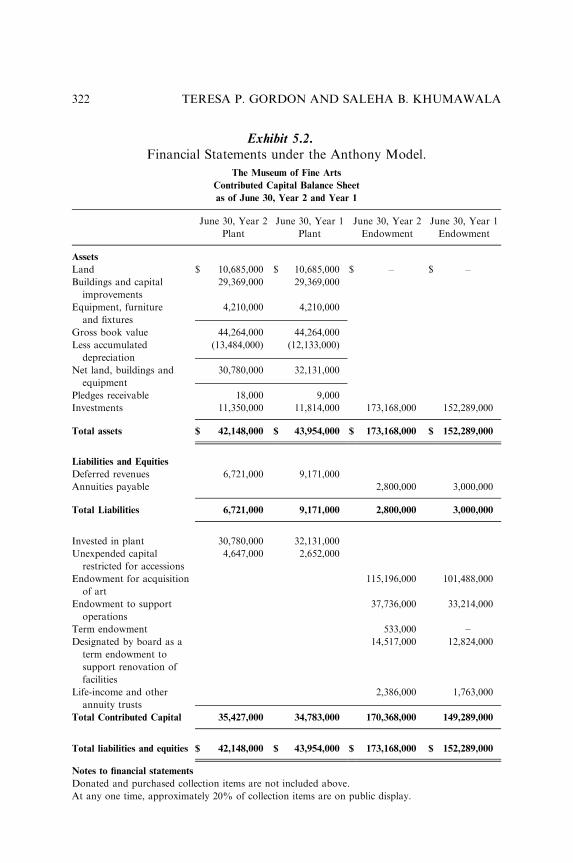
Exhibit 5.2.Financial Statements under the Anthony Model.
The Museum of Fine Arts
Contributed Capital Balance Sheet
as of June 30, Year 2 and Year 1
June 30, Year 2
Plant
June 30, Year 1
Plant
June 30, Year 2
Endowment
June 30, Year 1
Endowment
Assets
Land $ 10,685,000 $ 10,685,000 $ – $ –
Buildings and capital
improvements
29,369,000 29,369,000
Equipment, furniture
and fixtures
4,210,000 4,210,000
Gross book value 44,264,000 44,264,000
Less accumulated
depreciation
(13,484,000) (12,133,000)
Net land, buildings and
equipment
30,780,000 32,131,000
Pledges receivable 18,000 9,000
Investments 11,350,000 11,814,000 173,168,000 152,289,000
Total assets $ 42,148,000 $ 43,954,000 $ 173,168,000 $ 152,289,000
Liabilities and Equities
Deferred revenues 6,721,000 9,171,000
Annuities payable 2,800,000 3,000,000
Total Liabilities 6,721,000 9,171,000 2,800,000 3,000,000
Invested in plant 30,780,000 32,131,000
Unexpended capital
restricted for accessions
4,647,000 2,652,000
Endowment for acquisition
of art
115,196,000 101,488,000
Endowment to support
operations
37,736,000 33,214,000
Term endowment 533,000 –
Designated by board as a
term endowment to
support renovation of
facilities
14,517,000 12,824,000
Life-income and other
annuity trusts
2,386,000 1,763,000
Total Contributed Capital 35,427,000 34,783,000 170,368,000 149,289,000
Total liabilities and equities $ 42,148,000 $ 43,954,000 $ 173,168,000 $ 152,289,000
Notes to financial statements
Donated and purchased collection items are not included above.
At any one time, approximately 20% of collection items are on public display.
TERESA P. GORDON AND SALEHA B. KHUMAWALA322

5.2. EXAMPLE FINANCIAL STATEMENTS
Anthony’s proposed accounting model is applied to the set of transactionsused to illustrate the FASB approach (Chapter 3 in Section II) and theGASB approach (Chapter 4 in Section II). The financial statementspresented in Exhibits 5.1 through 5.5 were reviewed by Professor Anthonyto make sure that we correctly interpreted and applied the principles of hisapproach.
Exhibit 5.3.Financial Statements under the Anthony Model.
The Museum of Fine Arts
Operating Statement
for the year ended June 30, Year 2
Revenues
Contributions in support of operations $ 11,342,000
Government grants 610,000
Capital contributions recognized 1,351,000
Contributed services and supplies 440,000
Museum Gala Ball (net of costs) 1,700,000
Endowment earnings restricted for operations 1,881,000
Other investment earnings 5,825,000
Art school tuition 750,000
Admissions, tours and lectures 485,000
Gross profit on gift shop sales 3,060,000
Realized and unrealized gains/losses on investments 7,115,000
Realized loss on disposition of equipment (6,000)
Total revenues 34,553,000
Expenses
Preservation of collections 6,846,000
Exhibitions 14,508,000
Art school 1,960,000
Management and general 1,893,000
Fund raising and development 757,000
Total expenses 25,964,000
Net income from operations $ 8,589,000
Anthony’s Proposed Accounting Model 323

Under the Anthony model, there are two statements of financial positionreferred to as the Operating Balance Sheet (Exhibit 5.1) and the ContributedCapital Balance Sheet (Exhibit 5.2). These represent the two funds he feltwere essential for all types of entities to capture operating and nonoperatingstatus and transactions. Similar to the balance sheet, there are two separate‘‘change statements’’ referred to as Operating Statement (Exhibit 5.3) andthe Statement of Changes in Contributed Capital (Exhibit 5.4). This dualpresentation is somewhat similar to GASB, which presents the general fundseparately from nonexpendable funds in at least the funds-based statements.The Statement of Operating Cash Flows (Exhibit 5.5) does not includecertain investing and financing activities that are shown, instead, on theStatement of Changes in Contributed Capital (Exhibit 5.4). However, thecomputation and presentation of cash provided by operations is identical to
Exhibit 5.4.Financial Statements under the Anthony Model.
The Museum of Fine Arts
Statement of Changes in Contributed Capital
for the year ended June 30, Year 2
Plant Endowment
Increases in Contributed Capital
Contributions recognized $ 3,309,000 $ 8,500,000
Contributions in the form of long-lived plant assets 2,000,000
Cash received from deaccessions 361,000
Realized and unrealized gains on investments 692,000 11,575,000
Endowment earnings restricted for accessions 5,761,000
Interest and dividends restricted for re-investment 1,004,000
12,123,000 21,079,000
Decreases in Contributed Capital
Depreciation expense – contributed plant assets 1,351,000
Acquisitions of art (not capitalized) 10,128,000
Net increase 644,000 21,079,000
Beginning balance – contributed capital 34,783,000 149,289,000
Ending balance – contributed capital $ 35,427,000 $ 170,368,000
TERESA P. GORDON AND SALEHA B. KHUMAWALA324
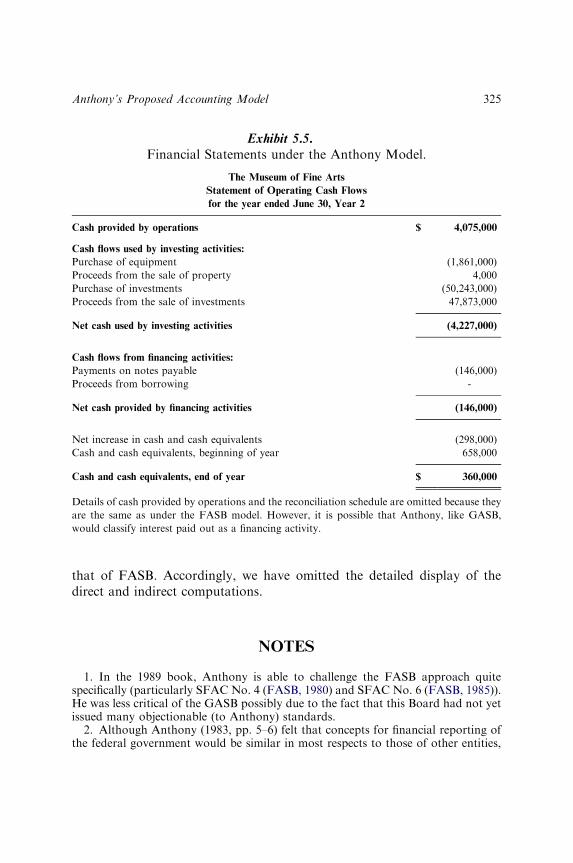
that of FASB. Accordingly, we have omitted the detailed display of thedirect and indirect computations.
NOTES
1. In the 1989 book, Anthony is able to challenge the FASB approach quitespecifically (particularly SFAC No. 4 (FASB, 1980) and SFAC No. 6 (FASB, 1985)).He was less critical of the GASB possibly due to the fact that this Board had not yetissued many objectionable (to Anthony) standards.2. Although Anthony (1983, pp. 5–6) felt that concepts for financial reporting of
the federal government would be similar in most respects to those of other entities,
Exhibit 5.5.Financial Statements under the Anthony Model.
The Museum of Fine Arts
Statement of Operating Cash Flows
for the year ended June 30, Year 2
Cash provided by operations $ 4,075,000
Cash flows used by investing activities:
Purchase of equipment (1,861,000)
Proceeds from the sale of property 4,000
Purchase of investments (50,243,000)
Proceeds from the sale of investments 47,873,000
Net cash used by investing activities (4,227,000)
Cash flows from financing activities:
Payments on notes payable (146,000)
Proceeds from borrowing -
Net cash provided by financing activities (146,000)
Net increase in cash and cash equivalents (298,000)
Cash and cash equivalents, beginning of year 658,000
Cash and cash equivalents, end of year $ 360,000
Details of cash provided by operations and the reconciliation schedule are omitted because they
are the same as under the FASB model. However, it is possible that Anthony, like GASB,
would classify interest paid out as a financing activity.
Anthony’s Proposed Accounting Model 325
Anthony’s framework specifically excludes the federal government because it canprint money to avoid going bankrupt.
REFERENCES
Anthony, R. N. (1983). Tell it like it was: A conceptual framework for financial accounting.
Homewood, IL: Richard D. Irwin, Inc.
Anthony, R. N. (1989). Should business and nonbusiness accounting be different? Boston, MA:
Harvard Business School Press.
Anthony, R. N. (1995). The nonprofit accounting mess. Accounting Horizons, 9(2), 44–53.
Financial Accounting Standards Board (FASB). (1980). Statement of financial accounting
concepts (SFAC) no. 4 – Objectives of financial reporting by nonbusiness organizations.
Norwalk, CT: Financial Accounting Standards Board.
Financial Accounting Standards Board (FASB). (1985). Statement of financial accounting
concepts (SFAC) no. 6 – Elements of financial statements. Norwalk, CT: Financial
Accounting Standards Board.
Solomons, D. (1995). Criteria for choosing an accounting model. Accounting Horizons, 9(1),
42–51.
TERESA P. GORDON AND SALEHA B. KHUMAWALA326
CHAPTER 6
MAUTZ’S PROPOSED
ACCOUNTING MODEL
The late Professor Robert K. Mautz, was another leading critic of currentaccounting standards for NFP and public sector entities. To Anthony’s(1989) question, ‘‘Should business and nonbusiness accounting be differ-ent?’’ Mautz would reply with a resounding yes! Unlike Anthony, however,Mautz did not appear to have any particular problems with the way FASBestablished concepts and standards for financial reporting for businessorganizations. He was, however, critical of FASB’s efforts to establishnonprofit accounting concepts, and his writings present a model that isdifferent from FASB and GASB. He argues that contributions and taxes aresimilar. In addition, Mautz proposed that the elements of financialstatements described in FASB’s Concepts Statement No. 3 were insufficientfor nonbusiness accounting. He proposed two new elements that he calledservice facilities and commitments.
6.1. KEY ASPECTS OF THE MODEL
In Financial Reporting for Nonprofit Organizations: A Fresh Look, Mautz(1994) frames his discussion as though a group of consultants has been hiredby a large country that is changing from a planned economy to an open-market economy. The team’s assignment is to recommend appropriateaccounting for nonbusiness organizations. As part of the work by thishypothetical group, team members examine the financial statements of theState of Utah, the American Accounting Association, and the AmericanAssociation of Retired Persons. Although none of these entities are amongtraditional charities (i.e., social services), they do represent the wide-range ofnonbusiness entities.
Mautz’s position on some aspects of nonprofit accounting is not entirelyclear. None of the three examples provided in the 1994 book include fixed
327
assets in the ‘‘statement of net assets,’’ although the principles call for usingbusiness accounting rules to report on wealth-increasing activities which twoof the example entities clearly have. Thus the examples appear to be a reportof ‘‘current funds’’ only. The operating statements (three different titles areused) appear to be prepared on a cash basis, reporting receipts, andexpenditures (although the terms ‘‘cost’’ and ‘‘expense’’ are also used).However, there are receivables and payables on the statement of net assetsso some accruals would be made. Mautz does not make an issue aboutdifferent types of donor restrictions and does not specifically discussendowments, although earnings on investments are shown under profit-directed activities on the operating statement.
The details of financial reporting under the Mautz model for NFP entitiesare left deliberately general. The recommendations are ‘‘principles to beobserved rather than rules to be followed’’ (Mautz, 1994, p. 104). Particularformats are not described because of the tremendous variety of organiza-tions covered by the principles. Accordingly, organizations would haveflexibility of manner and style and accountants would use professionaljudgment to decide if statements put forth by NFP organizations meet thespirit and intent of the principles.
6.1.1. Business and Nonbusiness Organizations are Different
Mautz is particularly adamant about the differences between business andgovernmental entities (Mautz, 1981) and thus foreshadows the white paperissued by GASB in 2006 on the same topic.1 Mautz argues that the traditionalaccounting model (assets ¼ liabilitiesþequity) represents a closed system.Resources are solicited from lenders and owners and used to acquire assets tobe used productively in the business’s operations and to purchase goods andservices that will be transformed into revenue-generating products andservices. The acquisition of assets generates positive cash flows that permitrepayment of liabilities and compensate investors.
In contrast, a governmental entity’s balance sheet is an open system inwhich ‘‘fund balance’’ has no clear meaning and represents only an attemptto ‘‘preserve the sanctity of the double-entry system’’ (Mautz, 1981, p. 55).The government’s power to tax citizens does not appear on the balancesheet, but regularly causes new infusions of assets to appear on the left-handside of the equation with no real impact on the right-hand side. Mautzpoints out similar differences with operating statements. In businessorganizations, net income represents success and there is normally a causal
TERESA P. GORDON AND SALEHA B. KHUMAWALA328
relationship between expenses and revenues. ‘‘Matching revenues andexpenses reflects the market’s reaction to a business. Matching taxes andother revenues with operating costs for a government represents no suchmarket test’’ (p. 56). Instead, elections are the way taxpayers expresswhether they think the services provided are worth the price.
6.1.2. Unique Sources of Revenue
Mautz argues that contributions and tax receipts are fundamentally similar.Both provide resources to be used for an organization’s purposes, both can besubject to restrictions, both are nonreciprocal transfers, and both requiresolicitation efforts. A government must convince citizens to accept new orincreased taxes; charities must convince donors to continue or increase theircontributions. In both cases, resource providers must be convinced ‘‘that theresources are needed for worthy purposes and will not be wasted’’ (Mautz,1994, p. 12). In addition, the arguments made for the differences betweenbusiness and governmental balance sheets and operating statements wouldapply almost as well to charitable organizations. Fund balance (or net assetposition in FASB’s terminology2) is difficult to interpret directly and assetsappear on the left-hand side of the balance sheet equation via contributionswithout any real impact on the right-hand side. Matching of revenues andexpenses is nebulous when compared to profit-oriented activities. ‘‘Fund-raising permits services, it doesn’t cause the services. Providing servicesexpends the funds, it doesn’t bring them in’’ (Mautz, 1994, p. 51). OnMautz’soperating statement (see Exhibit 6.2), wealth-increasing activities would beclearly segregated from the value-transferring and cost-sharing activities ofthe NFP entity. Expenditures for fundraising would be netted against thecontributions received rather than commingled with the expenditures relatedto providing the value-transferring and cost-sharing programs.
Financial reporting for predominantly cost-sharing or value-transferringentities should ‘‘emphasize the needs and interests of contributors andtaxpayers as the primary users of such reports’’ (Mautz, 1994, p. 13). Theomission of ‘‘creditors’’ (included in both FASB and GASB conceptualframeworks as primary users) is deliberate. A banker, for example, wouldnot spend ‘‘much time comparing the balance sheet of a business corporationwith the balance sheet of a NFP entity. His real interest in the NFP entitywould be its flow of receipts,’’ (Mautz, 1994, p.49). The future success of theorganization and its viability as a going concern cannot be evaluated without
Mautz’s Proposed Accounting Model 329
some attempt to compare commitments and obligations to the entity’srecord in obtaining resources from contributors and others.
6.1.3. New Elements-Service Facilities and Commitments
Mautz was one of the first to consider the theoretical implication of whatis now often referred to as heritage assets. His service facilities resemble assetsbut also have characteristics of liabilities. These ‘‘service facilities are useful,desirable, and often costly properties that, when used in a nonprofit entity’sactivities, are cash-consuming rather than cash-generating,’’ (Mautz, 1994,p. 109).3 The acquisition of a service facility commits the NFP organi-zation to maintaining and staffing the facility over a long period of time.Mautz suggested that service facilities be reported separately on a stewardshipbasis and not be included in assets on the ‘‘statement of net assets’’ (the termhe used instead of balance sheet or statement of financial position). Servicefacilities could be reported at historical cost, approximate current values, or atdepreciated cost. Depreciation disclosures ‘‘probably have little usefulness toanyone’’ (Mautz, 1994, p. 57) and would be replaced with a generaldescription of the extent, condition and plans for the properties.
The second new conceptual element proposed by Mautz is commitment.4
Commitments may or may not meet the definition of a liability but representobligations of the entity. For example, when an organization starts a newprogram, there is often an implied commitment to continue to offer theprogram indefinitely into the future. ‘‘Good management of a not-for-profitconsists of making the right commitments and in keeping commitments andcontributions in reasonable balance’’ (Mautz, 1990, p. 94). Planned main-tenance, replacement, and so forth, would be included in a statement ofcommitments. This statement would cover the next five years or so andwould serve the same purpose that accrual accounting serves in businessreporting. His recommendations seem revolutionary to many accountantsbecause they call for reporting long-range budgets to present thecommitments that management has made to maintain facilities, operateprograms, and so forth.
6.2. EXAMPLE FINANCIAL STATEMENTS
The Mautz approach to nonprofit accounting is applied to the set oftransactions developed for the museum and used to illustrate the FASB,
TERESA P. GORDON AND SALEHA B. KHUMAWALA330
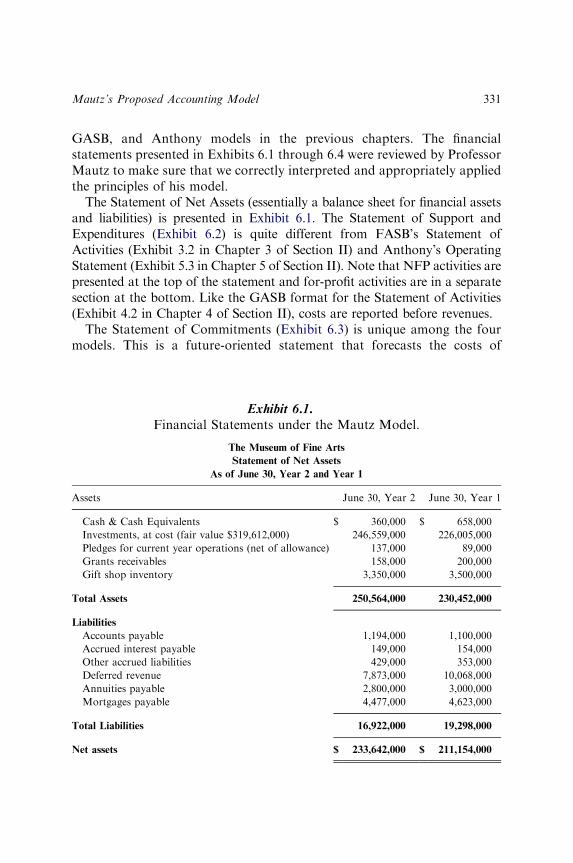
GASB, and Anthony models in the previous chapters. The financialstatements presented in Exhibits 6.1 through 6.4 were reviewed by ProfessorMautz to make sure that we correctly interpreted and appropriately appliedthe principles of his model.
The Statement of Net Assets (essentially a balance sheet for financial assetsand liabilities) is presented in Exhibit 6.1. The Statement of Support andExpenditures (Exhibit 6.2) is quite different from FASB’s Statement ofActivities (Exhibit 3.2 in Chapter 3 of Section II) and Anthony’s OperatingStatement (Exhibit 5.3 in Chapter 5 of Section II). Note that NFP activities arepresented at the top of the statement and for-profit activities are in a separatesection at the bottom. Like the GASB format for the Statement of Activities(Exhibit 4.2 in Chapter 4 of Section II), costs are reported before revenues.
The Statement of Commitments (Exhibit 6.3) is unique among the fourmodels. This is a future-oriented statement that forecasts the costs of
Exhibit 6.1.Financial Statements under the Mautz Model.
The Museum of Fine Arts
Statement of Net Assets
As of June 30, Year 2 and Year 1
Assets June 30, Year 2 June 30, Year 1
Cash & Cash Equivalents $ 360,000 $ 658,000
Investments, at cost (fair value $319,612,000) 246,559,000 226,005,000
Pledges for current year operations (net of allowance) 137,000 89,000
Grants receivables 158,000 200,000
Gift shop inventory 3,350,000 3,500,000
Total Assets 250,564,000 230,452,000
Liabilities
Accounts payable 1,194,000 1,100,000
Accrued interest payable 149,000 154,000
Other accrued liabilities 429,000 353,000
Deferred revenue 7,873,000 10,068,000
Annuities payable 2,800,000 3,000,000
Mortgages payable 4,477,000 4,623,000
Total Liabilities 16,922,000 19,298,000
Net assets $ 233,642,000 $ 211,154,000
Mautz’s Proposed Accounting Model 331
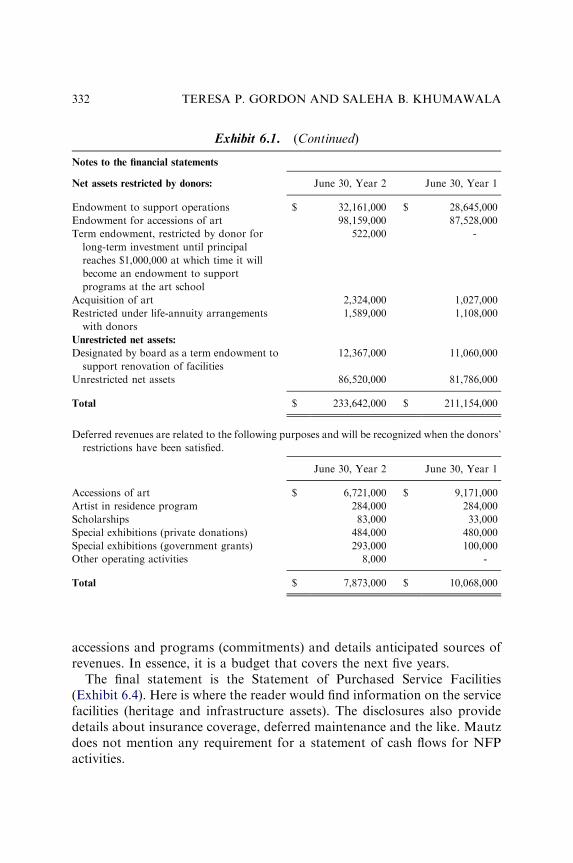
accessions and programs (commitments) and details anticipated sources ofrevenues. In essence, it is a budget that covers the next five years.
The final statement is the Statement of Purchased Service Facilities(Exhibit 6.4). Here is where the reader would find information on the servicefacilities (heritage and infrastructure assets). The disclosures also providedetails about insurance coverage, deferred maintenance and the like. Mautzdoes not mention any requirement for a statement of cash flows for NFPactivities.
Notes to the financial statements
Net assets restricted by donors: June 30, Year 2 June 30, Year 1
Endowment to support operations $ 32,161,000 $ 28,645,000
Endowment for accessions of art 98,159,000 87,528,000
Term endowment, restricted by donor for
long-term investment until principal
reaches $1,000,000 at which time it will
become an endowment to support
programs at the art school
522,000 -
Acquisition of art 2,324,000 1,027,000
Restricted under life-annuity arrangements
with donors
1,589,000 1,108,000
Unrestricted net assets:
Designated by board as a term endowment to
support renovation of facilities
12,367,000 11,060,000
Unrestricted net assets 86,520,000 81,786,000
Total $ 233,642,000 $ 211,154,000
Deferred revenues are related to the following purposes and will be recognized when the donors’
restrictions have been satisfied.
June 30, Year 2 June 30, Year 1
Accessions of art $ 6,721,000 $ 9,171,000
Artist in residence program 284,000 284,000
Scholarships 83,000 33,000
Special exhibitions (private donations) 484,000 480,000
Special exhibitions (government grants) 293,000 100,000
Other operating activities 8,000 -
Total $ 7,873,000 $ 10,068,000
Exhibit 6.1. (Continued)
TERESA P. GORDON AND SALEHA B. KHUMAWALA332
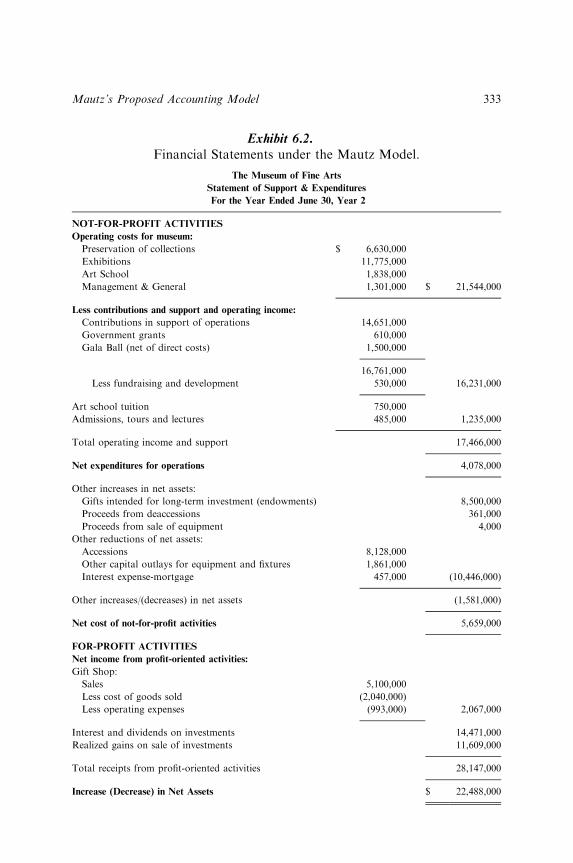
Exhibit 6.2.Financial Statements under the Mautz Model.
The Museum of Fine Arts
Statement of Support & Expenditures
For the Year Ended June 30, Year 2
NOT-FOR-PROFIT ACTIVITIES
Operating costs for museum:
Preservation of collections $ 6,630,000
Exhibitions 11,775,000
Art School 1,838,000
Management & General 1,301,000 $ 21,544,000
Less contributions and support and operating income:
Contributions in support of operations 14,651,000
Government grants 610,000
Gala Ball (net of direct costs) 1,500,000
16,761,000
Less fundraising and development 530,000 16,231,000
Art school tuition 750,000
Admissions, tours and lectures 485,000 1,235,000
Total operating income and support 17,466,000
Net expenditures for operations 4,078,000
Other increases in net assets:
Gifts intended for long-term investment (endowments) 8,500,000
Proceeds from deaccessions 361,000
Proceeds from sale of equipment 4,000
Other reductions of net assets:
Accessions 8,128,000
Other capital outlays for equipment and fixtures 1,861,000
Interest expense-mortgage 457,000 (10,446,000)
Other increases/(decreases) in net assets (1,581,000)
Net cost of not-for-profit activities 5,659,000
FOR-PROFIT ACTIVITIES
Net income from profit-oriented activities:
Gift Shop:
Sales 5,100,000
Less cost of goods sold (2,040,000)
Less operating expenses (993,000) 2,067,000
Interest and dividends on investments 14,471,000
Realized gains on sale of investments 11,609,000
Total receipts from profit-oriented activities 28,147,000
Increase (Decrease) in Net Assets $ 22,488,000
Mautz’s Proposed Accounting Model 333
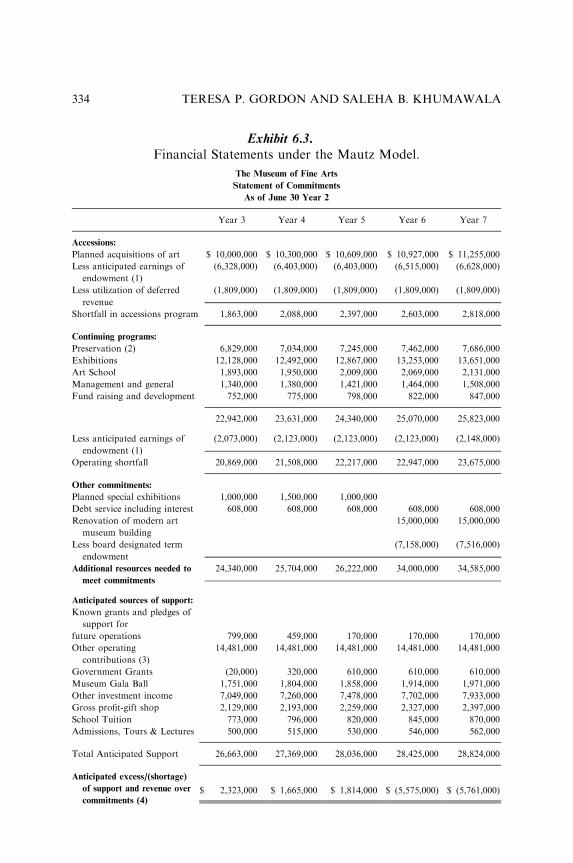
Exhibit 6.3.Financial Statements under the Mautz Model.
The Museum of Fine Arts
Statement of Commitments
As of June 30 Year 2
Year 3 Year 4 Year 5 Year 6 Year 7
Accessions:
Planned acquisitions of art $ 10,000,000 $ 10,300,000 $ 10,609,000 $ 10,927,000 $ 11,255,000
Less anticipated earnings of
endowment (1)
(6,328,000) (6,403,000) (6,403,000) (6,515,000) (6,628,000)
Less utilization of deferred
revenue
(1,809,000) (1,809,000) (1,809,000) (1,809,000) (1,809,000)
Shortfall in accessions program 1,863,000 2,088,000 2,397,000 2,603,000 2,818,000
Continuing programs:
Preservation (2) 6,829,000 7,034,000 7,245,000 7,462,000 7,686,000
Exhibitions 12,128,000 12,492,000 12,867,000 13,253,000 13,651,000
Art School 1,893,000 1,950,000 2,009,000 2,069,000 2,131,000
Management and general 1,340,000 1,380,000 1,421,000 1,464,000 1,508,000
Fund raising and development 752,000 775,000 798,000 822,000 847,000
22,942,000 23,631,000 24,340,000 25,070,000 25,823,000
Less anticipated earnings of
endowment (1)
(2,073,000) (2,123,000) (2,123,000) (2,123,000) (2,148,000)
Operating shortfall 20,869,000 21,508,000 22,217,000 22,947,000 23,675,000
Other commitments:
Planned special exhibitions 1,000,000 1,500,000 1,000,000
Debt service including interest 608,000 608,000 608,000 608,000 608,000
Renovation of modern art
museum building
15,000,000 15,000,000
Less board designated term
endowment
(7,158,000) (7,516,000)
Additional resources needed to
meet commitments
24,340,000 25,704,000 26,222,000 34,000,000 34,585,000
Anticipated sources of support:
Known grants and pledges of
support for
future operations 799,000 459,000 170,000 170,000 170,000
Other operating
contributions (3)
14,481,000 14,481,000 14,481,000 14,481,000 14,481,000
Government Grants (20,000) 320,000 610,000 610,000 610,000
Museum Gala Ball 1,751,000 1,804,000 1,858,000 1,914,000 1,971,000
Other investment income 7,049,000 7,260,000 7,478,000 7,702,000 7,933,000
Gross profit-gift shop 2,129,000 2,193,000 2,259,000 2,327,000 2,397,000
School Tuition 773,000 796,000 820,000 845,000 870,000
Admissions, Tours & Lectures 500,000 515,000 530,000 546,000 562,000
Total Anticipated Support 26,663,000 27,369,000 28,036,000 28,425,000 28,824,000
Anticipated excess/(shortage)
of support and revenue over
commitments (4)$ 2,323,000 $ 1,665,000 $ 1,814,000 $ (5,575,000) $ (5,761,000)
TERESA P. GORDON AND SALEHA B. KHUMAWALA334
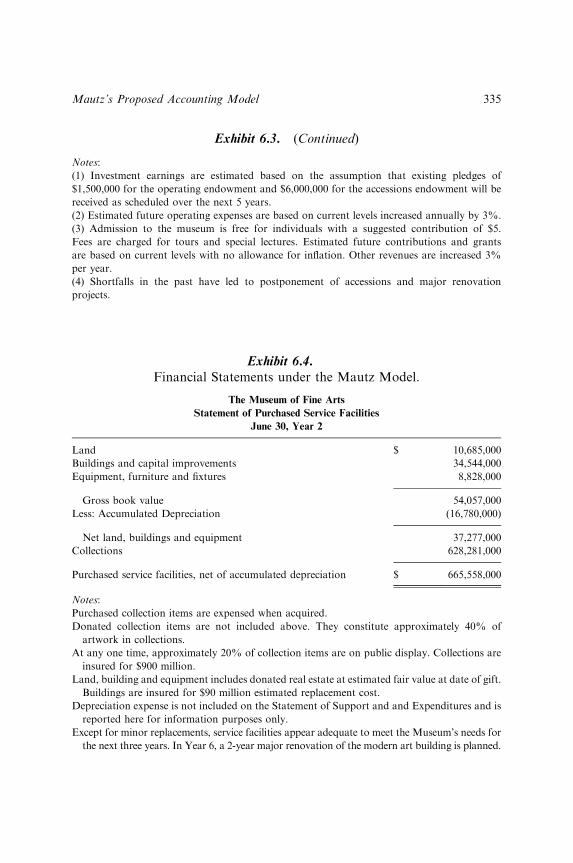
Exhibit 6.4.Financial Statements under the Mautz Model.
The Museum of Fine Arts
Statement of Purchased Service Facilities
June 30, Year 2
Land $ 10,685,000
Buildings and capital improvements 34,544,000
Equipment, furniture and fixtures 8,828,000
Gross book value 54,057,000
Less: Accumulated Depreciation (16,780,000)
Net land, buildings and equipment 37,277,000
Collections 628,281,000
Purchased service facilities, net of accumulated depreciation $ 665,558,000
Notes:
Purchased collection items are expensed when acquired.
Donated collection items are not included above. They constitute approximately 40% of
artwork in collections.
At any one time, approximately 20% of collection items are on public display. Collections are
insured for $900 million.
Land, building and equipment includes donated real estate at estimated fair value at date of gift.
Buildings are insured for $90 million estimated replacement cost.
Depreciation expense is not included on the Statement of Support and and Expenditures and is
reported here for information purposes only.
Except for minor replacements, service facilities appear adequate to meet the Museum’s needs for
the next three years. In Year 6, a 2-year major renovation of the modern art building is planned.
Notes:
(1) Investment earnings are estimated based on the assumption that existing pledges of
$1,500,000 for the operating endowment and $6,000,000 for the accessions endowment will be
received as scheduled over the next 5 years.
(2) Estimated future operating expenses are based on current levels increased annually by 3%.
(3) Admission to the museum is free for individuals with a suggested contribution of $5.
Fees are charged for tours and special lectures. Estimated future contributions and grants
are based on current levels with no allowance for inflation. Other revenues are increased 3%
per year.
(4) Shortfalls in the past have led to postponement of accessions and major renovation
projects.
Exhibit 6.3. (Continued)
Mautz’s Proposed Accounting Model 335
NOTES
1. Mautz (1994, p. 41) provides a table that lays out the differences betweenbusiness and nonbusiness organizations.2. On this point, Mautz is in agreement with FASB. Fund balance is not a
meaningful term and should be replaced by ‘‘net assets.’’ He and FASB also agreethat fund accounting is fine for control purposes but only serves to confuse readerswhen allowed to dominate the basic financial statements. His version of an operatingstatement would, like FASB’s statement of activities, report the ‘‘change in netassets.’’ However, the figures would not be the same because ‘‘service facilities’’ arenot considered assets in Mautz’s model.3. The logic of Mautz’s position is presented most clearly in his 1989 article in the
Journal of Accountancy where he provides a point-by-point analysis of FASB’sdefinitions of assets and liabilities to show that ‘‘service facilities’’ have only two ofthe three essential characteristics of an asset and also have two of the three essentialcharacteristics of a liability.4. Mautz’s most thorough discussion of the importance of reporting commitments
is found in his 1990 article in Journal of Accountancy. He argues for disclosure ofcommitments but accounting only for completed transactions. The rationale for thedifference appears to be the higher level of uncertainty involved in measuringcommitments.
REFERENCES
Anthony, R. N. (1989). Should business and nonbusiness accounting be different? Boston, MA:
Harvard Business School Press.
Governmental Accounting Standards Board (GASB). (2006).Why governmental accounting and
financial reporting is – and should be – Different. White Paper. Available at www.
gasb.org8/1/07
Mautz, R. K. (1981). Financial reporting: Should government emulate business? Journal of
Accountancy, 152(2), 53–60.
Mautz, R. K. (1989). Not-for-profit financial reporting: Another view. Journal of Accountancy,
168(2), 60–66.
Mautz, R. K. (1990). Why not-for-profits should report their commitments: Current GAAP
financial reports provide little understanding of future obligations. Journal of
Accountancy, 169(6), 92–97.
Mautz, R. K. (1994). Financial reporting for nonprofit organizations: A fresh look. New York,
NY: Garland Publishing, Inc.
TERESA P. GORDON AND SALEHA B. KHUMAWALA336
CHAPTER 7
COMPARISON OF FINANCIAL
STATEMENTS
The examples in Chapters 4 through 6 of Section II are based on a uniformset of transactions but produced financial statements that ‘‘look different’’and may therefore impact the decisions made by those using the reports.Although these transactions represent a small subset of possible transac-tions, it is evident that these different accounting models applied to a givenset of transactions will produce materially different results from oneanother. This chapter compares the resulting numbers that would bereported under the four alternate approaches to nonbusiness accounting.
The major differences between the models can be attributed to (1) differentcriteria for recognizing assets or liabilities and (2) differences in revenue andexpense recognition. Of lesser importance, though visually significant, aredifferences in presentation within the statements. In each section, we brieflyexplain why particular amounts are different and discuss the strengths andweaknesses of each model.
7.1. ASSETS AND LIABILITIES
As shown in Table 7.1, the total assets and total net assets amounts arelargest under the FASB and GASB models, primarily due to capitalizationof collections, whereas the amounts are smallest under the Mautz andAnthony models. That said, total liabilities are larger under the Mautz andAnthony models primarily due to the differences in timing of the recognitionof donor-restricted gifts. In addition, net assets are labeled differently undereach model. Although the display of net assets is not material in and ofitself, the differences in measurement between the methodologies cause theamounts reported to appear quite different and may have a fundamentalimpact on user analyses.
337
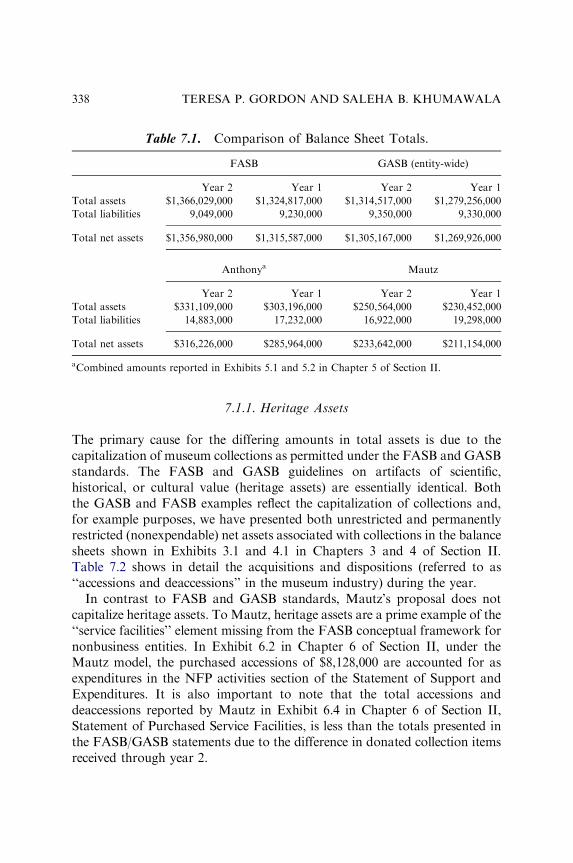
7.1.1. Heritage Assets
The primary cause for the differing amounts in total assets is due to thecapitalization of museum collections as permitted under the FASB and GASBstandards. The FASB and GASB guidelines on artifacts of scientific,historical, or cultural value (heritage assets) are essentially identical. Boththe GASB and FASB examples reflect the capitalization of collections and,for example purposes, we have presented both unrestricted and permanentlyrestricted (nonexpendable) net assets associated with collections in the balancesheets shown in Exhibits 3.1 and 4.1 in Chapters 3 and 4 of Section II.Table 7.2 shows in detail the acquisitions and dispositions (referred to as‘‘accessions and deaccessions’’ in the museum industry) during the year.
In contrast to FASB and GASB standards, Mautz’s proposal does notcapitalize heritage assets. To Mautz, heritage assets are a prime example of the‘‘service facilities’’ element missing from the FASB conceptual framework fornonbusiness entities. In Exhibit 6.2 in Chapter 6 of Section II, under theMautz model, the purchased accessions of $8,128,000 are accounted for asexpenditures in the NFP activities section of the Statement of Support andExpenditures. It is also important to note that the total accessions anddeaccessions reported by Mautz in Exhibit 6.4 in Chapter 6 of Section II,Statement of Purchased Service Facilities, is less than the totals presented inthe FASB/GASB statements due to the difference in donated collection itemsreceived through year 2.
Table 7.1. Comparison of Balance Sheet Totals.
FASB GASB (entity-wide)
Year 2 Year 1 Year 2 Year 1
Total assets $1,366,029,000 $1,324,817,000 $1,314,517,000 $1,279,256,000
Total liabilities 9,049,000 9,230,000 9,350,000 9,330,000
Total net assets $1,356,980,000 $1,315,587,000 $1,305,167,000 $1,269,926,000
Anthonya Mautz
Year 2 Year 1 Year 2 Year 1
Total assets $331,109,000 $303,196,000 $250,564,000 $230,452,000
Total liabilities 14,883,000 17,232,000 16,922,000 19,298,000
Total net assets $316,226,000 $285,964,000 $233,642,000 $211,154,000
aCombined amounts reported in Exhibits 5.1 and 5.2 in Chapter 5 of Section II.
TERESA P. GORDON AND SALEHA B. KHUMAWALA338
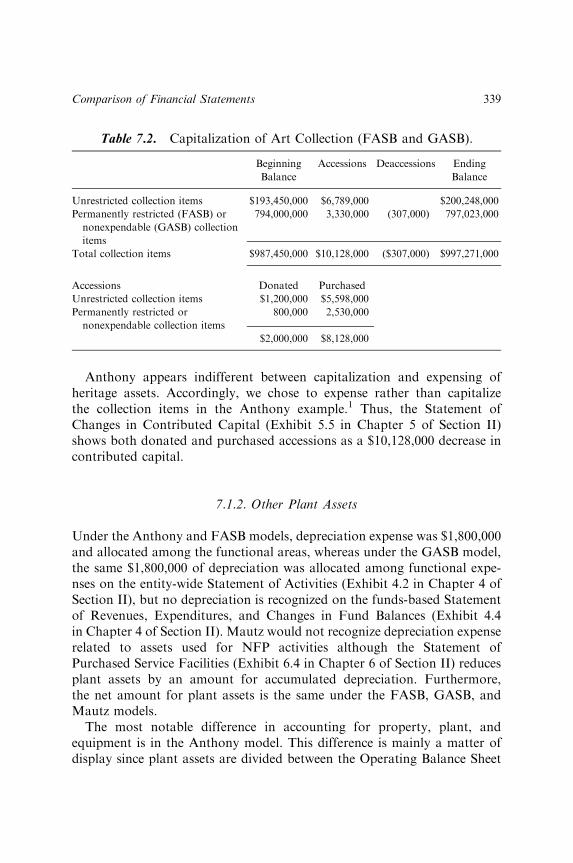
Anthony appears indifferent between capitalization and expensing ofheritage assets. Accordingly, we chose to expense rather than capitalizethe collection items in the Anthony example.1 Thus, the Statement ofChanges in Contributed Capital (Exhibit 5.5 in Chapter 5 of Section II)shows both donated and purchased accessions as a $10,128,000 decrease incontributed capital.
7.1.2. Other Plant Assets
Under the Anthony and FASB models, depreciation expense was $1,800,000and allocated among the functional areas, whereas under the GASB model,the same $1,800,000 of depreciation was allocated among functional expe-nses on the entity-wide Statement of Activities (Exhibit 4.2 in Chapter 4 ofSection II), but no depreciation is recognized on the funds-based Statementof Revenues, Expenditures, and Changes in Fund Balances (Exhibit 4.4in Chapter 4 of Section II). Mautz would not recognize depreciation expenserelated to assets used for NFP activities although the Statement ofPurchased Service Facilities (Exhibit 6.4 in Chapter 6 of Section II) reducesplant assets by an amount for accumulated depreciation. Furthermore,the net amount for plant assets is the same under the FASB, GASB, andMautz models.
The most notable difference in accounting for property, plant, andequipment is in the Anthony model. This difference is mainly a matter ofdisplay since plant assets are divided between the Operating Balance Sheet
Table 7.2. Capitalization of Art Collection (FASB and GASB).
Beginning
Balance
Accessions Deaccessions Ending
Balance
Unrestricted collection items $193,450,000 $6,789,000 $200,248,000
Permanently restricted (FASB) or
nonexpendable (GASB) collection
items
794,000,000 3,330,000 (307,000) 797,023,000
Total collection items $987,450,000 $10,128,000 ($307,000) $997,271,000
Accessions Donated Purchased
Unrestricted collection items $1,200,000 $5,598,000
Permanently restricted or
nonexpendable collection items
800,000 2,530,000
$2,000,000 $8,128,000
Comparison of Financial Statements 339
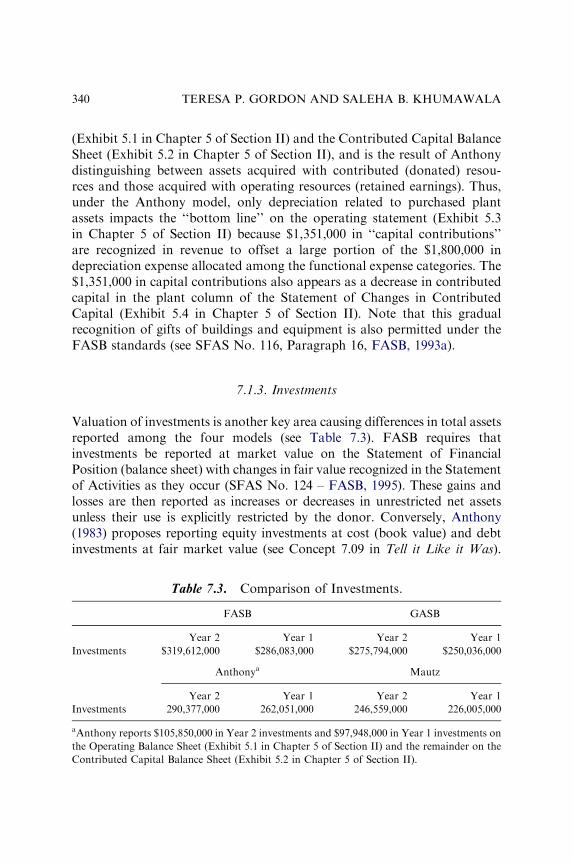
(Exhibit 5.1 in Chapter 5 of Section II) and the Contributed Capital BalanceSheet (Exhibit 5.2 in Chapter 5 of Section II), and is the result of Anthonydistinguishing between assets acquired with contributed (donated) resou-rces and those acquired with operating resources (retained earnings). Thus,under the Anthony model, only depreciation related to purchased plantassets impacts the ‘‘bottom line’’ on the operating statement (Exhibit 5.3in Chapter 5 of Section II) because $1,351,000 in ‘‘capital contributions’’are recognized in revenue to offset a large portion of the $1,800,000 indepreciation expense allocated among the functional expense categories. The$1,351,000 in capital contributions also appears as a decrease in contributedcapital in the plant column of the Statement of Changes in ContributedCapital (Exhibit 5.4 in Chapter 5 of Section II). Note that this gradualrecognition of gifts of buildings and equipment is also permitted under theFASB standards (see SFAS No. 116, Paragraph 16, FASB, 1993a).
7.1.3. Investments
Valuation of investments is another key area causing differences in total assetsreported among the four models (see Table 7.3). FASB requires thatinvestments be reported at market value on the Statement of FinancialPosition (balance sheet) with changes in fair value recognized in the Statementof Activities as they occur (SFAS No. 124 – FASB, 1995). These gains andlosses are then reported as increases or decreases in unrestricted net assetsunless their use is explicitly restricted by the donor. Conversely, Anthony(1983) proposes reporting equity investments at cost (book value) and debtinvestments at fair market value (see Concept 7.09 in Tell it Like it Was).
Table 7.3. Comparison of Investments.
FASB GASB
Year 2 Year 1 Year 2 Year 1
Investments $319,612,000 $286,083,000 $275,794,000 $250,036,000
Anthonya Mautz
Year 2 Year 1 Year 2 Year 1
Investments 290,377,000 262,051,000 246,559,000 226,005,000
aAnthony reports $105,850,000 in Year 2 investments and $97,948,000 in Year 1 investments on
the Operating Balance Sheet (Exhibit 5.1 in Chapter 5 of Section II) and the remainder on the
Contributed Capital Balance Sheet (Exhibit 5.2 in Chapter 5 of Section II).
TERESA P. GORDON AND SALEHA B. KHUMAWALA340
Anthony’s unique approach is the opposite of the usual GASB reporting.Governments report equity investments at fair value but generally takeadvantage of the option to report debt securities with maturity terms of oneyear or less at amortized cost (GASB Statement No. 31, GASB, 1997). Thatsaid, Mautz uses cost to measure all investments since unrealized gains are notfinancial resources immediately available. While market values are disclosed,Mautz only uses fair value reporting (commercial accounting rules) forinvestments related to business-type activities (this is not illustrated becausethe example transactions do not have any investments associated with themuseum’s gift shop).
In our example, the museum uses a pooled investment fund to manageendowments and other resources. Valuation of the investments variesdepending on the accounting model used. From a practical perspective,there may be some differences in managing a pooled investment. UnderGASB, changes in the fair value of investments are recognized as revenuefor both governmental fund statements and government-wide statements,even though funds are not available to meet current period expendituresunless the investments are sold. This is a notable departure from thetraditional accounting for governmental funds, which focuses on currentlyavailable financial resources.
Under FASB, investments of temporarily restricted net assets createunrestricted (or temporarily restricted) investment income (interest anddividends and gain or loss). However, Anthony includes some investmentincome in the Statement of Changes in Contributed Capital (Exhibit 5.4 inChapter 5 of Section II) rather than reporting it as operating revenue. In theMautz example, earnings on investments and realized gains are shown underprofit-directed activities on the Statement of Support & Expenditures(Exhibit 6.2 in Chapter 6 of Section II).
7.1.4. Current Assets and Liabilities
The differences in the total liabilities among the four models result prima-rily from variations in recognition criteria for donor-restricted gifts andgrants. The FASB and GASB totals for assets and liabilities are fairlysimilar (Table 7.1). The slight difference is related to the treatment ofrevenues with time restrictions. FASB immediately recognizes gifts andgrants with time restrictions but GASB defers revenue recognition until timerestrictions (a type of eligibility requirement) are met (refer to Table 4.2 inChapter 4 of Section II). If cash has been received, a liability is recognized.
Comparison of Financial Statements 341
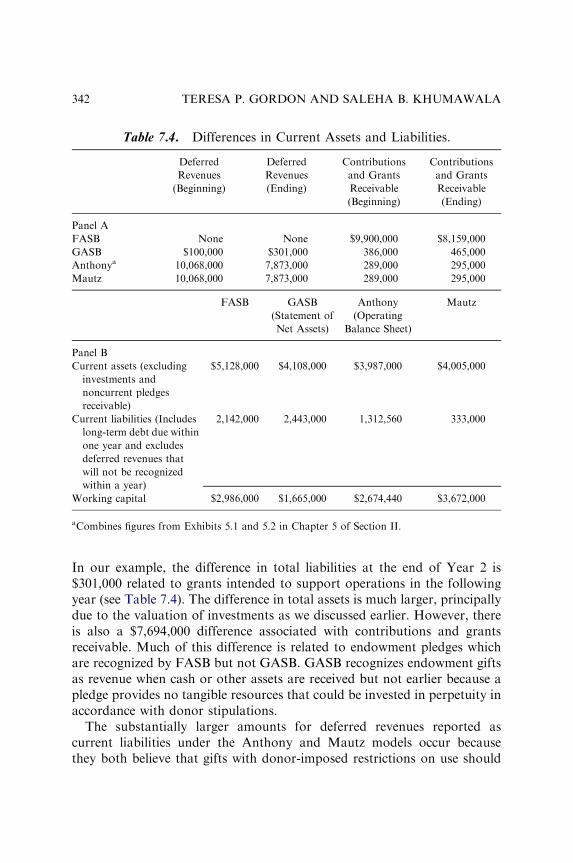
In our example, the difference in total liabilities at the end of Year 2 is$301,000 related to grants intended to support operations in the followingyear (see Table 7.4). The difference in total assets is much larger, principallydue to the valuation of investments as we discussed earlier. However, thereis also a $7,694,000 difference associated with contributions and grantsreceivable. Much of this difference is related to endowment pledges whichare recognized by FASB but not GASB. GASB recognizes endowment giftsas revenue when cash or other assets are received but not earlier because apledge provides no tangible resources that could be invested in perpetuity inaccordance with donor stipulations.
The substantially larger amounts for deferred revenues reported ascurrent liabilities under the Anthony and Mautz models occur becausethey both believe that gifts with donor-imposed restrictions on use should
Table 7.4. Differences in Current Assets and Liabilities.
Deferred
Revenues
(Beginning)
Deferred
Revenues
(Ending)
Contributions
and Grants
Receivable
(Beginning)
Contributions
and Grants
Receivable
(Ending)
Panel A
FASB None None $9,900,000 $8,159,000
GASB $100,000 $301,000 386,000 465,000
Anthonya 10,068,000 7,873,000 289,000 295,000
Mautz 10,068,000 7,873,000 289,000 295,000
FASB GASB
(Statement of
Net Assets)
Anthony
(Operating
Balance Sheet)
Mautz
Panel B
Current assets (excluding
investments and
noncurrent pledges
receivable)
$5,128,000 $4,108,000 $3,987,000 $4,005,000
Current liabilities (Includes
long-term debt due within
one year and excludes
deferred revenues that
will not be recognized
within a year)
2,142,000 2,443,000 1,312,560 333,000
Working capital $2,986,000 $1,665,000 $2,674,440 $3,672,000
aCombines figures from Exhibits 5.1 and 5.2 in Chapter 5 of Section II.
TERESA P. GORDON AND SALEHA B. KHUMAWALA342
be deferred until the organization has performed as promised. Obviously,these differences also affect grants receivables and contributions receivable(Table 7.4) and will be discussed later under the comparison of revenuerecognition criteria. In our example, some of the pledges are related toexhibitions in future years. FASB recognizes these pledges as grantsreceivable whereas GASB does not. GASB does not require multiyearpledges to be discounted to present values, further exacerbating thesediscrepancies. The Anthony and Mautz views on revenue recognition arevery similar. Neither records pledges related to programs to be delivered infuture years. The amounts presented as deferred revenue in the Anthony andMautz examples are $7,873,000 more than FASB and $7,572,000 more thanGASB (Table 7.4, Panel A). Although some of the differences are offsetting,each alternative model leads to considerably different amounts of reportedworking capital, as shown in Table 7.4, Panel B.
7.2. REVENUES AND EXPENSES
The differences in measurement for gifts and grants lead to the mostsignificant differences in reported revenues and expenses for the fourmodels. The primary sources of the discrepancies are noncash contributionsand depreciation in reported expenses. Ostensibly, these differences alsoimpact the bottom-line change in net assets. In addition, choices on how todisplay revenues and expenses make the income statement equivalentsappear different, even when revenues and expenses are measured in the sameway. The following sections describe and explain the effect of the differencesin the examples.
7.2.1. Contributions and Grants
The most complex set of differences between the models is the dissimilarrevenue recognition criteria used for contributions and grants. FASB is themost aggressive in recognizing promises to give and records unconditionalpledges as revenue even when the promises relate to gifts not due for severalyears. To avoid recognizing contributions as unrestricted revenue beforethey are available for expenditure, NFP entities that follow FASB standardsrecord pledges subject to time restrictions as temporarily restricted. Whenthe cash is received and available for expenditure, the resources aretransferred from the temporarily restricted to the unrestricted category.
Comparison of Financial Statements 343
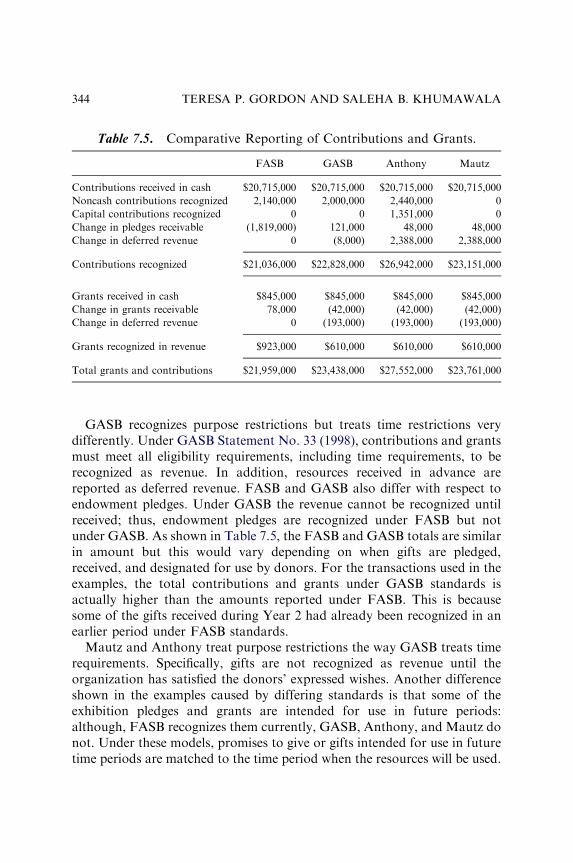
GASB recognizes purpose restrictions but treats time restrictions verydifferently. Under GASB Statement No. 33 (1998), contributions and grantsmust meet all eligibility requirements, including time requirements, to berecognized as revenue. In addition, resources received in advance arereported as deferred revenue. FASB and GASB also differ with respect toendowment pledges. Under GASB the revenue cannot be recognized untilreceived; thus, endowment pledges are recognized under FASB but notunder GASB. As shown in Table 7.5, the FASB and GASB totals are similarin amount but this would vary depending on when gifts are pledged,received, and designated for use by donors. For the transactions used in theexamples, the total contributions and grants under GASB standards isactually higher than the amounts reported under FASB. This is becausesome of the gifts received during Year 2 had already been recognized in anearlier period under FASB standards.
Mautz and Anthony treat purpose restrictions the way GASB treats timerequirements. Specifically, gifts are not recognized as revenue until theorganization has satisfied the donors’ expressed wishes. Another differenceshown in the examples caused by differing standards is that some of theexhibition pledges and grants are intended for use in future periods:although, FASB recognizes them currently, GASB, Anthony, and Mautz donot. Under these models, promises to give or gifts intended for use in futuretime periods are matched to the time period when the resources will be used.
Table 7.5. Comparative Reporting of Contributions and Grants.
FASB GASB Anthony Mautz
Contributions received in cash $20,715,000 $20,715,000 $20,715,000 $20,715,000
Noncash contributions recognized 2,140,000 2,000,000 2,440,000 0
Capital contributions recognized 0 0 1,351,000 0
Change in pledges receivable (1,819,000) 121,000 48,000 48,000
Change in deferred revenue 0 (8,000) 2,388,000 2,388,000
Contributions recognized $21,036,000 $22,828,000 $26,942,000 $23,151,000
Grants received in cash $845,000 $845,000 $845,000 $845,000
Change in grants receivable 78,000 (42,000) (42,000) (42,000)
Change in deferred revenue 0 (193,000) (193,000) (193,000)
Grants recognized in revenue $923,000 $610,000 $610,000 $610,000
Total grants and contributions $21,959,000 $23,438,000 $27,552,000 $23,761,000
TERESA P. GORDON AND SALEHA B. KHUMAWALA344
Noncash contributions of services and materials are also treateddifferently under the various models. These differences rarely affect the‘‘bottom line’’ because recognition increases revenues and expenses equally.FASB has more restrictive rules than Anthony with respect to what types ofservices can be recognized and GASB is silent with respect to contributedservices.2 In our examples, only the $2,000,000 fair value of donated worksof art are recognized in the GASB statements, whereas $50,000 in donatedsupplies for the art school and $90,000 in donated legal services inmanagement and general are recognized in the FASB statements. Noncashcontributions under Anthony are larger by an additional $300,000 inservices related to docents because this type of volunteer service does notmeet the FASB recognition standards. In contrast, no noncash contribu-tions are recognized on the Mautz Statement of Support and Expenditures(see Exhibit 6.2 in Chapter 6 of Section II).
Revenues from contributions and grants are displayed differently under thefour models. FASB presents contributions and grants at the top of itsStatement of Activities (Exhibit 3.2 in Chapter 3 of Section II) as part of totalpublic support and revenues. The GASB Statement of Activities (Exhibit 4.2in Chapter 4 of Section II) starts with expenses and then subtracts $1,988,000in operating grants and contributions as part of program revenues. Theremaining $10,950,000 in unrestricted contributions is reported as part ofgeneral revenues in the bottom section of the statement along with thecontributions toward endowments and donated art. Mautz also presentsoperating costs first and then subtracts $14,651,000 in contributions and$610,000 in grants (see Exhibit 6.2 in Chapter 6 of Section II). The remaining$8,500,000 in endowment gifts is presented after ‘‘net expenditures foroperations’’ under the heading ‘‘other increases in net assets.’’ The totaldiffers from Anthony by the amount of noncash contributions and thetransfer to cover depreciation on donated buildings and equipment. However,the Anthony amounts are spread over two different statements. The operatingstatement reports $13,743,000, the sum of the first four revenue amounts onExhibit 5.3 in Chapter 5 of Section II. The remaining $13,809,000 in cash andnoncash contributions is reported as the first two lines under increases incontributed capital on Exhibit 5.4 in Chapter 5 of Section II.
7.2.2. Expenses
Generally, there are few differences in recognition criteria for expenses.Differences arise primarily from depreciation and noncash contributed
Comparison of Financial Statements 345
services or supplies. As shown in Table 7.6, the functional expenses onthe FASB and GASB Statements of Activities (Exhibits 3.2 and 4.2 inChapters 3 and 4 of Section II) are substantially the same despite thedifferences in display. Total expenses under the FASB model are $300,000lower than what is reported in Anthony’s Operating Statement (Exhibit 5.3in Chapter 5 of Section II) due to the limited recognition of donated servicespermitted under SFAS No. 116. Likewise, FASB’s expenses are $140,000higher than GASB’s expenses since some recognition of noncash donationsof supplies and services is required by FASB.
Mautz’s statement of support and expenditures is most similar to theGASB funds-based statement: both omit depreciation expense and presentcapital outlays as expenditures (see Table 7.6). Consequently, the functionalcategories on Mautz’s Statement of Support and Expenditures (Exhibit 6.2in Chapter 6 of Section II) match those on the GASB funds-based Statementof Revenues, Expenditures, and Changes in Fund Balance (Exhibit 4.4 inChapter 4 of Section II), with one exception; the $200,000 difference is amatter of display – certain additional costs related to the Gala Ball arenetted against revenue on the Mautz Statement of Support and Expendi-tures (Exhibit 6.2 in Chapter 6 of Section II).
GASB and Mautz are also similar in the way they choose to display for-profit and NFP activities separately. However, GASB uses ‘‘business-typeactivities’’ more loosely than Mautz and governmental entities with bothbusiness-type and nonbusiness-type activities may report as though allactivities were business-type, generally based on whether fees are chargedfor services. Mautz makes a clear distinction between commercial and NFPendeavors. However, both Mautz and GASB show a concern for accountingon the basis of resources available rather than accrual accounting, althoughonly GASB’s approach includes statements under both. Additionally, theGASB Statement of Activities (Exhibit 4.2 in Chapter 4 of Section II) andthe Mautz Statement of Support and Expenditures (Exhibit 6.2 in Chapter 6of Section II) present expenses before revenues – in recognition of the factthat nonbusiness organizations exist to provide services and thereby incurcosts.
The largest difference between expenses and expenditures is the$1,800,000 in depreciation expense. Mautz does not record depreciationexpense on service facilities. This is consistent with Sunder (1999) whoargues that public-goods organizations have beneficiaries as opposed tocustomers (who can withhold purchases). Since goods are not sold tocustomers at a price, there is no need to use depreciation as part of a pricesetting policy. Other accountants argue that depreciation of plant assets is
TERESA P. GORDON AND SALEHA B. KHUMAWALA346
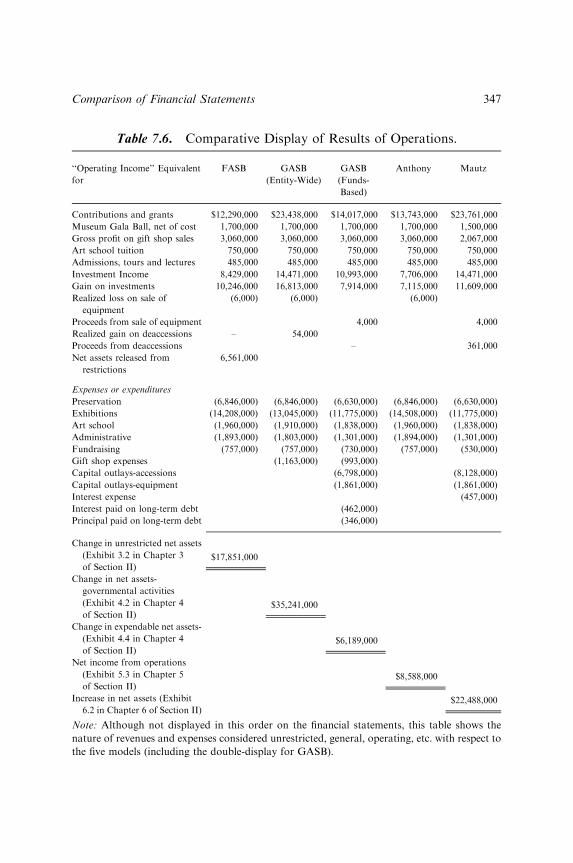
Table 7.6. Comparative Display of Results of Operations.
‘‘Operating Income’’ Equivalent
for
FASB GASB
(Entity-Wide)
GASB
(Funds-
Based)
Anthony Mautz
Contributions and grants $12,290,000 $23,438,000 $14,017,000 $13,743,000 $23,761,000
Museum Gala Ball, net of cost 1,700,000 1,700,000 1,700,000 1,700,000 1,500,000
Gross profit on gift shop sales 3,060,000 3,060,000 3,060,000 3,060,000 2,067,000
Art school tuition 750,000 750,000 750,000 750,000 750,000
Admissions, tours and lectures 485,000 485,000 485,000 485,000 485,000
Investment Income 8,429,000 14,471,000 10,993,000 7,706,000 14,471,000
Gain on investments 10,246,000 16,813,000 7,914,000 7,115,000 11,609,000
Realized loss on sale of
equipment
(6,000) (6,000) (6,000)
Proceeds from sale of equipment 4,000 4,000
Realized gain on deaccessions – 54,000
Proceeds from deaccessions – 361,000
Net assets released from
restrictions
6,561,000
Expenses or expenditures
Preservation (6,846,000) (6,846,000) (6,630,000) (6,846,000) (6,630,000)
Exhibitions (14,208,000) (13,045,000) (11,775,000) (14,508,000) (11,775,000)
Art school (1,960,000) (1,910,000) (1,838,000) (1,960,000) (1,838,000)
Administrative (1,893,000) (1,803,000) (1,301,000) (1,894,000) (1,301,000)
Fundraising (757,000) (757,000) (730,000) (757,000) (530,000)
Gift shop expenses (1,163,000) (993,000)
Capital outlays-accessions (6,798,000) (8,128,000)
Capital outlays-equipment (1,861,000) (1,861,000)
Interest expense (457,000)
Interest paid on long-term debt (462,000)
Principal paid on long-term debt (346,000)
Change in unrestricted net assets
(Exhibit 3.2 in Chapter 3
of Section II)$17,851,000
Change in net assets-
governmental activities
(Exhibit 4.2 in Chapter 4
of Section II)$35,241,000
Change in expendable net assets-
(Exhibit 4.4 in Chapter 4
of Section II)$6,189,000
Net income from operations
(Exhibit 5.3 in Chapter 5
of Section II)$8,588,000
Increase in net assets (Exhibit
6.2 in Chapter 6 of Section II)$22,488,000
Note: Although not displayed in this order on the financial statements, this table shows the
nature of revenues and expenses considered unrestricted, general, operating, etc. with respect to
the five models (including the double-display for GASB).
Comparison of Financial Statements 347
useful because it helps measure the ‘‘true’’ cost of providing services.Theoretically, although depreciation might be viewed as a source of fundsthat could be used to replace assets, it only functions that way if anorganization actually sets aside cash or investments equal to depreciationexpense. The issue of depreciation is also problematic in the NFP setting ifthe assets will be maintained indefinitely – particularly if they are consideredirreplaceable. That is why no depreciation of collection items is recognizedin the FASB and GASB examples, even though collection items arecapitalized.
7.2.3. Results of Operations
The combined effect of the different revenue and expense recognitioncriteria under the four models has a dramatic impact on the ‘‘bottom line’’as shown in Table 7.6. The FASB standards permit intermediate subtotalson the Statement of Activities but imply that the change in unrestricted netassets should generally be a satisfactory indicator of the results of currentoperations (see SFAS No. 117, Paragraph 112, FASB, 1993b). The GASBequivalent would possibly be the change in expendable net assets but thisfigure is not available on an accrual basis. Accordingly, we have includedtwo versions of ‘‘the bottom line’’ for GASB in Table 7.6. Each is potentiallyuseful for different purposes. The differences between Anthony and FASBcenter on two major issues. The first difference is the relative importance ofthe balance sheet as compared to the income statement. FASB generallytakes the position that assets and liabilities should be measured directly andthat measuring the change in assets and liabilities (net assets) is the best wayto measure the results of operations. In contrast, the Anthony modeldirectly measures revenues and expenses to arrive at a figure that representsoperating results, and assets are measured indirectly as ‘‘the forms in whichan entity’s capital exists’’ (Anthony, 1983, Concept 7.02, p. 177).
A second difference results from the way FASB defines temporarily andpermanently restricted net assets. Based on its own definition of liabilities(SFAC No. 6), FASB concluded that restricted contributions do not giverise to liabilities. Therefore, SFAS No. 116 requires immediate recognitionof all contributions as support (a type of revenue). Comparatively,according to Anthony, the only real difference between business andnonprofit organizations is their source of capital: businesses obtain capitalfrom equity investors and creditors and nonprofit organizations obtaincapital from contributors and creditors (Anthony, 1989, p. 1). Hence,
TERESA P. GORDON AND SALEHA B. KHUMAWALA348
Anthony argues permanently restricted net assets should not be recognizedas revenue because they constitute a contribution to capital just as issues ofcommon stock are considered contributed capital in a business organization.To Anthony, temporarily restricted contributions give rise to an obligationto provide services or take other actions specified by the donor.Accordingly, he would record deferred revenue as a liability until theservices were provided, thus matching the revenue to the expenses incurredto satisfy the obligation.
Interestingly, the Mautz Statement of Revenue and Support shows thelargest increase in net assets since the presentation does not display theunrestricted versus donor-restricted net asset changes. This could be clarifiedthrough footnote disclosures; the balances designated for specific uses areclearly displayed under the Mautz examples (see notes to Exhibit 6.1 inChapter 6 of Section II). From this information, it would be possible tocompute the change in net assets related to donor-restricted net assets. TheAnthony model is the only one of the four that is explicitly interested in ameasure that could be used to evaluate performance during the year. The$8,588,000 reported on Anthony’s Operating Statement (Exhibit 5.3 inChapter 5 of Section II) is much smaller than the FASB and GASB accrual-based number because change in net assets related to endowments and plantare reported on a separate statement (Exhibit 5.4 in Chapter 5 of Section II).Anthony would argue that the operating statement (Exhibit 5.3 in Chapter 5of Section II) is the only statement of the five on Table 7.6 that clearlypresents operating results because it matches revenues to accomplishments(functional expenses).
7.2.4. Matters of Display
The usefulness of the various presentations is debatable. FASB and GASBhave the benefit of a growing level of familiarity since users are accustomedto statements in these formats. However, GASB makes a distinctionbetween operating and contributed capital similar to that recommended byAnthony. GASB displays the general fund (unrestricted or expendable)separately from nonexpendable (restricted) funds in at least the funds-basedstatements. GASB’s statement of activities is organized in such a way thattransfers between restricted and unrestricted funds do not have to bedisplayed, simplifying the statement and making it unnecessary to counttemporarily restricted contributions twice (once when received and again
Comparison of Financial Statements 349
when reclassified to unrestricted when the restriction is released). However,the GASB reports are voluminous and therefore arguably intimidating.
The multiple balance sheets under the Anthony model can also causeconfusion. Out of the four, the Mautz model has the simplest display and isintended to answer the following questions:
(1) How much did the entity receive during the reporting period and fromwhat sources?
(2) What did the entity do with what it received?(3) How much does the entity have left?(4) What are the entity’s plans and commitments for the future? (Mautz,
1994, p. 110)
Mautz is the only one to provide information about future anticipatedoperations in the unique Statement of Commitments (Exhibit 6.3 inChapter 6 of Section II). That said, Mautz is also the only one to notinclude a Statement of Cash Flows. One could argue that the Cash FlowStatement is not necessary since the Mautz presentation is on a modified-cash basis. This is because where the Anthony model reflects mostlysimilarities between business and nonprofit organization, the Mautz modelrecognizes significant differences. The major difference is the way cash flowsthrough the organization. Generating profits for owners is the main objectiveof operations of a for-profit business, whereas a nonprofit organizationgenerally aims to provide service to the public. Therefore, two additionalelements were included in the Mautz model: service facilities and commit-ments. According to Mautz, the service facilities are cash outflow items andresemble assets except that they use cash rather than generate cash as normalassets would. In his view, adding these cash-consuming items into assetswould be misleading and provide no value to financial statement users.However, the service facilities are not classified as liabilities under Mautzeither, since nonprofit organizations provide service without expecting any-thing in return. This unique characteristic makes service facilities neitherassets nor liabilities under the Mautz model.
With respect to the Statement of Cash Flows, GASB’s presentation isarguably better than that of FASB, mainly because FASB does not requirethe direct method that is mandatory for GASB institutions. Moreover,Anthony did not spend much time discussing the need for a statement ofcash flows but agreed that it was necessary (concept 8.06, Anthony, 1983,p. 204). In a way, the cash flow statements are the ‘‘most alike’’ of any of thestatements mandated by FASB, GASB, or Anthony.
TERESA P. GORDON AND SALEHA B. KHUMAWALA350
7.3. EVALUATION OF THE MODELS
Nonbusiness public-good organizations are often criticized for presentingexcessive detail and for their failure to aggregate financial informationsufficiently to provide the reader with a clear overall picture. FASB andMautz both opposed the reporting of detailed information about the fundswhile agreeing that fund accounting might be useful for internal control ormanagement purpose. GASB attempts to meet the needs of all parties bya dual presentation that provides sufficient detail regarding funds andalso gives an entity-wide perspective. Anthony imposes a two-fund structureon both business and nonbusiness entities to segregate earned operatingcapital from contributed capital transactions. All four approaches seem tohave balanced the need for detail with the need for sufficient brevity toprovide a view of the entity as a whole rather than just the details aboutthe parts.
Although the differences between GASB and FASB are significant, thestandards also share a number of similarities. The more profounddifferences are those between FASB/GASB and the views of Anthony andMautz. In their proposed models, both Anthony and Mautz agree that anobligation to donors is equivalent to a liability. However, Anthony’sapproach is based on the premise that nonbusiness and business accountingshould be similar, whereas Mautz believes that the differences should lead todifferent standards. On a continuum, FASB and GASB would besomewhere between them, closer to Anthony in some respects, closer toMautz in others.
Although the Anthony, FASB, and GASB conceptual frameworks aredetailed, Mautz’s principles are general and this makes his position notentirely clear on some aspects of nonprofit accounting. Our comparison ofthe four models, described at length in Chapters 3 through 6 of Section IIclearly may be useful to standard setters considering issues of internationalharmonization. Some choices must be made between underlying theoreticalconcepts. Even if the overriding concerns are decision usefulness andaccountability, it is clear that reasonable people can produce and defend anumber of options. Empirical testing could potentially be used to see whichmeasurement approaches and displays are the most useful to the uniquedecision makers of nonbusiness entities: contributors and taxpayers.
Comparability issues also remain a concern. In particular, the differencesbetween FASB and GASB are troublesome for financial statement users inindustries like higher education and health care, since the entities areproviding the same services but (sometimes) measuring and reporting results
Comparison of Financial Statements 351
differently. Prior to the establishment of the new FASB and GASB models,these industries followed the same accounting standards as embodied inAICPA industry audit guides. When financial statement users were askedabout the importance of having the same set of standards for all of highereducation, the issue was ranked as the 10th most important item out of 75(Engstrom, 1988). In comparison, having public universities follow the samestandards as the controlling governmental entity was ranked near thebottom (64th of 75 items). Subsequent to the current FASB and GASBstandards, comparisons among institutions of higher education becamemore difficult as has been discussed at length by Engstrom and Esmond-Kiger (1997) and Fischer (1997).
One possible solution is for all entities to follow the same set of standardsunder a concept referred to as sector neutrality.3 This notion presumes thatthere is little need for different sets of standards, although there might besupplementary rules for the two special sets of transactions that almostnever confront commercial enterprises: nonreciprocal contributions andimposed nonexchange transactions. Sector neutrality is consistent withAnthony’s general approach to standard setting (1983, 1989). In addition,standards might need to address the fact that resource providers often placerestrictions on funds to be used by governments and NFP entities. Theserestrictions require that choices be made about the timing of revenuerecognition and whether restricted funds must be accounted for anddisclosed separately.
7.4. CONCLUSION
In this research study, we briefly examine the development of U.S.accounting practices for nonbusiness entities beginning with theories aboutthe origin of voluntary NFP entities (Chapter 1 in Section II). An exami-nation of key theoretical concepts (Chapter 2 in Section II) then provides afoundation for the discussion of existing GAAP for NFP entities (FASB)and public governmental entities (GASB) as well as alternate accountingmodels proposed by Robert Anthony and Robert Mautz (Chapters 3through 6 in Section II). Using a uniform set of economic transactions for amuseum, we have illustrated the financial statements that would result fromapplication of the four models. In this final chapter, we compare theexamples and identify differences in measurement and display that couldpotentially impact the decisions that donors and other resource providersmake.
TERESA P. GORDON AND SALEHA B. KHUMAWALA352
Our goal is to bring together theoretical concepts and alternateapproaches in a way that can facilitate discussions about the futuredirection of nonbusiness accounting and financial reporting. We believe thetopic is timely given several current trends. First, major changes in financialstatement presentation for business entities are currently under discussionalong with changes to revenue recognition (FASB, 2008a, 2008b). Businesspeople serve on the boards of NFP entities and often expect the accountingto be similar to the accounting practices in the business world. Since FASBsets standards for both for-profit and NFP entities, for-profit accountingand reporting changes trickle down and impact financial reporting for NFPentities. Thus change in the for-profit accounting model may provide anopportunity to revisit the U.S. standards for NFP financial reporting. Thesecond important trend is the internationalization of accounting standardsand the fact that no international standard setting organization has yetconsidered the unique accounting and financial reporting requirements forNFP entities. Accordingly, we believe that changes to the current U.S.standards and the development of comparable standards around the worldmake the topic of this study relevant. The debates in the early 1990s werevigorous and sometimes acrimonious. The decisions that were made werenot necessarily welcomed by all constituents. We hope that the ideas wehave gathered together and illustrated in this research study can provide astarting point for a similar period of deliberations on the future ofnonbusiness accounting and financial reporting.
NOTES
1. As mentioned in Chapter 5 in Section II, Professor Anthony reviewed his set offinancial statements and agreed with our decision.2. GASB Statement No. 33 provides examples of donated artwork and real
property. Although there is no prohibition on the recognition of contributed suppliesor services, the topic has not been specifically addressed by the Board.3. Sector neutrality has been the dominant view in New Zealand since at least
1994 and a single conceptual framework applies to for-profit businesses, NFP entitiesand government (Cordery & Baskerville, 2007).
REFERENCES
Anthony, R. N. (1983). Tell it like it was: A conceptual framework for financial accounting.
Homewood, IL: Richard D. Irwin, Inc.
Comparison of Financial Statements 353

Anthony, R. N. (1989). Should business and nonbusiness accounting be different? Boston, MA:
Harvard Business School Press.
Cordery, C. J., & Baskerville, R. F. (2007). Charity financial reporting regulation: A
comparative study of the UK and New Zealand. Accounting History, 12(1), 7–27.
Engstrom, J. H. (1988). Information needs of college and university financial decision makers.
Research Report. Norwalk, CT: Governmental Accounting Standards Board.
Engstrom, J. H., & Esmond-Kiger, C. (1997). Different formats, same user needs: A
comparison of the FASB and GASB college and university financial reporting models.
Accounting Horizons, 11(3), 16–34.
Financial Accounting Standards Board (FASB). (1993a). Statement of financial accounting
standards no. 116 – Accounting for contributions received and made. Norwalk, CT:
Financial Accounting Standards Board.
Financial Accounting Standards Board (FASB). (1993b). Statement of financial accounting
standards no. 117 – Financial statements of not-for-profit organizations. Norwalk, CT:
Financial Accounting Standards Board.
Financial Accounting Standards Board (FASB). (1995). Statement of financial accounting
standards (SFAS) no. 124 – Accounting for certain investments held by not-for-profit
organizations. Norwalk, CT: Financial Accounting Standards Board.
Financial Accounting Standards Board (FASB). (2008a). Preliminary views on financial
statement presentation. Discussion Paper. Norwalk, CT: Financial Accounting
Standards Board.
Financial Accounting Standards Board (FASB). (2008b). Preliminary views on revenue
recognition in contracts with customers. Discussion Paper. Norwalk, CT: Financial
Accounting Standards Board.
Fischer, M. (1997). Two accounting standard setters. Journal of Public Budgeting, Accounting &
Financial Management, 9(2), 251–284.
Governmental Accounting Standards Board (GASB). (1997). Statement no. 31: Accounting and
financial reporting for certain investments and for external investment pools. Norwalk, CT:
Governmental Accounting Standards Board.
Governmental Accounting Standards Board (GASB). (1998). Statement no. 33: Accounting and
financial reporting for nonexchange transactions. Norwalk, CT: Governmental Account-
ing Standards Board.
Mautz, R. K. (1994). Financial reporting for nonprofit organizations: A fresh look. New York,
NY: Garland Publishing, Inc.
Sunder, S. (1999). A theory of accounting and controls for organizations producing public-versus
private-goods. Working Paper, School of Management, Yale University.
TERESA P. GORDON AND SALEHA B. KHUMAWALA354
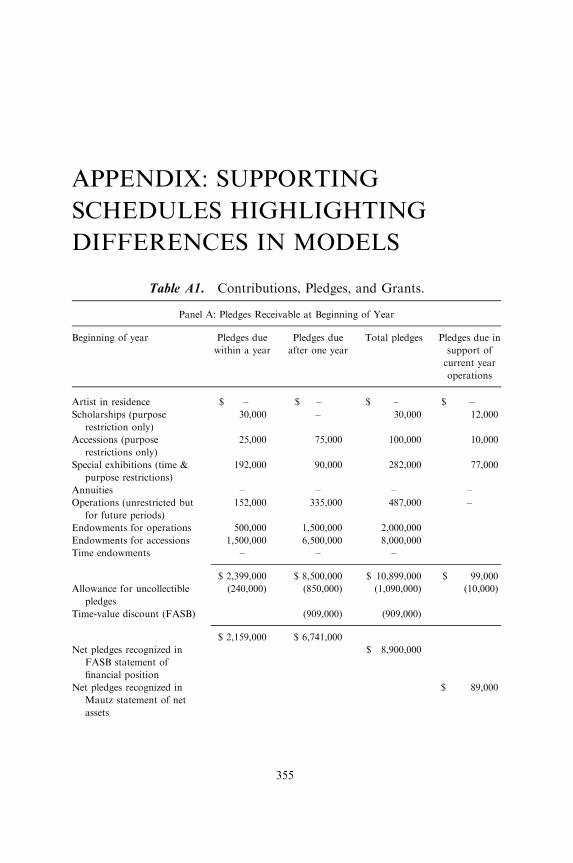
APPENDIX: SUPPORTING
SCHEDULES HIGHLIGHTING
DIFFERENCES IN MODELS
Table A1. Contributions, Pledges, and Grants.
Panel A: Pledges Receivable at Beginning of Year
Beginning of year Pledges due
within a year
Pledges due
after one year
Total pledges Pledges due in
support of
current year
operations
Artist in residence $ – $ – $ – $ –
Scholarships (purpose
restriction only)
30,000 – 30,000 12,000
Accessions (purpose
restrictions only)
25,000 75,000 100,000 10,000
Special exhibitions (time &
purpose restrictions)
192,000 90,000 282,000 77,000
Annuities – – – –
Operations (unrestricted but
for future periods)
152,000 335,000 487,000 –
Endowments for operations 500,000 1,500,000 2,000,000
Endowments for accessions 1,500,000 6,500,000 8,000,000
Time endowments – – –
$ 2,399,000 $ 8,500,000 $ 10,899,000 $ 99,000
Allowance for uncollectible
pledges
(240,000) (850,000) (1,090,000) (10,000)
Time-value discount (FASB) (909,000) (909,000)
$ 2,159,000 $ 6,741,000
Net pledges recognized in
FASB statement of
financial position
$ 8,900,000
Net pledges recognized in
Mautz statement of net
assets
$ 89,000
355
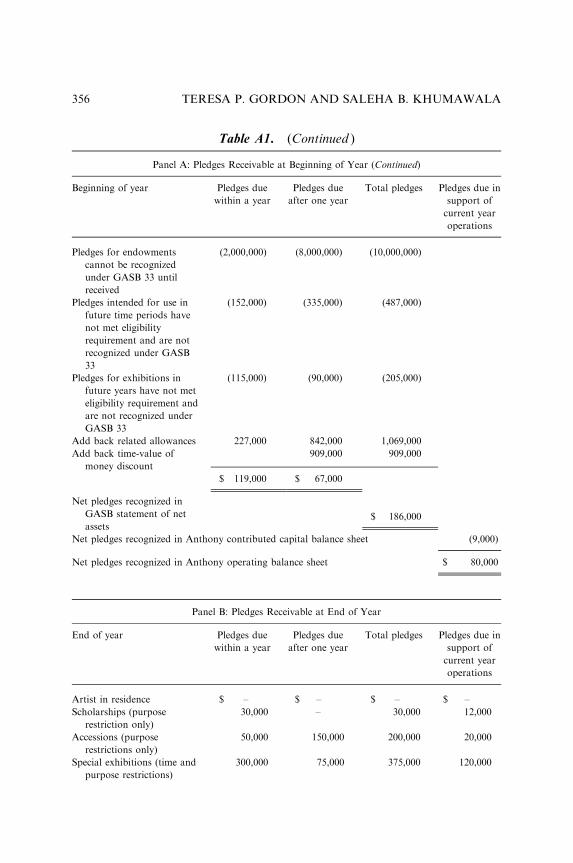
Panel A: Pledges Receivable at Beginning of Year (Continued)
Beginning of year Pledges due
within a year
Pledges due
after one year
Total pledges Pledges due in
support of
current year
operations
Pledges for endowments
cannot be recognized
under GASB 33 until
received
(2,000,000) (8,000,000) (10,000,000)
Pledges intended for use in
future time periods have
not met eligibility
requirement and are not
recognized under GASB
33
(152,000) (335,000) (487,000)
Pledges for exhibitions in
future years have not met
eligibility requirement and
are not recognized under
GASB 33
(115,000) (90,000) (205,000)
Add back related allowances 227,000 842,000 1,069,000
Add back time-value of
money discount
909,000 909,000
$ 119,000 $ 67,000
Net pledges recognized in
GASB statement of net
assets$ 186,000
Net pledges recognized in Anthony contributed capital balance sheet (9,000)
Net pledges recognized in Anthony operating balance sheet $ 80,000
Panel B: Pledges Receivable at End of Year
End of year Pledges due
within a year
Pledges due
after one year
Total pledges Pledges due in
support of
current year
operations
Artist in residence $ – $ – $ – $ –
Scholarships (purpose
restriction only)
30,000 – 30,000 12,000
Accessions (purpose
restrictions only)
50,000 150,000 200,000 20,000
Special exhibitions (time and
purpose restrictions)
300,000 75,000 375,000 120,000
Table A1. (Continued )
TERESA P. GORDON AND SALEHA B. KHUMAWALA356
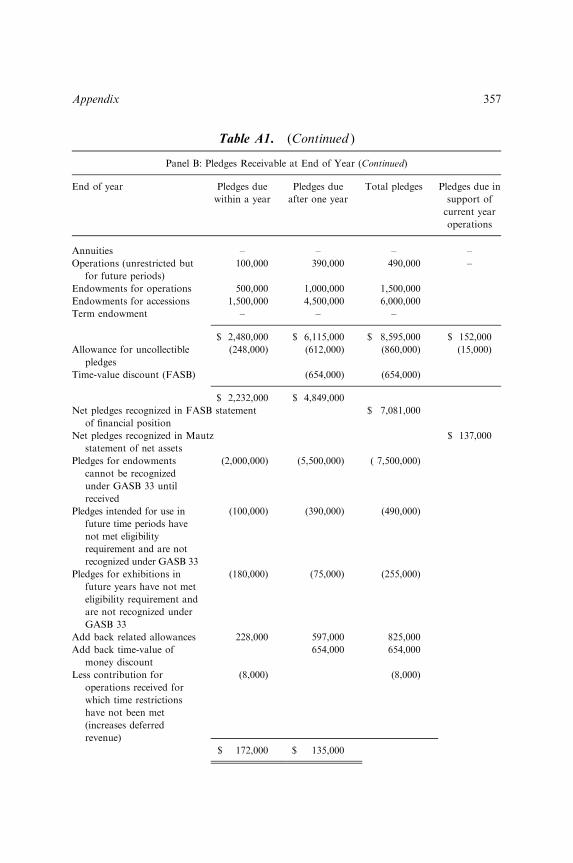
Panel B: Pledges Receivable at End of Year (Continued)
End of year Pledges due
within a year
Pledges due
after one year
Total pledges Pledges due in
support of
current year
operations
Annuities – – – –
Operations (unrestricted but
for future periods)
100,000 390,000 490,000 –
Endowments for operations 500,000 1,000,000 1,500,000
Endowments for accessions 1,500,000 4,500,000 6,000,000
Term endowment – – –
$ 2,480,000 $ 6,115,000 $ 8,595,000 $ 152,000
Allowance for uncollectible
pledges
(248,000) (612,000) (860,000) (15,000)
Time-value discount (FASB) (654,000) (654,000)
$ 2,232,000 $ 4,849,000
Net pledges recognized in FASB statement
of financial position
$ 7,081,000
Net pledges recognized in Mautz
statement of net assets
$ 137,000
Pledges for endowments
cannot be recognized
under GASB 33 until
received
(2,000,000) (5,500,000) ( 7,500,000)
Pledges intended for use in
future time periods have
not met eligibility
requirement and are not
recognized under GASB 33
(100,000) (390,000) (490,000)
Pledges for exhibitions in
future years have not met
eligibility requirement and
are not recognized under
GASB 33
(180,000) (75,000) (255,000)
Add back related allowances 228,000 597,000 825,000
Add back time-value of
money discount
654,000 654,000
Less contribution for
operations received for
which time restrictions
have not been met
(increases deferred
revenue)
(8,000) (8,000)
$ 172,000 $ 135,000
Table A1. (Continued )
Appendix 357
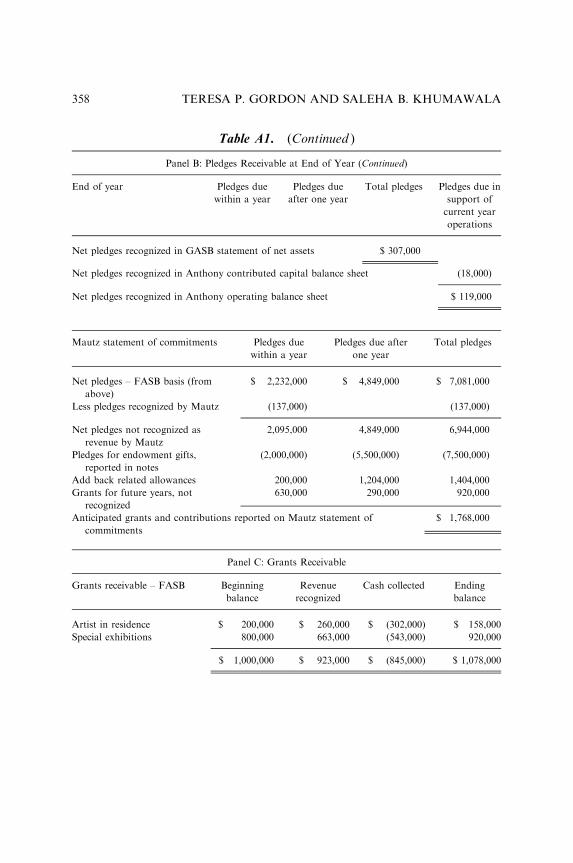
Panel B: Pledges Receivable at End of Year (Continued)
End of year Pledges due
within a year
Pledges due
after one year
Total pledges Pledges due in
support of
current year
operations
Net pledges recognized in GASB statement of net assets $ 307,000
Net pledges recognized in Anthony contributed capital balance sheet (18,000)
Net pledges recognized in Anthony operating balance sheet $ 119,000
Mautz statement of commitments Pledges due
within a year
Pledges due after
one year
Total pledges
Net pledges – FASB basis (from
above)
$ 2,232,000 $ 4,849,000 $ 7,081,000
Less pledges recognized by Mautz (137,000) (137,000)
Net pledges not recognized as
revenue by Mautz
2,095,000 4,849,000 6,944,000
Pledges for endowment gifts,
reported in notes
(2,000,000) (5,500,000) (7,500,000)
Add back related allowances 200,000 1,204,000 1,404,000
Grants for future years, not
recognized
630,000 290,000 920,000
Anticipated grants and contributions reported on Mautz statement of
commitments
$ 1,768,000
Panel C: Grants Receivable
Grants receivable – FASB Beginning
balance
Revenue
recognized
Cash collected Ending
balance
Artist in residence $ 200,000 $ 260,000 $ (302,000) $ 158,000
Special exhibitions 800,000 663,000 (543,000) 920,000
$ 1,000,000 $ 923,000 $ (845,000) $ 1,078,000
Table A1. (Continued )
TERESA P. GORDON AND SALEHA B. KHUMAWALA358
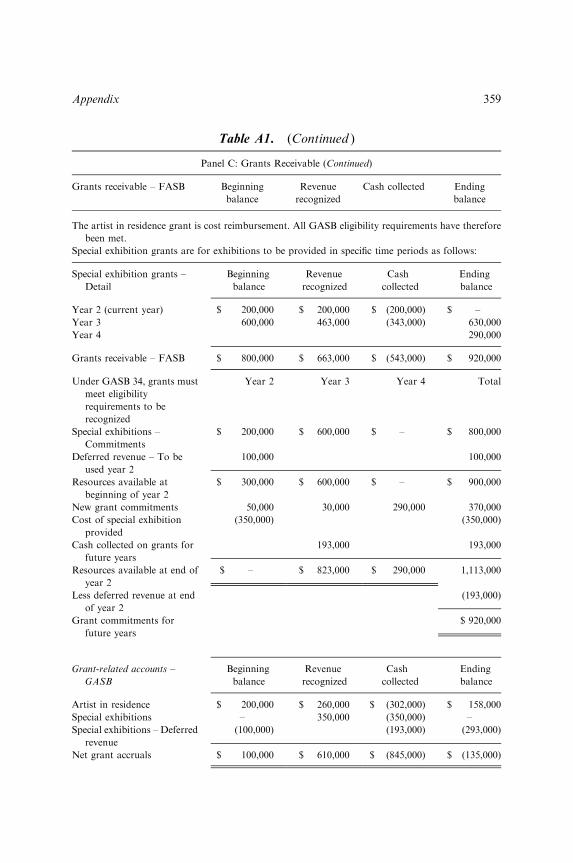
Panel C: Grants Receivable (Continued)
Grants receivable – FASB Beginning
balance
Revenue
recognized
Cash collected Ending
balance
The artist in residence grant is cost reimbursement. All GASB eligibility requirements have therefore
been met.
Special exhibition grants are for exhibitions to be provided in specific time periods as follows:
Special exhibition grants –
Detail
Beginning
balance
Revenue
recognized
Cash
collected
Ending
balance
Year 2 (current year) $ 200,000 $ 200,000 $ (200,000) $ –
Year 3 600,000 463,000 (343,000) 630,000
Year 4 290,000
Grants receivable – FASB $ 800,000 $ 663,000 $ (543,000) $ 920,000
Under GASB 34, grants must
meet eligibility
requirements to be
recognized
Year 2 Year 3 Year 4 Total
Special exhibitions –
Commitments
$ 200,000 $ 600,000 $ – $ 800,000
Deferred revenue – To be
used year 2
100,000 100,000
Resources available at
beginning of year 2
$ 300,000 $ 600,000 $ – $ 900,000
New grant commitments 50,000 30,000 290,000 370,000
Cost of special exhibition
provided
(350,000) (350,000)
Cash collected on grants for
future years
193,000 193,000
Resources available at end of
year 2
$ – $ 823,000 $ 290,000 1,113,000
Less deferred revenue at end
of year 2
(193,000)
Grant commitments for
future years
$ 920,000
Grant-related accounts –
GASB
Beginning
balance
Revenue
recognized
Cash
collected
Ending
balance
Artist in residence $ 200,000 $ 260,000 $ (302,000) $ 158,000
Special exhibitions – 350,000 (350,000) –
Special exhibitions – Deferred
revenue
(100,000) (193,000) (293,000)
Net grant accruals $ 100,000 $ 610,000 $ (845,000) $ (135,000)
Table A1. (Continued )
Appendix 359
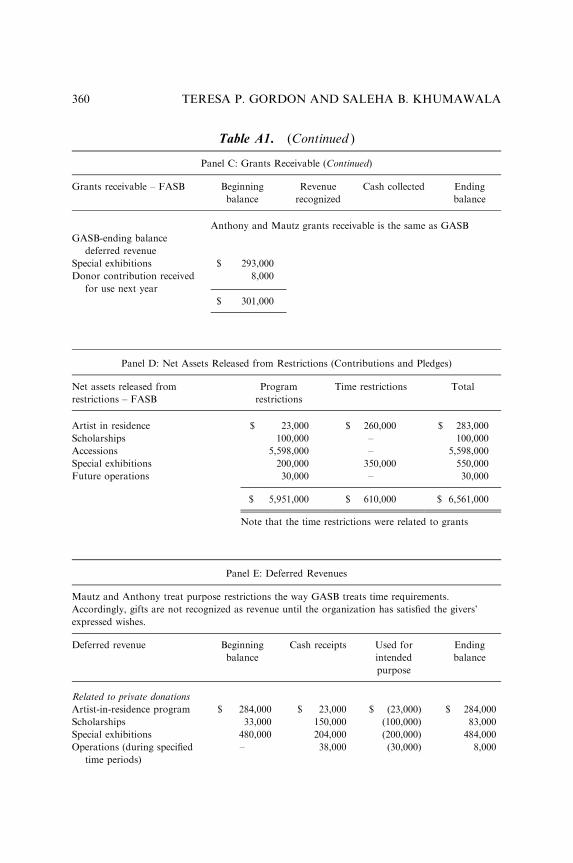
Panel C: Grants Receivable (Continued)
Grants receivable – FASB Beginning
balance
Revenue
recognized
Cash collected Ending
balance
Anthony and Mautz grants receivable is the same as GASB
GASB-ending balance
deferred revenue
Special exhibitions $ 293,000
Donor contribution received
for use next year
8,000
$ 301,000
Panel D: Net Assets Released from Restrictions (Contributions and Pledges)
Net assets released from
restrictions – FASB
Program
restrictions
Time restrictions Total
Artist in residence $ 23,000 $ 260,000 $ 283,000
Scholarships 100,000 – 100,000
Accessions 5,598,000 – 5,598,000
Special exhibitions 200,000 350,000 550,000
Future operations 30,000 – 30,000
$ 5,951,000 $ 610,000 $ 6,561,000
Note that the time restrictions were related to grants
Panel E: Deferred Revenues
Mautz and Anthony treat purpose restrictions the way GASB treats time requirements.
Accordingly, gifts are not recognized as revenue until the organization has satisfied the givers’
expressed wishes.
Deferred revenue Beginning
balance
Cash receipts Used for
intended
purpose
Ending
balance
Related to private donations
Artist-in-residence program $ 284,000 $ 23,000 $ (23,000) $ 284,000
Scholarships 33,000 150,000 (100,000) 83,000
Special exhibitions 480,000 204,000 (200,000) 484,000
Operations (during specified
time periods)
– 38,000 (30,000) 8,000
Table A1. (Continued )
TERESA P. GORDON AND SALEHA B. KHUMAWALA360
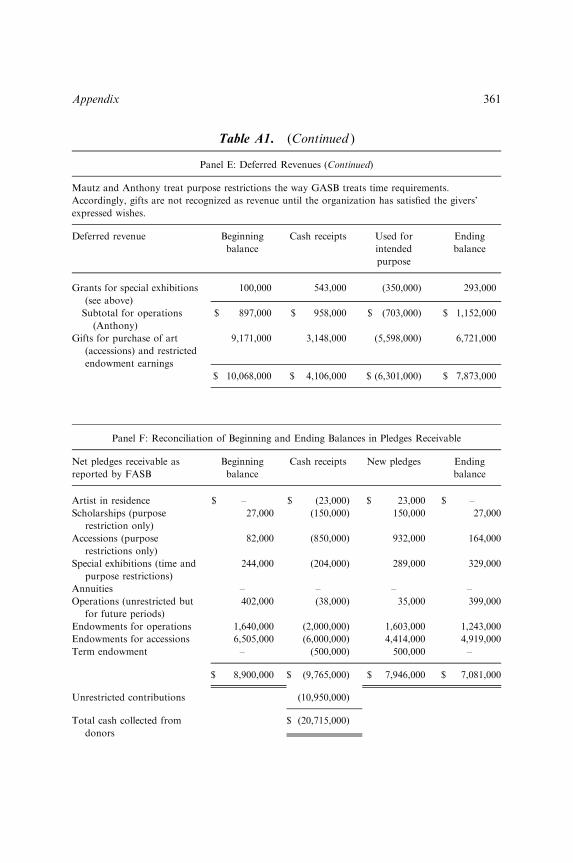
Panel E: Deferred Revenues (Continued)
Mautz and Anthony treat purpose restrictions the way GASB treats time requirements.
Accordingly, gifts are not recognized as revenue until the organization has satisfied the givers’
expressed wishes.
Deferred revenue Beginning
balance
Cash receipts Used for
intended
purpose
Ending
balance
Grants for special exhibitions
(see above)
100,000 543,000 (350,000) 293,000
Subtotal for operations
(Anthony)
$ 897,000 $ 958,000 $ (703,000) $ 1,152,000
Gifts for purchase of art
(accessions) and restricted
endowment earnings
9,171,000 3,148,000 (5,598,000) 6,721,000
$ 10,068,000 $ 4,106,000 $ (6,301,000) $ 7,873,000
Panel F: Reconciliation of Beginning and Ending Balances in Pledges Receivable
Net pledges receivable as
reported by FASB
Beginning
balance
Cash receipts New pledges Ending
balance
Artist in residence $ – $ (23,000) $ 23,000 $ –
Scholarships (purpose
restriction only)
27,000 (150,000) 150,000 27,000
Accessions (purpose
restrictions only)
82,000 (850,000) 932,000 164,000
Special exhibitions (time and
purpose restrictions)
244,000 (204,000) 289,000 329,000
Annuities – – – –
Operations (unrestricted but
for future periods)
402,000 (38,000) 35,000 399,000
Endowments for operations 1,640,000 (2,000,000) 1,603,000 1,243,000
Endowments for accessions 6,505,000 (6,000,000) 4,414,000 4,919,000
Term endowment – (500,000) 500,000 –
$ 8,900,000 $ (9,765,000) $ 7,946,000 $ 7,081,000
Unrestricted contributions (10,950,000)
Total cash collected from
donors
$ (20,715,000)
Table A1. (Continued )
Appendix 361
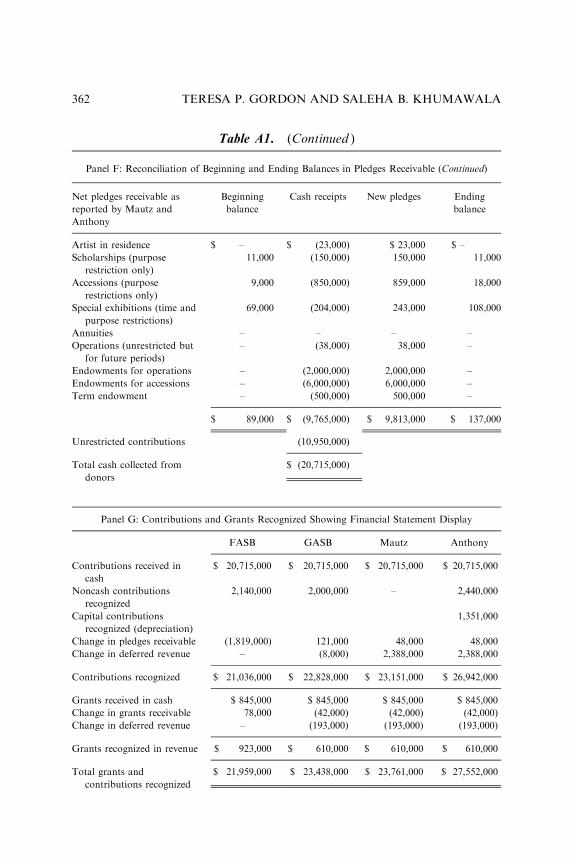
Net pledges receivable as
reported by Mautz and
Anthony
Beginning
balance
Cash receipts New pledges Ending
balance
Artist in residence $ – $ (23,000) $ 23,000 $ –
Scholarships (purpose
restriction only)
11,000 (150,000) 150,000 11,000
Accessions (purpose
restrictions only)
9,000 (850,000) 859,000 18,000
Special exhibitions (time and
purpose restrictions)
69,000 (204,000) 243,000 108,000
Annuities – – – –
Operations (unrestricted but
for future periods)
– (38,000) 38,000 –
Endowments for operations – (2,000,000) 2,000,000 –
Endowments for accessions – (6,000,000) 6,000,000 –
Term endowment – (500,000) 500,000 –
$ 89,000 $ (9,765,000) $ 9,813,000 $ 137,000
Unrestricted contributions (10,950,000)
Total cash collected from
donors
$ (20,715,000)
Panel G: Contributions and Grants Recognized Showing Financial Statement Display
FASB GASB Mautz Anthony
Contributions received in
cash
$ 20,715,000 $ 20,715,000 $ 20,715,000 $ 20,715,000
Noncash contributions
recognized
2,140,000 2,000,000 – 2,440,000
Capital contributions
recognized (depreciation)
1,351,000
Change in pledges receivable (1,819,000) 121,000 48,000 48,000
Change in deferred revenue – (8,000) 2,388,000 2,388,000
Contributions recognized $ 21,036,000 $ 22,828,000 $ 23,151,000 $ 26,942,000
Grants received in cash $ 845,000 $ 845,000 $ 845,000 $ 845,000
Change in grants receivable 78,000 (42,000) (42,000) (42,000)
Change in deferred revenue – (193,000) (193,000) (193,000)
Grants recognized in revenue $ 923,000 $ 610,000 $ 610,000 $ 610,000
Total grants and
contributions recognized
$ 21,959,000 $ 23,438,000 $ 23,761,000 $ 27,552,000
Table A1. (Continued )
Panel F: Reconciliation of Beginning and Ending Balances in Pledges Receivable (Continued)
TERESA P. GORDON AND SALEHA B. KHUMAWALA362
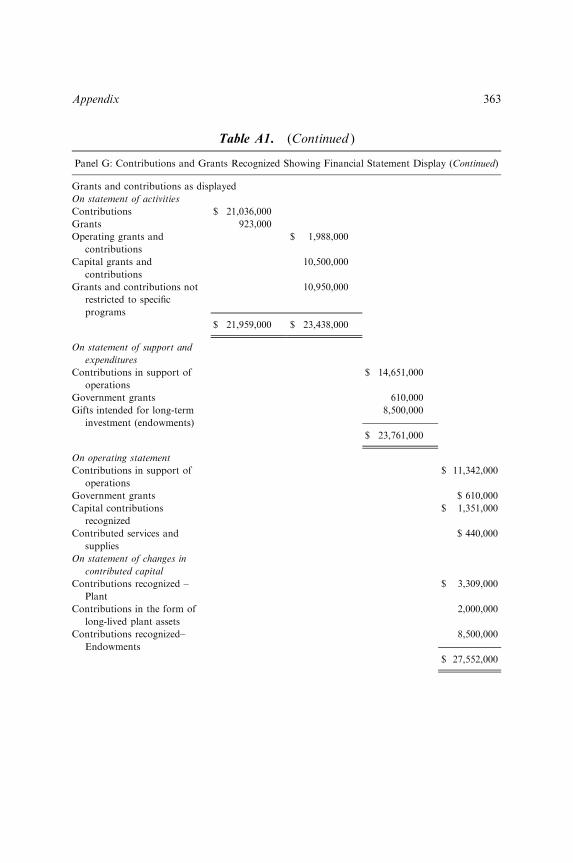
Grants and contributions as displayed
On statement of activities
Contributions $ 21,036,000
Grants 923,000
Operating grants and
contributions
$ 1,988,000
Capital grants and
contributions
10,500,000
Grants and contributions not
restricted to specific
programs
10,950,000
$ 21,959,000 $ 23,438,000
On statement of support and
expenditures
Contributions in support of
operations
$ 14,651,000
Government grants 610,000
Gifts intended for long-term
investment (endowments)
8,500,000
$ 23,761,000
On operating statement
Contributions in support of
operations
$ 11,342,000
Government grants $ 610,000
Capital contributions
recognized
$ 1,351,000
Contributed services and
supplies
$ 440,000
On statement of changes in
contributed capital
Contributions recognized –
Plant
$ 3,309,000
Contributions in the form of
long-lived plant assets
2,000,000
Contributions recognized–
Endowments
8,500,000
$ 27,552,000
Table A1. (Continued )
Panel G: Contributions and Grants Recognized Showing Financial Statement Display (Continued)
Appendix 363
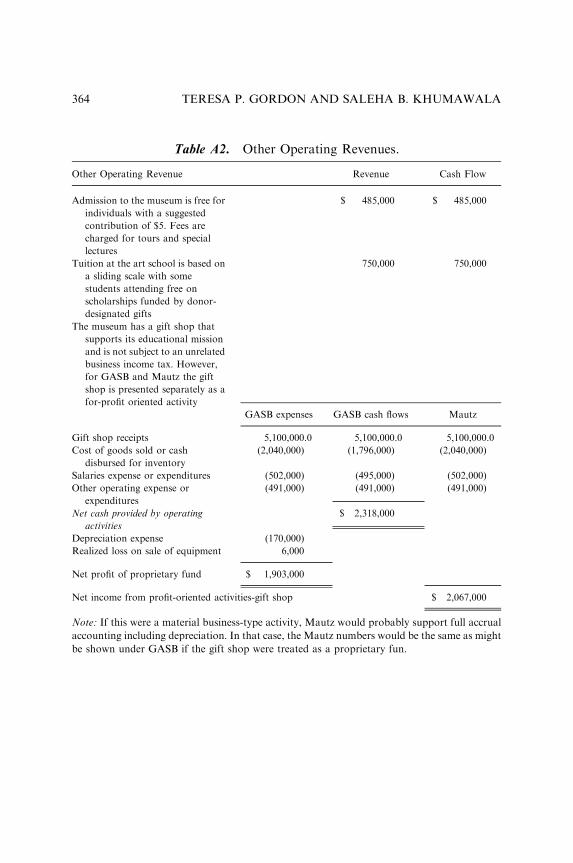
Table A2. Other Operating Revenues.
Other Operating Revenue Revenue Cash Flow
Admission to the museum is free for
individuals with a suggested
contribution of $5. Fees are
charged for tours and special
lectures
$ 485,000 $ 485,000
Tuition at the art school is based on
a sliding scale with some
students attending free on
scholarships funded by donor-
designated gifts
750,000 750,000
The museum has a gift shop that
supports its educational mission
and is not subject to an unrelated
business income tax. However,
for GASB and Mautz the gift
shop is presented separately as a
for-profit oriented activity
GASB expenses GASB cash flows Mautz
Gift shop receipts 5,100,000.0 5,100,000.0 5,100,000.0
Cost of goods sold or cash
disbursed for inventory
(2,040,000) (1,796,000) (2,040,000)
Salaries expense or expenditures (502,000) (495,000) (502,000)
Other operating expense or
expenditures
(491,000) (491,000) (491,000)
Net cash provided by operating
activities
$ 2,318,000
Depreciation expense (170,000)
Realized loss on sale of equipment 6,000
Net profit of proprietary fund $ 1,903,000
Net income from profit-oriented activities-gift shop $ 2,067,000
Note: If this were a material business-type activity, Mautz would probably support full accrual
accounting including depreciation. In that case, the Mautz numbers would be the same as might
be shown under GASB if the gift shop were treated as a proprietary fun.
TERESA P. GORDON AND SALEHA B. KHUMAWALA364
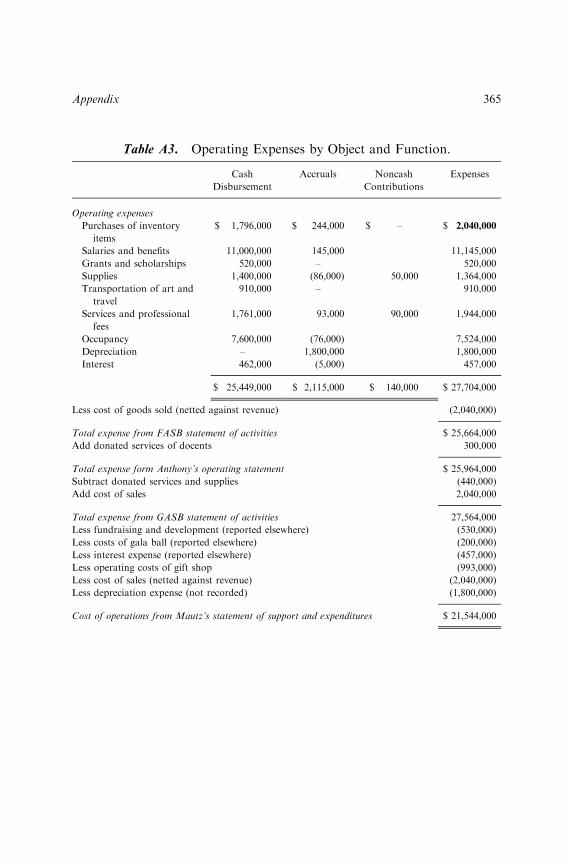
Table A3. Operating Expenses by Object and Function.
Cash
Disbursement
Accruals Noncash
Contributions
Expenses
Operating expenses
Purchases of inventory
items
$ 1,796,000 $ 244,000 $ – $ 2,040,000
Salaries and benefits 11,000,000 145,000 11,145,000
Grants and scholarships 520,000 – 520,000
Supplies 1,400,000 (86,000) 50,000 1,364,000
Transportation of art and
travel
910,000 – 910,000
Services and professional
fees
1,761,000 93,000 90,000 1,944,000
Occupancy 7,600,000 (76,000) 7,524,000
Depreciation – 1,800,000 1,800,000
Interest 462,000 (5,000) 457,000
$ 25,449,000 $ 2,115,000 $ 140,000 $ 27,704,000
Less cost of goods sold (netted against revenue) (2,040,000)
Total expense from FASB statement of activities $ 25,664,000
Add donated services of docents 300,000
Total expense form Anthony’s operating statement $ 25,964,000
Subtract donated services and supplies (440,000)
Add cost of sales 2,040,000
Total expense from GASB statement of activities 27,564,000
Less fundraising and development (reported elsewhere) (530,000)
Less costs of gala ball (reported elsewhere) (200,000)
Less interest expense (reported elsewhere) (457,000)
Less operating costs of gift shop (993,000)
Less cost of sales (netted against revenue) (2,040,000)
Less depreciation expense (not recorded) (1,800,000)
Cost of operations from Mautz’s statement of support and expenditures $ 21,544,000
Appendix 365
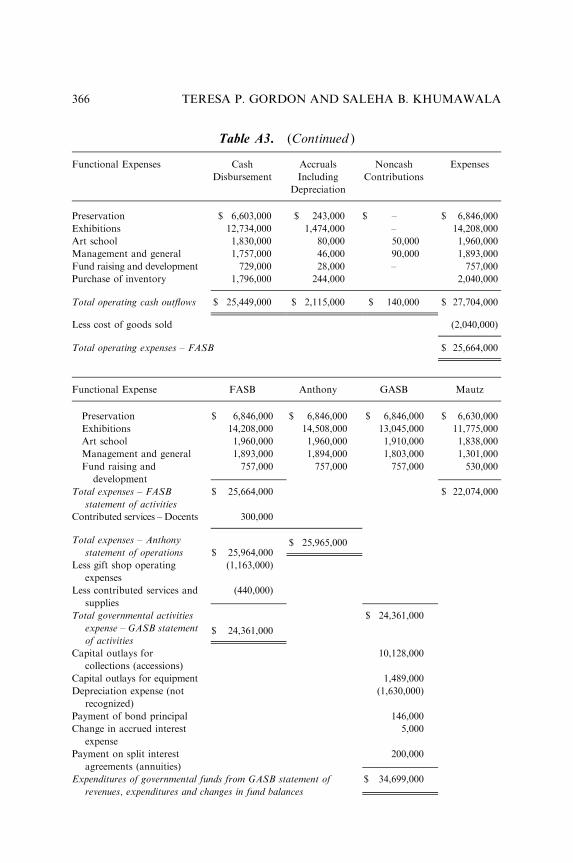
Table A3. (Continued )
Functional Expenses Cash
Disbursement
Accruals
Including
Depreciation
Noncash
Contributions
Expenses
Preservation $ 6,603,000 $ 243,000 $ – $ 6,846,000
Exhibitions 12,734,000 1,474,000 – 14,208,000
Art school 1,830,000 80,000 50,000 1,960,000
Management and general 1,757,000 46,000 90,000 1,893,000
Fund raising and development 729,000 28,000 – 757,000
Purchase of inventory 1,796,000 244,000 2,040,000
Total operating cash outflows $ 25,449,000 $ 2,115,000 $ 140,000 $ 27,704,000
Less cost of goods sold (2,040,000)
Total operating expenses – FASB $ 25,664,000
Functional Expense FASB Anthony GASB Mautz
Preservation $ 6,846,000 $ 6,846,000 $ 6,846,000 $ 6,630,000
Exhibitions 14,208,000 14,508,000 13,045,000 11,775,000
Art school 1,960,000 1,960,000 1,910,000 1,838,000
Management and general 1,893,000 1,894,000 1,803,000 1,301,000
Fund raising and
development
757,000 757,000 757,000 530,000
Total expenses – FASB
statement of activities
$ 25,664,000 $ 22,074,000
Contributed services – Docents 300,000
Total expenses – Anthony
statement of operations $ 25,964,000$ 25,965,000
Less gift shop operating
expenses
(1,163,000)
Less contributed services and
supplies
(440,000)
Total governmental activities
expense – GASB statement
of activities$ 24,361,000
$ 24,361,000
Capital outlays for
collections (accessions)
10,128,000
Capital outlays for equipment 1,489,000
Depreciation expense (not
recognized)
(1,630,000)
Payment of bond principal 146,000
Change in accrued interest
expense
5,000
Payment on split interest
agreements (annuities)
200,000
Expenditures of governmental funds from GASB statement of
revenues, expenditures and changes in fund balances
$ 34,699,000
TERESA P. GORDON AND SALEHA B. KHUMAWALA366
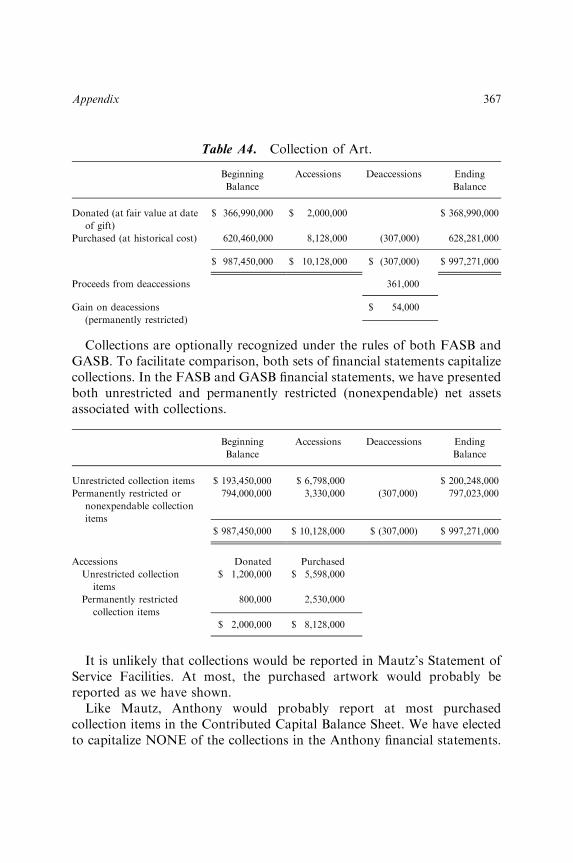
Table A4. Collection of Art.
Beginning
Balance
Accessions Deaccessions Ending
Balance
Donated (at fair value at date
of gift)
$ 366,990,000 $ 2,000,000 $ 368,990,000
Purchased (at historical cost) 620,460,000 8,128,000 (307,000) 628,281,000
$ 987,450,000 $ 10,128,000 $ (307,000) $ 997,271,000
Proceeds from deaccessions 361,000
Gain on deacessions
(permanently restricted)
$ 54,000
Collections are optionally recognized under the rules of both FASB andGASB. To facilitate comparison, both sets of financial statements capitalizecollections. In the FASB and GASB financial statements, we have presentedboth unrestricted and permanently restricted (nonexpendable) net assetsassociated with collections.
Beginning
Balance
Accessions Deaccessions Ending
Balance
Unrestricted collection items $ 193,450,000 $ 6,798,000 $ 200,248,000
Permanently restricted or
nonexpendable collection
items
794,000,000 3,330,000 (307,000) 797,023,000
$ 987,450,000 $ 10,128,000 $ (307,000) $ 997,271,000
Accessions Donated Purchased
Unrestricted collection
items
$ 1,200,000 $ 5,598,000
Permanently restricted
collection items
800,000 2,530,000
$ 2,000,000 $ 8,128,000
It is unlikely that collections would be reported in Mautz’s Statement ofService Facilities. At most, the purchased artwork would probably bereported as we have shown.
Like Mautz, Anthony would probably report at most purchasedcollection items in the Contributed Capital Balance Sheet. We have electedto capitalize NONE of the collections in the Anthony financial statements.
Appendix 367

Table A5. Plant, Property, and Equipment.
Beginning
Balance
Additions Retirements Ending
Balance
As reported on FASB statement of financial position
Land $ 10,685,000 $ – $ – $ 10,685,000
Building 34,544,000 – – 34,544,000
Equipment 7,017,000 1,861,000 (50,000) 8,828,000
Totals at historical cost $ 52,246,000 $ 1,861,000 $ (50,000) $ 54,057,000
Less accumulated depreciation for
Building (11,745,000) (1,080,000) – (12,825,000)
Equipment (3,275,000) (720,000) 40,000 (3,955,000)
Total accumulated
depreciation
$ (15,020,000) $ (1,800,000) $ 40,000 $ (16,780,000)
Net plant, property, and
equipment
$ 37,226,000 $ 61,000 $ (10,000) $ 37,277,000
Proceeds from disposition of
equipment
4,000
Realized loss on sale of
equipment
$ (6,000)
TERESA P. GORDON AND SALEHA B. KHUMAWALA368
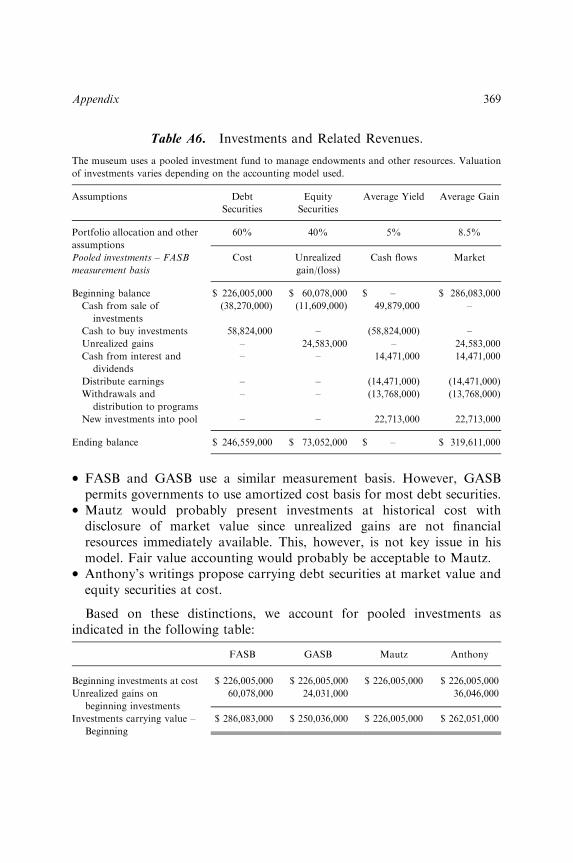
Table A6. Investments and Related Revenues.
The museum uses a pooled investment fund to manage endowments and other resources. Valuation
of investments varies depending on the accounting model used.
Assumptions Debt
Securities
Equity
Securities
Average Yield Average Gain
Portfolio allocation and other
assumptions
60% 40% 5% 8.5%
Pooled investments – FASB
measurement basis
Cost Unrealized
gain/(loss)
Cash flows Market
Beginning balance $ 226,005,000 $ 60,078,000 $ – $ 286,083,000
Cash from sale of
investments
(38,270,000) (11,609,000) 49,879,000 –
Cash to buy investments 58,824,000 – (58,824,000) –
Unrealized gains – 24,583,000 – 24,583,000
Cash from interest and
dividends
– – 14,471,000 14,471,000
Distribute earnings – – (14,471,000) (14,471,000)
Withdrawals and
distribution to programs
– – (13,768,000) (13,768,000)
New investments into pool – – 22,713,000 22,713,000
Ending balance $ 246,559,000 $ 73,052,000 $ – $ 319,611,000
� FASB and GASB use a similar measurement basis. However, GASBpermits governments to use amortized cost basis for most debt securities.� Mautz would probably present investments at historical cost withdisclosure of market value since unrealized gains are not financialresources immediately available. This, however, is not key issue in hismodel. Fair value accounting would probably be acceptable to Mautz.� Anthony’s writings propose carrying debt securities at market value andequity securities at cost.
Based on these distinctions, we account for pooled investments asindicated in the following table:
FASB GASB Mautz Anthony
Beginning investments at cost $ 226,005,000 $ 226,005,000 $ 226,005,000 $ 226,005,000
Unrealized gains on
beginning investments
60,078,000 24,031,000 36,046,000
Investments carrying value –
Beginning
$ 286,083,000 $ 250,036,000 $ 226,005,000 $ 262,051,000
Appendix 369
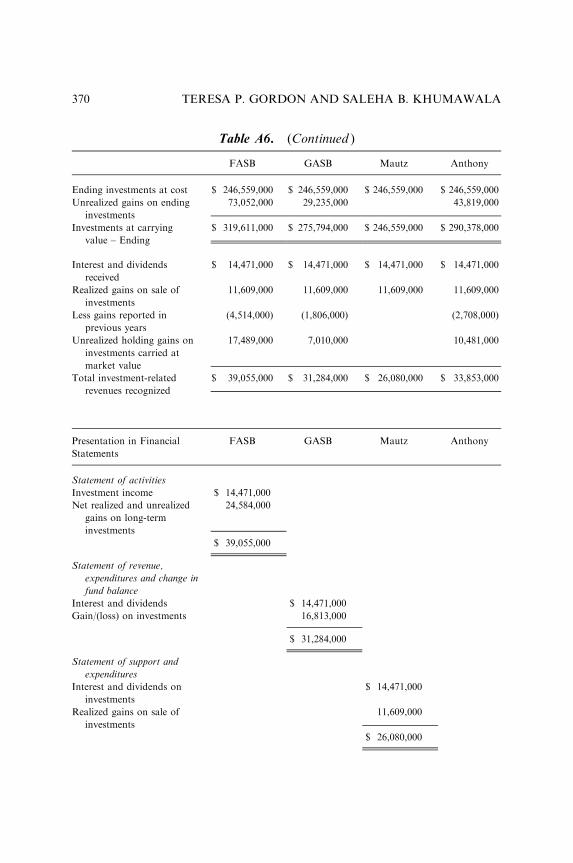
FASB GASB Mautz Anthony
Ending investments at cost $ 246,559,000 $ 246,559,000 $ 246,559,000 $ 246,559,000
Unrealized gains on ending
investments
73,052,000 29,235,000 43,819,000
Investments at carrying
value – Ending
$ 319,611,000 $ 275,794,000 $ 246,559,000 $ 290,378,000
Interest and dividends
received
$ 14,471,000 $ 14,471,000 $ 14,471,000 $ 14,471,000
Realized gains on sale of
investments
11,609,000 11,609,000 11,609,000 11,609,000
Less gains reported in
previous years
(4,514,000) (1,806,000) (2,708,000)
Unrealized holding gains on
investments carried at
market value
17,489,000 7,010,000 10,481,000
Total investment-related
revenues recognized
$ 39,055,000 $ 31,284,000 $ 26,080,000 $ 33,853,000
Presentation in Financial
Statements
FASB GASB Mautz Anthony
Statement of activities
Investment income $ 14,471,000
Net realized and unrealized
gains on long-term
investments
24,584,000
$ 39,055,000
Statement of revenue,
expenditures and change in
fund balance
Interest and dividends $ 14,471,000
Gain/(loss) on investments 16,813,000
$ 31,284,000
Statement of support and
expenditures
Interest and dividends on
investments
$ 14,471,000
Realized gains on sale of
investments
11,609,000
$ 26,080,000
Table A6. (Continued )
TERESA P. GORDON AND SALEHA B. KHUMAWALA370

Presentation in Financial
Statements
FASB GASB Mautz Anthony
Operating statement
Endowment earnings
restricted for operations
$ 1,881,000
Other investment earnings 5,825,000
Realized and unrealized gains
on investments
7,115,000
$ 14,821,0000
Statement of changes in
contributed capital
Plant
Realized and unrealized
gains on investments
$ 692,000
Endowment earnings
restricted for
accessions
5,761,000
Endowment
Realized and unrealized
gains on investments
11,575,000
Interest and dividends
restricted for
re-investment
1,004,000
$ 19,032,000
$ 33,853,000
Table A6. (Continued )
Appendix 371
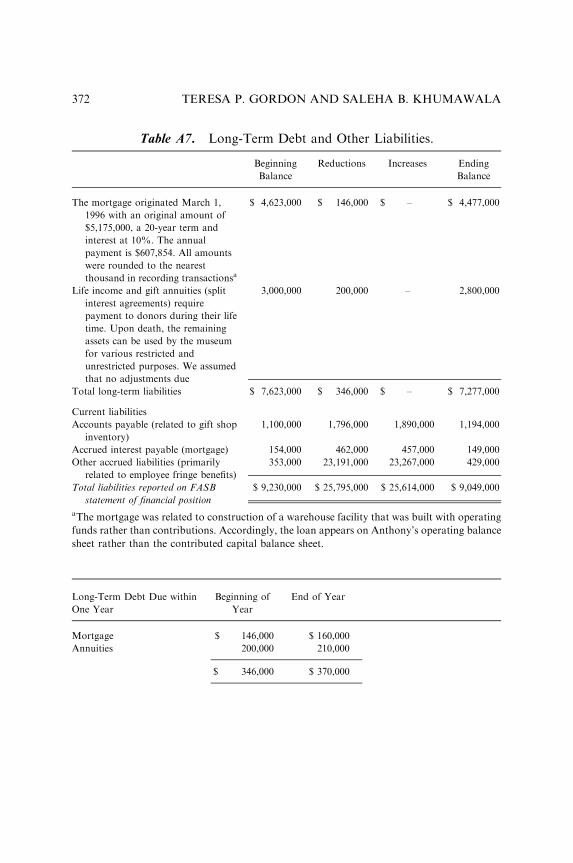
Table A7. Long-Term Debt and Other Liabilities.
Beginning
Balance
Reductions Increases Ending
Balance
The mortgage originated March 1,
1996 with an original amount of
$5,175,000, a 20-year term and
interest at 10%. The annual
payment is $607,854. All amounts
were rounded to the nearest
thousand in recording transactionsa
$ 4,623,000 $ 146,000 $ – $ 4,477,000
Life income and gift annuities (split
interest agreements) require
payment to donors during their life
time. Upon death, the remaining
assets can be used by the museum
for various restricted and
unrestricted purposes. We assumed
that no adjustments due
3,000,000 200,000 – 2,800,000
Total long-term liabilities $ 7,623,000 $ 346,000 $ – $ 7,277,000
Current liabilities
Accounts payable (related to gift shop
inventory)
1,100,000 1,796,000 1,890,000 1,194,000
Accrued interest payable (mortgage) 154,000 462,000 457,000 149,000
Other accrued liabilities (primarily
related to employee fringe benefits)
353,000 23,191,000 23,267,000 429,000
Total liabilities reported on FASB
statement of financial position
$ 9,230,000 $ 25,795,000 $ 25,614,000 $ 9,049,000
aThe mortgage was related to construction of a warehouse facility that was built with operating
funds rather than contributions. Accordingly, the loan appears on Anthony’s operating balance
sheet rather than the contributed capital balance sheet.
Long-Term Debt Due within
One Year
Beginning of
Year
End of Year
Mortgage $ 146,000 $ 160,000
Annuities 200,000 210,000
$ 346,000 $ 370,000
TERESA P. GORDON AND SALEHA B. KHUMAWALA372
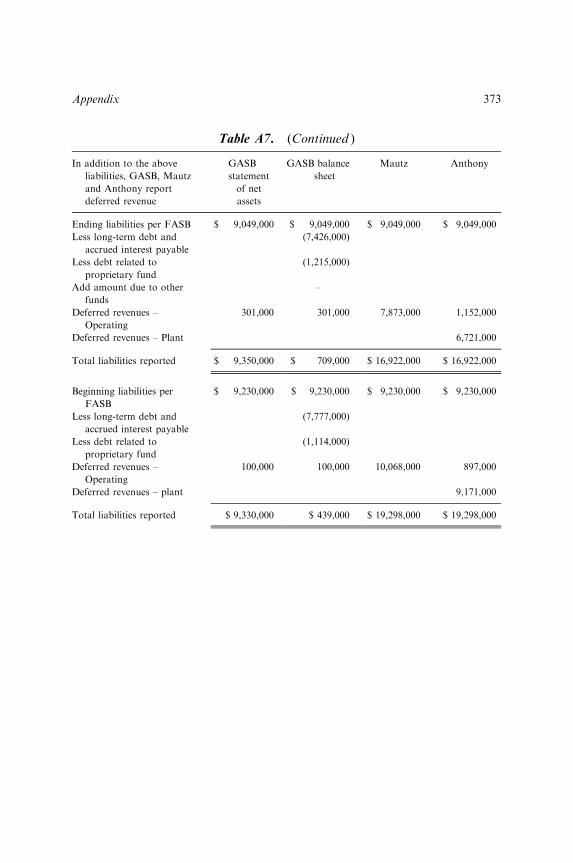
Table A7. (Continued )
In addition to the above
liabilities, GASB, Mautz
and Anthony report
deferred revenue
GASB
statement
of net
assets
GASB balance
sheet
Mautz Anthony
Ending liabilities per FASB $ 9,049,000 $ 9,049,000 $ 9,049,000 $ 9,049,000
Less long-term debt and
accrued interest payable
(7,426,000)
Less debt related to
proprietary fund
(1,215,000)
Add amount due to other
funds
–
Deferred revenues –
Operating
301,000 301,000 7,873,000 1,152,000
Deferred revenues – Plant 6,721,000
Total liabilities reported $ 9,350,000 $ 709,000 $ 16,922,000 $ 16,922,000
Beginning liabilities per
FASB
$ 9,230,000 $ 9,230,000 $ 9,230,000 $ 9,230,000
Less long-term debt and
accrued interest payable
(7,777,000)
Less debt related to
proprietary fund
(1,114,000)
Deferred revenues –
Operating
100,000 100,000 10,068,000 897,000
Deferred revenues – plant 9,171,000
Total liabilities reported $ 9,330,000 $ 439,000 $ 19,298,000 $ 19,298,000
Appendix 373
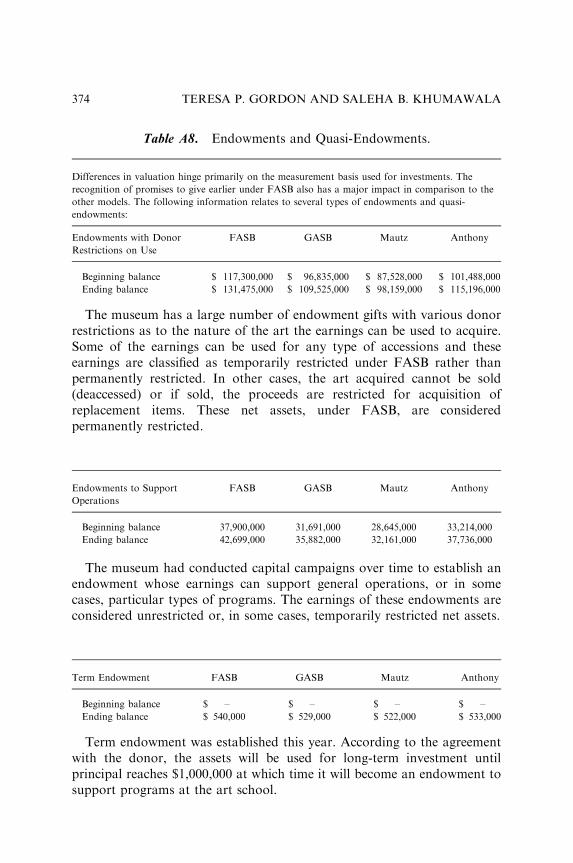
Table A8. Endowments and Quasi-Endowments.
Differences in valuation hinge primarily on the measurement basis used for investments. The
recognition of promises to give earlier under FASB also has a major impact in comparison to the
other models. The following information relates to several types of endowments and quasi-
endowments:
Endowments with Donor
Restrictions on Use
FASB GASB Mautz Anthony
Beginning balance $ 117,300,000 $ 96,835,000 $ 87,528,000 $ 101,488,000
Ending balance $ 131,475,000 $ 109,525,000 $ 98,159,000 $ 115,196,000
The museum has a large number of endowment gifts with various donorrestrictions as to the nature of the art the earnings can be used to acquire.Some of the earnings can be used for any type of accessions and theseearnings are classified as temporarily restricted under FASB rather thanpermanently restricted. In other cases, the art acquired cannot be sold(deaccessed) or if sold, the proceeds are restricted for acquisition ofreplacement items. These net assets, under FASB, are consideredpermanently restricted.
Endowments to Support
Operations
FASB GASB Mautz Anthony
Beginning balance 37,900,000 31,691,000 28,645,000 33,214,000
Ending balance 42,699,000 35,882,000 32,161,000 37,736,000
The museum had conducted capital campaigns over time to establish anendowment whose earnings can support general operations, or in somecases, particular types of programs. The earnings of these endowments areconsidered unrestricted or, in some cases, temporarily restricted net assets.
Term Endowment FASB GASB Mautz Anthony
Beginning balance $ – $ – $ – $ –
Ending balance $ 540,000 $ 529,000 $ 522,000 $ 533,000
Term endowment was established this year. According to the agreementwith the donor, the assets will be used for long-term investment untilprincipal reaches $1,000,000 at which time it will become an endowment tosupport programs at the art school.
TERESA P. GORDON AND SALEHA B. KHUMAWALA374
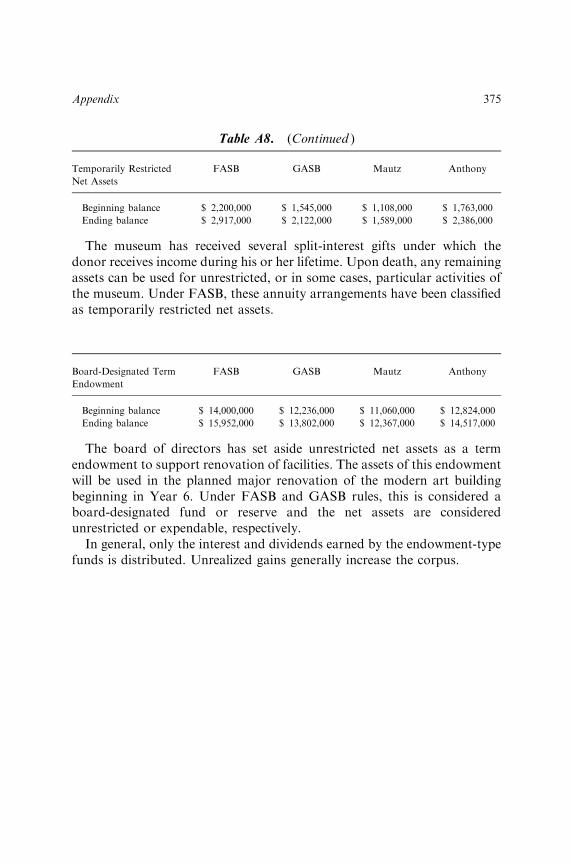
Temporarily Restricted
Net Assets
FASB GASB Mautz Anthony
Beginning balance $ 2,200,000 $ 1,545,000 $ 1,108,000 $ 1,763,000
Ending balance $ 2,917,000 $ 2,122,000 $ 1,589,000 $ 2,386,000
The museum has received several split-interest gifts under which thedonor receives income during his or her lifetime. Upon death, any remainingassets can be used for unrestricted, or in some cases, particular activities ofthe museum. Under FASB, these annuity arrangements have been classifiedas temporarily restricted net assets.
Board-Designated Term
Endowment
FASB GASB Mautz Anthony
Beginning balance $ 14,000,000 $ 12,236,000 $ 11,060,000 $ 12,824,000
Ending balance $ 15,952,000 $ 13,802,000 $ 12,367,000 $ 14,517,000
The board of directors has set aside unrestricted net assets as a termendowment to support renovation of facilities. The assets of this endowmentwill be used in the planned major renovation of the modern art buildingbeginning in Year 6. Under FASB and GASB rules, this is considered aboard-designated fund or reserve and the net assets are consideredunrestricted or expendable, respectively.
In general, only the interest and dividends earned by the endowment-typefunds is distributed. Unrealized gains generally increase the corpus.
Table A8. (Continued )
Appendix 375