Community Benefit Activities of Private, Nonprofit Hospitals
28
Community Benefit Activities of Private, Nonprofit Hospitals Gloria J. Bazzoli Jan P. Clement Virginia Commonwealth University Hui-Min Hsieh HealthCore, Inc. Abstract The definition of hospital community benefits has been intensely debated for many years. Recently, consensus has developed about one group of activities being central to community benefits because of its focus on care for the poor and on needed community services for which any payments received are low relative to costs. Dis- agreements continue, however, about the treatment of bad debt expense and Medicare shortfalls. A recent revision of the Internal Revenue Service’s Form 990 Schedule H, which is required of all nonprofit hospitals, highlights the agreed-on set of activities but does not dismiss the disputed items. Our study is the first to apply definitions used in the new IRS form to assess how conclusions about the adequacy of nonprofit hospi- tal community benefits could be affected if bad debt expenses and Medicare shortfalls are included or excluded. Specifically, we examine 2005 financial data for California and Florida hospitals. Overall, we find that conclusions about community benefit adequacy are very different depending on which definition of community benefits is used. We provide thoughts on new directions for the current policy debate about the treatment of bad debts and Medicare shortfalls in light of these findings. Introduction There has been much debate over the adequacy of private, nonprofit hospi- tal community benefit activities given their tax-exempt status. Two major issues have been central to this debate: (1) what activities should qualify as “community benefits” and (2) whether private, nonprofit hospitals pro- vide enough of these community benefits, however defined, to warrant their favorable tax status. Answering the second question has been dif- Journal of Health Politics, Policy and Law, Vol. 35, No. 6, December 2010 DOI 10.1215/03616878-2010-036 © 2011 by Duke University Press
Transcript of Community Benefit Activities of Private, Nonprofit Hospitals

Community Benefit Activities of Private,
Nonprofit Hospitals
Gloria J. Bazzoli Jan P. Clement
Virginia Commonwealth University
Hui- Min HsiehHealthCore, Inc.
Abstract The definition of hospital community benefits has been intensely debated for many years. Recently, consensus has developed about one group of activities being central to community benefits because of its focus on care for the poor and on needed community services for which any payments received are low relative to costs. Dis-agreements continue, however, about the treatment of bad debt expense and Medicare shortfalls. A recent revision of the Internal Revenue Service’s Form 990 Schedule H, which is required of all nonprofit hospitals, highlights the agreed- on set of activities but does not dismiss the disputed items. Our study is the first to apply definitions used in the new IRS form to assess how conclusions about the adequacy of nonprofit hospi-tal community benefits could be affected if bad debt expenses and Medicare shortfalls are included or excluded. Specifically, we examine 2005 financial data for California and Florida hospitals. Overall, we find that conclusions about community benefit adequacy are very different depending on which definition of community benefits is used. We provide thoughts on new directions for the current policy debate about the treatment of bad debts and Medicare shortfalls in light of these findings.
Introduction
There has been much debate over the adequacy of private, nonprofit hospi-tal community benefit activities given their tax- exempt status. Two major issues have been central to this debate: (1) what activities should qualify as “community benefits” and (2) whether private, nonprofit hospitals pro-vide enough of these community benefits, however defined, to warrant their favorable tax status. Answering the second question has been dif-
Journal of Health Politics, Policy and Law, Vol. 35, No. 6, December 2010 DOI 10.1215/03616878-2010-036 © 2011 by Duke University Press

1000 Journal of Health Politics, Policy and Law
ficult because the definitional issues inherent in the first question have not been completely resolved. In the last few years, the hospital industry, trade associations, and federal policy makers have increasingly agreed on one set of activities that all believe do constitute community benefit in that they relate to servicing the needs of indigent and underserved indi-viduals and to providing needed services to the community for which monies received are inadequate to cover costs. Efforts that began with the Catholic Health Association (CHA) and VHA, Inc., followed by hearings held by Senator Chuck Grassley’s (R- IA) U.S. Senate Finance Committee, and culminating in actions by the Internal Revenue Service, have focused much attention on this set of activities and led to specific approaches for quantifying and reporting their unreimbursed costs in federally filed IRS forms.
Lack of agreement continues, however, about two items that some argue should be counted as community benefits while others contend should not. Specifically, these are bad debt expense, namely, uncollectible payments that patients were expected to pay, and unreimbursed costs of the Medi-care program, frequently called Medicare shortfalls.
The objective of our article is to examine the sensitivity of conclusions about the adequacy of private nonprofit hospital community benefits to alternative definitions of community benefits, using methods developed by health services researchers to make such assessments. In particular, we examine what conclusion would be reached if one focused strictly on the set of activities for which agreement has been reached about commu-nity benefit status and how this conclusion is affected if the definition is expanded to include the currently disputed items of bad debt and Medicare shortfalls. We also examine a third definition used frequently by health services researchers to provide an additional point of reference.
We are limited to studying only California and Florida hospitals because they have detailed hospital financial reporting that allows us to identify and quantify many of the community benefit components speci-fied in the new IRS form. This assessment, although limited to two states and based on data collected before the new form was developed, is impor-tant because existing studies use community benefit definitions that differ markedly from those that are now the focus of policy debate. Our study also gives a benchmark for where the industry stood that can be used to contrast changes in community benefit activities. Based on our findings, we suggest directions for future policy development that may help resolve remaining areas of dispute about hospital community benefit definition and measurement.
Bazzoli, Clement, and Hsieh ■ Community Benefits 1001
The next two sections provide background on community benefit defi-nition and measurement and also on the methods and findings of existing research. This is followed by a description of our study methods, includ-ing our conceptual framework, data resources, model specification, and analytic approaches. Results are then presented, and a concluding section discusses policy implications and areas for future research.
Background on Defining and Measuring Community Benefits
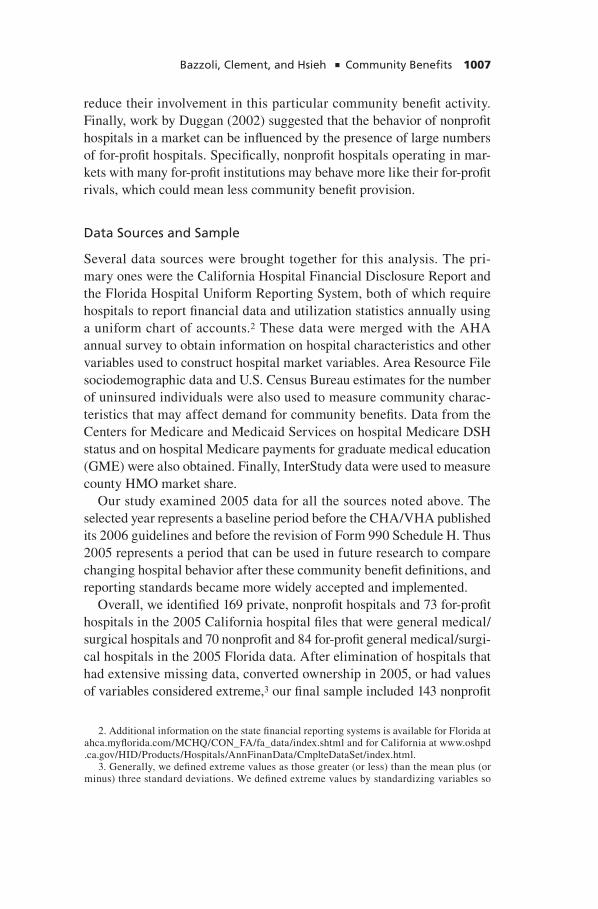
A U.S. Government Accountability Office (GAO) report in 2008 provided a thorough history of the issues and policy context relevant to defining and measuring hospital community benefits. This report noted that the origins of the current debate date back to a 1956 IRS revenue ruling (Rev. Rul. 56 – 185, 1956 – 1 C.B. 202), which stated that hospitals qualifying as 501(c)(3) charitable organizations were expected to provide charity care, namely, free health services to the poor who were unable to afford their care, to the best of the hospital’s financial ability. A later 1969 ruling (Rev. Rul. 690 – 545, 1969 – 2 C.B. 117) replaced the original standard with a broader community benefit definition that required nonprofit hospitals to demonstrate how they reduced governmental burden and promoted gen-eral welfare. This later ruling not only expanded the range of activities that could be deemed community benefits but also provided substantial latitude to nonprofit hospitals in defining what among their many activities counted as community benefits.
In the years after the 1969 IRS ruling, questions about the adequacy of nonprofit hospital community benefit provision rose to national attention and policy debate. Trocchio (2006) noted that several U.S. congressional committees in the 1980s and 1990s questioned whether there were any real differences between for- profit and nonprofit hospitals, whether non-profit hospitals continued to deserve their tax- exempt status, and whether there should be a level of effort test that nonprofit hospitals had to meet to continue their tax exemption. CHA and VHA, Inc., became involved with this issue during this period, given its relevancy for their nonprofit hospital members. Together, the organizations identified member approaches for providing and documenting their community benefit activities.
In 2006 CHA and VHA, Inc., established specific definitions and guide-lines for measuring community benefit activities, publishing A Guide for Planning and Reporting Community Benefit in that year (Catholic Health Association [CHA] 2006a). These guidelines identified the unreimbursed

1002 Journal of Health Politics, Policy and Law
costs of the following activities as community benefits: charity care, Medicaid, other means- tested government programs, health professions education, research, community health improvement services, financial and in- kind contributions to charitable organizations, community benefit operations, and community building activities.
Missing from the list were bad debt expense and unreimbursed Medi-care costs, which many nonprofit hospitals were counting as community benefits. CHA and VHA, Inc., took the position that these should not be considered because bad debt could be generated by patients who were not necessarily needy and might represent ineffective hospital efforts to col-lect on their bills. Further, they believed that hospitals needed to have clear guidelines to identify patients eligible for charity care a priori. In terms of Medicare shortfalls, CHA and VHA, Inc., noted that these may be due to inefficiency rather than underpayment and that serving Medicare benefi-ciaries was not a differentiating feature of nonprofit hospitals (U.S. GAO 2008). The American Hospital Association (AHA), however, took the position that both these items should be considered community benefits because a large share of bad debt was likely attributable to poor patients, some of whom did not follow through in applying for coverage through public programs. Also, the AHA felt that underpayments by Medicare did relieve the government of substantial financial burden and that many Medicare patients were needy given their fixed incomes. These differing views on the treatment of bad debt expense and Medicare shortfalls were also reflected in state community benefit reporting. Of the nineteen states in 2006 that required these reports, CHA (2006b) found that six included bad debt expense and nine included Medicare shortfalls.
The IRS faced growing pressure in 2007 from policy makers to develop more precise tools and guidance for measuring hospital community bene-fits, especially as the result of hearings held by Senator Grassley. In these hearings, Grassley emphasized the CHA and VHA, Inc., standards and sided with their arguments about bad debt expense and Medicare short-falls, indicating that the former merely “clouds the picture” (Grassley 2006). He also exhorted the IRS to provide more specificity and direc-tion to nonprofit hospitals in their federal reporting of community benefit activities.
In December 2007 the IRS introduced a revision to its Form 990 Schedule H, which is filed annually by all private, nonprofit hospitals with 501(c)(3) status. Prior to this revision, Schedule H allowed for open- ended, general descriptions of hospital community benefit activities. The new version, however, identifies particular activities under a section labeled “charity

Bazzoli, Clement, and Hsieh ■ Community Benefits 1003
care and other community benefits” and asks hospitals to report for each activity (1) the numbers of persons served, (2) total expenses involved in these activities, (3) direct offsetting revenues, and (4) resulting net com-munity benefit expense (i.e., total expense less direct revenues).1 The com-munity benefit activities identified in this section are charity care at cost, unreimbursed Medicaid, unreimbursed costs from other means- tested government programs, community health improvement services and community benefit operations, health professions education, subsidized health services, research, and cash and in- kind contributions to commu-nity groups. In addition, the schedule asks hospitals to report unreim-bursed costs for community building activities. The above activities are consistent with the items identified in the CHA and VHA, Inc., guidelines. In a separate section, Schedule H requests data on bad debt expense and unreimbursed Medicare costs. Hospitals are also asked to provide written rationale for why some or all of these latter costs should be considered community benefits. Thus, although the new Schedule H certainly high-lights and emphasizes the set of activities for which most stakeholders agreed constitute community benefits, it did not dismiss entirely the two items in dispute.
Background on Prior Community Benefit Research
Given the lack of clarity and diversity in prior community benefit defini-tions, it is not surprising that prior research studies of hospital community benefit provision have used very different measures. For example, Norton and Staiger (1994) and Sutton, Milet, and Blanchfield (2002) both exam-ined hospital care for uninsured individuals and thus were most consistent with the original 1956 IRS standards. They contrasted charity care provi-sion among nonprofit and for- profit hospitals, and found that both types of hospitals provided similar amounts. Based on this finding, they concluded that nonprofit hospitals were not providing adequate community benefits because the monies they would otherwise pay in taxes were not resulting in higher levels of charity care.
Several studies examined hospital uncompensated care, namely, unre-imbursed costs resulting from charity care and bad debt. A number of studies found that nonprofit hospitals provide more uncompensated care
1. A copy of the form can be accessed at www.irs.gov/pub/irs- pdf/f990sh.pdf.

1004 Journal of Health Politics, Policy and Law
than do for- profit hospitals (Bazzoli et al. 2006; Davidoff et al. 2000; Thorpe, Seiber, and Florence 2001; Congressional Budget Office 2006). However, the critical question for policy debate is whether this additional provision by nonprofit hospitals is sufficient to warrant their tax exemp-tions. To examine this, Schneider (2007) used the sum of for- profit hospi-tal uncompensated care and the federal and state income taxes they paid as a benchmark to assess the adequacy of nonprofit community benefit provision. Her empirical analysis found that nonprofit hospitals were defi-cient in providing sufficient uncompensated care relative to this for- profit hospital benchmark, ceteris paribus. Morrisey, Wedig, and Hassan (1996) and Kane and Wubbenhorst (2000) used similar approaches and obtained similar results. Morrisey, Wedig, and Hassan (1996) concluded that 20 to 40 percent of nonprofit hospitals provided insufficient uncompensated care relative to a for- profit benchmark, and Kane and Wubbenhorst (2000) concluded that about 50 percent of nonprofit hospitals were deficient given this type of benchmark.
Some researchers have examined more expansive community benefit definitions. For example, Herzlinger and Krasker (1987) and Arrington and Haddock (1990) examined the scope of hospital services, the num-ber of emergency room visits (as an access measure), and involvement in health professions education. Herzlinger and Krasker (1987) focused only on hospitals in multihospital systems and concluded that nonprofit hospitals were not substantially different on many study measures relative to for- profit hospitals. However, Arrington and Haddock (1990) examined both system and nonsystem hospitals and found that nonprofit hospitals provided more community benefits than did for- profit hospitals.
Two additional studies also looked at a broader set of activities and quantified their associated unreimbursed costs. Nicholson et al. (2000) assessed uncompensated care costs, losses on medical research, and price discounts for private patients provided by nonprofit hospitals. They con-trasted this to a benchmark based on the sum of these plus profits and esti-mated taxes paid by for- profit hospitals in three large multihospital sys-tems. They found that there was about a 20 percent deficit in community benefits provided by nonprofit hospitals overall relative to the for- profit benchmark. Schneider (2007) examined a community benefit measure that included uncompensated care costs, Medicare and Medicaid short-falls, price discounts for privately insured patients, and policy discounts given to hospital employees. With this broader measure, her analysis found that nonprofit hospitals in California met or exceeded the for- profit bench-mark, holding hospital, market, and community characteristics constant.

Bazzoli, Clement, and Hsieh ■ Community Benefits 1005
This finding differs from those reached with her narrower community benefit definition that measured only uncompensated care costs.
Overall, there has been great variability in the definitions of community benefits used in prior research, and these definitions do not link well to the focal activities identified in the new IRS form. Nor do prior definitions used in research allow an assessment of how community benefit adequacy could be affected when the disputed items are included or excluded. How-ever, the findings do illustrate the sensitivity of conclusions to the specific definition of community benefits used. Thus it is important to examine how the definitions used in the new IRS form might affect assessments of community benefit provision.
Study Framework and Methods
In this section, we present the conceptual underpinnings of our study and then discuss our data, measures, and analytic methods.
Conceptual Framework
Similar to Nicholson et al. (2000), we conceptualize hospital commu-nity benefits as public goods in that individuals receive benefits either directly or indirectly from consuming these goods, and firms producing them typically collect insufficient revenues to cover production costs. Weisbrod’s (1980) economic theory envisioned that nonprofit hospitals filled an important role in providing public goods given that for- profit firms will avoid producing them and government officials will provide low quantities as viewed by some community stakeholders because of diverse voter preferences. Thus government officials grant tax- exempt status to private nonprofit hospitals because these hospitals can serve a role in meeting community needs that are unmet by for- profit firms and government agencies.
However, hospital provision of community benefits depends on several other factors, not just a hospital’s ownership status. In particular, these factors relate to the supply and demand for community benefits. Supply factors include an individual hospital’s capacity to provide community benefits and the ability of other institutions in the market to produce these benefits. Demand relates to community characteristics that influence the amount and types of community benefits needed.
Schneider (2007) categorized these demand and supply factors into three groups: hospital characteristics, community characteristics, and mar-

1006 Journal of Health Politics, Policy and Law
ket characteristics. The most important hospital characteristic of interest to this study is hospital ownership status. We specifically examine private hospitals within three ownership groups: church- affiliated nonprofit hos-pitals, non- church- affiliated nonprofit hospitals, and for- profit hospitals. We separate church- affiliated institutions because their religious ties may mean greater commitment to serving community needs. Other hospital characteristics may influence hospital involvement in community benefit provision, such as hospital size, teaching status, system affiliation, dispro-portionate share hospital (DSH) status, and status as a trauma center. Hos-pitals with more staffed beds and those that are system affiliated may have more capacity or resources to draw on to provide community benefits. Those with residency training programs are involved with health profes-sions education and also may provide more care to low- income and unin-sured individuals to provide learning experiences for health professionals they are training. Hospitals with DSH status, either through Medicaid or Medicare, serve greater numbers of low- income individuals and receive additional payments that may offset their unreimbursed costs. Hospitals with trauma centers may have large numbers of uninsured trauma victims whom they are obligated to treat.
Community characteristics can affect the level of need in a hospital’s service area and thus its level of community benefit provision. Communi-ties with larger shares of uninsured people will likely have greater need for charity care. Ironically, greater prevalence of uninsured individuals in the population might lead to lower levels of unreimbursed Medicaid costs because fewer individuals are covered by these programs and thus gen-erating unreimbursed program costs. Hospitals located in more prosper-ous areas, as measured by per capita income, may have lower community benefit needs because of less need for charity care and more prevalent private insurance coverage. Schneider (2007) also suggested that higher birth rates per one thousand women or rural location may influence com-munity benefit provision.
Hospital market characteristics can also play an important role. Hospitals located in areas with high health maintenance organization (HMO) mar-ket share or high levels of hospital competition may have fewer resources to support community benefit activities. Hospitals located in markets with a greater supply of hospital beds relative to the population may experience less need for community benefit provision in that there are more institu-tions involved with these activities. Similarly, Schneider (2007) argued that if other hospitals are providing greater amounts of charity care, there may be less unmet need in the community, and individual hospitals could
Bazzoli, Clement, and Hsieh ■ Community Benefits 1007
2. Additional information on the state financial reporting systems is available for Florida at ahca.myflorida.com/MCHQ/CON_FA/fa_data/index.shtml and for California at www.oshpd .ca.gov/HID/Products/Hospitals/AnnFinanData/CmplteDataSet/index.html.
3. Generally, we defined extreme values as those greater (or less) than the mean plus (or minus) three standard deviations. We defined extreme values by standardizing variables so
reduce their involvement in this particular community benefit activity. Finally, work by Duggan (2002) suggested that the behavior of nonprofit hospitals in a market can be influenced by the presence of large numbers of for- profit hospitals. Specifically, nonprofit hospitals operating in mar-kets with many for- profit institutions may behave more like their for- profit rivals, which could mean less community benefit provision.
Data Sources and Sample
Several data sources were brought together for this analysis. The pri-mary ones were the California Hospital Financial Disclosure Report and the Florida Hospital Uniform Reporting System, both of which require hospitals to report financial data and utilization statistics annually using a uniform chart of accounts.2 These data were merged with the AHA annual survey to obtain information on hospital characteristics and other variables used to construct hospital market variables. Area Resource File sociodemographic data and U.S. Census Bureau estimates for the number of uninsured individuals were also used to measure community charac-teristics that may affect demand for community benefits. Data from the Centers for Medicare and Medicaid Services on hospital Medicare DSH status and on hospital Medicare payments for graduate medical education (GME) were also obtained. Finally, InterStudy data were used to measure county HMO market share.
Our study examined 2005 data for all the sources noted above. The selected year represents a baseline period before the CHA/VHA published its 2006 guidelines and before the revision of Form 990 Schedule H. Thus 2005 represents a period that can be used in future research to compare changing hospital behavior after these community benefit definitions, and reporting standards became more widely accepted and implemented.
Overall, we identified 169 private, nonprofit hospitals and 73 for- profit hospitals in the 2005 California hospital files that were general medical/surgical hospitals and 70 nonprofit and 84 for- profit general medical/surgi-cal hospitals in the 2005 Florida data. After elimination of hospitals that had extensive missing data, converted ownership in 2005, or had values of variables considered extreme,3 our final sample included 143 nonprofit

1008 Journal of Health Politics, Policy and Law
that they were measured relative to hospital bed size. This was done separately by hospital ownership type.
4. Although we were able to measure most items identified in the revised IRS Form 990 Schedule H, there were a few we could not: community health improvement services and com-munity benefit operations, subsidized health services, cash and in- kind contributions to commu-nity groups, and community building activities. Data reported in Gray and Schlesinger 2009 for Maryland hospitals suggest that these items represent a small portion of the primary community benefit activities emphasized in the new IRS form. In particular, they represented about 12 per-cent of Gray and Schlesinger’s community benefit measure in 2005. However, their measure did not include unreimbursed Medicaid shortfalls, which for our California and Florida hospitals was about 60 to 70 percent of our primary community benefit measure (see table 2). Factoring our data into their study, we expect that the items we are able to measure represent about 90 to 95 percent of primary community benefit activities emphasized in the IRS 990 form.
and 62 for- profit California hospitals and 63 nonprofit and 74 for- profit hospitals in Florida. This represents about 85 to 90 percent of hospitals in the various state and ownership categories. A comparison of included and excluded hospitals in relation to bed size, ownership type, teaching status, presence of a trauma center, and rural location indicated no significant differences for these characteristics in Florida. In California there were also no significant differences with the exception that a disproportionate number of excluded hospitals in this state were major teaching hospitals that were members of the Association of American Medical College’s Council of Teaching Hospitals.
Variable Construction
We constructed individual community benefit items using Form 990 Schedule H worksheets and the California and Florida financial data. Table 1 provides a brief description of the variables that we were able to measure.4 Some modifications to variable construction were essential given the lack of certain items in the California or Florida financial report-ing systems. In particular, the instructions for converting charge- based measures (e.g., reported charity care, bad debt expense) to costs allowed hospitals to use either an institutional cost- to- charge ratio or their own cost- accounting methodology. Because we lack information on the latter, an institutional cost- to- charge ratio was used. We followed IRS worksheet instructions and subtracted Medicaid provider taxes, research costs, and health professionals training costs from hospital expenses when calculat-ing this ratio. For unreimbursed Medicaid costs, hospitals are instructed to use net Medicaid patient service revenues, excluding any Medicaid GME received. Unfortunately, neither the California nor the Florida system reports Medicaid GME separately. To correct for this, we allocated a por-

Bazzoli, Clement, and Hsieh ■ Community Benefits 1009
Table 1 Community Benefit Activity Definitions Based on IRS Form 990 Schedule H Items and Taxes Paid by Hospitals
Charity Care and Other Community Benefits (Part I, Section 7 of Form 990 Section H)
Charity care costs Measured as hospital-reported deductions from revenue, translated to costs by institutional cost-to-charge ratio.
Unreimbursed Measured as the sum of (1) Medicaid gross patient revenues Medicaid costs translated to costs with institutional cost-to-charge ratio,
(2) Medicaid provider taxes, and (3) an allocation of health professions education cost based on a hospital’s Medicaid patient share of discharges. Net Medicaid revenues are then deducted from this sum to obtain unreimbursed Medicaid costs.
Unreimbursed Measured as county indigent care gross patient revenues costs—other translated to costs with institutional cost-to-charge ratio means-tested less net revenues received from county to offset these costs government (measured only in Calif.). programs from county indigent programs Health professions Measured as reported costs of training all health professionals education cost that were unallocated to Medicaid (see above) less the sum (net of revenues) of revenues received for training purposes (such as student
tuition received) and Medicare GME payments.Research costs Measured as direct costs of research activities less revenues (net of revenues) received to offset research costs.
Bad Debt and Medicare Shortfalls (Part III, Form 990 Section H)
Bad debt expenses Measured as bad debt expense, which hospitals report on (measured as a charge basis, translated to costs by institutional costs) cost-to-charge ratio.Unreimbursed Measured as Medicare gross patient revenues translated to Medicare costs costs with institutional cost-to-charge ratio less net
Medicare revenues received by the hospital (excluding any Medicare GME payments).
Taxes Paid by Hospitals
Taxes Represents the sum of estimated state and federal income taxes, sales tax, and property tax for for-profit hospitals.
Additionally, any income taxes reported by nonprofit hospi-tals they may report for unrelated businesses are included.
Sources: Florida data come from Florida Agency for Health Care Administration Database; California data come from California Office of Statewide Health Planning and Development Database.
Note: GME = graduate medical education

1010 Journal of Health Politics, Policy and Law
tion of health professions education cost to Medicaid based on a hospital’s Medicaid patient share of hospital discharges. This approach means that unreimbursed Medicaid and health professions education costs both are not measured precisely. However, there should be no overall effect of this on our primary community benefits measures, which sums across items, because any under- (or over- )estimate of unreimbursed Medicaid costs should be offset by an equal over- (or under- )estimate of unreimbursed health professions educational costs. Another essential deviation was in relation to research costs. The IRS worksheets ask hospitals to compare the direct and indirect costs of research to total research revenues received. However, we had data only on direct costs of research and payments to offset direct costs, not information related to indirect costs.
We also constructed measures for taxes paid by hospitals. The Cali-fornia and Florida financial reports had items related to provisions for federal and state income taxes, but we observed problems with these vari-ables. Many for- profit system hospitals had zero values despite having positive net incomes and despite hospital financial reporting instructions that income taxes were to be distributed to individual system hospitals based on their net incomes. Given this, we estimated for- profit hospital income taxes based on the net income they reported and state and federal tax laws in 2005. We also estimated property taxes. We obtained data on industrial property tax rates from the Minnesota Taxpayers Association, which annually collects data on property tax rates for individuals and companies in rural areas and large cities for all U.S. states (Minnesota Taxpayers Association 2007). Following Nicholson et al. (2000), we esti-mated a for- profit hospital’s property taxes by taking the value of net fixed assets (less accumulated deprecation) and multiplying this by the respec-tive urban and rural tax rates in the documentation noted above. Also, fol-lowing this earlier study, we estimated sales tax by multiplying a for- profit hospital’s supply expenses by the sales tax rates applicable in each state. The latter was obtained from the Federation of Tax Administrators and reflected state sales tax rates as of January 1, 2007, because historical data were not available (Federation of Tax Administrators 2007). Finally, a few nonprofit hospitals reported paying income taxes in California, and we included these because they represented a contribution to the community just as taxes paid by for- profit hospitals. Our tax measure is thus the sum of estimated federal and state income tax, property tax, and sales tax for for- profit hospitals and any reported income taxes of nonprofit hospitals.
Construction for many of the other study variables was straightforward given the variables identified above in the conceptual framework discus-

Bazzoli, Clement, and Hsieh ■ Community Benefits 1011
5. There is no general consensus for defining markets in health services research. Geopoliti-cal boundaries such as counties or metropolitan statistical areas are commonly used given that analysis of patient travel patterns is sometimes difficult to conduct and may be endogenous given the phenomena under study. We selected counties for our study given that our analysis encompasses both urban and rural hospitals, which could not be accommodated if metropolitan areas were instead chosen.
sion. Additional discussion of a few variables is warranted. In relation to ownership status, we obtained this information from the California and Florida financial reports rather than the AHA. Hospital teaching status was measured through two variables: membership in the Council of Teaching Hospitals (COTH) of the Association of American Medical Colleges, which is indicative of a major commitment to teaching; and a measure for non- COTH members indicating the presence of residency training programs.
In relation to community and hospital market characteristics, all mea-sures were developed using the county as the relevant market area.5 The Herfindahl- Hirschman Index used in the analysis was based on total hos-pital admissions as reported in the American Hospital Association data and used the sum of admissions for system hospitals in a county when they belonged to the same hospital system. Our models include a variable indicating high for- profit hospital presence in a market, which we defined separately for California and Florida based on the percentage of hospitals in a county that were for- profit. This variable took the value of 1 for coun-ties that had greater than the median value on this variable in their state and was 0 otherwise, and thus will indicate whether hospital provision of community benefits differs in markets with substantial versus little for- profit penetration. Finally, our measure for charity care provided by other hospitals includes care delivered not only by the for- profit and nonprofit hospitals under study but also by public and district hospitals because their efforts in this regard will reduce demands on private hospitals to provide these services.
Analytic Methods
The model estimated in our analysis takes the following form:
log (CB)n = β1 + β20wnn + β3Hospn + β4Commn + β5Markn + εn (1)
where CB represents community benefits, namely, the sum of unreim-bursed costs for community benefit activities, measured in logs given the skewness of this variable. In the equation, n references individual hospi-

1012 Journal of Health Politics, Policy and Law
tals. Ownn represents ownership status, which in our case will be nonprofit, church- affiliated and nonprofit, non- church- affiliated (for- profit ownership is the omitted category). Hospn represents other hospital characteristics. Commn is community characteristics that could affect demand. Markn is hospital market characteristics that could affect the supply of community benefit activities in the market.
We estimated equation (1) separately for California and Florida hospi-tals because Chow tests indicated that the models had significantly dif-ferent structures in the two states. It was also worthwhile to do separate analysis because California has mandated community benefit reporting, but Florida does not. We estimated the models first using ordinary least squares, applying robust estimation techniques given the clustering of community and hospital market variables. Also, two- stage least squares models were estimated, again with robust techniques, recognizing the point raised by Schneider (2007) that charity care offered by other hos-pitals in a market could be endogenous. This would arise if, for example, a hospital under study was a major provider of indigent care in its com-munity. If this were so, there would be less need for other hospitals in the market to provide charity care. Two instruments were used in this analysis: (1) following Schneider (2007), the sum of subsidies, transfers from restricted funds, and tax appropriations that other hospitals receive to support their indigent care activities; and (2) the percentage of all hos-pital beds in the county owned by public or district hospitals. Our results section reports the results of our specification tests for the instruments, which suggested that they were valid choices.
Empirical Results
Table 2 reports average unreimbursed costs for each individual primary community benefit activity plus bad debts, Medicare shortfalls, and taxes paid by ownership type. For simplicity, we combined church- affiliated and non- church- affiliated nonprofit hospitals in this table. Also, to improve comparability across ownership types, we constructed the variables on a per- bed basis because nonprofit hospitals tend to be larger than for- profit hospitals. In both California and Florida, nonprofit hospitals have more charity care costs per bed than for- profit hospitals. Florida nonprofit hos-pitals have greater unreimbursed Medicaid costs per bed than for- profit hospitals, but this was not true in California. The other unreimbursed cost items for primary community benefit activities are much smaller in magnitude than the first two, and when significant differences are present,

Tab
le 2
M
ean
Un
reim
bu
rsed
Co
sts
for
Co
mm
un
ity
Ben
efit
Act
ivit
ies
per
Ho
spit
al B
ed: N
on
pro
fit
and
Fo
r-Pr
ofi
t H
osp
ital
s in
Cal
ifo
rnia
an
d F
lori
da,
200
5
C
alif
orni
a H
ospi
tals
Fl
orid
a H
ospi
tals
O
vera
ll
O
vera
ll
Non
profi
t Fo
r-Pr
ofit
NFP
and
N
onpr
ofit
For-
Profi
t N
FP a
nd
H
ospi
tals
H
ospi
tals
FP
Mea
n H
ospi
tals
H
ospi
tals
FP
Mea
n
Prim
ary
com
mun
ity b
enefi
t act
iviti
es
Cha
rity
car
e co
sts
10
,149
* 7,
363*
9,
303
18,7
22**
8,
673*
* 13
,381
U
nrei
mbu
rsed
Med
icai
d co
sts
36,6
12
38,8
22
37,2
78
23,1
52*
16,9
66*
19,8
88
Unr
eim
burs
ed c
osts
for
oth
er m
eans
-tes
ted
gove
rnm
ent p
rogr
ams
4,39
7*
2,55
2*
3,83
5 n.
a.
n.a.
n.
a.
Hea
lth p
rofe
ssio
ns e
duca
tion
cost
(ne
t of
reve
nues
) 1,
389
581
1,14
2 3,
985*
* 80
5**
1,92
8
Res
earc
h co
sts
(net
of
reve
nues
) 29
1**
7**
203
126*
6*
61
To
tal o
f pr
imar
y co
mm
unity
ben
efit a
ctiv
ities
52
,992
47
,983
51
,477
45
,107
**
26,4
68**
33
,945
Bad
deb
t and
Med
icar
e sh
ortf
all
B
ad d
ebts
at c
ost
14,5
34
11,6
15
13,6
52
24,5
27**
14
,950
**
19,4
06
Unr
eim
burs
ed M
edic
are
cost
s 60
,744
**
38,9
29**
54
,118
23
,342
20
,037
21
,549
To
tal o
f ba
d de
bt a
nd M
edic
are
7
4,58
3**
50,6
50**
67
,358
46
,268
**
34,8
20**
39
,978
Taxe
s pa
id
6**
23,2
98**
6,
754
0**
25,8
65**
13
,735
Num
ber
of h
ospi
tals
14
3 62
20
5 63
74
13
7
Sour
ces:
Aut
hor a
naly
sis
of in
form
atio
n fr
om C
alif
orni
a O
ffice
of S
tate
wid
e H
ealt
h Pl
anni
ng a
nd D
evel
opm
ent D
atab
ase
and
Flo
rida
Age
ncy
for H
ealt
h C
are
Adm
inis
trat
ion
Dat
abas
e as
wel
l as
AH
A a
nnua
l sur
vey
data
, Are
a R
esou
rce
Fil
e, U
.S. C
ensu
s, C
ente
rs f
or M
edic
are
and
Med
icai
d S
ervi
ces,
and
Int
erSt
udy
data
. See
text
for
spe
cific
var
iabl
e co
nstr
ucti
ons.
Not
es: N
FP
= n
ot f
or p
rofit
; FP
= f
or p
rofit
; n.a
. = n
ot a
ppli
cabl
e*F
or-p
rofit
and
non
profi
t hos
pita
ls s
igni
fican
tly
diff
eren
t wit
hin
stat
e at
p ≤
0.0
5 le
vel
**Fo
r-pr
ofit a
nd n
onpr
ofit h
ospi
tals
sig
nific
antl
y di
ffer
ent w
ithi
n st
ate
at p
≤ 0
.01
leve
l
1014 Journal of Health Politics, Policy and Law
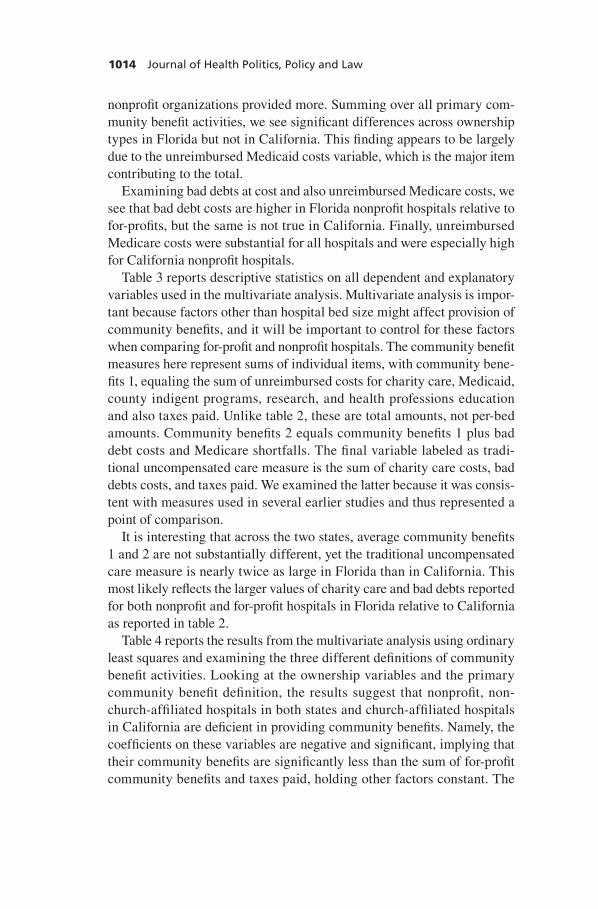
nonprofit organizations provided more. Summing over all primary com-munity benefit activities, we see significant differences across ownership types in Florida but not in California. This finding appears to be largely due to the unreimbursed Medicaid costs variable, which is the major item contributing to the total.
Examining bad debts at cost and also unreimbursed Medicare costs, we see that bad debt costs are higher in Florida nonprofit hospitals relative to for- profits, but the same is not true in California. Finally, unreimbursed Medicare costs were substantial for all hospitals and were especially high for California nonprofit hospitals.
Table 3 reports descriptive statistics on all dependent and explanatory variables used in the multivariate analysis. Multivariate analysis is impor-tant because factors other than hospital bed size might affect provision of community benefits, and it will be important to control for these factors when comparing for- profit and nonprofit hospitals. The community benefit measures here represent sums of individual items, with community bene-fits 1, equaling the sum of unreimbursed costs for charity care, Medicaid, county indigent programs, research, and health professions education and also taxes paid. Unlike table 2, these are total amounts, not per- bed amounts. Community benefits 2 equals community benefits 1 plus bad debt costs and Medicare shortfalls. The final variable labeled as tradi-tional uncompensated care measure is the sum of charity care costs, bad debts costs, and taxes paid. We examined the latter because it was consis-tent with measures used in several earlier studies and thus represented a point of comparison.
It is interesting that across the two states, average community benefits 1 and 2 are not substantially different, yet the traditional uncompensated care measure is nearly twice as large in Florida than in California. This most likely reflects the larger values of charity care and bad debts reported for both nonprofit and for- profit hospitals in Florida relative to California as reported in table 2.
Table 4 reports the results from the multivariate analysis using ordinary least squares and examining the three different definitions of community benefit activities. Looking at the ownership variables and the primary community benefit definition, the results suggest that nonprofit, non- church- affiliated hospitals in both states and church- affiliated hospitals in California are deficient in providing community benefits. Namely, the coefficients on these variables are negative and significant, implying that their community benefits are significantly less than the sum of for- profit community benefits and taxes paid, holding other factors constant. The

Bazzoli, Clement, and Hsieh ■ Community Benefits 1015
findings in the final set of columns, which focus strictly on uncompensated care and taxes, are also consistent with these conclusions for the primary community benefit definition. However, one finds different results once one accounts for both bad debt costs and Medicare shortfalls. Looking at community benefits definition 2 in the middle columns of table 4, we observe that there is no significant difference between the two nonprofit hospital groups and the omitted for- profit group. This suggests that the nonprofit groups provide enough of these community benefits to match those provided by for- profits, including the taxes the latter pay, all else equal. This finding is consistent with Schneider (2007) when she used an expanded community benefit definition that included Medicare shortfalls, as does our second community benefits definition.
Table 5 provides parameter estimates for our two- stage least squares models. The specification tests at the bottom of the table indicate that our instruments are valid. Namely, the first specification test, which assesses the joint significance of the instruments in a reduced form model with charity care provided by other hospitals as the dependent variable, indi-cates that these variables are significantly related to this variable. The overidentification test, for which the null hypothesis is that the instru-ments are correlated with the error term of the community benefit models, is rejected in all cases, although marginally so with a p = 0.11 for the tra-ditional uncompensated care measure in California. The pattern of results for the ownership variables overall are very similar to those in table 4. Generally, we find underprovision of community benefits relative to for- profit hospitals when the primary definition of community benefits is used and for the traditional uncompensated care measure. For the most part, these results become insignificant when the expanded definition of com-munity benefits is used, except for the negative coefficient for nonprofit, non- church- affiliated hospitals in Florida, which is marginally significant at the p = 0.10 level.
Tables 4 and 5 also provide similar findings for many other variables in the model. For hospital characteristics, larger hospitals (as measured by bed size) consistently provide more community benefits than smaller hospitals. This is true regardless of how community benefits are mea-sured. Teaching hospitals in California, whether COTH affiliated or not, typically provided more community benefits, but this was not true in Flor-ida. Similarly, hospitals with trauma centers in California provided more community benefits regardless of how it was measured, but this also was not found in Florida. For community characteristics, the ordinary least squares models suggested the paradoxical finding that greater propor-

Tab
le 3
M
ean
s an
d S
tan
dar
d D
evia
tio
ns
of
Dep
end
ent
and
Exp
lan
ato
ry V
aria
ble
s
Cal
ifor
nia
Hos
pita
ls
Flo
rida
Hos
pita
ls
Stan
dard
Stan
dard
Mea
n D
evia
tion
Mea
n D
evia
tion
Hos
pita
l ave
rage
: Unr
eim
burs
ed c
osts
for
com
mun
ity b
enefi
t act
iviti
es
C
omm
unity
ben
efits
defi
nitio
n 1
($ m
illio
ns)a
12
.746
15
.970
13
.822
18
.240
C
omm
unity
ben
efits
defi
nitio
n 2
($ m
illio
ns)b
27
.043
28
.837
24
.447
29
.590
T
radi
tiona
l unc
ompe
nsat
ed c
are
mea
sure
($
mill
ions
)c
6.07
4 6
.096
12
.154
12
.920
Hos
pita
l cha
ract
eris
tics
Prop
ortio
n ch
urch
-affi
liate
d .1
92
.395
.0
61
.241
Pr
opor
tion
nonp
rofit
, non
-chu
rch-
affil
iate
d .5
02
.501
.4
01
.492
St
affe
d an
d se
t-up
bed
s (0
0s)
2.17
7 1.
572
2.69
1 2.
361
Pr
opor
tion
syst
em-a
ffilia
ted
.758
.4
29
.816
.3
89
Prop
ortio
n w
ith r
esid
ency
teac
hing
pro
gram
s .0
91
.289
.0
68
.253
Pr
opor
tion
CO
TH
mem
bers
.0
55
.228
.0
41
.199
Pr
opor
tion
DSH
rec
ipie
nts
.831
.3
76
.605
.4
90
Prop
ortio
n w
ith tr
aum
a ce
nter
.1
83
.387
.0
95
.295
Com
mun
ity c
hara
cter
istic
s (c
ount
y)
Prop
ortio
n of
pop
ulat
ion
unin
sure
d .1
89
.037
.1
55
.032
Pe
r ca
pita
inco
me
(000
s)
37.0
03
10.1
95
34.2
11
8.33
5
Bir
ths
/ 1,0
00 w
omen
age
s 15
to 4
4 69
.090
8.
540
63.5
58
7.22
4
Prop
ortio
n lo
cate
d in
rur
al c
omm
unity
.0
59
.237
.1
43
.351
(con
tinu
ed)

Tab
le 3
(C
on
tin
ued
)
Cal
ifor
nia
Hos
pita
ls
Flo
rida
Hos
pita
ls
Stan
dard
Stan
dard
Mea
n D
evia
tion
Mea
n D
evia
tion
Mar
ket c
hara
cter
istic
s (c
ount
y)
HM
O m
arke
t sha
re
.438
.1
69
.213
.1
33
Her
finda
hl-H
irsc
hman
Ind
ex
.273
.2
55
.444
.2
63
Hos
pita
l bed
s / 1
,000
pop
ulat
ion
1.89
8 .5
34
2.78
5 .7
57
Prop
ortio
n in
mar
kets
with
hig
h %
for
-pro
fit h
ospi
tals
.5
30
.500
.6
46
.480
C
hari
ty c
are
prov
ided
by
othe
rs (
000,
000s
) 54
.526
61
.972
29
.947
33
.552
Inst
rum
enta
l var
iabl
es u
sed
in 2
SLS
(cou
nty)
Su
m o
f re
stri
cted
fun
d tr
ansf
ers,
indi
gent
sub
sidi
es, a
nd p
ublic
sup
port
fo
r in
dige
nt c
are
prov
isio
n fo
r ot
her
hosp
itals
in a
cou
nty
($ m
illio
ns)
2.32
0 3.
983
38.3
54
86.1
39
Prop
ortio
n of
hos
pita
l bed
s in
cou
nty
that
are
pub
licly
ow
ned
.126
.1
18
.095
.1
67N
umbe
r of
hos
pita
ls
205
137
Sour
ces:
Aut
hor a
naly
sis
of in
form
atio
n fr
om C
alif
orni
a O
ffice
of S
tate
wid
e H
ealt
h Pl
anni
ng a
nd D
evel
opm
ent D
atab
ase
and
Flo
rida
Age
ncy
for H
ealt
h C
are
Adm
inis
trat
ion
Dat
abas
e as
wel
l as
AH
A a
nnua
l sur
vey
data
, Are
a R
esou
rce
Fil
e, U
.S. C
ensu
s, C
ente
rs f
or M
edic
are
and
Med
icai
d S
ervi
ces,
and
Int
erSt
udy
data
. See
text
for
spe
cific
var
iabl
e co
nstr
ucti
ons.
Not
es: C
OT
H =
Cou
ncil
of
Teac
hing
Hos
pita
ls; D
SH =
dis
prop
orti
onat
e sh
are
hosp
ital
; HM
O =
hea
lth
mai
nten
ance
org
aniz
atio
n; 2
SLS
= t
wo-
stag
e le
ast
squa
res
a Equ
als
the
sum
of
unre
imbu
rsed
cos
ts fo
r ch
arit
y ca
re, M
edic
aid,
cou
nty
indi
gent
pro
gram
s (C
A o
nly)
, res
earc
h, a
nd h
ealt
h pr
ofes
sion
s ed
ucat
ion
and
also
ta
xes
paid
by
hosp
ital
sb E
qual
s co
mm
unit
y be
nefit
s 1
defi
niti
on a
s ab
ove
plus
cos
ts f
or b
ad d
ebt a
nd M
edic
are
shor
tfal
lsc E
qual
s su
m o
f ch
arit
y ca
re c
osts
, bad
deb
t cos
ts, a
nd ta
xes
paid
by
hosp
ital
s

Tab
le 4
M
ult
ivar
iate
An
alys
is o
f C
om
mu
nit
y B
enefi
t A
ctiv
itie
s: R
ob
ust
OLS
Reg
ress
ion
Mo
del
s
C
omm
unity
Ben
efits
C
omm
unity
Ben
efits
T
radi
tiona
l Unc
ompe
nsat
ed
D
efini
tion
1 D
efini
tion
2 C
are
Mea
sure
C
alif
orni
a Fl
orid
a C
alif
orni
a Fl
orid
a C
alif
orni
a Fl
orid
a
Hos
pita
l cha
ract
eris
tics
Non
chur
ch, n
onpr
ofit
–.38
1***
-.
519*
* –.
074
–.22
8 –.
419*
**
-.28
8*
Chu
rch-
affil
iate
d, n
onpr
ofit
–.51
3***
.0
79
–.03
2 .0
98
–.41
9***
–.
133
St
affe
d an
d se
t-up
bed
s (0
0s)
.388
***
.273
***
.379
***
.248
***
.338
***
.234
***
Sy
stem
-affi
liate
d .4
14**
–.
169
.193
–.
058
.122
.1
20
Res
iden
cy te
achi
ng p
rogr
ams
.421
***
.030
.1
92
–.08
1 .2
17**
.0
97
CO
TH
mem
ber
.672
***
.281
.5
04**
* .1
69
.285
* .1
18
DSH
rec
ipie
nt
.255
.1
44
–.19
7 –.
099
.095
.0
81
Tra
uma
cent
er
.378
***
–.04
9 .2
85**
* .1
81
.433
***
.280
*C
omm
unity
cha
ract
eris
tics
Prop
ortio
n of
pop
ulat
ion
unin
sure
d –7
.622
**
.810
–1
3.04
5***
–1
.212
–6
.708
**
1.59
6
Per
capi
ta in
com
e (0
00s)
–.
016*
–.
001
–.01
8***
–.
0002
–.
020*
**
.001
B
irth
s / 1
,000
wom
en a
ges
15 to
44
.006
–.
004
.006
.0
01
–.00
02
–.00
5
Rur
al c
omm
unity
–.
105
–.77
3***
–.
336
–.72
3***
–.
196
–.77
3***
Mar
ket c
hara
cter
istic
s
H
MO
mar
ket s
hare
.9
41
–.05
6 –.
104
.012
.7
26
–.65
6
Her
finda
hl-H
irsc
hman
Ind
ex
1.14
0***
.1
74
.498
.2
73
–.03
1 .2
23
Hos
pita
l bed
s / 1
,000
pop
ulat
ion
.096
.2
13
.026
.1
63
–.09
4 .0
59
(con
tinu
ed)

Tab
le 4
(C
on
tin
ued
)
C
omm
unity
Ben
efits
C
omm
unity
Ben
efits
T
radi
tiona
l Unc
ompe
nsat
ed
D
efini
tion
1 D
efini
tion
2 C
are
Mea
sure
C
alif
orni
a Fl
orid
a C
alif
orni
a Fl
orid
a C
alif
orni
a Fl
orid
a
H
igh
% f
or-p
rofit
hos
pita
ls
.402
**
–.05
7 .0
01
–.18
0 .0
52
.001
C
hari
ty c
are
prov
ided
by
othe
rs (
mill
ions
) .0
02
–.00
4*
.003
* –.
002
–.00
04
–.00
4*In
terc
ept
14.9
34**
* 15
.286
***
18.2
06**
* 15
.802
***
16.3
70**
* 15
.350
***
R2
.521
.6
29
.585
.6
67
.544
.6
34
Sour
ces:
Aut
hor a
naly
sis
of in
form
atio
n fr
om C
alif
orni
a O
ffice
of S
tate
wid
e H
ealt
h Pl
anni
ng a
nd D
evel
opm
ent D
atab
ase
and
Flo
rida
Age
ncy
for H
ealt
h C
are
Adm
inis
trat
ion
Dat
abas
e as
wel
l as
AH
A a
nnua
l sur
vey
data
, Are
a R
esou
rce
Fil
e, U
.S. C
ensu
s, C
ente
rs f
or M
edic
are
and
Med
icai
d S
ervi
ces,
and
Int
erSt
udy
data
. See
text
for
spe
cific
var
iabl
e co
nstr
ucti
ons.
Not
es: O
LS
= o
rdin
ary
leas
t squ
ares
; CO
TH
= C
ounc
il o
f Te
achi
ng H
ospi
tals
; DSH
= d
ispr
opor
tion
ate
shar
e ho
spit
al; H
MO
= h
ealt
h m
aint
enan
ce o
rga-
niza
tion
*p ≤
0.1
0; *
*p ≤
0.0
5; *
**p ≤
0.01

Tab
le 5
M
ult
ivar
iate
An
alys
is o
f C
om
mu
nit
y B
enefi
t A
ctiv
itie
s: R
ob
ust
Tw
o-S
tag
e Le
ast
Squ
ares
Reg
ress
ion
Mo
del
s
C
omm
unity
Ben
efits
C
omm
unity
Ben
efits
T
radi
tiona
l Unc
ompe
nsat
ed
D
efini
tion
1 D
efini
tion
2 C
are
Mea
sure
C
alif
orni
a Fl
orid
a C
alif
orni
a Fl
orid
a C
alif
orni
a Fl
orid
a
Hos
pita
l cha
ract
eris
tics
Non
profi
t, no
nchu
rch
–.32
4**
–.64
4***
–.
052
–.34
5*
–.42
8***
–.
406*
*
Chu
rch-
affil
iate
d –.
412*
* .0
63
.003
.0
76
–.43
6***
–.
175
St
affe
d an
d se
t-up
bed
s (0
0s)
.367
***
.293
***
.372
***
.270
***
.340
***
.254
***
Sy
stem
-affi
liate
d .4
00*
–.09
4 .1
87
.040
.1
28*
.198
R
esid
ency
teac
hing
pro
gram
s .6
47**
–.
117
.279
* –.
253
.211
* –.
101
C
OT
H m
embe
r .6
27**
* .3
30
.486
***
.329
.1
93*
.152
D
SH r
ecip
ient
.0
80
–.00
2 –.
262
–.12
0 .2
87**
.0
48
Tra
uma
cent
er
.444
***
–.19
5 .3
12**
* –.
005
.426
***
.147
Com
mun
ity c
hara
cter
istic
s
Pr
opor
tion
of p
opul
atio
n un
insu
red
14.8
47
3.21
1 –4
.389
.9
20
–9.5
33
4.50
8
Per
capi
ta in
com
e (0
00s)
.0
09
.008
–.
008
.009
–.
024*
* .0
12
Bir
ths
/ 1,0
00 w
omen
age
s 15
to 4
4 –.
033
–.00
2 –.
009
.005
.0
05
–.00
4
Rur
al c
omm
unity
1.
014
–.67
4***
.0
91
–.60
5***
–.
335
–.66
7***
Mar
ket c
hara
cter
istic
s
H
MO
mar
ket s
hare
4.
290
.657
1.
171
.744
.3
21
.130
H
erfin
dahl
-Hir
schm
an I
ndex
.4
66
–.43
8 .2
39
–.38
0 .0
55
–.41
2
Hos
pita
l bed
s / 1
,000
pop
ulat
ion
.224
.1
63
.074
.1
13
–.10
8 .0
07
(con
tinu
ed)

Tab
le 5
(C
on
tin
ued
)
C
omm
unity
Ben
efits
C
omm
unity
Ben
efits
T
radi
tiona
l Unc
ompe
nsat
ed
D
efini
tion
1 D
efini
tion
2 C
are
Mea
sure
C
alif
orni
a Fl
orid
a C
alif
orni
a Fl
orid
a C
alif
orni
a Fl
orid
a
H
igh
% f
or-p
rofit
hos
pita
ls
.892
**
–.19
2 .1
85
–.15
4 –.
003
–.14
1
Cha
rity
car
e pr
ovid
ed b
y ot
hers
(m
illio
ns)
–.01
0 –.
010
–.00
3 –.
013
.002
–.
015
Inte
rcep
t 11
.639
***
15.0
53**
* 16
.949
***
15.5
11**
* 16
.781
***
15.1
15**
*IV
rel
evan
ce te
st (χ2
p-v
alue
) .0
15
.000
1 .0
13
.000
1 .0
13
.000
1H
anse
n ov
erid
entifi
catio
n te
st p
-val
ue
.642
.3
00
.531
.2
47
.111
.3
80F
-val
ue (
Prob
> F
) 23
.34
31.7
4 72
.34
47.8
6 18
6.72
30
.16
(0.0
00)
(0.0
00)
(0.0
00)
(0.0
00)
(0.0
00)
(0.0
00)
Sour
ces:
Aut
hor a
naly
sis
of in
form
atio
n fr
om C
alif
orni
a O
ffice
of S
tate
wid
e H
ealt
h Pl
anni
ng a
nd D
evel
opm
ent D
atab
ase
and
Flo
rida
Age
ncy
for H
ealt
h C
are
Adm
inis
trat
ion
Dat
abas
e as
wel
l as
AH
A a
nnua
l sur
vey
data
, Are
a R
esou
rce
Fil
e, U
.S. C
ensu
s, C
ente
rs f
or M
edic
are
and
Med
icai
d S
ervi
ces,
and
Int
erSt
udy
data
. See
text
for
spe
cific
var
iabl
e co
nstr
ucti
ons.
Not
es: C
OT
H =
Cou
ncil
of
Teac
hing
Hos
pita
ls; D
SH =
dis
prop
orti
onat
e sh
are
hosp
ital
; HM
O =
hea
lth
mai
nten
ance
org
aniz
atio
n*p
≤ 0
.10;
**p
≤ 0
.05;
***
p ≤
0.01

1022 Journal of Health Politics, Policy and Law
tions of uninsured people led to fewer community benefits in California. However, this relationship was insignificant in the two- stage models. In Florida, fewer community benefits were provided among hospitals in rural areas, but this was not true in California. Few significant relationships were present for the market factors.
Discussion
Although a consensus has developed that one set of activities is relevant as hospital community benefit activities, agreement has not been reached about the treatment of bad debt expense and Medicare shortfalls. The recent revision of IRS Form 990 Schedule H, although providing tools for more precise measurement of many community benefit activities, left issues about hospital bad debts and Medicare shortfalls open and unre-solved. Our analysis tested whether an inclusive versus exclusive definition of hospital community benefits mattered when using common approaches developed by health services researchers to assess the adequacy of non-profit hospital community benefit provision relative to a for- profit hospital benchmark that accounts for their community benefits and taxes paid. Overall, we found that for California and Florida nonprofit hospitals, conclusions about the adequacy of their community benefits were highly dependent on the definition of community benefits used.
Specifically, our major finding was that private, nonprofit hospitals in California and Florida were not, as a group, providing adequate com-munity benefits when the primary IRS definition of community benefits was used. This was the case for non- church- affiliated nonprofit hospitals in California and Florida and for church- affiliated hospitals in California. These findings were robust across different estimation methods. When both bad debts and Medicare shortfalls were included, we found that the nonprofit hospital community benefits generally met the for- profit bench-mark. Overall, our results suggest that inclusion of Medicare shortfalls may be especially important to concluding that nonprofit hospitals provide sufficient community benefits. Namely, when we examined the traditional uncompensated care measure, we still observed deficiencies for private, nonprofit hospitals, and only when Medicare shortfalls and bad debts are captured together do these deficiencies disappear. This conclusion is con-sistent with the results of Schneider (2007), in that she found deficits in community benefit provision when only uncompensated care was exam-ined, but these deficits were eliminated when other items, including Medi-care shortfalls, were included in the analysis.

Bazzoli, Clement, and Hsieh ■ Community Benefits 1023
There are important limitations to our analysis. We were not able to measure all items identified in Form 990 Schedule H that are considered primary community benefit activities. As noted above, though, data com-piled by Gray and Schlesinger (2009) suggest that these omitted activities are likely to be only a small portion of community benefit activity. Also, we focus on a small sample of hospitals, but we are capturing around 85 to 90 percent of the for- profit and private, nonprofit hospitals in the states studied. Finally, the data we examined came from a source other than the eventual IRS forms. This has the disadvantage that we might be missing or undercounting important activities, but there is also the countervailing advantage in that the data are not influenced by incentives to creatively report community benefit activities given the items on which the IRS form focuses. In addition, our 2005 study data reflect a period before the publi-cation of the CHA and VHA, Inc., guidelines in 2006 and the subsequent revision of Form 990 Schedule H and thus do not reflect hospital behavior changes that resulted as a consensus was building for community benefit definitions. However, our analysis provides a baseline on hospital involve-ment in relevant activities that is not available from earlier studies.
Despite these limitations, our findings provide insights into why the debate over the inclusion or exclusion of bad debt expense and Medicare shortfalls has remained intense and difficult to resolve. Both sides argu-ing either for or against inclusion of these items have made reasonable arguments to support their positions. Those arguing against inclusion note that bad debts may include some patients who are not necessarily needy and might represent ineffective hospital collection efforts. They also note that Medicare shortfalls may not represent underpayment of hospitals but inefficiency. Those arguing for inclusion note that some patients generat-ing bad debt are economically disadvantaged and that Medicare shortfalls do reduce financial burden on government agencies, which was the intent expressed in the 1969 IRS rulings. Our findings suggest that bad debts and Medicare shortfalls represent big dollar items, as evident in table 2, and thus are likely important to many nonprofit hospitals in making the case that their tax exemptions are warranted.
In light of these positions and our findings, perhaps the best strategy for policy makers and the hospital industry is to refocus the current debate on identifying the circumstances under which some or all of hospital bad debts and Medicare shortfalls should be counted toward community bene-fit. In terms of bad debt, nonprofit hospitals are already moving in this direction by redefining their charity care policies so that financially needy individuals are captured as charity cases a priori rather than being counted

1024 Journal of Health Politics, Policy and Law
toward bad debt (Stati, Hurley, and Cunningham 2005). Hospitals have also revised their charity care policies so that they can rely on information such as a person’s enrollment in state- subsidized food or housing pro-grams or in prescription aid programs rather than rely on more sensitive and difficult to collect income and asset information (Evans 2009). Also, Evans (2010) noted that in response to the new IRS Form 990, nonprofit hospitals are developing statistical approaches that segment that portion of their bad debt expenses that might be considered charity care because patients generating these bills live in low- income zip codes. These hospital responses, though, have occurred in an ad hoc way without clear guidance from trade associations or policy makers.
Guidelines and standards for nonprofit hospitals could focus on the types of patients or services for which resulting bad debts or Medicare shortfalls may qualify as community benefits. Studying approaches used by hospitals currently to deal with bad debt expense would be a good starting point for developing such standards. For Medicare shortfalls, it may be best to identify certain types of Medicare patients (e.g., those with SSI or without supplemental insurance) or certain services (e.g., those less frequently provided by for- profit hospitals or that are generally known to be unprofitable given existing PPS formula) and use these as a basis to segment Medicare shortfalls into the portion relevant to community bene-fit measurement. Also, useful data may be gleaned from the first round of Form 990 Schedule H submissions because hospitals are asked to report their rationale for why some or all of their bad debts and Medicare short-falls should be counted as community benefits. Ultimately, a refocused discussion on these issues might provide a way to break existing dead-locks over whether bad debt expense and Medicare shortfalls count as community benefits. Given the results of our analysis, resolution of these issues is important because the inclusion or exclusion of these disputed items is likely to be relevant for judging the adequacy of nonprofit hospital community benefit activities.
References
Arrington, B., and C. C. Haddock. 1990. Who Really Profits from Not- For- Profits? Health Services Research 25 (June): 291 – 304.
Bazzoli, G. J., R. C. Lindrooth, R. Kang, and R. Hasnain- Wynia. 2006. The Influence of Health Policy and Market Factors on the Hospital Safety Net. Health Services Research 41 (August, Part 1): 1159 – 1180.

Bazzoli, Clement, and Hsieh ■ Community Benefits 1025
California Office of Statewide Health Planning and Development (OSHPD) Data-base. Healthcare Information Division — Annual Financial Data, Complete Data Set. www.oshpd.ca.gov/HID/Products/Hospitals/AnnFinanData/CmplteDataSet/index.html (data for 2005).
Catholic Health Association (CHA). 2006a. A Guide for Planning and Reporting Community Benefit. Washington, DC: CHA.
———. 2006b. Comparison between the Catholic Health Association and VHA Inc.’s A Guide for Planning and Reporting Community Benefit and State Community Benefit and Related Laws, Guidelines, and Standards. September 12. http://www .nonprofithealthcare.org/resources/CHA- VHAGuideComparedToStateLaws.pdf.
Congressional Budget Office (CBO). 2006. Nonprofit Hospitals and the Provi-sion of Community Benefits, December. Washington, DC: CBO. www.cbo.gov/ftpdocs/76xx/doc7695/12- 06- Nonprofit.pdf (accessed February 2010).
Davidoff, A. J., A. T. LoSasso, G. J. Bazzoli, and S. Zuckerman. 2000. The Effect of Changing State Health Policy on Hospital Uncompensated Care. Inquiry 37:253 – 67.
Duggan, M. 2002. Hospital Market Structure and the Behavior of Not- For- Profit Hos-pitals. RAND Journal of Economics 33:433 – 446.
Evans, M. 2009. HFMA Takes Strict Stance on Charity Care. Modern Healthcare 39 (24): 10, 12.
———. 2010. Making Good on Bad Debt. Modern Healthcare 40 (1): 32 – 33. Federation of Tax Administrators. 2007. State Sales Tax Rate and Vendor Discounts.
www.taxadmin.org/fta/rate/sales_vdr.html (accessed December 14, 2007).Florida Agency for Health Care Administration (AHCA) Database. Hospital Finan-
cial Data (Florida Hospital Uniform Reporting System). www.ahca.myflorida.com/MCHQ/CON_FA/fa_data/index.shtml (data for 2005).
Grassley, C. 2006. Tax- Exempt Hospitals, Community Benefit, and Charitable Care. News release, November 17. www.grassley.senate.gov/news/Article.cfm?customel _dataPageID_1502=3860.
Gray, B., and M. Schlesinger. 2009. Charitable Expectations of Nonprofit Hospitals: Lessons from Maryland. Web exclusive, Health Affairs, July 23, w809 – w821. content .healthaffairs.org/cgi/reprint/28/5/w809.
Herzlinger, R. E., and W. S. Krasker. 1987. Who Profits from Nonprofits? Harvard Business Review 65 (1): 93 – 105.
Internal Revenue Service (IRS). 2009. 2009 Instructions for Schedule H (Form 990) Hospitals. www.irs.gov/pub/irs- pdf/i990sh.pdf (accessed September 20, 2010).
Kane, N. M., and W. H. Wubbenhorst. 2000. Alternative Funding Policies for the Uninsured: Exploring the Value of Hospital Tax Exemption. Milbank Quarterly 78:185 – 212.
Minnesota Taxpayers Association. 2007. Fifty State Comparison Study (2004). www .mntax.org/research/property.php (accessed December 17, 2007).
Morrisey, M. A., G. J. Wedig, and M. Hassan. 1996. Do Nonprofit Hospitals Pay Their Way? Health Affairs 15 (4): 132 – 144.
Nicholson, S., M. V. Pauly, L. R. Burns, A. Baumritter, and D. A. Ash. 2000. Measur-ing Community Benefits Provided by For- Profit and Nonprofit Hospitals. Health Affairs 19 (6): 168 – 177.

1026 Journal of Health Politics, Policy and Law
Norton, E. C., and D. O. Staiger. 1994. How Hospital Ownership Affects Access to Care for the Uninsured. RAND Journal of Economics 25:171 – 185.
Schneider, H. 2007. Paying Their Way? Do Nonprofit Hospitals Justify Their Favorable Tax Treatment? Inquiry 44:187 – 199.
Stati, A., R. E. Hurley, and P. J. Cunningham. 2005. Balancing Margin and Mission: Hospitals Alter Billing and Collection Practices for Uninsured Patients. Issue Brief 99. October. Washington, DC: Center for Studying Health System Change.
Sutton, J. P., M. Milet, and B. Blanchfield. 2002. The Role of Private Hospitals in the California Healthcare Safety Net: A Comparison of Charitable Contributions Reported by the For- Profit and Non- Profit Hospitals in 1998. Public Policy Brief H Series 3 (2): 1 – 6.
Thorpe, K. E., E. E. Seiber, and C. S. Florence. 2001. The Impact of HMOs on Hospital- Based Uncompensated Care. Journal of Health Politics, Policy and Law 26:543 – 555.
Trocchio, J. 2006. Community Benefit: A Matter of Accountability: One Organiza-tion’s Approach. ABA Health eSource, vol. 3, November. www.abanet.org/health/esource/Volume3/03/trocchio.html (accessed June 9, 2008).
U.S. Government Accountability Office (GAO). 2008. Nonprofit Hospitals: Variation in Standards and Guidance Limits Comparison of How Hospitals Meet Commu-nity Benefit Requirements. Report GAO- 08- 880. September. Washington, DC: U.S. GAO.
Weisbrod, B. A. 1980. Private Goods, Collective Goods: The Role of the Nonprofit Sector. In The Economics of Nonproprietary Organizations, Research in Law and Economics, ed. K. Clarkson and D. Martin, supplement 1, 139 – 177. Greenwich, CT: JAI.