Cost-Benefit Analysis of 9-1-1 Call Center Consolidation in ...
Upload
khangminh22Category
view
1download
0
ATTACHMENT F
BENEFIT-COST ANALYSIS
COMMONWEALTH OF VIRGINIA
AttFBenefitCostAnalysis.pdf

Norfolk Coastal Adaptation and Community Transformation Plan
Attachment F Benefit Cost Analysis i

Norfolk Coastal Adaptation and Community Transformation Plan
Attachment F Benefit Cost Analysis ii
Attachment F Benefit Cost Analysis
To facilitate the reader understanding, Attachment F is divided into five distinct sections plus an Appendices. Contents for Sections I through III are provided herein. Because Section IV: BCA Methodologies contains various sub-sections, another table of contents has been developed for this portion of the report and is provided in a separate document:
I: Overview provides a summary of the purpose of the Benefit-Cost Analysis, theapproach taken to conduct the analysis, and presents overarching results.
II: Project Description provides a detailed project description of the Newton’s CreekWatershed, Ohio Creek Watershed, and the Elizabeth River Shoreline Restoration.Though each of these projects can be viewed independently of one another, togetherthey form the City of Norfolk Coastal Adaptation and Community Transformation Plan.
III: Existing Conditions describes specific existing conditions of risks andvulnerabilities that will be reduced by the institution of each project. This includesdisconnected neighborhoods, vulnerable populations, environmental conditions, culturalresources and critical assets, economic growth trends, and current risk context.
IV: Benefits Included in the Benefit Cost Ratio provides a detailed approach for eachbenefit quantified in this analysis.
V: Qualitative Benefits describes benefits not included in the benefit cost ratio (BCR),which are limited to the nine pages required by HUD.
Appendiceso F-1: Attachment H Crosswalko F-2: Benefit-Cost Analysis Resultso F-3: Project Cost Estimateso F-4: Operations and Maintenance Cost Justificationso F-5: Overview of Stormwater Capital Improvement Projects, FY 2012 through
FY 2016o F-6: Sea Level Rise Memorandumso F-7: Hazus Technical Manual Excerptso F-8: FEMA Standard Valueso F-9: Research Valuing Aesthetic Benefitso F-10: Annualized Building, Content, and Inventory Replacement Costso F-11: Depth-Damage Functions for Buildings, Contents, and Inventoryo F-12: Code Mapping for Structures and Industrieso F-13: Structure Inventory Mappingo F-14: Transportation Losseso F-15: Comparable Facilities – Nassau County Pump Station Damage Assessment
Summary (Hurricane Sandy, 2012) Additional documentation can be found here. This documentation includes the
following:o Project Cost Estimates in spreadsheet formalo Benefit Cost Analysis results in spreadsheet formato Economic Impact Analysis documentationo Benefit cost analysis spreadsheet calculationso Additional images, maps, and graphics

Norfolk Coastal Adaptation and Community Transformation Plan
Attachment F Benefit Cost Analysis iii
Contents Part I Overview……………………………………………………………….………...……...I.1
Overview .......................................................................................................................... I.2
Project Phasing................................................................................................................ I.7
Quantified Results ......................................................................................................... I.10
BCA Crosswalk ............................................................................................................. I.15
Part II Project Description…………………………………………………………………....II.1
Project Area ................................................................................................................... II.3
Project Summaries ........................................................................................................ II.6
Ohio Creek Watershed ................................................................................................. II.9
Newton’s Creek Watershed ....................................................................................... II.21
Elizabeth River Shoreline Restoration...................................................................... II.40
Design Philosophy ....................................................................................................... II.44
Project Schedule .......................................................................................................... II.49
Capital Cost Estimates ............................................................................................... II.52
Operation & Maintenance Costs ............................................................................... II.54
Feasibility of Proposed Projects ................................................................................ II.57
Project Metrics ............................................................................................................ II.60
Publicly Funded Resiliency Actions Post-Irene ....................................................... II.66
Part III Existing Conditions……………………………………………………………..…..III.1
Existing Conditions ...................................................................................................... III.2
Vulnerable Populations ............................................................................................... III.4
Environmental Conditions .......................................................................................... III.8
Cultural Resources and Critical Assets ................................................................... III.17
Growth Trends ........................................................................................................... III.24
Current Risk Context ................................................................................................ III.25
Stormwater Management Risk .............................................................................. III.27
Coastal Flood Risk .................................................................................................. III.30
Lack of Neighborhood Connectivity ...................................................................... III.34
Affordable Housing Need ....................................................................................... III.39
Economic Risk ......................................................................................................... III.42
Environmental Risk ................................................................................................ III.44
Recent Hurricane Impacts ...................................................................................... III.45

Norfolk Coastal Adaptation and Community Transformation Plan
Attachment F Benefit Cost Analysis iv
Risks of Inaction ...................................................................................................... III.50
Part IV Benefits Included in the Benefit Cost Ratio………………………………………..IV.I
Resiliency Values…………….………………….….…………………………….IV.1.1.1
Hazard Scenarios....…………….………….….………………………………..IV.1.1.2
Direct Physical Damages (Buildings)…………..…..…………..………….…..IV.1.2.2
Essential Facilities and Critical Infrastructure.…………...............................IV.1.3.2
Human Impacts…………………………………...............................................IV.1.4.2
Fatalities Avoided…………………………......................................................IV.1.4.4
Mental Stress and Anxiety Benefits……………………...............................IV.1.4.12
Lost Productivity………………………………………………...………......IV.1.4.18
Relocation and Economic Loss of Function…………………………....…..IV.1.4.23
Shelter Needs……………………..………………………...................….…..IV.1.4.28
Environmental Values .................................................................................. ……….IV.2.2
Green Infrastructure Benefits. ....................................................................... ….IV.2.12
Ecosystem Goods and Services Benefits ....................................................... …..IV.2.21
Social Value ........................................................................................................... ….IV.3.2
Recreational Benefits ........................................................................................ ….IV.3.4
Health Benefits ................................................................................................. ….IV.3.12
Aesthetic Benefits ............................................................................................ ….IV.3.15
Economic RevitalizationBenefits……...………………………..………………….IV.4.2
Economic Impacts Avoided .................................................................................. …IV.5.2
Part V Qualitative Benefits…………………………………………………………….……..V.1
Affordable Housing ........................................................................................................ V.1
Workforce Benefits ........................................................................................................ V.1
Historic Preservation ..................................................................................................... V.1
Stormwater Management .............................................................................................. V.2
Water Quality Benefits .................................................................................................. V.3
Urban Heat Island Mitigation....................................................................................... V.4
Emergency Response and Recovery Efforts ................................................................ V.5
Injuries ............................................................................................................................ V.5
Economic Impacts of Project Implementation ............................................................ V.5
Regional Benefits ............................................................................................................ V.6
Light Rail Infrastructure .............................................................................................. V.6

Norfolk Coastal Adaptation and Community Transformation Plan
Attachment F Benefit Cost Analysis v
List of Figures Part I Overview
Figure I.1 Norfolk Phase I Target Area and Phase 2 Project Sub-Area ................... I.5
Figure I.2 Norfolk Coastal Adaptation and Community Transformation Plan Key Intervention Sites ............................................................................................................ I.6
Figure I.3 Norfolk Coastal Adaptation and Community Transformation Plan Phasing Strategies ........................................................................................................... I.8
Figure I.4 Norfolk Coastal Adaptation and Community Transformation Plan Project Scheduling .......................................................................................................... I.9
Part II Project Description
Figure II.1 Existing Conditions of the Target Area ................................................... II.4
Figure II.2 Estimated Flooding at the 1% Annual Chance Event of the Target Area ................................................................................................................................ II.4
Figure II.3 Resulting Target Area ............................................................................... II.8
Figure II.4 Ohio Creek Watershed Vision Plan ....................................................... II.10
Figure II.5 Ohio Creek Shoreline Proposed Coastal Flood Protection .................. II.15
Figure II.6 Ohio Creek Proposed Stormwater Management ................................. II.16
Figure II.7 Ohio Creek Proposed Open Space Network ......................................... II.17
Figure II.8 Ohio Creek Proposed Network Connectivity ........................................ II.18
Figure II.9 Ohio Creek Watershed Proposed Living Shoreline ............................. II.19
Figure II.10 Newton’s Creek Watershed Vision Plan ............................................. II.21
Figure II.11 Newton’s Creek Proposed Coastal Resiliency Improvements........... II.24
Figure II.12 Newton’s Creek Watershed Holt Avenue Back-Up ........................... II.25
Figure II.13 Newton’s Creek Proposed Stormwater Management ........................ II.27
Figure II.14 Newton’s Creek Watershed Stromwater Transect ............................ II.28
Figure II.15 Newton’s Creek Connectivity Improvements ..................................... II.30
Figure II.16 Coastal Resiliency Accelerator Goals and Objectives ........................ II.33
Figure II.17 Newton’s Creek Coastal Resilience Accelerator Potential Locations II.37
Figure II.18 Newton’s Creek Watershed Proposed Living Shoreline .................... II.38
Figure II.19 Examples of Living Shorelines with Protective Sills .......................... II.40
Figure II.20 Proposed Elizabeth River Living Shoreline ........................................ II.42
Figure II.21 Target Area Existing Conditions and Historic Streambed ................ II.45

Norfolk Coastal Adaptation and Community Transformation Plan
Attachment F Benefit Cost Analysis vi
Figure II.22 Sea Level Rise Projections, Norfolk, VA ............................................. II.46
Part III Existing Conditions
Figure III.1 Target Area Watersheds ........................................................................ III.2
Figure III.2 Target Area Neighborhoods ................................................................... III.2
Figure III.3 Poverty by Census Tract in Norfolk...................................................... III.5
Figure III.4 Sensitive Environment Areas in Norfolk ............................................ III.11
Figure III.5 Primary Land Uses in the Target Area ............................................... III.13
Figure III.6 Coastal Land Uses in the Target Area ................................................ III.14
Figure III.7 Example Land Uses in the Target Area .............................................. III.15
Figure III.8 Landmarks and Cultural Assets in the Target Area ......................... III.18
Figure III.9 Parks and Recreation Centers in the Target Area ............................ III.19
Figure III.10 The Tide Light Rail Route ................................................................. III.20
Figure III.11 Government Buildings Located within the Target Area ................. III.21
Figure III.12 Emergency Services within the Target Area .................................... III.22
Figure III.13 July 2015 Rain-Driven Flooding on E. Brambleton ........................ III.27
Figure III.14 Schematic Comparison of Stormwater Flows and Potential Flooding in the St. Paul’s Area and Harbor Park during Regular and High Tide Scenarios III.28
Figure III.15 October 1, 2015 Flooding from Rainfall ........................................... III.30
Figure III.16 1736 Norfolk Historic Shoreline and Present City Buildout ........... III.31
Figure III.17 Target Area 100-Year Flood Inundation with 2.5 feet of SLR ....... III.31
Figure III.18 Sea Level Rise Predictions from USACE and NOAA Nearest Target Area, Sewell’s Point and Chesapeake Bay Bridge Tunnel ..................................... III.32
Figure III.19 Norfolk Target Area in 1950 and Today .......................................... III.34
Figure III.20 I-264 and the Berkley Bridge near Harbor Park and Tidewater Gardens ....................................................................................................................... III.35
Figure III.21 Chesterfield Heights............................................................................ III.35
Figure III.22 Subsidized Housing in the St. Paul’s Area........................................ III.39
Figure III.23 Tidewater Gardens Area within the Current 100-Year Floodplain ................................................................................................................... III.40
Figure III.24 Critical Economic Risks within the Hampton Roads Region ......... III.42
Figure III.25 Health Scores of the Elizabeth River Branches, 2014 ..................... III.44
Figure III.26 Hurricane Joaquin Impacts in the Target Area............................... III.48

Norfolk Coastal Adaptation and Community Transformation Plan
Attachment F Benefit Cost Analysis vii
Part IV Benefits Included in the Benefit Cost Ratio
Figure IV.1.1.1 Estimated Flood Depth – Hurricane Irene ............................... IV.1.1.2
Figure IV.1.1.2 Sea Level Rise Scenarios ............................................................. IV.1.1.3
Figure IV.1.1.3 Estimated Flood Extent of 1% Annual Chance of Occurrence under Present Conditions ................................................................................................. IV.1.1.4
Figure IV.1.1.4 Estimated Flood Extent of 1% Annual Chance of Occurrence Given 2.5 Feet of Sea Level Rise ...................................................................................... IV.1.1.4
Figure IV.1.1.5 Estimated Flood Extent of 1% Annual Chance and Proposed Improvements ......................................................................................................... IV.1.1.5
Figure IV.1.1.6 Estimated Flood Extent of 1% Annual Chance Given 2.5 Feet of Sea Level Rise and Proposed Improvements .............................................................. IV.1.1.5
Figure IV.1.1.7 Hurricane Irene Interpolation With and Without SLR at Project Area ......................................................................................................................... IV.1.1.6
Figure IV.1.2.1 Norfolk Proposed Project Total Study Area, Total Exposure by Building Occupancy Type, 100-Year with 2.5 Feet of Sea Level Rise, 2015 .... IV.1.2.3
Figure IV.1.2.2 Structural, Content, and Inventory Damage from Inundation, USACE Galveston Average Light Industrial Use ............................................... IV.1.2.7
Figure IV.1.3.1 Newton’s Creek Watershed Structures with No Detour During the 10%, 2%, and 1% Annual Chance Flood Event plus 2.5 Feet of SLR ........... IV.1.3.11
Figure IV.1.3.2 Ohio Creek Watershed Structures with No Detour During the 10%, 2%, and 1% Annual Chance Flood Event plus 2.5 Feet of SLR ..................... IV.1.3.11
Figure IV.1.4.1 P Factor Descriptions .................................................................. IV.1.4.8
Figure IV.1.4.2 W Factor Descriptions ................................................................ IV.1.4.8
Figure IV.1.4.3 Hydrograph of 1% Annual Chance Event plus Sea Level Rise .................................................................................................................................. IV.1.4.9
Figure IV.1.4.4 Hydrograph of 2% Annual Chance Event plus Sea Level Rise .......................................................................................................................... IV.1.4.9
Figure IV.1.4.5 Hydrograph of 10% Annual Chance Event plus Sea Level Rise ........................................................................................................................ IV.1.4.10
Figure IV.1.4.6 Locations of Operation Brother’s Keeper Shelters ................ IV.1.4.32
Figure IV.2.1 Newton’s Creek Perspective Conceptual Design ............................ IV.2.6
Figure IV.2.2 Ohio Creek Perspective Conceptual Design ................................... IV.2.7
Figure IV.2.3 Target Area Blue Green Network Conceptual Design .................. IV.2.8
Figure IV.2.4 Example of a Rain Garden ............................................................. IV.2.14
Figure IV.2.5 and Figure IV.2.6 Example of Permeable Pavers ........................ IV.2.15
Figure IV.3.1 Target Area Open Space Conceptual Design ............................... IV.3.23
Figure IV.4.1 Newton’s Creek Watershed Medium Density Scenario ................ IV.4.2

Norfolk Coastal Adaptation and Community Transformation Plan
Attachment F Benefit Cost Analysis viii
Figure IV.4.2 Phasing Assumptions for Revitalization Plans – Medium Density Scenario ...................................................................................................................... IV.4.9
Figure IV.5.1 Newton’s Creek Watershed Top 10 Impacted Industries for the 1% Annual Chance Event .............................................................................................. IV.5.9
Figure IV.5.2 Ohio Creek Watershed Top 10 Industries Affected by the 1% Annual Chance Event .......................................................................................................... IV.5.11
Figure IV.5.3 Top Industries Affected by Output Loss for the 1% Annual Chance Flood Scenario ......................................................................................................... IV.5.12
List of Tables Part I Overview
Table I.1 Overview of Benefits Calculated and Included in the Benefit Cost Ratio ............................................................................................................................... I.11
Table I.2 All Applicable Costs included in the Benefit Cost Analysis ..................... I.12
Table I.3 Benefit Cost Analysis Results ...................................................................... I.12
Table I.4 BCA Crosswalk: Project Costs .................................................................... I.15
Table I.5 BCA Crosswalk: Quantifiable Benefits and Qualitative Benefits ............ I.15
Part II Project Description
Table II.1 Opinion of Probable Capital Costs for the Norfolk Coastal Adaptation and Community Transformation Plan...................................................................... II.51
Table II.2 Current Flooding Under Nuisance and Major Flood Event Scenarios……………………………………………………………………………...II.62
Part III Existing Conditions
Table III.1 Hurricane Irene Modeled Loss Results ................................................ III.47
Table III.2 Approximate Expected Costs of Non-Implementation by Watershed at the 5-, 20-, and 50-Year Scenario ............................................................................. III.50
Part IV Benefits Included in the Benefit Cost Ratio
Table IV.1 Overview of Benefits ................................................................................ IV.iii
Table IV.2 Summary of Uncertain Variables, Newton’s Creek Watershed .......... IV.v
Table IV.3 Net Present Value of Social Benefits High/Medium/Low Variation with a 3% and 7%
Discount Rate ............................................................................................................. IV.vii
Table IV.4 Net Present Value of Economic Revitalization Benefits High/Medium/Low Variation

Norfolk Coastal Adaptation and Community Transformation Plan
Attachment F Benefit Cost Analysis ix
with a 3% and 7% Discount Rate ............................................................................ IV.vii
Table IV.1.1.1 FEMA-Projected Coastal Surge With and Without SLR ......... IV.1.1.6
Table IV.1.2.1 Foundation Type and Elevation Above Grade .......................... IV.1.2.6
Table IV.1.2.2 Total Expected Building Damage Costs due to Coastal Flooding in 2015 Dollars ............................................................................................................ IV.1.2.9
Table IV.1.2.3 Newton’s Creek Watershed Expected Building Damage Costs due to Coastal Flooding in 2015 Dollars .......................................................................... IV.1.2.9
Table IV.1.2.4 Ohio Creek Watershed Expected Building Damage Costs due to Coastal Flooding in 2015 Dollars ........................................................................ IV.1.2.10
Table IV.1.3.1 Service Population and Loss of Function Time ......................... IV.1.3.4
Table IV.1.3.2 Value of Pump Station Loss of Function .................................... IV.1.3.6
Table IV.1.3.3 Impacted Schools .......................................................................... IV.1.3.8
Table IV.1.3.4 Value of School Closure ............................................................... IV.1.3.8
Table IV.1.3.5 Total Roadway Loss of Function Costs During the 100-Year Flood Event plus 2.5 Feet of SLR .................................................................................. IV.1.3.13
Table IV.1.3.6 Essential Facility and Critical Infrastructure Loss of Function Results ................................................................................................................... IV.1.3.15
Table IV.1.4.1 Human Impacts Benefits Calculated .......................................... IV.1.4.2
Table IV.1.4.2 D Factor for the 10%, 2%, and 1% Annual Chance Events .... IV.1.4.6
Table IV.1.4.3 Evaluated P Values ....................................................................... IV.1.4.6
Table IV.1.4.4 W Values ........................................................................................ IV.1.4.7
Table IV.1.4.5 Expected Loss of Life per Flood Scenario Evaluated .............. IV.1.4.11
Table IV.1.4.6 Annualized and Net Present Values for Casualties Benefits .. IV.1.4.11
Table IV.1.4.7 Prevalence Rates ......................................................................... IV.1.4.16
Table IV.1.4.8 Cost of Mental Health Treatment after a Disaster .................. IV.1.4.16
Table IV.1.4.9 Results by Watershed Transformation Project ....................... IV.1.4.17
Table IV.1.4.10 Expected Losses for 2013 Population by Annual Chance Flood Event...................................................................................................................... IV.1.4.18
Table IV.1.4.11 Productivity Loss Per Worker ................................................. IV.1.4.22
Table IV.1.4.12 Number of Wage Earning Residents ....................................... IV.1.4.22
Table IV.1.4.13 Lost Productivity for the 100-Year Event .............................. IV.1.4.23
Table IV.1.4.14 Expected Losses for Population in 2013 by Annual Flood Chance Event...................................................................................................................... IV.1.4.23
Table IV.1.4.15 Damage State Correlations ...................................................... IV.1.4.26
Table IV.1.4.16 Total Relocation Expected Losses and Benefits by Flood Scenario and Compartment ................................................................................................ IV.1.4.29
Norfolk Coastal Adaptation and Community Transformation Plan
Attachment F Benefit Cost Analysis x
Table IV.1.4.17 Relative Modification Factors ................................................. IV.1.4.34
Table IV.1.4.18 Weight Factors for Income and Age ....................................... IV.1.4.34
Table IV.1.4.19 People Seeking Shelter ............................................................. IV.1.4.35
Table IV.1.4.20 Households Seeking Shelter ..................................................... IV.1.4.35
Table IV.2.1 Environmental Benefits Valued......................................................... IV.2.3
Table IV.2.2 Environmental Benefit Valuation Methods ...................................... IV.2.5
Table IV.2.3 Summary of Proposed Amenities and Features ............................... IV.2.5
Table IV.2.4 Benefit Methodology Crosswalk ...................................................... IV.2.10
Table IV.2.5 Total GI Elements ............................................................................. IV.2.14
Table IV.2.6 Total Annual Gallons of Water Intercepted by Bioretention Features, Permeable Pavers, Trees, and Rain Gardens ....................................................... IV.2.16
Table IV.2.7 Annual Pollutant Uptake Capacity for Criteria Air Pollutants in Grams per Square Meter ....................................................................................... IV.2.17
Table IV.2.8 Cost per Pound of Pollutant ............................................................ IV.2.18
Table IV.2.9 Emissions Factor (lbs/kWh) ............................................................. IV.2.19
Table IV.2.10 Annual Carbon Sequestration Based on Vegetative Type .......... IV.2.20
Table IV.2.11 Cost per Pound of Carbon Dioxide ............................................... IV.2.20
Table IV.2.12 Summary of Benefits Using FEMA Standard Values ................. IV.2.25
Table IV.2.13 Total Square Footage of Features ................................................ IV.2.26
Table IV.2.14 Summary of Applicable Benefits Using FEMA Standard Values ....................................................................................................................... IV.2.27
Table IV.2.15 Total Annual Benefits ..................................................................... IV.2.29
Table IV.2.16 Reduced Grey Infrastructure Costs .............................................. IV.2.30
Table IV.3.1 New and Improved Park, Recreational, and Open Space .............. IV.3.4
Table IV.3.2 Summary of Methods to Value Benefits ........................................... IV.3.5
Table IV.3.3 Earth Economics Method Annual Benefits for Newton’s Creek Watershed Transformation Project ........................................................................ IV.3.8
Table IV.3.4 Earth Economics Method Annual Benefits Ohio Creek Watershed Transformation Project ............................................................................................ IV.3.9
Table IV.3.5 Earth Economics Method Net Present Values for Newton’s Creek Watershed Transformation Project ...................................................................... IV.3.10
Table IV.3.6 Earth Economics Method Net Present Value for Ohio Creek Watershed Transformation Project ...................................................................... IV.3.11
Table IV.3.7 FEMA Method Newton’s Creek Watershed Transformation Project ...................................................................................................................... IV.3.12
Table IV.3.8 FEMA Method Ohio Creek Watershed Transformation Project IV.3.12

Norfolk Coastal Adaptation and Community Transformation Plan
Attachment F Benefit Cost Analysis xi
Table IV.3.9 Health-Related Benefits of Increased Recreational Activity ........ IV.3.16
Table IV.3.10 Methods to Value Aesthetic Benefits ............................................. IV.3.18
Table IV.3.11 New and Improved Park, Recreational, and Open Space Contributing to Aesthetic Quality................................................................................................. IV.3.19
Table IV.3.12 Added and Improved Spaces Contributing to Aesthetic Quality – Newton’s Creek Watershed Transformation Project .......................................... IV.3.19
Table IV.3.13 Added and Improved Spaces Contributing to Aesthetic Quality – Ohio Creek Watershed Transformation Project ................................................. IV.3.20
Table IV.3.14 Scenario Results for Added Property Values: Aesthetic Value and Reduction in Flood Risk ......................................................................................... IV.3.23
Table IV.3.15 Total Results for Added Property Values .................................... IV.3.23
Table IV.4.1 Summary of Existing Output and Employment Compensation in the City of Norfolk ........................................................................................................... IV.4.5
Table IV.4.2 Added Output and Employment Compensation for Revitalization Districts – Low Density Scenario ............................................................................. IV.4.6
Table IV.4.3 Added Output and Employment Compensation for Revitalization Districts – Medium Density Scenario ...................................................................... IV.4.7
Table IV.4.4 Added Output and Employment Compensation for Revitalization Districts – High Density Scenario ............................................................................ IV.4.8
Table IV.4.5 Added Output and Employment Compensation for the Acceleration Center and Grandy Village ...................................................................................... IV.4.9
Table IV.5.1 Total Impact Summary of Output Loss in Newton’s Creek Watershed .................................................................................................................. IV.5.7
Table IV.5.2 Newton’s Creek Watershed Top Industries Affected by Output Loss for the 1% Annual Chance Flood Scenario ............................................................ IV.5.8
Table IV.5.3 Total Impact Summary of Output Loss in Ohio Creek Watershed .................................................................................................................. IV.5.9
Table IV.5.4 Ohio Creek Watershed Top Industries Affected by Output Loss for the 1% Annual Chance Event ...................................................................................... IV.5.10
Table IV.5.5 Total Impact Summary of Output Loss for 1% Annual Chance Flood Scenario .................................................................................................................... IV.5.11
Table IV.5.6 Top 10 Industries Affected by Output Loss for the 1% Annual Chance Flood Scenario ......................................................................................................... IV.5.12
Table IV.5.7 Net Present Value and Annualized Benefits for Economic Impacts ..................................................................................................................... IV.5.13

Norfolk Coastal Adaptation and Community Transformation Plan
Attachment F Benefit Cost Analysis xii
Definitions and Acronyms

Norfolk Coastal Adaptation and Community Transformation Plan
Attachment F Benefit Cost Analysis xiii
Definitions
Affordable housing: Housing for which occupants pay no more than 30 percent of his or her income for gross housing cost.1
American Community Survey: A nationwide survey designed to provide communities with a fresh look at how they are changing. It is a critical element in the Census Bureau’s reengineered 2010 census plan. The ACS collects information such as age, race, income, commute time to work, home value, veteran status, and other important data from U.S. households.
Base Flood Elevation (BFE): The elevation of the base flood, including wave height, relative to the North American Vertical Datum (NAVD), specified within the City of Norfolk Flood Insurance Study (FIS).
Casualty: A person who is killed, wounded or injured by some event, and is usually used to describe multiple deaths and injuries due to violent incidents or disasters.
Census Block Group: A geographical unit used by the U.S. Census Bureau which represents sstatistical divisions of census tracts, are generally defined to contain between 600 and 3,000 people, and are used to present data and control block numbering. A block group consists of clusters of blocks within the same census tract that have the same first digit of their four-digit census block number. It is the smallest geographical unit for which the bureau publishes sample data, i.e. data which is only collected from a fraction of all households.2
Climate Change: A change in the statistical distribution of weather patterns when that change lasts for an extended period of time (i.e., decades to millions of years). Climate change may refer to a change in average weather conditions, or in the time variation of weather around longer-term average conditions (i.e., more or fewer extreme weather events).
Coastal Flooding: Occurs when normally dry low-lying land is flooded by seawater. The extent of coastal flooding is a function of the elevation inland flood waters penetrate, which is controlled by the topography of the coastal land exposed to flooding.
Critical/Essential Facility: Facilities that are needed for response activities before, during, and after a flood (e.g., hospitals, nursing homes, police stations, fire stations, and emergency operations centers); public and private utility facilities that are vital to maintaining or restoring normal services to flooded areas before, during, and after a flood; and structures or facilities that produce, use, or store highly volatile, flammable, explosive, toxic, and/or water-reactive materials.
Depth Damage Function: A mathematical relationship between the depth of flood water above or below the first floor of a building and the amount of damage that can be attributed due to water.
1 http://www.huduser.org/portal/glossary/glossary_a.html 2 https://www.census.gov/geo/reference/gtc/gtc_bg.html

Norfolk Coastal Adaptation and Community Transformation Plan
Attachment F Benefit Cost Analysis xiv
Disability: A physical or mental impairment that substantially limits one or more of the major life activities of such for an individual.
Displacement Time: The time during which occupants are displaced to temporary locations while damage is repaired.3
Direct Effects: Represents the initial impacts that occur as a result of an activity in an industry. For example, residential displacement time will have a direct effect on the real estate industry.
Economic Loss of Function (ELOF): The time that a facility is not capable of conducting business. In general, this is shorter than repair time because business will rent alternative space while repairs and construction are being completed.4
Employment: All jobs that are created or lost as a result of the activity, including full-time, part time, and temporary positions.
Family: All persons living in the same household who are related by birth, marriage, or adoption.
Family Income: Reported income from all sources for the householder and other household members related to the householder.
Flood Insurance Study (FIS): The official report provided by the Federal Emergency Management Agency (FEMA) containing the Flood Insurance Rate Maps (FIRMs), the Floodway Boundary and Floodway Map (FBFM), the water surface elevation of the base flood, and supporting technical data.
Geographic Information Systems (GIS): A system designed to capture, store, manipulate, analyze, manage, and present all types of spatial or geographical data.5
Gross Margins: A company’s total sales revenue minus its costs of goods sold.
Housing Stock: The number of existing housing units based on data compiled by the U.S. Census Bureau and referable to the same point or period of time.
IMPLAN: A private company that provides economic impact data and modeling for assessing economic impacts of project decisions in all industry sectors.
Indirect Effects: The impact of direct effects on industries that support those that are directly affected. Such as industries that provide equipment and materials for directly impacted industries.
3 http://www.fema.gov/media-library-data/20130726-1736-25045-7076/bca_reference_guide.pdf 4 HAZUS-MH Earthquake Technical Manual. Page 15-18. 5 http://www.esri.com/what-is-gis

Norfolk Coastal Adaptation and Community Transformation Plan
Attachment F Benefit Cost Analysis xv
Induced Effects: The response to a direct effect that occurs through re-spending of income received by a component of value-added. In other words, the change of local spending that result from income changes as a consequence of the activity.
Labor Income: The expected combined income of employment in each industry sector generated by project implementation expenditures.
Level of Protection: The recurrence interval to which the proposed project offers protection.6
Light Detection and Ranging (LiDAR): A remote sensing method that uses light in the form of a pulsed laser to measure ranges to the earth. These light pulses, used with other data, generates information about the Earth’s surface characteristics.
Losses Avoided: Losses that would occur if the project was not implemented.
Low-to-Moderate Income: LMI is generally defined as 80% or less than the area’s median income as calculated by HUD on a Metropolitan Statistical Area (MSA) basis.7
Normalize: Normalization refers to the process of converting figures of different origins, in this case the different dollar amounts from different years, into a value that can be recognized and interpreted consistently.
North American Industry Classification System (NAICS): The North American Industry Classification System (NAICS) is the standard used by Federal statistical agencies in classifying business establishments for the purpose of collecting, analyzing, and publishing statistical data related to the U.S. business economy.
Occupancy Class: HAZUS uses occupancy classes to categorize structures based on their construction type and building use.
Output: Value of industry production. In IMPLAN these are annual production estimates for the year of the data set (2013) and are in producer prices. For manufacturers this would be sales plus/minus change in inventory. For service sectors production this equals sales. For retail and wholesale trade, output is the gross margin.
Project Useful Life: The estimated amount of time the project will be effective.
Recurrence Interval8: The average or mean time in years between an expected occurrence of an event of specified intensity.
Relocation Expenses: Disruption costs that include the cost of shifting and transferring, and the rental of temporary space.9 Relocation expenses are assumed to be incurred once the
6 http://www.fema.gov/media-library-data/20130726-1736-25045-7076/bca_reference_guide.pdf 7 https://www.hudexchange.info/manage-a-program/acs-low-mod-summary-data/ 8 http://www.fema.gov/media-library-data/20130726-1736-25045-7076/bca_reference_guide.pdf 9 HAZUS-MH Flood Technical Manual. Page 14-22.

Norfolk Coastal Adaptation and Community Transformation Plan
Attachment F Benefit Cost Analysis xvi
building reaches a damage state ‘slight’ in the earthquake model. Below that threshold, it is unlikely that occupants will need to relocate.
Restoration Time: Time for physical restoration of the damage to the building, as well as time for clean-up, time required for inspections, permits and the approval process, as well as delays due to contractor availability.10
Sea level rise: The increase in mean sea level, or the average level of the ocean’s surface, due to the loss of land based ice and thermal expansion caused by the warming of the oceans.
Social Vulnerability Index (SoVI): An index based on a number of factors contained within county-level socioeconomic and demographic data used to determine social vulnerability to environmental hazards.11
Storm Surge: The rising of the sea as a result of atmospheric pressure changes and wind associated with a storm.
Target Area: The census block groups that make up the project area which includes the 100 year floodplain and 2.5 feet of sea level rise.
Urban Heat Island: Describes the phenomenon where urban air and surface temperatures are higher than nearby rural areas.
Value Added: Consists of compensation of employees, taxes on the production of goods and services and imports on less subsidies, and gross operating surplus.
Watershed: An area or ridge of land that separates waters flowing to different rivers, basins, or seas.
Willingness to Pay: The maximum amount an individual is willing to sacrifice to procure a good or avoid something undesirable.
Acronyms
°F: degrees Fahrenheit
ACS: American Community Survey
ARC: American Red Cross
BCA: Benefit Cost Analysis
BCR: Benefit Cost Ratio
BLS: Bureau of Labor Statistics
10 HAZUS-MH Flood Technical Manual. Page 14-25. 11 http://webra.cas.sc.edu/hvri/products/sovifaq.aspx

Norfolk Coastal Adaptation and Community Transformation Plan
Attachment F Benefit Cost Analysis xvii
BRV: Building Replacement Value
CDC: Centers for Disease Control
CPI: Consumer Price Index
CRV: Contents Replacement Value
CSRV: Contents-to-Structure Ratio Value
DDF: Depth-Damage Function
DEM: Digital Elevation Model
DOHMH: Department of Health and Mental Hygiene
ELOF: Economic Loss of Function
EPA: U.S. Environmental Protection Agency
EU: European Union
FAA: Federal Aviation Administration
FEMA: Federal Emergency Management Agency
FIMA: Federal Insurance and Mitigation Administration
FFE: First Floor Elevation
GAO: Government Accountability Office
GIS: Geographic Information System
GPIN: Geographical Parcel Identification Number
HUD: U.S. Department of Housing and Urban Development
ISRV: Inventory-to-Structure Ratio
LEHD: Longitudinal Employer-Household Dynamics
LiDAR: Light Detection and Ranging
LODES: LEHD Origin-Destination Employment Statistics
LMI: Low- to Moderate-Income
MEP: Mechanical/Engineering/Plumbing
NAAQS: National Ambient Air Quality Standards
NAVD88: North American Vertical Datum of 1988
NDRC: National Disaster Resilience Competition

Norfolk Coastal Adaptation and Community Transformation Plan
Attachment F Benefit Cost Analysis xviii
NFPA: National Fire Protection Association
NOAA: National Oceanic and Atmospheric Administration
NPL: National Priorities List
NREL: National Renewable Energy Laboratory
NRHA: Norfolk Redevelopment and Housing Authority
OMB: Office of Management and Budget
PFIRM: Preliminary Flood Insurance Map
PTSD: Post-Traumatic Stress Disorder
PUL: Project Useful Life
SAM: Social Accounting Matrix
SAMHSA: Substance Abuse and Mental Health Services Administration
SF: Square Feet
SLR: Sea Level Rise
STEP: Sheltering and Temporary Essential Power
TAMI: Technology, Advertising, Media, and Information
TM: Technical Manual
TSA: Temporary Sheltering
UHI: Urban Heat Island
USACE: U.S. Army Corps of Engineers
VOE: Value of Enjoyment
WTP: Willingness to Pay

Norfolk Coastal Adaptation and Community Transformation Plan
Attachment F Benefit Cost Analysis Page I.1
PART I
OVERVIEW
Norfolk Coastal Adaptation and Community Transformation Plan
Attachment F Benefit Cost Analysis Page I.2
Overview
A comprehensive benefit cost analysis (BCA) must be completed for the Phase 2 submission to
the U.S. Department of Housing and Urban Development (HUD) National Disaster Resilience
Competition (NDRC). The Phase 2 Benefit Cost Analysis (BCA) was prepared by the City of
Norfolk in collaboration with their consulting firm, Arcadis, Inc. Arcadis provided the expertise
for the analysis, while the City provided materials and data necessary for the determinations of
benefits and losses avoided in the Target Area. The BCA analysis must consider economic,
environmental, social, and resiliency factors to ensure that project benefits outweigh the costs.
Per the Notice of Funding Availability (NOFA) dated June 25, 2015, it is understood that the
results of the BCA alone are not cause to reject or approve a proposal. HUD recognizes that a
complete soundness of approach justification includes fundamental project elements such as
feasibility, replicability, public desirability, meeting unmet needs, risk reduction, and
improvements in resiliency. Over time the value of the project will increase as it prevents future
losses in subsequent disaster incidents. This analysis for the City of Norfolk’s Coastal
Adaptation and Community Transformation Plan Phase 2 proposal follows a carefully
considered process that includes direct project benefits, as well as secondary impacts of those
benefits.
The Qualifying Disaster for Virginia’s application is Hurricane Irene, which demonstrated that
without mitigation, the City of Norfolk, and the greater Hampton Roads region, will continue to
suffer physical, social and economic losses from future coastal and stormwater flooding. Losses
experienced in Hurricane Irene included structural and content damages to homes and
businesses; loss of power, communication and transportation services; and inaccessibility due to
stormwater flooding that was exacerbated by coastal storm surge. Future losses are expected to
be even more significant as sea levels continue to rise and coastal storms become more frequent
and intense.
Virginia has developed a statewide approach to its coastal and inland stormwater challenges;
“thRIVe: Resilience in Virginia” is a five-part approach to achieve resiliency guided by the
National Preparedness System to 1) unite the region, 2) create coastal resilience, 3) strengthen
vulnerable neighborhoods, 4) improve economic vitality, 5) and build water-management
solutions. The thRIVe plan’s five lines of effort align with HUD's goal for the NDRC, as they are
each designed to achieve a major critical objective, address unmet need, and provide replicable
and scalable solutions to identified vulnerabilities within the Target Areas defined in this
proposal.
For the purpose of the BCA, the proposed CDBG-NDR-assisted projects sub-area is the “Target
Area”. Please see Figure I.1 for a visual depiction of Norfolk’s Phase I Target Area and the
Phase 2 area of impact. As demonstrated in the City’s leverage letter appended to this
application, the City is using its own and partner’s funds to address Unmet Needs from the
Qualifying Disaster in the rest of the MID-URN area of Norfolk not directly assisted by the
proposed CDBG-NDR projects. The two projects proposed for the CDBG-NDR funding are a
part of and will support Norfolk’s overall NDRC resilience program, which is designed to reduce
risk in Norfolk’s entire MID-URN-qualified target area. The Norfolk proposed project Target
Area is comprised of two watersheds: the Ohio Creek Watershed and the Newton’s Creek
Watershed. Together, these watersheds include over 2,000 public housing units that experience

Norfolk Coastal Adaptation and Community Transformation Plan
Attachment F Benefit Cost Analysis Page I.3
frequent chronic flooding. In each watershed, a series of stormwater management techniques are
combined with coastal protection infrastructure and a living shoreline to reduce risk. Major
proposed project elements include:
A shoreline protection system to prevent surge inundation of Norfolk’s Target Area
The creation of new shoreline restoration areas that will provide a natural buffer for rising
seas as well as a healthier environment for native species of plants and animals in the
Elizabeth River
Replacement of aged public housing in configurations that support stormwater
management activities, provide economic revitalization opportunities, and benefit
vulnerable populations
Upper watershed green and blue stormwater management measures to be implemented on
both public and private land including rain gardens, water streets, permeable pavements,
and bioswales
The redevelopment of neighborhood areas where new or expanded wetlands and parks
can hold and manage stormwater on rainy days
Re-alignment of streets to allow historic creek beds to fill during rain events, alleviating
street flooding and allowing for the creation of “complete streets”
Development of a Coastal Resilience Accelerator that will provide a hub for regional
collaboration and innovation regarding water management and climate change
An incentivized private property on-site retention and public education program that will
allow runoff to be captured and detained for slow release post-storm
The combination of these flood-risk reduction techniques throughout the Target Area is expected
to provide a comprehensive resiliency milieu that can be sustained, replicated and expanded over
time in Norfolk and throughout the region. The image on the following page provides a
comprehensive view of the proposal.
The proposed activities, and their interdependent subparts, are displayed in Figure I.1 and
described in greater detail in Attachment F Part II Project Description. While these activities
can be implemented independently, all are required to achieve Norfolk’s vision and to meet the
Unmet Need described in Exhibit B, Exhibit D, and Exhibit E of the application.
As outlined in the Phase I application, the City of Norfolk in the larger Hampton Roads region is
subject to the highest rate of relative sea level rise on the East Coast – the area has experienced a
14-inch rise since 1930.1 The global sea level rise is 5 to 8 inches over the last century (Phase 1
Application, Exhibit D: Unmet Need, pg. 26). The Hampton Roads area is second to New
Orleans for the largest population at risk from sea level rise (Phase 1 Application, Exhibit D:
Unmet Need, pg. 26). Over the past several decades, Norfolk residents have received increased
stresses due to the impacts of climate change, such as sea level rise and more frequent and
intense coastal storms. As discussed in the Hampton Roads Planning District Commission’s
2013 report Coastal Resiliency: Adapting to Climate Change in Hampton Roads, sea level rise
1 Atkinson, Ezer, and Smith, Sea Level Rise and Flooding Risk in Virginia, 2012 (http://nsglc.olemiss.edu/sglpj/vol5no2/2-
atkinson.pdf)

Norfolk Coastal Adaptation and Community Transformation Plan
Attachment F Benefit Cost Analysis Page I.4
has significant effects on the region even when using varied and conservative modeling.2 Sea
level rise, and the effects of climate change in the region, are very real threats.
Additionally, the Target Area has a significant unmet affordable housing need. Currently, within
the St. Paul’s Area, there are more than 1,700 public housing units that need to be rebuilt. The
current public housing stock is unsatisfactory, and, as stated within the St. Paul’s Area Plan, the
City of Norfolk hopes to replace the public housing units one-for-one within the existing
neighborhood or within nearby communities. The current affordable housing is inadequate,
causes economic segregation in the St. Paul’s Area (and into the larger Target Area) and does not
provide adequate protection against extreme flood events. Affordable housing resilience will be
addressed within the proposed projects.
The Target Area also requires economic revitalization. Currently, the city is preparing for
various revitalization efforts, specifically though development of city-owned land in the St.
Paul’s Area. The City of Norfolk is currently soliciting for a Master Developer, who will assist
the city in maximizing its real estate assets and economic development opportunities, creating
non-competing land uses, a new tax base and emphasizing short and long-term job creation in the
Target Area and beyond.
Finally, to meet the needs of the populations within the Target Area, there must also be a focus
on social cohesion. The Norfolk Mayor’s Commission on Poverty Reduction proposed a plan
entitled the Norfolk Plan to Reduce Poverty, which outlined the core values of the city to build a
thriving future for all Norfolk residents by creating pathways out of poverty, providing the tools
and education needed to enter and succeed in those pathways, relying on citizens’ motivation and
a sense of personal responsibility, and investing in cost-effective and proven solutions.
Recommendations included better and more accessible early childhood development programs,
youth education and career pathways, adult workforce development, and neighborhood
revitalization and support. This final recommendation utilizes strategies to stabilize stressed
neighborhoods through community revitalization and economic development, develop mixed-
income housing and mixed-use communities in distressed neighborhoods, and create policies to
facilitate the de-concentration of poverty in Norfolk’s public housing communities.
2 Coastal Resiliency: Adapting to Climate Change in Hampton Roads, HRPDC, 2013

Norfolk Coastal Adaptation and Community Transformation Plan
Attachment F Benefit Cost Analysis Page I.5
Figure I.1 Norfolk Phase I Target Area and Phase 2 Project Sub-Area

Norfolk Coastal Adaptation and Community Transformation Plan
Attachment F Benefit Cost Analysis Page I.6
Figure I.2 Norfolk Coastal Adaptation and Community Transformation Plan Key Intervention Sites

Norfolk Coastal Adaptation and Community Transformation Plan
Attachment F Benefit Cost Analysis Page I.7
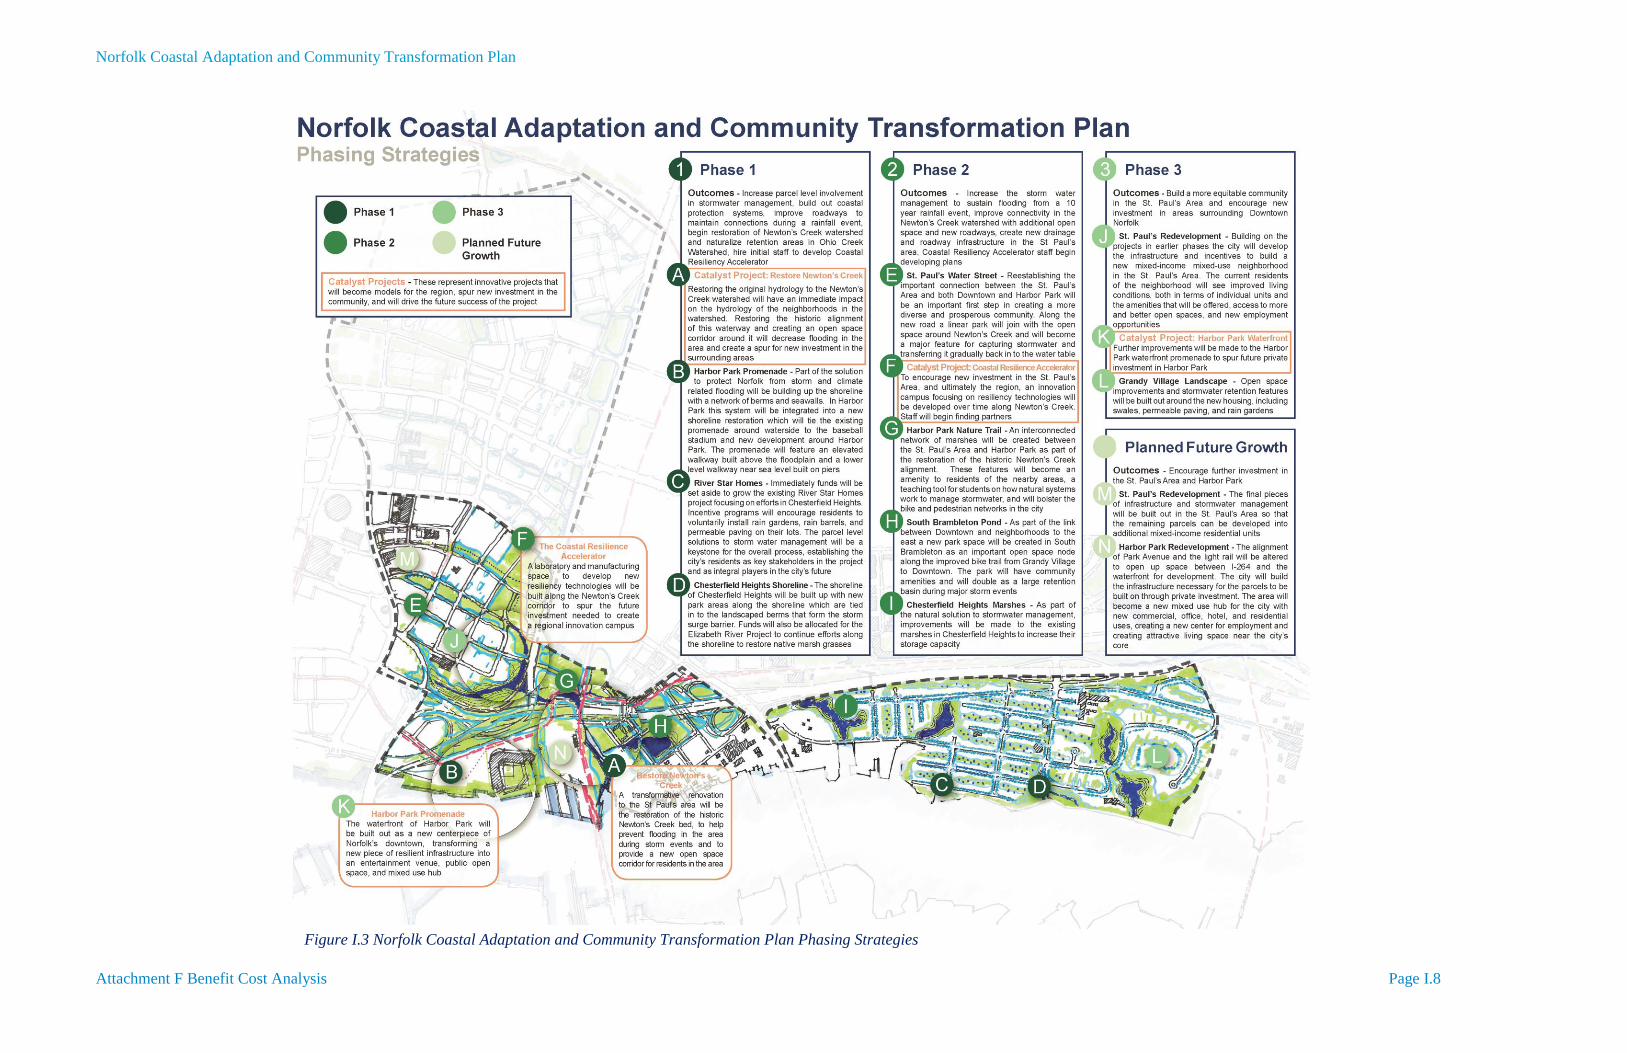
Project Phasing
The magnitude of the project components will require several years of construction; however, by
implementing through phases, the watersheds and communities will benefit from improvements
incrementally that build on each other and intend to spur further development into the future
through catalyst projects in each phase. Because the project is phased, benefits and costs must be
accounted for and discounted appropriately each year in coordination with the proposed
implementation date of each project element. As such, capital and operation and maintenance
costs are phased and discounted appropriately. For this reason, the project costs presented herein
are different from those presented in Appendix F-3 and Appendix F-4.
Phase 0 (Pre-Construction)
The community’s role in water management and the project are established through the River
Star Homes catalyst project in initiating parcel level solutions during the permitting and final
design stages.
Phase 1 (Mid 2018-2020)
Phase 1 aims to appropriately provide solutions based on the watershed’s history and future.
Under the Restore Newton’s Creek catalyst project, Newton’s Creek will return to its original
hydrology while both watersheds will receive shoreline protection based on anticipated future
sea level rise.
Phase 2 (2020-Mid 2021)
Phase 2 improves the natural and built systems in regards to water management and connectivity
in the Target Area. During this phase, the Coastal Resiliency Accelerator catalyst project will be
created to promote holistic and innovative water management practices. It is intended that the
accelerator will be the pilot for additional components of an innovation campus, thereby creating
an innovation hub located in Norfolk - home to emerging technology industries in critical 21st
century fields, including sea level rise. Green and water spaces will be added and improved in
increasing the stormwater management capacity of the natural systems and providing
recreational amenities that increase access to other areas in the city and encourage future
investments in these neighborhoods.
Phase 3 (Mid 2012 – Mid 2022)
Phase 3 provides the archetypal framework for new infrastructure for mixed-income mixed-use
neighborhoods and further investment in areas surrounding Downtown Norfolk. During this
phase, the Harbor Park Promenade catalyst project will be completed. This feature will provide
new access to enjoy the Elizabeth River and transforms an underutilized area into an attractive
space to become a mixed use hub.
Figure I.2 displays the Norfolk Coastal Adaptation and Community Transformation Plan
phasing strategies and Figure I.3 provides a more detailed overview of the project scheduling
process.
Norfolk Coastal Adaptation and Community Transformation Plan
Attachment F Benefit Cost Analysis Page I.8
Figure I.3 Norfolk Coastal Adaptation and Community Transformation Plan Phasing Strategies

Norfolk Coastal Adaptation and Community Transformation Plan
Attachment F Benefit Cost Analysis Page I.9
Figure I.4 Norfolk Coastal Adaptation and Community Transformation Plan Project Scheduling

Norfolk Coastal Adaptation and Community Transformation Plan
Attachment F Benefit Cost Analysis Page I.10
Quantified Results
In order to demonstrate the benefits expected from investment in the proposed Norfolk Coastal
Adaptation and Community Transformation Plan, analysts evaluated four categories of benefits:
resiliency values, such as direct physical damages and critical asset impacts; environmental
benefits, such as reduced carbon emissions and reduced stormwater runoff; social and
recreational benefits, including aesthetic values and mental stress and anxiety cost reductions;
and economic revitalization impacts realized by the project. Within each of these categories,
losses avoided and benefits added by the project were considered. Principle sources of
methodologies and data standards for the development of the BCA originated from entities such
as the U.S. Army Corps of Engineers (USACE), the Federal Emergency Management Agency
(FEMA), and Earth Economics, as well as from literary publishers and journals.
The BCA for Norfolk’s Coastal Adaptation and Community Transformation Plan considers both
quantified and qualitative benefits in accordance with the NDRC NOFA Appendix H and OMB
Circular A-94. The quantified benefits, which can be represented in monetary terms and are used
to develop the benefit cost ratio (BCR) are broadly divided into Resiliency Values and Inherent
Values. All resulting benefits are presented in a low, medium, and high scenario to account for
sensitivity in the analysis (see Page I.11 for more information). The City of Norfolk requests that
for the purposes of project analysis, the medium scenario be considered the most appropriate.
Results are ultimately provided in three ways: annual benefits, net present value, and the BCR.
Annual Benefits: Annual benefits are the avoided damages and added benefits per year
expected over the useful life of the project. Annual losses avoided are presented as a
function based on the annual chance of the damaging event occurring. For example, if
benefits for a 1% annual chance event are $150,000 then the benefit is multiplied by .01,
and $1,500 is the annual benefit.
Net Present Value: In order to compare the future benefits to the current cost of a
project, a discount rate is applied over the life of the project to calculate the net present
value of annual benefits. The net present value is the benefit used in the BCR, and once
all benefits are aggregated, the project net present value is the sum of the benefits minus
the net present costs. Annual benefits and net present value are calculated for each value
measure presented herein so that they may be incorporated into the benefit cost ratio.
Benefit Cost Ratio: To evaluate cost effectiveness, a project’s total net benefits are
divided by the total project cost, resulting in a benefit cost ratio. A project is considered
to be cost-effective when the ratio is greater than or equal to 1.0, indicating that the
benefits are sufficient to justify the costs.
Costs incorporated into the BCA include all project life cycle costs, such as:
Project capital investment costs
Operations and maintenance costs over the project useful life (PUL)
Any costs associated with actions taken by the City or any governmental partner(s) after
the date of the Qualified Disaster to enhance resilience. These costs are described in
Exhibit G.
See Table I.1 below for a summary of the benefits presented herein, including a description of

Norfolk Coastal Adaptation and Community Transformation Plan
Attachment F Benefit Cost Analysis Page I.11
how each is derived. All benefits presented are directly related to the social, environmental, and
economic resiliency metrics that will measure project success, as defined in Exhibit E:
Soundness of Approach. A crosswalk is provided at the end of this section to review the
methodologies used to calculate these benefits and the associated results.
Table I.2 summarizes the costs associated with the project. Table I.3 and associated figures
below summarize the results of benefits that are appropriate to integrate into the BCR. All
proposed activities, as well as the application in total are cost beneficial with benefits of almost
$2 billion, compared to a total estimated cost of approximately $299 million, including existing
resiliency efforts and operations and maintenance costs, a ratio of 7.03.
Table I.1 Overview of Benefits Calculated and Included in the Benefit Cost Ratio
Benefit
Category Benefit Calculated Description
Resiliency
Benefits
Direct Physical
Damages to Buildings,
Contents, and Inventory
Analysts applied USACE depth-damage
functions (DDFs) to vulnerable structures,
critical/essential facilities, and modes of
transportation in the benefitting area. The DDFs
consider the type of structure/asset, structure or
contents replacement value, and expected flood
depth within the structure to determine the dollar
value of contents or structure damage. Economic
losses also use DDFs to evaluate the economic
impact of natural disasters.
Natural disasters threaten or cause direct impact
to structures but can also seriously harm health,
social, and economic resources, which lead to
psychological distress. Methodologies to
calculate expected losses avoided for Human
Impacts are a product of flood depth and damage
to people’s homes.
Essential Facility and
Critical Infrastructure
Service Loss
Human Impacts
Economic Losses
Environmental
Benefits
Provisioning Services Environmental benefits are gained heavily from
the implementation of the projects, which are
designed to incorporate expansion of park
spaces/wetlands, provide connectivity between
neighborhoods and the waterfront, and offer
aesthetically pleasing public gathering spaces.
Regulating Services
Supporting Services
Cultural Services
Social Benefits
Recreational Benefits Social benefits are based on added recreational
and community gathering space. There are health
cost reductions and willingness to pay values
associated with these amenities.
Health Benefits
Aesthetic Benefits
Economic
Revitalization
Economic
Revitalization
Economic gains are based on the addition of new
retail and commercial space and expected job
growth and gains as a result.

Norfolk Coastal Adaptation and Community Transformation Plan
Attachment F Benefit Cost Analysis Page I.12
Table I.2 All Applicable Costs included in the Benefit Cost Analysis
Activity Capital Costs* Operations and
Maintenance
Post-Irene
Resiliency
Actions
Total Costs
Newton’s Creek $141,820,312 $9,209,300 $20,320,364 $171,349,975
Ohio Creek $97,073,808 $10,049,763 $3,319,739 $110,443,311
Total $238,894,120 $19,259,063 $23,640,103 $281,793,286
*Capital costs are presented as net present value, as the capital costs are broken out over a 7
year implementation period; thus, the costs represented in this table vary from those in
Appendix F-2.
Table I.3 Benefit Cost Analysis Results
Activity Scenario All Applicable Costs Net Present Value
of Benefits
Benefit-Cost
Ratio
Newton’s Creek
Low $141,820,312 $1,085,286,303 6.33
Medium $141,820,312 $1,791,992,285 10.46
High $141,820,312 $2,881,102,025 16.81
Ohio Creek
Low $97,073,808 $116,968,617 1.06
Medium $97,073,808 $189,377,673 1.71
High $97,073,808 $224,119,946 2.03
Total
Low $238,894,120 $1,202,254,920 4.27
Medium $238,894,120 $1,981,369,958 7.03
High $238,894,120 $3,105,221,971 11.02

Norfolk Coastal Adaptation and Community Transformation Plan
Attachment F Benefit Cost Analysis Page I.13
0.00%
20.00%
40.00%
60.00%
80.00%
100.00%
BENEFITS The results of the Benefit Cost Analysis for Norfolk’s Coastal Adaptation and Community
Transformation Plan application consider economic, social, and resiliency factors. Results are
provided in three forms: annual benefits, net present value, and the BCR. In order to compare
future benefits to current cost, a discount rate is applied over the life of the project to calculate
the net present value, or NPV, from annual benefits. A project’s total net benefits are divided by
the total project cost, resulting in a benefit cost ratio, or BCR. A BCR greater than 1.0 is
considered cost-effective.
$1.9 BILLION
NET PRESENT VALUE BENEFITS
BCR: 7.03
Net Present Value Comparison

Norfolk Coastal Adaptation and Community Transformation Plan
Attachment F Benefit Cost Analysis Page I.14
Norfolk Coastal Adaptation and Community Transformation Plan
Attachment F Benefit Cost Analysis Page I.15
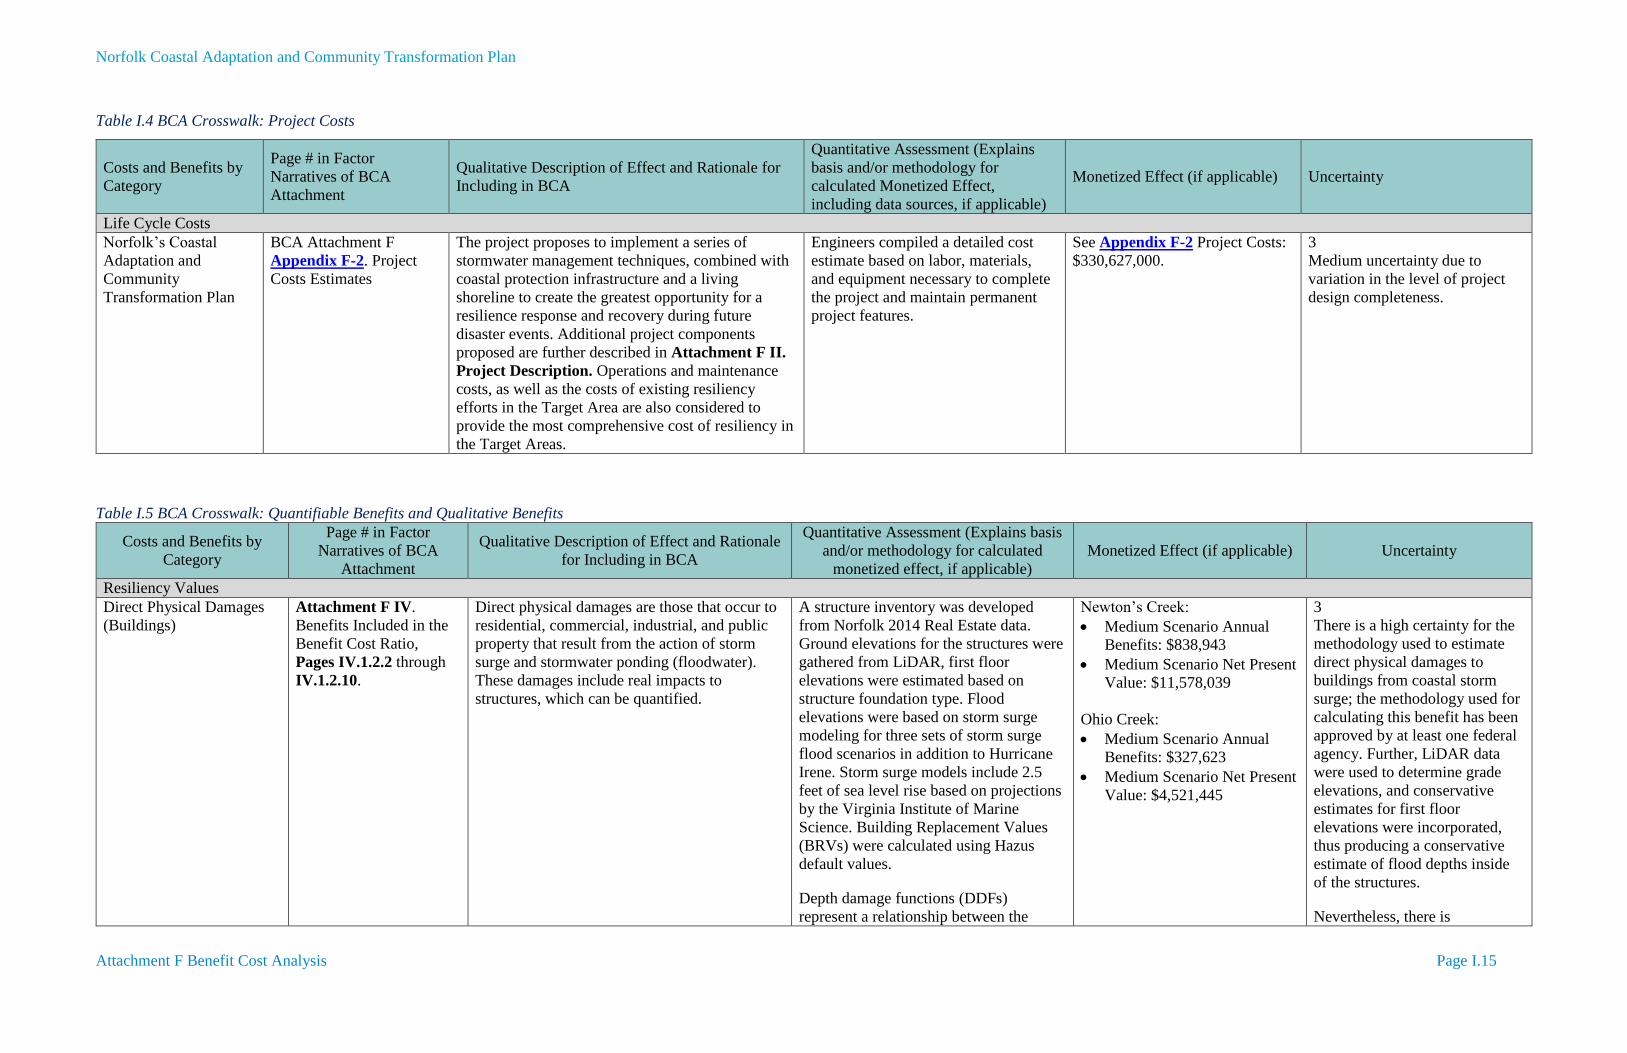
Table I.4 BCA Crosswalk: Project Costs
Table I.5 BCA Crosswalk: Quantifiable Benefits and Qualitative Benefits
Costs and Benefits by
Category
Page # in Factor
Narratives of BCA
Attachment
Qualitative Description of Effect and Rationale
for Including in BCA
Quantitative Assessment (Explains basis
and/or methodology for calculated
monetized effect, if applicable)
Monetized Effect (if applicable) Uncertainty
Resiliency Values
Direct Physical Damages
(Buildings)
Attachment F IV.
Benefits Included in the
Benefit Cost Ratio,
Pages IV.1.2.2 through
IV.1.2.10.
Direct physical damages are those that occur to
residential, commercial, industrial, and public
property that result from the action of storm
surge and stormwater ponding (floodwater).
These damages include real impacts to
structures, which can be quantified.
A structure inventory was developed
from Norfolk 2014 Real Estate data.
Ground elevations for the structures were
gathered from LiDAR, first floor
elevations were estimated based on
structure foundation type. Flood
elevations were based on storm surge
modeling for three sets of storm surge
flood scenarios in addition to Hurricane
Irene. Storm surge models include 2.5
feet of sea level rise based on projections
by the Virginia Institute of Marine
Science. Building Replacement Values
(BRVs) were calculated using Hazus
default values.
Depth damage functions (DDFs)
represent a relationship between the
Newton’s Creek:
Medium Scenario Annual
Benefits: $838,943
Medium Scenario Net Present
Value: $11,578,039
Ohio Creek:
Medium Scenario Annual
Benefits: $327,623
Medium Scenario Net Present
Value: $4,521,445
3
There is a high certainty for the
methodology used to estimate
direct physical damages to
buildings from coastal storm
surge; the methodology used for
calculating this benefit has been
approved by at least one federal
agency. Further, LiDAR data
were used to determine grade
elevations, and conservative
estimates for first floor
elevations were incorporated,
thus producing a conservative
estimate of flood depths inside
of the structures.
Nevertheless, there is
Costs and Benefits by
Category
Page # in Factor
Narratives of BCA
Attachment
Qualitative Description of Effect and Rationale for
Including in BCA
Quantitative Assessment (Explains
basis and/or methodology for
calculated Monetized Effect,
including data sources, if applicable)
Monetized Effect (if applicable) Uncertainty
Life Cycle Costs
Norfolk’s Coastal
Adaptation and
Community
Transformation Plan
BCA Attachment F
Appendix F-2. Project
Costs Estimates
The project proposes to implement a series of
stormwater management techniques, combined with
coastal protection infrastructure and a living
shoreline to create the greatest opportunity for a
resilience response and recovery during future
disaster events. Additional project components
proposed are further described in Attachment F II.
Project Description. Operations and maintenance
costs, as well as the costs of existing resiliency
efforts in the Target Area are also considered to
provide the most comprehensive cost of resiliency in
the Target Areas.
Engineers compiled a detailed cost
estimate based on labor, materials,
and equipment necessary to complete
the project and maintain permanent
project features.
See Appendix F-2 Project Costs:
$330,627,000.
3
Medium uncertainty due to
variation in the level of project
design completeness.

Norfolk Coastal Adaptation and Community Transformation Plan
Attachment F Benefit Cost Analysis Page I.16
Costs and Benefits by
Category
Page # in Factor
Narratives of BCA
Attachment
Qualitative Description of Effect and Rationale
for Including in BCA
Quantitative Assessment (Explains basis
and/or methodology for calculated
monetized effect, if applicable)
Monetized Effect (if applicable) Uncertainty
depth of floodwater in a structure and the
percent of damage that can be attributed
to the flooding. The DDFs from the
USACE are applied to estimate structure
damages associated with each return
period. The percent of structural damage
is related to 1-foot depth increments
which are multiplied by a structure
replacement value to produce a physical
loss value in dollars. See Part IV for
additional data sources.
uncertainty in the accuracy of
the structure data gathered from
Norfolk 2014 Real Estate data.
For this reason, uncertainty level
for this benefit is a 3.
Direct Physical Damages
(Contents and Inventory)
Attachment F IV.
Benefits Included in the
Benefit Cost Ratio,
Pages IV.1.2.2 through
IV.1.2.10.
Contents and inventory damage is that which
applies to personal property and material goods
and services held by a business that are
damaged during flood events. This value is
quantifiable.
Damage to contents and inventory are
estimated using a DDF associated with
structure occupancy type. Contents and
inventory DDFs from the USACE are
applied to estimate damages associated
with each return period. The percent of
damage is related to 1-foot depth
increments. See Part IV for additional
data sources.
Newton’s Creek:
Medium Scenario Annual
Benefits: $2,519,524
Medium Scenario Net Present
Value: $34,771,312
Ohio Creek:
Medium Scenario Annual
Benefits: $309,678
Medium Scenario Net Present
Value: $4,273,789
3
There is a high certainty for the
methodology used to estimate
direct physical damages to
buildings from coastal storm
surge; the methodology used for
calculating this benefit has been
approved by at least one federal
agency. Further, LiDAR data
was used to determine grade
elevations, and conservative
estimates for first floor
elevations were incorporated,
thus producing a conservative
estimate of flood depths inside
of the structures.
Nevertheless, there is
uncertainty in the accuracy of
the structure data gathered from
Norfolk 2014 Real Estate data.
For this reason, uncertainty level
for this benefit is a 3.
Essential Facility and
Critical Infrastructure
Service Loss
Attachment F IV.
Benefits Included in the
Benefit Cost Ratio, Page
IV.1.3.2 through Page
IV.1.3.15
Typical essential facilities whose functions are
critical during natural disasters include
hospitals, fire stations, EMS stations, police
stations, and similar facilities. Critical
infrastructure that IS equally necessary include
wastewater service, electrical power service,
and transportation infrastructure. Interruption of
these assets, services, and systems that serve the
public can cascade and result in further
Loss of service calculations are a
function of service population, loss of
function time, and value per capita of
service. Analysts identified the number
of type of essential and critical facilities
that are vulnerable to flood impacts using
local data from the City of Norfolk’s
Geographic Information System (GIS)
department. Service populations for
Newton’s Creek:
Medium Scenario Annual
Benefits: $4,535,498
Medium Scenario Net Present
Value: $62,593,255
Ohio Creek:
Medium Scenario Annual
Benefits: $598,008
2
There is a high certainty for the
methodology used to estimate
essential facility and critical
infrastructure service loss as a
result of storm surge; the
methodology used for
calculating this benefit has been
approved by at least one federal

Norfolk Coastal Adaptation and Community Transformation Plan
Attachment F Benefit Cost Analysis Page I.17
Costs and Benefits by
Category
Page # in Factor
Narratives of BCA
Attachment
Qualitative Description of Effect and Rationale
for Including in BCA
Quantitative Assessment (Explains basis
and/or methodology for calculated
monetized effect, if applicable)
Monetized Effect (if applicable) Uncertainty
economic, environmental, and societal losses.
The value of service provided by essential
facilities and critical infrastructure can be
quantified and included as benefits within the
benefit cost analysis in addition to any expected
physical property damages.
identified assets and facilities were
estimated using the total population for
the City of Norfolk. Loss of function
time was estimated using local
knowledge of emergency response and
preparedness measures employed by the
jurisdiction in a flood event. FEMA
standard values were used as the value of
the service provided for each facility or
system.
Medium Scenario Net Present
Value: $8,252,954
agency.
Uncertainties lie in the
estimation of service
populations for critical facilities.
Service population data were not
readily available for some
assets, therefore it was necessary
to obtain a general estimate of
service population based on total
population and additional assets
within Norfolk.
Fatalities Attachment F IV.
Benefits Included in the
Benefit Cost Ratio,
Pages IV.1.4.4 through
IV.1.4.11
Fatalities are an unfortunate risk inherent to
storm events. The proposed project provides
benefit by reducing the potential for lost life
during a storm event.
After an analysis of the impacts of the
Qualified Disaster and various
methodologies available for estimating
the number of fatalities for a flood event,
the estimation methodology selected is
based upon a 2013 study conducted by
Brno University. The methodology
considers expected damage value,
community preparedness, and warning
features to estimate loss of life. FEMA
standard life safety values were applied
to the number of fatalities expected for
each of the three flood scenarios
assessed.
Full Target Area:
Annual Benefits: $93,645
Net Present Value:
$1,292,365
4
A standard FEMA value for the
cost of a life was used, however
there are multiple methods for
determining the number of
possible casualties. The method
chosen for evaluation is
considered the most
conservative as it evaluates
community characteristics that
contribute to vulnerability.
Nevertheless, there are many
factors post-disaster that could
increase or decrease potential
casualties, including
unpredictable behaviors.
Relocation and Economic
Loss of Function
Attachment F IV.
Benefits Included in the
Benefit Cost Ratio,
Pages IV.1.4.25 through
IV.1.4.29.
Relocation costs and economic loss of function
(ELOF) are consequences of displacement that
result from disaster impacts. Relocation costs
are associated with moving a household or a
business to a new location and resuming
business or life in that new location. ELOF cost
is associated with the interruption of a business
or the removal of a piece of real estate from the
market as a result of disaster impacts. Both
costs can be derived as a function of
displacement time. See economic loss for costs
associated with ELOF.
Displacement time has been calculated
by:
1. Identifying expected flood depths and
structural damage expected to occur
2. Calculating building restoration time
based on flood depths and structure
damage identified
3. Assigning relocation and ELOF rates
based on occupancy class and extent of
damage
4. Using relocation and loss of function
time values by occupancy and damage
extent to calculate relocation expenses
and ELOF time without benefit
duplication.
Newton’s Creek:
Medium Scenario Annual
Benefits: $155,355
Medium Scenario Net Present
Value: $2,144,011
Ohio Creek:
Medium Scenario Annual
Benefits: $20,767
Medium Scenario Net Present
Value: $286,603
2
High certainty; the methodology
used for calculating this benefit
has been approved by at least
one federal agency. Further,
analysis was completed based on
USACE DDFs. There are
uncertainties with regard to
underground networks and
flooding that could exacerbate
loss. Further, LiDAR was used
to determine grade elevations,
with site checks in several areas.
FEMA Hazus methods improve
the analysis. Uncertainty in

Norfolk Coastal Adaptation and Community Transformation Plan
Attachment F Benefit Cost Analysis Page I.18
Costs and Benefits by
Category
Page # in Factor
Narratives of BCA
Attachment
Qualitative Description of Effect and Rationale
for Including in BCA
Quantitative Assessment (Explains basis
and/or methodology for calculated
monetized effect, if applicable)
Monetized Effect (if applicable) Uncertainty
See Part IV for data sources commercial owner occupancies
are acknowledged, as well as
post-disaster behavior of
residents and businesses.
Shelter Needs Attachment F IV.
Benefits Included in the
Benefit cost Ratio, Pages
IV.1.4.31 through
IV.1.4.35.
After a disaster event, impacted individuals may
need to shelter if they cannot access their homes
due to flooding. Even though the home may not
be damaged, people will be displaced if they are
evacuated or cannot physically access their
property by foot, vehicle, or transit due to
flooded roadways and transit systems.
The FEMA Hazus methodology is used
for this benefit. Short-term sheltering
needs are based on displaced population,
determined using flood depths. For this
analysis, the displaced population is
considered residential population located
within the area where flood depth is
equal to or greater than 12 inches.
Population is estimated based on the
percentage of residential square footage
per building compared to the total
residential square footage in the census
block group. The number of displaced
individuals is then modified by factors
accounting for income and age. The cost
for sheltering is captured in the relocation
costs and is not given a separate
monetary value to avoid duplication of
benefits. See Part IV for data sources.
Newton’s Creek:
10% Annual Chance: 47
households, 113 people
2% Annual Chance: 99
households, 242 people
1% Annual Chance: 318
households, 774 people
Ohio Creek:
10% Annual Chance: 3
households, 8 people
2% Annual Chance: 42
households, 101 people
1% Annual Chance: 57
households, 139 people
2
High certainty; the methodology
used for calculating this benefit
has been approved by at least
one federal agency. The same
considerations as other
resiliency measures apply
related to structure data and
DDFs. Recent census data were
used for population and
demographics. Uncertainty lies
in post-disaster behavior.
Mental Stress and Anxiety Attachment F IV.
Benefits Included in the
Benefit Cost Ratio,
Pages IV.1.4.13 through
IV.1.4.18.
Natural disasters threaten or cause loss of
health, social, and economic resources which
may lead to psychological distress. Research
indicates that individuals who experience a high
number of stressors and property damage are
more likely to experience symptoms of mental
illness, Post-Traumatic Stress Disorder (PTSD),
and higher levels of stress and anxiety. An
increase in mental health issues after a disaster
will increase mental health treatment costs.
Such costs are captured here and are considered
losses avoided by the project.
Benefits are based on a national standard
cost of treatment per person by type of
treatment (mild/moderate or severe),
provided by FEMA. The FEMA standard
value was normalized to 2015 values and
applied to the number of residents that
would be impacted by the three flood
scenarios analyzed; however this number
is adjusted by 41% based on FEMA
estimates. The cost of mental health is
estimated for 30 months; this is the
maximum amount of time studies have
been able to estimate the prevalence of
mental health impacts after a disaster.
See Part IV for data sources.
Newton’s Creek:
Medium Scenario Annual
Benefits: $272,725
Medium Scenario Net Present
Value: $3,763,805
Ohio Creek:
Medium Scenario Annual
Benefits: $79,284
Medium Scenario Net Present
Value: $1,094,174
3
Medium certainty; the
methodology used for
calculating this benefit has been
approved by one federal agency.
However, this method only
considers the percent of the
population that is expected to
seek treatment post-disaster and
is considered to be conservative
for that reason. Further, the
percent of the population
expected to seek treatment is a
natural figure, and not locally
specific. Costs are also national
and not locally specific. Coping
tactics vary widely within a
given population.
Lost Productivity Attachment F IV. Natural disasters cause mental health problems Benefits are based on research conducted Newton’s Creek: 3

Norfolk Coastal Adaptation and Community Transformation Plan
Attachment F Benefit Cost Analysis Page I.19
Costs and Benefits by
Category
Page # in Factor
Narratives of BCA
Attachment
Qualitative Description of Effect and Rationale
for Including in BCA
Quantitative Assessment (Explains basis
and/or methodology for calculated
monetized effect, if applicable)
Monetized Effect (if applicable) Uncertainty
Benefits Included in the
Benefit Cost Ratio,
Pages IV.1.4.20 through
Pages IV.1.4.23
to increase after a disaster, and research
indicates this can impact work productivity.
Lost productivity costs are captured here and
are considered losses avoided by the project.
by the World Health Organization, which
indicates individuals with mental health
problems experience a 25.5% reduction
in earnings, and national employment
compensation data gathered from the
U.S. Bureau Labor of Statistics, from
which a productivity value per worker
was derived. Benefits were estimated for
three flood scenarios. See Part IV for
more detail and data sources.
Medium Scenario Annual
Benefits: $167,463
Medium Scenario Net
Present Value: $2,311,108
Ohio Creek:
Medium Scenario Annual
Benefits: $48,683
Medium Scenario Net
Present Value: $671,861
Medium certainty; the
methodology used to calculate
this benefit has been approved
by one federal agency. However,
this method only considers the
population that is expected to
have severe mental health issues
after a disaster, and does not
consider mild to moderate
mental health issues in the
analysis. Costs are national and
not location specific. Coping
tactics vary widely within a
given population.
Economic Impacts
Avoided
Attachment F IV.
Benefits Included in the
Benefit Cost Ratio,
Pages IV.5.2 through
IV.5.13.
Direct economic output refers to the value of
industry production, which varies by industry.
For example, the output of the service sector is
measured in sales, hospital output is measured
in the total service package that a patient
receives during their entire length of stay, and
output for non-profit organizations is based on
the cost of production or the expenses that the
organization must incur to operate. The industry
output value is significant because it supports
the understanding of the relationships of
industries that comprise the overall economy
within a geographic region. Measuring change
in industry output as a result of some stimulus
or impact is considered one of the most efficient
and straightforward methods to evaluate the
relationships between industries in any given
economy. Moreover, it allows one to witness
the reverberating effects of natural disasters on
that economy.
This methodology calculates lost
economic output as a result of flood-
damaged structures using the IMPLAN
economic impact assessment software.
This analysis uses lost economic output
by industry and input-output modeling
software to calculate the direct effects of
output loss within an industry, as well as
the effects that loss has on supporting
industries and spending patterns in the
economy (also known as indirect effects).
See Part IV for data sources.
Newton’s Creek:
Medium Scenario Annual
Benefits: $6,152,608
Medium Scenario Net Present
Value: $84,910,584
Ohio Creek:
Medium Scenario Annual
Benefits: $988,243
Medium Scenario Net Present
Value: $13,638,491
3
This benefit has been calculated
using a standard methodology
from City level data from
IMPLAN. Uncertainty is due to
the use of multiple conversion
calculations associated with use
of City-level data. Moreover, the
results are considered a
conservative estimate as
economic impacts measured are
limited to the Virginia Beach –
Norfolk - Newport News MSA.
Inherent Values
Environmental Value
Environmental Value Attachment F IV.
Benefits Included in the
Benefit-Cost Ratio, Pages
IV.2.2 through IV.2.30.
Benefits provided by ecosystem goods and
services and green infrastructure (GI) can be
valued using the economic valuation theory,
which relies on people’s willingness to pay for a
good or service. Under the umbrella of
willingness to pay theory are numerous
The benefits of ecosystem goods and
services of natural capital and GI are
valued using different approaches.
FEMA values ecosystem goods and
services based on the square footage of
different types of vegetative areas (green
Newton’s Creek:
Medium Scenario Annual
Benefits: $670,716
Medium Scenario Net Present
Value: $9,570,615
2
Values used in calculating this
benefit are provided by federal
and published sources. Further
certainty in the results is
accomplished by combining

Norfolk Coastal Adaptation and Community Transformation Plan
Attachment F Benefit Cost Analysis Page I.20
Costs and Benefits by
Category
Page # in Factor
Narratives of BCA
Attachment
Qualitative Description of Effect and Rationale
for Including in BCA
Quantitative Assessment (Explains basis
and/or methodology for calculated
monetized effect, if applicable)
Monetized Effect (if applicable) Uncertainty
valuation methods including contingent
valuation, hedonic pricing, and travel cost.
Other methods used to value environmental
benefits include income, replacement cost,
avoided cost, and market price. For this
analysis, the benefits of ecosystem goods and
services are calculated through value, or benefit
transfer. The transfer refers to the application of
derived values from the original study site to the
goods and services provided by the project site.
Benefit transfer has become popular to value the
ecosystem services of natural capital, as it
allows for timely and cost-effective analyses.
open space, wetlands, and riparian), and
the Green Infrastructure Guide values
the environmental benefits of GI. It was
determined that, for certain ecosystem
services, it was possible to calculate
benefits using both methods. When this
occurs, a combination of benefits is
calculated, and the combined benefits are
included in the benefit cost ratio as low,
medium, and high value scenarios. Data
sources and a more detailed description
of the approach are provided in Section
IV.
Ohio Creek:
Medium Scenario Annual
Benefits: $2,519,945
Medium Scenario Net Present
Value: $60,289,248
both approaches.
Social Value
Recreational Benefits Attachment F IV.
Benefits Included in the
Benefit Cost Ratio, Pages
IV.3.4 through IV.3.12.
The proposed project will add new and
improved park space, bicycle and pedestrian
trails, and community gathering and recreation
spaces and amenities, which will give residents
and visitors opportunities to participate in
activities such as walking, jogging, bicycling,
and playground use. There are two benefits
related to recreation that may be quantified: 1)
increased outdoor recreation, and 2) health
benefits related to increased activity due to the
availability of new recreation space.
There are two methods that can be used
to quantify recreational benefits: Earth
Economics and FEMA. Earth Economics
uses participation rates based on
statewide recreation activity, collected
through an Outdoors Demand Survey, to
estimate benefits in the Target Area.
FEMA quantifies recreational benefits
based on the square footage of added or
improved recreational space. Both
methods and results are included in the
BCR as a range of benefits. See Part IV
for more detail on the approach and data
sources.
Newton’s Creek:
Medium Scenario Annual
Benefits: $19,371,947
Medium Scenario Net Present
Value: $276,423,168
Ohio Creek:
Medium Scenario Annual
Benefits: $4,045,199
Medium Scenario Net Present
Value: $57,721,958
2
This benefit was calculated
using standard federal
methodology and other
published resources. Further
certainty in the results is
accomplished by combining
both approaches. However,
uncertainty lies in the fact that
benefits are based on a
conceptualized scenario for
project programming, based on
public outreach and feasibility.
The final design will determine
the extent of benefits here.
Health Benefits Attachment F IV.
Benefits Included in the
Benefit Cost Ratio, Pages
IV.3.14 through IV.3.16.
Generally, those who are physically active live
longer and are at lower risk for heart disease,
stroke, Type 2 diabetes, depression, some
cancers, and obesity. Access to outdoor
recreation has been found to increase the rate of
exercise in the surrounding population,
therefore improving overall health in the area.
Improved health is related to reduced health
care costs and increased work productivity. The
benefits valued here are avoided health care
costs of medical bills and compensation
payments due to an increase in physical activity,
as well as avoided lost productivity costs.
The total number of residents in the
Target Area is adjusted based on the
percent of population that meets physical
fitness guidelines in Virginia. The
resulting number is then increased
proportionate to proposed added
recreation space. Health care cost
savings per capita per year are then
applied to the increased number of
residents meeting physical fitness
guidelines to determine avoided health
care costs due to increased physical
activity. To provide low, medium, and
Newton’s Creek:
Medium Scenario Annual
Benefits: $1,276,310
Medium Scenario Net Present
Value: $17,614,037
Ohio Creek:
Medium Scenario Annual
Benefits: $328,917
Medium Scenario Net Present
Value: $4,539,294
3
There is medium certainty for
this benefit; it was calculated
using published resources.
Uncertainty lies in the use of
population projections to
estimate low, medium, and high
expected benefits for this
category. Furthermore, benefits
are based on a conceptualized
scenario for project
programming, based on public
outreach and feasibility. The

Norfolk Coastal Adaptation and Community Transformation Plan
Attachment F Benefit Cost Analysis Page I.21
Costs and Benefits by
Category
Page # in Factor
Narratives of BCA
Attachment
Qualitative Description of Effect and Rationale
for Including in BCA
Quantitative Assessment (Explains basis
and/or methodology for calculated
monetized effect, if applicable)
Monetized Effect (if applicable) Uncertainty
high estimated benefits and to account
for population growth, benefits are
calculated for the projected population at
certain points in time.
final design will determine the
extent of benefits here.
Aesthetic Benefits Attachment F IV.
Benefits Included in the
Benefit Cost Ratio, Pages
IV.3.18 through IV.3.23.
Norfolk’s proposed project will provide a litany
of benefits that will render the Target Areas
more appealing to existing and future residents
and businesses, in turn resulting in a positive
effect for residents and the local economy.
Attractive views and reduction of flood risk are
just two contributing factors to this positive
benefit that can be quantified.
There are two methods that can be used
to quantify such benefits: FEMA
calculates aesthetic benefit based on the
square footage of added space that may
be considered an aesthetic amenity;
Earth Economics provides an approach
that evaluates potential impacts to
property values. Impacts to property
values considered include the location of
property near well-maintained green
spaces and attractive views, in addition
to the reduction in perceived risk of
flooding. Property value benefits are
presented as high, medium, and low
scenarios, and are expected to
incorporate considerations presented in
FEMA’s aesthetic benefit methodology.
Therefore, the Earth Economics benefit
values are those that are incorporated
into the benefit cost ratio so that a
duplication of benefits is avoided.
Newton’s Creek:
Medium Scenario Annual
Benefits: $10,677,535
Medium Scenario Net Present
Value: $88,979,467
Ohio Creek:
Medium Scenario Annual
Benefits: $3,725,340
Medium Scenario Net Present
Value: $31,044,505
3
This benefit was calculated
using standard federal
methodology, however
uncertainty exists due to the fact
that no similar studies exist for
the area that evaluate the
economic benefits of adding
aesthetic amenities and reducing
flood risk. The studies that were
utilized are considered to be
comparable. Benefits are based
on a conceptualized scenario for
project programming, based on
public outreach and feasibility.
The final design will determine
the extent of benefits here.
Economic Revitalization
Economic Revitalization Attachment F IV.
Benefits Included in the
Benefit Cost Ratio, Pages
IV.4.2 through Pages
IV.4.9.
The proposed project consists of several
economic revitalization efforts targeted towards
various locations within the Target Area. These
efforts include the following: 1) Redevelopment
of public housing sites to create additional
residential, retail, office, and hospitality
opportunities;
2) Creation of an Acceleration Center that will
partner with education organizations to focus
revolutionary water management solutions and
workforce training for the water management
industry. The economic benefits of the
aforementioned efforts can be measured by
anticipated added economic output and
employment compensation for those industries.
Output and employment compensation
benefits can be quantified per square foot
using standardized data (based on
FEMA’s Hazus software methodology
which uses national output per square
foot data) to estimate economic losses
and employment/output ratios and to
estimate economic and employment
losses using IMPLAN data. IMPLAN
data from 2013 was available to analysts
and provided City-level output and
employment compensation by industry.
The methodology relates industries from
IMPLAN to structure use and calculates
average IMPLAN output/employment
compensation for the industry. The total
Newton’s Creek Economic
Revitalization:
Medium Scenario Net Present
Value: $1,140,711,899
Newton’s Creek Future
Revitalization Benefits:
Medium Scenario Net Present
Value: $57,762,618
Ohio Creek Economic
Revitalization:
Medium Scenario Net Present
Value: $3,427,415
3
Local IMPLAN data was used to
calculate this benefit based on a
conceptualized scenario for
project programming, based on
public outreach and feasibility.
The final design will determine
the extent of benefits here.

Norfolk Coastal Adaptation and Community Transformation Plan
Attachment F Benefit Cost Analysis Page I.22
Costs and Benefits by
Category
Page # in Factor
Narratives of BCA
Attachment
Qualitative Description of Effect and Rationale
for Including in BCA
Quantitative Assessment (Explains basis
and/or methodology for calculated
monetized effect, if applicable)
Monetized Effect (if applicable) Uncertainty
square footage throughout the City was
calculated and the output and
employment compensation per square
foot was determined. Benefits are
presented for high, medium, and low
density revitalization scenarios. See Part
IV for data sources
Qualitative Benefits
Affordable Housing Attachment F V.
Qualitative Benefits,
Page V.1
Several public housing projects are located
within the Target Area; units within these
projects are subject to frequent flooding that
damages structures and contents. Recurrent
damage to such units has rendered the area
blighted, and some residential areas have been
vacated. Studies estimate that building 100
affordable housing units for families through
housing tax credit programs can support as
many as 30 new jobs in the local economy.
Moreover, the availability of affordable housing
attracts employers to the area and could also
increase the amount of disposable income to be
reinvested into the local economy. Many
employers have reported that a lack of
affordable housing makes it more difficult – and
thus more costly – to recruit and retain
employees.
If families within affordable households
are required to spend a smaller
percentage of their income on housing,
assumptions can be made that these
populations would be able to allocate
these resources more heavily in disaster
response, action, and recovery.
Therefore, by protecting affordable
housing from future flood events, the
Target Area can preserve the economic
benefits that affordable housing
provides, encourage and retain current
and future LMI employers, and increase
disposable income expenditures in the
local economy.
++ The lack of existing research
methodologies on this subject
limits the ability to quantify the
benefits of affordable housing
that will be both protected and
generated by the proposed
project. However, it is clear that
the loss of affordable housing
due to a future flood event
would greatly impact the
populations within the Target
Area. A portion of these benefits
are recognized in the Economic
Impact benefits.
Stormwater Management Attachment F V.
Qualitative Benefits,
Page V.2
Most of Norfolk collects stormwater from
streets and surrounding areas in a dedicated
stormwater drainage system. The stormwater
network in the project areas is designed to
collect rainwater runoff and route it towards the
Elizabeth River. During extreme flood events,
the outfalls of these systems are closed to
prevent tidal waters from backing up into the
system through the inlets, causing flooding in
city streets and surrounding areas. Analysts
used GIS to determine the potential areas of
stormwater inundation of the Target Area and
ran models to estimate depression storage and
the level of stormwater ponding.
Analysts calculated the total volume of
water for the 10% annual chance, 24-
hour rain event and compared this
volume to two rain-driven flooding
scenarios: estimated flood depths given
blockage of the stormwater system
(depression storage), and estimated flood
depths given failure of stormwater
storage and removal systems with the
proposed shoreline protection in place.
++ Based on the model, flooding
from the scenario is expected to
concentrate in low lying areas,
but also against the coast,
damaging assets most vulnerable
to coastal flood events.
Therefore, benefits of the project
that are related to stormwater
flood reductions, such as direct
physical damages, relocation,
economic impacts, and critical
facilities, are already realized.

Norfolk Coastal Adaptation and Community Transformation Plan
Attachment F Benefit Cost Analysis Page I.23
Costs and Benefits by
Category
Page # in Factor
Narratives of BCA
Attachment
Qualitative Description of Effect and Rationale
for Including in BCA
Quantitative Assessment (Explains basis
and/or methodology for calculated
monetized effect, if applicable)
Monetized Effect (if applicable) Uncertainty
Workforce Benefits Attachment F V.
Qualitative Benefits,
Page V.1
The proposed Acceleration Center - a nexus for
technological, organizational and conceptual
innovation around identified regional resilience
issues – will provide a workforce training
program in the water management industries.
Workforce training programs create
opportunities for individuals to obtain
experience that will land them a well-
paying job in the future. Thus, such
programs are considered future
investments in a particular industry.
+ Although the Center expects to
employ 5 FTE staff in year 1,
the number of industry workers
trained and exported from this
initiative is unknown at this
time. Therefore no quantitative
benefits could be derived from
the amenity.
Historic Preservation Attachment F V.
Qualitative Benefits,
Page V.1 through Page
V.2
The proposed Target Area contains a number of
historic structures that would benefit directly
from the installation of the protection measures.
Though the building/content replacement value
of these structures is not inherently higher when
compared to non-historic buildings; the social,
cultural, and historic loss of these structures
would have a much greater impact on the
community as a whole.
Benefits associated with protecting
historic and cultural resources include
the protection of high property values,
monetary values of the number of visits
and ticket sales, and nonmarket values of
such resources such as the desire to
conserve and preserve historical
resources for future generations.
+ The benefit that is provided by
the presence of historic and
cultural resources is captured
elsewhere within this analysis.
Nevertheless, it is important to
note that the abundance of
historical structures in the Target
Area would have an impact on
the community if they were
impacted by a flood event.
Water Quality Benefits Attachment F V.
Qualitative Benefits,
Page V.3 through Page
V.4
Reduction in stormwater treatment needs
inherently provides water quality benefits in the
form of TMDLs. TMDLs represent the total
amounts of pollution that a water body can
receive and still meet EPA standards for water
quality.
The Virginia Department of
Environmental Quality submits the
"Reduction of Toxics in State Waters
Report" to several House Committees
each year in January. From the January
2015 report’s Appendix I-3 “State of the
Elizabeth River Scorecard 2014”, we
read:
“The Eastern Branch [of the Elizabeth
River] earns a D, indicating urgent need
behind a new plan for this branch.
Scientists found disturbingly high levels
of bacteria in Broad Creek and Indian
River tributaries and extremely low
dissolved oxygen in Broad Creek. The
Elizabeth River Project has just
completed a draft comprehensive
strategy for community-wide efforts to
improve the Eastern Branch, with a
priority focus on Broad Creek and Indian
River.” (page 3).
+ Although it is known that the
Elizabeth River is currently
polluted, there is no clear way to
ascertain a value for overall
water quality at this time, such
as Total Maximum Daily Loads
(TMDLs) that are expected to be
reduced though these projects.
Reduced costs for stormwater
treatment are being included as
benefits in the quantitative
portion of this analysis.
Urban Heat Island
Mitigation
Attachment F V.
Qualitative Benefits,
Page V.4 through Page
Urban areas are more vulnerable to the effects
of temperature increase and precipitation pattern
changes because of the heating and cooling
In a 2014 study, Norfolk ranked fifth in
the nation as having the fastest growing
overnight urban heat island with
+ The uncertainty of quantifying
this benefit is too great, as it
involves knowing the degree to

Norfolk Coastal Adaptation and Community Transformation Plan
Attachment F Benefit Cost Analysis Page I.24
Costs and Benefits by
Category
Page # in Factor
Narratives of BCA
Attachment
Qualitative Description of Effect and Rationale
for Including in BCA
Quantitative Assessment (Explains basis
and/or methodology for calculated
monetized effect, if applicable)
Monetized Effect (if applicable) Uncertainty
V.5 processes of building roofs and cars, as well as
the emission of greenhouse gases. The City of
Norfolk is vulnerable to the Urban Heat Island
(UHI) effect, as it maintains a relatively dense
urban environment to the surrounding regions
and contains a large amount of impervious
paved surfaces that trap and absorb heat.
Research has indicated that the installation of
green space, such as rain gardens, bio-retention
features, and permeable pavements, cause a
reduction in temperature variations; therefore it
can be assumed that the proposed project will
reduce the UHI effect in Norfolk.
temperatures heating in the city faster
than in rural areas. The proposed Target
Area will contribute towards reducing
UHI effects by planting trees, expanding
park spaces, installing bio-retention
features, incorporating rain gardens into
existing landscapes, and installing
permeable pavement throughout.
which heat will be reduced in
the locality; thus this benefit is
considered qualitative.
Emergency and Recovery
Efforts
Attachment F V.
Qualitative Benefits,
Page V.5
After Hurricane Irene, flooded roadways and
out-of-service transportation services impeded
travel throughout the Target Area. Although no
lives were lost due to this situation, flooded
roads could in the future prevent emergency
response vehicles such as police cars,
ambulances or firefighting equipment from
effectively reaching victims in time.
The protection of these areas from
flooding will serve to reduce emergency
response need and times, and give
adequate access to crews that typically
deal with fallen trees, downed power
lines or other disaster incidents. Flood
risk reduction will also favorably impact
post-disaster recovery efforts, allowing
residents and property owners to return
from evacuation safely in order to
address possible damages and begin the
return to “blue skies” life.
+ This reduction in the need for
and cost of emergency services
is not able to be quantified at
this time, however, due to a lack
of data from previous flood
events.
Injuries Attachment F V.
Qualitative Benefits,
Page V.5
Injuries are an unfortunate inherent risk
associated with natural hazard events.
According to the CDC, injuries sustained in
New York City within the first week of
Hurricane Sandy recovery were from
evacuation, cleanup, or repair of a
damaged/destroyed home. The most common
injuries were arm/hand cuts, followed by back
strain/sprain, and leg cuts. Such injuries are
associated with medical treatment and costs that
may be quantified to include as a benefit.
The same CDC study states that twenty-
five % of people with an injury in New
York City received treatment from a
hospital, emergency department (ED), or
doctor’s office, though this varied by
household. It is possible to attribute this
percentage to the Norfolk area, however
there is a lack of injury data related to
Norfolk and the qualifying disaster.
+ Injuries that may be experienced
during and immediately after a
future flood event have not been
quantified in the Benefit Cost
Analysis due to lack of data
from past storms. Although it
would have been possible to
apply knowledge of Hurricane
Sandy injuries to Norfolk, the
level of uncertainty in such an
analysis warranted exclusion of
such benefits from the Benefit-
Cost Ratio.
Regional Benefits Attachment F V.
Qualitative Benefits,
Page V.6
Naval activities, the Virginia Port Authority,
and other water-based industries in the area
such as ship building and ship repair facilities
provide considerable employment; the ability
There are no known considerations for
base relocation and closures (BARC) for
the Hampton Roads area, however such
closures would certainly have an impact
+ This benefit is unquantifiable at
this time with regard to the
Target Area, as the measurable
impact of flooding is greater

Norfolk Coastal Adaptation and Community Transformation Plan
Attachment F Benefit Cost Analysis Page I.25
Costs and Benefits by
Category
Page # in Factor
Narratives of BCA
Attachment
Qualitative Description of Effect and Rationale
for Including in BCA
Quantitative Assessment (Explains basis
and/or methodology for calculated
monetized effect, if applicable)
Monetized Effect (if applicable) Uncertainty
for these employees to get to and from work
each day is paramount to the region’s economic
success. The protection afforded by the
proposed projects will positively impact the
lives of these employees, in turn helping to
maintain a steady productivity in the region.
on the economy and response efforts. than the Target Areas.
Light Rail Infrastructure Attachment F V.
Qualitative Benefits,
Page V.6
Norfolk’s light rail system- “The Tide”- is part
of a larger plan to develop a multi-modal
transportation network to sustain Norfolk’s
position as the business, cultural, educational,
and medical center of Hampton Roads.
During the Hurricane Irene event, light rail
transportation was suspended Saturday, August
27th and was scheduled to resume
approximately 35 hours later at 11 am on
Sunday, August 28th.
Work week ridership for the first six
months of operation averaged 4,650 a
day – exceeding the original projection
of 2,900 trips per day. Norfolk has
already experienced over $1.2 billion in
investment along the 7.4 mile light rail
alignment since it was announced. The
Tide’s ridership is significantly
dependent on the system as nearly half
of all trips on the system are home based
work trips. Loss of service impacts as a
result of flooding have large impacts on
the community as it affects people’s
ability to get to and from work. It can be
assumed under the scenario which
incorporates SLR (as stated above and
within the BCA results) that the light rail
system if impacted could be out of
service for an extended period of time.
+ If it was assumed that the light
rail would receive similar
impacts as the roadway systems
during natural hazard events
(which is likely considering the
tracks’ proximity to the water),
analysts believe significant
impacts could be experienced.
The proposed project will
provide benefits to
transportation infrastructure
including the light rail system by
protecting these assets against
future natural hazard impacts
related to storm surge and
flooding, thereby reducing
shocks and stresses on the
community.
Economic Benefits of
Project Implementation
Attachment F V.
Qualitative Benefits,
Page V.5
Resiliency projects often benefit the local and
regional economy by providing employment
opportunities during implementation and
increasing output and Gross Domestic Product
(GDP) for the area. Even the construction phase
generates economic impacts due to the influx of
expenditure into the economy and jobs created
by the increased need for services.
To measure economic impacts related to
project expenditures, analysts used
IMPLAN Version 3.0 economic
software system to develop an input-
output model of the MSA’s economy.
Overall, the proposed project is expected
to generate more than 2,550 jobs, $141
million in labor income, and $199
million in industry output through the
MSA alone, increasing local GPD by
$199 million. Economic relationships
can and do extend to geographic areas
beyond the MSA; It is expected that
project implementation will generate
economic benefits at a national level.
++ This benefit can be calculated
using a standard methodology
from City level data from
IMPLAN. Moreover, the results
are considered a conservative
estimate as economic impacts
measured are limited to the
Virginia Beach – Norfolk -
Newport News MSA.

Norfolk Coastal Adaptation and Community Transformation Plan
Attachment F Benefit Cost Analysis Page II.1
Project
Description
PART II PROJECT DESCRIPTION AND COSTS INCLUDED IN THE BCA

Norfolk Coastal Adaptation and Community Transformation Plan
Attachment F Benefit Cost Analysis Page II.2
Project Area, Objectives, and Alternatives Considered

Norfolk Coastal Adaptation and Community Transformation Plan
Attachment F Benefit Cost Analysis Page II.3
Project Area
The Target Area includes the southern Norfolk neighborhoods of Chesterfield Heights, South Brambleton, Harbor Park, and St. Paul’s Area. In the context of this application, the neighborhoods will be broken into two watersheds: the Ohio Creek Watershed and the Newton’s Creek Watershed.
The Target Area contains a total population of 11,840 persons according to the U.S. Census Bureau. Of this population, approximately 86% of the households meet the low-to-moderate income (LMI) requirements for the Commonwealth of Virginia (FY 2015 HUD LMISD [HUD Median Income for Fiscal Year 2014]). LMI is generally defined as 80% or less than the area’s median income as calculated by HUD on a Metropolitan Statistical Area (MSA) basis.1 ACS data are used with Income Limits for Metropolitan Areas and for Non Metropolitan Counties prepared by the Department's Office of Policy Development and Research to calculate the Low to Moderate Income Summary Data (LMISD).2 It should be noted that the ACS data provided by HUD used to determine LMI status are 2006 to 2010 survey data, whereas income and poverty data are based upon the most recent 2013 ACS data provided by the US Census Bureau. However, Norfolk is confident in the information, as it is the most up-to-date data available for each metric.
The Target Area is comprised of 12 U.S. Census block groups, with a combined median income of $25,350 per household—an income level that is only 48% of the national median household income.3 The median household income for the City of Norfolk is $44,474.The Target Area includes the following census block groups: 35.01.1, 35.01.2, 35.01.3, 35.01.4, 41.1, 42.1, 42.2, 46.1, 46.2, 47.2, 48.1, and 49.2. The Ohio Creek Watershed contains census tracts (whole or partial) 46 and 47. The Newton’s Creek Watershed contains census tracts (whole or partial) 35.01, 41, 42, 47, 48, and 49. Within the Target Area census block groups, approximately 43.2% of households live below the poverty line.
The Target Area contains 23 critical assets. These include three elementary schools, a middle school, a pre-school, an electrical substation, a fire station, four recreational centers, and various other critical infrastructure. The Newton’s Creek Watershed also contains seven historic buildings, all of which are listed on the National Register of Historic Places.4 In addition, the historic African-American district located within the St. Paul’s Area, on Church Street, is culturally important and in need of improvement to increase connection and access to the surrounding area. The Ohio Creek Watershed houses Chesterfield Heights, a designated national historic district on the National Register of Historic Places containing 404 structures.5
Proposal Objectives
The primary proposal objectives are described in the Phase 1 application: 1) uniting the region; 2) increasing economic vitality; 3) building resilience; 4) maintaining neighborhood connectivity; and 5) providing innovative water management. Providing innovative water management is the fundamental driver that will make the other objectives possible to achieve.
1 https://www.hudexchange.info/manage-a-program/acs-low-mod-summary-data/ 2 https://www.hudexchange.info/manage-a-program/acs-low-mod-summary-data/ 3 http://factfinder.census.gov/faces/nav/jsf/pages/community_facts.xhtml 4 http://www.nps.gov/nr/research/ 5http://www.nps.gov/nr//listings/20030620.htm

Norfolk Coastal Adaptation and Community Transformation Plan
Attachment F Benefit Cost Analysis Page II.4
Norfolk suffers from increasing vulnerability to flooding, which has been disruptive to regional transportation connectivity and is undermining commercial and military activities. Recurrent flooding is a threat to regional economic vitality. Figure II.2 below indicates the current existing 1% annual chance flood conditions in the City of Norfolk with no sea level rise. The analysis performed for Norfolk’s Coastal Adaptation and Community Transformation Plan models 2.5 feet of SLR in order to project the potential consequences into the future. This will be discussed further in Part 5.
Figure II.1 Existing Conditions of the Target Area
Figure II.2 Estimated Flooding at the 1% Annual Chance Event of the Target Area

Norfolk Coastal Adaptation and Community Transformation Plan
Attachment F Benefit Cost Analysis Page II.5
Alternatives Considered
Several alternatives were considered for the Target Area.
No Action
If the present conditions were allowed to persist without any action, the vulnerable areas would remain vulnerable to coastal flooding and continued stormwater flooding. Without taking action to protect the region, residents would have no resilience to flooding and the conditions would worsen over time due to SLR and subsidence. Moreover, the region would not benefit from the ancillary assistances provided by the recommended projects.
River Barrier
One alternative to the proposed shoreline defenses against coastal flooding would be to construct a barrier at the mouth of the Eastern branch of the Elizabeth River. Such a barrier would be very effective at preventing coastal surge flooding for neighborhoods along the entire river. However, the barrier would be very expensive and would require expensive navigation gates for industrial shipping. Moreover, the barrier and gate would create significant impediments to tidal flushing and environmental health of the river. Finally, the barrier would only be a remedy for the coastal flooding and would not solve all of the rainfall induced flooding. Additional actions would be required. Thus, the cost of the barrier and gate was considered excessive compared to the limited benefits obtained.
Elevated Houses
A second alternative to prevent flooding is to adapt the community to accommodate frequent flooding. To avoid property damage to residential structures, the buildings could be individually elevated above the expected flood elevation. This would provide each resident with a safe and dry location during flood events. The limitations were determined to be high cost for elevation of all properties and failure to address other regional problems, such as poor connectivity. For instance, even with elevated houses, flooding on local roadways would prevent access by emergency services, impede commuting, and disrupt regular daily activities. Thus, this approach was removed from further consideration.
Recommended Action
The proposed action integrates coastal and stormwater flood management in a holistic manner while simultaneously generating social and environmental benefits for the neighborhoods. The proposed action is innovative and produced the desired outcomes for protecting LMI homes, increasing neighborhood connectivity, providing opportunities for new economic activity, and increasing the overall resiliency of the neighborhoods. Furthermore, the recommended actions are scalable, feasible, and replicable throughout Norfolk and the Hampton Roads Region.

Norfolk Coastal Adaptation and Community Transformation Plan
Attachment F Benefit Cost Analysis Page II.6
Project Summaries

Norfolk Coastal Adaptation and Community Transformation Plan
Attachment F Benefit Cost Analysis Page II.7
Project Summaries
The City of Norfolk has developed the Coastal Adaptation and Community Transformation Plan, which seeks to substantially improve conditions at several locations along the Eastern Branch of the Elizabeth River. The project includes significant modifications within the Ohio Creek Watershed and a largescale renovation of the Newton’s Creek Watershed. Newton’s Creek watershed improvements include the development of a Coastal Resilience Laboratory and Acceleration Center. Figure II.3 provides a visual representation of planned land uses and outcomes within the Target Area. Significant additional visual detail is provided within Attachment E Maps and Images and also here.
Within the Ohio Creek Watershed are two thriving neighborhoods, the historic Chesterfield Heights neighborhood and Grandy Village, both of which have a cohesive community personality. Thus, the water-management tactics deployed in these neighborhoods must be integrated into the existing landscape while maintaining the character of place and the location of existing road networks.
In contrast, the Newton’s Creek Watershed contains several areas that are ideal for a more comprehensive renewal. In this area, the South Brambleton neighborhood is a mix of industrial waterfront activities, a few apartments, and many vacant lots. The Harbor Park area is an under-utilized waterfront location that contains extensive gravel parking lots that function as infrequently used overflow parking for the Tides Ball Park and an Amtrak passenger rail station. The St. Paul’s Area, which includes the Tidewater Gardens, Calvert Square, and Young Terrace neighborhoods, is comprised of isolated HUD housing developments from the 1960s that have reached the end of their design lives and contain many aging apartment buildings in need of demolition and replacement. The approach for this area is to create an innovative water management foundation on which to revitalize the community.
The Coastal Resilience Laboratory and Acceleration Center—an independent 501(c)(3) organization—serves as the nexus for technological, organizational and innovation around community revitalization, water management, resilience measurement, port, Naval Station, and other water-sector business related resilience challenges. Managed by a Board of Directors inclusive of community and private sector partners and the Commonwealth’s major universities, the Center will be staffed by a small, agile team of entrepreneurs skilled at identifying problems, matching them with potential solutions, working with companies to create product and moving product quickly to market.
Project Useful Life
The PUL is 50 years, based upon FEMA Standard Values for infrastructure projects.
Certain actions proposed as part of Norfolk’s Coastal Adaptation and Community Transformation Plan, including the creation of parks, open spaces, and wetlands, are expected to last in perpetuity, as will the benefits related to these actions. Thus, in accordance with FEMA Mitigation Policy FP-108-024-01, the benefits and costs related to these actions are projected for 100 years at a 7% discount rate.

Norfolk Coastal Adaptation and Community Transformation Plan
Attachment F Benefit Cost Analysis Page II.8
Figure II.3 Resulting Target Area

Norfolk Coastal Adaptation and Community Transformation Plan
Attachment F Benefit Cost Analysis Page II.9
Ohio Creek Watershed Transformation

Norfolk Coastal Adaptation and Community Transformation Plan
Attachment F Benefit Cost Analysis Page II.10
Ohio Creek Watershed Transformation
A large focus of the proposed activities within the Ohio Creek Watershed is to protect residential housing from nuisance flooding and future coastal inundation. During Hurricane Irene, coastal storm surge pushed up the Elizabeth River and into the few remaining low-lying areas that were the original Ohio Creek, and from there, the water slowly inundated the neighborhood. When there are hurricanes, nor’easters, and even during high tides, water from the Elizabeth River also moves backward up the stormwater drainage system and consequently prevents rainfall from draining out of the neighborhood. During especially high surges, the water from the river can back up the system far enough to flow out onto streets and sidewalks. Even when the river is experiencing normal tide conditions, the outdated stormwater system is too small to convey run-off to the river during many rainfall events. As a consequence, the neighborhood streets and sidewalks flood frequently. There are only two roadways from which residents can enter and leave the neighborhood—one of which is submerged during nuisance flood events. As a result, the residents are cut off from the rest of the city. To remedy this situation, three water-management tactics are proposed. First, protect the shoreline so that high water levels in the river do not enter the neighborhood or the stormwater system. Second, capture rainfall across the watershed to slow its flow into the stormwater system and provide additional storage for rainwater so that the water does not pond in the streets. Third, introduce a living shoreline feature to minimize erosion and increase environmental wellness. Moreover, the City of Norfolk proposes to use these water-management activities as opportunities to improve the neighborhood by increasing neighborhood connectivity, adding new and improved natural habitat, and increasing resilience to future flooding.
Figure II.4 Ohio Creek Watershed Vision Plan

Norfolk Coastal Adaptation and Community Transformation Plan
Attachment F Benefit Cost Analysis Page II.11
Shoreline Protection
The 100-year coastal surge along this part of the Elizabeth River is approximately 8 feet at present day sea levels. However, according to the National Oceanic and Atmospheric Administration’s (NOAA’s) intermediate SLR forecast, the combined effects of SLR and subsidence may amount to as much as a 2.5-foot increase over the next 50 years. In order to provide a resilient defense against future surge and waves, coastal protection should be based upon a 100-year coastal surge of 11 feet.
To ameliorate the most significant vulnerability for the communities in this watershed, Kimble Terrace Drive will be elevated from its current elevation to 11 feet, and a new, higher bridge will be constructed. This road raising serves two functions; the first is to prevent water from flowing over the road and into the upland area, and the second is to maintain passable and safe egress in and out of the adjacent neighborhoods during times of high tide and coastal flooding. To further mitigate vulnerability to coastal flooding, the two drainage outfalls under Kimball Terrace (west of Chesterfield Heights) will be fitted with tide gates that can be closed during high water conditions in the Elizabeth River. Additionally, a series of smaller tide control devices will be installed along the shoreline of the neighborhood in the lower lying areas. This will prevent coastal surge from flowing into the marsh areas and inundating the neighborhood as happened during Hurricane Irene.
To increase resilience to future coastal flood events, a shoreline protection system will stretch from Kimball Terrace Drive on the west of Chesterfield Heights to the east side of the Grandy Village, and inland along the eastern perimeter of the Grandy Village neighborhood. Figure II.5 indicates the proposed shoreline-protection measures. The berm and wall system only needs to be 2 to 3 feet above prevailing grade in order to provide protection against the future 100-year coastal flood. The berm is envisioned to contain a robust sheet pile core with an exterior of soil, which will be vegetated with grasses and indigenous plants. If desired by the community, a walking path of pervious pavement, exercise equipment, benches, and picnic tables can be placed on the river front berm to provide a recreational amenity. In this way, the flood-protection feature will be visually integrated into the existing landscape. Though a flood-protection berm is preferred in the design, several locations along the river front have inadequate space to provide a properly sloped berm due to existing infrastructure. In these areas a vertical flood wall is proposed on the river side with a graded landscape feature on the inland side.
A robust living shoreline will be created. The slope of the berm and the elevation of the rock breakwater and vegetation of the shoreline construction will be carefully integrated so that as sea levels rise, the natural vegetation will be able to adapt by moving up the properly graded river bank. This presence of the rock, soil, and vegetation will function to attenuate wave energy and prevent erosion of the shoreline during coastal flooding events. In this way, the combined, multiple layers of defense from the berm and the living shoreline, will afford greater protection in concert than either feature could provide by itself. In addition to contributing to the robustness of the shoreline flood protection system, the marsh vegetation will provide important habitat along this reach of the river that will benefit local faunae and recreational fishing, which is popular in the community. For more information regarding the installation and benefits of the living shoreline, please refer to the Elizabeth River Shoreline Restoration project description section.

Norfolk Coastal Adaptation and Community Transformation Plan
Attachment F Benefit Cost Analysis Page II.12
Finally, to seal off the perimeter of the watershed, several roadway portions on the northeast side of Grandy Village will be raised to an elevation of 11 feet so that coastal surge cannot enter the neighborhood overland from the east. Though these elevations are relatively minor adjustments to the perimeter topography and landscape, the neighborhood can be made significantly more resilient to both present and future 100-year coastal flooding, critical access to the neighborhood can be maintained during times of emergency, and approximately 450 low to moderate income homes will be kept out of harm’s way.
Summary of Shoreline Protection
Length of Elevated Roads: 3,000 linear feet Length of Coastal Berm: 5,000 linear feet Length of Flood Wall: 2,100 linear feet Number of Tide Control Devices: 8 devices at 5 locations Structures protected from 100-year coastal flooding: 477 structures
Innovative Stormwater Management
By nature of preventing coastal surge and high tides from backing up the stormwater system, the shoreline protection described above will provide significant improvement of the ability for the system to drain during low-intensity rain events. However, the very old stormwater infrastructure remains significantly undersized, with much smaller diameter pipes than would be used today. The small pipes limit the capacity to convey large water volumes from the intense summer thunderstorms that can cause nuisance flooding. Nuisance flooding can be reduced by capturing and slowing down the water infiltration into the storm system, thereby alleviating any potential backflow or overload. To further mitigate the vulnerability to street and neighborhood flooding, several tactics are proposed to attenuate the intensity of stormwater runoff within the neighborhood.
Flooding can be reduced by capturing and temporarily retaining water in barrels, rain gardens, open areas, and parks. The City of Norfolk proposes to implement a dispersed stormwater-collection program using a combination of rain barrels and rain gardens at each residential parcel within the watershed. The flow in roof gutters and downspouts will be redirected into a storage device that has a capacity to accommodate the 10-year rainfall volume and discharge it slowly from an outlet on the bottom of the device. When each parcel temporarily stores the water that falls on their own property and releases it slowly into the communal drainage, the initial pulse of stormwater into the system is attenuated, which helps to prevent the undersized system from being overwhelmed and backing up into the streets. As part of the stormwater-collection program and in order to bring about a community-wide sense of responsibility for personal environmental impacts, the City intends to encourage all residents of the watershed to participate by offering discounted city fees to the participants. This program incorporates, builds upon, and refines community-chosen designs that have been developed and engineered by Hampton University, Old Dominion University, and Wetlands Watch. Public outreach and education materials and events about stormwater, flooding, and water quality will be offered, building upon and incorporating best strategies and lessons learned from the successful and innovative Elizabeth River Project: River Stars Program.
Stormwater flooding is also mitigated by reducing the amount of impervious surfaces in the neighborhood so that rainfall can infiltrate into the soil rather than entering the stormwater-

Norfolk Coastal Adaptation and Community Transformation Plan
Attachment F Benefit Cost Analysis Page II.13
drainage system. The City proposes to retrofit existing streets with pervious pavement, bio-swales, and rain gardens to manage stormwater collection in parts of the neighborhood. Many of the neighborhood streets have street parking along one or both sides of the street, which is currently impervious material. The City proposes to replace the impervious paving with permeable pavement under all of the parking areas to allow infiltration along the street curbs (see Figure II.6). In addition, at many street intersections, “green” decorative planters will be constructed in the sidewalks that contain flowers and ornamental plants but will also contain water-storage capacity. Finally, a large box culvert will be placed underneath Marlboro Avenue in the watershed to receive water from the uphill surface streets and release it much more slowly into the existing stormwater system.
In addition to the innovative parcel scale and street-level stormwater detention, the proposed project includes increased capacity and improvement of several large stormwater-retention areas, which will simultaneously increase wetland habitat. Several marsh retention areas on the western side of the watershed are expected to provide a total of 1.7 million cubic feet of rainwater storage, and will be connected to and integrated with the wetlands and park areas in the design for a holistic stormwater management and treatment system. The passage of stormwater through the wetlands will remove phosphorus and nitrogen, thereby helping the city to meet its TMDL targets. Finally, there are several parcels imperiled by low elevation and proximity to flooded areas. The City proposes to acquire these properties and turn them into multi-purposed open park space and recreational amenities where residents can gather during dry days, but where additional stormwater will be detained during rainfall events. Figure II.7 indicates new park and green spaces to be added to the area. The sum of parcel scale, street scale, and large-scale detention will be adequate to accommodate the 10-year rainfall and prevent most nuisance flooding of streets, sidewalks, and homes.
Because tidal gates and check valves will block the discharge of stormwater during coastal flooding and high tide, stormwater will be stored inside the berm in the marsh areas. Despite the increased capacity of stormwater retention, the storage is limited. For many rain events, the stormwater will exceed the storage capacity of the system before the river stage subsides and the gates can be opened to release the stormwater into the river. Thus, several large pumps are proposed to discharge rainwater over the coastal berm and into the river. These pumps help to ensure that the rainfall within the Ohio Creek Watershed can be adequately managed. Summary of Stormwater Management
Total Area of City-Installed Rain Gardens: 7,200 square feet Estimated Area of Pervious Street Paving and Walkways: 13,000 linear feet Storage Capacity of Green Streetscape and Box Culvert: 36,000 cubic feet Number of Newly Installed Pumping Stations: 5 stations Protected and Enhanced Wetlands: 15.1 acres
Community Amenities
All of these strategies offer the advantage of a small-scale, replicable, and community-oriented approach to resiliency at a neighborhood scale. The communities of Chesterfield Heights and Grandy Village contain school facilities and a community center. As neighborhood streets are improved with green stormwater techniques, new permeable bicycle and sidewalk connections

Norfolk Coastal Adaptation and Community Transformation Plan
Attachment F Benefit Cost Analysis Page II.14
will be constructed, providing recreational benefits as well as safe routes to school and other community facilities. Bike lanes and new pedestrian walkways are designed in the proposed project, which will increase neighborhood connectivity and help improve social cohesion. Additionally, improvements will be made at the Campostella Road Intersection will help integrate the Ohio Creek Watershed communities into the surrounding urban fabric. Figure II.8 indicates the various connections made through this effort of supplying safe bike routes and integration into other areas of the city.
Along the waterfront, the berm can be utilized as community open space with a promenade as a central feature. Along the promenade, benches, picnic tables, and exercise stations provide additional public benefit. Further multi-purpose open space and recreational amenities will be provided with the acquisition of several parcels imperiled by low elevation and proximity to flooded areas.
Summary of Community Amenities
Length of permeable walkways: 13,000 linear feet Wetlands increased and protected: 15.1 acres Newly Developed Sports Fields: 2.9 acres Added Waterfront Park Space: 11.5 acres Newly Planted Trees: 478 trees
Elizabeth River Shoreline Restoration
As part of the proposed activities in the Coastal Adaptation and Community Transformation Plan, the City of Norfolk will construct robust living shorelines (also known as constructed wetlands) along the banks of the Elizabeth River in portions of the Target Area. Figure II.9 identifies the proposed location of the Living Shoreline development in the Ohio Creek Watershed. Living shorelines are placed parallel to the shore, from upland to the river, and create habitat for species, safeguard the shoreline from erosion due to wave energy, soak up stormwater and reduce storm surge, and trap polluted runoff, slowing the flow of nutrients, sediment, and chemical contaminants into rivers, streams, and the Chesapeake Bay. When combined with the shoreline berm, a robust living shoreline can increase durability and effectiveness of the flood protection structure. For design details, see the Elizabeth River Shoreline Restoration Project section below.
Summary of Living Shoreline
Length of Living Shoreline Improvements: 2,200 linear feet
Grandy Village Phase VI NRHA Activities (Leverage)
The Grandy Village Phase VI activity being undertaken by the Norfolk Redevelopment & Housing Authourity (NRHA) is part of Norfolk’s commitment to the Ohio Creek Watershed. Construction is anticipated to begin May 2016. Changes to Grandy Village involve the demolition of older public housing units and the construction of 70 new apartments, a 1,500-square-foot community office, associated infrastructure, and a new roadway for the entire community connecting Kimball Terrace and Wiley Drive, as well as stormwater measures (e.g.,

Norfolk Coastal Adaptation and Community Transformation Plan
Attachment F Benefit Cost Analysis Page II.15
expansion of bio-retention area and manufactured water quality inlets, grass swales) and open spaces.
The residential units will be spread across 12 new buildings totaling 88,982 square feet, featuring a mix of Garden and Townhouse styles ranging from 1 to 4 bedrooms. The 70 units will replace obsolete units built in the early 1950’s that lacked central heat and air conditioning, as well as other standard amenities that are common in apartments today (e.g., dish washers, hook ups for washers and dryers, energy-efficient appliances and more spacious apartments).
The NRHA will integrate these properties into the surrounding neighborhoods, using landscape plantings and amenities—such as playgrounds, playing field space, and proper lighting—to enhance the quality of residents’ lives. The Grandy Phase VI project will integrate similar features, such as residential units overlooking the Elizabeth River to the south of the property. Landscape design includes the provision of grading and stormwater conveyance away from buildings; sod, seeding and planting beds in all disturbed areas; buffer yards; streetscape; parking; and foundation plantings. Existing wetlands and tidal areas on the property will be preserved or enhanced. Water conservation practices will be achieved through drought tolerant plantings and limited irrigation. Outdoor common areas for the residents will be located at the center of the main project area. An open field (approximately 41,000 square feet) of usable gathering and play space is allocated for this amenity. The gathering area will be sited centrally, with residential units surrounding the space. Adjacent to the gathering space, a playground will be constructed to the southeast, easily accessible by the residents via proposed sidewalk connections. Proposed sidewalks also tie into the existing neighborhood sidewalks that branch out to the city sidewalks and nearby commercial centers.
The costs and benefits of the Grandy Village activities have been integrated into the Ohio Creek Watershed BCA.

Norfolk Coastal Adaptation and Community Transformation Plan
Attachment F Benefit Cost Analysis Page II.16
Figure II.5 Ohio Creek Shoreline Proposed Coastal Flood Protection

Norfolk Coastal Adaptation and Community Transformation Plan
Attachment F Benefit Cost Analysis Page II.17
Figure II.6 Ohio Creek Proposed Stormwater Management

Norfolk Coastal Adaptation and Community Transformation Plan
Attachment F Benefit Cost Analysis Page II.18
Figure II.7 Ohio Creek Proposed Open Space Network

Norfolk Coastal Adaptation and Community Transformation Plan
Attachment F Benefit Cost Analysis Page II.19
Figure II.8 Ohio Creek Proposed Network Connectivity

Norfolk Coastal Adaptation and Community Transformation Plan
Attachment F Benefit Cost Analysis Page II.20
Figure II.9 Ohio Creek Watershed Proposed Living Shoreline

Norfolk Coastal Adaptation and Community Transformation Plan
Attachment F Benefit Cost Analysis Page II.21
Newton’s Creek Watershed Transformation

Norfolk Coastal Adaptation and Community Transformation Plan
Attachment F Benefit Cost Analysis Page II.22
Figure II.10 Newton’s Creek Watershed Vision Plan
Newton’s Creek Watershed
The Newton’s Creek Watershed is experiencing the same flooding dynamics as in the Ohio Creek Watershed described previously. Consequently, many of the same water-management measures are proposed for the Newton’s Creek Watershed. However, one significant difference between the watersheds is that the land-use types are more diverse in the Newton’s Creek Watershed, which permits some additional options for large-scale stormwater management, as well as community and economic development, which are not possible in the Ohio Creek Watershed.
There are three distinct neighborhoods within the Newton’s Creek Watershed, each with its own character, challenges, and unique opportunities. The South Brambleton neighborhood is a mix of industrial waterfront activities, outdated apartment buildings, and many vacant lots. The Harbor Park area is an underutilized waterfront location that contains extensive impervious parking lots and many gravel parking lots that function as infrequently used overflow parking for the Tides Baseball Park. The St. Paul’s Area contains multiple isolated HUD housing development from the 1960s that have reached the end of their design life and contains many aging apartment buildings in need of demolition and replacement. Thus, the flood-reduction techniques envisioned for the Newton’s Creek Watershed can take advantage of extensive areas that can be completely transformed to create an innovative water-management foundation upon which a new, resilient community can be built. The tactics proposed throughout the Newton’s Creek Watershed are shoreline protection, construction of green spaces, wetlands, and water streets for

Norfolk Coastal Adaptation and Community Transformation Plan
Attachment F Benefit Cost Analysis Page II.23
stormwater management, as well as design and the start of construction of new neighborhoods with enhanced connectivity and opportunities for economic development. Outdated public housing located in flood-prone areas will be replaced with a mixed-income, mixed-use neighborhood landscape. Importantly, the redevelopment can only take place once the coastal and stormwater flooding has been mitigated.
Shoreline Protection
As described for the Ohio Creek Watershed, the estimated future coastal surge elevation along this part of the Elizabeth River is approximately 11 feet. All proposed actions are needed to protect the inland regions from this level of coastal flooding. A continuous line of coastal protection is proposed along the entirety of the shoreline in this region with the character of the coastal protection varying according to differences in land use goals across the watershed. Starting in the east, the beginning of the floodwall and berm system will serve to protect a vulnerable portion of the I-264 off ramp and a significant number of residential homes within the South Brambleton neighborhood. This portion of the Newton’s Creek Watershed does house a number of industrial activities along the coast that require access to the river. Thus, the coastal protection in this area will be placed behind the industry and will be an integration of a low earthen berm to create a continuous topographic feature at an elevation of 11 feet. To the west of the industrial sites, the elevated road will connect to a vertical flood wall that will encompass an important electrical sub-station. The entire electrical supply to the City of Norfolk passes through this site; thus, energy resilience is significantly enhanced by protecting the Reeves Electrical Substation site within the shoreline protection system. To the west of the sub-station is a water channel that is the vestigial remnant of Newton’s Creek. All stormwater runoff from the entire watershed drains through this channel into the Elizabeth River; as a result, this channel is very important to the overall stormwater management of the whole watershed. This portion of the shoreline barrier will include two tidal control devices that can be closed during high tides and coastal surge to prevent water moving from the Elizabeth River up the channel and into the upper watershed. Shoreline protection will continue across the channel and tie into the elevated Norfolk-Southern railroad right of way on the western bank of the channel.
The Harbor Park area starts on the western side of the Norfolk-Southern line, where the coastal protection will take the form of an earthen berm with a solid sheet pile core, similar to the one proposed in the Ohio Creek Watershed. There will be an 8-foot-wide concrete walking/bicycle path running the length of the berm. Once protected, the existing waterfront will become valuable waterfront real estate that will be transformed into attractive, waterside commercial spaces and additional waterfront recreational areas. There are stormwater outfalls along the river in Harbor Park on which one-way check valves will be installed to prevent back flow when the river elevation is high. Similar to the living shoreline described above for the Ohio Creek watershed, breakwaters and marsh vegetation will be installed along the Harbor Park shoreline to provide wave attenuation, erosion control, increased natural habitat, and an adaptive living shoreline that accommodates SLR over time. For more information regarding the installation and benefits of the living shoreline, please refer to the Elizabeth River Shoreline Restoration project description section.
Finally, several minor roadway and curb elevations will take place throughout the watershed. In South Brambleton, a portion of Reeves Avenue will be raised as part of the storm surge barrier to

Norfolk Coastal Adaptation and Community Transformation Plan
Attachment F Benefit Cost Analysis Page II.24
ensure residents within the area are fully protected. On the western side of both Harbor Park and the St. Paul’s Area, minor curb raises and roadway modifications will be further enhanced to provide protection from future inundation. Figure II.11 identifies all of the proposed coastal flood protection measures discussed above within the Newton’s Creek Watershed.
Summary of Shoreline Protection
Length of Elevated Roads: 3,275 linear feet Total Area of Coastal Berm and Floodwall System: 10.8 acres Number of Tide Control Devices: 2 devices at 1 location Structures protected from 100-year coastal flooding: 477 structures
Innovative Stormwater Management
Typically, urban areas are structured according to the desired location of buildings and street layout, only after which stormwater considerations are fit within the constraints of the urban landscape. However, the City of Norfolk proposes an innovative approach to invert that paradigm and instead organize the stormwater infrastructure first. The pioneering Norfolk Coastal Adaptation and Community Transformation Plan proposes to construct a designed system of surface-water storage features and then fit the neighborhoods within and around these features. The main stormwater features will be the establishment of a blue green corridor network aligned with the original Newton’s Creek channel, which is the lowest topography in the area and the area most prone to flooding. The sequence of greenspaces will be underlain by a large culvert system into which water can drain under moderate to small rainfall events via inlets. When the culvert fills during large rainfall events, then the green spaces will store the excess water and deliver it downgradient over the connecting weirs. The proposed system offers substantially more resilience to stormwater flooding than a traditional curb and gutter stormwater system. In addition, the linked sequence of green spaces can function as an amenity that can be landscaped with ornamental plants and flower gardens, and can function as parks and playgrounds during dry weather.
Many locations within the Newton’s Creek Watershed suffer from nuisance stormwater flooding. Some components of the drainage system in this area are older, undersized pipes and there is not adequate stormwater storage within the watershed. Thus, when there is more water than the drainage system can convey, the water ponds on low-lying roads and areas within the neighborhoods. One of the primary chokepoints in draining the system are the undersized culverts that convey the water under Holt Street and under the Norfolk-Southern rail line to the outflow channel on the eastern side of the rail line. The culverts are small and they are located below mean sea level such that even high tides push water back up the system and prevent rainfall from draining out to the river. Figure II.12 provides a visual of the existing flood issue using modeled storm events. In order to remedy this issue, the City of Norfolk proposes the following stormwater management controls.

Norfolk Coastal Adaptation and Community Transformation Plan
Attachment F Benefit Cost Analysis Page II.25
Figure II.11 Newton’s Creek Proposed Coastal Resiliency Improvements

Norfolk Coastal Adaptation and Community Transformation Plan
Attachment F Benefit Cost Analysis Page II.26
Figure II.12 Newton’s Creek Watershed Holt Street Back-Up
First, the proposed tide gate at the mouth of the outflow channel next to the Norfolk-Southern rail line provides an opportunity for stormwater storage to be disconnected from the river. A large pump station is proposed for placement just inside the mouth of the channel so that when the tide gate is closed, the station can expel water from the channel and effectively empty the stormwater system prior to a rainfall event. To increase the available storage on the bottom of the watershed, an auxiliary storage area is proposed adjacent to the outflow channel. The City proposes to convert several city-owned, vacant lots in the South Brambleton area to water storage. These lots are in the area northwest of the industrial regions and will be excavated to produce a large storage area that will be connected to the main outflow channel by 800 linear feet of underground box culvert. In this way, stormwater draining from the upper watershed can accumulate in the pre-emptied channel and to the new South Brambleton storage pond via the underground culvert. The pumping station that will be used to drain the stormwater system before a storm can also be used to continue moving stormwater over the berm and into the river during and after a storm. The pumping capacity will be designed to accommodate the 10-year rainfall volume and, thus, prevent nuisance flooding up to the 10% annual chance rainfall event. Once the river stage attenuates to normal elevations, the tide gate can be opened, allowing the accumulated stormwater from the upper portions of the watershed to drain naturally into the river.
Second, to increase the efficacy of the stormwater system to move water down the watershed to the primary storage areas, the City proposes to improve and increase the capacity of the culverts under Holt Street and the Norfolk-Southern line. Upgrading this feature will allow the system to more efficiently move stormwater out of the St. Paul’s Area and into storage in the South Brambleton area. The lower storage areas and pumps provide the primary capacity for the watershed to mitigate stormwater flooding.

Norfolk Coastal Adaptation and Community Transformation Plan
Attachment F Benefit Cost Analysis Page II.27
After the surface-water network has been established, the innovative neighborhood development will proceed with a realignment of green streets and water streets that connect to each other and to the individual green spaces. The function of the green and water streets is similar to the main green spaces; an area along the street alignment will be dedicated to holding water and slowly conveying it down to the main green spaces. The interconnection between these greenspaces and streets will emulate and reestablish the historic Newton’s Creek bed allowing the area to drain water naturally to the Elizabeth River as nature intended. When it rains, rather than letting rain collect in the street or into traditional curb and gutter, there will be pervious soil and plants, such as a bioswale, that will have a lower elevation than the street and sidewalk. The bioswales will convey some of the water to the main green spaces of the surface-water collection system, while the remainder will infiltrate into the soil without impeding day-to-day life for residents and businesses. Depending upon aesthetic decisions, the streets can be designed to retain water during dry times or they can be designed to fully drain and thus be vegetated during dry times. Additionally, bioswales can be substituted with rain gardens dependent upon the preference of the community. The primary objective is to offer the neighborhood a mix of water streets or green streets to provide a diversity of beautiful streetscapes as an additional benefit to the robust and resilient water management program. Figure II.13 identifies the initial design of the proposed Newton’s Creek stormwater infrastructure.
The overarching goal of the Newton’s Creek Watershed stormwater management system is to provide the watershed with a unique and identifiable structure that is cutting edge and used as a replicable and scalable model across the entire country. Combining multiple layers of defense into a holistic, seamless, and well-designed system will not only ensure the protection of the residents within the watershed but also provide the community with safeguards well into the future. Additionally, allowing for the community to redevelop organically around the system affords a multitude of possibilities in the redesign of the area. Figure II.14 provides an example of the landscape character identified in the proposed stormwater-management system and offers a model stormwater transect displaying how this stormwater-management system might work as one complete system.
The City is intent on integrating green infrastructure, on-site water retention, and blue infrastructure on all new development in the renovated portions of the community, and will implement changes to zoning and building codes to accomplish these important objectives, especially as outlined in its PlaNorfolk 2030 comprehensive plan. The outcome of this innovative approach to water management provides resilience against nuisance flooding and opportunities for economic investment, commercial development, and community renewal within an attractive area protected from coastal flooding.
Summary of Expected Amenities
Total Amount of Newly Constructed Wetlands: 44.2 acres Total Area of City-Installed Rain Gardens/Bioswales: 44,400 square feet Estimated Area of Pervious Street Paving and Walkways: 104,200 square feet Increased Stormwater Culvert Capacity: 56,400 linear feet Number of Newly Installed Pumping Stations: 1 station

Norfolk Coastal Adaptation and Community Transformation Plan
Attachment F Benefit Cost Analysis Page II.28
Figure II.13 Newton’s Creek Proposed Stormwater Management

Norfolk Coastal Adaptation and Community Transformation Plan
Attachment F Benefit Cost Analysis Page II.29
Figure II.14 Newton’s Creek Watershed Stormwater Transect

Norfolk Coastal Adaptation and Community Transformation Plan
Attachment F Benefit Cost Analysis Page II.30
Community Amenities
The innovative stormwater-management solutions in the Newton’s Creek Watershed will create the framework and the motivations to revitalize several communities and create new incentives to spur growth in the adjacent downtown. The blue green corridor running north-south along Tidewater Drive will serve the dual purpose of collecting water from the higher ground in the neighborhoods to the north and allowing it to slowly infiltrate and move to larger water bodies to the south, as well as creating a new network of parks and trails connecting residents to the downtown and Harbor Park. The connections and the park spaces created will give new multimodal transportation options and bring access to quality natural open spaces for many residents in the city. New road connections will be made between the downtown area, St. Paul’s Area, Harbor Park, and South Brambleton neighborhoods. One major enhancement to be provided is the Holt Street connection, which currently runs from Harbor Park to the south, under I-264, and intersects with Tidewater Drive. This major thoroughfare will be extended further north so that the intersection at Tidewater Drive can be signalized and can run through the St. Paul’s Area to align with Freemason Street. This new connection will establish an important tie between Harbor Park and downtown Norfolk. To enhance the pedestrian and cyclist experience along this route, a new system of pathways will be implemented under I-264, wrapping around the constructed wetland features being added in this area. This bike and pedestrian path will not only connect Harbor Park to the downtown area but will also tie in to the system running east to South Brambleton, Chesterfield Heights, and Norfolk State University. Figure II.15 identifies the new connections made with other portions of the city by the institution of the proposed projects. This critical connectivity is presently missing in the area.
In the St. Paul’s Area, the City proposes to take advantage of the fact that the existing HUD project housing has outlived its useful life and must be relocated and demolished. Norfolk proposes to accomplish this by taking the first steps in replacing a portion of the Tidewater Gardens housing development (approximately 196 units) and relocating these families through a vacancy management program that has been tested and proven effective before in the city. Though the complete redevelopment of the St. Paul’s Area will not occur immediately in the HUD project timeline, the ultimate goal of the city is to look for private investment through a Master Developer to rebuild Tidewater Gardens and a number of other communities as a higher density mixed-use mixed-income neighborhood planned around stormwater-management. The proximity of the neighborhood to downtown Norfolk demands a higher density of residential units than is currently occupying the site. Downtown Norfolk represents a large regional employment center and, by increasing the density in the adjacent neighborhoods, the city can bring people closer to their work and keep more of the city’s income flowing back into local businesses. By creating a higher density, mixed-income neighborhood, the city will be able to maintain the same number of low and moderate income units in the area while improving the quality of those units and the surrounding environment

Norfolk Coastal Adaptation and Community Transformation Plan
Attachment F Benefit Cost Analysis Page II.31
Figure II.15 Newton’s Creek Connectivity Improvements
Additionally, the St. Paul’s Area will gain access to large multi-use, attractive open spaces containing sports fields, water features, and nature trails. These open spaces will offer safe walking and bike routes to work, school, and to the public transit systems currently operating in the city. The combination of permeable paving surfaces and the water features will create pathways for water to slowly enter the ground, preventing pooling during minor rains and the

Norfolk Coastal Adaptation and Community Transformation Plan
Attachment F Benefit Cost Analysis Page II.32
severe flooding currently experienced in these areas during significant storm events. The landscape around these water features will concentrate on using native species and creating new protected refuge areas for wildlife. The open space network being created will restore the area’s natural and historic hydrology, as well as the area’s local plants and wildlife to the place where they have been lost.
In Harbor Park, the storm surge barrier will, over time, become the framework to build a new waterfront promenade tying into the Tides baseball stadium and the existing waterside development. Linking the museums, hotels, and entertainment venues currently housed in waterside to the stadium will benefit both areas economically and will help to attract more private investment to Norfolk’s waterfront. The flood protection afforded by the storm surge barrier will also increase the value of the land around the stadium, creating new opportunities for private investment in office, residential, and hospitality space. The addition of new residents, workers, and visitors to the area will help to bring new vitality to downtown Norfolk and to the city’s waterfront. The area is already served by both public transit and Norfolk’s Amtrak station, making it an attractive transit-oriented development site.
Summary of Expected Amenities
Added Amount of Manicured Parks: 11.7 acres Total Area of New Water Street Park Area: 5 acres Added Waterfront Promenade Space: 10.8 acres Newly Planted Trees: 1,427 trees
Coastal Resilience Accelerator The Coastal Resilience Laboratory and Acceleration Center (the Center)—an independent 501(c)(3) organization—serves as the nexus for technological, organizational and innovation around community revitalization, water management, resilience measurement, port, Naval Station, and other water-sector business related resilience challenges. Managed by a Board of Directors inclusive of community and private sector partners and the Commonwealth’s major universities, the Center will be staffed by a small, agile team of entrepreneurs skilled at identifying problems, matching them with potential solutions, working with companies to create product and moving product quickly to market.
The Center is aligned with a wider effort to Re-Invent Hampton Roads (Re-Invent), a community initiative led by the Hampton Roads Community Foundation (HRCF). Re-Invent seeks to revitalize the regional economy by focusing on efforts that will generate high-paying, satisfying jobs including workforce development, export expansion, identifying and supporting existing business clusters and developing regional civic leadership talent. HRCF and its Re-Invent partners, including the Regional Economic Development Authority, CEO Roundtable, Old Dominion University, Norfolk State University, Hampton University, Tidewater Community College, will play important roles including oversight, research, innovation, strategic insight, investment, and connecting major employers to the Center. The Coastal Resilience Accelerator aims to achieve five overarching goals with eight objectives listed in Figure II.16.
In turn, the Center will advance the Re-Invent effort by focusing on innovation and economic development in the water economy. The Center is designed not to control innovation in the region, but as a network of public, private, educational and nonprofit organizations, coordinated

Norfolk Coastal Adaptation and Community Transformation Plan
Attachment F Benefit Cost Analysis Page II.33
by a small staff to leverage the region’s business, people and geography to create a risk tolerant environment in which innovation and entrepreneurship can flourish. Its objectives cascade from the Center’s strategic goals. The Center’s joint innovation and economic development mission coupling academic, non-profit, and private sector partners could be modeled throughout the country as a response to community threats.
• Water Management Solutions Acceleration: The Center will concentrate on the development and evolution of businesses that contribute to regional resilience by providing innovative water management solutions.
• Accelerating Incorporation of Resilient Principles in Existing Systems: The Center will act as the center for resilience thinking and a business incubator accessible to all of the cities across the region. A prime focus will be identifying via big data analysis, those sectors, projects and actions that most quickly build the region’s ability to bounce forward from disruptions. Key areas will include business continuity and recovery, critical infrastructure recovery, reduction of burden on emergency management, building neighborhood cohesion and Naval Station Norfolk operational continuity.
• Entrepreneurial Ecosystem: Focusing on a water resilience cluster, accelerate the timeline between research to product and product to market to increase regional economic vitality.
• Financing and Capital Market Innovation: Working with 100 Resilient Cities Platform Partners including SwissRe, Re.Bound, Social Finances and others, create innovative financing utilizing public and private sources to ensure the region’s ability to implement needed resilience projects. Innovations may include catastrophe bonds, tax increment financing (TIF) and innovations to capture disaggregated cost savings from mitigation interventions.
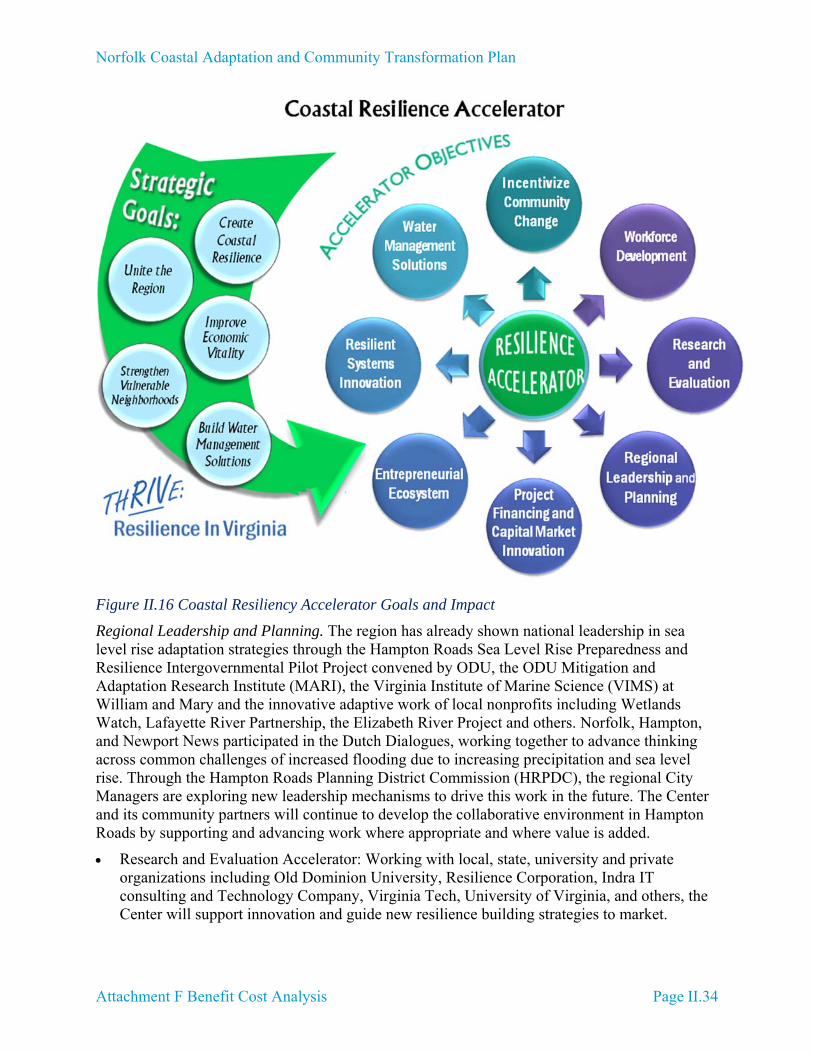
Norfolk Coastal Adaptation and Community Transformation Plan
Attachment F Benefit Cost Analysis Page II.34
Figure II.16 Coastal Resiliency Accelerator Goals and Impact
Regional Leadership and Planning. The region has already shown national leadership in sea level rise adaptation strategies through the Hampton Roads Sea Level Rise Preparedness and Resilience Intergovernmental Pilot Project convened by ODU, the ODU Mitigation and Adaptation Research Institute (MARI), the Virginia Institute of Marine Science (VIMS) at William and Mary and the innovative adaptive work of local nonprofits including Wetlands Watch, Lafayette River Partnership, the Elizabeth River Project and others. Norfolk, Hampton, and Newport News participated in the Dutch Dialogues, working together to advance thinking across common challenges of increased flooding due to increasing precipitation and sea level rise. Through the Hampton Roads Planning District Commission (HRPDC), the regional City Managers are exploring new leadership mechanisms to drive this work in the future. The Center and its community partners will continue to develop the collaborative environment in Hampton Roads by supporting and advancing work where appropriate and where value is added.
Research and Evaluation Accelerator: Working with local, state, university and private organizations including Old Dominion University, Resilience Corporation, Indra IT consulting and Technology Company, Virginia Tech, University of Virginia, and others, the Center will support innovation and guide new resilience building strategies to market.

Norfolk Coastal Adaptation and Community Transformation Plan
Attachment F Benefit Cost Analysis Page II.35
Workforce Development Accelerator: Working with existing local efforts to ensure a workforce capable of filling the needs of a growing water innovation sector, the Center will assist Opportunities Inc., Tidewater Community College, Old Dominion University and other educational institutions to ensure alignment of high quality low-cost training opportunities that quickly move the unemployed and underemployed as well as transitioning veterans into living wage jobs.
Accelerate change through K-12 Educational Opportunities: Convening a partnership of educational institutions who have a history of working with local school districts, programs will educate students about climate change, sea level rise and its impact on the region. Engaging children can be highly effective in reaching their parents as activities will emphasize real life impacts and mitigating actions that allow citizens to thrive in a coastal environment including: hazard identification, the role of the environment in mitigating impacts, the importance of strong social networks in a high-risk environment, and the role of science, mathematics, technology and innovation in creating solutions to system level challenges.
Community College Partners. The Center will focus on building workforce skills and an affordable path to a four-year degree through Virginia’s Community Colleges including Tidewater Community College (TCC) and other interested community colleges throughout Virginia. TCC and others will provide on-site workforce training including Innovation and Entrepreneurialism in collaboration with non-profit and private sector partners and four-year universities. Modeling of the successful TCC Center for Workforce Solutions partnerships, the Center partnership will create customized training and specialized academies in the area of Coastal Resilience.
Community colleges will utilize the Center labs as well as offer courses at the Accelerator in areas related to Coastal Resilience while students pursue Associate Degrees and Professional Certificates in Coastal Resilience creating a low-cost education opportunity in an emerging market as well as access to Virginia’s four-year institutions. TCC and other interested community college faculty based at the Center will collaborate with K-12 programs as well as the universities, creating an accessible bridge between the two for interested students, or a path to a successful career in two years.
University Partners. All Commonwealth universities interested and able to participate will house research faculty at the Center to staff the innovation component of the center, which shall serve as leverage. Founding partners include Old Dominion University, Norfolk State University, Hampton University, University of Virginia, Virginia Tech, and Virginia Institute of Marine Science. As the Center becomes established more Commonwealth universities may participate. Anchor institutions are home to a substantial portion of students with LMI household backgrounds. For example, undergraduate students at both Old Dominion University and Norfolk State meet HUD’s LMI criteria given the rate of Pell grant awardees at each institution which is 32% and 67% respectively. Student success offices at participating universities would ensure that LMI background students with interests in engineering, technology, and other related fields participate in courses, labs, internships, and mentorships at the Center. The affiliated faculty would pursue applied research in designated areas of coastal resilience utilizing innovation labs at the center while teaching and training students. Faculty will have the opportunity to work across institutions with other center faculty as well as with businesses also housed at the Accelerator.

Norfolk Coastal Adaptation and Community Transformation Plan
Attachment F Benefit Cost Analysis Page II.36
Hampton Roads hosts other research institutions, including NASA Langley Research Center and Department of Energy funded Jefferson Labs, which will be key partners in the Center providing mentorship to students and collaborating with faculty and private sector partners to develop technologies with regional impact.
Commercialization. Following the National Institute of Aerospace (NIA) model, the Center will support pre-competitive collaboration within the domain of coastal resilience research. By managing intellectual property generated by partner research institutions, the Center will allow innovators flexibility designed to accelerate the transition of resilience technologies and strategies from design concepts to products and solutions. The Center Director and staff will act as an Innovation Intermediary responsible for engaging startups, VCs, mid-sized companies, and others who would be willing and able to license and commercialize IP packages.
The Innovation Intermediary, with the support of an Advisory Board comprised of partners including University IP staff, will work day-to-day with member institutions to identify IP with commercial potential, facilitate the collection of IP from several partner members into packages of related IP that can be licensed, and work on behalf of members to create and administer IP policies that protect their interests. Further, the staff will focus on regional opportunities, thus building capacity in Hampton Roads.
Much like the Commonwealth Center for Advanced Manufacturing (CCAM), which operates to develop technology with key industry-academic partnerships, Center partners including corporations and academic institutions will pay annual dues serving as a substantial source of annual operating funds. Additional sources of funding for early stage technology development will include the Small Business Innovation Research Program (SBIR) and the Small Business Technology Transfer (STTR) program as well as other similar SBA programs that may arise to facilitate innovation and cooperation between small businesses and research institutions.
Benefits to Vulnerable Populations. Innovation labs occupied by colleges and universities will be required to meet a threshold requirement ensuring LMI student access from across institutions, thus providing training to students while developing new technologies and providing technical expertise and facilities for startups and small companies. Research will be focused on benefit to technologies and methods piloted in LMI communities in the pre-commercial stage. The commercialization process undertaken by the Center also will include pathways for utilization in LMI target areas locally, and through coordinated workforce training. Therefore, targeted LMI communities would benefit from education, innovations, and commercialization, creating economic vitality and reducing flood risk to target communities.
Faculty and staff from Old Dominion University, and other colleges and universities in Hampton Roads and the Commonwealth, will each provide innovation support and training by committing faculty and by involving LMI students in real-world innovation and in the commercialization process for new technologies. Academic projects will, when possible, develop technologies and processes that benefit LMI communities during the commercialization phase.
Figure II.17 identifies the potential location of the new Coastal Resilience Accelerator site with identified future expansion locations.

Norfolk Coastal Adaptation and Community Transformation Plan
Attachment F Benefit Cost Analysis Page II.37
Elizabeth River Shoreline Restoration
As part of the proposed activities in the Newton’s Creek Watershed Transformation Project, the City of Norfolk will construct robust living shorelines (also known as constructed wetlands) along the banks of the Elizabeth River in the Target Area. Figure II.18 identifies the proposed location of the Living Shoreline development in the Newton’s Creek Watershed. Living shorelines are placed parallel to the shore, from upland to river, and create habitat for species, safeguard the shoreline from erosion due to wave energy, soak up stormwater and reduce storm surge, and trap polluted runoff, slowing the flow of nutrients, sediment, and chemical contaminants into rivers, streams, and the Chesapeake Bay. When combined with the shoreline berm, a robust living shoreline can increase durability and effectiveness of the flood protection structure (shoreline berm). For design details, see the Elizabeth River Shoreline Restoration Project section on the following pages.
Summary of Expected Amenities
1,200 linear feet of living shoreline

Norfolk Coastal Adaptation and Community Transformation Plan
Attachment F Benefit Cost Analysis Page II.38
Figure II.17 Newton’s Creek Coastal Resilience Accelerator Potential Locations

Norfolk Coastal Adaptation and Community Transformation Plan
Attachment F Benefit Cost Analysis Page II.39
Figure II.18 Newton’s Creek Watershed Proposed Living Shoreline

Norfolk Coastal Adaptation and Community Transformation Plan
Attachment F Benefit Cost Analysis Page II.40
Elizabeth River Shoreline Restoration

Norfolk Coastal Adaptation and Community Transformation Plan
Attachment F Benefit Cost Analysis Page II.41
Elizabeth River Shoreline Restoration
Shorelines have traditionally been stabilized using hardened structures, such as bulkheads, revetments, and concrete seawalls. These structures ironically can contribute to erosion, and provide little habitat for estuarine species that improve water quality and absorb stormwater. As part of the proposed activities in the Ohio Creek Watershed and Newton’s Creek Watershed, the City of Norfolk proposes to construct robust living shorelines along the bank of the Elizabeth River in the Target Area. Figure II.19 below illustrates some examples of living shorelines.
The living shoreline (sometimes called a constructed wetland) design includes: Riparian, Wetland, and Sill zones. These are placed parallel to the shore, from upland to river. The shoreline will be carefully graded to provide the appropriate slope conditions in each zone, and will account for plant species to migrate with rising sea levels. Riparian area (the most upland zone) will integrate with berm sections and allow for heavy shrubbery and grass to grow. The wetland (the intertidal zone) allows for tidal grasses such as cordgrass (spartina alterniflora) to take root in soils that are inundated during high tide. These grasses cause the accumulation of sediment over time, creating habitat for successive species of high marsh grasses and mollusks. The Sill safe guards the shoreline from erosion due to wave energy.
Wetlands act like a sponge, soaking up stormwater and dampening storm surges. By trapping polluted runoff, wetlands help slow the flow of nutrients, sediment and chemical contaminants into rivers, streams and the Chesapeake Bay.6
Figure II.19 Examples of Living Shorelines with Protective Sills (oyster shell on left, stone on right) Photo Credits: Low Country Open Land Trust (left) Chesapeake Bay Trust (Right)
Normally, a south-facing shoreline without major issues concerning fetch, like the Chesterfield Heights and Harbor Park shore, would not require a protective sill. However, as this shoreline experiences frequent boat wakes from the passing barges in the nearby shipping lane, a marsh toe sill was included in our design.
The wetlands are designed to meet the proposed marsh toe sill at midtide so that the marsh grass and other plants will be sustained. As sea level rises in future years, the midtide elevation will
6 Chesapeake Bay Foundation http://www.chesapeakebay.net/issues/issue/wetlands

Norfolk Coastal Adaptation and Community Transformation Plan
Attachment F Benefit Cost Analysis Page II.42
also rise. The designed wetland that lies below midtide has a greater chance of becoming a mud flat as the marsh grasses retreat upland. The mud flat is still healthy and beneficial to the ecosystem, so the design accommodates for SLR as well as providing continuous benefits to the neighborhoods.
When combined with a shoreline berm, a robust living shoreline can increase the durability and effectiveness of the flood protection structure. The slope of the berm and the elevation of the rock breakwater and vegetation of the shoreline construction can be carefully integrated so that as sea levels rise, the natural vegetation will be able to adapt by moving up the properly graded river bank. This presence of the rock, soil, and vegetation will function to attenuate wave energy and prevent erosion of the shoreline during coastal flooding events. In this way, the combined, multiple layers of defense from the berm and the living shoreline, will afford greater protection in concert than either feature could provide by itself. Several stormwater outfalls coincide with the designed living shorelines. By taking discharge capacity into account, it is necessary to protect this area from stormwater spilling at a higher discharge rate and potentially ruining the integrity of the proposed living shoreline. Integrating stone around the outfall opening will provide outlet protection by reducing the flow rate of stormwater flows. Recycled concrete or existing stone debris on site can be used to reduce cost. The design proposes 2,200 linear feet of living shoreline in the Ohio Creek Watershed, and 1,200 linear feet in Newton’s creek, totaling a full acre of new wetland creation. Figure II.20 displays the proposed areas of the Elizabeth River Living Shoreline installation.

Norfolk Coastal Adaptation and Community Transformation Plan
Attachment F Benefit Cost Analysis Page II.43
Figure II.20 Proposed Elizabeth River Living Shoreline

Norfolk Coastal Adaptation and Community Transformation Plan
Attachment F Benefit Cost Analysis Page II.44
Design Philosophy

Norfolk Coastal Adaptation and Community Transformation Plan
Attachment F Benefit Cost Analysis Page II.45
Design Philosophy Combined Resiliency Actions
The primary goal of the Target Area designs are to develop a system in which both coastal and precipitation events can be mitigated to the highest degree feasible. As such, the measures proposed in each area advises a holistic system of water retention and detention. In preliminary designs, pervious pavement, bio-swales, rain gardens, above ground stormwater storage, wetland expansion, water streets and open park spaces, as well as permeable pavements, will manage stormwater impacts in a collective and collaborative manner while the identified floodwall, berm, pumping systems and roadway elevations will ensure protection from coastal surge impacts. The conceptual designs for both watersheds propose to maximize water-storage volumes in the space available, while integrating these features into the local environment as an amenity rather than a requirement.
Coastal Resiliency and Flood Protection
The proposed design within the Target Area considers a coastal protection system that will incorporate permanent engineered features while also integrating the natural landscape into the design. Because the City of Norfolk relies heavily on the use of its waterfronts by both visitors and residents to stimulate activity in the Target Area, preservation of existing waterfront access and the addition of new pedestrian-friendly riverside features was important in each prevention measure’s design. The demand for visual corridors and anticipated waterfront zoning provided strict guidance in identifying both locations and prevention feature proposals, primarily due to the need to maintain unobstructed views. Although a combination of berms, floodwalls, and road elevations are being proposed, these features will be incorporated into the fabric of the waterfront through landscaped promenades, attractive commercial areas, and integrated park spaces. These proposed project elements will be important in maintaining the community’s visual and physical connectivity to the waterfront, as well as the prevention of damages and loss within the area due to flooding.
Additionally, the overall project design of the Target Area will focus heavily on the integration of bio-retention features and coastal surge water management upgrades into the community. The increased capacity and improvement of multiple stormwater-retention areas and increased wetland habitat areas have been unified into the design of the Ohio Creek Watershed. Because this area has an established infrastructure, the project design will work to integrate many of these new improvements into the existing systems, creating a holistic stormwater-management and treatment system. One of the primary ways the project design is working around the existing street grids is by replacing these pre-existing roads with permeable pavements. This will not only allow for the current infrastructure to remain but also allow for water to infiltrate into the soils rather than sheet flow into other areas of the neighborhood, ultimately providing a higher degree of protection in the area.
Because the scope of the project in the Newton’s Creek Watershed provides a much greater level of flexibility with regard to the installation of new infrastructure and design, the project has indicated that the approach should largely focus on the re-establishment of the historic Newton’s Creek streambed. Flooding is common in this watershed not only because of low elevations near the water but also due to the quick urbanization of the area throughout the 19th and 20th century. Figure II.21 displays a historic map of the original Newton’s Creek streambed compared to a current buildout map with the original creek overlaid on top.

Norfolk Coastal Adaptation and Community Transformation Plan
Attachment F Benefit Cost Analysis Page II.46
The Newton’s Creek Watershed design will include the development of park spaces, natural bioswales, restoring stream areas, developing constructed wetlands and water streets and instituting rain gardens along the streambed to allow for flooding to occur in the area without directly affecting any residents, businesses, or infrastructure. The City of Norfolk will also convert multiple city-owned parcels into water-retention features serving dual purposes (as both a stormwater-collection area and public amenity). The Newton’s Creek Watershed proposal also focuses heavily on the relocation and redevelopment of neighborhoods prone to flooding, as well as readjusting the existing street grid. This portion of the project would not only provide more opportunity to incorporate upgraded stormwater features but also allow the City to begin re-envisioning the area as a whole.
Figure II.21 Target Area Existing Conditions and Historic Streambed
The protection features proposed will be designed to provide protection at the 1% annual chance still water elevation plus 2.5 feet (30 inches) of SLR. This elevation is estimated at +10.1 to +10.6 feet North American Vertical Datum of 1988 (NAVD88). This level of protection is based on two contributing factors—the 1% annual chance surge still water level at a level of elevation between 7.6 and 8.1 feet NAVD88, and an allowance for SLR for the high projection of ranges in 2060.

Norfolk Coastal Adaptation and Community Transformation Plan
Attachment F Benefit Cost Analysis Page II.47
Figure II.22 Sea Level Rise Projections, Norfolk, VA7
Stormwater Flood Protection
As a best management practice, it is also important to consider the implementation of stormwater flood protection measures in the proposed Target Area designs. This is particularly important in the case of the City of Norfolk due to the fact that a major portion of both designs involve the employment of a coastal floodwall and berm system. Typically, in coastal regions, elevations tend to slope downward as they near the water. This means that in areas where there is a high level of impermeable surface, precipitation and stormwater tends to flow towards these lower elevations. If a coastal-protection system is put into place that does not take into account this consideration during a severe enough precipitation event, the measure could be deemed useless as water will begin to build up behind the system and flood nearby structures. To mitigate this risk, both project designs have incorporated a series of pump stations on the landward side of the proposed shoreline protection measures to assist in pumping stored rainwater over the floodwall back into the Elizabeth River.
An additional concern that must be factored into the proposed designs is the backup and overloading of existing stormwater-management systems. In storm events, it is the intent of the City of Norfolk management infrastructure to convey all gathered stormwater through the existing pipes to a number of outfalls directly into the receiving waters, such as the Elizabeth River. During a high tide event, such as a storm surge, water from the river can backflow through the stormwater outfalls into the system, seriously impeding the outflow capacity. This prevention of outflow essentially causes a bathtub effect within low-lying areas where water will continue to
7 Source: Mitchell, M., et. al. (2013). Recurrent Flooding Study for Tidewater Virginia. Gloucester, VA: Virginia Institute of Marine Science.

Norfolk Coastal Adaptation and Community Transformation Plan
Attachment F Benefit Cost Analysis Page II.48
build eventually causing flooding in roadways and possibly structures. Therefore, these outfalls must have a closure mechanism to account for anticipated surge. This consideration has been incorporated into the Ohio Creek Watershed area where this problem has been experienced and documented before.
Additional Benefits
Although there is a heavy focus on each of the project’s resiliency benefits, the additional social, recreational, environmental, and economic benefits cannot be overstated. Within this BCA report, the proposed project designs are evaluated for affordable housing benefits, new employment opportunities, economic revitalization, community connectedness, added value to quality of life, reductions in undesirable factors, historic preservation, and expected health improvements. All of these considerations are integrated into one overarching design philosophy—to make Norfolk a more resilient and sustainable city.

Norfolk Coastal Adaptation and Community Transformation Plan
Attachment F Benefit Cost Analysis Page II.49
Schedule and Cost Estimates
Norfolk Coastal Adaptation and Community Transformation Plan
Attachment F Benefit Cost Analysis Page II.50
Project Schedule
The following schedule for the Norfolk Coastal Adaptation and Community Transformation Plan has been developed based upon the expertise of design and engineering staff who are familiar with construction for projects of this magnitude implemented in the region. The Mid-Town Tunnel / Midtown Tunnel / MLK Extension project located in Norfolk and Portsmouth (currently under implementation with an expected completion date of 2017 and cost of two billion dollars) provided an analog for this schedule with regard to confidence in the rationale and schedule uncertainties.
Within 4 Months of the Notice to Proceed
Norfolk will assemble the project team for kick-off discussions. Conceptual design will be developed with input from communities and stakeholders to ensure full community buy in.
It is assumed that the implementation of the project will result in significant social and environmental impacts and that the preparation of an Environmental Impact Statement (EIS) will be required. It is the intention of the City of Norfolk to lead the preparation of the EIS on behalf of HUD for the portion of the Project in the City of Norfolk. The City has already consulted with the U.S. Army Corps of Engineers, and will seek consultation from the National Oceanographic and Atmospheric Administration-National Marine Fisheries Service, the U.S. Environmental Protection Agency, the Virginia Department of Environmental Quality and Virginia Marine Resources Commission as Cooperating Agencies in the development of the EIS. The City will meet with HUD to confirm this requirement or if an Environmental Assessment (EA) will be sufficient for NEPA documentation.
Months 4-12
A draft EIS (DEIS) will be developed and 30% project design incorporating cooperating agency comments will be completed in support of the DEIS. Upon internal review, notice of availability of DEIS will be published in Federal Register (FR). It is anticipated with this sequence of events, that by the end of 12 months, the comment period on the DEIS would be completed, as well as receipt of other environmental agency comments on 30% design.
Months 12-24
Draft final EIS (FEIS) will be completed and comments will be incorporated into a FEIS. Final design will be performed in accordance with the stipulations and mitigative measures developed during the EIS process. Final design documents will be coordinated with the permitting agencies prior to their implementation.
The city will begin the process of acquiring necessary properties to move forward with initial construction phases and the community will continue to be engaged throughout the life of the project.
The community will be engaged in parcel-level stormwater management. The existing River Star Homes Program will offer incentive for residents to voluntarily install rain gardens, rain barrels, and permeable paving on their lots with technical assistance from the Program.
Phase 1: Months 24-48
Shoreline protection elements will be constructed including roadway modification, flood walls and berms. Living adaptive shorelines with breakwaters and marsh vegetation will be installed

Norfolk Coastal Adaptation and Community Transformation Plan
Attachment F Benefit Cost Analysis Page II.51
along the shoreline. The community of Chesterfield Heights will have improved access to the Elizabeth River. Pump Stations and tidal gates will be constructed; road improvements will also be completed.
In the Public Housing communities of the St. Paul’s Area, residents whose homes are scheduled for demolition will be relocated. Smooth move teams and client services will case manage these households to assure that all relocation options are evaluated. The demolition of 196 units in Tidewater Gardens will take place during this period; grading and shaping of the topography, cultivating surface flow connection from upland to the culvert lower in the watershed will also be performed in restoring Newton’s Creek.
Initial staff for the Coastal Resilience Accelerator will be identified and hired.
Phase 2: Months 48-64
Location of Coastal Resilience Accelerator will be identified.
Completion of pump stations and flood walls, restoration of wildlife habitat continues. Connection will be enhanced between the shoreline communities to the downtown area via water and green spaces in the St. Paul’s Area. A network of marshes will be created between the St. Paul’s Area and Harbor Park in further restoring the historic alignment of Newton’s Creek.
Phase 3: Months 64-72
The improved conditions generated during Phases 1 and 2 will allow for private investment partnerships with the City in realizing the full intentions of the City’s transformation plan as it relates to replacing outdated assisted housing beginning in Tidewater Gardens.
The Harbor Park sea wall and raised promenade will be completed. Open space improvement and stormwater retention features will be built around the new housing to be constructed in Grandy Village in the Ohio Creek Watershed, including swales, permeable paving, and rain gardens.
Property for the Coastal Resiliency Accelerator will be acquired and development of technology and aids for the water management sector will accomplished, advertised, and promoted.
Planned Future Growth
The Coastal Resiliency Accelerator’s further growth is intended to spur the creation of an innovation hub for multiple sectors in leveraging its regional assets of military expertise, local universities and medical schools, and precedent of investment in innovation and technology.
The previously implemented Harbor Park shoreline promenade and additional intended work in the Harbor Park area is intended to catalyze a new mixed-use hub with commercial, office, hotel, and residential uses, creating a new center for employment and creating attractive living space near the city’s core. This area is planned as the second area for development of mixed income housing for those currently in outdated HUD housing. Redevelopment of public housing units in Young Terrace and Calvert Square (further up in the watershed) will be scheduled for implementation in the following phases of the housing strategy.
The City is currently drafting a Request for Quotation (RFQ) for hiring a master developer in early Spring 2016. The master developer will be choosing between two city-owned properties in the St. Paul’s Area for redevelopment. This is anticipated to better position the City for private investment in the Target Area.

Norfolk Coastal Adaptation and Community Transformation Plan
Attachment F Benefit Cost Analysis Page II.52
It is intended that this developer would work with private investors that will be further incentivized by the work herein proposed to build in the target areas in alignment with the desired future outcomes of Norfolk.
Capital Cost Estimates
A more detailed list of probable costs for these proposed projects can be found in Appendix F-3 of the BCA report, however a simplified version is offered in Table II.1 below.
Table II.1 Opinion of Probable Capital Costs for the Norfolk Coastal Adaptation and Community Transformation Plan
Group/Item Subtotal Group Total
Ohio Creek Watershed - Chesterfield Heights and Grandy Village
Flood Walls and Living Shoreline $7,101,600Road Raise $35,172,000Stormwater Management $26,624,000Landscape Elements $5,510,656Other Project Requirements $7,177,500
Ohio Creek Watershed Cost of Work Subtotal $81,590,000
10% Construction Risk Allowance $8,159,000
25% Design and Support Cost $22,437,250
Administrative Costs $3,365,000
Ohio Creek Watershed Cost of Work Sub Total (HUD ask) $115,545,000
Grandy Village Leverage $15,050,000
Ohio Creek Watershed Cost of Work Total $130,595,000
Newton's Creek Watershed - South Brambleton, Harbor Park & St. Paul's Area
Flood Walls and Living Shore Line
$47,838,000 South Brambleton $4,224,000
Harbor Park $42,540,000
St. Paul's Area $1,074,000 Road Raise and Retrofit
$6,068,760 South Brambleton $4,668,000
Harbor Park $1,020,000
St. Paul's Area $380,760 Stormwater Management $33,839,400

Norfolk Coastal Adaptation and Community Transformation Plan
Attachment F Benefit Cost Analysis Page II.53
Group/Item Subtotal Group Total
South Brambleton $23,214,400
Harbor Park $600,000
St. Paul's Area $10,025,000 Landscape Elements
$17,091,984 South Brambleton $410,420
Harbor Park $6,355,206
St. Paul's Area $10,326,358 Demolition & Gray Infrastructure
$18,040,000 South Brambleton $0
Harbor Park $0
St. Paul's Area $18,040,000 Other Project Requirements
$13,422,500 South Brambleton $3,270,000
Harbor Park $1,052,500
St. Paul's Area $9,100,000
Newton's Creek Watershed Cost of Work Subtotal $136,301,000
10% Construction Risk Allowance $13,630,000
25% Design and Support Costs $37,480,000
Administrative Costs $5,622,000
Newton’s Creek Watershed Cost of Work Sub Total (HUD ask) $193,032,000
Coastal Resiliency Accelerator Leverage Activity Costs $7,000,000
Newton’s Creek Watershed Cost of Work Total $200,032,000
Total Cost of Work $330,627,000
O&M Total Annual Cost (See O&M
Spreadsheet) $1,398,950
Project Cycle End Year 2065

Norfolk Coastal Adaptation and Community Transformation Plan
Attachment F Benefit Cost Analysis Page II.54
Operation and Maintenance Costs
Primary operations and maintenance (O&M) costs for Norfolk’s Coastal Adaptation and Community Transformation Plan include those that are related to flood walls and living shorelines, stormwater management, roadway retrofits, and landscaping elements. The opinion of probable cost for the entire project is approximately $1,398,950 annually over the useful life of the project; this cost is in 2015 dollars. This full and necessary amount is anticipated to begin one year upon completion of construction, assuming a one-year warranty period. The majority of the O&M costs are derived from maintenance of the pumps and gates.
Expected O&M for each neighborhood in the Target Area is listed below: Ohio Creek Watershed $730,000 annual Newton’s Creek Watershed $668,950 annual
o South Brambleton $387,290 annual o Harbor Park $148,180 annual o St. Paul’s Area $133,480 annual
For major assumptions and other factors that affect Norfolk’s Coastal Adaptation and Community Transformation Plan O&M costs, see Appendix F-4.
Flood Walls, Berms, and Living Shoreline
Flood walls, berms and living shorelines are proposed in the Target Areas of both watersheds. Primary resources required to maintain these coastal protection activities include inspections and repairs; inspections are expected to be necessary on a bi-annual basis, in addition to pre and post-flood events. Inspections include monitoring the flood walls, berms and living shorelines for change that may indicate a protection reduction for the shoreline.
Walls will be inspected for cracks. Berms will be inspected for adherence to the designed width and slope, in addition to non-advisable growth of trees or shrubs. The living shorelines will be monitored for erosion, scour and invasive plants. It is expected that staff needs for annual inspections in three neighborhoods (Chesterfield Heights, South Brambleton, and Harbor Park) will include the below hourly estimates; estimates listed are those required for each of the three neighborhoods.
1 High Level Staff: 4 hours annual at $110/hour 1 Mid Level Staff: 24 hours annual at $80/hour 2 Low Level Staff: 100 hours combined annual at $40/hour each
In addition to staff needs, inspections of flood walls, berms and the living shorelines will also require supplies such as fuel for site visits, measuring equipment, and record keeping supplies, expected to cost $1,500 annually (combined for all three neighborhoods.)
Repair costs for the Chesterfield Heights, South Brambleton, and Harbor Park neighborhoods include landscape maintenance and repairs. Mowing will be conducted bi-weekly in the summer months and monthly during the winter season. Such maintenance will require 2 low level staff 30 days per year at $40/hour each. Maintenance/ repair supplies are expected to cost $5,000 annually for each neighborhood, which include travel costs, mower costs, and miscellaneous repair materials such as concrete, paint, and other landscaping supplies.

Norfolk Coastal Adaptation and Community Transformation Plan
Attachment F Benefit Cost Analysis Page II.55
Inspection and repair costs for the St. Paul’s Area are estimated to be half the price of the three neighborhoods listed above. Therefore, inspections will require 2 annual hours of high level staff, 12 annual hours of mid level staff, 50 annual hours of low level staff, and supplies are expected to cost $250 annually.
Repairs for St. Paul’s Area are expected to be even lower than those listed above, requiring 2 low level staff 60 hours per year and $1,000 in annual supplies.
The Harbor Park sea wall is expected to require different inspection and repair requirements than other flood wall considerations. The American Society of Civil Engineers recommends that sea walls are inspected every 5-6 years, but due to the magnitude of the project, 3 years was selected as the inspection frequency. Specialized staff required for sea wall inspections include:
1 High Level/Qualified Marine Structural Engineer: 24 hours annual at $225/hour 1 Mid Level Marine Structural Engineer: 40 hours annual at $110/hour 2 Low Level Marine Structural Engineering Staff: 160 hours combined annual at
$80/hour.
Annual seawall repairs and maintenance requirements include 2 mid level staff for 160 hours annually at $80/hour each. Supplies are expected to cost $35,000 per year for concrete, paint, parts, and landscaping.
Stormwater Management
Target Area stormwater management activities include permeable pavement and bio-retention areas, pumps and tide gates, and water streets. Permeable pavement and bio-retention activities are proposed only for the Chesterfield Heights neighborhood. Pump stations are proposed in Chesterfield Heights and South Brambleton, while tide gates are proposed for both watersheds. The water streets are proposed for Harbor Park and St. Paul’s Area.
Permeable pavement and bio-retention activities are proposed to be integrated into street and sidewalk retrofits in the Chesterfield Heights neighborhood. O&M requirements for such activities include replacement of permeable pavement, inspections, and repairs. It is expected that the permeable pavement must be replaced every 20 years and will require $31,000 annual allocation of funds for each anticipated life-cycle replacement, including materials and labor. Permeable pavement will require semi-annual cleaning with a vacuum sweeper and clearing of inlets that drain to the subsurface bed; inspections must be conducted annually for rutting and reveling, which will be patched with porous asphalt. Cleaning, inspections, and repair of permeable pavements in Chesterfield Heights is expected to require the following annual staff and supply needs:
High Level Staff: 10 hours annually at $110/hour 1 Mid Level Staff: 24 hours annually at $80/hour 2 Low Level Staff: 200 hours combined annually at $40/hour each Porous asphalt for patching: $1,000 annually
Inspections of bio-retention areas will be conducted one day every month, with one week of maintenance required after major rainfall events (160 hours annually for $40/hour). Maintenance requirements for bio-retention areas include jet vacuum and filter bags every 5 years and annual costs for brooms, shovels, and ice picks (estimated together at $1,000/year.)

Norfolk Coastal Adaptation and Community Transformation Plan
Attachment F Benefit Cost Analysis Page II.56
The stormwater system improvements are expected to require full-time maintenance personnel in addition to bi-annual gate inspections, annual training, and cleaning of box culverts. 20-year replacement costs are assumed conservatively under conditions of full utilization. Reduced utilization would prolong the lifespan of the pumps, in which case this allocated money would be spent for maintenance due to lack of use of the pumps and corrosive issues related to salt brackish water, which can be extremely detrimental to the pump impellers.
Annual electrical operations costs for the pump stations were estimated based on 1% of the capital costs, for annual operational costs of $38,500 in Chesterfield Heights and $28,000 in South Brambleton. It is assumed that the costs for personnel and inspections will be shared between the four neighborhoods; 60% of costs will be necessary for Chesterfield Heights, 20% for South Brambleton, 10% for Harbor Park, and 10% for the St. Paul’s Area.
Maintenance for water streets are expected to require 2 low level staff at $40/hour each, in addition to supplies. St. Paul’s Area will require 240 hours and $3,000 annually. Roadway Retrofits
The bridge reconstruction that will take place along the Kimball Terrace in Chesterfield Heights is assumed to match the approach/design of the bridge currently in place, which is a conventional 42-foot wide two lane concrete and steel bridge that accommodates both sidewalks and bike lanes. The annual cost of bridge O&M ($14,000 annually) includes inspections, which require the following staff and supplies:
Low Level Staff: 40 hours at $120.00/hour High Level Staff: 20 hours at $160/hour Mid Level Staff: 40 hours at $100/hour Inspection and Repair Supplies: $2,000
Landscaping Elements
Annual landscaping maintenance for open space properties will be required throughout the Target Area, including new parks, sports fields, wetlands, naturalized upland areas, and rain gardens. It is expected that one person will be able to maintain a half acre of landscaped area in one day. Rain gardens will require additional maintenance in the first few years of planting; it is expected that mulch will need to be applied twice annually until groundcover is established. Furthermore, rain gardens will require annual inspections for debris, weeds and invasive plants, as well as sediment control and soil testing will be required every 3 years. After establishment of vegetated areas in the Target Area, mowing and trimming will be required twice per year at a minimum. More frequently in grass covered areas. It is anticipated that one person can maintain 1,000 square feet of rain gardens per day, and that mulch and tools will cost $0.50 per square foot annually. Low level staff rate required for landscaping was assumed to be $40/hour.

Norfolk Coastal Adaptation and Community Transformation Plan
Attachment F Benefit Cost Analysis Page II.57
Project Feasibility

Norfolk Coastal Adaptation and Community Transformation Plan
Attachment F Benefit Cost Analysis Page II.58
Project Feasibility
The activities proposed here are achievable and will be effective at meeting the goals established in the Phase 1 application. While there are many innovative concepts in the proposed holistic approach of integrating coastal and stormwater flooding, the individual components are standard practice. The methods for estimating storm surge risk and for computing stormwater volumes have been well validated in the engineering community and result in dependable design of berm heights and pumping volumes. The construction of the berms and pump stations are straightforward, and the sites are accessible by traditional construction equipment. The terraforming and landscaping of the green spaces and bioswales are likewise standard practice. One challenge will be the variable depth of groundwater within the Target Area, which will impact the excavation depth and storage capacity of the green spaces. Fortunately, the strategy of the plan provides ample flexibility to adjust the areal extent and depths of the individual storage areas. The proposed retrofits of green water collection, pervious pavement, and sub-grade water storage in the Ohio Creek Watershed have been implemented previously and have been demonstrated to work. The City of Norfolk has an extensive GIS database, which will be used to locate all subsurface utilities for coordination and avoidance during construction.
During construction, there will be challenges from working in heavily congested areas and in areas with space constraints (such as under I-264), but these can be handled with careful planning, coordination, and attention to safety. The cost estimates have carefully considered all of the direct project costs and have included allowance for existing construction risk to account for uncertainties at this design phase, such as unknown sub-surface soil conditions. It is expected that the project can be implemented for the estimated costs. Several regions require conversion of land use from typical residential lots into water storage sites and, fortunately, the City already owns most of the desired sites.
Furthermore, success of the project is helped by the continual public involvement and stakeholder engagement that Norfolk and others have pursued over a number of years. In the St. Paul’s Area, there have been multiple community meetings and a renovation plan has already been published and been well received by the neighborhood. According to City officials, many residents are excited for the project to begin. In the Chesterfield Heights neighborhood, a coalition of university students has previously explored the concept of parcel-scale stormwater detention with the community. There is acceptance and interest by the community in participating in these resiliency activities. Additionally, continuous efforts from organizations like the NRHA have spurred interest in the redevelopment and renovation in the Target Areas. Thus, the proposed activities are feasible and viable for the requested sums with community support and in the absence of unidentified technical roadblocks.
Finally, the City of Norfolk has investigated potential delays or infeasibilities due to permitting constraints by meeting with a representative of the Norfolk District, U.S. Army Corps of Engineers on October 13, 2015 as part of a pre-application meeting. The purpose of the meeting was to provide the Corps with an overview of the proposed flood control project for which funding under the National Disaster Resiliency Competition (NDRC) Program is being requested. A review of the currently proposed concepts planned by the City, the design principals integrated into the project concepts to minimize impacts to wetlands and waters of the U.S. (WOUS) and the type of permits required and timeframe for securing them were discussed. The NEPA process was also discussed as it relates to the acquisition of wetlands and water quality permits including opportunities to utilize the “Combined NEPA/404 Process.” The Corps

Norfolk Coastal Adaptation and Community Transformation Plan
Attachment F Benefit Cost Analysis Page II.59
supported the design principles for avoidance and minimization of impacts discussed in the meeting and indicated that, based on the briefing presented in the meeting, it did not see any “red flags” associated with the project. The Corps representative did emphasize that it is important to coordinate with all involved agencies regarding compensatory mitigation, as well as with all key stakeholders including the Elizabeth River Project.
Depending on the scope of the project, the Corps indicated the project may require an Individual Permit which could likely be obtained within 8-12 months. However, if the Corps and other key federal agencies (USFWS, NMFS and EPA) were made “cooperating agencies” during the NEPA process, the wetlands and water quality permits could be issued upon the completion of Record of Decision (ROD) if an EIS were developed. This would significantly reduce federal permit acquisition time, although a Joint Permit Application would still need to be filed for securing State (Virginia Marine Resources Commission and Virginia Department of Environmental Quality) permits for impacts within their jurisdiction. From the meeting on this date, there do not appear to be significant environmental obstacles to securing all necessary permits to execute the project.
Replicability
The project is replicable throughout the city as the Ohio Creek Watershed and Newton’s Creek Watershed provide representative conditions for the rest of the city to implement improvement plans (See Figure III.6 & III.7, Part III for land typologies represented). Furthermore, the project elements reflect the direction of intended work to revitalize the city over the next half century.
While the project provides a framework for replicability across the city as a whole, the project is proposed, in part, to replicate other successful projects previously completed or in progress. An example of this replicability in action is the Grandy Village Phase VI project, currently in progress in the Ohio Creek Watershed (See page II.14). This project is demonstrative of Norfolk’s long-term objective of replacing existing aging affordable housing with safe, resilient, well-built units.
Project Risks to Implementation
Despite careful planning and the support of an optimistic community, there are several risks that may impede progress on implementing the proposed activities. First, there may be permitting obstacles that may become clear during further design and during the NEPA process. Possible permitting impediments may involve construction of the living shoreline on the river bottom, concerns about the tide gates impacting tidal flushing, riparian impacts of the coastal berm, and water quality in the bioswales and urbane green spaces. There may also be significant time that will need to be dedicated to environmental impact studies. However, the pre-application permitting meeting with the USACE has minimized this risk to presently allowable extent.
Second, there may be complications from uncooperative property owners adjacent to the proposed activities. For instance, it may be difficult to coordinate construction activities with Norfolk-Southern or with Dominion Electric power, both of whom are important stakeholders and whose permission will be required to implement the coastal berm. Additionally, the City plans to acquire some private property, which may be imperiled if the City encounters an unwilling seller.
Finally, there is uncertainty regarding the subsurface soil conditions along the Elizabeth River. This may have an impact on the penetration depth of piles for the shoreline berm.

Norfolk Coastal Adaptation and Community Transformation Plan
Attachment F Benefit Cost Analysis Page II.60
Project Metrics

Norfolk Coastal Adaptation and Community Transformation Plan
Attachment F Benefit Cost Analysis Page II.61
Norfolk Project Metrics
Norfolk intends to track project progress and benefits using metrics relevant to the resiliency, economic, environmental, and social health of the community. These metrics were developed with broad coordination across city departments and partner entities and are based on stakeholder feedback throughout the planning process. It was important to all stakeholders that metrics that would certainly be tracked be included and assignments have been made for the tracking of all metrics below. This is evidenced by the establishment of baselines for tracking. City departments involved in the development and tracking of metrics include planning (and the floodplain manager), economic development, public works/ stormwater, emergency management, housing, and the new resiliency office.
Norfolk Resiliency Metric 1
Measure the reduction in property damage, displacement, and loss of service impacts after the threshold level flood disaster in Norfolk. Use a “Losses Avoided Study” to determine reduction in flood losses compared to losses expected to occur in a similar event.
Baseline: Expected losses based on expected flood depth before mitigation.
Change expected: Dollar value of flood damages avoided, including relocation of businesses and residents.
Method of measurement: Loss Avoidance Study.
Tracking period: Post project completion, post threshold event (at least studied 10-year coastal event plus sea level rise).
Norfolk Resiliency Metric 2
Measure the reduction in street flooding, loss of accessibility, loss of transportation services during nuisance flooding and major storm events.
Baseline: See table below for typical current flooding under nuisance and major flood event scenarios.
Change expected: Reduction in number of road centerline miles, track miles, route miles that are flooded.
Method of measurement: Modeling.
Tracking period: Per event that meets scenario parameters.

Norfolk Coastal Adaptation and Community Transformation Plan
Attachment F Benefit Cost Analysis Page II.62
Table II.2 Opinion of Probable Capital Costs for the Norfolk Coastal Adaptation and Community Transformation Plan
NDRC BASELINE INUNDATION
Inundated Transportation
Units
Phase 1 Area Phase 2 Area Total
Nuisance Event*
Major Event**
Nuisance Event *
Major Event**
Nuisance Event*
Major Event**
Streets Miles 0.1 10.1 0 1.7 0.1 11.8
Light Rail Miles 0 1.1 0 0 0 1.1
Bus Routes Miles 0 7.5 0 5.6 0 13.1
Bus Stops Count 0 13 0 3 0 16
* Nuisance event is tidal elevation +3’ ** Major event is the 1% annual chance flood event
Norfolk Resiliency Metric 3
Measure stormwater runoff reduction measures taken through the City’s On-site Parcel Retention Program by documenting an increase in the number of participating River Star and Bay Star homes.
Baseline: There are 65 homes in the program as of October 2015 (20 Bay Star Homes and 45 River Star homes).
Change expected: 20% increase
Tracking period: annually.
Method of measurement: Number of homes certified in the program.
Norfolk Resiliency Metric 4
Measure the change in number of people affected by coastal flooding in the Target Area.
Baseline: Population in structures that flood in the Target Area in 2015 equals 4,333.
Change expected: All 4,333 people escape flooding from the 1% annual chance flood event.
Method of measurement: Total population of Target Area divided by total square feet (SF) of structures in the Target Area gives a percentage of people per SF. Applied this percentage to total SF of structures that flood in the 1% annual chance coastal flood event to identify population experiencing risk reduction.
Tracking period: Project useful life.

Norfolk Coastal Adaptation and Community Transformation Plan
Attachment F Benefit Cost Analysis Page II.63
Norfolk Environmental Metric 1
Measure an increase in the land area of wetland and/or shoreline restoration projects.
Baseline: Currently, there are 14.73 acres of wetlands and 1,216.54 linear feet of detached marshes in the Target Area.
Change expected: Project will add approxmately 70 acres of constructed wetlands; 3,400 linear feet of protected coastal wetlands. The project will also add 51,600SF (1.18 acres) of rain gardens, 2.9 acres of sports fields for retention, 11.5 acres of Waterfront Parks, 11.7 acres of Manicured Parks, 10.8 acres of waterfront promenade, and 5 acres of water street park.
Method of measurement: The City’s annual flyover photos and VIMS inventory comparisons will quantify area of additional wetlands and shoreline restoration.
Tracking period: annual.
Norfolk Environmental Metric 2
Measure a reduction in Total Maximum Daily Loads (TMDLs) pollutant loads from the Target Area.
Baseline: The numbers below are from 2009 imagery, the City’s baseline for TMDL calculations: Nitrogen Pollutant Load- 6,885 lbs/yr, Required Reduction- 557 lbs/yr; Phosphorous Pollutant Load- 1,040 lbs/yr, Required Reduction- 123 lbs/yr; Sediment Pollutant Load- 380,774 lbs/yr, Required Reduction- 72,438 lbs/yr.
Change expected: Nitrogen Pollutant Reduction – 2,502.98 lbs/yr; Phosphorous Pollutant Reduction – 159.80 lbs/yr; Sediment Pollutant Reduction – 204,032.9 lbs/yr
Method of measurement: GIS data, loading of the Bay TMDL pollutants, based on impervious and turf cover. In the Target Area, there are approximately 314 acres of managed turf and 495 acres of impervious cover. Loads from forest, water, and wetlands are not required nor included.
Tracking period: annually
Norfolk Environmental Metric 3
Measure an increase in the number of trees and canopy added to the Target Area Baseline: 3,022 (trees) 35 (canopy).
Change expected: Additional 2,224 trees.
Method of measurement: GIS database (see Table below).
Tracking period: Project completion.
Norfolk Social Value Metric 1
Measure an increase in length of bicycle paths/lanes.
Baseline: Target Area contains 1.1 miles.
Change expected: Project includes approx. 8.6 miles of new bike/ pedestrian trails.

Norfolk Coastal Adaptation and Community Transformation Plan
Attachment F Benefit Cost Analysis Page II.64
Method of measurement: GIS modeling.
Tracking period: every 5 years.
Norfolk Social Value Metric 2
Measure reduction in social vulnerability over time. The Social Vulnerability Index (SoVI) developed by the University of South Carolina’s Hazards & Vulnerability Research Institute (HVRI) is developed by compiling census block socioeconomic and demographic data to construct an index of social vulnerability to environmental hazards. HVRI explains: “Social vulnerability is represented as the social, economic, demographic, and housing characteristics that influence a community’s ability to respond to, cope with, recover from, and adapt to environmental hazards.”[1] After project completion, Norfolk will demonstrate a reduction in social vulnerability over time by analyzing the SoVI after each new dataset published by the U.S. Census Bureau. Baseline: Using the most recent SoVI for the Target Area (based upon American Community Survey [ACS] 2010 data), the social vulnerability index Census Tract average for the Target Area is determined to be high (2.76.) This index considers 6 components: race and poverty, wealth, age, rural/class, ethnicity and small renter households.
Change expected: A reduction over time in the SoVI number by at least 1.0 points; it is expected that the proposed project will ultimately lower vulnerability to flood threat especially for LMI and other vulnerable populations in the target area.
Method of measurement: Publication of the SoVI after each issuance of US Census/ACS data release.
Tracking period: Approximately every 3- 5 years.
Norfolk Social Value Metric 3
Measure the improvement of walkability for the areas impacted by the project. The walkability of a neighborhood offers proven health benefits for its residents and fosters community activities. “Walk Score” provides walkability scores worldwide to quantify walkability down to the parcel level.
Baseline: The Chesterfield Heights neighborhood, which includes Chesterfield Heights and Grandy Village, has a baseline walk score of 17, placing it as 73 out of 74 Norfolk neighborhoods assessed by Walk Score. The Brambleton neighborhood, which includes South Brambleton and minor extents of the project are adjacent to Tidewater drive, has a baseline walk score of 52. The Tidewater-Young Park neighborhood, which includes the Harbor Park area and project proposed areas of St. Paul’s has a walk score of 74.
Change expected: Increased walkability in all three neighborhoods-- Chesterfield Heights, Brambleton, and Tidewater-Young Park to a score of 40, 60, and 77, respectively.
Method of measurement: Information available at the neighborhood level by Walk Score was used to measure the baseline of the project areas. As of September 28, 2015 the walk scores were obtained from WalkScore.com.
[1] Hazards & Vulnerability Research Institute, FAQ, http://artsandsciences.sc.edu/geog/hvri/faq. 9-25-15

Norfolk Coastal Adaptation and Community Transformation Plan
Attachment F Benefit Cost Analysis Page II.65
Tracking period: Upon completion of the project and updating of the Walk Score system (within one year of project completion).
Norfolk Economic Value Metric 1
Measure the increase in employment opportunities in the Target Areas over time after project completion.
Baseline: Currently there are 3,086 jobs located in the Target Area.
Change expected: Incremental increase over time of number of jobs in Target Area.
Method of measurement: Count number of jobs added in Target Area by using data from the American Community Survey.
Tracking period: Every three years or as often as the US Census makes the ACS data available.
Norfolk Economic Value Metric 2
Measure number of replacement public households in the target area.
Baseline: 928 units of aged, poor quality affordable housing in Tidewater Gardens and Calvert Square.
Change expected: Replace all 928 aged, poor quality housing with 928 new housing units constructed to higher resilience standards through a combination of onsite (Tidewater Gardens and Calvert Square) and off-site development and increase the number of affordable units throughout Norfolk by an additional 1825 units through a combination of private sector, non-profit, and NHRA funding.
Method of measurement: Records maintained by the Norfolk Housing Redevelopment Authority.
Tracking period: Ten years.

Norfolk Coastal Adaptation and Community Transformation Plan
Attachment F Benefit Cost Analysis Page II.66
Publicly Funded Resiliency Actions Post-Irene

Norfolk Coastal Adaptation and Community Transformation Plan
Attachment F Benefit Cost Analysis Page II.67
Publicly Funded Resiliency Actions Post-Irene
Hurricane Irene spurred a renewed interest in SLR in Norfolk, and City leadership responded with increased involvement in state and regional opportunities to assess and incorporate SLR into planning growth and resiliency actions. Norfolk also invested or committed to the following post-Irene resiliency actions, either through grants or City revenues, totaling over $34 million.
1. Development and implementation of the 2015 Dutch Dialogues: Through their Dutch connection (see Exhibit G narrative), the City spent time and travel costs over a period of several years to bring about the June 2015 Dutch Dialogues event, which was a regional, state, and international multi-day design workshop to create innovative resilience solutions to regional flooding issues. Toward this effort, the City spent approximately $100,000 in in-kind, logistics, and staff time expenses. If the City were to pay for time and travel expenses of all Dutch experts who came for free, it would be an additional $250,000, as estimated by the Dutch Embassy. This consensus became the basis for the Phase 1 NDRC projects and application.
2. In 2013, the Mayor’s Commission on Poverty Reduction was charged with examining the causes and impacts of poverty in Norfolk, and with developing a plan to reduce poverty for future generations. Recommendations to reduce and de-concentrate poverty carry an implementation cost of $3.9 million; some of the actions include addressing flooding in poor neighborhoods.
3. In 2014, Norfolk was selected as one of the first 33 cities to participate in the Rockefeller Foundation’s “100 Resilient Cities” program, which allowed the City to hire its first Chief Resiliency Officer and to pursue a portfolio of resiliency measures in programs, projects, and policies. The 100 Resilient Cities program committed to a $1 million grant over two years in support of this effort. The City committed an additional $187,866 over the same period.
4. The City of Norfolk has set aside $1.3 million in the Affordable Housing Trust Fund to help improve low-income housing within the area. Additionally, the Center for Community Change stated in their Housing Trust Fund Progress Report that according to their survey, an average of $6.50 is contributed in leverage for every $1 committed by the Affordable Housing Trust Fund. Although this may be the case, for the purposes of this analysis, the project team only applied the $1.3 million set aside.
5. Funding for the National Fish and Wildlife Foundation Sandy Grant for the development of a Green Infrastructure Plan and Network for the Lafayette River Watershed (project budget of $4.64 million) was accepted by the City Council in August 2015. The City approved the use of $257,343 in City funding as project match.
6. Norfolk is presently conducting a review of all City codes to analyze deficiencies and find areas for strengthening construction and zoning against flooding hazards. They are rewriting the zoning code ordinance, which will be guided by a resilience framework being developed in cooperation with 100 Resilient Cities, the American Planning Association, the Urban Land Institute, and others for SLR adaptation. The estimated cost of this effort is $564,715; this work is expected to be completed in 2017.
7. The USACE will be constructing a 2015/2016 Beach Nourishment Project; initial cost is estimated at $18.4 million. The City’s initial cost share will be $5.5 million. Estimated
Norfolk Coastal Adaptation and Community Transformation Plan
Attachment F Benefit Cost Analysis Page II.68
nine-year period re-nourishment costs are $7.5 million, with the City’s matching share (29%) of $2.2 million. The main purpose of this project is to reduce coastal storm damage by extending the berm of the beach for wave attenuation during storms. City funding is approved; project start date is 2016.
8. New funds aimed at economic and community revitalization: the City’s approved FY 2016 budget embraces the creation of several unique programs that will be entirely capitalized with Community Development Block Grant (CDBG) funds and other federal resources. The investment in these programs in FY 2016 will be a total of $2 million for revitalization and reinvestment of catalytic redevelopment sites and neighborhood commercial districts, assistance to small businesses and women minority-owned businesses. This also includes the Norfolk Innovation fund – focused on providing financing for firms in the fields of technology, sustainability and resiliency, healthcare, entrepreneurship.
9. Norfolk has created a citywide flooding reserve account funded by Storm Water Fees that was increased in 2013 by an additional $1.00. Each fiscal year this reserve account brings in approximately $1,315,200 for neighborhood flood reduction, stormwater-quality improvement, stormwater facilities improvement, and maintenance of waterfront structures (such as bulkheads).
For the fiscal years post-Irene (FY 2013, FY 2014, FY 2015, and FY 2016), the City has allocated a total of $14,000,000 as follows:
Neighborhood flood reduction $5,800,000 Stormwater quality improvement $3,800,000 Stormwater facilities improvement $2,400,000 Stormwater waterfront structures $2,000,000
Projects included in these activities are listed in the Appendices of the BCA report.

Norfolk Coastal Adaptation and Community Transformation Plan
Attachment F Benefit Cost Analysis Page III.1
PART III
EXISTING
CONDITIONS

Norfolk Coastal Adaptation and Community Transformation Plan
Attachment F Benefit Cost Analysis Page III.2
Existing Conditions
Norfolk is the historic, urban, financial, and cultural core of the Hampton Roads metropolitan
area, named for the large natural harbor of the same name located at the mouth of Chesapeake
Bay. The city is partially bordered to the south and west by the Elizabeth River and to the north
by the Chesapeake Bay. It also shares land borders with the independent cities of Chesapeake
and Portsmouth to the south and Virginia Beach to the east.
The Target Area of this NDRC Application includes two watersheds to the east of Downtown
Norfolk—the Newton’s Creek Watershed and Ohio Creek Watershed—with particular emphasis
on the waterfront neighborhoods of Harbor Park, South Brambleton, Chesterfield Heights, and
the St. Paul’s Area, as shown in Figure III.1 and Figure III.2 below.
Figure III.1 Target Area Watersheds
Figure III.2 Target Area Neighborhoods

Norfolk Coastal Adaptation and Community Transformation Plan
Attachment F Benefit Cost Analysis Page III.3
Vulnerable Populations

Norfolk Coastal Adaptation and Community Transformation Plan
Attachment F Benefit Cost Analysis Page III.4
Vulnerable Populations
Certain populations are particularly vulnerable during disasters due to social, economic, and
educational factors that can exacerbate disaster recovery and resilience. The statistics presented
below were derived from two primary resources: the United States Department of Urban and
Housing Development’s (HUD) analysis of Low and Moderate Income Summary Data (LMISD)
and the US Census Bureau American Community Survey (ACS) data. Because the most recent
HUD LMISD data relies on ACS 2006-2010 figures, analysts only used this data for low to
moderate income (LMI) population percentage determination. All other figures were developed
from the most recent 2009-2013 ACS data to provide the most up-to-date analysis.
Social Vulnerability
In the Mayor’s 2014 “Plan to Reduce Poverty,” the following statistics are cited for the City:
“Norfolk’s poverty level has historically been nearly double Virginia’s overall average. The U.S.
Census Bureau reported that from 2008–2012, 18.2% of individuals (27.7% of children) in Norfolk
experienced poverty, versus 11.1% of individuals (14.6% of children) across the state as a whole.
Compared to neighboring Hampton Roads localities, Norfolk has a high poverty rate. While
poverty is a significant problem across the region, it is especially concentrated in the City of
Norfolk.” (Page 8)
“In Norfolk, poverty and race are linked, with high levels of poverty among minorities. A given
Norfolk resident experiencing poverty is most likely to be black: 58% of the city’s 40,000
individuals living in poverty are black, constituting 24% of all blacks living in Norfolk. Although
they constitute a much smaller percentage of Norfolk’s population, other minority groups—such
as Native Americans—experience disproportionately high poverty rates.” (Page 10)
Racial and ethnic minorities comprise an estimated 96% of the population in Newton’s Creek
Watershed and 91% in Ohio Creek Watershed project areas.1
1 United States Census Bureau. American Community Survey 5 Year Estimates.

Norfolk Coastal Adaptation and Community Transformation Plan
Attachment F Benefit Cost Analysis Page III.5
Seniors and young children are
especially vulnerable during
disasters, as they may depend on
family care and may be more
susceptible to the stress of
disasters. In the Target Area, 12%
of the population in the Ohio
Creek Watershed is over the age
of 65 and 12% is under the age of
5; 7% of the population in the
Newton’s Creek Watershed is
over the age of 65 and 13% is
under the age of 5.
Dependent populations generally
require dedicated assistance from
caretakers or emergency
personnel during and after
disasters. Some people may
physically lack the ability to
evacuate themselves. Hearing or
visually impaired persons or those
with cognitive issues may not be
able to respond to evacuation and
emergency instructions in a timely manner. Those with mental challenges can become
overwhelmed and experience lasting impacts from the disruption of daily routine, changes in
transportation options, and costs associated with recovery.
Economic Vulnerability
An estimated 86% of the Target Area population is considered LMI.
HUD defines a family of four earning $56,700 or less as low
income in the Virginia Beach-Norfolk-Newport News Metropolitan
area.2 The median household income is $22,306 in Newton’s Creek
Watershed and $28,556 in Ohio Creek Watershed project areas.3
Low-income households face increased challenges in post-disaster
situations, as they have fewer financial resources to recover after
disasters. Furthermore, these households have fewer options for
transportation and accommodation during or after disasters, and are
less able to recover from lost income if they are unable to travel to
work or their workplace is also impacted.
Analysts used the U.S. Census Bureau-based Longitudinal
Employer-Household Dynamics (LEHD) Origin-Destination
Employment Statistics (LODES) dataset to estimate the number of
2 HUD User. http://www.huduser.gov/portal/datasets/il/il2015/2015summary.odn 3 Ibid.
Figure III.3 Poverty by Census Tract in Norfolk
Norfolk Plan to Reduce Poverty Poverty Rate for Individuals by
Census Tract

Norfolk Coastal Adaptation and Community Transformation Plan
Attachment F Benefit Cost Analysis Page III.6
jobs currently available in the Target Area, the earnings and demographic data of workers, and
the general location of residences of those workers.
Based on the LODES analysis, 97% of the jobs in the Target Area are held by people living
outside and commuting to the Target Area. Transportation links are critical for this population as
they travel from areas such as Virginia Beach, other areas of Norfolk, Chesapeake, Portsmouth,
Hampton City, Newport News, and Suffolk into the Target Area every day for work.4
32% of the jobs in the Target Area earn less than $1,250 a month
38.4% of the jobs in the Target Area are held by those with a high school degree or less
46.5% of the outflowing jobs make less than $1,250 a month while only 37.4% of the
inflowing jobs make $1,250 or less; of the interior flow, 69% makes less than $1,250 a
month
A majority (58%) of Norfolk’s housing units are renter occupied, and 29% of households are
considered severely rent-burdened, paying greater than 50% of their income towards housing
costs.5 Despite Norfolk’s ongoing efforts to reduce this burden (see Affordable Housing below),
there continues to be an urgent need for affordable housing in the area.
Educational Vulnerability
“Norfolk adults living in poverty, in large part, do not have the education required for most job
openings within the city or the region: only 2.7% of Norfolk citizens with a bachelor’s degree or
higher are unemployed, compared to 9.8% of residents with some college or an associate’s degree,
11.7% of high school graduates, and 17.8% of persons with less than a high school education.” 6
Residents with low English proficiency may also not be able to access up-to-date emergency
communications and may struggle to respond to evacuation measures. Residents with limited
education have more limited job opportunities, typically earn lower incomes, and may have less
access to clear information about hazards and preparedness.
Approximately 10% of the residents in the Target Area have low English proficiency, and 15%
of residents have less than a high school education.7
4 The LODES Data for Norfolk are located here. 5 100 Resilient Cities Norfolk SWOT Analysis, July 2015 6 Mayor’s 2014 “Norfolk Plan to Reduce Poverty,” pp. 14 7 US Census Bureau, American Community Survey 5-year estimates

Norfolk Coastal Adaptation and Community Transformation Plan
Attachment F Benefit Cost Analysis Page III.7
Environmental
Conditions

Norfolk Coastal Adaptation and Community Transformation Plan
Attachment F Benefit Cost Analysis Page III.8
Environmental Conditions
The Hampton Roads region, initially settled more than 400 years ago, is located to the south and
the west of Chesapeake Bay’s mouth in the southeastern corner of Virginia. The southern part of
this region includes the urbanized cities of Portsmouth, Virginia Beach, Chesapeake, and
Norfolk—the urban core of “the Southside.” Norfolk is surrounded by several different water
bodies, including the Elizabeth River, James River and Chesapeake Bay, and their main
tributaries. As the city is low-lying, nearly all of the city is less than 15 feet above sea level.10
The Target Area is comprised of 1.8 square miles, extending eastward of downtown Norfolk, and
is located on the northern shoreline of the Eastern Branch of the Elizabeth River. This area
includes lowlands and coastal formations, as well as areas of wetlands.
Air Quality
The Clean Air Act, which was last amended in 1990, requires the United States Environmental
Protection Agency (USEPA) to set National Ambient Air Quality Standards (NAAQS) for
pollutants considered harmful to public health and the environment. There are two types of
national ambient air quality standards; Primary standards provide public health protection, and
Secondary standards provide protection against decreased visibility and damage to animals,
crops, vegetation, and buildings. USEPA has set National Ambient Air Quality Standards for six
principal pollutants, which are called criteria pollutants.11
Each year, the Virginia Department of Environmental Quality Office of Air Quality Monitoring
releases a report of air quality levels around the state. This report outlines the results of testing
for criteria pollutants. The latest report is from 2013. Norfolk is one of the state’s testing areas
for criteria pollutants, which are particle pollution (PM2.5 and PM10), carbon monoxide, sulfur
dioxide, nitrogen dioxide, ozone, and lead.
PM2.5, PM10, carbon monoxide, sulfur dioxide, and nitrogen dioxide levels in Norfolk were
below Primary and Secondary NAAQS in 2013. Ozone and lead air quality standards for Norfolk
are not given. Nevertheless, for the period from 2011 to 2013, only the counties of Fairfax and
Arlington exceeded the ozone air quality standards in the state. Norfolk is a “Maintenance Area”
for ozone, which means that it had formerly not attained the standard, but is now recognized by
USEPA as meeting the NAAQS. A Maintenance Area must have an approved “maintenance
plan” to meet and maintain air quality standards. Lead levels were below the Primary and
Secondary NAAQS for the four testing sites in Virginia outside Norfolk.12
In early 2015, the General Assembly of Virginia was in talks to join the Regional Greenhouse
Gas Initiative that establishes a regional CO2 electric power sector cap and trade program, as
well as the Commonwealth Resilience Fund—a revolving fund to serve as a consistent revenue
stream to assist counties, cities, and towns in the Hampton Roads region with the implementation
of efforts to combat SLR and recurrent flooding. The bill also provides economic development
assistance for families, businesses, and localities in Southwest Virginia to offset negative
economic impacts associated with reduced fossil fuel production.13 The bill will be considered in
10 Briefing Book Tidewater District Norfolk. pp. 15. 11 United States Environmental Protection Agency. National Ambient Air Quality Standards (NAAQS).
http://www.epa.gov/ttn/naaqs/criteria.html 12 Commonwealth of Virginia Department of Environmental Quality. Virginia Ambien Air Monitoring 2013 Data Report.
http://www.deq.virginia.gov/Portals/0/DEQ/Air/AirMonitoring/Annual_Report_2013.pdf 13 Virginia’s Legislative Information System. HB 2205 Regional Greenhouse Gas Initiative; Commonwealth Resilience Fund
established. http://lis.virginia.gov/cgi-bin/legp604.exe?151+sum+HB2205

Norfolk Coastal Adaptation and Community Transformation Plan
Attachment F Benefit Cost Analysis Page III.9
the next session. On January 27, 2015, Norfolk passed Resolution No. 1609 supporting this
legislation, requesting that the Commonwealth participate in the Regional Greenhouse Gas
Initiative for the protection of coastal flooding, due to an increase in recurrent flooding in the
city.
Water Quality
Norfolk’s Department of Utilities is the second largest waterworks in the Commonwealth of
Virginia. As a regional water purveyor, Norfolk provides top-quality drinking water to 850,000
customers in Norfolk, Virginia Beach, parts of Chesapeake, and to the U.S. Navy. In addition to
water, the Department of Utilities also provides wastewater-collection service to approximately
240,000 residents in Norfolk.14
The City of Norfolk obtains its raw (untreated) water from eight reservoirs, two rivers, and four
deep wells. From these sources, raw water is pumped to one of the Department of Utilities’ two
water-treatment plants, where it is filtered and disinfected. The City meets or exceeds USEPA
standards for all regulated substances, and is well below the national level for secondary and
unregulated but monitored substances, according to its 2015 Water Quality Report.
From the Dutch Dialogues Briefing Book (Page 22):
“Norfolk’s existing municipal separate storm sewer system (MS4) is managed by the Norfolk
Public Works Stormwater Division. This system consists of 349 miles of pipe, 137 miles of ditches,
13 storm water ponds, and 10 storm water pump stations. The newest portions of the system have
been sized to accommodate a 10-year storm event while portions constructed before the 1950s
have capacity for a 2-year storm. Extra capacity is needed to handle the additional backwater
flows caused by storm surges or high tide, which may occur concurrently. This could be
accomplished by either increasing the capacities of most of the storm drain piping or by a number
of retention strategies throughout the City.
Although much of the storm drain system design was intended to accommodate 2-year (50%
annual probability of occurrence) or 10-year (10% annual probability of occurrence events)
design events, those systems were designed for tail water elevations as had been measured at the
Sewells Point tide gauge. As part of the Fugro Atlantic flooding studies, tide gauges were installed
in many of the principle drainages within the City. The gauge measurements indicate that with the
exception of the drainages on the northern perimeter of the city that empty into Chesapeake Bay,
the water level elevations in the watersheds are higher than those measured at Sewells Point.
While the differences between those water level elevations and the water level elevation at Sewells
Point depend on many factors, in general the water level elevations in the drainages throughout
most of Norfolk are 0.5-ft +/-0.2 ft above the water levels at Sewells Point.
While those differences are small, the landscape is flat. The lack of gradient implies that the small
difference in tailwater elevation increases the annual % probability of occurrence of a specific
water level within the drainages. A 0.5-ft difference (above that measured at Sewells Point)
approximately doubles the annual probability of occurrence. Thus a system intended to serve a 2-
year flood event (50% annual probability of occurrence) is in reality capable of serving a 1-year
design event (100% annual probability of occurrence). Similarly, a system intended to serve a 10-
14 On 9-21-15: http://www.norfolk.gov/utilities/

Norfolk Coastal Adaptation and Community Transformation Plan
Attachment F Benefit Cost Analysis Page III.10
year flood event (10% annual probability of occurrence) is in reality capable of serving a 5-year
design event (20% annual probability of occurrence). While Norfolk has made significant
investments to expand and improve its storm water infrastructure, the age and size of the systems,
coupled with limited available funding resources, has created a significant backlog of high priority
storm water projects.”
Wastewater-treatment plants for the City’s effluent are operated by the Hampton Roads
Sanitation District, although the wastewater system is maintained by the City’s Division of
Wastewater, Department of Utilities.
Brownfields and Contaminated Sites
As a strategic harbor, Norfolk has a legacy of industrial contamination that reflects its long
history of naval operations, shipbuilding, and maritime trade. Environmental toxins are linked to
numerous environmental and health risks. According to the USEPA, contaminated sediments are
a significant environmental problem, impairing the use of many water bodies and contributing to
the over 3,200 fish consumption advisories that have been issued nationwide. Volatile chemicals
in buried wastes and/or contaminated groundwater can emit vapors that may migrate through
subsurface solids and into air spaces of overlying buildings. Volatile organic compounds
(VOCs)—such as those used in paints, solvents, disinfectants, and stored fuels—can cause
cancer in animals; some are suspected or known to cause cancer in humans.15
According to the Virginia Department of Environmental Quality, there are 880 registered
petroleum-storage tanks and 1,100 registered petroleum releases (64 of them open) in Norfolk.16
There are five sites in the City that have completed the (Brownfield) Voluntary Remediation
Program and six that are planned sites for the program as of June 2015.17 There are two
superfund sites on the USEPA’s National Priorities List (NPL) located within Norfolk. The NPL
is the list of national priorities among the known releases or threatened releases of hazardous
substances, pollutants, or contaminants throughout the United States. No superfund sites are
located in the Target Area, although sites of concern have been identified by the USEPA,
including the Sewells Point Naval Complex and the Naval Amphibious Base Little Creek.
The Norfolk Naval Base – Sewells Point Naval Complex site had contamination of concern in
groundwater, sediment, soil, subsurface soil, surface soil, and surface water. Some of the
contaminants of concern include base neutral acids, dioxins/dibenzofurans, inorganics, metals,
polycyclic aromatic hydrocarbons, polychlorinated biphenyls (PCBs), pesticides, and VOCs. In
2010, physical construction of the remedies was completed. The site has not undergone post-
construction; therefore, full remediation has not been achieved at the site.18
The second site is the Naval Amphibious Base Little Creek, located in the Tidewater region of
Virginia, near the mouth of the Chesapeake Bay. Wastes that have been generated and disposed
at the Little Creek facility include pesticides, paints, solvents, inorganics, heavy metals, PCBs,
mixed municipal wastes, nickel plating baths, chromic acid, silver cyanide, copper cyanide,
15 EPA Chemicals and Toxics Resources: http://www2.epa.gov/learn-issues/chemicals-and-toxics-resources 16http://www.deq.virginia.gov/Programs/LandProtectionRevitalization/PetroleumProgram/FilesForms.aspx#petdbf 17http://www.deq.virginia.gov/Programs/LandProtectionRevitalization/RemediationProgram/VoluntaryRemediationProgram/Pu
blicInformation.aspx 18 http://cumulis.epa.gov/supercpad/cursites/csitinfo.cfm?id=0302858

Norfolk Coastal Adaptation and Community Transformation Plan
Attachment F Benefit Cost Analysis Page III.11
lacquer, lacquer stripper, per-chloro-ethylene sludge, soap, dyes, and degreasers. The most
updated information from the USEPA is from 2012 and states that the site is still under
cleanup.19
Chemical-Storage Facilities
There are no chemical-storage facilities located in the Target Area.
Environmentally Sensitive Areas
The NOAA Office of Response and Restoration maintains Environmental Sensitivity Index maps
that characterize coastal environments and wildlife based on their sensitivity to spilled oil. These
maps are useful for understanding environmental sensitivity in a coastal region such as Norfolk.
Figure III.4 shows the map as it looks currently for the city. The red lines represent highly
sensitive salt and brackish water marshes in sheltered tidal flats. This type of ecosystem is found
in the Lafayette River and Little Creek, in the northern section of the city.
Marshes are defined as wetlands frequently or continually inundated with water, and
characterized by emergent soft-stemmed vegetation adapted to saturated soil conditions. Tidal
marshes serve many important functions. They provide vital food and habitat for clams, crabs,
and juvenile fish, as well as offering shelter and nesting sites for several species of migratory
waterfowl.20 The tidal marshes in Norfolk serve as habitat for threatened and endangered species,
including the Great egret, Peregrine falcon, Yellow crowned night heron, Green sea turtle,
Kemps Ridley sea turtle, Leatherback sea turtle, Loggerhead sea turtle, and Atlantic sturgeon.21
Tidal marshes also buffer stormy seas,
slow shoreline erosion, and are able to
absorb excess nutrients before they
reach the oceans and estuaries.
Therefore, this sensitive ecosystem is
vital to the control of flooding in
Norfolk.
In conjunction with these proposed
projects, the Elizabeth River Project
organization adopted their “Eastern
Branch Environmental Restoration
Strategy” in November 201422, and is
now gathering resources to implement
the living shoreline restoration along
the river in the Target Area. From its
strategy (Page 4): “The City of Norfolk
and Elizabeth River Project are
exploring the potential for restoring
almost a mile of under-used, degraded,
but highly visible waterfront just east of
downtown at the mouth of the Eastern
19 http://www.epa.gov/reg3hwmd/npl/VA5170022482.htm 20 http://water.epa.gov/type/wetlands/marsh.cfm 21http://geoplatform.maps.arcgis.com/home/webmap/viewer.html?webmap=6c427fb5d07745368ac8a22738659775 22 http://media.wix.com/ugd/8de0fd_2142235a562444d9858ca4e1b5d25a11.pdf on 9-22-15
Figure III.4 Sensitive Environment Areas in Norfolk (Target
Area outlined in orange)

Norfolk Coastal Adaptation and Community Transformation Plan
Attachment F Benefit Cost Analysis Page III.12
Branch, in the vicinity of Harbor Park stadium. This site has the potential to jump-start interest in
the larger restoration of the Eastern Branch and demonstrate many aspects of this plan, from
public outreach to habitat restoration and water quality improvements.”
Land Use
Since Jamestown was settled in 1607, the region developed an economy that is based on its ties
to the water. The natural shelter provided by protected harbors with deep water access has
attracted commercial shipping activities, as well as national military activity.23
The downtown has a broad range of higher intensity uses; traditional character is present
throughout the Target Area with a grid street pattern, smaller lots, and variety of uses within
close proximity to one another.24
Before the Civil War, the area was home to scattered farms and plantations. Post-Civil War, the
city expanded into the Harbor Park, South Brambleton, and St. Paul’s Area. Expansion into
Chesterfield Heights began in 1904 when the community was platted and the first development
began in 1914.25 Prior to man-made alteration, the shoreline consisted of numerous creeks and
tributaries of the Eastern Branch, as well as wetlands. Harbor Park during the early history of the
city was low-lying wetlands with a large tributary of the Elizabeth River running north towards
Tidewater Drive,26 and development in the St. Paul’s Area was built on former creek beds. Many
of the tributaries and creeks were filled over the past 150 years with debris from fires and storms
that devastated the city or to eradicate mosquitos following outbreaks of yellow fever in the
1850s. Now, 10 to 12% of the city is composed of filled lands,27 and the former creeks and
wetlands are the lowest-lying areas of the city today and have the most severe flooding. The
predominant land uses in the Target Area are residential, industrial, and commercial, as shown in
Figure III.5 below.
The St. Paul’s Area is bounded by the Norfolk Southern Railroad on the north, Tidewater Drive
on the east, I-264 on the south, and Monticello Avenue on the west. Most of the area was
originally drainage and tributaries of the former Newton’s Creek. By the 1920s, all of the
tributaries, creeks, and wetlands within the St. Paul’s Area had been filled. The area has had
many uses over the history or Norfolk, and since the 1950s, the area has mostly been low-income
housing, warehouses, commercial development, and vacant land.
Harbor Park is bounded by I-264 on the north and west, Norfolk Southern Rail Road on the east,
and the waterfront on the south. The entire area used to belong to Newton’s Creek before 1900
when most of these former water areas were filled in. The area flourished as the city’s location
for rail terminal and yards, warehousing, and other high intensity development, but such uses
declined in the mid-twentieth century, coincident with the construction of I-264 in the 1950s and
1960s, which further isolated the waterfront. In recent years, the Harbor Park baseball stadium
and light rail station have been built here.
South Brambleton is bordered by the Elizabeth River to the south, Norfolk Southern Railroad on
the west, and Route 168 (East Brambleton / Campostella) on the north and east. Currently, the
23 Briefing Book Tidewater District. Page 8. 24 PlaNorfolk. pp. 46. 25 Briefing Book Tidewater District. 26 Briefing Book Tidewater District. pp. 35. 27 Briefing Book Tidewater District Norfolk. pp. 16.
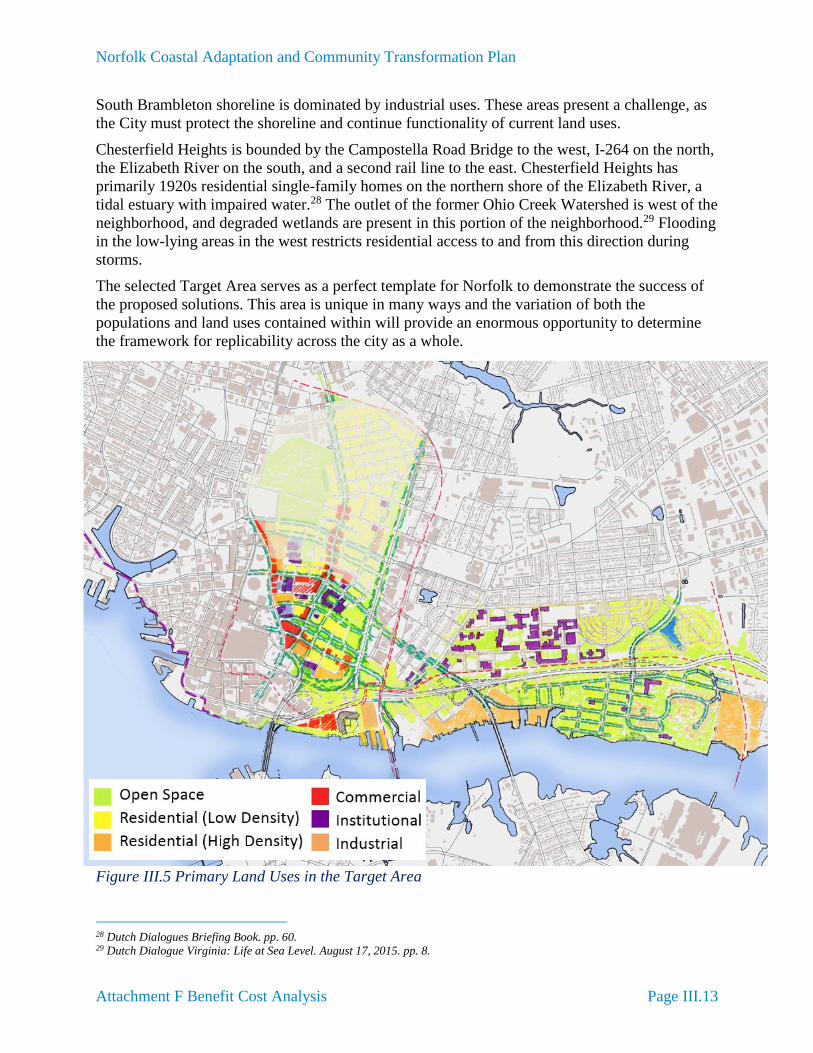
Norfolk Coastal Adaptation and Community Transformation Plan
Attachment F Benefit Cost Analysis Page III.13
South Brambleton shoreline is dominated by industrial uses. These areas present a challenge, as
the City must protect the shoreline and continue functionality of current land uses.
Chesterfield Heights is bounded by the Campostella Road Bridge to the west, I-264 on the north,
the Elizabeth River on the south, and a second rail line to the east. Chesterfield Heights has
primarily 1920s residential single-family homes on the northern shore of the Elizabeth River, a
tidal estuary with impaired water.28 The outlet of the former Ohio Creek Watershed is west of the
neighborhood, and degraded wetlands are present in this portion of the neighborhood.29 Flooding
in the low-lying areas in the west restricts residential access to and from this direction during
storms.
The selected Target Area serves as a perfect template for Norfolk to demonstrate the success of
the proposed solutions. This area is unique in many ways and the variation of both the
populations and land uses contained within will provide an enormous opportunity to determine
the framework for replicability across the city as a whole.
Figure III.5 Primary Land Uses in the Target Area
28 Dutch Dialogues Briefing Book. pp. 60. 29 Dutch Dialogue Virginia: Life at Sea Level. August 17, 2015. pp. 8.

Norfolk Coastal Adaptation and Community Transformation Plan
Attachment F Benefit Cost Analysis Page III.14
Figure III.6 Coastal Land Uses in the Target Area

Norfolk Coastal Adaptation and Community Transformation Plan
Attachment F Benefit Cost Analysis Page III.15
Figure III.7 Example Land Uses in the Target Area

Norfolk Coastal Adaptation and Community Transformation Plan
Attachment F Benefit Cost Analysis Page III.16
Public, Cultural, and
Natural Resources

Norfolk Coastal Adaptation and Community Transformation Plan
Attachment F Benefit Cost Analysis Page III.17
Cultural Resources and Critical Assets
The character of Norfolk is exemplified in its vibrant downtown, which is home to roadways
lined with historic commercial and industrial buildings, the Attucks Theatre, numerous historic
and culturally significant churches, and the local historic district of East Freemason.30 In fact, the
neighborhoods surrounding downtown Norfolk include four of the City’s five historic districts.31
The Chesterfield Heights neighborhood was added to the National Historic Register in 2003, and
has 404 buildings contributing to its status as a National Historic District. The protection of
historical and cultural resources from the force of nature will ensure a resilient tourism industry
contributing to the resiliency of the overall economy. Figure III.8 on the following page
identifies the landmarks and cultural assets of the Target Area.
Parks
The City of Norfolk Parks system includes 2 festival parks, 3 beach parks, 6 community parks,
12 dog parks, 17 community centers with active park amenities, and 71 neighborhood parks. The
community parks are 10 acres in size or larger, and support larger events and athletic activities.
Park programming draws from a larger geographical area and on-site parking is available.
Neighborhood parks are usually 10 acres or less and provide some type of recreational
component or a green area. Primary park users are from within nearby neighborhoods.32
Harbor Park is the only park located within the Target Area (excluding the Future Expansion
Zone) and is a baseball stadium for the Norfolk Tides, a minor league team. The park is located
along the shore of the Elizabeth River. As noted above, the park is not easily accessible by
walking and is rarely used to full capacity. Figure III.9 indicates parks and recreation centers
both near and within the Target Area.
30 PlaNorfolk 2030. The General Plan of the City of Norfolk. June 2015. pp 11-2 31 Norfolk Baseline Economic Study Report, July 2015 32 http://www.norfolk.gov/rpos/parks.asp

Norfolk Coastal Adaptation and Community Transformation Plan
Attachment F Benefit Cost Analysis Page III.18
Figure III.8 Landmarks and Cultural Assets in the Target Area

Norfolk Coastal Adaptation and Community Transformation Plan
Attachment F Benefit Cost Analysis Page III.19
Figure III.9 Parks and Recreation Centers in the Target Area

Norfolk Coastal Adaptation and Community Transformation Plan
Attachment F Benefit Cost Analysis Page III.20
Transportation
Mass transportation in the city includes the Tide Light Rail system, buses, ferries, and paratransit
services. The Tide Light Rail opened in August 2011 and runs through the Target Area parallel
to I-264, with a stop in Harbor Park and a terminal downtown. The system extends 7.4 miles
from the Eastern Virginia Medical Center complex east through downtown Norfolk to Newtown
Road at the border of Virginia Beach. It is currently served by 11 stations and four park-and-ride
lots. Due to the existing layout of the system, the Tide is extremely vulnerable to flooding, and
service has been halted on several occasions either due to high tides or significant storm events.
Figure III.10 below indicates the current Light Rail infrastructure. The Tide is the only rail
transit in the region and carries more than 120,000 passengers monthly.33 Because many of these
passengers are employed within the area, the system is relied upon as a critical service to get
these passengers to and from their workplaces.
Figure III.10 The Tide Light Rail Route
Government
Figure III.11 identifies the locations of government buildings within the Target Area.34
Figure III.12 illustrates the distribution of emergency services in the same area.
33 Hampton Roads Transit, Ridership trends, July 2015. http://gohrt.com/public-records/Operations-
Documents/Ridership/2015/July-2015-Presentation-Ridership.pdf 34 Regional Background for Norfolk NDRC Grant Application Input

Norfolk Coastal Adaptation and Community Transformation Plan
Attachment F Benefit Cost Analysis Page III.21
Figure III.11 Government Buildings Located within the Target Area

Norfolk Coastal Adaptation and Community Transformation Plan
Attachment F Benefit Cost Analysis Page III.22
Figure III.12 Emergency Services within the Target Area

Norfolk Coastal Adaptation and Community Transformation Plan
Attachment F Benefit Cost Analysis Page III.23
Growth Trends

Norfolk Coastal Adaptation and Community Transformation Plan
Attachment F Benefit Cost Analysis Page III.24
Growth Trends
Economy and Employment
The majority of jobs in Norfolk are in service industry (including healthcare), federal civilian,
and military employment sectors.35 The military, the Port of Virginia, and tourism are the three
main drivers of the Hampton Roads economy. The federal government currently creates about
45% of gross regional product. Naval Station Norfolk, the largest naval complex in the world,
supports the readiness of the United States’ Atlantic fleet. The military provides direct
employment to more than 44,000 people in the City of Norfolk,36 and these jobs pay 30% more
than average wages in the region.37 The U.S. Navy’s large presence anchors a significant
maritime and defense industry cluster, which includes ancillary industries, such as shipbuilding.
The Hampton Roads Planning District Commission (HRPDC) estimates that military contracts in
the region support 55,000 direct and 49,000 indirect and induced jobs.38 The Port of Virginia is
another significant economic asset, handling 11% of East Coast foreign trade by value. The port
drives ancillary industry growth, notably in transportation, shipbuilding, and freight. Many
multi-national maritime companies maintain North American headquarters in Norfolk.39
The challenge of rising water and recurrent flooding in Hampton Roads is made more difficult
by the state of the region’s economic health. Though the 2008 recession did not impact the
Hampton Roads area to the extent that many others experienced, rebounding has been slow and
steady. The reductions in military spending and sequestration have substantially and adversely
affected the local economy. Norfolk has experienced consistent job losses since 2004, losing
22,666 jobs between 2001 and 2014, of which 60% were government jobs.40
PlaNorfolk 2030 looks to drive economic development and create new capabilities, new
companies, and new businesses in clusters including Maritime and Transportation Business,
Technology Business, Retail and Commercial Business, and Finance and Business Services.
“Most of these industries (will) play a major role in Norfolk’s development, especially Maritime
and Transportation, while others, such as Technology Business Cluster, will assist Norfolk in the
future.”41
35 PlaNorfolk 2030. The General Plan of the City of Norfolk. June 2015. pp. 5-2 36 Hampton Roads Planning District Commission, Economic Impact of the Department of Defense in Hampton Roads, 2013, pp.
33 37 Norfolk Baseline Economic Study Report, July 2015, pp. 27 38 Ibid. 39 Ibid, pp. 28 40 Ibid, pp. 38 41 PlaNorfolk 2030. The General Plan of the City of Norfolk. June 2015. pp. 5-2

Norfolk Coastal Adaptation and Community Transformation Plan
Attachment F Benefit Cost Analysis Page III.25
Current Risk Context
Current Risk Context

Norfolk Coastal Adaptation and Community Transformation Plan
Attachment F Benefit Cost Analysis Page III.26
Risk Associated with
Stormwater
Management

Norfolk Coastal Adaptation and Community Transformation Plan
Attachment F Benefit Cost Analysis Page III.27
Stormwater Management Risk
Norfolk experiences frequent flooding due to rain.
Residents are accustomed to annual events that
produce hazards and inconveniences due to road
conditions and other flooding-induced safety issues.
Norfolk is an older colonial city with some original
historical infrastructure dating back to the 1800s.
Infrastructure improvements were most recently
performed in the 1950s due to rapid urbanization.
That upgraded infrastructure is currently
approaching the end of its serviceable life and is due
for upgrades. Early stormwater system designs did
not consider future development or tidal impacts.
The existing municipal stormwater system is
separate from the sewer system and is managed by
the Norfolk Public Works Stormwater Division. The
portions of the system designed before the 1950s
was sized to accommodate a 2-year storm; the
newer portions were designed to accommodate a 10-year storm event. Stormwater in Harbor
Park is managed by an underground collection and conveyance pipe network that discharges
stormwater directly into the Elizabeth River or to a series of concrete-lined ditch systems under
the elevated section of I-264. The concrete-lined ditches discharge to a waterway near the
Norfolk Southern railroad tracks.
No part of the system was designed to handle the additional backwater flows caused by storm
surges or high tide, which may occur concurrently.42 Figure III.14 demonstrates current normal
flows in the Newton’s Creek Watershed and the flooding issues that can occur at high tide when
flows are blocked.
42 Briefing Book Tidewater District. pp. 22.
Figure III.13 July 2015 Rain-driven
flooding on E. Brambleton Avenue in
Newton’s Creek Area in proximity to
assisted housing communities of Calvert
Square and Tidewater Gardens

Norfolk Coastal Adaptation and Community Transformation Plan
Attachment F Benefit Cost Analysis Page III.28
Figure III.14 Schematic Comparison of Stormwater Flows and Potential Flooding in the St.
Paul’s Area and Harbor Park during Regular and High Tide Scenarios
With recent increases in flooding incidents, projected SLR, the continuation of land subsidence
due to fill settlement, elevation below 15 feet, undersized underground stormwater systems, and
the prevalence of impervious surfaces, the flooding situation is only expected to worsen in the
future.

Norfolk Coastal Adaptation and Community Transformation Plan
Attachment F Benefit Cost Analysis Page III.29
Coastal Flood Risk

Norfolk Coastal Adaptation and Community Transformation Plan
Attachment F Benefit Cost Analysis Page III.30
Coastal Flood Risk
With about 144 miles of shoreline and being
almost completely surrounded by bodies of
water (including bays, rivers, and tidal creeks),
Norfolk is at greater risk for coastal flooding
than other parts of Virginia.43 The Hampton
Roads metropolitan region, and the Target Area
in particular, are at risk of inundation from
coastal storms, a risk that is being exacerbated
by SLR. The Hampton Roads area of the
Virginia coast is experiencing SLR at nearly
twice the global average due to local land
subsidence, glacial rebound, and ocean
circulation dynamics.44 Intermediate projections
from the USACE and NOAA are at around 2.5
feet for the area by 2065 (see Figure III.17).45
Already within the City of Norfolk, the historic
waterfront neighborhood of The Hague (just
northwest of the Target Area) experiences street
flooding during high tide, a phenomenon that
used to occur only during storm surge events.
The area now experiences more than 100 hours
of street flooding per year, as opposed to less
than 50 hours per year between 1930 and 1990.46 The neighborhoods in the Target Area are built
on low-lying coastal land and, in some areas, filled wetlands, and are vulnerable to coastal
flooding from rising sea levels as well as coastal storm surge.
The majority of the St. Paul’s Area (Newton’s Creek Watershed) is within the 100-year
floodplain (AE Zone - Elevation 7.6 feet). The current development in this area was built on the
former creek with the flood risk areas reflecting the old creek bed (see Figure III.15). A large
portion of Tidewater Drive drains to this area, causing existing stormwater systems to back up
and making it unable to handle the load of an abnormal rain event. This causes significant
flooding on Tidewater Drive and within the Tidewater Gardens public housing, with the entrance
to downtown from Tidewater Drive having at least one lane flooded during these events.
Upgrades to the existing stormwater system have been made but are unable to fully address this
problem.47
43 Phase 1 – Attachments-ATT401237-ExhibitDNeed.pdf (pg. 26 of Phase 1 Application) 44 Atkinson et al, Sea level Rise and Flooding Risk in Virginia, Sea Grant Law and Policy Journal, Vol. 5 No. 2. pp. 6, 2013 45 USACE and NOAA curves obtained from http://www.corpsclimate.us/ccaceslcurves.cfm. 46 Atkinson et al, Sea level Rise and Flooding Risk in Virginia, Sea Grant Law and Policy Journal, Vol. 5 No. 2., 2013 47 Saint Paul’s Area Plan, pp. 29
Figure III.15 October 1, 2015 flooding
from rainfall and high tide of 6.5 ft in
Tidewater Gardens community of the St.
Paul’s Area

Norfolk Coastal Adaptation and Community Transformation Plan
Attachment F Benefit Cost Analysis Page III.31
Figure III.17 Target Area 100-Year Flood Inundation with 2.5 feet of SLR
Figure III.16 1736 Norfolk Historic Shoreline and Present
City Buildout
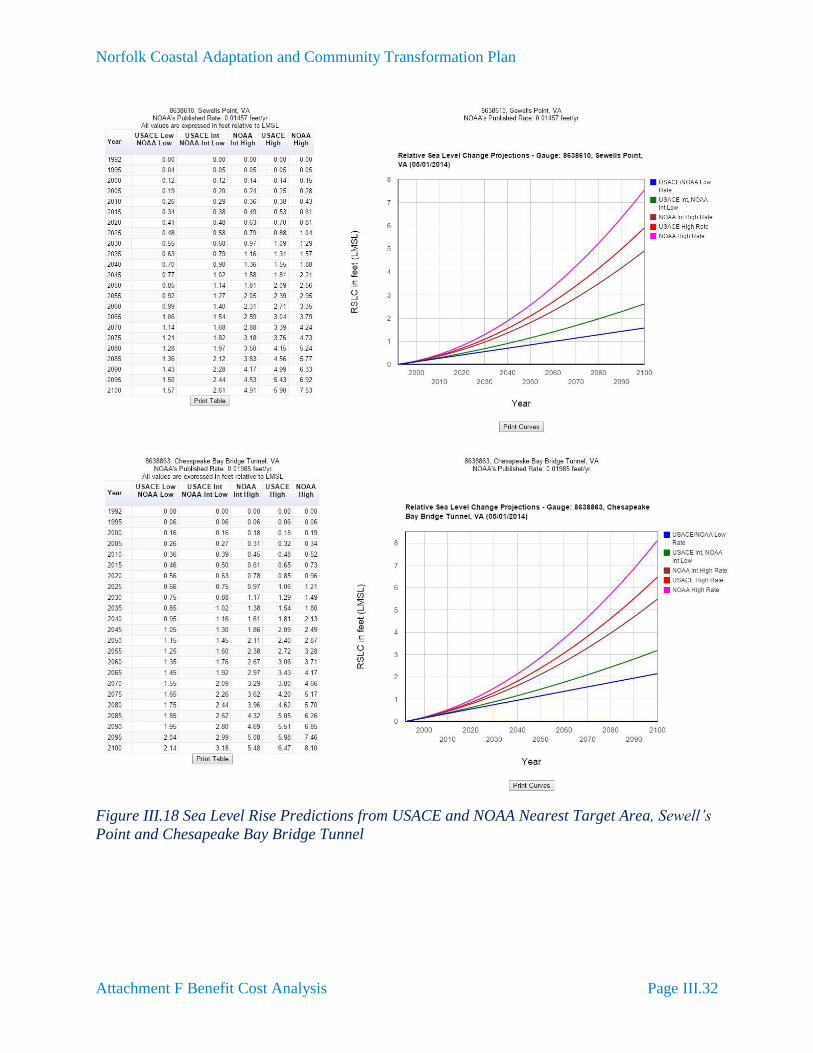
Norfolk Coastal Adaptation and Community Transformation Plan
Attachment F Benefit Cost Analysis Page III.32
Figure III.18 Sea Level Rise Predictions from USACE and NOAA Nearest Target Area, Sewell’s
Point and Chesapeake Bay Bridge Tunnel

Norfolk Coastal Adaptation and Community Transformation Plan
Attachment F Benefit Cost Analysis Page III.33
Lack of
Neighborhood
Connectivity

Norfolk Coastal Adaptation and Community Transformation Plan
Attachment F Benefit Cost Analysis Page III.34
Lack of Neighborhood Connectivity
In addition to flood risk reduction, a key issue to be addressed by the proposed activities is to
improve mobility and connectivity of the targeted waterfront neighborhoods, which have
suffered decades of urban renewal and disinvestment and are physically disconnected from the
surrouding city by highways and vacant land.
Figure III.19 below shows two aerial images of downtown Norfolk (in the background) and the
St. Paul’s Area (in the foreground). The image on the left was taken in 1950, and the image on
the right is from today. The historic Saint Mary’s Church is used as a reference point in both
images. Note particularly the extent of urban clearance that has taken place over time for the
construction of I-264, the Harbor Park stadium and parking areas, and the Tidewater Gardens
public housing development, in the lower right.
Figure III.19 Norfolk Target Area in 1950 and Today (note the images are at different altitudes)
The St. Paul’s Area—including the public housing developments of Tidewater Gardens, Calvert
Square, and Young Terrace—is cut off physically and psychologically from downtown and the
waterfront. Figure III.20 below shows many of the key spatial discontinuities in the Target
Area; areas are separated by highways, with few cross-connections, and there are large amounts
of low-performing open space, mostly parking lots, large grassy areas and vacant land, notably
along the waterfront.

Norfolk Coastal Adaptation and Community Transformation Plan
Attachment F Benefit Cost Analysis Page III.35
Figure III.20 I-264 and the Berkley Bridge near Harbor Park and Tidewater Gardens
Figure III.21 Chesterfield Heights
Similarly, the neighborhood of Chesterfield Heights, in the Ohio Creek Watershed, is cut off
from the rest of Norfolk by I-264.
From the “St. Paul’s Area Plan” published by the City in 2012, we find this description of the
problem in the Newton’s Creek Watershed Target Area (Pages 7-14):

Norfolk Coastal Adaptation and Community Transformation Plan
Attachment F Benefit Cost Analysis Page III.36
“The current character of St. Paul’s is defined by an auto-oriented access pattern created by the
urban renewal efforts in the 1940s, 1950s and 1960s. Those efforts promoted a new development
and access pattern to replace the blighted buildings and network of streets and blocks that had
developed prior to World War II. The new public housing in and around St. Paul’s filled an
important need for affordable family housing after the war, and the widened streets and new
highway connections along and across the Elizabeth River dramatically improved regional access
by car.”
“Today, many of the aspects originally seen as improvements register as major obstacles, making
St. Paul’s isolated and unattractive for new private-sector investment. Issues created by current
development patterns include:
Challenge 1: Current development patterns block St. Paul’s potential community and
economic value.
“Key land uses, including housing, offices and shopping, are separated from each other on large
“superblocks.” This physical isolation of land uses severely limits the interrelationships among
activities that are a uniquely valuable advantage of urban settings. Lack of connection limits
choice among different types of housing, jobs, transportation, retail and other services.
“The superblock layout of Tidewater Gardens undermines its intent as a residential neighborhood.
As in many public housing developments of its day, design of the site and buildings compromises
a sense of address, feelings of safety, and the ability of residents to make use of outdoor spaces.
The front doors of most units face an internal walking path, not a street. These internal paths lack
visibility from traffic and buildings, as well as the critical mass of pedestrians that creates the
perception of safety. Open areas between buildings lack definition between private and shared
areas, and thus generate little sense of ownership or stewardship on the part of residents, which
in turn means these areas get less use and maintenance than they might.
“St. Paul’s auto-oriented development pattern leaves it a generic place with little defining quality,
in the same way that many suburban development locations lack definition. It lacks the uniqueness
and amenities needed to create a more focused market position, key to attracting higher-value
urban commercial and housing demand. Businesses in St. Paul’s tend to lack an inherent
connection to Downtown. Reliance on surface parking. Development with greater economic and
community value would come only with higher densities, mixed-uses, improved walkability and
transit access that together free up current parking lots to be replaced with buildings and parks.”
Challenge 2: Physical separation from the surrounding area creates both real and perceived
barriers
“Broad arterial roads on three sides (St. Paul’s Boulevard, Brambleton Avenue and Tidewater
Drive) and elevated highways on the remaining side (I-264 and Berkley Bridge ramps) physically
isolate St. Paul’s. Tidewater Gardens residents cited this band of high-traffic roads among the top
five most disliked physical characteristics in a 2006 resident survey. The heavy traffic – much of
it funneled toward Interstate and bridge access – and its associated noise, pollution, hazard to
children, and interruption of convenient walking routes— significantly compromises resident
quality of life.
“These same roads surrounding St. Paul’s offer a poor walking environment because they were
designed for vehicles, not people. Crosswalks can be very long where multiple turn lanes occur,

Norfolk Coastal Adaptation and Community Transformation Plan
Attachment F Benefit Cost Analysis Page III.37
and this coupled with short signal durations and heavy traffic makes it hard for even able-bodied
people to cross the street in the time provided.
“The lack of a traditional street grid within and around St. Paul’s is unwelcoming, disorienting,
and provides a poor setting for development. “Superblocks” in St. Paul’s (especially the U.S.
Postal Service distribution facility and portions of Tidewater Gardens) make St. Paul’s difficult to
access… and … there are missing elements in St. Paul’s internal street network. Many streets lack
street trees and sidewalks.
“The poor walking environment, both within and surrounding St. Paul’s, limits pedestrian access
to current and future transit options. Access to transit depends on reasonable walking conditions
between transit stops and destinations – conditions generally not present today. One critically
needed pedestrian improvement connection is between Tidewater Park Elementary School and the
rest of St. Paul’s. The walking path linking the school with Charlotte Street and most of Tidewater
Gardens has poor visibility from streets and buildings, and is susceptible to flooding.”
Challenge 3: Lack of economic diversity
“Income segregation further isolates St. Paul’s. The 618-unit Tidewater Gardens public housing
development is the only housing in St. Paul’s. All residents have incomes at or below 40% of Area
Median Income. Added to the approximately 1,000 public housing units nearby at the Young
Terrace and Calvert Square public housing developments, this marks St. Paul’s as a place of
poverty.”
Other challenges noted within the St. Paul’s Area Plan (similar throughout the entire Target
Area) include:
The physical condition and layout of the Tidewater Gardens public housing community calls
for its replacement. This facility is more than 60 years old and lacks modern-day amenities
and appropriate parking for residents.
Stormwater flooding is a chronic threat to safety and property. The neighborhood suffers
chronic stormwater flooding problems.
Real and perceived crime acts as a deterrent to potential investment. Many residents of
Tidewater Gardens have cited crime as a major issue in the St. Paul’s Area.
There is a lack of neighborhood-serving retail. The predominant retail in the St. Paul’s Area
is fast-food restaurants.
There is a lack of recreation accessible to all segments of the community.
There is a high unemployment rate and lack of job skills in current Tidewater Gardens
residents.
There is a lack of adequate, suitably located parking to serve the needs of the current
development.

Norfolk Coastal Adaptation and Community Transformation Plan
Attachment F Benefit Cost Analysis Page III.38
Affordable Housing
Need

Norfolk Coastal Adaptation and Community Transformation Plan
Attachment F Benefit Cost Analysis Page III.39
Affordable Housing Need
Housing prices in the Hampton Roads region have been growing faster than state and national
averages since approximately 2005, with above-average growth throughout the recession and
recovery. This can be attributed in part to a strong employment base in the military assets in the
region, as well as innovation in the public and private sectors, including health care and local
government.
But the supply of new affordable housing has not kept pace with demand; as of the development
of the 2012-2016 HUD Consolidated Plan, waitlists for public housing totaled more than 1,800
families, while the waitlist for housing assistance vouchers exceeded 8,300.48 Housing
production has shifted towards multi-family, mixed-use, and otherwise higher density housing in
recent decades as noted in the Briefing Book prepared for the City’s 2015 Dutch Dialogues
event: “Between 1992 and 2011, 42.1% of the building permits were for single-family detached
units, far less than current composition of the housing stock (79.2% low density). This shift away
from single-family detached housing illustrates Norfolk’s increasing market strength in the area
of urban living, which is unique in the region and may represent a shift away from the
suburbanization that the region has experienced over the past several decades.”49
Figure III.22 Subsidized Housing in the St. Paul’s Area
The existing housing stock that is affordable is also at risk. PlaNorfolk 2030 notes that,
“Deterioration of older housing is a direct threat to the stability of many of Norfolk’s low income
neighborhoods … exacerbated by absentee landlords and limited financial resources available to
residents for maintenance and repairs.”50 Recurrent flooding also adds to the deterioration of
these aging housing units, as poor ground saturation and intermittent flooding of structures
brings a host of damages—mold, the slow disintegration of foundation components that were not
constructed of flood-resistant materials, and other structural elements that may be compromised
48 100 Resilient Cities Norfolk SWOT Analysis, July 2015, pp. 43 49 Dutch Dialogues Briefing Book, pp. 73. 50 PlaNorfolk 2030, pp. 7-1

Norfolk Coastal Adaptation and Community Transformation Plan
Attachment F Benefit Cost Analysis Page III.40
due to land subsidence or the constant presence of high
water tables from SLR. A six-page report of the
structural and infrastructure deficiencies in the
Tidewater Gardens complex, for example, was
presented by the Norfolk Housing Redevelopment
Authority in 2010, describing additional problems—
such as erosion, severe drainage issues, poor soils, and
accessibility challenges—that are all exacerbated by
the recurrent flooding.51
The St. Paul’s Area in the Target Area is home to three
subsidized housing “super-blocks”—a total of 1,673
public housing units in the developments of Tidewater
Gardens, Young Terrace and Calvert Square. The
vision of the St. Paul’s Area Plan (published in 2012)
was incorporated into PlaNorfolk 2030. As a way of
de-concentrating poverty is this area, the City plans to
create a more economically revitalized neighborhood
by 1) demolishing these aging structures, some of
which are more than 60 years old, in great need of
repair, or updating (for example, they utilize antiquated
heating systems); 2) replacing the housing with a careful blend of mixed-use, mixed-income
development; 3) addressing economic segregation by opening up connections to other areas of
the City including the downtown; and 4) investing in resources for safe, healthy, and rewarding
living, such as updated and green stormwater infrastructure techniques to reduce flooding on the
site and in adjacent areas.
The Expanded St. Paul’s Area / Tidewater Gardens Transformation Plan outlines the City’s goals
to redevelop the Tidewater Gardens public housing complex (within the St. Paul’s Area) in this
manner, and forms a portion of the proposed project.
A share of the Target Area is located in a state enterprise zone, which designates areas eligible
for various state and local incentives, such as grants, tax and fee relief, and free professional
specialists and training support.52
As part of the Norfolk Coastal Adaptation and Community Transformation Plan, the community
proposes to begin taking steps towards realizing the vision developed within the St. Paul’s Area
Plan by focusing on the redevelopment of a large portion of the Tidewater Gardens area. This
initial catalyst project will ultimately help to spur the long-term goal of housing redevelopment
and mixed income neighborhoods in the area.
Tidewater Gardens is within the 100-year floodplain with flood-induced problems that will be
augmented with SLR, encompassing the entire development. The demolition and relocating of
residents in this community is the first planned phase of the City’s housing replacement strategy.
51 Letter dated November 6, 2010 from Vanasse Hangen Brustlin, Inc. to the Norfolk Housing Redevelopment Authority. 52 Dutch Dialogues Briefing Book, pp. 8
Figure III.23 Tidewater Gardens Area
within the Current 100-Year
Floodplain

Norfolk Coastal Adaptation and Community Transformation Plan
Attachment F Benefit Cost Analysis Page III.41
Economic Risk

Norfolk Coastal Adaptation and Community Transformation Plan
Attachment F Benefit Cost Analysis Page III.42
Economic Risk
The Hampton Roads region has a unique interdependency with the military. The region is home
to the largest concentration of U.S. defense facilities in the world, as well as the third-largest
commercial port on the East Coast. Nearly a quarter of the nation’s active-duty military
personnel are stationed in the region, and a third of the U.S. naval ship-building and repair
capacity is housed there. The world’s largest navy base, the Norfolk Naval Station, and its
companion Naval Air Station are located in the northwestern quadrant of Norfolk. The Navy’s
Little Creek Amphibious Base is located on the Chesapeake Bay shoreline between Norfolk and
Virginia Beach. Norfolk also is home to the North Atlantic Treat Organization’s (NATO’s)
Allied Command Transformation, the only NATO headquarters on United States soil. The
Norfolk Naval Shipyard, which pre-dates the Civil War, and the Portsmouth Naval Hospital are
within the City of Portsmouth.53 Figure III.23 below indicates various military and critical
infrastructure institutions in the Hampton Roads region.
The Federal Government currently creates about 45% of gross regional product, mostly in
defense-related spending and supporting activities.54 The 100 Resilient Cities Norfolk Strengths,
Weaknesses, Opportunities, and Threats (SWOT) analysis noted that much of the area’s
economy is derived from sectors (like the military) over which there is no local control, and
which provides little or no property tax revenue. The SWOT identified as potential threats the
undiversified economic base, lack of connections between creative businesses and legacy
industries, as well as untapped potential connecting skilled workers leaving the military with
local businesses and entrepreneurship.55
The recurrence of flooding in the Target Area continues to adversely affect the area. Structures
are aging and deteriorating due to flooding. Because of the consistent business interruptions
(e.g., inaccessible streets, flooded interiors, and even power outages), new commercial interests
have been known to look elsewhere, and the primary type of business remaining in the area is
fast food restaurants. Without the proposed project, the Target Area will continue to experience
the economic stresses of recurrent flooding, and will be less resilient against shocks.
Figure III.24 Critical Economic Risks within the Hampton Roads Region
53 Ibid. 54 Ibid. pp. 10 55 100 Resilient Cities Norfolk SWOT Analysis, pp. 46.

Norfolk Coastal Adaptation and Community Transformation Plan
Attachment F Benefit Cost Analysis Page III.43
Environmental Risk

Norfolk Coastal Adaptation and Community Transformation Plan
Attachment F Benefit Cost Analysis Page III.44
Environmental Risk
The Eastern Branch of the Elizabeth River—which runs parallel to the Target Area and is the
discharge point for both the Ohio Creek Watershed and Newton’s Creek Watershed—has been
called the “lost branch” by the Elizabeth River project due to its low visibility and accessibility
to Hampton Roads residents.56 The “State of the Elizabeth River” scorecard of 2014 gave the
Eastern Branch a score of D, indicating an urgent need to address its environmental quality
issues. The Eastern Branch and its tributaries suffer from high levels of bacteria, low levels of
dissolved oxygen, and high levels of river-bottom contaminants—all important metrics of
estuarine health.57
Figure III.25 Health Scores of the Elizabeth River Branches, 2014. Virginia Dept. of
Environmental Quality (Target Area Watersheds Outlined In orange)
The Elizabeth River has lost 50% of its tidal wetlands since 1945.58 Wetlands act like a sponge,
soaking up stormwater and dampening storm surges. By trapping polluted runoff, wetlands help
slow of the flow of nutrients, sediment, and chemical contaminants into rivers, streams, and the
Chesapeake Bay. Hundreds of species of fish, birds, mammals, and invertebrates depend on
wetlands. However, shoreline development and deterioration, as well as SLR, pose major threats
to these critical habitats. Development along the shoreline blocks the creation of further wetland
habitat and creates excess sediment, and SLR floods wetlands with saltwater, destroying plants
faster than they can migrate to higher ground.59 Urbanized areas contribute significantly to
stormwater runoff; urban runoff is responsible for an estimated 15% of phosphorous, 14% of
nitrogen, and 9% of sediment loads in the Chesapeake Bay.60
56 Eastern Branch Environmental Restoration Strategy, The Elizabeth River Project, November 2014, pp. 7 57 State of the Elizabeth River Scorecard, 2014. Virginia Department of Environmental Quality 58 NOAA Living Shorelines Proposal, the Elizabeth River Project 59 The Chesapeake Bay Program, Wetlands Overview: http://www.chesapeakebay.net/issues/issue/wetlands 60 Storm Water Management and the Chesapeake Bay, 2001. Chesapeake Bay Program: http://www.chesapeakebay.net

Norfolk Coastal Adaptation and Community Transformation Plan
Attachment F Benefit Cost Analysis Page III.45
Recent Hurricane
Impacts

Norfolk Coastal Adaptation and Community Transformation Plan
Attachment F Benefit Cost Analysis Page III.46
Hurricane Irene Damage, 2011
The City of Norfolk was impacted by Hurricane Irene in August 2011, causing significant
damage to public assets, including water/wastewater, public safety, and transporation facilities,
as well as creating large amounts of debris. These impacts were experienced throughout Norfolk,
including the Target Area. According to the National Weather Service (NWS), Hurricane Irene
was upgraded to a Category 1 storm before making landfall with wind gusts of 63 miles per hour
measured at the Norfolk Naval Station. Further, the NWS reported a mean lower low water
(MLLW) measurement of 7.54 feet at Sewell’s Point with the city reporting 7.63 feet at the same
location, meaning that the average height of the lowest tide recorded during landfall of the storm
was 7.63 feet below the peak surge height. Damage experienced throughout Norfolk was related
to high wind and storm surge.
FEMA project worksheets were developed for damaged assets throughout the city amounting to
approximately $3.2 million. A significant portion of these project worksheets resulted from
debris-removal costs followed by emergency protective measures for water and wastewater
utilities, as well as police and fire services. Recovery from Hurricane Irene is ongoing, with
many open Project Worksheets.
As part of this proposal, analysts also modeled the impacts of Irene and associated damages. This
step was necessary to accurately characterize and estimate quantitative impacts as disaster
damages are recovered in a variety of ways, including Public Assistance, Individual Assistance,
and Private Insurers. These damage information sources are not always coordinated to represent
total impact. Costs that were modeled include those associated with damage to buildings,
contents, and inventory, as well as relocation costs, mental stress and lost productivity impacts,
and impacts to the economy. To run the model, analysts used an Irene inundation map provided
by the City of Norfolk and overlaid this information on an inventory of all structures within the
Target Area. The estimated flood depth was calculated at each impacted struture location and
physical damages were estimated using USACE depth damage functions (DDF).
Impacts to individuals that may be quantified include relocation, mental stress, and lost
productivity; these include costs associated with displacement and psychological impacts related
to personal experience with flooding of homes. The model estimates that 4,500 people in the
Target Area were directly affected by Irene’s floodwater, with approximately 1,000 individuals
requiring shelter. This equates to approximately $39 million in costs associated with impacts to
individuals, as well as restoration of structures, contents, and inventory. Economic impacts as a
result of business interruption were also modeled for Hurricane Irene. Impacts to Target Area
businesses were identified and run through economic modeling software to estimate impacts to
economic relationships throughout the Virginia Beach-Norfolk-Newport News MSA. Modeled
economic impacts are expected to have been over $37 million, for total modeled impacts
inflicted by Hurricane Irene over $76 million. Please refer to Direct Physical Damages, Human
Impacts, and Economic Losses Avoided in Part IV. Benefits Included in the Benefit Cost
Ratio for complete methodologies.

Norfolk Coastal Adaptation and Community Transformation Plan
Attachment F Benefit Cost Analysis Page III.47
Table III.1 Hurricane Irene Modeled Loss Results
Estimated Costs Newton’s Creek
Watershed
Ohio Creek
Watershed Total
Building $3,764,724 $1,498,272 $5,262,995
Contents $10,679,459 $1,730,558 $12,410,017
Inventory $1,181,968 $43,610 $1,225,578
Relocation $335,254 $111,887 $447,142
Mental Stress $11,511,627 $670,869 $12,182,496
Lost Productivity $7,068,542 $411,937 $7,480,479
Economic Impacts61 $33,013,497 $4,339,195 $37,352,692
Total $67,555,071 $8,806,328 $76,361,399
Hurricane Joaquin Damage, 2015
Though a lesser storm than Hurricane Irene, the most recent impact to the City of Norfolk came
in early October 2015 as Hurricane Joaquin made its way up the Eastern Seaboard. While exact
damages have not yet been calculated, it is known that significant flooding damages occurred, as
much of the area had already experienced a significant amount of rainfall lasting several days
just before the impacts of the hurricane were felt. According to the NWS, Hurricane Joaquin was
a Category 2 storm as it veered away from the Eastern Seaboard toward Bermuda. Although
wind did not play a significant role in the damages from the storm, heavy rains continued to pour
across the state and within the Target Area. Figure III.26 provides visuals of the impacts of
Hurricane Joaquin within the Target Area.
Hurricane Isabel Damage, 2003
Hurricane Isabel impacted the City of Norfolk in September 2003, resulting in significant debris,
power outages, and other damage from high winds and storm surge. Impacts from this storm
were felt throughout the Hampton Roads area. Storm surge was reported on Fisherman’s Island
in excess of 4 feet. Approximately 200,000 cubic yards of debris were collected by the City of
Norfolk following Hurricane Isabel.
61 Economic impacts are modeled using IMPLAN software, following the methodology provided in the Economic Losses Avoided
section of Part IV. Benefits Included in the Benefit Cost Ratio. Impacts are based on damages to structures in the Target Area,
and economic effects of those damages are modeled throughout the Virginia Beach-Norfolk-Newport News MSA.

Norfolk Coastal Adaptation and Community Transformation Plan
Attachment F Benefit Cost Analysis Page III.48
Figure III.26 Hurricane Joaquin Impacts in the Target Area

Norfolk Coastal Adaptation and Community Transformation Plan
Attachment F Benefit Cost Analysis Page III.49
Risks of Inaction

Norfolk Coastal Adaptation and Community Transformation Plan
Attachment F Benefit Cost Analysis Page III.50
Risks of Inaction
Population in Norfolk, Virginia is projected to increase steadily over the next three decades.62
Based on the risks identified above, it is likely that this increase will not be experienced within
the Target Area.
The narrative below indicates the potential impact on the Target Area if the proposed projects are
not implemented. Three scenarios are detailed at the 5-, 20-, and 50-year scale. Table III.2
displays the potential monetary impact for each scenario if the projects are not implemented.
These values account for direct physical damages to structures, relocation costs, casualties,
mental stress and anxiety costs, lost productivity, critical facility loss of service, and economic
loss.
It is important to note that inherent benefits derived from the development of the Target Area
projects such as environmental benefits and recreational benefits are not included in these
figures. The proposed projects within the Target Area not only ensure the costs in Table III.2 are
saved andare able to be invested into the community in other ways, but also offer a multitude of
secondary and tertiary benefits. For example, the addition of a park may help to increase area
property values, but may also increase the health of the localpopulation who use the park for
recreation. Other benefits can include a decrease in carbon emissions, a reduction in stormwater
treatment costs, and a reduction in impervious surfaces. Without the installation of the proposed
projects in the Target Area, these benefits will not be realized and the populations in the area will
continue to be disadvantaged. Part IV provides in-depth methodologies of how these benefits
were determined for the project’s useful life, and how the BCR was developed.
Table III.2 Costs of Non-Implementation by Watershed at the 5-, 20-, and 50-Year Scenario
Scenario Newton’s Creek
Watershed
Ohio Creek
Watershed Total
5-Year $60,227,543 $9,918,822 $70,146,365
20-Year $155,614,810 $25,628,069 $181,242,879
50-Year $202,718,296 $33,385,501 $236,103,797
5-Year Scenario
Even within the 5-year scenario, without action the residents in the Target Area would be subject
to increased difficulties in adapting to and recovering from future disasters. The Target Area
suffers from increasing vulnerability to flooding, which has been progressively more disruptive
to regional transportation connectivity and undermines commercial and military activities.
Moreover, area structures continue to age, deteriorating both from flooding and from extended
use beyond the structure’s intended life. Low-income housing facilities have been identified as
particularly susceptible. In recent years, there has been an increased unwillingness to invest in a
62 Weldon Cooper Center for Public Service, University of Virginia, Total Population Projections for Virginia and its Localities,
2020-2040. http://www.coopercenter.org/sites/default/files/node/13/Locality%20Projected%20Total%20Population,%202020-
2040_0.pdf

Norfolk Coastal Adaptation and Community Transformation Plan
Attachment F Benefit Cost Analysis Page III.51
region that floods with growing frequency; without this investment, the region will continue to
worsen and become even more vulnerable.
Because of consistent business interruptions (e.g., inaccessible streets, flooded interiors, and
even power outages), new commercial interests are looking elsewhere. If present conditions
persist without action, it is likely that economic disinvestment would begin to take place in the
unprotected Target Area.
Additionally, without project implementation, vulnerable populations will remain disconnected
from other areas of the city and continue to be limited in their opportunities to both live and work
in the Hampton Roads Region. The proposed projects also identify the need for a catalyst to
better and safer options for living and working arrangements that directly benefit LMI
populations. Without the proposed projects in both watersheds, these residents will continue to
experience an unfair and unequal disadvantage.
20-Year Scenario
As the population in Norfolk and specifically the Target Area continues to grow, so will the need
for new homes, roads, and economic development; without careful consideration and planning
focused on mitigating risks, future development may increase flood risk and further jeopardize
the safety of residents. Without innovative coastal and stormwater solutions, Norfolk’s
increasing population may result in expanded impervious areas with consequential augmented
damages from flooding events.
Research and modeling indicated that Hurricane Irene reached a 17-year recurrence interval. We
can assume that within a 20-year period, a similar storm may impact the Target Area and the
entire city, resulting in similar or worse (due to increased population) damages. Furthermore, the
frequency and magnitude of coastal surge inundation in the Target Area is anticipated to increase
in the future as sea levels rise. This would put residents at greater risk to the impacts of future
disasters including damage to almost all properties in the Target Area. If action is not taken,
residents in the Target Area will suffer the cycle of disasetr and recovery time and time again.
Not only will vulnerable populations be subject to more difficult conditions, but they may
become weaker against future shocks and stresses under current and anticipated climate changes.
The proposed alternative can transform this area into a resilient community that recovers quickly
and becomes stronger after each disaster-- the resilience dividend.
As mentioned above, economic impacts would begin to be felt even within the 5-year timeframe
and would only be exacerbated when extended out to the 20-year scenario. Without the proposed
projects, the Target Area will continue to experience the economic stresses of recurrent flooding,
and will be less resilient against shocks. Local economic development will be greatly hampered,
commercial and military investment will wane, and any interest by outside investors will fade, if
not entirely dissipate. Blight will increase throughout the region as investment pulls out and low-
income populations continue to exist in an urban resource desert.
Additional impacts of inaction may include continued degradation of low-income
neighborhoods, a sustained lack of connectivity options, persistent decay of pre-existing
stormwater management infrastructure ultimately leading to more frequent flooding, and an
increase in the total LMI populations in both watersheds as a result of declining property values.

Norfolk Coastal Adaptation and Community Transformation Plan
Attachment F Benefit Cost Analysis Page III.52
50-Year Scenario
The frequency and magnitude of coastal surge inundating the Target Area is anticipated to
increase in the future as sea levels rise. Under the 50-year scenario, projected SLR would be
fully realized and severe damages would occur to almost all properties in the Target Area. Of
particular note, the Target Area and Norfolk as a whole could lose a total of 411 historic
properties between the two watersheds identified. Without the added protective flood and
improved stormwater measures, the city may continue to have difficulty in appropriately
responding to and recovering from flood events.
The economy in general would experience a substantial decline as area investment might by now
be completely gone. The overall economic model of the Target Area would rely solely on the
military and tourism industries, both of which would likely slow as degrading infrastructure and
lack of investment would make the region less attractive. Without the ability to diversify the
economic base, the Target Area would become less resilient.
Overtime, due to a lack of new jobs, absence of quality housing options, poor connectivity to
other areas in the region, continued threat of coastal and stormwater flooding, and disinterest in
future investment; there is potential for a substantial migration of the population to other more
resilient areas. LMI households, however, may not be able to afford to leave, rendering them
especially vulnerable to storms.

Norfolk Coastal Adaptation and Community Transformation Plan Application
Attachment F Benefit Cost Analysis Page IV.
PART IV BENEFITS INCLUDED IN THE BENEFIT COST RATIO

Norfolk Coastal Adaptation and Community Transformation Plan Application
Attachment F Benefit Cost Analysis Page IV.i
Introduction

Norfolk Coastal Adaptation and Community Transformation Plan Application
Attachment F Benefit Cost Analysis Page IV.ii
Introduction
The methodologies included in Attachment F are intended to provide sufficient detail to the reader to understand the research and processes developed to arrive at the identified benefit cost ratios (BCAs) that represent the analysis results. Each of the Target Area projects identified within the application will not only provide those populations directly impacted a significant amount of benefits but also those indirectly impacted. In other words, these projects will carry benefits far beyond the immediate Target Areas into the community, region, and even the state as a whole. In order to gain an understanding of the various projects being instituted and the numerous geographies being impacted, the Norfolk Key Intervention Sites Infographic found in the Overview will help to visualize the scope and scale of the projects. An additional BCA Results Infographic also found within the Overview helps to provide a quick understanding of the benefits derived from each of the projects, as well as a brief snapshot of the calculations developed throughout Attachment F. The methodologies have been broken down into a series of compartments based upon the benefits being realized. The first section focuses on the direct physical structural damages including impacts to critical facilities during the design storm event. The second section discusses the benefits derived from avoiding human impacts such as displacement, relocation costs, mental health and anxiety, shelter needs, and even casualties. The section immediately following will look at calculated environmental benefits discussing the added value of provisioning services, regulating services, supporting services, and cultural services. Fourth, Attachment F will focus on social benefits derived from the Target Areas project implementation including recreation, aesthetic, and general health benefits. The Methodologies section will also focus heavily on identified economic benefits including added economic output and employment compensation. Table IV.1 displays an overview of the benefits calculated and included into each of the Target Area’s benefit cost ratio. Although there are a significant amount of quantitative benefits, there are also numerous qualitative benefits as well including reduction in Urban Heat Island (UHI) affect, direct benefits to and from affordable housing to the local economy, the economic and social benefits associated with maintaining historic structures and the Chesterfield Heights historic district, benefits associated with stormwater management due to project installation, and others. It is important to note that although the proposed projects are not considered final, the circumstances surrounding the Natural Disaster Resilience Competition (NDRC) require that each Target Area and the projects contained within be evaluated for cost-effectiveness. Therefore, the benefits established above operate under the assumption that each project has been finalized. The applicant recognizes that as project design continues to move forward, benefits and costs are liable to change.
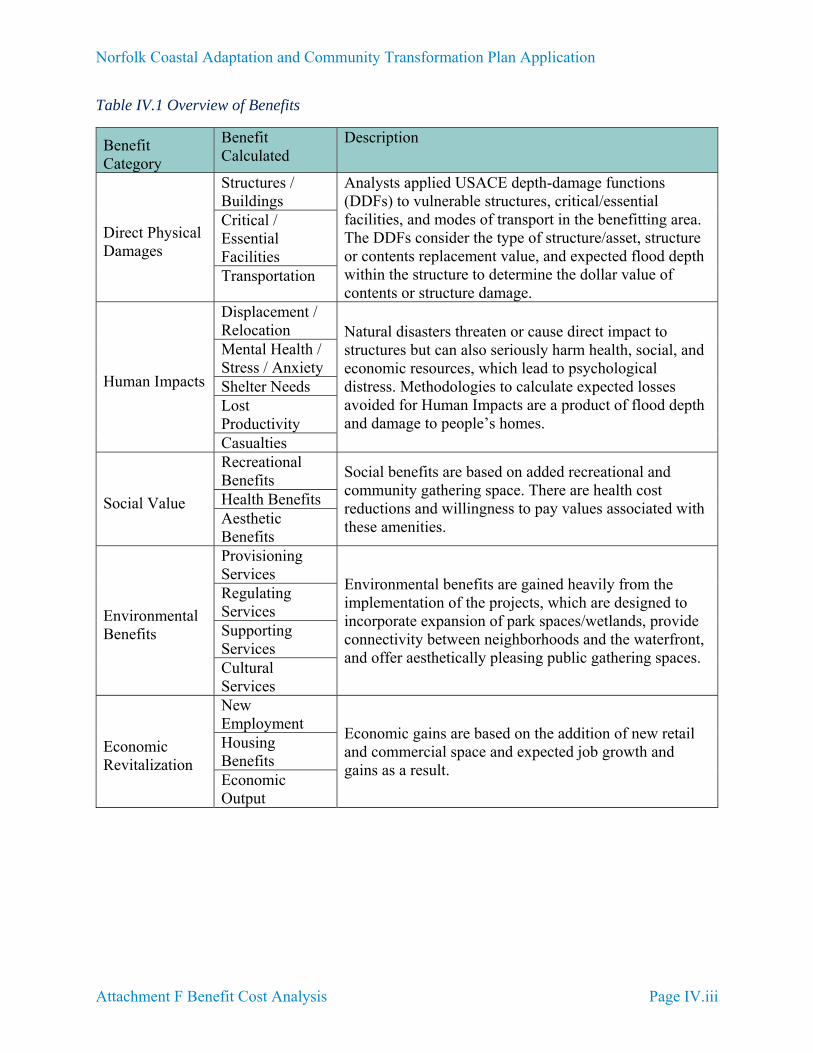
Norfolk Coastal Adaptation and Community Transformation Plan Application
Attachment F Benefit Cost Analysis Page IV.iii
Table IV.1 Overview of Benefits
Benefit Category
Benefit Calculated
Description
Direct Physical Damages
Structures / Buildings
Analysts applied USACE depth-damage functions (DDFs) to vulnerable structures, critical/essential facilities, and modes of transport in the benefitting area. The DDFs consider the type of structure/asset, structure or contents replacement value, and expected flood depth within the structure to determine the dollar value of contents or structure damage.
Critical / Essential Facilities Transportation
Human Impacts
Displacement / Relocation Natural disasters threaten or cause direct impact to
structures but can also seriously harm health, social, and economic resources, which lead to psychological distress. Methodologies to calculate expected losses avoided for Human Impacts are a product of flood depth and damage to people’s homes.
Mental Health / Stress / Anxiety Shelter Needs Lost Productivity Casualties
Social Value
Recreational Benefits Social benefits are based on added recreational and
community gathering space. There are health cost reductions and willingness to pay values associated with these amenities.
Health Benefits Aesthetic Benefits
Environmental Benefits
Provisioning Services
Environmental benefits are gained heavily from the implementation of the projects, which are designed to incorporate expansion of park spaces/wetlands, provide connectivity between neighborhoods and the waterfront, and offer aesthetically pleasing public gathering spaces.
Regulating Services Supporting Services Cultural Services
Economic Revitalization
New Employment
Economic gains are based on the addition of new retail and commercial space and expected job growth and gains as a result.
Housing Benefits Economic Output

Norfolk Coastal Adaptation and Community Transformation Plan Application
Attachment F Benefit Cost Analysis Page IV.iv
Sensitivity Analysis
As is inherent to any model, there are many uncertainties owing to approximations, limitations of existing data, and simplifications that can have a negative impact on model results. This uncertainty imposes a limit on the confidence of the model outputs and the results produced. A sensitivity analysis can capture the margin of error.
The analysts varied the discount rate and upper/lower bounds for each of the potential benefits within the Target Area to determine the potential level of error calculated in the overall BCR. The higher the discount rate, the greater the reduction in the present value of the benefits accrued over time. Likewise, the higher and lower the estimated boundaries that are used during analysis, the higher and lower the resulting benefits will be for those calculated.
High/Medium/Low Projection Approach
It is difficult to place a commonly accepted value on many of the benefits within the BCR whether it be because research indicates that the values naturally vary, because measuring the inherent value of a specific benefit can be done in multiple ways, or because a methodology may not be readily available. In developing the overall BCR of the Norfolk Coastal Adaptation and Community Transformation Plan, analysts were required to use varying methodologies which led to the use of higher and lower valuations. High, medium, and low estimated benefits are used in consideration of assumptions and uncertainties, as well as to illustrate the range of benefits. Medium estimates provide favorable assumptions and represent the scenario found to be the most reasonable.
For the purposes of the Norfolk Coastal Adaptation and Community Transformation Plan, uncertainties were realized for the economic revitalization benefits and several social benefits including recreational benefits, health benefits, and aesthetic benefits, and solutions were developed. Table I.4 below indicates these uncertain variables and the solutions proposed to account for sensitivities in the data. Table I.5 and Table I.6 provide the resulting benefits of this analysis. *The table below reflects Economic Revitalization estimates for Newton’s Creek Watershed only.

Norfolk Coastal Adaptation and Community Transformation Plan Application
Attachment F Benefit Cost Analysis Page IV.v
Table IV.2 Summary of Uncertain Variables, Newton’s Creek Watershed
Project Benefit
Secondary Benefit
Uncertain Variables Solution
Economic Benefit
Economic Revitalization*
Research and design indicated that there could be a significant variation in the redevelopment of the St. Paul’s Area within the Newton’s Creek Watershed. Therefore, analysts developed low, medium, and high density scenarios to illustrate potential variations.
Low Estimate: 584,000 sq. ft. Medium Estimate: 2,644,833 sq. ft.
High Estimate: 3,048,643 sq. ft.
Social Benefit
Recreation Benefits
The high, medium, and low estimated recreation benefits account for varying methods and population growth. The low estimated benefits were determined using a standard FEMA value for the recreational value of natural space. The medium and high estimated benefits were determined using a method that uses the size of the population and survey data regarding outdoor based recreation rather than the size of the natural space. It was possible to account for population growth using this method, therefore the high estimated benefits capture the recreational benefit for the projected population in 2020, while the medium estimated benefits account for the population in 2010.
Low Estimate: FEMA Standard Value of Recreation for Natural Space Medium Estimate: 2010 Population Size and Outdoor Activity Days Survey
High Estimate:2020 Population Projection and Outdoor Activity Days Survey
Social Benefit
Health Benefits
A factor used in calculating health benefits includes the size of the population. To account for future population growth, high, medium, and low estimated benefits are determined using the population in 2013, the projected population in 2020, and the projected population in 2040, respectively.
Low Estimate: 11,840 total pop. Medium Estimate: 13,183 total pop.
High Estimate: 13,630 total pop.
Social Benefit
Aesthetic Benefits
High, medium, and low estimated benefits were calculated to account for uncertainty related to the increase in property value due to aesthetic improvements and flood risk reduction. Because literature suggests a range of property value increase, anywhere from 3-20%, are range of estimated property value increase is used.
Low Estimate: 5 percent Medium Estimate: 10 percent
High Estimate: 20 percent

Norfolk Coastal Adaptation and Community Transformation Plan Application
Attachment F Benefit Cost Analysis Page IV.vi
Discount Rates
Another important factor in considering sensitivity in the BCR analysis was the use of varying discount rates. All proposed projects are required to analyze the future benefits on a net present value basis. This is done by annualizing the project’s benefits based on the known discount rate and project life. By keeping all other variables the same and only altering the discount rate, one is able to see the impact of the discount rate on the project’s economic feasibility. In the case of the Norfolk Coastal Adaptation and Community Transformation Plan, the analysts used the HUD NDRC Phase 2 NOFA mandated discount rate of 7% found within the Office of Management and Budget (OMB) Circular A-94: Guidelines and Discount Rates for Benefit-Cost Analysis of Federal Programs.1
Sources of literature, such as the article Discount Rate published by the Association of State Floodplain Managers, makes clear the uncertainty surrounding discount rates. The OMB Circular A-94 goes so far as to state, “Significant changes in this rate will be reflected in future updates of this Circular.2” While the OMB regularly reviews and updates the discount rate for budgeting purposes, there is no evidence within OMB Circular A-94 that the discount rate has been adjusted or reviewed for public investment purposes. According to the OMB website, the last update to the Circular was performed on October 29, 1992, approximately 23 years ago. The previous version of the OMB was submitted in 1972 with a discount rate of 10%, indicating that after a 20 year period it was deemed necessary to lower the discount rate to reflect pricing more accurately.
Additionally, it is important to note that hazard mitigation projects and projects benefiting both social and cultural aspects of a community typically span longer than a public investment project. This is presented clearly in the FEMA PUL table where the majority of the projects extend to at least 50 years.3 It should be mentioned here that all projects within the Target Area extend to at least 50 years on the FEMA PUL table. Furthermore, it should be noted that the intent of this competition is to also analyze the social aspects of the projects instituted and the OMB makes it clear that the current discount rate policy views government as a separate entity of society while a social discount rate attempts to account for the effect of public policies on society.4 A social discount rate differs from the OMB Circular mandated rate in that they are typically very low. In fact, the Government Accountability Office (GAO) recommends the use of “very low” discount rates when analyzing policies with large intergenerational effects involving human life.5 Appendix C of OMB Circular A-94 (revised in January 2015), states the 30-year interest rate is 1.4% for “Programs with durations longer than 30 years…”6 This means a 1.4% discount rate is in accordance with GAO guidance.
For projects of this scale, the National Center for Environmental Decision-Making Research suggests that a valid intergenerational discount rate should be between 1.5 to 3%.7 Therefore, in
1 OMB Circular A-94, Section 8.b.1 (1992), https://www.whitehouse.gov/omb/circulars_a094#8 2 OMB Circular A-94, Section 8.b.1 (1992), https://www.whitehouse.gov/omb/circulars_a094#8 3 FEMA BCA Reference Guide, Appendix D (2009). http://www.fema.gov/media-library-data/20130726-1736-25045-7076/bca_reference_guide.pdf 4 Kohyama, Hiroyuki (2006). http://www.law.harvard.edu/faculty/hjackson/DiscountRates_29.pdf 5 GAO Discount Rate Policy (1991).http://archive.gao.gov/f0102/144181.pdf 6 Web page. Located at: https://www.whitehouse.gov/sites/default/files/omb/memoranda/2015/m-15-05.pdf 7 National Center for Environmental Decision-Making Research Presentation Module 4. http://www.ncedr.org/tools/othertools/costbenefit/module4.htm

Norfolk Coastal Adaptation and Community Transformation Plan Application
Attachment F Benefit Cost Analysis Page IV.vii
order to adjust for sensitivity throughout the analysis, the project team applied the higher 3% discount rate to display the effect of change in discount and adjust for sensitivity. Table I.5 and Table I.6 display results for the social and economic revitalization benefits at the 3% and 7% discount rate.
Table IV.3 Net Present Value of Social Benefits High/Medium/Low Variation with a 3% and 7% Discount Rate
Social Benefits 7 Percent Discount Rate
Low Medium High Newton's Creek Watershed $62,714,882 $381,228,857 $490,737,636Ohio Creek Watershed $19,866,453 $92,275,509 $127,017,782Total $82,581,335 $473,504,366 $617,755,418
3 Percent Discount Rate Low Medium High
Newton's Creek Watershed $91,604,568 $749,832,298 $898,597,422
Ohio Creek Watershed $27,728,088 $171,824,139 $216,296,981
Total $119,332,656 $921,656,437 $1,114,894,403 Table IV.4 Net Present Value of Economic Revitalization Benefits High/Medium/Low Variation with a 3% and 7% Discount Rate
Economic Revitalization 7 Percent Discount Rate
Low Medium High Newton's Creek Watershed $794,676,506 $1,140,711,899 $2,011,513,141 Ohio Creek Watershed $3,427,415 $3,427,415 $3,427,415 Total $798,103,921 $1,144,139,315 $2,014,940,556
3 Percent Discount Rate Low Medium High
Newton's Creek Watershed $1,798,985,014 $2,548,046,078 $4,415,146,652 Ohio Creek Watershed $6,389,987 $6,389,987 $6,389,987 Total $1,805,375,001 $2,554,436,065 $4,421,536,639
Future Economic Revitalization 7 Percent Discount Rate
Low Medium High Newton's Creek Watershed $15,606,004 $57,762,618 $166,562,337
3 Percent Discount Rate Low Medium High
Newton's Creek Watershed $49,130,565 $185,137,208 $543,836,212

Norfolk Coastal Adaptation and Community Transformation Plan Application
Attachment F Benefit Cost Analysis Page IV.1.1.0
PART IV BENEFITS INCLUDED IN THE BENEFIT COST RATIO
1.0 Resiliency Values

Norfolk Coastal Adaptation and Community Transformation Plan Application
Attachment F Benefit Cost Analysis Page IV.1.1.1
Hazard Analysis

Norfolk Coastal Adaptation and Community Transformation Plan Application
Attachment F Benefit Cost Analysis Page IV.1.1.2
Hazard Scenarios Coastal Storms and Flooding
The City of Norfolk evaluated risk under three sets of storm surge flood scenarios in addition to Hurricane Irene (Figure IV.1.1.1). These scenarios are based on the probability that a given flood elevation will be equaled or exceeded in any particular year. The three sets of storm surge flood scenarios were estimated:
Estimated storm surge at present conditions Estimated storm surge given sea level rise (SLR) Estimated storm surge given SLR and including conceptual flood mitigation measures.
Estimated SLR over the useful life of the project (50 years) was estimated as an increase of 2.5 ft. based on projections by the Virginia Institute of Marine Science (VIMS)1 and are presented in Figure IV.1.1.2. Each set of scenarios includes flood elevations for the 10%, 2%, and 1% annual chance coastal flood events based on FEMA’s December 16, 2014 Revised Flood Insurance Study (510104V000B) and associated Flood Insurance Rate Maps (FIRMs). Estimated wave
1 Virginia Institute of Marine Science (VIMS), 2013. Recurrent Flooding Study for Tidewater Virginia (SJR 76, 2012)
Figure IV.1.1.1 Estimated Flood Depth - Hurricane Irene

Norfolk Coastal Adaptation and Community Transformation Plan Application
Attachment F Benefit Cost Analysis Page IV.1.1.3
action (approximately 0.5 ft. in the vicinity of the study area and based on the 1% annual chance event) was added to the stillwater elevation of each flood elevation. This approach has been selected for its consistency with current FEMA Benefit Cost Analysis Guidance. Analysts developed a series of inundation maps to visualize each flood scenario. Inundation maps showing the extent of flooding during the 1% annual chance and 1% annual chance plus 2.5 ft. of SLR scenarios are shown on Figure IV.1.1.3 and Figure IV.1.1.4, respectively. Inundation maps showing the estimated depth of flooding given the 1% annual chance plus 2.5 ft. of SLR with the proposed Target Area improvements for each scenario are shown on Figure IV.1.1.5 and IV.1.1.6.
Analysts evaluated grade elevations with Light Detection and Ranging (LiDAR) data collected in 2013 and compared these grade elevations to expected flood elevations to determine the extent of flooding under each scenario. Engineers evaluated flood extents for connectivity to the actual source of flooding, and all areas not expected to flood due to disconnection from the flood source were removed. Flood elevations associated with their appropriate scenarios can be graphed and used to interpolate probabilities of historical flood events as well. Figure IV.1.1.7 provides an interpolation of the data presented in Table IV.1.1.1 for the Hurricane Irene event within the Target Area both with and without consideration of SLR. Based on the regression analysis, the Hurricane Irene elevation of 5.94 feet North American Vertical Datum of 1988 (NAVD88) would have a 5.9% chance of being repeated without consideration of SLR and would be likely to occur almost annually when SLR is included. The Proposed Project would protect the area to the 1% annual chance flood event plus SLR, plus freeboard. This equates to just above the 0.34% annual chance flood event (Figure IV.1.1.7). The elevations required to meet this level of protection vary throughout the Target Area based on topography and flood elevation.
Figure IV.1.1.2 Sea Level Rise Scenarios

Norfolk Coastal Adaptation and Community Transformation Plan Application
Attachment F Benefit Cost Analysis Page IV.1.1.4
Figure IV.1.1.3 Estimated Flood Extent of 1% Annual Chance of Occurrence under Present Conditions
Figure IV.1.1.4 Estimated Flood Extent of 1% Annual Chance of Occurrence Given 2.5 Feet of Sea Level Rise

Norfolk Coastal Adaptation and Community Transformation Plan Application
Attachment F Benefit Cost Analysis Page IV.1.1.5
Figure IV.1.1.6 Estimated Flood Extent of 1% Annual Chance Given 2.5 Feet of SLR and Proposed Improvements
Figure IV.1.1.5 Estimated Flood Extent of 1% Annual Chance and Proposed Improvements

Norfolk Coastal Adaptation and Community Transformation Plan Application
Attachment F Benefit Cost Analysis Page IV.1.1.6
Figure IV.1.1.7 Hurricane Irene Interpolation With and Without SLR at Project Area.
Table IV.1.1.1 FEMA-Projected Coastal Surge With and Without SLR2
2 FEMA (2014). Flood Insurance Study, City of Norfolk, Virginia FIS#510104V000B
Event
Elevation (ft. NAVD) Present Condition Sea Level Rise Coastal Surge Wave Action Coastal Surge Wave Action
10 % 5.5 6 8 8.5
2 % 6.9 7.4 9.4 9.9
1 % 7.6 8.1 10.1 10.6
0.2 % 8.9 9.4 11.4 11.9
Irene (5.9%) 5.94

Norfolk Coastal Adaptation and Community Transformation Plan Application
Attachment F Benefit Cost Analysis IV.1.2.0
Direct Physical Damages - Buildings

Norfolk Coastal Adaptation and Community Transformation Plan Application
Attachment F Benefit Cost Analysis IV.1.2.1
Direct Physical Damages - Buildings
The proposed project will significantly reduce the risk of direct physical damage due to stormwater and coastal flood events. Direct physical damages to buildings are based on impacts to structure, contents, and inventory. Structural damage is damage that applies to real property, contents damage is damage that applies to personal property, and inventory damage is damage that applies to materials and goods held or sold by a business.
This section provides an overview of the existing building conditions in the City of Norfolk; outlines the approach taken to refine Norfolk’s Real Estate Assessor data; identifies the methodology used to estimate direct physical damages using depth damage functions; documents assumptions and uncertainties; and provides an overview of the results for modeled coastal and stormwater inundation scenarios in the Target Area.
An initial flood exposure analysis shows that approximately 1,373 structures are estimated to benefit from the implementation of the proposed projects at the proposed coastal level of protection discussed in Part II Project Description. The majority of these structures are also potentially vulnerable to stormwater flooding due to the low and relatively flat topography of the Target Area and outdated stormwater management system. Figure IV.1.2.1 identifies the total exposure of properties within the Target Area, as well as a breakdown of exposure within each watershed. A detailed breakdown of the structures included in the exposure analysis is provided here. The methodology used to calculate building, content, and inventory replacement values is provided in this section.
Data Sources
This subsection provides insight into the process analysts used to develop the Norfolk Coastal Adaptation and Community Transformation Plan structure inventory, necessary for the calculation of direct physical damages expected to be avoided by the proposed projects. Prior to the calculation of damages, the structure inventory had to be evaluated and modified to ensure accuracy of the results. The following sources were used to develop both the structure inventory and direct physical damages:
City of Norfolk 2015 Real Estate Data. Provided information for each of the structures present within the Target Areas.
City of Norfolk 2015 Parcel Boundaries. Analysts used this GIS layer to determine the outline of parcels within the Target Areas.
2013 City of Norfolk Light Detection and Ranging (LiDAR) Data. Provided grade elevations for the structures in the dataset and a Building_3D
Federal Emergency Management Agency (FEMA) Hazus Default Building Replacement Values. A dollar value per square foot used to determine the total building replacement value for each structure record.
U.S. Army Corps of Engineers (USACE) West Shore Lake Pontchartrain Hurricane and Storm Damage Risk Reduction Study, Contents to Structure Ratio Values (2014). A ratio applied to the building replacement value to determine the contents replacement value for each structure record.

Norfolk Coastal Adaptation and Community Transformation Plan Application
Attachment F Benefit Cost Analysis IV.1.2.2
Federal Emergency Management Agency (FEMA) Hazus Default Inventory Values (2006). A dollar value per square foot used to determine the inventory replacement value for commercial and industrial structure records.
Modeled 10%, 2%, 1%, and 0.2% Inundation Depth Data with Sea Level Rise (2015). Modeled by the analysts, these GIS raster files with flood elevations were used to determine the depth of flooding in each structure. A description of this data set is provided in the Hazard Analysis Section.

Norfolk Coastal Adaptation and Community Transformation Plan Application
Attachment F Benefit Cost Analysis IV.1.2.3
Figure IV.1.2.1 Norfolk Proposed Project Total Study Area, Total Exposure by Building Occupancy Type, 100-Year with 2.5 Ft. of Sea Level Rise, 2015

Norfolk Coastal Adaptation and Community Transformation Plan Application
Attachment F Benefit Cost Analysis IV.1.2.4
Detailed Approach Developing the Structure Inventory
In order to determine direct damages, the analysts were first required to develop a structure inventory of buildings within the Target Area. The following steps were used to develop the inventory:
1. Gather Real Estate Data. Analysts pulled relevant information in the Real Estate data. A basic description of the type of information, the name(s) of relevant fields, and a description of how the data was analyzed is provided below:
Parcel Number - [Routing_number] parcel number that relates to the parcel data layer in GIS.
Owner Name – [Owner1] name of the current owner.
Property Address – [prop_street] the address for the property including street number and name.
Property Class Description – [property_class], [PropClassDesc] coded value for the property zoning type and description. The property class information was used to relate the correct damage estimate to specific structures.
Building Square Footage – [finish_living_area], [Area] the finish_living_area contains the square footage for residential structures including some apartments. The Area field contains square footage for non-residential structures and the majority of apartments. This data was used as part of the cost estimation for each structure.
Number of Stories – [story_height] the number of stories for a given structure. The information is used to determine the appropriate damage estimate for each structure.
Basement – [crawl_code], [bsmnt_fin_area] the crawl_code field contains the type of crawl space. The bsmnt_fin_area shows the number of square feet in a basement when present. These data were used to determine the elevation of the first floor living space.
2. Analyze City of Norfolk parcel information. The parcel information was included in a larger set of data layers provided by the City. A basic description of the type of information, the name(s) of relevant fields, and a description of how the data was analyzed is provided below:
Parcel Number – [GPIN] parcel number that relates to the real estate data set.
Parcel Latitude and Longitude – the central point of each parcel was created using GIS analyses tools to create the latitude and longitude coordinates of each parcel.
3. Examine LiDAR Data and Layers derived from Data. The LiDAR information was provided by the City of Norfolk and covers all areas of the city. It contains the processed ground elevation information and a polygon layer called Building_3D. The ground elevation information is a raster data set. The Building_3D layer is a polygon layer

Norfolk Coastal Adaptation and Community Transformation Plan Application
Attachment F Benefit Cost Analysis IV.1.2.5
derived from the LiDAR data and contains building footprints. Two data files were present:
Buildings_3D - Generated from the 2013 LiDAR dataset containing building base and top elevations
Buildings - Information had a higher degree of accuracy with regard to building footprints, but used an older LiDAR data set to apply elevations.
Since analysts wanted to maintain the elevation information stored in the Buildings_3D polygon file, this file served as the primary analysis layer. Analysts developed centroids from this layer and made the following adjustments to the dataset. Duplicate points representing the same building were deleted. The data point with the lowest base elevation was retained in most cases. If the difference between the base and top elevation was high, the point with the largest difference was retained.
4. Determine Data Gaps and Remediate Needs. Structure data was captured using the three data sets mentioned above and merged together in ArcGIS. Each data set was evaluated for accuracy and completeness. Where data gaps were identified, analysist developed a methodology to remedy the gap in information.
5. Structure Footprint Development and Identification. Determining the location of a structure is important to obtain the grade and flood elevation for use in the analysis. Since analysts wanted to maintain the elevation information stored in the Buildings_3D polygon file, this file served as the primary analysis layer. Analysts developed centroids from this layer and made the following adjustments to the dataset. Duplicate points representing the same building were deleted. The data point with the lowest base elevation was retained in most cases. If the difference between the base and top elevation was high, the point with the largest difference was retained.
Points representing multiple buildings were copied and placed into each Building layer polygon. In residential areas where the Buildings layer does not have an equivalent 3D_Buildings center point, the values were left null. In areas where it was clear that the structure was a shed or outbuilding, and there was no equivalent 3D_Building center point, the value was left null.
6. Structure Square Footage. In determining building square footages, the “finished living area” was used for residential structures and the total building “area” was used for non-residential and apartment buildings. For structures where these two fields contained a null value, an average square footage of the property class was calculated and applied to the record.
7. Structure First Floor Elevation. A base grade elevation of the parcel was determined using the 2013 LiDAR data set provided by the City of Norfolk for comparison. In order to determine the structure’s grade elevation, the value contained in the 3D_Buildings layer field under the “base building elevation” was used. This information was compared to the parcel centroid elevation, and if a significant difference between the two was identified, the value defaulted to the 2013 LiDAR.
Identifying the type of foundation for each structure is important to determine the first floor elevation (FFE). The City of Norfolk Real Estate data includes a field indicating the presence or absence of a basement and the presence or absence of a crawlspace. Based on this information,

Norfolk Coastal Adaptation and Community Transformation Plan Application
Attachment F Benefit Cost Analysis IV.1.2.6
the following foundation elevations in Table IV.1.2.1 were added to the grade elevations of the parcel centroid to determine the FFE. Elevation above grade values were obtained from FEMA’s Hazus Loss Estimation Software.
Table IV.1.2.1 Foundation Type and Elevation above Grade
Foundation Type Elevation Above Grade (Feet)
Crawl Space 3
Slab 1
Basement 0
Source: FEMA Hazus 2.1 Technical Manual
8. Number of Stories. Number of stories is necessary to determine the correct depth damage function appropriate for each structure as described in the following section. To determine the number of stories for each structure, the building height and was divided by an estimated story height of 10 feet. While several records contained a “number of stories” attribute in the Real Estate dataset, many of the records had a null value. In order to establish a building height for the null records, the difference between the 3D_Buildings layer “base building elevation” and “building top elevation” was used if appropriate.
In the case that multiple points existed, the lowest and highest points were retained, and the difference between these two values was estimated to be the building elevation. In cases where a building height and number of stories value were absent an average building height by structure occupancy type was applied to the structure record.
Calculating Direct Physical Damages
Damage to buildings, contents, and inventory are estimated using the depth of flooding and application of a depth-damage function (DDF) associated with the building occupancy type. Flood DDFs are in the form of depth-damage curves, relating depth of flooding (in feet), as measured from the top of the first finished floor, to damage expressed as a percent of the total replacement cost. DDFs are unique for building, contents, and inventory. For each structure, a building occupancy code based on structure use and appropriate damage function is assigned, and modeled flood elevations (1-foot increments) are used to determine the associated flood damages. The percent flood damage is multiplied by the total replacement value (building, contents, and inventory) for each structure to produce an estimate of the total dollar loss.
Direct physical damage is calculated using a library of readily available DDFs extracted from FEMA’s Hazus software. DDFs are developed from a variety of sources including the following:
‐ Federal Insurance and Mitigation Administration (FIMA) FIA;
‐ USACE Chicago District
‐ USACE Galveston District
‐ USACE New Orleans District
‐ USACE New York District
‐ USACE Philadelphia District

Norfolk Coastal Adaptation and Community Transformation Plan Application
Attachment F Benefit Cost Analysis IV.1.2.7
Each source provided specific DDFs which were applied to each structure record based on building occupancy type. Figure IV.1.2.2 provides an example depth damage relationship for an Average Light Industrial Structure from the USACE Galveston District.
Figure IV.1.2.2 Structural, Content, and Inventory Damage from Inundation, USACE Galveston Average Light Industrial Use
Once the structure inventory was developed, analysts then applied the depth damage functions to each structure through the following process:
1. Map Structure Inventory to the Appropriate Occupancy Codes. Relating the appropriate occupancy code to the individual structure records is an important step in ensuring development of defensible results. These occupancy codes provide direct links to the classifications used within RS Means and the FEMA Hazus software to estimate building and content replacement costs. Each occupancy type required individual analysis to ensure alignment of the most accurate code to the structure inventory record. For the purposes of this analysis, the Real Estate data provided by the City of Norfolk offered a “Property Class Description” field, simplifying the relation to the appropriate occupancy type. Due to a high level of specificity in the “Property Class Description” for each field, each occupancy code was mapped based on the property class description. Appendix F-13: Structure Inventory Mapping provides the Structure Occupancy Code Mapping results.
The structure inventory was later refined to identify specific critical infrastructure assets, utilities, transportation resources, public facilities, and essential facilities (such as fire
0%
10%
20%
30%
40%
50%
60%
70%
80%
90%
0 1 2 3 4 5 6 7 8 9 10 11 12 13 14 15 16 17 18 19 20 21 22 23 24
ESTIMATED LEV
EL OF DAMAGE (%)
HEIGHT OF FLOOD INUNDATION (FT.) RELATIVE TO FIRST FLOOR ELEVATION
Structural Content Inventory

Norfolk Coastal Adaptation and Community Transformation Plan Application
Attachment F Benefit Cost Analysis IV.1.2.8
departments, schools, shelters, and other assets).
2. Develop Replacement Values. Building Replacement Values (BRVs), content to structure ratios, and inventory to structure ratios are all required to determine the total expected damage to structures within the study area. The BRV value provides an approximate per square foot valuation of the replacement cost required to repair/reconstruct a similar type building. Similarly, the content and inventory values are derived as percentages of the BRV, essentially indicating what would be required to replace any of the contents (e.g., office supplies, computers, equipment) or inventory (items for sale) that might have been damaged.
BRVs were extracted from the FEMA Hazus Default Inventory database and normalized for inflation using the Consumer Price Index (CPI) calculator from 2006 to 2015. Content and inventory ratios were derived from the USACE West Shore Lake Pontchartrain Hurricane and Storm Damage Risk Reduction Study and again required normalization through the CPI calculator from 2014 to 20151. These developed values are all provided within Appendix F-10: Annualized Building, Content, and Inventory Replacement Costs.
3. Determine Modeled Flood Depths and Apply Depth-Damage Functions. Inundation modeling was developed for the 10%, 2%, and 1% annual chance flood events plus 2.5 feet of sea level rise via the methods discussed in Part IV.1.1. In order to determine the flood depths at the structure location, the established structure FFE was subtracted from the corresponding maximum surface water flood elevation. These final flood depths at each event were then matched to damage using appropriate DDFs.
4. Calculate Physical Loss Values. Direct physical damage for buildings is a product of total structure square footage, replacement value, flood depth, and the associated damage percentage at that flood depth. The results from this analysis are provided below.
Detailed Results
Detailed results of the total structural damages are provided in Table IV.1.2.2 through Table IV.1.2.4 for the medium scenario. All results have been annualized and normalized using a 7% discount rate over the project useful life.
1 USACE. 2014. West Shore Lake Pontchartrain Hurricane and Storm Damage Risk Reduction Study – Final Integrated Feasibility Study Report and Environmental Impact Statement. November.

Norfolk Coastal Adaptation and Community Transformation Plan Application
Attachment F Benefit Cost Analysis IV.1.2.9
Table IV.1.2.2 Total Expected Building Damage Costs due to Coastal Flooding in 2015 Dollars
Loss Category
Expected Costs in 2015 Dollars by Annual Chance Coastal Flood Event, Including 2.5
feet of SLR Post-Mitigation Benefits
10-Year Event
50-Year Event
100-Year Event
Annual Benefits
Net Present Value
Building Damage Costs ($)
$6,512,705 $14,542,537 $22,444,482 $1,166,566 $16,099,481
Contents Damage Costs ($)
$16,429,643 $31,521,665 $44,692,350 $2,720,321 $37,542,460
Inventory Damage Costs ($)
$757,611 $993,339 $1,325,330 $108,881 $1,502,639
Total Property Loss ($)
$23,699,959 $47,057,540 $68,462,162 $3,995,768 $55,144,580
Table IV.1.2.3 Newton’s Creek Watershed Expected Building Damage Costs due to Coastal Flooding in 2015 Dollars
Loss Category
Expected Costs in 2015 Dollars by Annual Chance Coastal Flood Event, Including 2.5
feet of SLR Post-Mitigation Benefits
10-Year Event
50-Year Event
100-Year Event
Annual Benefits
Net Present Value
Building Damage Costs ($)
$5,361,695 $8,808,165 $12,661,000 $838,943 $11,578,039
Contents Damage Costs ($)
$15,325,078 $26,196,401 $35,551,296 $2,411,949 $33,286,693
Inventory Damage Costs ($)
$750,322 $981,435 $1,291,440 $107,575 $1,484,619
Total Property Loss ($)
$21,437,095 $35,986,001 $49,503,736 $3,358,467 $46,349,349

Norfolk Coastal Adaptation and Community Transformation Plan Application
Attachment F Benefit Cost Analysis IV.1.2.10
Table IV.1.2.4 Ohio Creek Watershed Expected Building Damage Costs due to Coastal Flooding in 2015 Dollars
Loss Category
Expected Costs in 2015 Dollars by Annual Chance Coastal Flood Event, Including 2.5
feet of SLR Post-Mitigation Benefits
10-Year Event
50-Year Event
100-Year Event
Annual Benefits
Net Present Value
Building Damage Costs ($)
$1,151,010 $5,734,372 $9,783,482 $327,623 $4,521,445
Contents Damage Costs ($)
$1,104,565 $5,325,264 $9,141,054 $308,372 $4,255,768
Inventory Damage Costs ($)
$7,288 $11,904 $33,890 $1,306 $18,021
Total Property Loss ($)
$2,262,863 $11,071,540 $18,958,426 $637,301 $8,795,235

Norfolk Coastal Adaptation and Community Transformation Plan Application
Page IV.1.3.1 Attachment F Benefit Cost Analysis
Essential Facilities and Critical Infrastructure

Norfolk Coastal Adaptation and Community Transformation Plan Application
Page IV.1.3.2 Attachment F Benefit Cost Analysis
Essential Facility and Critical Infrastructure Loss of Service Costs
FEMA defines a critical, or essential, facility as a facility for which “even a slight change of flooding is too great a threat.” 1 Typical essential facilities, necessary for disasters, include hospitals, fire stations, EMS stations, police stations, and similar facilities. Critical infrastructure and lifelines include utilities and services, such as wastewater service, electrical power services, and transportation infrastructure. It is necessary to separate the analysis of essential facilities and critical infrastructure from the analysis of general residential and commercial buildings because, in addition to damage costs and displacement consequences that may be the result of flood impacts, these assets serve the public, and impacts related to service interruption can cascade and result in further economic, environmental, and societal losses. The FEMA BCA Reference Guide (BCAR) defines loss of function (or service) as, “Cost and direct economic impacts that occur when physical damages are severe enough to interrupt the function of a building or other facility.” The value of the service provided by essential facilities and critical infrastructure can be quantified and included as benefits within the benefit cost analysis in addition to any expected physical property damages. FEMA quantifies standard service values for many typical critical and essential facilities, which will be explained and used later on in the analysis.
Data Sources
The Federal Emergency Management Agency’s (FEMA) Benefit Cost Analysis Re-engineering (BCAR) outlines methods to value essential facility and critical infrastructure loss of service. Geographic information systems (GIS) data provided by the Norfolk GIS Department was used to determine asset locations.
Detailed Approach
The first step to analyze essential facilities and critical infrastructure is to identify the number and types of facilities that meet FEMA’s definition located within the Target Area. These assets were located and grouped into the following categories:
Pump Stations
Electrical Substation
Fire Station
Schools (often serve as emergency shelters)
Roads
No other essential assets and critical infrastructure were specifically identified within the Target Area. Analysts gathered the following information for each asset: location, size of service population, facility size, operating budget, and any other facility-specific information. A log of this information was developed to document the information gathered on all facilities. The analysis was completed for facilities in each category above, and the methods for each are outlined below.
1 Federal Emergency Management Agency. 2015. Critical Facility. [Web page] Located at: https://www.fema.gov/critical-facility.

Norfolk Coastal Adaptation and Community Transformation Plan Application
Page IV.1.3.3 Attachment F Benefit Cost Analysis
Pump Stations
Service loss avoided is a function of pump station location, service population, flood depth, and estimated downtime by flood depth.
As the service population for each individual pump station was not readily available, analysts divided the total population in the City of Norfolk (242,803)2 by the total number of wastewater pump stations (198), stormwater pump stations (12), or water pump stations (8) in the city to assign a proportionate population share to each asset. The number of pump stations was provided by the City of Norfolk GIS Department.
The loss of function time is based on flood depth and damage state. While FEMA provides depth loss of service functions for this asset type, a comparison of these functions with historical losses at other sites determined that more conservative figures would be necessary. For example, where FEMA’s function might identify 45 days of lost service correlated to a particular flood depth, a comparison of pump station impacts from other flood events in the United States that ARCADIS has recorded (See Appendix F-15: Comparable Facilities) indicates that a pump station downtime of 5 days for the correlating flood depth may be more appropriate given that the City would take certain emergency response and preparedness measures to limit interruption (e.g., generators, spare parts, emergency repairs, etc.). It was determined eight pump stations would experience a loss of function, summarized in Table IV.1.3.1.
o It is important to note, the pump stations analyzed include submersible and dry pit submersible assets. While an asset may be submersible, critical components needed for function, such as power source or emergency generators, may not be.
In order to value the service provided by the pump stations to the population, analysts applied FEMA’s standard value for wastewater service, $45 per capita member of the service population per day, or FEMA’s standard value for water service, $103 per capita member of the service population per day. 3 FEMA has estimated these values using nationwide economic data by economic sector and water importance factors from the Economic Census and North American Industry Classification System (NAICS). Importance factors were obtained from the FEMA-sponsored publication ATC-25.
2 US Census Bureau. American Community Survey 2013 5-Year Estimates. [Web Page] Located at: http://factfinder.census.gov/faces/nav/jsf/pages/community_facts.xhtml#none
3 FEMA Benefit-Cost Analysis Re-engineering (BCAR). Development of Standard Economic Values. Version 5.0. August 2011. Pages 38 and 42.

Norfolk Coastal Adaptation and Community Transformation Plan Application
Page IV.1.3.4 Attachment F Benefit Cost Analysis
Table IV.1.3.1 Service Population and Loss of Function Time
Pump Station Type Service
Population
FEMA Standard
Value
Flood Depth at First Floor Days of LOF
10-Year 50-Year 100-Year 10-Year 50-Year 100-Year
Newton’s Creek PS 004 Sewage Pump Station 1,226 $45 1.8 3.27 3.9 5 7 7 PS 005 Sewage Pump Station 1,226 $45 2.2 3.6 4.3 5 7 7 PS 129 Sewage Pump Station 1,226 $45 3.1 4.5 5.21 7 7 15
RS 132 Sewage Pump Station 1,226 $45 -0.84 0.5 1.2
-
- 5
East Brambleton Avenue - East of May Avenue
Pump Station 20,234 $103 7.13 8.5 9.23 15 15 15
Ohio Creek PS 141 Sewage Pump Station 1,226 $45 4.9 6.3 7 5 15 15
PS 147 Sewage Pump Station 1,226 $45 0.35 1.75 2.45
- 5 5
WPS-I16-00001
Finished Water Pump Station
26,978 $103 -0.12 1.88 1.98
- 5 5

Norfolk Coastal Adaptation and Community Transformation Plan Application
Page IV.1.3.5 Attachment F Benefit Cost Analysis
The value of lost service is calculated as follows:
∗ ∗
Limitations, Uncertainties, Assumptions, and Sensitivities
Service population data was not readily available for pump stations, therefore it was necessary to obtain a general estimate of service population based on total population and pump stations within Norfolk City.
It was assumed the first flood elevation of pump stations is one foot above grade.
Detailed Results
With a total impacted population of 54,568, and the FEMA standard value of $45/person/day for loss of wastewater service, or $103/person/day for water service, the estimated total loss of function is summarized below. Benefits for each annual flood chance event were multiplied by their probabilty of occurrence and added together to determine annual benefits. Annualized benefits were projected out to a 50-year project useful life at a 7% discount rate.4 Results are presented below in Table IV.1.3.2 for the medium scenario.
4 Association of Floodplain Managers. 2008. Discount Rate. Page 3. Located at: http://www.floods.org/PDF/WhitePaper/ASFPM_Discount_%20Rate_Whitepaper_0508.pdf

Norfolk Coastal Adaptation and Community Transformation Plan Application
Page IV.1.3.6 Attachment F Benefit Cost Analysis
Table IV.1.3.2 Value of Pump Station Loss of Function
Pump Station Expected Losses by % Annual Chance Flood
Scenario Expected Benefits
10-Year 50-Year 100-Year Annual Benefits Net Present Value
Newton’s Creek PS 004 $275,850.00 $386,190.00 $386,190.00 $39,170.70 $540,584.88PS 005 $275,850.00 $386,190.00 $386,190.00 $39,170.70 $540,584.88PS 129 $386,190.00 $386,190.00 $827,550.00 $54,618.30 $753,773.29RS 132 $0.00 $0.00 $275,850.00 $2,758.50 $38,069.36East Brambleton Avenue - East of May Avenue
$31,261,530.00 $31,261,530.00 $31,261,530.00 $4,063,998.90 $56,086,216.56
Newton’s Creek Total $32,199,420.00 $32,420,100.00 $33,137,310.00 $4,199,717.10 $57,959,228.97Ohio Creek PS 141 $275,850.00 $827,550.00 $827,550.00 $52,411.50 $723,317.80PS 147 $0.00 $275,850.00 $275,850.00 $8,275.50 $114,208.07WPS-I16-00001 $0.00 $13,893,670.00 $13,893,670.00 $416,810.10 $5,752,290.32Ohio Creek Total $275,850.00 $14,997,070.00 $14,997,070.00 $477,497.10 $6,589,816.19Total $32,475,270.00 $47,417,170.00 $48,134,380.00 $4,677,214.20 $64,549,045.16

Norfolk Coastal Adaptation and Community Transformation Plan Application
Attachment F Benefit Cost Analysis Page IV.1.3.7
Electrical Substation
The Reeves Avenue Electrical Substation is located in the Newton’s Creek Watershed. The FEMA BCAR provides a method to estimate the value of lost service, though analysis determined the electrical substation would not be impacted in any of the study events, therefore benefits are not calculated in this analysis.
Fire Stations
Fire Station 1 is located within the Newton’s Creek Watershed, and the service area is Young Terrace.5 Based on flood depths from the resiliency analysis, it was determined the fire station would not be impacted during an event, therefore there would be no loss of service. As such, benefits are not calculated in this analysis. Schools
Norfolk’s Coastal Adaptation and Community Transformation Plan will protect four schools in the Target Area from flooding. Norfolk public schools were closed Monday, October 29, 2012 after Hurricane Sandy.6 There is no historical data regarding school closures for Hurricane Irene.
In accordance with the FEMA BCAR Guide and Supplement, expected loss data can be used to calculate benefits for the BCA. Days of lost service are determined using modeled flood depths and damage state, determined in the Direct Physical Damages section. Two of the four schools would be impacted by a lesser storm than the 100-year event and three of the four would be impacted by the 100-year event. This is summarized in Table IV.1.3.3.
Analysts determined the annual operating budget for each school to calculate the loss of service from a school closure. Annual operating budgets published by the City of Norfolk School Board were used for the FY 2015-2016 to calculate daily operating budget and value loss of service.7 The operating budget per day is applied to the time the school is out of service to determine the loss of function cost. The value of school closure is summarized in Table IV.1.3.4.
5 http://www.virginiafirefighters.com/norfolk.htm
6 http://blog.checkeredflag.com/my_weblog/2012/10/hampton-roads-closures-and-cancellations-due-to-hurricane-sandy.html
7School Board’s Proposed Education Plan and Budget 2016. Located at: http://www.npsk12.com/pdf/FY_2016_School_Boards_Proposed_Ed_Plan-Budget.pdf

Norfolk Coastal Adaptation and Community Transformation Plan Application
Attachment F Benefit Cost Analysis Page IV.1.3.8
Table IV.1.3.3 Impacted Schools
School
Flood Depth Loss of Function (Days) Daily
Operating Budget
10-Year Event
50-Year Event
100-Year Event
10-Year Event
50-Year Event
100-Year Event
Newton’s Creek
Tidewater Park Elementary School*
3 4 5 135 180 225 $10,563.58
Ruffner Academy 1 2 3 45 90 135 $20,705.69
Ohio Creek
Chesterfield Heights Academy*
- - 1 0 0 45 $11,446.91
*Serves as an emergency shelter.
Detailed Results
Results are provided for three different flood events at the medium scenario. Benefits for each event were multiplied by their probability of occurrence and then added together to obtain annual benefits. A 50-year project useful life at a 7% discount rate was applied to annual results to determine net present value8.
Table IV.1.3.4 Value of School Closure
School
Expected Losses by % Annual Chance Flood Scenario
Expected Benefits
10-Year Event
50-Year Event 100-Year Event
Annual Benefits
Net Present Value
Newton’s Creek
Tidewater Park Elementary School
$1,426,082.67 $1,901,443.56 $2,376,804.45 $204,405.18 $2,820,944.00
Ruffner Academy $931,756.19 $4,050.00 $12,150.00 $93,378.12 $1,288,687.70
Newton’s Creek Total
$2,357,838.86 $1,905,493.56 $2,388,954.45 $297,783.30 $4,109,631.71
Ohio Creek
Chesterfield $0.00 $0.00 $515,110.81 $5,151.11 $71,089.13
8 Association of Floodplain Managers. 2008. Discount Rate. Page 3. Located at: http://www.floods.org/PDF/WhitePaper/ASFPM_Discount_%20Rate_Whitepaper_0508.pdf

Norfolk Coastal Adaptation and Community Transformation Plan Application
Attachment F Benefit Cost Analysis Page IV.1.3.9
School
Expected Losses by % Annual Chance Flood Scenario
Expected Benefits
10-Year Event
50-Year Event 100-Year Event
Annual Benefits
Net Present Value
Heights Academy
Total Benefit $2,357,838.86 $1,905,493.56 $2,904,065.26 $302,934.41 $4,180,720.85
Roadway Service Impacts
Transportation assets and systems can also experience significant losses during a flood event. Nuisance flooding is common in the Target Area and occurs on a regular basis, so much so that even high tides can impact a number of roads. Loss of function of roadway systems is determined through the per-hour value of time, detour route, and number of vehicles that would be likely to travel along a roadway. In order to determine this value, analysts focused on residential properties captured within the Target Areas that would be surrounded by floodwaters during the 10%, 2%, and 1% annual chance flood event plus 2.5 feet of SLR. Once residential properties were identified, analysts applied the Northeast average number of vehicles per household derived from the U.S. Department of Transportation Summary of Travel Trends: 2009 National Household Travel Survey.9 Additionally, analysts incorporated the average daily vehicle trips extracted from the same document. To complete the analysis, the FEMA BCAR Development of Standard Economic Values rate of $29.63 was applied per vehicle per hour for the lost time cost of road closures which was assumed to be inundated for a period of 12 hours. Data Sources
Analysts used methodologies derived from the FEMA BCA Toolkit Version 5.1 to develop a total economic loss per day value for each of the identified inundated roads. Specifically, analysts used the sources identified below to calculate the transportation losses:
FEMA Supplement to the Benefit-Cost Analysis Reference Guide.10 Analysts used the methodology provided within the guide to develop the total economic losses of roadways.
FEMA Benefit-Cost Analysis Re-engineering (BCAR) Development of Standard Economic Values. Analysts used this resource to determine the appropriate hourly value per vehicle per hour to be applied to the AADT.
U.S. Department of Transportation Summary of Travel Trends 2009. This document provided the average number of vehicles per household and the daily vehicle trips.
Inundation Mapping. Mapping provided by hydrologic and hydraulic experts helped to identify properties that would not have an identifiable detour during each of the inundation scenarios.
9 U.S. Department of Transportation (2009). Summary of Travel Trends: 2009 National Household Travel Survey. Page 9. http://nhts.ornl.gov/2009/pub/stt.pdf
10 FEMA (2011). FEMA Supplement to the Benefit-Cost Analysis Reference Guide. http://www.fema.gov/media-library-data/1396549910018-c9a089b8a8dfdcf760edcea2ff55ca56/bca_guide_supplement__508_final.pdf

Norfolk Coastal Adaptation and Community Transformation Plan Application
Attachment F Benefit Cost Analysis Page IV.1.3.10
City of Norfolk Parcel Information and Real Estate Data. This information allowed analysts to identify parcel information and property descriptions to determine which parcels were residential uses.
Detailed Approach
Analysts followed the below procedure to determine the expected loss of function for roadways. The analysis was performed using the inundation model developed to reflect the 10%, 2%, and 1% annual chance flood event plus 2.5 feet of SLR.
1. Identify Parcel and Property Uses. Analysts used the City of Norfolk Parcel Information and Real Estate Data to identify all parcels within the Target Areas and determine the appropriate property uses and descriptions. This information was provided to the city by the Norfolk Property Appraiser.
2. Apply Flood Inundation Mapping. Analysts applied each of the developed flood inundation maps to the Target Areas to determine the total number of residential structures within the areas potentially impacted by each flood scenario.
3. Identify Properties with No Access to Detour Routes. In order to calculate loss of economic function, analysts were required to determine the fastest alternate route for each of the identified inundated roads that a driver would take to get from one point to another without passing through flood waters. This presented a challenge because a number of identified structures did not have access to a road that was not likely closed due to flood inundation. Figure IV.1.3.1 and Figure IV.1.3.2 below provide a visual of each watershed with the inundation mapping applied and residential structures identified with no detour route.
The FEMA Supplement to the Benefit-Cost Analysis Reference Guide states “For road or bridge losses that do not have detours, the number of daily trips should be based on the number of one-way trips, and the delay time should be 12 hours per one-way trip.”11 Therefore, because these roads would remain severely inundated and a detour would not exist, a delay time of 12 hours was applied as a standard value.
11 FEMA Supplement to the Benefit-Cost Analysis Reference Guide (2011). Page 5-14. http://www.fema.gov/media-library-data/1396549910018-c9a089b8a8dfdcf760edcea2ff55ca56/bca_guide_supplement__508_final.pdf

Norfolk Coastal Adaptation and Community Transformation Plan Application
Attachment F Benefit Cost Analysis Page IV.1.3.11
Figure IV.1.3.1 Newton’s Creek Watershed Structures with No Detour During the 10%, 2%, and 1% Annual Chance Flood Event plus 2.5 Feet of SLR
Figure IV.1.3.2 Ohio Creek Watershed Structures with No Detour During the 10%, 2%, and 1% Annual Chance Flood Event plus 2.5 Feet of SLR

Norfolk Coastal Adaptation and Community Transformation Plan Application
Attachment F Benefit Cost Analysis Page IV.1.3.12
4. Determine Value per Vehicle per Hour. The FEMA BCAR Development of Standard Economic Values provides a value of $29.63 to be applied per vehicle per hour for the lost time cost of road closures based on the following equation12:
(%PPaV * (WR * .05)) + (%CV * WR) * PPV = HVTV
Where:
%PPaV
= Percent of Personal Passenger Vehicles
WR = Wage Rate
%CV = Commercial Vehicles
PPV = Average Persons Per Vehicle
HVTV = Hourly Value of Time per Vehicle
It is important to note that the HVTV is calculated based on information provided by the National Household Travel Survey (NHTS) and the Department of Transportation. According to the NHTS, 82% of vehicles on the road are personal passenger vehicles, with the remaining 18% being commercial vehicles. This study also indicated that the average number of persons per vehicle is approximately 1.67. Finally, the national average hourly wage of $30.07 was used to produce the final outcome.
5. Calculate Roadway Loss of Function per Watershed. Analysis was then completed by determining the roadway loss of function per watershed using the following equation:
((UpPD * VpH * VTpD) * DT) * HVTV
Where:
UpPD = Number of Units per Property Description
VpH = Average Vehicles per Household
VTpD = Average Number of Vehicle Trips per Day
DT = Delay Time
HVTV = Hourly Value of Time per Vehicle
Limitations, Uncertainties, Assumptions, and Sensitivities
In taking care to appropriately identify roadway loss of function within the Target Areas, the following assumptions were made:
12 FEMA (2011). FEMA Benefit-Cost Analysis Re-engineering (BCAR) Development of Standard Economic Values. Page 2. https://www.hudexchange.info/course-content/ndrc-nofa-benefit-cost-analysis-data-resources-and-expert-tips-webinar/FEMA-BCAR-Resource.pdf

Norfolk Coastal Adaptation and Community Transformation Plan Application
Attachment F Benefit Cost Analysis Page IV.1.3.13
The FEMA BCAR 2011 Hourly Value of Time per Vehicle has not been normalized and therefore may be an underestimate when compared to the 2015 valuation.
Analysts assumed, in concurrence with the FEMA Supplement to the Benefit-Cost Analysis Reference Guide, that if a residential property does not have a clearly defined detour then the delay time should apply the standard value of 12 hours per one-way trip.
The FEMA Supplement to the Benefit-Cost Analysis Reference Guide states that “For road or bridge losses that do not have detours, the number of daily trips should be based on the number of one-way trips, and the delay time should be 12 hours per one-way trip.” This again reinforces that this analysis is a conservative estimate in that the analysts used the total number of daily trips and applied 12 hours to the total rather than apply 12 hours per one way trip.
Analysis was only performed on residential properties and therefore the values produced may provide a conservative estimate when it is clear that additional property uses are contained within the inundation areas.
It should be noted that an alternative approach to calculating transportation loss of function would be to look at the trips per day on the roads themselves. Analysts explored this methodology, but determined that the methodology would be inappropriate for use due to the fact that so much of the community, especially within the Ghent Neighborhood and Downtown, would remain at risk to flooding, that the direction of the trips would be critical to consider. Analysts ultimately felt that isolating the evaluation to the residents directly within the Target Area would be both a more conservative and appropriate approach.
Detailed Results
The results of the roadway loss of function costs are presented below in Table IV.1.3.5 by compartment and for the entire proposed project.
Table IV.1.3.5 Total Roadway Loss of Function Costs During the 100-Year Flood Event plus 2.5 Feet of Sea Level Rise
Expected Losses by % Annual Chance Flood Scenario
Expected Benefits
10% 2% 1%
Annualized Value
Net Present Value
Newton’s Creek Watershed
$241,657.35 $321,149.90 $740,870.56 $37,997.44 $524,374.91
Ohio Creek Watershed
$731,331.45 $1,376,810.95 $1,469,022.31 $115,359.59 $1,591,993.45
Total $972,988.90 $1,697,960.85 $2,209,892.87 $153,357.03 $2,116,368.36

Norfolk Coastal Adaptation and Community Transformation Plan Application
Attachment F Benefit Cost Analysis Page IV.1.3.14
Detailed Results
The methods described above were used to calculate the loss of function if essential facilities and critical infrastructure in the Target Area were to flood. The calculations were performed using depth damage functions take from the FEMA BCA toolkit. The essential facilities and critical infrastructure analyzed in this analysis include:
Pump Stations o PS004 o PS005 o PS 141 o PS 147 o WPS-I16-00001 o PS 129 o RS 132 o East Brambleton Avenue - East of May Avenue
Schools o Tidewater Park Elementary School o Ruffner Academy o Chesterfield Heights Academy
Roads
The loss of function value presented below is the cost associated with losing the facility or infrastructure’s critical function. This translates as benefits in the BCA as it represents the costs avoided by protecting the facilities from flooding. These values are added to other losses avoided and additional benefits to determine total annual benefits, net present value, and the benefit cost ratio. Table IV.1.3.6 shows results at the medium scenario for each type of essential facility or critical infrastructure in each watershed by recurrence interval. The net present value is determined using a 50-Year project useful life at a 7% discount rate.13
Coordination with Other Benefits
Essential facilities are analyzed separately from residential and commercial structures when identifying flood risk and the ability to provide service. This is not the case for economic loss of function, also known as output loss. Output loss measures the loss of industry production for businesses and facilities that are impacted by flooding, while facility loss of function values how service interruptions negatively impact the service population. Because the loss of functions and the methods used to determine value varies, it is appropriate to report both losses together, as is the case with schools. This is not the case for pump stations, as the value per capita per day is based on economic data. Therefore, loss of function is valued here for pump stations, and has been removed from the Economic Loss of Function benefits.
13 Association of State Floodplain Managers. 2008. Discount Rate. Page 3. May 17. Located at: http://www.floods.org/PDF/WhitePaper/ASFPM_Discount_%20Rate_Whitepaper_0508.pdf

Norfolk Coastal Adaptation and Community Transformation Plan Application
Attachment F Benefit Cost Analysis Page IV.1.3.15
Table IV.1.3.6 Essential Facility and Critical Infrastructure Loss of Function Results
Facility Loss of Service Costs for Each Annual Chance Flood Scenario
Benefits
10% 2% 1% Annualized Net Present Value Pump Stations Newton’s Creek $32,199,420.00 $32,420,100.00 $33,137,310.00 $4,199,717.10 $57,959,228.97Ohio Creek $275,850.00 $14,997,070.00 $14,997,070.00 $477,497.10 $6,589,816.19Total $32,475,270.00 $47,417,170.00 $48,134,380.00 $4,677,214.20 $64,549,045.16Schools Newton’s Creek $2,357,838.86 $1,905,493.56 $2,388,954.45 $297,783.30 $4,109,631.71Ohio Creek $0.00 $0.00 $515,110.81 $5,151.11 $71,089.13Total $2,357,838.86 $1,905,493.56 $2,904,065.26 $302,934.41 $4,180,720.85Roads Newton’s Creek $241,657.35 $321,149.90 $740,870.56 $37,997.44 $524,374.91Ohio Creek $731,331.45 $1,376,810.95 $1,469,022.31 $115,359.59 $1,591,993.45Total $972,988.90 $1,697,960.85 $2,209,892.87 $153,357.03 $2,116,368.36Total Loss of Function
$35,806,097.76 $51,020,624.41 $53,248,338.13 $5,133,505.64 $70,846,134.37

Norfolk Coastal Adaptation and Community Transformation Plan
Attachment F Benefit Cost Analysis IV.1.4.1
Human Impacts

Norfolk Coastal Adaptation and Community Transformation Plan
Attachment F Benefit Cost Analysis IV.1.4.2
Human Impacts
The implementation of Norfolk’s Coastal Adaptation and Community Transformation Plan is expected to help the City avoid losses normally experienced by the human population as a result of the 1% annual chance flood event plus sea level rise. The details of how such impacts are quantified is presented herein. Human impacts as a result of flood events are evaluated in five ways: fatalities, mental stress and anxiety, lost productivity, business economic loss of function and residential relocation (commonly referred to as displacement costs), and shelter needs. Because shelter needs is inherently captured within the displacement costs calculations, the results developed in this section are not included in the BCR to avoid a duplication of benefits. With that stated, avoidance and reduction of this impact and the others evaluated has the potential to reduce some aspects of social vulnerability that may be present within the Target Area. In turn, the reduction of these impacts will increase resiliency in the social fabric of the community. Table IV.1.4.1 below summarizes the Human Impacts evaluated herein. Table IV.1.4.1 Human Impacts Benefits Calculated Benefit Description Page
Fatalities Avoided
This methodology calculates the potential number of lives lost due to flood events that will be avoided in the Target Area. The number of fatalities are quantified using Federal Aviation Administration (FAA) standard values.
IV.1.4.4
Mental Stress and Anxiety
The proposed project is expected to reduce the psychological impacts associated with residents who personally experience flooding of their homes. This is evaluated using FEMA standard methodology.
IV.1.4.13
Lost Productivity
This differs from mental stress and anxiety as it measures the reduction of psychological effects that impact work productivity for residents who may experience flooding in their homes. This is also evaluated using FEMA standard methodology.
IV.1.4.20
Relocation and Economic Loss of Function
Displacement consists of relocation costs avoided that are associated with the threat and impact of flooding. Displacement is a function of the flood depth and direct physical damage.
IV.1.4.25
Shelter Needs
Shelter needs are considered a function of displacement. While this methodology would be considered a duplication of benefits to Displacement, it is important that these needs be acknowledged and discussed.
IV.1.4.31

Norfolk Coastal Adaptation and Community Transformation Plan
Attachment F Benefit Cost Analysis IV.1.4.3
Fatalities Avoided

Norfolk Coastal Adaptation and Community Transformation Plan
Attachment F Benefit Cost Analysis IV.1.4.4
Fatalities Avoided Fatalities are an unfortunate risk inherent to natural disasters. Flood events are considered some of the most frequently occurring natural hazards, contributing to 44% of natural hazard-related fatalities worldwide.1 Moreover, studies have determined that “coastal flood events are even more catastrophic than inland floods in terms of loss of life.”2 One of the benefits of the Norfolk Coastal Adaptation and Community Transformation Plan flood protection activities is that the risk of fatalities due to storm surge will be greatly reduced. The approach analysts have taken to identify the benefits associated with reduced risk of fatalities is a function of physical damage to structure and contents, population emergency preparedness, and warning system capabilities. According to various news articles, Hurricane Irene resulted in five fatalities throughout the State of Virginia.3 Although no fatalities occurred within Norfolk during this event, this does not indicate the absence of such risk for the City of Norfolk.4 Due to a lack of publicly available data, injuries are not included as a quantified benefit in this methodology. Data Sources Norfolk’s Coastal Adaptation and Community Transformation Plan is expected to reduce the number of fatalities that can be anticipated to occur in the Target Area as a result of storm surge. Most existing methodologies that estimate fatalities use two groups of characteristics: hydraulic characteristics such as water depth, rate of water rising, stream velocities, wind, and temperature; and by area characteristics including factors such as population density, land use, warning systems, and vulnerability of the population.5 Analysts reviewed several approaches that can be used to estimate fatalities as a result of natural disasters:
Methodology One attempts to develop a relationship between water depth and mortality as a fraction of the inhabitants in the area; the main limitation of this method is that the relation is only based on data from one event; circumstances and characteristics of the community have likely changed since the event.6
Methodology Two is dependent upon water depth and the rate of water rise; this method’s limitation is that the number of fatalities estimated are influenced to a large degree by the value chosen for the rate of rising water;7 this has the potential to result in outliers that will skew the results.
Methodology Three considers material loss, population preparedness, and warning
1 International Federation of Red Cross and Red Crescent Societies. 2013. World Disasters Report – Focus on Technology and the Future of Humanitarian Action. [web page] Located at: http://worlddisasterreport.org/en/.
2 Brazdova, M. and J. Riha. 2014. A simple model for estimation of the number of fatalities due to floods in central Europe. Nat Hazards Earth Syst Sci. 14 June 12.
3 Associated Press. 2012. Hurricane Irene Facts: A Region-by-Region Look at the Storm’s Toll. Huffington Post. [web page] located at: http://www.huffingtonpost.com/2012/08/27/hurricane-irene-damage-statistics-2011_n_1832342.html.
4 Associated Press. 2011. Hurricane Irene Deaths. Huffington Post. [web page] located at: http://www.huffingtonpost.com/2011/08/28/hurricane-irene-deaths_n_939421.html.
5 Jonkman, S.N. and J.K. Vrijling. 2002. Loss of life models for sea and river floods. Flood Defence. Wu et al. (eds) Science Press, New York Ltd.
6 Ibid.
7 Ibid.

Norfolk Coastal Adaptation and Community Transformation Plan
Attachment F Benefit Cost Analysis IV.1.4.5
capabilities. Analysts identified this approach as most appropriate since it accounts for both event damage characteristics and the community’s capacity to prepare for and react to flood events, which are related to vulnerability. This is especially important because of Norfolk’s initiatives to increase flood hazard awareness.
The approach chosen to estimate reduced fatalities within the Target Area is based on a study completed by the Brno University of Technology in 2013.8 Through this approach, analysts consider the number of fatalities expected for the 10%, 5%, 2%, and 1% annual chance flood events, including 2.5 ft. of SLR. Additional data required to supplement the Brno approach include standard life safety values from the Federal Aviation Administration (FAA): the FAA’s Willingness to Pay value for one fatality is $5.8 million. The Federal Emergency Management Agency (FEMA) has acknowledged the validity of the life safety values and permits their use in benefit cost analyses. In addition, material loss information from Part IV.1.2 Direct Physical Damages evaluation was used in this approach. Detailed Approach The Brno approach to estimate loss of life is based on three main factors: material loss (in dollars), population preparedness, and warning. The relationship of these factors is expressed in the equation presented below. There are, of course, additional factors that are important to consider in estimating the loss of life in a natural hazard event. Nevertheless, factors such as debris, climatic conditions, water quality, and time of day, were not available for Brno’s analysis due to a lack of data. The equation for fatality estimates is presented below:
0.075 ∗ . ∗ 2 . ∗ 2 . Where: LOL: Loss of life D: Material Loss (in dollars) P: Population preparedness W: Warning D Factor The D factor (material loss) consists of building damage and contents loss; both values are determined through the approach to estimate Direct Physical Damage (Buildings). For the purposes of this analysis, only structure and contents damage for residential structures are evaluated for the appropriate flood scenarios. Such losses are assumed to reflect both the destructive ability of the event and the number of endangered inhabitants. Damage to constructed assets, such as roads or utility systems, are not considered in this analysis. The D Factors for the scenarios analyzed are included in Table IV.1.4.2 below.
8 Brazdova, M. and J. Riha. 2014. A simple model for the estimation of the number of fatalities due to floods in central Europe. Nat Hazards Earth Syst Sci. 14. June 12.

Norfolk Coastal Adaptation and Community Transformation Plan
Attachment F Benefit Cost Analysis IV.1.4.6
Table IV.1.4.2 D Factor for the 10%, 2%, and 1% Annual Chance Events
Cost 10% Annual
Chance 2% Annual
Chance 1% Annual
Chance Building Damage $1,392,748 $6,241,063 $11,089,370
Contents Damage $1,068,024 $5,796,333 $10,233,028
Total Property Loss $2,460,772 $12,037,397 $21,322,397
P Factor Factor P (population preparedness) expresses the preparedness of the community for flood management and resiliency, and is intended to reflect the population’s awareness of flooding and required preparations. This value is determined by rating eight sub-factors on a scale of -1 to 1 according to Figure IV.1.4.1. Analysts interviewed Norfolk City planners and emergency management personnel in order to appropriately capture population preparedness. The City expects that Target Area residents are very knowledgeable about flood risk in their community, as they frequently experience nuisance flooding during small rain events. Nevertheless, larger events such as tropical storms and hurricanes may present potential issues with community preparedness and response. Thus the P Factor is evaluated for three flood scenarios: the 10%, 2%, and 1% annual chance flood events. The following values for P1 to P8 were determined for this analysis (see Table IV.1.4.3).
Aggregated preparedness was determined using the formula ∗ ∑ , where P is the sub-
factor score.9 Table IV.1.4.3 Evaluated P Values
P Subfactor Factor Description
Evaluation of Existing
Conditions (10%)
Evaluation of Existing
Conditions (2%)
Evaluation of Existing
Conditions (1%)
P1 Flood awareness and general knowledge of hazards
0.5 0.5 -0.5
P2 Flood memory 1.0 1.0 0.0P3 Existing flood documentation 1.0 1.0 1.0
P4 Understanding of activities and behavior during floods
0.0 0.0 -0.5
P5 Initiatives and activities of flood committees
1.0 1.0 1.0
P6 Response to hydrological forecast
0.0 0.0 0.0
P7 Response to flood warning 0.5 0.5 -0.5
P8 Evacuation and rescue activities
0.5 0.5 0.5
Aggregated Preparedness 2.25 2.25 0.75
9 Brazdova, M. and J. Riha. 2014. A simple model for the estimation of the number of fatalities due to floods in central Europe. Nat Hazards Earth Syst Sci. 14. June 12.

Norfolk Coastal Adaptation and Community Transformation Plan
Attachment F Benefit Cost Analysis IV.1.4.7
W Factor Factor W (warning) includes those factors that influence warning of the community that an event is forecasted. The contributing factors include a hydrological forecast, the type of warning system employed, the speed of flooding, and the rate of water level rise. The scale of sub-factors is included in Figure IV.1.4.2. To evaluate factor W4, water rise rates were determined based on the storm event hydrographs in Figures IV.1.4.3 through IV.1.4.5. These hydrographs show the 1%, 2%, and 10% annual chance events, plus sea level rise, compared to Hurricane Irene. Evaluations for W1 to W4 values for each flood scenario are provided in Table IV.1.4.4. The aggregated effect of Factor W was
evaluated using the following formula, ∗ ∑ where W is the sub-factor score.10
Table IV.1.4.4 W Values
W Subfactor Subfactor Description
Evaluation of Existing
Conditions (10%)
Evaluation of Existing
Conditions (2%)
Evaluation of Existing
Conditions (1%)
W1 Reliability of hydrological forecast
0.5 0.5 0.5
W2 Speed of flood arrival 0.0 0.0 0.0W3 Warning system 1.0 1.0 1.0W4 Rate of water level rise 0.0 0.0 0.0
Total 0.875 0.875 0.875
10 Brazdova, M. and J. Riha. 2014. A simple model for the estimation of the number of fatalities due to floods in central Europe. Nat Hazards Earth Syst Sci. 14. June 12.

Norfolk Coastal Adaptation and Community Transformation Plan
Attachment F Benefit Cost Analysis IV.1.4.8
Figure IV.2.4.1 P Factor Descriptions
Figure IV.1.4.1 W Factor Descriptions

Norfolk Coastal Adaptation and Community Transformation Plan
Attachment F Benefit Cost Analysis IV.1.4.9
Figure IV.1.4.3 Hydrograph of 1% Annual Chance Event plus Sea Level Rise
Figure IV.1.4.4 Hydrograph of 2% Annual Chance Event plus Sea Level Rise

Norfolk Coastal Adaptation and Community Transformation Plan
Attachment F Benefit Cost Analysis IV.1.4.10
Figure IV.1.4.5 Hydrograph of 10% Annual Chance Event plus Sea Level Rise
Limitations, Uncertainties, Assumptions, and Sensitivities
Although a large cause of lost life during natural hazard events, road damages that result from flooding are not incorporated into the analysis. Therefore, the results presented do not include casualties related to road closures or damage.
Loss of life post-disaster can be affected by many factors not considered in this methodology, including the financial and physical health of the population, mental stress and anxiety, failure to obey or untimely evacuation orders, structure vacancy, and other factors not considered.
Injuries are not considered in this analysis due to a lack of historical data that can be reasonably applied to the Target Area.
Detailed Results
Results are obtained by plugging the factors (D, P, and W) into Equation 1, repeated below for ease of reference. The result of the calculations for each annual chance event evaluated is listed in Table IV.1.4.5.
0.075 ∗ . ∗ 2 . ∗ 2 . Where: LOL: Loss of life D: Material Loss (in dollars) P: Population preparedness W: Warning

Norfolk Coastal Adaptation and Community Transformation Plan
Attachment F Benefit Cost Analysis IV.1.4.11
Table IV.1.4.5. Expected Loss of Life per Flood Scenario Evaluated
Annual Chance Event
Expected Loss of Life
10 percent 0.07 2 percent 0.13 1 percent 0.65
As referenced above, the FAA’s life safety value is $5,800,000 per death. This value can be applied to the expected loss of life to determine the total cost of the lost lives for the BCA. This is considered a loss avoided because the proposed project would prevent the casualties estimated by the methodology. Incorporation into the BCA
The casualty values reported above represent expected fatality losses avoided for the entire Target Area. The benefits for the Target Area as a whole were annualized and given a net present value to incorporate into the BCA (see Table IV.1.4.6). The benefits of avoided fatalities are split equally between Newton’s Creek and Ohio Creek. Table IV.1.4.6. Annualized and Net Present Values for Casualties Benefits
Category 10% Annual
Chance Event 2% Annual
Chance Event 1% Annual
Chance Event Annualized NPV
Study Area Fatalities
$3,779,093.60 $751,165.75 $408,303.10 $93,644.56 $1,292,364.81

Norfolk Coastal Adaptation and Community Transformation Plan
Attachment F Benefit Cost Analysis IV.1.4.12
Mental Stress and Anxiety Benefits

Norfolk Coastal Adaptation and Community Transformation Plan
Attachment F Benefit Cost Analysis IV.1.4.13
Mental Stress and Anxiety Natural disasters threaten or cause loss of health, social, and economic resources, which leads to psychological distress.11 Literature indicates that individuals who experience a high number of stressors, such as property damage or displacement, are more likely to experience symptoms of mental illness, post-traumatic stress disorder (PTSD), and higher levels of stress and anxiety.12 Those with initially low levels of health, social, or economic resources, such as the elderly or low-to medium-income (LMI) individuals, are more vulnerable to the negative impacts of natural disasters and tend to experience relatively steeper declines in emotional and physical health.13 Furthermore, the loss of social, health, and economic resources after a natural disaster is associated with declines in psychosocial functioning,14 the interaction related to one’s psychological development in, and contact with, a social environment. As mental health issues increase after a disaster, so will mental health treatment costs. Increased health care costs burden individuals and society as a whole.15 The overwhelming majority of the Target Area is characterized as LMI and includes various types of vulnerable populations (see Part III Existing Conditions); these populations are at higher risk to mental health impacts after natural disasters. LMI residents have fewer resources to prepare for disaster events and are less prepared to invest in recovery. This can lead to a progressive depletion of resources and hamper recovery efforts.16 Flood protection measures will reduce damage to homes, public transportation, and critical systems, and reduce risk of mental illness post-disaster, as people will be subject to fewer stressors. Existing Conditions Numerous studies have shown that there are mental health impacts after disasters, but only a few studies have tried to place a monetary value on these impacts after disaster events. The American Red Cross (ARC) estimates that 30 to 40% of an impacted population will need mental health assistance.17 Galea (2005) has found that 1 to 11% of an impacted population will experience
11 Hobfoll, S.E. 1989. Conservation of resources: A new attempt at conceptualizing stress. American Psychologist. 44:513–524. [PubMed: 2648906].
12 Rhodes, J., Chan, C.,Pacson, C., Rouse, C.E., Waters, M., and E. Fussell. 2010. The Impact of Hurricane Katrina on the mental and physical health of low-income parents in New Orleans. Am J Orthopsychiatry. April; 80(2): 237-247.
13 Galea, S., Tracy, M., Norris, F., and S.F. Coffey. 2008. Financial and social circumstances and the incidence and course of PTSD in Mississippi during the first two years after Hurricane Katrina. Journal of Traumatic Stress. 21:357–368. [PubMed: 18720399]
14 Sattler, D.N., Preston, A., Kaiser, C.F., Olivera, V.E., Valdez, J., and S. Schlueter. 2002. Hurricane Georges: A crossnational study examining preparedness, resource loss, and psychological distress in the U. S. Virgin Islands, Puerto Rico, Dominican Republic, and the United States. Journal of Traumatic Stress. 15:339–350. [PubMed: 12392221]
15 Office of the Assistant Secretary for Planning and Evaluation. Undated. The Effect of Health Care Cost Growth on the U.S. Economy. United States Department of Health and Human Services. Pages 46 – 49.
16 Sümer, N., Karancı, A.N., Berument, S.K., and H. ve Güneş. 2005. The role of personal resources in predicting psychological distress following the 1999 Marmara, Turkey Earthquake. Journal of Traumatic Stress. 18:331–342. [PubMed: 16281230]
17 Welker, Catherine. 2011. American Red Cross Liaison Officer to FEMA Headquarters Disaster Services. Personal correspondence, December 6.

Norfolk Coastal Adaptation and Community Transformation Plan
Attachment F Benefit Cost Analysis IV.1.4.14
PTSD.18 Wang et al (2007) conducted a survey of Hurricane Katrina survivors and found that 31% of respondents met the criteria for a mood or anxiety disorder.19 Further, research conducted by Schoenbaum et al (2009) demonstrated that the prevalence of mental health issues after Hurricanes Katrina and Rita was 6% for major health issues and 26% for mild to moderate health issues.20 Approximately 86% of the Target Area is characterized as LMI, and vulnerable populations in the Target Area include seniors, people with disabilities, and children. For more details, see Part III Existing Conditions and Attachment F Appendices. These populations are at a higher risk of mental health issues after a disaster event, as they may have lower levels of health, social, or economic resources.21 Historical Losses Mental health impacts of previous natural disasters provide a foundation upon which projected mental health costs can be estimated. While there is little information regarding mental health impacts post-Irene, the mental health impacts of similar events, such as Hurricanes Sandy or Katrina, support an understanding of the impacts that could occur in Norfolk. Modelers have determined Irene to be a 17 year event. Hurricane Sandy is considered to be a 50- to 100-year event,22 and studies have found Katrina to have a 21-year return period.23 Therefore, given the extent of impact in Norfolk after Irene, the impacts of Sandy and Katrina provide a reasonable understanding of what could happen in Norfolk during similar and/or greater events. Furthermore, Norfolk’s Coastal Adaptation and Community Transformation Plan intends to protect against the impacts of a 100-year storm event plus 2.5 feet of SLR, meaning the mental health impacts described throughout this analysis would likely be prevented in the future. After Hurricane Katrina, low-income families were disproportionately stranded in the city or shelters, which increased the chance of experiencing deprivation, stress, and fear.24 Research conducted by Rhodes et al (2010) found that prevalence rates for low–income survivors for mild
18 Galea, Sandro; Nandi, Arijit Nandi; and David Vlahov. 2005. The Epidemiology of Post-Traumatic Stress Disorder after Disasters. Epidemiologic Reviews, (July) 27 (1): 78-91. Located online at: http://epirev.oxfordjournals.org/content/27/1/78.full.pdf+html.
19 Wang, Phillip; Gruber, Michael; Powers, Richard; Schoenbaum, Michael; Speier, Anthony; Wells, Kenneth; and Ronald Kessler. 2007. Mental Health Service Use among Hurricane Katrina Survivors in the Eight Months After the Disaster. Psychiatric Service. Vol. 58 Number 11. November.
20 Schoenbaum, Michael; Butler, Brittany; Kataoka, Sheryl; Norquist, Grayson; Springgate, Benjamin; Sullivan, Greer; Duan, Naihua; Kessler, Ronald; and Kenneth Wells. 2009. Promoting Mental Health Recovery After Hurricanes Katrina and Rita: What Can Be Done at What Cost. Archives of General Psychiatry, Vol. 66, #8, August.
21 Galea S, Tracy M, Norris F, and S.F. Coffey. 2008. Financial and social circumstances and the incidence and course of PTSD in Mississippi during the first two years after Hurricane Katrina. Journal of Traumatic Stress. 21:357–368. [PubMed: 18720399]
22 Sweet, Zervas, Gill, and Park. Hurricane Sandy Inundation Probabilities Today and Tomorrow. Undated. Located at: http://www1.ncdc.noaa.gov/pub/data/cmb/bams-sotc/extreme-events/2012/BAMS-Extremes-of-2012-Section-06.pdf
23 Elsner J.B., Jagger T.H., and Tsonis, A.A., December 2005. Estimated Return Periods for Hurricane Katrina. Located at: http://myweb.fsu.edu/jelsner/PDF/Research/ElsnerJaggerTsonis2006.pdf
24 Spence PR, Lachlan KA, Griffin DR. Crisis communication, race, and natural disasters. Journal of Black Studies. 2007; 37:539–554.

Norfolk Coastal Adaptation and Community Transformation Plan
Attachment F Benefit Cost Analysis IV.1.4.15
to moderate mental illness rose from 23.5% to 37.5%, prevalence for severe mental illness rose from 6.9% to 14.3%, and the prevalence of high perceived stress rose from 20.2% to 30.9%. Additionally, 47.7% of the respondents were classified as having probable PTSD. The New York Times reported that Beth Israel Hospital Medical Center in Lower Manhattan saw a 69% increase in psychiatric patients in the November following Hurricane Sandy, and, in Brooklyn, Maimonides Medical Center reported a 56% increase in psychiatric emergency room visits in the month following the storm.25 Research conducted after Hurricanes Katrina and Sandy provides evidence of increased mental health illness post-disaster and rates at which these increases are likely to occur. The cost of treatment can be estimated using this research. Data Sources The Federal Emergency Management Agency’s (FEMA) Final Sustainability Benefits Methodology Report26 provided a method to calculate benefits related to avoided mental stress and anxiety costs. The 2013 American Community Survey27 5-year estimates provided population data, which were distributed among buildings in the Resiliency Analysis. Flood depths obtained from the Resiliency Analysis were used to determine impacted buildings, and therefore, residents. Detailed Approach Benefits of avoided mental health treatment costs can be based on three factors: cost, prevalence, and course. Prevalence is the percentage of people who experience mental health problems after a disaster event, and course is the rate at which mental health symptoms reduce or increase over time. Cost is simply the cost of treatment to those who seek it. Schoenbaum (2009) provides prevalence percentages and mental health expenses, which FEMA has used to derive a standard value for mental stress and anxiety costs (see Table IV.1.4.7). Prevalence percentages are adjusted over different time periods. Mild to moderate impacts will reduce over time as treatment is provided, and severe mental health problems may persist much longer, possibly never being fully resolved.28 For this reason, mild to moderate prevalence percentages reduce over time, while severe prevalence percentages remain consistent over time. Kessler (2008) supports this trend, reporting increasing rates of PTSD and severe mental health issues between 6 months after a hurricane and approximately 1 year after.29 It is possible, if left
25 Manuel, J. 2013. The Long Road to Recovery. Environmental Health Impacts of Hurricane Sandy. Environmental Health Perspectives. Vol. 121. Number 5. May 1.
26 Federal Emergency Management Agency. Final Sustainability Benefits Methodology Report. August 23, 2012. 27 United States Census. American Community Survey. 2013. Located at: https://www.census.gov/programs-surveys/acs/data.html 28 Schoenbaum, Michael; Butler, Brittany; Kataoka, Sheryl; Norquist, Grayson; Springgate, Benjamin; Sullivan, Greer; Duan, Naihua; Kessler, Ronald; and Kenneth Wells. 2009. Promoting Mental Health Recovery After Hurricanes Katrina and Rita: What Can Be Done at What Cost. Archives of General Psychiatry, Vol. 66, #8, August.
29 Kessler RC, Galea S, Gruber MJ, Sampson NA, Ursano RJ, and S. Wessely. 2008. Trends in mental illness and suicidality after Hurricane Katrina. Molecular Psychiatry. 13:374–384.

Norfolk Coastal Adaptation and Community Transformation Plan
Attachment F Benefit Cost Analysis IV.1.4.16
untreated, that PTSD and severe mental illness become more entrenched over time, while mild or moderate mental illness symptoms can be expected to attenuate.30 Table IV.1.4.7 Prevalence Rates
Time after Disaster Severe Mild/Moderate 7-12 months 6% 26% 13-18 months 7% 19% 19-24 months 7% 14% 25-30 months 6% 9%
Source: FEMA Final Sustainability Benefits Methodology Report. Schoenbaum provides an estimate of treatment costs in an ideal scenario where all needs are met. FEMA argues that treatment costs from the study must be adjusted to consider only those with mental health problems who will actually seek out treatment at approximately 41% of the affected population.31 FEMA uses the following steps to adjust total treatment costs from Schoenbaum for percentage of individuals who seek treatment and prevalence.
∗ ∗ 0.41 This methodology is applied to each time period adjusting for prevalence. The values provided by FEMA have been normalized using the Consumer Pricing Index (CPI) Inflation Calculator,32 and the costs for both severe and mild/moderate mental health problems over each time period are added together to provide a total treatment cost of $2,706.96 for 30 months. Table IV.1.4.8 provides a summary of treatment costs per person in current dollars. Table IV.1.4.8 Cost of Mental Health Treatment after a Disaster
Time after Disaster Severe Mild/Moderate Total per person 7-12 months $ 220.00 $ 691.27 $ 911.2713-18 months $ 256.66 $ 451.98 $ 708.6419-24 months $ 256.66 $ 372.22 $ 628.8825-30 months $ 218.89 $ 239.28 $ 458.17
Total $ 2,706.96 Limitations, Uncertainties, Assumptions, and Sensitivities
Research analysis is limited to 30 months after a disaster; therefore, estimated losses avoided are limited to this time period. Mental health avoided losses beyond 2.5 years
30 Rhodes, J., Chan, C.,Pacson, C., Rouse, C.E., Waters, M., and E. Fussell. 2010.. The Impact of Hurricane Katrina on the mental and physical health of low-income parents in New Orleans. Am J Orthopsychiatry. April; 80(2): 237-247.
31 Wang, Philip S., MD, DrPH; Lane, Michael, MS; Olfson, Mark, MD, MPH; Pincus, Harold
A., MD; Wells, Kenneth B., MD, MPH; and Ronald C. Kessler, PhD. 2005. Twelve-Month Use of Mental Health Services in the United States: Results from the National Comorbidity Survey Replication. Archives of General Psychiatry, v. 62, June.
32 U.S. Bureau of Labor Statistics. Undated. CPI Inflation Calculator. [web page] Located at: http://www.bls.gov/data/inflation_calculator.htm.

Norfolk Coastal Adaptation and Community Transformation Plan
Attachment F Benefit Cost Analysis IV.1.4.17
after a disaster, though expected, are not valued in this analysis.
Benefits are calculated for only 41% of the impacted population because research states that only this portion of the population with mental health issues will seek treatment. This significantly lowers the calculated treatment costs and does not consider the full costs to society. The Lost Productivity methodology provided within this BCA may partly address this limitation.
Detailed Results The results presented below in Table IV.1.4.9 are those for the 1% annual chance event at the medium scenario. The total number of residents who experience flooding are considered impacted for this analysis, and are included in the total population that may seek treatment. The cost of treatment ($2,706.96) was applied to this population to determine mental stress and anxiety costs. Table IV.1.4.9 Results by Watershed Transformation Project
Watershed Residents That May Seek Mental Health
Illness Treatment* Mental Stress and Anxiety Costs
Newton’s Creek
3,135 $ 8,485,515.48
Ohio Creek 842 $ 2,279,327.56Total 3,977 $ 10,764,843.03
Future Trends As population in the area grows, the population that is subject to possible mental health issues after a disaster can be expected to increase. Additionally, the increasing intensity of storms will put more area at risk to the impacts of natural disasters, adding to the population at risk to mental health impacts. An increase in mental health treatment due to population growth is not considered in this analysis. Incorporation into the Benefit Cost Analysis The expected benefits provide an economic value for the first 30 months only because there was insufficient literature to estimate impacts beyond 30 months. Because of this, FEMA adds the results for the recurrence interval at which the project will protect as a lump sum to the net present value rather than determine annual benefits.33 For this analysis, treatment costs for the 10-, 50-, and 100-year event are multiplied by the probability of occurrence (for each event) and added together to obtain annual results, with the assumption that benefits have only been determined for the first 2.5 years after an event. The annual results are integrated with other losses avoided to determine total benefits, net present value, and the benefit cost ratio. The net present value is calculated using a 50-year project useful life at a 7% discount rate.34 The results of this analysis are presented in Table IV.1.4.10 below.
33 Federal Emergency Management Agency. Final Sustainability Benefits Methodology Report. August 23, 2012.
34 Association of Floodplain Managers. 2008. Discount Rate. Page 3. Located at: http://www.floods.org/PDF/WhitePaper/ASFPM_Discount_%20Rate_Whitepaper_0508.pdf

Norfolk Coastal Adaptation and Community Transformation Plan
Attachment F Benefit Cost Analysis IV.1.4.18
Table IV.1.4.10 Expected Losses for 2013 Population by Annual Chance Flood Event
Watershed
Expected Losses by Percent Annual Chance Flood Scenario
Benefits
10% 2% 1% Annualized Net Present
Value Newton’s Creek $1,310,729.37 $2,839,832.93 $8,485,515.48 $272,724.75 $3,763,805Ohio Creek $232,301.95 $1,663,011.68 $2,279,327.56 $79,283.70 $1,094,174Total $1,543,031.33 $4,502,844.60 $10,764,843.03 $352,008.46 $4,857,979

Norfolk Coastal Adaptation and Community Transformation Plan
Attachment F Benefit Cost Analysis IV.1.4.19
Lost Productivity

Norfolk Coastal Adaptation and Community Transformation Plan
Attachment F Benefit Cost Analysis IV.1.4.20
Lost Productivity Work productivity can be directly linked to mental health or illness. Kessler and Frank (1997) found that the average prevalence of psychiatric work loss days35 is 6 days per month per 100 workers, and work cutback days36 is 31 days per month per 100 workers.37 Further research conducted by Kessler et al (2008) found that respondents with serious mental illness will experience a $16,306 reduction in 12-month earnings compared to respondents without mental illness38, and a study of 19 countries by the World Health Organization showed a lifetime 32% reduction in earnings for respondents with mental illness.39 The historical impacts described in the previous section indicate that mental health issues will increase after a disaster, and this, paired with research related to lost productivity due to mental illness, indicates that economic productivity can be impacted by an increase in mental health issues post-disaster.40 The implementation of Norfolk’s Coastal Adaptation and Community Transformation Plan will reduce the number of stressors (such as damage to homes) post-disaster, in turn reducing mental health impacts. Fewer mental health impacts will reduce lost work productivity. Low- to moderate- income (LMI) individuals and vulnerable populations are at greater risk to experience mental health impacts after a natural disaster because they generally have lower levels of health, social, and economic resources. The protection of life, property, and critical infrastructure for LMI and vulnerable populations allows these groups to recover more quickly after disasters, preventing increased psychological distress, stress, and symptoms of mental illness. Existing Conditions The Target Area is home to 2,825 jobs, and a large number of those jobs are held by LMI workers. Industries in the Target Area likely to employ LMI workers include construction, manufacturing, wholesale and retail trade, transportation and warehousing, and accommodation and food service. Additionally, a large number of LMI households and vulnerable populations that reside in the Target Area are subjected to mental health impacts post-disaster, which in turn makes them vulnerable to work productivity losses. For more information regarding jobs and vulnerable populations in the Target Area, see Part III Existing Conditions. 35 A psychiatric work loss day is the complete inability to work or perform normal activities due to mental illness or its treatment.
36 Work cutback day is reduced work activity due to mental illness or its treatment.
37 Kessler RC, Frank RG. The impact of psychiatric disorders on work loss days. Psychol Med. 1997 Jul; 27(4):861-73. PubMed PMID: 9234464.
38 Kessler et al. Individual and Societal Effects of Mental Disorders on Earnings on the United States: Results from the National Comorbidity Survey Replication. American Journal of Psychiatry. 165:6. June 2008.
39 Levinson, et al. 2010. Associations of Serious Mental Illness with Earnings: Results from the WHO World Mental Health Surveys. British Journal of Psychiatry. August; 197(2): 114–121. http://www.ncbi.nlm.nih.gov/pmc/articles/PMC2913273
40 Insel, Thomas. Assessing the Economic Costs of Serious Mental Illness. American Journal of Psychiatry. 165:6 June 2008. / Kessler et al. Individual and Societal Effects of Mental Disorders on Earnings on the United States: Results from the National Comorbidity Survey Replication. American Journal of Psychiatry. 165:6. June 2008.

Norfolk Coastal Adaptation and Community Transformation Plan
Attachment F Benefit Cost Analysis IV.1.4.21
Historical Impacts Hurricane Irene caused substantial economic loss, possibly between 4.7 billion and 40 billion dollars throughout the northeast.41 The Phase 1 application states, “345 homes in the contiguous sub-county target area sustained damage – 187 dwellings affected, 2 residential dwellings destroyed, 28 residential dwellings sustained major damage, and 128 residential dwellings sustained minor damage.” As previously stated, such impacts can increase mental health issues post-disaster. Levinson et al (2010) 42 and Kessler (1997) reveal that mental health issues can impact work productivity, and Schoenbaum et al (2009) 43 shows that mental health issues increase after a disaster. Therefore, it is reasonable that an increase in mental health issues, such as stress, anxiety, and post-traumatic stress disorder (PTSD), after a disaster can contribute to the economic losses associated with disaster events. For more information regarding mental health impacts post disaster, see the Mental Stress and Anxiety section. For more information on the economic impacts of Hurricane Irene, see Part III Existing Conditions. Data Sources The Federal Emergency Management Agency’s (FEMA) Updated Social Benefits Methodology Report provided the approach taken to determine the benefits calculated in this section. Other data sources include:
2013 American Community Survey 5-year estimates: average number of workers per household and income characteristics
City of Norfolk Real Estate Assessor: number of residential units
Flood depths, calculated in the Part IV.1.2 Direct Physical Damages, were used to determine the number of impacted buildings.
Detailed Approach Analysts researched several sources of literature related to lost productivity due to mental illness, and found that Levinson et al (2010)44 conducted research using the World Health Organization’s Mental Health Surveys conducted in 19 countries. The study found that individuals in the United States with mental health illnesses experience as much as a 25.5% reduction in earnings. The national employment compensation in March 2015 was $33.49 per hour.45 This multiplied by the average number of hours worked per day (6.9)46 produces a daily
41 Morici: Economic Impact of Hurricane Irene. 28 August 2011. Located at: http://www.cnbc.com/id/44305225 ; NBC News. Hurricane Irene to deliver blow to economy. Web page. Located at: http://www.nbcnews.com/id/44292442/ns/business-us_business/t/hurricane-irene-deliver-blow-economy/#.VgCLud9Viko
42 Levinson, et al. 2010. Associations of Serious Mental Illness with Earnings: Results from the WHO World Mental Health Surveys. British Journal of Psychiatry. August; 197(2): 114–121. http://www.ncbi.nlm.nih.gov/pmc/articles/PMC2913273
43 Schoenbaum, Michael; Butler, Brittany; Kataoka, Sheryl; Norquist, Grayson; Springgate, Benjamin; Sullivan, Greer; Duan, Naihua; Kessler, Ronald; Wells, Kenneth. 2009. Promoting Mental Health Recovery After Hurricanes Katrina and Rita: What Can Be Done at What Cost. Archives of General Psychiatry, Vol. 66, #8, August 2009.
44 Levinson, et al. 2010. Associations of Serious Mental Illness with Earnings: Results from the WHO World Mental Health Surveys. British Journal of Psychiatry. August; 197(2): 114–121. http://www.ncbi.nlm.nih.gov/pmc/articles/PMC2913273
45 Employer Costs for Employee Compensation. March 2015. United States Department of Labor, Bureau of Labor Statistics.
46 Average week hours of overtime of all employees. Web page. Located at: http://www.bls.gov/news.release/empsit.t18.htm

Norfolk Coastal Adaptation and Community Transformation Plan
Attachment F Benefit Cost Analysis IV.1.4.22
value of $231.08. Thus, a 25.5% reduction in earnings is equivalent to $58.90 daily, or $1,767.77 monthly. Time periods post-disaster are based on prevalence factors presented in the Mental Stress and Anxiety section. The number of months of each time period after the disaster (column 1 of Table IV.1.4.11) is applied to the monthly productivity loss ($1,767.77) to determine possible lost productivity for that time period. Time periods are based on prevalence factors provided by Levinson. Prevalence factors are used to adjust productivity loss, as only a portion of the population will experience mental health impacts post-disaster. The prevalence factor is based on severe mental health issues because there is insufficient literature to document the impacts of mild/moderate mental health issues on productivity.47 Table IV.1.4.11 Productivity Loss Per Worker
Time After Disaster Potential Productivity
Loss Prevalence Factor
Productivity Loss per Worker
1-12 months (12 mo.) $21,213.23 6% $1,272.7913-18 months (6 mo.) $10,606.62 7% $742.4619-24 months (6 mo.) $10,606.62 7% $742.4625-30 months (6 mo.) $10,606.62 6% $636.39
Total Productivity Loss per Worker $3,394.10 The total lost productivity per worker for 30 months is applied to the number of wage-earning residents who will experience flooding during a 1% annual chance event, the level of protection of the project. According to the 2013 American Community Survey 5-year estimates, it can be inferred the average number of workers per household in the City of Norfolk, Virginia is 1.19 workers.48 This figure is applied to the number of households impacted during the 1% annual chance event to determine the number of wage earning residents who will experience flooding. The average number of people per household (2.43)49 along with population data was used to determine number of households in the Target Area (see Table IV.1.4.12). Table IV.1.4.12 Number of Wage Earning Residents
Watershed Number of Households
Number of Wage Earning
Residents Newton’s Creek 5,488 6,530Ohio Creek 1,124 1,337Total 6,611 7,867
47 FEMA. 2014. Updated Social Benefits Methodology Report. December 18.
48 US Census 2013 American Community Survey 5-Year Estimates. Undated. Located at: http://factfinder.census.gov/faces/nav/jsf/pages/community_facts.xhtml#none
49 US Census 2013 American Community Survey 5-Year Estimates. Undated. Located at: http://factfinder.census.gov/faces/nav/jsf/pages/community_facts.xhtml#none

Norfolk Coastal Adaptation and Community Transformation Plan
Attachment F Benefit Cost Analysis IV.1.4.23
Limitations, Uncertainties, Assumptions, and Sensitivities The city is the smallest level of geography at which household and working population
data is available. Therefore, assumptions were made that the average number of workers per household for the City of Norfolk is applicable to the Target Area.
Value is provided for the first 30 months only because there is insufficient literature available to analyze longer periods of time.
Prevalence rates are based on severe mental health issues because there is insufficient literature related to the impacts of mild or moderate mental health issues on work productivity. Therefore, results are considered conservative.
Detailed Results Table IV.1.4.13 below summarizes the loss of productivity by watershed for the 1% annual flood chance, as it is the level of protection of Norfolk’s Coastal Adaptation and Community Transformation Plan. Table IV.1.4.13 Lost Productivity for the 100-Year Event
Watershed Number of Wage Earning Residents
Productivity Loss
Newton’s Creek
6,530 $5,210,403.29
Ohio Creek 1,337 $1,399,586.84Total 7,867 $6,609,990.13
Future Trends As the area impacted by increasingly intense storms grows in size and population, the number of people affected by mental health issues after a disaster will increase; therefore, impacts to work productivity will increase. This increase in work productivity impacts is not accounted for in this analysis. Incorporation into Benefit Cost Analysis The annual value is treated in the same manner as mental health treatment costs and is integrated into the benefit cost ratio. See Table IV.1.4.14 below. Table IV.1.4.14 Expected Losses for Population in 2013 by Annual Flood Chance Event
Watershed
Expected Losses by Percent Annual Chance Benefits
10% 2% 1% Annualized Net Present
Value
Newton’s Creek
$804,833.68 $1,743,756.74 $5,210,403.29 $167,462.54 $2,311,107.92
Ohio Creek $142,641.52 $1,021,147.33 $1,399,586.84 $48,682.97 $671,861.27Total $947,475.20 $2,764,904.08 $6,609,990.13 $216,145.50 $2,982,969.19

Norfolk Coastal Adaptation and Community Transformation Plan
Attachment F Benefit Cost Analysis IV.1.4.24
Relocation and Economic Loss of Function

Norfolk Coastal Adaptation and Community Transformation Plan
Attachment F Benefit Cost Analysis IV.1.4.25
Relocation and Economic Loss of Function
Relocation costs and economic loss of function (ELOF) costs are two consequences of displacement that result from disaster impacts. Relocation costs are associated with moving a household or a business to a new location and resuming life or business in that new location. ELOF cost is associated with the interruption of a business or the removal of a piece of real estate from the market as a result of disaster impacts. Both costs can be derived as a function of displacement time without duplication of benefit. Because the monetary values of ELOF are captured in Part IV.5 Economic Impacts Avoided, the detailed results presented in this section reflect relocation costs only. The value of displacement time can be measured in two ways: restoration time and ELOF. Restoration time is “time for physical restoration of the damage to the building, as well as time for clean-up, time required for inspections, permits and the approval process, as well as delays due to contractor availability.”50 This analysis assumes that all interrupted businesses are eventually able to return to business as usual. As such, ELOF is represented as proportions of restoration time based on the business type and extent of damage. Some businesses may be unable to relocate while they are displaced and will experience ELOF for this entire period; some may relocate and resume business elsewhere. Impacted businesses or residents may thus incur both, one, or neither of relocation and ELOF costs. Care must be taken to ensure that these two costs are accounted for fully and that there is no duplication of benefits between the two values,51 particularly in cases where both costs are incurred. For example, a business may have to restock its damaged inventory before being able to relocate and start operations in a new space, thus incurring both ELOF and relocation costs. The purpose of this methodology is to describe the approach taken to account appropriately for such costs associated with displacement. Data Sources Analysts used methodologies from Hazus 2.1 to differentiate ELOF and restoration times, as well as the costs of relocation, supplemented with localized values. Specifically, analysts used the Flood Technical Manual (TM) calculation for relocation expenses and the Earthquake TM calculation for ELOF based on percent damage to the structure. The Earthquake TM is applicable because of the hazard neutral approach to loss of function; additionally, Hazus methodologies related to flood hazard are often built from methodologies developed for earthquake hazard. While the cause and extent of damage differ for these two hazard types, the consequences of such hazards (damage, displacement, loss of function) are generally the same. As such, the Flood TM will often refer to the Earthquake TM for greater detail; this was the case with detailed calculations necessary to determine ELOF. The data necessary to calculate relocation and ELOF costs were gathered from the sources identified below:
50 Federal Emergency Management Agency. Undated. Multi-hazard Loss Estimation Methodology Flood Model Technical Manual. Page 14-25.
51 Economic loss is calculated as loss of output for industries with impacted structures. The methodology for calculating economic loss is detailed in a separate methodology.

Norfolk Coastal Adaptation and Community Transformation Plan
Attachment F Benefit Cost Analysis IV.1.4.26
Direct Physical Damages (Buildings). Building damage, contents and inventory loss, and restoration time evaluated for each structure in the Direct Physical Damages section are used.
Hazus 2.1 One-time Disruption Cost Defaults. Hazus provides one-time relocation costs per SF based on occupancy type. These costs are provided in 2006 dollars and have been normalized to 2015 dollars based on inflation.
2009-2013 American Community Survey 5-Year Estimates, Occupied Housing Units. This dataset identifies the number of owner-occupied and rented residential structures in the Target Area. Hazus 2.1 default occupancy values were applied to commercial structures (see Appendix F-11: Depth Damage Functions).
Hazus 2.1 Construction Time Modifiers. Modifiers represent median values for probability of business or service interruption for various occupancy classes based on damage state and restoration time.
FEMA BCA Toolkit 5.1.52 Analysts extracted depth displacement tables from FEMA’s BCA Toolkit to determine displacement time for structures based on flood depth. These tables were compared to restoration time ranges provided within the Hazus 2.1 Flood TM and found to be conservative in comparison (see Appendix F-7 Hazus Technical Manual Excerpts). It should be noted that these tables do not consider flooding below grade (see Assumptions).
Detailed Approach Analysts followed a series of steps to determine expected relocation and ELOF impacts from storm surge consistent with that experienced during Hurricane Irene. To do so, an analysis was performed to identify structures expected to be impacted for the 10%, 2%, and 1% annual chance events. These structures were then assigned a percentage of owner-occupancy rates, rental rates, and damage state. Owner-occupancy and rental rates were based on local data and the structure’s designated occupancy code; the damage state was assigned based on the percentage of structure damage calculated through the Direct Physical Damages analysis. Table IV.1.4.15 below shows the percent damage threshold for each damage state assigned. Table IV.1.4.15 Damage State Correlations
Damage State None Slight Moderate Extensive Complete Correlating Percent Damage Threshold
0% 1% 5% 25% 50%
Source: Hazus 2.1 Earthquake TM The steps to identify expected relocation and ELOF impacts referenced above are described in more detail below:
52 Federal Emergency Management Agency. 2015. Benefit Cost Toolkit Version 5.1. February 11. Located at: http://www.fema.gov/media-library/assets/documents/92923.

Norfolk Coastal Adaptation and Community Transformation Plan
Attachment F Benefit Cost Analysis IV.1.4.27
1. Evaluate restoration time. Analysts correlated estimated flood depth within each structure to USACE depth displacement tables to estimate restoration times for each flood scenario (see Appendix F-12: Code Mapping for Structures and Industries).
2. Occupancy Mapping. Analysts mapped Norfolk Building Classes to Hazus Occupancy codes in order to make appropriate use of Hazus values (Appendix F-12: Code Mapping for Structures and Industries).
3. Determine local rental rates by occupancy. Local rent rates within the Target Area were researched and applied by occupancy. To establish local rent rates, analysts conducted an online survey of residential and commercial structures available for rent within the Target Area; Loopnet, Trulia, and Zillow (all online real estate services) were used to conduct the survey. Available rental units were categorized by commercial and residential uses, and then analysts calculated an average rent price per square foot per year for each use. The results show that the average annual lease per square foot for commercial properties is $11.53, and the average annual lease per square foot for residential properties is $10.17. These values were then converted to an average lease per square foot per day (Price/SF/Day) for use in the Relocation Expenses calculation outlined below.
4. Process relocation expenses. The Hazus Flood TM provides guidance to calculate displacement expenses, or disruption costs, to building occupants based on occupancy type using the following equation.
RELi = Σ if %DAM - BLi,j > 10%: Fai,j * [ (1 - %OOi) * (DC1) + %OOi * (DCi + RENTi * RTi,j)] Where:
RELi = Relocation costs for occupancy class i Fai,j = Floor area of occupancy group I and depth j (in square
feet) %DAM - BLi,j
= Percent building damage for occupancy I and water depth j, (from depth-damage function), if greater than 10%
DCi = Disruption costs for occupancy i RTi,j = Recovery time (in days) for occupancy I and water depth j %OOi = Percent owner occupied for occupancy i RENTi = Rental cost ($/ft2/day) for occupancy i
It is important to note that the equation detailed above incorporates owner-occupied structures when calculating displacement values. The reason for this is that a renter who has been displaced would likely cease to pay rent to the building owner of the damaged property, and instead would pay rent to a new landlord. As such, the renter could reasonably be expected to incur no new rental expenses. Conversely, if the damaged property is owner-occupied, then the owner will have to pay for new rental costs in addition to any existing costs while the building is being repaired. This model assumes it unlikely that an occupant will relocate if a building is slightly damaged (less than 10% structure damage). 5. Determine ELOF costs. The ELOF expected to be incurred by businesses that occupy
damaged structures was calculated using the following equation.

Norfolk Coastal Adaptation and Community Transformation Plan
Attachment F Benefit Cost Analysis IV.1.4.28
LOFds = BCTds * MODds
Where: LOFds = Loss of function for damage state BCTds = Building construction for cleanup time for damage MODds = ELOF modifiers for damage state (Appendix F-7:
Hazus Technical Manual Excerpts) 6. Complete the analysis. The analysis described above was completed for damages expected
at four recurrence intervals: the 10%, 2%, and 1% annual chance flood events, including sea level rise.
Analysts used the ELOF values to then calculate the loss of output for businesses in various industries; another methodology provided by Hazus. The methodology for loss of output calculations, in addition to an economic impact analysis of such losses, is provided as a separate methodology. Limitations, Uncertainties, Assumptions, and Sensitivities In taking care to appropriately identify restoration time and ELOF so that benefits are not duplicated when calculating relocation expenses and output losses, the following assumptions were made:
Some businesses will choose to relocate their operations while structure damage is being repaired to minimize output loss. To do so, these businesses may rent additional space elsewhere, thus choosing to incur relocation costs during building restoration as opposed to economic losses; this scenario assumes that business output will remain the same upon relocation.
ELOF does not occur until the building reaches greater than 10% structural damage, calculated in the Direct Physical Damages Evaluation.
Analysts assume, in concurrence with Hazus 2.1, that businesses that qualify as entertainment (COM8), theatres (COM9), parking facilities (COM10), and heavy industry (IND1) will not relocate after a disaster due to the type of activities that take place in such structures. As such, no relocation costs are associated with these uses, though ELOF is associated with such uses.
Depth displacement tables used in the analysis do not consider flooding below grade. Utilities often lie below structure the first floor elevation in Norfolk. When these areas flood, occupants may be displaced due to interruptions in utility service, even if flood waters do not reach above the first floor.
See Appendix F-11: Depth-Damage Functions for Buildings, Contents, and Inventory for the depth displacement tables used in the analysis.
Despite aforementioned limitations and assumptions in the Relocation and Economic Loss of Function approach, there is a high certainty in the analysis as the approach has been approved by at least one federal agency. Nevertheless, there are uncertainties with regard to underground utility networks and flooding that could exacerbate that loss. Further, LiDAR was used to

Norfolk Coastal Adaptation and Community Transformation Plan
Attachment F Benefit Cost Analysis IV.1.4.29
determine grade elevations, with site checks in several areas. Uncertainty in commercial owner occupancies is also acknowledged, as well as post-disaster behavior of residents and businesses. Detailed Results The results of the relocation costs are presented below in Table IV.1.4.16 by compartment and for the entire proposed project. ELOF costs are presented in the Economic Losses section. Table IV.1.4.16 Total Relocation Expected Losses and Benefits by Flood Scenario and Compartment
Watershed
Expected Losses by % Annual Chance Flood Scenario
Expected Benefits
10% 2% 1% Annualized
Value Net Present
Value Newton’s Creek Watershed
$925,259 $1,823,470 $2,635,941 $155,355 $2,144,011
Ohio Creek Watershed
$78,621 $356,208 $578,102 $20,767 $286,603
Total $1,003,880 $2,179,678 $3,214,043 $176,122 $2,430,615

Norfolk Coastal Adaptation and Community Transformation Plan
Attachment F Benefit Cost Analysis IV.1.4.30
Shelter Needs

Norfolk Coastal Adaptation and Community Transformation Plan Application
Attachment F Benefit Cost Analysis IV.1.4.31
Shelter Needs After a disaster, significant flooding can prevent individuals from accessing their homes. Even though a home may not be damaged, residents could be displaced if they are evacuated or cannot physically access their property by foot, vehicle, or transit due to flooded roadways or transit systems.53 Approximately 11,840 people in the Target Area are at risk to displacement due to flooding during storm events. Low-income individuals, as well as young families and the elderly, are more likely to seek shelter.54 Approximately 44% of the population in the Target Area is either less than 5 years old or older than 65, and 86% of the total population are low- to moderate- income individuals. For more information regarding vulnerable populations see Part III Existing Conditions. The shelter needs of such populations are recognized within this approach, however quantified benefits associated with such needs are included in the Relocation and Economic Loss of Function benefits. Therefore, the benefits developed in this section are not incorporated into the overall BCR. Historical Impacts Documented accounts of shelter needs during previous disasters provide context to impacts calculated below. In response to expected impacts of Hurricane Irene, shelters started opening on Friday the 26th55 and mandatory evacuation for low-lying areas of Norfolk began 8:00 am on Saturday August 27th, 2011.56 Jim Redick, Emergency Management Director, stated, although evacuation orders were given prior to Irene and public shelters were activated, many people chose to shelter in local churches. Recognizing this trend in Norfolk, Operation Brother’s Keeper, a faith based shelter program, has since been implemented. Figure IV.1.4.6 below identifies the locations of Operation Brother’s Keeper shelters in the City of Norfolk.
53 FEMA. Undated. HAZUS Flood Technical Manual. Pg. 432 Located at: http://www.fema.gov/media-library-data/20130726-1820-25045-8292/hzmh2_1_fl_tm.pdf
54 FEMA. Undated. HAZUS Flood Technical Manual. Pg. 432 Located at: http://www.fema.gov/media-library-data/20130726-1820-25045-8292/hzmh2_1_fl_tm.pdf
55 Associated Press. 2011. Voluntary Evacuations Issued in Virginia in Anticipation of Hurricane Irene. August 25. http://www.wusa9.com/news/article/164333/188/Voluntary-Evacuations-Issued-In-Va-
The Virginian-Pilot. 2011. Hurricane Guide/ Irene-related evacuations in Virginia. August 26. http://hamptonroads.com/2011/08/hurricane-guide-irenerelated-evacuations-virginia
56 Associated Press. 2011. State-by-state glance at how Hurricane Irene is predicted to strike states all along the Eastern Seaboard. http://archive.kare11.com/pdf/Hurricane_Irene_state_breakdown.pdf

Norfolk Coastal Adaptation and Community Transformation Plan Application
Attachment F Benefit Cost Analysis IV.1.4.32
Figure IV.1.4.6 Locations of Operation Brother’s Keeper Shelters

Norfolk Coastal Adaptation and Community Transformation Plan Application
Attachment F Benefit Cost Analysis IV.1.4.33
Detailed Approach Short-term sheltering needs are based on a displaced population, determined using flood depths. Access to an area is obstructed at a depth between 6 inches (the typical height of a curb) and 12 inches (when vehicles begin to float). For this analysis, any residential unit with a flood depth that equals or exceeds 12 inches will cause displacement of residents and a need for short-term sheltering. Therefore, the displaced population is the sum of the residential population located within the area where flood depth is equal to or greater than 12 inches. Analysts have assigned a population to each building based upon the share of residential square footage per building compared to the total residential square footage in the census block group. The ratio of building square footage to total residential square footage in the block group is applied to the total population in the census tract to determine the share of the total population in each building. The residential buildings that experience 12 inches of flooding or greater are considered impacted in this analysis, and the population assigned to these buildings is considered the displaced population. The number of displaced population seeking shelter is adjusted to account for the likelihood that an individual may seek out other shelter options, such as a hotel or staying with friends or family. Based on FEMA’s Hazus methodology, two factors impact these choices: income and age.57 Individuals who seek shelter are most likely low-income and/or do not have family in the area, and age is a secondary role, as some individuals may seek shelter even if they have the financial means to do otherwise.58 Low-income families lack the means to find other shelter, and young and elderly families may prefer to use publicly provided shelters; even so, these populations tend to be lower income or dependent on fixed incomes.59 As a result, weight and modification factors are based primarily on income. FEMA has developed a constant to adjust for income and age. The following equations, provided by Hazus, are used to calculate the number of people using shelters.
∗
∗ ∗
To calculate the constant, the following equation was used:
∗ ∗
Default weight and modification factors (Table IV.1.4.17 and Table IV.1.4.18), taken from FEMA’s Hazus methodology, were used in this analysis to determine the constant described in
57 Federal Emergency Management Agency. Undated. HAZUS Flood Technical Manual. Located at: http://www.fema.gov/media-library-data/20130726-1820-25045-8292/hzmh2_1_fl_tm.pdf
58 Federal Emergency Management Agency. Undated. HAZUS Flood Technical Manual. Located at: http://www.fema.gov/media-library-data/20130726-1820-25045-8292/hzmh2_1_fl_tm.pdf
59 Federal Emergency Management Agency. Undated. HAZUS Flood Technical Manual. Located at: http://www.fema.gov/media-library-data/20130726-1820-25045-8292/hzmh2_1_fl_tm.pdf

Norfolk Coastal Adaptation and Community Transformation Plan Application
Attachment F Benefit Cost Analysis IV.1.4.34
the second equation. The percentage of the population in each income and age class (as organized in Table IV.1.4.17) was determined for each census block group in the Target Area. Table IV.1.4.17 Relative Modification Factors
Class Description Default
Default for Communities with 60% or More of
Households with Income > $35,000
Income IM1 Household Income < $10,000 0.40 0.46
IM2 $10,000 < Household Income < $15,000
0.30 0.36
IM3 $15,000 < Household Income < $25,000
0.15 0.12
IM4 $25,000 < Household Income < $35,000
0.10 0.05
IM5 $35,000 < Household Income 0.05 0.01Age AM1 Population under 16 Years Old 0.05 -
AM2 Population Between 16 and 65 Years Old
0.20 -
AM3 Population Over 65 Years Old 0.50 -
Source: HAZUS
Table IV.1.4.18 Weight Factors for Income and Age
Class Description Default IW Income Weighting Factor 0.80AW Age Weighting Factor 0.20
The average number of persons per household in the City of Norfolk (2.43)60 was applied to the number of people using a shelter (calculated using the first equation) to estimate the number of households seeking shelter. Limitations, Uncertainties, Assumptions, and Sensitivities Sensitivity analyses conducted by FEMA indicated that small modifications in weight and modification factors had little effect on the estimated shelter needs. It was recommended that these factors are used unless there are statistical data available on who uses shelters.
Default income and wage factors are applicable to the Target Area.
60 US Census 2010 data. Undated. Located at: http://factfinder.census.gov/faces/tableservices/jsf/pages/productview.xhtml?src=CF
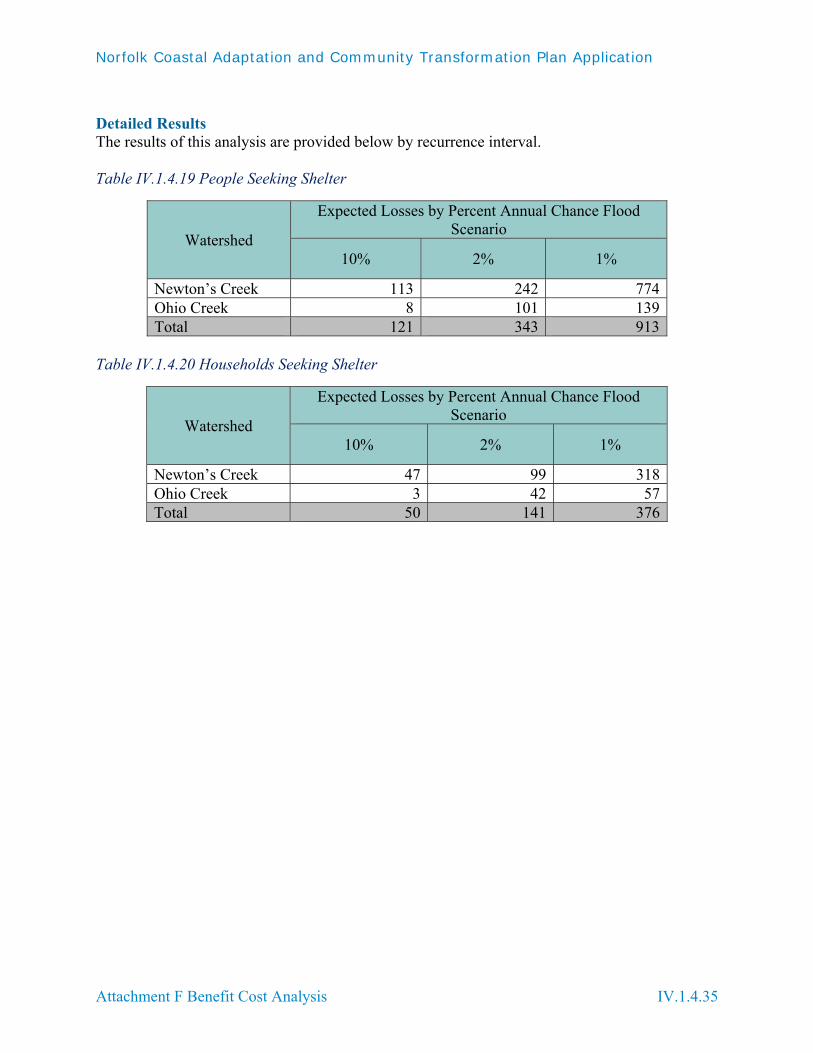
Norfolk Coastal Adaptation and Community Transformation Plan Application
Attachment F Benefit Cost Analysis IV.1.4.35
Detailed Results The results of this analysis are provided below by recurrence interval. Table IV.1.4.19 People Seeking Shelter
Watershed
Expected Losses by Percent Annual Chance Flood Scenario
10% 2% 1%
Newton’s Creek 113 242 774Ohio Creek 8 101 139Total 121 343 913
Table IV.1.4.20 Households Seeking Shelter
Watershed
Expected Losses by Percent Annual Chance Flood Scenario
10% 2% 1%
Newton’s Creek 47 99 318Ohio Creek 3 42 57Total 50 141 376

Norfolk Coastal Adaptation and Community Transformation Plan
Attachment F Benefit Cost Analysis IV.2.1
2.0 Environmental Values

Norfolk Coastal Adaptation and Community Transformation Plan
Attachment F Benefit Cost Analysis IV.2.2
Environmental Value
Norfolk’s Coastal Adaptation and Community Transformation Plan will accomplish the following, all of which will provide an abundance of environmental benefits:
Develop new wetlands; Enhance existing wetlands Add permeable pavers, rain gardens, trees, grasses, and shrubs Enhance waterfront areas and shoreline habitats; Add stormwater management and storage features Add living shorelines
Environmental benefits of Norfolk’s Coastal Adaptation and Community Transformation Plan can be grouped into two categories based on valuation methods: those associated with the ecosystem goods and services of natural capital (calculated using the Federal Emergency Management Agency methodology) and those associated with green infrastructure (GI) (calculated using the Green Infrastructure Guide). The environmental benefits of green infrastructure, are inherently ecosystem services, but are differentiated here for methodological purposes.
Ecosystem Goods and Services
Source: Earth Economics
Natural capital is the world’s stock of natural assets, such as soil, air, water, and all living things. Natural capital provides a stream of benefits to individual people and to society as a whole. Goods and services produced by natural capital that benefit people are called ecosystem goods and services. For example, natural capital, such as forests and soils, provide the ecosystem service of filtering water independent of treatment plants.
Ecosystem services can be grouped into four broad categories1:
Provisioning services: produce the physical materials that society uses. Everything in our economy is made from natural capital such as minerals, gases, and living things.
Regulating services: create and maintain a healthy environment. Ecosystems can
1 Earth Economics. 2015. Earth Economics Ecosystem Valuation Toolkit. [Web page] Located at: http://esvaluation.org/ecosystem-services/

Norfolk Coastal Adaptation and Community Transformation Plan
Attachment F Benefit Cost Analysis IV.2.3
provide flood and storm protection, water quality, and gas and climate stability. These services contribute to ecosystem functions and economic resilience.
Supporting services: maintain conditions for life, such as habitat or genetic diversity.
Cultural services: provide meaningful human interaction with nature. Services include spiritual, recreational, aesthetics, educational, and scientific uses.
Green Infrastructure
Beyond the primary purpose of capturing and storing stormwater runoff, which reduces flood risk, GI can improve air quality, contribute to climate regulation, reduce energy use, reduce capital infrastructure costs, and mitigate the impacts of urban heat island effect.2
Existing studies and methods allowed analysts to value the following ecosystem goods and services provided by natural capital and green infrastructure, listed in Table IV.2.1.
Table IV.2.1 Environmental Benefits Valued
Environmental Benefit
Wetlands
Riparian
Green Open Space
Bioretention Feature
Permeable Pavers
Rain Garden
s Trees
Grass/ Planted Cover
Provisioning Services
Food
Fiber/Raw Materials
Fuel
Water Supply
Regulating Services Hurricane Storm Hazard Risk Reduction
Earth Quake Risk Reduction
Waste Reduction and Filtration/Water Quality
2 Center for Neighborhood Technology. 2010. The Value of Green Infrastructure: A Guide to Recognizing Its Economic, Environmental, and Social Benefits. Pages 9-15. Located at: http://www.cnt.org/sites/default/files/publications/CNT_Value-of-Green-Infrastructure.pdf
Valued in this analysis
Value available or can be obtained
Study may exist

Norfolk Coastal Adaptation and Community Transformation Plan
Attachment F Benefit Cost Analysis IV.2.4
Environmental Benefit
Wetlands
Riparian
Green Open Space
Bioretention Feature
Permeable Pavers
Rain Garden
s Trees
Grass/ Planted Cover
Climate Regulation Water Retention/Flood Hazard Reduction
Fire Hazard Risk Reduction
Air Quality
Supporting Services
Nutrient Cycling
Habitat
Biological Control
Primary Productivity
Erosion Control
Soil Formation
Pollination
Cultural Services
Recreation/Tourism*
Scientific Value
Educational Value
Aesthetic Values*
Spiritual/cultural*
Biodiversity
*Quantified in the Social Benefits Section of the Benefit Cost Analysis.
Benefit Valuation Methods
The benefits provided by ecosystem goods and services and GI can be valued in a fashion similar to that of economic benefits valued in the economy. Economic valuation theory typically relies on people’s willingness to pay for a good or service. Under the umbrella of willingness to pay theory are numerous valuation methods including contingent valuation, hedonic pricing, and travel cost. Other methods used to value environmental benefits include factor income, replacement cost, avoided cost, and market price. Table IV.2.2 outlines each of these methodologies in brief.
These methodologies can be used to develop factors specific to the Target Area, a time and resource intensive process, or through the transfer of benefit factors from studies of areas similar to the Target Area. For this analysis, the benefits of ecosystem goods and services are calculated through value, or benefit, transfer. The “transfer” refers to the application of derived values from the original study site to the goods and services provided by the project site. Benefit transfer has

Norfolk Coastal Adaptation and Community Transformation Plan
Attachment F Benefit Cost Analysis IV.2.5
become popular to value the ecosystem services of natural capital, as it allows for timely and cost-effective analyses.
Table IV.2.2 Environmental Benefits Valuation Methods
Summary of Amenities
The environmental benefits quantified in this section rely on preliminary yet reliable conceptual design estimates presented in the Project Description section and in the conceptual designs on the following page (Figures IV.2.1, IV.2.2, and IV.2.3). Table IV.2.3 summarizes the proposed amenities and features that contribute environmental benefits.
Table IV.2.3 Summary of Proposed Amenities and Features Amenities and Features Newton's Creek Ohio Creek Manicured Parks Shade Trees (EA) 468 Shrubs (EA) 3,803 Grass / Planted Groundcover (SF) 140,400 Sports Fields Grass / Planted Groundcover (SF) 92,800 Waterfront Promenade Shade Trees (EA) 648 Shrubs (EA) 4,320 Grass / Planted Groundcover (SF) 129,600 Constructed Wetlands Vegetation (SF) 884,000 302,000 Permeable Walkways (SF) 44,200 15,100
Method Description Example
Contingent Valuation Involves directly asking people how much they are willing to pay for an environmental service
Asking people how much they are willing to pay for the protection of shoreline and beaches
Hedonic Pricing Estimates economic values for ecosystems services that directly affect market price
Impact of ecosystem services, such as a scenic view, on housing prices
Travel Cost Cost of travel required to consume or enjoy ecosystem services
Determining the cost users incur when traveling to and using parks
Factor Income Enhancement of income by the ecosystem service provision
Increased commercial fishery catch and income due to water quality improvements
Replacement Cost Cost of replacing ecosystem services with man-made systems
Replacing natural nutrient waste treatment with water treatment systems
Avoided Costs Value of costs that would be incurred in the absence of an ecosystem service
Flood control provided by barrier islands avoids property damage along coastlines
Market Price Prices set in the marketplace that appropriately reflect the value to the “marginal buyer”
Market price of wood

Norfolk Coastal Adaptation and Community Transformation Plan
Attachment F Benefit Cost Analysis IV.2.6
Amenities and Features Newton's Creek Ohio Creek Water Street Park Shade Trees (EA) 200 Shrubs (EA) 175 Planted Groundcover (SF) 60,000 Waterfront Parks Shade Trees (EA) 460 Shrubs (EA) 3,738 Grass / Planted Groundcover (SF) 138,000 Rain Gardens Shade Trees (EA) 111 18 Shrubs (EA) 888 144 Planted Groundcover (SF) 26,640 4,320 Permeable Parking Area Permeable Parking (SF) 85,500 Protected Coastal Wetlands Living Shoreline (LF) 1,200 2,200 Bioretention Features Area (SF) 746,000
*EA: each, SF: square feet, LF: linear feet
Figure IV.2.1 Newton’s Creek Perspective Conceptual Design

Norfolk Coastal Adaptation and Community Transformation Plan
Attachment F Benefit Cost Analysis IV.2.7
Figure IV.2.2 Ohio Creek Perspective Conceptual Design

Norfolk Coastal Adaptation and Community Transformation Plan
Attachment F Benefit Cost Analysis IV.2.8
Figure IV.2.3 Target Area Blue Green Network Conceptual Design

Norfolk Coastal Adaptation and Community Transformation Plan
Attachment F Benefit Cost Analysis IV.2.9
Data Sources
The resources used in this analysis include the Federal Emergency Management Agency’s (FEMA’s) Final Sustainability Benefits Methodology Report3, The Value of Green Infrastructure: A Guide to Recognizing Its Economic, Environmental, and Social Benefits (The Green Infrastructure Guide) developed by the Center of Neighborhood Technology4, and Earth Economics5. Data needs and sources include:
U.S. Department of Agriculture, U.S. Forest Service, Piedmont Community Tree Guide6: To value the environmental benefits of added trees, analysts used annual ecosystem service estimates for trees.
Yang J., Yu Q., and Gong P. 2008. Quantifying air pollution removal for green roofs in Chicago 7: Analysts used annual pollutant uptake and annual carbon sequestration for grasses and vegetation to estimate annual carbon sequestration and pollutant uptake for grasses and vegetation.
Electric Power Research Institute (EPRI): To determine reduced energy use due to reduced water treatment needs, analysts used an estimated energy use (kWh) per gallon of water treated.
Piedmont Community Tree Guide, Green Infrastructure Guide, Stern’s Review, Executive Order 12866, and the National Highway Traffic Safety Administration Final Regulatory Impact Analysis (FRIA): Analysts used the cost per pound of pollutant provided by the listed sources to obtain a monetary value for reduced pollutant emissions.
U.S. Environmental Protection Agency (EPA) Emissions and Generation Resource Integrated Database (eGRID): Emission factors provided by eGRID are used to determine the total amount of reduced pollutant emissions based on reduced energy use.
U.S. Climate Data: Annual precipitation is used along with other factors to determine annual runoff reduction.
Green Infrastructure Guide or HydroCAD: Similarly, retention rates a needed to determine annual runoff reduction for green infrastructure features.
Detailed Approach
3 FEMA. 2012. Final Sustainability Benefits Methodology Report. Contract: HSFEHQ-10-D-0806. August 23.
4 Center of Neighborhood Technology (CNT). 2011. The Value of Green Infrastructure: A Guide to Recognizing Its Economic, Environmental and Social Benefits (The Green Infrastructure Guide). January 21.
5 Earth Economics. 2015. Earth Economics Ecosystem Valuation Toolkit. [Web page] Located at: http://esvaluation.org/ecosystem-services/
6 McPherson, E.G., Simpson, J.R., Peper, P.J., Gardner, S.L., Vargas, K.E., Maco, S.E., and Q. Xiao. 2006. Piedmont Community Tree Guide: Benefits, Costs, and Strategic Planting. November.
7 Yang J., Yu Q., and Gong P. 2008. Quantifying air pollution removal for green roofs in Chicago. Atmospheric Environment. 42 7266-7273. 17 March.

Norfolk Coastal Adaptation and Community Transformation Plan
Attachment F Benefit Cost Analysis IV.2.10
FEMA values ecosystem goods and services based on the square footage of different types of vegetative areas (green open space, wetlands, and riparian), and the Green Infrastructure Guide values the environmental benefits of GI. It was determined that, for certain ecosystem services, such as air quality, it was possible to calculate benefits using both methods depending on the type of feature. When this occurs, low, medium, and high results are presented in this methodology to provide a range of benefits and illustrate sensitivity. Furthermore, it became evident that some of the benefits provided by green infrastructure could not be calculated using the Green Infrastructure Guide, but it was possible to use FEMA methodology, or vice versa. When this occurs, a combination of benefits is calculated, and the combined benefits are included in the benefit cost ratio, as they capture the full range of environmental benefits regardless of methodology. For example, the GI Guide provides a method to calculate air quality and climate regulation benefits of grass, but it does not consider water retention or erosion control, which is are benefits associated with green open space, as stated by FEMA. A summary of this evaluation is provided in Table IV.2.4 below.
Table IV.2.4 Benefit Methodology Crosswalk Feature Environmental Benefit Aesthetic Benefit* Recreation Benefit*
Ohio Creek Sports Fields Grass/Planted Cover GI Guide and FEMA Earth Economics or
FEMA Earth Economics or FEMA Concrete Walkways -
Constructed Wetlands Vegetation GI Guide and FEMA
Earth Economics or FEMA
- Permeable Walkways GI Guide Earth Economics or
FEMA Bioretention Features GI Guide and FEMA Waterfront Parks Shade Trees GI Guide
Earth Economics or FEMA
- Grass/Planted Cover GI Guide and FEMA Earth Economics or
FEMA Concrete Walkways - Rain Gardens Shade Trees GI Guide
Earth Economics or FEMA
- Grass/Planted Cover GI Guide and FEMA Earth Economics or
FEMA Concrete Walkways - Permeable Parking Permeable Parking GI Guide - - Living Shoreline
Living Shoreline FEMA Earth Economics or FEMA
Earth Economics or FEMA
Newton’s Creek Manicured Parks Shade Trees GI Guide
Earth Economics or FEMA
- Grass/Planted Cover GI Guide and FEMA Earth Economics or
FEMA Concrete Walkways - Waterfront Promenade

Norfolk Coastal Adaptation and Community Transformation Plan
Attachment F Benefit Cost Analysis IV.2.11
Feature Environmental Benefit Aesthetic Benefit* Recreation Benefit* Shade Trees GI Guide
Earth Economics or FEMA
- Grass/Planted Cover GI Guide and FEMA Earth Economics or
FEMA Concrete Walkways - Constructed Wetlands Vegetation GI Guide and FEMA Earth Economics or
FEMA Earth Economics or FEMA Permeable Walkways GI Guide
Water Street Park Shade Trees GI Guide Earth Economics or
FEMA or Tree Guide
-
Planted Ground Cover GI Guide and FEMA Earth Economics or FEMA Concrete Walkways -
Rain Gardens
Shade Trees GI Guide Earth Economics or FEMA
-
Grass/Planted Cover GI Guide and FEMA Earth Economics or FEMA Concrete Walkways -
Living Shoreline
Living Shoreline FEMA Earth Economics or FEMA
Earth Economics or FEMA
*Quantified in the Social Benefits of the Benefit Cost Analysis. Shrubs are not included in this table because there is insufficient data to calculate environmental benefits. Shrubs do contribute to aesthetic benefits, which are captured in the Social Benefits.

Norfolk Coastal Adaptation and Community Transformation Plan
Attachment F Benefit Cost Analysis IV.2.12
Green Infrastructure Benefits

Norfolk Coastal Adaptation and Community Transformation Plan
Attachment F Benefit Cost Analysis IV.2.13
Green Infrastructure
The environmental benefits of GI elements rely on various approaches derived from the Green Infrastructure Guide and Earth Economics, and are grounded in avoided cost, replacement cost, and market value as valuation methods.
Basic steps taken to value environmental benefits of GI:
1. Quantify the benefit by a defined resource unit. For example, gallons of water intercepted.
2. Translate the estimate of total resource units received from a given benefit to a dollar figure.
a. At this point, different valuation methods (avoided cost, replacement cost, and market value) are used to assign a dollar value to the environmental benefit.
Source: Center for Neighborhood Technology. U.S. Environmental Protection Agency. The Economic Benefits of Green Infrastructure. A Case Study of Lancaster, PA. February 2014.
The total square footage (Table IV.2.5) of GI features (or for trees, the count) is needed to quantify benefits.

Norfolk Coastal Adaptation and Community Transformation Plan
Attachment F Benefit Cost Analysis IV.2.14
Table IV.2.5 Total GI Elements
Features (SF or Count) Newton's
Creek Ohio Creek
Total
Trees (Count) 1,746 478 2,224 Grass / Planted Groundcover (SF) 296,640 235,120 531,760 Vegetation (SF) 2,123,000 302,000 2,425,000 Permeable Walkways / Parking (SF) 104,200 100,600 204,800 Bioretention Features (SF) 746,000 746,000Rain Gardens (SF) 44,400 7,200 51,600
Water Quality – Reduced Treatment Costs
The expansion of urban areas and the impervious surfaces associated with them impose significant impacts on water quality. Water that falls on impervious surfaces collects pollutants and enters the stormwater management system. Infiltration of water into vegetated areas and permeable pavement filters out pollutants, such as motor oil. When rainwater is allowed to permeate and be cleaned in the ground, treatment costs are avoided. Features such as natural vegetation, rain gardens, permeable pavers, and bioretention features perform this ecosystem service. When rainwater is filtered by features, such as blue and green roofs, before it enters the system, fewer pollutants need to be removed in the treatment process. Examples of green infrastructure are included below through Figure IV.2.4 through Figure IV.2.6.
Figure IV.2.4 Example of a Rain Garden

Norfolk Coastal Adaptation and Community Transformation Plan
Attachment F Benefit Cost Analysis IV.2.15
Figure IV.2.5 and Figure IV.2.6 Example of Permeable Pavers
The total square footage (or for trees, the count) of GI is used to estimate the total number of stormwater gallons intercepted by these features, summarized in Table IV.2.6 and Table IV.2.7. For bioretention areas, the GI area includes the area of the feature and its drainage area. Retention rates were modeled for bioretention features for four different rainfall recurrence intervals, and the average retention rate was used to calculate annual runoff reduction. Retention rates for permeable pavers and rain gardens and can be found in the Green Infrastructure Guide. The below formulas were used to determine the total runoff reduction for bioretention features for GI.
∗ ∗ % ∗ 144
∗ 0.0043 8
The Piedmont Community Tree Guide provides the annual number of gallons intercepted by a tree.
∗ 2,566
Retention rates nor annual rainfall interception were available for grass/planted cover, as well as vegetation, thus water quality benefits are not calculated here. To address this gap and capture water quality benefits, analysts applied the FEMA standard value for water quality for green open space to the total SF of the features. See the Ecosystem Goods and Services Section for more detail.
8 Unless otherwise noted, all equations used in this section are from the Green Infrastructure Guide published by the Center for Neighborhood Technology.

Norfolk Coastal Adaptation and Community Transformation Plan
Attachment F Benefit Cost Analysis IV.2.16
Table IV.2.6 Total Annual Gallons of Water Intercepted by Bioretention Features, Permeable Pavers, Trees, and Rain Gardens
Feature Feature Area (Sq. Ft.) or Tree Count
Drainage Area (Sq.
Ft.)
Average Retention Rate (%)
Annual Rainfall
Interception per Tree (gallons)
Runoff Reduction (gallons)
Ohio Creek Constructed Wetlands Grandy Village Storage*
388,975 -
3,528,360 88 - 100,276,792
East Chesterfield Heights Storage*
26,897 -
1,611,720 20 - 9,512,021
West Chesterfield Heights Storage*
5,793 -
304,920 22 - 2,002,061
Kimball Terrace Storage*
97,244 -
2,352,240 53 - 37,964,206
Ohio Storage* 227,591 - 13,721,400 18 - 72,065,622 Permeable Walkways
15,100 - - 80 - 350,620
Waterfront Parks Shade Trees - 460 - - 2,566 1,180,360Rain Gardens Shade Trees - 18 - 2,566 46,188Rain Garden 7,200 - - 80 - 167,183Permeable Parking Permeable Parking
85,500 -
- 80 - 1,985,300
Total 225,550,353Newton’s Creek Manicured Parks Shade Trees - 544 - - 2,566 1,395,904Waterfront Promenade Shade Trees - 648 - - 2,566 1,662,768Constructed Wetlands Permeable Walkways
64,600 - - 80 - 1,500,005
Water Street Park Shade Trees - 200 - - 2,566 513,200
Total 5,071,877TOTAL 230,622,230
*Bioretention feature

Norfolk Coastal Adaptation and Community Transformation Plan
Attachment F Benefit Cost Analysis IV.2.17
The value of treatment is applied to the gallons of water intercepted to estimate avoided treatment costs. Local stormwater treatment rates are used to determine a cost per gallon ($0.0106)9, and this is used in the equation below to determine the avoided costs.
$ $0.0106
Another benefit of stormwater storage is a reduction in energy used for treating wastewater. Because the cost of energy is already captured in the avoided treatment costs, the benefits of reduced energy use are translated to air quality and climate regulation benefits. These are indirect benefits associated with reduced water treatment, such as reduced pollutant emissions. Air Quality- Reduced Criteria Air Pollutant Emissions Direct Benefits
Criteria air pollutants (Nitrogen dioxide, sulfur dioxide, particulate matter, and ozone) impose a variety of health impacts, such as increased risk of bronchitis, asthma, and emphysema. Natural vegetation can absorb these air pollutants and reduce health risks in the surrounding population. The annual uptake and avoided pollutant emissions captured by natural vegetation is a direct benefit, and grass/planted cover, vegetation, and trees are proposed to be planted throughout the Target Area within a variety of amenities: manicured parks, sport fields, waterfront parks and promenades, constructed wetlands, and rain gardens.
The annual pollutant uptake and avoided pollutant emissions capacity for criteria air pollutants for trees and the annual pollutant uptake capacity for criteria air pollutants for grasses and shrubs was used with the area or amount of added trees to estimate total pollutant reduction. For this analysis, annual pollutant uptake figures for grasses and shrubs (Table IV.2.7) were obtained from research conducted in Chicago, Illinois10, and annual pollutant uptake and avoided pollutant emissions capacity for trees (0.83 pound per tree) was obtained from the Piedmont Community Tree Guide.
Table IV.2.7 Annual Pollutant Uptake Capacity for Criteria Air Pollutants in Grams per Square Meter11
Type of Vegetation
Nitrogen Dioxide
Sulfur Dioxide
Particulate Matter
Ozone Total
Grass 0.65 2.33 1.12 4.49 8.59
Herbaceous Plants
0.83 2.94 1.52 5.81 11.10
9 City of Norfolk. Undated. Water and Sewer Rates. [Web page] Located at: http://www.norfolk.gov/index.aspx?NID=654
10 Yang J., Yu Q., and Gong P. 2008. Quantifying air pollution removal for green roofs in Chicago. Atmospheric Environment. 42 7266-7273. 17 March.
11 Yang J., Yu Q., and Gong P. 2008. Quantifying air pollution removal for green roofs in Chicago. Atmospheric Environment. 42 7266-7273. 17 March.

Norfolk Coastal Adaptation and Community Transformation Plan
Attachment F Benefit Cost Analysis IV.2.18
The value of this ecosystem service, pollutant reduction, was determined using the cost per pound of criteria air pollutants listed in Table IV.2.8. The value represented below is the marginal damage cost for different pollutants to meet air quality standards. The table lists the values provided by three different sources; values were normalized12 to current dollars, and the average was used to value benefits included in the benefit cost ratio.
Table IV.2.8 Cost per Pound of Pollutant13
Pollutant Piedmont Community Tree
Guide
Green Infrastructure
Guide
National Highway Traffic Safety Administration
Average Cost per Pound of
Pollutant14
Ozone $3.66 $3.66
Nitrogen Dioxide $7.75 $3.66 $3.48 $4.96
Sulfur Dioxide $2.26 $2.25 $20.58 $8.36
Particulate Matter $2.73 $3.11 $2.92
Small Particulate Matter $159.29 $159.29
Volatile organic compounds
$7.37 $0.88 $4.13
Average $30.55
The value of pollutant reduction was calculated as follows using the information provided above.
∗ 0.83 ∗ $30.55 $
∗ ∗ 0.092903 ∗ 0.00220462 ∗ $
Indirect Benefits
As previously mentioned, there are indirect benefits associated with reduced water treatment, such as reduced air pollutant emissions, due to reduced energy consumption for water treatment. This indirect benefit is captured for features (bioretention features, rain gardens, and permeable pavers) that analysts were able to calculate runoff reduction for in the Water Quality section above. Even though runoff reduction was calculated for trees, indirect benefits are not calculated
12 Values were converted from past dollars to current dollars using the Consumer Price Index Inflation Calculator located at: http://data.bls.gov/cgi bin/cpicalc.pl?cost1=2.84&year1=2010&year2=2015
13 E. Gregory McPherson, James R. Simpson, Paula J. Peper, Shelly L. Gardner, Kelaine E. Vargas, and Qingfu Xiao. 2006. The Piedmont Community Tree Guide. Benefits, Costs, and Strategic Planting. U.S. Department of Agriculture, U.S. Forest Service. Pacific Southwest Research Station. November.
14 Normalize to current dollars using the Consumer Price Index (CPI) Inflation Calculator. Located at: http://data.bls.gov/cgi-bin/cpicalc.pl

Norfolk Coastal Adaptation and Community Transformation Plan
Attachment F Benefit Cost Analysis IV.2.19
here because the annual pollutant uptake and avoided pollutant capacity of trees, provided by the Piedmont Tree Guide, already captures avoided power plant emissions. The annual pollutant uptake and avoided pollutant capacity of trees was used in the Direct Benefits portion of this Air Quality section to calculate the air quality benefits provided by trees.
Reduced energy use is a product of reduced runoff and a standard energy consumption factor. EPRI’s 2002 standard energy consumption factor for water treatment plants is 1,911 kilowatt hours (kWh) per million gallons.15
1,911
Emission factors are used to determine the reduction in criteria air pollutants. The emission factors for the Norfolk region are provided by the EPA eGRID for 2010 (Table IV.2.9). The eGRID does not provide emission factors for ozone, volatile organic compounds, or particulate matter, thus the benefits are not captured in this analysis. The pounds of reduced pollutants are multiplied by the cost per pound listed in Table IV.2.8 to estimate the value of pollutant reduction. A summary of the calculation is provided below, with emissions factors listed in Table IV.2.9.
∗ ∗
$
Table IV.2.9 Emissions Factor (lbs/kWh)
Air pollutant Pounds per kWh
Pounds per mWh
Nitrogen Dioxide
0.0007997 0.7997
Sulfur Dioxide 0.0020387 2.0387 Climate Regulation- Reduced Carbon Dioxide Emissions
Carbon dioxide, a greenhouse gas, is a primary contributor to climate change. Climate change is expected to impose worldwide impacts, such as reduced human health and damage to property due to increased flooding and more intense storms. Carbon sequestration is an ecosystem service that helps to mitigate climate impacts; natural vegetation captures and stores carbon in the atmosphere as it grows. The proposed project will plant trees, grass/planted cover, and vegetation within numerous amenities: manicured parks, sport fields, waterfront parks and promenades, constructed wetlands, and rain gardens. Market values and social costs of carbon have been developed recently by the European Union, the United States Interagency Working Group on Social Cost of Carbon, and the Stern Review published by the British Government, and allow for the estimation of the economic value of carbon sequestration.
15 EPRI. 2002. Water Sustainability (Volume 4): U.S. Electricity Consumption for Water Supply and Treatment – The Next Half Century. Technical Report. Page I-4. March. Located at: http://www.epri.com/abstracts/Pages/ProductAbstract.aspx?ProductId=000000000001006787&Mode=download, projected for advanced ww treatment with nitrification

Norfolk Coastal Adaptation and Community Transformation Plan
Attachment F Benefit Cost Analysis IV.2.20
Direct Benefits
Analysts applied the rate of carbon sequestration for various types of natural vegetation, collected from the Piedmont Community Tree Guide and Earth Economics (summarized in Table IV.2.10), to the added trees and planted grasses resultant from the proposed activities to estimate pounds of carbon sequestered. This ecosystem service was translated to dollar figures using the cost of carbon represented in Table IV.2.11. The European Union (EU) value is the market price of carbon set in the EU’s Emission Trading System. The Stern Review, Tree Guide, and Executive Order 12866 values are an estimate of the social cost of carbon, which is the price the world has to pay if no action is taken on climate change for each ton of gas emitted. More specifically, it can be thought of as the monetary damage of emitting an extra unit of carbon at any point in time on the present value (at any time) of expected well-being. The social cost of carbon considers changes in net agricultural productivity, human health, property damages from increased flood risk, and changes in energy costs.16 The cost per pound of carbon was normalized using the Consumer Price Index (CPI) Inflation Calculator.
Table IV.2.10 Annual Carbon Sequestration Based on Vegetative Type
Vegetative Cover
Sources Pounds of Carbon per Year
Trees Piedmont Community Tree Guide
128 (per tree)
Plants Earth Economics 0.04 (per square foot)Grass Earth Economics 0.04 (per square foot)
Table IV.2.11 Cost per Pound of Carbon Dioxide
Estimate Year Cost per Pound17 Low Estimate EU Market Price 2010 $0.01 Tree Guide 2006 $0.01 Medium Estimate Executive Order 12866* 2012 $0.03 High Estimate Stern Review 2007 $0.05 Average Price $0.03
*EO 1286618 provides different estimates of the price of carbon based on discount rate. The average of the estimates is presented here.
16 U.S. EPA. The Social Cost of Carbon. Web page. Located at: http://www3.epa.gov/climatechange/EPAactivities/economics/scc.html
17 Normalized to current dollars using the CPI Inflation Calculator. Located at: http://data.bls.gov/cgi-bin/cpicalc.pl
18 Located at: https://www.whitehouse.gov/sites/default/files/omb/inforeg/social_cost_of_carbon_for_ria_2013_update.pdf

Norfolk Coastal Adaptation and Community Transformation Plan
Attachment F Benefit Cost Analysis IV.2.21
Using the information provided above and the average cost per pound of carbon, the value of climate benefits was calculated as follows.
128 ∗ ∗ $0.03 $
∗ 0.04 ∗ $0.03 $
Indirect Benefits
Like before, indirect benefits are those associated with avoided power plant emissions for reduced water treatment needs. The indirect benefits are captured for bioretention features, permeable pavers, trees, and rain gardens. Unlike the Indirect Benefits section for Air Quality, the annual carbon sequestration for trees does not include avoided power plant emissions, therefore indirect benefits due to reduced water treatment can be calculated here.
The carbon dioxide emission factor for the Norfolk region provided by EPA eGRID (1.07365 lbs/kWh) is used in the equation below with the amount of energy reduction, previously calculated, and the cost per pound of carbon (Table IV.2.11) to estimate the cost of carbon dioxide emissions.
∗ 1.07365 ∗ $0.03 $
Reduced Grey Infrastructure Costs
GI and natural vegetation reduces the amount of stormwater entering the sewer system, and this reduces the amount of conventional infrastructure (grey infrastructure) needed to manage stormwater. The EPA estimates that the conventional cost and management of stormwater storage infrastructure is $22.1719 per cubic foot. Cubic feet was provided for bioretention features only, therefore it is the only GI feature for which reduced grey infrastructure costs are calculated. The cubic feet of storage features and average retention rate was used in the following equation to determine avoided grey infrastructure costs.
$22.17 ∗ ∗
% $) Limitations, Uncertainties, Assumptions, and Sensitivities
The Piedmont Community Tree Guide accounts for tree morbidity over time (33.95%). This assumption is factored into the figures provided by the Tree Guide; therefore, it is not included as a separate function in the calculation.
It is assumed that added trees carry attributes similar to those provided in the Piedmont Tree Guide.
19 Center for Neighborhood Technologies. Undated. Green Values National Stormwater Management Calculator. Cost Sheet. [Web page]Located at: http://greenvalues.cnt.org/national/cost_detail.php

Norfolk Coastal Adaptation and Community Transformation Plan
Attachment F Benefit Cost Analysis IV.2.22
It was assumed that the trees added are medium trees; therefore, the benefits were calculated for medium trees. It is possible that this will change later in the design phase.
Water quality benefits were not calculated for grasses and planted cover because annual retention rates were unavailable at the time of analysis.
The EPA eGRID does not provide emissions factors for ozone, volatile organic compounds, and particulate matter, therefore indirect air quality benefits were not included in the analysis.
Environmental benefits for shrubs were not included in this analysis because there is insufficient data to estimate annual ecosystem services per shrub, such as pounds of carbon sequestered or gallons of water retained per shrub.
Reduced grey infrastructure costs were calculated for bioretention features only.
The results of previously conducted studies are applicable to the Target Area.

Norfolk Coastal Adaptation and Community Transformation Plan
Attachment F Benefit Cost Analysis IV.2.23
Ecosystem Goods and Services Benefits

Norfolk Coastal Adaptation and Community Transformation Plan
Attachment F Benefit Cost Analysis IV.2.24
Ecosystem Goods and Services
Wetlands and riparian habitats comprise a multifunctional system that provides numerous ecosystem goods and services, as well as contribute to the resilience of coastal communities. Green and riparian spaces also provide a variety of ecosystem goods and services. A summary of these benefits and the studies FEMA used to determine standard values is provided in Appendix F-8: FEMA Standard Values.
FEMA used the benefits transfer method to develop standard values for various ecosystem services of certain types of vegetative areas (wetlands, riparian, and green open space) that can be used in FEMA-approved benefit cost analyses required in applications for federal funding. Benefits are calculated by square foot; totals provided in Appendix F-8: FEMA Standard Values.
Detailed Approach
To illustrate a range of benefits, the standard FEMA values for green open space, riparian habitat, or wetlands was applied to the total area of the proposed amenities ( Table IV.2.12). The standard FEMA values include numerous ecosystem services and some of the values are duplicative of the benefits already calculated using the GI Guide; furthermore, the total area of the amenities includes features that do not contribute environmental benefits, such as concrete walkways in parks, therefore it is not appropriate to use the total area of amenities or the total FEMA standard value. Nevertheless, the FEMA standard values do provide a method to calculate benefits of natural capital (associated with new or improved green spaces, wetlands, and riparian areas) that have yet to be calculated in this analysis. To supplant benefits already calculated, analysts used FEMA standard values for benefits not yet captured in this analysis and removed any duplication of benefits if an alternative valuation method was available.
The following basic steps were taken to review and apply FEMA standard values:
1. Review studies from which FEMA estimated values
2. Determine applicable values, consider possible duplication of benefits, and add missing ecosystem service values wherever possible.
a. Analysts determined The GI Guide did not capture the following benefits provided by FEMA:
i. FEMA values for water quality (water retention: $293.02 per acre per year) can be used to value water quality benefits provided by grasses that have yet to be quantified.
ii. Similarly, FEMA values for erosion control and pollination ($64.88 and $290.08 per acre per year) can supplant the green infrastructure calculations for grasses.
iii. FEMA values for water quality (water quality: $731.21 and water retention: $5,335.50) can be used to value water quality benefits provided by vegetation (within wetlands) that have yet to be quantified.
iv. FEMA’s value for wetlands ($15,391.34 per acre per year) can be used to value the benefits of the living shoreline and wetlands.

Norfolk Coastal Adaptation and Community Transformation Plan
Attachment F Benefit Cost Analysis IV.2.25
1. The GI Guide can be used to calculate benefits for certain features within the proposed wetlands, such as permeable walkways or bioretention features, but it does not capture the value of ecosystem services provided by a wetland as a whole. Therefore, FEMA’s value for wetlands is used to capture the environmental benefit of wetlands. The area of features not necessarily a wetland or the area of features with benefits already calculated, i.e. permeable walkways, were subtracted from the total area used to calculated benefits using FEMA’s standard value.
b. Analysts did not identify additional studies that provided an estimated value for a benefit not already captured by the GI Guide or FEMA.
3. Convert dollar value per acre per year to dollar value per square foot per year (see Appendix F-8: FEMA Standard Values)
4. Normalize values using the Consumer Price Index (CPI) Calculator20 (see Appendix F-8: FEMA Standard Values). The CPI Calculator adjusts past dollars to current value using the average Consumer Price Index for a given calendar year. The Consumer Price Index data represents changes in prices of all goods and services purchased for consumption.
a. Water Quality (green open space): $0.01 per square foot per year in current dollars
b. Erosion Control and Pollination (green open space): $0.01 per square foot per year in current dollars
c. Water Quality (wetlands): $0.14 per square foot per year in current dollars
d. Wetlands: $0.32 per square foot per year in current dollars
5. Value ecosystem good and service benefits using applicable FEMA value per square foot.
Table IV.2.12 below summarizes the total area of proposed amenities, as well as the FEMA standard value applied, and annual benefits. The benefits presented in this table are not included in the BCR (in exception to the living shoreline and wetlands), but are provided here to illustrate a range of methods and results.
Table IV.2.12 Summary of Benefits Using FEMA Standard Values
Amenity Applicable
FEMA Category
FEMA Standard Value for
Environmental Benefits
Total Square
Feet Newton’s
Creek
Total Square
Feet Ohio Creek
Newton’s Creek Total
Benefit
Ohio Creek Total
Benefit
Constructed Wetlands
Wetlands $0.32 1,925,352 657,756 $616,113 $210,482
20 U.S. Bureau of Labor Statistics. Undated. CPI Inflation Calculator. [Web page] Located at: http://www.bls.gov/data/inflation_calculator.htm.

Norfolk Coastal Adaptation and Community Transformation Plan
Attachment F Benefit Cost Analysis IV.2.26
Amenity Applicable
FEMA Category
FEMA Standard Value for
Environmental Benefits
Total Square
Feet Newton’s
Creek
Total Square
Feet Ohio Creek
Newton’s Creek Total
Benefit
Ohio Creek Total
Benefit
Living Shoreline21
Riparian Habitat
$0.53 3,600 9,090 $1,908 $4,818
Waterfront Parks
Green Open Space
$0.02 500,940 $10,019
Sport Fields
Green Open Space
$0.02 126,324 $2,526
Rain Gardens
Green Open Space
$0.02 44,400 7,200 $888 $144
Manicured Parks
Green Open Space
$0.02 509,652 $10,193
Water Street Park
Green Open Space
$0.02 217,800 $4,356
Waterfront Promenade
Green Open Space
$0.02 470,448 $9,409
Total 3,171,252 1,301,310 $642,867 $227,989
Table IV.2.13 summarize the area of features that analysts determined applicable FEMA values could be applied. The value of water quality, erosion control, and pollination benefits for grass and vegetation and the value of ecosystem services provided by living shorelines and wetlands are summarized in Table IV.2.14. These benefits are integrated with benefits calculated using the GI Guide to obtain total annual benefits, provided in Table IV.2.15.
Table IV.2.13Total Square Footage of Features
Feature Applicable
FEMA Category
Newton’s Creek Watershed
(Square Feet)
Ohio Creek Watershed
(Square Feet) Total
Sports Fields Grasses/Planted Cover
Green Open Space
- 92,800 92,800
Manicured Parks Grass/Planted Cover
Green Open Space
140,400 - 140,400
21 1,200 linear feet at 3 foot depth is 3,600 square feet; 2,200 linear feet at 3 foot depth is 6,600 square feet.

Norfolk Coastal Adaptation and Community Transformation Plan
Attachment F Benefit Cost Analysis IV.2.27
Feature Applicable
FEMA Category
Newton’s Creek Watershed
(Square Feet)
Ohio Creek Watershed
(Square Feet) Total
Waterfront Promenade
Grasses/Planted Cover
Green Open Space
129,600 - 129,600
Water Street Park Grasses/Planted Cover
Green Open Space
60,000 - 60,000
Waterfront Parks Grasses/Planted Cover
Green Open Space
- 138,000 138,000
Living Shoreline Living shoreline22 Riparian 3,600 6,600 10,200Constructed Wetlands Vegetation Wetlands 884,00 320,000 1,186,000Wetlands Wetlands * 997,152** 997,152Rain Gardens Grass/Planted Cover
Green Open Space
26,640 4,320 30,960
*Benefits are captured by the GI calculations for bioretention features, which are located in constructed wetlands and waterfront parks. **Does not include area of permeable walkways and vegetation.
Table IV.2.14 Summary of Applicable Benefits Using FEMA Standard Values
Feature Applicable
FEMA Category
Applicable FEMA Benefits
FEMA Standard
Value
Newton’s Creek
Watershed
Ohio Creek Watershed
Total
Sports Fields
Grasses/Planted Cover
Green Open Space
Water Quality, Erosion Control, and Pollination
$0.02 - $1,856 $1,856
Manicured Parks
Grass/Planted Cover
Green Open Space
Water Quality, Erosion Control, and Pollination
$0.02 $2,808 - $2,808
Waterfront Promenade
Grasses/Planted Cover
Green Open Space
Water Quality, Erosion Control, and Pollination
$0.02 $2,592 - $2,592
22 1,200 linear feet at 3 foot depth is 3,600 square feet; 2,200 linear feet at 3 foot depth is 6,600 square feet.

Norfolk Coastal Adaptation and Community Transformation Plan
Attachment F Benefit Cost Analysis IV.2.28
Feature Applicable
FEMA Category
Applicable FEMA Benefits
FEMA Standard
Value
Newton’s Creek
Watershed
Ohio Creek Watershed
Total
Water Street Park
Grasses/Planted Cover
Green Open Space
Water Quality, Erosion Control, and Pollination
$0.02 $1,200 - $1,200
Waterfront Parks
Grasses/Planted Cover
Green Open Space
Water Quality, Erosion Control, and Pollination
$0.02 - $2,760 $2,760
Living Shoreline
Living shoreline23
Riparian
Ecosystem Services – See Appendix F-8: FEMA Standard Values
$0.53 $1,908 $4,818 $6,726
Constructed Wetlands Vegetation Wetlands Water Quality $0.14 $123,760 $42,280 $166,040
Wetlands Wetlands
Ecosystem Services – See Appendix F-8: FEMA Standard Values
$0.32 - $319,089 $319,089
Rain Gardens
Grass/Planted Cover
Green Open Space
Water Quality, Erosion Control, and Pollination
$0.02 $533 $86 $619
Limitations, Uncertainties, Assumptions, Sensitivities
The following sensitivities were identified during analysis:
The estimated value of ecosystem service from other studies is applicable to the Target Area.
Environmental benefits related to the natural berm are not included in this analysis.
23 1,200 linear feet at 3 foot depth is 3,600 square feet; 2,200 linear feet at 3 foot depth is 6,600 square feet.

Norfolk Coastal Adaptation and Community Transformation Plan
Attachment F Benefit Cost Analysis IV.2.29
Detailed Results
Annual benefits are provided in Table IV.2.15. Nearly 60 acres of constructed wetlands and bioretention features provide the greatest annual benefits ($2.7 million), followed by 2,000+ new trees ($243,743).
The benefits are integrated with other losses avoided and added benefits to determine total annual benefits, net present value, and the benefit cost ratio. The proposed addition of parks, natural vegetation, and wetlands can be expected to last in perpetuity, therefore the benefits will be realized far longer than 50 years (the useful life of the project’s proposed hard infrastructure). In accordance with FEMA Mitigation Policy FP-108-024-01, the annual benefits are converted to net present value using a present value coefficient for a 100–year project useful life at a 7% discount rate. The reduced grey infrastructure costs are a one-time avoided cost; therefore, they are added as a lump sum to the net present value (see Table IV.2.16).
Table IV.2.15 Total Annual Benefits
Amenities and Features Newton's Creek Ohio Creek Manicured Parks Shade Trees $59,880 - Grass / Planted Groundcover $4,168 - Sports Fields Grass / Planted Groundcover - $2,755Waterfront Promenade Shade Trees $82,911 - Grass / Planted Groundcover $3,848 - Constructed Wetlands Vegetation $134,495 $42,280Permeable Walkways $11,001 $3,759Bioretention Features - $2,377,874Wetlands $319,089 -Water Street Park Shade Trees $25,590 -Planted Groundcover $1,781 -Waterfront Parks Shade Trees (EA) - $58,857Grass / Planted Groundcover - $4,097Rain Gardens Shade Trees $14,202 $2,303Planted Groundcover $791 $128Rain Garden $11,052 $1,792Permeable Parking Area Permeable Parking - $21,282Protected Coastal Wetlands Living Shoreline $1,908 $4,818Total $670,716 $2,519,945

Norfolk Coastal Adaptation and Community Transformation Plan
Attachment F Benefit Cost Analysis IV.2.30
Table IV.2.16 Reduced Grey Infrastructure Costs
Bioretention Feature Cubic Feet Reduced Infrastructure
Costs Grandy Village Storage 940,000 $18,878,152East Chesterfield Heights Storage
65,000 $296,010
West Chesterfield Heights Storage
14,000 $70,769
Kimball Terrace Storage 235,000 $2,857,407Ohio Storage 550,000 $2,229,183Total 1,804,000 $24,331,521

Norfolk Coastal Adaptation and Community Transformation Plan
Attachment F Benefit Cost Analysis IV.3.1
3.0
Social Values

Norfolk Coastal Adaptation and Community Transformation Plan
Attachment F Benefit Cost Analysis IV.3.2
Social Value Literature has revealed that urban parks help improve the quality of life and social sustainability of cities by providing recreational opportunities and aesthetic enjoyment, promoting physical health, contributing to psychological well-being, enhancing social ties, and providing opportunities for education.1 Time spent outdoors has proven to have a positive effect on life expectancy, health, and well-being, and this is reflected in society as a whole. Accessibility to parks and green space is especially important for the elderly, children, and people with disabilities. The availability of safe recreation spaces for children supports healthy physical and psychological development, and access to open space is associated with greater longevity for seniors due to increased physical activity and reduced risk of depression.2 Furthermore, these types of spaces foster social interaction and promote social cohesion within diverse communities. Research has shown that communities with stronger social networks improve the resiliency of vulnerable populations against hazards, as social ties within communities are critical to the ability to sustain shocks and stresses, as well as recover effectively.3 Lastly, maintained green spaces can encourage more use of city spaces, and therefore increased social monitoring of public spaces, “eyes on the street”, sometimes referred to as crime prevention through environmental design (CPTED).4 Key elements of the conceptual design of Norfolk’s Coastal Adaptation and Community Transformation Plan will enhance the health and well-being of nearby residents, increase social capital, and improve quality of life in the greater community.
1 Zhou, X. and M.P. Rana. 2011. Social benefits of urban green space. A conceptual framework of valuation and accessibility measurements. Management of Environmental Quality: An International Journal.
2 California State Parks. 2005. The Health and Social Benefits of Recreation. California State Parks, Sacramento.
3 Center for American Progress. Social Cohesion. The Secret Weapon in the Fight for Equitable Climate Resilience. May 2015. Located at: https://cdn.americanprogress.org/wp-content/uploads/2015/05/SocialCohesion-report.pdf
4 Wolfe, M.K., and J. Mennis. 2012. “Does Vegetation Encourage or Suppress Urban Crime? Evidence from Philadelphia, PA.” Landscape and Urban Planning 108 (2–4): 112–122.

Norfolk Coastal Adaptation and Community Transformation Plan
Attachment F Benefit Cost Analysis IV.3.3
Recreational Benefits
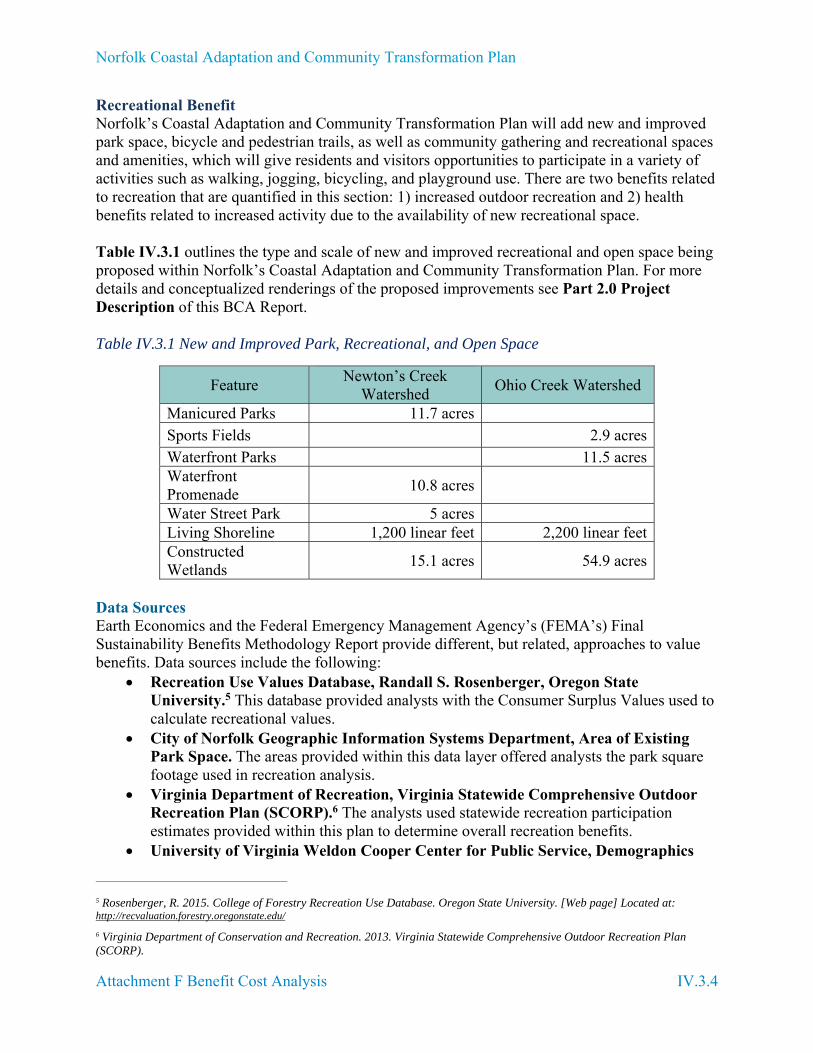
Norfolk Coastal Adaptation and Community Transformation Plan
Attachment F Benefit Cost Analysis IV.3.4
Recreational Benefit Norfolk’s Coastal Adaptation and Community Transformation Plan will add new and improved park space, bicycle and pedestrian trails, as well as community gathering and recreational spaces and amenities, which will give residents and visitors opportunities to participate in a variety of activities such as walking, jogging, bicycling, and playground use. There are two benefits related to recreation that are quantified in this section: 1) increased outdoor recreation and 2) health benefits related to increased activity due to the availability of new recreational space. Table IV.3.1 outlines the type and scale of new and improved recreational and open space being proposed within Norfolk’s Coastal Adaptation and Community Transformation Plan. For more details and conceptualized renderings of the proposed improvements see Part 2.0 Project Description of this BCA Report. Table IV.3.1 New and Improved Park, Recreational, and Open Space
Feature Newton’s Creek
Watershed Ohio Creek Watershed
Manicured Parks 11.7 acres Sports Fields 2.9 acres Waterfront Parks 11.5 acres Waterfront Promenade
10.8 acres
Water Street Park 5 acres Living Shoreline 1,200 linear feet 2,200 linear feet Constructed Wetlands
15.1 acres 54.9 acres
Data Sources Earth Economics and the Federal Emergency Management Agency’s (FEMA’s) Final Sustainability Benefits Methodology Report provide different, but related, approaches to value benefits. Data sources include the following:
Recreation Use Values Database, Randall S. Rosenberger, Oregon State University.5 This database provided analysts with the Consumer Surplus Values used to calculate recreational values.
City of Norfolk Geographic Information Systems Department, Area of Existing Park Space. The areas provided within this data layer offered analysts the park square footage used in recreation analysis.
Virginia Department of Recreation, Virginia Statewide Comprehensive Outdoor Recreation Plan (SCORP).6 The analysts used statewide recreation participation estimates provided within this plan to determine overall recreation benefits.
University of Virginia Weldon Cooper Center for Public Service, Demographics
5 Rosenberger, R. 2015. College of Forestry Recreation Use Database. Oregon State University. [Web page] Located at: http://recvaluation.forestry.oregonstate.edu/
6 Virginia Department of Conservation and Recreation. 2013. Virginia Statewide Comprehensive Outdoor Recreation Plan (SCORP).

Norfolk Coastal Adaptation and Community Transformation Plan
Attachment F Benefit Cost Analysis IV.3.5
and Workforce Group. The report developed from this team provided population projections used in current and future analysis of the Target Area.
Outdoor Recreation Demand for Virginia: An Analysis Using 2011 Virginia Outdoors Survey Data by Terance Rephann.7 Activity days and projected activity days were obtained from the article and used during analysis.
Detailed Approach There are two methods that can be used to quantify recreational benefits (Table IV.3.2), Earth Economics or FEMA. Earth Economics uses participation rates based on statewide recreational activity, collected through an Outdoors Demand Survey, to estimate benefits in the Target Area. FEMA quantified recreational benefits based on the square footage of added or improved space that is expected to provide recreational value. Both methods and results are presented in herein to illustrate a range of benefits. Table IV.3.2 Summary of Methods to Value Benefits
Parameter FEMA Earth Economics
Recreation Low Value Medium Value High Value
Health Benefits of Recreation
- Low Value
Medium Value
High Value
Earth Economics Approach Statewide participation rates were used to estimate future recreational activity resulting from Norfolk’s Coastal Adaptation and Community Transformation Plan. The Virginia Department of Conservation and Recreation maintains the Virginia Outdoors Plan, and an element of this plan is the Outdoors Demand Survey. The survey estimates participation in and demand for a wide variety of recreational activities throughout Virginia, and the results of the survey are used to estimate statewide activity days for the current population and projected population in 2020.8 Activity days are the total number of days during which an activity is performed within a year for a given population. Projected activity days in 2020 based on two methods: Regional Method and Cohort Component. Rephann T., page 29, “The regional method estimates average resident activity levels for each activity by region. Resident activity levels are determined by multiplying mean participation proportions by median person-days of activity per household member (total household person-days involved in activity divided by the household size) for each activity. The local activity levels by recreation activity are applied to local area population estimates and projections to obtain aggregate local-area activity levels…The cohort component method estimates rates statewide for 28 demographic groups categorized by age. Mean participation rates were multiplied by median activity levels for each category. Local aggregate activity levels were obtained by multiplying the demographic group activity levels by the corresponding local area demographic group population and projections.”
7 Rephann, Terrance. 2012. Outdoor Recreation Demand for Virginia: An Analysis Using 2011 Virginia Outdoors Survey Data. February 27.
8 Rephann, Terrance. 2012. Outdoor Recreation Demand for Virginia: An Analysis Using 2011 Virginia Outdoors Survey Data. February 27.

Norfolk Coastal Adaptation and Community Transformation Plan
Attachment F Benefit Cost Analysis IV.3.6
The ratio of statewide activity days to the total state population was applied to the total population in the Target Area to determine the total number of activity days for certain recreational activities within a given year. Consumer surplus values9 were used to value the annual increase in recreational participation (activity days). The results (value of increased recreational participation) are distributed across the total acreage of new and existing park space (55.5 acres) to obtain a value per acre. Currently, there are 13.6 acres of park space, and Norfolk’s Coastal Adaptation and Community Transformation Plan intends to add 101.54 acres of manicured and waterfront parks, sports fields, waterfront promenade space, living shoreline, constructed wetlands, and converted open to recreational space. To account for outdoor recreational activity that may already be occurring, the recreational value for 13.6 acres is subtracted from the total benefits. FEMA Approach FEMA provides a recreational value per acre per year for green open space, wetlands, and riparian habitat using the benefit transfer method. See Appendix F-8: FEMA Standard Values for more detail on the studies used to determine the recreational value per square foot. The benefit transfer method applies the results of previously conducted primary studies to another geography. For more detail on benefit transfer, see the Environmental Benefits Section of this Attachment F Part 5.0 BCA. The recreational value was converted from acres to square feet and (based on the vegetative cover) applied to the total area of new and improved park space resulting from Norfolk’s Coastal Adaptation and Community Transformation Plan to estimate the recreational value of such spaces. Limitations, Uncertainties, Assumptions, and Sensitivities Limitations, uncertainties, assumptions, and sensitivities of the Earth Economics approach include:
It is assumed that the current amount of recreational area does not fully meet the needs of residents in the Target Area.
It is assumed that the ratio of activity days to persons within a year is the same in Norfolk as it is statewide.
Recreational amenities will be added throughout the Target Area; therefore, it is assumed that the entire population contributes to the number of activity days per activity.
An increase in population is considered by calculating benefits for the population in 2020, using projected activity days (based on population projections) at certain points in time. Population growth is considered until 2020, as projected activity days are provided only for 2020.
Limitations, uncertainties, assumptions, and sensitivities of the FEMA methodology include:
The results of previously conducted studies are applicable to the Target Area. The FEMA value relies on studies, which are limited in scope, but are considered applicable nationwide. This approach does not consider location specific factors known to impact the results of studies that value recreational benefits, such as population density, age,
9 Rosenberger, R. 2015. College of Forestry Recreation Use Database. Oregon State University. [Web page] Located at: http://recvaluation.forestry.oregonstate.edu/.

Norfolk Coastal Adaptation and Community Transformation Plan
Attachment F Benefit Cost Analysis IV.3.7
and income distribution.10 Detailed Results The results of the above methods are presented in Table IV.3.3 through Table IV.3.8 below. Table IV.3.3 through Table IV.3.6 summarize medium ($23 million annually) and high ($25 million annually) estimated recreational benefits using Earth Economics methodology. Table IV.3.7 and Table IV.3.8 provide a low estimation of recreational benefit ($260,000 annually) using the FEMA methodology. The low, medium, and high annual benefits were incorporated into the low, medium, and high benefit cost ratio, respectively. The new parks and wetlands that will result in an increase of outdoor recreation can be expected to last perpetuity. As such, benefits will be realized for many years to come. FEMA Mitigation Policy FP-108-024-01 recommends the environmental benefits of land acquisition projects be projected for 100 years at a 7% discount rate. As a result, annual results are projected over a 100-year project useful life at a 7% discount rate to determine net present value.
10 Brander, L.M. and M.J. Koetse. 2011. The Value of Urban Open Space: Meta-analyses of contingent valuation and hedonic pricing results. Journal of Environmental Management. 92 (2011) 2763-2773. October

Norfolk Coastal Adaptation and Community Transformation Plan
Attachment F Benefit Cost Analysis IV.3.8
Table IV.3.3 Earth Economics Method Annual Benefits for Newton’s Creek Watershed Transformation Project
Activity Regional Method Cohort Component Method Average Year 2010 2020 2010 2020 2010 2020
Walking for pleasure
$4,356,821 $4,582,578 $4,236,022 $4,300,638 $4,296,421 $4,441,608
Jogging/running $9,054,840 $9,592,162 $6,292,853 $6,346,623 $7,673,846 $7,969,392Fitness trail $364,796 $384,503 $433,954 $419,257 $399,375 $401,880Using a playground
$2,221,964 $2,349,624 $2,705,794 $3,154,127 $2,463,879 $2,751,875
Picnicking away from home
$178,862 $187,160 $178,184 $178,073 $178,523 $182,617
Visiting natural preserves
$306,058 $324,009 $243,733 $261,422 $274,895 $292,715
Visiting parks $1,177,639 $1,248,129 $595,398 $599,167 $886,519 $923,648Softball $234,724 $662,621 $256,002 $863,086 $245,363 $762,853Baseball $408,193 $246,096 $273,165 $265,673 $340,679 $255,885Soccer $676,016 $430,454 $1,017,027 $273,036 $846,522 $351,745Football $391,035 $714,388 $343,705 $1,018,203 $367,370 $866,296Visiting historic areas
$669,753 $414,928 $535,374 $344,827 $602,563 $379,877
Bird watching $96,938 $707,661 $121,903 $549,928 $109,420 $628,795Saltwater fishing $622,915 $662,621 $750,226 $863,086 $686,571 $762,853Total Benefit $20,760,554 $22,506,934 $17,983,339 $19,437,145 $19,371,947 $20,972,040

Norfolk Coastal Adaptation and Community Transformation Plan
Attachment F Benefit Cost Analysis IV.3.9
Table IV.3.4 Earth Economics Method Annual Benefits Ohio Creek Watershed Transformation Project
Activity Regional Method Cohort Component Method Average Year 2010 2020 2010 2020 2010 2020
Walking for pleasure
$909,780 $956,922 $884,555 $898,048 $897,167 $927,485
Jogging/running $1,890,808 $2,003,010 $1,314,057 $1,325,285 $1,602,432 $1,664,148Fitness trail $76,176 $80,291 $90,617 $87,548 $83,396 $83,920Using a playground
$463,985 $490,642 $565,017 $658,636 $514,501 $574,639
Picnicking away from home
$37,350 $39,082 $37,208 $37,185 $37,279 $38,134
Visiting natural preserves
$63,910 $67,659 $50,896 $54,589 $57,403 $61,124
Visiting parks $245,912 $260,631 $124,329 $125,116 $185,120 $192,874Softball $49,014 $138,367 $53,458 $180,227 $51,236 $159,297Baseball $85,238 $51,389 $57,042 $55,477 $71,140 $53,433Soccer $141,164 $89,886 $212,373 $57,015 $176,768 $73,450Football $81,655 $149,177 $71,772 $212,619 $76,713 $180,898Visiting historic areas
$139,856 $86,644 $111,795 $72,006 $125,826 $79,325
Bird watching $20,242 $147,772 $25,455 $114,835 $22,849 $131,303Saltwater fishing $130,075 $138,367 $156,660 $180,227 $143,368 $159,297Total Benefit $4,335,164 $4,699,839 $3,755,234 $4,058,814 $4,045,199 $4,379,326

Norfolk Coastal Adaptation and Community Transformation Plan
Attachment F Benefit Cost Analysis IV.3.10
Table IV.3.5 Earth Economics Method Net Present Value for Newton’s Creek Watershed Transformation Project
Activity Regional Method Cohort Component Method Average Year 2010 2020 2010 2020 2010 2020
Walking for pleasure
$62,168,898 $65,390,300 $60,445,171 $61,367,197 $61,307,034 $63,378,749
Jogging/running $129,206,456 $136,873,682 $89,794,764 $90,562,023 $109,500,610 $113,717,852Fitness trail $5,205,391 $5,486,603 $6,192,228 $5,982,521 $5,698,809 $5,734,562Using a playground
$31,705,930 $33,527,543 $38,609,849 $45,007,261 $35,157,890 $39,267,402
Picnicking away from home
$2,552,246 $2,670,649 $2,542,569 $2,540,983 $2,547,408 $2,605,816
Visiting natural preserves
$4,367,240 $4,623,385 $3,477,901 $3,730,312 $3,922,571 $4,176,849
Visiting parks $16,804,116 $17,809,954 $8,495,931 $8,549,708 $12,650,023 $13,179,831Softball $3,349,348 $9,455,154 $3,652,980 $12,315,649 $3,501,164 $10,885,401Baseball $5,824,641 $3,511,628 $3,897,875 $3,790,973 $4,861,258 $3,651,300Soccer $9,646,295 $6,142,285 $14,512,294 $3,896,044 $12,079,294 $5,019,165Football $5,579,802 $10,193,829 $4,904,437 $14,529,076 $5,242,119 $12,361,453Visiting historic areas
$9,556,921 $5,920,740 $7,639,428 $4,920,444 $8,598,174 $5,420,592
Bird watching $1,383,235 $10,097,847 $1,739,469 $7,847,106 $1,561,352 $8,972,477Saltwater fishing $8,888,578 $9,455,154 $10,705,220 $12,315,649 $9,796,899 $10,885,401Net Present Value $296,239,096 $321,158,754 $256,610,115 $277,354,947 $276,424,606 $299,256,851
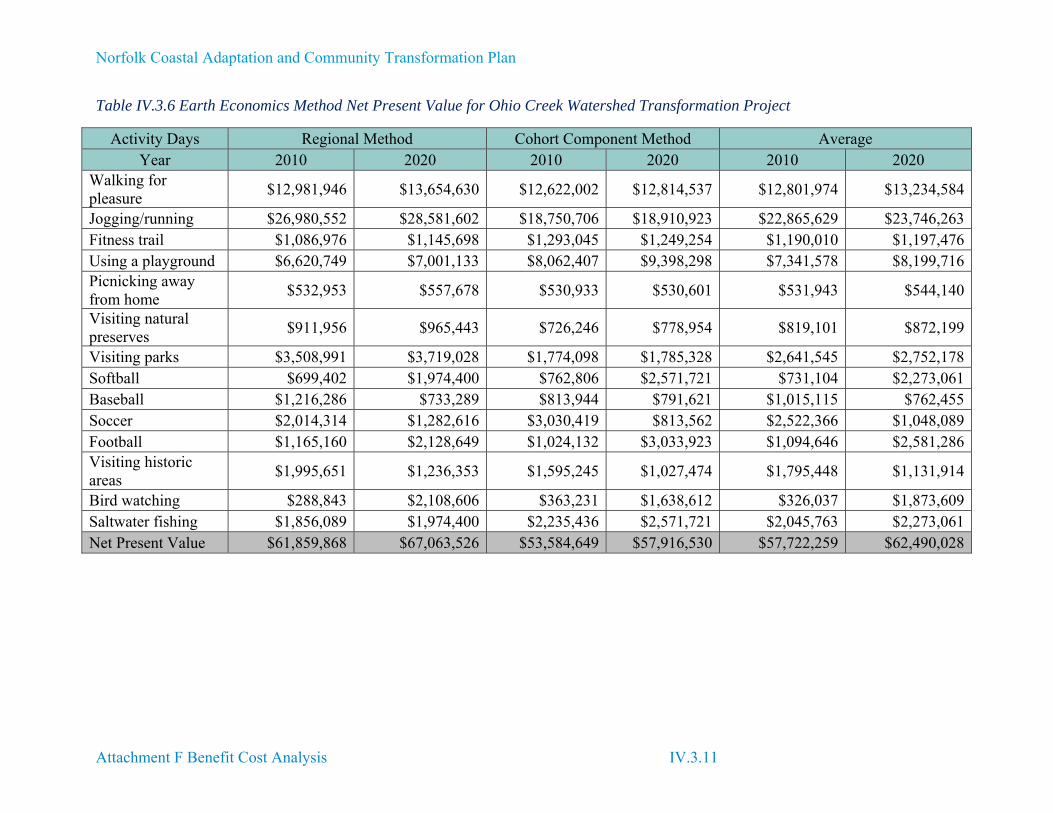
Norfolk Coastal Adaptation and Community Transformation Plan
Attachment F Benefit Cost Analysis IV.3.11
Table IV.3.6 Earth Economics Method Net Present Value for Ohio Creek Watershed Transformation Project
Activity Days Regional Method Cohort Component Method Average Year 2010 2020 2010 2020 2010 2020
Walking for pleasure
$12,981,946 $13,654,630 $12,622,002 $12,814,537 $12,801,974 $13,234,584
Jogging/running $26,980,552 $28,581,602 $18,750,706 $18,910,923 $22,865,629 $23,746,263Fitness trail $1,086,976 $1,145,698 $1,293,045 $1,249,254 $1,190,010 $1,197,476Using a playground $6,620,749 $7,001,133 $8,062,407 $9,398,298 $7,341,578 $8,199,716Picnicking away from home
$532,953 $557,678 $530,933 $530,601 $531,943 $544,140
Visiting natural preserves
$911,956 $965,443 $726,246 $778,954 $819,101 $872,199
Visiting parks $3,508,991 $3,719,028 $1,774,098 $1,785,328 $2,641,545 $2,752,178Softball $699,402 $1,974,400 $762,806 $2,571,721 $731,104 $2,273,061Baseball $1,216,286 $733,289 $813,944 $791,621 $1,015,115 $762,455Soccer $2,014,314 $1,282,616 $3,030,419 $813,562 $2,522,366 $1,048,089Football $1,165,160 $2,128,649 $1,024,132 $3,033,923 $1,094,646 $2,581,286Visiting historic areas
$1,995,651 $1,236,353 $1,595,245 $1,027,474 $1,795,448 $1,131,914
Bird watching $288,843 $2,108,606 $363,231 $1,638,612 $326,037 $1,873,609Saltwater fishing $1,856,089 $1,974,400 $2,235,436 $2,571,721 $2,045,763 $2,273,061Net Present Value $61,859,868 $67,063,526 $53,584,649 $57,916,530 $57,722,259 $62,490,028

Norfolk Coastal Adaptation and Community Transformation Plan
Attachment F Benefit Cost Analysis IV.3.12
Table IV.3.7 FEMA Method Newton’s Creek Watershed Transformation Project
Category* Description Square Feet
Recreation Value Per
SF per Year
Recreation Value per Section per
Year Net Present Value
Green Open Space
Water Street Park 217,800 $0.13 $28,314 $404,022
Green Open Space
Manicured Parks 509,652 $0.13 $66,255 $945,411
Green Open Space
Waterfront Promenade 470,448 $0.13 $61,158 $301,320.38
Wetlands Constructed Wetlands 1,925,352 $0.01 $19,254 $872,687Riparian Living Shoreline 3,600 $1,332 $19,007Total 3,126,852 $176,313 $2,515,861
*Feature categorized to determine a standard recreation value per square foot per year. Table IV.3.8 FEMA Method Ohio Creek Watershed Transformation Project
Category* Description Square
Feet
Recreation Value per
SF per Year
Recreation Value per Section per Year
Net Present Value
Green Open Space Waterfront Parks 500,940 $0.13 $65,122 $929,250Green Open Space Sports Fields 126,324 $0.13 $16,422 $234,333
Wetlands Constructed Wetlands**
657,756 $0.01 $6,578 $93,857
Riparian Living Shoreline 9,090 $0.37 $3,363 $47,992Total 1,294,110 $91,485 $1,305,432 *Feature categorized to determine a standard recreation value per square foot per year. **Half of the total benefit provided above is included in the BCR because recreational use may already be occurring.

Norfolk Coastal Adaptation and Community Transformation Plan
Attachment F Benefit Cost Analysis IV.3.13
Health Benefits

Norfolk Coastal Adaptation and Community Transformation Plan
Attachment F Benefit Cost Analysis IV.3.14
Health Benefits of Recreation Regular exercise strongly influences an individual’s health. Generally, people who are physically active live longer and are at lower risk for heart disease, stroke, type 2 diabetes, depression, some cancers, and obesity.11 The National Center for Chronic Disease Prevention and Health Promotion (Centers for Disease Control [CDC]) estimates that for adults, 150 minutes of exercise weekly and muscle training bi-weekly is necessary to maintain proper health. Adequate, safe, and community-scale space for outdoor recreation can influence physical activity behavior among residents. Studies have found that access to outdoor recreation can increase the rate of exercise for a surrounding population by 48%.12 Increased exercise improves health, and therefore, reduces health care costs and increases work productivity. The benefits valued here are avoided health care costs of medical bills and compensation payments due to an increase in physical activity, as well as lost productivity costs due to poor physical health. These benefits are not duplicative of the recreational benefits calculated above, which is the benefit a consumer derives from the recreational service provided by park space. These benefits also do not duplicate the lost productivity costs as a result of increased mental illness post-disaster, which are quantified in the Human Impacts section. Data Sources Earth Economics, studies conducted by the Trust for Public Land, and the East Carolina University Physical Inactivity Cost Calculator provided resources to quantify benefits, and the data necessary to complete the analysis was obtained from the CDC and American Community Survey 2013 5-year estimates.13 Population projections were obtained from the University of Virginia Weldon Cooper Center for Public Service, Demographics and Workforce Group.14 Detailed Approach State level data on physical fitness was used to determine the number of people that would meet physical fitness guidelines if the Norfolk’s Coastal Adaptation and Community Transformation Plan were implemented.15 Therefore, the total number of residents in the Target Area is adjusted based on the percentage of the population that meets physical fitness guidelines (both 150-minute aerobic exercise and muscle strengthening requirements). In Virginia, this percentage is 22.7% for adults and 23.8% for children that meet aerobic exercise requirements.16 The increase in the number of residents meeting physical fitness guidelines is related to an increase in physical activity (48%) associated with added recreation space.17 Thus, the number of residents meeting physical fitness guidelines is adjusted based on this percentage to determine the additional number of residents meeting fitness guidelines due to added recreational space. Health care cost savings per person per year, determined using the Physical Inactivity Cost Calculator, were applied to the increased number of residents meeting
11 National Center of Chronic Disease Prevention and Health Promotion. 2014. State Indicator Report on Physical Activity. Page 1.
12 Sherer, P. 2006. The Benefits of Parks: Why America Needs More City Parks and Open Space. San Francisco: The Trust for Public Land.
13 United States Census. 2013 American Community Survey 5-year estimates. Located at: https://www.census.gov/programs-surveys/acs/data.html
14 Population Estimates. Undated. Located at: http://www.coopercenter.org/demographics/virginia-population-estimates
15 National Center of Chronic Disease Prevention and Health Promotion. 2014. State Indicator Report on Physical Activity.
16 National Center of Chronic Disease Prevention and Health Promotion. 2014. State Indicator Report on Physical Activity. Page 18.
17 Sherer, P. 2006. The Benefits of Parks: Why America Needs More City Parks and Open Space. San Francisco: The Trust for Public Land.

Norfolk Coastal Adaptation and Community Transformation Plan
Attachment F Benefit Cost Analysis IV.3.15
physical fitness guidelines to determine avoided health care costs due to increased physical activity. To provide low, medium and high estimated benefits and to account for population growth, benefits are calculated for the projected population at certain points in time. Limitations, Uncertainties, Assumptions, and Sensitivities
The percentage of people meeting physical fitness guidelines in the Target Area is the same as the percentage of people within the State of Virginia meeting physical fitness guidelines.
The population will grow over time; therefore, benefits will increase. These additional benefits were captured using population projections through 2040, the latest projections available to analysts.
Population projections were available for the City of Norfolk for 2020 and 2040. To determine population growth in the Target Area, it was assumed the share of population in the Target Area as compared to the City of Norfolk will remain constant over time.
Age distribution will remain the same over time. People working in the Target Area may also benefit from the added recreation space, but
these benefits are not included in the analysis. Conceptual designs show added recreation space and amenities throughout the Target Area;
therefore, it is assumed that the entire population residing within the Target Area will benefit. Detailed Results The low, medium, and high results are presented in Table IV.3.9 below, and are based on the population in 2013, 2020, and 2040, respectively. Results are integrated with other losses avoided and added benefits to determine total annual benefits, net present value, and the benefit cost ratio. Because health benefits are related to an increase recreational activity, the benefits are treated in the same manner; the net present value was determined using a 100-year project useful life at a 7% discount rate.18
18 Association of Floodplain Managers. 2008. Discount Rate. Page 3. Located at: http://www.floods.org/PDF/WhitePaper/ASFPM_Discount_%20Rate_Whitepaper_0508.pdf

Norfolk Coastal Adaptation and Community Transformation Plan
Attachment F Benefit Cost Analysis IV.3.16
Table IV.3.9 Health-Related Benefits of Increased Recreational Activity
Watershed Ohio Creek Newton’s Creek Total Benefits 2013 Population Annual Benefits-Population Under 18 $97,871.24 $454,251.94 $552,123.18 Annual Benefits-Population Over 18 $156,194.38 $725,582.07 $881,776.45 Total Annual Benefits $254,065.62 $1,179,834.01 $1,433,899.63 Net Present Value $3,506,295.00 $16,282,589.55 $19,788,884.56 2020 Population Annual Benefits-Population Under 18 $126,705.33 $491,396.68 $618,102.02Annual Benefits-Population Over 18 $202,211.21 $784,913.82 $987,125.02Total Annual Benefits $328,916.54 $1,276,310.50 $1,605,227.04Net Present Value $4,539,293.62 $17,614,037.03 $22,153,330.652040 Population Annual Benefits-Population Under 18 $131,007.61 $508,082.05 $639,089.66Annual Benefits-Population Over 18 $209,077.28 $811,565.55 $1,020,642.83Total Annual Benefits $340,084.89 $1,319,647.59 $1,659,732.48Net Present Value $4,693,425.22 $18,212,121.22 $22,905,546.44

Norfolk Coastal Adaptation and Community Transformation Plan
Attachment F Benefit Cost Analysis IV.3.17
Aesthetic Benefits

Norfolk Coastal Adaptation and Community Transformation Plan
Attachment F Benefit Cost Analysis IV.3.18
Aesthetic Benefits Norfolk’s Coastal Adaptation and Community Transformation Plan will provide a number of benefits that will render the Target Area more appealing to existing and future residents and businesses, in turn resulting in a positive effect for residents and the local economy. Attractive views and reduction of flood risk are just two contributing factors to this positive effect that can be quantified. There are two methods that can be used to quantify such benefits: FEMA calculates aesthetic benefit based on the square footage of added space that may be considered an aesthetic amenity; while Earth Economics provides an approach that evaluates potential impacts to property values. Impacts to property values that were considered include the location of property near well-maintained green spaces and attractive views, in addition to the reduction in perceived risk of flooding. Property value benefits are presented for high, medium, and low scenarios. Both FEMA and Earth Economics provide methods to value benefits, but Earth Economic values are incorporated into the benefit cost ratio (BCR) to avoid a duplication of benefits. Nevertheless, it is important to recognize the benefits produced by FEMA’s methodology as to illustrate a range of benefits. For reader facilitation, FEMA’s approach to calculate aesthetic benefits are presented first, followed by a more detailed discussion of impacts to property values and benefits incorporated into the BCR. Data Sources FEMA’s Final Sustainability Benefits Methodology Report19 provided the method to value the square footage of added space that may be considered aesthetic. Earth Economics20 and The Value of Green Infrastructure: A Guide to Recognizing Its Economic, Environmental, and Social Benefits (The Green Infrastructure Guide) developed by the Center of Neighborhood Technology21 and various sources of literature provided the research needed to estimate an increase in property value for both proximity to aesthetic resources and reduction in flood risk. The value of real estate in the Target Area was obtained from the City of Norfolk Real Estate Assessor data.22 Detailed Approach There are two methods that can be used to quantify aesthetic benefits (Table IV.3.10) - Earth Economics or FEMA. Earth Economics adjusts nearby property values by a percentage that is based on a compilation of literature that reveals property value increases due to aesthetic improvements, as well as other factors described later. FEMA quantifies aesthetic benefits based on the square footage of added or improved spaces that are considered aesthetic amenities. Both methods and results are presented in this section to illustrate a range of benefits. Ultimately, the Earth Economic low, medium, and high estimates have been integrated into the low, medium, and high BCR.
19 Federal Emergency Management Agency. 2012. Final Sustainability Benefits Methodology Report. HSFEHQ-10-D-0806. August 23.
20 Earth Economics. 2014. Earth Economics Homepage. [Web page]. Located at: http://www.eartheconomics.org/.
21 Center for Neighborhood Technology. 2011. The Value of Green Infrastructure: A Guide to Recognizing Its Economic, Environmental and Social Benefits. January 21.
22 Web page: http://www.norfolk.gov/assessor/

Norfolk Coastal Adaptation and Community Transformation Plan
Attachment F Benefit Cost Analysis IV.3.19
Table IV.3.10 Methods to Value Aesthetic Benefits
Parameter FEMA Earth Economics Aesthetic Benefit
Low Value Low Value Medium Value High Value
FEMA Approach to Aesthetic Benefit The same FEMA-based approach used to estimate recreational value was used to determine aesthetic value. To summarize the approach, FEMA provides an aesthetic value per acre per year for green open space, wetlands, and riparian habitats; Analysts converted the values from acres to square feet, and applied the value per square foot to the total added area of new and improved aesthetic space to yield the estimated aesthetic value of such spaces. The amenities that Norfolk’s Coastal Adaptation and Community Transformation Plan will contribute to aesthetic quality are summarized in Table IV.3.11. FEMA’s aesthetic value per square foot for those features, and the resulting benefits are presented in Table IV.3.12 and Table IV.3.13 below. As discussed previously, these benefits are not included in the BCR. Table IV.3.11 New and Improved Park, Recreational, and Open Space Contributing to Aesthetic Quality
Amenity Newton’s Creek
Watershed Ohio Creek Watershed
Manicured Parks 11.7 acres -Sports Fields - 2.9 acresWaterfront Parks - 11.5 acresWaterfront Promenade 10.8 acres -Water Street Park 5 acres -Living Shoreline 1,200 linear feet 2,200 linear feetConstructed Wetlands 15.1 acres 54.9 acresRain Gardens 1.02 acres 0.16 acres
Table IV.3.12 Added and Improved Spaces Contributing to Aesthetic Quality – Newton’s Creek Watershed Transformation Project
Category* Amenity Square
Feet
Aesthetic Value per
SF per Year
Aesthetic Value per Feature per
Year
Net Present Value
Wetlands Constructed Wetlands
1,925,35
2 $0.04 $77,014 $1,098,939
Green Open Space
Water Street Park 217,800 $0.04 $8,712 $124,314
Green Manicured Parks 509,652 $0.04 $20,386 $290,896

Norfolk Coastal Adaptation and Community Transformation Plan
Attachment F Benefit Cost Analysis IV.3.20
Category* Amenity Square
Feet
Aesthetic Value per
SF per Year
Aesthetic Value per Feature per
Year
Net Present Value
Open Space Green Open Space
Waterfront Promenade
470,448 $0.04 $18,818 $268,519
Green Open Space
Rain Gardens 44,400 $0.01 $1,776 $25,342
Riparian Living Shoreline Newton Creek
3,600 $0.04 $36 $514
Total $126,742 $1,808,524*Feature categorized to determine a standard recreation value per square foot per year.
Table IV.3.13 Added and Improved Spaces Contributing to Aesthetic Quality – Ohio Creek Watershed Transformation Project
Category Description Square
Feet (SF)
Aesthetic Value per
SF per Year
Aesthetic Value per Feature per
Year
Net Present Value
Wetlands Constructed Wetlands
657,756 $0.04 $26,310 $375,429
Green Open Space
Waterfront Parks 500,940 $0.04 $20,038 $285,923
Green Open Space
Sports Fields 126,324 $0.04 $5,053 $72,102
Green Open Space
Rain Gardens 7,200 $0.04 $288 $4,110
Riparian Living Shoreline Ohio Creek
9,090 $0.01 $91 $1,297
Total $81,055.82 $738,861 Earth Economics Approach to Property Value Benefits Research indicates that property values increase from a reduction in flood risk and an increase in aesthetic value; these benefits are mutually exclusive and thus may be quantified without any duplication. Aesthetic value related to green spaces can be determined from what consumers are

Norfolk Coastal Adaptation and Community Transformation Plan
Attachment F Benefit Cost Analysis IV.3.21
willing to pay for this value in the housing market.23 Literature24 indicates that green spaces can increase property values by 2% to 20%25; a summary of this literature is provided in Appendix F-9: Research Valuing Aesthetic Benefits. Research also shows that property value increases 2% to 5% on average for marginal reductions in flooding; because increases are based on visible improvements, this is considered a conservative estimate.26 Generally, reduction in flood risk may also be realized in the reduction of flood insurance premiums. Streiner and Loomis (1995), using hedonic pricing, found that flood damage reduction added 3% to 5% to mean residential property value.27 Bin et al. (2008) found that, in areas where there is a high level of risk awareness in the community due to regulatory standards, homes located in the floodplain experience a 7% reduction in price. 28 Ranges of property value increases as a result of both proximity to aesthetic amenities and reduction in flood risk call for presentation of benefits in high, medium, and low scenarios. The approach presented below was followed for each of these scenarios, using 20%, 10%, and 5% increases in property value for proximity to aesthetic amenities, and 5%, 3.5%, and 2% increases for flood risk reduction. The assessed value of structures that were appropriate to include in each analysis was determined from the City of Norfolk 2014 Real Estate Assessor data. The assessed value must be converted to market value. An assessed value is the valuation placed on a property by a public tax assessor for purposes of taxation, while fair market value is the agreed upon price between a willing and informed buyer and seller under usual and ordinary circumstances. In other words, market value is the best estimate of the price the property will bring when offered for sale on the open market. Tax assessors often apply an 80% multiplier to the fair market value to determine the assessed value (meaning the assessed value is 80% of the market value).29 Thus, to convert assessed value to market value, the below equation is used.
/0.8 The applicable percentage increase in property value was then applied to the structure market value to obtain the increase in property value. The added value must then be converted to an
23 Earth Economics. Located at: http://www.eartheconomics.org/
24 Referenced literature is a combination of that referenced by Earth Economics, as well as independent research completed by Arcadis.
25 Sadeghian M. and Vardanyan Z. 2013. The Benefits of Urban Parks, a Review of Urban Research. Journal of Novel Applied Sciences. 2 (8): 231-237.; Haq S. 2011. Urban Green Spaces and an Integrative Approach to Sustainable Environment. Journal of Environmental Protection. 2, 601-608. May 3.; Wise, S., Braden, J., Ghalayini, D., Grant, J., Kloss, C. MacMullan, E., Morse, S., Montatto, F., Nees, D., Nowak, D., Peck, S., Shaik, S. and C. Yu. 2010. Integrating Valuation Methods to Recognize Green Infrastructure’s Multiple Benefits: Low Impact Development. pp. 1123-1143. DOI: 10.1061/41099(367)98.
26 Johnston, D.M. and J.B. Braden. 2004. Downstream Economic Benefits from Storm Water Management: A Comparison of Conservation and Conventional Development. DOI: 10.1061/(ASCE)0733-9496(2004)130:6(498).
27 Streiner, C.F., and Loomis, J.B. 1995. “Estimating the benefits of urban stream restoration using the hedonic price method.” River, 5(4), 267–278.
28 Bin, O., Brown Kruse, J., and C.E. Landry. 2008. Flood Hazards, Insurance Rates, and Amenities: Evidence from Coastal Housing Market. Journal of Risk and Insurance. Vol. 75 No. 1. Pp. 63-82
29 Duncan, J. 2013. Assessed Value vs Market Value: Understanding the Difference. Movoto Blog. [web page] Located at: http://www.movoto.com/blog/homeownership/assessed-value-vs-market-value/. April 3.

Norfolk Coastal Adaptation and Community Transformation Plan
Attachment F Benefit Cost Analysis IV.3.22
annual figure. To do so, Earth Economics suggests that a reasonable estimate is 1% of the overall property value increase is realized per month; therefore, the added value is multiplied by 12% to obtain an annual added value using the following equation:
∗ 0.12 It is important to note that for this analysis, the increase in property value represents a cap for which the added value per year should not exceed. For example, it may take 10 years of added value to reach the increase in property value identified using the above equations. The annual value is used to project benefits each year until the total added value (or increase in property value) is reached. Limitations, Uncertainties, Sensitivities, and Assumptions Limitations, uncertainties, assumptions, and sensitivities of the FEMA approach include:
It is assumed that the results of previously conducted studies, used by FEMA to determine standard values, are applicable to the Target Area.
Limitations, uncertainties, assumptions, and sensitivities of the Earth Economics approach include:
The benefits that result from perceived flood risk reduction and proximity to aesthetic amenities are not considered a duplication of benefits because the estimated increase in property value is considered conservative for both benefits. Moreover, such benefits are mutually exclusive.
Benefits are realized financially when a property is sold on the open market. Nevertheless, the property value increase is a quantification of the increased value to residents and prospective buyers in the area; date of sale is neither known nor relevant to the benefits calculated.
Aesthetic improvements and added spaces are located throughout the Target Area; therefore, it is assumed that all property values within the Target Area will increase as a result of Norfolk’s Coastal Adaptation and Community Transformation Plan.
Perceived flood risk reduction is expected to only be realized in structures that flood during the 10% annual chance scenario, which is closest to the flooding that was experienced during Hurricane Irene. Structures evaluated for an increase in property value are those that meet such criteria.

Norfolk Coastal Adaptation and Community Transformation Plan
Attachment F Benefit Cost Analysis IV.3.23
Figure IV.1.3.1 Target Area Open Space Conceptual Design Detailed Results The results of the Earth Economics methodology (for property value increases as a result of aesthetic amenity and reduction in perceived flood risk) are presented below. These scenario results are integrated with other losses avoided and added benefits to determine total annual benefits, net present value, and the benefit cost ratio. As demonstrated in Table IV.3.14 and Table IV.3.15, the total added value per year for the medium scenario is $10.6 million in Newton’s Creek and $3.7 million in Ohio Creek. Based on the total increase in market value and the total added value per year, it is estimated that it will take 8.3 years after project implementation for the increase in property values to be fully realized.

Norfolk Coastal Adaptation and Community Transformation Plan
Attachment F Benefit Cost Analysis IV.3.24
Table IV.3.14 Scenario Results for Added Property Values: Aesthetic Value and Reduction in Flood Risk
Target Area Scenario
Aesthetic Value Reduction in Flood Risk (10% Annual Chance)
Market Value Increased Market
Value (20%, 10%, 5%)
Added Value per Year
Market Value Increase in
Market Value (5%, 3.5%, 2%)
Added Value per Year
Newton’s Creek
High $856,569,875 $171,313,975 $20,557,677 $94,408,875 $4,720,443.75 $566,453 Medium $856,569,875 $85,656,987 $10,278,838 $94,408,875 $3,304,311 $396,517
Low $856,569,875 $42,828,494 $5,139,419 $94,408,875 $1,888,178 $226,581
Ohio Creek High $297,814,250 $59,562,850 $7,147,542 $7,936,250 $396,813 $47,618
Medium $297,814,250 $29,781,425 $3,573,771 $7,936,250 $277,769 $33,332 Low $297,814,250 $14,890,712 $1,786,885 $7,936,250 $158,725 $19,047
Table IV.3.15 Total Results for Added Property Values
Target Area Scenario Total Increased Property Value
Total Increased Market Value
Total Added Value per
Year
Newton’s Creek
High $140,848,300 $176,060,375 $21,127,245 Medium $71,183,574 $88,979,467 $10,677,535
Low $35,443,643 $44,727,054 $5,367,246
Ohio Creek High $49,093,800 $61,367,250 $7,364,070
Medium $24,835,604 $31,044,505 $3,725,340 Low $12,489,978 $15,612,472 $1,873,496

Norfolk Coastal Adaptation and Community Transformation Plan
Attachment F Benefit Cost Analysis Page IV.4.1
4.0 Economic Revitalization
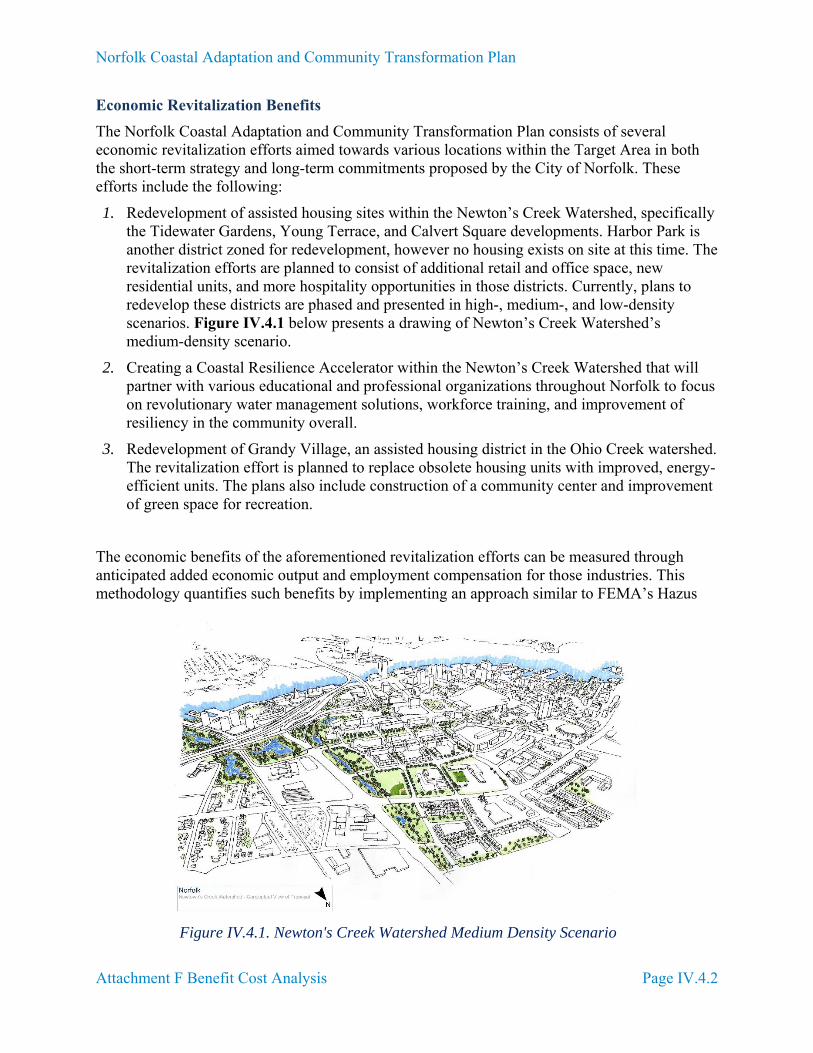
Norfolk Coastal Adaptation and Community Transformation Plan
Attachment F Benefit Cost Analysis Page IV.4.2
Economic Revitalization Benefits
The Norfolk Coastal Adaptation and Community Transformation Plan consists of several economic revitalization efforts aimed towards various locations within the Target Area in both the short-term strategy and long-term commitments proposed by the City of Norfolk. These efforts include the following:
1. Redevelopment of assisted housing sites within the Newton’s Creek Watershed, specifically the Tidewater Gardens, Young Terrace, and Calvert Square developments. Harbor Park is another district zoned for redevelopment, however no housing exists on site at this time. The revitalization efforts are planned to consist of additional retail and office space, new residential units, and more hospitality opportunities in those districts. Currently, plans to redevelop these districts are phased and presented in high-, medium-, and low-density scenarios. Figure IV.4.1 below presents a drawing of Newton’s Creek Watershed’s medium-density scenario.
2. Creating a Coastal Resilience Accelerator within the Newton’s Creek Watershed that will partner with various educational and professional organizations throughout Norfolk to focus on revolutionary water management solutions, workforce training, and improvement of resiliency in the community overall.
3. Redevelopment of Grandy Village, an assisted housing district in the Ohio Creek watershed. The revitalization effort is planned to replace obsolete housing units with improved, energy-efficient units. The plans also include construction of a community center and improvement of green space for recreation.
The economic benefits of the aforementioned revitalization efforts can be measured through anticipated added economic output and employment compensation for those industries. This methodology quantifies such benefits by implementing an approach similar to FEMA’s Hazus
Figure IV.4.1. Newton's Creek Watershed Medium Density Scenario

Norfolk Coastal Adaptation and Community Transformation Plan
Attachment F Benefit Cost Analysis Page IV.4.3
2.1 software methodology. Hazus is capable of using IMPLAN data to estimate economic and employment impacts due to flooding; therefore, it is appropriate that a similar approach is used to estimate impacts of additional innovation, recreation, retail, office, residential, and hospitality space. Overall, this analysis involves average output and employment compensation values per square foot for industries within the City of Norfolk’s Target Area that are expected to be impacted by the proposed revitalization efforts, which are then multiplied by the square footage of added new space for each corresponding industry.
Several of the proposed revitalization districts are considered long-term objectives of Norfolk’s Coastal Adaptation and Community Transformation Plan, including Young Terrace, Calvert Square, and Grandy Village. It is the City’s intent to focus revitalization efforts to the Young Terrace and Calvert Square districts with the assistance of either a master developer or tax increment financing and a BID group once the redevelopment of Tidewater Gardens and Harbor Park are complete. Because Young Terrace, Calvert Square, and Grandy Village are considered to be long-term commitments, the revitalization benefits associated with those developments can be included in the benefit-cost analysis.
Data Sources
The main data sources necessary to identify economic revitalization benefits include 2014 Real Estate building data for Norfolk and 2013 IMPLAN data for the City of Norfolk, which provides industry annual economic output data and annual employment compensation data. IMPLAN is a private economic data provider that offers data sourced from federally collected datasets. IMPLAN data were used to determine employment compensation and output per square foot data for retail, office, residential, and hospitality industries. 2014 Real Estate building data maintained by Norfolk’s Real Estate Assessor provided the square footage of structures throughout the City.
Detailed Approach
FEMA’s Hazus software methodology uses national output per square foot data to estimate economic losses. IMPLAN data are often incorporated into Hazus software and uses employment/output ratios to estimate economic and employment losses. Although the benefits described in this section are not a function of economic loss, the basic approach to estimating economic loss in Hazus may be applied to estimate economic gains.
In following the Hazus approach, Norfolk 2013 industry output and employment compensation values provided by IMPLAN are broken down to yield an average output and employment compensation value per square foot for the City. IMPLAN defines output as the value of industry production; for retail sales, this is considered gross margin. Gross margin represents the total sales revenue a company retains after incurring direct costs. Employment compensation may be defined as the payroll cost of employees paid by an employer, including wages and benefits. IMPLAN also provides employment data per industry; although unable to include in the BCR, analysts have included added employment to this analysis in order to provide an additional measure of the value of economic revitalization1. Economic data obtained from IMPLAN are
1 As defined by IMPLAN, jobs include both full-time and part-time positions.

Norfolk Coastal Adaptation and Community Transformation Plan
Attachment F Benefit Cost Analysis Page IV.4.4
considered complete, current, and can be used to represent economic industries at specifically defined scales; therefore, they are the best available data for this analysis.
The following steps were taken to calculate output and employment compensation per square foot. Table IV.4.1 summarizes the results of these steps.
1. Relate retail, office, residential, hospitality, innovation, and recreation industries from IMPLAN to structure class codes in the Norfolk 2014 Real Estate dataset. The mapping results for those industries is provided in Appendix F-12: Code Mapping for Structures and Industries.
2. Calculate the average annual output, employment compensation, and jobs per square foot for each of the four industries. This was accomplished by calculating the total annual output and employment compensation for each industry, divided by the total square footage of structures that would fall under that industry category. The equation below provides an example of the calculation used.
After the average annual output and employment compensation per square foot are determined for each industry, the example equation below is used to calculate the economic benefits of added retail, office, residential, hospitality, innovation, and recreation space.
∗

Norfolk Coastal Adaptation and Community Transformation Plan
Attachment F Benefit Cost Analysis Page IV.4.5
Table IV.4.1 Summary of Existing Output and Employment Compensation in the City of Norfolk
Industry Total Annual Output
Total Annual Employment Compensation
Total Annual Jobs
Total Square Feet of Space
Average Annual Output per SF
Average Annual Employment Compensation per SF
Average Annual Employment per Square Foot
Retail $914,584,193 $342,913,363 12,324 11,902,386 $76.84 $28.81 0.001
Office $4,490,502,284 $319,777,386 31,946 15,000,662 $299.35 $21.32 0.002
Residential $1,960,032,763 $105,402,934 5,597 115,839,683 $16.92 $1.76 0.000
Hospitality $783,400,982 $291,175,401 13,584 4,873,197 $160.76 $59.75 0.002
Innovation $2,657,077,112 $1,154,171,816 18,925 15,627,054 $170.03 $73.86 0.001
Recreation $13,700,160 $5,787,547 235 117,703 $116.40 $49.17 0.001

Norfolk Coastal Adaptation and Community Transformation Plan
Attachment F Benefit Cost Analysis Page IV.4.6
Limitations, Uncertainties, Assumptions, and Sensitivities
For the purposes of this analysis, the following limitations, uncertainties, assumptions, and sensitivities are recognized:
The approach does not account for inflation over time, nor does it consider business turnover, vacancy rates, introduction of new industries, and changes in future land use designations for these revitalization areas.
Relationships between industries and structure uses that already exist within Norfolk are not at a one-to-one relationship: there are many structure uses that comprise one industry.
Analysts assumed that the revitalization plans provide a net addition of retail, office, hospitality, and recreation space per industry. Therefore, results are considered a broad estimate of future economic gains in these districts, based on the current conditions of Norfolk’s economy. This results in a static analysis that does not account for changes in Norfolk’s real estate market nor the success of revitalization efforts.
The square footage of residential units was estimated using Hazus default full replacement cost models2, which provide average number of units and square footage per structure for different density scenarios.
Detailed Results
The results of the analysis for each effort are summarized below.
Annual benefits are projected over a 50-year project useful life. Applicable high-, medium-, and low-density development scenarios are included as results for the assisted housing revitalization efforts in Newton’s Creek Watershed. Table IV.4.2 through Table IV.4.4 provide detailed results for each of the assisted housing revitalization density scenarios; Table IV.4.5 provides detailed results for the additional revitalization efforts: the Acceleration Center and Grandy Village.
Table IV.4.2. Added Output and Employment Compensation for Revitalization Districts – Low Density Scenario
District Industry Added SFAdded Annual
Output
Added Employment
Compensation
Added Jobs
Tidewater Gardens
Retail 35,000 $2,689,414 $1,008,366 36
Office 20,000 $5,987,072 $426,351 43
Residential Space 502,500 $8,502,410 $882,657 47
Total (TG) 557,500 $17,178,896 $2,317,374 126
Harbor Park Retail 10,000 $768,404 $288,105 10
2 Table 14.1

Norfolk Coastal Adaptation and Community Transformation Plan
Attachment F Benefit Cost Analysis Page IV.4.7
District Industry Added SFAdded Annual
Output
Added Employment
Compensation
Added Jobs
Office 40,000 $11,974,144 $852,702 85
Hospitality 40,000 $6,430,284 $2,390,016 112
Residential Space 624,000 $10,558,216 $1,096,075 58
Total (HP) 714000 $29,731,049 $4,626,897 265
Young Terrace
Retail 10,000 $768,404 $288,105 10
Calvert Square
Retail 5,000 $384,202 $144,052 5
Total Benefits – Low Density Scenario
1,286,500 48,062,551 7,376,428 406
Table IV.4.3 Added Output and Employment Compensation for Revitalization Districts – Medium Density Scenario
District Industry Added SFAdded Annual
Output
Added Employment
Compensation
Added Jobs
Tidewater Gardens
Retail 50,000 $3,842,020 $1,440,523 52
Office 30,000 $8,980,608 $639,527 64
Residential Space 1,095,000 $18,527,639 $1,923,401 102
Total (TG) 1,175,000 $31,350,268 $4,003,451 218
Young Terrace
Retail 15,000 $1,152,606 $432,157 16
Residential Space 168,333 $2,848,237 $295,683 16
Total (YT) 183,333 $4,000,843 $727,840 31
Calvert Square
Retail 10,000 $768,404 $288,105 10
Residential Space 125,000 $2,115,027 $219,566 12
Total (CS) 135,000 $2,883,431 $507,671 22
Harbor Park
Retail 30,000 $2,305,212 $864,314 31
Office 40,000 $11,974,144 $852,702 85
Hospitality 40,000 $6,430,284 $2,390,016 112
Residential Space 1,040,000 $17,597,027 $1,826,792 97
Total (HP) 1,150,000 $38,306,668 $5,933,823 325

Norfolk Coastal Adaptation and Community Transformation Plan
Attachment F Benefit Cost Analysis Page IV.4.8
District Industry Added SFAdded Annual
Output
Added Employment
Compensation
Added Jobs
Total Benefits – Medium Density Scenario
5,286,666 $76,541,210 $11,172,784 596
Table IV.4.4 Added Output and Employment Compensation for Revitalization Districts – High Density Scenario
District Industry Added SF Added Annual
Output
Added Employment
Compensation Added Jobs
Tidewater Gardens
Retail 100,000 $7,684,041 $2,881,046 104
Office 50,000 $14,967,680 $1,065,878 106
Residential Space 2,797,143 $47,328,269 $4,913,267 261
Total (TG) 2,947,143 $69,979,989 $8,860,190 471
Young Terrace
Retail 30,000 $2,305,212 $864,314 31
Residential Space 714,286 $12,085,870 $1,254,665 67
Total (YT) 744,286 $14,391,083 $2,118,978 98
Calvert Square
Retail 20,000 $1,536,808 $576,209 21
Residential Space 432,857 $7,324,037 $760,327 40
Total 452,857 $8,860,846 $1,336,536 61
Harbor Park
Retail 50,000 $3,842,020 $1,440,523 52
Office 40,000 $11,974,144 $852,702 85
Hospitality 40,000 $6,430,284 $2,390,016 112
Residential Space 2,377,143 $40,221,777 $4,175,524 222
Total (HP) 2,507,143 $62,468,225 $8,858,765 470
Total Benefits- High Density Scenario
6,651,429 $155,700,143 $21,174,469 $1,100

Norfolk Coastal Adaptation and Community Transformation Plan
Attachment F Benefit Cost Analysis Page IV.4.9
Table IV.4.5 Added Output and Employment Compensation for the Acceleration Center and Grandy Village
Revitalization Effort
Industry Added
SF Added Annual
Output
Added Employment
Compensation
Added Jobs
Acceleration Center
Innovation 1,500 $255,045.88 $553,929.66 5*
Grandy Village
Recreation 1,500 $174,593.60 $73,755.97 3
*The Acceleration Center is expected to employ five people. The value of these 5 jobs are based on average annual employment compensation values for the innovation industry. Incorporation into the Benefit-Cost Ratio
An additional important assumption of this analysis is that the revitalization plan for the assisted housing developments will be phased; this includes the Tidewater Gardens, Young Terrace, Calvert Square, and Harbor Park districts. It is expected that the City will not engage in redevelopment of more than one district at a time, and that each district will be broken down into sub-phases of redevelopment so that the full benefit of the Proposed Project within one district will be realized within 5 years of the start of implementation. This is true for all assisted housing developments except for Young Terrace, where full development is expected to take place between years 18-27. The full annual benefit then continues to be realized throughout the useful life of the project (50 years). Therefore, the results of the analysis for those four revitalization projects are presented in a phased fashion for each density scenario; the medium density scenario is demonstrated in Figure IV.4.2. This phased format was integrated into the benefit-cost ratio. Note that the Coastal Resiliency Accelerator and Grandy Village are assumed to be realized the year of implementation and were incorporated into the benefit-cost ratio as such; these benefits are not displayed in the figure below.
Economic Revitalization
Benefits Future Revitalization Benefits
Tidewater Gardens Harbor Park
Calvert Square Young Terrace
Total
Year 1-5 $106,061,153 $106,061,153Year 6-10 $176,768,591 $245,665,085 $422,433,676Year 11-17 $247,476,028 $573,218,531 $35,029,980 $855,724,539Year 18-27 $353,537,183 $818,883,615 $70,059,960 $26,007,754 $1,268,488,512Year 28-50 $813,135,520 $1,883,432,316 $161,137,908 $108,759,697 $2,966,465,441Year 50-55 $409,441,808 $35,029,980 $23,643,412 $468,115,200Year 55-60 $35,029,980 $23,643,412 $58,673,392Year 60-67 $33,100,777 $33,100,777
Figure IV.4.2 Phasing Assumptions for Revitalization Plans – Medium Density Scenario

Norfolk Coastal Adaptation and Community Transformation Plan
Attachment F Benefit Cost Analysis IV.5.1
Economic Impacts Avoided

Norfolk Coastal Adaptation and Community Transformation Plan
Attachment F Benefit Cost Analysis IV.5.2
Economic Impacts Avoided
Norfolk’s existing economic relationships and impacts to those relationships in a post-disaster situation are modeled and presented within this portion of the methodology. Such economic impacts are based on expectations of business interruption and losses resulting from flooding. Additional economic impacts as a result of project implementation are included in Part V Qualitative Benefits, and the Economic Revitalization section presented within Part IV.
Economic losses as a result of natural disasters demonstrate the economic disruption or ripple effects that follow from structure damage and expected business interruptions. Post-disaster economic losses may be quantified in several ways, for example lost output, retail sales, wages and work time, utility disruptions, lost tourism, or increased financial market volatility.1 This analysis serves to evaluate lost output and labor income. Output refers to the value of industry production, which varies by industry.2 For example, the output of the service sector is measured in sales, hospital output is measured in the total service package that a patient receives during their entire length of stay, and output for non-profit organizations is based on the cost of production or the expenses that the organization must incur to operate.3 The industry output value is significant because it supports an understanding of the relationships of industries that comprise the overall economy within a geographic region;4 measuring change in industry output as a result of some stimulus or impact is considered one of the most efficient and straightforward methods to evaluate the relationships between industries in any given economy. Moreover, it demonstrates the reverberating effects of natural disasters on that economy. Labor income is defined as employee compensation, which includes wages and benefits, and proprietor income. This analysis uses calculations for lost economic output by industry and input-output modeling software to estimate the economic effects of output and labor income loss within an industry, as well as the effects that loss has on relationships with other industries and spending patterns in the economy. The proposed flood protection system that is part of Norfolk’s Coastal Adaptation and Community Transformation Plan is expected to prevent damage and disruption to businesses and residences from storm surge within the Target Area, thus the modeled results of existing economic post-disaster conditions may be considered to be a loss avoided in the benefit-cost analysis. The results of economic loss are analyzed within the context of the Virginia Beach-Norfolk-Newport News Metropolitan Statistical Area (MSA), and are presented as such.
Analysts took the following principle steps to identify lost industry output and assess cascading economic impacts:
1 Kliesen, K.L. 1994. The Economics of Natural Disasters. Federal Reserve Bank of St. Louis. [Web page] Located at: https://www.stlouisfed.org/Publications/Regional-Economist/April-1994/The-Economics-of-Natural-Disasters April.
2 MIG IMPLAN. The controlled vocabulary of IMPLAN-specific terms. [web page] located at: http://www.implan.com/index.php?option=com_glossary&Itemid=1865.
3 Swick, R., Bathgate, D., and M. Horrigan. 2006. Services Producer Price Indices: Past, Present, and Future. U.S. Bureau of Labor Statistics. Located online at: http://www.bls.gov/bls/fesacp1060906.pdf. May 26.
Mead, C.I., McCully, C.P., and M.B. Reindsdorf. 2003. Income and Outlays of Households and of Nonprofit Institutions Serving Households. U.S. Bureau of Economic Analysis. Located at: http://www.bea.gov/scb/pdf/2003/04April/0403household.pdf. April.
4 Bureau of Economic Analysis. 2014. Frequently Asked Questions. [Web page] Located at: http://www.bea.gov/faq/index.cfm?faq_id=1034. April.

Norfolk Coastal Adaptation and Community Transformation Plan
Attachment F Benefit Cost Analysis IV.5.3
1. Identify ELOF time expected to occur in 10%, 2%, and 1% annual chance flood scenarios (see methodologies for Displacement).
2. Translate business interruption into output losses using Hazus methods.
3. Input these output losses by industry sector into IMPLAN to model the direct and indirect effects of such losses.
Data Sources
The principle calculation used to determine the loss of output is sourced from the Hazus 2.1 Flood Technical Manual (TM) Direct Economic Losses Chapter 14. The output loss approach uses the results of other analyses completed for this application as inputs; information necessary to complete output loss calculations are identified below.
Direct Physical Damages (Buildings). Analysts modeled flood impacts at various recurrence intervals to determine which structures are expected to flood and the depth of flooding within those structures. Building damage, contents and inventory loss, and relocation costs were evaluated for each structure. The output loss analysis used this information to gather appropriate square footage of damaged structures to use in the calculations.
Displacement Values. Once flood impacts were modeled and structure damage was identified, the ELOF was calculated for damaged structures using expected displacement time based on the U.S. Army Corps of Engineer’s (USACE’s) depth-damage function (DDF) in addition to multipliers provided by Hazus in order to differentiate displacement time from ELOF time.
Industry Output. Existing industry output for the Target Area was sourced from the IMPLAN base model for the City of Norfolk, which uses 2013 data. For the purposes of this analysis, output was identified at the city level so that the most appropriate and accurate measure of economic output by industry could be identified.
Norfolk Real Estate Data. 2014 Real Estate building data for Norfolk were used to determine the building use, designated land use, and square footage of both damaged and undamaged structures in the Target Area.
NAICS Codes. IMPLAN software uses 440 IMPLAN sectors, which are derived from North American Industry Classification System (NAICS) codes.
Once calculated, output loss results are imported into input-output software that models the expected effects of such losses on Norfolk’s economy. Analysts used IMPLAN software for this portion of the analysis. IMPLAN software is produced by the Minnesota IMPLAN Group of MIG, Inc. and licensed to users for the purpose of measuring the effect of a change or activity that takes place in a particular local or regional economy. MIG, Inc. licensed IMPLAN Version 3.0 economic impact assessment software system to the analyst team. The software uses an input-output methodology of analysis, in combination with social accounting matrices and economic multipliers, to estimate the result of changes or activities in the economic study area.

Norfolk Coastal Adaptation and Community Transformation Plan
Attachment F Benefit Cost Analysis IV.5.4
IMPLAN data sets can create a complete set of balanced social accounting matrices (SAMs) for every zip code, county, and state. The SAMs provide a complete picture of the economy, and are used to generate multipliers, which measure the total change throughout the economy from one unit change for a given sector to estimated economic impacts. IMPLAN incorporates data from many sources, including the U.S. Bureau of Economic Analysis (BEA), the U.S. Bureau of Labor Statistics (BLS), and the U.S. Census Bureau. Analysts used the city-level data available in the Virginia Beach-Norfolk-Newport News MSA dataset to estimate output impacts. These impacts were then input into the IMPLAN software to model the relationships of these impacts throughout the MSA. Greater regional and national consequences are not accounted for in the model. These implications are discussed in Part V Qualitative Benefits.
Detailed Approach
FEMA’s Hazus software methodology uses national output per square foot data to estimate economic losses. IMPLAN data are often incorporated into Hazus software and uses employment/output ratios to estimate economic and employment losses. Nevertheless, analysts performed this evaluation outside of Hazus so that it could be appropriately modified.
Information Gathering
1. Identify impacted structures. Analysts identified Target Area structures expected to incur ELOF time as a result of storm surge for the 10%, 2%, and 1% flood scenarios. This process is described in the methodology for Relocation and Economic Loss of Function.
2. Develop a Norfolk Real Estate Data-IMPLAN-Resiliency Occupancy Class Crosswalk. Analysts assigned all Norfolk Real Estate Data structure uses to appropriate IMPLAN NAICS codes and Hazus Occupancy Class Codes, so that structure uses were assigned an IMPLAN industry. Proper identification of structures and their associated economic industries is essential to the analysis, as many assumptions inherent to the analysis are based on industry type. Please refer to Appendix F-12: Code Mapping for Structures and Industries for the results of the crosswalk.
3. Calculate Output per Day per Square Foot (Output/Day/SF) for all industries. Once analysts were able to identify which structure types correlated with the most appropriate industry, analysts divided an industry’s daily output by the total square footage of all structures assigned to one industry within the City.
It should be noted that code mapping correlations do not always occur in a one-to-one ratio. There are instances where several Norfolk Real Estate Data class codes relate to one IMPLAN NAICS and vice versa. This was particularly the case for Norfolk Real Estate Data codes defined simply as ‘office buildings’. For such situations, analysts created families of codes that are related, and assigned an average Output/Day/SF for the industries in that family. It is also necessary to understand the presence of industries within a family. This was accomplished by calculating the percentage of output that each industry contributes to the family. Later in the analysis, this percentage is applied to the square footage of the damaged structures that are within that family. This appropriately modifies damage to each industry to reflect the approximate presence of the industry in the economy.

Norfolk Coastal Adaptation and Community Transformation Plan
Attachment F Benefit Cost Analysis IV.5.5
Data Processing
1. Output Loss Calculations. Hazus Flood TM5 provides calculations to evaluate the expected loss of industry output in the Target Area. Minor revisions were made to the original calculation, as discussed in the Assumptions section of this methodology. The calculation presented below was run for each flood scenario included in the analysis.
YLOSi = Σ FAij * INCi * LOFi, j
Where:
YLOSi = Output losses
FAij = Floor area of impacted occupancy class
INCi = Output/Day/SF for industry
LOFi, j = Business loss of function time (in days)
Completing the Analysis
1. IMPLAN Analysis. The output loss per industry within the Target Area was input in IMPLAN. While the output loss was calculated based on the City of Norfolk’s economic data, the entire Virginia Beach-Norfolk-Newport News MSA was used as the geography to complete the IMPLAN analysis so that economic effects on output losses within the Target Area could be measured throughout all of the MSA. Within the model, each Target Area had one activity for each annual chance event; each activity had several events indicating each industry’s output loss. Analysts ran three models for each of the Target Area: one for the 10%, 2%, and 1% flood scenario.
2. Evaluate Results. Analysts collected the following data for each economic impact model:
Total Impact Summary. This table provides the total direct, indirect, induced, and total effect of the modeled activities on employment, labor income, and output throughout all of Norfolk
Top 10 Industries Affected
Employment Loss
Output Loss
Labor Income
Limitations, Uncertainties, Assumptions, and Sensitivities
5 Pages 14-33 of the Direct Economic Loss Chapter

Norfolk Coastal Adaptation and Community Transformation Plan
Attachment F Benefit Cost Analysis IV.5.6
In appropriately calculating output loss without duplicating benefits associated with business relocation and other costs, the following assumptions were made:
Structures that are not expected to be impacted during the storm, and industries represented by features that will not be protected by the Norfolk Coastal Adaptation and Community Transformation Plan (such as shipyards), were excluded from this analysis.
The square footage of mixed-use structures, such as mixed residential and commercial buildings, was divided among the mixed industries based on number of stories and square footage. It was assumed in these mixed-use structures that the first floor will consist of non-residential space.
If the expected flood depth within the structure is less than 10 feet, the area of the first floor is used to calculate output loss.
The original output loss calculation provided by the Hazus Earthquake TM incorporates a recapture factor, which represents output losses that can be recouped to some extent by working overtime after the event. The Hazus Earthquake TM provides a recapture factor for each Occupancy Code. These recapture factors have not been included in the output loss calculation. The analysis assumes that, as soon as a business relocates or reopens after a disaster, it is able to return immediately to pre-storm output. Recapture factors are not appropriate for use because they do not consider opportunity costs.
Seasonal variation in economic output of various sectors included in the analysis was not considered due to data limitations.
Output/Day/SF was calculated using square footage of an industry within the Target Geography using 2014 Real Estate building data for Norfolk. It is assumed that these data are accurate.
The results display the economic impacts anticipated to be experienced within the Virginia Beach-Norfolk-Newport News MSA as a result of expected output loss in the Target Area. Therefore, these impacts are considered to be conservative, as the local economy for the Target Area has economic linkages that impact areas beyond the Virginia Beach-Norfolk-Newport News MSA.
Results are presented in 2015 dollars.
IMPLAN does not account for price elasticities or changes in consumer/industry behavior based on a direct effect, such as changes in spending patterns within sectors not related directly to activity changes. Therefore, the analysis assumes a static economy.
IMPLAN also models total value added as a result of economic activities, which is the difference between an industry’s output and the cost of its inputs. To avoid double-counting output values, total value added was not evaluated in this analysis.
The local purchase percentage (LPP) provided by the IMPLAN SAMs was applied to the output losses that were input into the software. The local purchase percentage represents the typical allocation of expenditures for an industry in the defined region. The result is a more conservative estimate of economic loss modeled throughout the local economy.

Norfolk Coastal Adaptation and Community Transformation Plan
Attachment F Benefit Cost Analysis IV.5.7
The IMPLAN data used for this analysis are from 2013. The implications of the timing of the collection and release of these data have not been explored.
As described in Relocation and Economic Loss of Function, displacement values and economic loss, although closely related, are considered two independent costs of disaster impacts. The reason for this is the function of time used in the two analyses; restoration time and ELOF. It is imperative that the length of time attributed to each of these functions is not duplicated. As detailed in Relocation and Economic Loss of Function, appropriate steps were taken to ensure that such duplication is not present in this analysis.
IMPLAN defines output as the value of industry production; for retail sales, this is considered gross margin. Gross margin represents the total sales revenue a company retains after incurring direct costs.
Detailed Results Newton’s Creek Watershed Economic Impact Results
The results presented in Table IV.5.1 for Newton’s Creek Watershed include those for each of the three flood scenarios analyzed, reporting the direct, indirect, induced, and total impacts for loss of labor income and output. Although unable to include in the benefit-cost ratio, analysts have included impacts to employment to provide an additional measure of economic relationships. Moreover, the top ten industries that will be impacted by the event are provided in Table IV.5.2 and Figure IV.5.1.
In Newton’s Creek Watershed, a 1% annual chance flood scenario is expected to mainly impact shipyards, restaurants, and the real estate industry. These industries are expected to receive the most direct impacts for the 1% annual chance flood scenario, meaning structures that such industries occupy will be inundated by storm surge. The results suggest the strongest economic relationships in the MSA exist between the aforementioned directly impacted industries and the wholesale trade and company management industries (which are expected to generate the greatest indirect effects). Industries that have the highest induced impacts include residences and hospitals.
By analyzing existing economic relationships in the Virginia Beach-Norfolk-Newport News MSA, it can be expected that a 1% annual chance event will impact a total of 397 jobs, $20 million in labor income, and $66 million in industry production (or sales).
Table IV.5.1 Total Impact Summary of Output Loss in Newton's Creek Watershed
Recurrence Interval
Impact Type Employment Labor Income Output Total
10% Annual Chance
Direct Effect -68 $5,391,765 $18,359,371 $23,751,136Indirect Effect
-36.5 $1,832,207 $5,226,304 $7,058,511
Induced Effect
-51.1 $2,117,496 $6,645,472 $8,762,968
Total Effect -155.5 $9,341,469 $30,231,147 $39,572,616

Norfolk Coastal Adaptation and Community Transformation Plan
Attachment F Benefit Cost Analysis IV.5.8
Recurrence Interval
Impact Type Employment Labor Income Output Total
2% Annual Chance
Direct Effect -157.3 $8,915,000 $30,326,321 $39,241,321Indirect Effect
-61.9 $3,100,303 $9,125,805 $12,226,108
Induced Effect
-85.8 $3,561,852 $11,176,846 $14,738,698
Total Effect -305.1 $15,577,155 $50,628,971 $66,206,126
1% Annual Chance
Direct Effect -202.3 $11,551,018 $39,893,586 $51,444,604Indirect Effect
-82.6 $4,133,058 $12,214,305 $16,347,363
Induced Effect
-112.5 $4,671,715 $14,658,723 $19,330,438
Total Effect -397.4 $20,355,791 $66,766,614 $87,122,405 Table IV.5.2 Newton’s Creek Watershed Top Industries Affected by Output Loss for the 1% Annual Chance Flood Scenario
Sector Description Employmen
t Labor
Income Output Total
363 Ship building and repairing -92 $7,801,400 $25,427,890 $33,229,290502 Limited-service restaurants -84.8 $1,642,206 $4,479,064 $6,121,270440 Real estate -11.7 $282,496 $2,351,254 $2,633,750464 Employment services -10.3 $367,183 $543,345 $910,528395 Wholesale trade -8.3 $524,764 $1,714,507 $2,239,271
526 Other local government enterprises
-8 $598,041 $2,350,777 $2,948,818
410 Water transportation -7.1 $1,168,053 $6,478,812 $7,646,865501 Full-service restaurants -7 $144,922 $336,743 $481,665465 Business support services -6.4 $225,397 $373,037 $598,434
405 Retail - General merchandise stores
-5.2 $134,197 $353,487 $487,684

Norfolk Coastal Adaptation and Community Transformation Plan
Attachment F Benefit Cost Analysis IV.5.9
Figure IV.5.1 Newton’s Creek Watershed Top 10 Impacted Industries for the 1% Annual Chance Event
Ohio Creek Watershed Economic Impact Results
The Ohio Creek Watershed results are broken down similar to the Newton’s Creek results (see Tables IV.5.3, IV.5.4; Figure IV.5.2). In Ohio Creek, a 1% flood scenario is expected to mainly impact real estate, local government enterprises, and the construction industry; results indicate the maintenance and repair industry is most heavily influenced by direct impacts to these industries. Similar to Newton’s Creek, residences and hospitals are expected to experience the highest induced impacts. It is important to note that injuries expected during the 1% annual chance flood event, and the economic effect that will have on hospitals, is not considered in this analysis. For the same flood scenario, a total of 154 jobs, $6.5 million in labor income, and $34 million in industry production (or sales) is estimated to be lost for the year of the event.
Table IV.5.3 Total Impact Summary of Output Loss in Ohio Creek Watershed
Recurrence Interval
Impact Type Employment Labor
Income Output Total
10% annual chance
Direct Effect -2.9 $100,510 $976,473 $1,076,983
Indirect Effect -2 $89,574 $275,213 $364,787
Induced Effect -1.9 $80,863 $252,875 $333,738
Total Effect -6.8 $270,947 $1,504,561 $1,775,508
2% annual chance
Direct Effect -31.5 $1,242,686 $10,730,935 $11,973,621
Indirect Effect -23.5 $1,091,120 $3,328,693 $4,419,813
Induced Effect -22.2 $935,943 $2,928,299 $3,864,242
‐58%
‐11%
‐5%
‐5%
‐13%
Ship building and repairing
Limited‐service restaurants
Real estate
Employment services
Wholesale trade
Other local government enterprises
Water transportation
Full‐service restaurants
Business support services
Retail ‐ General merchandise stores

Norfolk Coastal Adaptation and Community Transformation Plan
Attachment F Benefit Cost Analysis IV.5.10
Recurrence Interval
Impact Type Employment Labor
Income Output Total
Total Effect -77.2 $3,269,750 $16,987,928 $20,257,678
1% annual chance
Direct Effect -63 $2,455,397 $21,560,484 $24,015,881
Indirect Effect -47 $2,175,868 $6,642,357 $8,818,225
Induced Effect -44.4 $1,869,852 $5,849,908 $7,719,760
Total Effect -154.3 $6,501,116 $34,052,749 $40,553,865 Table IV.5.4 Ohio Creek Watershed Top Industries Affected by Output Loss for the 1% Annual Chance Event
Sector Description Employmen
t Labor
Income Output Total
440 Real estate -47.2$1,139,97
2$9,488,13
9 $10,628,111
526 Other local government enterprises
-19.2$1,437,63
3$5,651,04
6 $7,088,679
62 Maintenance and repair construction of nonresidential structures
-6 $384,217$1,111,16
3 $1,495,380
464 Employment services -5.7 $202,193 $299,198 $501,391
468 Services to buildings -4.4 $110,985 $242,233 $353,218
63 Maintenance and repair construction of residential structures
-3.4 $219,290 $671,358 $890,648
517 Private households -3.1 $52,315 $52,592 $104,907502 Limited-service restaurants -2.8 $54,457 $148,529 $202,986501 Full-service restaurants -2.5 $52,170 $121,223 $173,393
433 Monetary authorities and depository credit intermediation
-2.2($138,070
)($517,400
) ($655,470)
Total Economic Impact Results Naturally, the total project results presented in this methodology demonstrate the complete expected economic impact in Norfolk should another flood event occur. These impacts appear to be quite extensive; a 1% flood scenario is expected to mainly impact shipyards, restaurants, and the real estate industry. For the same flood scenario, a total of 551 jobs, $26.8 million in labor income, and $100 million in industry production (or sales) is estimated to be lost for the year of the event. See Tables IV.5.5 through IV.5.7 and Figure IV.5.3.

Norfolk Coastal Adaptation and Community Transformation Plan
Attachment F Benefit Cost Analysis IV.5.11
Figure IV.5.2 Ohio Creek Watershed Top 10 Industries Affected by the 1% Annual Chance Event
Table IV.5.5 Total Impact Summary of Output Loss for 1% Annual Chance Flood Scenario
Recurrence Interval
Impact Type Employment Labor
Income Output Total
10% annual chance
Direct Effect -70.8 $5,492,275 $19,335,844 $24,828,119
Indirect Effect -38.5 $1,921,781 $5,501,517 $7,423,298
Induced Effect -53 $2,198,359 $6,898,347 $9,096,706
Total Effect -162.3 $9,612,415 $31,735,707 $41,348,122
2% annual chance
Direct Effect -188.8 $10,157,686 $41,057,256 $51,214,942
Indirect Effect -85.4 $4,191,423 $12,454,498 $16,645,921
Induced Effect -108 $4,497,795 $14,105,145 $18,602,940
Total Effect -382.3 $18,846,904 $67,616,899 $86,463,803
1% annual chance
Direct Effect -265.2 $14,006,415 $61,454,071 $75,460,486
Indirect Effect -129.6 $6,308,926 $18,856,661 $25,165,587
Induced Effect -156.9 $6,541,566 $20,508,631 $27,050,197
Total Effect -551.7 $26,856,907$100,819,36
3 $127,676,27
0
‐48%
‐32%
‐7%
Real estate
Other local government enterprises
Maintenance and repair construction ofnonresidential structuresEmployment services
Services to buildings
Maintenance and repair construction ofresidential structuresPrivate households
Limited‐service restaurants
Full‐service restaurants
Monetary authorities and depositorycredit intermediation

Norfolk Coastal Adaptation and Community Transformation Plan
Attachment F Benefit Cost Analysis IV.5.12
Table IV.5.6 Top 10 Industries Affected by Output Loss for the 1% Annual Chance Flood Scenario
Sector Description Employmen
t Labor
Income Output Total
363 Ship building and repairing -92.1 $7,806,449 $25,444,345 $33,250,794502 Limited-service restaurants -87.6 $1,696,663 $4,627,592 $6,324,255440 Real estate -59 $1,422,468 $11,839,393 $13,261,861
526 Other local government enterprises
-27.2 $2,035,674 $8,001,823 $10,037,497
464 Employment services -16 $569,376 $842,542 $1,411,918
395 Wholesale trade -10.4 $656,792 $2,145,867 $2,802,659
501 Full-service restaurants -9.5 $197,091 $457,966 $655,057
62 Maintenance and repair construction of nonresidential structures
-9.1 $580,183 $1,677,903 $2,258,086
465 Business support services -7.7 $272,253 $450,584 $722,837
468 Services to buildings -7.6 $193,182 $421,632 $614,814
Figure IV.5.3 Top Industries Affected by Output Loss for the 1% Annual Chance Flood Scenario
‐47%
‐9%
‐20%
‐14%
Ship building and repairing
Limited‐service restaurants
Real estate
Other local government enterprises
Employment services
Wholesale trade
Full‐service restaurants
Maintenance and repair construction ofnonresidential structuresBusiness support services
Services to buildings

Norfolk Coastal Adaptation and Community Transformation Plan
Attachment F Benefit Cost Analysis IV.5.13
Table IV.5.7 Net Present Value and Annualized Benefits for Economic Impacts
Output and Labor Income Loss by Percent Annual Chance Flood Scenario
Benefits
Target Area 10% 2% 1% Annualized Net Present
Value
Newton’s Creek
$39,572,616 $66,206,126 $87,122,405 $6,152,608 $84,910,584
Ohio Creek $1,775,508 $20,257,678 $40,553,865 $988,243 $13,638,491
Total $41,348,122 $86,463,803 $127,676,270 $7,140,851 $98,549,075

Norfolk Coastal Adaptation and Community Transformation Plan
PART V QUALITATIVE BENEFITS

Norfolk Coastal Adaptation and Community Transformation Plan
Qualitative Benefits For many reasons, not all benefits can be included in the benefit cost ratio. Nevertheless, it is still important that these benefits are in the consideration of funding for the projects in Norfolk’s Coastal Adaptation and Community Transformation Plan. Two projects are proposed within the Target Area, based on watershed. As such, the qualitative benefits section may take up to six pages according to the Notice of Funding Availability.
Affordable Housing Many employers have reported that a lack of affordable housing makes it more difficult—and, thus, more costly—to recruit and retain employees. In a national survey of more than 300 companies, 55% of respondents acknowledged an insufficient level of affordable housing in their proximity, and two-thirds of these respondents believed that this shortage negatively affected their ability to hold on to qualified employees.1 From an employer’s perspective, a lack of affordable housing may put a local economy at a competitive disadvantage. Research indicates that building an estimated 100 affordable housing units for families through Low-Income Housing Tax Credit programs can support as many as 30 new jobs in the local economy. These employment effects are on par with building comparable market-rate units.2 The availability of affordable housing not only attracts employers but could also increase the amount of disposable income to be reinvested into the local economy. Further, when families spend a smaller percentage of their overall income on housing, they have more resources available to recover and resist shocks and stresses, thereby increasing community resilience.
Workforce Benefits The Coastal Resilience Accelerator will have national implications for research and best practices in addressing SLR and leveraging economic development opportunities related to coastal communities. This Department of Housing & Community Development initiative will revitalize the regional economy by focusing on efforts that will generate high-paying jobs. Nevertheless, as described in Part II Project Description, there will be significant benefits for vulnerable populations. The efforts of the Accelerator are also expected to provide workforce development, expand exports, identify and support existing business clusters, and develop regional civic leadership talent. Innovation labs occupied by colleges and universities will be required to meet a threshold requirement ensuring LMI student access from across institutions, thus providing training to students while developing new technologies and providing technical expertise and facilities for startups and small companies. Academic projects will, when possible, develop technologies and processes that benefit LMI communities during the commercialization phase.
Historic Preservation The Target Area contains a number of historic structures that would benefit directly from the installation of the proposed protection measures. The Ohio Creek Watershed encompasses the Chesterfield Heights Historic District, which was placed on the National Register of Historic
1 Urban Land Institute (2007). Lack of Affordable Housing near Jobs: A Problem for Employers and Employees. 2 Cohen, Rebecca and Wardrip, Keith (2011). The Economic and Fiscal Benefits of Affordable Housing. The Planning Commissioners Journal.
Attachment F Benefit Cost Analysis Page V.1

Norfolk Coastal Adaptation and Community Transformation Plan
Places in June 2003.3 The district is comprised of 401 residential structures and 3 non-residential buildings; it stands out as one of the largest and earliest planned suburbs in Norfolk. The Newton’s Creek Watershed is home to seven historic structures, including the Attucks Theatre and six churches—one of which dates back to 1739 and remains Norfolk’s oldest building.4 Though the building/content replacement value of these structures is not inherently higher when compared to non-historic buildings, the social, cultural, and historic loss of these structures would have a much greater impact on the community as a whole.
Historic preservation has the potential to increase area property values. In a Pennsylvania study, the authors found immediate and sizeable increases (15 to 63%) in prices of homes in historic districts the year following historic designation. They also found annual appreciation rates of 3 to 4 percentage points higher than those in surrounding non-historic neighborhoods.5 In New Jersey, it was found that, “Properties listed on the national, state, or local historic registers have a market value of $6 billion, of which about $300 million can be attributed to the value-enhancing effort of historic designation.”6
An analysis of property values within the Target Area indicates similar results. Residential structures contained within the Chesterfield Heights Historic District maintained an average value approximately 27% higher than structures located directly outside of the district.
Historic preservation provides benefits through preservation of cultural heritage for future generations. Although these are considered nonmarket values, the inherent benefit of protecting these resources within a community is a qualitative benefit that should be considered.
Stormwater Management Most stormwater from streets and surrounding areas is collected in a dedicated stormwater-drainage system. The stormwater network in the Target Area is designed to collect rainwater runoff and route it toward the Elizabeth River. During extreme flood events, the outfalls of these systems are closed to prevent tidal waters from backing up into the system up through inlets, causing flooding in city streets and surrounding areas.
Analysts used GIS to determine the potential areas of stormwater inundation in the Target Area without any stormwater management improvements, such as those proposed by the projects. The analysts calculated the total volume of water for the 10% annual chance, 24-hour rain event and compared this volume to two rain-driven flooding scenarios combined with surge events that would lead to system backup (2.8% current annual chance coastal flood event or 46% annual chance coastal flood event when sea level rise is considered):7 1) No shoreline protection system in place, and 2) Proposed shoreline protection system in place, but without the proposed
3 National Park Service. Undated. National Register of Historic Places Program: Chesterfield Highlands Historic Places Program. [web page] Located at: http://www.nps.gov/nr/feature/places/13000540.htm 4 National Park Service. Undated. National Register of Historic Places Program [web page] Located at: http://www.nps.gov/nr/research/ 5 Pennsylvania Historical and Museum Commission. 2011. Economic Benefits of Historic Preservation Activities in Pennsylvania. December. 6 New Jersey Historic Trust. 2005. Economics and Historic Preservation: A Guide and Review of the Literature. 7 Results from a transient model of stormwater runoff over the City surface and through the stormwater system, while desirable, were not available given the short duration of the application.
Attachment F Benefit Cost Analysis Page V.2

Norfolk Coastal Adaptation and Community Transformation Plan
pumping system integral to this shoreline protection system.8 Based on the model, flooding from the scenario is expected to concentrate in low-lying areas, but also against the coast in both scenarios, damaging assets most vulnerable to coastal flood events.
The analysis showed that the proposed boundary flood protection would neither resolve nor escalate the stormwater flooding issues associated with combined surge and rain events. Nevertheless, the conditions associated with stormwater flooding differ depending upon whether the storm scenario includes or does not include coastal boundary flood protection.
It should be noted that flooding in these scenarios does not account for water that flows overland; only the capacity of depression storage is considered. Such overland flow would require a transient stormwater flow model that was beyond the current scope of this evaluation. The development of such a model is strongly recommended in future phases of work to facilitate stormwater resiliency design and evaluation. Also, stormwater backup into basements, though anticipated, is not presented in these figures. The damages calculated for these scenarios were considered to be captured already within the calculated coastal flood damages in coastal inundation areas and were not added to the BCA to avoid duplication of benefits.
Norfolk’s Coastal Adaptation and Community Transformation Plan will provide green stormwater management techniques throughout the Target Area. These measures—on-site parcel retention such as rain gardens, bioswales, and rain barrels on both public and private properties; green and blue street improvements; enhanced and newly created wetlands; dry-day parks; above- and belowground retention areas; and other techniques—are expected to provide a good measure of stormwater detention that will attenuate the delivery of stormwater during and immediately after a rain event. Because the project design is not complete, specific volumes cannot be quantified at this time.
Water Quality Benefits Although reduced costs for stormwater treatment are being included as benefits in the quantitative portion of this analysis, there is no clear way to ascertain a value for overall water quality at this time. TMDLs represent the total amounts of pollution that a water body can receive and still meet USEPA standards for water quality. The Virginia Department of Environmental Quality submits the “Reduction of Toxics in State Waters Report” to the House Committees on Conservation and Natural Resources and the Chesapeake and Its Tributaries, and to the Senate Committee on Agriculture, Conservation and Natural Resources each year in January. From the January 2015 report’s Appendix I-3 “State of the Elizabeth River Scorecard 2014,” we read:
“The Eastern Branch [of the Elizabeth River] earns a D, indicating urgent need behind a new plan for this branch. Scientists found disturbingly high levels of bacteria in Broad Creek and Indian River tributaries and extremely low dissolved oxygen in Broad Creek. The Elizabeth
8 The pumping portion of the proposed stormwater solution relies, in part, on the presence of the boundary flood protection in order to function fully. The second scenario, with the wall in place, but without a pumping solution, is not a realistic scenario, but was developed to understand the benefits of the stormwater solution both with and without the shoreline protection solution in place.
Attachment F Benefit Cost Analysis Page V.3

Norfolk Coastal Adaptation and Community Transformation Plan
River Project9 has just completed a draft comprehensive strategy for community-wide efforts to improve the Eastern Branch, with a priority focus on Broad Creek and Indian River.” (Page 3)
The scorecard measures nine characteristics, including dissolved oxygen, bacteria from both human sources and from shellfish, nitrogen, and phosphorus. A grade of D was given in 2014 to the following measured elements: bottom health (abundance and diversity of life on the riverbed), polycyclic aromatic hydrocarbons (PAHs), phosphorus, and polychlorinated biphenyls. Again from the Report:
“The Elizabeth River Project in 2014 engaged diverse stakeholders to complete a comprehensive action plan, Eastern Branch Environmental Restoration Strategy, currently in final draft form. Though this branch traverses three cities (Norfolk, Chesapeake, and Virginia Beach), it has the lowest public profile and also some of the lowest scores for environmental health of any of the Elizabeth’s five branches, especially with regard to troubling scores in Broad Creek and Indian River tributaries to the Eastern Branch.
“The main channel of this branch, toward its mouth in downtown Norfolk, is the healthiest in terms of water quality. Nonetheless, partners are focusing on an area of bottom contamination there at the former location of a wood treatment facility.”10
A metric associated with TMDL is provided in Part II Project Description. In addition, the Elizabeth River activities are expected to restore marsh and oyster reefs and create resilient habitat for the Atlantic Sturgeon (Acipenser oxyrinchus), endangered in the Chesapeake Bay, and the following fish found in the Elizabeth River and managed under the Magnuson-Stevens Fisheries Conservation and Management Act: Spiny Dogfish (Squalus acanthias), Summer Flounder (Paralichthys dentatus), Black Sea Bass (Centropristis striata), Squid (Lolliguncula brevis), Butterfish (Poronotus triacanthus), and Atlantic Bluefish (Pomatomus saltatrix). Another key species managed under National Marine Fisheries Service that will use these habitats is the Striped Bass (Morone saxatilis).
Urban Heat Island Mitigation Urban areas are more vulnerable to the effects of temperature increase and precipitation pattern changes because of the heating and cooling processes of building roofs and cars, as well as the emission of greenhouse gases.11 Norfolk is vulnerable to the UHI effect, as it maintains a relatively dense urban environment compared to the surrounding regions and contains a large amount of impervious (paved) surfaces that trap and absorb heat. In a 2014 study, Norfolk ranked fifth in the nation as having the fastest growing overnight UHI.12 Norfolk has recognized as part of the PlaNorfolk 2030 that a result of several actions identified in the plan will “serve to reduce the effect of reflected energy on temperatures (the urban heat island effect), as well as increase the tree canopy cover and reduce the amount of paved surface.”13 Research has indicated that the installation of green stormwater infrastructure—such as rain gardens, bio-
8 The Elizabeth River Project is the non-profit organization that leads community efforts to restore the environmental health of the Elizabeth River. 10 “State of the Elizabeth River Scorecard 2014”, Nov. 17, 2014. Page 10 11 Choi, Hyun-Ah (2012). Determining the Effect of Green Spaces on Urban Heat Distribution Using Satellite Imagery. 12 Climate Central (2014). Summer in the City: Hot and Getting Hotter 13 City of Norfolk (2015). PlaNorfolk 2030, page 6-13.
Attachment F Benefit Cost Analysis Page V.4

Norfolk Coastal Adaptation and Community Transformation Plan
retention features, and permeable pavements—can cause a reduction in temperature variations in an area.14
The proposed actions in the Target Area will contribute toward reducing UHI effects—planting trees, expanding park spaces, installing bio-retention features, incorporating rain gardens into existing landscapes, and installing permeable pavement throughout the area—and will not only create more inviting spaces for the public but provide new shaded areas, assist in cooling surface temperatures, and reduce greenhouse gases from the atmosphere by absorption.
Improvements made in the Target Area will also allow for water, air, and water vapor to filtrate naturally through the soil rather than through the stormwater-collection system. This ability to filtrate naturally will greatly reduce energy needs required to treat wastewater and, therefore, reduce the amount of greenhouse gases emitted from the treatment plants. Additionally, the capability to decrease the UHI effect could indirectly save electrical energy costs. The Lawrence Berkeley Lab Heat Island Group estimates that each one degree Fahrenheit increase in peak summertime temperature leads to an increase in peak demand of 225 megawatts, costing ratepayers $100 million annually.15
Emergency Response and Recovery Efforts After Hurricane Irene, flooded roadways and non-functioning transportation services impeded travel throughout the Target Area. Although no lives were lost due to this situation, flooded roads could (in the future) prevent emergency response vehicles—such as police cars, ambulances, or firefighting equipment—from reaching victims in time. The protection of these areas from flooding will serve to reduce emergency response times and give adequate access to crews that typically deal with fallen trees, downed power lines, or other disaster incidents. Flood risk reduction will also favorably impact post-disaster recovery efforts, allowing residents and property owners to return from evacuation safely in order to address possible damages and begin the return to “blue skies” life. This reduction in the need for and cost of emergency services is not able to be quantified due to a lack of data from previous flood events.
Injuries Injuries that may be experienced during and immediately after a future flood event have not been quantified in the BCA due to lack of local injury data from past storms.
Economic Impacts of Project Implementation Resiliency projects often benefit the local and regional economy by providing employment opportunities during implementation and increasing output and Gross Domestic Product (GDP) for the area. Even the construction phase generates economic benefits due to the influx of expenditure into the economy and jobs created by the increased need for services. While it is important to identify the benefits that federal spending on such a project would add to the Virginia Beach-Norfolk-Newport News MSA economy, these benefits cannot be counted toward the project’s BCA.16 To measure economic impacts related to project expenditures, analysts used
14 Choi, Hyun-Ah (2012). Determining the Effect of Green Spaces on Urban Heat Distribution Using Satellite Imagery. 15 Chang, S. (2000). Energy Use. Lawrence Berkeley Lab Heat Island Group. 16 According to OMB Circular A-94, “employment or output multipliers that purport to measure the secondary effects of government expenditures on employment and output should not be included in measured social benefits or costs.”
Attachment F Benefit Cost Analysis Page V.5

Norfolk Coastal Adaptation and Community Transformation Plan
IMPLAN Version 3.0 economic software system to develop an input-output model of the MSA’s economy. Expenditures associated with project implementation were input into the model, including planning, design, materials, labor, and equipment. Overall, the proposed project is expected to generate more than 2,550 jobs, $141 million in labor income, and $199 million in industry output through the MSA alone, increasing local GPD by $199 million. Economic relationships can and do extend to geographic areas beyond the MSA, and these benefits are not quantified. It is expected that project implementation will generate economic benefits at a national level. The full economic impact assessment conducted, including the analysis and results, are provided in a folder on the Box, and may be found here.
Regional Benefits Although there are no known considerations for BRAC for the Hampton Roads area, the region is responsive to concerns by its largest employer and gross regional product initiator, the federal military. Naval activities, the Virginia Port Authority, and other water-based industries in the area—such as ship building and repair facilities—provide considerable employment; the ability for these employees to get to and from work each day is paramount to the region’s economic success. The protection afforded by the proposed projects will positively impact the lives of these employees, in turn helping to maintain steady productivity in the region.
Light Rail Infrastructure Norfolk is the smallest city in America to have built a light rail system. Work week ridership for the first six months of operation averaged 4,650 a day—exceeding the original projection of 2,900 trips per day.17 The total cost of the light rail (called “The Tide”) makes it the least expensive system built on a per mile basis in the country. Norfolk has already experienced more than $1.2 billion in investments along the 7.4-mile light rail alignment since it was announced in 2011. In fact, the past 10 years of downtown development has been primarily along The Tide’s right-of-way. The light rail system is part of a larger plan to develop a multi-modal transportation network to sustain Norfolk’s position as a business, cultural, educational, and medical center.
During Hurricane Irene, light rail transportation was suspended Saturday, August 27, 2011, in anticipation of flooding on rail lines and adjacent streets; it was scheduled to resume approximately 35 hours later at 11 A.M. on Sunday, August 28, 2011. 18 Additionally, light rail service was temporarily suspended during the most recent Hurricane Joaquin event in October 2015. Ray Amoruso, Chief Planning and Development Officer of Hampton Roads Transit, stated, “Our Operators are instructed never to risk their equipment if the waters rise while they are in route, and to call into dispatch for detour instructions.” It’s important to recognize that Hurricane Irene was considered a 17-year event (based on recurrence interval analysis) and Hurricane Joaquin was considered to be a much lesser event than Irene. Much more significant impacts would occur during the 100-year event plus 2.5 feet of SLR being analyzed.
The Tide Light Rail system ridership is significantly dependent on the system; nearly half of all trips on the system are home-based work trips. Loss of service impacts as a result of flooding have large impacts on the community, as it affects people’s ability to get to and from work. It can be assumed (under the scenario that incorporates SLR, as stated above and within the BCA
17 PlaNorfolk 2030 (2013). City of Norfolk 18 http://gohrt.com/news_release/transit-services-suspended-for-saturday/
Attachment F Benefit Cost Analysis Page V.6

Norfolk Coastal Adaptation and Community Transformation Plan
results) that the light rail system, if impacted, could be out of service for an extended period of time. Many light rail systems have delicate electronic systems which, when exposed to floodwater, have a high likelihood of severe damage. For repair of damaged light rail components, loss of service for the rail line can be a number of weeks. It is assumed that under significant flood scenarios, such as those modeled for Norfolk, this loss of service would be substantial and have severe negative impacts to employed and unemployed riders.
The proposed project will provide benefits to transportation infrastructure, including the light rail system, by protecting these assets against future impacts related to storm surge and flooding, thereby reducing shocks and stresses on the community.
Attachment F Benefit Cost Analysis Page V.7

HUD NDRC – Chesapeake and Newport News BCA
F1-1
1. BCA Preparation
The Commonwealth of Virginia engaged the services of contracted Stantec Consulting Services,
Inc. (Stantec) through the Old Dominion University Foundation to compile and manage the
Benefit Cost Analysis (BCA) for their application for the National Disaster Resilience Competition
(NDRC) for the Cities of Chesapeake and Newport News. Stakeholders for the Virginia
application include, but are not limited to: all communities in the Hampton Roads region
(including Chesapeake, Newport News and Norfolk), the office of Governor Terry McAuliffe, and
the Virginia Department of Housing and Community Development (DHCD). See “Section I –
Capacity” in the Phase 2 Application for a list of stakeholders who will be integral to managing
and contributing to the proposed projects.
In coordination with the NDRC, Stantec provided professional engineering and grant writing
services to the Commonwealth of Virginia. Stantec worked directly with the Commonwealth to
compile data and information about the proposed projects for the Virginia grant application.
Using the provided information, Stantec applied engineering methodology to analyze the
lifecycle costs and potential quantitative and qualitative benefits for each project.
The Commonwealth of Virginia worked with many community partners to assess community
needs, generate solutions, and assess the feasibility and costs of these projects. Stantec worked
with the Commonwealth to select and move forward with conducting a BCA for attractive
projects. This process involved ample discussion of benefits achieved by each project, which
played a large role in the selection process. In other words, final benefits as applied in the BCA
spreadsheet were quantified through a broad stakeholder, iterative process.
Stantec then developed analysis methodology and conducted BCAs for a variety of different
projects ranging from living shorelines and stream restorations to property buyouts and tide gate
construction. Stantec analyzed these projects and utilized resources to showcase the BCA
computations and methods.
2. Full Proposal Cost
The project cost for Chesapeake and Newport News are listed in Tables F.1 and F.2 below. Costs
are provided in total for each City, as well as per grouped projects.
The lifecycle costs include estimated operations and maintenance, and utilize a typical design
life of 50 years. Cost estimates were developed by the State’s many partners by applying data
from recent bid tabs of local developers, contractors, and projects of similar profile.
Refer to “Section IV: Leverage” in the Phase 2 Application for the Commonwealth of Virginia for
a detailed overview of direct and supporting funding partners.

HUD NDRC – Chesapeake and Newport News BCA
F1-2
Table F.1 – Chesapeake Project Cost Summary
Project ActivityInitial
Expenditure1
Annual
Maintenance Costs2
Design Life
(Years)
Total Maintenance
Costs3
(NPV)
Lifecycle Cost
w/ Total Leverage4
(NPV)
Lifecycle Cost
for Benefit Comparison5
(NPV)
127,076,125$ 595,000$ 127,671,125$ 87,371,125$ 40,895,000$ 86,776,125$
Freeman Overpass 25,500,000$ 5,000$ 50 $69,000 25,569,000$ 25,569,000$ 69,000$ 25,500,000$
Bainbridge Blvd Elevation 49,300,000$ 15,000$ 50 $207,000 49,507,000$ 49,507,000$ 207,000$ 49,300,000$
South Hill Neighborhood Buyout 9,662,188$ 5,000$ 50 $69,000 9,731,188$ 9,731,188$ 69,000$ 9,662,188$
Freeman Ave Stormwater Bio-Filtration Site 1,291,500$ 4,100$ 50 $56,000 1,347,500$ 1,347,500$ 56,000$ 1,291,500$
Buckeye Stormwater Bio-Filtration Site 255,875$ 4,100$ 50 $56,000 311,875$ 311,875$ 56,000$ 255,875$
Bainbridge Blvd Living Shoreline 472,250$ 5,000$ 50 $69,000 541,250$ 541,250$ 69,000$ 472,250$
Lakeside Park Living Shoreline 294,312$ 5,000$ 50 $69,000 363,312$ 363,312$ 69,000$ 294,312$
Bainbridge Boulevard Public Utilities Upgrades 7,000,000$ -$ 50 $0 7,000,000$ -$ 7,000,000$ -$
22nd Street Bridge 18,000,000$ -$ 50 $0 18,000,000$ -$ 18,000,000$ -$
South Norfolk / Liberty Street Drainage 1,500,000$ -$ 50 $0 1,500,000$ -$ 1,500,000$ -$
South Norfolk / Oakdale Resilience Projects 5,000,000$ -$ 50 $0 5,000,000$ -$ 5,000,000$ -$
South Norfolk / Portlock Drainage BMPs 800,000$ -$ 50 $0 800,000$ -$ 800,000$ -$
South Norfolk Sanitary Sewer Improvements 8,000,000$ -$ 50 $0 8,000,000$ -$ 8,000,000$ -$
73,889,900$ 345,000$ 74,234,900$ 74,234,900$ 345,000$ 73,889,900$
Fernwood Farms Buyout and Living Shoreline 39,272,675$ 10,000$ 50 $138,000 39,410,675$ 39,410,675$ 138,000$ 39,272,675$
Mains Creek Buyout and Living Shoreline 34,217,225$ 10,000$ 50 $138,000 34,355,225$ 34,355,225$ 138,000$ 34,217,225$
Micro-Mitigation Project 400,000$ 5,000$ 50 $69,000 469,000$ 469,000$ 69,000$ 400,000$
Total 200,966,025$ 940,000$ 201,906,025$ 161,606,025$ 41,240,000$ 160,666,025$
Project 2 - Voluntary Buyout and Living Shoreline at Fernwood
Farms and Mains Creek
Application Designation Lifecycle Cost Calculation
Leverage
CommittedGrant Request
Project 1 - Freeman Ave Overpass, Bainbridge Blvd Elevation, and
South Hill Voluntary Buyout / Flood Protection

HUD NDRC – Chesapeake and Newport News BCA
F1-3
Table F.2 – Newport News Project Cost Summary
Project ActivityInitial
Expenditure1
Annual
Maintenance Costs2
Design Life
(Years)
Total Maintenance
Costs3
(NPV)
Lifecycle Cost
w/ Total Leverage4
(NPV)
Lifecycle Cost
for Benefit Comparison5
(NPV)
29,612,000$ 1,173,000$ 30,785,000$ 22,673,000$ 10,115,000$ 20,670,000$
Chesapeake Avenue Seawall and Bike Path 6,500,000$ 15,000$ 50 $207,000 6,707,000$ 6,707,000$ 707,000$ 6,000,000$
Urban Stream Restoration and Wetlands 3,000,000$ 20,000$ 50 $276,000 3,276,000$ 3,276,000$ 441,000$ 2,835,000$
Chesapeake Avenue Tide Gate & Pump Station 12,000,000$ 50,000$ 50 $690,000 12,690,000$ 12,690,000$ 855,000$ 11,835,000$
Southeast Neighborhood Grocery Store 3,800,000$ -$ 50 $0 3,800,000$ -$ 3,800,000$ -$
Lower Jefferson 12th to 14th Street Streetscape 2,000,000$ -$ 50 $0 2,000,000$ -$ 2,000,000$ -$
27th and Buxton Street Grade Adjustments 1,472,000$ -$ 50 $0 1,472,000$ -$ 1,472,000$ -$
Short Street and Christopher Shores Drainage
Improvements 840,000$ -$ 50 $0 840,000$ -$ 840,000$ -$
Total 29,612,000$ 1,173,000$ 30,785,000$ 22,673,000$ 10,115,000$ 20,670,000$
Application Designation Lifecycle Cost Calculation
Leverage
CommittedGrant Request
Project 1 - Salters Creek Watershed

HUD NDRC – Chesapeake and Newport News BCA
F1-4
3. Current Situation
3.1. Existing Vulnerability
In 2011, the Hampton Roads region of Virginia was devastated by Hurricane Irene. The
Category 1 hurricane reached wind gusts of 67 MPH and is considered a FEMA Qualifying
Disaster for the region. The Target Areas comprise sub-county areas in the Hampton Roads
region and meet the threshold requirements of Most Impacted and Distressed as well as having
Unmet Recovery Needs following a Qualifying Disaster.
The high winds and storm surge impacts of Hurricane Irene exposed areas of concern for the
Hampton Roads region. The hurricane affected critical facilities like water/wastewater assets,
damaged transportation infrastructure, and reduced economic activity. The storm exposed
vulnerabilities and deficiencies with the drainage and storm water management in the
watershed. Hurricane Irene also revealed a need to develop a comprehensive strategy and
plan to prepare, protect and recover from future extreme rain and flood events.
The Hampton Roads region is at risk of flooding from coastal storm events including tropical
storms, hurricanes and nor’easters, a risk that is considered to be increasing due to the threat of
sea level rise (SLR). In fact the area has been subject to the highest rate of relative sea level rise
on the East Coast, seeing 14 inches of rise since 1930. The threat of sea level rise is exacerbated
by land subsidence, and as a result, the region is experiencing the impacts of climate change
more rapidly than other coastal communities. The region is second only to New Orleans as the
largest population center at risk from sea level rise in the country.
Implementing land use regulations to control future development in flood prone locations is vital
for resilient construction. Like much of the Atlantic coast, the Hampton Roads region contains
neighborhoods in and around floodplains that are vulnerable to natural disasters and in need of
protection via alternative planning and design measures. Affordable housing planning and
development should be a consideration in areas other than those most at risk – something
property buyouts and resilient projects play a role in.
Refer to “Section II: Need/Extent of the Problem” in the Phase 2 Application for the
Commonwealth of Virginia for a detailed overview of the census tracts included as part of the
Target Areas.
3.2. Social Conditions
The overall funding request predominantly serves low-to-moderate-income (LMI) residents and
other populations considered to be the most vulnerable to natural disaster due to social,
economic, and educational factors that can make disaster recovery and resilience more
challenging. In the Target Area, vulnerable populations include low-income persons and
households, seniors, those with disabilities who are more likely to need assistance, children, and
non-English proficient residents. These groups are especially vulnerable during natural disasters
because they rely on outside care and may be more at risk to stress during a disaster.
In the Target Area in the City of Chesapeake, more than 50% of people earn less than 80% of the
area median income. Within the Target Area, 52% are LMI as indicated by CDBG LMI summary

HUD NDRC – Chesapeake and Newport News BCA
F1-5
data. At least one-third of the city of Newport News’s population is considered LMI, with a
majority of the LMI population living in the Southeast neighborhood.
Vulnerable populations suffer the most during extreme flooding events. LMI residents are at
greater risk from lack of electricity, transportation, restricted access to income and employment,
and the effects on homes and businesses following the flood event. As many LMI residents and
business owners are unable to repair or rebuild properly following a storm, due to no flood
insurance or access to grant funds, homes and businesses remain damaged.
Without the recovery, resilience, and revitalization projects, some populations within Virginia
continue to be vulnerable as the Target Areas struggle with economic depression, high
unemployment rates, under-employment, instability, poverty, inequality, aging and insufficient
infrastructure, environmental degradation, declining and aging populations, and limited
developable land. The Target Areas are at risk of experiencing continued declines in population,
employment, economic investment, and overall community stability. Refer to “Section II:
Need/Extent of the Problem” in the Phase II Application for the Commonwealth of Virginia for
specific data on LMI areas.
3.3. Environmental Conditions
The City of Chesapeake has over 300 miles of coastline, and approximately one-third of its land
area consists of wetlands. Water-related infrastructure is prevalent throughout the city’s
waterways for commercial, industrial, and recreational uses, including over 12 miles of deep
draft channels and over 120 miles of commercial waterfront land. The city also includes
branches of the Elizabeth River. Flooding can occur along all waterways and large sections of
the city are low and subject to tidal flooding during hurricanes and severe nor’easters also
creating large amounts of remaining debris.
After multiple large storm events and extensive flooding, the City of Newport News (with its 244
miles of shoreline) is in need of many repairs to the ecosystem. Improvements include stream
and channel restoration, bank stabilization, dredging and wetland construction, as well as
preventative measures such as seawalls to help mitigate future environmental damage from
occurring. Drainage improvements and storm water management techniques are being
evaluated for increased efficiency and resiliency to address the safety of community residents,
and to enhance the economic development, quality of life, and build a sense of community
within the watershed.
The Chesapeake Bay is the largest estuary in the US and plays a significant role in the lives of
Hampton Roads’ residents including recreation, fishing, navigation, and commerce. The Bay
suffers from serious pollution degradation primarily related to nutrients (nitrogen and phosphorus)
and sediment. Currently, a massive restoration project is underway within the watershed to
reduce nutrient and sediment discharges into the Bay with the goal of reducing harmful algal
blooms and the “dead” zone caused by algae dying off. This application specifically targets
projects with environmental benefits aimed at improving the health and future of the
Chesapeake Bay.

HUD NDRC – Chesapeake and Newport News BCA
F1-6
4. Proposed Project/Program
4.1. Proposal Objectives
Virginia has developed a regional approach to its natural disaster and climate changing
challenges: “Thrive: Resilience in Virginia”, a refined three-part approach to achieve resiliency -
guided by the National Preparedness System to 1) build water management solutions, 2)
strengthen vulnerable neighborhoods, 3) improve economic vitality. Each of these components
contributes to “uniting the region” and “creating coastal resilience” which were identified in the
Phase I application as cornerstones of Virginia’s approach. Thrive's lines of effort align with HUD's
goal for the National Disaster Resilience Competition, as they are each designed to achieve a
major critical objective, address unmet need, and provide replicable and scalable solutions to
identified vulnerabilities within the Target Areas defined in this proposal.
From Thrive, a Resilience Lab/Accelerator will be created to identify critical resilience issues that
constrain business continuity of coast-based businesses, produce research solutions, develop
needed workforce skills and training and support the expansion of businesses to deliver the
solutions to the market. The Coastal Resilience Accelerator has eight defined objectives:
Water Management Solutions
Resilient Systems Innovation
Entrepreneurial Ecosystem
Project Financing and Capital Market Innovation
Regional Leadership and Planning
Research and Evaluation
Workforce Development
Incentivize Community Change
Refer to “Section III: Soundness of Approach” in the Phase 2 Application for the Commonwealth
of Virginia for further detail on the Thrive strategy and proposal objectives.
4.2. Design Philosophy
The infrastructure upgrade projects were selected with the intention to help the impacted
communities achieve a safe and resilient baseline for the environment and critical infrastructure
so they can support their current population, create new industries, and seek future growth while
keeping in mind any impact from future climate change. The projects for “Thrive: Resilience in
Virginia” were selected with the following strategy in mind:
1) Unite the region - The goal is to unite the region by increasing cooperation and coordination
around shared water and economic challenges and opportunities. Formal relationships with
regional partners have been established to address the impacts of climate change and the
resulting sea level rise.
2) Create coastal resilience - The goal is to use increasing risk to drive change, creating a region
capable of thriving as a coastal community for the next century. As rising sea levels necessitate
a changed landscape, the strategy is to adapt land use around water by making water a
community amenity - reintroducing natural landscapes into neighborhoods

HUD NDRC – Chesapeake and Newport News BCA
F1-7
3) Strengthen vulnerable neighborhoods - The proposed projects will help build regional
resilience and strengthen vulnerable neighborhoods by reducing flood risk, while increasing
opportunity. The cities will augment these initiatives to help people adopt behaviors that reduce
vulnerability and building social cohesion by establishing networks that connect people.
4) Improve economic vitality - The goal is to maintain the region’s economic drivers while
diversifying the economy. In the coming decades, the region will invest heavily in water
management and resilience-enhancing systems.
5) Build water management solutions - Thrive will create, test, and build water management
solutions that showcase innovative and replicable solutions at multiple scales, and create
multiple benefits to cities. The projects listed in the application are designed with the following
water management principles:
a.) System approach
b.) Scales approach
c.) Hold water as far up the watershed as possible
d.) Slow the water and clean it as it drains through distributed green multi-purpose open
space areas
e.) Restore creek beds to channel water
f.) Physically reimagine the community to achieve co-benefits such as connectivity,
economic revitalization, social cohesion, and health and ecological benefits
Refer to “Section III - Soundness of Approach” to find the design philosophy described in more
detail.
4.3. Geographic Boundaries
The Target Areas comprise census tracts within the Cities of Chesapeake, Newport News, and
Norfolk located in the Hampton Roads Region at the mouth of the Chesapeake Bay. The
sheltered harbor and extensive network of rivers, creeks and swamps have attracted people to
settle here for thousands of years. Due to land subsidence, Hampton Roads is experiencing the
highest rate of relative sea level rise on the East Coast. This rise is significantly increasing both the
region’s risk for flooding and the severity and resultant impact of storms. The City of Chesapeake
has over 300 miles of coastline, and approximately one-third of its land area consists of wetlands,
while the City of Newport News has approximately 244 miles of shoreline, including inland areas
and a military base. These features add to the attraction of the cities, but also make them
vulnerable to natural hazards. Within Newport News, a project in the Southeast Neighborhood
are specifically being targeted with this application
Refer to “Section II – Need/Extent of the Problem” to find specific sub-county areas and census
tracts designated as Target Areas.
4.4. Proposal Components
The proposed Virginia projects for Chesapeake and Newport News in this application are
comprised of four main categories focusing specifically on stream/watershed restoration,

HUD NDRC – Chesapeake and Newport News BCA
F1-8
property buyouts, green infrastructure installations, and flood resilient upgrades. Refer to
“Section III – Soundness of Approach” for more detail on project components, including specific
benefits to be achieved and how the specified projects may interact with other projects
described.
1. Stream/watershed restoration – The multiple projects plan to create living shorelines
aimed at constructing coastal marshes, providing open green space, and resulting in a
revitalized ecosystem. Other facets of the projects involve bank stabilization and
wetland restoration.
2. Property Buyouts – The voluntary buyouts will purchase properties in flood prone areas
and reduce water surface elevations via the living shoreline projects and create green
space for the local community.
3. Green Infrastructure Installations – The implementation of green infrastructure such as bio-
filtration in Chesapeake and other green space along the bike path in Newport News.
4. Flood Resilient Upgrades to Seawall, Tide Gate, Pump Station, and Freeman
Avenue/Bainbridge Boulevard – Multiple infrastructure projects will occur reducing the
risk of potential flooding in low lying areas.
4.5. Timeline
The proposed construction projects within these communities can be expected to last
approximately 24 months. The design life for each of these projects will vary between 25-50 years
depending on the infrastructure.

HUD NDRC – Chesapeake and Newport News BCA
F1-9
5. Baseline Risks
5.1. Long Term Effects
The planning and design phase of a project considers the baseline approach asking the
question, “What are the risks if the proposed projects are not implemented?” Communities must
weigh the benefits and costs associated with the baseline option. As weather events are
becoming more severe and extreme, resulting impacts of damage and loss are also increasing.
Staying idle and not rebuilding with recovery, resilience, and revitalization in mind will leave
communities like those in Virginia vulnerable to increased risk from natural disasters affecting the
environment, health, safety, and economy of the surrounding population.
Hurricane Irene validated the proposition that without more resilient infrastructure, the region will
continue to be impacted socially, physically, and economically from subsequent natural
disasters. If the recovery and resilience projects are not implemented in Virginia, past storm surge
and flood events may leave communities with damaged and abandoned structures. Not only
will the visible damage endure from previous natural disasters, but also unseen, underground
infrastructure may be destroyed. Risk of a similar, future event will remain or increase with the
evolving weather patterns observed across the nation posing a risk to the health and safety of
the community. Unless the proposed projects are implemented, the Target Areas are at risk of
experiencing continued declines in population, employment, economic investment, and overall
community stability.
Communities like those in Chesapeake and Newport News target areas have experienced
flooding of their homes and businesses, and loss of power, communication and transportation. If
the properties at risk are not bought out and relocated, then chances are the community will
face a comparable situation at some point in the near future (5, 20, 50 years later) based on
recurrence intervals and the frequency of past observed storm events along the Atlantic coast.
Future losses are predicted to increase as sea levels continue to rise and coastal storms become
more frequent and intense.
Over time, if the revitalization projects are not implemented and redevelopment does not
occur, then the impacted communities may suffer both socially and economically as they are
much more vulnerable in their ability to recover from disaster events.
The proposed seawall and tide gate upgrades are projects designed to mitigate future hazards
to health and infrastructure. Even though the proposed recovery and resilience projects may not
prevent all damage or mitigate every risk, future improvements in quality of life and the regional
economy from projects like the living shorelines and Chesapeake Avenue bike trail will bring
substantial new benefits to these Virginia communities.
5.2. Effect on Community
Natural disasters like flooding can have major impacts on a community. Mild flooding can
cause damage to landscaping and create unwelcome debris. Major flooding ruins buildings
and leads to potential injuries or death.
When impacted areas remain, local communities suffer consequences economically and
socially. Generally, the areas impacted by natural disasters can affect local property values,

HUD NDRC – Chesapeake and Newport News BCA
F1-10
and deter future development. Vulnerable populations with limited resources are especially
affected by flooding because of financial constraints, disability, age, and other constraints. The
target areas for the Chesapeake and Newport News NDRC proposed projects include
concentrations of low and moderate income households and persons with other vulnerabilities. .
Due to struggling economies, aging infrastructure, and susceptible terrain, the Target Areas have
been unable to recover from disasters or plan for future events by implementing resilient
measures. Unless the two cities, as partners of the Commonwealth, are able to capitalize on this
opportunity to build comprehensive, sustainable, and resilient infrastructure and revitalize
neighborhoods, they will continue to be at risk as flooding and sea level rise increase.
5.3. Additive Impacts
The result of not implementing these restorative and rehabilitation projects diminishes additive
impacts like local tourism, recreational activities, and improved living environment in the Virginia
communities.
The absence of proposed green infrastructure, living shorelines, and localized drainage and
stream restoration projects will coincide with the absence of potential qualitative benefits. These
benefits include increased standards of living, community cohesion, recreation, health, wellness,
and public perception.
Without the construction of additional transit options like the Freeman Overpass, Bainbridge
Boulevard upgrade and the Chesapeake Avenue Bike Trail in the region, additional traffic
congestion and increased gas emissions will remain. Residents without access to delayed access
to private transportation or public transit will not be fully connected to other locations in the city
that could provide jobs, recreation, health care, and education.
If the flooding conditions the region experiences continues to persist and the upgrades are not
constructed, the vulnerable populations will stay susceptible to coastal and stormwater flooding.
Additionally, the region would not benefit from the additive benefits provided by the
recommended projects.
5.4. Impact to LMI Households
A large portion of the region’s citizens is vulnerable to the increasing risks associated with sea
level rise. Using the intermediate/low scenario from NOAA’s Climate Central model, there is a
better than even chance the region will experience floods exceeding 5 feet of the high tide line
by 2030-40. Climate Central’s Surging Seas risk finder estimates that more than 107,000 Virginians
live in homes below 5 feet of the high tide line. Close to 77,000 of those residents are ranked as
high or medium for Social Vulnerability. According to US Census data, 13% of the region’s
citizens live in poverty and 9% of Hampton Roads residents report no access to a vehicle, leaving
them unable to evacuate without assistance and increasing the burden on public shelters and
public transportation networks in the event of a disaster.
Virginia’s economy will also face challenges from rising sea levels. A study by Sandia National
Laboratories notes failure to mitigate the effects of climate change in Virginia could result in
$45.4 billion in lost Gross Domestic Product and the loss of more than 314,000 jobs by 2050.

HUD NDRC – Chesapeake and Newport News BCA
F1-11
Repetitive risk of loss has a disproportionate impact on low income, elderly, disabled, limited-
English, and other vulnerable populations. Many Virginia communities contain pockets of
concentrated poverty that will be adversely impacted if these recovery, resilience, and
revitalization projects are not completed. Localized flooding events and severe storms continue
to put low income neighborhoods at risk. Using the best available science and data,
communities are being encouraged to find the most significant vulnerabilities and risks facing
the affected communities. LMI households would benefit when innovative resilience projects are
discovered to better prepare these communities for future storms and other extreme events.
Low- and moderate-income individuals and households make up a significant portion of the
population in the areas of Chesapeake and Newport News where resilience activities and NDRC
projects are proposed. The target areas include the communities’ oldest, most urbanized, and
most economically disadvantaged neighborhoods (South Norfolk in Chesapeake and the
Southeast Neighborhood in Newport News). In Chesapeake, over 50% of the population of the
target areas, South Norfolk/Mill Creek Watershed and Crestwood/Oak Grove Watershed, is low
and moderate income. South Norfolk, Chesapeake’s historic urban center located on the
waterfront has an individual poverty level of nearly 20%, of whom nearly one-third are children
and 12% are persons over 65 years of age. In the census tracts in Newport News’s Salters Creek
Watershed target area 78% of its population is low and moderate income and more than half of
the city’s public and assisted housing inventory is located there.
Without the projects providing for recovery, resilience, and revitalization, some populations
within Virginia continue to be vulnerable. Target Areas may continue to struggle with economic
depression, high unemployment rates, under-employment, instability, poverty, inequality, aging
and insufficient infrastructure, environmental degradation, declining and aging populations,
and limited developable land. The Target Areas are at risk of experiencing continued declines in
population, employment, economic investment, and overall community stability. Refer to
“Section II: Need/Extent of the Problem” in the Phase 2 Application for the Commonwealth of
Virginia for a detailed overview challenges faced by LMI areas.
5.5. Cost Avoidance
Avoiding damages or inducing cost savings should be a key item in risk mitigation and resilience
planning. Cost effectiveness and induced savings benefits are central to comparing projects in
the benefit-cost analysis. Many of the proposed projects seek to reduce future expenses and
reduce the amount of property damage in the event of a similar disaster.
Building the Chesapeake Avenue tide gates and seawall will include expenditures now, but the
net benefit in the future will be the cost avoidance through the mitigation of future injury or loss
of life. Also, having damaged structures and neighborhoods remaining may diminish the local
economy and inhibit potential development.
Freeman Avenue Overpass provides an alternative means of transportation of goods and
services, which is especially beneficial during a disaster event. The Bainbridge Boulevard is
being proposed above the 100-year (1% annual-chance event) flood elevation so it can serve
as a reliable and cost effective form of transportation during a disaster event. Cost savings will
occur over time due to decreased traffic delays and decreased level of risk in event of a natural
disaster.

HUD NDRC – Chesapeake and Newport News BCA
F1-12
Flood hazard reduction and buyout programs provide important damage reductions. Restoring
a stream or wetland to better handle flood flows is important for reducing the damages induced
by rivers and streams. Additionally, buyout programs are very beneficial for removing at-risk
properties from flood hazard areas and reducing any future risk altogether. Together, the two
can be powerful tools for reducing damage costs during a disaster event.

HUD NDRC – Chesapeake and Newport News BCA
F1-13
6. Benefits and Cost
This section describes the methods used to determine the life cycle costs and resiliency,
environmental, social and economic benefits of projects. A benefit-cost analysis was only
required for covered projects, however all projects were investigated in an effort to justify the
value they would provide the community, region, and nation at large. Benefit-cost ratios as well
as net-benefit values were produced for each project to serve as an indicating metric of the
value added. Where monetization of benefits was not possible, project merit is discussed from a
qualitative perspective. Refer to “Section III: Soundness of Approach” in the Phase 2
Application for the Commonwealth of Virginia for more detail on each qualitative benefit. Refer
to Tables F.3 and F.4 for a line item summary of each expected benefit considered in this
analysis. The costs and benefits methodology is discussed in greater detail in the sections below.
6.1. Lifecycle Cost
Lifecycle costs for each project consider both initial capital costs and annual expenses required
to maintain a project over the project life. Capital costs and annual expense estimates are
based on local knowledge and resources. Based on this information, a net present value (NPV)
representing the lifecycle cost was computed based on a discount rate of 7% over the useful life
of the project per guidance from Office of Budget and Management (OBM) Circular A-94,
revised October 29, 1992.
6.2. Quantified Benefits
6.2.1. Resilience Value
Resilience benefits for the Hampton Roads projects focus primarily on avoidance of
damages and impacts associated with flooding. A description of benefits calculated for
each project is provided below. Additional detail on calculation of specific benefits is
available at the following file transfer site: ftp://VIRGINIA1006:[email protected]
Freeman Overpass, Bainbridge Boulevard Elevation and South Hill Voluntary Buyout
(Chesapeake):
Coastal Flood Damages Avoided: Raising Bainbridge Boulevard (up to El. 10 ft)
combined with the installation of tide gates / valves at all creek crossings will prevent
flooding on the east side of Bainbridge Boulevard for coastal flooding up to El. 8 ft.
For flooding exceeding El. 8 ft, it is assumed that the project provides no flood
protection (tide gates open). Voluntary acquisition and demolition of 41 flood prone
structures in the South Hill neighborhood will prevent any future damage to structures
and building contents. Using these before and after scenarios, damages to
structures and building contents were calculated using the methods employed by
the FEMA Benefit-Cost Analysis (BCA) Software. Actual calculations were performed
in GIS and Microsoft Excel to allow for the efficient review of a large dataset.
Resident Displacement Avoided: The Bainbridge Boulevard and South Hill projects
described above will also reduce the effects of displacement on vulnerable
populations. Displacement costs avoided were calculated using estimated depth of

HUD NDRC – Chesapeake and Newport News BCA
F1-14
flooding and FEMA depth displacement curves utilized by the FEMA BCA Software.
Actual calculations were again performed in GIS and Microsoft Excel.
Reduced Loss of Roadway Function during High Tides and Storm Events: Several
sections of Bainbridge Boulevard are currently located below El. 6 ft. Based on a
projected sea level rise (SLR) of 2.5 feet, it is anticipated that the roadway may
overtop as frequently as 3 to 4 times a year causing road closures and delays. The
resilience benefit is quantified by using the FEMA standard benefit per vehicle hour
caused by road closure delays. Typical traffic counts were provided by the Virginia
Department of Transportation, and the increased driving time for each vehicle was
estimated based on a reasonable detour route.
Voluntary Buyout and Living Shoreline at Fernwood Farms and Mains Creek (Chesapeake):
Coastal Flood Damages and Resident Displacement Avoided: The Fernwood Farms
and Mains Creek Voluntary Buyout Program benefit includes acquisition and
demolition of 79 and 78 structures, respectively. Calculation methods were identical
to those performed for the South Hill project discussed above.
Salters Creek Watershed (Newport News):
Coastal Flood Damages and Resident Displacement Avoided: The Chesapeake
Avenue Tide Gate and Pump Station will protect areas within the Salters Creek
Watershed for coastal flood events below El. 7 ft. A storm surge at El. 7 ft is equivalent
to a 25-year event based on current FEMA studies; however considering 2.5 feet of
SLR this elevation could be exceeded as often as once every 4 years. Damages
(structures and content) and resident displacement avoided were calculated for
floods below El. 7 ft in accordance with the methods described above. For floods
greater than El. 7 ft, it is assumed that the project provides no flood protection (tide
gates open).
Erosion Damage Avoided: During Hurricane Isabell, a 500 foot section of sea wall
along Chesapeake Avenue was damaged from the resultant storm surge and
resultant waves. Damage repair costs to the sea wall and infrastructure behind it
were provided by the City of Newport News. Using historic water level data, a
recurrence interval for Isabell (~1:40 years) and sea level rise adjustment, the
annualized risk and net present value were calculated based on the historic damage
and likelihood of future occurrence.
6.2.2. Environmental Value
Environmental benefits for the Hampton Roads projects focus primarily on improving water or
air quality and enhancing habitat. A description of benefits calculated for each project is
provided below. Further details and backup calculations are available via hyperlink from the
BCA Narrative Table.

HUD NDRC – Chesapeake and Newport News BCA
F1-15
Freeman Overpass, Bainbridge Boulevard Elevation and South Hill Voluntary Buyout
(Chesapeake):
Reduced Vehicle Emissions: The Freeman Overpass project will significantly reduce
congestion in the area reducing vehicle operation hours. The environmental benefit
is quantified based on reduction benefits from the TIGER BCA Resource Guide.
Reduced emission benefits from the proposed projects were developed in a
separate report entitled “Freeman Avenue/Norfolk-Portsmouth Beltline (NPBL)
Railroad Overpass TIGER Grant Discretionary Grant Proposal.
Enhanced Habitat and Green Space Services: The Bainbridge Boulevard, Freeman
Avenue and South Hill projects all incorporate enhancements in the form of living
shorelines, green infrastructure facilities and added public green space. These types
of areas provide environmental services such as climate regulation, improved
habitat, improved biodiversity, improved water quality and nutrient reduction. Some
social services are also provided such as aesthetics and recreation opportunities.
Nutrient reduction benefits were calculated for living shorelines and bio-filtration
facilities using the Virginia standard “direct value” method for phosphorus reduction.
The other services provided by open space, green infrastructure facilities and living
shorelines for these projects were calculated using standard values per unit area from
FEMA Mitigation Policy – FP 108-024-01 which have been ajusted to 2015 dollars for
this study. Each project was reviewed individually and only the appropriate
environmental service benefits were included within the benefit calculation.
Voluntary Buyout and Living Shoreline at Fernwood Farms and Mains Creek (Chesapeake):
Enhanced Habitat and Green Space Services: Fernwood Farms and Mains Creek
projects both include creation of new living shorelines and public open space which
provide environmental services such as those discussed above. Calculation methods
were identical to those performed for the Bainbridge Boulevard and South Hill
projects discussed above.
Salters Creek Watershed (Newport News):
Reduced Vehicle Emissions: The Chesapeake Avenue Seawall and Bike Path project
includes a bike path which could provide an alternative method for people to get to
work other than driving. The environmental benefit is quantified based on reduction
benefits from the TIGER BCA Resource Guide. Reduced emissions are based on the
reduction in the number of auto miles driven each year. Using 2010 US Census data
and the American Community Survey from 2013 for Newport News it was assumed
that a fraction of the population within a half mile of the bike path would use it for
their daily commute. Using data regarding average commutes from the 2013
American Community Survey, the number of miles reduced by use of the bike paths
was estimated. Reduced emission benefits were then quantified using values from
the TIGER BCA Resource Guide.
Enhanced Habitat and Green Space Services: The Hampton Avenue and Slaters
Creek stream restoration projects both incorporate restoration of the riparian areas.
Restored riparian areas provide environmental services such as climate regulation,

HUD NDRC – Chesapeake and Newport News BCA
F1-16
improved habitat, improved biodiversity, improved water quality, nutrient reduction
and erosion control. Nutrient reduction benefits were calculated for restored riparian
areas the Virginia standard “direct value” method for phosphorus reduction which is
based on the length of stream restored. The other environmental services provided
by restored riparian areas were calculated using standard values per unit area from
FEMA Mitigation Policy – FP 108-024-01 which have been inflated to 2015 dollars for
this study. Each project was reviewed individually and only the appropriate
environmental service benefits were included the benefit calculation.
6.2.3. Social Value
Social benefits for the Hampton Roads projects were found to be difficult to monetize and
are discussed qualitatively in section 6.3.
6.2.4. Economic Revitalization
Economic benefits for the Hampton Roads projects include reduction in commuter travel
time and increasing property values due to added amenities. A description of benefits
calculated for each project is provided below. Further details and backup calculations are
available via hyperlink from the BCA Narrative Table.
Freeman Overpass, Bainbridge Boulevard Elevation and South Hill Voluntary Buyout
(Chesapeake):
Reduced Travel Time: The Freeman Overpass and Bainbridge Boulevard Elevations
projects both reduce travel times for commuters. Less time spent driving represents
less of an economic drain on productivity. The economic benefit is quantified based
on reduction benefits from the TIGER BCA Resource Guide. Travel time reduction
benefits for the Freeman Overpass project was developed in a separate report
entitled “Freeman Avenue/Norfolk-Portsmouth Beltline (NPBL) Railroad Overpass
TIGER Grant Discretionary Grant Proposal. Travel time reduction benefits for the
Bainbridge Boulevard Elevation project were calculated by reviewing sea levels over
the past 17 years, adding the projected sea level rise and identifying the frequency
of inundation of Bainbridge Boulevard based on its current profile. The length of time
the detour would take to bypass the flooding was then estimated and quantified
based on reduction benefits from the TIGER BCA Resource Guide.
Salters Creek Watershed (Newport News):
Increased Property Values from Adjacent Greenways/Trails: The Chesapeake
Avenue Seawall and Bike Path project includes bike path for recreational purposes.
According to a 2009 study by Asabere, P and F Huffman, properties within a half mile
of greenways, trails and bike paths experience an average increase in property
values of 5% of the property value. Parcels and assessed property values within a half
mile of the project were identified and 5% of the property values were calculated as
a one-time economic benefit of the project.

HUD NDRC – Chesapeake and Newport News BCA
F1-17
Qualitative Benefits
6.2.5. Resilience Value
Freeman Overpass, Bainbridge Boulevard Elevation and South Hill Voluntary Buyout
(Chesapeake):
Improved Evacuation Routes during Flood Events: The Bainbridge Boulevard
Elevation project will provide better evacuation routes during flood events. Raising
the roadway above the 1-Percent-Annual-Chance water surface elevation would
allow for alternate means of evacuation in the event of a natural disaster and
reduce the likelihood of people becoming trapped by flood waters.
Improved Emergency Access: The Freeman Avenue Overpass project will reduce
extreme congestion and emergency vehicle access. Under existing conditions, rail
traffic causes extensive backups and delay on Freeman Avenue and Interstate-64,
potentially impeding emergency vehicles. Replacing the at-grade Norfolk and
Portsmouth Belt Line Railroad Company (NPBL) rail crossing on Freeman Avenue with
an overpass would help to avoid traffic delays and obstruction of access caused by
rail lines.
Reduced Vulnerability to Industrial Spills: The South Hill Voluntary Buyout project
removes populations from the vicinity of industrial activities. The South Hill
neighborhood is adjacent to a fertilizer tank farm and other industrial hazards. In the
past, there have been liquid fertilizer spills in the local area. While difficult to quantify,
removing people from the area would reduce the potential for the community being
affected by future accidents.
Salters Creek Watershed (Newport News):
Reduced Flooding of Roadways and Yards: The Hampton Avenue Stream Restoration
project includes upsizing several culverts. This is expected to improve drainage and
reduce the impact of flooding waters on roadways and properties. The benefit
remains qualitative until a detailed hydraulic study is performed in order to monetize
flood damage estimation. Less ponding water and basement backups can be
expected due to the improved drainage.
6.2.6. Environmental Value
Environmental benefits for the Hampton Roads projects were successfully monetized and are
discussed quantitatively in section 6.2.
6.2.7. Social Value
Freeman Overpass, Bainbridge Boulevard Elevation and South Hill Voluntary Buyout
(Chesapeake):
Health Benefits from Improved Walkability / Bike Path Use: Bainbridge Boulevard
Elevation project includes replacing one car lane with bike lanes. Once the

HUD NDRC – Chesapeake and Newport News BCA
F1-18
community begins utilizing the proposed bike trail and bike lane, local residents
should benefit from improved levels of fitness and health.
Improved Quality of Life by Improved Natural Environment: The Bainbridge Boulevard
Elevation and South Hill buyout projects include open space and environmental
enhancements. Stabilizing and restoring the natural environment should lead to an
improved ecosystem and as a result, an increased quality of life for surrounding
homes and businesses.
Benefit to Low- and Moderate-Income Persons: The Freeman Overpass, Bainbridge
Boulevard Elevation and South Hill Buyout projects are located in an area which has
higher unemployment and lower incomes than the median for the City. The water
management approaches and development to be implemented, as part of these
projects, will work in concert to address flood vulnerabilities, enhance the health and
wellbeing of residents, and stimulate economic growth within LMI communities.
Voluntary Buyout and Living Shoreline at Fernwood Farms and Mains Creek (Chesapeake):
Improved Quality of Life and Benefit to Low- and Middle-Income Persons: Fernwood
Farms and Mains Creek projects both include creation of new living shorelines and
public open space in low- and middle- income population areas and provide all the
qualitative social benefits discussed above for the Freeman Overpass, Bainbridge
Boulevard and South Hill projects for these services.
Salters Creek Watershed (Newport News):
Health Benefits, Improved Quality of Life and Benefit to Low- and Middle-Income
Persons: The Salters Creek projects include restoration of riparian areas and
pedestrian trails in low- and middle- income population areas and provide all the
qualitative social benefits discussed above for the Freeman Overpass, Bainbridge
Boulevard and South Hill projects for these services.
6.2.8. Economic Revitalization
Freeman Overpass, Bainbridge Boulevard Elevation and South Hill Voluntary Buyout
(Chesapeake):
Construction Jobs Created: The Freeman Overpass, Bainbridge Boulevard and South
Hill projects include significant infrastructure construction and will create numerous
opportunities for construction jobs within the region.
Increased Property Values due to Reduced Blight: The South Hill buyout will decrease
the number of distressed properties in the area and reduce blight. This will improve
the quality of the adjacent neighborhood and will result in a rise in property values.
Voluntary Buyout and Living Shoreline at Fernwood Farms and Mains Creek (Chesapeake):
Increased Property Values due to Reduced Blight: The Fernwood Farms and Mains
Creek buyouts will decrease the number of distressed properties in the area and

HUD NDRC – Chesapeake and Newport News BCA
F1-19
reduce blight. This will improve the quality of the adjacent neighborhood and will
result in a rise in property values.
Salters Creek Watershed (Newport News):
Construction Jobs Created: The Salters Creek Watershed projects include significant
infrastructure construction and will create numerous opportunities for construction
jobs within the region.
Increased Tourism: The Salters Creek Watershed projects include construction of bike
paths and associated connections to local parks and improvements to local
recreational facilities. This is anticipated to bring in individuals from outside the City /
Region to use these facilities.
6.3. Benefits Summary
The Benefit Cost Summary Tables detail the calculation of total benefits for each
covered project and are provided as Tables F.3 and F.4. Benefit Cost Narrative Tables
provided as Tables F.5 and F.6 summarize the benefit cost analyses performed and
meet the requirements of Appendix H of the NOFA.

HUD NDRC – Chesapeake and Newport News BCA
F1-20
Table F.3 – Chesapeake Benefit Cost Summary
Project Activity
Lifecycle Cost
for Benefit Comparison5
(NPV)
Benefits (NPV)Benefit-Cost-
Ratio (BCR)Net Benefit Value
87,371,125$ 171,030,043$ 1.96 83,658,918$
Freeman Overpass 25,569,000$ 52,839,011$ 2.07 27,270,011$
Travel Time Savings (Freeman Ave Overpass) 51,461,144$
Emissions Reductions (Freeman Ave Overpass) 1,377,867$
Bainbridge Blvd Elevation 49,507,000$ 102,896,337$ 2.08 53,389,337$
Flood Damages Avoided 50,059,280$
Resident Displacement Avoided 48,691,451$
Travel Time Savings (Bainbridge Elevation - Flooding) 4,145,606$
South Hill Neighborhood Buyout 9,731,188$ 12,358,074$ 1.27 2,626,886$
Flood Damages Avoided (South Hill Buyout) 6,292,393$
Resident Displacement Avoided (South Hill Buyout) 4,573,199$
Open Green Space (FEMA Method) 1,492,482$
Freeman Ave Stormwater Bio-Filtration Site 1,347,500$ 681,155$ 0.51 (666,345)$
Green Infrastructure (FEMA Method) 92,555$
Green Infrastructure (Phosphorus Reduction) 588,600$
Buckeye Stormwater Bio-Filtration Site 311,875$ 614,697$ 1.97 302,822$
Green Infrastructure (FEMA Wetland Method) 86,697$
Green Infrastructure (Phosphorus Reduction) 528,000$
Bainbridge Blvd Living Shoreline 541,250$ 1,200,029$ 2.22 658,779$
Coastal Marsh (FEMA Wetland Method) 44,982$
Coastal Marsh (Phosphorus Reduction) 1,155,047$
Lakeside Park Living Shoreline 363,312$ 440,739$ 1.21 77,427$
Coastal Marsh (FEMA Wetland Method) 20,535$
Coastal Marsh (Phosphorus Reduction) 420,204$
74,234,900$ 194,809,753$ 2.62 120,574,853$
Fernwood Farms Buyout and Living Shoreline 39,410,675$ 94,523,632$ 2.40 55,112,957$
Flood Damages Avoided 48,691,451$
Resident Displacement Avoided 24,465,301$
Open Green Space (FEMA Method) 3,961,662$
Coastal Marsh (FEMA Wetland Method) 770,567$
Coastal Marsh (Phosphorus Reduction) 16,634,652$
Mains Creek Buyout and Living Shoreline 34,355,225$ 100,286,121$ 2.92 65,930,896$
Flood Damages Avoided 51,673,844$
Resident Displacement Avoided 25,473,760$
Open Green Space (FEMA Method) 2,150,930$
Coastal Marsh (FEMA Wetland Method) 977,877$
Coastal Marsh (Phosphorus Reduction) 20,009,710$
Micro-Mitigation Project 469,000$ -$ 0.00 (469,000)$
Total 161,606,025$ 365,839,796$ 2.26 163,933,771$
Project 2 - Voluntary Buyout and Living Shoreline at Fernwood
Farms and Mains Creek
Application Designation Lifecycle Cost Calculation Benefit Metrics
Project 1 - Freeman Ave Overpass, Bainbridge Blvd Elevation,
and South Hill Voluntary Buyout / Flood Protection

HUD NDRC – Chesapeake and Newport News BCA
F1-21
Table F.4 – Newport News Benefit Cost Summary
Project Activity
Lifecycle Cost
for Benefit Comparison5
(NPV)
Benefits (NPV)Benefit-Cost-
Ratio (BCR)
Net Benefit Value
(NPV)
22,673,000$ 44,425,196$ 1.96 21,752,196$
Chesapeake Avenue Seawall and Bike Path 6,707,000$ 11,135,327$ 1.66 4,428,327$
Damages Avoided from Storm Surge and Sea Level Rise 4,347,235$
Increased Property Values for Areas Adjacent to Greenway /
Trail 6,712,335$
Emissions Reductions Associated with Increased Bicycle
Commuting 75,757$
Urban Stream Restoration and Wetlands 3,276,000$ 8,772,609$ 2.68 5,496,609$
Hampton Avenue Stream Restoration / Bank Stabilization
(Phosphorus Reduction) 2,652,000$
Hampton Avenue Stream Restoration (FEMA Riparian
Method) 169,860$
Salters Creek Stream Restoration / Bank Stabilization
(Phosphorus Reduction) 2,856,000$
Salters Creek Stream Restoration (FEMA Riparian Method) 3,094,749$
Chesapeake Avenue Tide Gate & Pump Station 12,690,000$ 24,517,260$ 1.93 11,827,260$
Flood Damages Avoided 17,833,777$
Resident Displacement Avoided 6,683,483$
Total 22,673,000$ 44,425,196$ 1.96 21,752,196$
Application Designation Lifecycle Cost Calculation Selection Metrics
Project 1 - Salters Creek Watershed Projects

1 2 3 4 5 6
(Explain basis and/or methodology for calculating
Monetized Effect, including data sources, if applicable)Monetized Effect (if applicable)
Life Cycle Costs
Freeman Avenue Overpass F1-8
Replace the existing at-grade Norfolk and Portsmout Belt
Line Railroad Company (NPBL) rail crossing on Freeman Ave
with an overpass to avoid traffic delays caused by rail traffic.
Cost esimtate developed by City of Chesapeake. $25,500,000.00 - Capital Cost
$69,000.00 - Maintenance Cost
1. Low uncertainty. Preliminary
engineering complete and detailed cost
estimates developed.
Buckeye and Freeman Avenue Bio-Filtration Sites F1-8Construct two stormwater bio-filtration facilities 0.74 and
0.79 acre in size.Cost esimtate developed by City of Chesapeake.
$1,547,375.00 - Capital Cost
$112,000.00 - Maintenance Cost
2. Low uncertainty. City of Chesapeake
has experience with the design and
maintenance of similar facilities.
Bainbridge Boulevard Elevation F1-8
Raise Bainbridge Blvd above the current 100-year WSE of 8
ft. Convert the road from a four lane roadway to three lanes
to allow for the addition of bike lanes. Improve utilities along
roadway including undergrounding electric/communications
and upgrading waterlines, sanitary sewer and stormwater
facilities.
Cost esimtate developed by City of Chesapeake. $49,300,000.00 - Capital Cost
$207,000.00 - Maintenance Cost
4. Moderate to high uncertainty. Tide
gates and pump stations associated with
road elevation are conceptual. Significant
design taks remain.
Bainbridge Boulevard and Lakeside Park Living Shoreline F1-8Construct two living shoreline projects of 0.46 and 0.21 acres
in size.Cost esimtate developed by City of Chesapeake.
$766,562.00 - Capital Cost
$138,000.00 - Maintenance Cost
2. Low uncertainty. City of Chesapeake
has experience with the design and
maintenance of similar facilities.
South Hill Community Buyout F1-8
Voluntary buyout of properties in the South Hill community
including up to 38 residences, 2 small businesses, and 1 small
church.
Cost esimtate developed by City of Chesapeake. $9,662,188.00 - Capital Cost
$69,000.00 - Maintenance Cost
3. Lowto moderate uncertainty. This will
be a voluntary acquisition program. It is
not clear as to the number of residents
who will accept an offer.
Mains Creek Living Shoreline and Voluntary Property Acquisition F1-8Voluntary buyout of properties in Mains Creek community
and restoring 10 acres of the area as a coastal marsh.Cost esimtate developed by City of Chesapeake.
$34,217,225.00 - Capital Cost
$138,000.00 - Maintenance Cost
3. Lowto moderate uncertainty. This will
be a voluntary acquisition program. It is
not clear as to the number of residents
who will accept an offer.
Fernwood Farms Living Shoreline and Voluntary Property Acquisition F1-8
Voluntary buyout of properties in Fernwood Farms
community and restoring 8 acres of the area as a coastal
marsh.
Cost esimtate developed by City of Chesapeake. $39,272,675.00 - Capital Cost
$138,000.00 - Maintenance Cost
3. Lowto moderate uncertainty. This will
be a voluntary acquisition program. It is
not clear as to the number of residents
who will accept an offer.
Micro-Mitigation Projects F1-8Micro flood mitigation projects for residents in Fernwood
Farms and Mains Creek who do not wish to sell.Cost esimtate developed by City of Chesapeake.
$400,000.00 - Capital Cost
$69,000.00 - Maintenance Cost
3. Lowto moderate uncertainty. This will
be a voluntary acquisition program. It is
not clear as to the number of residents
who will accept an offer.
Table F.5 - BCA Narrative Table
City of Chesapeake
Costs and Benefits by Category
Page # in BCA
Narrative -
Attachment F
Qualitative Description of Effect and Rationale for Including
in BCA
Quantitative Assessment
Uncertainty (1-5)
F122

1 2 3 4 5 6
(Explain basis and/or methodology for calculating
Monetized Effect, including data sources, if applicable)Monetized Effect (if applicable)
Table F.5 - BCA Narrative Table
City of Chesapeake
Costs and Benefits by Category
Page # in BCA
Narrative -
Attachment F
Qualitative Description of Effect and Rationale for Including
in BCA
Quantitative Assessment
Uncertainty (1-5)
Improve evacuation routes during flood events F1-17
Bainbridge Blvd has sections below El. 5 Ft. This results in
flooding of the roadway for storms less than 10-year
recurrence interval under existing conditions.
Monetization not feasible. ++
1. Low uncertainty. Evacuation benefits
from raising roadway are well
understood.
Reduce loss of roadway function during high tides and storm events. F1-14
Bainbridge Blvd has sections below El. 5 Ft. With a projected
sea level rise of 2.5 Ft, the roadway would be inundated by
tidal events 58 times within the 18 year gage record at
Money Point. Local traffic will require detours and delays.
Loss of roadway service was calculated using FEMA BCA
methods including average daily traffic (9300 trips) and 15
minute / 4.2 mile detour. $4,145,606.18 - NPV
3. Moderate uncertainty. Benefits are
calculated based on 2.5 feet of SLR.
Ultimate benefits may be greater or less
depending on climate change scenarios.
Reduce flood damage to properties from tidal surge through
construction of tide gatesF1-13
Bainbridge Bld raise and proposed tide gates will prevent
flooding for flood surcharges up to El. 8feet.
FEMA Flood Insurance Study Flood Elevations.
FEMA BCA Methodology.
USACE EM 04-01 Depth Damage Relationships.
SLR 2.5 Feet
$50,059,280.00 - NPV
3. Moderate uncertainty. Benefits are
calculated based on 2.5 feet of SLR.
Ultimate benefits may be greater or less
depending on climate change scenarios.
Prevention of resident discplacement from flooding caused by tidal
surge through construction of tide gatesF1-13
Bainbridge Bld raise and proposed tide gates will prevent
flooding for flood surcharges up to El. 8feet.
FEMA Flood Insurance Study Flood Elevations.
FEMA BCA Methodology.
USACE EM 04-01 Depth Damage Relationships.
SLR 2.5 Feet
$48,691,450.84 - NPV
3. Moderate uncertainty. Benefits are
calculated based on 2.5 feet of SLR.
Ultimate benefits may be greater or less
depending on climate change scenarios.
Reduce flood damage to properties from tidal surge through
voluntary acquisition demolition
Repetitive loss structures are located in the South Hill, Mains
Creek and Fernwood Farms areas. Considering SLR, the
additional risks to propertieis will only increase causing
damage to structures and content.
FEMA Flood Insurance Study Flood Elevations.
FEMA BCA Methodology.
USACE EM 04-01 Depth Damage Relationships.
SLR = 2.5 Feet
Itemized Values Below
3. Moderate uncertainty. Benefits are
calculated based on 2.5 feet of SLR.
Ultimate benefits may be greater or less
depending on climate change scenarios.
South Hill Community Buyout F1-13 See above $6,292,393.00 - NPV See above
Fernwood Farms F1-14 See above $48,691,450.84 - NPV See above
Mains Creek F1-14 See above $51,673,844.00 - NPV See above
Prevention of resident discplacement from flooding caused by tidal
surge through voluntary acquisition demolition
Repetitive loss structures are located in the South Hill, Mains
Creek and Fernwood Farms areas. Considering SLR, the
additional risks to propertieis will only increase causing
damage to structures and content.
FEMA Flood Insurance Study Flood Elevations.
FEMA BCA Methodology.
USACE EM 04-01 Depth Damage Relationships.
SLR = 2.5 Feet
Itemized Values Below
3. Moderate uncertainty. Benefits are
calculated based on 2.5 feet of SLR.
Ultimate benefits may be greater or less
depending on climate change scenarios.
South Hill Community Buyout F1-13 See above See above $4,573,199.00 - NPV See above
Fernwood Farms F1-14 See above See above $24,465,301.00 - NPV See above
Mains Creek F1-14 See above See above $25,473,760.00 - NPV See above
Improved emergency access to industrial areas will reduce risk for
lifeloss in medical emergencies and improve spill response in the case
of an industrial accident.
F1-17
Overpass on Freeman Avenue will provide this emergency
access. Under existing conditions, rail traffic causes
extensive backups on Freeman Ave and I-64 potentially
impeding emergency vehicles.
Monetization not feasible. ++
1. Low uncertainty. Overpass will provide
a clear benefit for emergency vehicle
access.
Reduced vulnerability to industrial spill. F1-17
The South Hill neighborhood is adjacent to the fertilizer tank
farm and other industrial hazards. There have been past
liquid fertilizer spills in the area, which while difficult to
quantify, removing people from the area would reduce the
potential of people being affected by future accidents
Monetization not feasible. ++
1. Low uncertainty. Removal of residential
structures from a heavy industrial zone
will provide a clear reduction in
consequences of industrial spill.
Resiliency Value
F123

1 2 3 4 5 6
(Explain basis and/or methodology for calculating
Monetized Effect, including data sources, if applicable)Monetized Effect (if applicable)
Table F.5 - BCA Narrative Table
City of Chesapeake
Costs and Benefits by Category
Page # in BCA
Narrative -
Attachment F
Qualitative Description of Effect and Rationale for Including
in BCA
Quantitative Assessment
Uncertainty (1-5)
Reduced nutrient and sediment discharge into Chesapeake Bay
Water quality improvement projects in the form of living
shoreline (coastal marsh reclamation) and green
infrastrcuture (bio-filtration) will reduce the discharge of
sediment, nitrogen and phosphorus into the Chesapeake
Bay.
Phosphorus reduction per nutrient trading - Virginia standard
"direct value" methodItemized Values Below
3.Moderate uncertainty. A simplified
method was utilized to calculate total
nutrient reduction. More detailed
methods could result in less or greater
benefit.
Buckeye Bio-Filtration F1-15 See above See above $528,000.00 - NPV See above
Freeman Avenue Bio-Filtration F1-15 See above See above $588,600.00 - NPV See above
Bainbridge Boulevard Living Shoreline F1-15 See above See above $1,155,046.67 - NPV See above
Lakeside Park Living Shoreline F1-15 See above See above $420,203.92 - NPV See above
Fernwood Farms Living Shoreline F1-15 See above See above $16,634,651.69 - NPV See above
Mains Creek Living Shoreline F1-15 See above See above $20,009,710.27 - NPV See above
Provision of additional ecosystem services associated with wetlands /
coastal marsh environments.
Restoration of wetland / coast marshland provides for
ecosystem and social benefits including storm hazard risk
reduction, climate regulation, habitat, recreation/tourism,
aesthetic values, and biodiversity
FEMA Mitigation Policy - FP 108-024-01 Itemized Values Below
3.Moderate uncertainty. Benefit transfer
methods using FEMA Policy are well
understood and applicable. However,
benefits will depend on the acquistion of
contiguous green space through a
voluntary program.
Bainbridge Boulevard Living Shoreline F1-15 See above See above $44,982.33 - NPV See above
Lakeside Park Living Shoreline F1-15 See above See above $20,535.41 - NPV See above
Fernwood Farms Living Shoreline F1-15 See above See above $770,566.86 - NPV See above
Mains Creek Living Shoreline F1-15 See above See above $977,876.72 - NPV See above
Provision of additional ecosystem services associated with open
space.
Open space / greenways provide for ecosystem and social
benefits including climate regulation, air quality, pollination,
recreation/tourism, and aesthetic values.
FEMA Mitigation Policy - FP 108-024-01 Itemized Values Below
3.Moderate uncertainty. Benefit transfer
methods using FEMA Policy are well
understood and applicable. However,
benefits will depend on the acquistion of
contiguous green space through a
voluntary program.
South Hill Community Buyout F1-15 See above See above $1,492,482.04 - NPV See above
Fernwood Farms Living Shoreline and Voluntary Property
AcquisitionF1-15 See above See above $3,961,661.88 - NPV See above
Mains Creek Living Shoreline and Voluntary Property Acquisition F1-15 See above See above $2,150,930.00 - NPV See above
Provision of additional ecosystem services associated with green
infrastructure.
Green infrastructure such as bio-filtration elements provide
for ecosystem and social benefits including waste reduction
and filtration/water quality, climate regulation, water
retention/flood hazard reduction, andaesthetic values.
FEMA Mitigation Policy - FP 108-024-01 Itemized Values Below
2. Low uncertainty. City of Chesapeake
has identified specific locations and
designs of facility. Benefit transfer
methods using FEMA Policy are well
understood and applicable.
Buckeye Bio-Filtration F1-15 See above See above $92,555.35 - NPV See above
Freeman Avenue Bio-Filtration F1-15 See above See above $86,697.42 - NPV See above
Reduced vehicle emissions F1-15Travel times and vehicle miles will be reduced from
construction of the Freeman Avenue Overpass .TIGER, Appendix A BCA $1,377,866.71 - NPV
2. Low to moderate uncertainty. Travel
miles calculated are based on engineering
traffic studies. Link between vehicle miles
reduced and emissions reductions are
well understood.
Environmental Value
F124

1 2 3 4 5 6
(Explain basis and/or methodology for calculating
Monetized Effect, including data sources, if applicable)Monetized Effect (if applicable)
Table F.5 - BCA Narrative Table
City of Chesapeake
Costs and Benefits by Category
Page # in BCA
Narrative -
Attachment F
Qualitative Description of Effect and Rationale for Including
in BCA
Quantitative Assessment
Uncertainty (1-5)
Health benefits from improved walkability / bike path use F1-17
Bainbridge Blvd elevation raise includes replacing one car
lane with bike lanes which will allow for safer and easier bike
/ pedestrian commuting. Additionally, recreational biking /
walking / running is expected to increase with the addition
of trail.
Monetization not feasible. ++
1. Low uncertainty. Many studies have
shown an increase in exercise and
physical activity will improve health
outcomes.
Improved quality of life provided by improved natural environment F1-18
Construction of living shoreline projects with natural function
and aesthetics will improve property values and quality of
life.
Monetization not feasible. ++
1. Low uncertainty.The proposed
restoration projects will enhance the
natural enivronment and improve quality
of life.
Benefit to low- and moderate-income persons F1-18
More than 50% of people in the target area earn less than
80% of the area median income. The
population of the target area is 50,025. Of that population,
25,940 individuals, or 51.85%, are low and moderate-income
(LMI), as indicated by CDBG low and moderate-income
summary data.
Monetization not feasible. ++
1. Low uncertainty.Projects were
specifically targeted to benefit LMI
communities.
Construction jobs created F1-18
Construction of the proposed infrastructure projects will
create numerous opportunities for construction jobs wihtin
the region.
Monetization not feasible. +
1. Low uncertainty. Construction projects
will result in increased temporary labor
and likely have induced economic
benefits.
Improved property values F1-18
Removal of floodprone structures will decrease the number
of distressed properties and reduce blight. This will improve
quality of neighborhood and result in a rise in property value.
Monetization not feasible. +
1. Low uncertainty. Studies have
demonstrated removal of blighted
propertiies will increase neighborhood
property values.
Reduced travel times and hours lost to congestion and detoursTravel times and vehicle miles will be reduced from
construction of the Freeman Avenue Overpass and reduction
in road closure flooding of Bainbridge Boulevard.
TIGER, Appendix A BCA Itemized Values Below
Freeman Avenue Overpass F1-16 See above See above $51,461,143.85 - NPV
2. Low to moderate uncertainty. Travel
times calculated are based on engineering
traffic studies.
Bainbridge Boulevard Elevation F1-16 See above See above $4,145,606.18 - NPV
3. Moderate uncertainty. Road closure
periods are based on a 2.5 ft SLR
projection. Detour travel times are likely
too low (conservative), as they are
calculated based on no traffic delays.
Benefits could be significantly higher.
Economic Revitalization
Social Value
F125

1 2 3 4 5 6
(Explain basis and/or methodology for calculating
Monetized Effect, including data sources, if applicable)Monetized effect (if applicable)
Life Cycle Costs
Chesapeake Avenue Seawall and Bike Path F1-8
Upgrade the existing seawall along Chesapeake Avenue. The
limit of the seawall extends 3,550 linear feet from Anderson
Park Fishing Pier to the City of Hampton line. Adjacent to the
seawall, bike trail and sidewalk will be constructed.
Cost estimate developed by City of Newport News and based
on past experience with similar projects.
$6,500,000.00 - Capital Cost
$207,000.00 - Maintenance Cost
2. Low uncertainty. City of Newport News
has previsouly constructed similar
improvements.
Urban Stream Restoration and Wetlands F1-8
Restore and stabilize 1,300 linear feet of an existing open
drainage channel along Hampton Avenue and 1,400 linear
feet of Salters Creek, an existing open drainage channel
along an existing right-of-way .
Cost estimate from NDRC Project Proposal document
provided by the City of Newport News
$3,000,000.00 - Capital Cost
$276,000.00 - Maintenance Cost
2. Low uncertainty. City of Newport News
has experience with the design and
maintenance of similar facilities.
Chesapeake Avenue Tide Gate & Pump Station F1-8 Install a 40' tide gate with storm pump station at 16th Street.
Cost estimate from 27th Street and Buxton Avenue Impact
Assessment Study - Stormwater Flood Reduction and Tidal
Flood Protection on Salters Creek - Preliminary Report dated
May 2013.
$12,000,000.00 - Capital Cost
$690,000.00 - Maintenance Cost
3. Moderate uncertainty. Tide gates and
pump station recommendations are basd
on a preliminary study. Further design is
required for refinement of cost esimates.
Reduced flooding of roadways and yards F1-17
Replace culverts along Hampton Avenue Channel to improve
drainage and reduce the impact of flood water on roadways
and property
Project will be designed to carry the 10-year storm event
within the channel banks. Existing information regarding
current flood risk is not available for use in calculation of
monetized benefit.
+
3. Moderate uncertainty. Basis of benefit
is conceptual design. No stormwater /
flood studies have been developed to
date. However, the City is reasonably
confident the channels can be increased
to reduce flooding risk.
Reduced flood damage to properties from tidal surge F1-14Tide gate prevents flooding for flood surcharges up to El. 7
feet.
FEMA Flood Insurance Study Flood Elevations.
FEMA BCA Methodology.
USACE EM 04-01 Depth Damage Relationships.
SLR 2.5 Feet
$17,833,777.02 - NPV
3. Moderate uncertainty. Benefits are
calculated based on 2.5 feet of SLR.
Ultimate benefits may be greater or less
depending on climate change scenarios.
Prevention of resident discplacement from flooding caused by tidal
surgeF1-14
Tide gate prevents flooding for flood surcharges up to El. 7
feet.
FEMA Flood Insurance Study Flood Elevations.
FEMA BCA Methodology.
SLR 2.5 Feet
$6,683,483.00 - NPV
3. Moderate uncertainty. Benefits are
calculated based on 2.5 feet of SLR.
Ultimate benefits may be greater or less
depending on climate change scenarios.
Reduce erosion damage from storm surge F1-14Replacement of Chesapeake avenue seawall will prevent
damage and costly repairs to wall, shoreline and roadway.
Historic costs to repair from Hurricane Isabell were used to
estimate potential future repair costs.
Return interval of Isabell storm surge was estimated from
NOAA Gage (~ 40 Years).
Considerin SLR 2.5 Feet (~4 Years).
$11,135,327.03 - NPV
4. Moderate to high uncertainty. Benefits
are based on damages associated with
one prior event. Potential for catastrophic
damages from a higher magnitude - lower
probability event are not included. SLR
was incorporated to assess potential for
more frequent damage associated with
elevated water levels.
Table F.6 - BCA Narrative Table
City of Newport News
Resiliency Value
Uncertainty (1-5)Costs and Benefits by Category
Page # in BCA
Narrative -
Attachment F
Qualitative Description of Effect and Rationale for Including
in BCA
Quantitative Assessment
F126

1 2 3 4 5 6
(Explain basis and/or methodology for calculating
Monetized Effect, including data sources, if applicable)Monetized effect (if applicable)
Table F.6 - BCA Narrative Table
City of Newport News
Uncertainty (1-5)Costs and Benefits by Category
Page # in BCA
Narrative -
Attachment F
Qualitative Description of Effect and Rationale for Including
in BCA
Quantitative Assessment
Reduced nutrient and sediment discharge into Chesapeake BayWater quality improvement projects will reduce the
discharge of sediment, nitrogen and phosphorus into the
Chesapeake Bay.
Phosphorus reduction per nutrient trading -
Virginia standard "direct value" methodItemized Values Below
3.Moderate uncertainty. A simplified
method was utilized to calculate total
nutrient reduction. More detailed
methods could result in less or greater
benefit.
Salters Creek Urban Stream Restoration F1-15 See above $2,856,000.00 - NPV See above
Hampton Avenue Stream Restoration and Wetlands F1-15 See above $2,652,000.00 - NPV See above
Tidal creek habitat improvementsStream restoration projects create open space and riparian
habitat. These benefits include recreation, aethetics, air
quality, etc.
Benefit transfer method - FEMA Mitigation Policy -
FP 108-024-01Itemized Values Below
2. Low uncertainty. City of Newport News
has identified specific locations for
restoration. Benefit transfer methods
using FEMA Policy are well understood
and applicable.
Salters Creek Urban Stream Restoration F1-15 See above $3,094,748.50 - NPV 2
Hampton Avenue Stream Restoration and Wetlands F1-15 See above $169,860.13 - NPV 2
Reduced vehicles on road F1-15
Reduced vehicle emissions from replacment of cars with
bicycles from expected change in commuting patterns for
residents within close proximity of trail.
Emission Reduction Values from TIGER BCA Resource Guide,
updated 3.27.2015; USEPA, "Average Annual Emissions and
Fuel Consumption for Gasoline-Fueled Passenger Cars and
LightTrucks," date unknown, pp.4-5 (web:
http://www.epa.gov/otaq/consumer/420f08024.pdf)
Expected Commuter Conversion: American Community
Survey, 2013 Five-Year Estimate for Newport News City, VA
$75,756.95 - NPV
4. Moderate to high uncertainty.
Estimates of bike path use are based on
national studies and account for limited
local data. Further studies regarding
specific uses by the community were not
available.
Health benefits from improved walkability / bike path use F1-18
Chesapeake Avenue bike path wil allow for safer and easier
bike / pedestrian commuting. Additionally, recreational
biking / walking / running is expected to increase with the
addition of trail.
Based on American Community Survey, it is anticipated that
approximately 300 local residents will commute to work by
biking or walking who previously drove. See Row 28.
Health effects were not able to be monetized.
++
1. Low uncertainty. Many studies have
shown an increase in exercise and
physical activity will improve health
outcomes.
Improved quality of life provided by improved natural environment,
flood reduction, and new amenitiesF1-18
Construction of improved streams (Hampton Avenue and
Salters Creek) with natural function and aesthetics will
improve property values and quality of life.
Reduced flooding and new amenities will improve quality of
life for this area of concentrated poverty, adding to the
impact of other public and private revitalization investments
and the potential for additional investment.
Monetization not feasible. ++
1. Low uncertainty.The proposed
restoration projects will enhance the
natural enivronment and improve quality
of life.
Benefit to low- and moderate-income persons F1-18
10.4% of the city’s total population lives in the project area.
91.7% of the population identify as minority. 12.2% of the
eligible workforce in the project area is unemployed
(citywide rate at 7%). Median Household Income for the
project area is $25,917 (city as a whole at $51,027). Any
improvements to these areas, as well as constuction project
activity will have a very positive impact on the community.
Monetization not feasible. ++
1. Low uncertainty.Projects were
specifically targeted to benefit LMI
communities.
Environmental Value
Social Value
F127

1 2 3 4 5 6
(Explain basis and/or methodology for calculating
Monetized Effect, including data sources, if applicable)Monetized effect (if applicable)
Table F.6 - BCA Narrative Table
City of Newport News
Uncertainty (1-5)Costs and Benefits by Category
Page # in BCA
Narrative -
Attachment F
Qualitative Description of Effect and Rationale for Including
in BCA
Quantitative Assessment
Construction jobs created F1-19
Construction of the proposed infrastructure projects will
create numerous opportunities for construction jobs wihtin
the region.
Monetization not feasible. ++
1. Low uncertainty. Construction projects
will result in increased temporary labor
and likely have induced economic
benefits.
Tourism associated with bike trails and improved shoreline F1-19
The bike path and associated connections to local parks will
create important linkages and is anticipated to bring in
individuals from outside the City / Region.
Monetization not feasible. +
3. Moderate uncertainty. Additional
tourism is anticipated with the proposed
improvements to the shoreline; however,
no specific studies are available to
corroborate.
Improved property values F1-16Property values of homes within close proximity to the bike
path and park are expected to increase.
Estimated increase of property value from bike trail is 5%
(Asabere, P. and F. Huffman. 2009. “The relative impacts of
trails and greenbelts on home price.” The Journal of Real
Estate Finance and Economics 38(4): 408-419).
$6,712,335.00 - NPV
3. Moderate uncertainty. Benefit transfer
method associated with increase in
property values adjacent to greenways is
general. A lower range of property valuen
increase was used for conservatism.
Additional study of the specific area
would be required for increased certainty.
Economic Revitalization
F128

HUD NDRC – Chesapeake and Newport News BCA
F1-29
7. Project Risks
7.1. Risks and Uncertainty
Uncertainties regarding the estimated costs and benefits for the proposed projects are
described in the BCA Narrative Tables in Section 6 of this document. Uncertainties fall primarily
into three categories: 1) Climate Change; 2) Benefit Transfer Methodology; and 3) Detail of
Available Studies and Design.
With regards to climate change, the proposal uniformly applies an estimated sea level rise of 2.5
feet as our base condition. This is considered a moderate future scenario. There are risks and
uncertainties related to both under-prediction and over-prediction of sea level rise. By selecting
a moderate scenario, the application seeks to balance these risks. Specific benefits affected by
this assumption include damages avoided from coastal flooding and displacement avoided
from coastal flooding.
Another uncertainty in the analyses relates primarily to the use of benefit or cost estimates based
on studies conducted in other areas. It is assumed in many cases that average benefits for
similar projects in other parts of the country or averaged nationwide are applicable to the
Virginia region. A particular project may have greater benefit or less benefit if all local factors
were to be accounted for, but it would be impractical to attempt to do so. If additional studies
more applicable to the project area are developed the analyses can be readily updated to
incorporate the new information.
The final major uncertainty relates to the detail of current analyses. The benefits of some
projects such as flood hazard reduction are based, in some cases, on conceptual or preliminary
designs. As these projects proceed from conceptual design to full design, the specific results on
which benefits are calculated will be known with greater certainty. As the project evolves the
benefit analyses can be readily updated to incorporate the new information.
7.2. Proposal Adaptation
Many of the projects proposed in the Virginia communities are scalable. If any of the potential
risks should occur, the project team could scale up or down the proposed infrastructure.

HUD NDRC – Chesapeake and Newport News BCA
F1-30
8. Challenges
8.1. Political and Legal
There may be challenges due to landowner resistance, for instance with the voluntary buyout of
homes in the South Hill, Fernwood Farms, Mains Creek Neighborhoods. Landowners may elect
not to sell land or easement required for the completion of the project. Non-participation could
reduce environmental and flood benefits, but would also reduce costs.
8.2. Additional Engineering
Technical risks are limited due to the nature of the projects proposed; however, design
engineers, planners, and architects create projects with local rules and regulations in mind as
part of their scope in order to comply with appropriate modeling, engineering standards, and
best practices.
8.3. Community Support
Refer to “Section IV: Leverage” in the Phase 2 Application for the Commonwealth of Virginia for
more detail on the support from Virginia stakeholders and for those providing private and public
funding.
Copyright © 2022 FDOKUMEN