Net Impact and Benefit-Cost Estimates of the Workforce ...
214
Upjohn Institute Technical Reports Upjohn Research home page 1-31-2017 Net Impact and Benefit-Cost Estimates of the Workforce Net Impact and Benefit-Cost Estimates of the Workforce Development System in Washington State Development System in Washington State Kevin Hollenbeck W.E. Upjohn Institute for Employment Research, [email protected] Wei-Jang Huang W.E. Upjohn Institute for Employment Research Follow this and additional works at: https://research.upjohn.org/up_technicalreports Citation Citation Hollenbeck, Kevin and Wei-Jang Huang. 2016. "Net Impact and Benefit-Cost Estimates of the Workforce Development System in Washington State." Upjohn Institute Technical Report No. 16-033. Kalamazoo, MI: W.E. Upjohn Institute for Employment Research. https://doi.org/10.17848/tr16-033 This title is brought to you by the Upjohn Institute. For more information, please contact [email protected].
-
Upload
khangminh22 -
Category
Documents
-
view
3 -
download
0
Transcript of Net Impact and Benefit-Cost Estimates of the Workforce ...

Upjohn Institute Technical Reports Upjohn Research home page
1-31-2017
Net Impact and Benefit-Cost Estimates of the Workforce Net Impact and Benefit-Cost Estimates of the Workforce
Development System in Washington State Development System in Washington State
Kevin Hollenbeck W.E. Upjohn Institute for Employment Research, [email protected]
Wei-Jang Huang W.E. Upjohn Institute for Employment Research
Follow this and additional works at: https://research.upjohn.org/up_technicalreports
Citation Citation Hollenbeck, Kevin and Wei-Jang Huang. 2016. "Net Impact and Benefit-Cost Estimates of the Workforce Development System in Washington State." Upjohn Institute Technical Report No. 16-033. Kalamazoo, MI: W.E. Upjohn Institute for Employment Research. https://doi.org/10.17848/tr16-033
This title is brought to you by the Upjohn Institute. For more information, please contact [email protected].

NET IMPACT AND BENEFIT-COST ESTIMATES OF THE WORKFORCE
DEVELOPMENT SYSTEM IN WASHINGTON STATE
Upjohn Institute Technical Report 16-033
KEVIN HOLLENBECKWEI-JANG HUANG
SUBMITTED TO:
DAVE WALLACEResearch Unit Manager
WORKFORCE TRAINING & EDUCATION COORDINATING BOARD (WTECB)
128 Tenth Ave., S.W., 6th FloorP.O. Box 43105
Olympia, WA 98504-3105
SUBMITTED BY:
W. E. UPJOHN INSTITUTE FOR EMPLOYMENT RESEARCH300 S. Westnedge Ave.
Kalamazoo, MI 49007-4686www.upjohn.org
DECEMBER 2016
This report documents work that was supported by the Workforce Training and Education Coordinating Board (WTECB) of the State of Washington, whose support is gratefully acknowledged. Staff at that agency and other agencies in Washington who contributed significantly to the research includes Dave Wallace, Jeff Zahir, and Dave Pavelchek. Outstanding research assistance at the Upjohn Institute was provided by Wei-Jang Huang. As usual, excellent clerical and organization assistance was provided by Claire Black. The views expressed and any errors are the responsibility of the authors. The opinions do not necessarily represent those of the Washington WTECB or the Upjohn Institute.

W.E. Upjohn Institute for Employment Research ii
Net Impact and Benefit-Cost Estimates of the Workforce Development System in Washington State
ABSTRACT
This study estimates the net impacts and private and social benefits and costs of 12 workforce development programs administered in Washington State. Seven of the programs serve job-ready adults: Workforce Investment Act (WIA) Adult programs, WIA Dislocated Worker programs, Community and Technical College Workforce Education, Community and Technical College Worker Retraining, Private Career Schools, Apprenticeships, and Aerospace Training. Three of the programs serve adults with employment barriers: Community and Technical College Basic Education for Adults (BEdA), Community and Technical College Integrated Basic Education Skills Training (I-BEST), and Division of Vocational Rehabilitation programs. The other two programs serve youth: WIA Youth programs and Secondary Career and Technical Education.1
The net impact analyses were conducted using either a nonexperimental, statistical matching methodology or econometric estimation. In particular, propensity score matching was undertaken for ten of the 12 programs. Individuals who had encountered the workforce development programs were statistically matched to individuals who had not. Administrative data with information from the universe of program participants and Wagner Peyser program registrants (who served as the comparison group pool) supported the analyses. These data included several years of pre-program and post-exit outcome information including demographics, employment and earnings information from the Unemployment Insurance wage record system, and benefits from the Unemployment Insurance system. For Vocational Rehabilitation and Secondary Career and Technical Education, it was not feasible to conduct propensity score matching. So for these programs, we relied on regression modeling.
The net impacts of these programs were estimated for two time frames. These were short-term (defined as three full quarters after exit) net impacts2 and longer-term (nine to 12 full quarters after exit) net impacts for individuals who exited in the fiscal year 2010/2011.3 Short-term employment impacts are positive for 11 of the 12 programs and negative for the other one; whereas the short-term quarterly earnings impacts are positive for 10 of the 12 programs. The longer-term impacts are similar. Employment impacts are positive for 10 of the 12 programs and negative for the other 2 programs. However, the negative employment net impacts are not statistically significant. The longer-term net impacts for quarterly earnings are positive and statistically significant for 10 of the 12 programs; positive and not statistically significant for one program; and negative and not statistically significant for the other program. The benefit-cost analyses show that all of the programs have discounted future benefits that far exceed the costs for participants in both the first 10 quarters following program exit and over the average working lifetime.4 However, for the public, only four of 11 programs have benefits that exceed costs in the first 10 quarters,5 whereas the public ultimately receives a positive return for 9 of the 11 over the average participant’s working lifetime.
1 The Workforce Investment Act was superceded by the Workforce Innovation and Opportunity Act of
2015. Because the years of analyses pre-dated the new legislation, this report will use the WIA acronym. 2Our estimate of the short-term impacts averaged the (three quarters after exit) estimated net impacts for the
individuals who exited in fiscal years 2010/2011 and 2012/2013. For Secondary Career and Technical Education, we used 2011/2012 instead of 2012/2013.
3 For Aerospace Training, we used 2011 Q3 to 2012 Q2 for the longer-term net impact estimation. 4 There is one exception. For Community and Technical College Worker Retraining, the average
participant’s discounted future benefits during the first 10 quarters after exit are slightly less than costs. 5 As explained in the text, we do not have cost data for private career schools.

W.E. Upjohn Institute for Employment Research iii
Net Impact and Benefit-Cost Estimates of the Workforce Development System in Washington State
TABLE OF CONTENTS
ABSTRACT ................................................................................................................................... ii
TABLE OF CONTENTS ..............................................................................................................iii
LIST OF TABLES ....................................................................................................................... vii
LIST OF FIGURES ..................................................................................................................... xii
1 OVERVIEW OF THE STUDY ................................................................................................. 1
Why are Net Impact and Cost-Benefit Analyses Useful? .......................................................... 2
Programs, Outcomes, and Time Periods .................................................................................... 3
Summary of Results ................................................................................................................... 6
2 GENERAL METHODOLOGY FOR NET IMPACT ESTIMATION .................................... 11
Net Impacts Problem Statement .............................................................................................. 11
Estimation of Net Impacts ....................................................................................................... 14
Estimation Procedures Used in This Study .............................................................................. 18
Choice of Outcome and Base Periods ...................................................................................... 19
Subgroups ................................................................................................................................ 21
3 WORKFORCE INVESTMENT ACT (WIA) ADULT PROGRAM ...................................... 23
Participant Characteristics ....................................................................................................... 23
Participation Model .................................................................................................................. 26
Propensity Score Statistics ....................................................................................................... 28
Statistical Match ...................................................................................................................... 29
Balance ..................................................................................................................................... 30
Net Impacts .............................................................................................................................. 31
Subgroup Analyses .................................................................................................................. 38
4 WIA DISLOCATED WORKER PROGRAM ........................................................................ 41
Participant Characteristics ....................................................................................................... 41
Participation Model .................................................................................................................. 43
Propensity Score Statistics ....................................................................................................... 45
Statistical Match ...................................................................................................................... 46
Balance ..................................................................................................................................... 46
Net Impacts .............................................................................................................................. 47
Subgroup Analyses .................................................................................................................. 53

W.E. Upjohn Institute for Employment Research iv
Net Impact and Benefit-Cost Estimates of the Workforce Development System in Washington State
Table of Contents (Continued)
5 WIA YOUTH PROGRAM ...................................................................................................... 57
Participant Characteristics ....................................................................................................... 57
Participation Model .................................................................................................................. 58
Propensity Score Statistics ....................................................................................................... 60
Statistical Match ...................................................................................................................... 61
Balance ..................................................................................................................................... 61
Net Impacts .............................................................................................................................. 64
Subgroup Analyses .................................................................................................................. 66
6 COMMUNITY AND TECHNICAL COLLEGE WORKFORCE EDUCATION ................. 71
Participant Characteristics ....................................................................................................... 71
Participation Model .................................................................................................................. 73
Propensity Score Statistics ....................................................................................................... 74
Statistical Match ...................................................................................................................... 75
Balance ..................................................................................................................................... 75
Net Impacts .............................................................................................................................. 77
Subgroup Analyses .................................................................................................................. 82
7 COMMUNITY AND TECHNICAL COLLEGE WORKER RETRAINING PROGRAM ... 85
Participant Characteristics ....................................................................................................... 85
Participation Model .................................................................................................................. 87
Propensity Score Statistics ....................................................................................................... 88
Statistical Match ...................................................................................................................... 89
Balance ..................................................................................................................................... 89
Net Impacts .............................................................................................................................. 89
Subgroup Analyses .................................................................................................................. 94
8 BASIC EDUCATION FOR ADULTS ON COMMUNITY AND TECHNICAL COLLEGE CAMPUSES .............................................................................. 99
Participant Characteristics ....................................................................................................... 99
Participation Model ................................................................................................................ 101
Propensity Score Statistics ..................................................................................................... 102
Statistical Match .................................................................................................................... 103
Balance ................................................................................................................................... 103
Net Impacts ............................................................................................................................ 106

W.E. Upjohn Institute for Employment Research v
Net Impact and Benefit-Cost Estimates of the Workforce Development System in Washington State
Table of Contents (Continued)
9 COMMUNITY AND TECHNICAL COLLEGES INTEGRATED BASIC EDUCATION AND SKILLS TRAINING (I-BEST) PROGRAM ............................................................ 111
Participant Characteristics ..................................................................................................... 111
Participation Model ................................................................................................................ 113
Propensity Score Statistics ..................................................................................................... 114
Statistical Match .................................................................................................................... 115
Balance ................................................................................................................................... 115
Net Impacts ............................................................................................................................ 116
10 PRIVATE CAREER SCHOOL PROGRAMS .................................................................... 123
Participant Characteristics ..................................................................................................... 123
Participation Model ................................................................................................................ 125
Propensity Score Statistics ..................................................................................................... 126
Statistical Match .................................................................................................................... 126
Balance ................................................................................................................................... 128
Net Impacts ............................................................................................................................ 128
Subgroup Analysis ................................................................................................................. 132
11 REGISTERED APPRENTICESHIP PROGRAMS ............................................................ 137
Participant Characteristics ..................................................................................................... 137
Participation Model ................................................................................................................ 139
Propensity Score Statistics ..................................................................................................... 140
Statistical Match .................................................................................................................... 140
Balance ................................................................................................................................... 141
Net Impacts ............................................................................................................................ 143
Subgroup Analyses ................................................................................................................ 145
12 AEROSPACE TRAINING .................................................................................................. 149
Participant Characteristics ..................................................................................................... 150
Participation Model ................................................................................................................ 151
Propensity Score Statistics ..................................................................................................... 152
Statistical Match .................................................................................................................... 153
Balance ................................................................................................................................... 153
Net Impacts ............................................................................................................................ 156

W.E. Upjohn Institute for Employment Research vi
Net Impact and Benefit-Cost Estimates of the Workforce Development System in Washington State
Table of Contents (Continued)
13 HIGH SCHOOL CAREER AND TECHNICAL EDUCATION (CTE) PROGRAMS ...... 161
Participant Characteristics ..................................................................................................... 161
Net Impacts ............................................................................................................................ 163
14 DIVISION OF VOCATIONAL REHABILITATION PROGRAMS ................................. 167
Participant Characteristics ..................................................................................................... 167
Net Impacts ............................................................................................................................ 170
15 BENEFIT-COST ANALYSES ............................................................................................ 175
Lifetime Earnings .................................................................................................................. 176
Fringe Benefits ....................................................................................................................... 178
Employee Tax Liabilities ....................................................................................................... 179
Unemployment Compensation .............................................................................................. 182
Costs ....................................................................................................................................... 184
Results .................................................................................................................................... 190
APPENDIX A DATA EDITING.............................................................................................. 195
Missing or “Out of Bounds” Quarterly Hours Data in Earnings Records ............................. 195
APPENDIX B EXPLANATORY NOTES FOR NET IMPACT ESTIMATE TABLES AND PRICE DEFLATORS ............................................................................................... 197
Outcomes ............................................................................................................................... 197
Regression Estimation ........................................................................................................... 197
Comparison Group Means ..................................................................................................... 199
Price Indices ........................................................................................................................... 199

W.E. Upjohn Institute for Employment Research vii
Net Impact and Benefit-Cost Estimates of the Workforce Development System in Washington State
LIST OF TABLES
1.1 Short-Term Net Impacts of Washington’s Workforce Development System, by Program ............................................................................................... 6 1.2 Longer-Term Net Impacts of Washington’s Workforce Development System, by Program ............................................................................................... 8 1.3 Discounted Benefits and Costs of Washington’s Workforce Development System, by Program ............................................................................................... 10 2.1 Preferred Estimation Technique ...................................................................................... 19 3.1 Descriptive Statistics for WIA Adult Treatment Group and Comparison Group Pool ............................................................................................................. 24 3.2 Coefficient Estimates from a Logit Model of Participation in WIA Adult Program ........................................................................................................ 27 3.3 Indicators of Propensity Score Model Quality for WIA Adult Analyses ....................... 29 3.4 Matching Algorithm Statistics and Post-Match Comparison of Characteristics for WIA Adult Analyses ......................................................................................... 30 3.5 Net Impact Estimates for WIA Adult Program for 2010/2011 Cohort ........................... 34 3.6 Net Impact Estimates for WIA Adult Program for 2012/2013 Cohort ........................... 35 3.7 Short-Term Net Impact Estimates for WIA Adult Program ........................................... 36 3.8 Selected Longer-Term Net Impact Estimates for Subgroups of WIA Adult Participants: 2010/2011 Cohort ............................................................................. 39 3.9 Selected Short-Term Net Impact Estimates for Subgroups of WIA Adult Participants: 2010/2011 and 2012/2013 Cohorts Averaged .................................. 39 4.1 Descriptive Statistics for WIA Dislocated Worker Treatment Group and Comparison Group Universe ...................................................................................................... 42 4.2 Coefficient Estimates from a Logit Model of Participation in WIA Dislocated Worker Program .................................................................................................... 44 4.3 Indicators of Propensity Score Model Quality for WIA Dislocated Worker Analyses ... 45 4.4 Matching Algorithm Statistics and Post-Match Comparison of Characteristics for WIA Dislocated Worker Analyses ................................................................... 47 4.5 Net Impact Estimates for WIA Dislocated Worker Program for 2010/2011 Cohort .................................................................................................. 49 4.6 Net Impact Estimates for WIA Dislocated Worker Program for 2012/2013 Cohort .................................................................................................. 50 4.7 Short-Term Net Impact Estimates for WIA Dislocated Worker Program ....................... 51 4.8 Selected Longer-Term Net Impact Estimates for Subgroups of WIA Dislocated Worker Participants: 2010/2011 Cohort ................................................................ 54 4.9 Selected Short-Term Net Impact Estimates for Subgroups of WIA Dislocated Worker Participants: 2012/2013 Cohort ................................................................ 54

W.E. Upjohn Institute for Employment Research viii
Net Impact and Benefit-Cost Estimates of the Workforce Development System in Washington State
List of Tables (Continued)
5.1 Descriptive Statistics for WIA Youth Treatment Group and Comparison Group Universe .............................................................................................................. 58 5.2 Coefficient Estimates from a Logit Model of Participation in WIA Youth Program ...... 59 5.3 Indicators of Propensity Score Model Quality for WIA Youth Analyses ....................... 60 5.4 Matching Algorithm Statistics and Post-Match Comparison of Characteristics for WIA Youth Analyses ........................................................................................ 62 5.5 Net Impact Estimates for WIA Youth Program for 2010/2011 Cohort ........................... 64 5.6 Net Impact Estimates for WIA Youth Program for 2012/2013 Cohort ........................... 65 5.7 Short-Term Net Impact Estimates for WIA Youth Program .......................................... 66 5.8 Selected Longer-Term Net Impact Estimates for Subgroups of WIA Youth Participants: 2010/2011 Cohort ............................................................................. 69 5.9 Selected Short-Term Net Impact Estimates for Subgroups of WIA Youth Participants: 2012/2013 Cohort ............................................................................. 69 6.1 Descriptive Statistics for CTC Workforce Education Treatment Group and Comparison Group Universe ................................................................................. 72 6.2 Coefficient Estimates from a Logit Model of Participation in CTC Workforce Education .............................................................................................................. 73 6.3 Indicators of Propensity Score Model Quality for CTC Workforce Education
Analyses .............................................................................................................. 75 6.4 Matching Algorithm Statistics and Post-Match Comparison of Characteristics for CTC Workforce Education Analyses ................................................................ 76 6.5 Net Impact Estimates for CTC Workforce Education Programs for 2010/2011 Cohort .................................................................................................. 78 6.6 Net Impact Estimates for CTC Workforce Education Programs for 2012/2013 Cohort .................................................................................................. 79 6.7 Short-Term Net Impact Estimates for CTC Workforce Education ................................ 80 6.8 Selected Longer-Term Net Impact Estimates for CTC Workplace Education Completers and Noncompleters: 2010/2011 Cohort .............................................. 83 6.9 Selected Short-Term Net Impact Estimates for CTC Workplace Education Completers and Noncompleters: 2012/2013 Cohort ............................................. 83 7.1 Descriptive Statistics for CTC Worker Retraining Treatment Group and Comparison Group Universe ................................................................................. 86 7.2 Coefficient Estimates from a Logit Model of Participation in CTC Worker Retraining .............................................................................................................. 87 7.3 Indicators of Propensity Score Model Quality for CTC Worker Retraining Analyses .............................................................................................................. 89 7.4 Matching Algorithm Statistics and Post-Match Comparison of Characteristics for CTC Worker Retraining Analyses .................................................................... 90 7.5 Net Impact Estimates for CTC Worker Retraining Program for 2010/2011 Cohort ....... 92 7.6 Net Impact Estimates for CTC Worker Retraining Program for 2012/2013 Cohort ....... 93 7.7 Short-Term Net Impact Estimates for CTC Worker Retraining Program ...................... 94

W.E. Upjohn Institute for Employment Research ix
Net Impact and Benefit-Cost Estimates of the Workforce Development System in Washington State
List of Tables (Continued)
7.8 Selected Longer-Term Net Impact Estimates for CTC Worker Retraining Completers and Noncompleters: 2010/2011 Cohort ............................................. 97 7.9 Selected Short-Term Net Impact Estimates for CTC Worker Retraining Completers and Noncompleters: 2012/2013 Cohort ............................................. 97 8.1 Descriptive Statistics for CTC Basic Education for Adults Treatment Group and Comparison Group Universe ..........................................................................100 8.2 Coefficient Estimates from a Logit Model of Participation in CTC Basic Education for Adults ..............................................................................................................102 8.3 Indicators of Propensity Score Model Quality for CTC Basic Education for Adults Analyses ..............................................................................................................103 8.4 Matching Algorithm Statistics and Post-Match Comparison of Characteristics for CTC Basic Education for Adults Analyses .......................................................104 8.5 Net Impact Estimates for CTC Basic Education for Adults for 2010/2011 Cohort ...................................................................................................106 8.6 Net Impact Estimates for CTC Basic Education for Adults for 2012/2013 Cohort ...................................................................................................107 8.7 Short-Term Net Impact Estimates for CTC Basic Education for Adults ........................108 9.1 Descriptive Statistics for CTC I-BEST Treatment Group and Comparison Group Universe ..............................................................................................................112 9.2 Coefficient Estimates from a Logit Model of Participation in CTC I-BEST Program ..............................................................................................................114 9.3 Indicators of Propensity Score Model Quality for CTC I-BEST Analyses ....................115 9.4 Matching Algorithm Statistics and Post-Match Comparison of Characteristics for CTC I-BEST Analyses ......................................................................................116 9.5 Net Impact Estimates for CTC I-BEST Program for 2010/2011 Cohort .........................118 9.6 Net Impact Estimates for CTC I-BEST Program for 2012/2013 Cohort .........................119 9.7 Short-Term Net Impact Estimates for CTC I-BEST .......................................................120 10.1 Descriptive Statistics for Private Career School Treatment Group and Comparison Group Universe .................................................................................124 10.2 Coefficient Estimates from a Logit Model of being a Private Career School Student ....125 10.3 Indicators of Propensity Score Model Quality for Private Career Schools .....................126 10.4 Matching Algorithm Statistics and Post-Match Comparison of Characteristics for Private Career Schools Analyses ......................................................................127 10.5 Net Impact Estimates for Private Career School Programs for 2010/2011 Cohort .........130 10.6 Net Impact Estimates for Private Career School Programs for 2012/2013 Cohort .........131 10.7 Short-Term Net Impact Estimates for Private Career School Programs ........................131 10.8 Selected Longer-Term Net Impact Estimates for Subgroups of Private Career School Participants: 2010/2011 Cohort .................................................................135 10.9 Selected Short-Term Net Impact Estimates for Subgroups of Private Career School Participants: 2012/2013 Cohort ..................................................................135

W.E. Upjohn Institute for Employment Research x
Net Impact and Benefit-Cost Estimates of the Workforce Development System in Washington State
List of Tables (Continued)
11.1 Descriptive Statistics for Registered Apprenticeship Treatment Group and Comparison Group Universe .................................................................................138 11.2 Coefficient Estimates from a Logit Model of Participation in Registered Apprenticeships .....................................................................................................139 11.3 Indicators of Propensity Score Model Quality for Registered Apprenticeships ..............140 11.4 Matching Algorithm Statistics and Post-Match Comparison of Characteristics for Registered Apprenticeships Analyses ...............................................................141 11.5 Net Impact Estimates for Registered Apprenticeship Programs for 2010/2011 Cohort ............................................................................................143 11.6 Net Impact Estimates for Registered Apprenticeship Programs for 2012/2013 Cohort .............................................................................................144 11.7 Short-Term Net Impact Estimates for Registered Apprenticeships .................................145 11.8 Selected Longer-Term Net Impact Estimates for Subgroups of Registered Apprenticeships: 2010/2011 Cohort ......................................................................148 11.9 Selected Short-Term Net Impact Estimates for Subgroups of Registered Apprenticeships: 2012/2013 Cohort ......................................................................148 12.1 Descriptive Statistics for Aerospace Training Treatment and Comparison Group Universe ..............................................................................................................150
12.2 Coefficient Estimates from a Logit Model of Participation in Aerospace Training ........152 12.3 Indicators of Propensity Score Model Quality for Aerospace Training Analyses ...........153 12.4 Matching Algorithm Statistics and Post-Match Comparison of Characteristics for Aerospace Training Analyses ...........................................................................154 12.5 Net Impact Estimates for Aerospace Training for 2011/2012 Cohort ............................156 12.6 Net Impact Estimates for Aerospace Training for 2012/2013 Cohort ............................157 12.7 Short-Term Net Impact Estimates for Aerospace Training ............................................158 13.1 Descriptive Statistics for High School CTE Treatment and Comparison Groups ..........162 13.2 Net Impact Estimates for High School CTE Graduates for 2010/2011 Cohort ..............164 13.3 Net Impact Estimates for High School CTE Graduates for 2011/2012 Cohort ..............165 13.4 Short-Term Net Impact Estimates for High School CTE Graduates ..............................166 14.1 Descriptive Statistics for DVR Treatment and Comparison Groups ..............................168 14.2 Net Impact Estimates for DVR Programs for 2010/2011 Cohort ...................................171 14.3 Net Impact Estimates for DVR Programs for 2012/2013 Cohort ...................................172 14.4 Short-Term Net Impact Estimates for DVR Programs ...................................................173 15.1 Data Used in Earnings Interpolations and Extrapolations ..............................................179 15.2 Marginal Sales/Excise Tax Rate Calculations ................................................................181 15.3 Marginal Federal Income Tax Rate Calculations ...........................................................182 15.4 Interpolation/Extrapolation of Unconditional Quarterly UI Benefits, by Program ........183 15.5 Average Quarterly Earnings and Average Training Duration, by Program ...................185 15.6 Estimated Forgone Earnings, by Program ......................................................................185 15.7 WIA Costs per Participant, by Program .........................................................................187

W.E. Upjohn Institute for Employment Research xi
Net Impact and Benefit-Cost Estimates of the Workforce Development System in Washington State
List of Tables (Continued)
15.8 Estimated Participant and Public Benefits and Costs per Participant in WIA Adult Programs ......................................................................................................191 15.9 Estimated Participant and Public Benefits and Costs per Participant in WIA Dislocated Workers Programs ...............................................................................191 15.10 Estimated Participant and Public Benefits and Costs per Participant in WIA Youth Programs .....................................................................................................191 15.11 Estimated Participant and Public Benefits and Costs per Participant in Community and Technical College Workforce Education Programs ........................................192 15.12 Estimated Participant and Public Benefits and Costs per Participant in Community and Technical College Worker Retraining Programs ............................................192 15.13 Estimated Participant and Public Benefits and Costs per Participant in Community and Technical College BEdA Programs ................................................................192 15.14 Estimated Participant and Public Benefits and Costs per Participant in Community and Technical College I-BEST Programs ..............................................................193 15.15 Estimated Participant and Public Benefits and Costs per Participant in Private Career School Programs ............................................................................193 15.16 Estimated Participant and Public Benefits and Costs per Participant in Apprenticeship Programs .......................................................................................193 15.17 Estimated Participant and Public Benefits and Costs per Participant in Aerospace Training ................................................................................................194 15.18 Estimated Participant and Public Benefits and Costs per Completer in Secondary CTE Programs ......................................................................................194 15.19 Estimated Participant and Public Benefits and Costs per Participant in DVR Programs .......................................................................................................194 A.1 Percentage of Records with Imputed Hours ....................................................................195 A.2 Percentage of Records with Re-coded Start Date ...........................................................196 B.1 Independent Variables Used in Regression Estimates of Outcomes, by Program .............................................................................................................198 B.2 Price Indices ..............................................................................................................199

W.E. Upjohn Institute for Employment Research xii
Net Impact and Benefit-Cost Estimates of the Workforce Development System in Washington State
LIST OF FIGURES
2.1 Timeline and Earnings Profile for a Hypothetical WIA Adult Client ............................. 20 3.1 Standardized Difference in Means, Pre- and Post-match, WIA Adults .......................... 32 3.2 Estimated Net Impacts on Earnings (top) and Employment (bottom) of WIA Adult Program, by Quarter after Exit, 2010/2011 Cohort ..................................... 37 3.3 Estimated Net Impacts on Earnings (top) and Employment (bottom) of WIA Adult Program, by Quarter after Exit, 2012/2013 Cohort ..................................... 38 4.1 Standardized Difference in Means, Pre- and Post-match, WIA Dislocated Workers .... 48 4.2 Estimated Net Impacts on Earnings (top) and Employment (bottom) of WIA Dislocated Worker Program, by Quarter after Exit, 2010/2011 Cohort ................ 52 4.3 Estimated Net Impacts on Earnings (top) and Employment (bottom) of WIA Dislocated Worker Program, by Quarter after Exit, 2012/2013 Cohort ................ 53 5.1 Standardized Difference in Means, Pre- and Post-match, WIA Youth .......................... 63 5.2 Estimated Net Impacts on Earnings (top) and Employment (bottom) of WIA Youth Program, by Quarter after Exit, 2010/2011 Cohort .................................... 67 5.3 Estimated Net Impacts on Earnings (top) and Employment (bottom) of WIA Youth Program, by Quarter after Exit, 2012/2013 Cohort .................................... 68 6.1 Standardized Difference in Means, Pre- and Post-match, CTC Workforce Education ... 77 6.2 Estimated Net Impacts on Earnings (top) and Employment (bottom) of CTC Workforce Education Programs, by Quarter after Exit, 2010/2011 Cohort ........... 81 6.3 Estimated Net Impacts on Earnings (top) and Employment (bottom) of CTC Workforce Education Programs, by Quarter after Exit, 2012/2013 Cohort .......... 82 7.1 Standardized Difference in Means, Pre- and Post-match, CTC Worker Retraining ....... 91 7.2 Estimated Net Impacts on Earnings (top) and Employment (bottom) of CTC Worker Retraining Programs, by Quarter after Exit, 2010/2011 Cohort ............... 95 7.3 Estimated Net Impacts on Earnings (top) and Employment (bottom) of CTC Worker Retraining Programs, by Quarter after Exit, 2012/2013 Cohort ............... 96 8.1 Standardized Difference in Means, Pre- and Post-match, CTC Basic Education for Adults ..............................................................................................................105 8.2 Estimated Net Impacts on Earnings (top) and Employment (bottom) of CTC Basic Education for Adults, by Quarter after Exit, 2010/2011 Cohort ..................109 8.3 Estimated Net Impacts on Earnings (top) and Employment (bottom) of CTC Basic Education for Adults, by Quarter after Exit, 2012/2013 Cohort ..................110 9.1 Standardized Difference in Means, Pre- and Post-match, CTC I-BEST ........................117 9.2 Estimated Net Impacts on Earnings (top) and Employment (bottom) of CTC I-BEST, by Quarter after Exit, 2010/2011 Cohort ........................................121

W.E. Upjohn Institute for Employment Research xiii
Net Impact and Benefit-Cost Estimates of the Workforce Development System in Washington State
List of Figures (Continued)
9.3 Estimated Net Impacts on Earnings (top) and Employment (bottom) of CTC I-BEST, by Quarter after Exit, 2012/2013 Cohort ........................................122 10.1 Standardized Difference in Means, Pre- and Post-match, Private Career Schools .........129 10.2 Estimated Net Impacts on Earnings (top) and Employment (bottom) of Private Career School Attendance, by Quarter after Exit, 2010/2011 Cohort .......133 10.3 Estimated Net Impacts on Earnings (top) and Employment (bottom) of Private Career School Attendance, by Quarter after Exit, 2012/2013 Cohort .......134 11.1 Standardized Difference in Means, Pre- and Post-match, Registered Apprenticeships ..142 11.2 Estimated Net Impacts on Earnings (top) and Employment (bottom) of Registered Apprenticeships, by Quarter after Exit, 2010/2011 Cohort .................146 11.3 Estimated Net Impacts on Earnings (top) and Employment (bottom) of Registered Apprenticeships, by Quarter after Exit, 2012/2013 Cohort .................147 12.1 Standardized Difference in Means, Pre- and Post-match, Aerospace Training ..............155 12.2 Estimated Net Impacts on Earnings (top) and Employment (bottom) of Aerospace Training, by Quarter after Exit, 2011/2012 Cohort .............................159 12.3 Estimated Net Impacts on Earnings (top) and Employment (bottom) of Aerospace Training, by Quarter after Exit, 2012/2013 Cohort .............................160 15.1 Hypothetical Earnings Profiles of Training Participants and Comparison Group Members ..............................................................................................................176

W.E. Upjohn Institute for Employment Research xiv
Net Impact and Benefit-Cost Estimates of the Workforce Development System in Washington State

W.E. Upjohn Institute for Employment Research 1
Net Impact and Benefit-Cost Estimates of the Workforce Development System in Washington State
1 OVERVIEW OF THE STUDY
By legislative mandate (RCW 28C.18.060), the Washington State Workforce Training
and Education Coordinating Board (WTECB) administers biennially outcome evaluations of the
state workforce training system based on surveys of program participants, surveys of employers
of program participants, and linkages with Employment Security Department payroll and wage
files. These evaluations report participant success in finding employment, levels of earnings, and
participant and employer satisfaction with program services and outcomes.
The WTECB’s duties also include administering a scientifically based net impact and
cost-benefit evaluation of the state training system. The net impact and cost-benefit evaluations
are most appropriately calculated by using data from nonparticipants as well as participants. The
data burden is thus greatly expanded as compared to what is required for the biennial outcome
evaluations, and so the legislation requires that that the WTECB conduct this evaluation every
five years. Net impact/return on investment studies were done in 1997, 2002, 2006, and 2012.6
This report provides the most recent net impact estimates of the Washington State employment
preparation and training system and its economic value to the State.
6The 1997 study is documented in Washington State Workforce Training and Education Coordinating
Board, Workforce Training Results: An Evaluation of Washington State’s Workforce Training System, 1997. Second Edition. Olympia, WA: 1997. Also Battelle, “Net Impact Evaluation: Appendix A, Technical Appendix,” no date. The 2002 study is documented in Washington State Workforce Training and Education Training Board, Workforce Training Results 2002: An Evaluation of Washington State’s Workforce Development System. Olympia, WA: 2003 and K. Hollenbeck and W. Huang, Net Impact and Benefit-Cost Estimates of the Workforce Development System in Washington State, Upjohn Institute Technical Report No. TR03-018, July 2003. The 2006 study is documented in K. Hollenbeck and W. Huang, Net Impact and Benefit-Cost Estimates of the Workforce Development System in Washington State, Upjohn Institute Technical Report No. TR06-020, September 2006. The 2012 study is documented in K. Hollenbeck and W. Huang, Net Impact and Benefit-Cost Estimates of the Workforce Development System in Washington State, Upjohn Institute Technical Report No. TR13-029, Revised December 2014.

W.E. Upjohn Institute for Employment Research 2
Net Impact and Benefit-Cost Estimates of the Workforce Development System in Washington State
Why are Net Impact and Cost-Benefit Analyses Useful?
Washington’s systematic calculation of net impacts of its workforce development
programs and their costs and benefits is rare, and indeed may be unique, among states.7
Presumably, the Washington legislature recognizes that investment in workforce development
requires public resources and needs to be accountable to the public for achieving results. But the
state also seems to recognize that it is important to dissect carefully the results that are achieved
in order to assure the public that its return on training investments is positive and that
improvements that are warranted can be implemented.
Individuals who participate in training or educational programs may experience
successful outcomes such as employment or increased earnings. However, it is not always clear
that positive outcomes for individuals are the direct result of their participation in the programs.
There could have been some other intervening factor(s) such as an improving economy that
cause positive results. The main issue for this study is to determine whether participants’
successes can be attributed to participation in the program, or might other factors coincidental to
the program have played a role?
A net impact analysis addresses the attribution question. It attempts to answer the
question of how outcomes compare to what would have happened to participants if there were no
program, and individuals were left to their next best alternatives. To find the answer, we
construct a comparison group of individuals who are very similar to the participants and would,
otherwise have qualified for the program, but who chose not to receive training or enroll in
education.8 We observe both the participants and comparison group members over time. We then
7 The WIOA legislation has mandated assessments and evaluations similar to what Washington has been
doing for all states. See Section 116 (e) “Evaluation of State Programs.” 8Experimental evaluation uses a randomly assigned control group.

W.E. Upjohn Institute for Employment Research 3
Net Impact and Benefit-Cost Estimates of the Workforce Development System in Washington State
attribute to the program any differences in outcomes that we observe for program participants to
those of comparison group members.
The net impacts of workforce development programs are likely to be positive for
participants. (The programs are delivering valuable skills to individuals who will use those skills
in the labor market.) However, accountability goes beyond positive net impacts. Of interest to
the public is whether the net impacts (outcomes for program participants minus outcomes for
similar individuals comprising a comparison group) aggregated over all participants will have
exceeded the costs of the program. Thus to get a full picture of the return on investment, it is
necessary to compare the programs’ benefits to their costs.
Programs, Outcomes, and Time Periods
The report describes analyses (net impact and benefit-cost) of 12 programs. Seven of the
programs serve job-ready adults: Workforce Investment Act (WIA) Adult programs, Dislocated
Worker programs, Community and Technical College Workforce Education, Community and
Technical College Worker Retraining, Private Career Schools, Apprenticeships, and Aerospace
Training. Three programs serve adults with employment barriers: Community and Technical
College Basic Education for Adults (BEdA), Community and Technical College Integrated Basic
Education and Skills Training (I-BEST), and Division of Vocational Rehabilitation (DVR)
programs. The other two programs serve youth: WIA Youth programs and Secondary Career and
Technical Education.
For the participants in each of these programs, we estimate the net impacts of
participation on the following outcomes:
employment rates hourly wages hours worked per quarter

W.E. Upjohn Institute for Employment Research 4
Net Impact and Benefit-Cost Estimates of the Workforce Development System in Washington State
quarterly earnings receipt and quarterly amount of UI benefits
The first four outcomes are derived from the quarterly wage record data supplied by employers
to the Unemployment Insurance (UI) system when they file their quarterly UI tax payments.9
The state supplied these administrative data for this study. A processing step that the state
undertook was to add together the information from multiple employers for those individuals
who had more than a single employer in a quarter. Furthermore, the state personnel had gathered
quarterly wage record data from surrounding states (Idaho and Oregon), and from the federal
payroll. The data from the other jurisdictions contributed to quarterly earnings, but did not have
hours information as is available in Washington wage record data. Throughout this study, we
define employment as having at least $100 (2014$) in earnings in a calendar quarter. Hourly
wages are defined as total quarterly wages divided by hours worked in the quarter.
Unemployment Insurance benefits data were gathered from the Washington’s Employment
Security Department. UI receipt in a quarter is defined as having non-zero benefits in the
calendar quarter.
The next chapter of this report details the methodologies that were used to calculate net
impacts. For the nine programs in which we used propensity score matching, the general idea is
that we constructed data bases containing longitudinal data over a lengthy period about
individuals who had participated in the programs of interest or who had registered for Wagner
Peyser (WP) services. The latter data were used to construct the comparison groups.10 We then
9 Appendix A provides details about data editing that was performed on the wage record data. In addition to
the editing that is described there, we “trimmed” earnings and hours data. Specifically, we deleted from analyses observations in the top and bottom 1% of the quarterly non-zero earnings and hours distributions of the treatment and matched comparison groups in the analyses periods: i.e., quarters 3 to 6 before registration, quarter 3 after exit, and quarters 9–12 after exit.
10 For two of the programs, we actually used administrative data on program applicants to construct the comparison groups. The programs were Secondary Career and Technical Education and Division of Vocational

W.E. Upjohn Institute for Employment Research 5
Net Impact and Benefit-Cost Estimates of the Workforce Development System in Washington State
statistically matched individuals who had participated in the programs to individuals in the
comparison group, and compared outcomes. Differences in outcomes were attributed to the
programs.
Two time periods were used for defining the populations of study. The first period was
the fiscal year running from July 2010 to June 2011 (hereafter referred to in this report as
2010/2011), and the second period was July 2012 to June 2013 (2012/2013). More specifically,
an individual was considered to be a member of a “treatment” group if he or she exited from an
education or training program during either of the two time periods. An individual was
considered to be a member of the “comparison” group pool if they registered for Wagner Peyser
services at a Work Source office during either of those years.11
Note that because administrative data were used, sometimes the concept of exiting from a
program was ambiguous and arbitrary, especially for individuals who exited without completing
the program or training. Some education or training programs result in a certificate or credential
for individuals who successfully complete all of the requirements. In these cases, an individual’s
exit date was set at the date when they received the credential. However, individuals who stop
attending a program are unlikely to report their action to program administrators, and so there
may be a lag in the data that reflects how long it takes for the program’s administrative
Rehabilitation programs. In these cases, there were administrative data on students (in the case of Career and Technical Education) and customers (in the case of DVR) who did not participate/receive services.
11 In program evaluation, populations of participants are often defined by entry date or as a cross-section of current enrollees. It is well-known that current enrollees are not representative of the population of all individuals who participate in a program because individuals with longer durations are more likely to be a current participant. The alternative of selecting all individuals who entered a program at a particular period of time captures the population of all individuals who participate in the program. The problem with using entry cohorts is that if programs last a long period of time (e.g., Community and Technical College Workforce Education programs or Registered Apprenticeships), it will take several years to get outcome data. The approach used in this study of defining the population by exit date is also representative of all individuals participating in the program, but allows a substantial number of quarters for outcome data. The “downside” to this approach is that the “treatment” received may differ for individuals in the same program simply because they started at different times and had different durations of participation.

W.E. Upjohn Institute for Employment Research 6
Net Impact and Benefit-Cost Estimates of the Workforce Development System in Washington State
information system to record the exit. Some programs use the rule that no contact over a 12-
month period means that the individual exited the program; some programs use a six-month or a
90-day rule. All in all, we note that the exit date may be subject to measurement error, which
therefore implies that length of time receiving treatment and initial outcome periods after
treatment are somewhat subject to error.
Summary of Results12
Table 1.1 provides a summary of short-term net impacts of the 12 programs on
employment and earnings. The elements reported in the table show the increase (or decrease) in
employment, defined as having at least $100 (2014 $) in earnings in the third quarter after
exiting from the program, and the increase (or decrease) in quarterly earnings, on average, for
that quarter.13 Note that these results include all participants—those individuals who completed
12 As described in the next chapter, we attempted to replicate as closely as possible the methodology used
in our prior studies for the WTECB. The estimated net impacts for some programs that are reported here are similar in magnitude to those reported in the earlier study. For other programs, the impacts are substantially different. This suggests that the business cycle may have a significant influence on the magnitudes of the net impacts. The inference is that one should be careful in extrapolating the results.
13 The earnings impacts are not conditional on individuals having earnings, i.e., the means include observations with values of zero.
Table 1.1 Short-Terma Net Impacts of Washington’s Workforce Development System, by Program
Program Net Employment Impact
(In percentage points) Net Quarterly Earnings Impacts
(2014 $) WIA Adults 11.9 1,625 WIA Dislocated Workers 11.5 1,667 WIAYouth 1.5^ −395 Comm. and Tech. College Workforce Education 6.5 1,285 Comm. and Tech. College Worker Retraining 8.1 850 Comm. and Tech. College BEdA −2.2 −291 Comm. and Tech. College I-BEST 4.7 586 Private Career Schools 4.5 446 Registered Apprenticeships 7.5 3,715 Aerospace Training 15.0 2,881 Secondary Career Technical Ed. 2.4 104 Vocational Rehabilitation (WIA Title IV) 21.0 120 NOTE: Specific estimation techniques are described in later chapters. aDefined as three quarters after exit. ^Table entry not statistically significant.

W.E. Upjohn Institute for Employment Research 7
Net Impact and Benefit-Cost Estimates of the Workforce Development System in Washington State
their education or training and those who left without completing. Separate net impact estimates
for subgroups of participants, including completers only, are reported later in this document.
The employment impacts are in percentage point terms. Eleven of the 12 are positive and
all but one of them are statistically significant. One program has negative short-run employment
impacts—Community and Technical College BEdA programs. The employment rates of the
comparison groups for all of the programs are on the order of 60 to 70 percent, so the positive
impacts range from about seven to 20 percent.14 All but two of the short-term earnings impacts
are positive, and they vary considerably in terms of magnitude. All of the impacts are statistically
significant15 and range from a low of about $100 per quarter to over $3,700 per quarter. Note that
Registered Apprenticeships, Aerospace Training, WIA Adults and Dislocated Workers, and
Community and Technical College Workforce Education have quite large impacts. The only
programs with decreases in earnings are WIA Youth and Community and Technical College
BEdA courses.
Table 1.2 provides estimates of the longer-term payoffs to education and training. All but
two of the employment net impacts are positive, and the two that are negative are not statistically
significant. As far as earnings are concerned, 10 of the 12 programs have positive and
statistically significant net impacts; one has a positive but not significant net earnings impact;
and one has a negative, but not significant net impact. Because of depreciation of the impacts
and regression to the mean, one might expect the short-term employment net impacts to be larger
than the longer-term net impacts. However, this is not the case. All but three of the longer-term
14 The Vocational Rehabilitation estimated employment impact of 35.6 percentage points is an outlier
caused by the fact that employment helped to define the treatment group. 15 The statistical significance of an estimate reflects the probability that the “true value” in the population is
nonzero. In subsequent chapters, we will indicate significance at a particular p-value. That implies that the true value is nonzero with a probability of (1.0 – p). So p = 0.05, 0.01, and 0.001 indicate that the probability that the true value is nonzero are 95 percent, 99 percent, and 99.9 percent, respectively. In this chapter, we are using p = 0.05.

W.E. Upjohn Institute for Employment Research 8
Net Impact and Benefit-Cost Estimates of the Workforce Development System in Washington State
earnings net impacts are larger (or less negative) than the short-term earnings net impacts. Note
that in percentage terms, the earnings net impacts for the 12 programs are on the order of 20
percent.
Table 1.2 Longer-Terma Net Impacts of Washington’s Workforce Development System, by Program
Program Net Employment Impact
(In percentage points) Net Quarterly Earnings Impacts
(2014 $) WIA Adults 4.1 1,319 WIA Dislocated Workers 7.4 1,455 WIA Youth 6.7 250^ Comm. and Tech. College Pro./Tech. 1.1 1,372 Comm. and Tech. College Worker Retraining 8.0 1,132 Comm. and Tech. College BEdA 2.9 −85^ Comm. and Tech. College I-BEST 12.3 976 Private Career Schools −0.4^ 509 Registered Apprenticeships −0.8^ 3,447 Aerospace Training 15.4 4,132 Secondary Career Technical Ed. 2.7 214 Vocational Rehabilitation 2.4 228 NOTE: Specific estimation techniques are described in later chapters. aDefined as average over quarters 9-12 after exit. ^Table entry not statistically significant.
Table 1.3 summarizes the benefit-cost estimates for the 12 programs. Due to data
limitations, the benefit-cost estimates for private career schools are partial. The table presents the
estimates of benefits and costs for the average participant, and it shows the benefits and costs to
the public that are associated with the average participant. All of the benefits and costs are
adjusted for inflation. For participants, the benefits include net earnings changes (earnings plus
fringe benefits minus taxes) and UI benefits. These benefits are discounted at an annual rate of
3.0 percent. The benefits are usually positive, indicating that the additional earnings and UI
benefits accrue to the participant, but in theory they may be negative if earnings and/or UI
benefits were projected to decrease. For the public, benefits include tax receipts plus changes in
UI benefits. Again, these may be positive (taxes are received and UI benefits are reduced) or,
they may be negative. For participants, the costs are forgone compensation during the period of
program participation and tuition/fees, if any. For the public, costs represent the budgetary

W.E. Upjohn Institute for Employment Research 9
Net Impact and Benefit-Cost Estimates of the Workforce Development System in Washington State
expenditures necessary to provide the training/education services plus any forgone taxes because
participants are in programs and have less earnings; thus paying less taxes.16 The public costs are
positive in all programs, but participant costs are negative in over half the programs because
forgone compensation is negative in those programs (participants actually earn more during their
program participation than if they had not participated).
The first four columns of data in the table show the average participant’s benefits and
costs that accrue over the first 10 quarters after exiting from the program as well as the public’s
benefits (revenue) and costs that are derived from or borne for the average participant. From the
participant’s perspective, most of the programs have real (i.e., inflation-adjusted) benefits that
exceed costs over the 10-quarter time frame; however one programs does not. Community and
Technical College Worker Retraining participants have large forgone compensation that
outweighs the net earnings impacts in the short-term.
The last four columns of the table extrapolate the benefits to the average participant’s
working lifetime (assumed to end at age 65). In this calculation, the programs are, for the most
part, quite beneficial for participants; their benefits significantly exceed costs in all cases, except
for Community and Technical College BEdA. From the public’s perspective, nine of the
programs have benefits that exceed costs in the long-run for the average participant; only
Community and Technical College BEdA and Vocational Rehabilitation are estimated to have
costs exceed benefits for the public over the lifetime of the average participant. The benefit-cost
analyses are detailed in chapter 15.
This report is organized as follows. The next chapter provides much of the technical
detail underlying the net impact estimation including the statistical matching approaches and
16Note that they may be negative costs (i.e., savings) if the forgone earnings of participants are negative.

W.E. Upjohn Institute for Employment Research 10
Net Impact and Benefit-Cost Estimates of the Workforce Development System in Washington State
regression models used to adjust results. The following twelve chapters examine the results for
the 12 workforce development system programs. The final chapter documents the cost-benefit
analyses. Appendix A discusses data editing and Appendix B presents explanatory notes for the
regression estimation models and the price indices used to convert nominal dollar figures into
real terms.
Table 1.3 Discounted Benefits and Costs of Washington’s Workforce Development System, by Program
Program
First 2.5 years Lifetime Participant Public Participant Public
Benefit Cost Benefit Cost Benefit Cost Benefit Cost WIA Adults 19,567 −3,135 3,484 1,799 119,302 −3,135 22,432 1,799 WIA Dislocated Workers 16,139 6,798 7,537 4,368 78,478 6,798 22,132 4,368 WIA Youth 3,861 −288 545 2,973 29,167 −288 7,128 2,973 Comm. and Tech. College Workforce Educ. 15,374 2,192 3,960 8,412 139,781 2,192 31,568 8,412 Comm. and Tech. College Worker Retraining 8,278 8,621 3,597 5,919 79,609 8,621 24,973 5,919 Comm. and Tech. College BEdA − 24 − 293 875 5,072 − 477 − 293 1,015 5,072 Comm. and Tech. College I-BEST 8,535 − 77 3,515 5,101 99,421 − 77 26,899 5,101 Private Career Schoolsa 6,953 1,045 2,199 --na-- 61,704 1,045 14,359 --na-- Registered Apprenticeships 36,159 −51,039 12,746 −8,906 287,521 −51,039 117,117 −8,906 Aerospace Training 41,453 4,016 11,912 8,626 383,631 4,016 133,863 8,626 Secondary Career Technical Ed. 2,216 − 149 315 1,724 46,048 − 149 11,963 1,724 Vocational Rehabilitation 1,883 − 4,634 384 5,988 20,017 − 4,634 5,084 5,988 NOTE: Benefits for a participant include earnings and fringe benefits less taxes plus UI benefits discounted at 3.0 percent annually; for the public, benefits include undiscounted tax receipts minus UI benefit payments. Costs include direct program costs (public and participant, if tuition/fees) and forgone compensation (participant) and forgone taxes (public). Table entries in 2014 $. --na-- not available; no data were available on the tuition and fees at private career schools. aPrivate costs only include forgone earnings; tuition rates unavailable.

W.E. Upjohn Institute for Employment Research 11
Net Impact and Benefit-Cost Estimates of the Workforce Development System in Washington State
2 GENERAL METHODOLOGY FOR NET IMPACT ESTIMATION
Probably most evaluators would agree that the best way to estimate the net impacts of a
program is to conduct a random assignment experiment. If it were feasible to do so, an
experiment could sort individuals who apply and are eligible for services randomly into two
groups—those who are allowed to receive services and those who aren’t. As long as assignment
into treatment or control is random, then the evaluator can have a high level of statistical
confidence that the program was responsible for any differences in outcomes.17
The issue is moot in the present context, however, because the programs being evaluated
were essentially entitlements for which anyone in the state could participate. Experiments were
not feasible. Thus this study relied on a nonexperimental methodology for ten of the 12
programs. Individuals who encountered the workforce development programs were compared to
individuals who didn’t, and members of the latter group were not randomly chosen. In other
words, there were systematic (nonrandom) differences between the participants and the
individuals to whom they were compared. Thus the statistical estimators used to calculate the net
impacts require strong assumptions and/or multivariate conditionality to control for those
differences.
Net Impacts Problem Statement
The net impact evaluation problem may be stated as follows: Individual i, who has
characteristics Xit, at time t, will be observed to have outcome(s) Yit(1) if she receives a
“treatment,” such as participating in the workforce development system and will be observed to
17 Even with an experiment, there may be implementation problems or behavioral responses that threaten its
external validity. For example, problems such as crossover, differential attrition, or Hawthorne effects may arise.

W.E. Upjohn Institute for Employment Research 12
Net Impact and Benefit-Cost Estimates of the Workforce Development System in Washington State
have outcome(s) Yit(0) if she doesn’t participate. The net impact of the treatment for individual i
is Yit(1) − Yit(0). But of course, this difference is never observed because an individual cannot
simultaneously receive and not receive the treatment.
The time subscript is dropped in the following discussion to simplify the notation without
loss of generality. Let T represent a data set with observations about individuals who receive the
treatment for whom we have data, and let nT represent the number of individuals with data in T.
Let U represent a data set with observations about individuals who may be similar to individuals
who received the treatment but who did not receive the treatment for whom we have data, and
let nU be its sample size. Techniques described below identify a subset of U that contains
observations that “match” those in T. This subset is C, and let nC be its sample size. Names that
may be used for these three data sets are Treatment sample (T), Comparison sample universe
(U), and Matched Comparison sample (C).
Receiving the treatment is assumed to be a random event; individuals happened to be in
the right place at the right time to learn about the program, or the individuals may have
experienced randomly the eligibility criteria for the program. Let Wi be an indicator variable that
takes on the value 1 if individual i receives the treatment and 0 otherwise. By assumption Wi is a
stochastic outcome that can be represented as follows:
(1) Wi = g(Xi, ei), where
ei is a random variable that includes unobserved or unobservable characteristics about individual i as well as a purely random component.
An assumption made about the function g is that 0 < prob(Wi = 1|Xi) < 1. This is referred to as
the “support” or “overlap” condition, and is necessary so that the outcome functions described
below are defined for all X.

W.E. Upjohn Institute for Employment Research 13
Net Impact and Benefit-Cost Estimates of the Workforce Development System in Washington State
In general, outcomes are also assumed to be stochastically generated. As individuals in
the treatment group encounter the treatment, they gain certain skills and knowledge and
encounter certain networks of individuals. Outcomes are assumed to be generated by the
following mapping:
(2) Yi(1) = f1(Xi) + e1i
Individuals not in the treatment group progress through time and also achieve certain outcomes
according to another stochastic process, as follows:
(3) Yi(0) = f0(Xi) + e0i
Let ˆk if X = E(Yi(k)|Xi), so eki are deviations from expected values that reflect unobserved or
unobservable characteristics, for k = 0,1.
As mentioned, the problem is that Yi(1) and Yi(0) are never observed simultaneously.
What is observed is the following:
(4) Yi = (1 − Wi)Yi(0) + WiYi(1)
The expected value for the net impact of the treatment on the sample of individuals treated:
(5) E[Yi(1) − Yi(0)|X, Wi = 1] = E (ΔY | X, W = 1)
= E[Y(1)|X, W = 1] − E[Y(0)|X, W = 0]
+ E[Y(0)|X, W = 0] − E[Y(0)|X, W = 1]
= 1f (X) − 0f (X) + BIAS, where
(X), k = 1, 0, are the outcome means for the treatment and comparison group
samples, respectively, and BIAS represents the expected difference in the Y(0) outcome between the
comparison group (actually observed) and the treatment group (the counterfactual.)
The BIAS term may be called selection bias.
ˆkf

W.E. Upjohn Institute for Employment Research 14
Net Impact and Benefit-Cost Estimates of the Workforce Development System in Washington State
A key assumption that allows estimation of equation (5) is that Y(0) W|X. This
orthogonality assumption states that given X, the outcome (absent the treatment), Y(0), is random
whether or not the individual is a participant. This is equivalent to the assumption that
participation in the treatment can be explained by X up to a random error term. The assumption is
called “unconfoundedness,” “conditional independence,” or “selection on observables.” If the
assumption holds, then the net impact is identified because BIAS goes to 0 and
(6) E[Δ Y|X, W = 1] = 1f (X) − 0f (X)
In random assignment, the X and W are uncorrelated through experimental control, so the
conditional independence assumption holds by design. In any other design, the conditional
independence is an empirical question.
Estimation of Net Impacts
The net impacts of receiving a treatment (i.e., participating in a program) are estimated
by comparing the outcomes of the individuals who received the treatment to the outcomes of a
set of individuals who did not receive the treatment. In the above exposition, T represents the
data set(s) with treatment observations, and U represents the data set from which the comparison
set of observations may be chosen. The chosen observations comprise C. Note that T and U may
come from the same source of data, or may be entirely different data sets. In the former situation,
U has been purged of all observations that are also in T.
There are numerous methods for constructing the comparison group. The nearest-
neighbor algorithm minimizes a distance metric between observations in T and U. Letting X
represent the vector of variables that are common to both T and U, and letting Xj, Xk be the values
of X taken on by the jth observation in T and kth observation in U, then C will be comprised of
the k observations in U that minimize the distance metric (Xj − Xk) for all j. The literature usually

W.E. Upjohn Institute for Employment Research 15
Net Impact and Benefit-Cost Estimates of the Workforce Development System in Washington State
suggests that the distance metric be a weighted least squares distance, (Xj − Xk)′ Σ-1 (Xj − Xk),
where Σ-1 is the inverse of the covariance matrix of X in the comparison sample. This is called
the Mahalanobis metric. If we assume that the Xj are uncorrelated, then this metric simply
becomes least squared error. In general, the literature on statistical matching has a discussion of
the effect of using different metrics, although in practice the Mahalanobis metric is used most
often.
An alternative matching algorithm, which we used in this study, involves use of
propensity scores. Essentially, observations in T and U are pooled, and the probability of being in
T is estimated, using logistic regression. The predicted probability of being a treatment case for
each observation is called its propensity score. Propensity score matching reduces the distance
metric to a single dimension, and it is appropriate because of the result that Y(0) W|X implies
that Y(0) W|p(X), where p(X) is the propensity score. Treatment observations are matched to
observations in the comparison sample with the closest propensity scores. In this study, we used
propensity score matching, although we required an exact match on sex. Our justification for
this latter requirement was twofold. First, it follows the usual practice in the literature. Second,
labor economics studies typically suggest that the labor market behavior of men and women
differ substantially.
A key assumption in matching procedures is the “unconfoundedness” or “conditional
independence” of the outcome variable, Y, with the covariates, X. The assumption implies that
the (co)variability of the X variables can be used to generate an estimate of the expected value of
Y in the treatment and comparison samples. This requires two conditions. First, the distribution
of the X variables should be statistically equivalent in the samples, and second, there is no
variable in either the treatment or comparison sample that is related to the outcome variable Y

W.E. Upjohn Institute for Employment Research 16
Net Impact and Benefit-Cost Estimates of the Workforce Development System in Washington State
that is not in X. If the first condition is violated, then any difference in outcomes between the
treatment and comparison groups might result from different covariability in X and not due to the
treatment. If the second condition is violated, then any difference in outcomes between the
treatment and comparison groups might be due to the unobserved or uncontrolled variable and
not due to the treatment.
Thus, in practice, analysts conducting the estimation need to show that the X variables in
the treatment sample are balanced with the X variables in the comparison sample. If the
distributions differ significantly, then the propensity score model is misspecified, and additional
interactions or polynomial terms may be added to the propensity score model. Matching should
be redone, and balancing tests should be redone. Often balance is tested by examining t-tests of
the difference in means for the treatment and comparison group covariates. The literature
suggests that even though it is the usual convention, using t-tests is not appropriate because
assessing balance is not a test of hypothesis. Two other statistical tests have been suggested. The
first of these, called the Cohen d statistic, is the standardized difference in means. It is equal to
( t cY Y ) / σt where tY and cY are the sample means for the treatment and comparison group, and
σt is the estimated standard deviation from the treatment group. The balance test involves
calculating d for each covariate and for the propensity score. A rule of thumb is that d should be
less than 0.25; however some authors suggest 0.10. In the results presented in this study, we use
d < 0.10.
Since the standardized difference in means is essentially focused on the first moment of
the distribution only, a second test is to calculate the ratio of the estimated variances of the
treatment and comparison group. This variable, v = σt2 / σc
2 , should be close to one. Again, in
our case, v is close to one for virtually all variables, and in all cases 0.52 < v < 1.52.

W.E. Upjohn Institute for Employment Research 17
Net Impact and Benefit-Cost Estimates of the Workforce Development System in Washington State
Also, in practice, analysts need to justify the assumption that there are no unobserved
variables that are related to the outcomes of interest. In this study, we have access to many
variables that are related to labor market outcomes18 and use them in the matching algorithm.
Arguably an important unobserved variable is individual motivation/initiative. We assume that
there is little difference in the distribution of this characteristic between the treatment and
comparison groups because the latter come from individuals who apply for services from the
public employment service, and it requires some degree of motivation to apply for those services.
An important consideration in implementing the matching approach is whether to sample
from U with or without replacement. Sampling with replacement reduces the “distance” between
the treatment and comparison group cases, but it may result in the use of multiple repetitions of
observations, which may artificially dampen the standard error of the net impact estimator.
Another consideration is the number of cases to use from U in constructing C. Commonly,
matching is done on a 1-to-1 basis, where the nearest neighbor is chosen. However, it is also
possible to take multiple nearest neighbors. In this study, we did 1-to-1 matching with
replacement.
The whole reason for matching is to find similar observations in the comparison group to
those in the treatment group when the “overlap” or statistical support is weak. Consequently, the
nearest-neighbor approach may be adjusted to require that the distance between the observations
that are paired be less than some criterion distance. This is called caliper or radii matching. We
applied a caliper of 0.005 in this study.
18 The primary purpose of workforce development programs is to achieve favorable labor market outcomes.
Thus it makes sense that programs collect the variables that are most likely to be related to those outcomes. If it were discovered that there were important variables that were left out, programs would quickly start collecting those variables.

W.E. Upjohn Institute for Employment Research 18
Net Impact and Benefit-Cost Estimates of the Workforce Development System in Washington State
Estimation Procedures Used in This Study
Once we have arrived at matched treatment and comparison data sets that are well-
balanced, several different estimators could be used to estimate the net impact of the treatment
on labor market outcomes. In this study, the average treatment effect on the treated (ATET) is
calculated straightforwardly by differencing the means of the outcome variables in the
comparison group from the treatment group. The outcome variables are specified in terms of
levels or difference-in-differences.
Table 2.1 summarizes our preferred estimator, by program. In general, the preferred
estimator was the mean of the difference-in-differences means [(post-program outcomes for
treatment cases minus pre-program levels) minus (outcomes for the comparison cases in the
post-program period minus levels at the pre-program period)]. This difference-in-differences
approach adjusts for individual-level fixed (time-invariant) unobservables. However, for
programs where there was a clear disruption to the human capital/labor market experiences of
participants, the preferred specification was differences in the post-program levels (post-program
outcomes from treatment cases minus outcomes for the comparison cases in the post-program
period). The table shows that various age ranges were for the comparison population. The age
ranges were selected in order to preserve overlap with the workforce program.
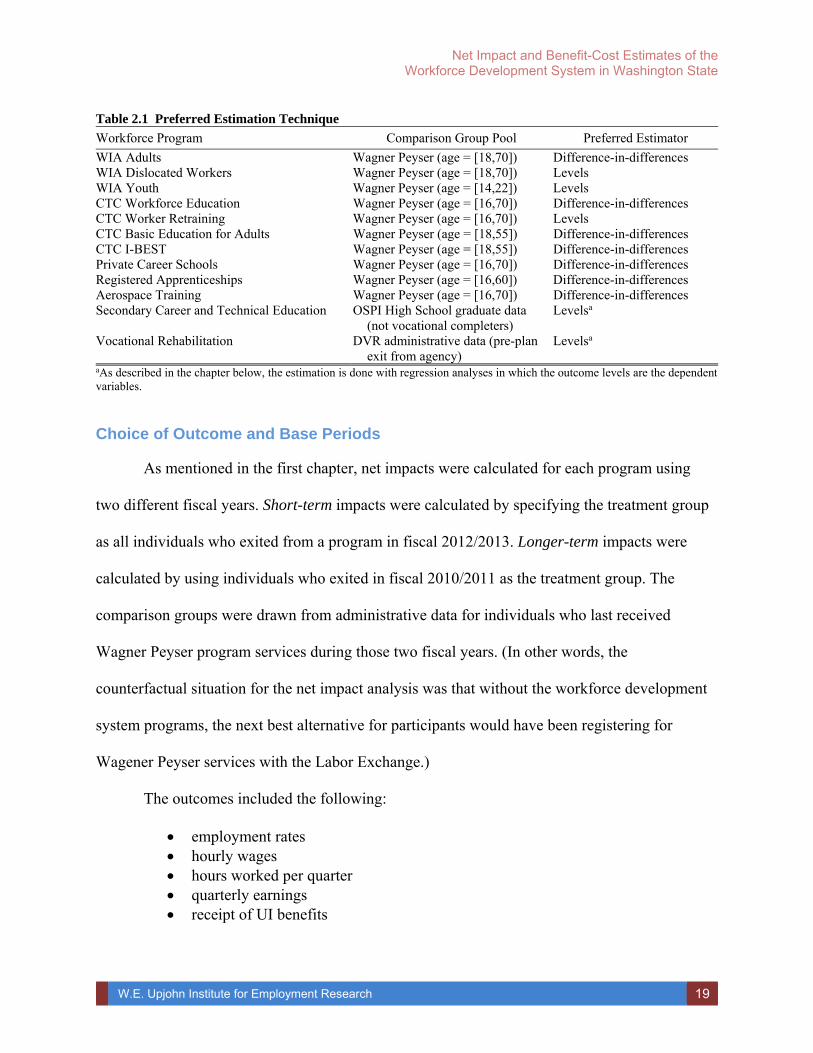
W.E. Upjohn Institute for Employment Research 19
Net Impact and Benefit-Cost Estimates of the Workforce Development System in Washington State
Table 2.1 Preferred Estimation Technique
Workforce Program Comparison Group Pool Preferred Estimator
WIA Adults Wagner Peyser (age = [18,70]) Difference-in-differences WIA Dislocated Workers Wagner Peyser (age = [18,70]) Levels WIA Youth Wagner Peyser (age = [14,22]) Levels CTC Workforce Education Wagner Peyser (age = [16,70]) Difference-in-differences CTC Worker Retraining Wagner Peyser (age = [16,70]) Levels CTC Basic Education for Adults Wagner Peyser (age = [18,55]) Difference-in-differences CTC I-BEST Wagner Peyser (age = [18,55]) Difference-in-differences Private Career Schools Wagner Peyser (age = [16,70]) Difference-in-differences Registered Apprenticeships Wagner Peyser (age = [16,60]) Difference-in-differences Aerospace Training Wagner Peyser (age = [16,70]) Difference-in-differences Secondary Career and Technical Education OSPI High School graduate data
(not vocational completers) Levelsa
Vocational Rehabilitation DVR administrative data (pre-plan exit from agency)
Levelsa
aAs described in the chapter below, the estimation is done with regression analyses in which the outcome levels are the dependentvariables.
Choice of Outcome and Base Periods
As mentioned in the first chapter, net impacts were calculated for each program using
two different fiscal years. Short-term impacts were calculated by specifying the treatment group
as all individuals who exited from a program in fiscal 2012/2013. Longer-term impacts were
calculated by using individuals who exited in fiscal 2010/2011 as the treatment group. The
comparison groups were drawn from administrative data for individuals who last received
Wagner Peyser program services during those two fiscal years. (In other words, the
counterfactual situation for the net impact analysis was that without the workforce development
system programs, the next best alternative for participants would have been registering for
Wagener Peyser services with the Labor Exchange.)
The outcomes included the following:
employment rates hourly wages hours worked per quarter quarterly earnings receipt of UI benefits

W.E. Upjohn Institute for Employment Research 20
Net Impact and Benefit-Cost Estimates of the Workforce Development System in Washington State
Figure 2.1 Timeline and Earnings Profile for a Hypothetical WIA Adult Client Earnings Profile Calendar Quarter 07:Q1 07:Q2 07:Q3 07:Q4 08:Q1 08:Q2 08:Q3 08:Q4 09:Q1 09:Q2 09:Q3 09:Q4 Analysis Quarter –9 –8 –7 –6 –5 –4 –3 –2 –1 Treatment Real Earnings $2,300 $1,500 $0 $1,000 $2,800 $3,000 $3,200 $3,200 $1,600 $0 $0 $1,200 Calendar Quarter 10:Q1 10:Q2 10:Q3 10:Q4 11:Q1 11:Q2 11:Q3 11:Q4 12:Q1 12:Q2 12:Q3 12:Q4 Analysis Quarter Treatment +1 +2 +3 +4 +5 +6 +7 +8 Real Earnings $2,000 $0 $0 $1,500 $2,500 $2,700 $2,700 $2,700 $2,900 $0 $1,600 $2,900 Calendar Quarter 13:Q1 13:Q2 13:Q3 13:Q4 Outcome Variables
Earnings (+3) $2,700 Ave. Earnings (9–12) $3,100 Base Period Earnings (–6 through –3) $2,500
Analysis Quarter +9 +10 +11 +12 Real Earnings $3,000 $3,100 $3,100 $3,200
All of these were measured on a quarterly basis. Employment was defined as having at least
$100 in earnings in a quarter; hourly wage rate was defined as quarterly earnings divided by
hours worked in the quarter; and receipt of a UI benefit was defined as nonzero benefits received
during the calendar quarter.
We used two different approaches for identifying the specific periods over which to
measure the short-term and longer-term outcomes. The first approach was to use the average of
the outcomes three quarters after exiting from the program for both cohorts, and the second was
the quarterly average during quarters 9–12 after exiting from the program. For difference-in-
differences estimators, we specified the pre-program base period to be the average of quarters 3–
6 prior to registration.
The timeline in Figure 2.1 is intended to help explain the analyses periods. The timeline
shows the registration and exit dates for a hypothetical individual of adult age who registered for
WIA Adult services in April, 2009 (Quarter 2 of 2009) and exited from services in November,
- 6 - 5 - 4 -3 - 2 - 1
registration
2008 2009 2010 2011 2012 2013
exit
+1 +2 +3 +4 +5 +6 +7 +8 +9 +10 +11 +12
analysis period

W.E. Upjohn Institute for Employment Research 21
Net Impact and Benefit-Cost Estimates of the Workforce Development System in Washington State
2010 (Quarter 4 of 2010). The earnings profile shows that this person had average quarterly
earnings of $2,500 (2014$) in the base period (2007:Q4 to 2008:Q3), $2,700 in the 3rd quarter
after exit (2011:Q3); and $3,100 average quarterly earnings in the 9th–12th post-exit quarters,
which were 2013:Q1 to 2013:Q4. So in calculating the average treatment effect for earnings
levels, this observation’s contributions to the treatment means would have been $2,700 and
$3,100 for the short-term and longer-term outcomes. For the difference-in-differences
calculations, this observation’s contributions to the means would have been $200 and $600,
respectively.
Subgroups
One of the advantages of relying on linked administrative data in an evaluation such as
this project is that there are usually adequate sample sizes to examine the net impacts of the
program interventions on subgroups of the population. Over the course of this project, we
examined different subgroups for many of the programs. For example, the treatment groups
usually comprised all individuals who had participated in a program and last received services
during a particular fiscal year. This included individuals who “completed” the program and those
who left without completing. Consequently in subgroup analyses, we examined “completers”
versus “non-completers.” As would be expected, “completers” generally had more favorable
outcomes.
The subgroup analyses that we performed are described in each of the chapters of this
report. We limited the subgroup analyses to programmatic feature variables—such as particular
types of interventions or completion status.

W.E. Upjohn Institute for Employment Research 22
Net Impact and Benefit-Cost Estimates of the Workforce Development System in Washington State

W.E. Upjohn Institute for Employment Research 23
Net Impact and Benefit-Cost Estimates of the Workforce Development System in Washington State
3 WORKFORCE INVESTMENT ACT (WIA) ADULT PROGRAM
The Workforce Investment Act (WIA) programs were the primary federally-funded job
development programs for individuals during the time period of the cohorts being analyzed;
services included core services, intensive services, and training. These levels of services were
intended to be sequential. Core services, intended for all clients, included skill assessment, labor
market information, consumer reports on training programs, and job search and placement
assistance. Individuals who did not become employed after receiving core services were eligible
for intensive services. These services were individualized—assessment, individual counseling,
employment planning, and prevocational training. Adults who continued to have difficulty
finding employment after core and intensive services were eligible for training. Training was
provided through individual training accounts (ITAs), which are essentially vouchers that may be
used at institutions on an approved list. For all services, highest priority was given to welfare and
low-income clients.
Participant Characteristics
Table 3.1 provides descriptive data that compare the individuals in the treatment group to
those in the comparison group pool (individuals who registered for WP services who were at
least 18 but no more than 70 at the time). The first two columns of numbers compare the WIA
clients who exited in 2010/2011 to individuals in the comparison group pool in the same year
(except that individuals who were served by Washington’s education and training programs were
removed from the data). The final two columns compare the WIA exiters in 2011/2012 to WP
participants in the same year.

W.E. Upjohn Institute for Employment Research 24
Net Impact and Benefit-Cost Estimates of the Workforce Development System in Washington State
Note that there are two types of variables displayed in the table. The top panel of the table
shows demographic characteristics. The bottom panel presents variables that are intended to
gauge the labor market history of individuals. The latter variables summarize the individuals’
employment and earnings histories prior to registration with WIA (or with Wagner Peyser).
Percent of quarters with employment measures the percentage of calendar quarters prior to
registration for which we had historical data (back to approximately 2007) that the individual had
earnings of over $100.19 The average quarterly earnings variable is the average for quarters in
19The numerator is the number of quarters with earnings that exceed $100 (2014 $) prior to registration; the
denominator is potential number of quarters prior to registration that the individual could have had earnings. We started the “clock” for potential quarters in the earliest quarter in our data for which the individual had non-zero earnings.
Table 3.1 Descriptive Statistics for WIA Adult Treatment Group and Comparison Group Pool 2010/2011 2012/2013 Characteristics WIA Adult Wagner Peyser WIA Adult Wagner PeyserDemographics Female 56.7% 43.2% 53.7% 44.3% Race: White 66.9% 64.9% 62.4%†† 62.7%††
Black 11.1% 6.7% 11.8% 6.4% Hispanic 10.1% 14.2% 10.4% 13.2% Other race 9.4% 8.1% 11.8% 8.3% Missing 2.6% 6.0% 3.7% 9.3% Mean, age at registration 37.0 39.7 36.8 36.2 Employed at registration 17.6% 12.7% 18.7% 10.8% Disability 6.7% 5.3% 4.6%†† 5.1%††
Veteran 8.8% 9.9% 0.2% 8.6% West WA 73.1% 60.4% 73.5% 60.9% Urban county 35.6% 44.3% 46.0%†† 46.0%††
Employment and Earnings (prior to registration) Percentage of prior quarters employed 58.2% 70.7% 55.0% 68.7% Average quarterly earningsa $3,340 $5,978 $3,160 $6,281 Mean, earnings trendb −$32.4 −$5.5 −$13.4 $118.5 Mean, earnings varianceb (in 106 $) $9.2 $19.5 $9.4 $14.3 Job turnover 33.2% 19.3% 31.6% 12.9% Percentage of quarters with multiple jobs 14.6%†† 14.9%†† 13.0% 11.8% Had earnings dip 56.4%†† 57.7%†† 47.4% 28.1% Mean, number of quarters since dip at registrationa 2.1 2.4 1.7 0.9 Average earnings dip size in percentagea 46.5% 44.2% 39.9% 19.1% Sample Size 3,294 331,268 2,757 178,493 NOTE: All differences in means (i.e., Wagner Peyser mean minus program mean) are statistically significant at the 0.05 level (t-test) unless otherwise denoted. Monetary data in 2014 $. a Averages include observations with values of zero. b Trend and variance calculations include quarters with zero earnings, if any. †† Differences in means are not statistically significant at 0.05 level (t-test).

W.E. Upjohn Institute for Employment Research 25
Net Impact and Benefit-Cost Estimates of the Workforce Development System in Washington State
which the individual had any earnings. Earnings trend is the slope coefficient on a straight line
time trend of earnings prior to registration (including 0s). Earnings variance is the statistical
variance of the quarterly earnings time series prior to registration. Larger variances suggest more
instability in earnings. Number of quarters with a job change is a measure of turnover. It is the
number of quarters during the earnings histories prior to registration that the individual had a
different employer from the previous quarter (the wage record data supplied by the state had a
flag indicating different employer). Job turnover is the percentage of quarters where the
employer of record changed from one quarter to the next.
The last three variables refer to an earnings “dip” that may have occurred during the
individual’s pre-registration earnings history. A “dip” is defined as a decrease in earnings of at
least 20 percent from one quarter to the next. In addition to a dummy variable indicating the
existence of such a dip, two other variables were entered in the model: number of quarters prior
to registration at which the dip occurred and the percentage size of the dip.20
The table shows that the populations are quite dissimilar both in terms of demographic
characteristics and labor market histories. All but two of the variables have differences in the
mean values that are statistically significant at the 0.05 level in the earlier cohort, and all but
three variables in the later cohort have statistically significant differences in means. Among the
demographic variables, much larger percentages of the WIA Adult exiters are females, were
employed at the time of registration, and are from the Western side of the state in both cohorts.
On the other hand, a much smaller percentage of WIA Adult exiters are from an urban county in
the earlier cohort; however, this percentage was identical in the later cohort for the WIA exiters
20 In previous studies, the participation models included several variables that described the pre-registration
public assistance experience of the individuals. In this study, no pre-registration public assistance data were available for the comparison groups, so those variables had to be dropped from the models.

W.E. Upjohn Institute for Employment Research 26
Net Impact and Benefit-Cost Estimates of the Workforce Development System in Washington State
and Wagner Peyser participants. In the 2012/2013 cohort, only a handful of WIA exiters (0.2%)
are veterans compared to almost 9 percent of the WP participants.
The average quarterly earnings for all WIA clients who had any earnings prior to
registration was $3,200 to $3,300 (’14 $), much smaller than the average quarterly earnings prior
to registration for Wagner Peyser program participants, which is $6,000 in the 2010/2011 cohort
and almost $6,300 in the later cohort. This suggests that the human capital characteristics of the
WIA Adults may be of significantly “lower quality” than of the WP participants. Indeed, there is
a difference in the employment percentage of over 10 percentage points for both cohorts.
Furthermore, the job turnover of WIA Adults is almost twice as large and, in the later cohort, a
much higher percentage of WIA Adult exiters had an earnings dip—over 47 percent to 28
percent. There was no statistically significant difference in this percentage for the 2010/2011
cohort, however. In short, except for a few variables, there were significant differences in these
two populations in each cohort. Thus the next step in the analyses was to estimate a model of
participation in the WIA adult program and conduct a statistical match using the propensity
score.
Participation Model
Table 3.2 provides the results from the logit estimation of participation in the WIA Adult
program. More precisely, the adults (aged 18–70) who had registered for Wagner Peyser services
(but who had not received employment and training services in Washington) were pooled with
the WIA adult clients who had exited. A “treatment” dependent variable was created; it was a
dummy variable equal to 1 for the WIA participants (and 0 for the WP group). The “model” is
not theoretically derived, and so inferences about causality should be cautiously formulated.
However, the independent variables include the pre-registration employment and earnings

W.E. Upjohn Institute for Employment Research 27
Net Impact and Benefit-Cost Estimates of the Workforce Development System in Washington State
variables, for which causality may be appropriate because they precede the participation
outcome. The demographic variables, however, are control variables that likely have little causal
influence.
The table provides the logit coefficient estimates and standard errors. The magnitude of
the coefficients is not easily interpreted, but the sign and statistical significance are. If the
coefficient is positive, then a change in the variable will increase the likelihood of participation.
If the coefficient is negative, then a (positive) change in that variable will decrease the likelihood
of being a WIA Adult exiter.
Table 3.2 Coefficient Estimates from a Logit Model of Participation in WIA Adult Program 2010/2011 2012/2013 Characteristics Coefficient Standard Error Coefficient Standard ErrorDemographics Female 0.372*** 0.040 0.135** 0.043 Race: (White is omitted category) Black 0.286*** 0.061 0.443*** 0.068 Hispanic −0.233*** 0.064 −0.074 0.072 Other 0.150* 0.063 0.381*** 0.065 Missing −0.859*** 0.112 −0.970*** 0.105 Age at registration −0.000 0.002 0.029*** 0.002 Employed at registration 0.424*** 0.048 0.778*** 0.053 Disability 0.171* 0.074 0.178 0.096 Veteran 0.029 0.068 −3.791*** 0.411 West WA 0.814*** 0.043 0.711*** 0.050 Urban county −0.604*** 0.041 −0.303*** 0.045 Employment and Earnings (prior to registration) Percentage of prior quarters employed −0.006*** 0.001 −0.011*** 0.001 Average quarterly earningsa (in 102 $) −0.001 0.001 −0.006*** 0.001 Earnings trendb (in 102 $) −0.021*** 0.004 −0.003 0.002 Earnings varianceb (in 108 $) −0.563*** 0.127 0.073 0.062 Job turnover 0.041*** 0.001 0.037*** 0.001 Percentage of quarters with multiple jobs −0.021*** 0.001 −0.015*** 0.001 Had earnings dip 0.343** 0.107 −0.699*** 0.133 Number of quarters since dip at registration −0.124*** 0.011 0.023 0.013 Earnings dip size in percentage 0.180 0.105 1.368*** 0.133 Constant −6.124*** 0.162 −6.259*** 0.172 Observations 334,562 181,250 NOTE: Model also includes dummy variables for sector of most recent employment (22 categories). aAverage includes quarters with values of zero, if any. bTrend and variance calculations include quarters with zero earnings, if any. *, **, *** indicate statistical significance at p = 0.05, 0.01, and 0.001, respectively.

W.E. Upjohn Institute for Employment Research 28
Net Impact and Benefit-Cost Estimates of the Workforce Development System in Washington State
In the model, the following demographic variables are positively associated with being in
the treatment group at a statistically significant level (i.e., a WIA Adult exiter) in both years of
data: female, African American (white is the omitted category), employed at registration, and
being from western Washington. The following demographic variables are negatively associated
with being in the treatment group: being Hispanic or having the race variable missing (again,
white is the omitted category) and residing in an urban county. Among the labor market
variables, many are negatively related to participation in the WIA adult program: the percentage
of quarters employed prior to registration, average quarterly earnings (not significant in the 2010
cohort), and the mean of the earnings trend (not significant in the 2012/2013 cohort). The only
labor market variable that is positively associated with participation is job turnover. The other
variables in the table either have insignificant coefficients or “flip” signs between the two
cohorts.
Propensity Score Statistics
The propensity score for an observation is the predicted probability using the estimated
logit coefficients and the observation’s actual data. If the logit model has substantial predictive
capability, then the mean propensity score for the comparison group should be small (near zero)
and should be much less than the mean score for the treatment. A measure of how well the logit
model discriminates between comparison group members and treatment group members is the
cumulative percentile for the comparison group pool at the propensity score that is at the 20th
percentile for the treatment group; a value of approximately 80 is “optimum.” Table 3.3 provides
these data for the WIA Adult analyses. Note that there is a sizeable difference in the means
between the WIA Adult and Wagner Peyser samples, and the 20th percentile indicators have a
relatively high value, although they do not reach 80 percent. The mean propensity scores for the

W.E. Upjohn Institute for Employment Research 29
Net Impact and Benefit-Cost Estimates of the Workforce Development System in Washington State
treatment groups are roughly 0.04 and 0.09, whereas they are about 0.01 for the comparison
pool, for both cohorts. The 20th percentile indicators are approximately 57 percent for the earlier
cohort and 73 percent for the later cohort. These values suggest that the participation model
discriminated between the treatment and comparison observations at a level that was not
especially noteworthy.
Table 3.3 Indicators of Propensity Score (p-score) Model Quality for WIA Adult Analyses Statistic 2010/2011 2012/2013
Mean p-score, WIA Adult 0.042 0.086
Mean p-score, Wagner Peyser 0.010 0.014
Percentile Wagner Peyser, at 20th percentile WIA Adult 56.7% 72.8%
Statistical Match
As described in the last chapter, the statistical matching that was done used a “nearest
neighbor” approach with the propensity score. For every observation j in T, we found the
observation k in U that minimized the absolute value of the difference between the propensity
score for j and k. We then added observation k to the comparison group sample, C. The statistical
match was done with replacement, so some observations in U were the “matches” for more than
one observation in the treatment group. Furthermore, it was done with a caliper of 0.005.
Table 3.4 provides data about the sample sizes, number of matched observations that
were duplicates, and a comparison of descriptive statistics between the treatment group and
constructed comparison group for the statistical match. In matching with replacement, we are
artificially reducing the variation in the matched comparison sample whenever the same
observation is used multiple times. (This is the tradeoff that is made in order to get “better
matches.”) Consequently, other things equal, matches would be preferred with a smaller number
of observations that are used multiple times, and a smaller number of maximum matches. The

W.E. Upjohn Institute for Employment Research 30
Net Impact and Benefit-Cost Estimates of the Workforce Development System in Washington State
table indicates that approximately five to ten percent of the matched comparison group records
are matched multiple times, and the maximum number of times for a record is six times.
Table 3.4 Matching Algorithm Statistics and Post-Match Comparison of Characteristics for WIA Adult
Analyses
Statistic/Characteristic 2010/2011 2012/2013
WIA Adult Wagner Peyser WIA Adult Wagner PeyserSample size 3,294 333,317 2,757 179,587 Sample size used in match 3,294 331,268 2,757 178,493 Matched sample size 3,271 3,271 2,718 2,718 Number of observations used once -- 2,949 -- 2,298 Number of observations used multiple times -- 143 -- 191 Maximum number of repeats -- 6 -- 5 Demographics Female 56.6% 56.6% 53.8% 53.8% Race: White 67.0%* 64.7%* 62.4% 60.3% Black 10.9%* 12.4%* 11.7%** 13.6%** Hispanic 10.1% 10.3% 10.4% 9.7% Other race 9.3% 10.5% 11.7% 12.1% Missing 2.6% 2.1% 3.7% 4.3% Mean, age at registration 37.0 37.3 36.7 36.3 Employed at registration 17.5% 16.8% 18.5% 18.4% Disability 6.7% 6.7% 4.6% 5.3% Veteran 8.8% 8.3% 0.2% 0.3% Urban county 35.7% 36.5% 46.0%* 48.4%* West WA 72.9% 72.8% 73.4% 74.9% Employment and Earnings (prior to registration) Percentage of prior quarters employed 58.4%*** 53.0%*** 55.5%*** 49.6%*** Average quarterly earningsa $3,361*** $2,937*** $3,202*** $2,676*** Mean, earnings trendb −$32.1 −$39.2 −$11.8 −$12.8 Mean, earnings varianceb (in 106 $) $9.2*** $7.9*** $9.5** $8.0** Job turnover 32.7%*** 30.8%*** 30.7%** 29.4%** Percentage of quarters with multiple jobs 14.7%*** 13.1%*** 13.1% 12.7% Had earnings dip 56.5%*** 51.0%*** 47.2% 47.6% Mean, number of quarters since dip at registrationa 2.1*** 1.9*** 1.7 1.8 Average earnings dip size in percentagea 46.5%*** 42.2%*** 39.7% 40.4% Sample Size 3,271 3,271 2,718 2,718 NOTE: Monetary values in 2014 $. Statistically significant difference in means denoted by *, **, ***. * p < 0.10; ** p < 0.05; *** p < 0.01 (two-tailed test). – means not applicable. a Averages include observations with values of zero. b Trend and variance calculations include quarters with zero earnings, if any.
Balance
After the statistical match, there should be few non-random differences in characteristics
between the treatment and matched comparison set. Table 3.4 presents the means of a number of
covariates in the treatment and matched comparison samples. Sample exclusions that account for

W.E. Upjohn Institute for Employment Research 31
Net Impact and Benefit-Cost Estimates of the Workforce Development System in Washington State
the differences between the first two rows of the table were for observations that had missing
data for any of the variables used in the match. The difference in counts between the second and
third row represents the number of observations that were deleted because they were not within
the caliper radius. Notice that the resulting distributions are well-balanced. There is only one
variable for which the difference in means is statistically significant. As noted in chapter 2, one
way to test for balance between the treatment and matched comparison group is by examining
the Cohen d statistics, or standardized difference in means. A well-balanced matching group will
have d < 0.25. Figure 3.1 shows this test graphically for the WIA Adult sample. The top graph is
for the 2010/2011 cohort and the bottom is for the 2012/2013 cohort. In the figures, the
standardized difference in means for each variable used in the match using the entire matching
pool sample (i.e., Wagner Peyser data) and the treatment sample is shown with the heavy black
dots. The same statistic using the matched sample is shown with “x’s.” The vertical lines are
drawn at +/− 0.10. The figures show visually how the bias is reduced by matching, with only one
variate—percent employed prior to program entry—barely outside of the 0.10 bound in both
cohorts.
Net Impacts
The major purpose of the study is, of course, to estimate the net impacts of the workforce
development system programs on clients. In particular, net impacts have been estimated for the
following five outcomes:
employment hourly wage quarterly hours of employment quarterly earnings receipt and amount of Unemployment Compensation benefits per quarter

W.E. Upjohn Institute for Employment Research 32
Net Impact and Benefit-Cost Estimates of the Workforce Development System in Washington State
Figure 3.1 Standardized Difference in Means, Pre- and Post-match, WIA Adults
NOTE: Standardized difference in means between comparison group pool and treatment group denoted by dot. Standardized difference in means between matched comparison group and treatment group denoted by x. Red vertical lines at +/− 0.10.
Tables 3.5 and 3.6 provide estimated net impacts for the WIA Adult program. The first
table displays the short-term (3 quarters after exit) and the longer-term (9–12 quarters after exit)
-50 0 50
Standardized % bias across covariates
earn_meanpctemployed
earn_varage_start
urbanmissracehispanic
time_since_dipearn_trend
vethad_earnings_dip
pctqmjobothrace
earn_dippctdisabled
employedblackwestfem
turnover
-50 0 50 100
Standardized % bias across covariates
earn_meanvet
pctemployedmissrace
earn_trendearn_varhispanicdisabled
urbanage_startpctqmjob
othraceblack
fememployed
westtime_since_dip
had_earnings_dipearn_dippct
turnover

W.E. Upjohn Institute for Employment Research 33
Net Impact and Benefit-Cost Estimates of the Workforce Development System in Washington State
outcomes for the 2010/2011 cohort of program exiters. The second table is limited to the short-
term net impacts for the 2012/2013 cohort. The first column in each of the tables presents the net
impact estimate, which is the average treatment effect. The impacts that are in “boxes” represent
the final, “official” estimates. The final columns of the tables provide the means of the
comparison group, both the full comparison group pool and the matched comparison group.
These columns are provided so that the net impacts can be estimated on a percentage basis.
Table 3.5 shows the results for the analyses of the 2010/2011 cohort and Table 3.6
provides the results for the 2012/2013 cohort. Our general strategy is to rely on the earlier cohort
of exiters to provide the longer-term net impacts, and to average the two cohorts of exiters to
provide the short-term impacts.
Note on unconditional versus conditional means. For many of the outcome variables, the
issue of whether or not to use observations with values of 0 in the calculations of mean results is
relevant. Means that are calculated without 0s are referred to as conditional means; means that
included 0s are referred to as unconditional means. The reason to use conditional means is that
many outcomes depend on whether or not an individual is in a particular status and on what
occurs in that status. For example, to have quarterly earnings, an individual must be employed. If
employed, the individual’s earnings depend on hours worked and wage rates. If a program has
impacts on the likelihood of employment and on wage rates, then the unconditional level of
earnings will confound both an employment and a wage rate effect. The conditional mean will
not be influenced by the share of the treatment or comparison group that is employed. The reason
to rely solely on unconditional means is that we are interested in the effect of a program on the

W.E. Upjohn Institute for Employment Research 34
Net Impact and Benefit-Cost Estimates of the Workforce Development System in Washington State
Table 3.5 Net Impact Estimates for WIA Adult Program for 2010/2011 Cohort
Outcome
Matched Sample Estimator Comparison Group Means
Average Treatment Effect
Full Sample Matched Sample With 0 W/o 0 With 0 W/o 0
Employment (percentage points)a Short term 13.5*** 54.2 -- 46.7 -- Ever-employed, longer term 5.3*** 64.9 -- 58.6 -- Percent of quarters, longer term 7.3*** 55.2 -- 47.4 -- Percent of quarters, longer term, diff-in-diff 4.1** −7.6 -- 1.3 -- Hourly wage Short term ($) 3.03*** 9.93 18.08 7.26 15.20 Short term, diff-in-diff ($) 2.93*** −3.79 −2.46 −0.71 −0.83 Longer term (4-quarter average) ($) 2.77*** 10.78 18.92 7.52 15.39 Longer term, diff-in-diff ($) 2.67*** −2.94 −1.62 −0.45 −0.84Quarterly hours Short term 81.4*** 206.1 375.3 160.0 334.9 Short term, diff-in-diff 71.6*** −39.1 13.0 0.9 23.1 Longer term (4-quarter average) 46.3*** 226.4 378.8 178.2 337.6 Longer term, diff-in-diff 36.4*** −18.9 19.9 19.1 30.4 Quarterly earnings Short term ($) 1,712*** 3,810 6,937 2,432 5,090 Short term, diff-in-diff ($) 1,646*** −1,668 −774 −342 −127 Longer term (4-quarter average) ($) 1,384*** 4,491 7,437 2,864 5,384 Longer term, diff-in-diff ($) 1,319*** −988 −246 91 180Unemployment Insurance Benefits Percent receiving, short term −8.2*** 24.3 -- 17.2 -- Benefits, short term ($) −291*** 788 3,242 486 2,827 Ever-received, longer term 0.7 15.0 -- 11.3 -- Benefits, longer term (4-quarter average) ($) 27** 171 2,016 116 1,801 NOTE: Monetary data in 2014 $. Sample sizes differ for virtually every entry in the table because of observations with missing data. If there were no missing data, the sample sizes would be those displayed in row 3 of Table 3.4. * significant at the 0.10 level; ** significant at the 0.05 level; *** significant at the 0.01 level (two-tailed test). – means not applicable. aShort term employment is defined as having more than $100 in quarterly earnings in the 3rd quarter after exit. Ever-employed, longer term is defined as having more than $100 in any quarter from the 9th to the 12th quarter after exit. Percent of quarters, longer-term takes on values of 0%, 25%, 50%, 75%, or 100% for an observation depending on whether the observation was employed for 0, 1, 2, 3, or 4 quarters between the 9th and 12th quarter after exit.
population that it serves. Furthermore, we are using the average or mean to measure that effect.
Therefore, the correct statistic is the unconditional mean. Both sets of impacts were estimated.
In all of the tables and in the cost-benefit analysis, we use unconditional means. However, the
conditional mean impacts are available from the authors on request.
The longer-term employment and earnings impacts that are shown in Table 3.5 are
positive and relatively large. The program results in more employment (slightly over 4
percentage points), a higher average hourly wage ($2.67 per hour), and a higher average of hours

W.E. Upjohn Institute for Employment Research 35
Net Impact and Benefit-Cost Estimates of the Workforce Development System in Washington State
Table 3.6 Net Impact Estimates for WIA Adult Program for 2012/2013 Cohort
Matched Sample
Estimator Comparison Group Means
Outcome Average
Treatment EffectFull Sample Matched Sample
With 0 W/o 0 With 0 W/o 0 Employmenta Short term 10.3*** 60.7 -- 55.4 -- Hourly wage Short term ($) 2.01*** 11.47 18.69 8.92 15.82 Short term, diff-in-diff ($) 3.52*** −2.96 −1.52 0.31 −0.27 Quarterly hours Short term 67.4*** 236.8 386.0 199.4 353.5 Short term, diff-in-diff 65.9*** −30.7 −0.1 43.9 71.6 Quarterly earnings Short term ($) 1,249*** 4,555 7,426 3,210 5,691 Short term, diff-in-diff ($) 1,604*** −1,764 −973 339 811 Unemployment Insurance Benefits Percent receiving, short term −0.5 9.7 -- 7.7 -- Benefits, short term ($) −9 205 2,121 150 1,956 NOTE: Monetary data in 2014 $. Sample sizes differ for virtually every entry in the table because of observations with missing data. If there were no missing data, the sample sizes would be those displayed in row 3 of Table 3.4. * significant at the 0.10 level; ** significant at the 0.05 level; *** significant at the 0.01 level (two-tailed test). -- means not applicable. aShort term employment is defined as having more than $100 in quarterly earnings in the 3rd quarter after exit.
of work per quarter (over 36 hours). These re-enforce each other so that the overall earnings
impact is positive and significant. The longer-term earnings impact is approximately 25 percent
(the estimated net impact is $1,319 (2014 $) per quarter and the unconditional mean level of
earnings for the match comparison group is $5,384). The longer-term estimates in the table
suggest a slight (statistically insignificant) increase in the percent of individuals receiving UI
benefits, and an increase in the level of those benefits. These point estimates are consistent with
having higher levels of employment and earnings.
The estimated short-term net impacts on employment, wage rate, hours, and earnings
displayed in Tables 3.5 and 3.6 are also positive, and in fact, are larger than the longer-term
impacts. The estimated quarterly earnings impacts of over $1,600 (2014 $) per quarter is
approximately 30 percent of average earnings for the matched comparison group. Although they
are negative for the earlier cohort, the net impacts on the take-up of UI and benefits are

W.E. Upjohn Institute for Employment Research 36
Net Impact and Benefit-Cost Estimates of the Workforce Development System in Washington State
essentially 0 for the 2012/2013 cohort, which is not too surprising given that these impacts are
measured just three quarters after exit.
As noted earlier, our preferred estimate for the short-term net impacts is the average of
the short-run impacts from Tables 3.5 and 3.6. These are presented in Table 3.7. The results in
this table suggest that in the short term, the WIA Adult program has large and significant
positive effects on employment and earnings. The short-term net impact estimators from both
cohorts are larger than the longer-term net impacts, so of course, their average is larger. In short,
our estimates suggest that this program has large and significant labor market impacts that are
still large, but somewhat attenuated, in the longer-term.
Table 3.7 Short-Term Net Impact Estimates for WIA Adult Program
2010/2011 Estimator
2012/2013 Estimator Average
Employmenta Short term 13.5*** 10.3*** 11.9*** Hourly wage Short term ($) 3.03*** 2.01*** 2.52*** Short term, diff-in-diff ($) 2.93*** 3.52*** 3.22*** Quarterly hours Short term 81.4*** 67.4*** 74.4*** Short term, diff-in-diff 71.6*** 65.9*** 68.7*** Quarterly earnings Short term ($) 1,712*** 1,249*** 1,481*** Short term, diff-in-diff ($) 1,646*** 1,604*** 1,625*** Unemployment Insurance Benefits Percent receiving, short term −8.2*** −0.5 −4.4*** Benefits, short term ($) −291*** −9 −150*** NOTE: Monetary data in 2014 $. * significant at the 0.10 level; ** significant at the 0.05 level; *** significant at the 0.01 level (two-tailed test). aShort term employment is defined as having more than $100 in quarterly earnings in the 3rd quarter after exit.
Figures 3.2 and 3.3 present the net impacts on earnings and employment for each quarter
after exit for 15 quarters for the 2010/2011 cohort and for 7 quarters for the 2012/2013 cohorts,
respectively. The shaded portion of the graphs are the 95% confidence limits on the net impact
estimates. With the exception of the employment impacts graph in the first figure, these figures
provide the time series of the preferred estimates for earnings and employment “boxed” in the

W.E. Upjohn Institute for Employment Research 37
Net Impact and Benefit-Cost Estimates of the Workforce Development System in Washington State
tables. The employment impacts in the first figure show “point-in-time” average treatment
effects and are provided to give the reader a sense of the dynamic pattern of estimated net
impacts.
Figure 3.2 Estimated Net Impacts on Earnings (top) and Employment (bottom) of WIA Adult Program, by
Quarter after Exit, 2010/2011 Cohort
NOTE: Earnings impacts are measured in 2014 $. Employment impacts are measured in percentage points. ATET means average treatment effect on the treated (defined in text).
0
500
1000
1500
2000
2500
1 2 3 4 5 6 7 8 9 10 11 12 13 14 15Quarter after Exit
ATET
0
5
10
15
20
1 2 3 4 5 6 7 8 9 10 11 12 13 14 15Quarter after Exit
ATET

W.E. Upjohn Institute for Employment Research 38
Net Impact and Benefit-Cost Estimates of the Workforce Development System in Washington State
Figure 3.3 Estimated Net Impacts on Earnings (top) and Employment (bottom) of WIA Adult Program, by Quarter after Exit, 2012/2013 Cohort
NOTE: Earnings impacts are measured in 2014 $. Employment impacts are measured in percentage points. ATET means average treatment effect on the treated (defined in text).
Subgroup Analyses
To test the effect of providing training to WIA Adult program participants, we estimated
the net impact outcomes for the subgroup of individuals who received training. On the one hand,
we might hypothesize that training will result in more positive outcomes. But on the other hand,
one reason why participants don’t get training is because they have been successful in finding
0
500
1000
1500
2000
2500
1 2 3 4 5 6 7Quarter after Exit
ATET
0
5
10
15
20
1 2 3 4 5 6 7Quarter after Exit
ATET

W.E. Upjohn Institute for Employment Research 39
Net Impact and Benefit-Cost Estimates of the Workforce Development System in Washington State
employment. Tables 3.8 and 3.9 display the estimated net impacts for individuals who did and
did not receive “training services,” as opposed to job search assistance or other “non-training”
services only.
Table 3.8 Selected Longer-Term Net Impact Estimates for Subgroups of WIA Adult Participants: 2010/2011
Cohort
Outcome
Subgroup Matched Comparison Group
Mean Participants who did not
receive training Participants with
training
Employment 1.3% 7.4%*** 47.4% Hourly Wage $0.66 $3.98*** $15.39 Hours Worked (quarterly) 9.5 54.0*** 337.6 Earnings (quarterly) $251 $2,016*** $5,384 UI Receipt 2.7%** −0.6%*** 11.3% UI Benefits (quarterly) $42** $17*** $1,801 Subgroup Sample Size 1,292 1,979 — NOTE: Outcomes shown in the table are the preferred outcomes that are “boxed” in table 3.5. Monetary data in 2014 $. * significant at the 0.10 level; ** significant at the 0.05 level; *** significant at the 0.01 level (two-tailed test). – means not applicable.
Table 3.9 Selected Short-Term Net Impact Estimates for Subgroups of WIA Adult Participants: 2010/2011
and 2012/2013 Cohorts Averaged
Outcome
Subgroup Matched Comparison
Group Mean Participants who did not
receive training Participants with
training Employment 10.9%*** 9.9%*** 55.4% Hourly Wage $3.11*** $4.12*** $15.82 Hours Worked (quarterly) 69.3*** 69.2*** 353.5 Earnings (quarterly) $1,246*** $1,957*** $5,691 UI Receipt −0.3%*** −0.7%*** 7.7% UI Benefits (quarterly) $3*** −$19 $1,956 Subgroup Sample Size 1,197 1,521 —
NOTE: Outcomes shown in the table are the preferred outcomes that are “boxed” in table 3.6. Monetary data in 2014 $. * significant at the 0.10 level; ** significant at the 0.05 level; *** significant at the 0.01 level (two-tailed test). – means not applicable.
The longer-term net impacts for individuals who received training are substantially better
than the impacts for those individuals who did not receive training services. The employment
rate is a little over six percentage points higher. The longer-term hourly wage net impact is just
under $4.00 per hour for individuals who received training versus less than $0.70 for non-
trainees. The average quarterly hours of employment are also considerably higher for trainees
than for the non-trainees. And of course given the sanguine net impacts for employment, hourly

W.E. Upjohn Institute for Employment Research 40
Net Impact and Benefit-Cost Estimates of the Workforce Development System in Washington State
wage rates, and quarterly hours, the average quarterly earnings for participants with training far
exceeded the average quarterly earnings for participants who did not receive training. The
longer-term net earnings impact for individuals who had been trained is over $2,000 compared to
about $250 for individuals who exited, but didn’t receive training. Trainee exiters were less
likely to receive UI benefits, but if they did receive benefits, the average level was higher.
In the short term, the net quarterly earnings impact estimates for the 2012/2013 cohort of
individuals who participated in training do not dominate non-trainees as they do for the
2010/2011 cohort. In fact, the net impacts for the employment rate and for quarterly hours for
non-trainees are slightly higher than for trainees. However, the net impact on trainees’ hourly
wage rate is about $1.00 less than for trainees, and the quarterly earnings net impact is about
$700 less.

W.E. Upjohn Institute for Employment Research 41
Net Impact and Benefit-Cost Estimates of the Workforce Development System in Washington State
4 WIA DISLOCATED WORKER PROGRAM
Over the period of analysis in this study, the Workforce Investment Act (WIA) had a
funding stream to serve dislocated workers, defined as individuals who lost jobs due to plant
closures, company downsizing, or other significant change in the market such that they are
unlikely to return to their occupation. The services that were provided to clients were identical to
those provided to the adult services described in the previous section. That is, they included,
“core services:” skill assessment, labor market information, training program consumer reports,
and job search and placement assistance. Dislocated workers unable to get jobs with core
services were eligible for individualized attention through intensive and training services. In
addition to the services for dislocated workers, this funding mechanism also established early
intervention programs for workers and firms facing substantial layoffs. Although the services
were similar, the clients who participated in this program were quite different from those who
participated in the adult programs. Dislocated workers tended to have had substantial labor
market attachment and much higher earnings levels and skill levels prior to their participation.
Participant Characteristics
Table 4.1 provides descriptive data that compare the individuals in the treatment group to
those in the comparison group pool. The first two columns of numbers in the table compare the
WIA Dislocated Worker clients who exited in 2010/2011 to individuals who registered for
Wagner Peyser services in the same year (except that individuals who were served by
Washington’s education and training programs were removed from the data). The final two
columns compare the WIA Dislocated Worker exiters in 2012/2013 to WP participants in the

W.E. Upjohn Institute for Employment Research 42
Net Impact and Benefit-Cost Estimates of the Workforce Development System in Washington State
same year. The data for the comparison group pool for the WIA Dislocated Workers are identical
to the pool for the WIA Adults.
Table 4.1 Descriptive Statistics for WIA Dislocated Worker Treatment Group and Comparison Group
Universe 2010/2011 2012/2013
Characteristics
WIA Dislocated Workers
Wagner Peyser
WIA Dislocated Workers
Wagner Peyser
Demographics Female 43.7%†† 43.2%†† 40.9% 44.3% Race: White 77.3% 64.9% 76.4% 62.7% Black 4.1% 6.7% 6.1%†† 6.4%†† Hispanic 6.6% 14.2% 7.0% 13.2% Other race 9.1% 8.1% 7.9%†† 8.3%†† Missing 2.8% 6.0% 2.5% 9.3% Mean, age at registration 44.3 39.7 44.7 36.2 Employed at registration 5.7% 12.7% 5.4% 10.8% Disability 3.9% 5.3% 3.9% 5.1% Veteran 11.1% 9.9% 0.5% 8.6% West WA 76.4% 60.4% 76.3% 60.9% Urban county 51.0% 44.3% 50.5% 46.0% UI Benefits (prior to registration) Quarter 1 $2,857 $1,180 $2,973 $125 Quarter 2 $1,906 $1,172 $2,141 $88 Quarter 3 $1,117 $962 $1,637 $76 Quarter 4 $809 $763 $1,333 $68 Employment and Earnings (prior to registration) Percentage of prior quarters employed 82.6% 70.7% 79.7% 68.7% Average quarterly earningsa $9,516 $5,978 $8,915 $6,281 Mean, earnings trendb −$4.3†† −$5.5†† $12.7 $118.5 Mean, earnings varianceb (in 106$) $29.9 $19.5 $29.6 $14.3 Job turnover 18.6% 19.3% 19.3% 12.9% Percentage of quarters with multiple jobs 11.4% 14.9% 11.2% 11.8% Had earnings dip 65.7% 57.7% 64.9% 28.1% Mean, number of quarters since dip at registrationa 1.9 2.4 2.0 0.9 Average earnings dip size in percentagea 52.1% 44.2% 52.1% 19.1% Sample Size 3,760 331,268 3,057 178,493 NOTE: All differences in means are statistically significant at the 0.05 level (t-test) unless otherwise denoted. Monetary data in 2014 $. Prior employment and earnings variables are defined in Chapter 3 (pp. 24-25). aAverages include observations with values of zero. bTrend and variance calculations include quarters with zero earnings, if any. ††Differences in means are not statistically significant at 0.05 level (t-test).
The populations are different in their demographic characteristics. Not surprisingly, the
dislocated workers are older than the Wagner Peyser registrants, averaging about 44 years old
compared to about 40 and 36 in the 2010/2011 and 2012/2013 cohorts respectively. They are less
likely to be a minority, less likely to have a (self-reported) disability, are more likely to be a

W.E. Upjohn Institute for Employment Research 43
Net Impact and Benefit-Cost Estimates of the Workforce Development System in Washington State
veteran, and more likely to reside in West Washington and in an urban county. In terms of their
labor market histories, the dislocated workers have higher levels of prior employment and
average quarterly earnings. They are much more likely to have experienced a dip in earnings,
and the size of their earnings dip is significantly greater. On the other hand, their average
earnings trend is lower and variance in prior earnings is higher.
Participation Model
Table 4.2 provides the results from the logit estimation of participation. More precisely,
the individuals who had registered for Wagner Peyser services (but who had not received
employment and training services in the Washington workforce development system) were
pooled with the WIA Dislocated Worker clients who had exited, and participation was a dummy
variable equal to 1 for the latter group (and 0 for the former). The independent variables used in
the model were identical to those used in the model of WIA Adult program participation as
described in the preceding chapter with one exception. Unemployment Insurance benefits
amounts in the four quarters prior to enrollment were added after the original predicted
propensity score failed to find good matches. The table provides the logit coefficient estimates
and standard errors.
As we noted in chapter 3, the model is not really a formal model of participation, and the
magnitudes of the coefficients are not particularly meaningful, but their signs and statistical
significance are. If the coefficient is positive, then a change in that independent variable will
increase the likelihood of being a WIA Dislocated Worker. If the coefficient is negative, then a
(positive) change in that variable will decrease the likelihood of being a WIA Dislocated Worker
participant.

W.E. Upjohn Institute for Employment Research 44
Net Impact and Benefit-Cost Estimates of the Workforce Development System in Washington State
Table 4.2 Coefficient Estimates from a Logit Model of Participation in WIA Dislocated Worker Program 2010/2011 2012/2013 Characteristics Coefficient Standard Error Coefficient Standard ErrorDemographics Female 0.259*** 0.038 −0.097* 0.047 Race: (White is omitted category) Black −0.381*** 0.085 −0.007 0.090 Hispanic −0.368*** 0.071 −0.137 0.082 Other −0.054 0.059 −0.192* 0.078 Missing −0.504*** 0.100 −0.904*** 0.127 Age at registration 0.010*** 0.002 0.034*** 0.002 Employed at registration −0.680*** 0.071 −0.572*** 0.089 Disability −0.301*** 0.087 0.044 0.105 Veteran 0.086 0.057 −3.621*** 0.269 West WA 0.555*** 0.043 0.733*** 0.053 Urban county −0.243*** 0.038 −0.284*** 0.047 UI Benefits (prior to registration) Quarter 1 (in 103 $) 0.355*** 0.011 0.590*** 0.014 Quarter 2 (in 103 $) −0.082*** 0.013 −0.071*** 0.020 Quarter 3 (in 103 $) −0.111*** 0.015 0.056* 0.022 Quarter 4 (in 103 $) −0.042** 0.014 0.174*** 0.019 Employment and Earnings (prior to registration) Percentage of prior quarters employed 0.009*** 0.001 −0.003* 0.001 Average quarterly earningsa (in 102 $) 0.001* 0.000 −0.002*** 0.000 Earnings trendb (in 102 $) −0.010* 0.004 0.006** 0.002 Earnings varianceb (in 108 $) −0.121*** 0.036 −0.060 0.044 Job turnover 0.027*** 0.002 0.030*** 0.001 Percentage of quarters with multiple jobs −0.017*** 0.002 −0.015*** 0.002 Had earnings dip 0.684*** 0.088 0.848*** 0.106 Number of quarters since dip at registration −0.137*** 0.012 −0.062*** 0.015 Earnings dip size in percentage −0.935*** 0.098 −0.623*** 0.120 Constant −6.920*** 0.187 −7.385*** 0.240 Observations 335,028 181,550 NOTE: Model also includes dummy variables for sector of most recent employment (22 categories). a Average includes quarters with values of zero, if any. b Trend and variance calculations include quarters with zero earnings, if any. *,**,*** indicate statistical significance at p = 0.05, 0.01, and 0.001, respectively.
In the model, the following demographic variables are positively associated with being in
the treatment group at a statistically significant level (i.e., a WIA Dislocated Worker exiter) in
both years of data: age and being from western Washington. The following demographic
variables are negatively associated with being in the treatment group: being Hispanic or Black,
having the race variable missing (white is the omitted category), and residing in an urban county.
Among the labor market variables, the following are negatively related to participation in the
WIA Dislocated Worker program: the percentage of quarters with multiple jobs, the mean of the
earnings variance, average number of quarters since experiencing an earnings dip, and the

W.E. Upjohn Institute for Employment Research 45
Net Impact and Benefit-Cost Estimates of the Workforce Development System in Washington State
average size of the earnings dip. The only labor market variables that are positively associated
with dislocated worker program participation are job turnover and having experienced an
earnings dip. The other variables in the table either have insignificant coefficients or “flip” signs
between the two cohorts.
Propensity Score Statistics
The propensity score for an observation is the predicted probability using the estimated
coefficients and the observation’s actual data. If the logit model has substantial predictive
capability, then the mean propensity score for the comparison group should be small (near zero)
and should be much less than the mean score for the treatment. As argued earlier, a measure of
how well the logit model discriminates between comparison group members and treatment group
members is the cumulative percentile for the comparison group at the propensity score that is the
20th percentile; a value of approximately 80 indicates a “good model.” Table 4.3 provides these
indicators for the WIA Dislocated Worker analyses. There is a large difference in the means,
although the difference for the 2010/2011 cohort is not as great as expected. The mean
propensity scores for the treatment groups are between 0.039 and 0.224, whereas they are 0.011
and 0.013 for the comparison pool in 2010/2011 and 2012/2013, respectively. The 20th
percentile indicators are reasonably large, achieving the 80 percent threshold in the 2012/2013
cohort.
Table 4.3 Indicators of Propensity Score (p-score) Model Quality for WIA Dislocated Worker AnalysesStatistic 2010/2011 2012/2013
Mean p-score, WIA Dislocated Worker 0.039 0.224
Mean p-score, Wagner Peyser 0.011 0.013 Percentile Wagner Peyser, at 20th percentile WIA
Dislocated Worker 63.4% 86.9%

W.E. Upjohn Institute for Employment Research 46
Net Impact and Benefit-Cost Estimates of the Workforce Development System in Washington State
Statistical Match
The statistical matching that was done used a “nearest neighbor” approach with the
propensity score. For every observation j in T, we found the observation k in U that minimized
the absolute value of the difference between the propensity score for j and k. We then added k to
the comparison group sample. The statistical match was done with a caliper, but also with
replacement, so some observations in U were the “matches” for more than one observation in the
treatment group and were duplicated in the match comparison set. Table 4.4 provides data about
the sample sizes, number of matched observations that were duplicates, and a comparison of
descriptive statistics between the treatment group and constructed comparison group. As with the
analysis of the adult title of WIA, we had a relatively small percentage of the matches with
multiple copies of the comparison group record—only 95 in the 2010/2011 analysis and about
400 in the 2012/2013 analysis, which had a smaller treatment group. Notice that means for the
comparison group are quite close to the treatment group as would be expected indicating that the
treatment and comparison group populations are well-balanced. Only a few variables had a
difference in means that is significant.
Balance
As noted in chapter 2, one way to test for balance between the treatment and matched
comparison group is by examining the Cohen d statistics, or standardized difference in means. A
well-balanced matching group will have d < 0.25. Figure 4.1 shows this test graphically for the
WIA dislocated worker sample. The top graph is for the 2010/2011 cohort and the bottom is for
the 2012/2013 cohort. In the figures, the standardized difference in means for each variable used
in the match using the entire matching pool sample (i.e., Wagner Peyser data) and the treatment
sample is shown with the heavy black dots. The same statistic using the matched sample is

W.E. Upjohn Institute for Employment Research 47
Net Impact and Benefit-Cost Estimates of the Workforce Development System in Washington State
Table 4.4 Matching Algorithm Statistics and Post-Match Comparison of Characteristics for WIA Dislocated
Worker Analyses 2010/2011 2012/2013
Statistic/Characteristic
WIA Dislocated Workers Wagner Peyser
WIA Dislocated Workers Wagner Peyser
Sample size 3,760 333,317 3,057 179,587Sample size used in match 3,760 331,268 3,057 178,493Matched sample size 3,751 3,751 3,042 3,042Number of observations used once --- 3,558 --- 2,069Number of observations used multiple times --- 95 --- 395Maximum number of repeats --- 3 --- 7Demographics Female 43.7% 43.7% 40.7% 40.7% Race: White 77.3%* 78.9%* 76.5% 77.7% Black 4.1% 3.6% 6.0% 5.7% Hispanic 6.6% 6.4% 7.0% 6.5% Other race 9.1% 8.4% 8.0% 7.9% Missing 2.9% 2.7% 2.5% 2.2% Mean, age at registration 44.3** 44.9** 44.7*** 45.6*** Employed at registration 5.8% 6.1% 5.4% 5.6% Disability 3.9% 3.4% 3.9% 4.4% Veteran 11.1% 11.1% 0.5% 0.4% West WA 76.4% 77.2% 76.1% 75.0% Urban county 50.9% 50.8% 50.3%** 47.8%**UI Benefits (prior to registration) Quarter 1 $2,845 $2,863 $2,948 $2,758 Quarter 2 $1,908 $1,979 $2,112** $1,881** Quarter 3 $1,120 $1,164 $1,606*** $1,468*** Quarter 4 $811 &875 $1,306** $1,243**Employment and Earnings (prior to registration) Percentage of prior quarters employed 82.6%** 81.4%** 79.8%*** 77.8%*** Average quarterly earningsa $9,495 $9,323 $8,908*** $8,401*** Mean, earnings trendb $0.3 -$4.4 $13.6 $5.1 Mean, earnings varianceb (in 106 $) $29.7 $28.8 $29.5 $27.9 Job turnover 18.6% 18.2% 19.3%*** 21.0%*** Percentage of quarters with multiple jobs 11.5% 11.1% 11.2% 11.5% Had earnings dip 65.7% 64.8% 64.8% 66.0% Mean, number of quarters since dip at registrationa 1.9 1.8 2.0 2.0 Average earnings dip size in percentagea 52.1% 51.4% 51.9% 52.3%Sample Size 3,751 3,751 3,042 3,042NOTE: Monetary values in 2014 $. Statistically significant difference in means denoted by *, **, ***. * p < 0.10; ** p < 0.05; *** p < 0.01 (two-tailed test). – means not applicable. a Averages include observations with values of zero. b Trend and variance calculations include quarters with zero earnings, if any.
shown with “x’s.” The vertical lines are drawn at +/− 0.10. The figures show visually how the
bias is reduced by matching. No variates are outside of the 0.10 bound in both cohorts.
Net Impacts
One of the major purposes of the study was to estimate the net impacts of the education
and training programs on clients. Tables 4.5 and 4.6 provide the estimated net impacts for the

W.E. Upjohn Institute for Employment Research 48
Net Impact and Benefit-Cost Estimates of the Workforce Development System in Washington State
Figure 4.1 Standardized Difference in Means, Pre- and Post-match, WIA Dislocated Workers
NOTE: Standardized difference in means between comparison group pool and treatment group denoted by dot. Standardized difference in means between matched comparison group and treatment group denoted by x. Red vertical lines at +/− 0.10.
WIA Dislocated Workers for the two cohorts. The first table displays the short-term (3 quarters
after exit) and the longer-term (9-12 quarters after exit) outcomes for the 2010/2011
-20 0 20 40 60
Standardized % bias across covariates
hispanicemployedpctqmjob
time_since_dipmissrace
blackdisabledturnover
earn_trendfem
othracevet
urbanhad_earnings_dip
earn_varearn_dippct
westage_start
pctemployedearn_mean
-50 0 50 100
Standardized % bias across covariates
vetmissracehispanic
employedearn_trend
femdisabled
pctqmjobblack
othraceurban
earn_varwest
pctemployedearn_mean
turnovertime_since_dip
age_starthad_earnings_dip
earn_dippct

W.E. Upjohn Institute for Employment Research 49
Net Impact and Benefit-Cost Estimates of the Workforce Development System in Washington State
Table 4.5 Net Impact Estimates for WIA Dislocated Worker Program for 2010/2011 Cohort
Matched Sample
Estimator Comparison Group Means Average
Treatment Effect
Full Sample Matched Sample
Outcome With 0 W/O 0 With 0 W/O 0 Employment (percentage points)a Short term 13.0*** 54.2 -- 55.2 -- Ever-employed, longer term 5.4*** 64.9 -- 66.4 -- Percent of quarters, longer term 7.4*** 55.2 -- 57.9 -- Percent of quarters, longer term, diff-in-diff 5.2*** −7.6 -- −20.6 -- Hourly wage Short term ($) 3.35*** 9.93 18.08 11.72 21.04 Short term, diff-in-diff ($) 3.86*** −3.79 −2.46 −9.82 −4.93 Longer term (4-quarter average) ($) 2.30*** 10.78 18.92 13.13 22.10 Longer term, diff-in-diff ($) 2.82*** −2.94 −1.62 −8.41 −4.44 Quarterly hours Short term 84.2*** 206.1 375.3 218.6 392.4 Short term, diff-in-diff 52.0*** −39.1 13.0 −121.9 −18.0 Longer term (4-quarter average) 54.7*** 226.4 378.8 248.3 402.6 Longer term, diff-in-diff 22.5*** −18.9 19.9 −92.1 −7.4 Quarterly earnings Short term ($) 1,881*** 3,810 6,937 4,760 8,547 Short term, diff-in-diff ($) 1,683*** −1,668 −774 −4,688 −2,302 Longer term (4-quarter average) ($) 1,455*** 4,491 7,437 5,714 9,187 Longer term, diff-in-diff ($) 1,256*** −988 −246 −3,734 −1,921 Unemployment Insurance Benefits Percent receiving, short term −20.1*** 24.3 -- 34.2 -- Benefits, short term ($) −921*** 788 3,242 1,369 3,994 Ever-received, longer term −1.4 15.0 -- 16.7 -- Benefits, longer term (4-quarter average) ($) 40** 171 2,016 225 2,308 NOTE: Monetary data in 2014 $. Sample sizes differ for virtually every entry in the table because of observations with missing data. If there were no missing data, the sample sizes would be those displayed in row 3 of Table 4.4. * significant at the 0.10 level; ** significant at the 0.05 level; *** significant at the 0.01 level (two-tailed test). -- means not applicable. a Short term employment is defined as having more than $100 in quarterly earnings in the 3rd quarter after exit. Ever-employed, longer term is defined as having more than $100 in any quarter from the 9th to the 12th quarter after exit. Percent of quarters, longer-term takes on values of 0%, 25%, 50%, 75%, or 100% for an observation depending on whether the observation was employed for 0, 1, 2, 3, or 4 quarters between the 9th and 12th quarter after exit.
cohort of program exiters. The second table is limited to the short-term net impacts for the
2012/2013 cohort. The first column in each of the tables presents the net impact estimate, which
is the average treatment effect. The final columns of the tables provide the means of the
comparison group, both the full comparison group pool and the matched comparison group.
These columns are provided so that the net impacts can be estimated on a percentage basis.

W.E. Upjohn Institute for Employment Research 50
Net Impact and Benefit-Cost Estimates of the Workforce Development System in Washington State
Table 4.6 Net Impact Estimates for WIA Dislocated Worker Program for 2012/2013 Cohort
Matched Sample
Estimator Comparison Group Means Average
Treatment Effect
Full Sample Matched Sample
Outcome With 0 W/O 0 With 0 W/O 0 Employmenta Short term 10.0*** 60.7 -- 60.0 -- Hourly wage Short term ($) 1.99*** 11.47 18.69 12.84 21.19 Short term, diff-in-diff ($) 2.97*** −2.96 −1.52 −7.16 −5.07Quarterly hours Short term 73.5*** 236.8 386.0 234.3 386.7 Short term, diff-in-diff 46.4*** −30.7 −0.1 −68.1 9.7 Quarterly earnings Short term ($) 1,453*** 4,555 7,426 5,053 8,340 Short term, diff-in-diff ($) 1,218*** −1,764 −973 −3,207 −1,901 Unemployment Insurance Benefits Percent receiving, short term −3.7*** 9.7 -- 14.5 -- Benefits, short term ($) −76** 205 2,121 373 2,577 NOTE: Monetary data in 2014 $. Sample sizes differ for virtually every entry in the table because of observations with missing data. If there were no missing data, the sample sizes would be those displayed in row 3 of Table 4.4. * significant at the 0.10 level; ** significant at the 0.05 level; *** significant at the 0.01 level (two-tailed test). -- means not applicable. a Short term employment is defined as having more than $100 in quarterly earnings in the 3rd quarter after exit.
The longer-term impacts displayed in Table 4.5 show that the Dislocated Worker
program engenders quite substantial net impacts on average. Employment is up by over 7
percentage points, hourly wages are up by $2.30, and average hours worked per quarter is up by
almost 55 hours. Since employment, wage rates, and hours are increased, average quarterly
earnings are also increased by almost $1,500 (2014$). The receipt of unemployment insurance is
decreased, although the net impact on benefit levels is positive.
The results in Tables 4.5 and 4.6 show that for exiters in the short term, the WIA
Dislocated Worker clients increase their employment rates, average hourly wages, and hours of
work. The significant increases in employment, wage rates, and hours worked combine to yield a
substantial increase in quarterly earnings of almost $1,900 for the 2010/2011 cohort and over
$1,450 for the 2012/2013 cohort, which represents impacts of about 22 and 17 percent,
respectively. In both cohorts, the short-term net impact estimators show a decrease in the take-up
of unemployment insurance benefits. In the earlier cohort, this decrease is especially large.

W.E. Upjohn Institute for Employment Research 51
Net Impact and Benefit-Cost Estimates of the Workforce Development System in Washington State
As noted earlier, our preferred estimate for the short-term net impacts is the average of
the short-run impacts from Tables 4.5 and 4.6. These are presented in Table 4.7. The results in
this table suggest that in the short term, the WIA Dislocated Worker program have large and
significant positive effects on employment and earnings. The short-term net impact estimators
from both cohorts are larger than the longer-term net impacts, so of course, their average is
larger. In short, our estimates suggest that this program has large and significant labor market
impacts that are still large, but somewhat attenuated, in the longer-term.
Table 4.7 Short-Term Net Impact Estimates for WIA Dislocated Worker Program
2010/2011 Estimator
2012/2013 Estimator Average
Employmenta Short term 13.0*** 10.0*** 11.5*** Hourly wage Short term ($) 3.35*** 1.99*** 2.67*** Short term, diff-in-diff ($) 3.86*** 2.97*** 3.42*** Quarterly hours Short term 84.2*** 73.5*** 78.9*** Short term, diff-in-diff 52.0*** 46.4*** 49.2*** Quarterly earnings Short term ($) 1,881*** 1,453*** 1,667*** Short term, diff-in-diff ($) 1,683*** 1,218*** 1,450*** Unemployment Insurance Benefits Percent receiving, short term −20.1*** −3.7*** −11.9*** Benefits, short term ($) −921*** −76** −499*** NOTE: Monetary data in 2014 $. * significant at the 0.10 level; ** significant at the 0.05 level; *** significant at the 0.01 level (two-tailed test). aShort term employment is defined as having more than $100 in quarterly earnings in the 3rd quarter after exit.
Figures 4.2 and 4.3 present the net impacts on earnings and employment for each quarter
after exit for 15 quarters for the 2010/2011 cohort and for 7 quarters for the 2012/2013 cohorts,
respectively. The shaded portion of the graphs are the 95 percent confidence limits on the net
impact estimates. Again, note that the employment impacts graphed in Figure 4.2 do not track
precisely with the estimates in Table 4.5.

W.E. Upjohn Institute for Employment Research 52
Net Impact and Benefit-Cost Estimates of the Workforce Development System in Washington State
Figure 4.2 Estimated Net Impacts on Earnings (top) and Employment (bottom) of WIA Dislocated Worker Program, by Quarter after Exit, 2010/2011 Cohort
NOTE: Earnings impacts are measured in 2014 $. Employment impacts are measured in percentage points. ATET means average treatment effect on the treated (defined in text).
0
1000
2000
3000
4000
1 2 3 4 5 6 7 8 9 10 11 12 13 14 15Quarter after Exit
ATET
0
5
10
15
20
25
1 2 3 4 5 6 7 8 9 10 11 12 13 14 15Quarter after Exit
ATET

W.E. Upjohn Institute for Employment Research 53
Net Impact and Benefit-Cost Estimates of the Workforce Development System in Washington State
Figure 4.3 Estimated Net Impacts on Earnings (top) and Employment (bottom) of WIA Dislocated Worker Program, by Quarter after Exit, 2012/2013 Cohort
NOTE: Earnings impacts are measured in 2014 $. Employment impacts are measured in percentage points. ATET means average treatment effect on the treated (defined in text).
Subgroup Analyses
About 70 percent of the WIA dislocated worker participants are coded in the
administrative data as having received training. Tables 4.8 and 4.9 display the net impact
estimates for that subgroup along with the estimates for the subgroup that did not receive
training. In the subgroup analyses for WIA Adults presented in chapter 3, we showed 1) that the
0
1000
2000
3000
4000
1 2 3 4 5 6 7Quarter after Exit
ATET
0
5
10
15
20
25
1 2 3 4 5 6 7Quarter after Exit
ATET

W.E. Upjohn Institute for Employment Research 54
Net Impact and Benefit-Cost Estimates of the Workforce Development System in Washington State
short-term and longer-term net impacts for individuals with training were more positive than the
net impacts for participants who did not get training, 2) that the longer-term net impacts for
individuals who had been trained were smaller in magnitude than the short-term impacts, and 3)
that the differentials between trained and non-trained individuals were much larger in the longer-
term than in the short term. This suggested a substantial payoff to training take grew over time.
Table 4.8 Selected Longer-Term Net Impact Estimates for Subgroups of WIA Dislocated Worker
Participants: 2010/2011 Cohort
Outcome
Subgroup Matched Comparison
Group Mean Participants who did not
receive training Participants with
training Employment 6.3%** 7.8%** 57.9% Hourly Wage $2.97*** $2.08*** $13.13 Hours Worked (quarterly) 47.8** 57.0*** 248.3 Earnings (quarterly) $1,721*** $1,367*** $5,714 UI Receipt −1.1%*** −1.6%*** 16.7% UI Benefits (quarterly) $14*** $49*** 225 Subgroup Sample Size 932 2,819 — NOTE: Outcomes shown in the table are the preferred outcomes that are “boxed” in table 4.5. Monetary data in 2014 $. * significant at the 0.10 level; ** significant at the 0.05 level; *** significant at the 0.01 level (two-tailed test). – means not applicable. Table 4.9 Selected Short-Term Net Impact Estimates for Subgroups of WIA Dislocated Worker Participants:
2012/2013 Cohort
Outcome
Subgroup Matched Comparison Group Mean
Participants who did not receive training
Participants with training
Employment 7.7%*** 11.0%*** 60.0% Hourly Wage $2.56*** $1.73*** $12.84 Hours Worked (quarterly) 50.7*** 83.6*** 234.3 Earnings (quarterly) $1,438*** $1,460*** $5,053 UI Receipt −1.4%*** −4.7%*** 14.5% UI Benefits (quarterly) $37*** −$127*** $373 Subgroup Sample Size 936 2,106 — NOTE: Outcomes shown in the table are the preferred outcomes that are “boxed” in table 4.6. Monetary data in 2014 $. * significant at the 0.10 level; ** significant at the 0.05 level; *** significant at the 0.01 level (two-tailed test). – means not applicable.
A somewhat similar picture is painted in the tables for dislocated workers. Unlike WIA
Adults, the short-term net impacts are very similar for participants who did and who did not
receive training services. However, just like WIA Adults, the labor market impacts were smaller
in the longer-term than in the short-term, the longer-term net impacts were larger in magnitude

W.E. Upjohn Institute for Employment Research 55
Net Impact and Benefit-Cost Estimates of the Workforce Development System in Washington State
for the participants that received training services, and obviously then, the differentials between
trained and non-trained dislocated workers were larger in the longer-term than in the short-term.
The bottom line is that, as with WIA Adults, training seems to result in positive outcomes for
Dislocated Worker participants, although the advantage doesn’t appear until the longer-term.

W.E. Upjohn Institute for Employment Research 56
Net Impact and Benefit-Cost Estimates of the Workforce Development System in Washington State

W.E. Upjohn Institute for Employment Research 57
Net Impact and Benefit-Cost Estimates of the Workforce Development System in Washington State
5 WIA YOUTH PROGRAM
The Workforce Investment Act (WIA) youth program prepared low-income youth ages
14 to 21 for academic and employment success. Youth were assessed to determine academic,
skill level, and support service needs. Staff members of the local workforce investment area
worked with each young person to develop a plan that may have encompassed counseling,
tutoring, job training, mentoring, or work experience. Other strategies included summer
employment, study skills training, or basic skills instruction in preparation for obtaining a GED.
Youth ages 18 to 21 may have been co-enrolled in WIA Adult programs. At least 30 percent of
the funding was to be used to provide activities for out-of-school youth.
To participate, youth must be low income (TANF or Food Stamp recipient, homeless, or
family income below 70 percent of the lower living standard income level) and must have an
educational deficiency.
Participant Characteristics
Table 5.1 provides descriptive data that compare the individuals in the treatment group to
those in the comparison group pool. The first two columns of numbers compare the WIA Youth
clients who exited in 2010/2011 to individuals under 22 who registered for Wagner Peyser (WP)
services in the same year (except that individuals who were served by Washington’s education
and training programs were removed from the data). The final two columns compare the WIA
Youth program exiters in 2012/2013 to WP exiters in the same year.
The populations are dissimilar. In particular, the WIA Youth are younger (from one to
two years on average), are more likely to be female, and are more likely to be from an urban
county and from western Washington than the WP registrants. The WIA youth have less

W.E. Upjohn Institute for Employment Research 58
Net Impact and Benefit-Cost Estimates of the Workforce Development System in Washington State
employment and earnings prior to registration: lower prior employment rates, lower average
quarterly earnings, a lower trend in prior earnings, and more turnover. The WIA Youth exiters
have $1,000 less in average quarterly earnings prior to registration than the WP registrants (who
are also youthful). In short, compared to the entire Wagner Peyser group of individuals, the WIA
Youth seem to have much less human capital in the form of prior employment.
Table 5.1 Descriptive Statistics for WIA Youth Treatment Group and Comparison Group Universe 2010/2011 2012/2013
Characteristics WIA YouthWagner Peyser WIA Youth
Wagner Peyser
Demographics Female 53.0% 47.7% 52.0% 45.1% Race: White 51.4%†† 51.8%†† 49.8% 53.2% Black 13.3% 6.4% 12.5% 6.4% Hispanic 22.1%†† 23.6%†† 22.4%†† 21.1%†† Other race 12.3% 6.5% 12.7% 6.5% Missing 0.8% 11.8% 2.6% 12.9% Mean, age at registration 18.3 20.1 18.5 19.6 Employed at registration 5.7% 11.7% 5.3% 10.4% Disability 13.5% 2.7% 10.5% 2.9% Veteran 0.2% 2.0% 0.0% 2.8% West WA 61.6% 50.2% 61.3% 48.9% Urban county 46.1% 30.9% 47.0% 32.0% Employment and Earnings (prior to registration) Percentage of prior quarters employed 27.0% 48.8% 20.6% 50.3% Average quarterly earningsa $404 $1,376 $324 $1,515 Mean, earnings trendb −$30.2 $46.5 −$15.0 $126.3 Mean, earnings varianceb (in 106 $) $0.5 $2.7 $0.5 $2.4 Job turnover 32.8% 17.6% 27.7% 15.2% Percentage of quarters with multiple jobs 4.5% 12.4% 3.4% 11.5% Had earnings dip 32.3% 46.7% 23.4% 29.1% Mean, number of quarters since dip at registrationa 1.1 2.0 0.8 1.0 Average earnings dip size in percentagea 28.9% 37.2% 21.0% 23.2% Sample Size 1,871 35,101 1,994 41,525 NOTE: All differences in means are statistically significant at the 0.05 level (t-test) unless otherwise denoted. Monetary data in 2014 $. Prior employment and earnings variables are defined in Chapter 3 (pp. 24-25). aAverages include observations with values of zero. bTrend and variance calculations include quarters with zero earnings, if any. ††Differences in means are not statistically significant at 0.05 level (t-test).
Participation Model
Table 5.2 provides the results from the logit estimation of program participation. Again,
the estimation occurs for populations of individuals who had registered for Wagner Peyser

W.E. Upjohn Institute for Employment Research 59
Net Impact and Benefit-Cost Estimates of the Workforce Development System in Washington State
services (but who had not received employment and training services in Washington) and the
WIA Youth clients who had exited. The latter have a dummy variable equal to 1 (as opposed to
0 for the former). The table provides the logit coefficient estimates and standard errors. The
magnitudes of the coefficients are not particularly meaningful, but the sign and statistical
significance are. If the coefficient is negative, then a (positive) change in that variable will
decrease the likelihood of being a WIA participant.
Table 5.2 Coefficient Estimates from a Logit Model of Participation in WIA Youth Program 2010/2011 2012/2013 Characteristics Coefficient Standard Error Coefficient Standard ErrorDemographics Female 0.136* 0.058 0.145** 0.052 Race: (White is omitted category) Black 0.246** 0.095 0.226** 0.086 Hispanic −0.090 0.077 0.137* 0.070 Other 0.422*** 0.095 0.452*** 0.084 Missing −2.859*** 0.274 −1.610*** 0.148 Age at the start of the program −0.725*** 0.021 −0.277*** 0.016 Employed at registration −0.149 0.118 −0.552*** 0.112 Disability 1.520*** 0.098 1.072*** 0.091 West WA 0.337*** 0.068 0.407*** 0.060 Urban county 0.673*** 0.067 0.652*** 0.060 Employment and Earnings (prior to registration) Percentage of prior quarters employed −0.016*** 0.002 −0.025*** 0.002 Average quarterly earningsa (in 102 $) 0.012** 0.004 0.005 0.004 Earnings trendb (in 102 $) −0.053*** 0.014 −0.051*** 0.009 Earnings varianceb (in 108 $) −16.154*** 2.755 −12.586*** 2.171 Job turnover 0.056*** 0.002 0.052*** 0.001 Percentage of quarters with multiple jobs −0.032*** 0.003 −0.034*** 0.003 Had earnings dip 0.015 0.273 −0.229 0.286 Number of quarters since dip at registration −0.208*** 0.024 −0.084** 0.027 Earnings dip size in percentage 0.015 0.266 −0.213 0.281 Constant 10.051*** 0.421 2.031*** 0.330 Observations 36,972 43,519 NOTE: Model also includes dummy variables for sector of most recent employment (22 categories). a Average includes quarters with values of zero, if any. b Trend and variance calculations include quarters with zero earnings, if any. *,**,*** indicate statistical significance at p = 0.05, 0.01, and 0.001, respectively.
The following demographic variables are significantly correlated with being in the
treatment group (i.e., a WIA participant) in both years of data: being female, being a
nonHispanic minority, having a disability, residing in an urban county, and being from western
Washington. Among the demographic variables, the only covariate that is negatively associated

W.E. Upjohn Institute for Employment Research 60
Net Impact and Benefit-Cost Estimates of the Workforce Development System in Washington State
with participation is age. Among the prior labor force variables, the two variables that are
positively related to participation are job turnover and prior earnings (the latter is not significant
in the 2012/2013 cohort). Most of the prior labor force variables are negatively related to
participation: prior employment percentage, prior earnings trend and variance, and number of
quarters since earnings dip.
Propensity Score Statistics
The propensity score for an observation is the predicted probability using the estimated
coefficients and the observation’s actual data. If the logit model has substantial predictive
capability, then the mean propensity score for the comparison group should be small (near zero)
and should be much less than the mean score for the treatment. The mean p-score for the
treatment group is 0.336 in 2010/2011, which is over several times larger than the mean for the
comparison pool—0.035. For the 2012/2013 data, the difference is also substantial, 0.229 to
0.037. As argued earlier, a measure of how well the logit model discriminates between
comparison group members and treatment group members is the cumulative percentile for the
comparison group at the propensity score that is the 20th percentile. Table 5.3 provides these
data for the WIA Youth analyses. These indicators are right around 80 percent suggesting that
the model satisfactorily discriminates.
Table 5.3 Indicators of Propensity Score (p-score) Model Quality for WIA Youth Analyses Statistic 2010/2011 2012/2013
Mean p-score, WIA Youth 0.336 0.229
Mean p-score, Wagner Peyser 0.035 0.037
Percentile Wagner Peyser, at 20th percentile WIA Youth 84.3% 77.5%

W.E. Upjohn Institute for Employment Research 61
Net Impact and Benefit-Cost Estimates of the Workforce Development System in Washington State
Statistical Match
The statistical matching algorithm uses a nearest neighbor approach with the propensity
score. For every observation j in T, we find the observation k in U that minimizes the absolute
value of the difference between the propensity score for j and k. We then add k to the comparison
group sample as long as it is within the length of the caliper. The statistical match is done with
replacement, so some observations in U are the “matches” for more than one observation in the
treatment group and are duplicated. Table 5.4 provides data about the sample sizes, number of
matched observations that are duplicates, and a comparison of descriptive statistics between the
treatment group and constructed comparison group. Duplication occurred quite a bit in the
statistical matches for this program. In the 2010/2011 and 2012/2013 matches, over 25 percent of
the records used in the match had multiple observations.
Balance
In general, the statistical matches for this program were not as close in terms of
characteristics as most of the other matches and thus the distributions are not as well balanced. In
the 2010/2011 analysis, three characteristics displayed in the data have means that are
statistically different from each other, and in the 2012/2013 match, there are four. It is likely that
restricting the comparison group to individuals under the age of 22 limited the sample size of the
comparison group pool substantially, and thus made it more difficult to find close matches. In
fact, comparing the third row of the table to the second row shows that one to three percent of the
matches were deleted because they were not within a caliper width. Figure 5.1 shows the
standardized difference in means, and unlike the equivalent figures in the prior two chapters,
here a number of variates are outside of the +/− 0.10 limits.

W.E. Upjohn Institute for Employment Research 62
Net Impact and Benefit-Cost Estimates of the Workforce Development System in Washington State
Table 5.4 Matching Algorithm Statistics and Post-Match Comparison of Characteristics for WIA Youth Analyses
2010/2011 2012/2013
Statistic/Characteristic Training Program Wagner Peyser
Training Program Wagner Peyser
Sample size 1,871 35,538 1,994 42,000 Sample size used in match 1,871 35,101 1,994 41,525 Matched sample size 1,583 1,583 1,790 1,790 Number of observations used once --- 508 --- 588 Number of observations used multiple times --- 213 --- 213 Maximum number of repeats --- 29 --- 38 Demographics Female 53.1% 53.1% 52.0% 52.0% Race: White 51.5% 53.0% 50.7% 53.5% Black 12.8% 13.5% 12.3% 12.6% Hispanic 22.7% 20.6% 22.2%** 19.2%** Other race 12.0% 12.2% 11.8% 11.9% Missing 0.9% 0.8% 2.9% 2.8% Mean, age at registration 18.4*** 18.2*** 18.5 18.4 Employed at registration 6.2%*** 4.1%*** 5.3%** 3.8%** Disability 11.7%*** 15.3%*** 10.1% 10.4% Veteran 0.2%* 0.6%* 0.0%*** 1.7%*** Urban county 45.7% 48.4% 46.7% 49.1% West WA 60.7% 62.7% 60.6% 62.8% Employment and Earnings (prior to registration) Percentage of prior quarters employed 25.0%*** 15.2%*** 19.8%*** 15.2%*** Average quarterly earningsa $407*** $252*** $337** $279** Mean, earnings trendb −$15.0 −$2.6 $0.6 $2.4 Mean, earnings varianceb (in 106 $) $0.5*** $0.3*** $0.5* $0.4* Job turnover 22.2%*** 14.2%*** 19.7%*** 14.8%*** Percentage of quarters with multiple jobs 4.9%*** 2.8%*** 3.8%*** 2.8%*** Had earnings dip 28.4%*** 13.8%*** 19.6%*** 13.7%*** Mean, number of quarters since dip at registrationa 1.0*** 0.5*** 0.7*** 0.4*** Average earnings dip size in percentagea 24.7%*** 11.6%*** 17.1%*** 11.6%*** Sample Size 1,583 1,583 1,790 1,790 NOTE: Monetary values in 2014 $. Statistically significant difference in means denoted by *, **, ***. * p < 0.10; ** p < 0.05; *** p < 0.01 (two-tailed test). – means not applicable. a Averages include observations with values of zero. b Trend and variance calculations include quarters with zero earnings, if any.

W.E. Upjohn Institute for Employment Research 63
Net Impact and Benefit-Cost Estimates of the Workforce Development System in Washington State
Figure 5.1 Standardized Difference in Means, Pre- and Post-match, WIA Youth
NOTE: Standardized difference in means between comparison group pool and treatment group denoted by dot. Standardized difference in means between matched comparison group and treatment group denoted by x. Red vertical lines at +/− 0.10.
-100 -50 0 50
Standardized % bias across covariates
age_startearn_mean
pctemployedpctqmjobmissraceearn_var
time_since_diphad_earnings_dip
earn_trendemployed
earn_dippcthispanic
femothrace
westblackurban
disabledturnover
-100 -50 0 50
Standardized % bias across covariates
pctemployedearn_mean
age_startpctqmjobmissrace
earn_trendearn_var
employedhad_earnings_dip
time_since_dipearn_dippct
hispanicfem
blackothrace
westdisabled
urbanturnover

W.E. Upjohn Institute for Employment Research 64
Net Impact and Benefit-Cost Estimates of the Workforce Development System in Washington State
Net Impacts
Tables 5.5 and 5.6 provide the estimated net impacts of the WIA Youth programs on
clients for the two cohorts. As with comparable tables in the prior chapters, the first table
displays the short-term (3 quarters after exit) and the longer-term (9 to 12 quarters after exit)
outcomes for the 2010/2011 cohort of program exiters. The second table is limited to the short-
term net impacts for the 2012/2013 cohort. As with the WIA Dislocated Workers, we use the
levels of the outcome variables as the dependent variable for which we are estimating the net
impact. The final four columns of data in the table provide the means of the dependent variables
Table 5.5 Net Impact Estimates for WIA Youth Program for 2010/2011 Cohort
Matched Sample
Estimator Comparison Group Means Average
Treatment Effect
Full Sample Matched Sample
Outcome With 0 W/O 0 With 0 W/O 0 Employment (percentage points)a Short term 13.5*** 52.9 --- 30.9 --- Ever-employed, longer term 7.2** 69.9 --- 58.2 --- Percent of quarters, longer term 6.7** 56.4 --- 43.4 --- Percent of quarters, longer term, diff-in-diff −6.6** 15.4 --- 37.5 --- Hourly wage Short term ($) 1.40*** 6.58 12.20 3.58 11.22 Short term, diff-in-diff ($) 0.59 1.35 0.47 2.28 0.91 Longer term (4-quarter average) ($) 0.82** 7.74 13.24 5.39 11.86 Longer term, diff-in-diff ($) 0.01 2.50 1.82 4.10 1.52 Quarterly hours Short term 32.7** 175.6 325.3 100.9 316.4 Short term, diff-in-diff 16.5 54.9 80.9 79.9 149.6 Longer term (4-quarter average) 24.3 207.7 330.9 141.0 284.3 Longer term, diff-in-diff 8.2 87.1 96.6 120.0 151.5 Quarterly earnings Short term ($) 363** 2,133 3,951 1,034 3,242 Short term, diff-in-diff ($) 232 645 1,133 796 1,915 Longer term (4-quarter average) ($) 250 2,882 4,530 1,778 3,515 Longer term, diff-in-diff ($) 118 1,394 1,927 1,540 2,348 NOTE: Monetary impacts in 2014 $. Sample sizes differ for virtually every entry in the table because of observations with missing data. If there were no missing data, the sample sizes would be those displayed in row 3 of Table 5.4. * significant at the 0.10 level; ** significant at the 0.05 level; *** significant at the 0.01 level (two-tailed test). -- means not applicable. aShort term employment is defined as having more than $100 in quarterly earnings in the 3rd quarter after exit. Ever-employed, longer term is defined as having more than $100 in any quarter from the 9th to the 12th quarter after exit. Percent of quarters, longer-term takes on values of 0%, 25%, 50%, 75%, or 100% for an observation depending on whether the observation was employed for 0, 1, 2, 3, or 4 quarters between the 9th and 12th quarter after exit.

W.E. Upjohn Institute for Employment Research 65
Net Impact and Benefit-Cost Estimates of the Workforce Development System in Washington State
for the particular outcomes, so that percentage impacts can be calculated. Note that we do not
have UI benefits as an outcome variable for WIA Youth.
In our prior studies, we have usually found negative net impact estimates for WIA Youth.
However, the longer-term and short term net impact estimates shown in Table 5.5 are positive
for employment, hourly wages, hours worked, and earnings (the longer-term estimates for the
latter two are not statistically significant). The short-term net impact results displayed in Table
5.6 for the 2012/2013 cohort are opposite, however, and are more in conformance with the
findings from prior studies. The net impacts shown there are quite negative and statistically
significant. Given the prior negative findings for this population, it may be the case that the
2010/2011 cohort is idiosyncratic.
Table 5.6 Net Impact Estimates for WIA Youth Program for 2012/2013 Cohort
Matched Sample
Estimator Comparison Group Means Average
Treatment EffectFull Sample Matched Sample
Outcome With 0 W/O 0 With 0 W/O 0 Employmenta Short term −10.6** 62.5 59.4 Hourly wage Short term ($) −2.24*** 8.84 13.92 7.73 12.93 Short term, diff-in-diff ($) −1.70*** 3.45 2.62 5.86 2.84 Quarterly hours Short term −57.8*** 223.2 351.4 198.7 332.4 Short term, diff-in-diff −51.8** 98.6 113.7 166.2 192.0 Quarterly earnings Short term ($) −1,154*** 3,191 5,025 2,697 4,512 Short term, diff-in-diff ($) −921*** 1,619 2,381 2,214 3,078 NOTE: Monetary impacts in 2014 $. Sample sizes differ for virtually every entry in the table because of observations with missing data. If there were no missing data, the sample sizes would be those displayed in rows 2 and 3 of Table 5.4. * significant at the 0.10 level; ** significant at the 0.05 level; *** significant at the 0.01 level (two-tailed test). -- means not applicable. aShort term employment is defined as having more than $100 in quarterly earnings in the 3rd quarter after exit.
As noted earlier, our preferred estimate for the short-term net impacts is the average of
the short-run impacts from Tables 5.5 and 5.6. These are presented in Table 5.7. With exception
of employment, the more negative estimates for the 2012/2013 cohort are larger in absolute
value than the short-term estimates for the 2010/2011 cohort, so the average that is shown in the

W.E. Upjohn Institute for Employment Research 66
Net Impact and Benefit-Cost Estimates of the Workforce Development System in Washington State
final column of the table is negative. In short, our (averaged) estimates suggest that this program
has does not provide positive labor market outcomes for youth.
Table 5.7 Short-Term Net Impact Estimates for WIA Youth Program
2010/2011 Estimator
2012/2013 Estimator Average
Employmenta Short term 13.5*** −10.6** 1.5 Hourly wage Short term ($) 1.40*** −2.24*** −0.42 Short term, diff-in-diff ($) 0.59 −1.70*** −1.14*** Quarterly hours Short term 32.7** −57.8*** −12.6 Short term, diff-in-diff 16.5 −51.8** -17.6* Quarterly earnings Short term ($) 363** −1,154*** −395*** Short term, diff-in-diff ($) 232 −921*** −344** NOTE: Monetary data in 2014 $. * significant at the 0.10 level; ** significant at the 0.05 level; *** significant at the 0.01 level (two-tailed test). aShort term employment is defined as having more than $100 in quarterly earnings in the 3rd quarter after exit.
Figures 5.2 and 5.3 present the estimated net impacts on earnings and employment for
each quarter after exit for 15 quarters for the 2010/2011 cohort and for 7 quarters for the
2012/2013 cohorts, respectively. The shaded portion of the graphs are the 95% confidence limits
on the net impact estimates.
Subgroup Analyses
According to the administrative data, training is not as prevalent for WIA Youth as it is
for Adults or Dislocated Workers, but we still find that around 25 percent of exiters are reported
to have received training services. Tables 5.8 and 5.9 display the net impact estimates for that
subgroup along with the estimates for the subgroup that did not receive training. The tables show
that the short-term and longer-term net impacts for individuals with training are more positive
(less negative) than the net impacts for participants who did not get training. In the longer-term
(2010/2011 cohort), the employment and earnings outcomes for the participants with training are
two to three times greater than for all other participants. In the short-term, they are 30 to 0

W.E. Upjohn Institute for Employment Research 67
Net Impact and Benefit-Cost Estimates of the Workforce Development System in Washington State
Figure 5.2 Estimated Net Impacts on Earnings (top) and Employment (bottom) of WIA Youth Program, by Quarter after Exit, 2010/2011 Cohort
NOTE: Earnings impacts are measured in 2014 $. Employment impacts are measured in percentage points. ATET means average treatment effect on the treated (defined in text).
-500
0
500
1000
1 2 3 4 5 6 7 8 9 10 11 12 13 14 15Quarter after Exit
ATET
-10
0
10
20
1 2 3 4 5 6 7 8 9 10 11 12 13 14 15Quarter after Exit
ATET

W.E. Upjohn Institute for Employment Research 68
Net Impact and Benefit-Cost Estimates of the Workforce Development System in Washington State
Figure 5.3 Estimated Net Impacts on Earnings (top) and Employment (bottom) of WIA Youth Program, by Quarter after Exit, 2012/2013 Cohort
NOTE: Earnings impacts are measured in 2014 $. Employment impacts are measured in percentage points. ATET means average treatment effect on the treated (defined in text).
percent less negative. All in all, the results suggest that there is a substantial payoff to training
for WIA Youth.
-2000
-1500
-1000
-500
0
1 2 3 4 5 6 7Quarter after Exit
ATET
-20
-10
0
10
20
1 2 3 4 5 6 7Quarter after Exit
ATET

W.E. Upjohn Institute for Employment Research 69
Net Impact and Benefit-Cost Estimates of the Workforce Development System in Washington State
Table 5.8 Selected Longer-Term Net Impact Estimates for Subgroups of WIA Youth Participants: 2010/2011
Cohort
Outcome
Subgroup Matched Comparison
Group Mean Participants who did not
receive training Participants with
training Employment 5.6%** 10.2%** 43.4% Hourly Wage $0.52** $1.86*** $5.39 Hours Worked (quarterly) 18.6** 43.7** 141.0 Earnings (quarterly) $141** $620** $1,778 Subgroup Sample Size 1,225 358 — NOTE: Monetary data in 2014 $. * significant at the 0.10 level; ** significant at the 0.05 level; *** significant at the 0.01 level (two-tailed test). – means not applicable. Table 5.9 Selected Short-Term Net Impact Estimates for Subgroups of WIA Youth Participants: 2012/2013
Cohort
Outcome
Subgroup Matched Comparison
Group Mean Participants who did not
receive training Participants with
training Employment −11.8%*** −7.4%** 59.4% Hourly Wage −$2.46*** −$1.67*** $7.73 Hours Worked (quarterly) −69.4*** −27.9** 198.7 Earnings (quarterly) −$1,366*** −$611*** $2,697 Subgroup Sample Size 1,288 502 — NOTE: Monetary data in 2014 $. * significant at the 0.10 level; ** significant at the 0.05 level; *** significant at the 0.01 level (two-tailed test). – means not applicable.

W.E. Upjohn Institute for Employment Research 70
Net Impact and Benefit-Cost Estimates of the Workforce Development System in Washington State

W.E. Upjohn Institute for Employment Research 71
Net Impact and Benefit-Cost Estimates of the Workforce Development System in Washington State
6 COMMUNITY AND TECHNICAL COLLEGE WORKFORCE EDUCATION
Workforce education programs represent the applied (non-transfer) training mission of
community and technical colleges (CTCs). Programs prepare individuals to enter a variety of
occupations that don’t require a baccalaureate degree. These programs are open to all high
school graduates or persons over the age of 18. (Persons under 18 who have not completed high
school may be admitted with the permission of their local school district.) Training is offered in
every county of the state on 34 community and technical college campuses and multiple
extension sites.
Participant Characteristics
Table 6.1 provides descriptive data that compare the individuals in the treatment group to
those in the comparison group pool. The comparison group consists of Wagner Peyser (WP)
clients who were 16 to 70 at the time of registration. The individuals who had participated in
other workforce development programs were removed from the data. The first two columns of
numbers compare the community and technical college students in Workforce Education
programs who exited in 2010/201121 to individuals in the comparison group. The final two
columns compare the community and technical college students in 2012/2013 to WP registrants
in the same year.
The populations are dissimilar. The community and technical college students are considerably
younger. The average age of the students when they entered the community and technical college
system is about 31, whereas the average age of the WP registrants when they registered is 36 to
21 In this and the succeeding three chapters that analyze CTC programs, exiters include students who
complete a credential as well as those who exit the system without a credential.

W.E. Upjohn Institute for Employment Research 72
Net Impact and Benefit-Cost Estimates of the Workforce Development System in Washington State
40. Also, there is a much larger percentage of females and much higher percentage of individuals
with other (nonwhite, nonblack, nonHispanic) racial background in the community and technical
college exiter population than in Wagner Peyser registrants. Geographically, the table shows that
CTC Workforce Education students are disproportionately from western Washington and from
urban counties.
Table 6.1 Descriptive Statistics for CTC Workforce Education Treatment Group and Comparison Group
Universe 2010/2011 2012/2013
Characteristics Workforce Education Wagner Peyser
Workforce Education Wagner Peyser
Demographics Female 56.5% 43.2% 55.7% 44.4% Race White 65.5% 64.7% 62.9%†† 62.4%†† Black 6.8%†† 6.7%†† 6.8% 6.4% Hispanic 8.1% 14.4% 8.9% 13.8% Other race 19.4% 8.1% 21.0% 8.2% Missing 0.3% 6.1% 0.4% 9.2% Mean, age at registration 31.0 39.5 30.7 35.7 Disability 6.6% 5.2% 7.3% 5.1% West WA 81.5% 60.3% 81.3% 60.3% Urban county 62.8% 44.1% 63.1% 45.5% Employment and Earnings (prior to registration) Percentage of prior quarters employed 59.0% 70.4% 57.2% 67.6% Average quarterly earningsa $3,335 $5,944 $3,096 $6,152 Mean, earnings trendb $36.6 −$5.5 $42.1 $115.7 Mean, earnings varianceb (in 106 $) $8.8 $19.4 $8.4 $14.0 Job turnover 31.4% 19.2% 31.2% 12.7% Percentage of quarters with multiple jobs 12.8% 14.9% 12.3% 11.6% Had earnings dip 40.5% 57.5% 37.0% 27.9% Mean, number of quarters since dip at registrationa 1.6 2.4 1.4 0.9 Average earnings dip size in percentagea 32.0% 44.1% 29.0% 19.0% Sample Size 34,522 333,316 31,182 182,399 NOTE: All differences in means are statistically significant at the 0.05 level (t-test) unless otherwise denoted. Monetary data in 2014 $. Prior employment and earnings variables are defined in Chapter 3 (pp. 24-25). aAverages include observations with values of zero. bTrend and variance calculations include quarters with zero earnings, if any. ††Differences in means are not statistically significant at 0.05 level (t-test).
The bottom panel of the table shows that the prior employment and earnings experiences
of the two populations are quite different as well. In particular, the community and technical
college participants had lower percentages of quarters with prior employment, much lower
average earnings prior to registration, and more job turnover. The pre-registration average

W.E. Upjohn Institute for Employment Research 73
Net Impact and Benefit-Cost Estimates of the Workforce Development System in Washington State
quarterly earnings levels of Wagner Peyser registrants are over $2,500 greater than the student
earnings levels prior to their registration in community and technical colleges.
Participation Model
Table 6.2 provides the results from the logit estimation of participation in a Community
and Technical College Workforce Education program. The dependent variable in this
econometric model, which was estimated with a sample that pooled the individuals who had
registered for Wagner Peyser services (but who had not participated in other workforce
development programs in Washington) with the Community and Technical College Workforce
Education students who had exited, is a dummy variable equal to 1 for the students (and 0 for the
WP clients). The table provides the logit coefficient estimates and standard errors.
Table 6.2 Coefficient Estimates from a Logit Model of Participation in CTC Workforce Education 2010/2011 2012/2013 Characteristics Coefficient Standard Error Coefficient Standard ErrorDemographics Female 0.294*** 0.013 0.335*** 0.015 Race: (White and missing are omitted categories) Black −0.473*** 0.025 −0.283*** 0.029 Hispanic −0.204*** 0.023 0.012 0.025 Other 0.758*** 0.017 0.918*** 0.019 Age at registration −0.047*** 0.001 −0.018*** 0.001 Disability 0.405*** 0.026 0.463*** 0.028 West WA 0.900*** 0.017 0.898*** 0.019 Urban county 0.602*** 0.014 0.472*** 0.016 Employment and Earnings (prior to registration) Percentage of prior quarters employed −0.002*** 0.000 −0.008*** 0.000 Average quarterly earningsa (in 102 $) −0.001*** 0.000 −0.005*** 0.000 Earnings trendb (in 102 $) −0.006*** 0.001 −0.008*** 0.001 Earnings varianceb (in 108 $) −0.233*** 0.033 0.084*** 0.021 Job turnover 0.037*** 0.000 0.035*** 0.000 Percentage of quarters with multiple jobs −0.023*** 0.000 −0.016*** 0.000 Had earnings dip 0.005 0.038 −0.392*** 0.044 Number of quarters since dip at registration −0.095*** 0.004 0.055*** 0.005 Earnings dip size in percentage −0.431*** 0.038 0.314*** 0.045 Constant −2.280*** 0.058 −2.743*** 0.061 Observations 367,838 213,581 NOTE: Model also includes dummy variables for sector of most recent employment (22 categories). a Average includes quarters with values of zero, if any. b Trend and variance calculations include quarters with zero earnings, if any. *,**,*** indicate statistical significance at p = 0.05, 0.01, and 0.001, respectively.

W.E. Upjohn Institute for Employment Research 74
Net Impact and Benefit-Cost Estimates of the Workforce Development System in Washington State
While the magnitude of the coefficients is not particularly meaningful, the sign and statistical
significance are. If the coefficient is negative, then a (positive) change in that variable will
decrease the likelihood of being a Community and Technical College Workforce Education
exiter.
The coefficient estimates seem quite reasonable. The following variables are significantly
correlated with being in the treatment group (i.e., a Community and Technical College
Workforce Education student) in both years of data: Female, having a disability, being from
Western Washington, residing in an urban county, and job turnover. The following variables are
significantly correlated with being a Wagner Peyser registrant: age at registration, African
American, percent of quarters in the labor market prior to enrollment with employment, average
earnings prior to registration, and trend and variance in earnings prior to registration. The results
are consistent with the notion that the Community and Technical College Workforce Education
programs seem to attract women, urban county residents, and individuals with relatively weak
earnings histories.
Propensity Score Statistics
The propensity score for an observation is the predicted probability using the estimated
coefficients and the observation’s actual data. If the logit model has substantial predictive
capability, then the mean propensity score for the comparison group should be small (near zero)
and should be much less than the mean score for the treatment. As argued earlier, a measure of
how well the logit model discriminates between comparison group members and treatment group
members is the cumulative percentile for the comparison group at the propensity score that is the
20th percentile. Table 6.3 provides these data for the Community and Technical College
Workforce Education analyses. The mean propensity scores for the treatment groups are roughly

W.E. Upjohn Institute for Employment Research 75
Net Impact and Benefit-Cost Estimates of the Workforce Development System in Washington State
0.26 and 0.34 for the 2010/2011 and 2012/2013 cohorts of exiters, respectively, whereas they are
just under 0.08 and just over 0.11 for the comparison groups. The 20th percentile indicators are
about 66 percent, which suggests that the participation model does not discriminate particularly
well between students and non-students.
Table 6.3 Indicators of Propensity Score (p-score) Model Quality for CTC Workforce Education Analyses Statistic 2010/2011 2012/2013
Mean p-score, CTC Workforce Education 0.258 0.341
Mean p-score, Wagner Peyser 0.077 0.113
Percentile Wagner Peyser at 20th percentile Workforce Education 66.2% 68.3%
Statistical Match
The statistical matching used a nearest neighbor approach with the propensity score. For
every observation j in T, we found the observation k in U that minimized the absolute value of
the difference between the propensity score for j and k. We then added k to the comparison group
sample as long as the difference between the propensity scores did not exceed the caliper. The
statistical match was done with replacement, so some observations in U were the “matches” for
more than one observation in the treatment group. Table 6.4 provides data about the sample
sizes, number of matched observations that were duplicates, and a comparison of descriptive
statistics between the treatment and comparison group observations.
Balance
As would be expected, the differences between the treatment group and the matched
comparison group means are much smaller than in Table 6.1. However, because the logit model
has relatively low discriminatory power, a number of the differences in means are significant.
For example, almost all of the employment and earnings variables (prior to registration) still
have significantly different averages in both the 2010/2011 match and 2012/2013 match.

W.E. Upjohn Institute for Employment Research 76
Net Impact and Benefit-Cost Estimates of the Workforce Development System in Washington State
Furthermore, the differences in means between most of the demographic variables are also
significant. In all likelihood, it would have made sense to add interaction terms or higher order
polynomial terms to the participation equation.
Table 6.4 Matching Algorithm Statistics and Post-Match Comparison of Characteristics for CTC Workforce
Education Analyses 2010/2011 2012/2013
Statistic/Characteristic Workforce Education Wagner Peyser
Workforce Education Wagner Peyser
Sample size 34,522 335,449 31,182 183,505 Sample size used in match 34,522 333,316 31,182 182,399 Matched sample size 34,103 34,103 30,779 30,779 Number of observations used once ___ 18,962 ___ 13,844 Number of observations used multiple times ___ 4,427 ___ 5,045 Maximum number of repeats ___ 85 ___ 112 Demographics Female 56.8% 56.8% 55.8% 55.8% Race White 65.7%*** 57.2%*** 63.2%*** 54.1%*** Black 6.8% 6.6% 6.8% 7.0% Hispanic 8.1% 7.9% 9.0%*** 7.7%*** Other race 19.0%*** 20.8%*** 20.5%*** 22.3%*** Missing 0.3%*** 7.5%*** 0.4%*** 8.9%*** Mean, age at registration 31.1*** 31.5*** 30.8*** 30.3*** Disability 6.6%*** 7.4%*** 7.2% 7.3% West WA 81.3%*** 82.3%*** 81.0%*** 82.9%*** Urban county 62.5%** 63.4%** 62.8%*** 65.1%*** Employment and Earnings (prior to registration) Percentage of prior quarters employed 59.2%*** 52.2%*** 57.6%*** 52.4%*** Average quarterly earningsa $3,368*** $3,000*** $3,132*** $2,787*** Mean, earnings trendb $38.2** $29.7** $43.7*** $14.5*** Mean, earnings varianceb (in 106 $) $8.9*** $8.3*** $8.5 $8.5 Job turnover 30.6%*** 28.3%*** 30.3%*** 28.1%*** Percentage of quarters with multiple jobs 12.9%*** 12.0%*** 12.4%*** 11.7%*** Had earnings dip 40.8%*** 35.1%*** 37.0%*** 35.7%*** Mean, number of quarters since dip at registrationa 1.6*** 1.4*** 1.4 1.4 Average earnings dip size in percentagea 32.1%*** 27.6%*** 28.9%** 28.0%** Sample Size 34,103 34,103 30,779 30,779 NOTE: Monetary values in 2014 $. Statistically significant difference in means denoted by *, **, ***. * p < 0.10; ** p < 0.05; *** p < 0.01 (two-tailed test). – means not applicable. aAverages include observations with values of zero. bTrend and variance calculations include quarters with zero earnings, if any.
Although many statistically significant differences in means remain after the matches, the
balance test—standardized means of post-match variates within +/− 0.10—shown in Figure 6.1
seem to show that balance was achieved.

W.E. Upjohn Institute for Employment Research 77
Net Impact and Benefit-Cost Estimates of the Workforce Development System in Washington State
Figure 6.1 Standardized Difference in Means, Pre- and Post-match, CTC Workforce Education
NOTE: Standardized difference in means between comparison group pool and treatment group denoted by dot. Standardized difference in means between matched comparison group and treatment group denoted by x. Red vertical lines at +/− 0.10.
Net Impacts
The major purpose of the study is to estimate the net impacts of the education and
training programs on clients. Tables 6.5 and 6.6 provide the estimated net impacts for
-100 -50 0 50
Standardized % bias across covariates
age_startearn_mean
had_earnings_dippctemployed
time_since_dipearn_dippct
earn_varhispanic
pctqmjobblack
disabledearn_trend
femothrace
urbanwest
turnover
-50 0 50 100
Standardized % bias across covariates
earn_meanage_start
pctemployedhispanic
earn_varearn_trend
blackpctqmjobdisabled
had_earnings_dipfem
time_since_dipearn_dippct
urbanothrace
westturnover

W.E. Upjohn Institute for Employment Research 78
Net Impact and Benefit-Cost Estimates of the Workforce Development System in Washington State
Community and Technical College Workforce Education programs. As with comparable tables
in the prior chapters, the first table displays the short-term (3 quarters after exit) and the longer-
term (9–12 quarters after exit) outcomes for the 2010/2011 cohort of program exiters.
Table 6.5 Net Impact Estimates for CTC Workforce Education Programs for 2010/2011 Cohort
Matched Sample
Estimator Comparison Group Means Average
Treatment EffectFull Sample Matched Sample
Outcome With 0 W/O 0 With 0 W/O 0 Employment (percentage points)a Short term 9.1*** 54.1 --- 48.6 --- Ever-employed, longer term 2.8*** 64.9 --- 62.4 --- Percent of quarters, longer term 5.9*** 55.2 --- 51.2 --- Percent of quarters, longer term, diff-in-diff 1.1** −7.3 --- 6.1 --- Hourly wage Short term ($) 3.07*** 9.89 18.05 7.65 15.45 Short term, diff-in-diff ($) 2.45*** −3.75 −2.46 −0.63 −1.04 Longer term (4-quarter average) ($) 2.88*** 10.75 18.87 8.80 16.48 Longer term, diff-in-diff ($) 2.27*** −2.89 −1.62 0.52 0.11 Quarterly hours Short term 54.2*** 205.4 374.7 174.2 351.9 Short term, diff-in-diff 41.4*** −38.5 13.1 8.8 33.2 Longer term (4-quarter average) 40.6*** 226.0 378.1 198.5 351.9 Longer term, diff-in-diff 27.9*** −17.9 20.1 33.2 36.6 Quarterly earnings Short term ($) 1,603*** 3,792 6,920 2,782 5,622 Short term, diff-in-diff ($) 1,454*** −1,654 −771 −313 82 Longer term (4-quarter average) ($) 1,521*** 4,475 7,409 3,500 6,096 Longer term, diff-in-diff ($) 1,372*** −972 −242 405 617 Unemployment Insurance Benefits Percent receiving, short term −11.3*** 24.1 --- 15.8 --- Benefits, short term ($) −348*** 783 3242 475 3002 Ever-received, longer term −3.9*** 14.9 --- 10.6 --- Benefits, longer term (4-quarter average) ($) −33*** 170 2,016 107 1,861 NOTE: Monetary impacts in 2014 $. Sample sizes differ for virtually every entry in the table because of observations with missing data. If there were no missing data, the sample sizes would be those displayed in rows 2 and 3 of Table 6.4. * significant at the 0.10 level; ** significant at the 0.05 level; *** significant at the 0.01 level (two-tailed test). -- means not applicable. aShort term employment is defined as having more than $100 in quarterly earnings in the 3rd quarter after exit. Ever-employed, longer term is defined as having more than $100 in any quarter from the 9th to the 12th quarter after exit. Percent of quarters, longer-term takes on values of 0%, 25%, 50%, 75%, or 100% for an observation depending on whether the observation was employed for 0, 1, 2, 3, or 4 quarters between the 9th and 12th quarter after exit.
The second table is limited to the short-term net impacts for the 2012/2013 cohort. The
longer-term coefficient estimates that are in “boxes” are the preferred net impact estimates using
a difference-in-differences specification. Table 6.7 below shows the preferred short-term net
impact estimates. The final columns of the tables provide the means of the comparison group,

W.E. Upjohn Institute for Employment Research 79
Net Impact and Benefit-Cost Estimates of the Workforce Development System in Washington State
Table 6.6 Net Impact Estimates for CTC Workforce Education Programs for 2012/2013 Cohort
Matched Sample
Estimator Comparison Group Means Average
Treatment EffectFull Sample Matched Sample
Outcome With 0 W/O 0 With 0 W/O 0 Employmenta Short term 3.9*** 60.7 --- 58.3 --- Hourly wage Short term ($) 1.67*** 11.39 18.57 9.78 16.57 Short term, diff-in-diff ($) 2.07*** −2.77 −1.50 1.02 0.94 Quarterly hours Short term 32.1*** 235.9 384.8 215.0 364.4 Short term, diff-in-diff 32.3*** −26.5 1.3 42.1 64.9 Quarterly earnings Short term ($) 984*** 4,513 7,361 3,690 6,253 Short term, diff-in-diff ($) 1,115*** −1,679 −945 534 1,190 Unemployment Insurance Benefits Percent receiving, short term −5.4*** 9.6 --- 8.4 --- Benefits, short term ($) −90*** 202 2,110 153 1,824 NOTE: Monetary impacts in 2014 $. Sample sizes differ for virtually every entry in the table because of observations with missing data. If there were no missing data, the sample sizes would be those displayed in rows 2 and 3 of Table 6.4. * significant at the 0.10 level; ** significant at the 0.05 level; *** significant at the 0.01 level (two-tailed test). -- means not applicable. aShort term employment is defined as having more than $100 in quarterly earnings in the 3rd quarter after exit.
both the full comparison group pool and the matched comparison group. These columns are
provided so that the net impacts can be estimated on a percentage basis.
The longer-term earnings impacts for the CTC Workforce Education exiters are quite
positive. The students earn, on average, almost $1,400 per quarter more than their comparison
group counterparts. This arises because of an employment net impact of 1.1 percentage points,
an average hourly wage impact of $2.27, and an average hours of employment impact of almost
30 hours. The estimates also show a reduction in recipiency and benefits for UI as longer-term
outcomes.
The estimated short-term and longer-term impacts for the Community and Technical
College Workforce Education students that are displayed in both tables are also quite positive. In
Table 6.6, average quarterly earnings increase by over $1,000, or about 15 percent. These
earnings gains come from increased employment impacts of 3.9 percentage points, average
hourly wage increases of $2.07, and increased average hours per quarter of about 32 hours.

W.E. Upjohn Institute for Employment Research 80
Net Impact and Benefit-Cost Estimates of the Workforce Development System in Washington State
As we have done in prior chapters, we average the short-term net impact estimates from
Table 6.5 and 6.6 to derive our preferred estimate for the short term. These averages are
presented in Table 6.7. The results in this table suggest that in the short term, the Workforce
Education programs offered at community and technical colleges have large and significant
positive effects on employment and earnings. The estimated impact on quarterly earnings is
almost $1,300 (2014 $), which occurs because of a positive employment impact of about 6.5
percentage points, an increase in the average hourly wage of $2.26, and an estimated increase in
hours of employment of 36.9 hours. Besides the positive employment and earnings, these
students are estimated to have lower UI benefit take-up and benefits.
Table 6.7 Short-Term Net Impact Estimates for CTC Workforce Education
2010/2011 Estimator
2012/2013 Estimator Average
Employmenta Short term 9.1*** 3.9*** 6.5*** Hourly wage Short term ($) 3.07*** 1.67*** 2.37*** Short term, diff-in-diff ($) 2.45*** 2.07*** 2.26*** Quarterly hours Short term 54.2*** 32.1*** 43.1*** Short term, diff-in-diff 41.4*** 32.3*** 36.8*** Quarterly earnings Short term ($) 1,603*** 984*** 1,294*** Short term, diff-in-diff ($) 1,454*** 1,115*** 1,285*** Unemployment Insurance Benefits Percent receiving, short term −11.3*** −5.4*** −8.3*** Benefits, short term ($) −348*** −90*** −219*** NOTE: Monetary data in 2014 $. * significant at the 0.10 level; ** significant at the 0.05 level; *** significant at the 0.01 level (two-tailed test). aShort term employment is defined as having more than $100 in quarterly earnings in the 3rd quarter after exit.
Figures 6.2 and 6.3 present the estimated net impacts on earnings and employment for
each quarter after exit for 15 quarters for the 2010/2011 cohort and for 7 quarters for the
2012/2013 cohorts, respectively. The shaded portion of the graphs are the 95% confidence limits
on the net impact estimates.

W.E. Upjohn Institute for Employment Research 81
Net Impact and Benefit-Cost Estimates of the Workforce Development System in Washington State
Figure 6.2 Estimated Net Impacts on Earnings (top) and Employment (bottom) of CTC Workforce Education Programs, by Quarter after Exit, 2010/2011 Cohort
NOTE: Earnings impacts are measured in 2014 $. Employment impacts are measured in percentage points. ATET means average treatment effect on the treated (defined in text).
0
500
1000
1500
1 2 3 4 5 6 7 8 9 10 11 12 13 14 15Quarter after Exit
ATET
0
2
4
6
8
10
1 2 3 4 5 6 7 8 9 10 11 12 13 14 15Quarter after Exit
ATET

W.E. Upjohn Institute for Employment Research 82
Net Impact and Benefit-Cost Estimates of the Workforce Development System in Washington State
Figure 6.3 Estimated Net Impacts on Earnings (top) and Employment (bottom) of CTC Workforce Education Programs, by Quarter after Exit, 2012/2013 Cohort
NOTE: Earnings impacts are measured in 2014 $. Employment impacts are measured in percentage points. ATET means average treatment effect on the treated (defined in text).
Subgroup Analyses
For Community and Technical College Workforce Education students, we examined
completers versus all students. That is, all of the treatment groups are defined by individuals who
“exited” during the fiscal year. Some of the exits may have occurred because the individuals
completed their participation in the program, and some of the exits may have occurred because
the individuals decided to leave without completing the program. As seen in tables 6.8 and 6.9, a
0
500
1000
1500
2000
1 2 3 4 5 6 7Quarter after Exit
ATET
0
2
4
6
8
10
1 2 3 4 5 6 7Quarter after Exit
ATET

W.E. Upjohn Institute for Employment Research 83
Net Impact and Benefit-Cost Estimates of the Workforce Development System in Washington State
little more than 60 percent of the Workforce Education treatment group actually completed their
schooling, defined as receiving a certificate or degree.22 As would be expected, the results show
that completers have far better net impacts than the average. Employment rates, average hourly
wages, average quarterly hours worked, and average quarterly earnings net impacts are all much
higher for the completers than for the noncompleters. For example, the estimated long-term net
impact for quarterly earnings is just over $2,300 for completers and under $650 for
noncompleters.
Table 6.8 Selected Longer-Term Net Impact Estimates for CTC Workplace Education Completers and
Noncompleters: 2010/2011 Cohort
Outcome Subgroup Matched Comparison
Group Mean Noncompleters Completers Employment −4.0*** 4.5*** 51.2 Hourly Wage $0.80*** $4.14*** $8.80 Hours Worked (quarterly) 7.0** 54.5*** 198.5 Earnings (quarterly) $643*** 2,305*** $3,500 UI Receipt −3.7*** −4.2*** 10.6 UI Benefits (quarterly) −$32*** −$33*** $107 Subgroup Sample Size 19,133 15,623 — NOTE: Monetary data in 2014 $. * significant at the 0.10 level; ** significant at the 0.05 level; *** significant at the 0.01 level (two-tailed test). – means not applicable.
Table 6.9 Selected Short-Term Net Impact Estimates for CTC Workplace Education Completers and
Noncompleters: 2012/2013 Cohort
Outcome Subgroup Matched Comparison
Group Mean Noncompleters Completers Employment −1.5** 9.8*** 58.3 Hourly Wage $0.88*** $3.70*** $9.78 Hours Worked (quarterly) 10.5*** 63.0*** 215.0 Earnings (quarterly) $480*** $1,910*** $3,690 UI Receipt −5.6*** −5.1*** 8.4 UI Benefits (quarterly) −$99*** −$79*** $153 Subgroup Sample Size 16,020 14,759 — NOTE: Monetary data in 2014 $. * significant at the 0.10 level; ** significant at the 0.05 level; *** significant at the 0.01 level (two-tailed test). – means not applicable.
22 The definition is slightly broader. The exact specification was GradDrop>0, which in addition to certificate or degree includes 1) individuals who completed 45 quarter credits or more with at least a 2.0 gpa but didn’t receive a degree, and 2) all other completers (high school or GED completer, apprentice completer, or completer of a non-credit vocational program that results in certification, e.g. A+, CISCO, etc.).

W.E. Upjohn Institute for Employment Research 84
Net Impact and Benefit-Cost Estimates of the Workforce Development System in Washington State
Similarly, the employment rate, hourly wage, and quarterly hours impacts are much larger for the
completers than for the noncompleters. The differences in net impacts between completers and
noncompleters are just as large for the short-term and for the longer-term estimates. The hourly
wage impact of almost $4.00 per hour for completers, the hours worked impact of almost 55
hours, and the earnings impact of over $2,300 are all more than four times larger than the net
impacts for noncompleters.

W.E. Upjohn Institute for Employment Research 85
Net Impact and Benefit-Cost Estimates of the Workforce Development System in Washington State
7 COMMUNITY AND TECHNICAL COLLEGE WORKER RETRAINING PROGRAM
The Worker Retraining (WR) program provides financial support to unemployed and
dislocated workers, connecting them to workforce education programs at community and
technical colleges, or basic skills and literacy training as necessary.23 WR programs also support
transitioning military members and veterans and a small number of workers vulnerable to
layoffs. Students receive financial assistance to help with tuition and may receive assistance to
offset costs of child care and transportation. The trainees are similar in economic circumstances
to individuals served by the WIA (now WIOA) Dislocated Worker program and can often
benefit from participation in both programs.
Participant Characteristics
Table 7.1 provides descriptive data that compare the individuals in the treatment group to those in
the comparison group pool. The comparison group consists of Wagner Peyser (WP) registrants who were 16
to 70 at the time of registration and received services in 2010/2011 or 2012/2013. The individuals who were
served by Washington’s workforce development programs were removed from the comparison group pool
data. The first two columns of numbers compare the community and technical college worker retraining
clients who exited in 2010/2011 to individuals in the comparison group. The final two columns compare the
community and technical college worker retraining exiters in 2012/2013 to WP registrants in the same year.
23A small percentage of Worker Retraining participants attended private career schools, but this project
excluded those individuals from the analyses and focused on community and technical college students only.

W.E. Upjohn Institute for Employment Research 86
Net Impact and Benefit-Cost Estimates of the Workforce Development System in Washington State
Table 7.1 Descriptive Statistics for CTC Worker Retraining Treatment Group and Comparison Group Universe
2010/2011 2012/2013
Characteristics Worker
Retraining Wagner PeyserWorker
Retraining Wagner PeyserDemographics Female 50.2% 43.2% 51.4% 44.4% Race: White 67.5% 64.7% 65.1% 62.4% Black 7.4%†† 6.7%†† 8.3% 6.4% Hispanic 7.2% 14.4% 8.2% 13.8% Other race 17.7% 8.1% 17.9% 8.2% Missing 0.3% 6.1% 0.4% 9.2% Mean, age at registration 40.7 39.5 39.9 35.7 Disability 8.1% 5.2% 9.7% 5.1% West WA 86.1% 60.3% 79.8% 60.3% Urban county 64.2% 44.1% 63.7% 45.5%Employment and Earnings (prior to registration) Percentage of prior quarters employed 78.1% 70.4% 74.7% 67.6% Average quarterly earningsa $7,423 $5,944 $6,509 $6,152 Mean, earnings trendb −$19.2 −$5.5 −$35.7 $115.7 Mean, earnings varianceb (in 106 $) $21.4 $19.4 $20.6 $14.0 Job turnover 22.8% 19.2% 24.4% 12.7% Percentage of quarters with multiple jobs 13.8% 14.9% 14.0% 11.6% Had earnings dip 75.3% 57.5% 68.5% 27.9% Mean, number of quarters since dip at registrationa 2.2 2.4 2.2 0.9 Average earnings dip size in percentagea 63.4% 44.1% 58.4% 19.0%Sample Size 6,816 333,316 6,600 182,399NOTE: All differences in means are statistically significant at the 0.05 level (t-test) unless otherwise denoted. Monetary data in 2014 $. Prior employment and earnings variables are defined in Chapter 3 (pp. 24-25). aAverages include observations with values of zero. bTrend and variance calculations include quarters with zero earnings, if any. ††Differences in means are not statistically significant at 0.05 level (t-test).
As with the other programs analyzed in this study, the populations differ. On average, the
Worker Retraining participants are older than the WP registrants. As in the CTC Workforce
Education programs, the CTC Worker Retraining exiters have larger shares of females,
minorities (except Hispanic), disabled workers, and residents of urban counties and western
Washington.
The Worker Retraining exiters’ work histories show more employment and higher
average quarterly earnings (percentage of quarters worked are about 75 to 78 percent versus
about 68 to 70 percent for the Worker Retraining and Wagner Peyser clients, respectively). The

W.E. Upjohn Institute for Employment Research 87
Net Impact and Benefit-Cost Estimates of the Workforce Development System in Washington State
average quarterly earnings difference was about $1,500 in the 2010/2011 data, and about $500 in
the 2012/2013 data.
Participation Model
Table 7.2 provides the results from the logit estimation of participation. The individuals
who had registered for Wagner Peyser services were pooled with the community and technical
college worker retraining clients, and the dependent variable, participation, was a dummy
variable equal to 1 for the latter group (and 0 for the former). The independent variables in the
participation model were identical to those used in the CTC Workforce Education programs
participation model documented in Chapter 6. The table provides the logit coefficient estimates
and standard errors. While the magnitude of the coefficients is not particularly meaningful, the
Table 7.2 Coefficient Estimates from a Logit Model of Participation in CTC Worker Retraining 2010/2011 2012/2013 Coefficient Standard Error Coefficient Standard ErrorDemographics Female 0.384*** 0.027 0.322*** 0.029 Race: (White and missing are omitted categories) Black −0.049 0.050 0.111* 0.052 Hispanic −0.086 0.051 0.125* 0.051 Other 0.678*** 0.034 0.783*** 0.037 Age −0.003* 0.001 0.025*** 0.001 Disability 0.495*** 0.047 0.538*** 0.047 West WA 1.141*** 0.039 0.702*** 0.036 Urban county 0.270*** 0.029 0.334*** 0.031 Employment and Earnings (prior to registration) Percentage of prior quarters employed 0.006*** 0.001 0.005*** 0.001 Average quarterly earningsa (in 102 $) 0.003*** 0.000 −0.002*** 0.000 Earnings trendb (in 102 $) −0.009** 0.003 0.004*** 0.001 Earnings varianceb (in 108 $) −0.324*** 0.040 0.052* 0.025 Job turnover 0.032*** 0.001 0.030*** 0.001 Percentage of quarters with multiple jobs −0.015*** 0.001 −0.010*** 0.001 Had earnings dip 0.777*** 0.068 −0.643*** 0.076 Number of quarters since dip at registration −0.279*** 0.007 −0.001 0.008 Earnings dip size in percentage 0.937*** 0.065 2.722*** 0.076 Constant −7.080*** 0.143 −7.830*** 0.151 Observations 340,132 188,999 NOTE: Model also includes dummy variables for sector of most recent employment (22 categories). a Average includes observations with values of zero, if any. b Trend and variance calculations include quarters with zero earnings, if any. *,**,*** indicate statistical significance at p = 0.05, 0.01, and 0.001, respectively.
W.E. Upjohn Institute for Employment Research 88
Net Impact and Benefit-Cost Estimates of the Workforce Development System in Washington State
sign and statistical significance are. If the coefficient is negative, then a (positive) change in that
variable will decrease the likelihood of being a community and technical college worker
retraining client.
The estimation results show that the following demographic variables are significantly
correlated with being in the treatment group (i.e., a Community and Technical College Worker
Retraining exiter) in both years of data: Female, “Other” racial category, having a disability,
being from Western Washington, and residing in an urban county. The following prior labor
market variables are also significantly correlated with being in worker retraining: percentage of
quarters with employment, job turnover, and average size/depth of an earnings dip.
Propensity Score Statistics
If the participation model had substantial predictive capability, then the mean propensity
score for the comparison group should be small (near zero) and should be much less than the
mean score for the treatment. As argued earlier, a measure of how well the logit model
discriminates between comparison group members and treatment group members is the
cumulative percentile for the comparison group at the propensity score that is the 20th percentile.
Table 7.3 provides these data for the community and technical college worker retraining
analyses. The mean propensity scores for the treatment groups are roughly 0.06 and 0.15,
whereas they are approximately 0.02 and 0.03 for the comparison group for 2010/2011 and
2012/2013 respectively. The 20th percentile indicator is approximately 70 percent. The relatively
large difference in p-score means is good, but the 20th percentile indicators did not reach the
80th percentile standard.

W.E. Upjohn Institute for Employment Research 89
Net Impact and Benefit-Cost Estimates of the Workforce Development System in Washington State
Table 7.3 Indicators of Propensity Score (p-score) Model Quality for CTC Worker Retraining Analyses Statistic 2001/2002 2003/2004
Mean p-score, Worker Retraining 0.056 0.148
Mean p-score, Wagner Peyser 0.019 0.031
Percentile Wagner Peyser, at 20th percentile Worker Retraining 61.3% 75.0%
Statistical Match
Table 7.4 provides data about the sample sizes, number of matched observations that
were duplicates, and a comparison of descriptive statistics between the treatment and comparison
group observations. The quality of the match seems relatively high. Less than 5 percent of the
matched comparison group records in the earlier cohort and 10 percent for the 2012/2013 cohort
have multiple copies, and most of the demographic and education as well as employment and
earnings means are not significantly different from each other. Relative to the community and
technical college workforce education, the statistical match for worker retraining does much
better on the previous earnings and employment variables and approximately as well on the
educational attainment variables.
Balance
The fact that only a few of the variables in Table 7.4 show significantly different means
suggests that the matched populations are well-balanced. This suggestion is buttressed by figure
7.1, which shows the standardized differences in means before and after the match.
Net Impacts
Tables 7.5 and 7.6 provide the estimated net impacts for Worker Retraining for the
2010/2011 and 2012/2013 cohorts, respectively. As with comparable tables in the prior chapters,
the first table displays the short-term (3 quarters after exit) and the longer-term (9–12 quarters
after exit) outcomes for the 2010/2011 cohort of program exiters. The second table is limited to

W.E. Upjohn Institute for Employment Research 90
Net Impact and Benefit-Cost Estimates of the Workforce Development System in Washington State
Table 7.4 Matching Algorithm Statistics and Post-Match Comparison of Characteristics for CTC Worker Retraining Analyses
2010/2011 2012/2013
Statistic/Characteristic Worker
Retraining Wagner PeyserWorker
Retraining Wagner PeyserSample size 6,816 335,449 6,600 183,505 Sample size used in match 6,816 333,316 6,600 182,399 Matched sample size 6,804 6,804 6,575 6,575 Number of observations used once --- 6,156 --- 5,065 Number of observations used multiple times --- 309 --- 686 Maximum number of repeats --- 6 --- 5 Demographics Female 50.1% 50.1% 51.4% 51.4% Race: White 67.6%*** 63.3%*** 65.3%*** 58.7%*** Black 7.4%* 6.6%* 8.3% 9.1% Hispanic 7.2% 6.7% 8.2% 8.0% Other race 17.6% 18.4% 17.8% 18.0% Missing 0.3%*** 5.0%*** 0.4%*** 6.3%*** Mean, age at registration 40.7 40.7 39.9 39.8 Disability 8.1% 8.6% 9.6% 8.9% Urban county 64.1% 64.8% 63.6% 64.0% West WA 86.1% 86.9% 79.7% 80.2% Employment and Earnings (prior to registration) Percentage of prior quarters employed 78.1%*** 76.4%*** 74.8%*** 71.6%*** Average quarterly earningsa (in 102 $) $7,432 $7,297 $6,527*** $6,085*** Mean, earnings trendb (in 102 $) −$19.3 −$22.4 −$34.8 −$65.8 Mean, earnings varianceb (in 106 $) $21.4 $21.1 $20.6 $21.5 Job turnover 22.7%* 22.1%* 24.2% 24.5% Percentage of quarters with multiple jobs 13.8%* 13.4%* 14.0% 14.2% Had earnings dip 75.3% 74.5% 68.4% 69.5% Mean, number of quarters since dip at registration 2.2*** 2.0*** 2.2 2.2 Average earnings dip size in percentage 63.4% 63.4% 58.2%* 59.7%* Sample Size 6,804 6,804 6,575 6,575 NOTE: Monetary values in 2014 $. Statistically significant difference in means denoted by *, **, ***. * p < 0.10; ** p < 0.05; *** p < 0.01 (two-tailed test). – means not applicable. aAverages include observations with values of zero. bTrend and variance calculations include quarters with zero earnings, if any.
the short-term net impacts for the 2012/2013 cohort. For this program, we use the levels of the
outcome variables as the dependent variable. The final columns of the tables provide the means
of the comparison group, both the full comparison group pool and the matched comparison
group. These columns are provided so that the net impacts can be estimated on a percentage
basis.

W.E. Upjohn Institute for Employment Research 91
Net Impact and Benefit-Cost Estimates of the Workforce Development System in Washington State
Figure 7.1 Standardized Difference in Means, Pre- and Post-match, CTC Worker Retraining
NOTE: Standardized difference in means between comparison group pool and treatment group denoted by dot. Standardized difference in means between matched comparison group and treatment group denoted by x. Red vertical lines at +/− 0.10.
-20 0 20 40 60
Standardized % bias across covariates
hispanictime_since_dip
pctqmjobearn_trend
blackearn_varage_startdisabled
femturnover
earn_meanpctemployed
othracehad_earnings_dip
urbanearn_dippct
west
-50 0 50 100
Standardized % bias across covariates
hispanicearn_trendearn_mean
blackpctqmjobearn_var
femdisabled
pctemployedothrace
age_starturbanwest
time_since_dipturnover
had_earnings_dipearn_dippct

W.E. Upjohn Institute for Employment Research 92
Net Impact and Benefit-Cost Estimates of the Workforce Development System in Washington State
The longer-term earnings and employment impacts are large and statistically significant.
The estimated longer-term employment rate impact is 8.0 percentage points; hourly wage impact
is $1.91; quarterly hours is 49.5; and the quarterly earnings impact is about $1,130. On the other
hand, the longer-term estimates of the net impact on receipt of and levels of Unemployment
Insurance benefits are not significantly different from 0.
Table 7.5 Net Impact Estimates for CTC Worker Retraining Program for 2010/2011 Cohort
Outcome
Matched Sample Estimator Comparison Group Means
Average Treatment Effect
Full Sample Matched Sample With 0 W/O 0 With 0 W/O 0
Employment (percentage points)a Short term 9.1*** 54.1 --- 52.5 --- Ever-employed, longer term 6.0*** 64.9 --- 65.4 --- Percent of quarters, longer term 8.0*** 55.2 --- 55.8 --- Percent of quarters, longer term, diff-in-diff 6.7*** −7.3 --- −17.2 --- Hourly wage Short term ($) 1.44*** 9.89 18.05 10.36 19.50 Short term, diff-in-diff ($) 2.18*** −3.75 −2.46 −7.45 −3.74 Longer term (4-quarter average) ($) 1.91*** 10.75 18.87 11.59 20.13 Longer term, diff-in-diff ($) 2.66*** −2.89 −1.62 −6.21 −3.06 Quarterly hours Short term 48.5*** 205.4 374.7 200.4 377.3 Short term, diff-in-diff 21.8*** −38.5 13.1 −95.2 −1.7 Longer term (4-quarter average) 49.5*** 226.0 378.1 230.4 382.5 Longer term, diff-in-diff 22.8*** −17.9 20.1 −65.2 0.3 Quarterly earnings Short term ($) 770*** 3,792 6,920 4,067 7,654 Short term, diff-in-diff ($) 719*** −1,654 −771 −3,299 −1,501 Longer term (4-quarter average) ($) 1,132*** 4,475 7,409 4,877 7,995 Longer term, diff-in-diff ($) 1,081*** −972 −242 −2,488 −1,213 Unemployment Insurance Benefits Percent receiving, short term −11.8*** 24.1 --- 28.9 --- Benefits, short term ($) −437*** 783 3,242 1,029 3,564 Ever-received, longer term −0.6 14.9 --- 14.9 --- Benefits, longer term (4-quarter average) ($) 8 170 2,016 180 2,126 NOTE: Monetary impacts in 2014 $. Sample sizes differ for virtually every entry in the table because of observations with missing data. If there were no missing data, the sample sizes would be those displayed in rows 2 and 3 of Table 7.4. * significant at the 0.10 level; ** significant at the 0.05 level; *** significant at the 0.01 level (two-tailed test). -- means not applicable. aShort term employment is defined as having more than $100 in quarterly earnings in the 3rd quarter after exit. Ever-employed, longer term is defined as having more than $100 in any quarter from the 9th to the 12th quarter after exit. Percent of quarters, longer-term takes on values of 0%, 25%, 50%, 75%, or 100% for an observation depending on whether the observation was employed for 0, 1, 2, 3, or 4 quarters between the 9th and 12th quarter after exit.

W.E. Upjohn Institute for Employment Research 93
Net Impact and Benefit-Cost Estimates of the Workforce Development System in Washington State
The short-term impacts for the Worker Retraining participants, shown in the two tables,
reflect a very strong, positive employment rate gain of 7 – 9 percentage points; positive net
impacts in hourly wage rates: $1.44 -- $1.63 per hour; and positive net impacts in quarterly
hours: 43.7 – 48.5 hours. All together, the estimated impacts on quarterly earnings are in the
$800 to $900 range. In the short run, the worker retraining participants had a small statistically
significant decrease in UI recipiency and benefits.
As noted earlier, our preferred estimate for the short-term net impacts is the average of
the short-run impacts from Tables 7.5 and 7.6. These are presented in Table 7.7. The results in
this table suggest that in the short term, the CTC Worker Retraining program have large and
significant positive effects on employment and earnings. The short-term employment and
earnings net impact estimators shown in Table 7.7 are very similar to, but just slightly smaller
than, the longer-term net impacts suggesting that the positive impacts from the CTC Worker
Retraining programs do not depreciate quickly. However the short-term reductions in UI
Table 7.6 Net Impact Estimates for CTC Worker Retraining Program for 2012/2013 Cohort
Matched Sample
Estimator Comparison Group Means Average
Treatment EffectFull Sample Matched Sample
Outcome With 0 W/O 0 With 0 W/O 0 Employmenta Short term 7.0*** 60.7 --- 56.5 --- Hourly wage Short term ($) 1.63*** 11.39 18.57 10.73 18.79 Short term, diff-in-diff ($) 2.62*** −2.77 −1.50 −4.77 −1.86 Quarterly hours Short term 43.7*** 235.9 384.8 212.4 371.9 Short term, diff-in-diff 32.3*** −26.5 1.3 −49.1 25.4 Quarterly earnings Short term ($) 930*** 4,513 7,361 4,103 7,182 Short term, diff-in-diff ($) 1,110*** −1,679 −945 −2,057 −581 Unemployment Insurance Benefits Percent receiving, short term −2.7*** 9.6 --- 10.8 --- Benefits, short term ($) −42** 202 2,110 239 2,208 NOTE: Monetary impacts in 2014 $. Sample sizes differ for virtually every entry in the table because of observations with missing data. If there were no missing data, the sample sizes would be those displayed in rows 2 and 3 of Table 7.4. * significant at the 0.10 level; ** significant at the 0.05 level; *** significant at the 0.01 level (two-tailed test). -- means not applicable. aShort term employment is defined as having more than $100 in quarterly earnings in the 3rd quarter after exit.
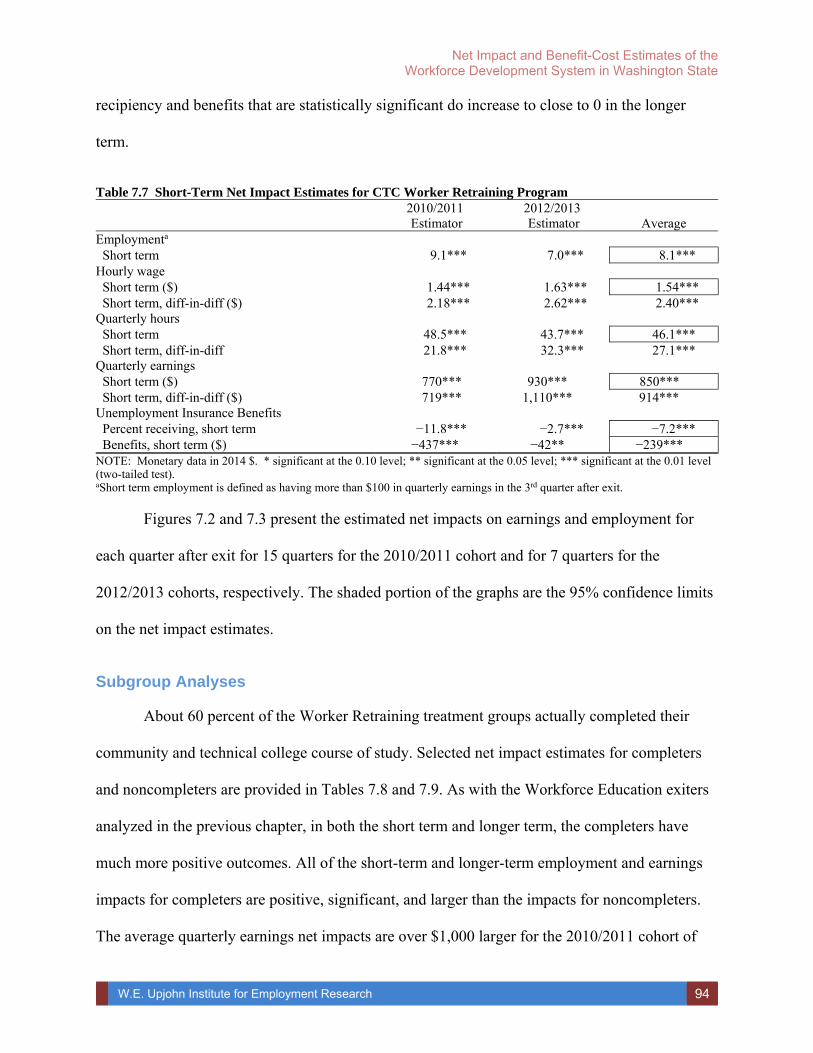
W.E. Upjohn Institute for Employment Research 94
Net Impact and Benefit-Cost Estimates of the Workforce Development System in Washington State
recipiency and benefits that are statistically significant do increase to close to 0 in the longer
term.
Table 7.7 Short-Term Net Impact Estimates for CTC Worker Retraining Program
2010/2011 Estimator
2012/2013 Estimator Average
Employmenta Short term 9.1*** 7.0*** 8.1*** Hourly wage Short term ($) 1.44*** 1.63*** 1.54*** Short term, diff-in-diff ($) 2.18*** 2.62*** 2.40*** Quarterly hours Short term 48.5*** 43.7*** 46.1*** Short term, diff-in-diff 21.8*** 32.3*** 27.1*** Quarterly earnings Short term ($) 770*** 930*** 850*** Short term, diff-in-diff ($) 719*** 1,110*** 914*** Unemployment Insurance Benefits Percent receiving, short term −11.8*** −2.7*** −7.2*** Benefits, short term ($) −437*** −42** −239*** NOTE: Monetary data in 2014 $. * significant at the 0.10 level; ** significant at the 0.05 level; *** significant at the 0.01 level (two-tailed test). aShort term employment is defined as having more than $100 in quarterly earnings in the 3rd quarter after exit.
Figures 7.2 and 7.3 present the estimated net impacts on earnings and employment for
each quarter after exit for 15 quarters for the 2010/2011 cohort and for 7 quarters for the
2012/2013 cohorts, respectively. The shaded portion of the graphs are the 95% confidence limits
on the net impact estimates.
Subgroup Analyses
About 60 percent of the Worker Retraining treatment groups actually completed their
community and technical college course of study. Selected net impact estimates for completers
and noncompleters are provided in Tables 7.8 and 7.9. As with the Workforce Education exiters
analyzed in the previous chapter, in both the short term and longer term, the completers have
much more positive outcomes. All of the short-term and longer-term employment and earnings
impacts for completers are positive, significant, and larger than the impacts for noncompleters.
The average quarterly earnings net impacts are over $1,000 larger for the 2010/2011 cohort of
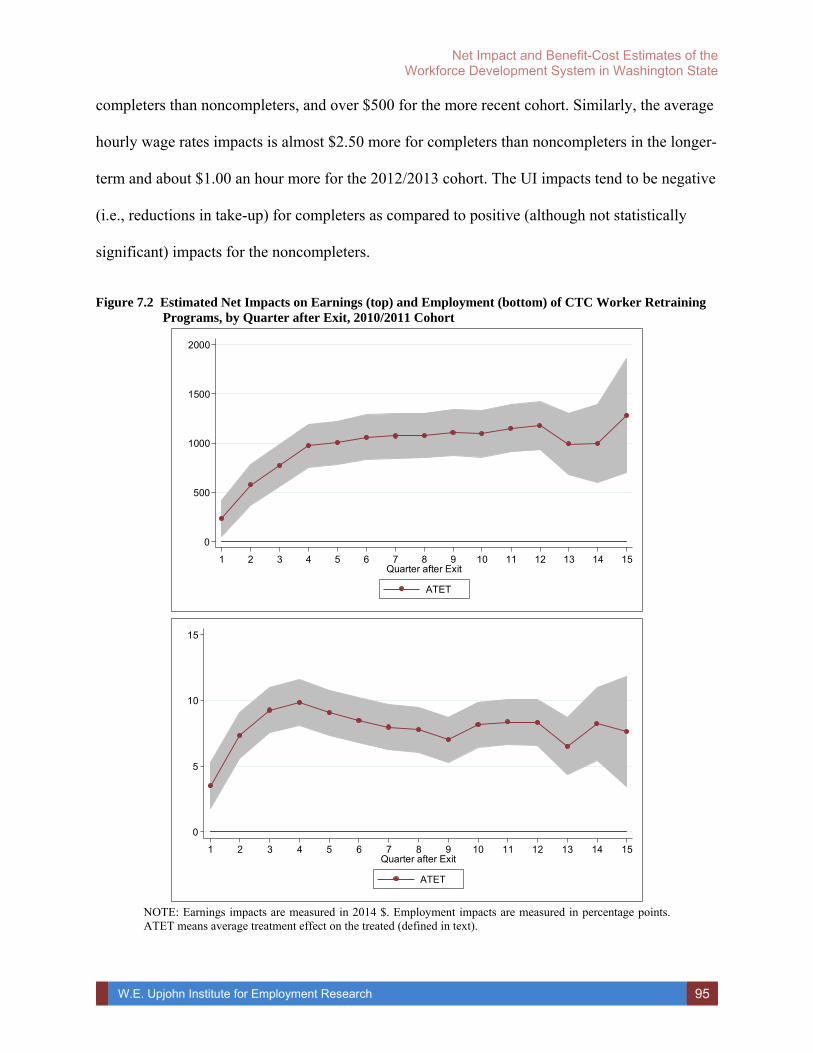
W.E. Upjohn Institute for Employment Research 95
Net Impact and Benefit-Cost Estimates of the Workforce Development System in Washington State
completers than noncompleters, and over $500 for the more recent cohort. Similarly, the average
hourly wage rates impacts is almost $2.50 more for completers than noncompleters in the longer-
term and about $1.00 an hour more for the 2012/2013 cohort. The UI impacts tend to be negative
(i.e., reductions in take-up) for completers as compared to positive (although not statistically
significant) impacts for the noncompleters.
Figure 7.2 Estimated Net Impacts on Earnings (top) and Employment (bottom) of CTC Worker Retraining
Programs, by Quarter after Exit, 2010/2011 Cohort
NOTE: Earnings impacts are measured in 2014 $. Employment impacts are measured in percentage points. ATET means average treatment effect on the treated (defined in text).
0
500
1000
1500
2000
1 2 3 4 5 6 7 8 9 10 11 12 13 14 15Quarter after Exit
ATET
0
5
10
15
1 2 3 4 5 6 7 8 9 10 11 12 13 14 15Quarter after Exit
ATET

W.E. Upjohn Institute for Employment Research 96
Net Impact and Benefit-Cost Estimates of the Workforce Development System in Washington State
Figure 7.3 Estimated Net Impacts on Earnings (top) and Employment (bottom) of CTC Worker Retraining Programs, by Quarter after Exit, 2012/2013 Cohort
NOTE: Earnings impacts are measured in 2014 $. Employment impacts are measured in percentage points. ATET means average treatment effect on the treated (defined in text).
0
500
1000
1500
2000
1 2 3 4 5 6 7Quarter after Exit
ATET
0
5
10
15
1 2 3 4 5 6 7Quarter after Exit
ATET
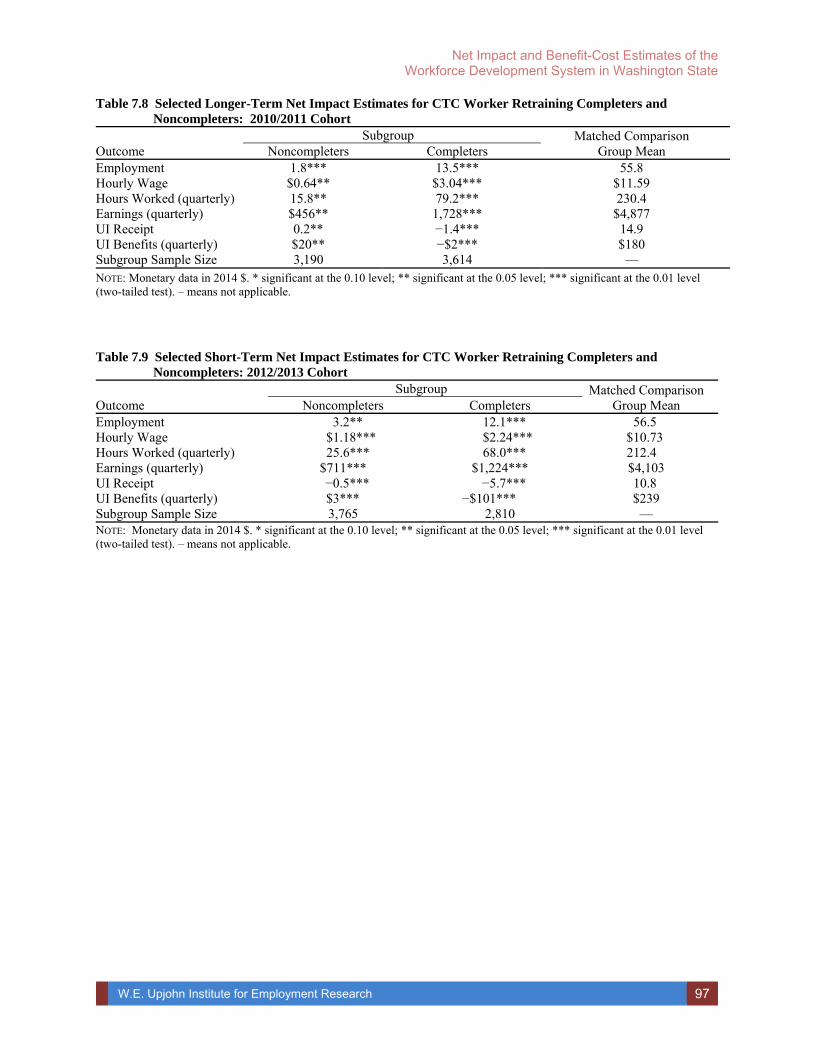
W.E. Upjohn Institute for Employment Research 97
Net Impact and Benefit-Cost Estimates of the Workforce Development System in Washington State
Table 7.8 Selected Longer-Term Net Impact Estimates for CTC Worker Retraining Completers and Noncompleters: 2010/2011 Cohort
Outcome Subgroup Matched Comparison
Group Mean Noncompleters Completers Employment 1.8*** 13.5*** 55.8 Hourly Wage $0.64** $3.04*** $11.59 Hours Worked (quarterly) 15.8** 79.2*** 230.4 Earnings (quarterly) $456** 1,728*** $4,877 UI Receipt 0.2** −1.4*** 14.9 UI Benefits (quarterly) $20** −$2*** $180 Subgroup Sample Size 3,190 3,614 — NOTE: Monetary data in 2014 $. * significant at the 0.10 level; ** significant at the 0.05 level; *** significant at the 0.01 level (two-tailed test). – means not applicable.
Table 7.9 Selected Short-Term Net Impact Estimates for CTC Worker Retraining Completers and
Noncompleters: 2012/2013 Cohort
Outcome Subgroup Matched Comparison
Group Mean Noncompleters Completers Employment 3.2** 12.1*** 56.5 Hourly Wage $1.18*** $2.24*** $10.73 Hours Worked (quarterly) 25.6*** 68.0*** 212.4 Earnings (quarterly) $711*** $1,224*** $4,103 UI Receipt −0.5*** −5.7*** 10.8 UI Benefits (quarterly) $3*** −$101*** $239 Subgroup Sample Size 3,765 2,810 — NOTE: Monetary data in 2014 $. * significant at the 0.10 level; ** significant at the 0.05 level; *** significant at the 0.01 level (two-tailed test). – means not applicable.

W.E. Upjohn Institute for Employment Research 98
Net Impact and Benefit-Cost Estimates of the Workforce Development System in Washington State

W.E. Upjohn Institute for Employment Research 99
Net Impact and Benefit-Cost Estimates of the Workforce Development System in Washington State
8 BASIC EDUCATION FOR ADULTS ON COMMUNITY AND TECHNICAL COLLEGE CAMPUSES
Adults with deficits in basic academic and literacy skills are supported in Basic
Education for Adults (BEdA) across the state. The purposes of the instruction are to:
provide academic instruction and education services below the postsecondary level that increase an individual’s ability to— (A) read, write, and speak English and perform mathematics or other activities
necessary for the attainment of a secondary school diploma or its recognized equivalent;
(B) transition to postsecondary education and training; or (C) obtain employment;
assist adults to become literate and obtain the knowledge and skills necessary for employment and self-sufficiency; and
assist adults who are parents to obtain the educational skills necessary to become full partners in the educational development of their children.
The types of programs include adult literacy, basic skills education, high school diploma or
equivalency preparation, integrated education and workforce training, employability skills
development, English language acquisition, integrated English literacy and civics instruction,
and family literacy. A substantial share of the instruction is for individuals with limited English
proficiency who participate in English acquisition instruction. Programs are offered at
community and technical colleges or at community-based organizations. The analyses in this
study were limited to programs delivered at community and technical colleges because of the
availability of administrative data.
Participant Characteristics
Table 8.1 provides descriptive data that compare the individuals in the treatment group to
those in the comparison group pool. The age range for including observations in the comparison

W.E. Upjohn Institute for Employment Research 100
Net Impact and Benefit-Cost Estimates of the Workforce Development System in Washington State
group pool was somewhat different from what was used for the other community and technical
college programs: the comparison group consists of Wagner Peyser (WP) registrants who were
18 to 55 at the time of registering for WP service, and as with all other programs in this study,
individuals who were served by Washington’s education and training programs were removed
from the data. The first two columns of numbers compare the Community and Technical College
BEdA participants who exited in 2010/2011 to individuals in the comparison group. The final
two columns compare the exiters in 2012/2013 to WP registrants in the same year.
Table 8.1 Descriptive Statistics for CTC Basic Education for Adults Treatment Group and Comparison
Group Universe 2010/2011 2012/2013
Characteristics BEdA Wagner Peyser BEdA
Wagner Peyser
Demographics Female 58.3% 43.5% 58.9% 44.1% Race: White 40.8% 63.0% 38.8% 61.2% Black 17.0% 7.2% 16.7% 6.7% Hispanic 21.1% 15.2% 20.5% 14.1% Other race 21.2% 8.3% 14.6% 8.4% Missing 0.0% 6.3% 9.3%†† 9.6%†† Mean, age at registration 32.0 36.1 31.3 33.3 Disability 4.8%†† 4.8%†† 5.6% 4.8% West WA 72.3% 59.9% 71.4% 60.1% Urban county 54.4% 43.7% 54.6% 45.4% Employment and Earnings (prior to registration) Percentage of prior quarters employed 50.7% 69.4% 50.1% 67.4% Average quarterly earningsa $2,332 $5,489 $2,246 $5,741 Mean, earnings trendb $9.2†† $5.8†† $32.8 $125.4 Mean, earnings varianceb (in 106 $) $4.9 $15.4 $4.5 $10.6 Job turnover 36.3% 20.2% 35.7% 13.6% Percentage of quarters with multiple jobs 13.1% 15.5% 12.7% 12.2% Had earnings dip 47.0% 57.1% 38.8% 28.0% Mean, number of quarters since dip at registrationa 2.1 2.4 1.6 0.9 Average earnings dip size in percentagea 38.4% 43.7% 30.8% 19.3% Sample Size 17,697 283,661 12,669 160,013 NOTE: All differences in means are statistically significant at the 0.05 level (t-test) unless otherwise denoted. Monetary data in 2014 $. Prior employment and earnings variables are defined in Chapter 3 (pp. 24-25). aAverages include observations with values of zero. bTrend and variance calculations include quarters with zero earnings, if any. ††Differences in means are not statistically significant at 0.05 level (t-test).
The populations are quite different. The BEdA participants are younger—averaging
about 31 as compared to 33—36 for the Wagner Peyser population—and are more likely to be

W.E. Upjohn Institute for Employment Research 101
Net Impact and Benefit-Cost Estimates of the Workforce Development System in Washington State
female and to be a minority. In both cohorts, about 60 percent of the treatment group members
are female, whereas about 45 percent of the Wagner Peyser registrants are female. Similarly, in
both cohorts, about 60 percent of the community and technical college BEdA clients are
nonwhite as compared to only about 35 percent of the WP population. As with many of the
programs analyzed in this study, the BEdA participants are much more likely to reside in an
urban county and in western Washington than were WP registrants.
The pre-program registration labor market experiences of the BEdA students are also
quite different from their Wagner Peyser counterparts. Their percentage of quarters with
employment is about 50 percent, whereas the comparison group pool was almost 70 percent. The
average quarterly earnings are also significantly lower. The average quarterly earnings for the
BEdA population is only about $2,300; whereas it is about $5,500 for the WP registrants.
Participation Model
Table 8.2 provides the results from the logit estimation of participation in BEdA. The
independent variables in the participation model are exactly the same as those used in the other
community and technical college programs as documented in the two previous chapters. The
table provides the logit coefficient estimates and standard errors. While the magnitude of the
coefficients is not particularly meaningful, the sign and statistical significance are. If the
coefficient is negative, then a (positive) change in that variable will decrease the likelihood of
being a community and technical college BEdA exiter.
The following variables are significantly correlated with being in the treatment group
(i.e., BEdA participant) in both years of data: female, minority, having a disability, being from
western Washington, residing in an urban county, and job turnover. Not surprisingly, most of the
prior employment and earnings variables are significantly correlated with being in the

W.E. Upjohn Institute for Employment Research 102
Net Impact and Benefit-Cost Estimates of the Workforce Development System in Washington State
Table 8.2 Coefficient Estimates from a Logit Model of Participation in CTC Basic Education for Adults 2010/2011 2012/2013 Characteristics Coefficient Standard Error Coefficient Standard ErrorDemographics Female 0.427*** 0.018 0.543*** 0.022 Race: (White or missing are omitted categories) Black 0.975*** 0.026 1.065*** 0.033 Hispanic 1.052*** 0.024 1.026*** 0.031 Other 1.366*** 0.024 0.924*** 0.033 Age −0.018*** 0.001 0.014*** 0.001 Disability 0.106** 0.041 0.272*** 0.047 West WA 0.643*** 0.022 0.568*** 0.026 Urban county 0.322*** 0.020 0.237*** 0.024 Employment and Earnings (prior to registration) Percentage of prior quarters employed −0.006*** 0.000 −0.010*** 0.000 Average quarterly earningsa (in 102 $) 0.001 0.000 −0.007*** 0.000 Earnings trendb (in 102 $) −0.003 0.003 −0.008*** 0.002 Earnings varianceb (in 108 $) −3.147*** 0.132 −0.832*** 0.117 Job turnover 0.041*** 0.000 0.039*** 0.001 Percentage of quarters with multiple jobs −0.027*** 0.001 −0.019*** 0.001 Had earnings dip −0.238*** 0.055 −0.309*** 0.067 Number of quarters since dip at registration −0.001 0.005 0.095*** 0.007 Earnings dip size in percentage −0.102 0.053 0.041 0.067 Constant −3.600*** 0.064 −4.084*** 0.073 Observations 301,358 172,682 NOTE: Model also includes dummy variables for sector of most recent employment (22 categories). aAverage includes quarters with values of zero, if any. bTrend and variance calculations include quarters with zero earnings, if any. *,**,*** indicate statistical significance at p = 0.05, 0.01, and 0.001, respectively.
comparison group (WP registrants): employment percentage, earnings trend and variance, and
having experienced an earnings dip. All of these results are consistent with the theory that
relatively skilled individuals with inconsistent earnings and employment histories tend to register
for Wagner Peyser services at Work Source offices, whereas BEdA participants are low-skilled
individuals seeking to upgrade their employment opportunities.
Propensity Score Statistics
Table 8.3 provides the mean propensity scores and 20th percentile indicator for the
community and technical college BEdA analyses. The mean propensity scores for the treatment
groups are roughly 0.21 and 0.26, whereas they are 0.05 and 0.06 for the comparison group for
the 2010/2011 and 2012/2013 cohorts, respectively. The 20th percentile indicator is
approximately 69 percent for both cohorts. These modest percentages suggest that the propensity

W.E. Upjohn Institute for Employment Research 103
Net Impact and Benefit-Cost Estimates of the Workforce Development System in Washington State
Table 8.3 Indicators of Propensity Score (p-score) Model Quality for CTC Basic Education for Adults Analyses
Statistic 2010/2011 2012/2013
Mean p-score, BEdA 0.207 0.259
Mean p-score, Wagner Peyser 0.049 0.059
Percentile Wagner Peyser, at 20th percentile BEdA 68.6% 69.1%
score model was only modestly successful in discriminating between the BEdA and Wagner
Peyser participants. This is borne out in Table 8.4 below.
Statistical Match
Table 8.4 provides data about the sample sizes, number of matched observations that
were duplicates, and a comparison of descriptive statistics between the treatment and comparison
group observations. The match “struggled.” Almost all of the differences in means are still
significant suggesting that the populations are relatively imbalanced. The top panel of statistics
in the table shows that less than 10 percent of the observations from the 2010/2011 comparison
group pool were used multiple times; however, about 16 percent of the comparison group pool
observations were used in the 2012/2013 match. Furthermore, the maximum number of repeats is
250 and 40 in the two matches which is far greater than what occurred in any of the other
program analyses. This is likely a result of the fact that the matched comparison group derived
from the WP file is much smaller in 2012/2013 and because most of the matching variables are
discrete.
Balance
The fact that only most of the variables in Table 8.4 show significantly different means
suggests that the matched populations are not well-balanced. However, Figure 8.1, which shows
the standardized differences in means before and after the match, indicates that all of the variates
in the match satisfy the +/− 0.10 criterion for balance.

W.E. Upjohn Institute for Employment Research 104
Net Impact and Benefit-Cost Estimates of the Workforce Development System in Washington State
Table 8.4 Matching Algorithm Statistics and Post-Match Comparison of Characteristics for CTC Basic Education for Adults Analyses
2010/2011 2012/2013 Statistic/Characteristic BEdA Wagner Peyser BEdA Wagner PeyserSample size 17,697 285,498 12,669 161,024 Sample size used in match 17,697 283,661 12,669 160,013 Matched sample size 17,360 17,360 12,432 12,432 Number of observations used once --- 10,465 --- 6,700 Number of observations used multiple times --- 1,574 --- 1,724 Maximum number of repeats --- 250 --- 40 Demographics Female 58.3% 58.3% 59.0% 59.0% Race: White 41.5%*** 33.9%*** 39.3%*** 37.1%*** Black 16.7% 16.7% 16.3%*** 19.1%*** Hispanic 21.2%*** 24.2%*** 20.6%*** 19.0%*** Other race 20.6%*** 22.3%*** 14.4%** 15.5%** Missing 0.0%*** 2.9%*** 9.3% 9.3% Mean, age at registration 32.0*** 31.7*** 31.4*** 30.6*** Disability 4.7%* 4.4%* 5.5% 5.2% West WA 71.9% 72.5% 71.0%*** 72.9%*** Urban county 54.1%*** 56.4%*** 54.1%*** 57.2%*** Employment and Earnings (prior to registration) Percentage of prior quarters employed 51.1%*** 54.3%*** 50.7%*** 44.7%*** Average quarterly earningsa $2,369*** $2,664*** $2,285*** $1,914*** Mean, earnings trendb $10.8 $10.5 $34.2*** $4.0*** Mean, earnings varianceb (in 106 $) $4.9*** $5.3*** $4.6*** $4.2*** Job turnover 35.0%*** 34.2%*** 34.5%*** 31.9%*** Percentage of quarters with multiple jobs 13.3% 13.2% 12.9%*** 11.6%*** Had earnings dip 47.2%*** 48.9%*** 38.8%*** 37.1%*** Mean, number of quarters since dip at registrationa 2.1*** 2.2*** 1.6 1.5 Average earnings dip size in percentagea 38.6% 39.2% 30.7%** 29.5%** Sample Size 17,360 17,360 12,432 12,432 NOTE: Monetary values in 2014 $. Statistically significant difference in means denoted by *, **, ***. * p < 0.10; ** p < 0.05; *** p < 0.01 (two-tailed test). – means not applicable. aAverages include observations with values of zero. bTrend and variance calculations include quarters with zero earnings, if any.

W.E. Upjohn Institute for Employment Research 105
Net Impact and Benefit-Cost Estimates of the Workforce Development System in Washington State
Figure 8.1 Standardized Difference in Means, Pre- and Post-match, CTC Basic Education for Adults
NOTE: Standardized difference in means between comparison group pool and treatment group denoted by dot. Standardized difference in means between matched comparison group and treatment group denoted by x. Red vertical lines at +/− 0.10.
-100 -50 0 50 100
Standardized % bias across covariates
earn_meanpctemployed
age_startearn_var
had_earnings_dippctqmjob
varcapearn_dippct
time_since_dipdisabled
earn_trendhispanic
urbanwestfem
blackothrace
turnover
-100 -50 0 50 100
Standardized % bias across covariates
earn_meanpctemployed
earn_varage_start
varcapearn_trend
missracepctqmjobdisabledhispanic
urbanothrace
had_earnings_dipwestfem
earn_dippcttime_since_dip
blackturnover

W.E. Upjohn Institute for Employment Research 106
Net Impact and Benefit-Cost Estimates of the Workforce Development System in Washington State
Net Impacts
The major purpose of the study is to estimate the net impacts of the education and
training programs on clients, and Tables 8.5 and 8.6 provide the estimated net impacts for BEdA
programs. As with comparable tables in the prior chapters, the first table displays the short-term
(3 quarters after exit) and the longer-term (9–12 quarters after exit) outcomes for the 2010/2011
cohort of program exiters. The second table is limited to the short-term net impacts for the
2012/2013 cohort. Our preferred specification for the estimates is the average treatment effect for
Table 8.5 Net Impact Estimates for CTC Basic Education for Adults for 2010/2011 Cohort
Outcome
Matched Sample Estimator Comparison Group Means Average
Treatment EffectFull Sample Matched Sample
With 0 W/O 0 With 0 With/O 0 Employment (percentage points)a Short term −0.3 56.1 --- 46.3 --- Ever-employed, longer term −3.1** 67.8 --- 66.7 --- Percent of quarters, longer term −0.8 57.8 --- 52.3 --- Percent of quarters, longer term, diff-in-diff 2.9** −3.9 --- 8.5 --- Hourly wage Short term ($) −0.79** 10.11 17.79 6.81 14.34 Short term, diff-in-diff ($) 0.38 −2.89 −2.17 −0.31 −0.55 Longer term (4-quarter average) ($) −1.15*** 11.18 18.75 8.36 15.01 Longer term, diff-in-diff ($) 0.03 −1.81 −1.20 1.25 0.25 Quarterly hours Short term −0.5 214.8 378.3 163.3 344.3 Short term, diff-in-diff 6.0 −24.7 18.8 14.2 49.4 Longer term (4-quarter average) −2.3 238.8 382.3 201.4 331.1 Longer term, diff-in-diff 4.2 −0.7 26.7 52.3 43.2 Quarterly earnings Short term ($) −279** 3,915 6,893 2,416 5,092 Short term, diff-in-diff ($) 130 −1,237 −538 −58 504 Longer term (4-quarter average) ($) −493*** 4,708 7,454 3,313 5,352 Longer term, diff-in-diff ($) −85 −445 65 838 853 Unemployment Insurance Benefits Percent receiving, short term −5.7** 22.7 --- 16.6 --- Benefits, short term ($) −169** 712 3133 457 2758 Ever-received, longer term −1.1 15.1 --- 12.1 --- Benefits, longer term (4-quarter average) ($) −23 169 1,987 121 1,719 NOTE: Monetary impacts in 2014 $. Sample sizes differ for virtually every entry in the table because of observations with missing data. If there were no missing data, the sample sizes would be those displayed in rows 2 and 3 of Table 8.4. * significant at the 0.10 level; ** significant at the 0.05 level; *** significant at the 0.01 level (two-tailed test). -- means not applicable. aShort term employment is defined as having more than $100 in quarterly earnings in the 3rd quarter after exit. Ever-employed, longer term is defined as having more than $100 in any quarter from the 9th to the 12th quarter after exit. Percent of quarters, longer-term takes on values of 0%, 25%, 50%, 75%, or 100% for an observation depending on whether the observation was employed for 0, 1, 2, 3, or 4 quarters between the 9th and 12th quarter after exit.

W.E. Upjohn Institute for Employment Research 107
Net Impact and Benefit-Cost Estimates of the Workforce Development System in Washington State
difference-in-differences. The final four columns of the tables provide the means of the
comparison group, both the full comparison group pool and the matched comparison group.
These columns are provided so that the net impacts can be estimated on a percentage basis.
The longer-term net impacts for the community and technical college Basic Education for
Adults participants are shown in Table 8.5. The employment rate rose by 2.9 percentage points,
but very small increases in the hourly wage and average hours of work per quarter were not
statistically significant. Combined, these impacts actually resulted in small, and not statistically
significant, decrease in average quarterly earnings of about $85. Being a BEdA exiter is also
estimated to reduce the participants’ reliance on unemployment insurance benefits, although
these are not statistically significant.
Table 8.6 Net Impact Estimates for CTC Basic Education for Adults for 2012/2013 Cohort
Outcome
Matched Sample Estimator Comparison Group Means Average
Treatment EffectFull Sample Matched Sample
With 0 W/O 0 With 0 W/O 0 Employmenta Short term −4.1*** 62.6 --- 56.2 --- Hourly wage Short term ($) −1.54*** 11.67 18.46 8.43 14.74 Short term, diff-in-diff ($) −0.93*** −1.80 −1.08 2.14 0.68 Quarterly hours Short term −18.7*** 245.7 388.7 205.2 358.6 Short term, diff-in-diff −41.9*** −12.1 8.1 78.3 95.2 Quarterly earnings Short term ($) −655*** 4,672 7,392 3,143 5,493 Short term, diff-in-diff ($) −712*** −1,154 −607 1,128 1,633 Unemployment Insurance Benefits Percent receiving, short term −2.6*** 9.4 --- 8.1 --- Benefits, short term ($) −35*** 196 2,087 142 1,743 NOTE: Monetary impacts in 2014 $. Sample sizes differ for virtually every entry in the table because of observations with missing data. If there were no missing data, the sample sizes would be those displayed in rows 2 and 3 of Table 8.4. * significant at the 0.10 level; ** significant at the 0.05 level; *** significant at the 0.01 level (two-tailed test). -- means not applicable. aShort term employment is defined as having more than $100 in quarterly earnings in the 3rd quarter after exit.
The short-term net impacts, shown in Tables 8.5 and 8.6, are either statistically
insignificantly different from 0 or quite negative for the BEdA exiters. In Table 8.6, the
employment rate goes down by over 4 percentage points, the average hourly wage drops by

W.E. Upjohn Institute for Employment Research 108
Net Impact and Benefit-Cost Estimates of the Workforce Development System in Washington State
nearly $1.00 per hour, and hours of work per quarter decreases by almost 42 hours. All together,
these declines lead to a drop in quarterly earnings of over $700 (about a 15 percent decline). The
reduced usage of unemployment insurance benefits estimated in the longer-term is also in the
short–term results.
As we have done in prior chapters, we average the short-term net impact estimates from
Table 8.5 and 8.6 to derive our preferred estimate for the short term. These averages are
presented in Table 8.7, with the preferred estimates in “boxes.” The results in this table suggest
that in the short term, the Basic Education for Adults offered at community and technical
colleges do not overcome the labor markets barriers that students face. The estimated net impacts
on labor market outcomes for the short term are negative. However, it should be noted that the
longer-term outcomes are either positive or less negative.
Table 8.7 Short-Term Net Impact Estimates for CTC Basic Education for Adults
2010/2011 Estimator
2012/2013 Estimator Average
Employmenta Short term −0.3 −4.1*** −2.2** Hourly wage Short term ($) −0.79** −1.54*** −1.17*** Short term, diff-in-diff ($) 0.38 −0.93*** −0.28 Quarterly hours Short term −0.5 −18.7*** −9.6 Short term, diff-in-diff 6.0 −41.9*** −18.0*** Quarterly earnings Short term ($) −279** −655*** −467*** Short term, diff-in-diff ($) 130 −712*** −291*** Unemployment Insurance Benefits Percent receiving, short term −5.7** −2.6*** −4.2*** Benefits, short term ($) −169** −35*** −102*** NOTE: Monetary data in 2014 $. * significant at the 0.10 level; ** significant at the 0.05 level; *** significant at the 0.01 level (two-tailed test). aShort term employment is defined as having more than $100 in quarterly earnings in the 3rd quarter after exit.
Figures 8.2 and 8.3 display graphically the net impacts over the first 15 and first 7
quarters after exiting the program for the 2010/2011 and 2012/2013 cohorts, respectively.

W.E. Upjohn Institute for Employment Research 109
Net Impact and Benefit-Cost Estimates of the Workforce Development System in Washington State
Figure 8.2 Estimated Net Impacts on Earnings (top) and Employment (bottom) of CTC Basic Education for Adults, by Quarter after Exit, 2010/2011 Cohort
NOTE: Earnings impacts are measured in 2014 $. Employment impacts are measured in percentage points. ATET means average treatment effect on the treated (defined in text).
-500
0
500
1000
1 2 3 4 5 6 7 8 9 10 11 12 13 14 15Quarter after Exit
ATET
-5
0
5
10
15
1 2 3 4 5 6 7 8 9 10 11 12 13 14 15Quarter after Exit
ATET

W.E. Upjohn Institute for Employment Research 110
Net Impact and Benefit-Cost Estimates of the Workforce Development System in Washington State
Figure 8.3 Estimated Net Impacts on Earnings (top) and Employment (bottom) of CTC Basic Education for Adults, by Quarter after Exit, 2012/2013 Cohort
NOTE: Earnings impacts are measured in 2014 $. Employment impacts are measured in percentage points. ATET means average treatment effect on the treated (defined in text).
-800
-600
-400
-200
0
1 2 3 4 5 6 7Quarter after Exit
ATET
-5
0
5
10
1 2 3 4 5 6 7Quarter after Exit
ATET

W.E. Upjohn Institute for Employment Research 111
Net Impact and Benefit-Cost Estimates of the Workforce Development System in Washington State
9 COMMUNITY AND TECHNICAL COLLEGES INTEGRATED BASIC EDUCATION AND SKILLS TRAINING (I-BEST) PROGRAM
Pioneered by Washington’s community and technical colleges, the Integrated Basic
Education and Skills Training Program (I-BEST) uses a team-teaching approach. Students work
with two teachers in the classroom: one provides job training and the other teaches basic skills in
reading, math, or English language. Students get the help they need while studying in the career
field of their choice; they learn by doing. Widely emulated in other states, the intent of I-BEST is
to quickly impart to adult students literacy, work, and college-readiness skills so they can move
through school and into living wage jobs faster.
Participant Characteristics
Table 9.1 provides descriptive data that compare the individuals in the treatment group,
i.e., individuals who exited from I-BEST in 2010/2011 or 2012/2013, to those in the comparison
group pool, registrants for Wagner Peyser services. The age range for including observations in
the comparison group pool was somewhat different from what was used for the other community
and technical college programs: the comparison group consists of Wagner Peyser (WP)
registrants who were 18 to 55 at the time of registering for WP service, and as with all other
programs in this study, individuals who were served by Washington’s education and training
programs were removed from the data. As noted in the previous chapter, we used the same age
range for the BEdA program.
The first two columns of numbers in the table compare the IBEST exiters in 2010/2011 to
WP registrants in that year, whereas the final two columns compare the exiters in 2012/2013 to
WP registrants in the same year.

W.E. Upjohn Institute for Employment Research 112
Net Impact and Benefit-Cost Estimates of the Workforce Development System in Washington State
Table 9.1 Descriptive Statistics for CTC I-BEST Treatment Group and Comparison Group Universe 2010/2011 2012/2013
Characteristics I-BEST Wagner Peyser I-BEST
Wagner Peyser
Demographics Female 69.3% 43.5% 67.3% 44.1% Race: White 48.3% 62.9% 49.1% 61.2% Black 12.2% 7.2% 11.6% 6.7% Hispanic 9.7% 15.2% 8.1% 14.1% Other race 28.8% 8.3% 30.2% 8.4% Missing 1.0% 6.3% 0.1%†† 9.6%†† Mean, age at registration 33.0 36.1 31.8 33.3 West WA 82.6% 59.8% 83.7% 60.1% Urban county 53.3% 43.7% 53.6% 45.4% Employment and Earnings (prior to registration) Percentage of prior quarters employed 57.0% 69.4% 55.4% 67.4% Average quarterly earningsa $2,779 $5,470 $2,435 $5,745 Mean, earnings trendb -$8.1†† $6.0†† $14.3 $125.5 Mean, earnings varianceb (in 106 $) $5.7 $17.4 $5.3 $12.8 Job turnover 20.4%†† 20.2%†† 19.7% 13.6% Percentage of quarters with multiple jobs 14.6%†† 15.6%†† 13.1%†† 12.2%†† Had earnings dip 48.8% 57.0% 45.6% 28.0% Mean, number of quarters since dip at registrationa 1.9 2.4 1.6 0.9 Average earnings dip size in percentagea 40.4% 43.6% 37.7% 19.3% Sample Size 1,296 282,152 1,316 159,773 NOTE: All differences in means are statistically significant at the 0.05 level (t-test) unless otherwise denoted. Monetary data in 2014 $. Prior employment and earnings variables are defined in Chapter 3 (pp. 24-25). aAverages include observations with values of zero. bTrend and variance calculations include quarters with zero earnings, if any. ††Differences in means are not statistically significant at 0.05 level (t-test).
The populations are quite different. The I-BEST participants are younger—averaging
about 31 as compared to 33 to 36 for the Wagner Peyser population—and are more likely to be
female and to be African American or other (nonwhite, nonHispanic) race. In both cohorts,
almost 70 percent of the treatment group members are female, whereas just under 45 percent of
the Wagner Peyser registrants are female. Similarly, in both cohorts, about 50 percent of the
Community and Technical College I-BEST clients are nonwhite as compared to only about 35
percent of the WP population. As with many of the programs analyzed in this study, the I-BEST
participants are much more likely to reside in an urban county and in western Washington than
are WP registrants.

W.E. Upjohn Institute for Employment Research 113
Net Impact and Benefit-Cost Estimates of the Workforce Development System in Washington State
The pre-program registration labor market experiences of the I-BEST exiters are also
quite different from their Wagner Peyser counterparts. Their percentage of quarters with
employment prior to being in an I-BEST program was about 55 percent, whereas the comparison
group pool was over 65 percent. The average quarterly earnings prior to program participation
are also significantly lower. The average quarterly earnings for the I-BEST population was only
about $2,400 to $2,800; whereas it was about $5,500 for the WP registrants.
Participation Model
Table 9.2 provides the results from the logit estimation of participation in I-BEST. The
independent variables in the participation model are exactly the same as those used in the other
community and technical college programs as documented in the two previous chapters. The
table provides the logit coefficient estimates and standard errors. While the magnitude of the
coefficients is not particularly meaningful, the sign and statistical significance are. If the
coefficient is negative, then a (positive) change in that variable will decrease the likelihood of
being a community and technical college I-BEST exiter.
The following variables are significantly correlated with being in the treatment group
(i.e., I-BEST participant) in both years of data: female, African American, other race, being from
western Washington, and size of an earnings dips in percentage terms. Not surprisingly, most of
the prior employment and earnings variables are significantly correlated with being in the
comparison group (WP registrants): employment percentage, earnings trend and variance, and
having experienced an earnings dip. All of these results are consistent with the theory that
relatively skilled individuals with inconsistent earnings and employment histories tend to register
for Wagner Peyser services at Work Source offices, whereas I-BEST participants, like

W.E. Upjohn Institute for Employment Research 114
Net Impact and Benefit-Cost Estimates of the Workforce Development System in Washington State
Table 9.2 Coefficient Estimates from a Logit Model of Participation in CTC I-BEST Program 2010/2011 2012/2013 Characteristics Coefficient Standard Error Coefficient Standard ErrorDemographics Female 0.676*** 0.064 0.707*** 0.063 Race: (White is omitted category) Black 0.432*** 0.094 0.512*** 0.096 Hispanic 0.077 0.105 −0.098 0.115 Other 1.377*** 0.068 1.446*** 0.068 Missing −1.786*** 0.281 −2.170*** 0.292 Age −0.013*** 0.003 0.011*** 0.003 West WA 1.215*** 0.082 1.304*** 0.083 Urban county -0.043 0.063 -0.222*** 0.063 Employment and Earnings (prior to registration) Percentage of prior quarters employed -0.003 0.001 −0.005*** 0.001 Average quarterly earningsa (in 102 $) 0.012*** 0.002 −0.019*** 0.002 Earnings trendb (in 102 $) −0.027*** 0.010 −0.000 0.000 Earnings varianceb (in 108 $) −2.190*** 0.441 −0.002 0.246 Job turnover −0.006*** 0.002 0.003 0.002 Percentage of quarters with multiple jobs 0.001 0.002 −0.002 0.002 Had earnings dip −0.143 0.181 −0.341* 0.180 Number of quarters since dip at registration −0.090*** 0.018 0.014 0.019 Earnings dip size in percentage 0.362** 0.179 0.954*** 0.182 Constant −5.220*** 0.232 −5.235*** 0.222 Observations 283,448 161,089 NOTE: Model also includes dummy variables for sector of most recent employment (22 categories). aAverage includes quarters with values of zero, if any. bTrend and variance calculations include quarters with zero earnings, if any. * p < 0.05, ** p < 0.01, *** p < 0.001 BEdA participants, are low-skilled individuals seeking to upgrade their employment
opportunities.
Propensity Score Statistics
Table 9.3 provides the mean propensity scores and 20th percentile indicator for the
community and technical college I-BEST analyses. The mean propensity scores for the treatment
groups are roughly 0.02 and 0.04 for the 2010/2011 and 2012/2013 cohorts, respectively,
whereas they are less than 0.01 for the comparison group for both cohorts. The 20th percentile
indicator is approximately 67 percent and 75 percent for the two cohorts. These modest
percentages suggest that the propensity score model may have been only modestly successful in

W.E. Upjohn Institute for Employment Research 115
Net Impact and Benefit-Cost Estimates of the Workforce Development System in Washington State
discriminating between the I-BEST and Wagner Peyser participants. However, as noted in the
following section, the statistical match ended up nicely balanced.
Table 9.3 Indicators of Propensity Score (p-score) Model Quality for CTC I-BEST Analyses Statistic 2010/2011 2012/2013
Mean p-score, I-BEST 0.017 0.037
Mean p-score, Wagner Peyser 0.005 0.008
Percentile Wagner Peyser, at 20th percentile I-BEST 66.7% 75.0%
Statistical Match
Table 9.4 provides data about the sample sizes, number of matched observations that
were duplicates, and a comparison of descriptive statistics between the treatment and comparison
group observations. Only three of the differences in means are still significant suggesting that the
match produced reasonably close “matches.” The top panel of statistics in the table shows that
less than 5 percent of the observations from the 2010/2011 and 2012/2013 comparison group
pools were used multiple times; a relatively small percentage. Furthermore, the maximum
number of repeats is only 4 and 6 in the two matches. All in all, the match was quite successful
in achieving balanced distributions in the treatment and comparison groups.
Balance
The fact that balance was achieved is shown in Figure 9.1, which shows the standardized
differences in means before and after the match. The figure shows that all of the variates in the
match satisfy the +/− 0.10 criterion for balance.

W.E. Upjohn Institute for Employment Research 116
Net Impact and Benefit-Cost Estimates of the Workforce Development System in Washington State
Table 9.4 Matching Algorithm Statistics and Post-Match Comparison of Characteristics for CTC I-BEST Analyses
2010/2011 2012/2013 Statistic/Characteristic I-BEST Wagner Peyser I-BEST Wagner PeyserSample size 1,296 285,046 1,316 160,783 Sample size used in match 1,296 282,152 1,316 159,773 Matched sample size 1,296 1,296 1,314 1,314 Number of observations used once --- 1,208 --- 1,173 Number of observations used multiple times --- 38 --- 60 Maximum number of repeats --- 4 --- 6 Demographics Female 69.4% 69.4% 67.3% 67.3% Race: White 48.3% 46.8% 49.2% 50.1% Black 12.2% 11.9% 11.6% 11.1% Hispanic 9.7% 9.6% 8.1% 6.8% Other race 28.8% 30.3% 30.1% 31.4% Missing 0.1% 0.1% 0.1% 0.1% Mean, age at registration 33.0 33.3 31.8 31.6 West WA 82.6% 83.3% 83.6% 85.4% Urban county 53.3% 55.8% 53.6% 55.0% Employment and Earnings (prior to registration) Percentage of prior quarters employed 57.0% 55.0% 55.4% 53.3% Average quarterly earningsa $2,778 $2,838 $2,438 $2,365 Mean, earnings trendb -$8.1 -$8.0 $14.4 $30.9 Mean, earnings varianceb (in 106 $) $5.7 $5.8 $5.4 $5.7 Job turnover 20.4%** 18.7%** 19.6% 19.1% Percentage of quarters with multiple jobs 14.6% 13.5% 13.1% 12.7% Had earnings dip 48.8%* 45.3%* 45.5% 46.0% Mean, number of quarters since dip at registrationa 1.9* 1.7* 1.6 1.7 Average earnings dip size in percentagea 40.5% 37.8% 37.7% 37.1% Sample Size 1,296 1,296 1,314 1,314 NOTE: Monetary values in 2014 $. Statistically significant difference in means denoted by *, **, ***. * p < 0.10; ** p < 0.05; *** p < 0.01 (two-tailed test). – means not applicable. aAverages include observations with values of zero. bTrend and variance calculations include quarters with zero earnings, if any.
Net Impacts
The major purpose of the study is to estimate the net impacts of the education and
training programs on clients, and Tables 9.5 and 9.6 provide the estimated net impacts for I-
BEST programs. As with comparable tables in the prior chapters, the first table displays the
short-term (3 quarters after exit) and the longer-term (9–12 quarters after exit) outcomes for the
2010/2011 cohort of program exiters. The second table is limited to the short-term net impacts
for the 2012/2013 cohort. Our preferred specification for the estimates is the average treatment

W.E. Upjohn Institute for Employment Research 117
Net Impact and Benefit-Cost Estimates of the Workforce Development System in Washington State
Figure 9.1 Standardized Difference in Means, Pre- and Post-match, CTC I-BEST
NOTE: Standardized difference in means between comparison group pool and treatment group denoted by dot. Standardized difference in means between matched comparison group and treatment group denoted by x. Red vertical lines at +/− 0.10.
-50 0 50Standardized % bias across covariates
earn_meanpctemployed
earn_varmissraceage_start
time_since_diphispanic
had_earnings_dipearn_dippct
pctqmjobearn_trend
turnoverblackurbanwestfem
othrace
-50 0 50Standardized % bias across covariates
earn_meanmissrace
pctemployedearn_varhispanic
age_startearn_trend
pctqmjoburbanblack
turnovertime_since_dip
had_earnings_dipearn_dippct
femwest
othrace

W.E. Upjohn Institute for Employment Research 118
Net Impact and Benefit-Cost Estimates of the Workforce Development System in Washington State
Table 9.5 Net Impact Estimates for CTC I-BEST Program for 2010/2011 Cohort
Outcome
Matched Sample Estimator Comparison Group Means Average
Treatment EffectFull Sample Matched Sample
With 0 W/O 0 With 0 With/O 0 Employment (percentage points)a Short term 7.1*** 56.1 --- 50.3 --- Ever-employed, longer term 6.6*** 67.7 --- 61.9 --- Percent of quarters, longer term 7.5*** 57.7 --- 51.2 --- Percent of quarters, longer term, diff-in-diff 12.3*** −3.9 --- 1.5 --- Average hourly wage Short term ($) 0.37 10.09 17.78 7.32 14.42 Short term, diff-in-diff ($) 1.58*** −2.86 −2.13 −0.60 −0.69 Longer term ($) 0.41 11.16 18.73 8.16 15.15 Longer term, diff-in-diff ($) 1.61*** −1.79 −1.16 0.24 0.26 Average quarterly hours Short term 33.2*** 214.7 378.1 177.2 349.0 Short term, diff-in-diff 54.3*** −24.7 18.7 -3.5 21.4 Longer term 44.3*** 238.5 382.0 197.3 346.6 Longer term, diff-in-diff 65.4*** −0.9 26.5 16.6 18.2 Average quarterly earnings Short term ($) 276* 3,908 6,881 2,592 5,105 Short term, diff-in-diff ($) 814*** −1,228 −529 −289 -1 Longer term ($) 438*** 4,695 7,439 3,150 5,422 Longer term, diff-in-diff ($) 976*** −440 75 270 422 Unemployment Insurance Benefits (average quarterly) Percent receiving, short term -8.8*** 22.7 --- 15.8 --- Benefits, short term ($) -252*** 710 3,128 415 2,610 Percent receiving, longer term -1.5 15.1 --- 11.0 --- Benefits, longer term ($) -29** 169 1,988 106 1,630 NOTE: Monetary impacts in 2014 $. Sample sizes differ for virtually every entry in the table because of observations with missing data. If there were no missing data, the sample sizes would be those displayed in rows 2 and 3 of Table 9.4. * significant at the 0.10 level; ** significant at the 0.05 level; *** significant at the 0.01 level (two-tailed test). -- means not applicable. aShort term employment is defined as having more than $100 in quarterly earnings in the 3rd quarter after exit. Ever-employed, longer term is defined as having more than $100 in any quarter from the 9th to the 12th quarter after exit. Percent of quarters, longer-term takes on values of 0%, 25%, 50%, 75%, or 100% for an observation depending on whether the observation was employed for 0, 1, 2, 3, or 4 quarters between the 9th and 12th quarter after exit.
effect for difference-in-differences. The final four columns of the tables provide the means of the
comparison group, both the full comparison group pool and the matched comparison group.
These columns are provided so that the net impacts can be estimated on a percentage basis.
The longer-term net impacts for the community and technical college I-BEST
participants are shown in Table 9.5. These estimates suggest that the I-BEST exiters gain
substantial labor market outcomes. The employment rate rose by 12.3 percentage points; the
average hourly wage rose by $1.61; and the average hours of work per quarter went up by 65

W.E. Upjohn Institute for Employment Research 119
Net Impact and Benefit-Cost Estimates of the Workforce Development System in Washington State
hours. Combined, these impacts resulted in an increase in average quarterly earnings of almost
$1,000. The longer-term net impacts on the receipt of UI benefits are inconsequential—an
estimated decrease in receipt of 1.5 percentage points (not significant) and reduction in quarterly
benefits of about $30.
Table 9.6 Net Impact Estimates for CTC I-BEST Program for 2012/2013 Cohort
Outcome
Matched Sample Estimator Comparison Group Means Average
Treatment EffectFull Sample Matched Sample
With 0 W/O 0 With 0 W/O 0 Employment (percentage points)a Short term 2.2 62.6 --- 59.1 --- Average hourly wage Short term ($) −1.15*** 11.67 18.46 9.59 16.05 Short term, diff-in-diff ($) 0.46 −1.80 −1.08 1.79 1.49 Average quarterly hours Short term 19.3** 245.7 388.7 213.8 357.9 Short term, diff-in-diff 40.3*** −12.3 8.0 36.7 55.0 Average quarterly earnings Short term ($) −263* 4,674 7,395 3,485 5,834 Short term, diff-in-diff ($) 359** −1,157 −609 733 1,135 Unemployment Insurance Benefits (average quarterly) Percent receiving, short term -4.4*** 9.4 --- 7.5 --- Benefits, short term ($) -50** 196 2,088 109 1,443 NOTE: Monetary impacts in 2014 $. Sample sizes differ for virtually every entry in the table because of observations with missing data. If there were no missing data, the sample sizes would be those displayed in rows 2 and 3 of Table 9.4. * significant at the 0.10 level; ** significant at the 0.05 level; *** significant at the 0.01 level (two-tailed test). -- means not applicable. aShort term employment is defined as having more than $100 in quarterly earnings in the 3rd quarter after exit.
The short-term net impacts, shown in Tables 9.5 and 9.6, are also quite positive for the I-
BEST exiters, although they are not as large as the longer-term net impacts. The difference-in-
differences estimators for the short term in the 2010/2011 cohort are all positive and statistically
significant. Employment rises by over 7 points; the average hourly wage goes up by $1.58; and
average quarterly hours rises by almost 55 hours. These increases combine to increase average
quarterly earnings by over $800. Table 9.6 also shows positive outcomes in the short term,
however, the increase in the employment rate and average hourly wage rate are not statistically
significant. These are paired with an increase in average quarterly hours of over 40 hours and

W.E. Upjohn Institute for Employment Research 120
Net Impact and Benefit-Cost Estimates of the Workforce Development System in Washington State
average quarterly earnings of over $350. Both tables show that in the short term, the net impact
on UI benefits is significantly negative.
As we have done in prior chapters, we average the short-term net impact estimates from
Table 9.5 and 9.6 to derive our preferred estimate for the short term. These averages are
presented in Table 9.7, with the preferred estimates in “boxes.” Given that the constituent net
impact estimates are fairly positive, it is not surprising that the preferred estimates in Table 9.7
are positive. These estimates suggests that three quarters after exiting, I-BEST participants have
employment rates that are almost 5 percentage points higher; average hourly wage rates that are
over $1.00 per hour higher; average hours worked in a quarter that are almost 50 hours greater;
and average quarterly earnings that are almost $600 greater than comparable individuals who
registered for Wagner Peyser services.
Table 9.7 Short-Term Net Impact Estimates for CTC I-BEST
2010/2011 Estimator
2012/2013 Estimator Average
Employmenta Short term 7.1*** 2.2 4.7*** Hourly wage Short term ($) 0.37 −1.15*** −0.39 Short term, diff-in-diff ($) 1.58*** 0.46 1.02*** Quarterly hours Short term 33.2*** 19.3** 26.3*** Short term, diff-in-diff 54.3*** 40.3*** 47.3*** Quarterly earnings Short term ($) 276* −263* 6 Short term, diff-in-diff ($) 814*** 359** 586*** Unemployment Insurance Benefits Percent receiving, short term −8.8*** −4.4*** −6.6*** Benefits, short term ($) −252*** −50** −156*** NOTE: Monetary data in 2014 $. * significant at the 0.10 level; ** significant at the 0.05 level; *** significant at the 0.01 level (two-tailed test). Tests of significance are not appropriate for Average column. aShort term employment is defined as having more than $100 in quarterly earnings in the 3rd quarter after exit.

W.E. Upjohn Institute for Employment Research 121
Net Impact and Benefit-Cost Estimates of the Workforce Development System in Washington State
Figures 9.2 and 9.3 display graphically the net impacts over the first 15 and first 7
quarters after exiting the program for the 2010/2011 and 2012/2013 cohorts, respectively. As can
be seen, they are positive and statistically significant through most of the follow-up quarters.
Figure 9.2 Estimated Net Impacts on Earnings (top) and Employment (bottom) of CTC I-BEST, by Quarter
after Exit, 2010/2011 Cohort
NOTE: Earnings impacts are measured in 2014 $. Employment impacts are measured in percentage points. ATET means average treatment effect on the treated (defined in text).
-1000
-500
0
500
1000
1500
1 2 3 4 5 6 7 8 9 10 11 12 13 14 15Quarter after Exit
ATET
-5
0
5
10
15
20
1 2 3 4 5 6 7 8 9 10 11 12 13 14 15Quarter after Exit
ATET

W.E. Upjohn Institute for Employment Research 122
Net Impact and Benefit-Cost Estimates of the Workforce Development System in Washington State
Figure 9.3 Estimated Net Impacts on Earnings (top) and Employment (bottom) of CTC I-BEST, by Quarter after Exit, 2012/2013 Cohort
NOTE: Earnings impacts are measured in 2014 $. Employment impacts are measured in percentage points. ATET means average treatment effect on the treated (defined in text).
0
500
1000
1500
2000
1 2 3 4 5 6 7Quarter after Exit
ATET
-5
0
5
10
15
1 2 3 4 5 6 7Quarter after Exit
ATET

W.E. Upjohn Institute for Employment Research 123
Net Impact and Benefit-Cost Estimates of the Workforce Development System in Washington State
10 PRIVATE CAREER SCHOOL PROGRAMS
Private Career (proprietary) School programs train individuals who have completed high
school or its equivalency for specific occupations. The institutions are privately operated, but
they are monitored by the WTECB. The occupations for which students are being trained run the
gamut from cosmetology to truck driving to computer programming and many others. The
administrative data come from a voluntary data collection effort administered by the WTECB.
Because of its voluntary nature, the representativeness or generalizability of the data is uncertain,
but thought to be reasonable.
Participant Characteristics
Table 10.1 provides descriptive data that compare the individuals in the treatment group
to those in the comparison group pool. As with many of the other programs including those at
community and technical colleges, the comparison group consists of Wagner Peyser (WP)
program registrants who were 16 to 70 at the time of registration in 2010/2011 or 2012/2013
with individuals who were served by Washington’s education and training programs removed
from the data. The first two columns of numbers compare the private career school students who
exited in 2010/2011 to individuals in the comparison group. The final two columns compare the
exiters in 2012/2013 to WP registrants in the same year.
The populations are somewhat different. Over 50 percent of the Private Career School
participants are females compared to under 45 percent of the WP registrants. The Private Career
School students are also six to ten years younger than the WP comparison group, on average. A
smaller share of the Private Career School participants are minorities than of Wagner Peyser

W.E. Upjohn Institute for Employment Research 124
Net Impact and Benefit-Cost Estimates of the Workforce Development System in Washington State
Table 10.1 Descriptive Statistics for Private Career School Treatment Group and Comparison Group Universe
2010/2011 2012/2013
Characteristics Training Program
Wagner Peyser
Training Program
Wagner Peyser
Demographics Female 52.1% 43.2% 51.0% 44.4% Race: White 56.9% 64.7% 61.5% 62.4% Black 7.9% 6.7% 8.2% 6.4% Hispanic 6.9% 14.4% 9.8% 13.8% Other race 14.5% 8.1% 14.9% 8.2% Missing 13.8% 6.1% 5.6% 9.2% Mean, age at registration 30.3 39.5 30.7 35.7 Disability 0.5% 5.2% 0.8% 5.1% West WA 72.4% 60.3% 70.4% 60.3% Urban county 60.2% 44.1% 29.6% 45.5% Employment and Earnings (prior to registration) Percentage of prior quarters employed 55.5% 70.4% 52.8% 67.6% Average quarterly earnings $3,113 $5,944 $2,948 $6,152 Mean, earnings trend $40.7 -$5.5 $43.7 $115.7 Mean, earnings variance (in 106 $) $9.2 $19.4 $9.4 $14.0 Job turnover 29.6% 19.2% 29.1% 12.7% Percentage of quarters with multiple jobs 12.5% 14.9% 11.3% 11.6% Had earnings dip 42.2% 57.5% 35.5% 27.9% Mean, number of quarters since dip at registration 1.6 2.4 1.3 0.9 Average earnings dip size in percentage 33.4% 44.1% 27.6% 19.0% Sample Size 18,509 333,316 16,436 182,399 NOTE: All differences in means are statistically significant at the 0.05 level (t-test). Monetary data in 2014 $. Prior employment and earnings variables are defined in Chapter 3 (pp. 24-25). aAverages include observations with values of zero. bTrend and variance calculations include quarters with zero earnings, if any.
registrants. A stark difference arises with disability status. Only about 0.5 percent of the Private
Career School students identify themselves as disabled, whereas over five percent of the WP
registrants are self-identified as disabled. Private Career School students are disproportionately
from urban counties and from western Washington (inexplicably the percentage of Private
Career School students from urban counties drops to under 30 percent in the 2012/2013 cohort).
In terms of labor market experience prior to schooling, the Private Career School students
had lower levels of average quarterly earnings—about $3,000 compared to almost $6,000—lower
prior employment rates, and more job turnover. The lower earnings may be explained by the
younger ages of the Private Career School students.

W.E. Upjohn Institute for Employment Research 125
Net Impact and Benefit-Cost Estimates of the Workforce Development System in Washington State
Participation Model
Table 10.2 provides the results from the logit estimation of participation in private career
schools. As with the analyses in the prior chapters, this regression used a 0 – 1 dependent
variable, with the private career students being coded as one. The table provides the logit
coefficient estimates and standard errors. While the magnitude of the coefficients is not
particularly meaningful, the sign and statistical significance are. If the coefficient is negative,
then a (positive) change in that variable will decrease the likelihood of being an exiter from a
private career school.
Table 10.2 Coefficient Estimates from a Logit Model of being a Private Career School Student 2010/2011 2012/2013 Characteristics Coefficient Standard Error Coefficient Standard ErrorDemographics Female 0.070*** 0.017 0.096*** 0.019 Race: (White is the omitted category) Black −0.237*** 0.031 0.243*** 0.034 Hispanic −0.561*** 0.032 −0.348*** 0.032 Other 0.495*** 0.024 0.655*** 0.027 Missing 0.625*** 0.025 −0.602*** 0.038 Age −0.048*** 0.001 −0.013*** 0.001 Disability −2.198*** 0.103 −1.818*** 0.091 West WA 0.284*** 0.020 0.760*** 0.021 Urban county 0.631*** 0.018 −1.006*** 0.021 Employment and Earnings (prior to registration) Percentage of prior quarters employed −0.005*** 0.000 −0.012*** 0.000 Average quarterly earningsa (in 102 $) −0.001** 0.000 −0.003*** 0.000 Earnings trendb (in 102 $) 0.001 0.002 −0.004*** 0.001 Earnings varianceb (in 108 $) −0.065 0.034 0.152*** 0.020 Job turnover 0.035*** 0.000 0.034*** 0.000 Percentage of quarters with multiple jobs −0.022*** 0.001 −0.016*** 0.001 Had earnings dip 0.147** 0.049 −0.056 0.056 Number of quarters since dip at registration −0.093*** 0.005 0.028*** 0.007 Earnings dip size in percentage −0.368*** 0.050 −0.010 0.058 Constant −2.334*** 0.077 −2.529*** 0.073 Observations 351,825 198,835 NOTE: Model also includes dummy variables for sector of most recent employment (22 categories). aAverage includes quarters with values of zero, if any. bTrend and variance calculations include quarters with zero earnings, if any. *,**,*** indicate statistical significance at p = 0.05, 0.01, and 0.001, respectively.
The coefficient estimates seem quite reasonable. The following variables are significantly
correlated with being in the treatment group (i.e., student at a Private Career School): Female,

W.E. Upjohn Institute for Employment Research 126
Net Impact and Benefit-Cost Estimates of the Workforce Development System in Washington State
being a nonHispanic NonBlack minority, residing in western Washington, residing in an urban
county (except in the 2012/2103 cohort), and job turnover. The following variables are
significantly correlated with being in treatment group: minority status, age at registration, having
a disability, average prior quarterly earnings, and having an earnings dip. All other covariates
have insignificant coefficients, or coefficients that switch signs across the two cohorts.
Propensity Score Statistics
The propensity score for an observation is the predicted probability using the estimated
coefficients and the observation’s actual data. If the logit model has substantial predictive
capability, then the mean propensity score for the comparison group should be small (near zero)
and should be much less than the mean score for the treatment. Table 10.3 provides these means
as well as the 20th percentile indicator for the Private Career School exiters. The mean
propensity scores for the treatment group are approximately 0.16 and 0.22; whereas they are 0.05
and 0.07 for the comparison group. The 20th percentile indicators are around 64 percent. The
means and the 20th percentile statistic indicate that the logit model of participation discriminates
only moderately well between treatment and comparison group observations.
Table 10.3 Indicators of Propensity Score (p-score) Model Quality for Private Career Schools Statistic 2010/2011 2012/2013
Mean p-score, Private Career Schools 0.160 0.224
Mean p-score, Wagner Peyser 0.047 0.070
Percentile Wagner Peyser, at 20th percentile Private Career Schools 64.2% 64.4%
Statistical Match
The statistical matching that was done was to use a nearest neighbor approach with the
propensity score. For every observation j in T, we found the observation k in U that minimized
the absolute value of the difference between the propensity score for j and k. We then added k to

W.E. Upjohn Institute for Employment Research 127
Net Impact and Benefit-Cost Estimates of the Workforce Development System in Washington State
the comparison group sample as long as the difference between the two p-scores did not exceed
the caliper. The statistical match was done with replacement, so some observations in U were the
“matches” for more than one observation in the treatment group and were duplicated in the
comparison sample. Table 10.4 provides data about the sample sizes, number of matched
observations that were duplicates, and a comparison of descriptive statistics between the
treatment and comparison group observations. The balance between the private career school
Table 10.4 Matching Algorithm Statistics and Post-Match Comparison of Characteristics for Private Career
Schools Analyses 2010/2011 2012/2013
Statistic/Characteristic Private Career
School Labor
Exchange Private Career
School Labor
Exchange Sample size 18,509 335,449 16,436 183,505 Sample size used in match 18,509 333,316 16,436 182,399 Matched sample size 18,261 18,261 16,266 16,266 Number of observations used once --- 11,648 --- 8,818 Number of observations used multiple times --- 1,813 --- 2,139 Maximum number of repeats --- 147 --- 73 Demographics Female 52.0% 52.0% 51.0% 51.0% Race: White 57.2% 56.8% 61.7% 62.3% Black 7.9%*** 9.0%*** 8.1% 8.5% Hispanic 7.0% 6.6% 9.9%*** 8.7%*** Other race 14.3%* 15.0%* 14.7% 15.0% Missing 13.6%*** 12.5%*** 5.7% 5.5% Mean, age at registration 30.4*** 30.8*** 30.7*** 30.0*** Disability 0.5%** 0.7%** 0.8% 0.7% West WA 72.1%** 70.9%** 70.2%* 69.2%* Urban county 59.8% 60.0% 29.9%*** 28.2%*** Employment and Earnings (prior to registration) Percentage of prior quarters employed 55.7%*** 48.8%*** 53.1%*** 46.8%*** Average quarterly earningsa $3,148*** $2,834*** $2,976*** $2,579*** Mean, earnings trendb $42.2** $32.2** $45.4*** −$6.2*** Mean, earnings varianceb (in 106 $) $9.3* $8.7* $9.5 $9.2 Job turnover 28.7%*** 27.2%*** 28.4%*** 26.2%*** Percentage of quarters with multiple jobs 12.6%*** 11.5%*** 11.3%*** 10.3%*** Had earnings dip 42.4%*** 37.8%*** 35.5%*** 33.9%*** Mean, number of quarters since dip at registrationa 1.7*** 1.5*** 1.3** 1.2** Average earnings dip size in percentagea 33.5%*** 30.0%*** 27.5%** 26.5%** Sample Size 18,261 18,261 16,266 16,266 NOTE: Monetary values in 2014 $. Statistically significant difference in means denoted by *, **, ***. * p < 0.10; ** p < 0.05; *** p < 0.01 (two-tailed test). – means not applicable. aAverages include observations with values of zero. bTrend and variance calculations include quarters with zero earnings, if any.

W.E. Upjohn Institute for Employment Research 128
Net Impact and Benefit-Cost Estimates of the Workforce Development System in Washington State
participants and matched comparison group is not especially strong. Many of the differences in
means in the table are significant, and more than 10 percent of the comparison group pool
observations were used multiple times.
Balance
The fact that only most of the variables in Table 10.4 show significantly different means
suggests that the matched populations are not well-balanced. However, Figure 10.1, which
shows the standardized differences in means before and after the match, indicates that all but one
of the variates in the match satisfy the +/− 0.10 criterion for balance in both cohorts.
Net Impacts
Tables 10.5 and 10.6 provide the estimated net impacts of attending private career
schools on clients. As with comparable tables in the prior chapters, the first table displays the
short-term (3 quarters after exit) and the longer-term (9-12 quarters after exit) outcomes for the
2010/2011 cohort of program exiters. The second table is limited to the short-term net impacts
for the 2012/2013 cohort. The coefficient estimates that are in “boxes” present our preferred
estimates using the preferred specification as chosen by WTECB staff—a difference-in-
differences specification.
The longer-term net impacts in Table 10.5 show positive outcomes for private career
school students. Although the change in the employment rate is an insignificant decrease, hourly
wages increase by almost $0.80 on average and average quarterly hours rise by 12 hours. These
increases result in an estimated net increase in quarterly earnings of $509. The longer-term
results also show a statistically significant decrease in unemployment insurance benefits and
recipiency.

W.E. Upjohn Institute for Employment Research 129
Net Impact and Benefit-Cost Estimates of the Workforce Development System in Washington State
Figure 10.1 Standardized Difference in Means, Pre- and Post-match, Private Career Schools
NOTE: Standardized difference in means between comparison group pool and treatment group denoted by dot. Standardized difference in means between matched comparison group and treatment group denoted by x. Red vertical lines at +/− 0.10.
The short-term impacts displayed in Tables 10.5 and 10.6 are, like the longer-term impacts,
positive. In the former table, the estimated net impact on quarterly earnings is a little over
-100 -50 0 50
Standardized % bias across covariates
age_startearn_mean
pctemployedhad_earnings_dip
time_since_dipdisabled
earn_dippcthispanic
earn_varpctqmjob
blackearn_trend
femothrace
westurban
turnover
-50 0 50 100
Standardized % bias across covariates
earn_meanage_start
pctemployedurban
disabledhispanic
earn_varearn_trend
pctqmjobblack
femhad_earnings_dip
time_since_dipothrace
earn_dippctturnover

W.E. Upjohn Institute for Employment Research 130
Net Impact and Benefit-Cost Estimates of the Workforce Development System in Washington State
Table 10.5 Net Impact Estimates for Private Career School Programs for 2010/2011 Cohort
Matched Sample
Estimator Comparison Group Means Average
Treatment EffectFull Sample Matched Sample
Outcome With 0 W/O 0 With 0 W/O 0 Employment (percentage points)a Short term 7.2*** 54.1 50.2 Ever-employed, longer term 1.5** 64.9 62.4 Percent of quarters, longer term 4.5*** 55.2 50.6 Percent of quarters, longer term, diff-in-diff −0.4 −7.3 8.3 Hourly wage Short term ($) 1.57*** 9.89 18.05 7.77 15.23 Short term, diff-in-diff ($) 1.18*** −3.75 −2.46 −0.13 −1.28 Longer term (4-quarter average) ($) 1.17*** 10.75 18.87 8.79 16.58 Longer term, diff-in-diff ($) 0.78*** −2.89 −1.62 0.89 0.21 Quarterly hours Short term 42.3*** 205.4 374.7 174.6 342.1 Short term, diff-in-diff 24.2*** −38.5 13.1 20.3 29.4 Longer term (4-quarter average) 30.1*** 226.0 378.1 194.4 346.2 Longer term, diff-in-diff 12.0** −17.9 20.1 40.1 38.4 Quarterly earnings Short term ($) 835*** 3,792 6,920 2,732 5,354 Short term, diff-in-diff ($) 709*** −1,654 −771 −193 −66 Longer term (4-quarter average) ($) 635*** 4,475 7,409 3,445 6,047 Longer term, diff-in-diff ($) 509*** −972 −242 520 719 Unemployment Insurance Benefits Percent receiving, short term −7.3*** 24.1 13.8 Benefits, short term ($) −227*** 783 3,242 412 2,979 Ever-received, longer term −2.4*** 14.9 9.8 Benefits, longer term (4-quarter average) ($) −20*** 170 2,016 103 1,898 NOTE: Monetary impacts in 2014 $. Sample sizes differ for virtually every entry in the table because of observations with missing data. If there were no missing data, the sample sizes would be those displayed in rows 2 and 3 of Table 9.4. * significant at the 0.10 level; ** significant at the 0.05 level; *** significant at the 0.01 level (two-tailed test). -- means not applicable. aShort term employment is defined as having more than $100 in quarterly earnings in the 3rd quarter after exit. Ever-employed, longer term is defined as having more than $100 in any quarter from the 9th to the 12th quarter after exit. Percent of quarters, longer-term takes on values of 0%, 25%, 50%, 75%, or 100% for an observation depending on whether the observation was employed for 0, 1, 2, 3, or 4 quarters between the 9th and 12th quarter after exit. $700, comprised of increases in employment, average hourly wage, and average quarterly hours.
The hours worked in a quarter net impact is estimated to go down by 5.4 hours for the 2012/2013
cohort; however, the employment rate rises by 1.9 percentage points and the average hourly
wage net impact shows an increase of about $0.50 per hour. These positives re-enforce each
other so that average quarterly earnings rise by $183, which is approximately a 3 percent
increase. Also, in the short-term, recipiency of and benefit levels of unemployment insurance
decrease significantly in both cohorts.

W.E. Upjohn Institute for Employment Research 131
Net Impact and Benefit-Cost Estimates of the Workforce Development System in Washington State
Table 10.6 Net Impact Estimates for Private Career School Programs for 2012/2013 Cohort
Matched Sample
Estimator Comparison Group Means Average
Treatment EffectFull Sample Matched Sample
Outcome With 0 W/O 0 With 0 W/O 0 Employmenta Short term 1.9** 60.7 57.1 Hourly wage Short term ($) 0.33** 11.39 18.57 9.31 16.07 Short term, diff-in-diff ($) 0.50** −2.77 −1.50 1.50 0.42Quarterly hours Short term 15.4*** 235.9 384.8 209.5 361.8 Short term, diff-in-diff −5.4 −26.5 1.3 59.4 70.5 Quarterly earnings Short term ($) 253*** 4,513 7,361 3,473 5,997 Short term, diff-in-diff ($) 183** −1,679 −945 640 1,018 Unemployment Insurance Benefits Percent receiving, short term −4.6*** 9.6 7.8 Benefits, short term ($) −74*** 202 2,110 141 1,823 NOTE: Monetary impacts in 2014 $. Sample sizes differ for virtually every entry in the table because of observations with missing data. If there were no missing data, the sample sizes would be those displayed in rows 2 and 3 of Table 9.4. * significant at the 0.10 level; ** significant at the 0.05 level; *** significant at the 0.01 level (two-tailed test). -- means not applicable. aShort term employment is defined as having more than $100 in quarterly earnings in the 3rd quarter after exit.
As we have done in prior chapters, we average the short-term net impact estimates from
Table 10.5 and 10.6 to derive our preferred estimate for the short term. These averages are
presented in Table 10.7, with the preferred estimates in “boxes.” The results in this table suggest
Table 10.7 Short-Term Net Impact Estimates for Private Career School Programs
2010/2011 Estimator
2012/2013 Estimator Average
Employmenta Short term 7.2*** 1.9** 4.5*** Hourly wage Short term ($) 1.57*** 0.33** 0.95*** Short term, diff-in-diff ($) 1.18*** 0.50** 0.84*** Quarterly hours Short term 42.3*** 15.4*** 28.8*** Short term, diff-in-diff 24.2*** −5.4 9.4*** Quarterly earnings Short term ($) 835*** 253*** 544*** Short term, diff-in-diff ($) 709*** 183** 446*** Unemployment Insurance Benefits Percent receiving, short term −7.3*** −4.6*** −5.9*** Benefits, short term ($) −227*** −74*** −150*** NOTE: Monetary data in 2014 $. * significant at the 0.10 level; ** significant at the 0.05 level; *** significant at the 0.01 level (two-tailed test). aShort term employment is defined as having more than $100 in quarterly earnings in the 3rd quarter after exit.

W.E. Upjohn Institute for Employment Research 132
Net Impact and Benefit-Cost Estimates of the Workforce Development System in Washington State
that in the short term, private career school programs provide substantially positive labor market
outcomes for exiters. The short-term outcomes are, in fact, greater than the estimated longer-term
impacts suggesting that the positive short-term impacts are attenuated, although they certainly do
not disappear.
Figures 10.2 and 10.3 display the time paths of employment and earnings for Private
Career School exiters for the 2010/2011 and 2012/2013 cohorts, respectively.
Subgroup Analysis
Tables 10.8 and 10.9 provide net impact estimates for the subgroup of the private career
school participants for whom the administrative data indicated had completed their programs.
Over 75 percent of the private career school students in these cohorts were reported to be
completers, so the subsamples consist of a large share of the total treatment samples. The results
are different and much stronger for completers than noncompleters, for the most part. For the
2010/2011 cohort of exiters, the short-term employment rate for the two subgroups are −8.8 and
1.0 percentage points for the noncompleters and completers, respectively. The estimated net
impacts for the average hourly wage are −$0.60 and $1.17; for the average quarterly hours
worked: −22.8 and 22.1; and for the average quarterly earnings: −$145 and $698. For the
2012/2013 cohort, the short-term employment rate net impacts for the two subgroups are −5.4
and 3.9 percentage points, for the noncompleters and completers, respectively. The average
hourly wage net impacts are −$0.75 and $1.03 and the average quarterly hours worked net
impacts are −31 and 7. All together, the difference in the net impacts on quarterly earnings is
over $750. Completers’ net impact on earnings is about $400; whereas it is a reduction in
quarterly earnings for noncompleters of about $350.

W.E. Upjohn Institute for Employment Research 133
Net Impact and Benefit-Cost Estimates of the Workforce Development System in Washington State
Figure 10.2 Estimated Net Impacts on Earnings (top) and Employment (bottom) of Private Career School Attendance, by Quarter after Exit, 2010/2011 Cohort
NOTE: Earnings impacts are measured in 2014 $. Employment impacts are measured in percentage points. ATET means average treatment effect on the treated (defined in text).
0
200
400
600
800
1 2 3 4 5 6 7 8 9 10 11 12 13 14 15Quarter after Exit
ATET
0
2
4
6
8
1 2 3 4 5 6 7 8 9 10 11 12 13 14 15Quarter after Exit
ATET

W.E. Upjohn Institute for Employment Research 134
Net Impact and Benefit-Cost Estimates of the Workforce Development System in Washington State
Figure 10.3 Estimated Net Impacts on Earnings (top) and Employment (bottom) of Private Career School Attendance, by Quarter after Exit, 2012/2013 Cohort
NOTE: Earnings impacts are measured in 2014 $. Employment impacts are measured in percentage points. ATET means average treatment effect on the treated (defined in text).
0
200
400
600
800
1 2 3 4 5 6 7Quarter after Exit
ATET
-2
0
2
4
6
1 2 3 4 5 6 7Quarter after Exit
ATET

W.E. Upjohn Institute for Employment Research 135
Net Impact and Benefit-Cost Estimates of the Workforce Development System in Washington State
Table 10.8 Selected Longer-Term Net Impact Estimates for Subgroups of Private Career School
Participants: 2010/2011 Cohort
Outcome Subgroup Matched Comparison
Group Mean Noncompleters Completers Employment −8.8%*** 1.0% 62.4% Hourly Wage -$0.60** $1.17*** $8.79 Hours Worked (quarterly) −22.8*** 22.1*** 194.4 Earnings (quarterly) −$145*** $698*** $3,445 UI Receipt −2.8%*** −2.2%*** 9.8% UI Benefits (quarterly) −$28*** −$17*** $103 Subgroup Sample Size 4,089 14,168 — NOTE: Monetary data in 2014 $. * significant at the 0.10 level; ** significant at the 0.05 level; *** significant at the 0.01 level (two-tailed test). – means not applicable.
Table 10.9 Selected Short-Term Net Impact Estimates for Subgroups of Private Career School Participants: 2012/2013 Cohort
Outcome Subgroup Matched Comparison Group
Mean Noncompleters Completers Employment −5.4%*** 3.9%*** 57.1% Hourly Wage -$0.75** $1.03*** $9.31 Hours Worked (quarterly) −30.7*** 7.1** 209.5 Earnings (quarterly) −$352** $405*** $3,473 UI Receipt −4.3%*** −4.7%*** 7.8% UI Benefits (quarterly) −$67*** −$76*** $141 Subgroup Sample Size 3,617 12,649 — NOTE: Monetary data in 2014 $. * significant at the 0.10 level; ** significant at the 0.05 level; *** significant at the 0.01 level (two-tailed test). – means not applicable.

W.E. Upjohn Institute for Employment Research 136
Net Impact and Benefit-Cost Estimates of the Workforce Development System in Washington State

W.E. Upjohn Institute for Employment Research 137
Net Impact and Benefit-Cost Estimates of the Workforce Development System in Washington State
11 REGISTERED APPRENTICESHIP PROGRAMS
The workforce development program that is the “treatment” in this chapter is Registered
Apprenticeship programs. Apprenticeships are formal agreements between employed individuals
(apprentices), employers, and the state in which classroom instruction and formal on-the-job
training are combined. They are typically multi-year efforts, and are supervised by journey-level
craftpersons or other trade professionals. Completion standards typically include 2000 total on-
the-job training hours and at least 144 hours of related and supplemental formal instruction.
Registered Apprenticeships are administered in Washington by the Department of Labor and
Industries.
Participant Characteristics
Table 11.1 provides descriptive data that compare the individuals in the treatment group
to those in the comparison group pool. The comparison group consists of Wagner Peyser (WP)
registrants who were 16 to 70 at the time of WP registration. The individuals who were served by
Washington’s education and training programs were removed from the data. The first two
columns of numbers compare the Aapprenticeship participants who exited in 2010/2011 to
individuals in the comparison group. The final two columns compare the exiters in 2012/2013 to
WP registrants in the same year.
One major data limitation in our analyses of Registered Apprenticeship programs is the
paucity of information about the individuals’ characteristics. The only characteristics available in
the administrative data are gender, age, minority status, and residency. We have no data on
education background, disability, limited English proficiency status, or employment or public
assistance status at the time of registration for the apprenticeship. This data deficiency limits

W.E. Upjohn Institute for Employment Research 138
Net Impact and Benefit-Cost Estimates of the Workforce Development System in Washington State
severely the quality of the participation model estimation and the statistical match as documented
below.
Table 11.1 Descriptive Statistics for Registered Apprenticeship Treatment Group and Comparison Group
Universe 2010/2011 2012/2013 Characteristics Apprenticeship Wagner Peyser Apprenticeship Wagner PeyserDemographics Female 8.6% 43.5% 9.0% 44.4% Race: White 77.8% 63.8% 78.8% 61.7% Black 5.3% 7.0% 5.4% 6.5% Hispanic 8.6% 14.8% 7.0% 14.2% Other race 8.4%†† 8.2%†† 8.8%†† 8.3%†† Missing 0.0% 6.2% 0.0% 9.3% Mean, age at registration 29.7 37.8 29.5 34.4 Veteran 10.6% 8.8% 11.3% 8.2% West WA 78.1% 60.1% 76.7% 60.0% Urban county 62.2% 43.9% 61.5% 45.2% Employment and Earnings (prior to registration) Percentage of prior quarters employed 72.5% 69.8% 70.2% 67.0% Average quarterly earningsa $5,378 $5,740 $5,226 $5,941 Mean, earnings trendb $175.2 -$0.8 $150.0 $119.1 Mean, earnings varianceb (in 106 $) $13.0 $18.5 $13.1†† $13.4†† Job turnover 32.7% 19.6% 32.7% 13.0% Percentage of quarters with multiple jobs 16.9% 15.1% 16.7% 11.8% Had earnings dip 38.8% 57.1% 37.2% 27.8% Mean, number of quarters since dip at registrationa 1.5 2.4 1.4 0.9 Average earnings dip size in percentagea 26.6% 43.7% 25.7% 19.1% Sample Size 3,424 311,603 2,974 174,392 NOTE: All differences in means are statistically significant at the 0.05 level (t-test) unless otherwise denoted. Monetary data in 2014 $. Prior employment and earnings variables are defined in Chapter 3 (pp. 24-25). aAverages include observations with values of zero. bTrend and variance calculations include quarters with zero earnings, if any. ††Differences in means are not statistically significant at 0.05 level (t-test).
Even with the few characteristics that are available, we see that the populations are
different. Only about 9 percent of Registerd Apprenticeship participants are females compared to
almost 45 percent of the WP registrants. The apprentices are considerably younger as well; they
average over 5 years younger in both cohorts, and a smaller share of the apprentices are
minorities. The prior employment rates, the trend in average quarterly earnings prior to
registration, and prior job turnover of the apprentices are higher than the WP comparison group
pool. Most of the other employment and earnings variables have similar means.

W.E. Upjohn Institute for Employment Research 139
Net Impact and Benefit-Cost Estimates of the Workforce Development System in Washington State
Participation Model
Table 11.2 provides the results from the logit estimation of Registered Apprenticeship
participation. The independent variables included the few demographic variables available plus
prior employment and earnings variables. The table provides the logit coefficient estimates and
standard errors. While the magnitude of the coefficients is not particularly meaningful, the sign
and statistical significance are. If the coefficient is negative, then a (positive) change in that
variable will decrease the likelihood of being an apprentice.
Table 11.2 Coefficient Estimates from a Logit Model of Participation in Registered Apprenticeships 2010/2011 2012/2013 Characteristics Coefficient Standard Error Coefficient Standard ErrorDemographics Female −1.752*** 0.065 −1.651*** 0.067 Race: (White and missing are omitted classes) Black −0.464*** 0.082 −0.442*** 0.087 Hispanic −0.284*** 0.067 −0.388*** 0.078 Other 0.016 0.067 −0.024 0.070 Age −0.087*** 0.002 −0.041*** 0.002 Veteran 0.152* 0.061 0.125 0.065 West WA 0.676*** 0.047 0.647*** 0.050 Urban county 0.691*** 0.041 0.517*** 0.044 Employment and Earnings (prior to registration) Percentage of prior quarters employed 0.005*** 0.001 −0.003*** 0.001 Average quarterly earningsa (in 102 $) 0.006*** 0.001 0.002** 0.001 Earnings trendb (in 102 $) 0.023*** 0.003 −0.004 0.002 Earnings varianceb (in 108 $) −1.203*** 0.128 −0.178* 0.069 Job turnover 0.043*** 0.001 0.036*** 0.001 Percentage of quarters with multiple jobs −0.016*** 0.001 −0.007*** 0.001 Had earnings dip 0.317** 0.099 0.143 0.111 Number of quarters since dip at registration −0.132*** 0.012 0.045** 0.014 Earnings dip size in percentage −1.232*** 0.107 −0.327** 0.119 Constant −3.776*** 0.189 −4.870*** 0.220 Observations 315,027 177,366 NOTE: Model also includes dummy variables for sector of most recent employment (22 categories). aAverage includes quarters with values of zero, if any. bTrend and variance calculations include quarters with zero earnings, if any. *,**,*** indicate statistical significance at p = 0.05, 0.01, and 0.001, respectively.
The coefficient estimates seem quite reasonable. The following variables are significantly
correlated with being in the treatment group (i.e., Registered Apprentice) in both years of data:
Being a veteran, being from Western Washington, residing in an urban county, average quarterly
earnings prior to registration, job turnover, and having had an earnings dip. The following

W.E. Upjohn Institute for Employment Research 140
Net Impact and Benefit-Cost Estimates of the Workforce Development System in Washington State
variables are significantly correlated with being in treatment group: Female, minority, age at
registration, prior multiple job holding, variance in earnings prior to registration, and length of
time since and magnitude of an earnings dip.
Propensity Score Statistics
The propensity score for an observation is the predicted probability using the estimated
coefficients from the logit that was just described and the observation’s actual data. If the logit
model has substantial predictive capability, then the mean propensity score for the comparison
group should be small (near zero) and should be much less than the mean score for the treatment.
As argued earlier, a measure of how well the logit model discriminates between comparison
group members and treatment group members is the cumulative percentile for the comparison
group at the propensity score that is the 20th percentile. Table 11.3 provides these data for
Registered Apprenticeships. The mean propensity scores for the treatment groups are roughly
0.12 and 0.11 whereas they are 0.010 and 0.015 for the comparison group for 2010/2011 and
2012/2013 respectively. The 20th percentile indicator is approximately 80 percent for both
cohorts. The means and the 20th percentile statistics indicate that the logit model of participation
discriminated reasonably well between treatment and comparison group observations.
Table 11.3 Indicators of Propensity Score (p-score) Model Quality for Registered Apprenticeships Statistic 2010/2011 2012/2013
Mean p-score, Registered Apprenticeship 0.121 0.113
Mean p-score, Wagner Peyser 0.010 0.015
Percentile Wagner Peyser, at 20th percentile Registered Apprenticeship 79.1% 79.5%
Statistical Match
Table 11.4 provides data about the sample sizes, number of matched observations that
were duplicates, and a comparison of descriptive statistics between the treatment group and the

W.E. Upjohn Institute for Employment Research 141
Net Impact and Benefit-Cost Estimates of the Workforce Development System in Washington State
matched comparison group. The balance between the registered apprentices and matched
comparison group is not especially strong. Many of the differences in means in the table are
significant, and about 8 percent of the comparison group pool observations were used multiple
times.
Table 11.4 Matching Algorithm Statistics and Post-Match Comparison of Characteristics for Registered
Apprenticeships Analyses 2010/2011 2012/2013 Statistic/Characteristic Apprenticeship Wagner Peyser Apprenticeship Wagner PeyserSample size 3,424 313,660 2,974 175,456 Sample size used in match 3,424 311,603 2,974 174,392 Matched sample size 3,335 3,335 2,951 2,951 Number of observations used once --- 2,608 --- 2,364 Number of observations used multiple times --- 281 --- 247 Maximum number of repeats --- 9 --- 8 Demographics Female 8.7% 8.7% 9.0% 9.0% Race: White 77.7%*** 69.6%*** 79.0%*** 70.6%*** Black 5.3% 4.7% 5.5% 5.3% Hispanic 8.6% 8.5% 6.9%*** 5.2%*** Other race 8.3% 9.0% 8.7% 9.4% Missing 0.0%*** 8.2%*** 0.0%*** 9.5%*** Mean, age at registration 29.9 29.5 29.6*** 28.8*** Veteran 10.6% 11.8% 11.3% 10.4% West WA 77.9% 77.8% 76.5% 75.5% Urban county 61.9% 60.2% 61.3% 60.4% Employment and Earnings (prior to registration) Percentage of prior quarters employed 72.3%*** 66.9%*** 70.2%*** 65.5%*** Average quarterly earningsa $5,420** $5,080** $5,243*** $4,666*** Mean, earnings trendb $151.5** $117.9** $151.1 $116.4 Mean, earnings varianceb (in 106 $) $13.1** $12.1** $13.2** $11.8** Job turnover 31.3% 30.7% 32.2% 31.7% Percentage of quarters with multiple jobs 17.0%*** 15.8%*** 16.7% 16.8% Had earnings dip 39.6%*** 35.0%*** 37.4% 37.6% Mean, number of quarters since dip at registrationa 1.5*** 1.3*** 1.4 1.4 Average earnings dip size in percentagea 27.2%*** 23.7%*** 25.7% 26.3% Sample Size 3,335 3,335 2,951 2,951 NOTE: Monetary values in 2014 $. Statistically significant difference in means denoted by *, **, ***. * p < 0.10; ** p < 0.05; *** p < 0.01 (two-tailed test). – means not applicable. a Averages include observations with values of zero. b Trend and variance calculations include quarters with zero earnings, if any.
Balance
The fact that most of the variables in Table 11.4 show significantly different means
suggests that the matched populations are not well-balanced. However, Figure 11.1, which

W.E. Upjohn Institute for Employment Research 142
Net Impact and Benefit-Cost Estimates of the Workforce Development System in Washington State
shows the standardized differences in means before and after the match, indicates that all of the
variates in the match satisfy the +/− 0.10 criterion for balance. Consequently, we believe that the
matched samples are balanced.
Figure 11.1 Standardized Difference in Means, Pre- and Post-match, Registered Apprenticeships
NOTE: Standardized difference in means between comparison group pool and treatment group denoted by dot. Standardized difference in means between matched comparison group and treatment group denoted by x. Red vertical lines at +/− 0.10.
-100 -50 0 50
Standardized % bias across covariates
femage_start
earn_dippcthad_earnings_dip
time_since_diphispanic
earn_varblack
earn_meanothrace
vetpctemployed
pctqmjobearn_trend
urbanwest
turnover
-100 -50 0 50 100
Standardized % bias across covariates
femage_starthispanic
earn_meanblack
earn_varothrace
earn_trendpctemployed
vetearn_dippct
had_earnings_diptime_since_dip
pctqmjoburbanwest
turnover

W.E. Upjohn Institute for Employment Research 143
Net Impact and Benefit-Cost Estimates of the Workforce Development System in Washington State
Net Impacts
Tables 11.5 and 11.6 provide the estimated net impacts of participating in Registered
Apprenticeships. The longer-term impacts, which operate mainly through the hourly wage, are
quite positive. The longer-term employment and quarterly hours worked net impacts are
essentially zero, but the hourly wage net impact is over $7.00, and that results in an estimated net
impact on quarterly earnings of almost $3,450 (a 40 percent impact). The longer-term net
impacts on unemployment insurance recipiency are an increase in the percentage of
apprenticeship exiters getting UI and an increase in benefits.
Table 11.5 Net Impact Estimates for Registered Apprenticeship Programs for 2010/2011 Cohort
Matched Sample
Estimator Comparison Group Means Average
Treatment EffectFull Sample Matched Sample
Outcome With 0 W/O 0 With 0 W/O 0Employment (percentage points)a Short term 9.5*** 55.4 --- 57.4 --- Ever-employed, longer term 5.6*** 66.7 --- 69.6 --- Percent of quarters, longer term 7.5*** 56.9 --- 59.5 --- Percent of quarters, longer term, diff-in-diff −0.8 −5.1 --- −1.5 ---Average hourly wage Short term ($) 9.07*** 10.08 17.97 11.28 19.41 Short term, diff-in-diff ($) 8.48*** −3.27 −2.36 −2.03 −0.72 Longer term ($) 7.95*** 11.06 18.84 12.67 20.43 Longer term, diff-in-diff ($) 7.36*** −2.28 −1.47 −0.64 0.60Average quarterly hours Short term 57.6*** 211.5 377.1 224.0 385.4 Short term, diff-in-diff 2.8 −30.2 16.2 −19.4 21.5 Longer term 54.3*** 234.3 380.8 250.5 389.1 Longer term, diff-in-diff −0.5 −7.4 23.9 7.2 27.6Average quarterly earnings Short term ($) 4,294*** 3,890 6,936 4,438 7,637 Short term, diff-in-diff ($) 3,638*** −1,430 −676 −1,045 −75 Longer term ($) 4,104*** 4,636 7,456 5,448 8,343 Longer term, diff-in-diff ($) 3,447*** −684 −109 −35 748Unemployment Insurance Benefits (average quarterly) Percent receiving, short term 7.4*** 23.4 --- 22.1 --- Benefits, short term ($) 445*** 747 3,190 739 3,346 Percent receiving, longer term 10.2*** 15.1 --- 15.9 --- Benefits, longer term ($) 282*** 171 2,007 172 2,042NOTE: Monetary impacts in 2014 $. Sample sizes differ for virtually every entry in the table because of observations with missing data. If there were no missing data, the sample sizes would be those displayed in rows 2 and 3 of Table 10.4. * significant at the 0.10 level; ** significant at the 0.05 level; *** significant at the 0.01 level (two-tailed test). -- means not applicable. aShort term employment is defined as having more than $100 in quarterly earnings in the 3rd quarter after exit. Ever-employed, longer term is defined as having more than $100 in any quarter from the 9th to the 12th quarter after exit. Percent of quarters, longer-term takes on values of 0%, 25%, 50%, 75%, or 100% for an observation depending on whether the observation was employed for 0, 1, 2, 3, or 4 quarters between the 9th and 12th quarter after exit.

W.E. Upjohn Institute for Employment Research 144
Net Impact and Benefit-Cost Estimates of the Workforce Development System in Washington State
Table 11.6 Net Impact Estimates for Registered Apprenticeship Programs for 2012/2013 Cohort
Matched Sample
Estimator Comparison Group Means Average Treatment
Effect Full Sample Matched Sample
Outcome With 0 W/O 0 With 0 W/O 0 Employmenta Short term 5.5*** 61.8 --- 64.4 --- Hourly wage Short term ($) 8.93*** 11.55 18.51 12.68 19.48 Short term, diff-in-diff ($) 8.19*** −2.22 −1.37 −0.03 0.44Quarterly hours Short term 59.2*** 241.3 386.6 252.5 387.9 Short term, diff-in-diff 11.7 −16.9 4.9 17.7 49.7 Quarterly earnings Short term ($) 4,759*** 4,603 7,374 5,025 7,719 Short term, diff-in-diff ($) 3,793*** −1,400 −812 91 1,024 Unemployment Insurance Benefits Percent receiving, short term 9.8*** 9.4 10.2 Benefits, short term ($) 398*** 199 2,101 213 2,084 NOTE: Monetary impacts in 2014 $. Sample sizes differ for virtually every entry in the table because of observations with missing data. If there were no missing data, the sample sizes would be those displayed in rows 2 and 3 of Table 10.4. * significant at the 0.10 level; ** significant at the 0.05 level; *** significant at the 0.01 level (two-tailed test). -- means not applicable. aShort term employment is defined as having more than $100 in quarterly earnings in the 3rd quarter after exit.
The short-term net impacts shown in Tables 11.5 and 11.6 display hourly wage impacts
that are similar to the longer-term net impact – over $8.00 per hour. Unlike the longer-term net
impacts, the estimated short-term net impacts on employment are substantial: 9.5 and 5.5
percentage points for the 2010/2011 and 2012/2013 cohorts, respectively. Those increases
together with the large increases in hourly wage rates and small positive, but not significant,
increases in quarterly hours worked result in large average quarterly earnings increases of greater
than $3,600. As with the longer-term net impacts shown in Table 11.5, the short- term impacts
include an increase in receipt of unemployment insurance benefits, and an increase in the benefit
levels.
As we have done in prior chapters, we average the short-term net impact estimates from
Table 11.5 and 11.6 to derive our preferred estimate for the short term. These averages are
presented in Table 11.7, with the preferred estimates in “boxes.” The results in this table suggest

W.E. Upjohn Institute for Employment Research 145
Net Impact and Benefit-Cost Estimates of the Workforce Development System in Washington State
that in the short term, registered apprenticeships bring substantial positive labor market outcomes
in the form of employment and earnings to individuals.
Table 11.7 Short-Term Net Impact Estimates for Registered Apprenticeships
2010/2011 Estimator
2012/2013 Estimator Average
Employmenta Short term 9.5*** 5.5*** 7.5*** Hourly wage Short term ($) 9.07*** 8.93*** 9.00*** Short term, diff-in-diff ($) 8.48*** 8.19*** 8.34*** Quarterly hours Short term 57.6*** 59.2*** 58.4*** Short term, diff-in-diff 2.8 11.7 7.2 Quarterly earnings Short term ($) 4,294*** 4,759*** 4,527*** Short term, diff-in-diff ($) 3,638*** 3,793*** 3,715*** Unemployment Insurance Benefits Percent receiving, short term 7.4*** 9.8*** 8.6*** Benefits, short term ($) 445*** 398*** 421*** NOTE: Monetary data in 2014 $. * significant at the 0.10 level; ** significant at the 0.05 level; *** significant at the 0.01 level (two-tailed test). aShort term employment is defined as having more than $100 in quarterly earnings in the 3rd quarter after exit.
Figures 11.2 and 11.3 show the dynamics of the increase in earnings and employment for
apprentices after exiting from the program for the 2010/2011 and 2012/2013 cohorts,
respectively.
Subgroup Analyses
According to the administrative data, under 60 percent of the Registered Apprenticeship
treatment groups in both cohorts actually complete their apprenticeships. Tables 11.8 and 11.9
display selected net impact estimates for the completers and for the noncompleters subgroup. All
of the impacts in both tables are statistically significant. Clearly, the positive net impacts for the
entire treatment group shown in Tables 11.5 and 11.6 are heavily weighted by the completers. In
Table 11.8, which shows the longer-term net impacts, the employment rates rise by 7.7
percentage points, wage rates by over $14.00, and quarterly earnings by over $6,500.

W.E. Upjohn Institute for Employment Research 146
Net Impact and Benefit-Cost Estimates of the Workforce Development System in Washington State
Figure 11.2 Estimated Net Impacts on Earnings (top) and Employment (bottom) of Registered Apprenticeships, by Quarter after Exit, 2010/2011 Cohort
NOTE: Earnings impacts are measured in 2014 $. Employment impacts are measured in percentage points. ATET means average treatment effect on the treated (defined in text).
0
2000
4000
6000
1 2 3 4 5 6 7 8 9 10 11 12 13 14 15Quarter after Exit
ATET
0
5
10
15
1 2 3 4 5 6 7 8 9 10 11 12 13 14 15Quarter after Exit
ATET

W.E. Upjohn Institute for Employment Research 147
Net Impact and Benefit-Cost Estimates of the Workforce Development System in Washington State
Figure 11.3 Estimated Net Impacts on Earnings (top) and Employment (bottom) of Registered Apprenticeships, by Quarter after Exit, 2012/2013 Cohort
NOTE: Earnings impacts are measured in 2014 $. Employment impacts are measured in percentage points. ATET means average treatment effect on the treated (defined in text).
Interestingly, the short-term net impact estimates for completers are slightly larger than
for the longer-term estimates. The net impact for employment is 17.6 percentage points as
compared to 7.7 percentage points in the longer-term. The short-term average hourly wage and
average quarterly hours net impacts are $15.67 per hour and about 37 hours as compared to
0
1000
2000
3000
4000
5000
1 2 3 4 5 6 7Quarter after Exit
ATET
0
5
10
15
1 2 3 4 5 6 7Quarter after Exit
ATET

W.E. Upjohn Institute for Employment Research 148
Net Impact and Benefit-Cost Estimates of the Workforce Development System in Washington State
$14.41 and about 32 hours in the longer-term. The average quarterly earnings impact is about
$300 greater in the short-term as well.
Table 11.8 Selected Longer-Term Net Impact Estimates for Subgroups of Registered Apprenticeships:
2010/2011 Cohort
Outcome Subgroup Matched Comparison
Group Mean Noncompleters Completers Employment −10.2%*** 7.7%*** 59.5% Hourly Wage −$0.14*** $14.41*** $12.67 Hours Worked (quarterly) −34.8*** 31.7*** 250.5 Earnings (quarterly) $133*** $6,559*** $5,448 UI Receipt −2.4%*** 22.0%*** 15.9% UI Benefits (quarterly) $1*** $545*** $172 Subgroup Sample Size 1,615 1,720 — NOTE: Monetary data in 2014 $. * significant at the 0.10 level; ** significant at the 0.05 level; *** significant at the 0.01 level (two-tailed test). – means not applicable.
Table 11.9 Selected Short-Term Net Impact Estimates for Subgroups of Registered Apprenticeships:
2012/2013 Cohort
Outcome Subgroup Matched Comparison
Group Mean Noncompleters Completers Employment −8.8%**** 17.6%*** 64.4% Hourly Wage −$0.25*** $15.67*** $12.68 Hours Worked (quarterly) −13.1*** 37.1*** 252.5 Earnings (quarterly) $273*** $6,858*** $5,025 UI Receipt 0.9%*** 17.3%*** 10.2% UI Benefits (quarterly) $35*** $705*** $213 Subgroup Sample Size 1,353 1,598 — NOTE: Monetary data in 2014 $. * significant at the 0.10 level; ** significant at the 0.05 level; *** significant at the 0.01 level (two-tailed test). – means not applicable.
Participating in a registered apprenticeship seems to bestow quite significant labor market
impacts for individuals; the completers subgroup is estimated to have very large labor market
returns. Even though they are much smaller, the estimated net impacts for quarterly earnings for
noncompleters are quite significant—about $270 in the short term and about $130 in the longer-
term.

W.E. Upjohn Institute for Employment Research 149
Net Impact and Benefit-Cost Estimates of the Workforce Development System in Washington State
12 AEROSPACE TRAINING24
As one of the key economic drivers to the economy in Washington State, the impact of
the aerospace workforce is of particular significant for continued health and growth of the
aerospace industry. In 2012, Washington State Second Substitute House Bill 2156 established
the Workforce Aerospace Pipeline Advisory Committee. The committee, made up of a tri-partite
board, has been tasked with recommending training programs for review by the Workforce
Board in coordination with the State Board for Community and Technical Colleges. Based on
the committee’s recommendations in 2013, five programs have been examined in the Aerospace
Manufacturing Skills: Supply, Demand, and Outcomes for Washington’s Aerospace Training
Programs Annual Reports for 2013, 2014, and 2015. We have used this general framework but
have expanded the analysis to both aerospace and aerospace-related training.
Exiting from one of these five educational programs is the “treatment” in this chapter.
The comparison group pool comprises individuals aged 16 to 70 who registered Wagner Peyser
(WP) services at a Work Source office. Because of data availability, the longer-term results for
these programs come from the 2011/2012 fiscal year (matched to the 2010/2011 WP registrants).
The short-term results come from the 2012/2013 fiscal year (matched to the 2012/2013 WP
registrants).
24 The program description is from “Aerospace Manufacturing Skills: Supply, Demand, and Outcomes for
Washington’s Aerospace Training Programs Annual Report – 2014,” Workforce Training and Education Coordinating Board and State Board for Community and Technical Colleges, February 2015.

W.E. Upjohn Institute for Employment Research 150
Net Impact and Benefit-Cost Estimates of the Workforce Development System in Washington State
Participant Characteristics
Table 12.1 provides descriptive data that compare the individuals in the treatment group
to those in the comparison group pool. The individuals who were served by Washington’s
education and training programs were removed from the comparison group pool. The first two
columns of numbers compare the Aerospace Training participants who exited in 2011/2012 to
individuals in the 2010/2011 WP comparison group. The final two columns compare the exiters
in 2012/2013 to WP registrants in the same year.
Table 12.1 Descriptive Statistics for Aerospace Training Treatment and Comparison Group Universe 2011/2012 2010/2011 2012/2013 Characteristics Aerospace Wagner Peyser Aerospace Wagner PeyserDemographics Female 12.3% 43.2% 12.7% 44.4% Race: White 67.9% 64.7% 60.1% 62.4% Black 4.4% 6.7% 5.6% 6.4% Hispanic 4.1% 14.4% 5.8% 13.8% Other race 23.5% 8.1% 28.3% 8.2% Missing 0.1% 6.1% 0.1% 9.2% Mean, age at registration 34.0 39.5 32.9 35.7 West WA 47.6% 60.3% 42.9% 60.3% Urban county --- 44.1% --- 45.5% Employment and Earnings (prior to registration) Percentage of prior quarters employed 63.7% 70.4% 63.0% 67.6% Average quarterly earningsa $4,810 $5,944 $4,518 $6,152 Mean, earnings trendb −$30.5†† −$5.5†† $13.4 $115.7 Mean, earnings varianceb (in 106 $) $16.3 $19.4 $14.4†† $14.0†† Job turnover 30.0% 19.2% 28.4% 12.7% Percentage of quarters with multiple jobs 12.1% 14.9% 11.8%†† 11.6%†† Had earnings dip 51.6% 57.5% 48.1% 27.9% Mean, number of quarters since dip at registrationa 1.8 2.4 1.6 0.9 Average earnings dip size in percentagea 43.0%†† 44.1%†† 39.0% 19.0% Sample Size 1,530 333,316 1,839 182,399 NOTE: All differences in means are statistically significant at the 0.05 level (t-test) unless otherwise denoted. Monetary data in 2014 $. --- means not available. Prior employment and earnings variables are defined in Chapter 3 (pp. 24-25). aAverages include observations with values of zero. bTrend and variance calculations include quarters with zero earnings, if any. ††Differences in means are not statistically significant at 0.05 level (t-test).
Just as in our analyses of Registered Apprenticeship programs, there is a paucity of
information about the individuals’ characteristics. The administrative data available are gender,
age, racial status, and residency. As these programs do not have “eligibility requirements” in the

W.E. Upjohn Institute for Employment Research 151
Net Impact and Benefit-Cost Estimates of the Workforce Development System in Washington State
ways that programs like Worker Retraining or Welfare-to-Work programs have, data on
education background, disability, limited English proficiency status, or employment or public
assistance status at the time of enrollment into aerospace training programs are not collected.
These data deficiencies limit severely the quality of the participation model estimation and the
statistical match as documented below.
Even with the few characteristics that are available, we see that the populations are quite
different. Only about 12 percent of Aerospace Training exiters are females compared to almost
45 percent of the WP registrants. The trainees are considerably younger as well; they average 3
to 5 years younger, and a smaller share of the aerospace training exiters reside in western
Washington. The prior employment rates of the Aerospace trainees and average quarterly
earnings are lower than the WP comparison group pool; whereas most of the other employment
and earnings variables have similar means.
Participation Model
Table 12.2 provides the results from the logit estimation of Aerospace Training
participation. The independent variables include the few demographic variables available plus
prior employment and earnings variables. The table provides the logit coefficient estimates and
standard errors. While the magnitude of the coefficients is not particularly meaningful, the sign
and statistical significance are. If the coefficient is negative, then a (positive) change in that
variable will decrease the likelihood of being an apprentice.
Most of the coefficient estimates are statistically significant. Only a handful of them are
positive: being a racial minority other than Black or Hispanic, job turnover, and the size of an
earnings dip prior to program registration. Most of the variables are significantly correlated with
being in the treatment group: Female, Hispanic, age at registration (not significant in the

W.E. Upjohn Institute for Employment Research 152
Net Impact and Benefit-Cost Estimates of the Workforce Development System in Washington State
2012/2013 cohort), being from western Washington, percentage employment prior to
registration, prior multiple job holding, having an earnings dip, and length of time since an
earnings dip.
Table 12.2 Coefficient Estimates from a Logit Model of Participation in Aerospace Training 2011/2012 2012/2013 Characteristics Coefficient Standard Error Coefficient Standard ErrorDemographics Female −1.729*** 0.081 −1.655*** 0.073 Race: (White and missing are omitted category) Black −0.355** 0.128 0.100 0.107 Hispanic −1.314*** 0.135 −0.778*** 0.106 Other 1.207*** 0.064 1.566*** 0.057 Age −0.035*** 0.003 −0.002 0.002 West WA −0.662*** 0.053 −0.878*** 0.050 Employment and Earnings (prior to registration) Percentage of prior quarters employed −0.001 0.001 −0.006*** 0.001 Average quarterly earningsa (in 102 $) 0.002* 0.001 −0.002* 0.001 Earnings trendb (in 102 $) −0.018*** 0.004 −0.001 0.002 Earnings varianceb (in 108 $) −0.136 0.082 0.072 0.049 Job turnover 0.038*** 0.002 0.031*** 0.001 Percentage of quarters with multiple jobs −0.030*** 0.002 −0.017*** 0.002 Had earnings dip −0.198 0.164 −0.202 0.144 Number of quarters since dip at registration −0.176*** 0.017 −0.016 0.016 Earnings dip size in percentage 0.582*** 0.162 1.007*** 0.147 Constant −4.790*** 0.271 −5.410*** 0.249 Observations 334,846 184,238 NOTE: Model also includes dummy variables for sector of most recent employment (22 categories). aAverage includes quarters with values of zero, if any. bTrend and variance calculations include quarters with zero earnings, if any. *,**,*** indicate statistical significance at p = 0.05, 0.01, and 0.001, respectively.
Propensity Score Statistics
The propensity score for an observation is the predicted probability using the estimated
coefficients from the logit that was just described and the observation’s actual data. If the logit
model has substantial predictive capability, then the mean propensity score for the comparison
group should be small (near zero) and should be much less than the mean score for the treatment.
As argued earlier, a measure of how well the logit model discriminates between comparison
group members and treatment group members is the cumulative percentile for the comparison
group at the propensity score that is the 20th percentile. Table 12.3 provides these data for

W.E. Upjohn Institute for Employment Research 153
Net Impact and Benefit-Cost Estimates of the Workforce Development System in Washington State
Aerospace Training. The mean propensity scores for the treatment groups are 0.036 and 0.066
whereas they are 0.004 and 0.015 for the comparison group for 2011/2012 and 2012/2013,
respectively. The 20th percentile indicator is approximately 66 percent for the earlier cohort and
about 75 percent for the later cohort. The means and the 20th percentile statistics indicate that the
logit model of participation discriminated only moderately well between treatment and
comparison group observations.
Table 12.3 Indicators of Propensity Score (p-score) Model Quality for Aerospace Training Analyses Statistic 2011/2012 2012/2013
Mean p-score, Aerospace Training 0.036 0.066
Mean p-score, Wagner Peyser 0.004 0.015
Percentile Wagner Peyser, at 20th percentile Aerospace Training 66.2% 73.3%
Statistical Match
Table 12.4 provides data about the sample sizes, number of matched observations that
were duplicates, and a comparison of descriptive statistics between the treatment group and the
matched comparison group. The balance between the Aerospace Training participants and
matched comparison groups is not especially strong. Many of the differences in means in the
table are significant, which would be characteristic of only a moderately successful match, but
only 4 percent and 6 percent of the comparison group pool observations were used multiple
times, which suggests that the match was reasonably successful.
Balance
The fact that most of the variables in Table 12.4 show significantly different means
suggests that the matched populations are not well-balanced. However, Figure 12.1, which
shows the standardized differences in means before and after the match, indicates that all of the

W.E. Upjohn Institute for Employment Research 154
Net Impact and Benefit-Cost Estimates of the Workforce Development System in Washington State
variates in the match satisfy the +/− 0.10 criterion for balance. Consequently, we believe that the
matched samples are appropriately balanced.
Table 12.4 Matching Algorithm Statistics and Post-Match Comparison of Characteristics for Aerospace
Training Analyses 2011/2012 2010/2011 2012/2013 Statistic/Characteristic Aerospace Wagner Peyser Aerospace Wagner PeyserSample size 1,530 335,449 1,839 183,505 Sample size used in match 1,530 333,316 1,839 182,399 Matched sample size 1,503 1,503 1,821 1,821 Number of observations used once --- 1,334 --- 1,528 Number of observations used multiple times --- 63 --- 112 Maximum number of repeats --- 8 --- 13 Demographics Female 12.4% 12.4% 12.8% 12.8% Race: White 68.3%*** 58.3%*** 60.7%*** 52.6%*** Black 4.5% 3.9% 5.7% 5.3% Hispanic 4.1% 4.7% 5.9% 4.9% Other race 23.0%* 26.0%* 27.6%*** 31.6%*** Missing 0.1%*** 7.2%*** 0.1%*** 5.7%*** Mean, age at registration 34.1 34.2 33.0 32.9 West WA 48.3% 45.4% 43.2% 40.7% Urban county 0.1%*** 37.2%*** 0.1%*** 40.9%*** Employment and Earnings (prior to registration) Percentage of prior quarters employed 63.9%*** 59.2%*** 63.3%*** 58.0%*** Average quarterly earningsa $4,876* $4,505* $4,558** $4,116** Mean, earnings trendb −$28.2 −$30.7 $14.9 $31.6 Mean, earnings varianceb (in 106 $) $16.6 $15.2 $14.5 $12.7 Job turnover 28.8% 27.5% 27.7%** 26.0%** Percentage of quarters with multiple jobs 12.3%** 11.0%** 11.9% 11.5% Had earnings dip 52.2%*** 45.9%*** 48.1% 46.9% Mean, number of quarters since dip at registrationa 1.8** 1.7 1.6 1.6 Average earnings dip size in percentagea 43.3%*** 37.8%*** 38.9% 38.1% Sample Size 1,503 1,503 1,821 1,821 NOTE: Monetary values in 2014 $. Statistically significant difference in means denoted by *, **, ***. * p < 0.10; ** p < 0.05; *** p < 0.01 (two-tailed test). – means not applicable. a Averages include observations with values of zero. b Trend and variance calculations include quarters with zero earnings, if any.

W.E. Upjohn Institute for Employment Research 155
Net Impact and Benefit-Cost Estimates of the Workforce Development System in Washington State
Figure 12.1 Standardized Difference in Means, Pre- and Post-match, Aerospace Training
NOTE: Standardized difference in means between comparison group pool and treatment group denoted by dot. Standardized difference in means between matched comparison group and treatment group denoted by x. Red vertical lines at +/− 0.10.
-100 -50 0 50
Standardized % bias across covariates
fem
age_start
hispanic
west
time_since_dip
pctemployed
earn_mean
pctqmjob
had_earnings_dip
black
earn_var
earn_trend
earn_dippct
othrace
turnover
-100 -50 0 50 100
Standardized % bias across covariates
fem
west
hispanic
earn_mean
age_start
pctemployed
earn_trend
black
pctqmjob
earn_var
time_since_dip
had_earnings_dip
earn_dippct
othrace
turnover

W.E. Upjohn Institute for Employment Research 156
Net Impact and Benefit-Cost Estimates of the Workforce Development System in Washington State
Net Impacts
Tables 12.5 and 12.6 provide the estimated net impacts of participating in Aerospace
Training programs for the 2011/2012 and 2012/2013 cohorts, respectively. The first table
displays both short-term and longer-term impacts, and the second table shows short-term net
impacts. The longer-term impacts in Table 12.5, using difference-in-differences, are quite
positive. The longer-term employment differential between the Aerospace Training participants
Table 12.5 Net Impact Estimates for Aerospace Training for 2011/2012 Cohort
Matched Sample
Estimator Comparison Group Means Average
Treatment Effect Full Sample Matched Sample
Outcome With 0 W/O 0 With 0 W/O 0 Employment (percentage points)a Short term 20.6*** 54.1 --- 51.4 --- Ever-employed, longer term 5.1** 64.9 --- 66.7 --- Percent of quarters, longer term 13.8*** 55.2 --- 54.1 --- Percent of quarters, longer term, diff-in-diff 15.4*** −7.3 --- 0.3 --- Average hourly wage Short term ($) 4.86*** 9.89 18.05 8.97 17.16 Short term, diff-in-diff ($) 5.86*** −3.75 −2.46 −2.30 −1.90 Longer term ($) 5.84*** 10.75 18.87 10.50 18.48 Longer term, diff-in-diff ($) 6.84*** −2.89 −1.62 −0.77 −0.19 Average quarterly hours Short term 154.0*** 205.4 374.7 190.0 363.2 Short term, diff-in-diff 169.4*** −38.5 13.1 −20.9 12.7 Longer term 111.9*** 226.0 378.1 218.8 364.2 Longer term, diff-in-diff 127.4*** −17.9 20.1 8.0 21.0 Average quarterly earnings Short term ($) 3,333*** 3,792 6,920 3,464 6,624 Short term, diff-in-diff ($) 3,839*** −1,654 −771 −993 −378 Longer term ($) 3,625*** 4,475 7,409 4,399 7,182 Longer term, diff-in-diff ($) 4,132*** −972 −242 −57 460 Unemployment Insurance Benefits (average quarterly) Percent receiving, short term −13.2*** 24.1 --- 18.5 --- Benefits, short term ($) −450*** 783 3,242 596 3,422 Percent receiving, longer term −7.5*** 14.9 --- 13.4 --- Benefits, longer term ($) −105*** 170 2,016 162 1,892 NOTE: Monetary impacts in 2014 $. Sample sizes differ for virtually every entry in the table because of observations with missing data. If there were no missing data, the sample sizes would be those displayed in rows 2 and 3 of Table 12.4. * significant at the 0.10 level; ** significant at the 0.05 level; *** significant at the 0.01 level (two-tailed test). -- means not applicable. aShort term employment is defined as having more than $100 in quarterly earnings in the 3rd quarter after exit. Ever-employed, longer term is defined as having more than $100 in any quarter from the 9th to the 12th quarter after exit. Percent of quarters, longer-term takes on values of 0%, 25%, 50%, 75%, or 100% for an observation depending on whether the observation was employed for 0, 1, 2, 3, or 4 quarters between the 9th and 12th quarter after exit.

W.E. Upjohn Institute for Employment Research 157
Net Impact and Benefit-Cost Estimates of the Workforce Development System in Washington State
and the matched comparison group members is over 15 percentage points. The hourly wage net
impact is almost $7.00 per hour, and the hours worked in a quarter increases by 127 hours. The
positive differentials in employment, wage rates, and hours worked combine to result in an
estimated longer-term quarterly earnings net impact of over $4,000.
The short-term net impacts are almost as sanguine. In Table 12.5, the short-term net
impact for employment is over 20 percentage points. Combined with an estimated wage impact
of almost $6.00 per hour and an estimated quarterly hours of employment of almost 170 hours
yields an estimated net impact on quarterly earnings of just short of $4,000. The entries in Table
12.6 suggest that relative to the comparison group, the short-term employment rate increases by
over 9 percent; the average hourly wage increases by over $3.00 per hour; and the quarterly
hours worked increases by over 65 hours. When the employment, hourly wage, and hours
worked net impacts are combined, the net impact for earnings is a positive $1,920.
Table 12.6 Net Impact Estimates for Aerospace Training for 2012/2013 Cohort
Matched Sample
Estimator Comparison Group Means Average
Treatment EffectFull Sample Matched Sample
Outcome With 0 W/O 0 With 0 W/O 0 Employment (percentage points)a Short term 9.3*** 60.7 -- 62.0 -- Average hourly wage Short term ($) 2.25*** 11.39 18.57 11.02 17.69 Short term, diff-in-diff ($) 3.14*** −2.77 −1.50 −0.22 0.24 Average quarterly hours Short term 75.4*** 235.9 384.8 238.9 383.3 Short term, diff-in-diff 65.3*** −26.5 1.3 35.6 65.7 Average quarterly earnings Short term ($) 1,672*** 4,513 7,361 4,336 6,957 Short term, diff-in-diff ($) 1,923*** −1,679 −945 −30 888 Unemployment Insurance Benefits (average quarterly) Percent receiving, short term −4.4*** 9.6 --- 10.3 --- Benefits, short term ($) −67** 202 2,110 209 2,216 NOTE: Monetary impacts in 2014 $. Sample sizes differ for virtually every entry in the table because of observations with missing data. If there were no missing data, the sample sizes would be those displayed in rows 2 and 3 of Table 12.4. * significant at the 0.10 level; ** significant at the 0.05 level; *** significant at the 0.01 level (two-tailed test). -- means not applicable. aShort term employment is defined as having more than $100 in quarterly earnings in the 3rd quarter after exit.

W.E. Upjohn Institute for Employment Research 158
Net Impact and Benefit-Cost Estimates of the Workforce Development System in Washington State
As we have done in prior chapters, we average the short-term net impact estimates from
Table 12.5 and 12.6 to derive our preferred estimate for the short term. These averages are
presented in Table 12.7, with the preferred estimates in “boxes.” The results in this table suggest
that in the short term, aerospace training has quite handsome payoffs for its students. These
positive net impacts become even slightly larger in the longer term.
Table 12.7 Short-Term Net Impact Estimates for Aerospace Training
2011/2012 Estimator
2012/2013 Estimator Average
Employmenta Short term 20.6*** 9.3*** 15.0*** Hourly wage Short term ($) 4.86*** 2.25*** 3.55*** Short term, diff-in-diff ($) 5.86*** 3.14*** 4.50*** Quarterly hours Short term 154.0*** 75.4*** 114.7*** Short term, diff-in-diff 169.4*** 65.3*** 117.4*** Quarterly earnings Short term ($) 3,333*** 1,672*** 2,502*** Short term, diff-in-diff ($) 3,839*** 1,923*** 2,881*** Unemployment Insurance Benefits Percent receiving, short term −13.2*** −4.4*** −8.8*** Benefits, short term ($) −450*** −67** −258*** NOTE: Monetary data in 2014 $. * significant at the 0.10 level; ** significant at the 0.05 level; *** significant at the 0.01 level (two-tailed test). aShort term employment is defined as having more than $100 in quarterly earnings in the 3rd quarter after exit.
Figures 12.2 and 12.3 display the dynamics of the outcomes for the 2011/2012 and
2012/2013 cohorts, respectively. Since we used the 2011/2012 cohort for the longer-term net
impact estimation, the first figures show only 11 quarters following exit.

W.E. Upjohn Institute for Employment Research 159
Net Impact and Benefit-Cost Estimates of the Workforce Development System in Washington State
Figure 12.2 Estimated Net Impacts on Earnings (top) and Employment (bottom) of Aerospace Training, by Quarter after Exit, 2011/2012 Cohort
NOTE: Earnings impacts are measured in 2014 $. Employment impacts are measured in percentage points. ATET means average treatment effect on the treated (defined in text).
0
2000
4000
6000
8000
1 2 3 4 5 6 7 8 9 10 11Quarter after Exit
ATET
0
10
20
30
1 2 3 4 5 6 7 8 9 10 11Quarter after Exit
ATET

W.E. Upjohn Institute for Employment Research 160
Net Impact and Benefit-Cost Estimates of the Workforce Development System in Washington State
Figure 12.3 Estimated Net Impacts on Earnings (top) and Employment (bottom) of Aerospace Training, by Quarter after Exit, 2012/2013 Cohort
NOTE: Earnings impacts are measured in 2014 $. Employment impacts are measured in percentage points. ATET means average treatment effect on the treated (defined in text).
0
1000
2000
3000
4000
1 2 3 4 5 6 7Quarter after Exit
ATET
0
5
10
15
20
25
1 2 3 4 5 6 7Quarter after Exit
ATET

W.E. Upjohn Institute for Employment Research 161
Net Impact and Benefit-Cost Estimates of the Workforce Development System in Washington State
13 HIGH SCHOOL CAREER AND TECHNICAL EDUCATION (CTE) PROGRAMS
Secondary Career and Technical Education provides general workplace and, to some
extent, specific occupational skills instruction to high school students. CTE classes in
Washington are classified as exploratory or preparatory. Furthermore, all CTE classes are in one
of 16 career clusters. CTE programs are designed to develop the skills, understanding, and
attitudes needed by workers in their occupations. Instructional programs organized within career
pathways include agriculture, family and consumer sciences, trade and industry, marketing,
business, diversified occupations, technology education, cosmetology, health education, and
others.
In high school graduate data supplied to us by the Office of the Superintendent of Public
Instruction (OSPI), each student observation has 0 – 1 flags for being a CTE completer or not
and for being a CTE concentrator or not. A student is identified as a CTE completer if she or he
had acquired 360 hours of instruction in a single CTE program area with at least D grades or
better. CTE concentrators are students who enrolled in two or more CTE courses above the
exploratory level in a single career cluster. High school graduates could be a completer only, a
concentrator only, a completer and concentrator, or neither a completer or concentrator. We
define the “treatment” for this study to be either a concentrator or completer (or both). The
comparison group is students who are neither a completer nor a concentrator.
Participant Characteristics
Table 13.1 provides descriptive data that compare the students in the treatment group to
those in the comparison group pool. The first two columns of numbers compare the High School

W.E. Upjohn Institute for Employment Research 162
Net Impact and Benefit-Cost Estimates of the Workforce Development System in Washington State
Table 13.1 Descriptive Statistics for High School CTE Treatment and Comparison Groups 2010/2011 2011/2012
Characteristics CTE Completer or Concentrator Non-CTE
CTE Completer or Concentrator Non-CTE
Demographics and Education Female --- --- 48.9% 53.1% Race: White 68.3%†† 68.4%†† 66.1%†† 66.7%†† Black 4.1% 4.5% 4.2% 4.5% Hispanic 14.9% 12.1% 15.5% 13.4% Other race 12.7% 15.0% 14.2% 15.4% Mean, age 17.7†† 17.7†† 17.7 17.7 Disability 9.3% 7.9% 9.4% 8.8% Free-Reduced lunch 35.9% 32.3% 37.7% 35.1% Bilingual 2.3% 2.5% 2.2% 2.4% 12th grade GPA 2.81 2.96 2.84 2.94 Reading score 424.6 429.1 426.0 429.4 Reading proficiency 93.5% 94.2% 92.2% 92.6% Math score 399.8 407.4 408.1 412.8 Math proficiency 59.3% 67.8% 68.1% 72.5% West WA 66.3% 67.1% 66.3% 67.7% Urban county 53.4% 56.4% 57.9% 52.7% Employment and Earnings (prior to Senior year) Percentage employed prior to Senior year 21.5% 19.6% 19.8%†† 19.3%†† Average quarterly earningsa $245 $213 $213†† $215†† Mean, earnings trendb $5.2†† $5.1†† $6.3†† $6.8†† Mean, earnings varianceb (in 106 $) $0.2 $0.2 $0.2†† $0.2†† Job turnover 21.1% 19.4% 19.5%†† 19.0%†† Percentage of quarters with multiple jobs 1.8% 1.6% 1.6%†† 1.6%†† Had earnings dip 16.2% 14.8% 13.2%†† 13.0%†† Mean, number of quarters since dipa 0.6 0.6 0.5†† 0.5†† Average earnings dip size in percentagea 13.8% 12.8% 11.4%†† 11.3%†† Sample Size 32,974 32,902 34,546 31,286 NOTE: Monetary data in 2014$. Difference in means is significant at 0.05 level, unless otherwise denoted. --- means not available.Prior employment and earnings variables are defined in Chapter 3 (pp. 24-25). aAverages include observations with values of zero. bTrend and variance calculations include quarters with zero earnings, if any. ††Differences in means are not statistically significant at 0.05 level (t-test).
Career and Technical Education completers and concentrators who graduated in 2010/2011 to
the remaining students in the sample. The final two columns compare the 2011/2012 Career and
Technical Education “treatment” group to other graduates.25
The demographic and educational characteristics of the two groups of graduates are quite
different for both cohorts. There are more males (variable not available in the first cohort), a
higher share of Hispanic students, a higher percentage of disabled students, and a higher share of
25Data were unavailable for the 2012/2013 academic year, so the analyses in this chapter use 2011/2012 for
the short-term impact estimation.

W.E. Upjohn Institute for Employment Research 163
Net Impact and Benefit-Cost Estimates of the Workforce Development System in Washington State
students on free or reduced price lunch among the graduates who are in the treatment group
(concentrators or completers). Conversely, there is a smaller share of black and of other racial
backgrounds, a smaller share of bilingual students, and a smaller percentage of students from
west Washington and from urban areas in the CTE treatment group. In terms of educational
achievement, the CTE completers and concentrators have lower cumulative grade point averages
and test scores than the comparison group graduates.
For the students in these data sets, the prior employment and earnings data are based on
the labor market experiences prior to their senior year. Every one of the prior employment and
earnings variables has no statistically significant difference in means for the 2011/2012 cohort.
In the first cohort, the differences seem to be relatively minor. The CTE completers and
concentrators have more employment experience, but also more job turnover and larger dips in
earnings than their non-CTE treatment counterparts.
Net Impacts
For this program (and for Vocational Rehabilitation), the method that we relied on to
estimate net impacts was to estimate a regression model in which the outcomes of interest were
the dependent variables and the coefficient on a treatment dummy variable (equal to one if the
observation was a CTE concentrator or completer; 0 otherwise) was the net impact. Tables 13.2
and 13.3 provide the estimated net impacts of being a CTE completer or concentrator in high
school. The longer-term impacts, estimated from the 2010/2011 cohort, are all positive and
statistically significant. The longer-term net impacts on employment, hourly wage, and quarterly
hours worked are 2.9 percentage points, $0.44, and 16.0 hours, respectively. These impacts are
all in the range of 5 to 10 percent. Together, the estimated increases in employment, hourly
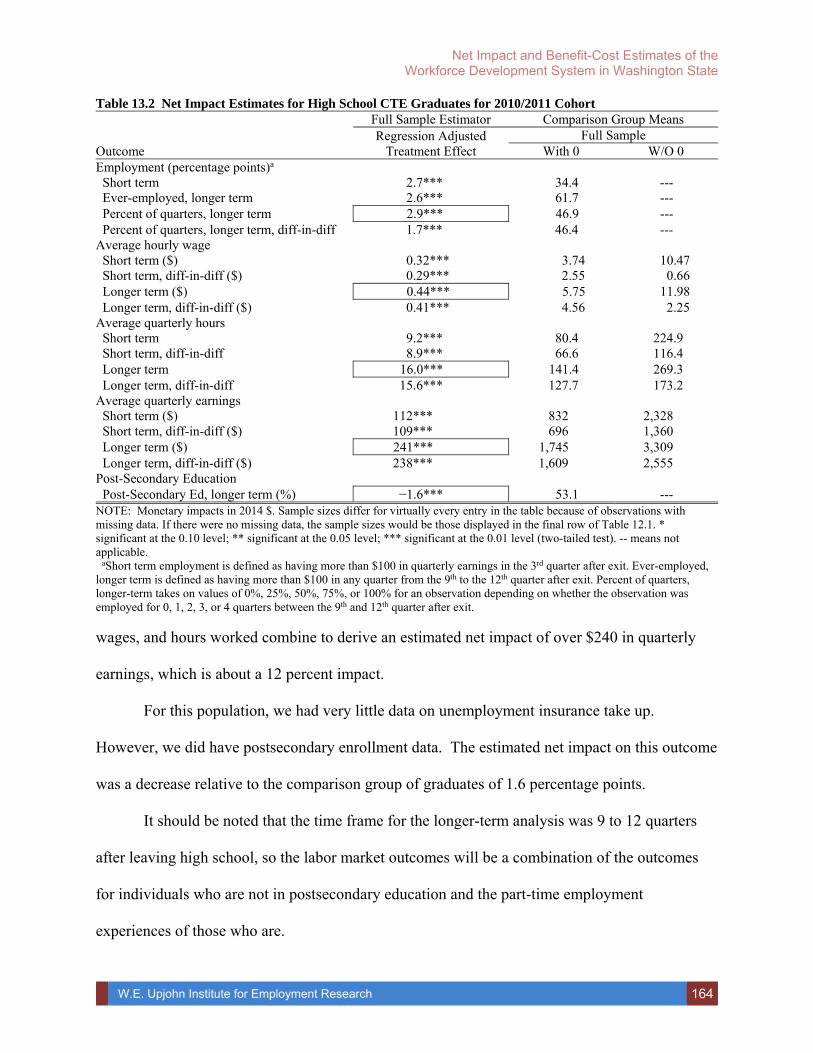
W.E. Upjohn Institute for Employment Research 164
Net Impact and Benefit-Cost Estimates of the Workforce Development System in Washington State
Table 13.2 Net Impact Estimates for High School CTE Graduates for 2010/2011 Cohort Full Sample Estimator Comparison Group Means Regression Adjusted
Treatment Effect Full Sample
Outcome With 0 W/O 0 Employment (percentage points)a Short term 2.7*** 34.4 --- Ever-employed, longer term 2.6*** 61.7 --- Percent of quarters, longer term 2.9*** 46.9 --- Percent of quarters, longer term, diff-in-diff 1.7*** 46.4 --- Average hourly wage Short term ($) 0.32*** 3.74 10.47 Short term, diff-in-diff ($) 0.29*** 2.55 0.66 Longer term ($) 0.44*** 5.75 11.98 Longer term, diff-in-diff ($) 0.41*** 4.56 2.25 Average quarterly hours Short term 9.2*** 80.4 224.9 Short term, diff-in-diff 8.9*** 66.6 116.4 Longer term 16.0*** 141.4 269.3 Longer term, diff-in-diff 15.6*** 127.7 173.2 Average quarterly earnings Short term ($) 112*** 832 2,328 Short term, diff-in-diff ($) 109*** 696 1,360 Longer term ($) 241*** 1,745 3,309 Longer term, diff-in-diff ($) 238*** 1,609 2,555 Post-Secondary Education Post-Secondary Ed, longer term (%) −1.6*** 53.1 --- NOTE: Monetary impacts in 2014 $. Sample sizes differ for virtually every entry in the table because of observations with missing data. If there were no missing data, the sample sizes would be those displayed in the final row of Table 12.1. * significant at the 0.10 level; ** significant at the 0.05 level; *** significant at the 0.01 level (two-tailed test). -- means not applicable. aShort term employment is defined as having more than $100 in quarterly earnings in the 3rd quarter after exit. Ever-employed, longer term is defined as having more than $100 in any quarter from the 9th to the 12th quarter after exit. Percent of quarters, longer-term takes on values of 0%, 25%, 50%, 75%, or 100% for an observation depending on whether the observation was employed for 0, 1, 2, 3, or 4 quarters between the 9th and 12th quarter after exit.
wages, and hours worked combine to derive an estimated net impact of over $240 in quarterly
earnings, which is about a 12 percent impact.
For this population, we had very little data on unemployment insurance take up.
However, we did have postsecondary enrollment data. The estimated net impact on this outcome
was a decrease relative to the comparison group of graduates of 1.6 percentage points.
It should be noted that the time frame for the longer-term analysis was 9 to 12 quarters
after leaving high school, so the labor market outcomes will be a combination of the outcomes
for individuals who are not in postsecondary education and the part-time employment
experiences of those who are.

W.E. Upjohn Institute for Employment Research 165
Net Impact and Benefit-Cost Estimates of the Workforce Development System in Washington State
Table 13.3 Net Impact Estimates for High School CTE Graduates for 2011/2012 Cohort
Full Sample Estimator Comparison Group Means
Regression Adjusted Treatment Effect
Full Sample Outcome With 0 W/O 0 Employmenta Short term 2.1** 36.0 --- Hourly wage Short term ($) 0.23** 3.98 10.66 Short term, diff-in-diff ($) 0.24** 2.87 0.87 Quarterly hours Short term 8.4*** 84.2 225.3 Short term, diff-in-diff 8.5*** 71.3 123.9 Quarterly earnings Short term ($) 95*** 907 2,426 Short term, diff-in-diff ($) 98*** 775 1,511 Post-Secondary Education Post-Secondary Ed, Short term (%) −1.5*** 57.1 -- NOTE: Monetary impacts in 2014 $. Sample sizes differ for virtually every entry in the table because of observations with missing data. If there were no missing data, the sample sizes would be those displayed in the final row of Table 12.1. * significant at the 0.10 level; ** significant at the 0.05 level; *** significant at the 0.01 level (two-tailed test). -- means not applicable. aShort term employment is defined as having more than $100 in quarterly earnings in the 3rd quarter after exit.
The short-term (three quarters after graduation) outcomes for CTE students displayed in
Tables 13.2 and 13.3 are very similar to the longer-term outcomes; however, they are smaller in
size. The employment differentials between CTE treatment and comparison group students are
estimated to be 2.7 and 2.1 percentage points for the 2010/2011 and 2011/2012 cohorts,
respectively; the hourly wage differentials are $0.32 and $0.23; the hours worked in a quarter
differentials are 9.2 and 8.4 hours; and the quarterly earnings impacts are estimated to be $112
and $95. As with the longer-term estimate, there is a negative differential in postsecondary
enrollment for the 2011/2012 cohort that is almost the same size as the longer-term differential:
–1.5 percentage points as compared to 1.6.
As we have done in prior chapters, we average the short-term net impact estimates from
Table 13.2 and 13.3 to derive our preferred estimate for the short term. These averages are
presented in Table 13.4, with the preferred estimates in “boxes.” The estimates in this table
suggest that in the short term, CTE results in favorable labor market outcomes for graduates,

W.E. Upjohn Institute for Employment Research 166
Net Impact and Benefit-Cost Estimates of the Workforce Development System in Washington State
Table 13.4 Short-Term Net Impact Estimates for High School CTE Graduates
2010/2011 Estimator
2011/2012 Estimator Average
Employmenta Short term 2.7*** 2.1** 2.4*** Hourly wage Short term ($) 0.32*** 0.23** 0.28*** Short term, diff-in-diff ($) 0.29*** 0.24** 0.27*** Quarterly hours Short term 9.2*** 8.4*** 8.8*** Short term, diff-in-diff 8.9*** 8.5*** 8.7*** Quarterly earnings Short term ($) 112*** 95*** 104*** Short term, diff-in-diff ($) 109*** 98*** 104*** Post-Secondary Education Post-Secondary Ed. Short term (%) −1.6*** −1.5*** −1.6***NOTE: Monetary data in 2014 $. * significant at the 0.10 level; ** significant at the 0.05 level; *** significant at the 0.01 level (two-tailed test). aShort term employment is defined as having more than $100 in quarterly earnings in the 3rd quarter after exit. although as noted above, these impacts confound part-time employment for students who
continue their education at the postsecondary level with graduates who directly enter the labor
market.

W.E. Upjohn Institute for Employment Research 167
Net Impact and Benefit-Cost Estimates of the Workforce Development System in Washington State
14 DIVISION OF VOCATIONAL REHABILITATION PROGRAMS
Housed within the Department of Social and Health Services, the Division of Vocational
Rehabilitation (DVR) offers training and other services to help eligible individuals with
disabilities become employed. The primary objective is competitive, full-time employment.
However, depending on the individual’s disability and functional limitations, other outcomes
may be more appropriate such as part-time employment, self-employment, or sheltered or
supported employment. The services that are provided on a customized basis include assessment,
counseling, vocational training, physical and restorative services (including corrective surgery),
and job search and placement assistance. Eligibility requirements include certification that the
individual:
has a physical, mental, or sensory impairment that constitutes or results in a substantial impediment to employment,
can benefit in terms of an employment outcome form the provision of vocational rehabilitation services, and
requires vocational rehabilitation services to prepare for, enter into, engage in, or retain gainful employment.
Note that approximately 90 percent of active clients in the program have severe disabilities.
Participant Characteristics
As with the high school CTE participants, we have been able to use the same data base
for treatment and comparison group cases for the DVR programs. The administrative data has a
field that identifies eligible clients who did and who did not get services, i.e., developed a
rehabilitation plan.26 The latter individuals became the comparison group pool. Table 14.1
26 DVR created this variable. Essentially, the treatment consisted of having a rehabilitation plan. Some
individuals successfully completed their plan and others did not. The comparison group comprised individuals who exited pre-plan.

W.E. Upjohn Institute for Employment Research 168
Net Impact and Benefit-Cost Estimates of the Workforce Development System in Washington State
provides descriptive data that compare the individuals in the treatment group to those in the
comparison group pool. The first two columns of numbers compare the DVR treatment exiters in
2010/2011 to the individuals in the comparison group. The final two columns compare the
2012/2013 exiters to their comparison group pool of applicants who exited pre-plan.
Table 14.1 Descriptive Statistics for DVR Treatment and Comparison Groups 2010/2011 2012/2013
Characteristics
DVR Treatment
Group Comparison
Group
DVR Treatment
Group Comparison
Group Demographics and Education Female 43.5% 41.1% 43.9%†† 43.1%†† Race: White 70.7% 67.9% 69.8% 66.9% Black 8.5% 9.9% 9.4%†† 10.3%†† Hispanic 8.3%†† 9.0%†† 8.7%†† 9.6%†† Other race 9.9%†† 9.6%†† 9.1%†† 9.6%†† Missing 2.5% 3.5% 3.1%†† 3.5%†† Mean, age at registration 37.9†† 38.0†† 38.0†† 38.4†† Employed at registration 14.4% 7.1% 14.0% 7.1% Mean, years of education at registration 13.6 13.5 13.6 13.5 Veteran 0.7%†† 1.1%†† 1.1%†† 1.5%†† Received SSDI 25.0% 21.1% 26.2%†† 24.9%†† Received SSI 19.3%†† 18.3%†† 20.3% 22.6% Received TANF 3.7% 6.7% 3.9% 6.7% Received other public assistance 25.1% 35.3% 24.8% 31.1% West WA 70.0% 64.0% 71.7%†† 70.0%†† Urban county 46.0% 40.4% 47.2%†† 45.6%†† Employment and Earnings (prior to registration) Percentage of prior quarters employed 48.2% 38.3% 45.9% 35.5% Average quarterly earningsa $2,548 $1,871 $2,420 $1,817 Mean, earnings trendb −$38.8†† −$46.4†† −$38.2†† −$30.6†† Mean, earnings varianceb (in 106 $) $7.6 $5.6 $6.9 $5.8 Job turnover 32.1% 35.8% 30.7% 33.4% Percentage of quarters with multiple jobs 11.3%†† 11.4%†† 11.1%†† 10.5%†† Had earnings dip 44.2% 40.4% 39.8% 29.7% Mean, number of quarters since dip at registrationa 1.7†† 1.7†† 1.6 1.2 Average earnings dip size in percentagea 37.0%†† 35.7%†† 33.3% 26.1% Sample Size 5,473 4,825 5,005 4,435 NOTE: Monetary data in 2014$. Difference in means is significant at 0.05 level, unless otherwise denoted. --- means not available.Prior employment and earnings variables are defined in Chapter 3 (pp. 24-25). aAverages include observations with values of zero. bTrend and variance calculations include quarters with zero earnings, if any. ††Differences in means are not statistically significant at 0.05 level (t-test).
The purposes of Table 14.1 are twofold. The table presents a descriptive picture of DVR
customers, and it demonstrates the differences between the treatment and comparison groups of

W.E. Upjohn Institute for Employment Research 169
Net Impact and Benefit-Cost Estimates of the Workforce Development System in Washington State
customers. The top panel of the table, labeled demographics and education, presents fairly
straightforward descriptions of the populations of customers. Just over 40 percent of customers
are women; about 70 percent of customers are white; their average age is about 38; between 7 to
14 percent of them are employed at registration; about one percent are veterans; a substantial
percentage are receiving SSDI, SSI, and/or other public assistance at the time of registration; and
about 70 percent are from the Western side of the state.
The bottom panel of the table is a bit more difficult to understand. It consists of variables
that describe the labor market experiences of customer prior to applying for services. The first
variable presents the percent of quarters in which the average customer worked during this
time—less than 50 percent. The second variable presents the average quarterly earnings prior to
applying for services; this average, which includes a high percentage of 0’s, is between $1,800
and $2,500. The next two variables are the trend and variance of the trend in quarterly earnings
for customers. The negative sign on the trend indicates that, on average, quarterly earnings go
smaller. The next variable, job turnover, measures what percentage of customers had earnings
from different employers. The next variable reports what percentage of quarters of employment
had more than one employer in the quarter—this is about 11 percent of the quarters on average.
The final set of variables refer to an earnings dip, which is a drop in earnings of 20 percent or
more from one quarter to the next. About 40 percent of the customers had experienced an
earnings dip prior to applying for services. On average, the dip occurred around 1.7 quarters
prior to application and was, on average, about 35 percent.
In using the table to identify any systematic differences between the treatment and
comparison cases, we find that many of the differences are not statistically significant. Relative
to the individuals comprising the comparison group, the means presented in the table concerning

W.E. Upjohn Institute for Employment Research 170
Net Impact and Benefit-Cost Estimates of the Workforce Development System in Washington State
socio-demographic variables at the time of application for services show that the individuals in
the treatment group are slightly less likely to be a minority, more likely to be employed at
registration, less likely to be receiving TANF or other public assistance at the time of
application, more likely to be from western Washington, and more likely to be from an urban
county. The means in the table concerning employment and earnings histories prior to
registration show that the treatment group had higher levels of employment and average
quarterly earnings, and had less job turnover prior to applying.
Net Impacts
The major purpose of the study is to estimate the net impacts of the education and
training programs on clients. Tables 14.2 and 14.3 provide the estimated net impacts for
receiving services from DVR. As with comparable tables in the prior chapters, the first table
displays the short-term (3 quarters after exit) and the longer-term (9–12 quarters after exit)
outcomes for the 2010/2011 cohort of program exiters. The second table is limited to the short-
term net impacts for the 2012/2013 cohort. The table presents the net impact estimate from a
regression model in which the dependent variables are the outcomes. The preferred specification
uses levels of the outcome variables. The assumptions of the difference-in-differences
specification are unlikely to hold for many of the treatment and comparison group cases. Many
customers were unlikely to be employed during the base period and/or disabling conditions may
have occurred between the base period and application. The final columns of the tables provide
the means of the comparison group, i.e., the individuals that did not receive services. These
columns are provided so that the net impacts can be estimated on a percentage basis.
The DVR programs are estimated to have substantial longer-term payoffs for the
individuals in the treatment group relative to those in the comparison group. The longer-term net

W.E. Upjohn Institute for Employment Research 171
Net Impact and Benefit-Cost Estimates of the Workforce Development System in Washington State
Table 14.2 Net Impact Estimates for DVR Programs for 2010/2011 Cohort
Full Sample Estimator Comparison Group Means
Regression Adjusted Treatment Effect
Full Sample Outcome With 0 W/O 0 Employment (percentage points)a Short term 20.1*** 18.7 --- Ever-employed, longer term 13.7*** 29.0 --- Percent of quarters, longer term 2.4*** 21.2 --- Percent of quarters, longer term, diff-in-diff −0.6 −4.8 --- Average hourly wage Short term ($) −0.03 2.70 13.84 Short term, diff-in-diff ($) −0.34** −1.31 −0.66 Longer term ($) 0.45*** 3.04 13.61 Longer term, diff-in-diff ($) 0.05 −0.97 −0.69 Average quarterly hours Short term 9.0*** 53.5 274.2 Short term, diff-in-diff −0.1 −20.3 22.8 Longer term 10.8*** 65.6 260.6 Longer term, diff-in-diff −0.3 −8.1 45.8 Average quarterly earnings Short term ($) 138*** 751 3,852 Short term, diff-in-diff ($) −7 −421 67 Longer term ($) 228*** 956 3,742 Longer term, diff-in-diff ($) 51 −216 446 Unemployment Insurance Benefits (average quarterly) Percent receiving, short term 0.1 4.9 --- Benefits, short term ($) −5 147 2,979 Percent receiving, longer term 1.1*** 4.1 --- Benefits, longer term ($) 25*** 44 1,887 NOTE: Monetary impacts in 2014 $. Sample sizes differ for virtually every entry in the table because of observations with missing data. If there were no missing data, the sample sizes would be those displayed in the final row of Table 13.1. * significant at the 0.10 level; ** significant at the 0.05 level; *** significant at the 0.01 level (two-tailed test). -- means not applicable. aShort term employment is defined as having more than $100 in quarterly earnings in the 3rd quarter after exit. Ever-employed, longer term is defined as having more than $100 in any quarter from the 9th to the 12th quarter after exit. Percent of quarters, longer-term takes on values of 0%, 25%, 50%, 75%, or 100% for an observation depending on whether the observation was employed for 0, 1, 2, 3, or 4 quarters between the 9th and 12th quarter after exit.
impact of receiving services on the employment rate is estimated to be 2.4 percentage points.
The net impacts on hourly wage and quarterly hours worked are $0.45 and 10.8 hours,
respectively. The impacts on average quarterly earnings is just under $230. All of these
impacts are statistically significant. The increased employment and earnings apparently
increases the propensity of DVR service recipients to receive unemployment insurance (up 1.1
percentage points) and to receive higher levels of benefits ($25 per quarter).
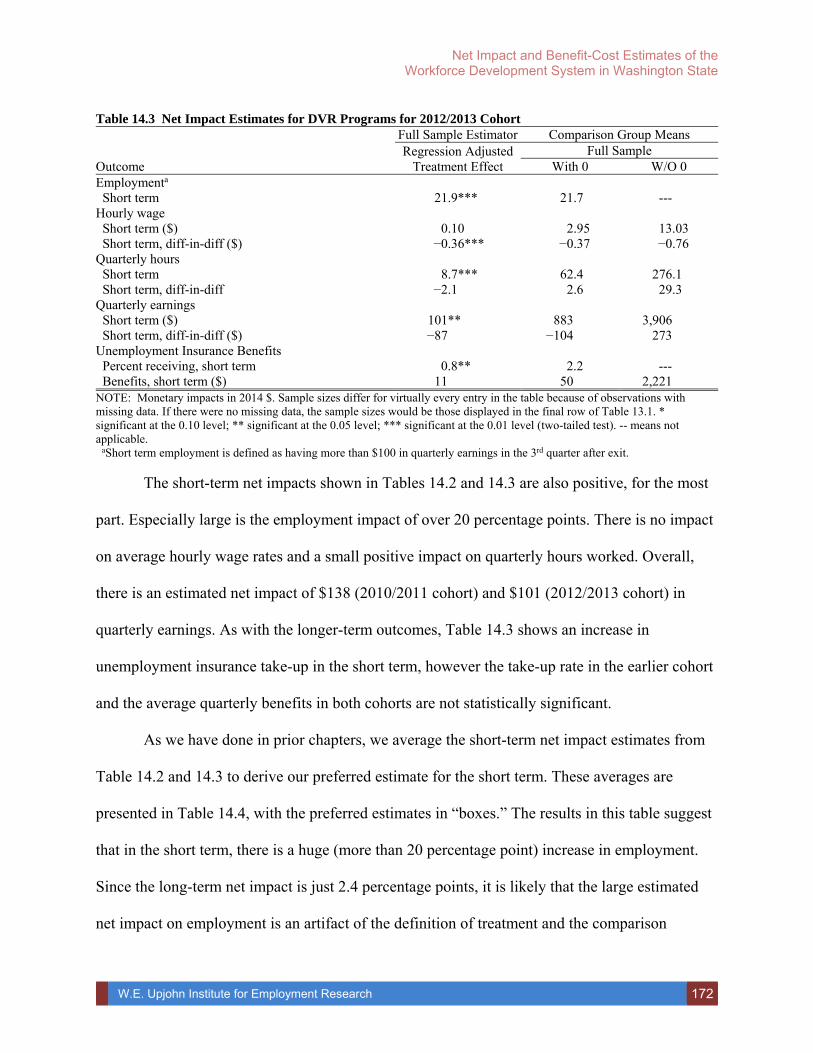
W.E. Upjohn Institute for Employment Research 172
Net Impact and Benefit-Cost Estimates of the Workforce Development System in Washington State
Table 14.3 Net Impact Estimates for DVR Programs for 2012/2013 Cohort Full Sample Estimator Comparison Group Means Regression Adjusted
Treatment Effect Full Sample
Outcome With 0 W/O 0 Employmenta Short term 21.9*** 21.7 --- Hourly wage Short term ($) 0.10 2.95 13.03 Short term, diff-in-diff ($) −0.36*** −0.37 −0.76 Quarterly hours Short term 8.7*** 62.4 276.1 Short term, diff-in-diff −2.1 2.6 29.3 Quarterly earnings Short term ($) 101** 883 3,906 Short term, diff-in-diff ($) −87 −104 273 Unemployment Insurance Benefits Percent receiving, short term 0.8** 2.2 --- Benefits, short term ($) 11 50 2,221 NOTE: Monetary impacts in 2014 $. Sample sizes differ for virtually every entry in the table because of observations with missing data. If there were no missing data, the sample sizes would be those displayed in the final row of Table 13.1. * significant at the 0.10 level; ** significant at the 0.05 level; *** significant at the 0.01 level (two-tailed test). -- means not applicable. aShort term employment is defined as having more than $100 in quarterly earnings in the 3rd quarter after exit.
The short-term net impacts shown in Tables 14.2 and 14.3 are also positive, for the most
part. Especially large is the employment impact of over 20 percentage points. There is no impact
on average hourly wage rates and a small positive impact on quarterly hours worked. Overall,
there is an estimated net impact of $138 (2010/2011 cohort) and $101 (2012/2013 cohort) in
quarterly earnings. As with the longer-term outcomes, Table 14.3 shows an increase in
unemployment insurance take-up in the short term, however the take-up rate in the earlier cohort
and the average quarterly benefits in both cohorts are not statistically significant.
As we have done in prior chapters, we average the short-term net impact estimates from
Table 14.2 and 14.3 to derive our preferred estimate for the short term. These averages are
presented in Table 14.4, with the preferred estimates in “boxes.” The results in this table suggest
that in the short term, there is a huge (more than 20 percentage point) increase in employment.
Since the long-term net impact is just 2.4 percentage points, it is likely that the large estimated
net impact on employment is an artifact of the definition of treatment and the comparison

W.E. Upjohn Institute for Employment Research 173
Net Impact and Benefit-Cost Estimates of the Workforce Development System in Washington State
Table 14.4 Short-Term Net Impact Estimates for DVR Programs
2010/2011 Estimator
2012/2013 Estimator Average
Employmenta Short term 20.1*** 21.9*** 21.0*** Hourly wage Short term ($) −0.03 0.10 0.04 Short term, diff-in-diff ($) −0.34** −0.36*** −0.35*** Quarterly hours Short term 9.0*** 8.7*** 8.9*** Short term, diff-in-diff −0.1 −2.1 −1.1 Quarterly earnings Short term ($) 138*** 101** 120*** Short term, diff-in-diff ($) −7 −87 −47 Unemployment Insurance Benefits Percent receiving, short term 0.1 0.8** 0.5 Benefits, short term ($) −5 11 3 NOTE: Monetary data in 2014 $. * significant at the 0.10 level; ** significant at the 0.05 level; *** significant at the 0.01 level (two-tailed test). aShort term employment is defined as having more than $100 in quarterly earnings in the 3rd quarter after exit. group’s employment rate substantially catches up to the treatment group by the longer-term. The
short-term net impacts on average quarterly hours of employment and quarterly earnings are
modestly positive, and these impacts grow slightly in the longer-term.

W.E. Upjohn Institute for Employment Research 174
Net Impact and Benefit-Cost Estimates of the Workforce Development System in Washington State

W.E. Upjohn Institute for Employment Research 175
Net Impact and Benefit-Cost Estimates of the Workforce Development System in Washington State
15 BENEFIT-COST ANALYSES
In addition to the net impact analyses, we have conducted benefit-cost analyses for the
workforce development programs. This chapter documents the methodology that we used and
the results of these analyses.
The essential task of a benefit-cost analysis (BCA) is to measure the benefits and costs of
a program, place weights on each, and arrive at a conclusion as to the net benefits of the
program. To conduct a BCA, it is necessary to measure the benefits and costs in a common unit,
usually dollars. Note that the benefits and costs may differ depending on the decision making
groups whose interests are affected by the action. For example, increased earnings are a benefit
for individuals, but a cost for employers (who get the benefits of increased production of goods
or services). In considering whether the workforce programs that are administered in Washington
had net benefits, we explicitly estimated benefits and costs for two groups: 1) the program
participants and 2) the rest of society (i.e., taxpayers).
For this project, the benefits that are calculated include the following:
Increased lifetime earnings Fringe benefits associated with those earnings Taxes on earnings (negative benefit to participants; positive benefit to society) Changes to UI benefits (if changes are negative; positive benefit to participants
and negative benefit to society; vice versa if changes are positive) The costs included the following:
Forgone earnings (reduced earnings during the period of program participation) Forgone tax receipts (cost to the public) Tuition payments, if any Program costs

W.E. Upjohn Institute for Employment Research 176
Net Impact and Benefit-Cost Estimates of the Workforce Development System in Washington State
Most of these costs and benefits are derived from the net impact estimates presented in prior
chapters or by calculating some simple descriptive statistics from the underlying data. The next
sections of the chapter document the assumptions and data that we have used to calculate each of
those benefits and costs. The final part of the chapter presents the results and discussion.
Lifetime Earnings
Figure 15.1 shows the earnings profiles for an average individual in any one of the
treatment groups and an average individual in the comparison group. The hypothesis used to
construct these profiles is that encountering a workforce development program enhances an
individual’s skills and productivity (thus increasing wage rates) and increases the likelihood of
employment. Thus, after the period of time spent participating in the program, the earnings
profile of the average treatment individual is above the earnings profile of the average
comparison group member (both hourly wage and employment net impacts are positive). During
the period of participation, the treatment individual’s earnings will be below the comparison
Real earnings
Partic. period
D
D2
3 10.5 12
Comparison group
Program participants
age
D1
Figure 15.1 Hypothetical Earnings Profiles of Training Participants and Comparison Group Members

W.E. Upjohn Institute for Employment Research 177
Net Impact and Benefit-Cost Estimates of the Workforce Development System in Washington State
group member’s earnings, on average. These are the forgone costs in the form of wages that are
given up by the participant while he or she is receiving services.
The theoretical lifetime earnings benefit would be the shaded area in the graph. The
average comparison group member’s real earnings grow at a constant rate (increase in
productivity). The average treatment group member’s earnings eventually become higher after
program participation and likely grow faster as they accumulate additional human capital in the
form of work experience.
The problem that needed to be solved in this project is how to estimate the shaded area.
The two lines D1 and D2 represent the difference in average earnings at three quarters after
exiting from the training program and at 10.5 quarters after exit. These are essentially the short-
term and longer-term net impact estimates that have been documented in the prior chapters.
(Note that 10.5 is the midpoint of quarters 9-12). Because the profiles represent the average
individual, we use the unconditional net earnings impacts to calculate these benefits. (They
automatically control for employment, hourly wage, and hours worked impacts.)
What is unknown (and unknowable from the data to which we had access) is the shape of
the earnings profiles into the future after the D2 point. The profiles could continue to move apart
from each other if the program participants continue to be more and more productive relative to
the comparison group member, or the profiles eventually may converge over time if the
participation effect depreciates. Alternatively, the profiles may become parallel to reflect a
scenario in which the program participants gain a permanent advantage, but then their
productivity growth eventually matches the comparison group members.

W.E. Upjohn Institute for Employment Research 178
Net Impact and Benefit-Cost Estimates of the Workforce Development System in Washington State
For this study, we interpolated the time path of unconditional earnings net impacts for the
first 12 quarters after exit using a simple linearization27 of the 2010/2011 cohort results. (Note
these are the values that are graphed in the 2010/2011 cohort net impact figures above.) We used
a single cohort in order to get a consistent base for the interpolation.
To extrapolate for quarters beyond the three years of follow-up data, the assumption was
made that in all quarters after quarter 12 until the average participant turned 65, the net impact
would be constant, i.e., the distance between the earnings outcomes for program participants and
comparison group members shown in Figure 15.1 would stay constant after the 12th quarter.
Table 15.1 provides the data that were used in the interpolations and extrapolations.
Fringe Benefits
With additional earnings, workers will also accrue additional fringe benefits in the form
of paid leave, paid insurances, retirement/savings plan contributions, and other non-cash
benefits. The U.S. Department of Labor Bureau of Labor Statistics, Economic News Release, No.
16-1808, September 8, 2016 reports the ratio of “Total Benefits” to “Wages and Salaries” for
private in June 2016 to be 43.5 percent for “All U.S.” and 42.5 for the Pacific Census region.
Under the assumption that workforce development program participants are less likely to get
fringe benefit coverages than the average worker, and to be conservative in our benefit
27 Equations (1) through (3) specify the interpolation used for these two programs.
(1) Trendj = (Longtermj – Shorttermj)/ 7.5 (2) Constantj = Shorttermj – 3 * QtrEarnchangej (3) Netearningsimpactjt = Trendj + Constantj * q , q = 1, 12; where Longtermj, Shorttermj = longer-term and short-term average quarterly unconditional earnings net impact estimates for program j, and Netearningsimpactjt = interpolated average quarterly unconditional earnings net impact estimates for program j in quarter q

W.E. Upjohn Institute for Employment Research 179
Net Impact and Benefit-Cost Estimates of the Workforce Development System in Washington State
Table 15.1 Data Used in Earnings Interpolations and Extrapolations
Program
Short-term Net Impacta
(‘14$) (1)
Longer-termNet Impactb
(‘14$) (2)
Earnings Linearizationc
(‘14$) (3)
Quarter 13 + Extrapolated Valued (‘14$)
(4)
Average Age at Exite
(5)
Number of Quarters until 65
(6)
WIA Adults 1,646 1,319 1,776.8 – 43.6q 1,253.6 37.6 109 WIA Dislocated Workers 1,881 1,455 2,051.4 – 56.8q 1,369.8 45.5 78 WIA Youth 363 250 408.3 – 15.1q 227.1 19.2 183 Workforce Education 1,454 1,372 1,486.7 – 10.9q 1,355.9 32.0 132 Worker Retraining 770 1,132 625.1 + 48.3q 1,204.7 41.8 93 Basic Education for Adults 130 −85 216.1 – 28.7q 0.0 32.0 132 I-BEST 814 976 749.2 + 21.6q 1,008.4 33.0 128 Private Career Schools 709 509 750.7 – 13.9q 583.9 31.0 136 Apprenticeship 3,638 3,447 3,685.7 – 15.9q 3,494.9 32.3 131 Aerospace Training 3,839 4,132 3,721.7 + 39.1q 4190.9 34.2 123 Career and Technical Education 112 241 20.5 + 30.5q 386.5 17.7 190 Vocational Rehabilitation 138 228 102.0 + 12.0q 246.0 39.3 103 a Unconditional average quarterly earnings net impact for 3rd quarter after exit estimated from 2010/2011 cohort. b Longer-term unconditional average quarterly earnings net impact estimated from 2010/2011 cohort. c For first nine rows, trend regression on first 12 quarters of unconditional average quarterly earnings net impact estimated from 2010/2011 cohort. For final two rows, linearization as described in footnote 27. d Calculated from column (3) with q = 12. e Arithmetic average of average age at registration for 2010/2011 and 2012/2013 cohorts plus average duration of services.
estimation, we used the assumption that this ratio would be 40 percent (applied to the net impact
earnings increments).
Employee Tax Liabilities
Higher earnings will lead to payment of increased payroll, sales/excise, and federal
income taxes.28 The increased taxes are a cost to participants and a benefit to the public. We used
average (marginal) tax rates for each of the three types of taxes and applied these rates to the
estimated earnings changes.
Payroll Taxes
Payroll taxes include social security and Medicare tax rates. The current rate of 7.65
percent was used to estimate the future liabilities. This requires three assumptions: this rate will
not increase in future years, the average participant will be employed in covered employment
28Washington does not have state income taxes.

W.E. Upjohn Institute for Employment Research 180
Net Impact and Benefit-Cost Estimates of the Workforce Development System in Washington State
(not self-employed), and that the average participant will not exceed the maximum earnings
levels against which this payroll tax is applied. The assumption that the rate will remain fixed at
its current rate seemed like a reasonable compromise since it is likely that the rate will continue
to increase somewhat over time as it has in the past, but it is also likely that some participants
will work in non-covered employment (such as agriculture) and that a few participants will
exceed the taxable earnings maximums. Thus we may be underestimating future tax rates, but
overestimating the taxable base.
Note that under FICA employers also pay additional payroll taxes. However, these taxes
do not need to be factored into the benefit-cost analysis since they are a transfer from employers
to the public. Similarly, the document W. Vroman, Tax Equity Study, 1999, showed that
employers bore, on average, a payroll tax rate of 2.13 percent for unemployment insurance taxes.
But, these also represent a transfer from employers to the public that do not affect participants.
Sales/Excise Taxes
We used a methodology similar to the payroll tax estimation to calculate these tax
liabilities, but in this case used a rate of 4.6 percent for all of the programs except WIA
dislocated workers, community and technical college worker retraining, and apprenticeships. For
the latter programs, in which recipients had higher incomes, we used a rate or 8.35 percent.
These rates were derived from a table titled, “Current Tax System: Tax Burden on Households,
Major State and Local Taxes” from an online document prepared by a State of Washington
analyst, Rick Peterson, accessed at http://www1.leg.wa.gov/documents/opr/2005/Tax%20
Alternatives%20Model%2020055%ver2.xls in March 2006. Table 15.2 reproduces a portion of
that table along with a calculation of marginal tax rates. The rate that we used for all of the
programs except the three mentioned above is the first entry in the marginal tax column (4). The

W.E. Upjohn Institute for Employment Research 181
Net Impact and Benefit-Cost Estimates of the Workforce Development System in Washington State
rate used for the programs with participants who have higher household incomes, 8.35 percent, is
the arithmetic average of the next two entries in that column.
Table 15.2 Marginal Sales/Excise Tax Rate Calculations
Total household income (1)
Total sales and excise taxes (2)
Approximate average income (3)
Marginal tax rate (4)
$0–$20,000 $1,769 $12,457
0.046
$20–$30,000 2,344 24,936
0.0903
$30–$40,000 3,184 34,236
0.0767
$40–$50,000 4,028 45,258
Federal Income Tax
We again used a simple average (marginal) tax rate, which is applied to the change in
earnings. The source used was the U.S. Department of Treasury, Internal Revenue Service, SOI
Tax Stats – Individual Statistical Tables by Size of Adjusted Gross Income
(https://www.irs.gov/uac/soi-tax-stats-individual-statistical-tables-by-adjusted-gross-income.pdf:
accessed September 2016), Table 1.1. This table showed average tax payments for filing year
2015 (tax year of 2014). Table 15.3 includes some of that data and displays marginal tax rates.
Note that the rows of the table are in categories of adjusted gross income (AGI) and not total
income. In general, AGI is less than household income. The average of the marginal tax rates for
AGI classes between $5,000 and $20,000 is 0.0449, and the average of the marginal tax rates for
AGIs between $20,000 and $40,000 is 0.0866. Based on these two numbers, we decided to use a
(marginal) tax rate of 0.045 for all the programs except WIA dislocated workers, community and
technical college worker retraining, and apprenticeship. For the latter three programs, we use
0.09.

W.E. Upjohn Institute for Employment Research 182
Net Impact and Benefit-Cost Estimates of the Workforce Development System in Washington State
Table 15.3 Marginal Federal Income Tax Rate Calculations
Total adjusted gross income (1)
Average tax liability, 2014 (2)
AGI midpoint (3)
Marginal tax rate (4)
$1 – 4,999 $ 178 $ 2,500
0.0042
$5,000 – 9,999 199 7,500
0.0194
$10,000 – 14,999 296 12,500
0.0704
$15,000 – 19,999 649 17,500
0.0700
$20,000 – 24,999 999 22,500
0.0904
$25,000 – 29,999 1,451 17,500
0.0995
$30,000 – 39,999 2,197 35,000
NOTE: Average tax liability in (2) is conditional on having a liability. Marginal tax rate calculated as the (Δ average tax liability) / (Δ midpoint). SOURCE: U.S. Department of Treasury, Internal Revenue Service, SOI Tax Stats – Individual Statistical Tables by Size of Adjusted Gross Income, Table 1.1.
Unemployment Compensation
Unemployment compensation benefits in the future may increase for participants if
programs increase employment (and therefore the probability of receiving UI) or increase
earnings (and therefore benefits) or they may decrease if programs decrease the likelihood of
unemployment or decrease duration of unemployment spells. Increased UI benefits in the future
would be a benefit to participants and cost to the public.
We used a similar empirical strategy as we did for lifetime earnings to interpolate and
extrapolate. In particular, the short-term and longer-term net impact estimates presented in each
chapter provide an estimate of the unconditional quarterly benefits for quarters three and “10.5”
after program exit. We divided the difference in the estimates by 7.5 quarters to get a quarterly
change that we applied for interpolation purposes. Then we used the estimate for the 12th
quarter after exit to extrapolate for 28 more quarters for all of the programs except WIA youth
programs, aerospace training, and secondary CTE programs. We were unable to estimate net

W.E. Upjohn Institute for Employment Research 183
Net Impact and Benefit-Cost Estimates of the Workforce Development System in Washington State
impacts of participation in the two workforce programs that serve youth (WIA youth and
secondary CTE) because of a very small number of observations. So, we did not estimate this
benefit or cost for those two programs.
Table 15.4 exhibits the precise estimates that we used in the cost-benefit analyses. The
typical pattern for the workforce development programs is that in the short term, unemployment
compensation benefits are decreased for participants who exit because, for the most part,
employment rates increase—at least, some individuals leave the UI rolls. However, as time
progresses, some workers begin to lose employment, and the groups UI net impact benefits
become positive, although of relatively small magnitude. There are some exceptions to this
general pattern; for some programs (i.e., basic education for adults and aerospace training)
continue to be negative for the entire period. For registered apprentices, the estimates are quite
sizeable and positive, which suggests that a larger share of the workers become unemployed and
collect benefits as well as the fact that earnings are large, so benefits are relatively large.
Table 15.4 Interpolation/Extrapolation of Unconditional Quarterly UI Benefits, by Program
Quarter after exit
Program WIA Adult
WIA DW
Workforce Educ.
Worker Retrain. BEdA
I-BEST
Priv. Career Appren. Aerospace DVR
1 −197.2 −664.1 −276.2 −315.7 −126.4 − 311.4 −190.7 464.5 0 51.6 2 −173.6 −581.3 −267.8 −277.6 −114.2 −281.7 −170.6 443 0 49.8 3 −150 −498.5 −259.4 −239.5 −102 −252.0 −150.5 421.5 0 48 4 −126.4 −415.7 −251 −201.4 −89.8 −222.3 −130.4 400 0 46.2 5 −102.8 −332.9 −242.6 −163.3 −77.6 -192.6 −110.3 378.5 0 44.4 6 −79.2 −250.1 −234.2 −125.2 −65.4 −162.9 −90.2 357 0 42.6 7 −55.6 −167.3 −225.8 −87.1 −53.2 −133.2 −70.1 335.5 0 40.8 8 −32 −84.5 −217.4 −49 −41 −103.5 −50 314 0 39 9 −8.4 −1.7 −209 −10.9 −28.8 −-73.8 −29.9 292.5 0 37.2 10 15.2 81.1 −200.6 27.2 −16.6 −44.1 −9.8 271 0 35.4 11 38.8 163.9 −192.2 65.3 −4.4 −14.4 10.3 249.5 0 33.6 12 - 40 62.4 246.7 −183.8 103.4 7.8 15.3 30.4 228 0 31.8 NOTE: Entries are in 2014 $. Extrapolation periods were 40 quarters.

W.E. Upjohn Institute for Employment Research 184
Net Impact and Benefit-Cost Estimates of the Workforce Development System in Washington State
Costs
Two types of costs were estimated for each of the programs. The first was forgone
earnings and total compensation, which would be reduced earnings, fringe benefits, and taxes
while the participants were actually engaged in the workforce development programs. The
forgone costs also generated “forgone taxes,” which would be costs borne by the public. The
second type of cost was the actual direct costs of the program services. In some cases, this
involves tuition or fee payments by the participants, and in almost all cases, it involves state
subsidies for delivering the services.29 The data sources for these types of costs are considered in
turn.
Forgone Compensation
Forgone earnings represent the difference between what workforce development program
participants would have earned if they had not participated in a program (which is unobservable)
and what they earned while they did participate. The natural estimate for the former is the
earnings of the matched comparison group members during the length of training. Specifically,
we used equation (4) to estimate mechanistically the forgone earnings. Note that we calculate
them in real $. Specifically, we calculate Forgonei for both 2010/2011 and 2012/2013 exiters and
average them. Table 15.5 displays the data as tabulated from administrative records. Table 14.6
displays the estimated forgone earnings.
(4) 1 1 0ˆ0.5
i i ii iForgone E E E d ,
where, 1 0,E E = avg. quarterly earnings (uncond.) for treatment group in quarter –1
and during participation period, respectively.
29 The exception is private career schools, which are assumed to get no state subsidy.

W.E. Upjohn Institute for Employment Research 185
Net Impact and Benefit-Cost Estimates of the Workforce Development System in Washington State
1E = avg. quarterly earnings in 1st post-exit period for matched
comparison group d = avg. program participation duration
i = indexes program Table 15.5 Average Quarterly Earnings and Average Training Duration, by Program
Program
1E
0E
1E
d (in quarters)
2010/2011
2012/2013 2010/2011 2012/2013 2010/2011 2012/2013 2010/2011 2012/2013
WIA Adults 1,680 1,717 2,556 3,210 2,120 2,838 3.37 3.08 WIA Disloc. Workers 5,931 5,540 2,986 3,737 3,455 3,889 4.47 4.24 WIA Youth 355 364 1,103 1,187 1,267 2,350 3.32 2.94 CTC Workforce Educ. 3,722 3,056 3,332 3,345 2,441 3,180 4.65 5.27 CTC Worker Retraining 3,265 2,678 1,842 2,660 3,026 3,413 5.58 6.33 CTC BEdA 1,850 2,115 2,154 2,657 2,186 2,796 1.46 1.37 CTC I-BEST 1,949 1,700 2,257 2,413 2,405 3,163 1.71 2.70 Priv. Career Schools 2,843 3,015 2,159 2,274 2,156 2,891 1.87 1.50 Apprentice 6,713 6,580 9,402 9,649 3,603 4,208 10.94 11.87 Aerospace 2,636 2,936 3,052 3,292 2,965 3,702 3.23 3.20 Secondary CTE 315 281 857 853 1,219 1,331 1.47 1.46 DVR 1,529 1,311 2,025 1,820 814 959 4.59 5.24 NOTE: Average quarterly earnings data in columns (1) – (6) are in ‘14 $.
Table 15.6 Estimated Forgone Earnings, by Program
Program
Foregone
2010/2011 (1)
2012/2013 (2)
Average (3)
WIA Adults −2,214 −2,872 −2,544 WIA Disloc. Workers 7,627 4,194 5,911 WIA Youth − 968 500 − 234 CTC Workforce Educ. −2,444 −1,196 −1,820 CTC Worker Retraining 7,272 2,439 4,856 CTC BEdA −199 −276 −238 CTC I-BEST −182 57 −63 Priv. Career Schools 685 1,011 848 Apprenticeships −46,417 −50,501 −48,459 Aerospace −813 86 − 364 Secondary CTE − 173 − 68 − 121 DVR Programs −3,918 −3,601 −3,760 NOTE: Dollars in ‘14 $.

W.E. Upjohn Institute for Employment Research 186
Net Impact and Benefit-Cost Estimates of the Workforce Development System in Washington State
There is wide variation in these forgone earnings estimates. As might be expected, the
largest forgone earnings occur for WIA Dislocated Workers and CTC Worker Retraining
participants. These individuals have typically lost relatively high paying jobs, and spend several
quarters (see Table 15.5) to be retrained. Usually, their new jobs pay only a fraction of what their
old jobs did. Unlike prior studies in which we estimated positive foregone earnings for most
programs, with these two cohorts, we only found one other program with positive foregone
earnings – Private Career Schools – and our estimate there was only about $800. All of the other
programs were estimated to have negative forgone earnings, meaning that the program
participants were actually earning more than the comparison group on average during their
participation in programs. These negative forgone earnings were relatively small for five
programs – WIA Youth, BEdA, I-BEST, Aerospace Training, and CTE. They are relatively large
for the remaining four programs – WIA Adults, Workforce Education at Community and
Technical Colleges, DVR, and Registered Apprenticeship. The latter was quite large; almost
$50,000. This means that registered apprentices were earning almost $5,000 more per quarter on
average than their comparison group counterparts during their apprenticeships.
In the benefit-cost analyses discussed later in this chapter, the forgone earnings are
assumed to have associated fringe benefits and tax liabilities that factor into the individuals’
returns. Furthermore, the forgone tax liabilities are costs (or benefits in the case of
apprenticeships) for the public.
Program Costs
WIA. The WIA costs were calculated from cost and participant data published in the
Workforce Board’s WIA Title 1-B Annual Reports for PY 10 and PY 12. Those reports provide
annual participants and expenditures for youth, adults, and dislocated workers. We first

W.E. Upjohn Institute for Employment Research 187
Net Impact and Benefit-Cost Estimates of the Workforce Development System in Washington State
converted the published cost per participant to 2014$ by using the CPI-U (in Appendix B). Then
to adjust the expenditure per participant data (14$) to expenditure per exiter (14$), we used the
average durations from Table 15.5. Finally, we averaged the PY 10 and PY 12 data to get a
single cost for the cost/benefit analyses. Table 15.7 provides the data used in these calculations.
Table 15.7 WIA Costs per Participant, by Program
Program
2010/2011 2012/2013 Cost used in c/b analysis
(14$) Published cost/
participant Cost/participant
(14$) Cost/exitera
(14$) Published cost/
participant Cost/participant
(14$) Cost/exitera
(14$)
WIA Adults $2,451 $2,670 $2,250 $2,776 $2,865 $2,199 $2,224.50
Dislocated Workers 2,332 2,541 2,839 2,690 2,777 2,943 2,891
Youth 3,490 3,802 3,346 3,358 3,466 2,678 3,012
Community/Technical College Costs. Staff from the State Board for Community and
Technical Colleges (SBCTC) supplied the cost data for the BEdA, Job Preparation, Worker
Retraining, and Aerospace training programs to the WTECB. In particular, SBCTC supplied the
following average nominal costs for the state support and student cost for a full-time resident
student:
Year State Cost Student FY2011 Workplace Ed. $4,548 $1,956 Worker Retraining 4,576 1,966 BEdAa 4,736 0 Aerospace 4,519 1,941 FY2013 Workplace Ed. 4,089 2,458 Worker Retraining 4,076 2,451 BEdAa 4,906 0
aSBCTC staff noted that BEdA cost is not for tuition. It represents internal state subsidization from other mission areas because BEdA has no tuition.
Per state staff’s suggestion, we assumed that Workplace Education students averaged 1.9 years;
Worker Retraining participants averaged 1.3 years; and BEdA participants average 1.0 years of
full-time equivalent course taking. We furthermore assumed that BEdA students did not pay
tuition.

W.E. Upjohn Institute for Employment Research 188
Net Impact and Benefit-Cost Estimates of the Workforce Development System in Washington State
The program and private costs used in the cost-benefit calculations were derived by
inflating all of the costs to 2014$ and assigning the FY2011 data to the 2010/2011 cohorts and
FY2013 data to the 2012/2013 cohort. In the cost-benefit analyses, the arithmetic average of the
two cohorts’ costs were used. Thus the public (state) cost for Workforce Education equaled
$8,717 [1.9 ftes * 0.5 * ($4,955 + $4,221)]. The public cost for Worker Retraining = $4,705 [1.3
ftes * 0.5 ($4,986 + $4,207)]; and the public cost for BEdA = $5,112 [1.0 fte * 0.5 * ($5,160 +
$5,064)]. The private (tuition) costs for Workplace Education = $4,435 [1.9 ftes * 0.5 * ($2,131
+ $2,537)] and for Worker Retraining = $3,037 [1.3 ftes * 0.5 * ($2,142 + $2,530)].
Note that we are not including any other educational expenses such as books or
transportation; nor are we factoring in any sort of financial aid. In the case of BEdA, there are
no tuition or supply costs to participants by assumption.
Private Career Schools. Because of the tremendous variation in tuitions and fees at
Private Career Schools, we did not include private costs in the cost-benefit analysis.
Registered Apprenticeships. Registered Apprenticeships typically involve several years
of on-the-job training plus related formal instruction. Data on the duration of related instruction
came from the Department of Labor & Industries (L&I). The data on tuition and state subsidies
from SBCTC were used to calculate private and public apprenticeship costs. The related
instructional component of a Registered Apprenticeship is typically 144 hours, which works out
to 0.16 fte. Registered Apprenticeships typically last four years, so a total of 0.64 fte per
apprentice was assumed. In our prior study, we used information from the Washington
Department of Labor & Industries (L&I) that suggested that the negotiated cost of the formal
instruction part of apprenticeship programs is approximately one-half of the full-time equivalent
tuition. Using the student cost data supplied by SBCTC staff persons in 2014$ ($1,964 in

W.E. Upjohn Institute for Employment Research 189
Net Impact and Benefit-Cost Estimates of the Workforce Development System in Washington State
FY2011 and $2,344 in FY2013), assuming 0.64 ftes, and assuming that the employer/apprentice
pays half of the tuition cost works out to a private cost of $689. Typically, the employer would
pay these charges, but ultimately, we assume that part of the cost is borne by the apprentice
either directly or in lower wages. These costs do not include books, tools, or transportation.
The public cost includes the instructional subsidy to the community and technical college
system plus the average administrative cost per registered apprentice. The instructional subsidy
is 0.64 ftes times the average FY2011 and FY2013 state subsidy per fte of $4,264, which equals
$2,729. Pro-rating the annual administrative cost of approximately $1.6 million across the
apprentices yields an estimate of about $480 per exiter. Thus the public cost for a Registered
Apprentice is $3,209.
Aerospace training. As noted above in the description of the Aerospace Training
programs that are occurring in the state, the education comprises technical workforce education
within the community and technical college system to prepare individuals for aerospace
occupations. Consequently, we have used the cost data for Community and Technical College
Workforce Education for this specialized program.
Secondary Career and Technical Education. The Office of the Superintendent of
Public Instruction provided a state and federal support level of high school CTE of
approximately $359.48 million in PY 2010-11 and $365.21 million in PY 2012-13.30 The online
OSPI Washington State Report Card reports CTE high school enrollment of 259,405 and
190,316 for those two academic years, respectively. These figures represent a per student cost of
$1,385.8 and $1,919.0 in nominal terms, in 2010-11 and 2012-13. Absent more specific
information about the course taking of the concentrators and completers, we use the average of
30 Memo from Phouang Hamilton to Colleen Seto, no date.

W.E. Upjohn Institute for Employment Research 190
Net Impact and Benefit-Cost Estimates of the Workforce Development System in Washington State
these costs inflated to 2014$ as the cost of secondary CTE on a per student basis. This is
$1,745.3.
Division of Vocational Rehabilitation. Data provided by the Division of Vocational
Rehabilitation that tracked precisely the expenditures for purchased services for the treatment
groups analyzed in chapter 14 and that imputed counseling and guidance costs yielded a public
cost of $6,637 per individual customer who exited.
Results
Tables 15.8 – 15.19 provide the benefit-cost analyses for the workforce development
system programs. Each table has an estimate for the first ten quarters after exiting the program
and an estimated lifetime benefits and costs. The tables provide estimated returns on investment
(ROI) for the participant and for the public, if they are calculable.31 The results are present in real
2014$ dollars, so everything has been adjusted for inflation. However, in addition, the
participant’s benefits are discounted by an annual rate of 3.0 percent to take into account the time
value of money. However, the public’s benefits are not discounted.
31 If investment costs are negative because the forgone compensation of participants is negative, no ROI
can be calculated.

W.E. Upjohn Institute for Employment Research 191
Net Impact and Benefit-Cost Estimates of the Workforce Development System in Washington State
Table 15.8 Estimated Participant and Public Benefits and Costs per Participant in WIA Adult Programs
Benefit/Cost First 2.5 years Lifetime (until 65)
Participant Public Participant Public Benefit Earnings Fringe Benefits Taxes
14,787 5,915 −2,477
0 0
2,574
96,274 38,510 −16,126
0 0
23,370 Transfers UI
− 888
910
644
− 938
Costs Forgone compensation Program costs
−3,135
0
−426 2,225
− 3,135
0
−426 2,225
Return on investment (quarterly) -- 19.6% NOTE: ’14 $. Participant benefits discounted at 3.0 percent annual rate. – denotes not calculable. Table 15.9 Estimated Participant and Public Benefits and Costs per Participant in WIA Dislocated Workers Programs
Benefit/Cost First 2.5 years Lifetime (until 65)
Participant Public Participant Public Benefit Earnings Fringe Benefits Taxes
16,734 6,694 −4,184
0 0
4,347
67,803 27,121 −16,951
0 0
23,301 Transfers UI
−3,105
3,190
505
−1,169
Costs Forgone compensation Program costs
6,798
0
1,477 2,891
6,798
0
1,477 2,891
Return on investment (quarterly) 11.2% 16.4% NOTE: ’14 $. Participant benefits discounted at 3.0 percent annual rate. – denotes not calculable.
Table 15.10 Estimated Participant and Public Benefits and Costs per Participant in WIA Youth Programs
Benefit/Cost First 2.5 years Lifetime (until 65)
Participant Public Participant Public Benefit Earnings Fringe Benefits Taxes
3,133 1,253 −525
0 0
545
23,665 9,466 −3,964
0 0
7,128 Transfers UI
0
0
0
0
Costs Forgone compensation Program costs
−288
0
−39
3,012
−288
0
−39
3,012 Return on investment (quarterly) – 1.2% NOTE: ’14 $. Participant benefits discounted at 3.0 percent annual rate. – denotes not calculable.

W.E. Upjohn Institute for Employment Research 192
Net Impact and Benefit-Cost Estimates of the Workforce Development System in Washington State
Table 15.11 Estimated Participant and Public Benefits and Costs per Participant in Community and
Technical College Workforce Education Programs
Benefit/Cost First 2.5 years Lifetime (until 65)
Participant Public Participant PublicBenefit Earnings Fringe Benefits Taxes
13,709 5,483 −2,296
0 0
2,390
114,581 45,833 −19,192
0 0
30,099Transfers UI
−1,522 1,570 −1,441 1,469
Costs Forgone compensation Program costs
−2,243 4,435
−305 8,717
−2,243 4,435
−305 8,717
Return on investment (quarterly) -- 3.2%NOTE: ‘14 $. Participant benefits discounted at 3.0 percent annual rate. – denotes not calculable.
Table 15.12 Estimated Participant and Public Benefits and Costs per Participant in Community and
Technical College Worker Retraining Programs
Benefit/Cost First 2.5 years Lifetime (until 65)
Participant Public Participant Public Benefit Earnings Fringe Benefits Taxes
8,526 3,411 −2,132
0 0
2,227
69,116 27,646 −17,279
0 0
24,985 Transfers UI
−1,527
1,570
126
−122
Costs Forgone compensation Program costs
5,584 3,037
1,214 4,705
5,584 3,037
1,214 4,705
Return on investment (quarterly) 11.6% 5.2% NOTE: ‘14 $. Participant benefits discounted at 3.0 percent annual rate. – denotes not calculable.
Table 15.13 Estimated Participant and Public Benefits and Costs per Participant in Community and
Technical College BEdA Programs
Benefit/Cost
First 2.5 years Lifetime (until 65)
Participant Public Participant Public
Benefit Earnings Fringe Benefits Taxes
576 230 −97
0 0
117
367 147 −61
0 0
22Transfers UI
−733 758 -930
993
Costs Forgone compensation Program costs
−293
0 −40
5,112−293
0
−40
5,112Return on investment (quarterly) – –
NOTE: ‘14 $. Participant benefits discounted at 3.0 percent annual rate. – denotes not calculable.

W.E. Upjohn Institute for Employment Research 193
Net Impact and Benefit-Cost Estimates of the Workforce Development System in Washington State
Table 15.14 Estimated Participant and Public Benefits and Costs per Participant in Community and
Technical College I-BEST Programs
Benefit/Cost
First 2.5 years Lifetime (until 65)
Participant Public Participant Public
Benefit Earnings Fringe Benefits Taxes
8,324 3,329 −1,394
0 0
1,737
81,779 32,711 −13,698
0 0
25,551Transfers UI
−1,724 1,778 −1,371
1,348
Costs Forgone compensation Program costs
−77
0 −11
5,112−77
0
−11
5,112Return on investment (quarterly) – 4.2%
NOTE: ‘14 $. Participant benefits discounted at 3.0 percent annual rate. – denotes not calculable.
Table 15.15 Estimated Participant and Public Benefits and Costs per Participant in Private Career School
Programs
Benefit/Cost First 2.5 years Lifetime (until 65)
Participant Public Participant PublicBenefit Earnings Fringe Benefits Taxes
6,484 2,593 −1,086
0 0
1,129
50,796 20,318 −8,508
0 0
13,455Transfers UI
−1,038 1,070 −902
904
Costs Forgone compensation Program costs
1,045
na146 na
1,045 na
146 na
Return on investment (quarterly) – –NOTE: ’14 $. Participant benefits discounted at 3.0 percent annual rate. na denotes not available. – denotes not calculable
Table 15.16 Estimated Participant and Public Benefits and Costs per Participant in Apprenticeship
Programs
Benefit/Cost
First 2.5 years Lifetime (until 65)
Participant Public Participant Public
Benefit Earnings Fringe Benefits Taxes
34,566 13,827 −8,642
0 0
8,996
258,676 103,470 −64,669
0 0
105,725Transfers UI
−3,612 3,750 −9,956
11,392
Costs Forgone compensation Program costs
−55,728
4,689−12,115
3,209−55,728
689
−12,115
3,209Return on investment (quarterly) – 4.1%
NOTE: ’14 $. Participant benefits discounted at 3.0 percent annual rate. – denotes not calculable

W.E. Upjohn Institute for Employment Research 194
Net Impact and Benefit-Cost Estimates of the Workforce Development System in Washington State
Table 15.17 Estimated Participant and Public Benefits and Costs per Participant in Aerospace Training
Benefit/Cost First 2.5 years Lifetime (until 65)
Participant Public Participant PublicBenefit Earnings Fringe Benefits Taxes
37,785 15,114 −9,446
0 0
9,842
336,958 134,783 −84,239
0 0
129,541Transfers UI
−2,000 2,070 −3,871 4,322
Costs Forgone compensation Program costs
−419 4,435
−91 8,717
−419 4,435
−91 8,717
Return on investment (quarterly) – 14.2%NOTE: ’14 $. Participant benefits discounted at 3.0 percent annual rate. – denotes not calculable
Table 15.18 Estimated Participant and Public Benefits and Costs per Completer in Secondary CTE
Programs
Benefit/Cost
First 2.5 years Lifetime (until 65)
Participant Public Participant Public
Benefit Earnings Fringe Benefits Taxes
1,790 716 −300
0 0
315
37,361 14,945 −6,258
0 0
11,963Transfers UI
0 0 0 0
Costs Forgone compensation Program costs
−149
0−21
1,745−149
0−21
1,745Return on investment (quarterly) – 3.1%
NOTE: ’14 $. Participant benefits discounted at 3.0 percent annual rate. – denotes not calculable
Table 15.19 Estimated Participant and Public Benefits and Costs per Participant in DVR Programs
Benefit/Cost First 2.5 years Lifetime (until 65)
Participant Public Participant Public Benefit Earnings Fringe Benefits Taxes
1,606 643 −269
0 0
281
16,906 6,762 −2,832
0 0
4,111 Transfers UI
−97
103
−819
973
Costs Forgone compensation Program costs
−4,634
0
−649 6,637
−4,634
0
−649 6,637
Return on investment (quarterly) – −1.2% NOTE: ’14 $. Participant benefits discounted at 3.0 percent annual rate. – denotes not calculable

W.E. Upjohn Institute for Employment Research 195
Net Impact and Benefit-Cost Estimates of the Workforce Development System in Washington State
APPENDIX A DATA EDITING
Missing or “Out of Bounds” Quarterly Hours Data in Earnings Records
Records that had missing hours, zero hours (despite having reported earnings), and hours
greater than 990 in the employment records had hours imputed. The imputation was done in
three passes. The first pass was to impute the hours using reported (non-imputed) information
from adjacent quarters. The same rule was applied as was used by the State contractor, which
was basically an interpolation of data from adjacent records. For records that still had missing or
zero hours, the next step in the algorithm was to assign the median working hours by the
individual’s industry and earnings class. If the industry was not available, the last step was to
assign the population median working hours by earnings class. When hours exceeded 990, they
were truncated to 990. Table A.1 shows the percentage of records for which hours were imputed.
We imputed data for about 2 percent of the records; which means that about 98 percent of the
records did not have imputed hours. CTE wage records do not have industry code so the
imputation using industry median hours was skipped.
Table A.1 Percentage of Records with Imputed Hours Program 2010/2011 2012/2013
WIA Adult 1.7% 1.9% WIA Dislocated Worker 2.3 2.2 WIA Youth 0.9 0.6 CTC Workforce Education 1.7 1.7 CTC Worker Retraining 2.2 2.1 CTC Basic Education for Adults 1.7 1.7 CTC I-BEST 2.8 2.2 Private Career Schools 1.9 1.8 Registered Apprenticeships 1.8 1.6 High School CTE 0.5 0.4 Vocational Rehabilitation 2.0 1.9 Aerospace Training 2.2 2.0 Wagner Peyser 2.6 2.6 NOTE: CTE participant cohorts are 2010/2011 and 2011/2012; Aerospace participant cohorts are 2011/2012 and 2012/2013.

W.E. Upjohn Institute for Employment Research 196
Net Impact and Benefit-Cost Estimates of the Workforce Development System in Washington State
Earnings and wage outliers. The quarterly earnings provided by the State were top-
coded at $99,999. For the derived hourly wage, we top-coded the high and low wages at the top
and bottom 1 percent value for each program/cohort.
Comparison group records that have received prior intervention. WTECB eliminated
the individuals in the Wagner Peyser program who ever were in other training programs in the
same cohort. So the contamination of comparison group individuals in the treatment sample is
not an issue.
Start date problems. For program participants that had no start date recorded, or had
start date before 2002, the start date is re-coded to be at 20 quarters before the exit quarter. The
percentages of affected records are listed in Table A.2.
Table A.2 Percentage of Records with Re-coded Start Date Program 2010/2011 2012/2013
WIA Adult 0.0% 0.0% WIA Dislocated Worker 0.0 0.0 WIA Youth 0.1 0.0 CTC Workforce Education 1.6 1.2 CTC Worker Retraining 2.3 6.4 CTC Basic Education for Adults 0.0 0.0 CTC I-BEST 1.5 1.0 Private Career Schools 0.1 0.0 Registered Apprenticeships 0.6 0.2 High School CTE 0.0 0.0 Vocational Rehabilitation 0.3 0.1 Aerospace Training 1.3 0.9 Wagner Peyser 0.0 0.0 NOTE: CTE participant cohorts are 2010/2011 and 2011/2012; Aerospace participant cohorts are 2011/2012 and 2012/2013.

W.E. Upjohn Institute for Employment Research 197
Net Impact and Benefit-Cost Estimates of the Workforce Development System in Washington State
APPENDIX B EXPLANATORY NOTES FOR NET IMPACT ESTIMATE TABLES AND PRICE DEFLATORS
Outcomes
This table gives net impact estimates for each outcome in CTE and DVR programs. The
first column, labeled “Regression Adjusted Treatment Effect”, provides coefficients on the
treatment dummy in an OLS-estimated model of the outcomes (for continuous variables). The
entries in the row for outcomes that are binary are logit coefficients transformed to be marginal
effects.
Two types of outcomes measured at two time periods, are displayed in the tables. The
two time periods are three quarters after program exit (short term) and average of quarters 9–12
or recipiency during one of the quarters (longer-term). The two types of outcomes are levels and
difference-in-differences. Levels measure the outcomes at the particular time period. “Diff-in-
diff” differences the levels at the post-training period minus a base-period measure. In particular,
quarters 3–6 before entry were used as the base period.
“Employment” means having earnings in the quarter ≥ $100 (2005 $). “Ever employed”
means being employed in at least one quarter of the time period. “Employment – longer term”
means arithmetic average of employment during quarters 9–12 after exit. “Employment – diff-in
diff” means (employment – longer term) minus (employment – base period).
Receipt means non-zero quarterly benefits for UI.
Monetary outcomes measured in 2014 $.
Regression Estimation
The outcome variables used in the CTE and DVR analyses are displayed in table B.1.
They varied somewhat among these two programs (and cohorts). All of the models had a

W.E. Upjohn Institute for Employment Research 198
Net Impact and Benefit-Cost Estimates of the Workforce Development System in Washington State
treatment dummy. In addition, all had a set of demographic variables, regional variables, and
employment and earnings history/labor market variables.
Table B.1 Independent Variables Used in Regression Estimates of Outcomes, by Program
Program
Type of Variable
Demographic Educational Regional Employment and Earnings
History/Labor Market
Secondary CTE Age, sex (except 10/11 cohort), minority, disability, free-reduced lunch status, bi-lingual status
12th Grade GPA, math and reading scores and proficiency
Urban county western WA
9 prior employment/earnings
DVR Age, sex, minority, veteran, various public assistance
Years of education Urban county western WA
9 prior employment/earnings
The set of demographic variables included age, sex, and minority status for both
programs save secondary CTE 2011/2012 cohort, for which gender is not available. In addition,
we used the following variables if they were in the administrative data: veteran status and
welfare assistance for DVR; disability status, free-reduced lunch status, and bi-lingual status for
CTE.
All of the models used two regional variables: residence in urban county and residence in
western WA. The educational variables are prior years of education at the time of program
registration and is available in DVR data. Student performance measurements in CTE files
include the following variables: 12th GPA, and math and reading scores as well as proficiency
levels.
Finally, all of the models used the nine employment and earnings history variables that
were used in the statistical matching in other training programs. They are described fully in the
text, but are listed here: percentage employment prior to registration, average prior quarterly
earnings, prior earnings trend, variance of prior earnings, number of quarters with job changes

W.E. Upjohn Institute for Employment Research 199
Net Impact and Benefit-Cost Estimates of the Workforce Development System in Washington State
prior to registration, percent of quarters with multiple jobs, earnings dip prior to registration,
number of quarters between dip and registration, and percentage dip in earnings.
Industry dummy variables for industry of employment were used in the DVR models.
Comparison Group Means
The last two columns of the tables present the means for the comparison groups for the
outcome variable measurement periods (post-training). They are given so that impacts can be
gauged on a percentage basis.
Price Indices
Table B.2 provides the price indices used to inflate/deflate earnings, benefits, and wages.
Table B.2 Price Indices Year Quarter Price Index Year Quarter Price Index 2000 1 166.667 2007 2 203.232 2000 2 168.467 2007 3 203.596 2000 3 169.700 2007 4 205.335 2000 4 170.733 2008 1 207.715 2001 1 172.233 2008 2 212.903 2001 2 174.167 2008 3 215.495 2001 3 174.133 2008 4 208.097 2001 4 173.533 2009 1 206.542 2002 1 173.867 2009 2 209.224 2002 2 175.833 2009 3 211.001 2002 3 176.567 2009 4 211.752 2002 4 177.233 2010 1 212.879 2003 1 179.067 2010 2 213.974 2003 2 179.600 2010 3 214.136 2003 3 180.300 2010 4 214.878 2003 4 180.267 2011 1 217.986 2004 1 181.900 2011 2 222.406 2004 2 184.500 2011 3 223.233 2004 3 185.100 2011 4 222.674 2004 4 186.433 2012 1 224.612 2005 1 187.400 2012 2 226.549 2005 2 190.100 2012 3 226.936 2005 3 192.700 2012 4 226.819 2005 4 193.700 2013 1 228.173 2006 1 194.500 2013 2 229.450 2006 2 198.000 2013 3 230.327 2006 3 199.067 2013 4 229.347 2006 4 197.000 2014 1 231.157 2007 1 198.905 2014 2 234.120