EFFECT OF WORKFORCE DIVERSITY ON EMPLOYEE ...
88
EFFECT OF WORKFORCE DIVERSITY ON EMPLOYEE WORK PERFORMANCE: A STUDY OF THE COUNTY GOVERNMENT OF MOMBASA ABDALLAH S. MWATUMWA A Research Project Submitted in Partial Fulfilment for the Degree of Master of Business Administration (Human Resource Management) in the School Business of Technical University of Mombasa 2015
-
Upload
khangminh22 -
Category
Documents
-
view
0 -
download
0
Transcript of EFFECT OF WORKFORCE DIVERSITY ON EMPLOYEE ...
EFFECT OF WORKFORCE DIVERSITY ON EMPLOYEE WORK
PERFORMANCE: A STUDY OF THE COUNTY GOVERNMENT OF
MOMBASA
ABDALLAH S. MWATUMWA
A Research Project Submitted in Partial Fulfilment for the Degree of
Master of Business Administration (Human Resource Management) in the
School Business of Technical University of Mombasa
2015
ii
DECLARATION
This Research Project is my original work and has not been presented for a
degree award in any other University.
Signature……………...……………………Date ………………………………
Abdallah S. Mwatumwa
MBA/0010/2012
This research project has been submitted for examination with our approval as
University Supervisors.
Signature……... ……………………………… Date ……………………...
Dr. William Kingi, PhD
Technical University of Mombasa, Kenya
Signature ……………………………………… Date ……………………
Dr. Hussein Mohammed, PhD
Technical University of Mombasa, Kenya
iii
DEDICATION
I dedicate this research project to my dear mother, the late Mariam Maere
Ndzowa.
iv
ACKNOWLEDGEMENT
First and foremost, I am deeply grateful to my supervisors, Dr. William Kingi
and Dr. Hussein Mohammed who guided me, supported and assisted me
throughout the entire research period. Their patience, knowledge, useful
comments and invaluable feedback helped me a lot in carrying out the study.
I would also like to give special thanks to all my lecturers at the Department of
Business Studies of Technical University of Mombasa, for the friendly and
incisive lectures which gave me the necessary conceptual tools for formulating
my research project. I owe very special debt of gratitude to Mr. Stephen
Mwanzia whose guidance and encouragement in Research Methods helped to
sharpen both my understanding and thinking of what was involved in a
research project. I stand to appreciate so much the friendship and moral support
that I enjoyed from fellow students, during and after lectures.
Further, I am deeply indebted to all the respondents who spent their precious
time and patience in filling out the questionnaire. It would have been
impossible to complete my research project without their honest contribution.
Most important of all, I want to thank and praise The Almighty God, for giving
me good health and strength all through my studies.
v
TABLE OF CONTENTS
DECLARATION ............................................................................................................................ ii
DEDICATION ............................................................................................................................... iii
ACKNOWLEDGEMENT ............................................................................................................. iv
LIST OF TABLES ....................................................................................................................... viii
LIST OF FIGURES ....................................................................................................................... ix
ABBREVIATIONS/ ACRONYMS ................................................................................................ x
DEFINITION OF TERMS ............................................................................................................ xi
ABSTRACT ................................................................................................................................. xii
CHAPTER ONE .............................................................................................................................. 1
INTRODUCTION ........................................................................................................................... 1
1.1 Background of Study ................................................................................ 1
1.2 Problem Statement .................................................................................... 3
1.3 Objectives of the Study ............................................................................. 4
1.4 Specific Objectives: .................................................................................. 4
1.5 Research Questions ................................................................................... 4
1.6 Justification of Study ................................................................................ 5
1.7 The Scope of the Study ............................................................................. 5
1.8 Limitations ................................................................................................ 6
CHAPTER TWO ............................................................................................................................. 7
LITERATURE REVIEW ................................................................................................................ 7
2.1 Introduction ............................................................................................... 7
2.2 Theoretical Framework ............................................................................. 9
2.3 Conceptual Framework ........................................................................... 11
2.3.1 Ethnicity and work performance ...................................................... 12
2.3.3 Education background and work performance ................................. 13
2.3.4 Employee Performance .................................................................... 15
2.4 Empirical Review of Literature............................................................... 16
vi
2.4.2 Egyptian Pharmaceutical Industry .................................................... 16
2.4.3 Banking Sector in Kenya .................................................................. 16
2.4.4 Kenya Ports Authority (KPA) .......................................................... 17
2.4.5 Effects of Ethnicity on Employee performance ............................... 17
2.4.6 Effects of Gender on Employee performance .................................. 17
2.4.7 Effects of Educational background on Employee performance ....... 18
2.5 A Critique of Existing Literature Related to the Study ........................... 19
2.5.2 Gender Diversity Problems .............................................................. 20
2.5.3 Educational Background Diversity Problems .................................. 21
2.6 Summary ................................................................................................. 21
2.7 Research gap ........................................................................................... 22
CHAPTER THREE ....................................................................................................................... 23
RESEARCH METHODOLOGY .................................................................................................. 23
3.1 Introduction ............................................................................................. 23
3.2 Research Design ...................................................................................... 23
3.3 Target Population .................................................................................... 24
3.4 The Sample Frame .................................................................................. 25
3.5 The Sampling Technique ........................................................................ 25
3.6 Instruments .............................................................................................. 26
3.7 Data Collection ....................................................................................... 26
3.8 Data Processing and Analysis ................................................................. 27
CHAPTER FOUR ......................................................................................................................... 28
DATA ANALYSIS, PRESENTATION AND DISCUSSION ..................................................... 28
4.1 Introduction ............................................................................................. 28
4.2 Response Rate ......................................................................................... 28
4.3 Demographic Characteristics .................................................................. 28
4.4 Measurements of Constructs ................................................................... 31
4.5 Reliability Test ........................................................................................ 42
4.6 Pearson`s Correlation Coefficient Analysis ............................................ 44
vii
4.7 Summary ................................................................................................. 49
CHAPTER FIVE ........................................................................................................................... 53
SUMMARY, CONCLUSIONS AND RECOMMENDATIONS ................................................. 53
5.1 Introduction ............................................................................................. 53
5.2 Summary of Descriptive Analysis .......................................................... 53
5.2.1 Ethnic Diversity and Employee Work Performance ............................ 53
5.2.2 Gender Diversity and Employee Work Performance .......................... 54
5.2.3 Educational background Diversity and Employee work Performance 54
5.2.4 Employee Work Performance .............................................................. 55
5.3 Recommendations for Future Study ....................................................... 55
5.4 Conclusion .............................................................................................. 56
REFERENCES .............................................................................................................................. 57
APPENDICES ............................................................................................................................... 62
APPENDIX A: LETTER TO RESPONDENTS ........................................................................... 62
APPENDIX B: QUESTIONNAIRE ............................................................................................. 63
APPENDIX C: INTERVIEW SCHEDULE .................................................................................. 70
APPENDIX D: OBSERVATION SCHEDULE ........................................................................... 72
APPENDIX E: WORK PLAN ...................................................................................................... 73
APPENDIX F: BUDGET .............................................................................................................. 75
viii
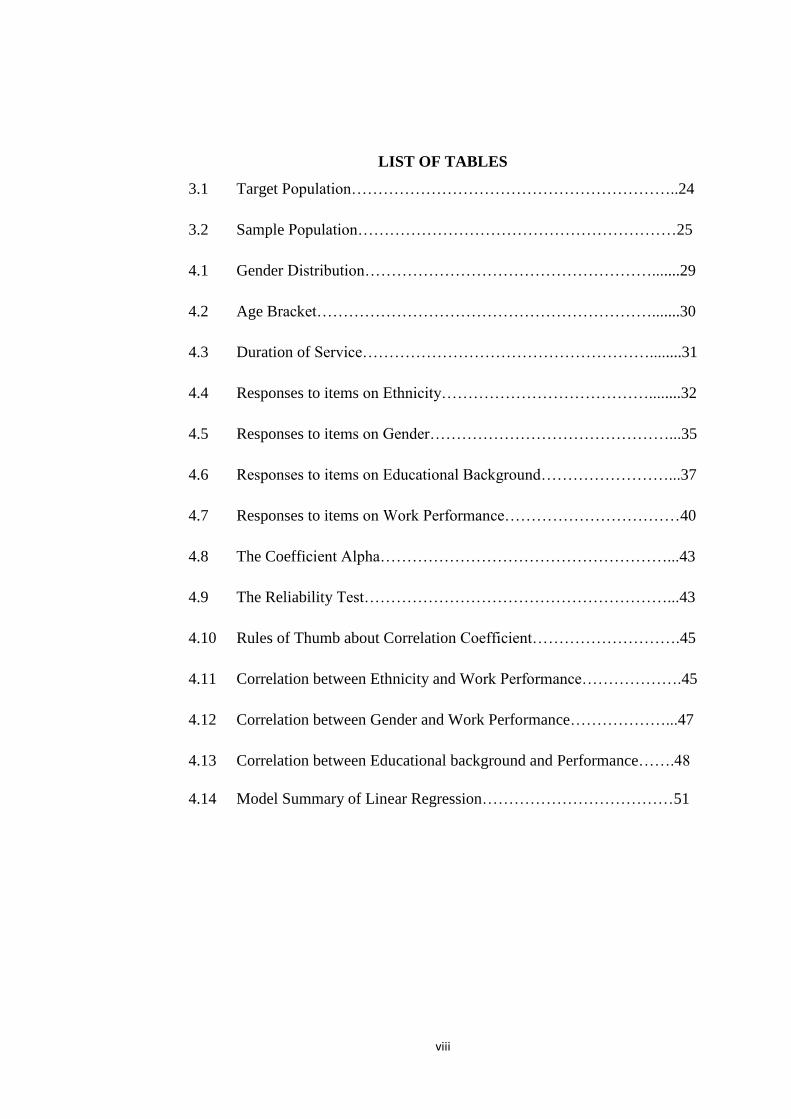
LIST OF TABLES
3.1 Target Population……………………………………………………..24
3.2 Sample Population……………………………………………………25
4.1 Gender Distribution……………………………………………….......29
4.2 Age Bracket……………………………………………………….......30
4.3 Duration of Service………………………………………………........31
4.4 Responses to items on Ethnicity…………………………………........32
4.5 Responses to items on Gender………………………………………...35
4.6 Responses to items on Educational Background……………………...37
4.7 Responses to items on Work Performance……………………………40
4.8 The Coefficient Alpha………………………………………………...43
4.9 The Reliability Test…………………………………………………...43
4.10 Rules of Thumb about Correlation Coefficient……………………….45
4.11 Correlation between Ethnicity and Work Performance……………….45
4.12 Correlation between Gender and Work Performance………………...47
4.13 Correlation between Educational background and Performance…….48
4.14 Model Summary of Linear Regression………………………………51
ix
LIST OF FIGURES
2.1 Conceptual Framework……………………………………………..11
x
ABBREVIATIONS/ ACRONYMS
TUM Technical University of Mombasa
CGM County Government of Mombasa
KPA Kenya Ports Authority
HRM Human Resource Manager
HRD Human Resource Development
SPSS Software Package for Social Science.
xi
DEFINITION OF TERMS
Diversity: The condition of having or being composed of differing
elements: variety; especially the inclusion of different
types of people (as people of different races or cultures)
in a group or organization
Ethnicity: Pertaining to or characteristic of a people, especially a
group (ethnic group) sharing a common and distinctive
culture, religion, language, or the like. Referring to the
origin, classification, characteristics, etc
Education: Knowledge, skill, and development gained from study or
training
Gender: Culturally and socially constructed difference between
men and women (as indicated by terms such as 'gender
affairs' and 'gender politics'
Performance: The accomplishment of a given task measured against
preset known standards of accuracy and completeness.
xii
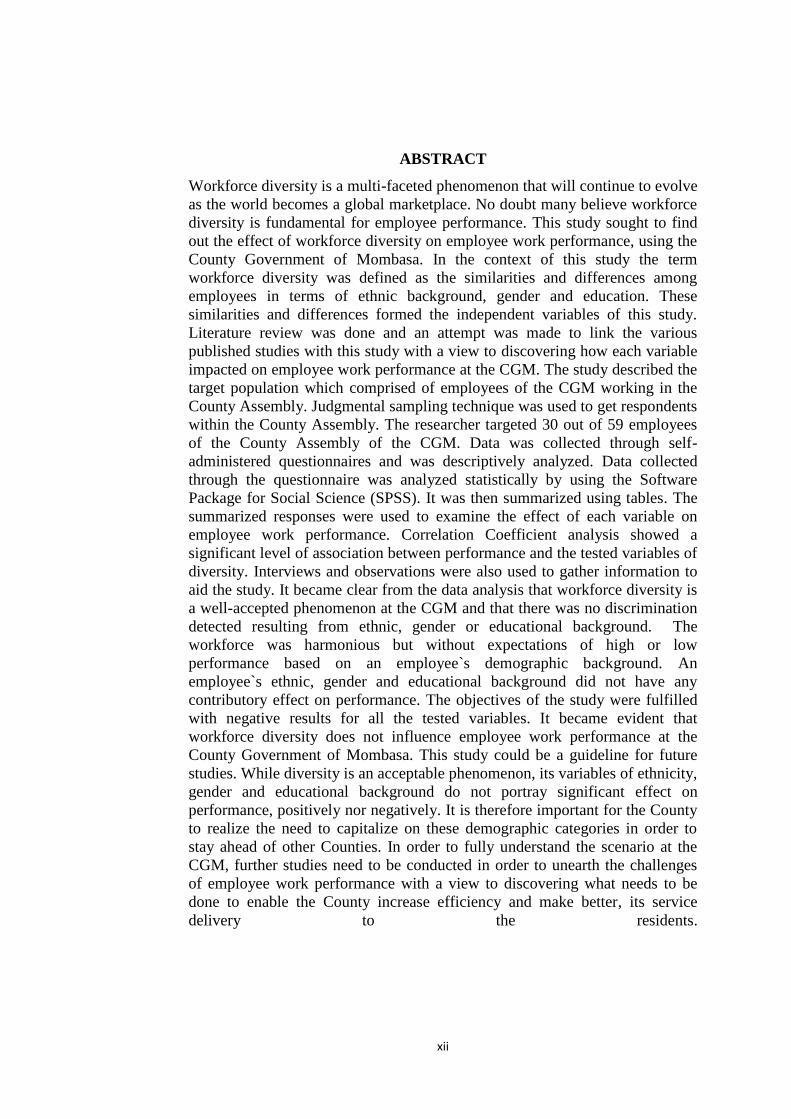
ABSTRACT
Workforce diversity is a multi-faceted phenomenon that will continue to evolve
as the world becomes a global marketplace. No doubt many believe workforce
diversity is fundamental for employee performance. This study sought to find
out the effect of workforce diversity on employee work performance, using the
County Government of Mombasa. In the context of this study the term
workforce diversity was defined as the similarities and differences among
employees in terms of ethnic background, gender and education. These
similarities and differences formed the independent variables of this study.
Literature review was done and an attempt was made to link the various
published studies with this study with a view to discovering how each variable
impacted on employee work performance at the CGM. The study described the
target population which comprised of employees of the CGM working in the
County Assembly. Judgmental sampling technique was used to get respondents
within the County Assembly. The researcher targeted 30 out of 59 employees
of the County Assembly of the CGM. Data was collected through self-
administered questionnaires and was descriptively analyzed. Data collected
through the questionnaire was analyzed statistically by using the Software
Package for Social Science (SPSS). It was then summarized using tables. The
summarized responses were used to examine the effect of each variable on
employee work performance. Correlation Coefficient analysis showed a
significant level of association between performance and the tested variables of
diversity. Interviews and observations were also used to gather information to
aid the study. It became clear from the data analysis that workforce diversity is
a well-accepted phenomenon at the CGM and that there was no discrimination
detected resulting from ethnic, gender or educational background. The
workforce was harmonious but without expectations of high or low
performance based on an employee`s demographic background. An
employee`s ethnic, gender and educational background did not have any
contributory effect on performance. The objectives of the study were fulfilled
with negative results for all the tested variables. It became evident that
workforce diversity does not influence employee work performance at the
County Government of Mombasa. This study could be a guideline for future
studies. While diversity is an acceptable phenomenon, its variables of ethnicity,
gender and educational background do not portray significant effect on
performance, positively nor negatively. It is therefore important for the County
to realize the need to capitalize on these demographic categories in order to
stay ahead of other Counties. In order to fully understand the scenario at the
CGM, further studies need to be conducted in order to unearth the challenges
of employee work performance with a view to discovering what needs to be
done to enable the County increase efficiency and make better, its service
delivery to the residents.
1
CHAPTER ONE
INTRODUCTION
1.1 Background of Study
For organizations to attract a broader talent pool of employees, it needs to
embrace an organizational culture of workforce diversity. This will lead to an
enhanced corporate reputation and strengthened cultural values. According to
Childs (2005), workforce diversity is a global workplace and marketplace
phenomenon. Therefore any business that intends to be successful must have a
borderless view and an underlying commitment to ensuring that workforce
diversity is part of its day-to-day business conduct. Diversity in workforce can
lead to compliance with anti-discrimination laws, increased multicultural work
environment and recognition that different perspectives are important.
Workforce diversity include, but are not limited to: age, ethnicity, ancestry,
gender, physical abilities/qualities, race, sexual orientation, educational
background, geographic location, income, marital status, military experience,
religious beliefs, parental status, and work experience Srivastava (2012).
According to Bhatia (2008), there are other sources of diversity such as
political affiliation, levels of ability, personality, socio-economic background
of individuals, membership or non-membership of unions, period and nature of
employment, and work style. All these indicate that human beings are different
individuals with unique capacities. Employees therefore work together for
organizations but they maintain their distinct identities, diverse cultures,
2
languages and lifestyles. With the advent of the internet and the worldwide
web, the concept of a global village underscored the need for organization to
promote workforce diversity in order to reach to the global markets Madiha,
(2003).
Organizations hire employees from diverse countries, cultures, values and
styles. While employees expect returns from the organization, their effective
performance is significant for its success. It is therefore important to consider
the effect of diversity on employee output. Workforce diversity could present
tremendous challenges as well as opportunities to the organization in terms of
effective management. The following are some of the challenges that diversity
could present to an organization, individual versus group fairness, resistance to
change, resentment, group cohesiveness and interpersonal conflict, segmented
communication networks, backlash and competition for opportunities Madiha,
(2003). It is therefore important to understand the impact of diversity on
organizational outcomes, such as organizational performance, employee
satisfaction, and turnover (Sungjoo, 2010).
As an organization, County Government of Mombasa (CGM) draws its
workforce from diverse backgrounds. Therefore, it faces pertinent issues such
as demographic changes, increasing number of women joining its workforce,
organizational restructuring, and the implementation of the equal opportunity
legislation, which requires organizations to review their management practices
and develop new and creative approaches to people management. All these
issues play out on the employee and can affect his or her work performance.
3
This research sought to investigate the effect of workforce diversity on
employee work performance in the (CGM), by way of analysis through testing
three dimensions of diversity namely: ethnicity, education and gender. The
CGM has a total workforce of over 2,000 employees and is run by the County
Executive which consists of the Governor, Deputy Governor, and a maximum
10-member County Executive Committee that is appointed by the Governor
and approved by the County Assembly. The study focused on the employees in
the County Assembly section of CGM who number 59.
1.2 Problem Statement
Workforce Diversity trends were first identified in the mid-1980s and they
were proclaimed as an opportunity for organizations to become more creative,
to reach previously untapped markets and talents, and in general to achieve and
maintain a competitive advantage Roberson (2007).
Erasmus (2007) contended that, diversity management and workforce diversity
are a forced integration that creates conflict and uncertainty in the workforce as
leadership is not skilled in the discipline of diversity management and its
principles. As such, human resource managers are in most cases not well
equipped to effectively practice diversity management, or identify what factors
contribute to effective diversity management and the tasks that can deal with
diversity related issues in the workplace. Research suggests that left
unmanaged, workforce diversity is more likely to damage morale, increase
turnover and cause significant communication problems and conflict in the
organization Roberson et al. (2007).
4
The County Government of Mombasa has a workforce drawn from almost all
the 42 ethnic groups of Kenya (refer to interview schedule), working under
unique social and environmental circumstances that provided a rare study on
workforce diversity. This study focused on the relationship among ethnicity,
gender and educational background, towards employee performance at the
County Government of Mombasa.
1.3 Objectives of the Study
The general objective of this study was to analyze the effect of workforce
diversity on employee work performance at the County Government of
Mombasa.
The specific objectives of this study are:
1.4 Specific Objectives:
1. To determine the effect of ethnicity on Employee work performance at
the County Government of Mombasa.
2. To determine the effect of gender on employee work performance at the
County Government of Mombasa.
3. To determine the effect of education on employee work performance at
the County Government of Mombasa.
1.5 Research Questions
The study sought to answer the following questions:
1. To what extent does ethnicity have an effect on employee work
performance at the County Government of Mombasa?
5
2. To what extent does gender have an effect on employee work
performance at the County Government of Mombasa?
3. To what extent does education have an effect on employee work
performance at the County Government of Mombasa?
1.6 Justification of Study
Based on the problem stated, it was evident that studies or researches
emanating from local scholars and institutions of higher learning and possibly
other research organizations related to the stated topic were limited. It was
therefore, envisaged that the results of the study would go a long way to
enlighten scholars and lay readers on the effects of workforce diversity upon
employee work performance at the County Government of Mombasa. The
parties that were to benefit immensely from this study included, the Human
Resource Manager at the County Government of Mombasa, who could use the
findings of this study to review the policies on employment. Also to benefit
were the top management at the County Government of Mombasa who would
use the findings of this study in policy formulation and review. Other County
Governments in Kenya, as well as other organizations, both private and public,
that required employee services for their sustainability, would benefit from this
study. Finally, future researchers and scholars, in this field of study, would
benefit too from the findings of this study.
1.7 The Scope of the Study
The study sought to examine the effects of workforce diversity on employee
work performance at the County Government of Mombasa. The research took
6
three months and involved the use of interviews, observations and
questionnaires.
1.8 Limitations
The major limitation during the process of completing this study was
eliminating the respondents` bias during the filling of the questionnaire. The
questionnaire was designed to measure the attitude of the employees toward
diversity and work performance. It was not easy to assess their objectivity in
answering the items since they were expected to tick. In future, a questionnaire
which would request some explanation would be more appropriate for gauging
the objectivity of respondents.
7
CHAPTER TWO
LITERATURE REVIEW
2.1 Introduction
This section presents the purpose of this study and a comprehensive theoretical
framework with regard to workforce diversity. It also highlighted the
conceptual framework which critically showed the relationship between the
various variables under consideration. The independent variables included
ethnicity, gender and education while the dependent variable was employee job
performance. An empirical review of relevant literature was discussed which
highlighted the previous studies on the topic of workforce diversity and its
effect on employee performance. A critical analysis of individual independent
variables was undertaken which examined their effects on employee job
performance and their overall attitude towards work ethics. Finally the chapter
highlighted on the research gap which this particular study was to fill.
2.1.1 Purpose
The main aim of this study was to investigate the effect of workforce diversity
on employee work performance at the CGM. According to Janssens, Sels &
van den Brande (2003), workplace diversity is a complex, controversial, and
political phenomena. It has been conceptualized by researchers from several
viewpoints. Nkomo (1995) stated that several researchers have looked at
workforce diversity from a very narrow perspective while some from a broad
view. According to Cross, Katz, Miller and Seashore (1994), scholars
favorably disposed to a narrow definition argue that the concept of diversity
8
should be restricted to specific cultural categories such as race and gender.
Nkomo (1995) opined that diversity based on race, ethnicity and gender cannot
be understood in the same way as diversity based on organizational functions,
abilities or cognitive orientations. In harmony with Nkomo (1995); Michaéla
et al. (2003), argued that since a cultural diversity dimension interacts with
other dimensions of diversity, a narrow concept of diversity would be deficient
since it will fail to recognize those interactions.
According to Jackson, Joshi and Erhardt (2003), advocates of a broad
definition of diversity, argued that, diversity encompasses all the possible ways
people can differ. According to this school of thought, individuals do not only
differ because of their race, gender, age and other demographic categories but
also because of their values, abilities, organizational function, tenure and
personality. They contended that an individual has multiple identities and that
the manifold dimensions cannot be isolated in an organizational setting.
The advocates of the broad definition of diversity further argued that, apart
from bringing their race, age, ethnicity, and gender, individuals also come with
their particular knowledge gained from their educational background,
personality and cognitive style to the work place. They pointed out that in order
to understand the dynamics of a heterogeneous workforce, interactive effects of
multi-dimensional diversity have to be addressed.
According to Thomas (1991), a broadening of the concept of diversity has a
potential positive effect on diversity management programs, as it will be more
9
acceptable if it is all inclusive, not only oriented toward specific demographic
groups of employees.
McGrath, Berdahl and Arrow (1995) conceptualized workforce diversity by
way of developing a five cluster classification. This categorization is widely
used and is as follows: demographic characteristic (age, ethnicity, gender, sex,
physical status, religion and education), task related knowledge, skills and
capacities (values, views and attitudes), personal, cognitive and attitudinal
styles (status in the organization such as one`s hierarchical position,
professional domain, departmental affiliation and seniority)
This research proposes to adopt the narrow definition of diversity so as to use
the demographic categorization to investigate the effect of workforce diversity
on employee performance at CGM. Three dimensions of workforce diversity
namely ethnicity, gender and education shall therefore form the independent
variables. The dependent variable shall be the work performance.
2.2 Theoretical Framework
Theoretically, the workplace diversity literature espouses three different
theoretical frameworks for the examination of the possible effects of workplace
diversity (Williams & O'Reilly, 1998).
According to Turner (1987), the first theory is social categorization theory,
which describes employees based on attributes like ethnicity, gender or age.
Turner argues that this results in stereotyping. The second theory is based on
similarity or attraction theory based on non-salient attributes like values and
10
education, which increase interpersonal attraction and attachment (Berscheid &
Walster, 1978). The third theory is information and decision-making theory,
which examines the impact of distribution of information and expertise on
work-teams (Wittenbaum & Stasser, 1996).
According to Michaéla et al. (2003), these theories lead to different and
sometimes contradictory hypotheses regarding the effects of diversity on group
process and performance. They argued that social categorization and similarity
theories lead to a prediction of negative effects, such as reduction in within-
group communication, decreased satisfaction and commitment, and increased
labor turnover.
According to Williams et al. (1998), the third theory on information and
decision-making perspective leads to positive effects of diversity since more
diverse work-teams are expected to process information differently and
members may bring together differing viewpoints. This in turn can lead to
more creativity and increased performance.
Several research findings by eminent scholars suggest that several factors could
be responsible for the conflicts provoked by workforce diversity. Tsui, Egan &
O’ Reilly (1992), proposed that identifying employees with distinct groups
such as ethnic background may disrupt group dynamics. Shaw (1993) agreed
with Egan and O`Reilly following their research on self-categorization theory
which showed that ethnic identification evoked more disliking, distrust and
competition than when categorization arises from within the organization.
11
This study was based on the third theory which considers attributes like
ethnicity, gender or age, Turner (1987).
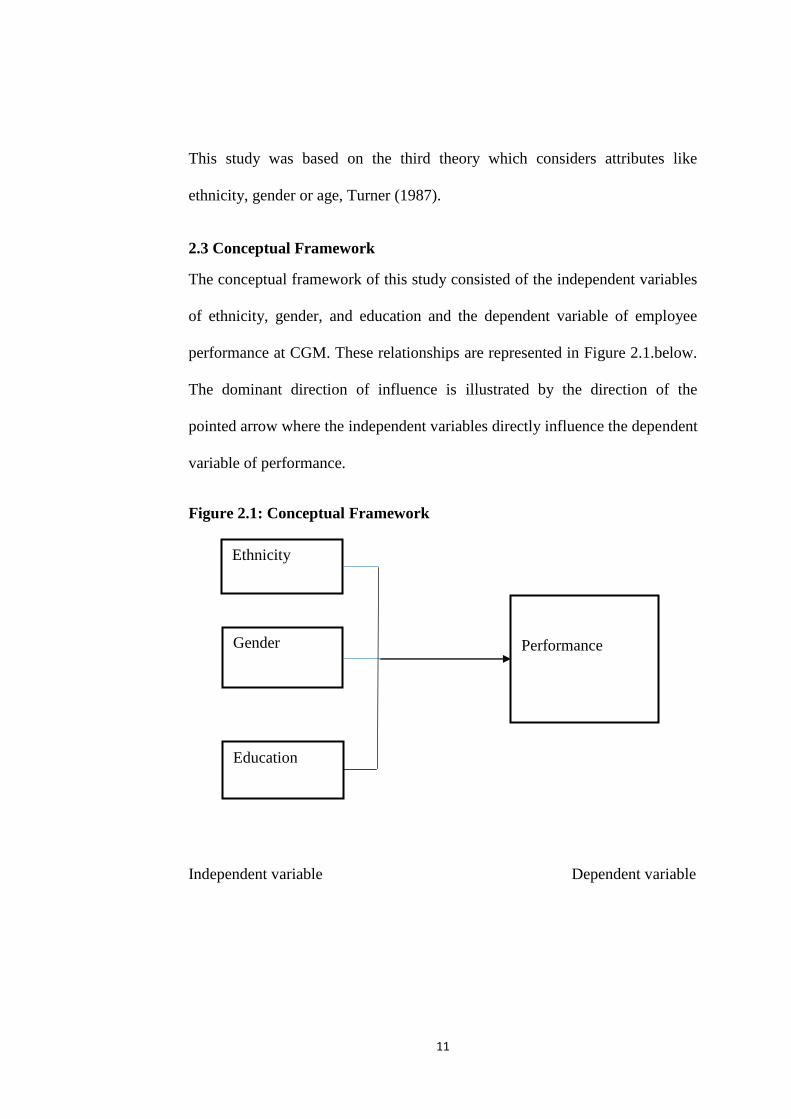
2.3 Conceptual Framework
The conceptual framework of this study consisted of the independent variables
of ethnicity, gender, and education and the dependent variable of employee
performance at CGM. These relationships are represented in Figure 2.1.below.
The dominant direction of influence is illustrated by the direction of the
pointed arrow where the independent variables directly influence the dependent
variable of performance.
Figure 2.1: Conceptual Framework
Independent variable Dependent variable
Ethnicity
Gender
Education
Performance
12
2.3.1 Ethnicity and work performance
According to a report by Makokolo (2005), an ethnic group is a tribolistic
grouping. It has a sense of common historic origins and frequently develops a
sense of common destiny. Pitts (2010) contend that, as organizations become
more diverse along ethnic lines, it makes sense to pay more attention to how
different groups interact with one another at work. Opstal (2009) stated that
ethnic diversity can have both advantages and disadvantages for the
organization. Jackson et al. (2004) cited examples of ethnic diversity
disadvantages as communication problems and conflict. When managers
ignore the clashes caused by ethnicity, they might be converted into personal
and emotional conflict in the long run and therefore damage organizational
culture, employee morale and overall sharp reduction of organizational
performance. Kiglai (2006) asserted that conflict resulting from ethnicity does
affect quality, performance and profit of an organization. Benschop (2001)
cited discrimination as a disadvantage of ethnic diversity. Dahlin, Weingart &
Hinds (2005) argued that high degree of ethnicity might be negative since it
can create conflict and cliques due to social categorization.
According to Zgourides, Johnson and Watson (2002), differences in cultural
characteristics bring an advantage of having ethnically different views for team
problem solving which can result in increased team performance when the
team learns to utilize these differences to their benefit. Opstal (2009) stated the
advantages of ethnic diversity as creativity and innovation. (Van Knippenberg,
De Dreu & Homan (2004) observed that ethnicity can provide a large pool of
13
resources to the organization such as knowledge and abilities. Jackson et al
(2004) cited better problem solving as an advantage of ethnic diversity.
Van Esbroek and van Engen (2008) stated that management of diversity is
important to help an organization benefit from the advantages and minimize
the disadvantages of ethnic diversity that can have negative effect on employee
and organizational performance. According to Timmermans, Ostergaard and
Kristinsson (2011), ethnicity can be positive toward performance, since it
broadens the viewpoints in the firm.
2.3.2 Gender and work performance
According to Connell (2002), gender refers to a description of masculinity or
femininity. Empirical research supports the argument that gender diversity is
positively linked to an organization`s performance. McMillan-Capehart
(2003), used the resource-based view of the firm to argue that gender diversity
at the management and organizational levels can provide a firm with a
competitive advantage. According to Leonard et al. (2003, gender-based
inequities in organizations, are reinforced and justified by stereotypes and
biases that describe positive characteristics and therefore a higher status to the
males. They thus observed that, organizations prefer to hire male employees
compared with women because they are perceived to have better performance
and abilities to manage their jobs.
2.3.3 Education background and work performance
According to Tracy & David (2011), organizations commonly reject employing
people whose training, experience or education is judged to be inadequate.
14
They argued that, educational background is important to employees and that
employees cannot find a job and perform well without adequate educational
background. Daniel (2009), found out that various levels and types of
education have different mobility rates. He argued that the occupations
available to those with working experience but do not possess a certified
tertiary paper may differ from those who possess such education level. Daniel
(2009), conducted a study, which showed that an individual will be more
productive depending on the level of their education. He observed that the
more education an individual employee receives, the more productive the
employee will be.
Cohen and Levinthal (2000), contended that the absorptive capacity of an
organization is likely to increase with variety in knowledge structures as
reflected in diverse educational majors. Jehn and Bezrukov (2004), observed
that informational diversity, such as education and functional areas were
positively related to actual work group performances, although the relationship
was mediated by task conflict.
Cohen et al. (2000), however observed that educational background can also
negatively affect team performance and social integration in teams. Horwitz
(2005), discovered that heterogeneity in education level was associated with
turnover intention. Jehn, Northcraft & Neale (1999), observed that wide
differences in educational background led to increase in task-related debates
among work teams. Knight et al. (2009) found out that educational diversity
was negatively related to decision-making consensus in top management
15
teams. They asserted that heterogeneous educational backgrounds tend to
increase the level of discomfort and conflict that may lead to decreased social
integration in teams.
However, according to Eduard (2010), employees who are less educated are
likely to suffer inferiority complex, which to a large measure may affect their
performance. He argued that such employees might develop a persistent feeling
of being inferior. Such employees end up feeling socially insecure and they
become less confident at work. He concluded that the lack of confidence would
greatly impair their performance and could even make them develop a negative
attitude toward other employees and the entire organization. At some instances,
they could become rebellious.
2.3.4 Employee Performance
Cascio (2000), defined performance as working effective which is the way in
which somebody does a job, judged by its effectiveness. It is how well an
employee is fulfilling the requirements of a job (Rue & Byars, 1993). Smith
(2010), argued that good workforce diversity practices in the area of human
resources are believed to enhance employee and organizational performance.
According to Cornelius (1999), effective performance can be a key determinant
in the achievement of business objectives while maximizing the contribution of
employees. Schuler (1992), observed that a performance appraisal system
should be objective, relevant to the job and the organization, fair to all
employees and offers no special treatment.
16
2.4 Empirical Review of Literature
In this section, the empirical review resultant from studies conducted in four
organizations; Malaysia Airline, Egyptian Pharmaceutical Industry, Banking
sector in Kenya and Kenya Ports Authority (KPA), which were conducted by
Eugene et al. (2011); Elsaid (2012); Munjuri and Maina (2013); Ngao and
Mwangi (2013) respectively. This section captures the effect of workforce
diversity on employee work performance from results of studies in the
organizations mentioned above.
2.4.1 Malaysia Airlines
Malaysia Airlines began in 1947 as Malaysian Airways. It has a workforce of
about 20,000 employees Eugene et al. (2011), 43% of the employees are
Malaysians, 39% are Indians, 14% are Chinese and 4% are other ethnic groups.
The gender distribution consists of 50.3% female and 49.7% male (Eugene et
al., 2011)
2.4.2 Egyptian Pharmaceutical Industry
The pharmaceutical sector in Egypt is one of the oldest strategic sectors
founded in 1939 and employs a workforce of 39,500, professional staff and
production workers Espicom Business Intelligence (2011).
2.4.3 Banking Sector in Kenya
Commercial banking started in 1896 in Kenya. As of December 2010 the
Kenya Commercial bank group was the largest financial service in Kenya with
an asset base valued at US$3.5billion. It had the widest network of banking
17
outlets comprising nearly 220 branches in Kenya, Rwanda, Southern Sudan,
Tanzania and Uganda Talk (2012). The study under review was carried out in
Kenya within Nairobi Region and the target population was 4,000 employees
Munjuri et al. (2012).
2.4.4 Kenya Ports Authority (KPA)
The Kenya Ports Authority (KPA) is a state corporation charged with the
responsibility of managing the Port of Mombasa, and other ports along the
Kenyan coastline and Kisumu. The workforce consists of over 5,000
employees drawn from all ethnic backgrounds (Beja, 2014).
2.4.5 Effects of Ethnicity on Employee performance
The study by Eugene et al. (2011), at the Malaysia Airlines showed that there is
significant relationship between ethnicity group and employee performance.
They observed that teams of employees who were ethnically diverse performed
poorly compared to the homogeneous teams. According to their results, in
ethnically homogeneous organizations, the ethnic differences among members
of diverse teams becomes more salient and are more likely to interfere with
performance. They further observed that in heterogeneous organizations, the
ethnic identities of team members may be less salient and therefore they create
less disruption.
2.4.6 Effects of Gender on Employee performance
The study by Eugene et al. (2011), at the Malaysia Airlines showed that there is
significant relationship between gender group and employee performance. The
18
findings of the study showed that gender group and employee performance are
positively linked. The study by Elsaid et al. (2012) in the Egyptian
Pharmaceutical Industry indicated that high employee performance relates
positively with the gender variable.
The study by Munjuri et al. (2012) in the Banking Sector in Kenya revealed
that the banking sector had strategies for support to gender groups, and equal
employment opportunities. The various tests of hypotheses showed a
significant level of association between employee performance and the mean
productivity levels of the bank workforce when categorized by gender.
The study by Ngao et al. (2013) at Kenya Ports Authority (KPA) indicated that
gender, greatly impacted on organizational performance and success.
2.4.7 Effects of Educational background on Employee performance
The study carried out by Eugene et al. (2011), at Malaysia Airlines indicated
that there is significant positive relationship between educational background
and employee performance.
They observed that the more different education types, or a more balance in
education types an organization possesses the higher the likelihood of having
innovations. They further observed that an organization may make an effort to
compensate for educational or skill deficiencies of group members by offering
specialized training that bring employees up to the required standards (Mosko,
1996).
19
The study by Elsaid et al. (2012), in the Egyptian Pharmaceutical Industry
indicated that educational background was significant in explaining employee
performance when employees with different educational levels or background
worked together. Those with higher education tended to perform better.
The findings of the study by Munjuri et al. (2012), the Banking Sector in
Kenya with respect to the effects of educational background and employee
performance showed that employees with higher education performed better.
2.5 A Critique of Existing Literature Related to the Study
Workforce is a primary concern for most businesses. Today`s organizations
need to recognize and manage workforce diversity effectively. However there
are several critical points when considering workforce diversity. In order to
make workforce diversity work effectively, those critical points must be
managed correctly.
2.5.1 Ethnic Diversity Problems
From the Malaysia Airlines study by Eugene et al. (2011), ethnicity diversity
poses a problem in the sense that it affects employee performance both
negatively and positively. According to Oyserma (2013), social identity theory,
social categorization theory and similar-attraction paradigm predict that ethnic
diversity holds negative consequences for organizations. Thus they concluded
that ethnic diversity in work teams may lead to psychological processes such as
in-group liking, in-group attraction and in-group favoritism. In turn, these
psychological processes may affect the behavior of individuals in such a way
that they will favor employees belonging to their own ethnic in-group over
20
employees belonging to different ethnic group. They argued that this may lead
to a number of negative outcomes such as less cooperation, less
communication, more conflicts and less cohesiveness.
2.5.2 Gender Diversity Problems
Belief in a male dominated world, with most cultures around the globe
adhering to that notion. Consequently, many organizations prefer to hire men
compared to women because men are perceived to have better performance and
ability to manage their jobs and women are stereotyped against in those
characteristics (Leonard et al., 2003).
The study at the Malaysia Airlines showed that gender affects employee
performance although it was not an area of concern in the organization.
Employees were not conscious of their gender identity. Every employee was
expected to meet his or her annual targets in whichever grade level they were
working. So the ability to meet the targets was the measure of performance and
not their gender. From the results, the organization had more female employees
than male employees but the organization was successful in meeting its targets.
The study in the Egyptian Pharmaceutical Industry showed the same results as
those at the Malaysia Airlines. The findings showed that gender group and
employee performance were positively linked. Performance appraisals were
used for making promotions and compensations related decisions but not to
gauge gender weakness.
21
The study of the Banking Sector of Kenya by Munjuri et al. (2012) shows that
there existed numerous issues associated with gender diversity which forced
the banking sector to develop strategies on how to handle them. Issues to do
with equal opportunities, gender groupings were quite sensitive in the banking
sector. The results of the study of KPA by Ngao et al. (2013) indicated the
necessity of gender diversity.
2.5.3 Educational Background Diversity Problems
According to Slaughter, Feldman & Thomas (2009), the relationships between
educational level and the dimensions of job performance are moderated by job
level. The relationships will be stronger for managerial jobs than for non-
managerial jobs. Based on similar reasoning, it is expected that the
relationships between education and job performance will be stronger for
individuals in higher complexity jobs
2.6 Summary
From the various literature reviews it was apparent that workforce diversity is a
complex, controversial and indeed a political phenomenon Janssens et al.
(2003). Thus any diversity studies should be as inclusive and engage a broad
overview of the dimensions of diversity. According to Michael et al. (2003),
there is always an interaction of the dimensions of diversity and therefore a
narrow approach to the study of diversity would be failing to recognize these
interactions and how they can influence the final results.
22
2.7 Research gap
This research sought to investigation whether there existed un-severable link
between workplace diversity and employee performance through examining
the effect of three variables of diversity at the County Government of
Mombasa (CGM), namely, ethnicity, gender and education. From the literature
review, the effect of workplace diversity on employee performance had not
been adequately tested under such social and environmental factors as exist at
the CGM. The extremely socialized and easy going friendly culture in the
CGM provided a peculiar opportunity for a rare study on workforce diversity.
23
CHAPTER THREE
RESEARCH METHODOLOGY
3.1 Introduction
This chapter outlined the methods of research, provided guidance to
implementation of the research towards the realization of the objectives.
Having considered the underpinning theories, and the research questions, this
section described the background to this study from the methodological point
of view. The following sections were covered; research design, population,
sampling technique instruments, sampling frame, sample size and, data
collection procedures, data processing and analysis.
3.2 Research Design
Research design is the overall plan or strategy for conducting or carrying out
the research (Oso & Onen, 2008). The research design for this particular study
was descriptive in nature. The study involved eliciting of opinion of some
employees of different cadres at CGM.
The study focused on investigating and examining factors of workforce
diversity towards employees’ performance in an organization. A questionnaire
was used as a tool to examine those factors of diversity in relation to work
performance. The researcher examined a sample that was representative of the
whole population so as to obtain a more in-depth and rich description. The
descriptive design was adopted because it has the advantage of using
questionnaires, observations and interviews without necessarily having to
change the environment of the study (Yin 1984)
24
3.3 Target Population
Mugenda and Mugenda (2003) defined population as the entire group of
individuals, events or objects having common observable characteristics.
Population can also refer to an entire group of individuals, objectives or items
from which the researcher wants information (Kothari, 2004).
This study targeted the CGM because of its unique workforce that is drawn
from all over Kenya and beyond and specifically, the Count Assembly of the
CGM and from the HRM office records the total number of workers was 59
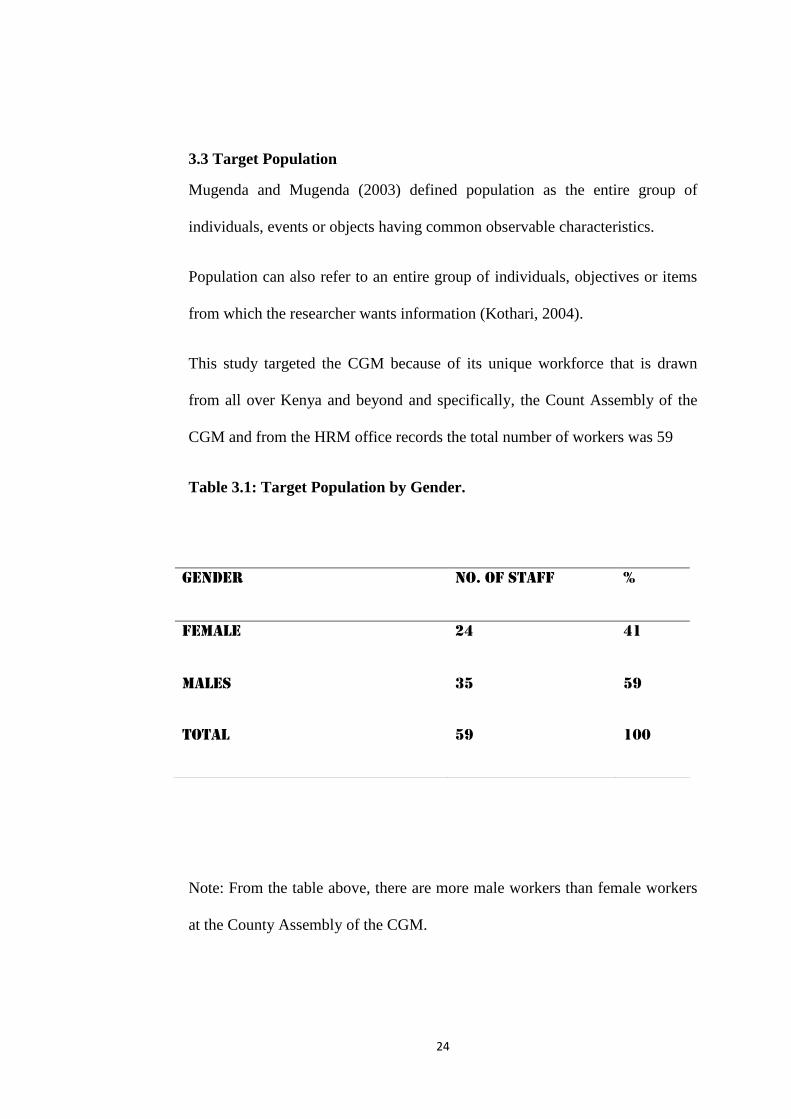
Table 3.1: Target Population by Gender.
Note: From the table above, there are more male workers than female workers
at the County Assembly of the CGM.
Gender No. Of Staff %
Female 24 41
Males 35 59
TOTAL 59 100
25
3.4 The Sample Frame
A sample frame is a list of all those within a population who can be sampled
out and should reflect the whole population. The sampling frame consisted of
the employees of the Count Assembly of the County Government of Mombasa.
A sample is a finite part of statistical population whose properties are studied
to gain information about the whole (Webster, 1985). A good sample should be
reflective on the whole population. Gay (1992) suggested that 10 percent of
accessible population is adequate to serve as sample. Cooper and Schindler
(2003) argued that if well chosen, samples of 10% to 30% of a population
could give reliable findings. Based on the argument by Cooper (2003), the
researcher took a sample of 30.
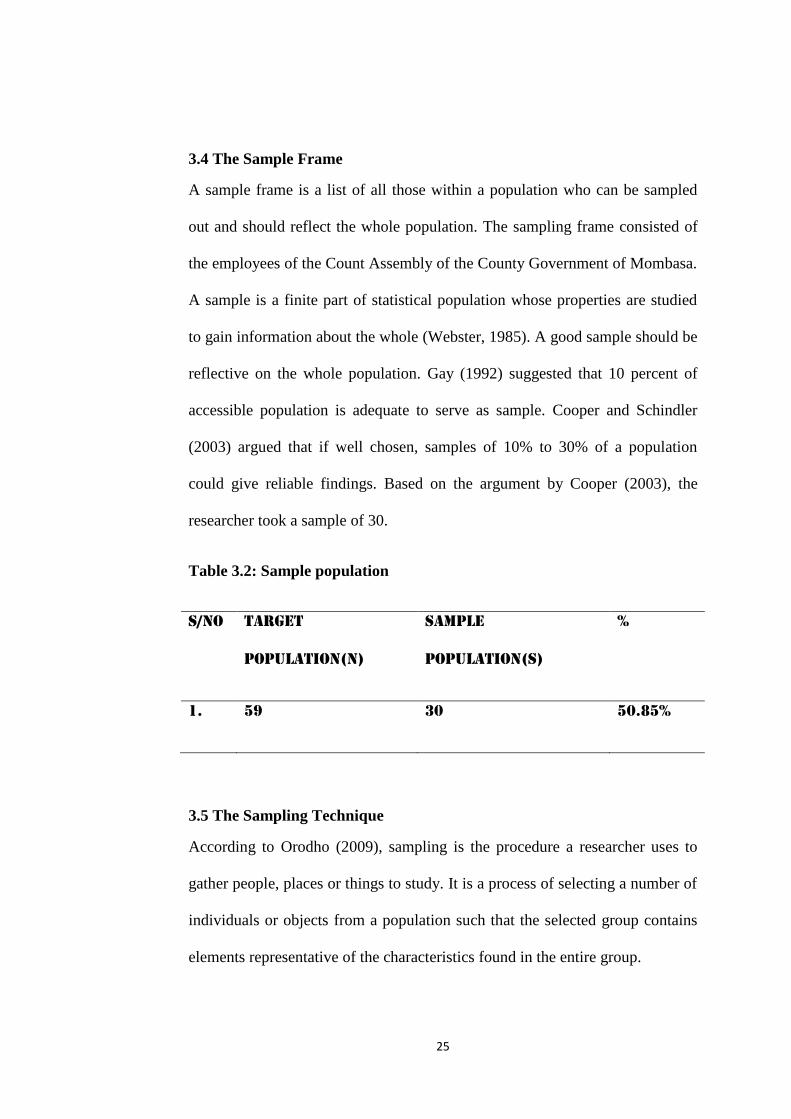
Table 3.2: Sample population
S/No Target
population(N)
Sample
Population(S)
%
1. 59 30 50.85%
3.5 The Sampling Technique
According to Orodho (2009), sampling is the procedure a researcher uses to
gather people, places or things to study. It is a process of selecting a number of
individuals or objects from a population such that the selected group contains
elements representative of the characteristics found in the entire group.
26
Judgmental sampling technique was used to get respondents from among the
workforce at the County Assembly of the CGM. In judgmental sampling the
researcher targets a group of people believed to be reliable for the study.
3.6 Instruments
The study employed the use of questionnaires as the main instruments for
carrying out this research as well as one on one interviews. From preliminary
investigations, it was found that most of the sample elements are employees
with adequate knowledge and background capable of responding to a
questionnaire favorably. The questionnaire was used in this study due to the
following reasons; it enabled the respondents to express themselves more
freely and clearly, it enabled the responses to be gathered in standardized way;
it saved time by enabling information to be gathered within the shortest
possible time and also that it facilitated the collection of potential information
from a sizable sample of respondents. The questions consisted of 4- point
Likert scale where the respondent was expected to strongly agree, agree,
disagree and strongly disagree with carefully constructed that ranged from very
positive to very negative toward an attitudinal phenomenon. The questionnaire
was Pilot tested using Cronbach reliability coefficient testing. The researcher
also made observations in the course of the study that backed up the research
findings.
3.7 Data Collection
The study used both primary as well as secondary data. Primary data was
collected directly from respondents through the use of questionnaires.
27
Interviews were conducted especially with senior staff due to the fact that the
number involved was small and therefore manageable. Secondary data was
collected from HRM office.
3.8 Data Processing and Analysis
After the questionnaires were received, the data was descriptively analyzed and
presented in the form of tables, charts and graphs. In this way it was hoped
that the information collected would easily be understood by readers and would
comprehend the findings of the research. According to Latham and Locke
(2006), Likert scale responses are treated as ordinal data and were therefore
collated into tables. The tables were clearly labeled and presented so that the
readers could be able to make sense of the information contained in them. All
the data collected through the questionnaire was analyzed statistically by using
the Software Package for social Science (SPSS). The variables used in this
research served as key points for the researcher to find out if the objectives of
the study were tenable. Pearson`s correlation Coefficient was used to determine
the relationship between the independent variables and the dependent variable.
28
CHAPTER FOUR
DATA ANALYSIS, PRESENTATION AND DISCUSSION
4.1 Introduction
This chapter reviews the results of primary data collected by presenting the
patterns of results and analysis of results relevant to the research questions and
objectives. The chapter has six main sections which include: questionnaire
response rate, demographic information of respondents, measurement of the
constructs, reliability test, Pearson`s correlation coefficient analysis and
summary.
4.2 Response Rate
Out of a total number of 30 questionnaires distributed only 27 responded. This
amounted to 90% response. The reasons why the 3 never responded can be be
manifold. One reason would be that they were too busy to take time off to
answer 34 probing items or they could have lost interest in participating.
However, in the researcher`s view the 90% response was adequate for reliable
findings. It is more than the limits advocated by Cooper (2003) for research
reliability.
4.3 Demographic Characteristics
This consists of the background information of the respondents. They were
requested to state their gender, age, and years of service in the organization.
4.3.1 Gender
29
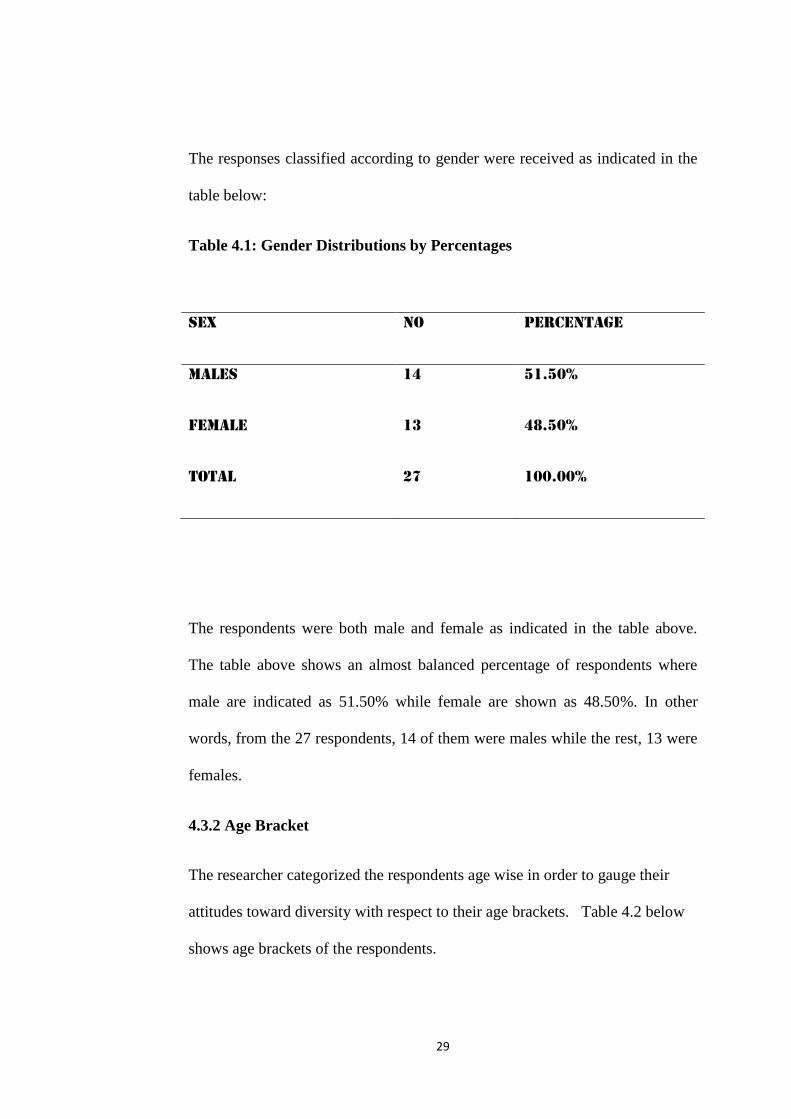
The responses classified according to gender were received as indicated in the
table below:
Table 4.1: Gender Distributions by Percentages
The respondents were both male and female as indicated in the table above.
The table above shows an almost balanced percentage of respondents where
male are indicated as 51.50% while female are shown as 48.50%. In other
words, from the 27 respondents, 14 of them were males while the rest, 13 were
females.
4.3.2 Age Bracket
The researcher categorized the respondents age wise in order to gauge their
attitudes toward diversity with respect to their age brackets. Table 4.2 below
shows age brackets of the respondents.
Sex No Percentage
Males 14 51.50%
Female 13 48.50%
TOTAL 27 100.00%
30
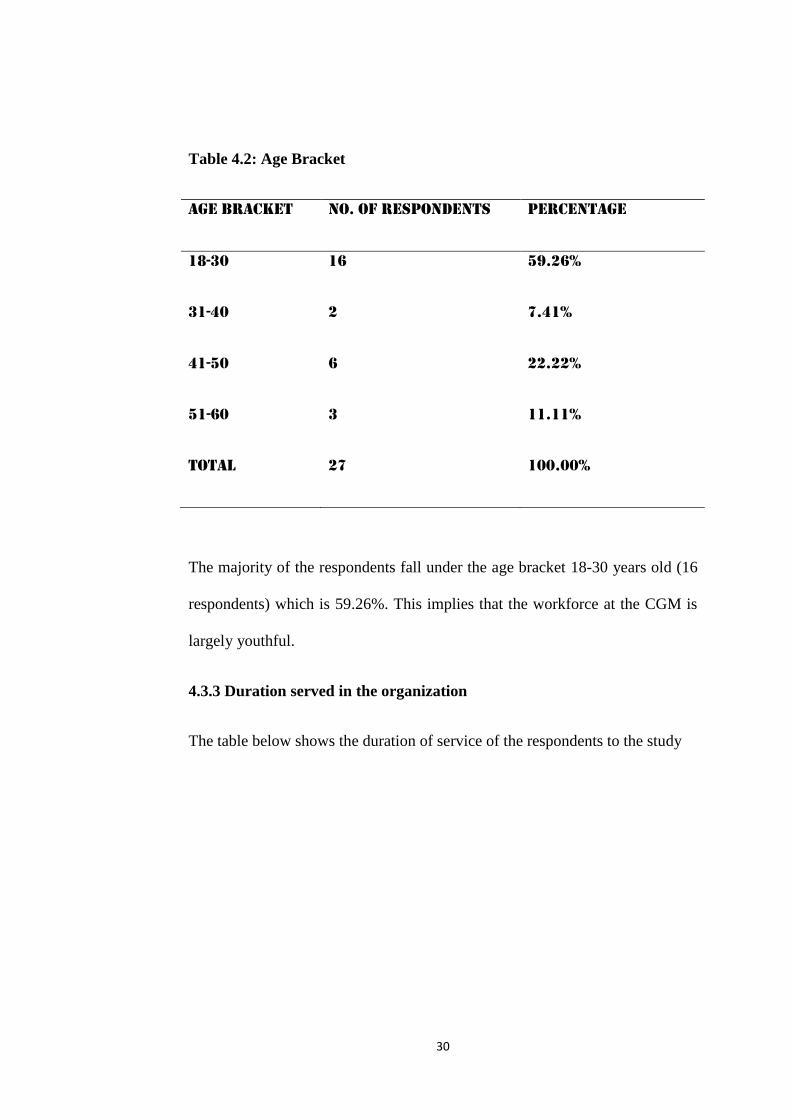
Table 4.2: Age Bracket
Age bracket No. of Respondents Percentage
18-30 16 59.26%
31-40 2 7.41%
41-50 6 22.22%
51-60 3 11.11%
TOTAL 27 100.00%
The majority of the respondents fall under the age bracket 18-30 years old (16
respondents) which is 59.26%. This implies that the workforce at the CGM is
largely youthful.
4.3.3 Duration served in the organization
The table below shows the duration of service of the respondents to the study
31
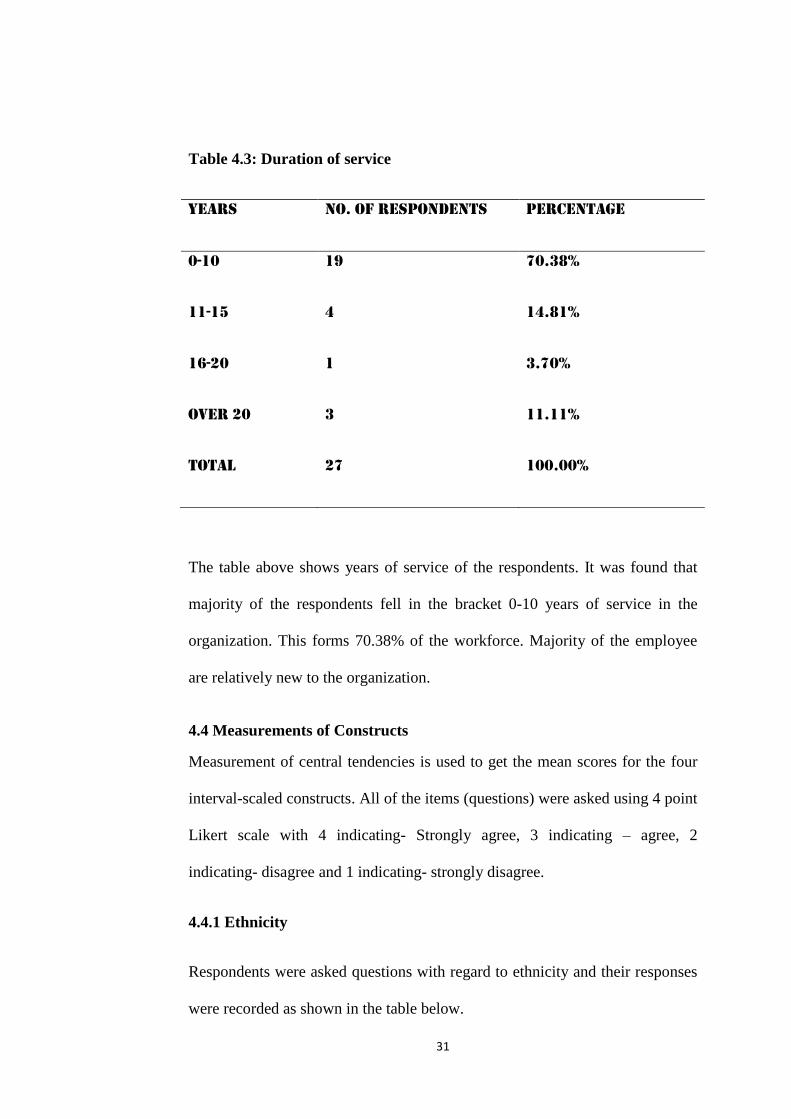
Table 4.3: Duration of service
Years No. of Respondents Percentage
0-10 19 70.38%
11-15 4 14.81%
16-20 1 3.70%
Over 20 3 11.11%
TOTAL 27 100.00%
The table above shows years of service of the respondents. It was found that
majority of the respondents fell in the bracket 0-10 years of service in the
organization. This forms 70.38% of the workforce. Majority of the employee
are relatively new to the organization.
4.4 Measurements of Constructs
Measurement of central tendencies is used to get the mean scores for the four
interval-scaled constructs. All of the items (questions) were asked using 4 point
Likert scale with 4 indicating- Strongly agree, 3 indicating – agree, 2
indicating- disagree and 1 indicating- strongly disagree.
4.4.1 Ethnicity
Respondents were asked questions with regard to ethnicity and their responses
were recorded as shown in the table below.
32
Table 4.4: Responses to items on Ethnicity
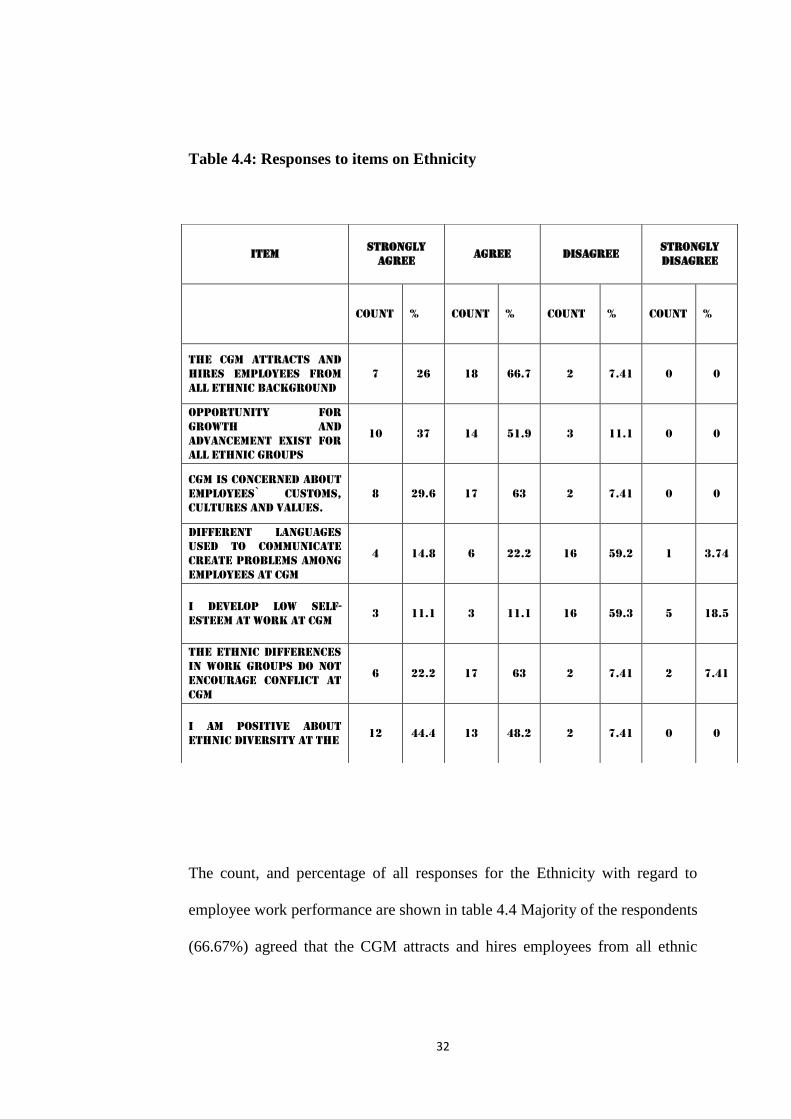
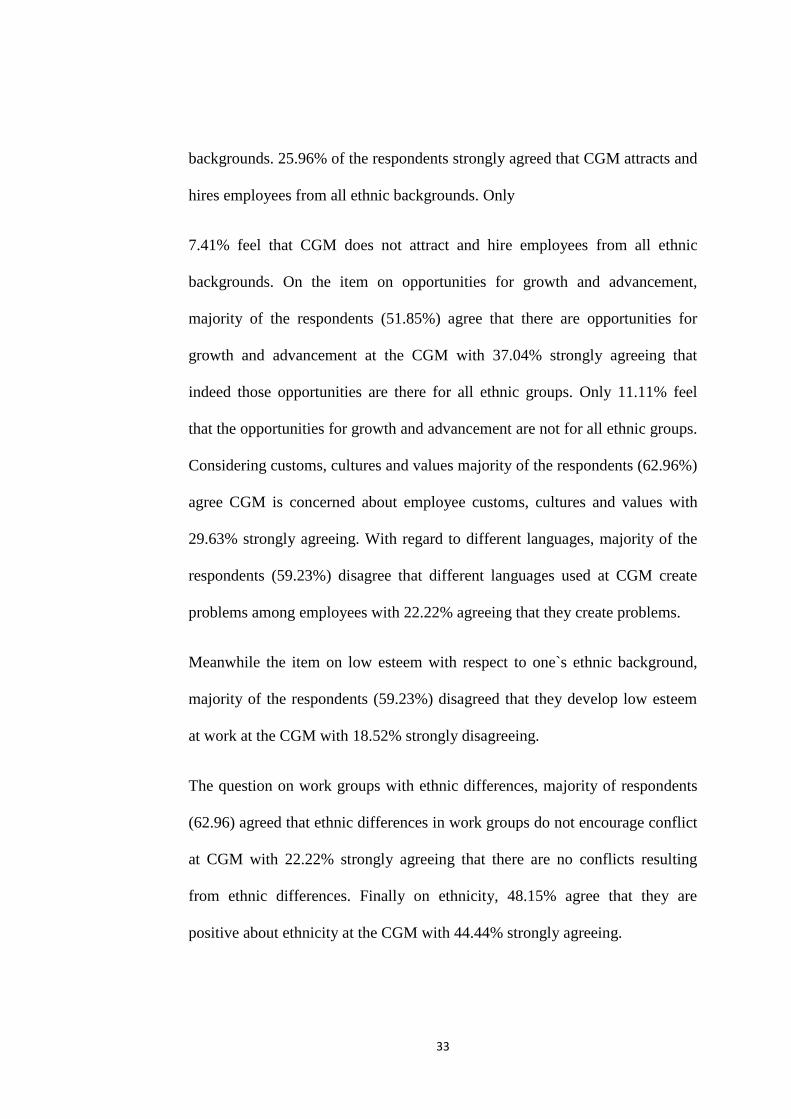
The count, and percentage of all responses for the Ethnicity with regard to
employee work performance are shown in table 4.4 Majority of the respondents
(66.67%) agreed that the CGM attracts and hires employees from all ethnic
Item Strongly
Agree Agree Disagree
Strongly
Disagree
Count % Count % Count % Count %
The CGM attracts and
hires employees from
all ethnic background
7 26 18 66.7 2 7.41 0 0
Opportunity for
growth and
advancement exist for
all ethnic groups
10 37 14 51.9 3 11.1 0 0
CGM is concerned about
employees` customs,
cultures and values.
8 29.6 17 63 2 7.41 0 0
Different languages
used to communicate
create problems among
employees at CGM
4 14.8 6 22.2 16 59.2 1 3.74
I develop low self-
esteem at work at CGM 3 11.1 3 11.1 16 59.3 5 18.5
The ethnic differences
in work groups do not
encourage conflict at
CGM
6 22.2 17 63 2 7.41 2 7.41
I am positive about
ethnic diversity at the 12 44.4 13 48.2 2 7.41 0 0
33
backgrounds. 25.96% of the respondents strongly agreed that CGM attracts and
hires employees from all ethnic backgrounds. Only
7.41% feel that CGM does not attract and hire employees from all ethnic
backgrounds. On the item on opportunities for growth and advancement,
majority of the respondents (51.85%) agree that there are opportunities for
growth and advancement at the CGM with 37.04% strongly agreeing that
indeed those opportunities are there for all ethnic groups. Only 11.11% feel
that the opportunities for growth and advancement are not for all ethnic groups.
Considering customs, cultures and values majority of the respondents (62.96%)
agree CGM is concerned about employee customs, cultures and values with
29.63% strongly agreeing. With regard to different languages, majority of the
respondents (59.23%) disagree that different languages used at CGM create
problems among employees with 22.22% agreeing that they create problems.
Meanwhile the item on low esteem with respect to one`s ethnic background,
majority of the respondents (59.23%) disagreed that they develop low esteem
at work at the CGM with 18.52% strongly disagreeing.
The question on work groups with ethnic differences, majority of respondents
(62.96) agreed that ethnic differences in work groups do not encourage conflict
at CGM with 22.22% strongly agreeing that there are no conflicts resulting
from ethnic differences. Finally on ethnicity, 48.15% agree that they are
positive about ethnicity at the CGM with 44.44% strongly agreeing.
34
According to Jackson (2004), ethnicity can bring about communication
problems and conflict. From the responses, this experience is not there at the
CGM. Benschop (2001) cited discrimination as a disadvantage of ethnicity
while Ely (1996) cited lack of social cohesion in organizational work groups as
a disadvantage of ethnicity but from the analysis, this perception is not
experienced at the CGM.
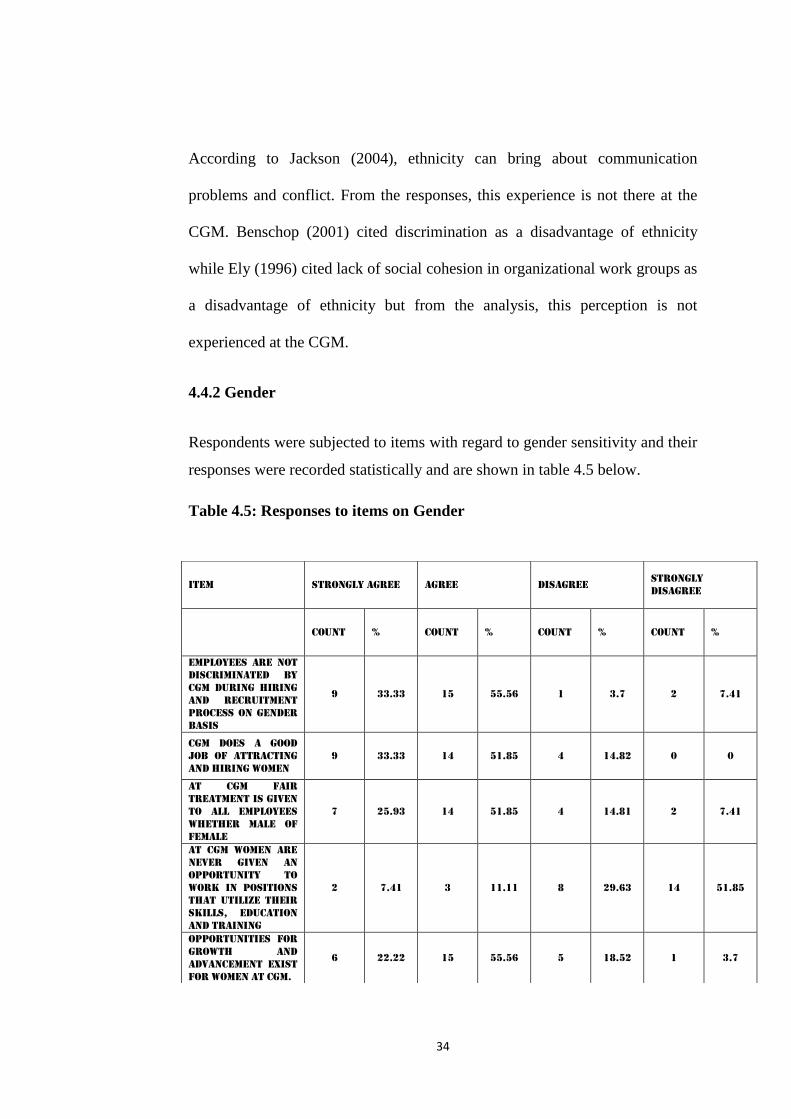
4.4.2 Gender
Respondents were subjected to items with regard to gender sensitivity and their
responses were recorded statistically and are shown in table 4.5 below.
Table 4.5: Responses to items on Gender
Item Strongly Agree Agree Disagree Strongly
Disagree
Count % Count % Count % Count %
Employees are not
discriminated by
CGM during hiring
and recruitment
process on gender
basis
9 33.33 15 55.56 1 3.7 2 7.41
CGM does a good
job of attracting
and hiring women
9 33.33 14 51.85 4 14.82 0 0
At CGM fair
treatment is given
to all employees
whether male of
female
7 25.93 14 51.85 4 14.81 2 7.41
At CGM women are
never given an
opportunity to
work in positions
that utilize their
skills, education
and training
2 7.41 3 11.11 8 29.63 14 51.85
Opportunities for
growth and
advancement exist
for women at CGM.
6 22.22 15 55.56 5 18.52 1 3.7
35
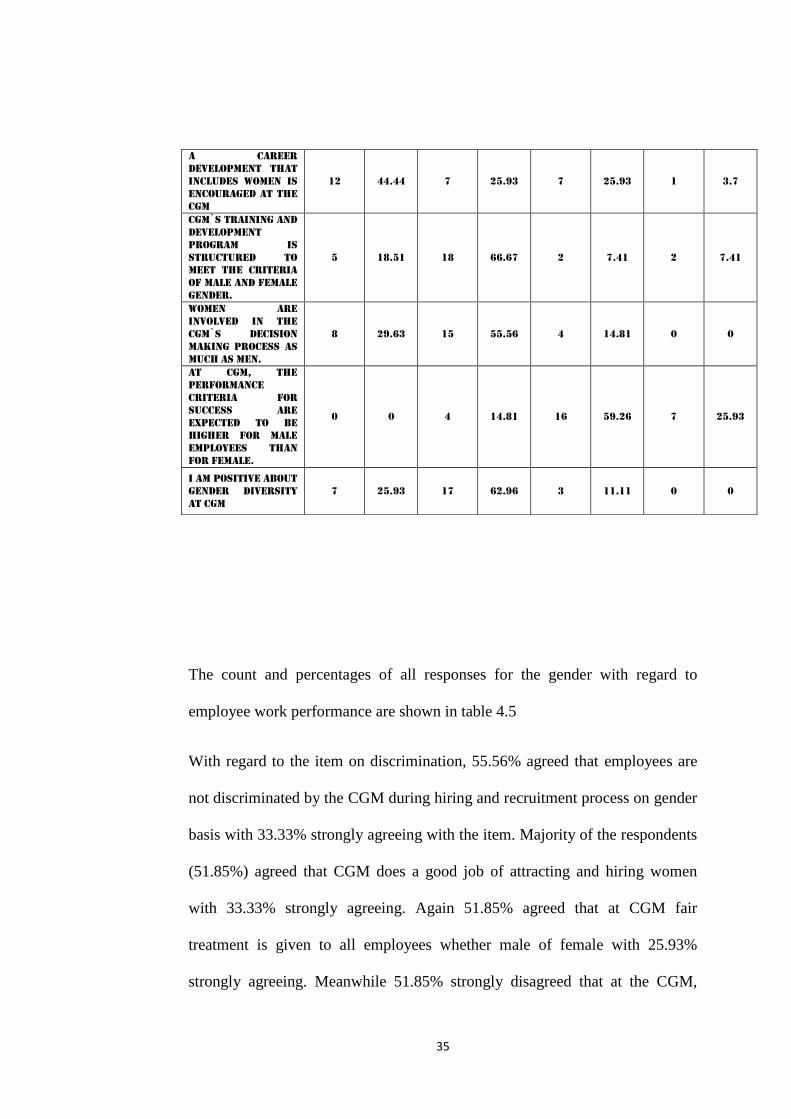
The count and percentages of all responses for the gender with regard to
employee work performance are shown in table 4.5
With regard to the item on discrimination, 55.56% agreed that employees are
not discriminated by the CGM during hiring and recruitment process on gender
basis with 33.33% strongly agreeing with the item. Majority of the respondents
(51.85%) agreed that CGM does a good job of attracting and hiring women
with 33.33% strongly agreeing. Again 51.85% agreed that at CGM fair
treatment is given to all employees whether male of female with 25.93%
strongly agreeing. Meanwhile 51.85% strongly disagreed that at the CGM,
A career
development that
includes women is
encouraged at the
CGM
12 44.44 7 25.93 7 25.93 1 3.7
CGM`s training and
development
program is
structured to
meet the criteria
of male and female
gender.
5 18.51 18 66.67 2 7.41 2 7.41
Women are
involved in the
CGM`s decision
making process as
much as men.
8 29.63 15 55.56 4 14.81 0 0
At CGM, the
performance
criteria for
success are
expected to be
higher for male
employees than
for female.
0 0 4 14.81 16 59.26 7 25.93
I am positive about
gender diversity
at CGM
7 25.93 17 62.96 3 11.11 0 0
36
women are never given an opportunity to work in positions that utilize their
skills, education and training with 29.63% disagreeing.
Majority of the respondents (55.56%) agreed that opportunity for growth and
advancement existed for women at the CGM, with 22.22% strongly agreeing.
With regard to career development for women, 44.44% strongly agreed that a
career development that includes women was encouraged at the CGM.
However, 25.93% disagreed. With respect to the training and development
program, In terms of decision making process, majority of respondents
(55.56%) agreed that women were involved in the CGM`s decision making
process as much as men with 29.63% strongly agreeing. 59.26% disagreed that
at the CGM, performance criteria for success was expected to be higher for
male than for female with 25.93 strongly disagreeing.62.96% agreed that they
were positive about gender diversity at the CGM with 25.93% strongly
agreeing.
According to Leonard (2003), gender based inequities in organizations are
reinforced and justified by stereotypes and biases that describe positive
characteristics and therefore a higher status to males. They argued that
organizations prefer to hire male employees compared to females because they
are perceived to have better performance and abilities to manage their job.
From the study and analysis of the responses this is not the perception at the
CGM. The situation at the CGM seems to be tending toward what Beldona
(2006) pointed out that there are narrowing gender gaps and an increase in
similarity of work values between men and women.
37
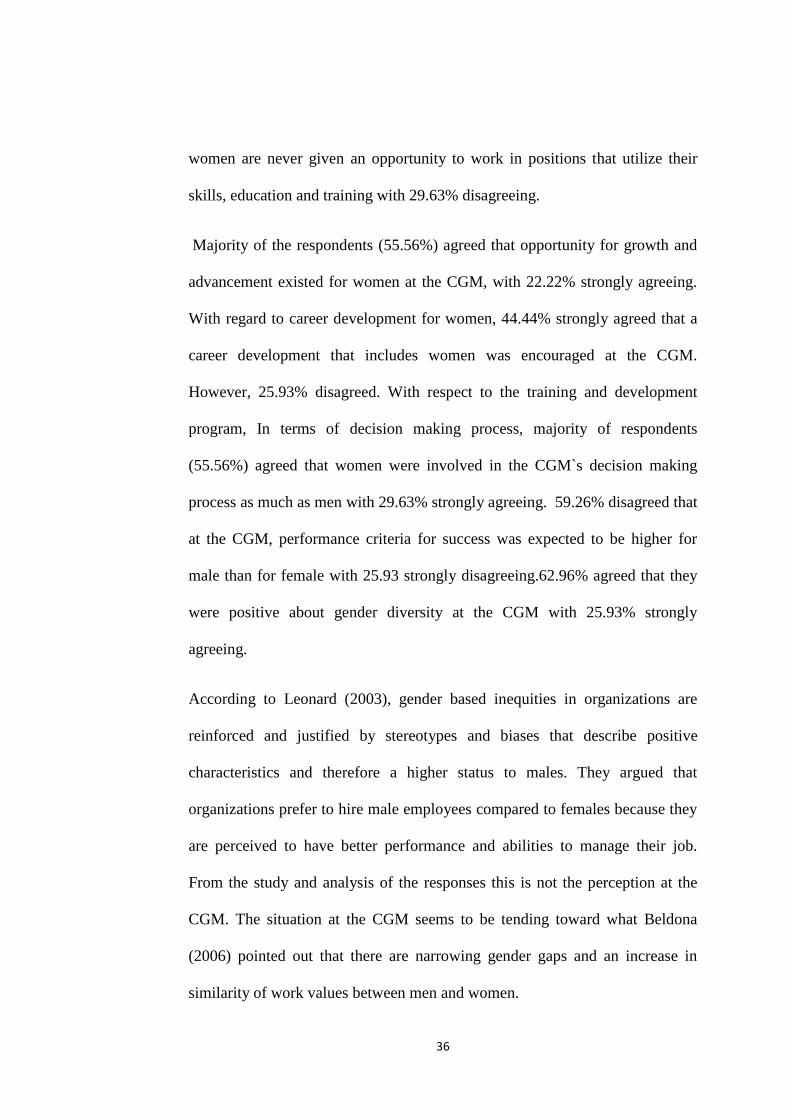
4.4.3 Educational Background
Respondents were subjected to items with regard to their perception on
education and its role in work performance. Table 4.6 below shows the
responses, statistically
Table 4.6 Responses to items on educational Background
Item Strongly
Agree Agree Disagree
Strongly
Disagree
Count % Count % Count % Count %
The recruitment plan of CGM
is based on the educational
background of applicant.
8 29.6 12 44.5 4 14.8 3 11.1
CGM provides paid study leave
to employees who further
they education
4 14.8 13 48.2 5 18.5 5 18.5
At the CGM opportunities for
growth and advancement exist
for employees who have low
educational qualification
4 14.8 11 40.7 10 37 2 7.41
At the CGM differences in
educational background do
not bring conflict among
employees.
10 37 12 44.4 2 7.41 3 11.1
As an employee of CGM, I
experience lack of confidence
due to my educational
background.
0 0 5 18.5 12 44.4 10 37
CGM gives equal treatment
when it comes to educational
background.
5 18.5 12 44.4 6 22.2 4 14.8
38
The count and percentage of all responses for the educational background with
regard to employee work performance are shown in table 4.6.
With regard to the recruitment plan, 44.45% of the respondents agreed that the
recruitment plan of the CGM was based on the educational backgrounds of
applicants. Meanwhile 48.15% agreed that CGM provides paid study leave to
employees who further their education with 14.81% strongly agreeing.
On low education qualifications, 40.74% of the respondents agreed that at the
CGM, opportunities for growth and advancement existed for employees with
low educational qualifications with 14.81% strongly agreeing. However
37.04% disagreed with 7.41% strongly disagreeing.
On differences on educational background, 44.44% agreed that at the CGM
differences in educational background did not bring conflict among employees
with 37.04% strongly agreeing.
On lack of confidence due to one`s educational background, 44.44% of the
respondents disagreed that as employees of CGM they experienced lack of
confidence due to their educational background with 37.04% strongly
disagreeing. Again 44.44% of the respondents agreed that CGM gave equal
treatment when it came to educational background of its employees with
18.52% strongly agreeing.
According to Tracy (2011), organizations commonly reject employing people
whose training, experience or education is judged to be inadequate. They
argued that education background is important to employees and that
39
employees cannot find a job and perform well without adequate educational
background. Daniel (2009) conducted a study which showed that an individual
will be more productive depending on the level of their education. From the
responses received at the CGM, this argument does not hold water. According
to Eduard (2010), employees who are less educated are likely to suffer
inferiority complex which to a large measure may affect performance but again
the perception at the CGM is very different with regard to low qualification.
From the analysis educational background at the CGM does not seem to have
advantages or disadvantages at the CGM.
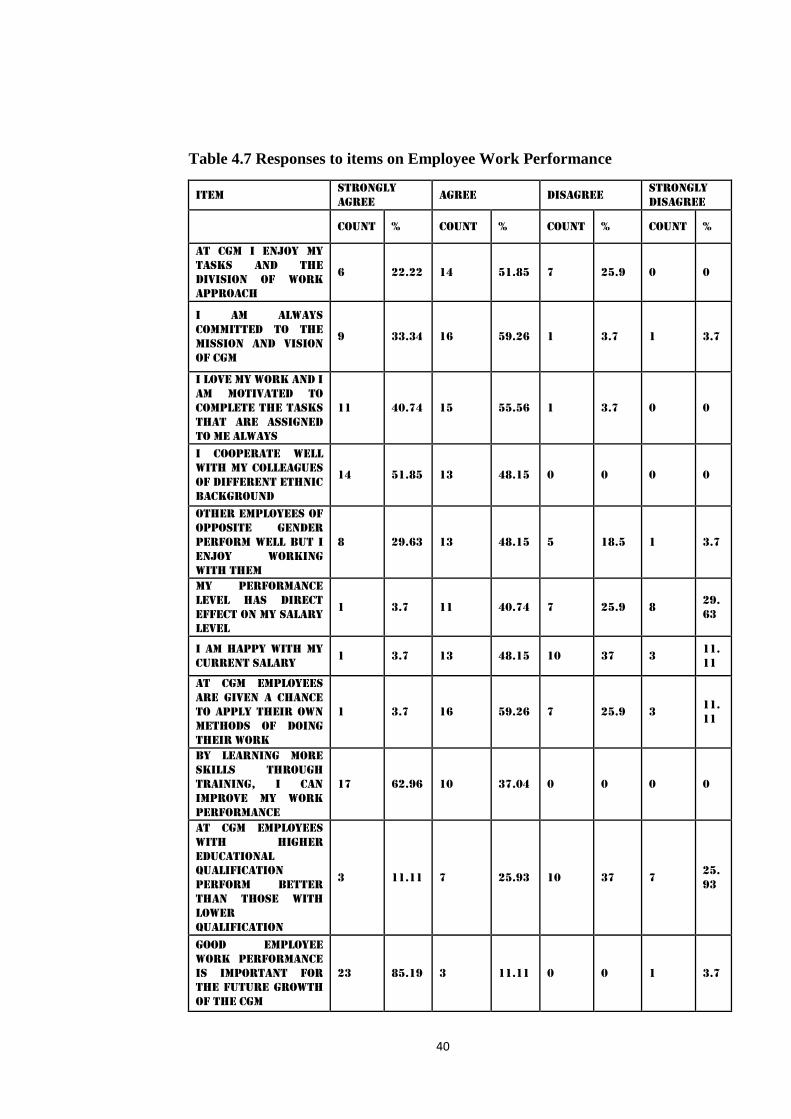
4.4.4 Employee Work Performance
Employee work performance was the dependent variable and respondents were
subjected to some very specific items in its respect and the responses were
recorded statistically in table 4.7 below.
40
Table 4.7 Responses to items on Employee Work Performance
Item Strongly
Agree Agree Disagree
Strongly
Disagree
Count % Count % Count % Count %
At CGM I enjoy my
tasks and the
division of work
approach
6 22.22 14 51.85 7 25.9 0 0
I am always
committed to the
mission and vision
of CGM
9 33.34 16 59.26 1 3.7 1 3.7
I love my work and I
am motivated to
complete the tasks
that are assigned
to me always
11 40.74 15 55.56 1 3.7 0 0
I cooperate well
with my colleagues
of different ethnic
background
14 51.85 13 48.15 0 0 0 0
Other employees of
opposite gender
perform well but I
enjoy working
with them
8 29.63 13 48.15 5 18.5 1 3.7
My performance
level has direct
effect on my salary
level
1 3.7 11 40.74 7 25.9 8 29.
63
I am happy with my
current salary 1 3.7 13 48.15 10 37 3
11.
11
At CGM employees
are given a chance
to apply their own
methods of doing
their work
1 3.7 16 59.26 7 25.9 3 11.
11
By learning more
skills through
training, I can
improve my work
performance
17 62.96 10 37.04 0 0 0 0
At CGM employees
with higher
educational
qualification
perform better
than those with
lower
qualification
3 11.11 7 25.93 10 37 7 25.
93
Good employee
work performance
is important for
the future growth
of the CGM
23 85.19 3 11.11 0 0 1 3.7
41
With regard to the item on enjoying one`s tasks, 51.85% of the respondents
agreed that at CGM, they enjoyed their tasks and the division of work
approach, with 22.23% strongly agreeing. However, 25.85% disagreed.
59.26% of the respondents agreed that they were always committed to the
mission and vision of the CGM with 33.34% strongly agreeing.
On the item on motivation, 55.56% of the respondents agreed that they loved
their work and were motivated to complete the tasks that were assigned to them
always with 40.74% strongly agreeing. Meanwhile 51.85% of the respondents
strongly agreed that they co-operated well with colleagues of different ethnic
backgrounds with 48.15% agreeing.
With respect to the item on gender sensitivity, 48.15% of the respondents
agreed that they enjoyed working with employees of opposite gender who
performed well, with 29.63% strongly agreeing. Meanwhile with regard to
salary and performance levels, 40.74% agreed that their performance levels had
direct effect on their salary levels. However, 25.93% disagreed with 29.63%
strongly disagreeing. Considering contentment with salary, 48.15% agreed that
they were happy with their current salaries. However, 37.04 disagreed.
On responsibility, 59.26% of the respondents agreed that at CGM, employees
are given a chance take responsibility of work. However, 25.93% disagreed.
Meanwhile on training and development, 62.96% strongly agreed that by
42
learning more skills through training, they could increase their work
performance, with 37.04% agreeing.
With the item on education and performance, 37.04% of the respondents
disagreed that at CGM, employees with higher educational qualifications
performed better than those with lower qualifications with 25.93% strongly
disagreeing. However, 25.93% agreed, with 11.10% strongly agreeing.
Finally, on work performance, 85.19% of the respondents strongly agreed that
good employee work performance was vital for the future growth of the CGM,
with 11.11% agreeing. However, 3.70% strongly disagreed that good employee
work performance was vital for the future growth of CGM.
According to Aswathapa (2008), employee performance can be systematically
measured against many factors including cooperation. From the analysis of the
responses, employees of the CGM are cooperative and happy.
4.5 Reliability Test
Reliability analysis is very important in research and is widely used to measure
the accuracy of the study. The questionnaire for the study was Pilot tested
using the Cronbach test using the Alpha Coefficient. Tables 4.8 and 4.9 below
show how the coefficient alpha is labeled and the results of the reliability test
respectively.
43
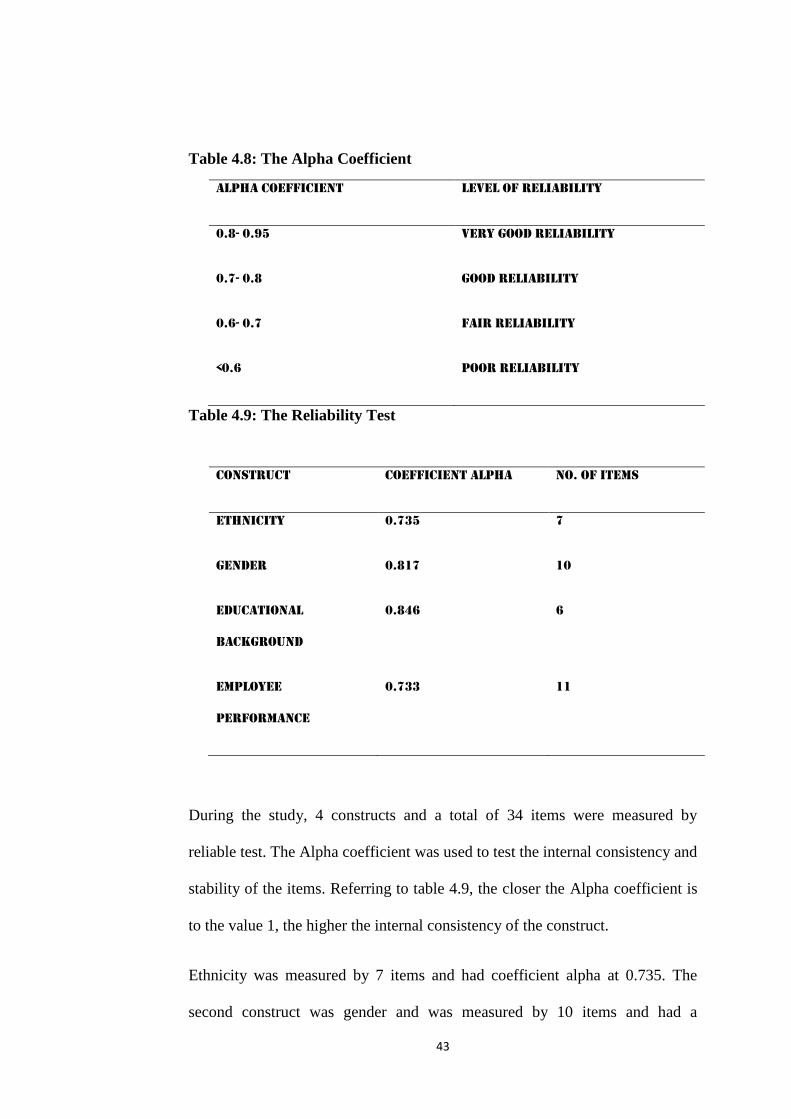
Table 4.8: The Alpha Coefficient
Alpha Coefficient Level of Reliability
0.8- 0.95 Very Good Reliability
0.7- 0.8 Good Reliability
0.6- 0.7 Fair Reliability
<0.6 Poor Reliability
Table 4.9: The Reliability Test
Construct Coefficient Alpha No. of Items
Ethnicity 0.735 7
Gender 0.817 10
Educational
Background
0.846 6
Employee
Performance
0.733 11
During the study, 4 constructs and a total of 34 items were measured by
reliable test. The Alpha coefficient was used to test the internal consistency and
stability of the items. Referring to table 4.9, the closer the Alpha coefficient is
to the value 1, the higher the internal consistency of the construct.
Ethnicity was measured by 7 items and had coefficient alpha at 0.735. The
second construct was gender and was measured by 10 items and had a
44
coefficient alpha at 0.817. The third construct was educational background
which was measured by 6 items and had a coefficient alpha of 0.846. The final
construct was employee performance, which had a coefficient alpha of 0.733
and was measured by 11 items.
Therefore the coefficient alpha of all examined constructs was acceptable. All
the constructs showed a coefficient alpha above 0.6 which reflected the fact
that, there was consistency and reliability of the tested items.
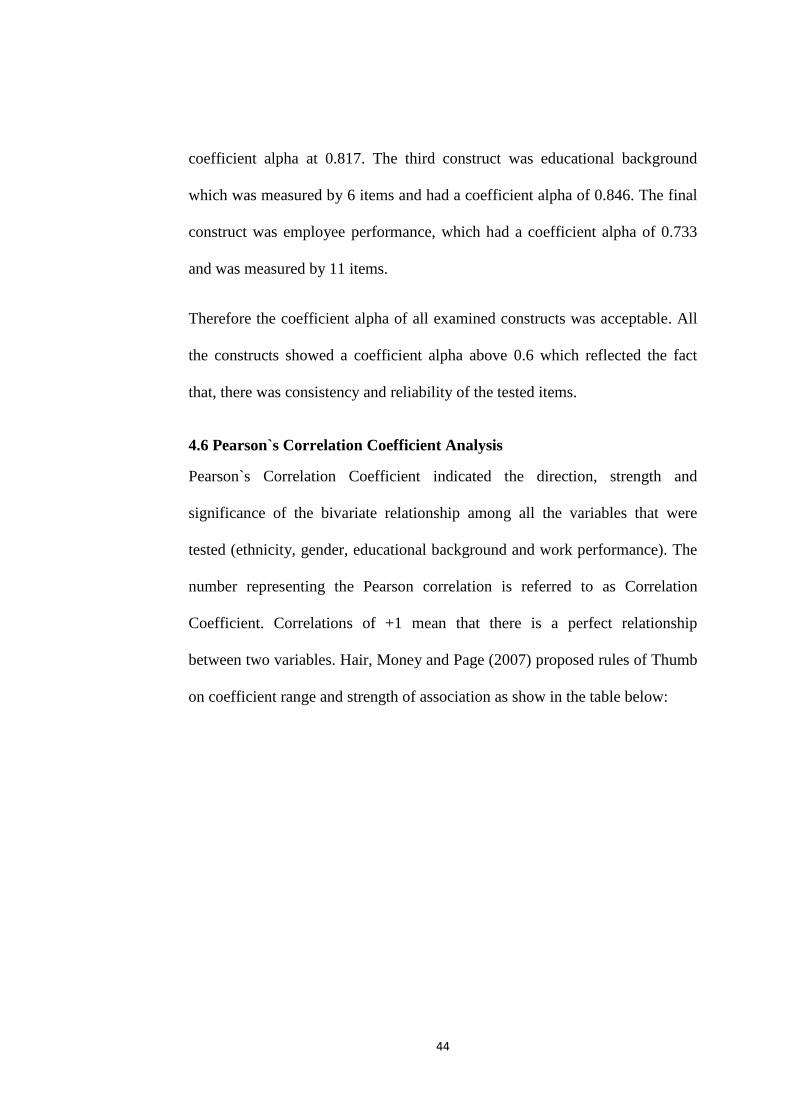
4.6 Pearson`s Correlation Coefficient Analysis
Pearson`s Correlation Coefficient indicated the direction, strength and
significance of the bivariate relationship among all the variables that were
tested (ethnicity, gender, educational background and work performance). The
number representing the Pearson correlation is referred to as Correlation
Coefficient. Correlations of +1 mean that there is a perfect relationship
between two variables. Hair, Money and Page (2007) proposed rules of Thumb
on coefficient range and strength of association as show in the table below:
45
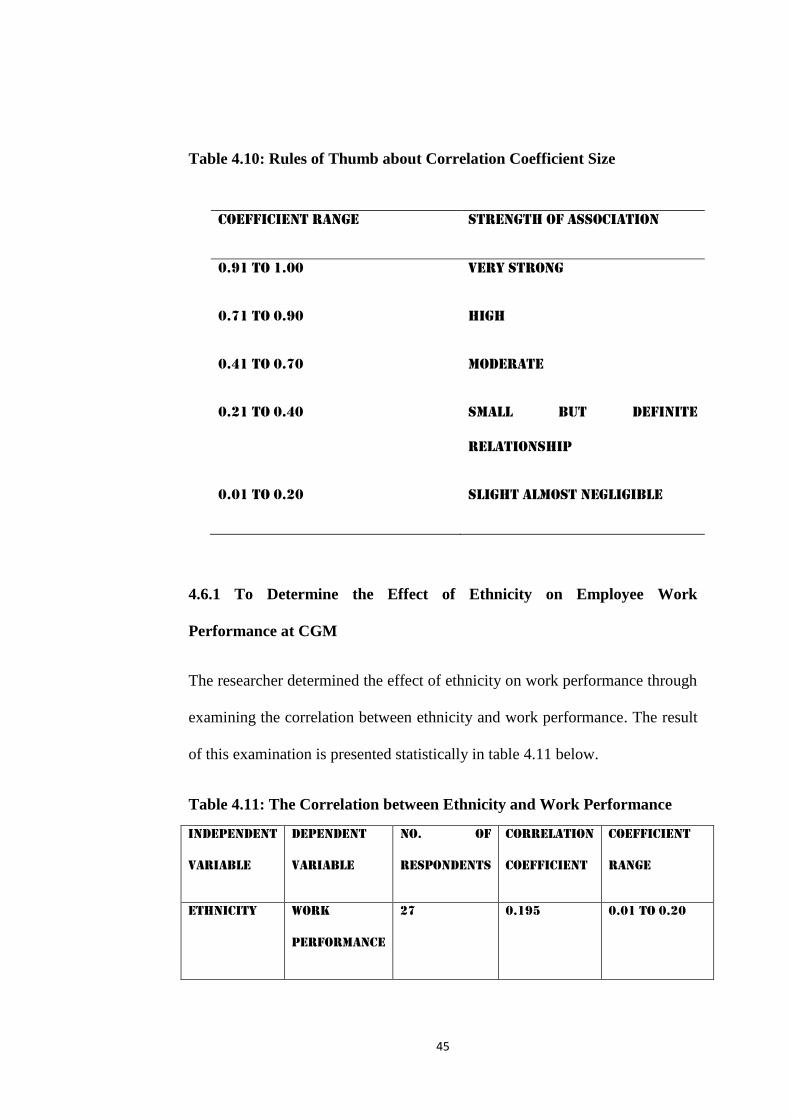
Table 4.10: Rules of Thumb about Correlation Coefficient Size
Coefficient Range Strength of Association
0.91 to 1.00 Very Strong
0.71 to 0.90 High
0.41 to 0.70 Moderate
0.21 to 0.40 Small but definite
Relationship
0.01 to 0.20 Slight almost Negligible
4.6.1 To Determine the Effect of Ethnicity on Employee Work
Performance at CGM
The researcher determined the effect of ethnicity on work performance through
examining the correlation between ethnicity and work performance. The result
of this examination is presented statistically in table 4.11 below.
Table 4.11: The Correlation between Ethnicity and Work Performance
Independent
Variable
Dependent
Variable
No. of
Respondents
Correlation
Coefficient
Coefficient
Range
Ethnicity Work
Performance
27 0.195 0.01 to 0.20
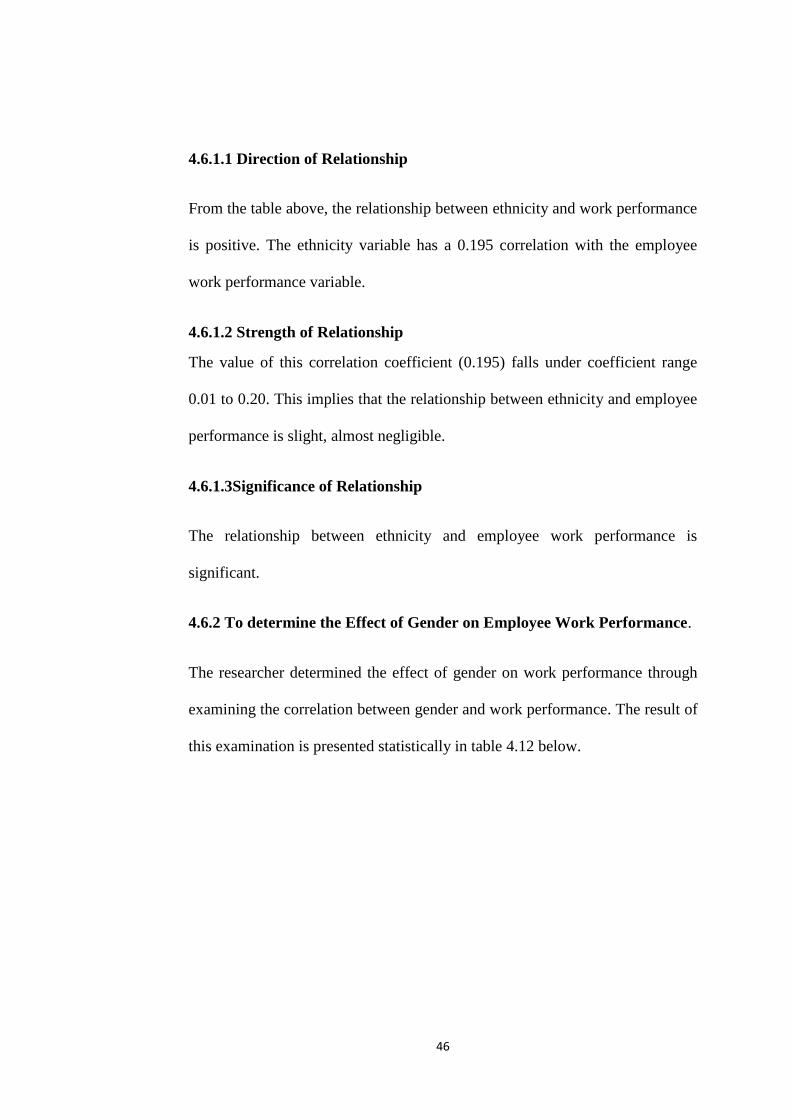
46
4.6.1.1 Direction of Relationship
From the table above, the relationship between ethnicity and work performance
is positive. The ethnicity variable has a 0.195 correlation with the employee
work performance variable.
4.6.1.2 Strength of Relationship
The value of this correlation coefficient (0.195) falls under coefficient range
0.01 to 0.20. This implies that the relationship between ethnicity and employee
performance is slight, almost negligible.
4.6.1.3Significance of Relationship
The relationship between ethnicity and employee work performance is
significant.
4.6.2 To determine the Effect of Gender on Employee Work Performance.
The researcher determined the effect of gender on work performance through
examining the correlation between gender and work performance. The result of
this examination is presented statistically in table 4.12 below.
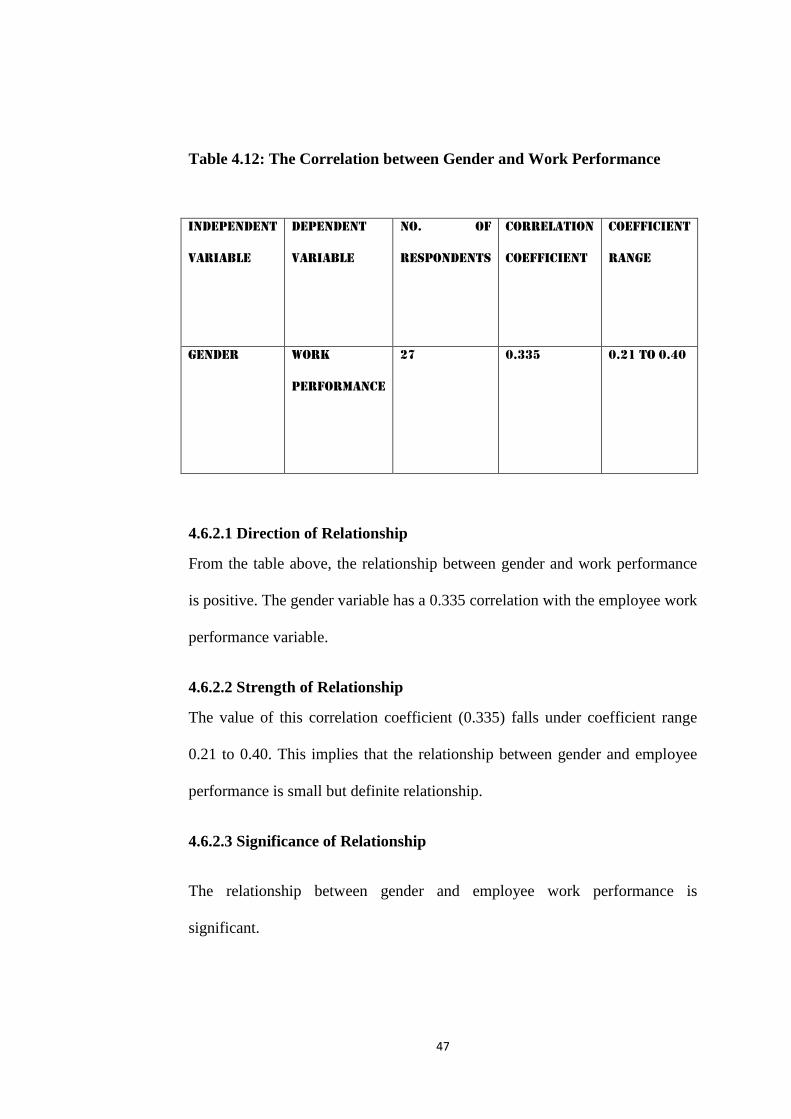
47
Table 4.12: The Correlation between Gender and Work Performance
Independent
Variable
Dependent
Variable
No. of
Respondents
Correlation
Coefficient
Coefficient
Range
Gender Work
Performance
27 0.335 0.21 to 0.40
4.6.2.1 Direction of Relationship
From the table above, the relationship between gender and work performance
is positive. The gender variable has a 0.335 correlation with the employee work
performance variable.
4.6.2.2 Strength of Relationship
The value of this correlation coefficient (0.335) falls under coefficient range
0.21 to 0.40. This implies that the relationship between gender and employee
performance is small but definite relationship.
4.6.2.3 Significance of Relationship
The relationship between gender and employee work performance is
significant.
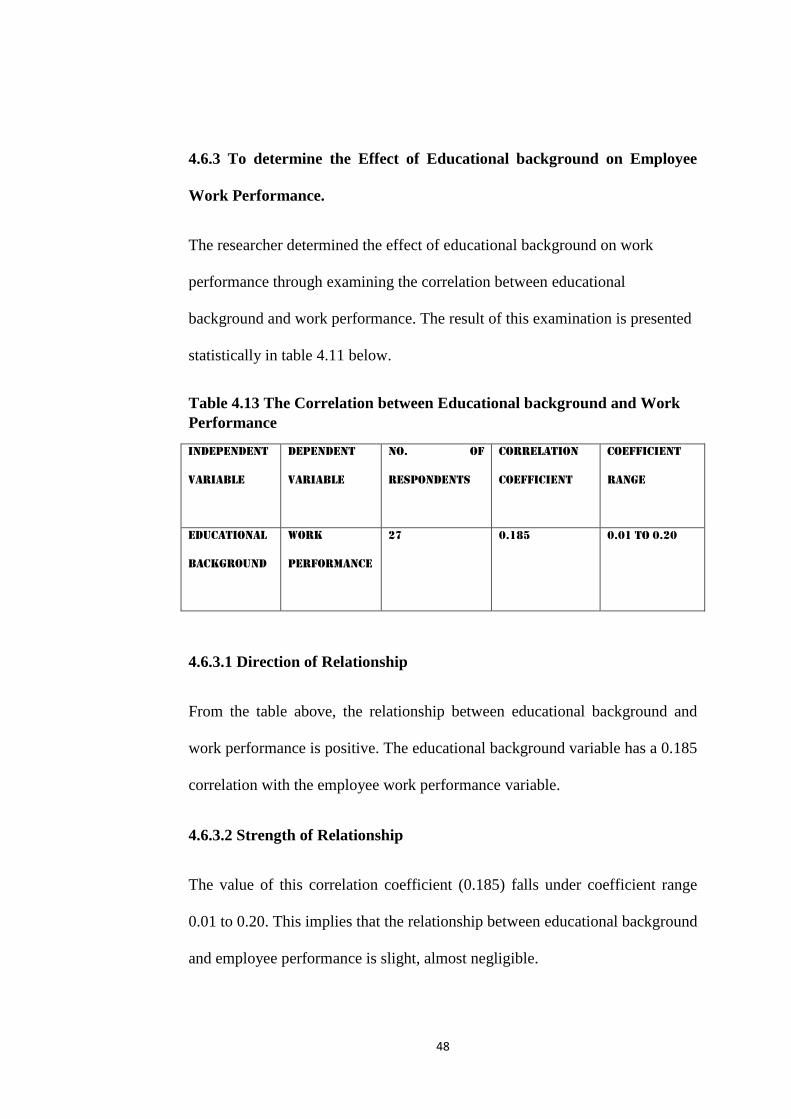
48
4.6.3 To determine the Effect of Educational background on Employee
Work Performance.
The researcher determined the effect of educational background on work
performance through examining the correlation between educational
background and work performance. The result of this examination is presented
statistically in table 4.11 below.
Table 4.13 The Correlation between Educational background and Work
Performance
Independent
Variable
Dependent
Variable
No. of
Respondents
Correlation
Coefficient
Coefficient
Range
Educational
Background
Work
Performance
27 0.185 0.01 to 0.20
4.6.3.1 Direction of Relationship
From the table above, the relationship between educational background and
work performance is positive. The educational background variable has a 0.185
correlation with the employee work performance variable.
4.6.3.2 Strength of Relationship
The value of this correlation coefficient (0.185) falls under coefficient range
0.01 to 0.20. This implies that the relationship between educational background
and employee performance is slight, almost negligible.
49
4.6.3.3 Significance of Relationship
The relationship between educational background and employee work
performance is significant
4.7 Summary
From the responses to the various items and the correlations of the tested
variables, it became clear that diversity is a well embraced phenomenon at the
CGM. It could be deduced from the findings that all employees of the CGM
were fully involved but it appeared diversity does not influence the attitude of
worker with respect to performance.
4.7.1 Effect of Ethnicity on Employee Work Performance.
The study sought to determine the effect of ethnicity on employee work
performance at the CGM. On analyzing the responses to the items on ethnicity
it became apparent that ethnicity was acceptable. The responses reflected the
fact that there was ethnic harmony amongst the workers. Majority of the
responses indicated that employees were happy with the ethnic composition.
Ethnic differences did not interfere with work groups.
4.7.2 Effect of Gender on Employee Work Performance.
The study also sought to determine the effect of gender on employee work
performance at the CGM. From majority of responses received to items on
gender sensitivity, it appeared there was a great deal of gender tolerance
amongst the workers. It became apparent that there was no gender
discrimination on hiring and recruitment processes and that CGM attracted and
50
hired women prodigiously. All employees were given fair treatment whether
male or female. A performance criterion for success was not expected to be
higher for males than for females. All employees were equal. No one suffered
inferiority or superiority due to his/her gender.
4.7.3 Effect of Educational background on Employee Work Performance
From the responses to the items on educational background, it became evident
there was no discrimination based on one`s educational background and that
low educational qualifications did not make employees feel inferior or lose
confidence. Further, it became apparent that differences on educational
background did not bring conflict amongst employees.
4.7.4 Employee Work Performance
Work performance was the dependent variable which the researcher sought to
determine the extent at which it was influenced by the three independent
variables, namely ethnicity, gender and educational background. From the
responses to the items on employee work performance, majority of the
employees enjoyed their daily tasks and that they were fully committed to the
vision and mission of the CGM. It was also evident that there was full co-
operation among employees of different ethnic background. It also came out
clearly from the responses that one`s performance was appreciated without
regard of gender. In the opinion of majority of the respondents, work
performance did not go with an employee`s educational background.
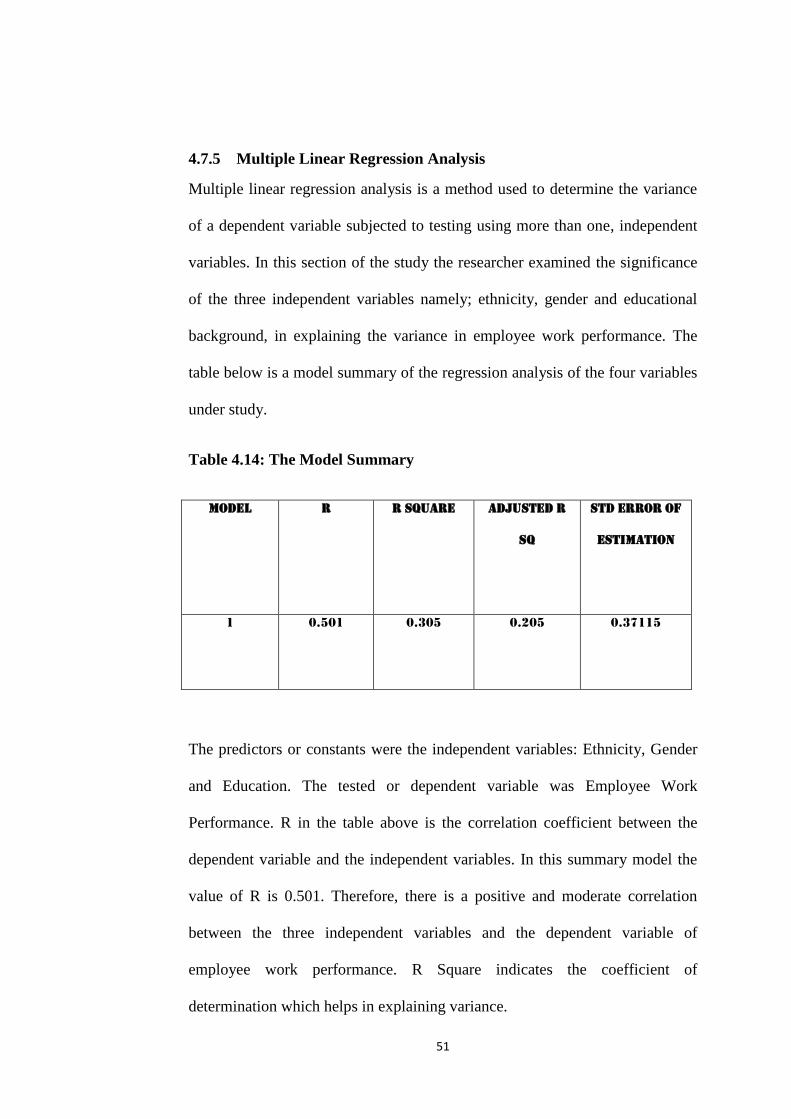
51
4.7.5 Multiple Linear Regression Analysis
Multiple linear regression analysis is a method used to determine the variance
of a dependent variable subjected to testing using more than one, independent
variables. In this section of the study the researcher examined the significance
of the three independent variables namely; ethnicity, gender and educational
background, in explaining the variance in employee work performance. The
table below is a model summary of the regression analysis of the four variables
under study.
Table 4.14: The Model Summary
Model R R Square Adjusted R
sq
Std Error of
Estimation
1 0.501 0.305 0.205 0.37115
The predictors or constants were the independent variables: Ethnicity, Gender
and Education. The tested or dependent variable was Employee Work
Performance. R in the table above is the correlation coefficient between the
dependent variable and the independent variables. In this summary model the
value of R is 0.501. Therefore, there is a positive and moderate correlation
between the three independent variables and the dependent variable of
employee work performance. R Square indicates the coefficient of
determination which helps in explaining variance.
52
In this study the R Square for the three independent variables was 0.305. This
means that the independent variables of ethnicity, gender and educational
background can explain only 30.5% of the variation in the dependent variable
of employee work performance. It implies that it leaves 69.50% unexplained in
study. In essence, there other additional variables that are crucial in explaining
the variations of employee performance at the CGM that were not considered
in this study
53
CHAPTER FIVE
SUMMARY, CONCLUSIONS AND RECOMMENDATIONS
5.1 Introduction
This chapter presents the discussion of the research findings. The descriptive
analysis presented in previous chapter is summarized. In addition, the
recommendations of the researcher are included. The last section of this
chapter gives the overall conclusion of the entire research project.
5.2 Summary of Descriptive Analysis
This is aimed at giving the conclusions regarding the characteristics of the
population based on the sample data and the analysis done. This section will
give a summary of the effect of each tested variable on work performance
based on the analysis in the previous chapter.
5.2.1 Ethnic Diversity and Employee Work Performance
From the research findings, it was evident that ethnicity had no significant
effect on employees` work performance at the CGM. Employees were found to
be ethnically harmonious. Dahlin (2005) argued that ethnicity is negative since
it can create conflict and cliques due to social categorization but that is not the
case at the CGM. Over 85% of the respondents felt that ethnic differences in
work groups never encouraged conflict. However, even though there was
harmony, ethnicity did not seem to have any significant contributory effect,
negatively or positively on work performance.
54
5.2.2 Gender Diversity and Employee Work Performance
From the analysis it became evident that gender diversity was well encouraged.
A performance criterion for success at work was equally expected to be higher
for female as well as for male employees. It was evident from the research that
there was no discrimination during hiring and recruitment process on gender
basis at the CGM. It also became apparent that CGM attracted and hired
women prodigiously and that employees were given fair treatment throughout,
whether male or female. The researcher observed that at the CGM, women
were given opportunity to work in positions that utilized their skills, education
and training. Kundu (2003) stated that hiring women helps an organization tap
niche in the market. However, it was evident that being a man or woman did
not encourage or discouraged one on performance.
5.2.3 Educational background Diversity and Employee work Performance.
It became evident from the results that educational background did not have
significant effect on work performance at the CGM. During the study,
educational background appeared very crucial since it formed the basis of the
recruitment plan at the CGM. However, low educational qualifications seemed
not to lower the esteem of workers since opportunities for growth and
advancement existed for all employees regardless of their educational
background. From the responses the researcher found out that difference in
educational background did not bring conflict among the employees. Tracy
(2011) argued that educational background is important to employees and that
they cannot perform well without education but that is contrary at the CGM.
55
5.2.4 Employee Work Performance
From the study, it became evident that employees of the CGM enjoyed their
tasks and that they were fully committed to the mission and vision of the
organization. According to the responses, the researcher observed that there
was motivation of workers at the CGM and that there was full cooperation
amongst workers of different ethnic backgrounds. It was also apparent that
different gender groups worked well and that there was appreciation of one`s
performance by members of the opposite gender. 62.97% of respondents
disagreed that employees with higher educational qualification performed
better. Finally, 85.19% of the respondents agreed that good employee work
performance was important for the future growth of the CGM.
5.3 Recommendations for Future Study
This study could serve as a guideline for future researches at the CGM. The
focus of this research was on workforce diversity. The results indicated
employee performance is not significantly affected when the diversity variables
of ethnicity, gender and educational background are considered at the CGM.
Diversity is a well-accepted phenomenon at the CGM. It is important for the
County therefore to realize the need to capitalize on these demographic
categories in order to stay ahead of other Counties. Smith (2010) argued that
good workforce diversity practices are believed to enhance employee and
organizational performance. However, at the CGM there seems to be no link
between workforce diversity and performance. To fully understand the
scenario at the CGM, further studies need to be conducted in order to unearth
the challenges of employee work performance, with a view to discovering what
56
needs to be done to enable the County increase efficiency and make better its
service delivery to the people.
5.4 Conclusion
The objectives of this study have been fulfilled with negative results for all the
tested variables. From the findings, workforce diversity has no significant
effect towards employee work performance at the CGM. There is no
discrimination on the basis of ethnicity, gender and educational background.
Normally discrimination either directly or indirectly curtails the potential of
available talents or underutilizes the employees. The CGM has a diverse
workforce with a satisfying work environment which is highly socialized. It
became clear from the study that low or higher employee work performance is
not influenced by workforce diversity at the CGM.
Several researches suggest that whether or not diversity has positive or
negative effect, depends on different aspects of the organization`s strategies,
culture and HRM practices. This indicates that diversity may be beneficial
under certain conditions and may fail to have any impact in others, Pugh
(2008). The following factors are known to affect the effectiveness of
workforce diversity: size of organization, age of organization, type of
organization and diversity of community surrounding an organization.
57
REFERENCES
Berscheid, E. & Walster, H. (1978). Interpersonal attraction. Reading, MA:
Addison Wesley.
Cross, E.Y., Katz, J.H., Miller, F.A., Seashore, E. (1994). The Promise of
Diversity: Over 40 Voices Discuss Strategies for Eliminating
Discrimination in Organizations. Burr Ridge: Irwin.
Michaéla C.S., Deanne, N.D.H., Paul, L.K., Janique, A. (2003). Diversity and
Team Outcomes: The Moderating Effects of Outcome Interdependence
and Group Longevity and the Mediating Effect of Reflexivity. Journal
of Organizational Behavior, Vol. 24 (6), 779-802.
Beja, P. (2014). Operations at Kenya Ports Authority Crippled as Workers
Strike. ROI, www.standardmedia.co.ke/.../operations-at-kenya-ports-
aut.
Benschop, Y. (2001). Pride, prejudice and performance: Relations between
HRM, diversity and performance. International Journal of Human
Resource Management, 12, , 1166-1181.
Bhatia, S. (2008). Genetic diversity in Kheri—A pastoralists developed Indian
sheep using microsatellite markers. Indian Journal of Biotechnology,
108-112.
Cascio, W. F. (2000). Costing human resources: The financial impact of
behavior in organizations (4th ed.). Cincinnati,OH: South-Western.
Childs, J. (2005). Managing Workforce Diversity at IBM. A Global Human
Resource Topic that has Arrived. Human Resource Management 44 (1),
73-77.
Cohen, W. M., & Levinthal, D. A. (2000). Absorptive capacity: A new
perspective on learning and innovation.,. Administrative Science
Quarterly, 35, 128-152.
Connell, R. W. (2002). Gender, Maiden. New york: Blackwell Publishers.
Cooper, D. R., & Schindler, P.S. (2003). Business Research Methods (8th ed.).
New York: McGraw-Hill.
Cornelius, N. (1999). HRM A Managerial Perspective. London: International
Thomson .
Dahlin, K., Weingart, L. & Hinds, P. (2005). Team diversity and information
use. The Academy of Management Journal 48 (6), 1107–1123.
Daniel, C. (2009). The effects of higher education policy on the location
decision of individuals: Evidence from Florida's Bright Futures
58
Scholarship Program. Regional Science and Urban Economics, 39,
553-562.
Eduard, B. (2010). Overcoming an Inferiority Complex- People Skills
Decoded. Retrived, www.peopleskillsdecoded.com/inferiority-complex.
Elsaid, A. M. (2012). Effects of cross cultural workforce diversity on employee
performance in Egyptian Pharmaceutical Organisation. Business &
management Research, 1(4), 162.
Erasmus, L. (2007). The Management of Workforce Diversity and the
Implications for Leadership at Financial Asset Services. Business
Management, University of Johannesburg.
Eugene, C., Lee, K., Tan. S., Tee, S. & Yang, P. (2011). Effects of Workforce
Diversity on Employee Performance. ROI,
eprints.utar.edu.my/450/1/BA-2011-0807009.pdf.
Gay, L. R. (1992). Educational Research: Competencies for Analysis and
Application, 4th ed. New York: Macmillan Publishing Company.
Hair, F. J., Money, A. H. & Page, P. (2007). Research Methods for Business.
West Sussex: John Wiley Sons.
Horwitz, S. (2005). The Compositional Impact of Team Diversity on
Performance: Theoretical Considerations.
http://www.researchgate.net/journal/1552-
6712_Human_Resource_Development_Review.
Jackson, S.E., Joshi, A., Erhardt, N. (2003). Recent Research on Team and
Organizational Diversity: SWOT Analysis and Implications, . Journal
of Management, 29, 801-830 .
Janssens, M., Sels, L., & van den Brande, I. (2003). Multiple Types of
Psychological Contracts. A Six Cluster Solution’, Human Relations, 56,,
1349–1378.
Jehn, K. A., & Bezrukova, K. (2004). A field study of group diversity:
Workgroup context and performance. Journal of Organizational
Behavior, 25(6), 703-729.
Jehn, K. A., Northcraft, G. B., & Neale, M. A. . (1999). Why differences make
a difference: a field study in diversity, conflict, and performance in
workgroups. Administrative Science Quarterly, 44, 741–763.
Kiglai. (2006). Training Manual on Conflict Management, The National Unity
and Reconciliation Commission, Republic of Rumanda.
Knight, D., Pearce, C. L., Smith, K. G., Olian, J. D., Sims, H. P., & Smith,
K.A. (2009). Top management team diversity, group process, and
59
strategic consensus. l, 20,. Strategic Management Journal,1 (20), 445-
465.
Kothari, C. R. (2004). Research Methodology, Methods and Techniques, 2nd
Revised Edn. New Delhi, India: New Age International Publishers.
Latham, G, P, & Locke, E, A. (2006). Enhancing the Benefits and Overcoming
the Pitfalls of Goal Setting. Organizational Dynamics,35, 332-340.
Leonard, W., Robertson, M., Snodgrass, D., & Kuzawa, C. (2003). Metabolic
correlates of hominid brain evolution. Comparative Biochemistry and
Physiology ,136, 5-15.
Madiha, A., Niazi, M., & Abbasi, R. (2003). Workforce diversity. ROI,
www.slideshare.net/leomaryslideshare/workforce-diversityppt-2003.
Makokolo, M. (2005). A report on Minority indigenous peoples and ethnic
diversity in Kenya. London: Minority Rights Group International.
McGrath, J.E., Berdahl, J.L., Arrow, H. (1995). Traits, Expectations, Culture
and Clout: The Dynamics of Diversity in Workgroups. Washington
D.C, : American Psychological Association.
McMillan-Capehart, A. (2003). Cultural diversity's impact on firm
performance: The moderating influence of diversity initiatives and
socialization tactics. Unpublished doctoral dissertation,Louisiana Tech
University, USA.
Mosko, W. &. (1996). Psychopharmacology Division 28 Directory .
Apadivision.org, 29 (2), 5-13.
Mugenda, O.M & Mugenda, A.G. (2003). Research Methods, Quantitative &
Qualitative Approaches. Nairobi:: Acts Press.
Munjuri, M. G. & Maina, R. M. (2013). Workforce diversity and employee
performance in the Banking sector in Kenya. Journal UoN Portal,3(1),
40-48.
Ngao, E. & Mwangi, C. (2013). Effects of Managing Gender of Employees in
Enhancing Organizational Performance. A Case Study of Kenya Ports
Authority(2013). European Journal of Business and Management,
5(21), 50-62.
Nkomo, S. (1995). Identities and the Complexity of Diversity Diversity in Work
Teams. Washington DC: American Psychological Association.
Opstal, E. (2009). Management Diversity. The relationship between the
Management of ethnic cultural, 25-46.
Orodho, J. A. (2009). Elements of Education and Social Science Research
Methods. Maseno: Kanezja.
60
Oso, W.Y. & Onen, D. (2008). A General Guide to Writing Resarch Proposal
and Report. A hand Book for Beginning Researchers, 2nd ed. Kampala,
Uganda: Makerere University.
Oyserma, D. (2013). Identity Based Motivation: Implications for Action
Readiness and Consumer Behavior. Journal of Consumer Psychology,
19, 250-260.
Pitts, D. W., Hicklin, A. K., Hawes, D. P., & Melton, E. (2010). What Drives
the Implementation of Diversity Management Programs? Evidence
from Public Organizations . Journal of Public Administration Research
& Theory, 20(4), 867-886.
Roberson, L. & Kulik, C.T. (2007). Stereotype threat at work. Academy of
Management Perspectives, 21, 24-40.
Rue, L.W., & Byars, L.L. (1993). Supervision: Key Link to Productivity, (4th
Ed). Chicago: Irwin.
Schuler, R. (1992). Strategic Human Resource Manageemnt Linkiing the
People with the Stratyegic Needs of the Business. Organisational
Dynamics, Summer, 18-31.
Shaw, M. (1993). Achieving equality of treatment and opportunity in the
workplace. In: Harrison, R. (ed) Human resource management: issues
and strategies. Wokingham, CA: Addison-Wesley.
Slaughter, S., Feldman, M. P. & Thomas, S. L. (2009). Institutional Conflict of
Interest Policies. Organization Science,19(1), 69-89.
Smith, P. (2010). Increasing Productivity: Workforce Training and
Development. The Bleaner.
Srivastava, E. & Agarwal, N. (2012). The Emerging Challenges in HRM.
International Journal of Scientific & Technology Research, 1(6), 46-48.
Sungjoo, L. (2010). Open innovation in SMEs—An intermediated network
model. ROI,
http://www.sciencedirect.com/science/article/pii/S0048733309002248.
Thomas, R. (1991). Beyond Race and Gender: Unleashing the Power of Your
Total Work Force by Managing Diversity. New York : AMACOM.
Timmermans, B., Ostergaard, C. R., & Kristinsson, K. (2011). Does a different
view create something new? The effect of employee diversity on
innovation. Research Policy, 500-509.
Tracy R. L. & David E. M. (2011). Choosing workers' qualifications: No
experience necessary? International Economic Review,34(3), 479-502.
61
Tsui, A.S., Egan, T.D. & O’ Reilly, C. (1992). Being Different Relational
Demography and Organizational Attachment . Administrative Science
Quarterly,37, 549-577.
Turner, J. (1987). Rediscovering the Social Group: A Social Categorization
Theory. Oxford, U.K: Blackwell.
Van Esbroek, W., & van Engen. M.L. (2008). Management van Diversiteit
enRechtvaardigheid: Op zoek naar een „Beste benadering‟. Tijdschrift
voor HRM, 63-90.
Van Knippenberg, D., De Dreu, C. K. W., & Homan, A. C. . (2004). Work
group diversity and group performance: An integrative model and
research Agenda. Journal of Applied Psychology, 89, 1008-1022.
Webster, M. (1985). Webster's nith new collegiate dictionary. Meriam-
Webster Inc.
Williams, K.Y. & O'Reilly, C. (1998). Demography and Diversity in
Organizations: A Review of 40 Years of Research, in B. M. Staw and
L. L. Cummings (eds.). Research in Organizational Behavior, 20, 77-
140.
Wittenbaum, G. & Stasser, G. (1996). Management of Information in Small
Groups. Thousand Oaks, CA: Sage.
Zgourides, G. D., Johnson, L., & Watson, W. . (2002). The influence of ethnic
diversity on leadership,group process, and performance: an examination
of learning teams. utar.edu.my/450/1/BA-2011-0807009.pdf, 2-8.
62
APPENDICES
APPENDIX A: LETTER TO RESPONDENTS
Date: ___________________________
MBA STUDENT
ST. NO: MBA/OOIO/2012.
Department of Business Studies
Technical University of Mombasa
To Respondent,
Dear Sir/Madam
RE: RESEARCH QUESTIONNAIRE
I am a student of MBA- Human Resource Management Option at TUM. In partial fulfillment
of the course, I am required to carry out a Research Project.
The subject of my research is the Effect of Workforce Diversity on Employee Work
Performance: A case study of County Government of Mombasa (CGM).
You have been selected to participate in this study as a respondent. The information you
provide shall be treated entirely for academic purposes and shall be held with high
confidentiality.
You cooperation shall be highly appreciated.
Yours sincerely,
Abdallah Mwatumwa.
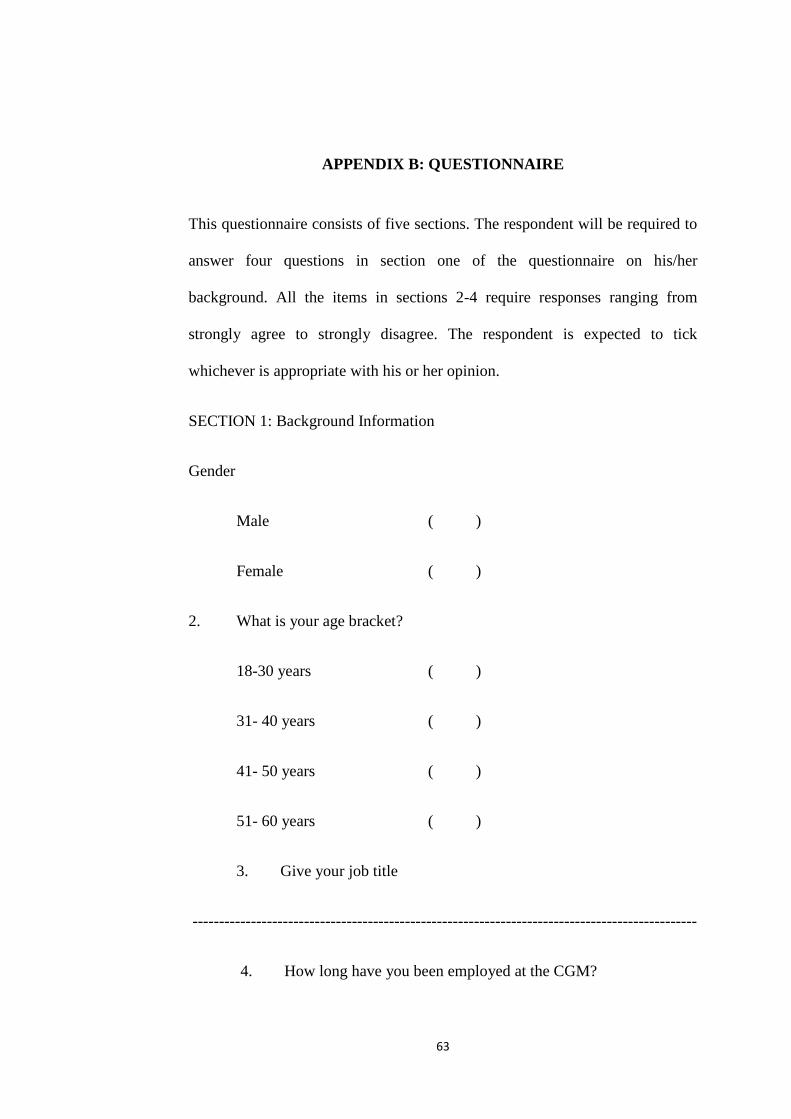
63
APPENDIX B: QUESTIONNAIRE
This questionnaire consists of five sections. The respondent will be required to
answer four questions in section one of the questionnaire on his/her
background. All the items in sections 2-4 require responses ranging from
strongly agree to strongly disagree. The respondent is expected to tick
whichever is appropriate with his or her opinion.
SECTION 1: Background Information
Gender
Male ( )
Female ( )
2. What is your age bracket?
18-30 years ( )
31- 40 years ( )
41- 50 years ( )
51- 60 years ( )
3. Give your job title
-----------------------------------------------------------------------------------------------
4. How long have you been employed at the CGM?
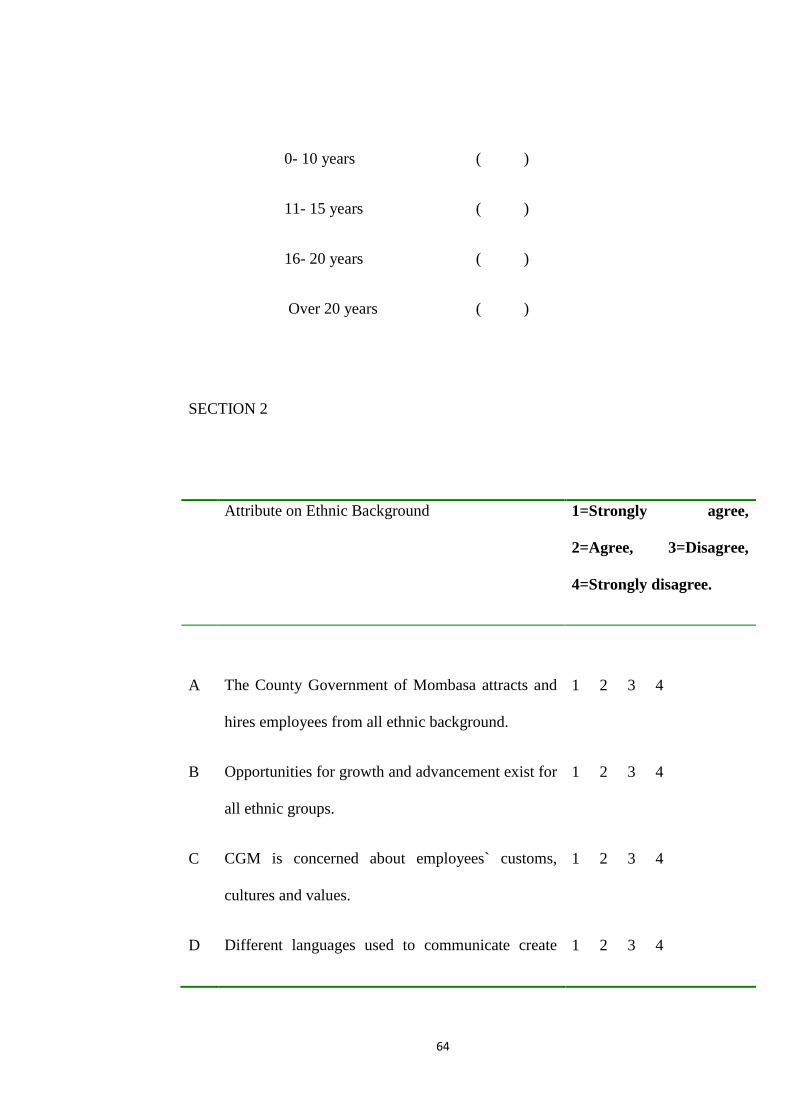
64
0- 10 years ( )
11- 15 years ( )
16- 20 years ( )
Over 20 years ( )
SECTION 2
Attribute on Ethnic Background 1=Strongly agree,
2=Agree, 3=Disagree,
4=Strongly disagree.
A The County Government of Mombasa attracts and
hires employees from all ethnic background.
1 2 3 4
B Opportunities for growth and advancement exist for
all ethnic groups.
1 2 3 4
C CGM is concerned about employees` customs,
cultures and values.
1 2 3 4
D Different languages used to communicate create 1 2 3 4
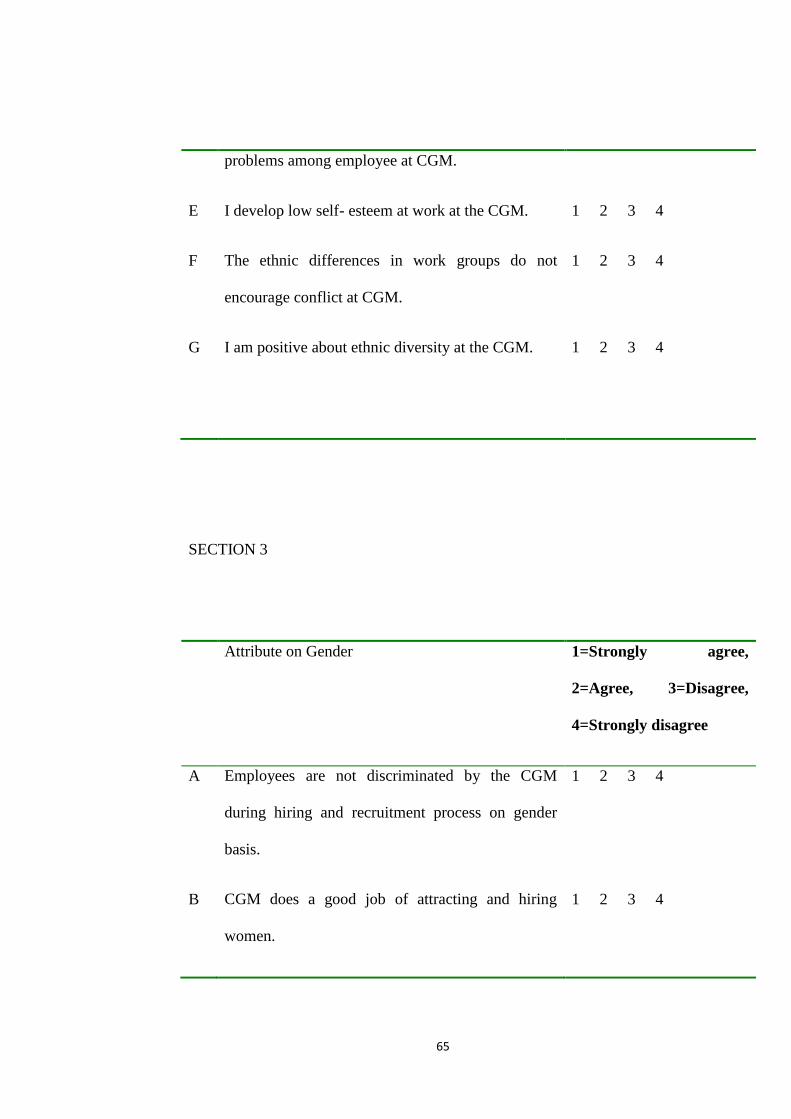
65
problems among employee at CGM.
E I develop low self- esteem at work at the CGM. 1 2 3 4
F The ethnic differences in work groups do not
encourage conflict at CGM.
1 2 3 4
G I am positive about ethnic diversity at the CGM.
1 2 3 4
SECTION 3
Attribute on Gender 1=Strongly agree,
2=Agree, 3=Disagree,
4=Strongly disagree
A Employees are not discriminated by the CGM
during hiring and recruitment process on gender
basis.
1 2 3 4
B CGM does a good job of attracting and hiring
women.
1 2 3 4
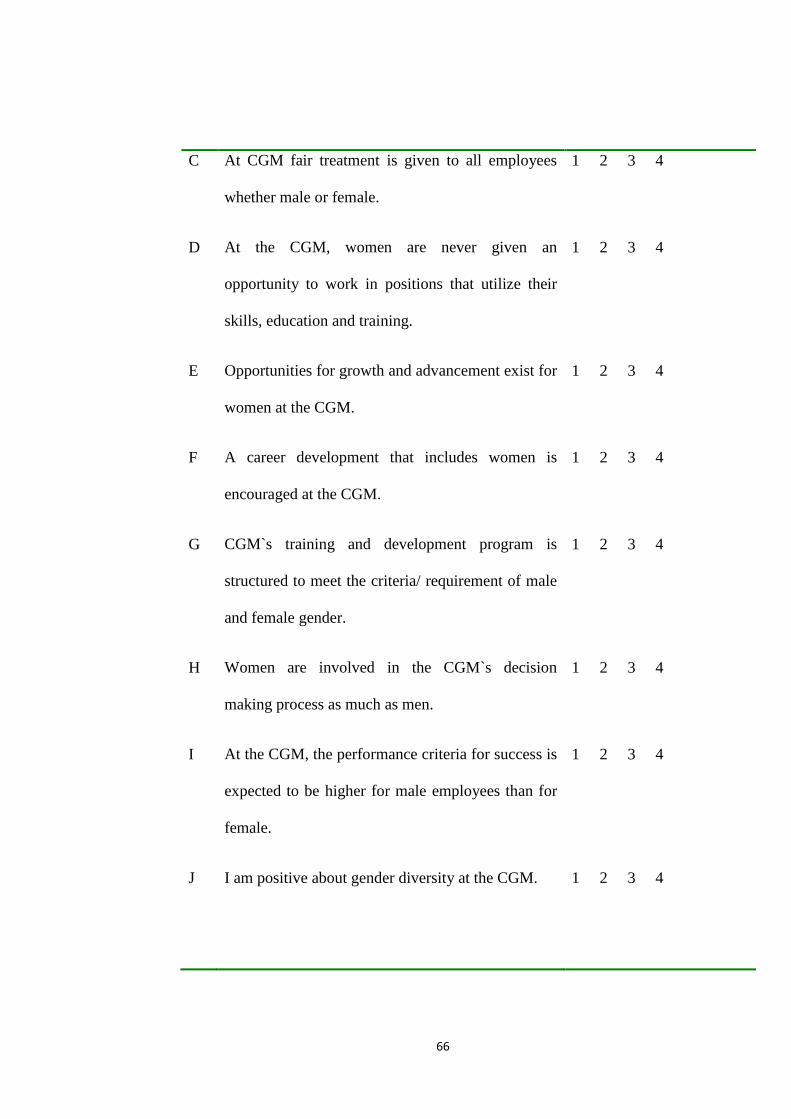
66
C At CGM fair treatment is given to all employees
whether male or female.
1 2 3 4
D At the CGM, women are never given an
opportunity to work in positions that utilize their
skills, education and training.
1 2 3 4
E Opportunities for growth and advancement exist for
women at the CGM.
1 2 3 4
F A career development that includes women is
encouraged at the CGM.
1 2 3 4
G CGM`s training and development program is
structured to meet the criteria/ requirement of male
and female gender.
1 2 3 4
H Women are involved in the CGM`s decision
making process as much as men.
1 2 3 4
I At the CGM, the performance criteria for success is
expected to be higher for male employees than for
female.
1 2 3 4
J I am positive about gender diversity at the CGM. 1 2 3 4
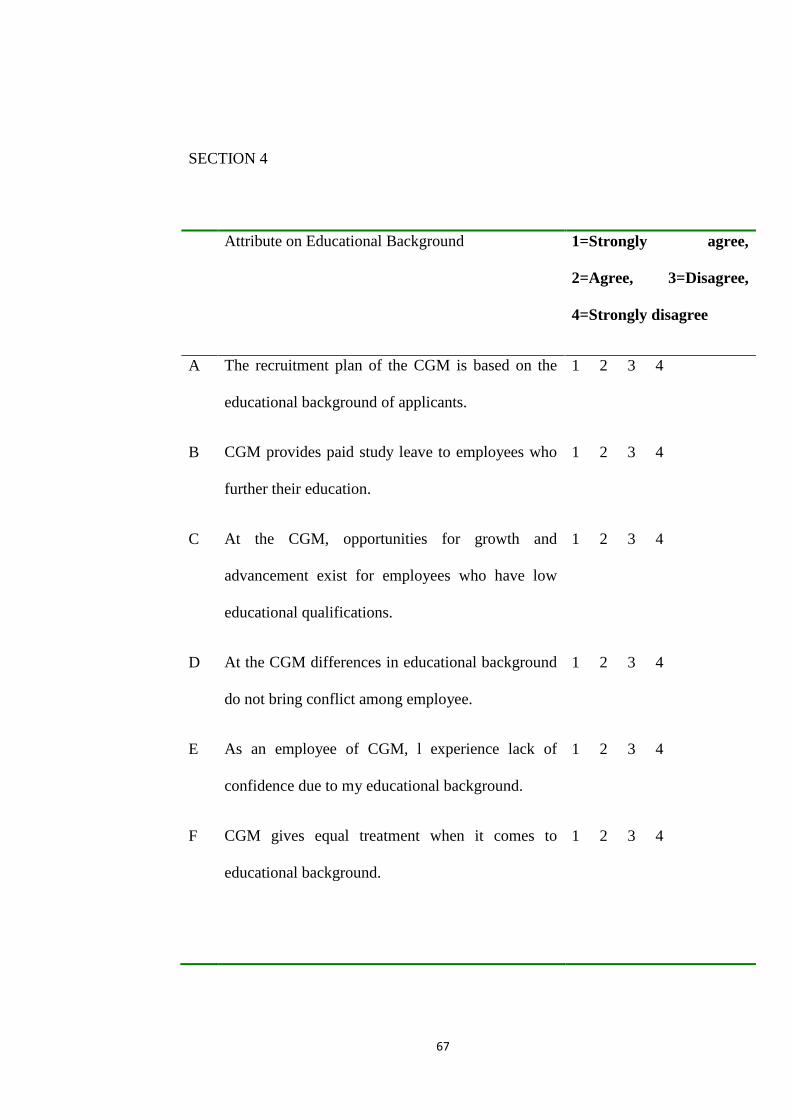
67
SECTION 4
Attribute on Educational Background 1=Strongly agree,
2=Agree, 3=Disagree,
4=Strongly disagree
A The recruitment plan of the CGM is based on the
educational background of applicants.
1 2 3 4
B CGM provides paid study leave to employees who
further their education.
1 2 3 4
C
At the CGM, opportunities for growth and
advancement exist for employees who have low
educational qualifications.
1 2 3 4
D At the CGM differences in educational background
do not bring conflict among employee.
1 2 3 4
E As an employee of CGM, l experience lack of
confidence due to my educational background.
1 2 3 4
F CGM gives equal treatment when it comes to
educational background.
1 2 3 4
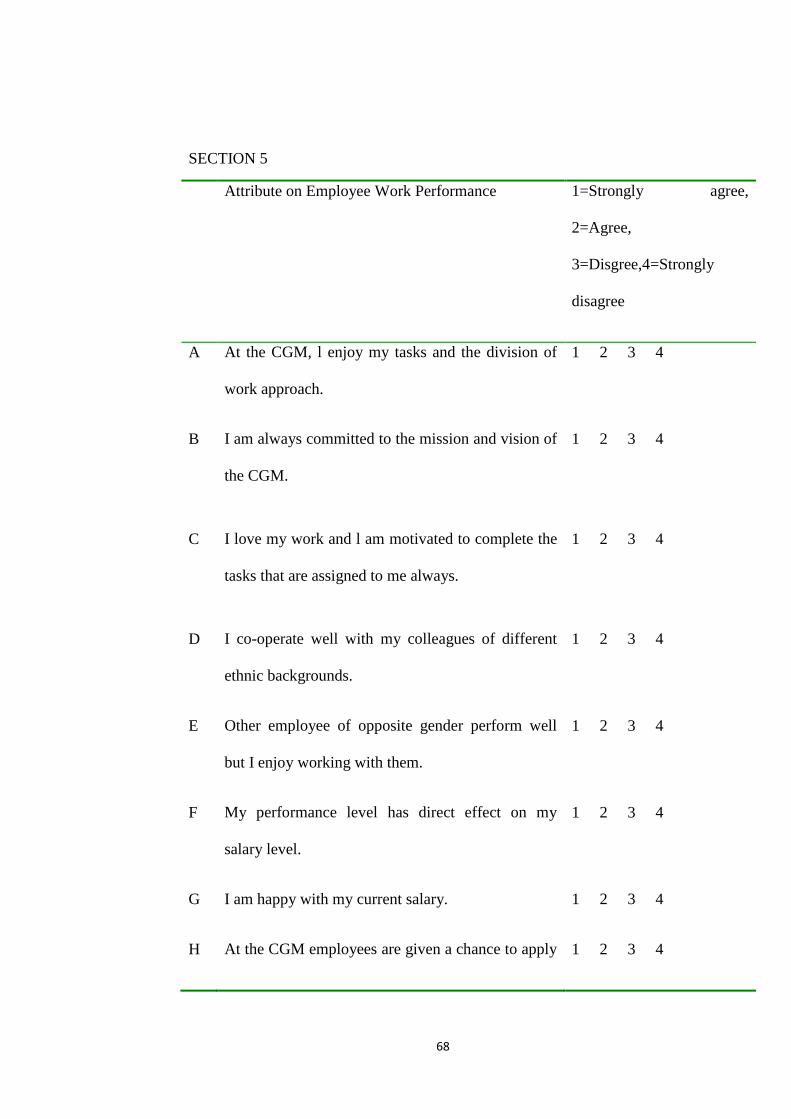
68
SECTION 5
Attribute on Employee Work Performance 1=Strongly agree,
2=Agree,
3=Disgree,4=Strongly
disagree
A At the CGM, l enjoy my tasks and the division of
work approach.
1 2 3 4
B
I am always committed to the mission and vision of
the CGM.
1 2 3 4
C
I love my work and l am motivated to complete the
tasks that are assigned to me always.
1 2 3 4
D I co-operate well with my colleagues of different
ethnic backgrounds.
1 2 3 4
E Other employee of opposite gender perform well
but I enjoy working with them.
1 2 3 4
F My performance level has direct effect on my
salary level.
1 2 3 4
G I am happy with my current salary. 1 2 3 4
H At the CGM employees are given a chance to apply 1 2 3 4
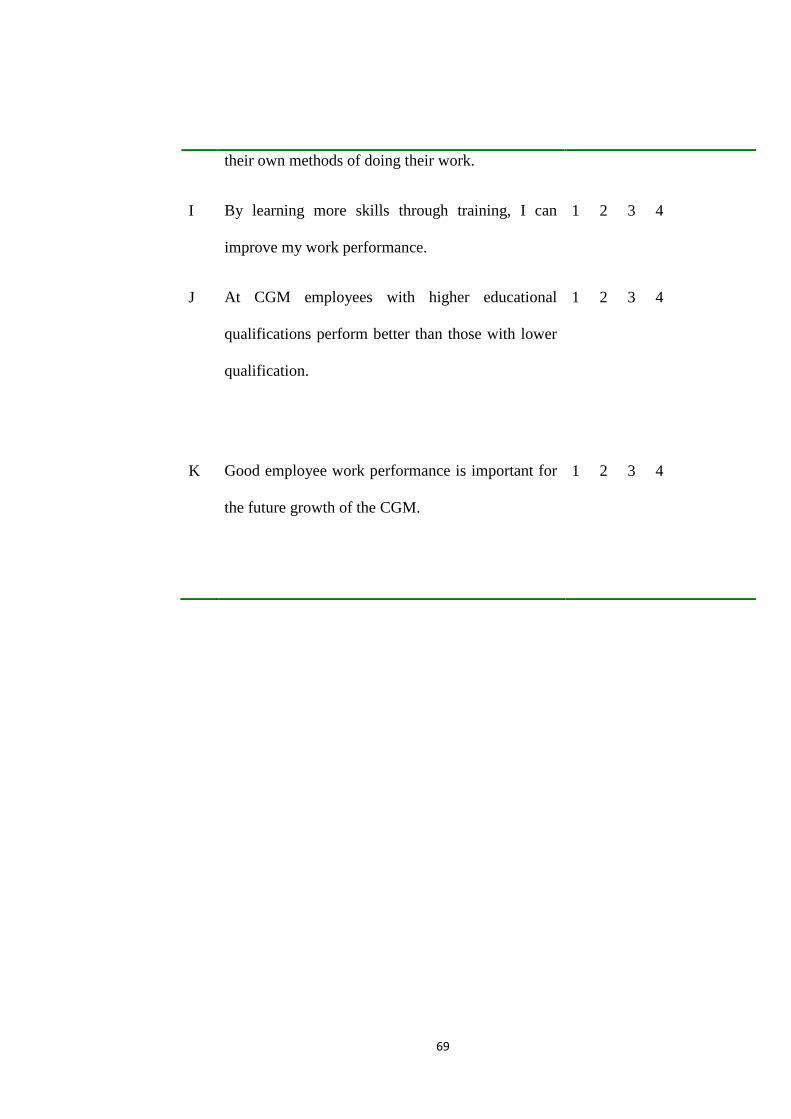
69
their own methods of doing their work.
I By learning more skills through training, I can
improve my work performance.
1 2 3 4
J At CGM employees with higher educational
qualifications perform better than those with lower
qualification.
1 2 3 4
K Good employee work performance is important for
the future growth of the CGM.
1 2 3 4
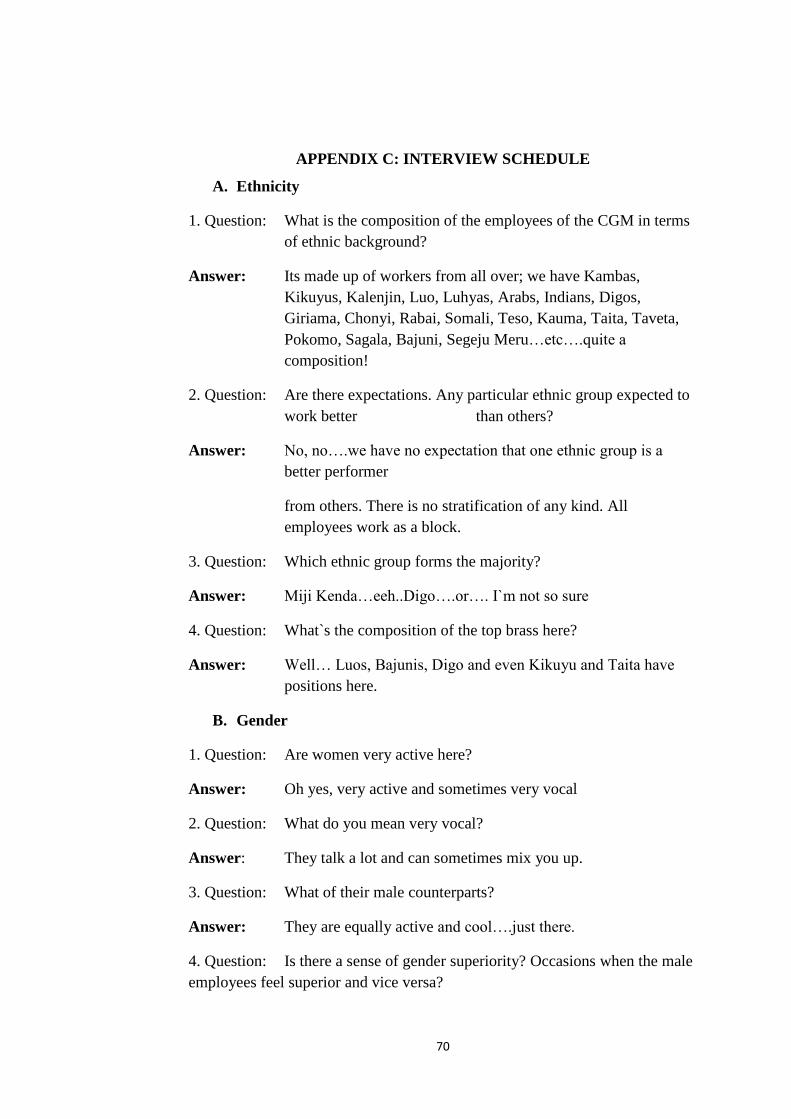
70
APPENDIX C: INTERVIEW SCHEDULE
A. Ethnicity
1. Question: What is the composition of the employees of the CGM in terms
of ethnic background?
Answer: Its made up of workers from all over; we have Kambas,
Kikuyus, Kalenjin, Luo, Luhyas, Arabs, Indians, Digos,
Giriama, Chonyi, Rabai, Somali, Teso, Kauma, Taita, Taveta,
Pokomo, Sagala, Bajuni, Segeju Meru…etc….quite a
composition!
2. Question: Are there expectations. Any particular ethnic group expected to
work better than others?
Answer: No, no….we have no expectation that one ethnic group is a
better performer
from others. There is no stratification of any kind. All
employees work as a block.
3. Question: Which ethnic group forms the majority?
Answer: Miji Kenda…eeh..Digo….or…. I`m not so sure
4. Question: What`s the composition of the top brass here?
Answer: Well… Luos, Bajunis, Digo and even Kikuyu and Taita have
positions here.
B. Gender
1. Question: Are women very active here?
Answer: Oh yes, very active and sometimes very vocal
2. Question: What do you mean very vocal?
Answer: They talk a lot and can sometimes mix you up.
3. Question: What of their male counterparts?
Answer: They are equally active and cool….just there.
4. Question: Is there a sense of gender superiority? Occasions when the male
employees feel superior and vice versa?
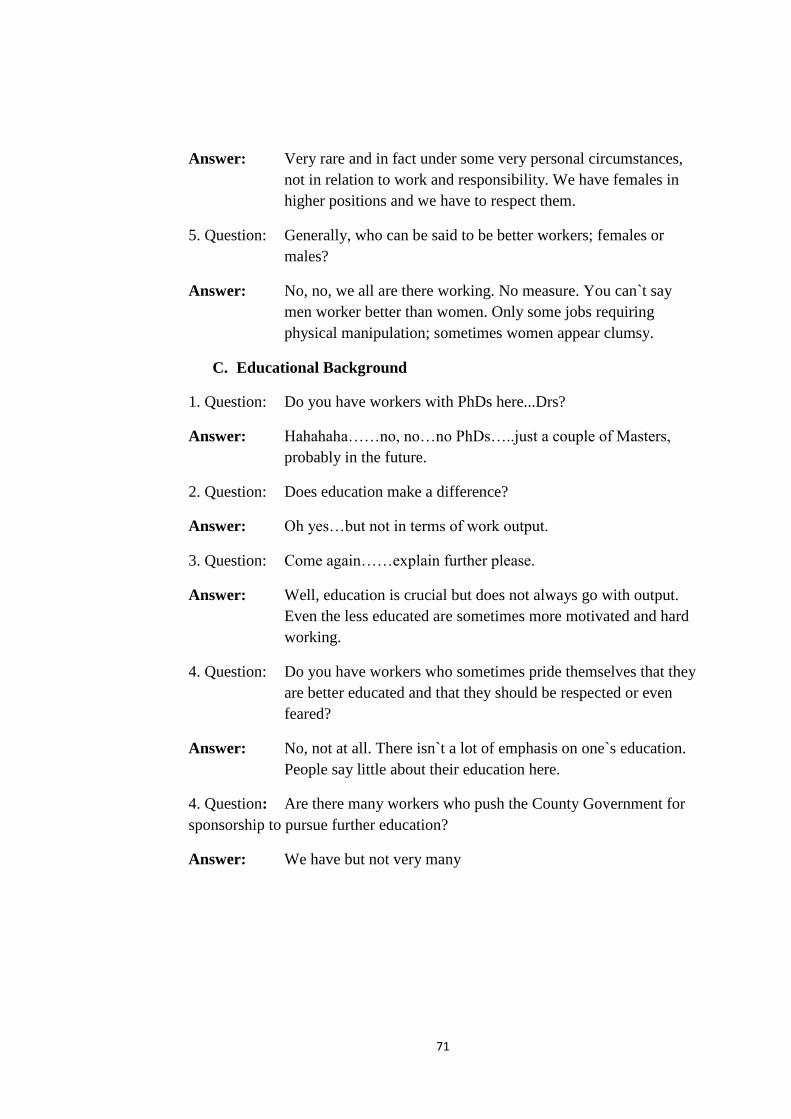
71
Answer: Very rare and in fact under some very personal circumstances,
not in relation to work and responsibility. We have females in
higher positions and we have to respect them.
5. Question: Generally, who can be said to be better workers; females or
males?
Answer: No, no, we all are there working. No measure. You can`t say
men worker better than women. Only some jobs requiring
physical manipulation; sometimes women appear clumsy.
C. Educational Background
1. Question: Do you have workers with PhDs here...Drs?
Answer: Hahahaha……no, no…no PhDs…..just a couple of Masters,
probably in the future.
2. Question: Does education make a difference?
Answer: Oh yes…but not in terms of work output.
3. Question: Come again……explain further please.
Answer: Well, education is crucial but does not always go with output.
Even the less educated are sometimes more motivated and hard
working.
4. Question: Do you have workers who sometimes pride themselves that they
are better educated and that they should be respected or even
feared?
Answer: No, not at all. There isn`t a lot of emphasis on one`s education.
People say little about their education here.
4. Question: Are there many workers who push the County Government for
sponsorship to pursue further education?
Answer: We have but not very many
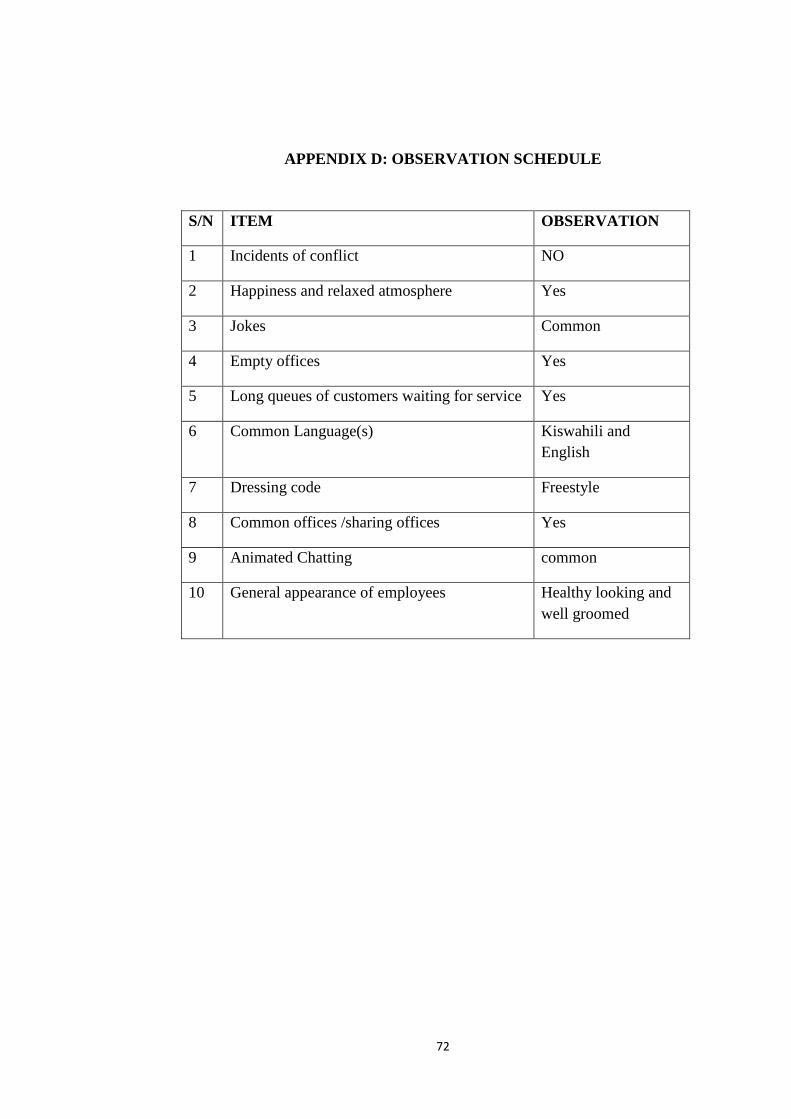
72
APPENDIX D: OBSERVATION SCHEDULE
S/N ITEM OBSERVATION
1 Incidents of conflict NO
2 Happiness and relaxed atmosphere Yes
3 Jokes Common
4 Empty offices Yes
5 Long queues of customers waiting for service Yes
6 Common Language(s) Kiswahili and
English
7 Dressing code Freestyle
8 Common offices /sharing offices Yes
9 Animated Chatting common
10 General appearance of employees Healthy looking and
well groomed
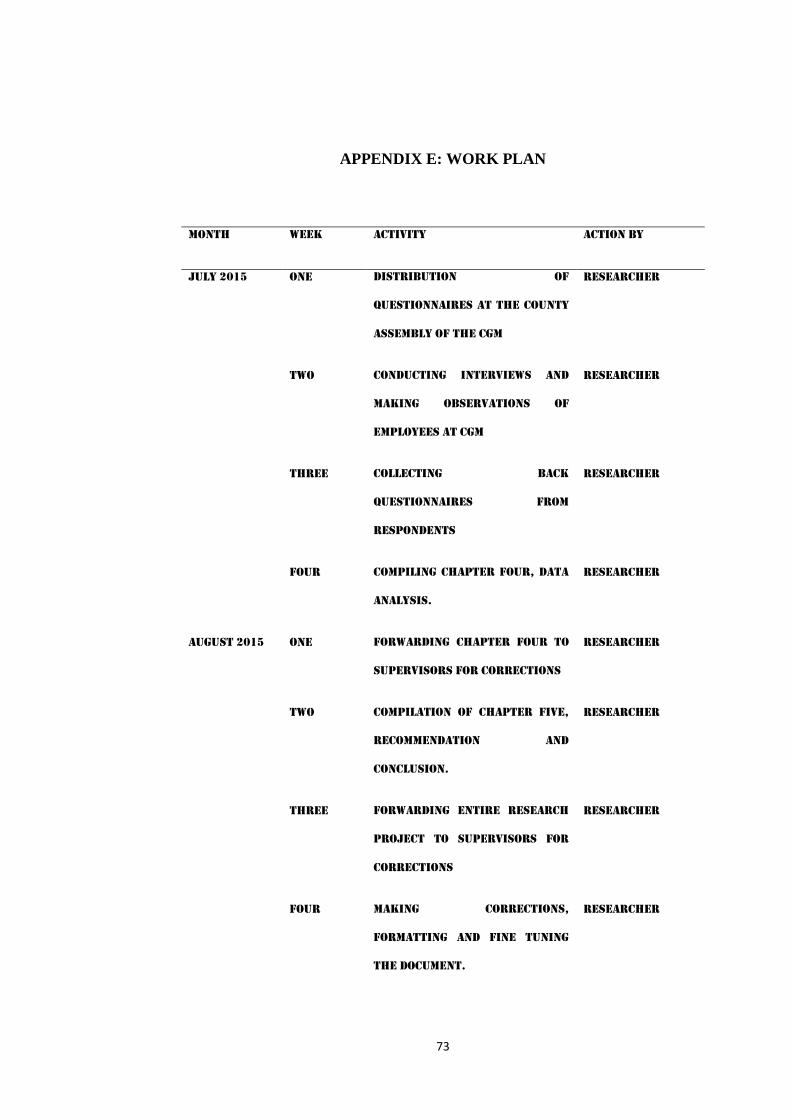
73
APPENDIX E: WORK PLAN
MONTH WEEK ACTIVITY ACTION BY
JULY 2015 ONE Distribution of
questionnaires at the County
Assembly of the CGM
Researcher
TWO Conducting interviews and
making observations of
employees at CGM
Researcher
THREE Collecting back
questionnaires from
respondents
Researcher
FOUR Compiling chapter Four, Data
analysis.
Researcher
AUGUST 2015 ONE Forwarding Chapter Four to
supervisors for corrections
Researcher
TWO Compilation of Chapter Five,
Recommendation and
Conclusion.
Researcher
THREE Forwarding entire Research
Project to Supervisors for
corrections
Researcher
FOUR Making corrections,
formatting and fine tuning
the Document.
Researcher
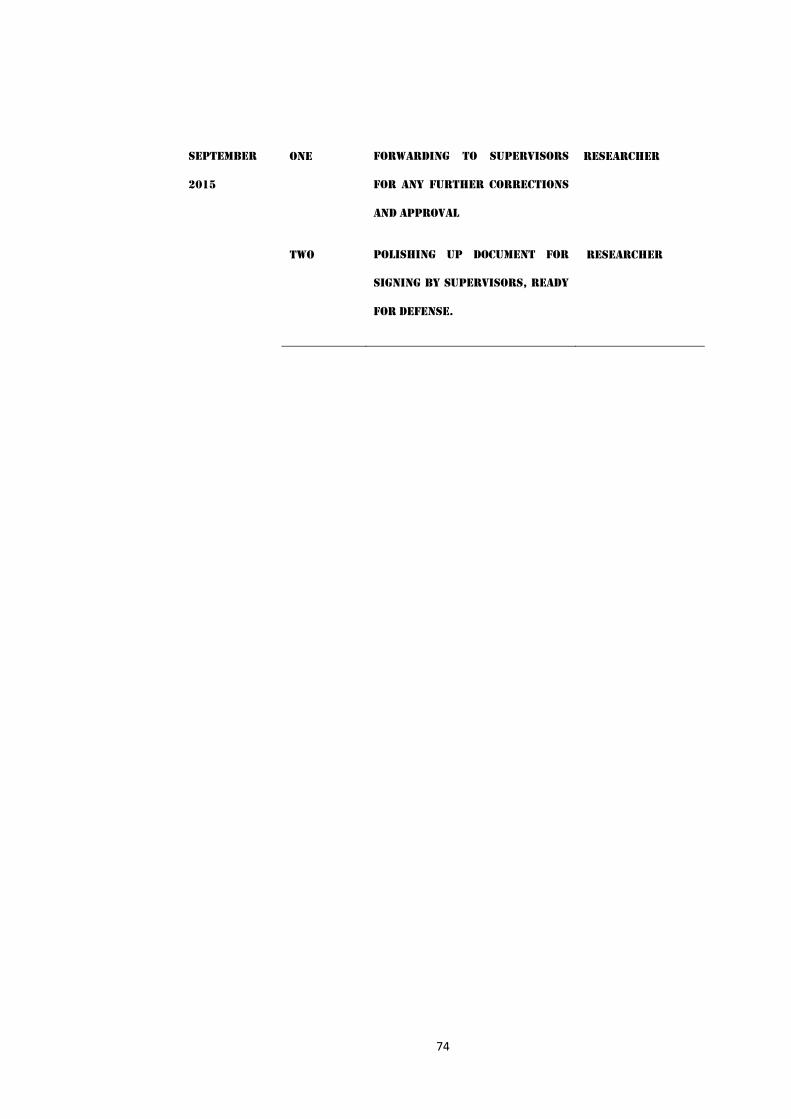
74
SEPTEMBER
2015
ONE Forwarding to Supervisors
for any further corrections
and approval
Researcher
TWO Polishing up Document for
Signing by Supervisors, ready
for Defense.
Researcher
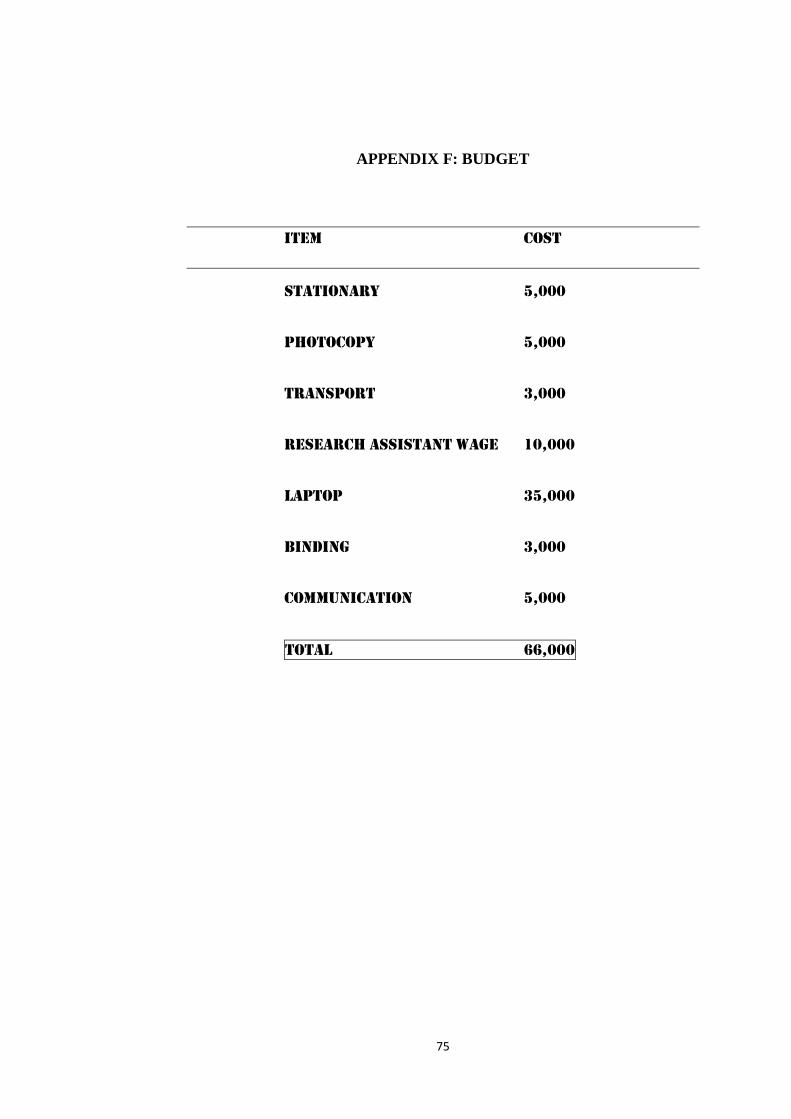
75
APPENDIX F: BUDGET
Item Cost
Stationary 5,000
Photocopy 5,000
Transport 3,000
Research Assistant Wage 10,000
Laptop 35,000
Binding 3,000
Communication 5,000
Total 66,000

76