Cost Benefit Analysis of Kisan Hit Urja Shakti Yojana (KHUSHY)
190
Cost Benefit Analysis of Kisan Hit Urja Shakti Yojana (KHUSHY) Final Report March 2014 Gujarat Urja Vikas Nigam Limited (GUVNL) CONFIDENTIAL
-
Upload
khangminh22 -
Category
Documents
-
view
2 -
download
0
Transcript of Cost Benefit Analysis of Kisan Hit Urja Shakti Yojana (KHUSHY)
Cost Benefit Analysis of Kisan Hit Urja Shakti
Yojana (KHUSHY)
Final Report
March 2014
Gujarat Urja Vikas Nigam Limited (GUVNL)
CONFIDENTIAL


MCB ISA A 0 0
P:\Ahmedabad\AMC\PROJECTS\326672AA01\Documents\Report\GUVNL - KHUSHY - Final Report-V3.docx
10 April 2014
Cost Benefit Analysis of Kisan Hit Urja Shakti Yojana (KHUSH
Final Report
Cost Benefit Analysis of Kisan Hit Urja Shakti Yojana (KHUSHY)
Final Report
March 2014
Gujarat Urja Vikas Nigam Limited (GUVNL)
CONFIDENTIAL
Mott MacDonald, 501 Sakar II, Ellisbridge, Ahmedabad 380 006, Gujarat, India
T +91 (0)79 2657 5550 F +91 (0)79 2657 5558 W www.mottmac.com
Sardar Patel Vidyut Bhavan, Race Course, Vadodara 390007


Cost Benefit Analysis of Kisan Hit Urja Shakti Yojana (KHUSH Final Report
CONFIDENTIAL
MCB/ISA/A/0/0 10 April 2014 P:\Ahmedabad\AMC\PROJECTS\326672AA01\Documents\Report\GUVNL - KHUSHY - Final Report-V3.docx
Revision Date Originator Checker Approver Description Standard00 December, 2013 BD, RR PM PS Draft Report
01 March, 2014 RR PM PS Final Report
02 May, 2014 RR PM PS Final Report
Issue and revision record
This document is issued for the party which commissioned it and for specific purposes connected with the above-captioned project only. It should not be relied upon by any other party or used for any other purpose.
We accept no responsibility for the consequences of this document being relied upon by any other party, or being used for any other purpose, or containing any error or omission which is due to an error or omission in data supplied to us by other parties.
This document contains confidential information and proprietary intellectual property. It should not be shown to other parties without consent from us and from the party which commissioned it.


Cost Benefit Analysis of Kisan Hit Urja Shakti Yojana (KHUSH Final Report
CONFIDENTIAL
MCB/ISA/A/0/0 10 April 2014 P:\Ahmedabad\AMC\PROJECTS\326672AA01\Documents\Report\GUVNL - KHUSHY - Final Report-V3.docx
Chapter Title Page
Executive Summary i
Overall Voltage Level/Quality ______________________________________________________________________ i Line break/Unscheduled Breakdowns _______________________________________________________________ i Incidence of Hooking ___________________________________________________________________________ ii Crop Output & Yield ____________________________________________________________________________ ii Transformer Failure ____________________________________________________________________________ ii Motor Failure ii Motor Starter Failure ___________________________________________________________________________ ii Bore Well iii View on continuation of the scheme _______________________________________________________________ iii PGVCL iii Year-Wise Sent Out and Units Billed _______________________________________________________________ iii Year-Wise Details on % Transformer Failure _________________________________________________________ iii Pay Back Period: Feeders Completed in 2008-09 _____________________________________________________ iii Pay Back Period: Feeders Completed in 2009-10 _____________________________________________________ iv Pay Back Period: Feeders Completed in 2010-11 _____________________________________________________ iv Pay Back Period: Feeders Completed in 2011-12 _____________________________________________________ iv Pay Back Period: Feeders Completed in 2012-13 _____________________________________________________ iv Pay Back Period: All Dedicated Feeders ____________________________________________________________ v Pay Back Period: All Scattered Connections _________________________________________________________ v Pay Back Period: Overall (All Feeders) _____________________________________________________________ v DGVCL v Year-Wise Sent Out and Units Billed _______________________________________________________________ v Year Wise % Theoretical Loss ____________________________________________________________________ vi Year-Wise Details on % Transformer Failure _________________________________________________________ vi Pay Back Period: Dedicated Feeders ______________________________________________________________ vi Pay Back Period: Scattered Feeders _______________________________________________________________ vi Pay Back Period: Overall (All Feeders) _____________________________________________________________ vi UGVCL vii Year-Wise Sent Out and Units Billed (Dedicated Feeders) _____________________________________________ vii Year Wise % Theoretical Loss ___________________________________________________________________ vii Year-Wise Details on % Transformer Failure ________________________________________________________ vii Pay Back Period: Dedicated Feeders _____________________________________________________________ vii Pay Back Period: Scattered Feeders ______________________________________________________________ vii Pay Back Period: Overall (All Feeders) ____________________________________________________________ viii MGVCL viii Year-Wise Sent Out and Units Billed (Dedicated Feeders) _____________________________________________ viii Year Wise % Theoretical Loss ___________________________________________________________________ viii Year-Wise Details on % Transformer Failure ________________________________________________________ viii Pay Back Period: Dedicated Feeders _____________________________________________________________ viii Pay Back Period: Scattered Feeders _______________________________________________________________ ix Pay Back Period: Overall (All Feeders) _____________________________________________________________ ix
1 Introduction 1
Contents

Cost Benefit Analysis of Kisan Hit Urja Shakti Yojana (KHUSH Final Report
CONFIDENTIAL
MCB/ISA/A/0/0 10 April 2014 P:\Ahmedabad\AMC\PROJECTS\326672AA01\Documents\Report\GUVNL - KHUSHY - Final Report-V3.docx
1.1 Mott MacDonald Group ______________________________________________________________ 1 1.1.1 What we do _______________________________________________________________________ 1 1.1.2 Mott MacDonald India________________________________________________________________ 2 1.2 Gujarat Urja Vikas Nigam Limited (GUVNL) _______________________________________________ 3 1.3 The Project ________________________________________________________________________ 4 1.4 Scope of Work _____________________________________________________________________ 4
Part A: Paschim Gujarat Vij Company Limited (PGVCL) 6
2 Profile of PGVCL 7
2.1 Paschim Gujarat Vij Company Limited ___________________________________________________ 7
3 Implementation of Kisan Hit Urja Shakti Yojana (KHUSHY) – PGVCL 8
4 Consumer Perception of Kisan Hit Urja Shakti Yojana (KHUSHY) – PGVCL 15
4.1 Approach and Methodology __________________________________________________________ 15 4.1.1 Sample Design ____________________________________________________________________ 15 4.1.2 Questionnaire Design _______________________________________________________________ 16 4.2 Key Results of Consumer Perception Study - PGVCL ______________________________________ 17 4.2.1 General Information ________________________________________________________________ 17 4.2.2 Level of Agreement on Technical and Financial Aspects ____________________________________ 20 4.2.3 Assessment of Tangible Benefits Accrued after implementation of KHUSHY ____________________ 27 4.2.4 Single Phase Connection and Bore well Details ___________________________________________ 35 4.2.5 View on continuation of the scheme ____________________________________________________ 36
5 Cost-Benefit Analysis of Kisan Hit Urja Shakti Yojana (KHUSHY) – PGVCL 37
5.1 Implementation Details of KHUSHY ____________________________________________________ 38 5.2 Benefits Accrued Under KHUSHY _____________________________________________________ 38 5.2.1 Transmission and Distribution Losses (PGVCL) __________________________________________ 38 5.2.2 Transformer Failures (PGVCL) ________________________________________________________ 40 5.3 Payback Period (PGVCL) ____________________________________________________________ 40 5.3.1 Selection of Baseline Loss/Sent Unit ___________________________________________________ 41 5.3.2 Selection of Cost Realization _________________________________________________________ 41 5.3.3 Cost of Capital ____________________________________________________________________ 41 5.3.4 Savings due to reduction in Transformer Failures _________________________________________ 41 5.4 Pay Back Calculations ______________________________________________________________ 42
Part B: Dakshin Gujarat Vij Company Limited (DGVCL) 45
6 Profile of DGVCL 46
6.1 Dakshin Gujarat Vij Company Limited __________________________________________________ 46
7 Implementation of Kisan Hit Urja Shakti Yojana (KHUSHY) – DGVCL 47
8 Consumer Perception of Kisan Hit Urja Shakti Yojana (KHUSHY) – DGVCL 49

Cost Benefit Analysis of Kisan Hit Urja Shakti Yojana (KHUSH Final Report
CONFIDENTIAL
MCB/ISA/A/0/0 10 April 2014 P:\Ahmedabad\AMC\PROJECTS\326672AA01\Documents\Report\GUVNL - KHUSHY - Final Report-V3.docx
8.1 Approach and Methodology __________________________________________________________ 49 8.1.1 Sample Design ____________________________________________________________________ 49 8.1.2 Questionnaire Design _______________________________________________________________ 50 8.2 Key Results of Consumer Perception Study - DGVCL ______________________________________ 50 8.2.1 General Information ________________________________________________________________ 50 8.2.2 Level of Agreement on Technical and Financial Aspects ____________________________________ 53 8.2.3 Assessment of Tangible Benefits Accrued after implementation of KHUSHY ____________________ 62 8.2.4 Single Phase Connection and Bore well Details ___________________________________________ 69 8.2.5 View on continuation of the scheme ____________________________________________________ 70
9 Cost-Benefit Analysis of Kisan Hit Urja Shakti Yojana (KHUSHY) – DGVCL 71
9.1 Implementation Details of KHUSHY ____________________________________________________ 72 9.2 Benefits Accrued Under KHUSHY _____________________________________________________ 72 9.2.1 Transmission and Distribution Losses (DGVCL) __________________________________________ 72 9.2.2 Transformer Failures (DGVCL) _______________________________________________________ 75 9.3 Payback Period (DGVCL) ____________________________________________________________ 75 9.3.1 Selection of Baseline Loss/Sent Unit ___________________________________________________ 76 9.3.2 Selection of Cost Realization _________________________________________________________ 76 9.3.3 Cost of Capital ____________________________________________________________________ 76 9.3.4 Savings due to reduction in Transformer Failures _________________________________________ 76 9.4 Pay Back Calculations ______________________________________________________________ 77
Part C: Uttar Gujarat Vij Company Limited (UGVCL) 78
10 Profile of UGVCL 79
10.1 Uttar Gujarat Vij Company Limited _____________________________________________________ 79
11 Implementation of Kisan Hit Urja Shakti Yojana (KHUSHY) 80
12 Consumer Perception of Kisan Hit Urja Shakti Yojana (KHUSHY) 82
12.1 Approach and Methodology __________________________________________________________ 82 12.1.1 Sample Design ____________________________________________________________________ 82 12.1.2 Questionnaire Design _______________________________________________________________ 83 12.2 Key Results of Consumer Perception Study - UGVCL ______________________________________ 83 12.2.1 General Information ________________________________________________________________ 84 12.2.2 Level of Agreement on Technical and Financial Aspects ____________________________________ 87 12.2.3 Assessment of Tangible Benefits Accrued after implementation of KHUSHY ____________________ 94 12.2.4 Single Phase Connection and Bore well Details __________________________________________ 101 12.2.5 View on continuation of the scheme ___________________________________________________ 101
13 Cost-Benefit Analysis of Kisan Hit Urja Shakti Yojana (KHUSHY) – UGVCL 103
13.1 Implementation Details of KHUSHY ___________________________________________________ 104 13.2 Benefits Accrued Under KHUSHY ____________________________________________________ 104 13.2.1 Transmission and Distribution Losses (UGVCL) _________________________________________ 104 13.2.2 Transformer Failures (UGVCL) ______________________________________________________ 107

Cost Benefit Analysis of Kisan Hit Urja Shakti Yojana (KHUSH Final Report
CONFIDENTIAL
MCB/ISA/A/0/0 10 April 2014 P:\Ahmedabad\AMC\PROJECTS\326672AA01\Documents\Report\GUVNL - KHUSHY - Final Report-V3.docx
13.3 Payback Period (UGVCL) ___________________________________________________________ 107 13.3.1 Selection of Baseline Loss/Sent Unit __________________________________________________ 108 13.3.2 Selection of Cost Realization ________________________________________________________ 108 13.3.3 Cost of Capital ___________________________________________________________________ 108 13.3.4 Savings due to reduction in Transformer Failures ________________________________________ 108 13.4 Pay Back Calculations _____________________________________________________________ 109
Part D: Madhya Gujarat Vij Company Limited (MGVCL) 110
14 Profile of MGVCL 111
14.1 Madhya Gujarat Vij Company Limited _________________________________________________ 111
15 Implementation of Kisan Hit Urja Shakti Yojana (KHUSHY) – MGVCL 112
16 Consumer Perception of Kisan Hit Urja Shakti Yojana (KHUSHY) – MGVCL 114
16.1 Approach and Methodology _________________________________________________________ 114 16.1.1 Sample Design ___________________________________________________________________ 114 16.1.2 Questionnaire Design ______________________________________________________________ 115 16.2 Key Results of Consumer Perception Study - MGVCL _____________________________________ 115 16.2.1 General Information _______________________________________________________________ 115 16.2.2 Level of Agreement on Technical and Financial Aspects ___________________________________ 118 16.2.3 Assessment of Tangible Benefits Accrued after implementation of KHUSHY ___________________ 125 16.2.4 Single Phase Connection and Bore well Details __________________________________________ 133 16.2.5 View on continuation of the scheme ___________________________________________________ 133
17 Cost-Benefit Analysis of Kisan Hit Urja Shakti Yojana (KHUSHY) – MGVCL 135
17.1 Implementation Details of KHUSHY ___________________________________________________ 136 17.2 Benefits Accrued Under KHUSHY ____________________________________________________ 136 17.2.1 Transmission and Distribution Losses (MGVCL) _________________________________________ 136 17.2.2 Transformer Failures (MGVCL) ______________________________________________________ 139 17.3 Payback Period (MGVCL) __________________________________________________________ 139 17.3.1 Selection of Baseline Loss/Sent Unit __________________________________________________ 140 17.3.2 Selection of Cost Realization ________________________________________________________ 140 17.3.3 Cost of Capital ___________________________________________________________________ 140 17.3.4 Savings due to reduction in Transformer Failures ________________________________________ 140 17.4 Pay Back Calculations _____________________________________________________________ 141
18 Observations & Recommendations 142
18.1 Consumer Perception of KHUSHY ____________________________________________________ 142 18.1.1 Overall Voltage Level/Quality ________________________________________________________ 142 18.1.2 Line break/Unscheduled Breakdowns _________________________________________________ 142 18.1.3 Incidence of Hooking ______________________________________________________________ 142 18.1.4 Crop Output & Yield _______________________________________________________________ 142 18.1.5 Transformer Failure _______________________________________________________________ 142 18.1.6 Motor Failure ____________________________________________________________________ 143 18.1.7 Motor Starter Failure_______________________________________________________________ 143

Cost Benefit Analysis of Kisan Hit Urja Shakti Yojana (KHUSH Final Report
CONFIDENTIAL
MCB/ISA/A/0/0 10 April 2014 P:\Ahmedabad\AMC\PROJECTS\326672AA01\Documents\Report\GUVNL - KHUSHY - Final Report-V3.docx
18.1.8 Bore Well _______________________________________________________________________ 143 18.1.9 View on continuation of the scheme ___________________________________________________ 143 18.2 Estimated Monetary Benefit to Customers ______________________________________________ 144 18.3 Cost Benefit Analysis for DISCOMs ___________________________________________________ 144
Appendices 146
Appendix A. List of Feeders Covered Under KHUSHY _______________________________________________ 147 Appendix B. Feeder Wise Change in Units Billed ___________________________________________________ 154 Appendix C. Feeder-Wise Details on Transformer Failure & Customer Complaints _________________________ 162 Appendix D. Questionnaire ____________________________________________________________________ 169

Cost Benefit Analysis of Kisan Hit Urja Shakti Yojana (KHUSH Final Report
CONFIDENTIAL
i MCB/ISA/A/0/0 10 April 2014 P:\Ahmedabad\AMC\PROJECTS\326672AA01\Documents\Report\GUVNL - KHUSHY - Final Report-V3.docx
The Government of Gujarat - through Kisan Hit Urja Shakti Yojana (KHUSHY) scheme - has been
implementing High Voltage Distribution System (HVDS) in place of Low Voltage Distribution System
(LVDS) on identified agricultural feeders. Approximately 65,000 No. of Agricultural consumers are
expected to accrue benefits under this scheme. In this context, GUVNL had engaged the service of Mott
MacDonald Private Limited to conduct a cost benefit analysis (CBA) and agricultural consumer survey to
assess tangible and intangible benefits of KHUSHY scheme.
The KHUSHY scheme has been implemented across all Distribution companies viz. PGVCL, DGVCL,
MGVCL and UGVCL. In total 174 feeders across all the distribution companies have been converted under
this scheme into HVDS. PGVCL and the agricultural consumers have benefitted immensely under this
scheme wherein 157 feeders have been converted into HVDS. All agricultural customers under these
feeders have been allotted dedicated transformers for their connections.
The consumer perception survey had to be done for a sample size of 5% of the total benefitted consumers
which were expected to be around 65000 Nos with an objective to assess the benefits to the consumer
because of the implementation of KHUSHY (HVDS) scheme. The survey has been conducted for 3265
HVDS customers. The distribution of the sample among the distribution companies and further at circle
and feeder level has been done on the basis of the actual conversion of feeders under KHUSHY (HVDS).
The discom wise sample size is as given in the below table
Discom Circle Division Sub-Division No. of Feeders No. of Beneficiaries
PGVCL 10 17 24 29 2865
UGVCL 2 4 5 6 151
DGVCL 3 4 4 5 149
MGVCL 1 1 1 2 100
TOTAL 16 26 34 42 3265
The key observations of the customer perception study for PGVCL are as under
Overall Voltage Level/Quality
There has been a major improvement in the voltage level/quality after the implementation of KHUSHY. The
continuity of power supply would not be effective in absence of low or constantly fluctuating voltage. The
effectiveness of the implementation of the scheme on this parameter is crucial and has led to improve
satisfaction levels of the customers.
Line break/Unscheduled Breakdowns
The incidences of line breaks and unscheduled shutdowns have also drastically decreased after
implementation of KHUSHY.
Executive Summary

Cost Benefit Analysis of Kisan Hit Urja Shakti Yojana (KHUSH Final Report
CONFIDENTIAL
ii MCB/ISA/A/0/0 10 April 2014 P:\Ahmedabad\AMC\PROJECTS\326672AA01\Documents\Report\GUVNL - KHUSHY - Final Report-V3.docx
Incidence of Hooking
Theft and pilferage account for a substantial part of the high transmission and distribution losses. One of
the objectives of the scheme was to minimize these losses. The various steps and technical interventions
during the scheme have made it cumbersome for the customers indulge in such activities.
Crop Output & Yield
The primary objective of the project was to provide consumers with uninterrupted and quality Power related
benefits. The Crop output & yield are directly dependent on the monsoon & weather conditions. The
electricity has little impact on the crop yield especially in cases where there is levels of underground water
are low.
Transformer Failure
The transformer failures have decreased drastically after the implementation of KHUSHY. Majority of the
surveyed customers strongly agree or agree to the statement that the transformer failures have reduced
after the implementation of the scheme.
The survey results show that majority of the customers experienced transformer failures around 3-5 times
while other few experienced it more than 5 times. After the implementation of KHUSHY all the surveyed
customers experienced transformer failure in the bracket of 0-2 times. The results hence show that there
has been a considerable decrease in transformer failure after the implementation of KHUSHY.
The results also show that there has been a considerable decrease in average days loss per transformer
failure after the implementation of KHUSHY.
Motor Failure
The survey results show that a major portion of the customers experienced motor failures around 3-5 times
while other few experienced it more than 5 times. After the implementation of KHUSHY all the surveyed
customers experienced motor failures in the bracket of 0-2 times. The results hence show that there has
been a considerable decrease in motor failure after the implementation of KHUSHY.
The results also show that there has been a considerable decrease in average days loss per motor failure
after the implementation of KHUSHY.
The results hence show that there has been a considerable decrease in expense incurred on motor
failures after the implementation of KHUSHY.
Motor Starter Failure
The survey results show that a major portion of the customers experienced motor starter failures around 2-
3 times/year while other few experienced it more than 3 times. After the implementation of KHUSHY all the
Cost Benefit Analysis of Kisan Hit Urja Shakti Yojana (KHUSH Final Report
CONFIDENTIAL
iii MCB/ISA/A/0/0 10 April 2014 P:\Ahmedabad\AMC\PROJECTS\326672AA01\Documents\Report\GUVNL - KHUSHY - Final Report-V3.docx
surveyed customers experienced motor starter failure in the bracket of 0-1 times. The results hence show
that there has been a considerable decrease in motor starter failure after the implementation of KHUSHY.
The results also show that there has been a considerable decrease in average days loss per motor starter
failure after the implementation of KHUSHY.
The results also show that there has been a considerable decrease in expense incurred on motor starter
failures after the implementation of KHUSHY.
Bore Well
The operating hours of the bore well basically depends upon three variables including the monsoon, the
levels of ground water and availability of electricity. The electricity issue have been solved to a large extent
after the implementation of the scheme. The other two variables remaining unpredictable and largely
varying from location to location there, no major increase in the operating hours of the bore wells has been
observed.
View on continuation of the scheme
Out of the 3865 beneficiaries surveyed, 99% of them are happy & satisfied with the implementation of the
KHUSHY Scheme and have expressed their interest and willingness in support and continuation of the
scheme in other parts of the state.
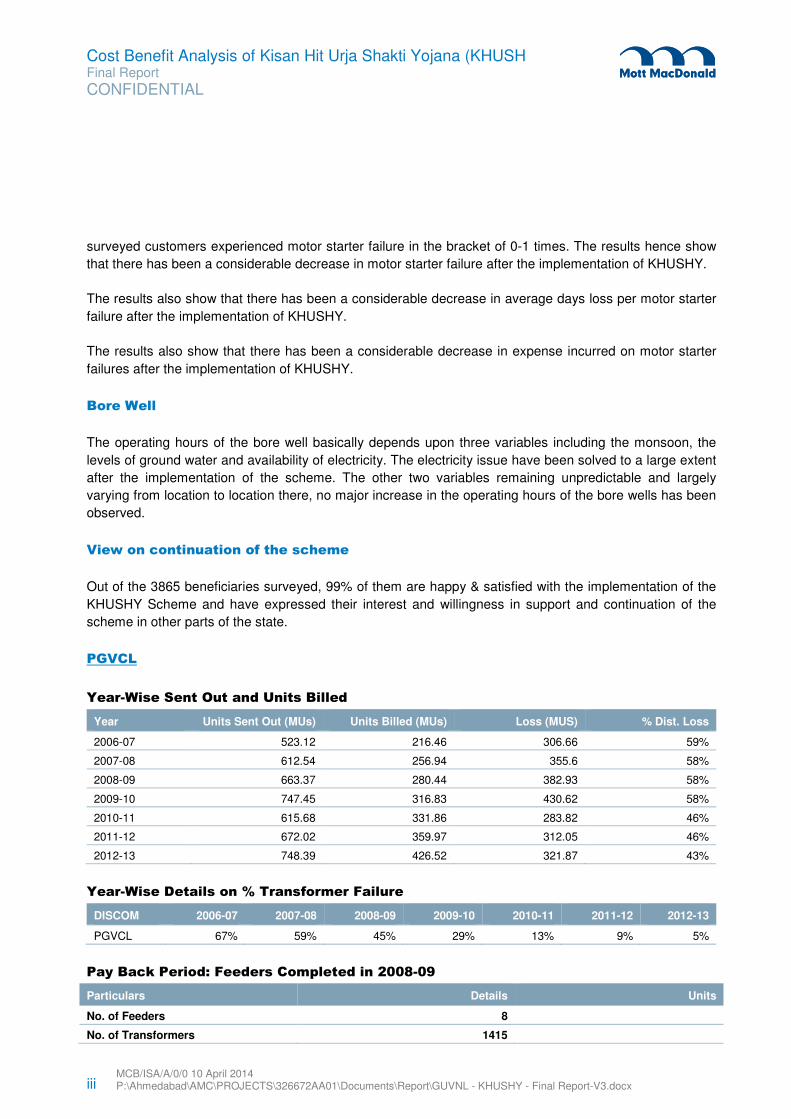
PGVCL
Year-Wise Sent Out and Units Billed
Year Units Sent Out (MUs) Units Billed (MUs) Loss (MUS) % Dist. Loss
2006-07 523.12 216.46 306.66 59%
2007-08 612.54 256.94 355.6 58%
2008-09 663.37 280.44 382.93 58%
2009-10 747.45 316.83 430.62 58%
2010-11 615.68 331.86 283.82 46%
2011-12 672.02 359.97 312.05 46%
2012-13 748.39 426.52 321.87 43%
Year-Wise Details on % Transformer Failure
DISCOM 2006-07 2007-08 2008-09 2009-10 2010-11 2011-12 2012-13
PGVCL 67% 59% 45% 29% 13% 9% 5%
Pay Back Period: Feeders Completed in 2008-09
Particulars Details Units
No. of Feeders 8
No. of Transformers 1415

Cost Benefit Analysis of Kisan Hit Urja Shakti Yojana (KHUSH Final Report
CONFIDENTIAL
iv MCB/ISA/A/0/0 10 April 2014 P:\Ahmedabad\AMC\PROJECTS\326672AA01\Documents\Report\GUVNL - KHUSHY - Final Report-V3.docx
Particulars Details Units
Total Expenditure 13.6 INR Crores
Base Year (1st Year) 2009-10
Payback Period 2.808 Years
Payback Year 2011-12
Pay Back Period: Feeders Completed in 2009-10
Particulars Details Units
No. of Feeders 8
No. of Transformers 1444
Total Expenditure 16.55 INR Crores
Base Year (1st Year) 2010-11
Payback Period 2.78 Years
Payback Year 2012-13
Pay Back Period: Feeders Completed in 2010-11
Particulars Details Units
No. of Feeders 58
No. of Transformers 11412
Total Expenditure 146.10 INR Crores
Base Year (1st Year) 2011-12
Payback Period 6.22 Years
Payback Year 2017-18
Pay Back Period: Feeders Completed in 2011-12
Particulars Details Units
No. of Feeders 16
No. of Transformers 2080
Total Expenditure 25.09 INR Crores
Base Year (1st Year) 2012-13
Payback Period 5.288 Years
Payback Year 2016-17
Pay Back Period: Feeders Completed in 2012-13
Particulars Details Units
No. of Feeders 71
No. of Transformers 9719
Total Expenditure 105.53 INR Crores
Base Year (1st Year) 2013-14
Payback Period 4.22 Years
Payback Year 2015-16

Cost Benefit Analysis of Kisan Hit Urja Shakti Yojana (KHUSH Final Report
CONFIDENTIAL
v MCB/ISA/A/0/0 10 April 2014 P:\Ahmedabad\AMC\PROJECTS\326672AA01\Documents\Report\GUVNL - KHUSHY - Final Report-V3.docx
Pay Back Period: All Dedicated Feeders
Particulars Details Units
No. of Feeders 161
No. of Transformers 26070
Total Expenditure 306.88 INR Crores
Base Year (1st Year) 2013-14
Payback Period 3.46 Years
Payback Year 2016-17
Pay Back Period: All Scattered Connections
Particulars Details Units
No. of Feeders -
No. of Transformers 10583
Total Expenditure 149.71 INR Crores
Base Year (1st Year) 2013-14
Payback Period 8.77 Years
Payback Year 2018-19
Pay Back Period: Overall (All Feeders)
Particulars Details Units
No. of Feeders 161+Scattered
No. of Transformers 36653
Total Expenditure 456.59 INR Crores
Base Year (1st Year) 2013-14
Payback Period 5.47 Years
Payback Year 2018-19
DGVCL
Year-Wise Sent Out and Units Billed
Year Units Sent Out (MUs) Units Billed (MUs) Loss (MUS) % Dist. Loss
2006-07 14.23 6.80 7.43 52%
2007-08 5.42 3.58 1.84 34%
2008-09 11.48 6.28 5.20 45%
2009-10 14.33 7.39 6.94 48%
2010-11 19.40 10.81 8.59 44%
2011-12 24.68 15.53 9.15 37%
2012-13 21.54 16.46 5.07 24%

Cost Benefit Analysis of Kisan Hit Urja Shakti Yojana (KHUSH Final Report
CONFIDENTIAL
vi MCB/ISA/A/0/0 10 April 2014 P:\Ahmedabad\AMC\PROJECTS\326672AA01\Documents\Report\GUVNL - KHUSHY - Final Report-V3.docx
Year Wise % Theoretical Loss
Discom 2006-07 2007-08 2008-09 2009-10 2010-11 2011-12 2012-13
DGVCL
Theoretical Loss (%)
14 88 74 70 63 61 61
Year-Wise Details on % Transformer Failure
DISCOM 2006-07 2007-08 2008-09 2009-10 2010-11 2011-12 2012-13
DGVCL 39% 12% 31% 20% 20% 17% 6%
Pay Back Period: Dedicated Feeders
Particulars Units
No. of Feeders 6
No. of Transformers 283
Total Expenditure 6.22 INR Crores
Base Year (1st Year) 2013-14
Payback Period 15.48 Years
Payback Year 2028-29
Pay Back Period: Scattered Feeders
Particulars Units
No. of Feeders -
No. of Transformers 724
Total Expenditure 4.38 INR Crores
Base Year (1st Year) 2013-14
Payback Period 53.11 Years
Payback Year 2065-66
Pay Back Period: Overall (All Feeders)
Particulars Units
No. of Feeders -
No. of Transformers 1007
Total Expenditure 10.60 INR Crores
Base Year (1st Year) 2013-14
Payback Period 22.16 Years
Payback Year 2034-35

Cost Benefit Analysis of Kisan Hit Urja Shakti Yojana (KHUSH Final Report
CONFIDENTIAL
vii MCB/ISA/A/0/0 10 April 2014 P:\Ahmedabad\AMC\PROJECTS\326672AA01\Documents\Report\GUVNL - KHUSHY - Final Report-V3.docx
UGVCL
Year-Wise Sent Out and Units Billed (Dedicated Feeders)
Year Units Sent Out (MUs) Units Billed (MUs) Loss (MUS) % Dist. Loss
2006-07 14.32 12.94 1.38 10%
2007-08 17.88 14.2 3.68 21%
2008-09 18.42 16.28 2.14 12%
2009-10 23.51 19.43 4.08 17%
2010-11 20.75 20.05 0.7 3%
2011-12 21.67 19.66 2.01 9%
2012-13 24.98 20.71 4.27 17%
Year Wise % Theoretical Loss
Discom 2006-07 2007-08 2008-09 2009-10 2010-11 2011-12 2012-13
UGVCL
Theoretical Loss (%)
55% 54% 24% 31% 53% 35% 31%
Year-Wise Details on % Transformer Failure
DISCOM 2006-07 2007-08 2008-09 2009-10 2010-11 2011-12 2012-13
UGVCL 14% 16% 9% 5% 5% 7% 4%
Pay Back Period: Dedicated Feeders
Particulars Units
No. of Feeders 7
No. of Transformers 477
Total Expenditure 4.26 INR Crores
Base Year (1st Year) 2013-14
Payback Period 14.93 Years
Payback Year 2027-28
Pay Back Period: Scattered Feeders
Particulars Units
No. of Feeders -
No. of Transformers 1977
Total Expenditure 31.52 INR Crores
Base Year (1st Year) 2013-14
Payback Period 18.76 Years
Payback Year 2031-32
Cost Benefit Analysis of Kisan Hit Urja Shakti Yojana (KHUSH Final Report
CONFIDENTIAL
viii
MCB/ISA/A/0/0 10 April 2014 P:\Ahmedabad\AMC\PROJECTS\326672AA01\Documents\Report\GUVNL - KHUSHY - Final Report-V3.docx
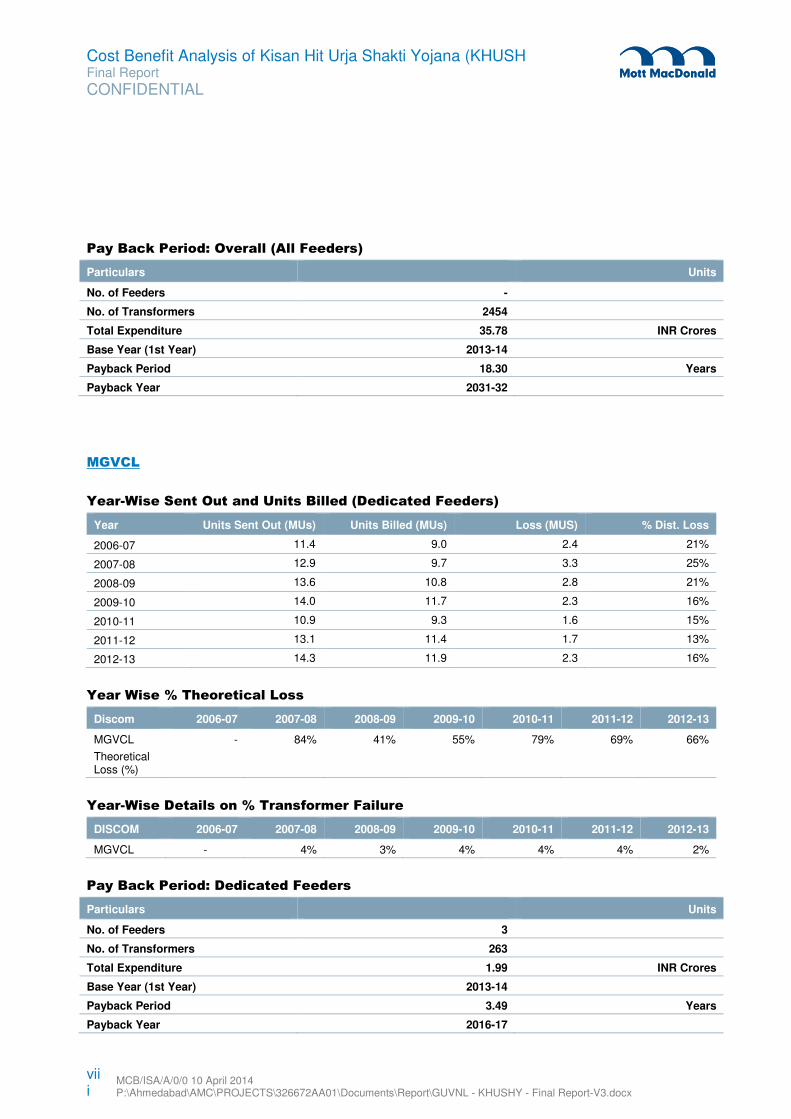
Pay Back Period: Overall (All Feeders)
Particulars Units
No. of Feeders -
No. of Transformers 2454
Total Expenditure 35.78 INR Crores
Base Year (1st Year) 2013-14
Payback Period 18.30 Years
Payback Year 2031-32
MGVCL
Year-Wise Sent Out and Units Billed (Dedicated Feeders)
Year Units Sent Out (MUs) Units Billed (MUs) Loss (MUS) % Dist. Loss
2006-07 11.4 9.0 2.4 21%
2007-08 12.9 9.7 3.3 25%
2008-09 13.6 10.8 2.8 21%
2009-10 14.0 11.7 2.3 16%
2010-11 10.9 9.3 1.6 15%
2011-12 13.1 11.4 1.7 13%
2012-13 14.3 11.9 2.3 16%
Year Wise % Theoretical Loss
Discom 2006-07 2007-08 2008-09 2009-10 2010-11 2011-12 2012-13
MGVCL
Theoretical Loss (%)
- 84% 41% 55% 79% 69% 66%
Year-Wise Details on % Transformer Failure
DISCOM 2006-07 2007-08 2008-09 2009-10 2010-11 2011-12 2012-13
MGVCL - 4% 3% 4% 4% 4% 2%
Pay Back Period: Dedicated Feeders
Particulars Units
No. of Feeders 3
No. of Transformers 263
Total Expenditure 1.99 INR Crores
Base Year (1st Year) 2013-14
Payback Period 3.49 Years
Payback Year 2016-17

Cost Benefit Analysis of Kisan Hit Urja Shakti Yojana (KHUSH Final Report
CONFIDENTIAL
ix MCB/ISA/A/0/0 10 April 2014 P:\Ahmedabad\AMC\PROJECTS\326672AA01\Documents\Report\GUVNL - KHUSHY - Final Report-V3.docx
Pay Back Period: Scattered Feeders
Particulars Units
No. of Feeders -
No. of Transformers 2516
Total Expenditure 27.24 INR Crores
Base Year (1st Year) 2013-14
Payback Period 9.50 Years
Payback Year 2022-23
Pay Back Period: Overall (All Feeders)
Particulars Units
No. of Feeders -
No. of Transformers 2910
Total Expenditure 29.29 INR Crores
Base Year (1st Year) 2013-14
Payback Period 8.30 Years
Payback Year -

Cost Benefit Analysis of Kisan Hit Urja Shakti Yojana (KHUSH Final Report
CONFIDENTIAL
MCB/ISA/A/0/0 10 April 2014 P:\Ahmedabad\AMC\PROJECTS\326672AA01\Documents\Report\GUVNL - KHUSHY - Final Report-V3.docx MCB/ISA/A/0/0 10 April 2014 P:\Ahmedabad\AMC\PROJECTS\326672AA01\Documents\Report\GUVNL - KHUSHY - Final Report-V3.docx
1
1.1 Mott MacDonald Group
Mott MacDonald is a U.K. based uniquely diverse £1 billion global consultancy, delivering leading-edge
solutions for public and private sector clients across 12 core business areas. As one of the world’s largest
employee-owned companies with more than 14,000 staff, the company has principal offices in nearly
50 countries and projects in 140.
Our breadth of skills, sectors, services and global reach makes us uniquely placed to bring our customers:
� Holistic, innovative thinking
� Global experience with local insight
� World-expert practitioners
� Multi-sector perspective
1.1.1 What we do
We work with our customers and use our worldwide resources and experience to:
� Plan, design, procure and deliver projects on any scale
� Provide management consultancy built on technical know-how
� Help shape and implement development policies and programmes
� Advance sustainability and promote the wellbeing of the planet
1.1.1.1 Our service to customers
By staying closely attuned to our customers’ needs and aspirations, we seek to keep ahead of the game,
proactively identifying new service requirements and gearing up to meet them. We understand what our
customer’s need, what’s required to satisfy those needs and we get on with it – adding real value in the
process by saving them as much money and time as possible without ever compromising on quality. We
take pride in every commission, no matter the size.
1.1.1.2 Sustainable solutions
We are committed to working in partnership with our customers and supply chains to incorporate
sustainable solutions into our projects. We are experts in sustainable design, construction and
management, seeking to include sustainability as a driver at the most critical conceptual, planning and
feasibility stages of all our projects – addressing the whole-life costs and impacts from a truly
multidisciplinary viewpoint.
We are also acting to reduce our own impact and have committed to an active programme to make
significant year on year reductions in our per capita carbon emissions.
1 Introduction

Cost Benefit Analysis of Kisan Hit Urja Shakti Yojana (KHUSH Final Report
CONFIDENTIAL
MCB/ISA/A/0/0 10 April 2014 P:\Ahmedabad\AMC\PROJECTS\326672AA01\Documents\Report\GUVNL - KHUSHY - Final Report-V3.docx MCB/ISA/A/0/0 10 April 2014 P:\Ahmedabad\AMC\PROJECTS\326672AA01\Documents\Report\GUVNL - KHUSHY - Final Report-V3.docx
2
1.1.1.3 Innovation
We pride ourselves in finding ways to solve existing challenges and tackle new ones. The value of our
innovation can be measured by the prestigious awards our people and projects win – over 200 in the last
three years.
1.1.1.4 Our people
Our principal differentiator is the quality of our staff. Our success is fuelled by their dedication, enthusiasm
and ingenuity. Many of our engineers, environmentalists, planners, economists, cost consultants; project
managers, safety experts, IT specialists, educationalists, healthcare advisors and management
consultants are recognised as innovators or world authorities in their fields. Understanding that to work
with the best we must be the best, we promote professional excellence and knowledge management,
which is why continuous learning and skills improvement are ingrained in our company culture.
1.1.1.5 Community spirit
As a multinational company with a global reach, we recognise our obligation to make a positive
contribution to communities in which we work. At a corporate level we engage and support local
communities sponsoring a number of charity projects each year. We also encourage and support our staffs
who invest enormous time and energy in a range of charitable, educational, disaster relief and
development work around the world.
1.1.1.6 Global presence
With major offices and centres of excellence across the globe, we bring our skills and resources directly to
our customers, wherever they or their projects are based. Each office has in-depth knowledge and
understanding of local conditions and practices, backed by our worldwide resources – enabling us to offer
services around the clock, around the world.
1.1.2 Mott MacDonald India
Mott MacDonald in India (hereinafter referred to as MM) has over 1600 staff engaged in planning,
developing and delivering projects across many sectors – from energy, industry, water and environment to
transport, buildings, urban infrastructure and social development. We are making our mark in many areas
of business and industry, serving not only the burgeoning domestic demand but also a wider customer
base in core markets such as industry, infrastructure and health.
1.1.2.1 Our Sectors
MM activities are focussed primarily on the growing need for physical and social infrastructure and the
creation of wealth and employment through manufacturing and the more efficient development of its
resources. These are extraordinarily diverse, ranging across:

Cost Benefit Analysis of Kisan Hit Urja Shakti Yojana (KHUSH Final Report
CONFIDENTIAL
MCB/ISA/A/0/0 10 April 2014 P:\Ahmedabad\AMC\PROJECTS\326672AA01\Documents\Report\GUVNL - KHUSHY - Final Report-V3.docx MCB/ISA/A/0/0 10 April 2014 P:\Ahmedabad\AMC\PROJECTS\326672AA01\Documents\Report\GUVNL - KHUSHY - Final Report-V3.docx
3
� Buildings
� Communications
� Energy
� Industry and industrial development
� Social development including health and
education
� Transportation infrastructure
� Urban development
� Water and environment
In all these markets, we address business and developmental issues as well as engineering. We aim to
serve the broader needs of our clients to create successful and sustainable projects. We bring to the
market an almost unique combination of management and engineering capability, both local and
worldwide, delivered in India with the maximum use of Indian and international resources.
Our Indian business has exceptional expertise in the industry sector, especially in chemicals,
pharmaceuticals and textiles where we lead the field in business case planning, business
conceptualisation, strategy, financial and demand modelling, basic and detailed engineering, project
management, procurement and validation services for some of the world’s largest chemical and
pharmaceutical manufacturers.
We are also one of the leading transportation and urban infrastructure service providers in India. Our
services in metros are well recognised and we are proud to be associated with Delhi Metro. We are
providing design work on almost 40% of the transport system all over Delhi including a 22km stretch from
the heart of Delhi to the city’s South-east border.
Our Indian experts are also enhancing project delivery for projects globally in key areas such as oil and
gas, water, power, pharmaceuticals, roads and highways, airports and buildings, health and education.
1.2 Gujarat Urja Vikas Nigam Limited (GUVNL)
Gujarat Urja Vikas Nigam Limited (GUVNL) is engaged in the business of bulk purchase and sale of
electricity, Supervision, Co-ordination and facilitation of the activities of its six Subsidiary Companies
including
� GSECL - Engaged in the business of Generation of Electricity.
� GETCO - Engaged in the business of Transmission of Electricity.
� UGVCL - Engaged in the business of Distribution of Electricity in the Northern area of Gujarat.
� DGVCL - Engaged in the business of Distribution of Electricity in the Southern area of Gujarat.
� MGVCL - Engaged in the business of Distribution of Electricity in the Central area of Gujarat.
� PGVCL - Engaged in the business of Distribution of Electricity in the Western area of Gujarat.
One of the basic functions of the Company includes Co-ordination of the activities of its subsidiaries,
business, works to determine their economic and financial objectives/targets and to review, control, guide

Cost Benefit Analysis of Kisan Hit Urja Shakti Yojana (KHUSH Final Report
CONFIDENTIAL
MCB/ISA/A/0/0 10 April 2014 P:\Ahmedabad\AMC\PROJECTS\326672AA01\Documents\Report\GUVNL - KHUSHY - Final Report-V3.docx MCB/ISA/A/0/0 10 April 2014 P:\Ahmedabad\AMC\PROJECTS\326672AA01\Documents\Report\GUVNL - KHUSHY - Final Report-V3.docx
4
and direct their performance with a view to secure optimum utilization of all resources placed at their
disposal.
1.3 The Project
The Government of Gujarat - through Kisan Hit Urja Shakti Yojana (KHUSHY) scheme - has been
implementing High Voltage Distribution System (HVDS) in place of Low Voltage Distribution System
(LVDS) on identified agricultural feeders. In HVDS, the 11 kV lines are extended nearer to the loads as
much as possible and small size Distribution transformers (e.g. 10, 16 & 25 kVA) are erected and service
connection is released to the consumer through a short LT lines preferably through insulated overhead
cables known as Aerial Bunched Cable (ABC)/PVC Cable. HVDS entails benefits both to DISCOM and
consumer.
Till date, all four DISCOMs (viz. PGVCL, UGVCL, MGVCL and DGVCL) put together have invested around
Rs. 550 Crore under this scheme. The utilities and approximately 65,000 No. of Agricultural consumers are
expected to accrue benefits against this capital expenditure. In this context, GUVNL has engaged the
service of Mott MacDonald Private Limited to conduct a cost benefit analysis (CBA) and agricultural
consumer survey to assess tangible and intangible benefits of KHUSHY scheme.
1.4 Scope of Work
1. Collect circle-wise actual annual costs incurred for conversion of LVDS to HVDS in identified Areas /
feeders across all four DISCOMs of Gujarat:
a. Aggregate capital expenditure covering new equipment / material (e.g. distribution transformer,
conductor, cross arm etc.) and installation & commissioning;
b. Repair and maintenance costs for LVDS and HVDS (e.g. repairing of DTR in case of failure);
c. Interest costs (including interest during construction) on loans (if any)
d. Any other significant costs incurred by utilities which has impact on cost benefit analysis
2. Estimate tangible (quantitative) benefits accrued to DISCOMs due to conversion of LVDS to HVDS.
Consultant will estimate following benefits in monetary terms (to the extent possible and taking
reasonable assumptions, wherever needed):
a. Reduction in AT&C losses
b. Reduction in distribution transformer failure rate
c. Comparison of System interruptions
d. Comparison of Technical Losses (Theoretical Losses)
e. Comparison of per HP sent out units
f. Comparison of Average Ampere Loading on feeders
g. Reduction in greenhouse gas emission due to reduction in AT&C losses.

Cost Benefit Analysis of Kisan Hit Urja Shakti Yojana (KHUSH Final Report
CONFIDENTIAL
MCB/ISA/A/0/0 10 April 2014 P:\Ahmedabad\AMC\PROJECTS\326672AA01\Documents\Report\GUVNL - KHUSHY - Final Report-V3.docx MCB/ISA/A/0/0 10 April 2014 P:\Ahmedabad\AMC\PROJECTS\326672AA01\Documents\Report\GUVNL - KHUSHY - Final Report-V3.docx
5
3. Identify and list down intangible (qualitative) benefits to utilities and consumers due to conversion of
LVDS to HVDS.
4. Conduct a consumer perception survey of agriculture consumers {for a specific sample size
approximately 5% of total benefited consumers (approximately 65,000 No.) to assess the benefits to the
consumer due to implementation of KHUSHY (HVDS) scheme.
5. Develop a MS Excel based model for assessing total costs; total benefits and overall cost benefit
analysis. (to be submitted to GUVNL with all the calculation formulas)
6. Prepare a report covering cost benefit analysis and outcome of the consumer survey.
7. Verification of data and information provided by GUVNL, DISCOMs and other organization (if any) for
ascertaining its correctness and accuracy.
8. Representing GUVNL before the Govt. of Gujarat or its agencies, Gujarat electricity Regulatory
Commission, any statutory or regulatory body or any public forum for sharing of the results of this study.

Cost Benefit Analysis of Kisan Hit Urja Shakti Yojana (KHUSH Final Report
CONFIDENTIAL
MCB/ISA/A/0/0 10 April 2014 P:\Ahmedabad\AMC\PROJECTS\326672AA01\Documents\Report\GUVNL - KHUSHY - Final Report-V3.docx MCB/ISA/A/0/0 10 April 2014 P:\Ahmedabad\AMC\PROJECTS\326672AA01\Documents\Report\GUVNL - KHUSHY - Final Report-V3.docx
6
Part A: Paschim Gujarat Vij Company Limited (PGVCL)

Cost Benefit Analysis of Kisan Hit Urja Shakti Yojana (KHUSH Final Report
CONFIDENTIAL
MCB/ISA/A/0/0 10 April 2014 P:\Ahmedabad\AMC\PROJECTS\326672AA01\Documents\Report\GUVNL - KHUSHY - Final Report-V3.docx MCB/ISA/A/0/0 10 April 2014 P:\Ahmedabad\AMC\PROJECTS\326672AA01\Documents\Report\GUVNL - KHUSHY - Final Report-V3.docx
7
2.1 Paschim Gujarat Vij Company Limited
PGVCL was incorporated on
15th September, 2003 with
certificate of business w.e.f.
15th October, 2003.
Commercial operation of
company started on 1st April
2005. PGVCL is feeding
electricity in 8 districts of
Gujarat namely Rajkot,
Jamnagar, Junagadh,
Porbandar, Bhuj, Bhavnagar,
Surendranagar and Amreli
covering total 83 Talukas. For
better administration and
consumers' conveniences, administrative area of company is divided into 11 circles out of which 6 circles
are under direct control of Corporate Office, 4 circles are under the control of Bhavnagar Zonal Office and
1 circle under the control of Bhuj Zonal Office. PGVCL caters to almost 48,61,565 customers. The areas
covered by UGVCL are as depicted in the figure. The basic details of PGVCL are as illustrated in the table:
Particulars Details
Total Area Covered By Company 99,771 Sq. Kms.
Districts Covered 8
Talukas Covered 83
Villages Covered 5905
Total Consumers of Company 4861565 (As on 30.06.13)
Circles 11
Divisions 44
Sub Divisions 226
Source: PGVCL Website
2 Profile of PGVCL

Cost Benefit Analysis of Kisan Hit Urja Shakti Yojana (KHUSH Final Report
CONFIDENTIAL
MCB/ISA/A/0/0 10 April 2014 P:\Ahmedabad\AMC\PROJECTS\326672AA01\Documents\Report\GUVNL - KHUSHY - Final Report-V3.docx MCB/ISA/A/0/0 10 April 2014 P:\Ahmedabad\AMC\PROJECTS\326672AA01\Documents\Report\GUVNL - KHUSHY - Final Report-V3.docx
8
High Voltage Distribution System including KHUSHY (Kisan Hit Urja Shakti Yojana) is a scheme with an
objective of eliminating Line losses by installing smaller size of distribution transformers matching with the
load demand of individual consumer or very small group of consumers. The scheme has been largely
implemented in the Agriculture Sector since its roll out in the year 2008-09. The scheme had been aimed in
improving Voltage Profile as well as reduction in Technical loss and associated Commercial Loss. The
scheme had been designed to benefit both the agricultural customers as a result of uninterrupted power
with consistent voltage as well as the distribution companies in the long rum due to drastic decrease in
transmission and distribution losses.
The KHUSHY scheme has been implemented across all Distribution companies viz. PGVCL, DGVCL,
MGVCL and UGVCL. In total 174 feeders across all the distribution companies have been converted under
this scheme into HVDS. PGVCL has benefitted immensely under this scheme wherein 161 feeders have
been converted into HVDS. All agricultural customers under these feeders have been allotted dedicated
transformers for their connections.
The details of feeders in PGVCL which have been converted into HVDS and the number of transformers
installed are as given in the table:
3 Implementation of Kisan Hit Urja Shakti Yojana (KHUSHY) – PGVCL

CO
NF
IDE
NT
IAL
Fin
al R
eport
Co
st B
en
efit A
na
lysis
of K
isan
Hit U
rja S
ha
kti Y
oja
na
(KH
US
H
9
MC
B/IS
A/A
/0/0
10 A
pril 2
014
P:\A
hm
edabad\A
MC
\PR
OJE
CT
S\3
26672A
A01\D
ocum
ents
\Report\G
UV
NL - K
HU
SH
Y - F
inal R
eport-V
3.d
ocx
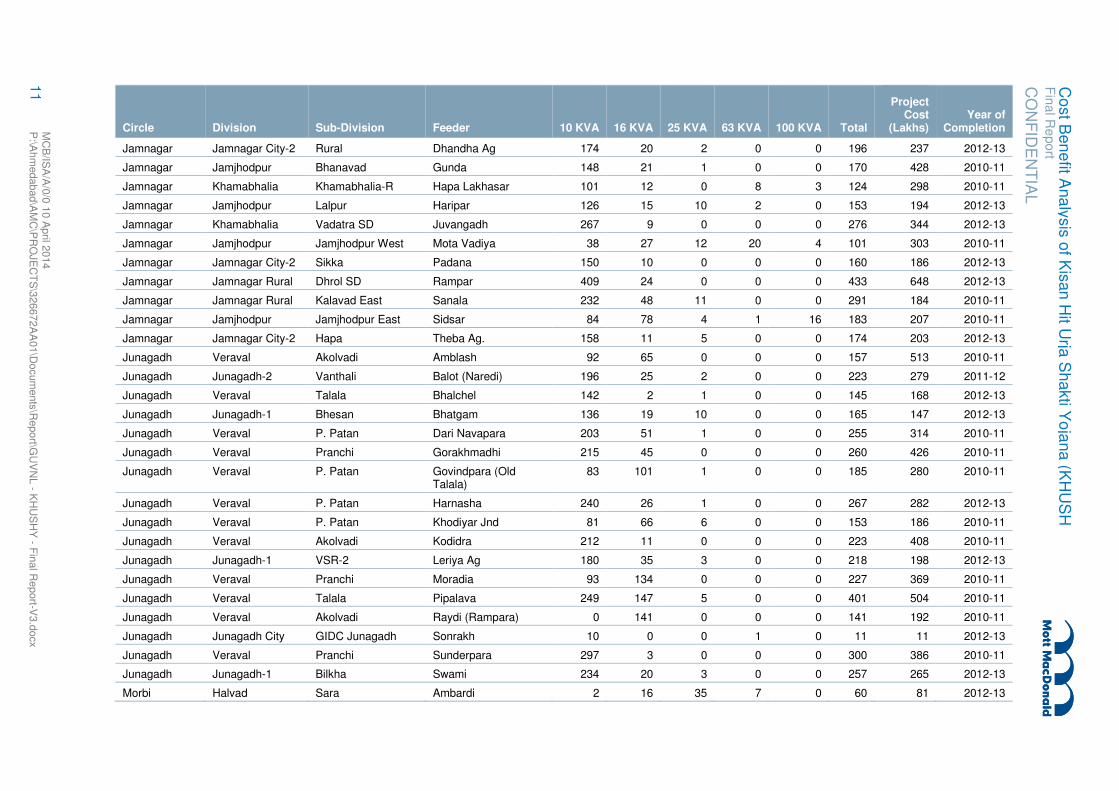
Table 3.1: PGVCL Feeder Details
Circle Division Sub-Division Feeder 10 KVA 16 KVA 25 KVA 63 KVA 100 KVA Total
Project Cost
(Lakhs) Year of
Completion
Amreli Una Una-2 Amodra 212 19 0 0 0 231 220 2012-13
Amreli Una Kodinar-2 Anandpur Amr 331 13 2 0 0 346 335 2012-13
Amreli Una Kodinar-1 Balnath 187 38 9 0 0 234 281 2011-12
Amreli Una Kodinar-2 Batheshvar # 2010-11
Amreli Una Kodinar-2 Bhavani 404 10 0 0 0 414 524 2010-11
Amreli Amreli-2 Vadia Dhundhiya Pipaliya 116 41 21 3 0 181 235 2009-10
Amreli Una Kodinar-2 Fafani 233 5 4 0 0 242 296 2010-11
Amreli SKD Jafrabad Fichadi 340 7 0 0 0 347 250 2012-13
Amreli Una Kodinar-2 Gaytri 244 37 3 0 0 284 415 2010-11
Amreli Una Kodinar Gir Devali 360 16 2 0 0 378 436 2009-10
Amreli Amreli-1 Amreli Rural Giriya 74 21 10 1 0 106 144 2012-13
Amreli SKD Rajula Hindorana 172 4 0 0 0 176 250 2010-11
Amreli Una Kodinar-2 Khodiyar # 2011-12
Amreli Amreli-2 Dhari-2 Marvadi 49 54 13 0 0 116 108 2012-13
Amreli Amreli-2 Chalala Morzar 108 21 12 2 0 143 126 2012-13
Amreli Una Kodinar-2 Pichhava Ag 114 3 0 0 0 117 136 2009-10
Amreli Una Kodinar-2 Satyanarayan # 2010-11
Amreli Amreli-1 Babra Valaradi 107 40 15 0 0 162 175 2012-13
Amreli Amreli-2 Kunkavav Vavdi Road 251 48 21 3 0 323 370 2010-11
Bhavnagar Bhavnagar Rural Vartej Bcw 121 53 21 0 0 195 240 2012-13
Bhavnagar Mahuva Jesar Bhandariya 112 14 6 0 0 132 113 2010-11
Bhavnagar Palitana Talaja Borda Ag 111 27 3 0 0 141 113 2009-10
Bhavnagar Mahuva Mahuva R-2 Datha 151 6 2 0 0 159 179 2012-13
Bhavnagar Bhavnagar City-2 Ghogha Hathab 174 14 1 0 0 189 150 2012-13
Bhavnagar Mahuva Jesar Hipavadli 34 33 11 0 0 78 81 2012-13
Bhavnagar Bhavnagar City-2 Mamsa Jaspara 279 30 13 0 0 322 348 2010-11
Bhavnagar Bhavnagar Rural Vartej Khodiyar 4 118 29 2 0 153 164 2008-09
Bhavnagar Bhavnagar Rural Vartej Khokhara 310 46 11 0 0 367 399 2009-10

CO
NF
IDE
NT
IAL
Fin
al R
eport
Co
st B
en
efit A
na
lysis
of K
isan
Hit U
rja S
ha
kti Y
oja
na
(KH
US
H
10
MC
B/IS
A/A
/0/0
10 A
pril 2
014
P:\A
hm
edabad\A
MC
\PR
OJE
CT
S\3
26672A
A01\D
ocum
ents
\Report\G
UV
NL - K
HU
SH
Y - F
inal R
eport-V
3.d
ocx
Circle Division Sub-Division Feeder 10 KVA 16 KVA 25 KVA 63 KVA 100 KVA Total
Project Cost
(Lakhs) Year of
Completion
Bhavnagar Mahuva Mahuva R-2 Kotda 116 18 13 0 0 147 154 2010-11
Bhavnagar Palitana Golidhal Navagam 36 3 0 0 0 39 50 2012-13
Bhavnagar Palitana Talaja Padri 196 7 0 0 0 203 150 2012-13
Bhavnagar Bhavnagar Rural Sanosara Pipardi Ag 86 36 20 0 0 142 163 2012-13
Bhavnagar Mahuva Jesar Vadal 76 33 2 0 0 111 161 2011-12
Bhavnagar Bhavnagar Rural Sanosara Vavadi 151 34 23 0 0 208 220 2010-11
Bhuj Naliya Kothara Arjanpar Ag 7 11 21 21 0 60 86 2012-13
Bhuj Anjar Anjar Rural-1 Bhalot Ag 27 10 24 0 0 61 74 2011-12
Bhuj Anjar Anjar Rural Bhavanipar 33 20 26 22 2 103 100 2010-11
Bhuj Anjar Anjar T Dabda 0 1 18 22 0 41 67 2012-13
Bhuj Naliya Nakhtrana Devisar 25 45 23 5 0 98 133 2010-11
Bhuj Mandvi Mundra Gelda 0 5 33 41 11 90 82 2011-12
Bhuj Anjar Bhimasar Hamirpar 132 95 23 5 0 255 318 2012-13
Bhuj Anjar Bhachau Kharoi 9 2 10 50 9 80 26 2010-11
Bhuj Bhachau Rapar Khengarpar 30 38 26 3 0 97 124 2012-13
Bhuj Bhuj Deshalpar Khirsara Ag 1 5 31 7 0 44 56 2012-13
Bhuj Naliya Nakhtrana Mathal Ag 0 0 1 20 0 21 40 2012-13
Bhuj Mandvi Dahisara Meghpar 1 13 47 12 0 73 98 2012-13
Bhuj Mandvi Mundra Navinal 37 16 61 9 0 123 120 2010-11
Bhuj Bhuj Madhapara Vavdi 3 8 3 0 0 14 19 2012-13
Botad Botad Paliyad Babarkot 94 35 20 0 0 149 187 2009-10
Botad Botad Botad (T-2) Dhakaniya 87 23 3 1 0 114 125 2011-12
Botad Botad Barvala Mithapur Ag 13 126 12 0 0 151 149 2008-09
Botad Gadhada Dhasa Patana 17 266 44 8 1 336 545 2008-09
Botad Gadhada Gadhda-R Pipal 95 20 7 0 0 122 126 2012-13
Botad Botad Botad (R) Ratanvav 11 3 7 0 0 21 23 2012-13
Botad Gadhada DHASA Sitapar 67 22 6 0 0 95 88 2012-13
Botad Botad Botad Zamrala Ag 15 10 5 1 0 31 23 2012-13
Jamnagar Jamnagar City-1 Hapa Aliyabada (New) 18 229 18 1 0 266 231 2008-09
Jamnagar Jamnagar Rural Kalavad West Bamangam 237 32 7 0 0 276 289 2010-11
CO
NF
IDE
NT
IAL
Fin
al R
eport
Co
st B
en
efit A
na
lysis
of K
isan
Hit U
rja S
ha
kti Y
oja
na
(KH
US
H
11
MC
B/IS
A/A
/0/0
10 A
pril 2
014
P:\A
hm
edabad\A
MC
\PR
OJE
CT
S\3
26672A
A01\D
ocum
ents
\Report\G
UV
NL - K
HU
SH
Y - F
inal R
eport-V
3.d
ocx
Circle Division Sub-Division Feeder 10 KVA 16 KVA 25 KVA 63 KVA 100 KVA Total
Project Cost
(Lakhs) Year of
Completion
Jamnagar Jamnagar City-2 Rural Dhandha Ag 174 20 2 0 0 196 237 2012-13
Jamnagar Jamjhodpur Bhanavad Gunda 148 21 1 0 0 170 428 2010-11
Jamnagar Khamabhalia Khamabhalia-R Hapa Lakhasar 101 12 0 8 3 124 298 2010-11
Jamnagar Jamjhodpur Lalpur Haripar 126 15 10 2 0 153 194 2012-13
Jamnagar Khamabhalia Vadatra SD Juvangadh 267 9 0 0 0 276 344 2012-13
Jamnagar Jamjhodpur Jamjhodpur West Mota Vadiya 38 27 12 20 4 101 303 2010-11
Jamnagar Jamnagar City-2 Sikka Padana 150 10 0 0 0 160 186 2012-13
Jamnagar Jamnagar Rural Dhrol SD Rampar 409 24 0 0 0 433 648 2012-13
Jamnagar Jamnagar Rural Kalavad East Sanala 232 48 11 0 0 291 184 2010-11
Jamnagar Jamjhodpur Jamjhodpur East Sidsar 84 78 4 1 16 183 207 2010-11
Jamnagar Jamnagar City-2 Hapa Theba Ag. 158 11 5 0 0 174 203 2012-13
Junagadh Veraval Akolvadi Amblash 92 65 0 0 0 157 513 2010-11
Junagadh Junagadh-2 Vanthali Balot (Naredi) 196 25 2 0 0 223 279 2011-12
Junagadh Veraval Talala Bhalchel 142 2 1 0 0 145 168 2012-13
Junagadh Junagadh-1 Bhesan Bhatgam 136 19 10 0 0 165 147 2012-13
Junagadh Veraval P. Patan Dari Navapara 203 51 1 0 0 255 314 2010-11
Junagadh Veraval Pranchi Gorakhmadhi 215 45 0 0 0 260 426 2010-11
Junagadh Veraval P. Patan Govindpara (Old Talala)
83 101 1 0 0 185 280 2010-11
Junagadh Veraval P. Patan Harnasha 240 26 1 0 0 267 282 2012-13
Junagadh Veraval P. Patan Khodiyar Jnd 81 66 6 0 0 153 186 2010-11
Junagadh Veraval Akolvadi Kodidra 212 11 0 0 0 223 408 2010-11
Junagadh Junagadh-1 VSR-2 Leriya Ag 180 35 3 0 0 218 198 2012-13
Junagadh Veraval Pranchi Moradia 93 134 0 0 0 227 369 2010-11
Junagadh Veraval Talala Pipalava 249 147 5 0 0 401 504 2010-11
Junagadh Veraval Akolvadi Raydi (Rampara) 0 141 0 0 0 141 192 2010-11
Junagadh Junagadh City GIDC Junagadh Sonrakh 10 0 0 1 0 11 11 2012-13
Junagadh Veraval Pranchi Sunderpara 297 3 0 0 0 300 386 2010-11
Junagadh Junagadh-1 Bilkha Swami 234 20 3 0 0 257 265 2012-13
Morbi Halvad Sara Ambardi 2 16 35 7 0 60 81 2012-13

CO
NF
IDE
NT
IAL
Fin
al R
eport
Co
st B
en
efit A
na
lysis
of K
isan
Hit U
rja S
ha
kti Y
oja
na
(KH
US
H
12
MC
B/IS
A/A
/0/0
10 A
pril 2
014
P:\A
hm
edabad\A
MC
\PR
OJE
CT
S\3
26672A
A01\D
ocum
ents
\Report\G
UV
NL - K
HU
SH
Y - F
inal R
eport-V
3.d
ocx
Circle Division Sub-Division Feeder 10 KVA 16 KVA 25 KVA 63 KVA 100 KVA Total
Project Cost
(Lakhs) Year of
Completion
Morbi Morbi Tankara Ambavadi 15 61 34 0 0 110 125 2012-13
Morbi Morbi Morbi Rural Balwam 0 0 29 8 37 74 60 2012-13
Morbi Halvad Charadva Chupani 0 16 66 44 20 146 85 2010-11
Morbi Halvad Halvad Town Dhavana 1 0 11 19 0 31 62 2012-13
Morbi Morbi Tankara Hadmatia Ag 119 44 15 1 0 179 171 2012-13
Morbi Wankaner Wankaner Rural-1 Holmadh 136 14 0 0 0 150 160 2012-13
Morbi Halvad Sara Jay Bhavani 3 6 25 27 5 66 57 2010-11
Morbi Halvad Sara Jay Bhole 28 44 13 1 0 86 77 2012-13
Morbi Halvad Halvad Town Kansari 3 8 16 14 0 41 62 2012-13
Morbi Halvad Halvad Town Merupar 0 2 8 7 0 17 39 2012-13
Morbi Halvad Charadva Om 4 6 21 4 0 35 31 2012-13
Morbi Halvad Sara Pavan 7 15 34 26 8 90 22 2010-11
Morbi Halvad Sara Ranipat 24 18 18 1 0 61 74 2012-13
Morbi Wankaner Wankaner Rural-2 Ratadia 39 8 2 0 0 49 49 2012-13
Morbi Wankaner Wankaner Rural-2 Samtherava 89 45 21 0 0 155 268 2010-11
Morbi Halvad Halvad Town Shivlaheri 1 3 28 8 0 40 66 2012-13
Morbi Halvad Sara Sundari 5 47 41 8 0 101 116 2012-13
Morbi Halvad Charadva Sundergadh 7 38 62 19 1 127 129 2010-11
Porbandar Keshod-2 Keshod-O&M-1 Amarnath 137 161 4 0 0 302 353 2010-11
Porbandar Porbandar Rural Ranavav Boradi 162 23 0 0 0 185 140 2012-13
Porbandar Keshod-2 Mangrol(R) Chakivav 275 56 0 0 0 331 390 2010-11
Porbandar Porbandar Rural Bagvadar Chamunda 147 2 0 0 0 149 185 2012-13
Porbandar Keshod-O&M-2 Chorwad Devgam 42 165 0 0 0 207 232 2010-11
Porbandar Mangrol Madhavpur Diwasa 69 4 0 0 0 73 93 2011-12
Porbandar Kutiyana RURAL Khodiyar Pbr 93 45 5 0 0 143 147 2012-13
Porbandar Porbandar Rural Bagvadar Mariya 113 3 0 0 0 116 147 2012-13
Porbandar Keshod-1 Rural-1 Nonjalvav 165 35 5 2 0 207 243 2012-13
Porbandar Keshod-2 Keshod-O&M-1 Nunarda 69 93 0 0 0 162 205 2010-11
Porbandar Keshod-2 Mangrol(R) Satmarg 64 111 0 0 0 175 220 2010-11
Porbandar Keshod-2 Mangrol(R) Shepa 278 175 0 0 0 453 543 2010-11

CO
NF
IDE
NT
IAL
Fin
al R
eport
Co
st B
en
efit A
na
lysis
of K
isan
Hit U
rja S
ha
kti Y
oja
na
(KH
US
H
13
MC
B/IS
A/A
/0/0
10 A
pril 2
014
P:\A
hm
edabad\A
MC
\PR
OJE
CT
S\3
26672A
A01\D
ocum
ents
\Report\G
UV
NL - K
HU
SH
Y - F
inal R
eport-V
3.d
ocx
Circle Division Sub-Division Feeder 10 KVA 16 KVA 25 KVA 63 KVA 100 KVA Total
Project Cost
(Lakhs) Year of
Completion
Porbandar Keshod-1 Keshod-O&M-1 Shergadh 265 54 3 0 0 322 356 2011-12
Porbandar Keshod-O&M-2 Mangrol(T) Water Works 178 61 1 0 0 240 293 2010-11
Rajkot City Rajkot City-3 Rajkot Rural Sub-Div
Nakarawadi 202 13 3 0 0 218 138 2012-13
Rajkot City Rajkot City-3 Madhapar Sub-Div Rangpar 200 19 1 0 0 220 255 2012-13
Rajkot Rural Dhoraji Dhoraji (R) Bateshwar 258 24 5 0 0 287 303 2012-13
Rajkot Rural Gondal Kotda Bhadva 165 28 2 0 0 195 237 2010-11
Rajkot Rural Dhoraji Jetpur (R) Dedarva 85 49 18 2 0 154 166 2012-13
Rajkot Rural Gondal Lodhika Devda 420 6 1 0 0 427 519 2010-11
Rajkot Rural Gondal Vasavad Devgam Rrc 197 14 2 0 0 213 258 2010-11
Rajkot Rural Jasdan Sardhar Gadhka 207 57 0 0 0 264 311 2010-11
Rajkot Rural Jasdan Jasdan Godladhar 121 6 1 0 0 128 124 2012-13
Rajkot Rural Dhoraji Jetpur (R) Haripar Rrc 43 20 0 0 0 63 85 2010-11
Rajkot Rural Dhoraji Jamkandorana Kobeshwar 140 36 5 0 0 181 273 2010-11
Rajkot Rural Jasdan Jasdan Lilapur 124 4 0 0 0 128 153 2010-11
Rajkot Rural Dhoraji Navagadh Lunagara 313 13 2 0 0 328 389 2011-12
Rajkot Rural Rajkot Rural Div LODHIKA Makhavad 169 3 0 0 0 172 197 2012-13
Rajkot Rural Gondal Rural-2 Mevasha 151 16 5 0 0 172 175 2012-13
Rajkot Rural Rajkot Rural Div Paddhari Mota Rampar 268 7 4 0 0 279 327 2012-13
Rajkot Rural Rajkot City-3 Mpsd Rajdan 238 27 7 0 0 272 360 2011-12
Rajkot Rural Rajkot City-3 RSD Ranpur 134 13 4 0 0 151 214 2012-13
Rajkot Rural Jasdan Vinchhiya Sanali 232 19 0 0 1 252 357 2010-11
Rajkot Rural Rajkot City-3 RSD Sanosara 166 2 0 0 0 168 218 2010-11
Rajkot Rural Rajkot Rural Div Paddhari Thoriyali 323 25 0 0 1 349 464 2010-11
Surendranagar Dhangadhra Dhangadhra Rural Akalvad 3 27 15 3 0 48 36 2012-13
Surendranagar Surendranagar-2 Than Anandpur 64 89 10 1 0 164 179 2010-11
Surendranagar Surendranagar-2 Muli Bali 1 17 37 7 0 62 45 2010-11
Surendranagar Surendranagar-1 Chuda Borana 0 200 2 0 0 202 111 2008-09
Surendranagar Surendranagar-2 Than Dada # 2011-12
Surendranagar Surendranagar-2 Sayla Devgadh # 2011-12

CO
NF
IDE
NT
IAL
Fin
al R
eport
Co
st B
en
efit A
na
lysis
of K
isan
Hit U
rja S
ha
kti Y
oja
na
(KH
US
H
14
MC
B/IS
A/A
/0/0
10 A
pril 2
014
P:\A
hm
edabad\A
MC
\PR
OJE
CT
S\3
26672A
A01\D
ocum
ents
\Report\G
UV
NL - K
HU
SH
Y - F
inal R
eport-V
3.d
ocx
Circle Division Sub-Division Feeder 10 KVA 16 KVA 25 KVA 63 KVA 100 KVA Total
Project Cost
(Lakhs) Year of
Completion
Surendranagar Surendranagar-2 Sayla Fulgram 0 302 5 0 0 307 160 2008-09
Surendranagar Surendranagar-2 Than Gebinath 40 20 4 0 0 64 57 2012-13
Surendranagar Dhangadhra Bavli Jayshakti 17 11 20 5 0 53 68 2009-10
Surendranagar Surendranagar-1 Chuda Keriya 69 2 1 0 0 72 72 2012-13
Surendranagar Surendranagar-2 Than Khakharathal 32 64 10 0 0 106 138 2011-12
Surendranagar Surendranagar-2 Muli Khatdi 41 65 39 10 0 155 114 2010-11
Surendranagar Dhangadhra Rajsitapur Meghdev 0 11 9 5 0 25 33 2011-12
Surendranagar Surendranagar-2 Sayla Nagadka 70 9 2 0 0 81 83 2012-13
Surendranagar Dhangadhra Bavli Narichana 1 23 23 7 0 54 50 2012-13
Surendranagar Surendranagar-1 LSDR Navi Morvad # 2008-09
Surendranagar Surendranagar-2 Sayla Noli 129 61 10 0 2 202 219 2010-11
Surendranagar Surendranagar-2 SRSD Pandavra 54 40 15 12 0 121 140 2011-12
Surendranagar Surendranagar-2 Muli Ramperda 4 6 20 6 0 36 23 2010-11
Surendranagar Surendranagar-1 LSDR Sardar # 2008-09
Surendranagar Dhangadhra Bavli Siddhanath 4 2 27 24 1 58 81 2009-10
Total 17993 5779 1627 549 122 26070 30687.56
# Data Included in Parent Feeder
Cost Benefit Analysis of Kisan Hit Urja Shakti Yojana (KHUSH Final Report
CONFIDENTIAL
MCB/ISA/A/0/0 10 April 2014 P:\Ahmedabad\AMC\PROJECTS\326672AA01\Documents\Report\GUVNL - KHUSHY - Final Report-V3.docx MCB/ISA/A/0/0 10 April 2014 P:\Ahmedabad\AMC\PROJECTS\326672AA01\Documents\Report\GUVNL - KHUSHY - Final Report-V3.docx
15
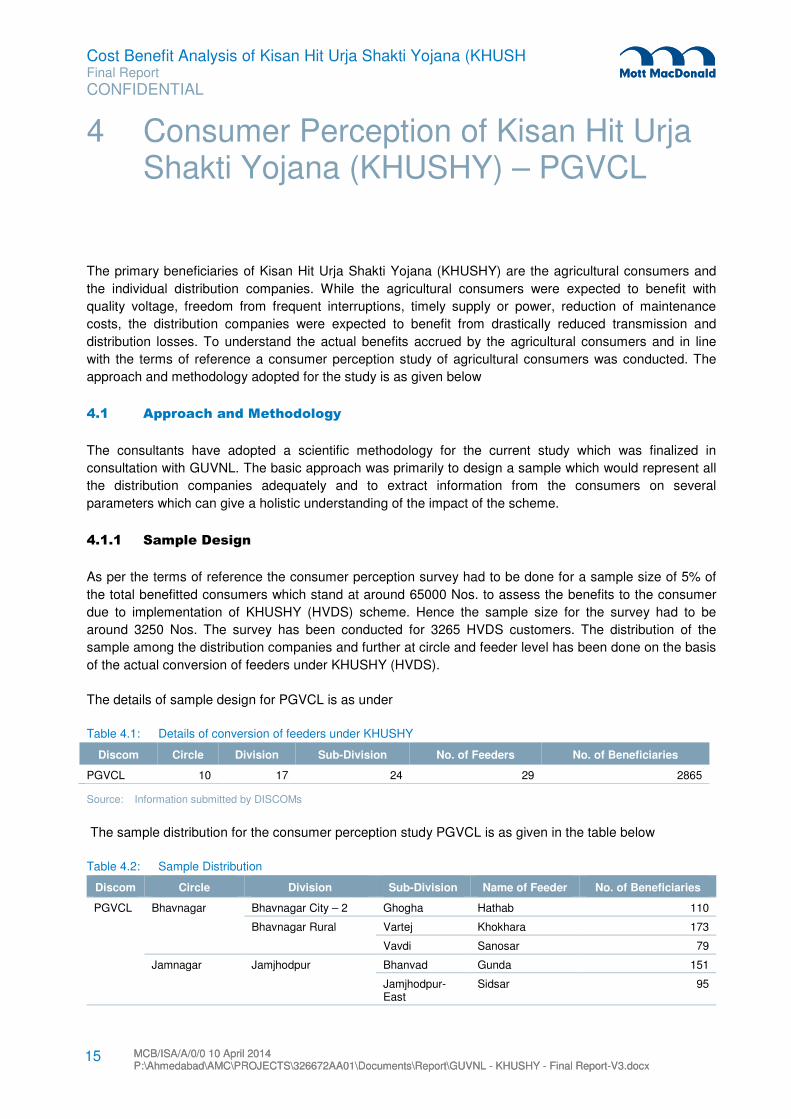
The primary beneficiaries of Kisan Hit Urja Shakti Yojana (KHUSHY) are the agricultural consumers and
the individual distribution companies. While the agricultural consumers were expected to benefit with
quality voltage, freedom from frequent interruptions, timely supply or power, reduction of maintenance
costs, the distribution companies were expected to benefit from drastically reduced transmission and
distribution losses. To understand the actual benefits accrued by the agricultural consumers and in line
with the terms of reference a consumer perception study of agricultural consumers was conducted. The
approach and methodology adopted for the study is as given below
4.1 Approach and Methodology
The consultants have adopted a scientific methodology for the current study which was finalized in
consultation with GUVNL. The basic approach was primarily to design a sample which would represent all
the distribution companies adequately and to extract information from the consumers on several
parameters which can give a holistic understanding of the impact of the scheme.
4.1.1 Sample Design
As per the terms of reference the consumer perception survey had to be done for a sample size of 5% of
the total benefitted consumers which stand at around 65000 Nos. to assess the benefits to the consumer
due to implementation of KHUSHY (HVDS) scheme. Hence the sample size for the survey had to be
around 3250 Nos. The survey has been conducted for 3265 HVDS customers. The distribution of the
sample among the distribution companies and further at circle and feeder level has been done on the basis
of the actual conversion of feeders under KHUSHY (HVDS).
The details of sample design for PGVCL is as under
Table 4.1: Details of conversion of feeders under KHUSHY
Discom Circle Division Sub-Division No. of Feeders No. of Beneficiaries
PGVCL 10 17 24 29 2865
Source: Information submitted by DISCOMs
The sample distribution for the consumer perception study PGVCL is as given in the table below
Table 4.2: Sample Distribution
Discom Circle Division Sub-Division Name of Feeder No. of Beneficiaries
PGVCL Bhavnagar
Bhavnagar City – 2 Ghogha Hathab 110
Bhavnagar Rural Vartej Khokhara 173
Vavdi Sanosar 79
Jamnagar Jamjhodpur Bhanvad Gunda 151
Jamjhodpur- East
Sidsar 95
4 Consumer Perception of Kisan Hit Urja Shakti Yojana (KHUSHY) – PGVCL

Cost Benefit Analysis of Kisan Hit Urja Shakti Yojana (KHUSH Final Report
CONFIDENTIAL
MCB/ISA/A/0/0 10 April 2014 P:\Ahmedabad\AMC\PROJECTS\326672AA01\Documents\Report\GUVNL - KHUSHY - Final Report-V3.docx MCB/ISA/A/0/0 10 April 2014 P:\Ahmedabad\AMC\PROJECTS\326672AA01\Documents\Report\GUVNL - KHUSHY - Final Report-V3.docx
16
Discom Circle Division Sub-Division Name of Feeder No. of Beneficiaries
Junagadh JND - 1 Bhesan Bhatgam 106
Bilkha Swami 180
Kutch Anjar Anjar - R1 Bhalot 71
Bachau Rapar Khengarpar 78
Bhuj Madhapar Vavdi 33
Morbi Halvad Sara Ambavadi 118
Morbi Tankara Hadmatiya 119
Porbandar Porbandar – R Ranavav Bordi 110
Kutiyana Khodiyar 147
RRC RRD Paddhari Mota Rampar 139
Gondal Lodhika Devda 72
Lodhika Devda/Und 60
Jetpur Dedarava Dedarava 38
Lunagara Kerali 32
Dedarava Rupavati 50
Dedarava Arab Timbdi 55
Kobeshwar AG Dadvi 11
Kobeshwar AG Kanavadala 34
Surendranagar SNR1 Chuda Borana 113
LSDR Navi Morvad 109
Amreli Amreli-2 Kukavav Vavdi Road 189
Talali AG 136
Botad Botad Gadhada-R Pipal 88
Gadhada Dhasa Patana 37
Sitapar 132
Total PGVCL 2865
Source: IMM Field Survey
4.1.2 Questionnaire Design
The consultants have used a pre-designed questionnaire as a research tool for the consumer perception
study. The approach while designing the questionnaire was to extract information on several parameters
as to understand the overall impact on the agricultural consumers. The details which the questionnaire
fetched broadly included the following
� Location Details including district, taluka, Discom, circle, division, subdivision and feeder details.
� General Information including name of beneficiary, address, contact details, number of family
members, source of income, land area, cultivation area, ownership of land, year of connection, billing
type, contract demand, connected load, transformer rating etc.

Cost Benefit Analysis of Kisan Hit Urja Shakti Yojana (KHUSH Final Report
CONFIDENTIAL
MCB/ISA/A/0/0 10 April 2014 P:\Ahmedabad\AMC\PROJECTS\326672AA01\Documents\Report\GUVNL - KHUSHY - Final Report-V3.docx MCB/ISA/A/0/0 10 April 2014 P:\Ahmedabad\AMC\PROJECTS\326672AA01\Documents\Report\GUVNL - KHUSHY - Final Report-V3.docx
17
� Technical Details including voltage quality, line break or shutdown details, transformer failure,
incidence of hooking, crop output and yield, aricultural income etc, power usage details etc.
� Operational Details including average number of days loss per failure, motor maintenance, average
expense per failure, operating days of borewell, operating hours of borewell, number of crops cultivated
during year, income per acre, primary type of crop etc.
� Socio Economic Details including type of house, house hold assets, farm assets, number of cattle etc.
� Broad view and suggestion on the implementation of KHUSHY
The questionnaire includes 51 broad questions in total. A copy of the questionnaire has been appended
with the report.
4.2 Key Results of Consumer Perception Study - PGVCL
The consultants have surveyed a total of 2865 agricultural consumers across PGVCL. The key survey
results are as given below
4.2.1 General Information
The General Information including name of beneficiary, address, contact details, number of family
members, source of income, land area, cultivation area, ownership of land, year of connection, billing type,
contract demand, connected load, transformer rating etc. we gathered during the field survey. The analysis
of the same are given in subsequent sections.
4.2.1.1 Source of Income
Economic resources have a significant direct impact on family wellbeing, as family members depend on
each other to meet basic needs and attain a certain standard of living. Changes to economic
circumstances (such as reduced income or wealth, or increased expenditure needs) may prevent a family
from being able afford necessary or desirable items or services. It is coherent that in order to sustain the
family wellbeing (dependency of family members on the head of the family), The source of income needs
to be upheld.
From the below table 4.4 the relationship between the family wellbeing and the source of income can be
depicted. Out of the 2865 beneficiaries surveyed, 100% have their major source of income as Agriculture
with 72% of them having 4-7 dependent family members, 11% having 1-4 family members dependent,
13% having 7-10 family members dependent and 4% having >10 family members dependent on the
income & earnings of the head of the household.

Cost Benefit Analysis of Kisan Hit Urja Shakti Yojana (KHUSH Final Report
CONFIDENTIAL
MCB/ISA/A/0/0 10 April 2014 P:\Ahmedabad\AMC\PROJECTS\326672AA01\Documents\Report\GUVNL - KHUSHY - Final Report-V3.docx MCB/ISA/A/0/0 10 April 2014 P:\Ahmedabad\AMC\PROJECTS\326672AA01\Documents\Report\GUVNL - KHUSHY - Final Report-V3.docx
18
Figure 4.1: Number of Family Members Figure 4.2: Source of Income
Source: IMM Analysis Source: IMM Analysis
Table 4.3: Number of Family Members and Source of Income
No of Family Members No of Respondents Primary Source of Income No of Respondents
1-4 300 Agriculture 2865
4-7 2054
7-10 371
>10 122
Total 2865 Total 2865
Source: IMM Analysis
Continuing to achieve the economic prosperity it is equally important to have ownership of the assets &
basic amenities (such as land, house, utilities etc.) which are contributing in the family well-fare and at the
same time in maintaining the living standards.
Out of 2865 Beneficiaries surveyed, 96 % of them were having land of their own whereas only 6% of the
totals were using land on lease for cultivation of crops and carry out their agricultural activities. It was also
observed that 62% of them were having Metered connections whereas 38% of them were un-metered
connections.
11%
72%
13%
4%
1-3
4-7
7-10
>10
100%
0%
Agriculture
Others

Cost Benefit Analysis of Kisan Hit Urja Shakti Yojana (KHUSH Final Report
CONFIDENTIAL
MCB/ISA/A/0/0 10 April 2014 P:\Ahmedabad\AMC\PROJECTS\326672AA01\Documents\Report\GUVNL - KHUSHY - Final Report-V3.docx MCB/ISA/A/0/0 10 April 2014 P:\Ahmedabad\AMC\PROJECTS\326672AA01\Documents\Report\GUVNL - KHUSHY - Final Report-V3.docx
19
Figure 4.3: Ownership of Land Figure 4.4: Billing Type
Source: IMM Analysis Source: IMM Analysis
Table 4.4: Ownership of Land and Billing Type
Ownership of Land Number of Respondents Billing Type Number of Respondents
Owned 2753 Metered 1777
Leased 112 Un-Metered 1088
Total 2865 Total 2865
Source: IMM Analysis
To cater the power demand & supply needs of the state under the KHUSHY scheme across DISCOMs,
erection of new transformers and HVDS supply lines have taken place to enable the agricultural
consumers to receive benefits like assured quality supply of power with the aim to improve reliability.
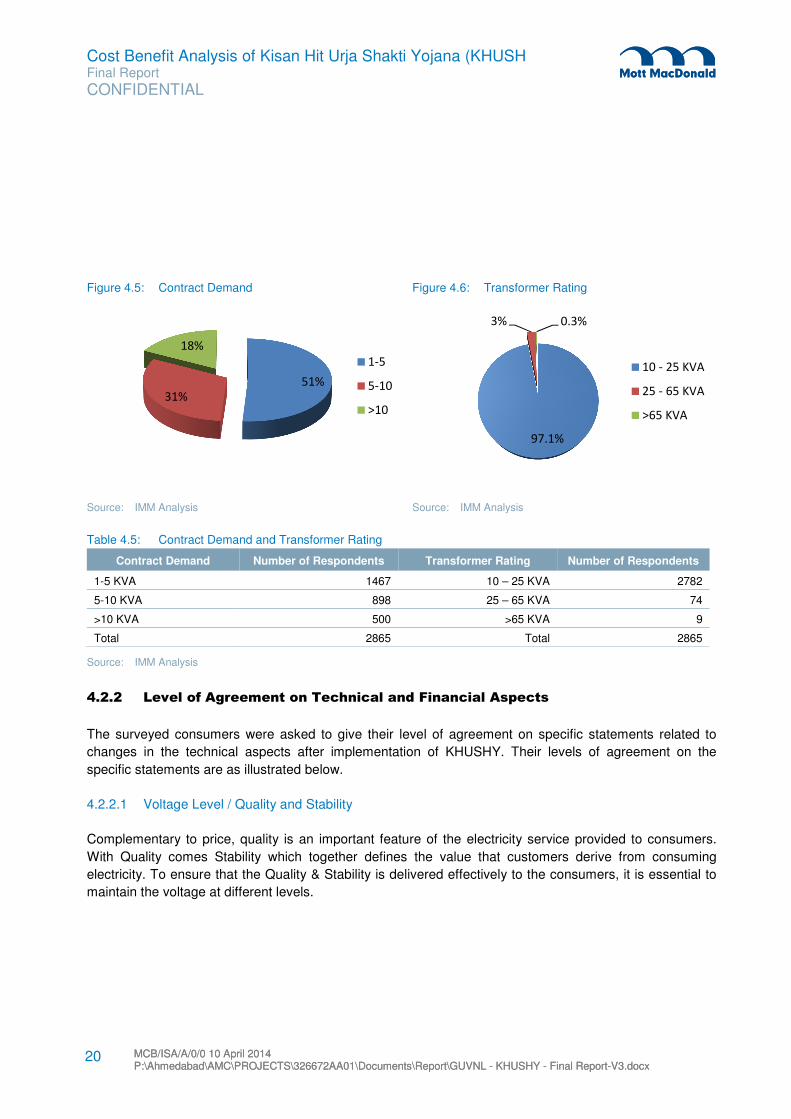
In view of the same & as an effective outcome, Table 4.6 below , depicts that out of the 2865 beneficiaries
surveyed, 51% of were having contractual demand in the range of 1-5 KVA, 31% were having in the range
of 5-10 KVA and the remaining 18% were having in the range of > 10 KVA.
It was also found that almost 97% of the total 2865 beneficiaries were having distribution transformers
having ratings in the range of 10- 25 KVA, 3% of them were using transformers with ratings in the range of
25 – 65 KVA and only 0.3% were having transformers with ratings in the range of > 65 KVA.
96%
4%
Owned
Leased 62%
38%
Metered
Un-Metered
Cost Benefit Analysis of Kisan Hit Urja Shakti Yojana (KHUSH Final Report
CONFIDENTIAL
MCB/ISA/A/0/0 10 April 2014 P:\Ahmedabad\AMC\PROJECTS\326672AA01\Documents\Report\GUVNL - KHUSHY - Final Report-V3.docx MCB/ISA/A/0/0 10 April 2014 P:\Ahmedabad\AMC\PROJECTS\326672AA01\Documents\Report\GUVNL - KHUSHY - Final Report-V3.docx
20
Figure 4.5: Contract Demand Figure 4.6: Transformer Rating
Source: IMM Analysis Source: IMM Analysis
Table 4.5: Contract Demand and Transformer Rating
Contract Demand Number of Respondents Transformer Rating Number of Respondents
1-5 KVA 1467 10 – 25 KVA 2782
5-10 KVA 898 25 – 65 KVA 74
>10 KVA 500 >65 KVA 9
Total 2865 Total 2865
Source: IMM Analysis
4.2.2 Level of Agreement on Technical and Financial Aspects
The surveyed consumers were asked to give their level of agreement on specific statements related to
changes in the technical aspects after implementation of KHUSHY. Their levels of agreement on the
specific statements are as illustrated below.
4.2.2.1 Voltage Level / Quality and Stability
Complementary to price, quality is an important feature of the electricity service provided to consumers.
With Quality comes Stability which together defines the value that customers derive from consuming
electricity. To ensure that the Quality & Stability is delivered effectively to the consumers, it is essential to
maintain the voltage at different levels.
51%
31%
18%
1-5
5-10
>10
97.1%
3% 0.3%
10 - 25 KVA
25 - 65 KVA
>65 KVA

Cost Benefit Analysis of Kisan Hit Urja Shakti Yojana (KHUSH Final Report
CONFIDENTIAL
MCB/ISA/A/0/0 10 April 2014 P:\Ahmedabad\AMC\PROJECTS\326672AA01\Documents\Report\GUVNL - KHUSHY - Final Report-V3.docx MCB/ISA/A/0/0 10 April 2014 P:\Ahmedabad\AMC\PROJECTS\326672AA01\Documents\Report\GUVNL - KHUSHY - Final Report-V3.docx
21
The overall outcome of the survey states
that 90% consumers strongly agree with the
statement that the overall voltage level/
quality and stability has improved after the
implementation of the KHUSHY scheme.
Table 4.6: Voltage Level/Quality and Stability
Statement DISCOM
Stro
ng
ly
Ag
ree
Ag
ree
No
Ch
an
ge
Dis
ag
ree
Stro
ng
ly
Dis
ag
ree
To
tal
The overall voltage level/quality and stability after implementation of KHUSHY has improved.
PGVCL
90% 8% 2% 0% 0% 100%
2582 228 52 3 0 2865
Source: IMM Analysis
4.2.2.2 Frequent Line break or Unscheduled Shutdown
The overall outcome of the survey states that 53% consumers strongly agree with the statement that the
frequent line break or unscheduled shutdowns has reduced after the implementation of the KHUSHY
scheme.
Figure 4.7: Voltage Level/Quality and Stability
Source: IMM Analysis
90.1%
8%1.8%
0.1%
Strongly Agree Agree No Change Disagree

Cost Benefit Analysis of Kisan Hit Urja Shakti Yojana (KHUSH Final Report
CONFIDENTIAL
MCB/ISA/A/0/0 10 April 2014 P:\Ahmedabad\AMC\PROJECTS\326672AA01\Documents\Report\GUVNL - KHUSHY - Final Report-V3.docx MCB/ISA/A/0/0 10 April 2014 P:\Ahmedabad\AMC\PROJECTS\326672AA01\Documents\Report\GUVNL - KHUSHY - Final Report-V3.docx
22
Figure 4.8: Frequent Line break or Unscheduled Shutdown has reduced
Source: IMM Analysis
Table 4.7: Frequent Line break or Unscheduled Shutdown
Statement DISCOM
Stro
ng
ly
Ag
ree
Ag
ree
No
C
ha
ng
e
Dis
ag
ree
Stro
ng
ly
Dis
ag
ree
To
tal
The frequent line break or unscheduled shutdown after implementation of KHUSHY Scheme has reduced
PGVCL 53% 39% 7% 1% 0% 100%
1509 1129 208 17 2 2865
Source: IMM Analysis
4.2.2.3 Transformer Failure
There can be various reasons to a transformer failure, some of the reasons why a transformer fails
includes design failures, inadequate or defective installation, oil contamination, insulation deterioration,
short circuits, line faults, unknown failures, improper maintenance & operation, lightning, moisture, aging
etc. The risk of a transformer failure is actually two-dimensional: the frequency of failure, and the severity
of failure.
To overcome such issues DISCOMs have provided the consumers with Step-Down Transformers ranging
from ratings 10, 16 & 25 KVA with a service connection through short LT lines and insulated cables Ariel
bunched cables (ABC/ PVC). In continuation to the same all possible measures are taken care by the
respective DISCOMs to carry out its maintenance activities.
53%
39% 7%1%
0%
Strongly Agree Agree No Change
Disagree Strongly Disagree
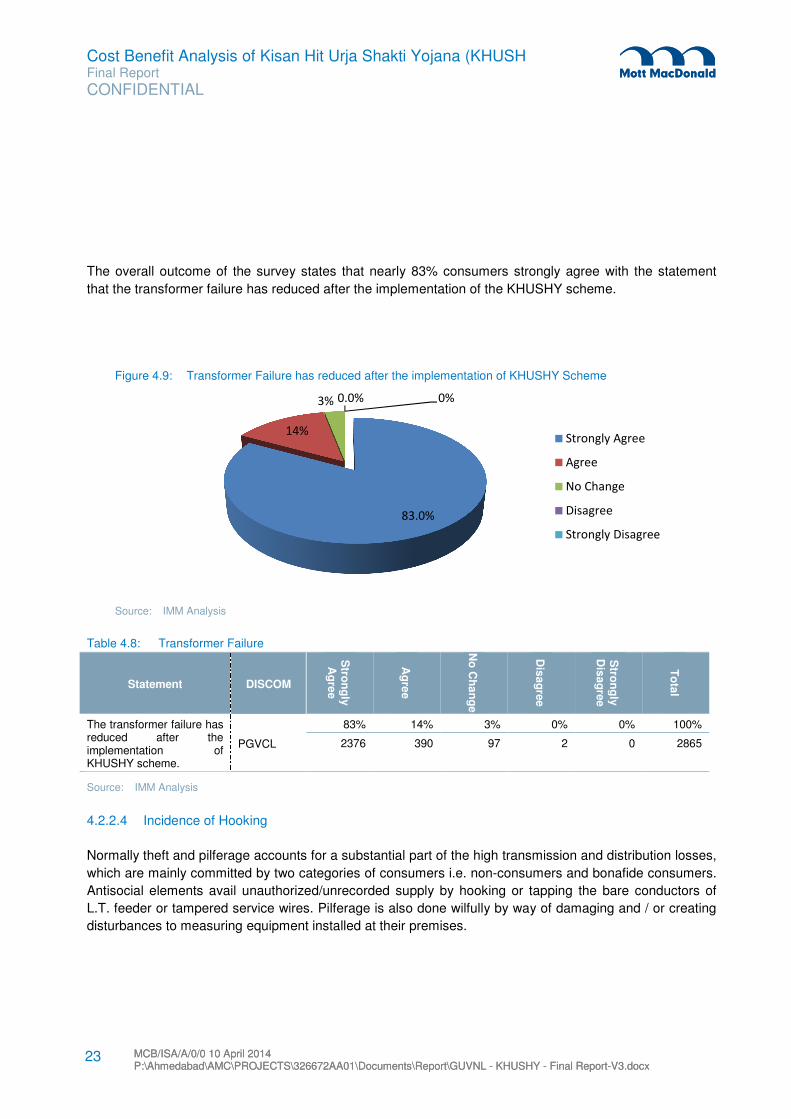
Cost Benefit Analysis of Kisan Hit Urja Shakti Yojana (KHUSH Final Report
CONFIDENTIAL
MCB/ISA/A/0/0 10 April 2014 P:\Ahmedabad\AMC\PROJECTS\326672AA01\Documents\Report\GUVNL - KHUSHY - Final Report-V3.docx MCB/ISA/A/0/0 10 April 2014 P:\Ahmedabad\AMC\PROJECTS\326672AA01\Documents\Report\GUVNL - KHUSHY - Final Report-V3.docx
23
The overall outcome of the survey states that nearly 83% consumers strongly agree with the statement
that the transformer failure has reduced after the implementation of the KHUSHY scheme.
Table 4.8: Transformer Failure
Statement DISCOM
Stro
ng
ly
Ag
ree
Ag
ree
No
Ch
an
ge
Dis
ag
ree
Stro
ng
ly
Dis
ag
ree
To
tal
The transformer failure has reduced after the implementation of KHUSHY scheme.
PGVCL
83% 14% 3% 0% 0% 100%
2376 390 97 2 0 2865
Source: IMM Analysis
4.2.2.4 Incidence of Hooking
Normally theft and pilferage accounts for a substantial part of the high transmission and distribution losses,
which are mainly committed by two categories of consumers i.e. non-consumers and bonafide consumers.
Antisocial elements avail unauthorized/unrecorded supply by hooking or tapping the bare conductors of
L.T. feeder or tampered service wires. Pilferage is also done wilfully by way of damaging and / or creating
disturbances to measuring equipment installed at their premises.
Figure 4.9: Transformer Failure has reduced after the implementation of KHUSHY Scheme
Source: IMM Analysis
83.0%
14%
3% 0.0% 0%
Strongly Agree
Agree
No Change
Disagree
Strongly Disagree

Cost Benefit Analysis of Kisan Hit Urja Shakti Yojana (KHUSH Final Report
CONFIDENTIAL
MCB/ISA/A/0/0 10 April 2014 P:\Ahmedabad\AMC\PROJECTS\326672AA01\Documents\Report\GUVNL - KHUSHY - Final Report-V3.docx MCB/ISA/A/0/0 10 April 2014 P:\Ahmedabad\AMC\PROJECTS\326672AA01\Documents\Report\GUVNL - KHUSHY - Final Report-V3.docx
24
To stop or minimize such activities
DISCOMs under the implementation of
KHUSHY have provided the consumers
with insulated overhead cables known as
Arial Bunched Cables (ABC/PVC) and
other devices and equipment’s. Reducing the length of LT lines by
relocation and installations of additional
distribution transformers. The overall
outcome of the survey states that nearly
94% consumers strongly agree that the
incidence hooking has reduced after the
implementation of the KHUSHY scheme.
Table 4.9: Incidence of Hooking
Statement DISCOM
Stro
ng
ly
Ag
ree
Ag
ree
No
Ch
an
ge
Dis
ag
ree
Stro
ng
ly
Dis
ag
ree
To
tal
Incidence of Hooking has reduced after implementation of KHUSHY Scheme
PGVCL
93% 5% 2% 0 0 100%
2670 131 64 0 0 2865
Source: IMM Analysis
4.2.2.5 Crop Output & Yield
As the primary objective of the project was to provide consumers with Power distribution related benefits,
whereas Crop output & yield are directly dependent on the monsoon & weather conditions for which the
electricity has no significant impact. The survey results show that 23% of the customers strongly agree
while other 20% agree that the crop output and yield has increased after the implementation of KHUSHY.
57% of the customers are of the opinion that there has been no change in the crop output and yield after
the implementation of KHUSHY.
Figure 4.10: Incidence of Hooking
Source: IMM Analysis
93%
5% 2%Strongly Agree
Agree
No Change

Cost Benefit Analysis of Kisan Hit Urja Shakti Yojana (KHUSH Final Report
CONFIDENTIAL
MCB/ISA/A/0/0 10 April 2014 P:\Ahmedabad\AMC\PROJECTS\326672AA01\Documents\Report\GUVNL - KHUSHY - Final Report-V3.docx MCB/ISA/A/0/0 10 April 2014 P:\Ahmedabad\AMC\PROJECTS\326672AA01\Documents\Report\GUVNL - KHUSHY - Final Report-V3.docx
25
Figure 4.11: Crop Output & Yield has increased
Source: Insert source text here
Table 4.10: Crop Output & Yield
Statement DISCOM
Stro
ng
ly
Ag
ree
Ag
ree
No
Ch
an
ge
Dis
ag
ree
Stro
ng
ly
Dis
ag
ree
To
tal
The Crop output & yield has yield has increased after implementation of KHUSHY scheme
PGVCL
22.8% 20% 57% 0.2% 0% 100%
673 565 1622 5 0 2865
Source: IMM Analysis
4.2.2.6 Agricultural Income
The perception regarding Agricultural
income can be depicted from the able,
however the overall outcome of the
survey states that nearly 17%
consumers strongly agrees with the
statement that the Agricultural income
has increased after the
implementation of the KHUSHY
scheme, whereas 61% states that
there has been no change in terms of
their income.
Figure 4.12: Agricultural Income
Source: IMM Analysis
17%
22%61%
0%
Strongly Agree Agree No Change Disagree

Cost Benefit Analysis of Kisan Hit Urja Shakti Yojana (KHUSH Final Report
CONFIDENTIAL
MCB/ISA/A/0/0 10 April 2014 P:\Ahmedabad\AMC\PROJECTS\326672AA01\Documents\Report\GUVNL - KHUSHY - Final Report-V3.docx MCB/ISA/A/0/0 10 April 2014 P:\Ahmedabad\AMC\PROJECTS\326672AA01\Documents\Report\GUVNL - KHUSHY - Final Report-V3.docx
26
Table 4.11: Agricultural Income
Statement DISCOM
Stro
ng
ly
Ag
ree
Ag
ree
No
Ch
an
ge
Dis
ag
ree
Stro
ng
ly
Dis
ag
ree
To
tal
Agricultural Income has increased after the implementation of KHUSHY Scheme
PGVCL
17% 22% 60.8% 0.2% 0% 100%
490 636 1733 6 0 2865
Source: IMM Analysis
4.2.2.7 Availability of Free Time
The perception regarding availability of free time,
the overall outcome of the survey states that
nearly 70% consumers strongly agree with the
statement that the availability of free time after
the implementation of the KHUSHY scheme.
It was found that after the implementation of the
KHUSHY scheme, the power supply to the
consumers was distributed as per schedule &
timings which was an advantage for them. The
free time which was after the implementation
was available with the consumers are utilized by
them for other working & revenue generating
activities, also with a possibility to start a small
shop/business to increase their sources of
income which will be ultimately helping them &
their families to enhance the lifestyle and
standards of living.
Table 4.12: Availability of Free Time
Statement DISCOM
Stro
ng
ly
Ag
ree
Ag
ree
No
Ch
an
ge
Dis
ag
ree
Stro
ng
ly
Dis
ag
ree
To
tal
You get free time for yourself after implementation of KHUSHY Scheme
PGVCL 70% 17% 13% 0% 0% 100%
2005 496 363 1 0 2865
Source: IMM Analysis
Figure 4.13: Availability of Free Time
Source: IMM Analysis
70%
17%
13%
Strongly Agree Agree No Change

Cost Benefit Analysis of Kisan Hit Urja Shakti Yojana (KHUSH Final Report
CONFIDENTIAL
MCB/ISA/A/0/0 10 April 2014 P:\Ahmedabad\AMC\PROJECTS\326672AA01\Documents\Report\GUVNL - KHUSHY - Final Report-V3.docx MCB/ISA/A/0/0 10 April 2014 P:\Ahmedabad\AMC\PROJECTS\326672AA01\Documents\Report\GUVNL - KHUSHY - Final Report-V3.docx
27
4.2.2.8 Overall Satisfaction with the KHUSHY Scheme
The perception regarding Overall satisfaction
can be depicted from the table, however the
overall outcome of the survey states that
nearly 89% beneficiaries strongly agrees with
the statement that they are overall satisfied
after the implementation of the KHUSHY
scheme.
Table 4.13: Overall Satisfaction with the KHUSHY Scheme
Statement DISCOM
Stro
ng
ly
Ag
ree
Ag
ree
No
C
ha
ng
e
Dis
ag
ree
Stro
ng
ly
Dis
ag
ree
To
tal
You are overall satisfied with the KHUSHY Scheme
PGVCL 89% 8% 3% 0% 0% 100%
2524 263 77 1 0 2865
Source: IMM Analysis
4.2.3 Assessment of Tangible Benefits Accrued after implementation of KHUSHY
The consumers were asked specific questions related to Technical, Operational and Financial aspects to
gauge the quantitative difference in tangible benefits before and after the implementation of KHUSHY.
Figure 4.14: Overall Satisfaction with the KHUSHY Scheme
Source: IMM Analysis
89%
8%
3%
Strongly Agree Agree No Change

Cost Benefit Analysis of Kisan Hit Urja Shakti Yojana (KHUSH Final Report
CONFIDENTIAL
MCB/ISA/A/0/0 10 April 2014 P:\Ahmedabad\AMC\PROJECTS\326672AA01\Documents\Report\GUVNL - KHUSHY - Final Report-V3.docx MCB/ISA/A/0/0 10 April 2014 P:\Ahmedabad\AMC\PROJECTS\326672AA01\Documents\Report\GUVNL - KHUSHY - Final Report-V3.docx
28
4.2.3.1 Transformer Failure
The perception regarding Transformer
Failure & Average no. of days per
failure can be depicted from the table.
The survey results show that more
than 38% of the customers
experienced transformer failures
around 3-5 times while other few
experienced it more than 5 times.
After the implementation of KHUSHY
all the surveyed customers
experienced transformer failure in the
bracket of 0-2 times. The results
hence show that there has been a
considerable decrease in transformer
failure after the implementation of
KHUSHY.
The survey results show that around 27% of the customers experienced 6-10 days loss due to each
transformer failure while other 24% experienced 11-15 days loss due to each transformer failure. After the
implementation of KHUSHY more than 99% of the surveyed customers experienced 0-5 days loss due to
each transformer failure and also the rate of failure has decreased to 0-2 per year.
Figure 4.15: Transformer Failure (Times In a Year)
Source: IMM Analysis
Table 4.14: Details on Transformer Failure Before and After KHUSHY
Parameter DISCOM
Total No. of Beneficiaries Surveyed Transformer Failure (No. of times)
Transformer failures before and after implementation of KHUSHY
Before After
0-2 3-5 > 5 0-2 3-5 >5
PGVCL 2865 60% 38% 2% 100% 0% 0%
1711 1076 78 2865 0 0
Source: IMM Analysis
0102030405060708090
100
0-2 3-5 > 5
Re
spo
nse
(in
%)
Transformer Failure (No. of times)
Before After

Cost Benefit Analysis of Kisan Hit Urja Shakti Yojana (KHUSH Final Report
CONFIDENTIAL
MCB/ISA/A/0/0 10 April 2014 P:\Ahmedabad\AMC\PROJECTS\326672AA01\Documents\Report\GUVNL - KHUSHY - Final Report-V3.docx MCB/ISA/A/0/0 10 April 2014 P:\Ahmedabad\AMC\PROJECTS\326672AA01\Documents\Report\GUVNL - KHUSHY - Final Report-V3.docx
29
Table 4.15: Details on Average number of Days Loss per Failure Before and After KHUSHY
Parameter DISCOM
No. of Beneficiaries Surveyed Average No. of Days Loss per Failure
Average No. of Days
Loss Per Failure
BEFORE AFTER
0-5 6-10 11-15 16-20 > 20 0-5 6-10 11-15 16-20 > 20
PGVCL 2865 33% 27% 24% 9% 6% 99.9% 0.1% 0% 0% 0%
953 778 691 267 176 2861 4 0 0 0
Source: IMM Analysis
Figure 4.16: Average Number of Days Loss Per Failure
Source: IMM Analysis
0
10
20
30
40
50
60
70
80
90
100
0-5 6-10 11-15 16-20 > 20
Re
spo
nse
(in
%)
Average No. of Days Loss per failure
Before
After

Cost Benefit Analysis of Kisan Hit Urja Shakti Yojana (KHUSH Final Report
CONFIDENTIAL
MCB/ISA/A/0/0 10 April 2014 P:\Ahmedabad\AMC\PROJECTS\326672AA01\Documents\Report\GUVNL - KHUSHY - Final Report-V3.docx MCB/ISA/A/0/0 10 April 2014 P:\Ahmedabad\AMC\PROJECTS\326672AA01\Documents\Report\GUVNL - KHUSHY - Final Report-V3.docx
30
4.2.3.2 Motor Maintenance / Failure
The perception regarding Motor
Maintenance & Average no. of days per
failure can be depicted from the table
The survey results show that more than
30% of the customers experienced
motor failures of around 3-5 times while
other few experienced it more than 5
times. After the implementation of
KHUSHY more than 99% of the
surveyed customers experienced motor
failures in the bracket of 0-2 times. The
results hence show that there has been
a considerable decrease in motor failure
after the implementation of KHUSHY.
Table 4.16: Details on Motor Maintenance / Failure (Times In a Year)
Parameter DISCOM
No. of Beneficiaries
Surveyed Motor Maintenance / Failure (Times In a Year)
Motor Maintenance/ Failure
BEFORE AFTER
0-2 3-5 6-8 >8 0-2 3-5 6-8 >8
PGVCL 2865 68% 30% 1% 0% 99.97% 0.03% 0% 0%
1959 865 28 13 2864 1 0 0
Source: IMM Analysis
Figure 4.17: Motor Maintenance / Failure (Times In a Year)
Source: IMM Analysis
0
10
20
30
40
50
60
70
80
90
100
0-2 3-5 6-8 >8
Re
spo
nse
(in
%)
Motor Maintenance per failure
Before After

Cost Benefit Analysis of Kisan Hit Urja Shakti Yojana (KHUSH Final Report
CONFIDENTIAL
MCB/ISA/A/0/0 10 April 2014 P:\Ahmedabad\AMC\PROJECTS\326672AA01\Documents\Report\GUVNL - KHUSHY - Final Report-V3.docx MCB/ISA/A/0/0 10 April 2014 P:\Ahmedabad\AMC\PROJECTS\326672AA01\Documents\Report\GUVNL - KHUSHY - Final Report-V3.docx
31
The survey results show that around 33%
of the customers experienced 6-10 days
loss after each motor failure while other
11% experienced more than 10 days loss
after each motor failure. After the
implementation of KHUSHY more than 99%
of the surveyed customers experienced day
loss after each motor failure in the bracket
of 0-5 times. The results hence show that
there has been a considerable decrease in
average day loss per motor failure after the
implementation of KHUSHY.
Table 4.17: Details on Average no. of Days Loss per Maintenance/ Failure
Parameter DISCOM
No. of Beneficiaries
Surveyed Motor Maintenance / Failure (Times In a Year)
Average no. of Days Loss per Maintenance/ Failure
BEFORE AFTER
0-5 6-10 > 10 0-5 6-10 > 10
PGVCL 2865 56% 33% 11% 99.90% 0.10% 0%
1601 958 306 2862 3 0
Source: IMM Analysis
Figure 4.18: Average no. of Days Loss per Maintenance/ Failure
Source: IMM Analysis
0
10
20
30
40
50
60
70
80
90
100
0-5 6-10 > 10
Re
spo
nse
(in
%)
Avg. No. of Days Loss per Maintenance/
Failure
Before After
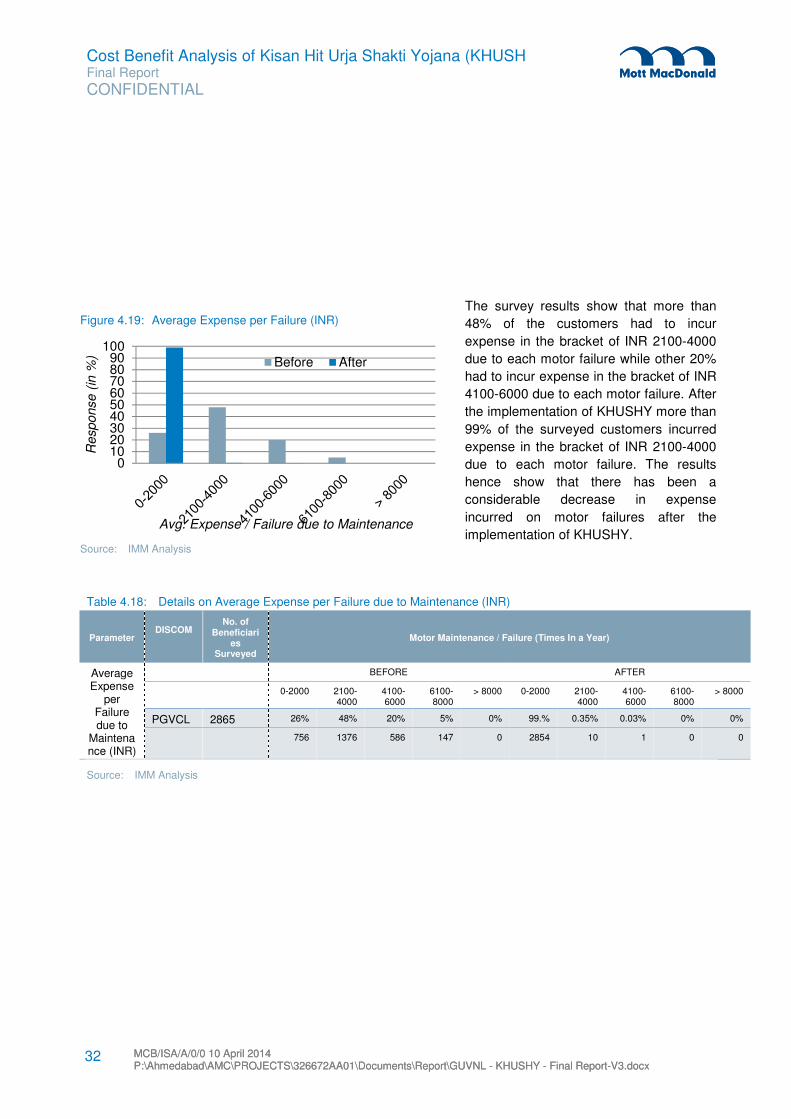
Cost Benefit Analysis of Kisan Hit Urja Shakti Yojana (KHUSH Final Report
CONFIDENTIAL
MCB/ISA/A/0/0 10 April 2014 P:\Ahmedabad\AMC\PROJECTS\326672AA01\Documents\Report\GUVNL - KHUSHY - Final Report-V3.docx MCB/ISA/A/0/0 10 April 2014 P:\Ahmedabad\AMC\PROJECTS\326672AA01\Documents\Report\GUVNL - KHUSHY - Final Report-V3.docx
32
The survey results show that more than
48% of the customers had to incur
expense in the bracket of INR 2100-4000
due to each motor failure while other 20%
had to incur expense in the bracket of INR
4100-6000 due to each motor failure. After
the implementation of KHUSHY more than
99% of the surveyed customers incurred
expense in the bracket of INR 2100-4000
due to each motor failure. The results
hence show that there has been a
considerable decrease in expense
incurred on motor failures after the
implementation of KHUSHY.
Table 4.18: Details on Average Expense per Failure due to Maintenance (INR)
Parameter DISCOM
No. of Beneficiari
es Surveyed
Motor Maintenance / Failure (Times In a Year)
Average Expense
per Failure due to
Maintenance (INR)
BEFORE AFTER
0-2000 2100-4000
4100-6000
6100-8000
> 8000 0-2000 2100-4000
4100-6000
6100-8000
> 8000
PGVCL 2865 26% 48% 20% 5% 0% 99.% 0.35% 0.03% 0% 0%
756 1376 586 147 0 2854 10 1 0 0
Source: IMM Analysis
Figure 4.19: Average Expense per Failure (INR)
Source: IMM Analysis
0102030405060708090
100
Response (
in %
)
Avg. Expense / Failure due to Maintenance
Before After
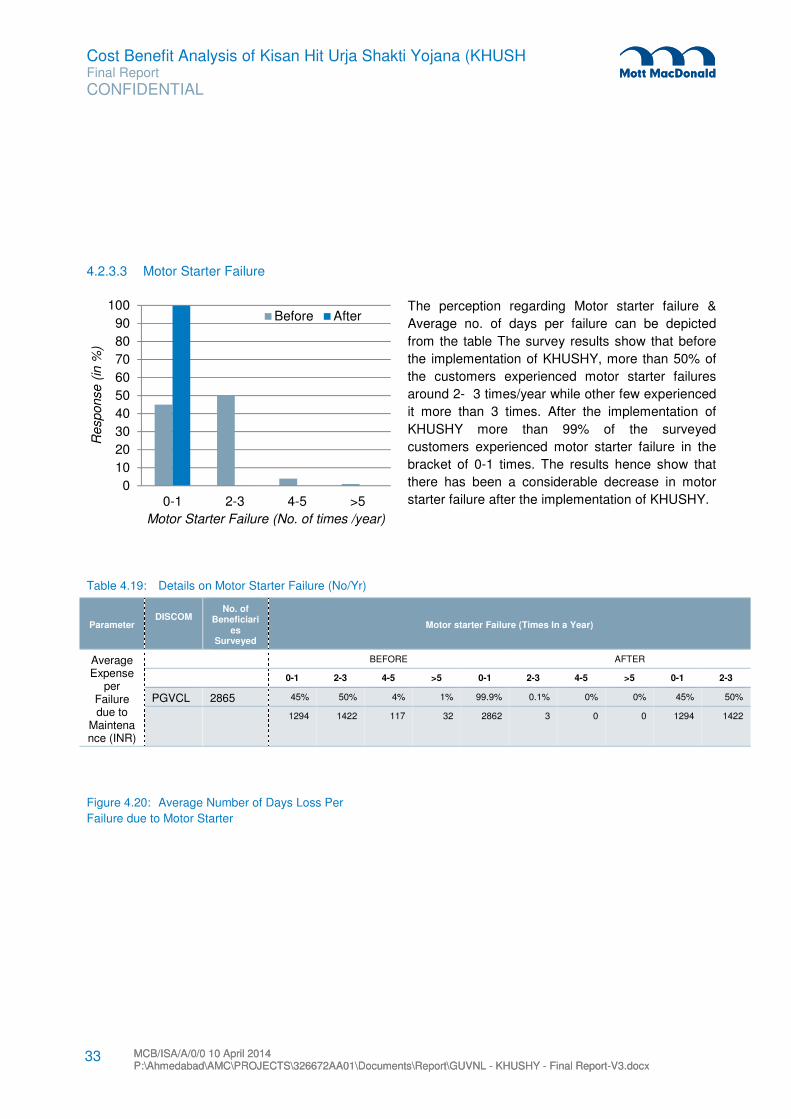
Cost Benefit Analysis of Kisan Hit Urja Shakti Yojana (KHUSH Final Report
CONFIDENTIAL
MCB/ISA/A/0/0 10 April 2014 P:\Ahmedabad\AMC\PROJECTS\326672AA01\Documents\Report\GUVNL - KHUSHY - Final Report-V3.docx MCB/ISA/A/0/0 10 April 2014 P:\Ahmedabad\AMC\PROJECTS\326672AA01\Documents\Report\GUVNL - KHUSHY - Final Report-V3.docx
33
4.2.3.3 Motor Starter Failure
The perception regarding Motor starter failure &
Average no. of days per failure can be depicted
from the table The survey results show that before
the implementation of KHUSHY, more than 50% of
the customers experienced motor starter failures
around 2- 3 times/year while other few experienced
it more than 3 times. After the implementation of
KHUSHY more than 99% of the surveyed
customers experienced motor starter failure in the
bracket of 0-1 times. The results hence show that
there has been a considerable decrease in motor
starter failure after the implementation of KHUSHY.
Table 4.19: Details on Motor Starter Failure (No/Yr)
Parameter DISCOM
No. of Beneficiari
es Surveyed
Motor starter Failure (Times In a Year)
Average Expense
per Failure due to
Maintenance (INR)
BEFORE AFTER
0-1 2-3 4-5 >5 0-1 2-3 4-5 >5 0-1 2-3
PGVCL 2865 45% 50% 4% 1% 99.9% 0.1% 0% 0% 45% 50%
1294 1422 117 32 2862 3 0 0 1294 1422
Figure 4.20: Average Number of Days Loss Per
Failure due to Motor Starter
0
10
20
30
40
50
60
70
80
90
100
0-1 2-3 4-5 >5
Response (
in %
)
Motor Starter Failure (No. of times /year)
Before After

Cost Benefit Analysis of Kisan Hit Urja Shakti Yojana (KHUSH Final Report
CONFIDENTIAL
MCB/ISA/A/0/0 10 April 2014 P:\Ahmedabad\AMC\PROJECTS\326672AA01\Documents\Report\GUVNL - KHUSHY - Final Report-V3.docx MCB/ISA/A/0/0 10 April 2014 P:\Ahmedabad\AMC\PROJECTS\326672AA01\Documents\Report\GUVNL - KHUSHY - Final Report-V3.docx
34
The survey results show that more than 68% of the
customers experienced 2-3 days loss due to each
motor starter failure while other few experienced more
than 3 days loss due to each motor starter failure. After
the implementation of KHUSHY more 100% of the
surveyed customers experienced 0-1 day loss due to
each motor starter failure. The results hence show that
there has been a considerable decrease in average
day loss per motor starter failure after the
implementation of KHUSHY.
Table 4.20: Details on Average Number of Days Loss per Failure due to Motor Starter
Parameter DISCOM
Total No. of Beneficiaries
Surveyed Days Loss Per Failure (Times In a Year)
Average Number of Days Loss Per Failure due to Motor Starter
BEFORE AFTER
0-1 2-3 4-5 >5 0-1 2-3 4-5 >5
PGVCL 2865 68% 18% 11% 3% 100% 0% 0% 0%
1943 508 324 90 2865 0 0 0
Source: IMM Analysis
Source: IMM Analysis
0102030405060708090
100
0-1 2-3 4-5 >5
Response (
in %
)
Motor Starter Failure (No. of Days /year)
Before After

Cost Benefit Analysis of Kisan Hit Urja Shakti Yojana (KHUSH Final Report
CONFIDENTIAL
MCB/ISA/A/0/0 10 April 2014 P:\Ahmedabad\AMC\PROJECTS\326672AA01\Documents\Report\GUVNL - KHUSHY - Final Report-V3.docx MCB/ISA/A/0/0 10 April 2014 P:\Ahmedabad\AMC\PROJECTS\326672AA01\Documents\Report\GUVNL - KHUSHY - Final Report-V3.docx
35
The survey results show that around 25%
of the customers had to incur expense in
the bracket of INR 501-1000 due to each
motor failure while other 29% had to incur
expense in the bracket of INR 1001-1500
after each motor failure. After the
implementation of KHUSHY, 99.5% of the
surveyed customers incurred expense in
the bracket of INR 0-500 after each motor
failure. The results hence show that there
has been a considerable decrease in
expense incurred on motor starter failures
after the implementation of KHUSHY.
Table 4.21: Details on Average Expense per Failure due to Motor Starter Failure (INR)
Parameter DISCOM
No. of Beneficiaries
Surveyed Days Loss Per Failure (Times In a Year)
BEFORE AFTER
Average Expense per Failure due to Motor Starter Failure
0-500 501-1000
1001-1500
>1500 0-500 501-1000
1001-1500
>1500
PGVCL 2865 27% 25% 29% 19% 99.55% 0.07% 0.03% 0.35%
778 730 821 536 2852 2 1 10
Source: IMM Analysis
4.2.4 Single Phase Connection and Bore well Details
The figure below depicts that 98% of the total 3265 surveyed beneficiaries do not have additional single
phase connection whereas all are having Bore Well facility.
Figure 4.21: Average Expense per Failure due to Motor Starter
Failure (INR)
Source: IMM Analysis
0
10
20
30
40
50
60
70
80
90
100
0-500 501-1000 1001-1500 >1500
Response (
in %
)
Avg. Expense / Failure due to Maintenance
Before After
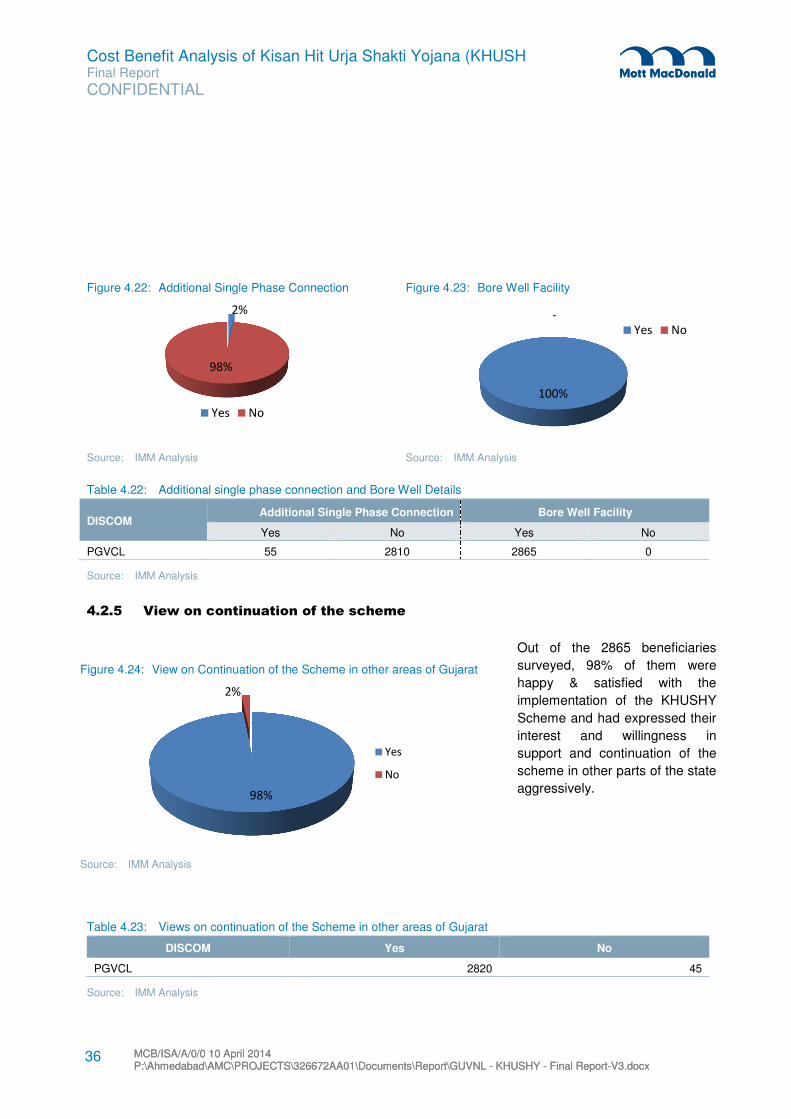
Cost Benefit Analysis of Kisan Hit Urja Shakti Yojana (KHUSH Final Report
CONFIDENTIAL
MCB/ISA/A/0/0 10 April 2014 P:\Ahmedabad\AMC\PROJECTS\326672AA01\Documents\Report\GUVNL - KHUSHY - Final Report-V3.docx MCB/ISA/A/0/0 10 April 2014 P:\Ahmedabad\AMC\PROJECTS\326672AA01\Documents\Report\GUVNL - KHUSHY - Final Report-V3.docx
36
Figure 4.22: Additional Single Phase Connection Figure 4.23: Bore Well Facility
Source: IMM Analysis Source: IMM Analysis
Table 4.22: Additional single phase connection and Bore Well Details
DISCOM Additional Single Phase Connection Bore Well Facility
Yes No Yes No
PGVCL 55 2810 2865 0
Source: IMM Analysis
4.2.5 View on continuation of the scheme
Out of the 2865 beneficiaries
surveyed, 98% of them were
happy & satisfied with the
implementation of the KHUSHY
Scheme and had expressed their
interest and willingness in
support and continuation of the
scheme in other parts of the state
aggressively.
Table 4.23: Views on continuation of the Scheme in other areas of Gujarat
DISCOM Yes No
PGVCL 2820 45
Source: IMM Analysis
2%
98%
Yes No
100%
-
Yes No
Figure 4.24: View on Continuation of the Scheme in other areas of Gujarat
Source: IMM Analysis
98%
2%
Yes
No
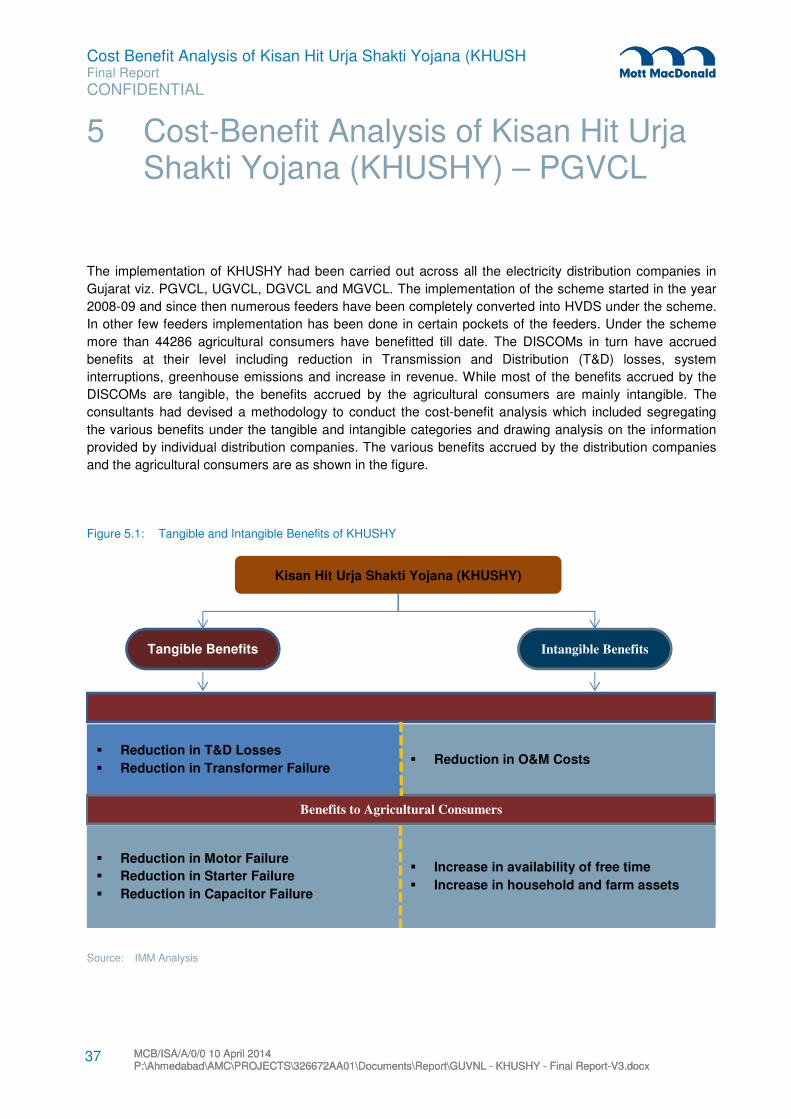
Cost Benefit Analysis of Kisan Hit Urja Shakti Yojana (KHUSH Final Report
CONFIDENTIAL
MCB/ISA/A/0/0 10 April 2014 P:\Ahmedabad\AMC\PROJECTS\326672AA01\Documents\Report\GUVNL - KHUSHY - Final Report-V3.docx MCB/ISA/A/0/0 10 April 2014 P:\Ahmedabad\AMC\PROJECTS\326672AA01\Documents\Report\GUVNL - KHUSHY - Final Report-V3.docx
37
The implementation of KHUSHY had been carried out across all the electricity distribution companies in
Gujarat viz. PGVCL, UGVCL, DGVCL and MGVCL. The implementation of the scheme started in the year
2008-09 and since then numerous feeders have been completely converted into HVDS under the scheme.
In other few feeders implementation has been done in certain pockets of the feeders. Under the scheme
more than 44286 agricultural consumers have benefitted till date. The DISCOMs in turn have accrued
benefits at their level including reduction in Transmission and Distribution (T&D) losses, system
interruptions, greenhouse emissions and increase in revenue. While most of the benefits accrued by the
DISCOMs are tangible, the benefits accrued by the agricultural consumers are mainly intangible. The
consultants had devised a methodology to conduct the cost-benefit analysis which included segregating
the various benefits under the tangible and intangible categories and drawing analysis on the information
provided by individual distribution companies. The various benefits accrued by the distribution companies
and the agricultural consumers are as shown in the figure.
Figure 5.1: Tangible and Intangible Benefits of KHUSHY
Source: IMM Analysis
5 Cost-Benefit Analysis of Kisan Hit Urja Shakti Yojana (KHUSHY) – PGVCL
Kisan Hit Urja Shakti Yojana (KHUSHY)
Tangible Benefits Intangible Benefits
� Reduction in T&D Losses
� Reduction in Transformer Failure � Reduction in O&M Costs
� Reduction in Motor Failure
� Reduction in Starter Failure
� Reduction in Capacitor Failure
� Increase in availability of free time
� Increase in household and farm assets
Benefits to Agricultural Consumers
Cost Benefit Analysis of Kisan Hit Urja Shakti Yojana (KHUSH Final Report
CONFIDENTIAL
MCB/ISA/A/0/0 10 April 2014 P:\Ahmedabad\AMC\PROJECTS\326672AA01\Documents\Report\GUVNL - KHUSHY - Final Report-V3.docx MCB/ISA/A/0/0 10 April 2014 P:\Ahmedabad\AMC\PROJECTS\326672AA01\Documents\Report\GUVNL - KHUSHY - Final Report-V3.docx
38
5.1 Implementation Details of KHUSHY
The implementation of KHUSHY was done in all distribution companies. The detailed lists of feeders and
villages which have benefitted under the scheme and corresponding details have been attached as
Appendix A.
Table 5.1: PGVCL - KHUSHY Implementation Details
Source: IMM Analysis
5.2 Benefits Accrued Under KHUSHY
The distribution companies have accrued varied tangible and intangible benefits under KHUSHY. The
assessments of the tangible benefits have been done on the basis of the year on year information provided
by the individual DISCOMs. The broad tangible benefits accrued by the distribution companies under the
scheme are as under:
� Reduction in Transmission &Distribution (T&D) Losses
� Reduction in transformer failure
� Decrease in O&M Costs
5.2.1 Transmission and Distribution Losses (PGVCL)
Energy losses occur in the process of supplying electricity to consumers due to technical and commercial
losses. The technical losses are due to energy dissipated in the conductors and equipment used for
transmission, transformation, sub- transmission and distribution of power. The losses can be further sub
grouped depending upon the stage of power transformation & transmission system as Transmission
Losses (400kV/220kV/132kV/66kV), as Sub transmission losses (33kV /11kV) and Distribution losses
(11kV/0.4kv). The commercial losses are caused by pilferage (Hooking), defective meters, and errors in
meter reading and in estimating unmetered supply of energy.
Under KHUSHY major investment in infrastructure has been done with the intention to reduce the
aforesaid losses. Under the scheme HT lines are stretched to individual farms and dedicated transformers
have been installed. This is expected to reduce the incidence of hooking to a large extent.
5.2.1.1 Units Sent Out and Units Billed
The figures on units sent out and units billed are a clear indication on the change in T&D losses. The
percentage of units loss was in excess of 59% in the year ending 2006-07 which has dipped to 43% in the
year ending 2012-13.
DISCOM Feeders No. of Customers
PGVCL 161 38175

Cost Benefit Analysis of Kisan Hit Urja Shakti Yojana (KHUSH Final Report
CONFIDENTIAL
MCB/ISA/A/0/0 10 April 2014 P:\Ahmedabad\AMC\PROJECTS\326672AA01\Documents\Report\GUVNL - KHUSHY - Final Report-V3.docx MCB/ISA/A/0/0 10 April 2014 P:\Ahmedabad\AMC\PROJECTS\326672AA01\Documents\Report\GUVNL - KHUSHY - Final Report-V3.docx
39
Figure 5.2: PGVCL - Year-Wise % Units Loss
Source: IMM Analysis
Table 5.2: Year-Wise Units Sent Out and Units Billed
Year Units Sent Out (MUs) Units Billed (MUs) Loss (MUs) % Dist. Loss
2006-07 523.12 216.46 306.66 59%
2007-08 612.54 256.94 355.6 58%
2008-09 663.37 280.44 382.93 58%
2009-10 747.45 316.83 430.62 58%
2010-11 615.68 331.86 283.82 46%
2011-12 672.02 359.97 312.05 46%
2012-13 748.39 426.52 321.87 43%
Source: IMM Analysis
0
10
20
30
40
50
60
70
80
90
100
2006-07 2007-08 2008-09 2009-10 2010-11 2011-12 2012-13
Year-Wise % Units Loss
Year-Wise % Units Loss

Cost Benefit Analysis of Kisan Hit Urja Shakti Yojana (KHUSH Final Report
CONFIDENTIAL
MCB/ISA/A/0/0 10 April 2014 P:\Ahmedabad\AMC\PROJECTS\326672AA01\Documents\Report\GUVNL - KHUSHY - Final Report-V3.docx MCB/ISA/A/0/0 10 April 2014 P:\Ahmedabad\AMC\PROJECTS\326672AA01\Documents\Report\GUVNL - KHUSHY - Final Report-V3.docx
40
5.2.2 Transformer Failures (PGVCL)
5.2.2.1 Transformer Failure
The percentage of Transformer Failure as around 67 % in the year ending 2006-07 which has dipped to 5
% in the year ending 2012-13
Table 5.3: Year-Wise Details on % Transformer Failure
DISCOM 2006-07 2007-08 2008-09 2009-10 2010-11 2011-12 2012-13
PGVCL 67% 59% 45% 29% 13% 9% 5%
Source: IMM Analysis
5.3 Payback Period (PGVCL)
The capital for the KHUSHY scheme has been sourced from Encon grant as well as share capital. Further
the implementation of the project started from the year 2008-09. The implementation of the scheme has
been done in phases spreading from the year 2008 to present year. The capital expenditure hence has
been spread over the years. The year-wise transmission and distribution losses vary largely from feeder to
feeder which is the basis of deriving the payback periods. The consultant have hence taken various
assumptions for the calculation of payback periods which are as under
Figure 5.3: PGVCL Year-Wise Transformer Failure
Source: IMM Analysis
0%
10%
20%
30%
40%
50%
60%
70%
80%
90%
100%
2006-07 2007-08 2008-09 2009-10 2010-11 2011-12 2012-13
Transformer Failures

Cost Benefit Analysis of Kisan Hit Urja Shakti Yojana (KHUSH Final Report
CONFIDENTIAL
MCB/ISA/A/0/0 10 April 2014 P:\Ahmedabad\AMC\PROJECTS\326672AA01\Documents\Report\GUVNL - KHUSHY - Final Report-V3.docx MCB/ISA/A/0/0 10 April 2014 P:\Ahmedabad\AMC\PROJECTS\326672AA01\Documents\Report\GUVNL - KHUSHY - Final Report-V3.docx
41
5.3.1 Selection of Baseline Loss/Sent Unit
The Average yearly losses/Sent Units from 2006-07 to the year of conversion into HVDS have been taken
as the baseline loss for the calculation of payback period.
5.3.2 Selection of Cost Realization
To calculate the payback period it is necessary to convert the units saved after the implementation of
KHUSHY into monetary terms. The consultants have considered various options for the same which are
described as under
� To convert the units saved into monetary terms using Average Energy Charge Realization of HT
Industry Segment (as per GERC Filing)
� To convert the units saved into monetary terms using Total Average Energy Charge Realization
excluding Agriculture (as per GERC Filing)
� To convert the units saved into monetary terms using Average Energy Charge Realization of Agriculture
Segment ( as per GERC Filing)
For the current study the consultant are using the second option ie. Average Energy Charge Realization
excluding Agriculture (as per GERC Filing)
5.3.3 Cost of Capital
The capital sources for the scheme are the Encon grant and the share capital of individual distribution
companies. The assumptions of the cost of capital of different capital sources are as under. The cost of
capital of Encon has been taken as 0% as it is a grant.
Capital Source Cost of Capital %
Energy Conservation Grant 0%
Share Capital 12%
5.3.4 Savings due to reduction in Transformer Failures
The consultants have also taken in to consideration the savings accrued in terms of operational and
maintenance costs due to reduction in transformer failures while calculation payback periods. In absence
of accurate data related to year-wise costs on maintenance of transformers from the distribution
companies, the consultants have taken into consideration estimated costs of repairs and maintenance of a
single transformer which have been provided by PGVCL.

Cost Benefit Analysis of Kisan Hit Urja Shakti Yojana (KHUSH Final Report
CONFIDENTIAL
MCB/ISA/A/0/0 10 April 2014 P:\Ahmedabad\AMC\PROJECTS\326672AA01\Documents\Report\GUVNL - KHUSHY - Final Report-V3.docx MCB/ISA/A/0/0 10 April 2014 P:\Ahmedabad\AMC\PROJECTS\326672AA01\Documents\Report\GUVNL - KHUSHY - Final Report-V3.docx
42
The consultants in addition to calculating total payback period for a particular discom, have also
calculated the payback period for a bunch of feeders completed during a particular year separately
since the inception of the scheme.
5.4 Pay Back Calculations
Table 5.4: PGVCL – Payback Calculations (2008-09)
Particulars Details Units
No. of Feeders 8
No. of Transformers 1415
Total Expenditure 13.6 INR Crores
Base Year (1st Year) 2009-10
Payback Period 2.808 Years
Payback Year 2011-12
Source: IMM Analysis
Table 5.5: PGVCL – Payback Calculations (2009-10)
Particulars Details Units
No. of Feeders 8
No. of Transformers 1444
Total Expenditure 16.55 INR Crores
Base Year (1st Year) 2010-11
Payback Period 2.78 Years
Payback Year 2012-13
Source: IMM Analysis
Table 5.6: PGVCL – Payback Calculations (2010-11)
Particulars Details Units
No. of Feeders 58
No. of Transformers 11412
Total Expenditure 146.10 INR Crores
Base Year (1st Year) 2011-12
Payback Period 6.22 Years
Payback Year 2017-18
Source: IMM Analysis

Cost Benefit Analysis of Kisan Hit Urja Shakti Yojana (KHUSH Final Report
CONFIDENTIAL
MCB/ISA/A/0/0 10 April 2014 P:\Ahmedabad\AMC\PROJECTS\326672AA01\Documents\Report\GUVNL - KHUSHY - Final Report-V3.docx MCB/ISA/A/0/0 10 April 2014 P:\Ahmedabad\AMC\PROJECTS\326672AA01\Documents\Report\GUVNL - KHUSHY - Final Report-V3.docx
43
Table 5.7: PGVCL – Payback Calculations (2011-12)
Particulars Details Units
No. of Feeders 16
No. of Transformers 2080
Total Expenditure 25.09 INR Crores
Base Year (1st Year) 2012-13
Payback Period 5.288 Years
Payback Year 2016-17
Source: IMM Analysis
Table 5.8: PGVCL – Payback Calculations (2012-13)
Particulars Details Units
No. of Feeders 71
No. of Transformers 9719
Total Expenditure 105.53 INR Crores
Base Year (1st Year) 2013-14
Payback Period 4.22 Years
Payback Year 2015-16
Source: IMM Analysis
Table 5.9: PGVCL – Payback Calculations (Dedicated Feeders)
Particulars Details Units
No. of Feeders 161
No. of Transformers 26070
Total Expenditure 306.88 INR Crores
Base Year (1st Year) 2013-14
Payback Period 3.46 Years
Payback Year 2016-17
Source: IMM Analysis
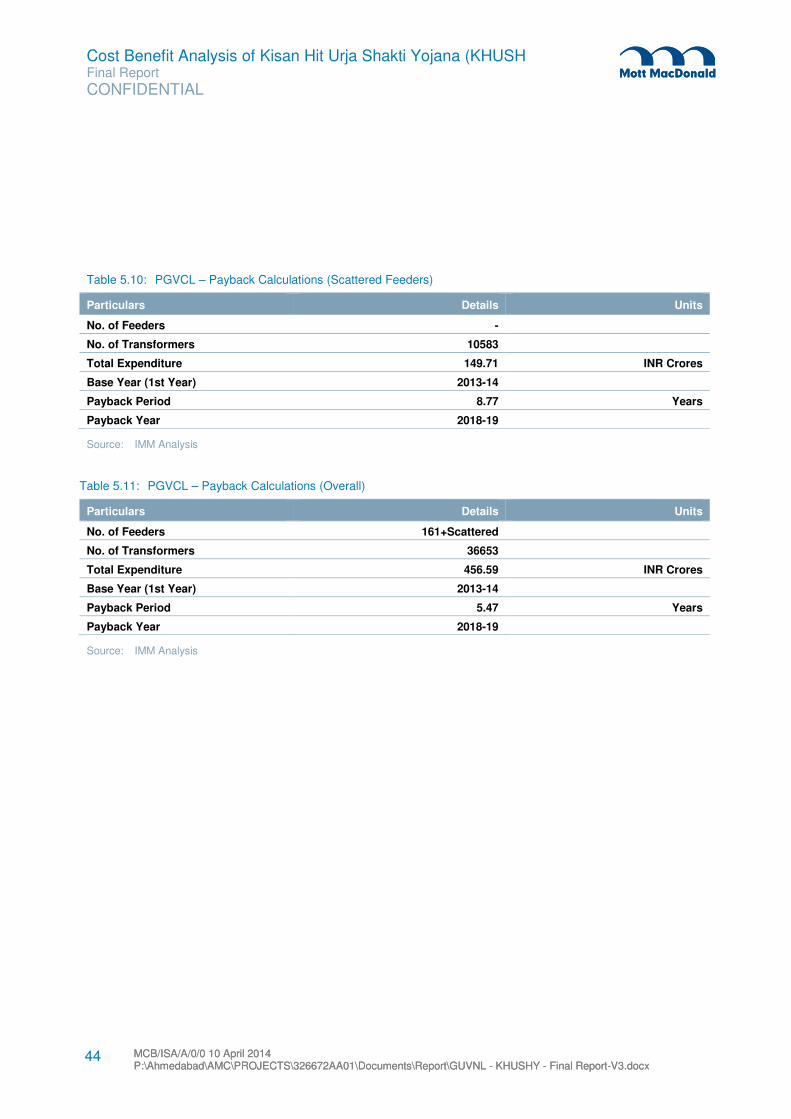
Cost Benefit Analysis of Kisan Hit Urja Shakti Yojana (KHUSH Final Report
CONFIDENTIAL
MCB/ISA/A/0/0 10 April 2014 P:\Ahmedabad\AMC\PROJECTS\326672AA01\Documents\Report\GUVNL - KHUSHY - Final Report-V3.docx MCB/ISA/A/0/0 10 April 2014 P:\Ahmedabad\AMC\PROJECTS\326672AA01\Documents\Report\GUVNL - KHUSHY - Final Report-V3.docx
44
Table 5.10: PGVCL – Payback Calculations (Scattered Feeders)
Particulars Details Units
No. of Feeders -
No. of Transformers 10583
Total Expenditure 149.71 INR Crores
Base Year (1st Year) 2013-14
Payback Period 8.77 Years
Payback Year 2018-19
Source: IMM Analysis
Table 5.11: PGVCL – Payback Calculations (Overall)
Particulars Details Units
No. of Feeders 161+Scattered
No. of Transformers 36653
Total Expenditure 456.59 INR Crores
Base Year (1st Year) 2013-14
Payback Period 5.47 Years
Payback Year 2018-19
Source: IMM Analysis
Cost Benefit Analysis of Kisan Hit Urja Shakti Yojana (KHUSH Final Report
CONFIDENTIAL
MCB/ISA/A/0/0 10 April 2014 P:\Ahmedabad\AMC\PROJECTS\326672AA01\Documents\Report\GUVNL - KHUSHY - Final Report-V3.docx MCB/ISA/A/0/0 10 April 2014 P:\Ahmedabad\AMC\PROJECTS\326672AA01\Documents\Report\GUVNL - KHUSHY - Final Report-V3.docx
45
Part B: Dakshin Gujarat Vij Company Limited (DGVCL)

Cost Benefit Analysis of Kisan Hit Urja Shakti Yojana (KHUSH Final Report
CONFIDENTIAL
MCB/ISA/A/0/0 10 April 2014 P:\Ahmedabad\AMC\PROJECTS\326672AA01\Documents\Report\GUVNL - KHUSHY - Final Report-V3.docx MCB/ISA/A/0/0 10 April 2014 P:\Ahmedabad\AMC\PROJECTS\326672AA01\Documents\Report\GUVNL - KHUSHY - Final Report-V3.docx
46
6.1 Dakshin Gujarat Vij Company Limited
DGVCL was incorporated as a Public
Limited Company on 15th September,
2003, primarily to carry out distribution of
electricity to retail and bulk consumers and
has become operational effective from 1st
April 2005. The Company is engaged in
distribution of electricity in 7 districts
namely Bharuch, Narmada, Surat (except
part of Surat City), Tapi, Dangs, Navsari
and Valsad in South Gujarat. There are in
total 23, 33,000 customers of DGVCL. The
areas covered by DGVCL are as depicted in the figure. The basic details of DGVCL are as illustrated in the
table:
Particulars Details
Total Area Covered By Company 23, 307 Sq. Kms.
Districts Covered 7
Talukas Covered 37
Villages Covered 3, 518
Total Consumers of Company 23, 33,000
Circles 4
Divisions 19
Sub Divisions 112
6 Profile of DGVCL

Cost Benefit Analysis of Kisan Hit Urja Shakti Yojana (KHUSH Final Report
CONFIDENTIAL
MCB/ISA/A/0/0 10 April 2014 P:\Ahmedabad\AMC\PROJECTS\326672AA01\Documents\Report\GUVNL - KHUSHY - Final Report-V3.docx MCB/ISA/A/0/0 10 April 2014 P:\Ahmedabad\AMC\PROJECTS\326672AA01\Documents\Report\GUVNL - KHUSHY - Final Report-V3.docx
47
High Voltage Distribution System including KHUSHY (Kisan Hit Urja Shakti Yojana) is a scheme with an
objective of eliminating Line losses by installing smaller size of distribution transformers matching with the
load demand of individual consumer or very small group of consumers. The scheme has been largely
implemented in the Agriculture Sector since its roll out in the year 2008-09. The scheme had been aimed in
improving Voltage Profile as well as reduction in Technical loss and associated Commercial Loss. The
scheme had been designed to benefit both the agricultural customers as a result of uninterrupted power
with consistent voltage as well as the distribution companies in the long rum due to drastic decrease in
transmission and distribution losses.
The KHUSHY scheme has been implemented across all Distribution companies viz. PGVCL, DGVCL,
MGVCL and UGVCL. In total 174 feeders across all the distribution companies have been converted under
this scheme into HVDS. PGVCL has benefitted immensely under this scheme wherein 157 feeders have
been converted into HVDS. All agricultural customers under these feeders have been allotted dedicated
transformers for their connections.
The details of feeders in DGVCL which have been converted into HVDS and the number of transformers
installed are as given in the table:
7 Implementation of Kisan Hit Urja Shakti Yojana (KHUSHY) – DGVCL

CO
NF
IDE
NT
IAL
Fin
al R
eport
Co
st B
en
efit A
na
lysis
of K
isan
Hit U
rja S
ha
kti Y
oja
na
(KH
US
H
48
MC
B/IS
A/A
/0/0
10 A
pril 2
014
P:\A
hm
edabad\A
MC
\PR
OJE
CT
S\3
26672A
A01\D
ocum
ents
\Report\G
UV
NL - K
HU
SH
Y - F
inal R
eport-V
3.d
ocx
Table 7.1: DGVCL Feeder Details
Circle Division Sub-Division Feeder 10 KVA 16 KVA 25 KVA 63 KVA 100 KVA Total
Project Cost
(Lakhs) Year of
Completion
Surat Rural Circle
Vyara Valod 11Kv Siker Ag Dom
18 234 44 5 0 301 546 Ongoing
Valsad Navsari Amalsad Mendharbhat Ag fdr
18 9 3 4 3 37 28 2009-2010
VALSAD VALSAD RURAL KHRGAM RUMLA 42 54 46 2 0 144 84 2011-2012
VALSAD Vapi Industrial Sarigam Maroli Rural 72 48 8 8 3 139 135 2011-2012
BHARUCH BHARUCH RURAL
AMOD 11 KV DANDA AG
28 70 42 6 0 146 211 2013-2014
BHARUCH BHARUCH RURAL
PALEJ 11 KV KARENA AG
19 24 42 3 0 88 66 2012-2013
BHARUCH BHARUCH RURAL
PALEJ 11 KV PARIYEJ AG
87 36 39 4 0 166 99 2010-2011
Total 284 475 224 32 6 1021 1169

Cost Benefit Analysis of Kisan Hit Urja Shakti Yojana (KHUSH Final Report
CONFIDENTIAL
MCB/ISA/A/0/0 10 April 2014 P:\Ahmedabad\AMC\PROJECTS\326672AA01\Documents\Report\GUVNL - KHUSHY - Final Report-V3.docx MCB/ISA/A/0/0 10 April 2014 P:\Ahmedabad\AMC\PROJECTS\326672AA01\Documents\Report\GUVNL - KHUSHY - Final Report-V3.docx
49
The primary beneficiaries of Kisan Hit Urja Shakti Yojana (KHUSHY) are the agricultural consumers and
the individual distribution companies. While the agricultural consumers were expected to benefit with
quality voltage, freedom from frequent interruptions, timely supply or power, reduction of maintenance
costs, the distribution companies were expected to benefit from drastically reduced transmission and
distribution losses. To understand the actual benefits accrued by the agricultural consumers and in line
with the terms of reference a consumer perception study of agricultural consumers was conducted. The
approach and methodology adopted for the study is as given below
8.1 Approach and Methodology
The consultants have adopted a scientific methodology for the current study which was finalized in
consultation with GUVNL. The basic approach was primarily to design a sample which would represent all
the distribution companies adequately and to extract information from the consumers on several
parameters which can give a holistic understanding of the impact of the scheme.
8.1.1 Sample Design
As per the terms of reference the consumer perception survey had to be done for a sample size of 5% of
the total benefitted consumers which stand at around 65000 Nos. to assess the benefits to the consumer
due to implementation of KHUSHY (HVDS) scheme. Hence the sample size for the survey had to be
around 3250 Nos. The survey has been conducted for 3265 HVDS customers. The distribution of the
sample among the distribution companies and further at circle and feeder level has been done on the basis
of the actual conversion of feeders under KHUSHY (HVDS).
The details of sample design for DGVCL is as under
Table 8.1: Details of conversion of feeders under KHUSHY
Discom Circle Division Sub-Division No. of Feeders No. of Beneficiaries
DGVCL 3 4 4 5 149
Source: Information submitted by DISCOMs
The sample distribution for the consumer perception study in DGVCL is as given in the table below
Table 8.2: Sample Distribution
Discom Circle Division Sub-Division Name of Feeder No. of Beneficiaries
DGVCL
Bharuch Bharuch Rural Amod Danda 32
Karena 21
Valsad Vapi Industrial Sarigam Maroli 15
Valsad Rural Khergam Rumla 31
Surat Rural Vyara Valod Siker 50
Total DGVCL 149
Source: IMM Field Survey
8 Consumer Perception of Kisan Hit Urja Shakti Yojana (KHUSHY) – DGVCL
Cost Benefit Analysis of Kisan Hit Urja Shakti Yojana (KHUSH Final Report
CONFIDENTIAL
MCB/ISA/A/0/0 10 April 2014 P:\Ahmedabad\AMC\PROJECTS\326672AA01\Documents\Report\GUVNL - KHUSHY - Final Report-V3.docx MCB/ISA/A/0/0 10 April 2014 P:\Ahmedabad\AMC\PROJECTS\326672AA01\Documents\Report\GUVNL - KHUSHY - Final Report-V3.docx
50
8.1.2 Questionnaire Design
The consultants have used a pre-designed questionnaire as a research tool for the consumer perception
study. The approach while designing the questionnaire was to extract information on several parameters
as to understand the overall impact on the agricultural consumers. The details which the questionnaire
fetched broadly included the following
� Location Details including district, taluka, Discom, circle, division, subdivision and feeder details.
� General Information including name of beneficiary, address, contact details, number of family
members, source of income, land area, cultivation area, ownership of land, year of connection, billing
type, contract demand, connected load, transformer rating etc.
� Technical Details including voltage quality, line break or shutdown details, transformer failure,
incidence of hooking, crop output and yield, aricultural income etc, power usage details etc.
� Operational Details including average number of days loss per failure, motor maintenance, average
expense per failure, operating days of borewell, operating hours of borewell, number of crops cultivated
during year, income per acre, primary type of crop etc.
� Socio Economic Details including type of house, house hold assets, farm assets, number of cattle etc.
� Broad view and suggestion on the implementation of KHUSHY
The questionnaire includes 51 broad questions in total. A copy of the questionnaire has been appended
with the report.
8.2 Key Results of Consumer Perception Study - DGVCL
The consultants have surveyed a total of 149 agricultural consumers across DGVCL. The key survey
results are as given below
8.2.1 General Information
The General Information including name of beneficiary, address, contact details, number of family
members, source of income, land area, cultivation area, ownership of land, year of connection, billing type,
contract demand, connected load, transformer rating etc. we gathered during the field survey. The analysis
of the same are given in subsequent sections.
8.2.1.1 Source of Income
Economic resources have a significant direct impact on family wellbeing, as family members depend on
each other to meet basic needs and attain a certain standard of living. Changes to economic
circumstances (such as reduced income or wealth, or increased expenditure needs) may prevent a family
from being able afford necessary or desirable items or services. It is coherent that in order to sustain the
family wellbeing (dependency of family members on the head of the family), The source of income needs
to be upheld.

Cost Benefit Analysis of Kisan Hit Urja Shakti Yojana (KHUSH Final Report
CONFIDENTIAL
MCB/ISA/A/0/0 10 April 2014 P:\Ahmedabad\AMC\PROJECTS\326672AA01\Documents\Report\GUVNL - KHUSHY - Final Report-V3.docx MCB/ISA/A/0/0 10 April 2014 P:\Ahmedabad\AMC\PROJECTS\326672AA01\Documents\Report\GUVNL - KHUSHY - Final Report-V3.docx
51
From the below table 4.4 the relationship between the family wellbeing and the source of income can be
depicted. Out of the 3265 beneficiaries surveyed, 100% have their major source of income as Agriculture
with 65% of them having 4-7 dependent family members, 14% having 1-4 family members dependent,
14% having 7-10 family members dependent and 7% having >10 family members dependent on the
income & earnings of the head of the household.
Figure 8.1: Number of Family Members Figure 8.2: Source of Income
Source: IMM Analysis Source: IMM Analysis
Table 8.3: Number of Family Members and Source of Income
No of Family Members No of Respondents Primary Source of Income No of Respondents
1-4 21 Agriculture 149
4-7 96
7-10 21
>10 10
Total 149 Total 149
Source: IMM Analysis
Continuing to achieve the economic prosperity it is equally important to have ownership of the assets &
basic amenities (such as land, house, utilities etc.) which are contributing in the family well-fare and at the
same time in maintaining the living standards.
Out of 100 Beneficiaries surveyed, 100 % of them were having land of their own for cultivation of crops and
carry out their agricultural activities. It was also observed that 62% of them were having Metered
connections whereas 38% of them were un-metered connections.
14%
65%
14%
7%
1-3
4-7
7-10
>10
100%
0%
Agriculture
Others
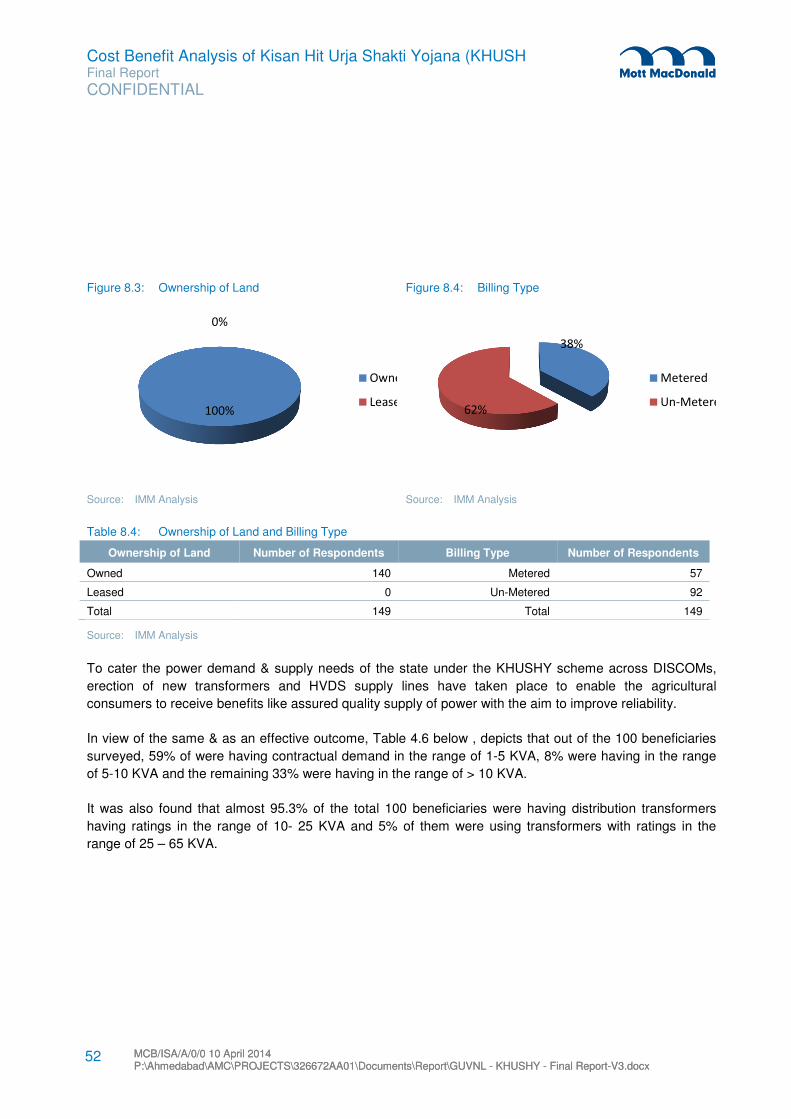
Cost Benefit Analysis of Kisan Hit Urja Shakti Yojana (KHUSH Final Report
CONFIDENTIAL
MCB/ISA/A/0/0 10 April 2014 P:\Ahmedabad\AMC\PROJECTS\326672AA01\Documents\Report\GUVNL - KHUSHY - Final Report-V3.docx MCB/ISA/A/0/0 10 April 2014 P:\Ahmedabad\AMC\PROJECTS\326672AA01\Documents\Report\GUVNL - KHUSHY - Final Report-V3.docx
52
Figure 8.3: Ownership of Land Figure 8.4: Billing Type
Source: IMM Analysis Source: IMM Analysis
Table 8.4: Ownership of Land and Billing Type
Ownership of Land Number of Respondents Billing Type Number of Respondents
Owned 140 Metered 57
Leased 0 Un-Metered 92
Total 149 Total 149
Source: IMM Analysis
To cater the power demand & supply needs of the state under the KHUSHY scheme across DISCOMs,
erection of new transformers and HVDS supply lines have taken place to enable the agricultural
consumers to receive benefits like assured quality supply of power with the aim to improve reliability.
In view of the same & as an effective outcome, Table 4.6 below , depicts that out of the 100 beneficiaries
surveyed, 59% of were having contractual demand in the range of 1-5 KVA, 8% were having in the range
of 5-10 KVA and the remaining 33% were having in the range of > 10 KVA.
It was also found that almost 95.3% of the total 100 beneficiaries were having distribution transformers
having ratings in the range of 10- 25 KVA and 5% of them were using transformers with ratings in the
range of 25 – 65 KVA.
100%
0%
Owned
Leased
38%
62%
Metered
Un-Metered

Cost Benefit Analysis of Kisan Hit Urja Shakti Yojana (KHUSH Final Report
CONFIDENTIAL
MCB/ISA/A/0/0 10 April 2014 P:\Ahmedabad\AMC\PROJECTS\326672AA01\Documents\Report\GUVNL - KHUSHY - Final Report-V3.docx MCB/ISA/A/0/0 10 April 2014 P:\Ahmedabad\AMC\PROJECTS\326672AA01\Documents\Report\GUVNL - KHUSHY - Final Report-V3.docx
53
Figure 8.5: Contract Demand Figure 8.6: Transformer Rating
Source: IMM Analysis Source: IMM Analysis
Table 8.5: Contract Demand and Transformer Rating
Contract Demand Number of Respondents Transformer Rating Number of Respondents
1-5 KVA 88 10 – 25 KVA 142
5-10 KVA 12 25 – 65 KVA 7
>10 KVA 49 >65 KVA 0
Total 149 Total 149
Source: IMM Analysis
8.2.2 Level of Agreement on Technical and Financial Aspects
The surveyed consumers were asked to give their level of agreement on specific statements related to
changes in the technical aspects after implementation of KHUSHY. Their levels of agreement on the
specific statements are as illustrated below.
8.2.2.1 Voltage Level / Quality and Stability
Complementary to price, quality is an important feature of the electricity service provided to consumers.
With Quality comes Stability which together defines the value that customers derive from consuming
electricity. To ensure that the Quality & Stability is delivered effectively to the consumers, it is essential to
maintain the voltage at different levels.
59%
8%
33%1-5
5-10
>10
95.3%
5% 0.0%
10 - 25 KVA
25 - 65 KVA
>65 KVA

Cost Benefit Analysis of Kisan Hit Urja Shakti Yojana (KHUSH Final Report
CONFIDENTIAL
MCB/ISA/A/0/0 10 April 2014 P:\Ahmedabad\AMC\PROJECTS\326672AA01\Documents\Report\GUVNL - KHUSHY - Final Report-V3.docx MCB/ISA/A/0/0 10 April 2014 P:\Ahmedabad\AMC\PROJECTS\326672AA01\Documents\Report\GUVNL - KHUSHY - Final Report-V3.docx
54
The overall outcome of the survey
states that 100% of the surveyed
consumers strongly agree with the
statement that the overall voltage
level/ quality and stability has
improved after the implementation of
the KHUSHY scheme.
Table8.6: Voltage Level/Quality and Stability
Statement DISCOM
Stro
ng
ly
Ag
ree
Ag
ree
No
Ch
an
ge
Dis
ag
ree
Stro
ng
ly
Dis
ag
ree
To
tal
The overall voltage level/quality and stability after implementation of KHUSHY has improved.
DGVCL
100% 0% 0% 0% 0% 100%
149 0 0 0 0 149
Source: IMM Analysis
8.2.2.2 Frequent Line break or Unscheduled Shutdown
The overall outcome of the survey states that 68% consumers strongly agree with the statement that the
frequent line break or unscheduled shutdowns has reduced after the implementation of the KHUSHY
scheme.
Figure 8.7: Voltage Level/Quality and Stability
Source: IMM Analysis
100.0%
Strongly Agree

Cost Benefit Analysis of Kisan Hit Urja Shakti Yojana (KHUSH Final Report
CONFIDENTIAL
MCB/ISA/A/0/0 10 April 2014 P:\Ahmedabad\AMC\PROJECTS\326672AA01\Documents\Report\GUVNL - KHUSHY - Final Report-V3.docx MCB/ISA/A/0/0 10 April 2014 P:\Ahmedabad\AMC\PROJECTS\326672AA01\Documents\Report\GUVNL - KHUSHY - Final Report-V3.docx
55
Figure 8.8: Frequent Line break or Unscheduled Shutdown has reduced
Source: IMM Analysis
Table 8.7: Frequent Line break or Unscheduled Shutdown
Statement DISCOM
Stro
ng
ly
Ag
ree
Ag
ree
No
C
ha
ng
e
Dis
ag
ree
Stro
ng
ly
Dis
ag
ree
To
tal
The frequent line break or unscheduled shutdown after implementation of KHUSHY Scheme has reduced
DGVCL 68% 31% 1% 0% 0% 100%
101 46 2 0 0 149
Source: IMM Analysis
8.2.2.3 Transformer Failure
There can be various reasons to a transformer failure, some of the reasons why a transformer fails
includes design failures, inadequate or defective installation, oil contamination, insulation deterioration,
short circuits, line faults, unknown failures, improper maintenance & operation, lightning, moisture, aging
etc. The risk of a transformer failure is actually two-dimensional: the frequency of failure, and the severity
of failure.
To overcome such issues DISCOMs have provided the consumers with Step-Down Transformers ranging
from ratings 10, 16 & 25 KVA with a service connection through short LT lines and insulated cables Ariel
bunched cables (ABC/ PVC). In continuation to the same all possible measures are taken care by the
respective DISCOMs to carry out its maintenance activities.
68%
31%
1%
Strongly Agree Agree No Change

Cost Benefit Analysis of Kisan Hit Urja Shakti Yojana (KHUSH Final Report
CONFIDENTIAL
MCB/ISA/A/0/0 10 April 2014 P:\Ahmedabad\AMC\PROJECTS\326672AA01\Documents\Report\GUVNL - KHUSHY - Final Report-V3.docx MCB/ISA/A/0/0 10 April 2014 P:\Ahmedabad\AMC\PROJECTS\326672AA01\Documents\Report\GUVNL - KHUSHY - Final Report-V3.docx
56
The overall outcome of the survey states that nearly 98% consumers strongly agree with the statement
that the transformer failure has reduced after the implementation of the KHUSHY scheme.
Table 8.8: Transformer Failure
Statement DISCOM
Stro
ng
ly
Ag
ree
Ag
ree
No
Ch
an
ge
Dis
ag
ree
Stro
ng
ly
Dis
ag
ree
To
tal
The transformer failure has reduced after the implementation of KHUSHY scheme.
DGVCL
98% 1% 1% 0% 0% 100%
146 1 2 0 0 149
Source: IMM Analysis
8.2.2.4 Incidence of Hooking
Normally theft and pilferage accounts for a substantial part of the high transmission and distribution losses,
which are mainly committed by two categories of consumers i.e. non-consumers and bonafide consumers.
Antisocial elements avail unauthorized/unrecorded supply by hooking or tapping the bare conductors of
L.T. feeder or tampered service wires. Pilferage is also done wilfully by way of damaging and / or creating
disturbances to measuring equipment installed at their premises.
Figure 8.9: Transformer Failure has reduced after the implementation of KHUSHY Scheme
Source: IMM Analysis
98.0%
1%1%
Strongly Agree
Agree
No Change

Cost Benefit Analysis of Kisan Hit Urja Shakti Yojana (KHUSH Final Report
CONFIDENTIAL
MCB/ISA/A/0/0 10 April 2014 P:\Ahmedabad\AMC\PROJECTS\326672AA01\Documents\Report\GUVNL - KHUSHY - Final Report-V3.docx MCB/ISA/A/0/0 10 April 2014 P:\Ahmedabad\AMC\PROJECTS\326672AA01\Documents\Report\GUVNL - KHUSHY - Final Report-V3.docx
57
To stop or minimize such activities
DISCOMs under the implementation of
KHUSHY have provided the consumers
with insulated overhead cables known as
Arial Bunched Cables (ABC/PVC) and
other devices and equipment’s. Reducing the length of LT lines by
relocation and installations of additional
distribution transformers. The overall
outcome of the survey states that nearly
99% consumers strongly agree that the
incidence hooking has reduced after the
implementation of the KHUSHY scheme.
Table 8.9: Incidence of Hooking
Statement DISCOM
Stro
ng
ly
Ag
ree
Ag
ree
No
Ch
an
ge
Dis
ag
ree
Stro
ng
ly
Dis
ag
ree
To
tal
Incidence of Hooking has reduced after implementation of KHUSHY Scheme
DGVCL
98% 0% 2% 0% 0% 100%
146 0 3 0 0 149
Source: IMM Analysis
Figure 8.10: Incidence of Hooking
Source: IMM Analysis
98%
2%
Strongly Agree
No Change

Cost Benefit Analysis of Kisan Hit Urja Shakti Yojana (KHUSH Final Report
CONFIDENTIAL
MCB/ISA/A/0/0 10 April 2014 P:\Ahmedabad\AMC\PROJECTS\326672AA01\Documents\Report\GUVNL - KHUSHY - Final Report-V3.docx MCB/ISA/A/0/0 10 April 2014 P:\Ahmedabad\AMC\PROJECTS\326672AA01\Documents\Report\GUVNL - KHUSHY - Final Report-V3.docx
58
8.2.2.5 Crop Output & Yield
As the primary objective of the project
was to provide consumers with Power
distribution related benefits, whereas
Crop output & yield are directly
dependent on the monsoon & weather
conditions for which the electricity has no
significant impact. The survey results
show that 1% of the customers agree
that the crop output and yield has
increased after the implementation of
KHUSHY. 99% of the customers are of
the opinion that there has been no
change in the crop output and yield after
the implementation of KHUSHY.
Table8.10: Crop Output & Yield
Statement DISCOM
Stro
ng
ly
Ag
ree
Ag
ree
No
Ch
an
ge
Dis
ag
ree
Stro
ng
ly
Dis
ag
ree
To
tal
The Crop output & yield has yield has increased after implementation of KHUSHY scheme
DGVCL
0% 1% 99% 0% 0% 100%
0 2 147 0 0 149
Source: IMM Analysis
Figure 8.11: Crop Output & Yield has Increased
Source: IMM Analysis
1.00%
99.00%
Agree No Change

Cost Benefit Analysis of Kisan Hit Urja Shakti Yojana (KHUSH Final Report
CONFIDENTIAL
MCB/ISA/A/0/0 10 April 2014 P:\Ahmedabad\AMC\PROJECTS\326672AA01\Documents\Report\GUVNL - KHUSHY - Final Report-V3.docx MCB/ISA/A/0/0 10 April 2014 P:\Ahmedabad\AMC\PROJECTS\326672AA01\Documents\Report\GUVNL - KHUSHY - Final Report-V3.docx
59
8.2.2.6 Agricultural Income
The perception regarding Agricultural
income can be depicted from the able,
however the overall outcome of the
survey states that nearly 1% consumers
strongly agrees with the statement that
the Agricultural income has increased
after the implementation of the KHUSHY
scheme, whereas 99% states that there
has been no change in terms of their
income.
Table8.11: Agricultural Income
Statement DISCOM
Stro
ng
ly
Ag
ree
Ag
ree
No
Ch
an
ge
Dis
ag
ree
Stro
ng
ly
Dis
ag
ree
To
tal
Agricultural Income has increased after the implementation of KHUSHY Scheme
DGVCL
0% 1% 99% 0% 0% 100%
0 2 147 0 0 149
Source: IMM Analysis
Figure 8.12: Agricultural Income
Source: IMM Analysis
1%
99%
Agree No Change

Cost Benefit Analysis of Kisan Hit Urja Shakti Yojana (KHUSH Final Report
CONFIDENTIAL
MCB/ISA/A/0/0 10 April 2014 P:\Ahmedabad\AMC\PROJECTS\326672AA01\Documents\Report\GUVNL - KHUSHY - Final Report-V3.docx MCB/ISA/A/0/0 10 April 2014 P:\Ahmedabad\AMC\PROJECTS\326672AA01\Documents\Report\GUVNL - KHUSHY - Final Report-V3.docx
60
8.2.2.7 Availability of Free Time
The perception regarding availability of free time
(across DISCOMs) , the overall outcome of the
survey states that nearly 99% consumers
strongly agree with the statement that the
availability of free time after the implementation
of the KHUSHY scheme.
It was found that after the implementation of the
KHUSHY scheme, the power supply to the
consumers was distributed as per schedule &
timings which was an advantage for them. The
free time which was after the implementation
was available with the consumers are utilized by
them for other working & revenue generating
activities, also with a possibility to start a small
shop/business to increase their sources of
income which will be ultimately helping them &
their families to enhance the lifestyle and
standards of living.
Table8.12: Availability of Free Time
Statement DISCOM
Stro
ng
ly
Ag
ree
Ag
ree
No
Ch
an
ge
Dis
ag
ree
Stro
ng
ly
Dis
ag
ree
To
tal
You get free time for yourself after implementation of KHUSHY Scheme
DGVCL 99% 0% 1% 0% 0% 100%
147 0 2 0 0 149
Source: IMM Analysis
Figure 8.13: Availability of Free Time
Source: IMM Analysis
99%
1%
Strongly Agree No Change

Cost Benefit Analysis of Kisan Hit Urja Shakti Yojana (KHUSH Final Report
CONFIDENTIAL
MCB/ISA/A/0/0 10 April 2014 P:\Ahmedabad\AMC\PROJECTS\326672AA01\Documents\Report\GUVNL - KHUSHY - Final Report-V3.docx MCB/ISA/A/0/0 10 April 2014 P:\Ahmedabad\AMC\PROJECTS\326672AA01\Documents\Report\GUVNL - KHUSHY - Final Report-V3.docx
61
8.2.2.8 Overall Satisfaction with the KHUSHY Scheme
The perception regarding Overall satisfaction
(across DISCOMs) can be depicted from the
table, however the overall outcome of the
survey states that nearly 99% beneficiaries
strongly agrees with the statement that they
are overall satisfied after the implementation
of the KHUSHY scheme.
Table 8.13: Overall Satisfaction with the KHUSHY Scheme
Statement DISCOM
Stro
ng
ly
Ag
ree
Ag
ree
No
Ch
an
ge
Dis
ag
ree
Stro
ng
ly
Dis
ag
ree
To
tal
You are overall satisfied with the KHUSHY Scheme
DGVCL 99% 0 1% 0% 0% 100%
147 0 2 0 0 149
Source: IMM Analysis
Figure 8.14: Overall Satisfaction with the KHUSHY Scheme
Source: IMM Analysis
99%
1%
Strongly Agree No Change

Cost Benefit Analysis of Kisan Hit Urja Shakti Yojana (KHUSH Final Report
CONFIDENTIAL
MCB/ISA/A/0/0 10 April 2014 P:\Ahmedabad\AMC\PROJECTS\326672AA01\Documents\Report\GUVNL - KHUSHY - Final Report-V3.docx MCB/ISA/A/0/0 10 April 2014 P:\Ahmedabad\AMC\PROJECTS\326672AA01\Documents\Report\GUVNL - KHUSHY - Final Report-V3.docx
62
8.2.3 Assessment of Tangible Benefits Accrued after implementation of KHUSHY
The consumers were asked specific questions related to Technical, Operational and Financial aspects to
gauge the quantitative difference in tangible benefits before and after the implementation of KHUSHY.
8.2.3.1 Transformer Failure
The perception regarding Transformer
Failure & Average no. of days per
failure (across DISCOMs) can be
depicted from the table. The survey
results show that more than 37% of
the customers experienced
transformer failures around 3-5 times
while other few experienced it more
than 5 times. After the implementation
of KHUSHY all the surveyed
customers experienced transformer
failure in the bracket of 0-2 times. The
results hence show that there has
been a considerable decrease in
transformer failure after the
implementation of KHUSHY.
Figure 8.15: Transformer Failure (Times In a Year)
Source: IMM Analysis
Table8.14: Details on Transformer Failure Before and After KHUSHY
Parameter DISCOM
Total No. of Beneficiaries Surveyed Transformer Failure (No. of times)
Transformer failures before and after implementation of KHUSHY
Before After
0-2 3-5 > 5 0-2 3-5 >5
DGVCL 149 63% 37% 0% 100% 0% 0%
94 55 0 149 0 0
Source: IMM Analysis
0102030405060708090
100
0-2 3-5 > 5
Re
spo
nse
(in
%)
Transformer Failure (No. of times)
Before After

Cost Benefit Analysis of Kisan Hit Urja Shakti Yojana (KHUSH Final Report
CONFIDENTIAL
MCB/ISA/A/0/0 10 April 2014 P:\Ahmedabad\AMC\PROJECTS\326672AA01\Documents\Report\GUVNL - KHUSHY - Final Report-V3.docx MCB/ISA/A/0/0 10 April 2014 P:\Ahmedabad\AMC\PROJECTS\326672AA01\Documents\Report\GUVNL - KHUSHY - Final Report-V3.docx
63
The survey results show that around 40% of the customers experienced 6-10 days loss due to each
transformer failure while other 3% experienced 11-15 days loss due to each transformer failure. After the
implementation of KHUSHY all of the surveyed customers experienced 0-5 days loss due to each
transformer failure and also the rate of failure has decreased to 0-2 per year.
Table 8.15: Details on Average number of Days Loss per Failure Before and After KHUSHY
Parameter DISCOM
No. of Beneficiaries Surveyed Average No. of Days Loss per Failure
Average No. of Days
Loss Per Failure
BEFORE AFTER
0-5 6-10 11-15 16-20 > 20 0-5 6-10 11-15 16-20 > 20
DGVCL 149 53% 40% 3% 0% 3% 100% 0% 0% 0% 0%
79 60 5 0 5 149 0 0 0 0
Source: IMM Analysis
Figure 8.16: Average Number of Days Loss Per Failure – Overall (All Discoms)
Source: IMM Analysis
0
10
20
30
40
50
60
70
80
90
100
0-5 6-10 11-15 16-20 > 20
Re
spo
nse
(in
%)
Average No. of Days Loss per failure
Before
After

Cost Benefit Analysis of Kisan Hit Urja Shakti Yojana (KHUSH Final Report
CONFIDENTIAL
MCB/ISA/A/0/0 10 April 2014 P:\Ahmedabad\AMC\PROJECTS\326672AA01\Documents\Report\GUVNL - KHUSHY - Final Report-V3.docx MCB/ISA/A/0/0 10 April 2014 P:\Ahmedabad\AMC\PROJECTS\326672AA01\Documents\Report\GUVNL - KHUSHY - Final Report-V3.docx
64
8.2.3.2 Motor Maintenance / Failure
The perception regarding Motor
Maintenance & Average no. of days per
failure (across DISCOMs) can be
depicted from the table The survey
results show that more than 48% of the
customers experienced motor failures of
around 3-5 times while other few
experienced it more than 5 times. After
the implementation of KHUSHY all of
the surveyed customers experienced
motor failures in the bracket of 0-2
times. The results hence show that
there has been a considerable decrease
in motor failure after the implementation
of KHUSHY.
Table 8.16: Details on Motor Maintenance / Failure (Times In a Year)
Parameter DISCOM
No. of Beneficiaries
Surveyed Motor Maintenance / Failure (Times In a Year)
Motor Maintenance/ Failure
BEFORE AFTER
0-2 3-5 6-8 >8 0-2 3-5 6-8 >8
DGVCL 149 52% 48% 0% 0% 100% 0% 0% 0%
78 71 0 0 149 0 0 0
Source: IMM Analysis
Figure 8.17: Motor Maintenance / Failure (Times In a Year)
Source: IMM Analysis
0
10
20
30
40
50
60
70
80
90
100
0-2 3-5 6-8 >8
Re
spo
nse
(in
%)
Motor Maintenance per failure
Before After

Cost Benefit Analysis of Kisan Hit Urja Shakti Yojana (KHUSH Final Report
CONFIDENTIAL
MCB/ISA/A/0/0 10 April 2014 P:\Ahmedabad\AMC\PROJECTS\326672AA01\Documents\Report\GUVNL - KHUSHY - Final Report-V3.docx MCB/ISA/A/0/0 10 April 2014 P:\Ahmedabad\AMC\PROJECTS\326672AA01\Documents\Report\GUVNL - KHUSHY - Final Report-V3.docx
65
The survey results show that around 4%
of the customers experienced 6-10 days
loss after each motor failure while other
10% experienced more than 10 days loss
after each motor failure. After the
implementation of KHUSHY all of the
surveyed customers experienced day
loss after each motor failure in the
bracket of 0-5 times. The results hence
show that there has been a considerable
decrease in average day loss per motor
failure after the implementation of
KHUSHY.
Table 8.17: Details on Average no. of Days Loss per Maintenance/ Failure
Parameter DISCOM
No. of Beneficiaries
Surveyed Motor Maintenance / Failure (Times In a Year)
Average no. of Days Loss per Maintenance/ Failure
BEFORE AFTER
0-5 6-10 > 10 0-5 6-10 > 10
DGVCL 149 86% 4% 10% 100% 0% 0%
128 6 15 149 0 0
Source: IMM Analysis
Figure 8.18: Average no. of Days Loss per Maintenance/ Failure
Source: IMM Analysis
0
10
20
30
40
50
60
70
80
90
100
0-5 6-10 > 10
Re
spo
nse
(in
%)
Avg. No. of Days Loss per Maintenance/
Failure
Before After

Cost Benefit Analysis of Kisan Hit Urja Shakti Yojana (KHUSH Final Report
CONFIDENTIAL
MCB/ISA/A/0/0 10 April 2014 P:\Ahmedabad\AMC\PROJECTS\326672AA01\Documents\Report\GUVNL - KHUSHY - Final Report-V3.docx MCB/ISA/A/0/0 10 April 2014 P:\Ahmedabad\AMC\PROJECTS\326672AA01\Documents\Report\GUVNL - KHUSHY - Final Report-V3.docx
66
The survey results show that more than
6% of the customers had to incur expense
in the bracket of INR 2100-4000 due to
each motor failure while other 44% had to
incur expense in the bracket of INR 4100-
6000 due to each motor failure. After the
implementation of KHUSHY all of the
surveyed customers incurred expense in
the bracket of INR 2100-4000 due to each
motor failure. The results hence show that
there has been a considerable decrease in
expense incurred on motor failures after
the implementation of KHUSHY.
Table 8.18: Details on Average Expense per Failure due to Maintenance (INR)
Parameter DISCOM
No. of Beneficiari
es Surveyed
Motor Maintenance / Failure (Times In a Year)
Average Expense
per Failure due to
Maintenance (INR)
BEFORE AFTER
0-2000 2100-4000
4100-6000
6100-8000
> 8000 0-2000 2100-4000
4100-6000
6100-8000
> 8000
DGVCL 149 38% 6% 44% 1% 0% 100% 0% 0% 0% 0%
56 9 66 18 0 149 0 0 0 0
Source: IMM Analysis
Figure 8.19: Average Expense per Failure (INR)
Source: IMM Analysis
0102030405060708090
100
Response (
in %
)
Avg. Expense / Failure due to Maintenance
Before After

Cost Benefit Analysis of Kisan Hit Urja Shakti Yojana (KHUSH Final Report
CONFIDENTIAL
MCB/ISA/A/0/0 10 April 2014 P:\Ahmedabad\AMC\PROJECTS\326672AA01\Documents\Report\GUVNL - KHUSHY - Final Report-V3.docx MCB/ISA/A/0/0 10 April 2014 P:\Ahmedabad\AMC\PROJECTS\326672AA01\Documents\Report\GUVNL - KHUSHY - Final Report-V3.docx
67
8.2.3.3 Motor Starter Failure
The perception regarding Motor starter failure &
Average no. of days per failure (across DISCOMs)
can be depicted from the table The survey results
show that before the implementation of KHUSHY,
more than 85% of the customers experienced motor
starter failures around 2- 3 times/year while other
few experienced it more than 3 times. After the
implementation of KHUSHY all of the surveyed
customers experienced motor starter failure in the
bracket of 0-1 times. The results hence show that
there has been a considerable decrease in motor
starter failure after the implementation of KHUSHY.
Table 8.19: Details on Motor Starter Failure (No/Yr)
Parameter DISCOM
No. of Beneficiari
es Surveyed
Motor starter Failure (Times In a Year)
Average Expense
per Failure due to
Maintenance (INR)
BEFORE AFTER
0-1 2-3 4-5 >5 0-1 2-3 4-5 >5
DGVCL 149 13% 85% 2% 0% 100% 0% 0% 0%
19 127 3 0 149 0 0 0
The survey results show that more than 45% of the customers experienced 2-3 days loss due to each
motor starter failure while other few experienced more
than 3 days loss due to each motor starter failure. After
the implementation of KHUSHY more 100% of the
surveyed customers experienced 0-1 day loss due to
each motor starter failure. The results hence show that
there has been a considerable decrease in average
day loss per motor starter failure after the
implementation of KHUSHY.
Figure 8.20: Average Number of Days Loss Per Failure due to Motor Starter
Source: IMM Analysis
0102030405060708090
100
0-1 2-3 4-5 >5
Response (
in %
)
Motor Starter Failure (No. of Days /year)
Before After
0
10
20
30
40
50
60
70
80
90
100
0-1 2-3 4-5 >5
Response (
in %
)
Motor Starter Failure (No. of times /year)
Before After
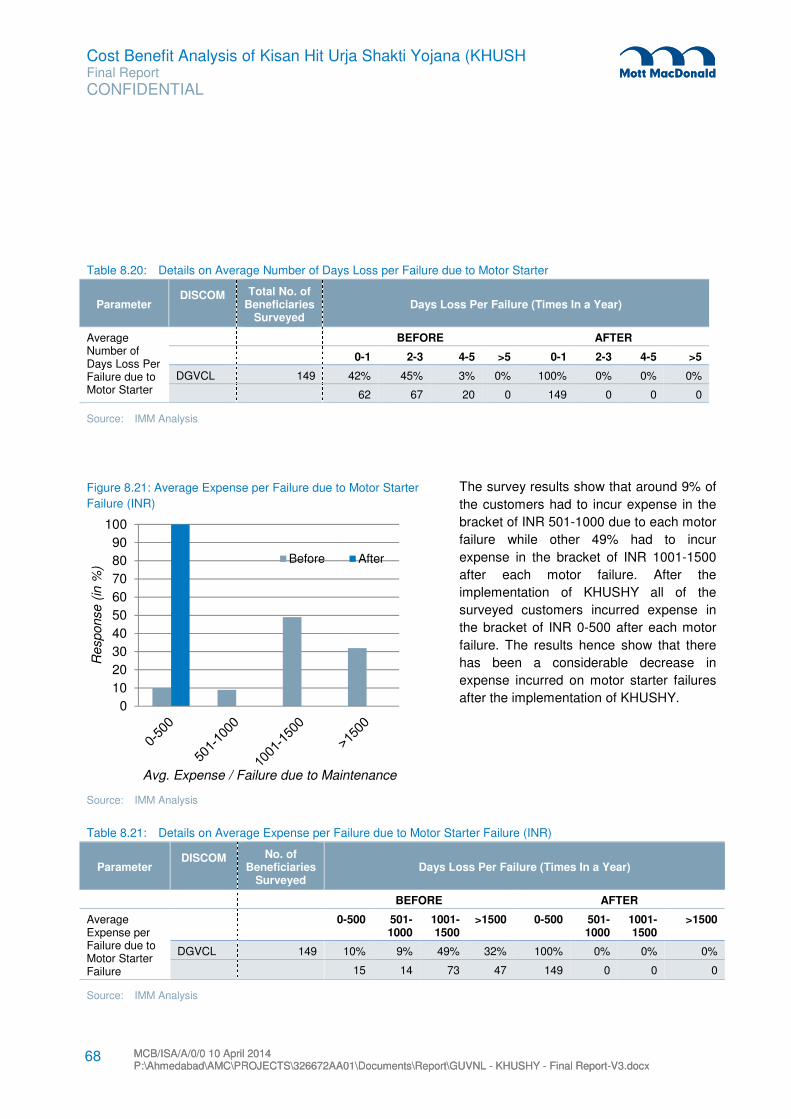
Cost Benefit Analysis of Kisan Hit Urja Shakti Yojana (KHUSH Final Report
CONFIDENTIAL
MCB/ISA/A/0/0 10 April 2014 P:\Ahmedabad\AMC\PROJECTS\326672AA01\Documents\Report\GUVNL - KHUSHY - Final Report-V3.docx MCB/ISA/A/0/0 10 April 2014 P:\Ahmedabad\AMC\PROJECTS\326672AA01\Documents\Report\GUVNL - KHUSHY - Final Report-V3.docx
68
Table 8.20: Details on Average Number of Days Loss per Failure due to Motor Starter
Parameter DISCOM
Total No. of Beneficiaries
Surveyed Days Loss Per Failure (Times In a Year)
Average Number of Days Loss Per Failure due to Motor Starter
BEFORE AFTER
0-1 2-3 4-5 >5 0-1 2-3 4-5 >5
DGVCL 149 42% 45% 3% 0% 100% 0% 0% 0%
62 67 20 0 149 0 0 0
Source: IMM Analysis
The survey results show that around 9% of
the customers had to incur expense in the
bracket of INR 501-1000 due to each motor
failure while other 49% had to incur
expense in the bracket of INR 1001-1500
after each motor failure. After the
implementation of KHUSHY all of the
surveyed customers incurred expense in
the bracket of INR 0-500 after each motor
failure. The results hence show that there
has been a considerable decrease in
expense incurred on motor starter failures
after the implementation of KHUSHY.
Table 8.21: Details on Average Expense per Failure due to Motor Starter Failure (INR)
Parameter DISCOM
No. of Beneficiaries
Surveyed Days Loss Per Failure (Times In a Year)
BEFORE AFTER
Average Expense per Failure due to Motor Starter Failure
0-500 501-1000
1001-1500
>1500 0-500 501-1000
1001-1500
>1500
DGVCL 149 10% 9% 49% 32% 100% 0% 0% 0%
15 14 73 47 149 0 0 0
Source: IMM Analysis
Figure 8.21: Average Expense per Failure due to Motor Starter
Failure (INR)
Source: IMM Analysis
0
10
20
30
40
50
60
70
80
90
100
Response (
in %
)
Avg. Expense / Failure due to Maintenance
Before After
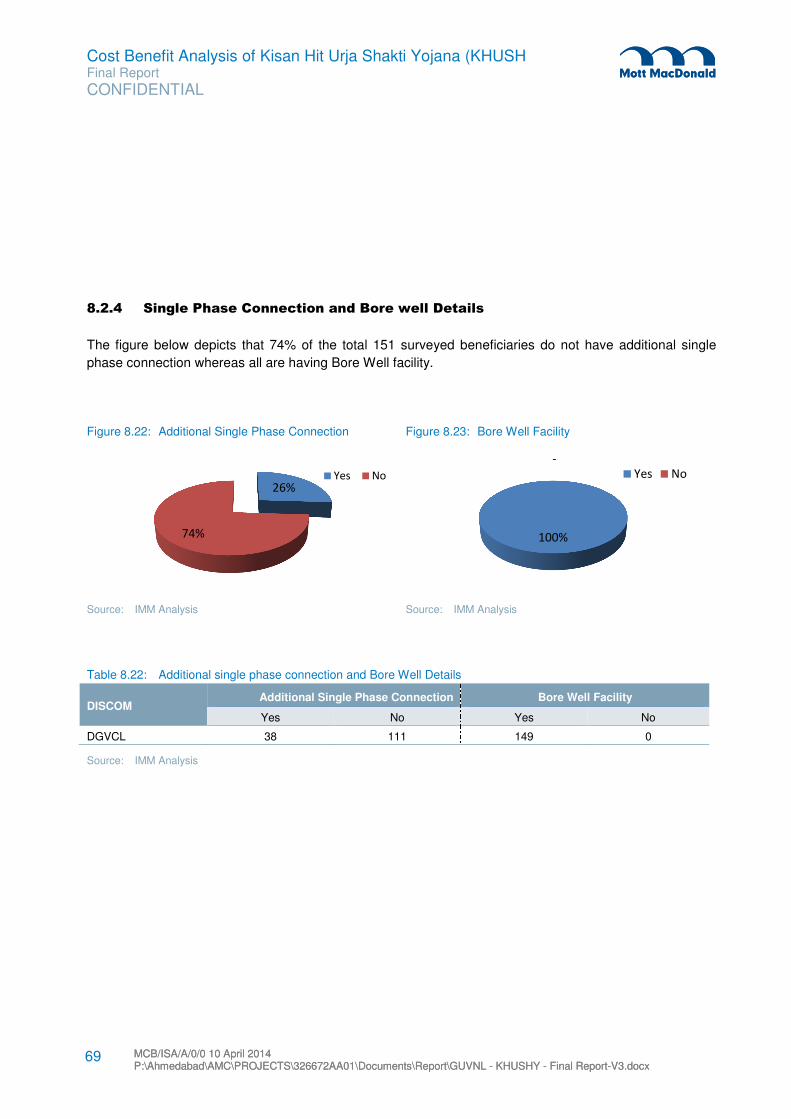
Cost Benefit Analysis of Kisan Hit Urja Shakti Yojana (KHUSH Final Report
CONFIDENTIAL
MCB/ISA/A/0/0 10 April 2014 P:\Ahmedabad\AMC\PROJECTS\326672AA01\Documents\Report\GUVNL - KHUSHY - Final Report-V3.docx MCB/ISA/A/0/0 10 April 2014 P:\Ahmedabad\AMC\PROJECTS\326672AA01\Documents\Report\GUVNL - KHUSHY - Final Report-V3.docx
69
8.2.4 Single Phase Connection and Bore well Details
The figure below depicts that 74% of the total 151 surveyed beneficiaries do not have additional single
phase connection whereas all are having Bore Well facility.
Figure 8.22: Additional Single Phase Connection Figure 8.23: Bore Well Facility
Source: IMM Analysis Source: IMM Analysis
Table 8.22: Additional single phase connection and Bore Well Details
DISCOM Additional Single Phase Connection Bore Well Facility
Yes No Yes No
DGVCL 38 111 149 0
Source: IMM Analysis
26%
74%
Yes No
100%
-
Yes No

Cost Benefit Analysis of Kisan Hit Urja Shakti Yojana (KHUSH Final Report
CONFIDENTIAL
MCB/ISA/A/0/0 10 April 2014 P:\Ahmedabad\AMC\PROJECTS\326672AA01\Documents\Report\GUVNL - KHUSHY - Final Report-V3.docx MCB/ISA/A/0/0 10 April 2014 P:\Ahmedabad\AMC\PROJECTS\326672AA01\Documents\Report\GUVNL - KHUSHY - Final Report-V3.docx
70
8.2.5 View on continuation of the scheme
All of the 149 beneficiaries
surveyed were happy & satisfied
with the implementation of the
KHUSHY Scheme and had
expressed their interest and
willingness in support and
continuation of the scheme in
other parts of the state
aggressively.
Table 8.23: Views on continuation of the Scheme in other areas of Gujarat
DISCOM Yes No
DGVCL 149 0
Source: IMM Analysis
Figure 8.24: View on Continuation of the Scheme in other areas of Gujarat
Source: IMM Analysis

Cost Benefit Analysis of Kisan Hit Urja Shakti Yojana (KHUSH Final Report
CONFIDENTIAL
MCB/ISA/A/0/0 10 April 2014 P:\Ahmedabad\AMC\PROJECTS\326672AA01\Documents\Report\GUVNL - KHUSHY - Final Report-V3.docx MCB/ISA/A/0/0 10 April 2014 P:\Ahmedabad\AMC\PROJECTS\326672AA01\Documents\Report\GUVNL - KHUSHY - Final Report-V3.docx
71
The implementation of KHUSHY had been carried out across all the electricity distribution companies in
Gujarat viz. PGVCL, UGVCL, DGVCL and MGVCL. The implementation of the scheme started in the year
2008-09 and since then numerous feeders have been completely converted into HVDS under the scheme.
In other few feeders implementation has been done in certain pockets of the feeders. Under the scheme
more than 44286 agricultural consumers have benefitted till date. The DISCOMs in turn have accrued
benefits at their level including reduction in Transmission and Distribution (T&D) losses, system
interruptions, greenhouse emissions and increase in revenue. While most of the benefits accrued by the
DISCOMs are tangible, the benefits accrued by the agricultural consumers are mainly intangible. The
consultants had devised a methodology to conduct the cost-benefit analysis which included segregating
the various benefits under the tangible and intangible categories and drawing analysis on the information
provided by individual distribution companies. The various benefits accrued by the distribution companies
and the agricultural consumers are as shown in the figure.
Figure 9.1: Tangible and Intangible Benefits of KHUSHY
9 Cost-Benefit Analysis of Kisan Hit Urja Shakti Yojana (KHUSHY) – DGVCL
Kisan Hit Urja Shakti Yojana (KHUSHY)
Tangibe Benefits Intangible Benefits
� Reduction in T&D Losses
� Reduction in Transformer Failure
� Reduction in O&M Costs
� Reduction in Motor Failure
� Reduction in Starter Failure
� Reduction in Capacitor Failure
� Increase in availability of free time
� Increase in household and farm assets
Benefits to Agricultural Consumers

Cost Benefit Analysis of Kisan Hit Urja Shakti Yojana (KHUSH Final Report
CONFIDENTIAL
MCB/ISA/A/0/0 10 April 2014 P:\Ahmedabad\AMC\PROJECTS\326672AA01\Documents\Report\GUVNL - KHUSHY - Final Report-V3.docx MCB/ISA/A/0/0 10 April 2014 P:\Ahmedabad\AMC\PROJECTS\326672AA01\Documents\Report\GUVNL - KHUSHY - Final Report-V3.docx
72
9.1 Implementation Details of KHUSHY
The implementation of KHUSHY was done in all distribution companies. The detailed lists of feeders,
villages and which have benefitted under the scheme and corresponding details have been attached as
Appendix A.
Table 9.1: KHUSHY Implementation Details
Source: IMM Analysis
9.2 Benefits Accrued Under KHUSHY
The distribution companies have accrued varied tangible and intangible benefits under KHUSHY. The
assessments of the tangible benefits have been done on the basis of the year on year information provided
by the individual DISCOMs. The broad tangible benefits accrued by the distribution companies under the
scheme are as under
� Reduction in Transmission &Distribution (T&D) Losses
� Reduction in System Interruptions
� Decrease in O&M Costs
9.2.1 Transmission and Distribution Losses (DGVCL)
Energy losses occur in the process of supplying electricity to consumers due to technical and commercial
losses. The technical losses are due to energy dissipated in the conductors and equipment used for
transmission, transformation, sub- transmission and distribution of power. The losses can be further sub
grouped depending upon the stage of power transformation & transmission system as Transmission
Losses (400kV/220kV/132kV/66kV), as Sub transmission losses (33kV /11kV) and Distribution losses
(11kV/0.4kv). The commercial losses are caused by pilferage (Hooking), defective meters, and errors in
meter reading and in estimating unmetered supply of energy.
Under KHUSHY major investment in infrastructure has been done with the intention to reduce the
aforesaid losses. Under the scheme HT lines are stretched to individual farms and dedicated transformers
have been installed. This is expected to reduce the incidence of hooking to a large extent.
DISCOM Feeders Villages No. of Customers
DGVCL 7 50 2406

Cost Benefit Analysis of Kisan Hit Urja Shakti Yojana (KHUSH Final Report
CONFIDENTIAL
MCB/ISA/A/0/0 10 April 2014 P:\Ahmedabad\AMC\PROJECTS\326672AA01\Documents\Report\GUVNL - KHUSHY - Final Report-V3.docx MCB/ISA/A/0/0 10 April 2014 P:\Ahmedabad\AMC\PROJECTS\326672AA01\Documents\Report\GUVNL - KHUSHY - Final Report-V3.docx
73
9.2.1.1 Units Sent Out and Units Billed
The figures on units sent out and units billed are a clear indication on the change in T&D losses. The
percentage of unit loss was in excess of 50% in the year ending 2006-07 which has dipped to 24% in the
year ending 2012-13.
Figure 9.2: DGVCL - Year-Wise % Units Loss
Source: IMM Analysis
Table 9.2: Discom-Wise and Year-Wise Units Sent Out and Units Billed
Year Units Sent Out (MUs) Units Billed (MUs) Loss (MUs) % Dist. Loss
2006-07 14.23 6.8 7.43 52%
2007-08 5.42 3.58 1.84 34%
2008-09 11.48 6.28 5.2 45%
2009-10 14.33 7.39 6.94 48%
2010-11 19.4 10.81 8.59 44%
2011-12 24.68 15.53 9.15 37%
2012-13 21.54 16.46 5.07 24%
Source: IMM Analysis
0
10
20
30
40
50
60
70
80
90
100
2006-07 2007-08 2008-09 2009-10 2010-11 2011-12 2012-13
Year-Wise % Units Loss
Year-Wise % Units Loss
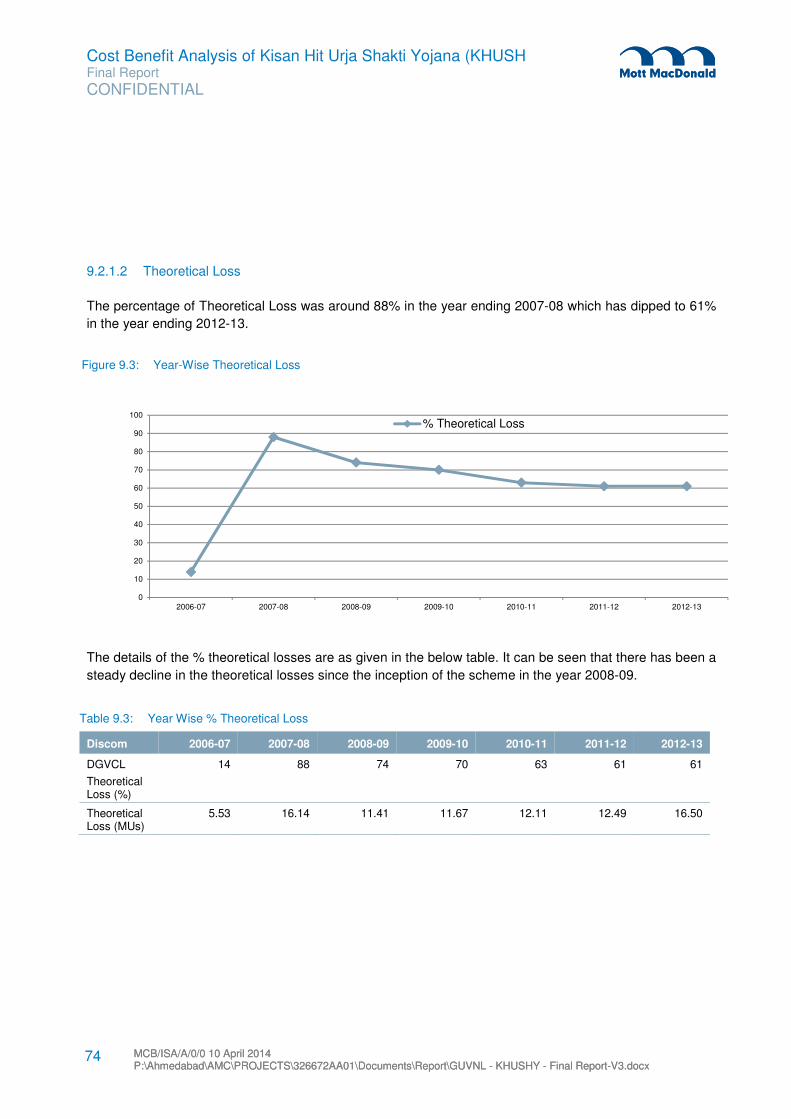
Cost Benefit Analysis of Kisan Hit Urja Shakti Yojana (KHUSH Final Report
CONFIDENTIAL
MCB/ISA/A/0/0 10 April 2014 P:\Ahmedabad\AMC\PROJECTS\326672AA01\Documents\Report\GUVNL - KHUSHY - Final Report-V3.docx MCB/ISA/A/0/0 10 April 2014 P:\Ahmedabad\AMC\PROJECTS\326672AA01\Documents\Report\GUVNL - KHUSHY - Final Report-V3.docx
74
9.2.1.2 Theoretical Loss
The percentage of Theoretical Loss was around 88% in the year ending 2007-08 which has dipped to 61%
in the year ending 2012-13.
The details of the % theoretical losses are as given in the below table. It can be seen that there has been a
steady decline in the theoretical losses since the inception of the scheme in the year 2008-09.
Table 9.3: Year Wise % Theoretical Loss
Discom 2006-07 2007-08 2008-09 2009-10 2010-11 2011-12 2012-13
DGVCL
Theoretical Loss (%)
14 88 74 70 63 61 61
Theoretical Loss (MUs)
5.53 16.14 11.41 11.67 12.11 12.49 16.50
Figure 9.3: Year-Wise Theoretical Loss
0
10
20
30
40
50
60
70
80
90
100
2006-07 2007-08 2008-09 2009-10 2010-11 2011-12 2012-13
% Theoretical Loss

Cost Benefit Analysis of Kisan Hit Urja Shakti Yojana (KHUSH Final Report
CONFIDENTIAL
MCB/ISA/A/0/0 10 April 2014 P:\Ahmedabad\AMC\PROJECTS\326672AA01\Documents\Report\GUVNL - KHUSHY - Final Report-V3.docx MCB/ISA/A/0/0 10 April 2014 P:\Ahmedabad\AMC\PROJECTS\326672AA01\Documents\Report\GUVNL - KHUSHY - Final Report-V3.docx
75
9.2.2 Transformer Failures (DGVCL)
9.2.2.1 Transformer Failure
The percentage of Transformer Failure as around 39 % in the year ending 2006-07 which has dipped to 6
% in the year ending 2012-13
Table 9.4: Year-Wise Details on % Transformer Failure
DISCOM 2006-07 2007-08 2008-09 2009-10 2010-11 2011-12 2012-13
DGVCL 39% 12% 31% 20% 20% 17% 6%
Source: IMM Analysis
9.3 Payback Period (DGVCL)
The capital for the KHUSHY scheme has been sourced from Encon grant as well as share capital. Further
the implementation of the project started from the year 2008-09. The implementation of the scheme has
been done in phases spreading from the year 2008 to present year. The capital expenditure hence has
been spread over the years. The year-wise transmission and distribution losses vary largely from feeder to
feeder which is the basis of deriving the payback periods. The consultant have hence taken various
assumptions for the calculation of payback periods which are as under
Figure 9.4: DGVCL Year-Wise Transformer Failure
Source: IMM Analysis
0%
10%
20%
30%
40%
50%
60%
70%
80%
90%
100%
2006-07 2007-08 2008-09 2009-10 2010-11 2011-12 2012-13
Transformer Failures

Cost Benefit Analysis of Kisan Hit Urja Shakti Yojana (KHUSH Final Report
CONFIDENTIAL
MCB/ISA/A/0/0 10 April 2014 P:\Ahmedabad\AMC\PROJECTS\326672AA01\Documents\Report\GUVNL - KHUSHY - Final Report-V3.docx MCB/ISA/A/0/0 10 April 2014 P:\Ahmedabad\AMC\PROJECTS\326672AA01\Documents\Report\GUVNL - KHUSHY - Final Report-V3.docx
76
9.3.1 Selection of Baseline Loss/Sent Unit
The Average yearly losses/Sent Units from 2006-07 to the year of conversion into HVDS have been taken
as the baseline loss for the calculation of payback period.
9.3.2 Selection of Cost Realization
To calculate the payback period it is necessary to convert the units saved after the implementation of
KHUSHY into monetary terms. The consultants have considered various options for the same which are
described as under
� To convert the units saved into monetary terms using Average Energy Charge Realization of HT
Industry Segment (as per GERC Filing)
� To convert the units saved into monetary terms using Total Average Energy Charge Realization
excluding Agriculture (as per GERC Filing)
� To convert the units saved into monetary terms using Average Energy Charge Realization of Agriculture
Segment ( as per GERC Filing)
For the current study the consultant are using the second option ie. Average Energy Charge Realization
excluding Agriculture (as per GERC Filing)
9.3.3 Cost of Capital
The capital sources for the scheme are the Encon grant and the share capital of individual distribution
companies. The assumptions of the cost of capital of different capital sources are as under. The cost of
capital of Encon has been taken as 0% as it is a grant.
Capital Source Cost of Capital %
Energy Conservation Grant 0%
Share Capital 12%
9.3.4 Savings due to reduction in Transformer Failures
The consultants have also taken in to consideration the savings accrued in terms of operational and
maintenance costs due to reduction in transformer failures while calculation payback periods. In absence
of accurate data related to year-wise costs on maintenance of transformers from the distribution
companies, the consultants have taken into consideration estimated costs of repairs and maintenance of a
single transformer which have been provided by PGVCL.

Cost Benefit Analysis of Kisan Hit Urja Shakti Yojana (KHUSH Final Report
CONFIDENTIAL
MCB/ISA/A/0/0 10 April 2014 P:\Ahmedabad\AMC\PROJECTS\326672AA01\Documents\Report\GUVNL - KHUSHY - Final Report-V3.docx MCB/ISA/A/0/0 10 April 2014 P:\Ahmedabad\AMC\PROJECTS\326672AA01\Documents\Report\GUVNL - KHUSHY - Final Report-V3.docx
77
The consultants in addition to calculating total payback period for a particular discom, have also
calculated the payback period for a bunch of feeders completed during a particular year separately
since the inception of the scheme.
9.4 Pay Back Calculations
Table 9.5: DGVCL – Payback Calculations (Dedicated Feeders)
Particulars Units
No. of Feeders 6
No. of Transformers 283
Total Expenditure 6.22 INR Crores
Base Year (1st Year) 2013-14
Payback Period 15.48 Years
Payback Year 2028-29
Source: IMM Analysis
Table 9.6: DGVCL – Payback Calculations (Scattered Feeders)
Particulars Units
No. of Feeders -
No. of Transformers 724
Total Expenditure 4.38 INR Crores
Base Year (1st Year) 2013-14
Payback Period 53.11 Years
Payback Year 2065-66
Source: IMM Analysis
Table 9.7: DGVCL – Payback Calculations (Overall)
Particulars Units
No. of Feeders -
No. of Transformers 1007
Total Expenditure 10.6 INR Crores
Base Year (1st Year) 2013-14
Payback Period 22.16 Years
Payback Year 2034-35
Source: IMM Analysis

Cost Benefit Analysis of Kisan Hit Urja Shakti Yojana (KHUSH Final Report
CONFIDENTIAL
MCB/ISA/A/0/0 10 April 2014 P:\Ahmedabad\AMC\PROJECTS\326672AA01\Documents\Report\GUVNL - KHUSHY - Final Report-V3.docx MCB/ISA/A/0/0 10 April 2014 P:\Ahmedabad\AMC\PROJECTS\326672AA01\Documents\Report\GUVNL - KHUSHY - Final Report-V3.docx
78
Part C: Uttar Gujarat Vij Company Limited (UGVCL)

Cost Benefit Analysis of Kisan Hit Urja Shakti Yojana (KHUSH Final Report
CONFIDENTIAL
MCB/ISA/A/0/0 10 April 2014 P:\Ahmedabad\AMC\PROJECTS\326672AA01\Documents\Report\GUVNL - KHUSHY - Final Report-V3.docx MCB/ISA/A/0/0 10 April 2014 P:\Ahmedabad\AMC\PROJECTS\326672AA01\Documents\Report\GUVNL - KHUSHY - Final Report-V3.docx
79
10.1 Uttar Gujarat Vij Company Limited
UGVCL was incorporated on September, 2003 and
the commercial operation of company started in April
2005. UGVCL is feeding electricity in 6 districts
namely Banaskantha, Patan, Mehsana,
Sabarkantha, Ahmedabad and Gandhinagar and
partly in other 3 districts including Kheda,
Surendranagar and Bhavnagar of Gujarat covering
total 65 Talukas. UGVCL caters to almost 30,52,773
customers across all its circles out of which nearly
2,46,389 are agricultural customers. The areas
covered by UGVCL are as depicted in the figure.
The basic details of PGVCL are as illustrated in the
table below
Particulars Details
Total Area Covered By Company 49,950 Sq. Kms.
Districts Covered 6+3 (Partly)
Talukas Covered 56+9 (Partly)
Villages Covered 4628
Total Consumers of Company 30,52,773
Circles 4
Divisions 21
10 Profile of UGVCL

Cost Benefit Analysis of Kisan Hit Urja Shakti Yojana (KHUSH Final Report
CONFIDENTIAL
MCB/ISA/A/0/0 10 April 2014 P:\Ahmedabad\AMC\PROJECTS\326672AA01\Documents\Report\GUVNL - KHUSHY - Final Report-V3.docx MCB/ISA/A/0/0 10 April 2014 P:\Ahmedabad\AMC\PROJECTS\326672AA01\Documents\Report\GUVNL - KHUSHY - Final Report-V3.docx
80
High Voltage Distribution System including KHUSHY (Kisan Hit Urja Shakti Yojana) is a scheme with an
objective of eliminating Line losses by installing smaller size of distribution transformers matching with the
load demand of individual consumer or very small group of consumers. The scheme has been largely
implemented in the Agriculture Sector since its roll out in the year 2008-09. The scheme had been aimed in
improving Voltage Profile as well as reduction in Technical loss and associated Commercial Loss. The
scheme had been designed to benefit both the agricultural customers as a result of uninterrupted power
with consistent voltage as well as the distribution companies in the long rum due to drastic decrease in
transmission and distribution losses.
The KHUSHY scheme has been implemented across all Distribution companies viz. PGVCL, DGVCL,
MGVCL and UGVCL. In total 174 feeders across all the distribution companies have been converted under
this scheme into HVDS. PGVCL has benefitted immensely under this scheme wherein 157 feeders have
been converted into HVDS. All agricultural customers under these feeders have been allotted dedicated
transformers for their connections.
The details of feeders in UGVCL which have been converted into HVDS and the number of transformers
installed are as given in the table:
11 Implementation of Kisan Hit Urja Shakti Yojana (KHUSHY)
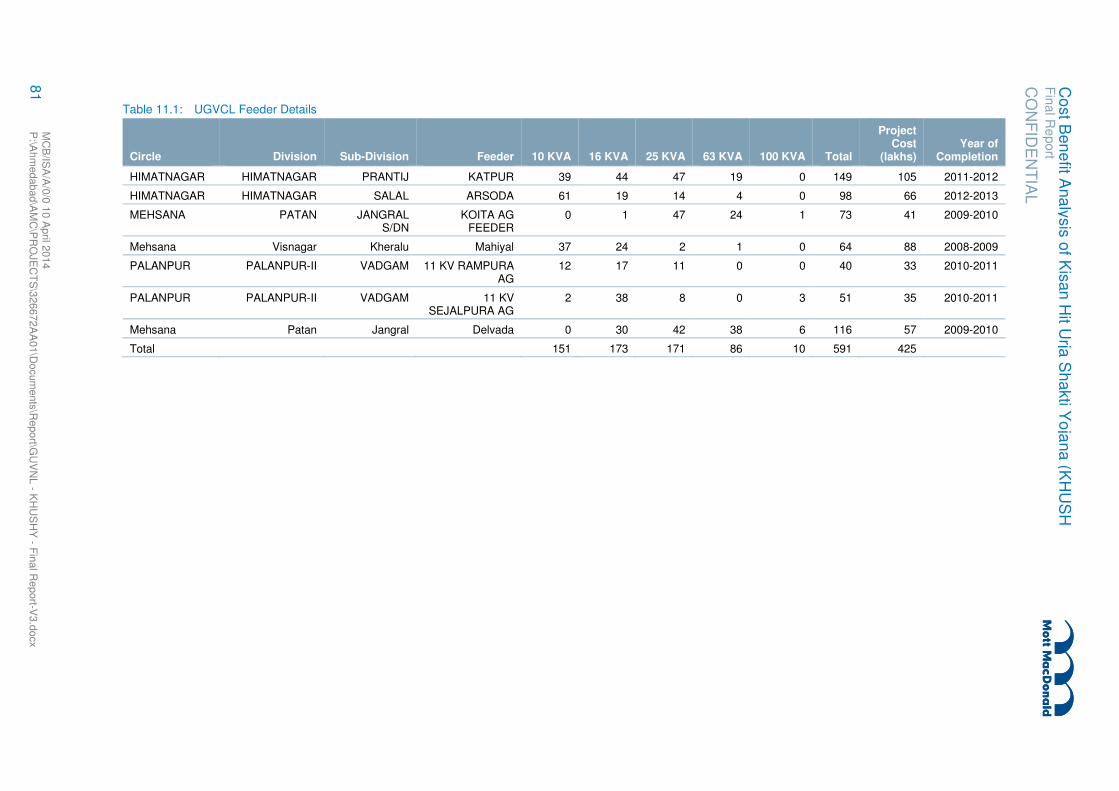
CO
NF
IDE
NT
IAL
Fin
al R
eport
Co
st B
en
efit A
na
lysis
of K
isan
Hit U
rja S
ha
kti Y
oja
na
(KH
US
H
81
MC
B/IS
A/A
/0/0
10 A
pril 2
014
P:\A
hm
edabad\A
MC
\PR
OJE
CT
S\3
26672A
A01\D
ocum
ents
\Report\G
UV
NL - K
HU
SH
Y - F
inal R
eport-V
3.d
ocx
Table 11.1: UGVCL Feeder Details
Circle Division Sub-Division Feeder 10 KVA 16 KVA 25 KVA 63 KVA 100 KVA Total
Project Cost
(lakhs) Year of
Completion
HIMATNAGAR HIMATNAGAR PRANTIJ KATPUR 39 44 47 19 0 149 105 2011-2012
HIMATNAGAR HIMATNAGAR SALAL ARSODA 61 19 14 4 0 98 66 2012-2013
MEHSANA PATAN JANGRAL S/DN
KOITA AG FEEDER
0 1 47 24 1 73 41 2009-2010
Mehsana Visnagar Kheralu Mahiyal 37 24 2 1 0 64 88 2008-2009
PALANPUR PALANPUR-II VADGAM 11 KV RAMPURA AG
12 17 11 0 0 40 33 2010-2011
PALANPUR PALANPUR-II VADGAM 11 KV SEJALPURA AG
2 38 8 0 3 51 35 2010-2011
Mehsana Patan Jangral Delvada 0 30 42 38 6 116 57 2009-2010
Total 151 173 171 86 10 591 425
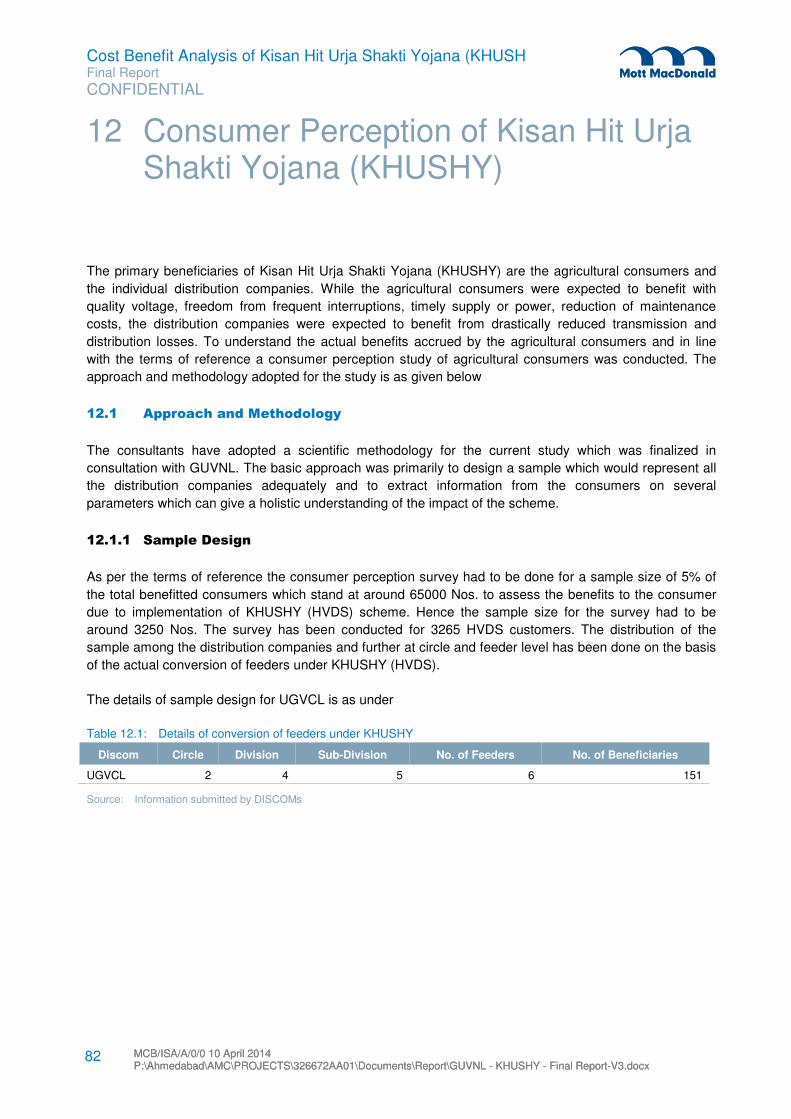
Cost Benefit Analysis of Kisan Hit Urja Shakti Yojana (KHUSH Final Report
CONFIDENTIAL
MCB/ISA/A/0/0 10 April 2014 P:\Ahmedabad\AMC\PROJECTS\326672AA01\Documents\Report\GUVNL - KHUSHY - Final Report-V3.docx MCB/ISA/A/0/0 10 April 2014 P:\Ahmedabad\AMC\PROJECTS\326672AA01\Documents\Report\GUVNL - KHUSHY - Final Report-V3.docx
82
The primary beneficiaries of Kisan Hit Urja Shakti Yojana (KHUSHY) are the agricultural consumers and
the individual distribution companies. While the agricultural consumers were expected to benefit with
quality voltage, freedom from frequent interruptions, timely supply or power, reduction of maintenance
costs, the distribution companies were expected to benefit from drastically reduced transmission and
distribution losses. To understand the actual benefits accrued by the agricultural consumers and in line
with the terms of reference a consumer perception study of agricultural consumers was conducted. The
approach and methodology adopted for the study is as given below
12.1 Approach and Methodology
The consultants have adopted a scientific methodology for the current study which was finalized in
consultation with GUVNL. The basic approach was primarily to design a sample which would represent all
the distribution companies adequately and to extract information from the consumers on several
parameters which can give a holistic understanding of the impact of the scheme.
12.1.1 Sample Design
As per the terms of reference the consumer perception survey had to be done for a sample size of 5% of
the total benefitted consumers which stand at around 65000 Nos. to assess the benefits to the consumer
due to implementation of KHUSHY (HVDS) scheme. Hence the sample size for the survey had to be
around 3250 Nos. The survey has been conducted for 3265 HVDS customers. The distribution of the
sample among the distribution companies and further at circle and feeder level has been done on the basis
of the actual conversion of feeders under KHUSHY (HVDS).
The details of sample design for UGVCL is as under
Table 12.1: Details of conversion of feeders under KHUSHY
Discom Circle Division Sub-Division No. of Feeders No. of Beneficiaries
UGVCL 2 4 5 6 151
Source: Information submitted by DISCOMs
12 Consumer Perception of Kisan Hit Urja Shakti Yojana (KHUSHY)

Cost Benefit Analysis of Kisan Hit Urja Shakti Yojana (KHUSH Final Report
CONFIDENTIAL
MCB/ISA/A/0/0 10 April 2014 P:\Ahmedabad\AMC\PROJECTS\326672AA01\Documents\Report\GUVNL - KHUSHY - Final Report-V3.docx MCB/ISA/A/0/0 10 April 2014 P:\Ahmedabad\AMC\PROJECTS\326672AA01\Documents\Report\GUVNL - KHUSHY - Final Report-V3.docx
83
The sample distribution for the consumer perception study in UGVCL is as given in the table below
Table 12.2: Sample Distribution
Discom Circle Division Sub-Division Name of Feeder No. of Beneficiaries
UGVCL
Himmatnagar Himmatnagar Salal Arsoda 36
Prantij Katpur 15
Mehsana Patan Jangral Delvada 28
Jangral Koita 22
Palanpur Palanpur-2 Vadgam KV Rampura 13
Palanpur Vagada KV Sejalpura 37
Total UGVCL 151
Source: IMM Field Survey
12.1.2 Questionnaire Design
The consultants have used a pre-designed questionnaire as a research tool for the consumer perception
study. The approach while designing the questionnaire was to extract information on several parameters
as to understand the overall impact on the agricultural consumers. The details which the questionnaire
fetched broadly included the following
� Location Details including district, taluka, Discom, circle, division, subdivision and feeder details.
� General Information including name of beneficiary, address, contact details, number of family
members, source of income, land area, cultivation area, ownership of land, year of connection, billing
type, contract demand, connected load, transformer rating etc.
� Technical Details including voltage quality, line break or shutdown details, transformer failure,
incidence of hooking, crop output and yield, aricultural income etc, power usage details etc.
� Operational Details including average number of days loss per failure, motor maintenance, average
expense per failure, operating days of borewell, operating hours of borewell, number of crops cultivated
during year, income per acre, primary type of crop etc.
� Socio Economic Details including type of house, house hold assets, farm assets, number of cattle etc.
� Broad view and suggestion on the implementation of KHUSHY
The questionnaire includes 51 broad questions in total. A copy of the questionnaire has been appended
with the report.
12.2 Key Results of Consumer Perception Study - UGVCL
The consultants have surveyed a total of 151 agricultural consumers across UGVCL. The key survey
results are as given below

Cost Benefit Analysis of Kisan Hit Urja Shakti Yojana (KHUSH Final Report
CONFIDENTIAL
MCB/ISA/A/0/0 10 April 2014 P:\Ahmedabad\AMC\PROJECTS\326672AA01\Documents\Report\GUVNL - KHUSHY - Final Report-V3.docx MCB/ISA/A/0/0 10 April 2014 P:\Ahmedabad\AMC\PROJECTS\326672AA01\Documents\Report\GUVNL - KHUSHY - Final Report-V3.docx
84
12.2.1 General Information
The General Information including name of beneficiary, address, contact details, number of family
members, source of income, land area, cultivation area, ownership of land, year of connection, billing type,
contract demand, connected load, transformer rating etc. we gathered during the field survey. The analysis
of the same is given in subsequent sections.
12.2.1.1 Source of Income
Economic resources have a significant direct impact on family wellbeing, as family members depend on
each other to meet basic needs and attain a certain standard of living. Changes to economic
circumstances (such as reduced income or wealth, or increased expenditure needs) may prevent a family
from being able afford necessary or desirable items or services. It is coherent that in order to sustain the
family wellbeing (dependency of family members on the head of the family), The source of income needs
to be upheld.
From the below table 4.4 the relationship between the family wellbeing and the source of income can be
depicted. Out of the 151 beneficiaries surveyed, 100% have their major source of income as Agriculture
with 53% of them having 4-7 dependent family members, 8% having 1-4 family members dependent, 17%
having 7-10 family members dependent and 22% having >10 family members dependent on the income &
earnings of the head of the household.
Figure 12.1: Number of Family Members Figure 12.2: Source of Income
Source: IMM Analysis Source: IMM Analysis
8%
53%17%
22%1-3
4-7
7-10
>10
100%
0%
Agriculture
Others
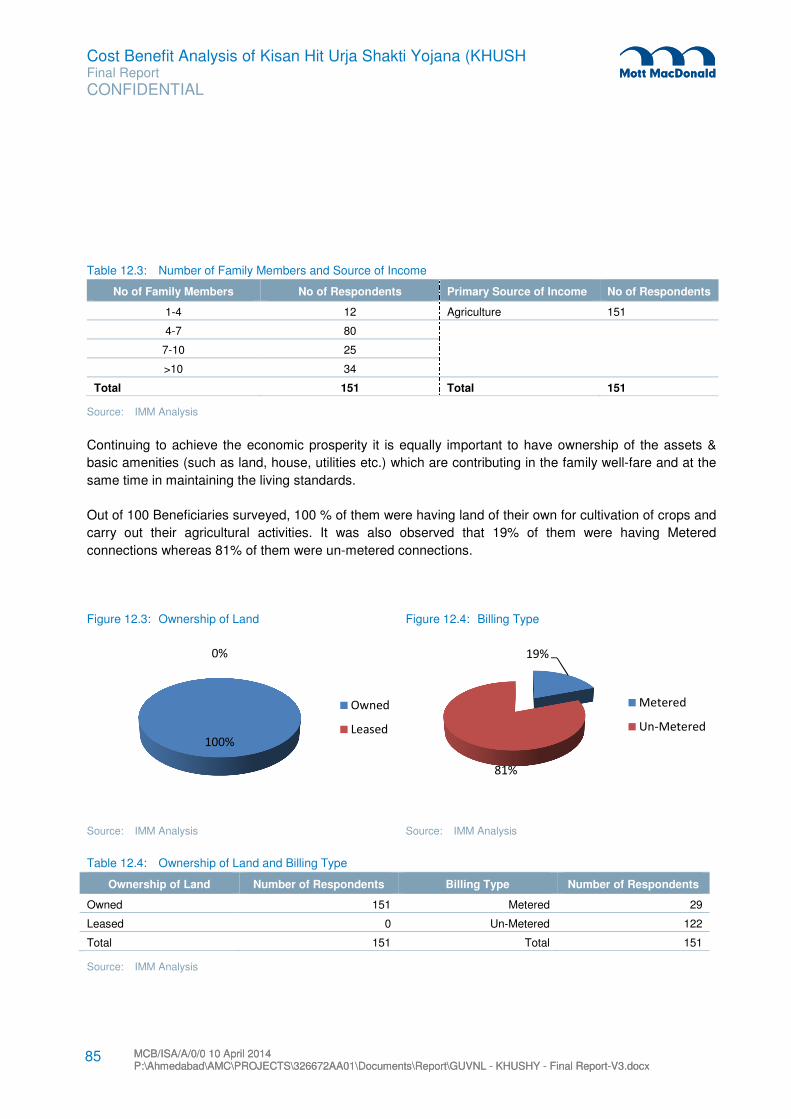
Cost Benefit Analysis of Kisan Hit Urja Shakti Yojana (KHUSH Final Report
CONFIDENTIAL
MCB/ISA/A/0/0 10 April 2014 P:\Ahmedabad\AMC\PROJECTS\326672AA01\Documents\Report\GUVNL - KHUSHY - Final Report-V3.docx MCB/ISA/A/0/0 10 April 2014 P:\Ahmedabad\AMC\PROJECTS\326672AA01\Documents\Report\GUVNL - KHUSHY - Final Report-V3.docx
85
Table 12.3: Number of Family Members and Source of Income
No of Family Members No of Respondents Primary Source of Income No of Respondents
1-4 12 Agriculture 151
4-7 80
7-10 25
>10 34
Total 151 Total 151
Source: IMM Analysis
Continuing to achieve the economic prosperity it is equally important to have ownership of the assets &
basic amenities (such as land, house, utilities etc.) which are contributing in the family well-fare and at the
same time in maintaining the living standards.
Out of 100 Beneficiaries surveyed, 100 % of them were having land of their own for cultivation of crops and
carry out their agricultural activities. It was also observed that 19% of them were having Metered
connections whereas 81% of them were un-metered connections.
Figure 12.3: Ownership of Land Figure 12.4: Billing Type
Source: IMM Analysis Source: IMM Analysis
Table 12.4: Ownership of Land and Billing Type
Ownership of Land Number of Respondents Billing Type Number of Respondents
Owned 151 Metered 29
Leased 0 Un-Metered 122
Total 151 Total 151
Source: IMM Analysis
100%
0%
Owned
Leased
19%
81%
Metered
Un-Metered

Cost Benefit Analysis of Kisan Hit Urja Shakti Yojana (KHUSH Final Report
CONFIDENTIAL
MCB/ISA/A/0/0 10 April 2014 P:\Ahmedabad\AMC\PROJECTS\326672AA01\Documents\Report\GUVNL - KHUSHY - Final Report-V3.docx MCB/ISA/A/0/0 10 April 2014 P:\Ahmedabad\AMC\PROJECTS\326672AA01\Documents\Report\GUVNL - KHUSHY - Final Report-V3.docx
86
To cater the power demand & supply needs of the state under the KHUSHY scheme across DISCOMs,
erection of new transformers and HVDS supply lines have taken place to enable the agricultural
consumers to receive benefits like assured quality supply of power with the aim to improve reliability.
In view of the same & as an effective outcome, Table 4.6 below , depicts that out of the 151 beneficiaries
surveyed, 3% of were having contractual demand in the range of 1-5 KVA, 33% were having in the range
of 5-10 KVA and the remaining 64% were having in the range of > 10 KVA.
It was also found that almost 72% of the total 151 beneficiaries were having distribution transformers
having ratings in the range of 10- 25 KVA, 27% of them were using transformers with ratings in the range
of 25 – 65 KVA and only 0.7% were having transformers with ratings in the range of > 65 KVA.
Figure 12.5: Contract Demand Figure 12.6: Transformer Rating
Source: IMM Analysis Source: IMM Analysis
Table 12.5: Contract Demand and Transformer Rating
Contract Demand Number of Respondents Transformer Rating Number of Respondents
1-5 KVA 4 10 – 25 KVA 109
5-10 KVA 50 25 – 65 KVA 41
>10 KVA 97 >65 KVA 1
Total 151 Total 151
Source: IMM Analysis
3%
33%
64%
1-5
5-10
>10 72.2%
27%
0.7%
10 - 25 KVA
25 - 65 KVA
>65 KVA

Cost Benefit Analysis of Kisan Hit Urja Shakti Yojana (KHUSH Final Report
CONFIDENTIAL
MCB/ISA/A/0/0 10 April 2014 P:\Ahmedabad\AMC\PROJECTS\326672AA01\Documents\Report\GUVNL - KHUSHY - Final Report-V3.docx MCB/ISA/A/0/0 10 April 2014 P:\Ahmedabad\AMC\PROJECTS\326672AA01\Documents\Report\GUVNL - KHUSHY - Final Report-V3.docx
87
12.2.2 Level of Agreement on Technical and Financial Aspects
The surveyed consumers were asked to give their level of agreement on specific statements related to
changes in the technical aspects after implementation of KHUSHY. Their levels of agreement on the
specific statements are as illustrated below.
12.2.2.1 Voltage Level / Quality and Stability
Complementary to price, quality is an important feature of the electricity service provided to consumers.
With Quality comes Stability which together defines the value that customers derive from consuming
electricity. To ensure that the Quality & Stability is delivered effectively to the consumers, it is essential to
maintain the voltage at different levels.
The overall outcome of the survey
states that 100% of the surveyed
consumers strongly agree with the
statement that the overall voltage
level/ quality and stability has
improved after the implementation of
the KHUSHY scheme.
Table 12.6: Voltage Level/Quality and Stability
Statement DISCOM
Stro
ng
ly
Ag
ree
Ag
ree
No
Ch
an
ge
Dis
ag
ree
Stro
ng
ly
Dis
ag
ree
To
tal
The overall voltage level/quality and stability after implementation of KHUSHY has improved.
UGVCL
100% 0% 0% 0% 0% 100%
151 0 0 0 0 151
Source: IMM Analysis
Figure 12.7: Voltage Level/Quality and Stability
Source: IMM Analysis
100.0%
Strongly Agree
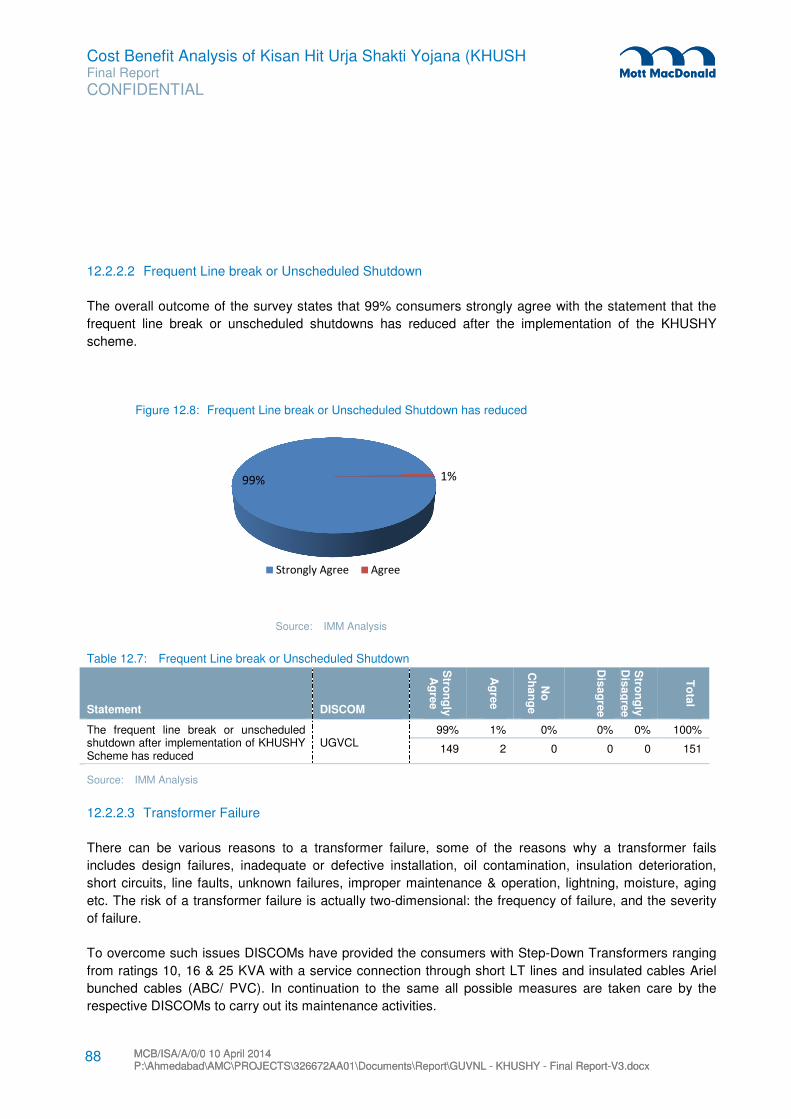
Cost Benefit Analysis of Kisan Hit Urja Shakti Yojana (KHUSH Final Report
CONFIDENTIAL
MCB/ISA/A/0/0 10 April 2014 P:\Ahmedabad\AMC\PROJECTS\326672AA01\Documents\Report\GUVNL - KHUSHY - Final Report-V3.docx MCB/ISA/A/0/0 10 April 2014 P:\Ahmedabad\AMC\PROJECTS\326672AA01\Documents\Report\GUVNL - KHUSHY - Final Report-V3.docx
88
12.2.2.2 Frequent Line break or Unscheduled Shutdown
The overall outcome of the survey states that 99% consumers strongly agree with the statement that the
frequent line break or unscheduled shutdowns has reduced after the implementation of the KHUSHY
scheme.
Figure 12.8: Frequent Line break or Unscheduled Shutdown has reduced
Source: IMM Analysis
Table 12.7: Frequent Line break or Unscheduled Shutdown
Statement DISCOM
Stro
ng
ly
Ag
ree
Ag
ree
No
C
ha
ng
e
Dis
ag
ree
Stro
ng
ly
Dis
ag
ree
To
tal
The frequent line break or unscheduled shutdown after implementation of KHUSHY Scheme has reduced
UGVCL 99% 1% 0% 0% 0% 100%
149 2 0 0 0 151
Source: IMM Analysis
12.2.2.3 Transformer Failure
There can be various reasons to a transformer failure, some of the reasons why a transformer fails
includes design failures, inadequate or defective installation, oil contamination, insulation deterioration,
short circuits, line faults, unknown failures, improper maintenance & operation, lightning, moisture, aging
etc. The risk of a transformer failure is actually two-dimensional: the frequency of failure, and the severity
of failure.
To overcome such issues DISCOMs have provided the consumers with Step-Down Transformers ranging
from ratings 10, 16 & 25 KVA with a service connection through short LT lines and insulated cables Ariel
bunched cables (ABC/ PVC). In continuation to the same all possible measures are taken care by the
respective DISCOMs to carry out its maintenance activities.
99% 1%
Strongly Agree Agree

Cost Benefit Analysis of Kisan Hit Urja Shakti Yojana (KHUSH Final Report
CONFIDENTIAL
MCB/ISA/A/0/0 10 April 2014 P:\Ahmedabad\AMC\PROJECTS\326672AA01\Documents\Report\GUVNL - KHUSHY - Final Report-V3.docx MCB/ISA/A/0/0 10 April 2014 P:\Ahmedabad\AMC\PROJECTS\326672AA01\Documents\Report\GUVNL - KHUSHY - Final Report-V3.docx
89
The overall outcome of the survey states that nearly 99% consumers strongly agree with the statement
that the transformer failure has reduced after the implementation of the KHUSHY scheme.
Table 12.8: Transformer Failure
Statement DISCOM
Stro
ng
ly
Ag
ree
Ag
ree
No
Ch
an
ge
Dis
ag
ree
Stro
ng
ly
Dis
ag
ree
To
tal
The transformer failure has reduced after the implementation of KHUSHY scheme.
UGVCL
99% 1% 0% 0% 0% 100%
150 1 0 0 0 151
Source: IMM Analysis
12.2.2.4 Incidence of Hooking
Normally theft and pilferage accounts for a substantial part of the high transmission and distribution losses,
which are mainly committed by two categories of consumers i.e. non-consumers and bonafide consumers.
Antisocial elements avail unauthorized/unrecorded supply by hooking or tapping the bare conductors of
L.T. feeder or tampered service wires. Pilferage is also done wilfully by way of damaging and / or creating
disturbances to measuring equipment installed at their premises.
Figure 12.9: Transformer Failure has reduced after the implementation of KHUSHY Scheme
Source: IMM Analysis
99.0%
1%
Strongly Agree
Agree

Cost Benefit Analysis of Kisan Hit Urja Shakti Yojana (KHUSH Final Report
CONFIDENTIAL
MCB/ISA/A/0/0 10 April 2014 P:\Ahmedabad\AMC\PROJECTS\326672AA01\Documents\Report\GUVNL - KHUSHY - Final Report-V3.docx MCB/ISA/A/0/0 10 April 2014 P:\Ahmedabad\AMC\PROJECTS\326672AA01\Documents\Report\GUVNL - KHUSHY - Final Report-V3.docx
90
To stop or minimize such activities
DISCOMs under the implementation of
KHUSHY have provided the consumers
with insulated overhead cables known as
Arial Bunched Cables (ABC/PVC) and
other devices and equipment’s. Reducing the length of LT lines by
relocation and installations of additional
distribution transformers. The overall
outcome of the survey states that nearly
99% consumers strongly agree that the
incidence hooking has reduced after the
implementation of the KHUSHY scheme.
Table 12.9: Incidence of Hooking
Statement DISCOM
Stro
ng
ly
Ag
ree
Ag
ree
No
Ch
an
ge
Dis
ag
ree
Stro
ng
ly
Dis
ag
ree
To
tal
Incidence of Hooking has reduced after implementation of KHUSHY Scheme
UGVCL
100% 0% 0% 0% 0% 100%
151 0 0 0 0 151
Source: IMM Analysis
12.2.2.5 Crop Output & Yield
As the primary objective of the project
was to provide consumers with Power
distribution related benefits, whereas
Crop output & yield are directly
dependent on the monsoon & weather
conditions for which the electricity has no
significant impact. The survey results
show that 1% of the customers strongly
agree that the crop output and yield has
increased after the implementation of
KHUSHY. 99% of the customers agree
that the crop output and yield has
increased after the implementation of
KHUSHY.
Figure 12.10: Incidence of Hooking
Source: IMM Analysis
Figure 12.11: Crop Output & Yield has Increased
Source: IMM Analysis
100%
0%
Strongly Agree
No Change
99.00%
1.00%
Agree Strongly Agree

Cost Benefit Analysis of Kisan Hit Urja Shakti Yojana (KHUSH Final Report
CONFIDENTIAL
MCB/ISA/A/0/0 10 April 2014 P:\Ahmedabad\AMC\PROJECTS\326672AA01\Documents\Report\GUVNL - KHUSHY - Final Report-V3.docx MCB/ISA/A/0/0 10 April 2014 P:\Ahmedabad\AMC\PROJECTS\326672AA01\Documents\Report\GUVNL - KHUSHY - Final Report-V3.docx
91
Table 12.10: Crop Output & Yield
Statement DISCOM
Stro
ng
ly
Ag
ree
Ag
ree
No
Ch
an
ge
Dis
ag
ree
Stro
ng
ly
Dis
ag
ree
To
tal
The Crop output & yield has yield has increased after implementation of KHUSHY scheme
UGVCL
1% 99% 0% 0% 0% 100%
1 150 0 0 0 151
Source: IMM Analysis
12.2.2.6 Agricultural Income
The perception regarding Agricultural
income can be depicted from the able,
however the overall outcome of the
survey states that nearly none of the
consumers surveyed agree with the
statement that the Agricultural income
has increased after the implementation
of the KHUSHY scheme
Table 12.11: Agricultural Income
Statement DISCOM
Stro
ng
ly
Ag
ree
Ag
ree
No
Ch
an
ge
Dis
ag
ree
Stro
ng
ly
Dis
ag
ree
To
tal
Agricultural Income has increased after the implementation of KHUSHY Scheme
UGVCL
0 0 100% 0% 0% 100%
0 0 151 0 0 151
Source: IMM Analysis
Figure 12.12: Agricultural Income
Source: IMM Analysis
0%
100%
Agree No Change

Cost Benefit Analysis of Kisan Hit Urja Shakti Yojana (KHUSH Final Report
CONFIDENTIAL
MCB/ISA/A/0/0 10 April 2014 P:\Ahmedabad\AMC\PROJECTS\326672AA01\Documents\Report\GUVNL - KHUSHY - Final Report-V3.docx MCB/ISA/A/0/0 10 April 2014 P:\Ahmedabad\AMC\PROJECTS\326672AA01\Documents\Report\GUVNL - KHUSHY - Final Report-V3.docx
92
12.2.2.7 Availability of Free Time
The perception regarding availability of free time,
the overall outcome of the survey states that
100% of the surveyed consumers strongly agree
with the statement that the availability of free
time after the implementation of the KHUSHY
scheme.
It was found that after the implementation of the
KHUSHY scheme, the power supply to the
consumers was distributed as per schedule &
timings which was an advantage for them. The
free time which was after the implementation
was available with the consumers are utilized by
them for other working & revenue generating
activities, also with a possibility to start a small
shop/business to increase their sources of
income which will be ultimately helping them &
their families to enhance the lifestyle and
standards of living.
Table 12.12: Availability of Free Time
Statement DISCOM
Stro
ng
ly
Ag
ree
Ag
ree
No
Ch
an
ge
Dis
ag
ree
Stro
ng
ly
Dis
ag
ree
To
tal
You get free time for yourself after implementation of KHUSHY Scheme
UGVCL 100% 0% 0% 0% 0% 100%
151 0 0 0 0 151
Source: IMM Analysis
Figure 12.13: Availability of Free Time
Source: IMM Analysis
100%
0%
Strongly Agree No Change

Cost Benefit Analysis of Kisan Hit Urja Shakti Yojana (KHUSH Final Report
CONFIDENTIAL
MCB/ISA/A/0/0 10 April 2014 P:\Ahmedabad\AMC\PROJECTS\326672AA01\Documents\Report\GUVNL - KHUSHY - Final Report-V3.docx MCB/ISA/A/0/0 10 April 2014 P:\Ahmedabad\AMC\PROJECTS\326672AA01\Documents\Report\GUVNL - KHUSHY - Final Report-V3.docx
93
12.2.2.8 Overall Satisfaction with the KHUSHY Scheme
The perception regarding Overall satisfaction
(across DISCOMs) can be depicted from the
table, however the overall outcome of the
survey states that nearly 99% beneficiaries
strongly agrees with the statement that they
are overall satisfied after the implementation
of the KHUSHY scheme.
Table 12.13: Overall Satisfaction with the KHUSHY Scheme
Statement DISCOM
Stro
ng
ly
Ag
ree
Ag
ree
No
C
ha
ng
e
Dis
ag
ree
Stro
ng
ly
Dis
ag
ree
To
tal
You are overall satisfied with the KHUSHY Scheme
UGVCL 100% 0% 0% 0% 0% 100%
151 0 0 0 0 151
Source: IMM Analysis
Figure 12.14: Overall Satisfaction with the KHUSHY Scheme
Source: IMM Analysis
100%
0%
Strongly Agree No Change

Cost Benefit Analysis of Kisan Hit Urja Shakti Yojana (KHUSH Final Report
CONFIDENTIAL
MCB/ISA/A/0/0 10 April 2014 P:\Ahmedabad\AMC\PROJECTS\326672AA01\Documents\Report\GUVNL - KHUSHY - Final Report-V3.docx MCB/ISA/A/0/0 10 April 2014 P:\Ahmedabad\AMC\PROJECTS\326672AA01\Documents\Report\GUVNL - KHUSHY - Final Report-V3.docx
94
12.2.3 Assessment of Tangible Benefits Accrued after implementation of KHUSHY
The consumers were asked specific questions related to Technical, Operational and Financial aspects to
gauge the quantitative difference in tangible benefits before and after the implementation of KHUSHY.
12.2.3.1 Transformer Failure
The perception regarding Transformer
Failure & Average no. of days per
failure (across DISCOMs) can be
depicted from the table. The survey
results show that more than 24% of
the customers experienced
transformer failures around 3-5 times
while other few experienced it more
than 5 times. After the implementation
of KHUSHY all the surveyed
customers experienced transformer
failure in the bracket of 0-2 times. The
results hence show that there has
been a considerable decrease in
transformer failure after the
implementation of KHUSHY.
The survey results show that around 29% of the customers experienced 6-10 days loss due to each
transformer failure while other 1% experienced 11-15 days loss due to each transformer failure. After the
implementation of KHUSHY all of the surveyed customers experienced 0-5 days loss due to each
transformer failure and also the rate of failure has decreased to 0-2 per year.
Figure 12.15: Transformer Failure (Times In a Year)
Source: IMM Analysis
Table 12.14: Details on Transformer Failure Before and After KHUSHY
Parameter DISCOM
Total No. of Beneficiaries Surveyed Transformer Failure (No. of times)
Transformer failures before and after implementation of KHUSHY
Before After
0-2 3-5 > 5 0-2 3-5 >5
UGVCL 151 60% 24% 17% 100% 0% 0%
90 36 25 151 0 .0
Source: IMM Analysis
0102030405060708090
100
0-2 3-5 > 5
Re
spo
nse
(in
%)
Transformer Failure (No. of times)
Before After

Cost Benefit Analysis of Kisan Hit Urja Shakti Yojana (KHUSH Final Report
CONFIDENTIAL
MCB/ISA/A/0/0 10 April 2014 P:\Ahmedabad\AMC\PROJECTS\326672AA01\Documents\Report\GUVNL - KHUSHY - Final Report-V3.docx MCB/ISA/A/0/0 10 April 2014 P:\Ahmedabad\AMC\PROJECTS\326672AA01\Documents\Report\GUVNL - KHUSHY - Final Report-V3.docx
95
Table 12.15: Details on Average number of Days Loss per Failure Before and After KHUSHY
Parameter DISCOM
No. of Beneficiaries Surveyed Average No. of Days Loss per Failure
Average No. of Days
Loss Per Failure
BEFORE AFTER
0-5 6-10 11-15 16-20 > 20 0-5 6-10 11-15 16-20 > 20
UGVCL 151 69% 29% 1% 1% 0% 100% 0% 0% 0% 0%
104 44 1 2 0 151 0 0 0 0
Source: IMM Analysis
Figure 12.16: Average Number of Days Loss Per Failure
Source: IMM Analysis
0
10
20
30
40
50
60
70
80
90
100
0-5 6-10 11-15 16-20 > 20
Re
spo
nse
(in
%)
Average No. of Days Loss per failure
Before
After

Cost Benefit Analysis of Kisan Hit Urja Shakti Yojana (KHUSH Final Report
CONFIDENTIAL
MCB/ISA/A/0/0 10 April 2014 P:\Ahmedabad\AMC\PROJECTS\326672AA01\Documents\Report\GUVNL - KHUSHY - Final Report-V3.docx MCB/ISA/A/0/0 10 April 2014 P:\Ahmedabad\AMC\PROJECTS\326672AA01\Documents\Report\GUVNL - KHUSHY - Final Report-V3.docx
96
12.2.3.2 Motor Maintenance / Failure
The perception regarding Motor
Maintenance & Average no. of days per
failure can be depicted from the table
The survey results show that more than
60% of the customers experienced
motor failures of around 3-5 times while
other few experienced it more than 5
times. After the implementation of
KHUSHY all of the surveyed customers
experienced motor failures in the
bracket of 0-2 times. The results hence
show that there has been a
considerable decrease in motor failure
after the implementation of KHUSHY.
Table 12.16: Details on Motor Maintenance / Failure (Times In a Year)
Parameter DISCOM
No. of Beneficiaries
Surveyed Motor Maintenance / Failure (Times In a Year)
Motor Maintenance/ Failure
BEFORE AFTER
0-2 3-5 6-8 >8 0-2 3-5 6-8 >8
UGVCL 151 32% 60% 5% 3% 100% 0% 0% 0%
48 91 8 4 151 0 0 0
Source: IMM Analysis
Figure 12.17: Motor Maintenance / Failure (Times In a Year)
Source: IMM Analysis
0
10
20
30
40
50
60
70
80
90
100
0-2 3-5 6-8 >8
Re
spo
nse
(in
%)
Motor Maintenance per failure
Before After

Cost Benefit Analysis of Kisan Hit Urja Shakti Yojana (KHUSH Final Report
CONFIDENTIAL
MCB/ISA/A/0/0 10 April 2014 P:\Ahmedabad\AMC\PROJECTS\326672AA01\Documents\Report\GUVNL - KHUSHY - Final Report-V3.docx MCB/ISA/A/0/0 10 April 2014 P:\Ahmedabad\AMC\PROJECTS\326672AA01\Documents\Report\GUVNL - KHUSHY - Final Report-V3.docx
97
The survey results show that around 98%
of the customers experienced 0-5 days
loss after each motor failure while other
2% experienced 6-10 days loss after
each motor failure. After the
implementation of KHUSHY all of the
surveyed customers experienced day
loss after each motor failure in the
bracket of 0-5 times. The results hence
show that there has been a considerable
decrease in average day loss per motor
failure after the implementation of
KHUSHY.
Table 12.17: Details on Average no. of Days Loss per Maintenance/ Failure
Parameter DISCOM
No. of Beneficiaries
Surveyed Motor Maintenance / Failure (Times In a Year)
Average no. of Days Loss per Maintenance/ Failure
BEFORE AFTER
0-5 6-10 > 10 0-5 6-10 > 10
UGVCL 151 98% 2% 0% 100% 0% 0%
148 3 0 151 0 0
Source: IMM Analysis
Figure 12.18: Average no. of Days Loss per Maintenance/ Failure
Source: IMM Analysis
0
10
20
30
40
50
60
70
80
90
100
0-5 6-10 > 10
Re
spo
nse
(in
%)
Avg. No. of Days Loss per Maintenance/
Failure
Before After

Cost Benefit Analysis of Kisan Hit Urja Shakti Yojana (KHUSH Final Report
CONFIDENTIAL
MCB/ISA/A/0/0 10 April 2014 P:\Ahmedabad\AMC\PROJECTS\326672AA01\Documents\Report\GUVNL - KHUSHY - Final Report-V3.docx MCB/ISA/A/0/0 10 April 2014 P:\Ahmedabad\AMC\PROJECTS\326672AA01\Documents\Report\GUVNL - KHUSHY - Final Report-V3.docx
98
The survey results show that more than
45% of the customers had to incur
expense in the bracket of INR 0-2000 due
to each motor failure while other 41% had
to incur expense in the bracket of INR
6100-8000 due to each motor failure. After
the implementation of KHUSHY all of the
surveyed customers incurred expense in
the bracket of INR 0-2000 due to each
motor failure. The results hence show that
there has been a considerable decrease in
expense incurred on motor failures after
the implementation of KHUSHY.
Table 12.18: Details on Average Expense per Failure due to Maintenance (INR)
Parameter DISCOM
No. of Beneficiari
es Surveyed
Motor Maintenance / Failure (Times In a Year)
Average Expense
per Failure due to
Maintenance (INR)
BEFORE AFTER
0-2000 2100-4000
4100-6000
6100-8000
> 8000 0-2000 2100-4000
4100-6000
6100-8000
> 8000
UGVCL 151 45% 2% 12% 41% 0% 100% 0% 0% 0% 0%
68 3 18 62 0 151 0 0 0 0
Source: IMM Analysis
12.2.3.3 Motor Starter Failure
The perception regarding Motor starter failure &
Average no. of days per failure can be depicted
from the table The survey results show that before
the implementation of KHUSHY, more than 69% of
the customers experienced motor starter failures
around 2- 3 times/year while other few experienced
it more than 3 times. After the implementation of
KHUSHY all of the surveyed customers
experienced motor starter failure in the bracket of 0-
1 times. The results hence show that there has
been a considerable decrease in motor starter
failure after the implementation of KHUSHY.
Figure 12.19: Average Expense per Failure (INR)
Source: IMM Analysis
0102030405060708090
100
Response (
in %
)
Avg. Expense / Failure due to Maintenance
Before After
0
10
20
30
40
50
60
70
80
90
100
0-1 2-3 4-5 >5
Response (
in %
)
Motor Starter Failure (No. of times /year)
Before After
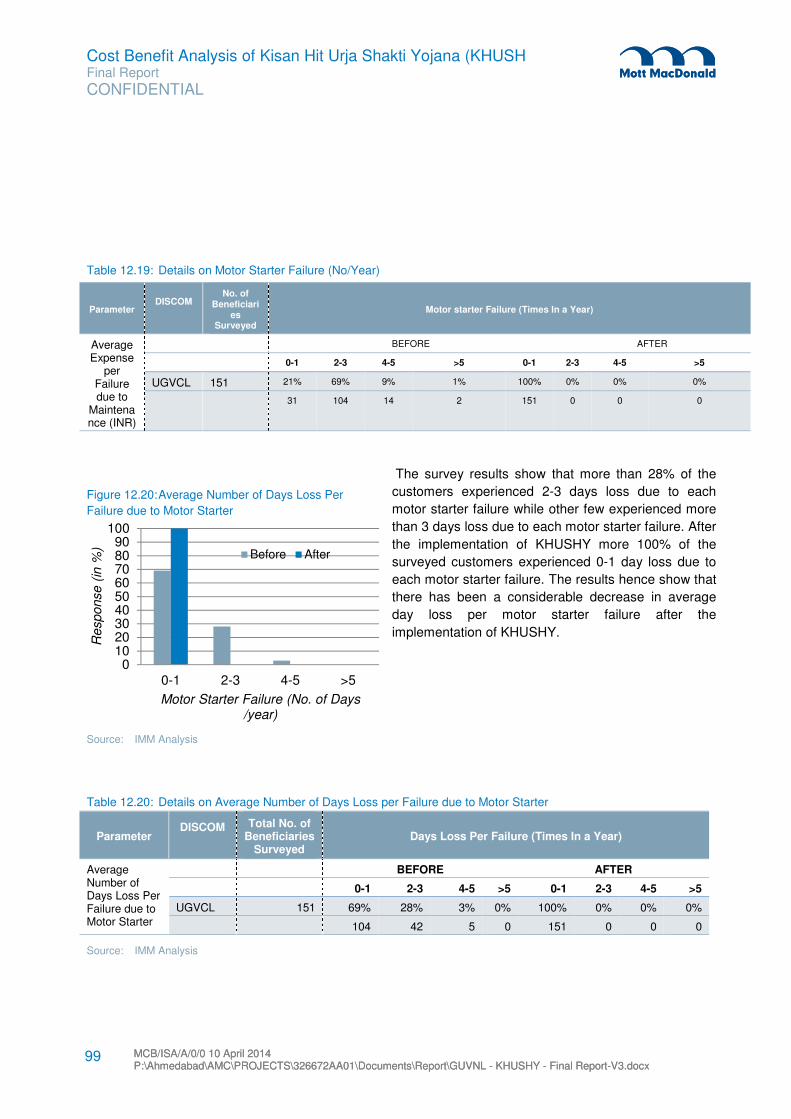
Cost Benefit Analysis of Kisan Hit Urja Shakti Yojana (KHUSH Final Report
CONFIDENTIAL
MCB/ISA/A/0/0 10 April 2014 P:\Ahmedabad\AMC\PROJECTS\326672AA01\Documents\Report\GUVNL - KHUSHY - Final Report-V3.docx MCB/ISA/A/0/0 10 April 2014 P:\Ahmedabad\AMC\PROJECTS\326672AA01\Documents\Report\GUVNL - KHUSHY - Final Report-V3.docx
99
Table 12.19: Details on Motor Starter Failure (No/Year)
Parameter DISCOM
No. of Beneficiari
es Surveyed
Motor starter Failure (Times In a Year)
Average Expense
per Failure due to
Maintenance (INR)
BEFORE AFTER
0-1 2-3 4-5 >5 0-1 2-3 4-5 >5
UGVCL 151 21% 69% 9% 1% 100% 0% 0% 0%
31 104 14 2 151 0 0 0
The survey results show that more than 28% of the
customers experienced 2-3 days loss due to each
motor starter failure while other few experienced more
than 3 days loss due to each motor starter failure. After
the implementation of KHUSHY more 100% of the
surveyed customers experienced 0-1 day loss due to
each motor starter failure. The results hence show that
there has been a considerable decrease in average
day loss per motor starter failure after the
implementation of KHUSHY.
Table 12.20: Details on Average Number of Days Loss per Failure due to Motor Starter
Parameter DISCOM
Total No. of Beneficiaries
Surveyed Days Loss Per Failure (Times In a Year)
Average Number of Days Loss Per Failure due to Motor Starter
BEFORE AFTER
0-1 2-3 4-5 >5 0-1 2-3 4-5 >5
UGVCL 151 69% 28% 3% 0% 100% 0% 0% 0%
104 42 5 0 151 0 0 0
Source: IMM Analysis
Figure 12.20: Average Number of Days Loss Per
Failure due to Motor Starter
Source: IMM Analysis
0102030405060708090
100
0-1 2-3 4-5 >5
Response (
in %
)
Motor Starter Failure (No. of Days /year)
Before After

Cost Benefit Analysis of Kisan Hit Urja Shakti Yojana (KHUSH Final Report
CONFIDENTIAL
MCB/ISA/A/0/0 10 April 2014 P:\Ahmedabad\AMC\PROJECTS\326672AA01\Documents\Report\GUVNL - KHUSHY - Final Report-V3.docx MCB/ISA/A/0/0 10 April 2014 P:\Ahmedabad\AMC\PROJECTS\326672AA01\Documents\Report\GUVNL - KHUSHY - Final Report-V3.docx
100
The survey results show that around 9% of
the customers had to incur expense in the
bracket of INR 501-1000 due to each motor
failure while other 64% had to incur
expense in the bracket of INR >500 after
each motor failure. After the
implementation of KHUSHY all of the
surveyed customers incurred expense in
the bracket of INR 0-500 after each motor
failure. The results hence show that there
has been a considerable decrease in
expense incurred on motor starter failures
after the implementation of KHUSHY.
Table 12.21: Details on Average Expense per Failure due to Motor Starter Failure (INR)
Parameter DISCOM
No. of Beneficiaries
Surveyed Days Loss Per Failure (Times In a Year)
BEFORE AFTER
Average Expense per Failure due to Motor Starter Failure
0-500 501-1000
1001-1500
>1500 0-500 501-1000
1001-1500
>1500
UGVCL 151 9% 1% 26% 64% 100% 0% 0% 0%
13 2 40 96 151 0 0 0
Source: IMM Analysis
Figure 12.21: Average Expense per Failure due to Motor Starter
Failure (INR)
Source: IMM Analysis
0
10
20
30
40
50
60
70
80
90
100
Response (
in %
)
Avg. Expense / Failure due to Maintenance
Before After

Cost Benefit Analysis of Kisan Hit Urja Shakti Yojana (KHUSH Final Report
CONFIDENTIAL
MCB/ISA/A/0/0 10 April 2014 P:\Ahmedabad\AMC\PROJECTS\326672AA01\Documents\Report\GUVNL - KHUSHY - Final Report-V3.docx MCB/ISA/A/0/0 10 April 2014 P:\Ahmedabad\AMC\PROJECTS\326672AA01\Documents\Report\GUVNL - KHUSHY - Final Report-V3.docx
101
12.2.4 Single Phase Connection and Bore well Details
The figure below depicts that 62% of the total 151 surveyed beneficiaries do not have additional single
phase connection whereas all are having Bore Well facility.
Figure 12.22: Additional Single Phase Connection Figure 12.23: Bore Well Facility
Source: IMM Analysis Source: IMM Analysis
Table 12.22: Additional single phase connection and Bore Well Details
DISCOM Additional Single Phase Connection Bore Well Facility
Yes No Yes No
UGVCL 57 94 151 0
Source: IMM Analysis
12.2.5 View on continuation of the scheme
All of the 151 beneficiaries surveyed
were happy & satisfied with the
implementation of the KHUSHY Scheme
and had expressed their interest and
willingness in support and continuation
of the scheme in other parts of the state
aggressively.
38%
62%
Yes No
100%
-
Yes No
Figure 12.24: View on Continuation of the Scheme in other areas of
Gujarat
Source: IMM Analysis

Cost Benefit Analysis of Kisan Hit Urja Shakti Yojana (KHUSH Final Report
CONFIDENTIAL
MCB/ISA/A/0/0 10 April 2014 P:\Ahmedabad\AMC\PROJECTS\326672AA01\Documents\Report\GUVNL - KHUSHY - Final Report-V3.docx MCB/ISA/A/0/0 10 April 2014 P:\Ahmedabad\AMC\PROJECTS\326672AA01\Documents\Report\GUVNL - KHUSHY - Final Report-V3.docx
102
Table 12.23: Views on continuation of the Scheme in other areas of Gujarat
DISCOM Yes No
UGVCL 151 0
Source: IMM Analysis

Cost Benefit Analysis of Kisan Hit Urja Shakti Yojana (KHUSH Final Report
CONFIDENTIAL
MCB/ISA/A/0/0 10 April 2014 P:\Ahmedabad\AMC\PROJECTS\326672AA01\Documents\Report\GUVNL - KHUSHY - Final Report-V3.docx MCB/ISA/A/0/0 10 April 2014 P:\Ahmedabad\AMC\PROJECTS\326672AA01\Documents\Report\GUVNL - KHUSHY - Final Report-V3.docx
103
The implementation of KHUSHY had been carried out across all the electricity distribution companies in
Gujarat viz. PGVCL, UGVCL, DGVCL and MGVCL. The implementation of the scheme started in the year
2008-09 and since then numerous feeders have been completely converted into HVDS under the scheme.
In other few feeders implementation has been done in certain pockets of the feeders. Under the scheme
more than 44286 agricultural consumers have benefitted till date. The DISCOMs in turn have accrued
benefits at their level including reduction in Transmission and Distribution (T&D) losses, system
interruptions, greenhouse emissions and increase in revenue. While most of the benefits accrued by the
DISCOMs are tangible, the benefits accrued by the agricultural consumers are mainly intangible. The
consultants had devised a methodology to conduct the cost-benefit analysis which included segregating
the various benefits under the tangible and intangible categories and drawing analysis on the information
provided by individual distribution companies. The various benefits accrued by the distribution companies
and the agricultural consumers are as shown in the figure.
Figure 13.1: Tangible and Intangible Benefits of KHUSHY
13 Cost-Benefit Analysis of Kisan Hit Urja Shakti Yojana (KHUSHY) – UGVCL
Kisan Hit Urja Shakti Yojana (KHUSHY)
Tangibe Benefits Intangible Benefits
� Reduction in T&D Losses
� Reduction in Transformer Failure
� Reduction in O&M Costs
� Reduction in Motor Failure
� Reduction in Starter Failure
� Reduction in Capacitor Failure
� Increase in availability of free time
� Increase in household and farm assets
Benefits to Agricultural Consumers

Cost Benefit Analysis of Kisan Hit Urja Shakti Yojana (KHUSH Final Report
CONFIDENTIAL
MCB/ISA/A/0/0 10 April 2014 P:\Ahmedabad\AMC\PROJECTS\326672AA01\Documents\Report\GUVNL - KHUSHY - Final Report-V3.docx MCB/ISA/A/0/0 10 April 2014 P:\Ahmedabad\AMC\PROJECTS\326672AA01\Documents\Report\GUVNL - KHUSHY - Final Report-V3.docx
104
13.1 Implementation Details of KHUSHY
The implementation of KHUSHY was done in all distribution companies. The detailed lists of feeders,
villages and which have benefitted under the scheme and corresponding details have been attached as
Appendix A.
Table 13.1: KHUSHY Implementation Details
Source: IMM Analysis
13.2 Benefits Accrued Under KHUSHY
The distribution companies have accrued varied tangible and intangible benefits under KHUSHY. The
assessments of the tangible benefits have been done on the basis of the year on year information provided
by the individual DISCOMs. The broad tangible benefits accrued by the distribution companies under the
scheme are as under:
� Reduction in Transmission &Distribution (T&D) Losses
� Reduction in System Interruptions
� Decrease in O&M Costs
13.2.1 Transmission and Distribution Losses (UGVCL)
Energy losses occur in the process of supplying electricity to consumers due to technical and commercial
losses. The technical losses are due to energy dissipated in the conductors and equipment used for
transmission, transformation, sub- transmission and distribution of power. The losses can be further sub
grouped depending upon the stage of power transformation & transmission system as Transmission
Losses (400kV/220kV/132kV/66kV), as Sub transmission losses (33kV /11kV) and Distribution losses
(11kV/0.4kv). The commercial losses are caused by pilferage (Hooking), defective meters, and errors in
meter reading and in estimating unmetered supply of energy.
Under KHUSHY major investment in infrastructure has been done with the intention to reduce the
aforesaid losses. Under the scheme HT lines are stretched to individual farms and dedicated transformers
have been installed. This is expected to reduce the incidence of hooking to a large extent.
13.2.1.1 Units Sent Out and Units Billed
The figures on units sent out and units billed are a clear indication on the change in T&D losses. The
percentage of units loss was in excess of 21% in the year ending 2007-08 which has decreased to 17% in
the year ending 2012-13.
DISCOM Feeders Villages No. of Customers
UGVCL 6 26 780
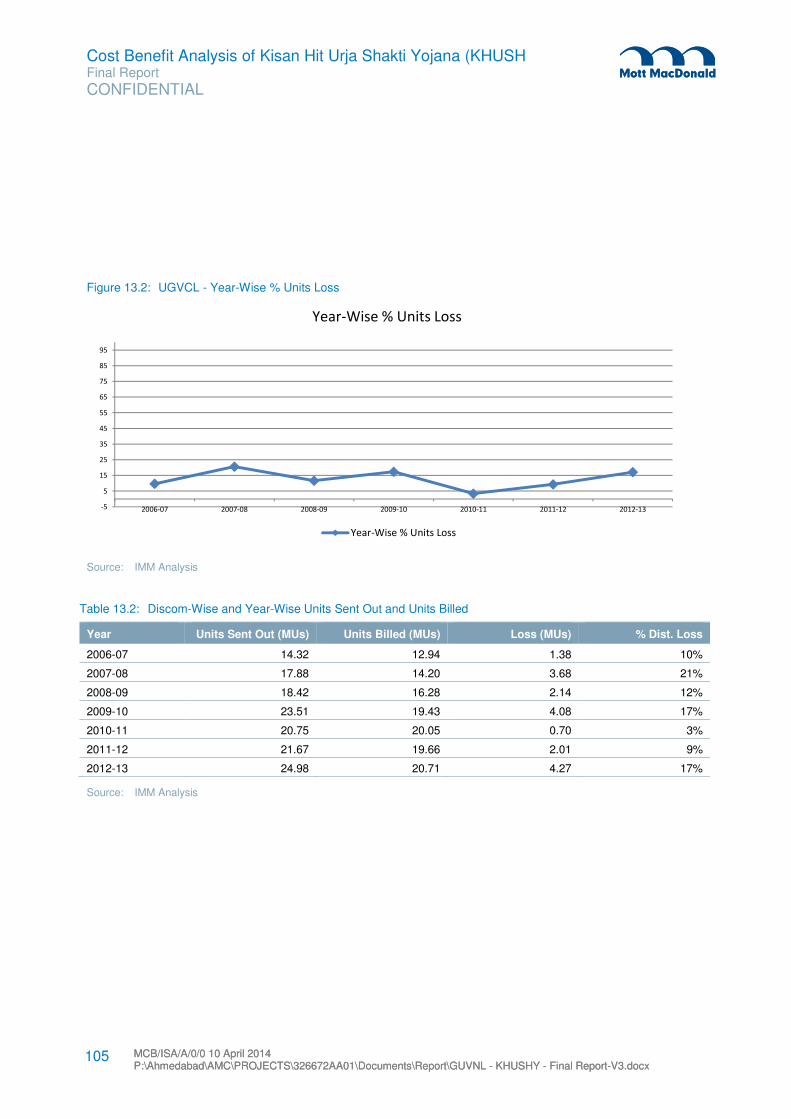
Cost Benefit Analysis of Kisan Hit Urja Shakti Yojana (KHUSH Final Report
CONFIDENTIAL
MCB/ISA/A/0/0 10 April 2014 P:\Ahmedabad\AMC\PROJECTS\326672AA01\Documents\Report\GUVNL - KHUSHY - Final Report-V3.docx MCB/ISA/A/0/0 10 April 2014 P:\Ahmedabad\AMC\PROJECTS\326672AA01\Documents\Report\GUVNL - KHUSHY - Final Report-V3.docx
105
Figure 13.2: UGVCL - Year-Wise % Units Loss
Source: IMM Analysis
Table 13.2: Discom-Wise and Year-Wise Units Sent Out and Units Billed
Year Units Sent Out (MUs) Units Billed (MUs) Loss (MUs) % Dist. Loss
2006-07 14.32 12.94 1.38 10%
2007-08 17.88 14.20 3.68 21%
2008-09 18.42 16.28 2.14 12%
2009-10 23.51 19.43 4.08 17%
2010-11 20.75 20.05 0.70 3%
2011-12 21.67 19.66 2.01 9%
2012-13 24.98 20.71 4.27 17%
Source: IMM Analysis
-5
5
15
25
35
45
55
65
75
85
95
2006-07 2007-08 2008-09 2009-10 2010-11 2011-12 2012-13
Year-Wise % Units Loss
Year-Wise % Units Loss

Cost Benefit Analysis of Kisan Hit Urja Shakti Yojana (KHUSH Final Report
CONFIDENTIAL
MCB/ISA/A/0/0 10 April 2014 P:\Ahmedabad\AMC\PROJECTS\326672AA01\Documents\Report\GUVNL - KHUSHY - Final Report-V3.docx MCB/ISA/A/0/0 10 April 2014 P:\Ahmedabad\AMC\PROJECTS\326672AA01\Documents\Report\GUVNL - KHUSHY - Final Report-V3.docx
106
13.2.1.2 Theoretical Loss
The percentage of Theoretical Loss was around 53% in the year ending 2006-07 which has dipped to 31%
in the year ending 2012-13.
The details of the % theoretical losses are as given in the below table.
Table 13.3: Year Wise % Theoretical Loss
Discom 2006-07 2007-08 2008-09 2009-10 2010-11 2011-12 2012-13
UGVCL
Theoretical Loss (%)
55% 54% 24% 31% 53% 35% 31%
Theoretical Loss (MUs)
20.08 18.96 8.44 12.13 17.82 12.81 12.73
Figure 13.3: Year-Wise Theoretical Loss (%)
0
10
20
30
40
50
60
70
80
90
100
2006-07 2007-08 2008-09 2009-10 2010-11 2011-12 2012-13

Cost Benefit Analysis of Kisan Hit Urja Shakti Yojana (KHUSH Final Report
CONFIDENTIAL
MCB/ISA/A/0/0 10 April 2014 P:\Ahmedabad\AMC\PROJECTS\326672AA01\Documents\Report\GUVNL - KHUSHY - Final Report-V3.docx MCB/ISA/A/0/0 10 April 2014 P:\Ahmedabad\AMC\PROJECTS\326672AA01\Documents\Report\GUVNL - KHUSHY - Final Report-V3.docx
107
13.2.2 Transformer Failures (UGVCL)
13.2.2.1 Transformer Failure
The percentage of Transformer Failure as around 8 % in the year ending 2006-07 which dipped to 5 % in
the year ending 2011-12 and subsequently increased back to 8 % in 2012-13.
Table 13.4: Year-Wise Details on % Transformer Failure
DISCOM 2006-07 2007-08 2008-09 2009-10 2010-11 2011-12 2012-13
UGVCL 14% 16% 9% 5% 5% 7% 4%
Source: IMM Analysis
13.3 Payback Period (UGVCL)
The capital for the KHUSHY scheme has been sourced from Encon grant as well as share capital. Further
the implementation of the project started from the year 2008-09. The implementation of the scheme has
been done in phases spreading from the year 2008 to present year. The capital expenditure hence has
been spread over the years. The year-wise transmission and distribution losses vary largely from feeder to
feeder which is the basis of deriving the payback periods. The consultant have hence taken various
assumptions for the calculation of payback periods which are as under
Figure 13.4: UGVCL Year-Wise Transformer Failure
Source: IMM Analysis
0%
10%
20%
30%
40%
50%
60%
70%
80%
90%
100%
2006-07 2007-08 2008-09 2009-10 2010-11 2011-12 2012-13
Transformer Failures

Cost Benefit Analysis of Kisan Hit Urja Shakti Yojana (KHUSH Final Report
CONFIDENTIAL
MCB/ISA/A/0/0 10 April 2014 P:\Ahmedabad\AMC\PROJECTS\326672AA01\Documents\Report\GUVNL - KHUSHY - Final Report-V3.docx MCB/ISA/A/0/0 10 April 2014 P:\Ahmedabad\AMC\PROJECTS\326672AA01\Documents\Report\GUVNL - KHUSHY - Final Report-V3.docx
108
13.3.1 Selection of Baseline Loss/Sent Unit
The Average yearly losses/Sent Units from 2006-07 to the year of conversion into HVDS have been taken
as the baseline loss for the calculation of payback period.
13.3.2 Selection of Cost Realization
To calculate the payback period it is necessary to convert the units saved after the implementation of
KHUSHY into monetary terms. The consultants have considered various options for the same which are
described as under
� To convert the units saved into monetary terms using Average Energy Charge Realization of HT
Industry Segment (as per GERC Filing)
� To convert the units saved into monetary terms using Total Average Energy Charge Realization
excluding Agriculture (as per GERC Filing)
� To convert the units saved into monetary terms using Average Energy Charge Realization of Agriculture
Segment ( as per GERC Filing)
For the current study the consultant are using the second option ie. Average Energy Charge Realization
excluding Agriculture (as per GERC Filing)
13.3.3 Cost of Capital
The capital sources for the scheme are the Encon grant and the share capital of individual distribution
companies. The assumptions of the cost of capital of different capital sources are as under. The cost of
capital of Encon has been taken as 0% as it is a grant.
Capital Source Cost of Capital %
Energy Conservation Grant 0%
Share Capital 12%
13.3.4 Savings due to reduction in Transformer Failures
The consultants have also taken in to consideration the savings accrued in terms of operational and
maintenance costs due to reduction in transformer failures while calculation payback periods. In absence
of accurate data related to year-wise costs on maintenance of transformers from the distribution
companies, the consultants have taken into consideration estimated costs of repairs and maintenance of a
single transformer which have been provided by PGVCL.
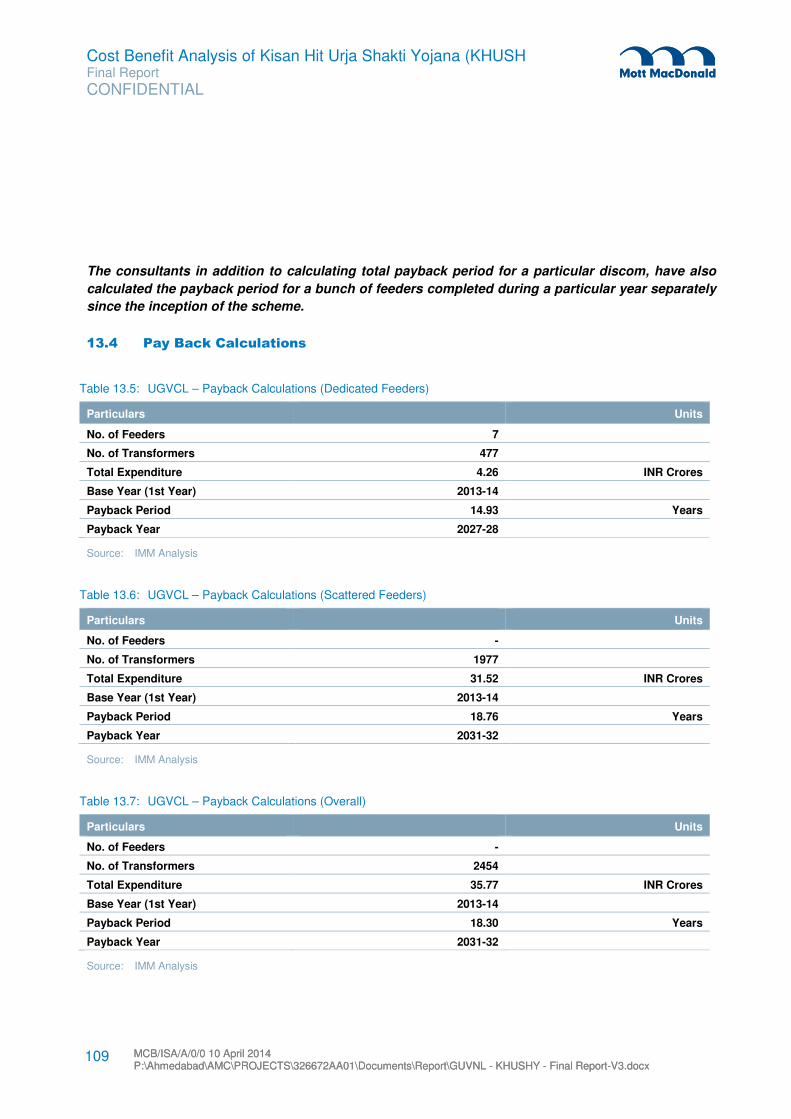
Cost Benefit Analysis of Kisan Hit Urja Shakti Yojana (KHUSH Final Report
CONFIDENTIAL
MCB/ISA/A/0/0 10 April 2014 P:\Ahmedabad\AMC\PROJECTS\326672AA01\Documents\Report\GUVNL - KHUSHY - Final Report-V3.docx MCB/ISA/A/0/0 10 April 2014 P:\Ahmedabad\AMC\PROJECTS\326672AA01\Documents\Report\GUVNL - KHUSHY - Final Report-V3.docx
109
The consultants in addition to calculating total payback period for a particular discom, have also
calculated the payback period for a bunch of feeders completed during a particular year separately
since the inception of the scheme.
13.4 Pay Back Calculations
Table 13.5: UGVCL – Payback Calculations (Dedicated Feeders)
Particulars Units
No. of Feeders 7
No. of Transformers 477
Total Expenditure 4.26 INR Crores
Base Year (1st Year) 2013-14
Payback Period 14.93 Years
Payback Year 2027-28
Source: IMM Analysis
Table 13.6: UGVCL – Payback Calculations (Scattered Feeders)
Particulars Units
No. of Feeders -
No. of Transformers 1977
Total Expenditure 31.52 INR Crores
Base Year (1st Year) 2013-14
Payback Period 18.76 Years
Payback Year 2031-32
Source: IMM Analysis
Table 13.7: UGVCL – Payback Calculations (Overall)
Particulars Units
No. of Feeders -
No. of Transformers 2454
Total Expenditure 35.77 INR Crores
Base Year (1st Year) 2013-14
Payback Period 18.30 Years
Payback Year 2031-32
Source: IMM Analysis

Cost Benefit Analysis of Kisan Hit Urja Shakti Yojana (KHUSH Final Report
CONFIDENTIAL
MCB/ISA/A/0/0 10 April 2014 P:\Ahmedabad\AMC\PROJECTS\326672AA01\Documents\Report\GUVNL - KHUSHY - Final Report-V3.docx MCB/ISA/A/0/0 10 April 2014 P:\Ahmedabad\AMC\PROJECTS\326672AA01\Documents\Report\GUVNL - KHUSHY - Final Report-V3.docx
110
Part D: Madhya Gujarat Vij Company Limited (MGVCL)

Cost Benefit Analysis of Kisan Hit Urja Shakti Yojana (KHUSH Final Report
CONFIDENTIAL
MCB/ISA/A/0/0 10 April 2014 P:\Ahmedabad\AMC\PROJECTS\326672AA01\Documents\Report\GUVNL - KHUSHY - Final Report-V3.docx MCB/ISA/A/0/0 10 April 2014 P:\Ahmedabad\AMC\PROJECTS\326672AA01\Documents\Report\GUVNL - KHUSHY - Final Report-V3.docx
111
14.1 Madhya Gujarat Vij Company Limited
MGVCL was incorporated in September,
2003, primarily to carry out distribution of
electricity to retail and bulk consumers and
has become operational effective from 1st
April 2005. The Company is engaged in
distribution of electricity in 5 districts namely
Panchmahal, Kheda, Dahod, Anand and
Vadodara. There are in total 27, 06,903
customers of MGVCL out of which around
82,289 are agricultural customers. The
areas covered by MGVCL are as depicted in
the below figure. The basic details of
DGVCL are as illustrated in the table below
Particulars Details
Total Area Covered By Company 23,854 Sq. Kms.
Districts Covered 5
Talukas Covered 48
Villages Covered 4,404
Total Consumers of Company 27,06,903
Circles 4
Divisions 21
14 Profile of MGVCL

Cost Benefit Analysis of Kisan Hit Urja Shakti Yojana (KHUSH Final Report
CONFIDENTIAL
MCB/ISA/A/0/0 10 April 2014 P:\Ahmedabad\AMC\PROJECTS\326672AA01\Documents\Report\GUVNL - KHUSHY - Final Report-V3.docx MCB/ISA/A/0/0 10 April 2014 P:\Ahmedabad\AMC\PROJECTS\326672AA01\Documents\Report\GUVNL - KHUSHY - Final Report-V3.docx
112
High Voltage Distribution System including KHUSHY (Kisan Hit Urja Shakti Yojana) is a scheme with an
objective of eliminating Line losses by installing smaller size of distribution transformers matching with the
load demand of individual consumer or very small group of consumers. The scheme has been largely
implemented in the Agriculture Sector since its roll out in the year 2008-09. The scheme had been aimed in
improving Voltage Profile as well as reduction in Technical loss and associated Commercial Loss. The
scheme had been designed to benefit both the agricultural customers as a result of uninterrupted power
with consistent voltage as well as the distribution companies in the long rum due to drastic decrease in
transmission and distribution losses.
The KHUSHY scheme has been implemented across all Distribution companies viz. PGVCL, DGVCL,
MGVCL and UGVCL. In total 174 feeders across all the distribution companies have been converted under
this scheme into HVDS. PGVCL has benefitted immensely under this scheme wherein 157 feeders have
been converted into HVDS. All agricultural customers under these feeders have been allotted dedicated
transformers for their connections.
The details of feeders in MGVCL which have been fully converted into HVDS and the number of
transformers installed are as given in the table:
15 Implementation of Kisan Hit Urja Shakti Yojana (KHUSHY) – MGVCL

CO
NF
IDE
NT
IAL
Fin
al R
eport
Co
st B
en
efit A
na
lysis
of K
isan
Hit U
rja S
ha
kti Y
oja
na
(KH
US
H
113
MC
B/IS
A/A
/0/0
10 A
pril 2
014
P:\A
hm
edabad\A
MC
\PR
OJE
CT
S\3
26672A
A01\D
ocum
ents
\Report\G
UV
NL - K
HU
SH
Y - F
inal R
eport-V
3.d
ocx
Table 15.1: MGVCL Feeder Details
Circle Division Sub-Division Feeder 10 KVA 16 KVA 25 KVA 63 KVA 100 KVA Total
Project Cost
(Lakhs) Year of
Completion
NADIAD MAHEMDAVAD KATHLAL GANGA DAS NA MUVADA
0 0 27 99 105 231 25 Ongoing
Anand Anand Umreth Pansora 29 30 54 3 0 116 35.28 2011-2012
Anand Anand Umreth Dagjipura 18 68 56 6 0 148 57.95 2011-2012
Anand Anand Umreth Kasor 50 56 31 4 0 141 105.82 2012-2013
Nadiad Nadiad Rural Mahudha Kaprupur - - - - - - - 2011-2012
Total 97 154 168 112 105 636 224

Cost Benefit Analysis of Kisan Hit Urja Shakti Yojana (KHUSH Final Report
CONFIDENTIAL
MCB/ISA/A/0/0 10 April 2014 P:\Ahmedabad\AMC\PROJECTS\326672AA01\Documents\Report\GUVNL - KHUSHY - Final Report-V3.docx MCB/ISA/A/0/0 10 April 2014 P:\Ahmedabad\AMC\PROJECTS\326672AA01\Documents\Report\GUVNL - KHUSHY - Final Report-V3.docx
114
The primary beneficiaries of Kisan Hit Urja Shakti Yojana (KHUSHY) are the agricultural consumers and
the individual distribution companies. While the agricultural consumers were expected to benefit with
quality voltage, freedom from frequent interruptions, timely supply or power, reduction of maintenance
costs, the distribution companies were expected to benefit from drastically reduced transmission and
distribution losses. To understand the actual benefits accrued by the agricultural consumers and in line
with the terms of reference a consumer perception study of agricultural consumers was conducted. The
approach and methodology adopted for the study is as given below
16.1 Approach and Methodology
The consultants have adopted a scientific methodology for the current study which was finalized in
consultation with GUVNL. The basic approach was primarily to design a sample which would represent all
the distribution companies adequately and to extract information from the consumers on several
parameters which can give a holistic understanding of the impact of the scheme.
16.1.1 Sample Design
As per the terms of reference the consumer perception survey had to be done for a sample size of 5% of
the total benefitted consumers which stand at around 65000 Nos. to assess the benefits to the consumer
due to implementation of KHUSHY (HVDS) scheme. Hence the sample size for the survey had to be
around 3250 Nos. The survey has been conducted for 3265 HVDS customers. The distribution of the
sample among the distribution companies and further at circle and feeder level has been done on the basis
of the actual conversion of feeders under KHUSHY (HVDS).
The details of sample design for MGVCL is are as under
Table 16.1: Details of conversion of feeders under KHUSHY
Discom Circle Division Sub-Division No. of Feeders No. of Beneficiaries
MGVCL 1 1 1 2 100
Source: Information submitted by DISCOMs
The sample distribution for the consumer perception study in MGVCL is as given in the table below
Table 16.2: Sample Distribution
Discom Circle Division Sub-Division Name of Feeder No. of Beneficiaries
MGVCL Anand Anand Bhalej
Dagjipura 74
Kasor 26
Total MGVCL 100
TOTAL 3265
16 Consumer Perception of Kisan Hit Urja Shakti Yojana (KHUSHY) – MGVCL

Cost Benefit Analysis of Kisan Hit Urja Shakti Yojana (KHUSH Final Report
CONFIDENTIAL
MCB/ISA/A/0/0 10 April 2014 P:\Ahmedabad\AMC\PROJECTS\326672AA01\Documents\Report\GUVNL - KHUSHY - Final Report-V3.docx MCB/ISA/A/0/0 10 April 2014 P:\Ahmedabad\AMC\PROJECTS\326672AA01\Documents\Report\GUVNL - KHUSHY - Final Report-V3.docx
115
16.1.2 Questionnaire Design
The consultants have used a pre-designed questionnaire as a research tool for the consumer perception
study. The approach while designing the questionnaire was to extract information on several parameters
as to understand the overall impact on the agricultural consumers. The details which the questionnaire
fetched broadly included the following:
� Location Details including district, taluka, Discom, circle, division, subdivision and feeder details.
� General Information including name of beneficiary, address, contact details, number of family
members, source of income, land area, cultivation area, ownership of land, year of connection, billing
type, contract demand, connected load, transformer rating etc.
� Technical Details including voltage quality, line break or shutdown details, transformer failure,
incidence of hooking, crop output and yield, aricultural income etc, power usage details etc.
� Operational Details including average number of days loss per failure, motor maintenance, average
expense per failure, operating days of borewell, operating hours of borewell, number of crops cultivated
during year, income per acre, primary type of crop etc.
� Socio Economic Details including type of house, house hold assets, farm assets, number of cattle etc.
� Broad view and suggestion on the implementation of KHUSHY
The questionnaire includes 51 broad questions in total. A copy of the questionnaire has been appended
with the report.
16.2 Key Results of Consumer Perception Study - MGVCL
The consultants have surveyed a total of 100 agricultural consumers across MGVCL. The key survey
results are as given below
16.2.1 General Information
The General Information including name of beneficiary, address, contact details, number of family
members, source of income, land area, cultivation area, ownership of land, year of connection, billing type,
contract demand, connected load, transformer rating etc. we gathered during the field survey. The analysis
of the same is given in subsequent sections.
16.2.1.1 Source of Income
Economic resources have a significant direct impact on family wellbeing, as family members depend on
each other to meet basic needs and attain a certain standard of living. Changes to economic
circumstances (such as reduced income or wealth, or increased expenditure needs) may prevent a family
from being able afford necessary or desirable items or services. It is coherent that in order to sustain the

Cost Benefit Analysis of Kisan Hit Urja Shakti Yojana (KHUSH Final Report
CONFIDENTIAL
MCB/ISA/A/0/0 10 April 2014 P:\Ahmedabad\AMC\PROJECTS\326672AA01\Documents\Report\GUVNL - KHUSHY - Final Report-V3.docx MCB/ISA/A/0/0 10 April 2014 P:\Ahmedabad\AMC\PROJECTS\326672AA01\Documents\Report\GUVNL - KHUSHY - Final Report-V3.docx
116
family wellbeing (dependency of family members on the head of the family), The source of income needs
to be upheld.
From the below table 4.4 the relationship between the family wellbeing and the source of income can be
depicted. Out of the 100 beneficiaries surveyed, 100% have their major source of income as Agriculture
with 55% of them having 4-7 dependent family members, 6% having 1-4 family members dependent, 25%
having 7-10 family members dependent and 14% having >10 family members dependent on the income &
earnings of the head of the household.
Figure 16.1: Number of Family Members Figure 16.2: Source of Income
Source: IMM Analysis Source: IMM Analysis
Table 16.3: Number of Family Members and Source of Income
No of Family Members No of Respondents Primary Source of Income No of Respondents
1-4 6 Agriculture 100
4-7 51
7-10 23
>10 13
Total 100 Total 100
Source: IMM Analysis
Continuing to achieve the economic prosperity it is equally important to have ownership of the assets &
basic amenities (such as land, house, utilities etc.) which are contributing in the family well-fare and at the
same time in maintaining the living standards.
6%
55%
25%
14%1-3
4-7
7-10
>10
100%
0%
Agriculture
Others

Cost Benefit Analysis of Kisan Hit Urja Shakti Yojana (KHUSH Final Report
CONFIDENTIAL
MCB/ISA/A/0/0 10 April 2014 P:\Ahmedabad\AMC\PROJECTS\326672AA01\Documents\Report\GUVNL - KHUSHY - Final Report-V3.docx MCB/ISA/A/0/0 10 April 2014 P:\Ahmedabad\AMC\PROJECTS\326672AA01\Documents\Report\GUVNL - KHUSHY - Final Report-V3.docx
117
Out of 100 Beneficiaries surveyed, 100 % of them were having land of their own for cultivation of crops and
carry out their agricultural activities. It was also observed that 95% of them were having Metered
connections whereas 5% of them were un-metered connections.
Figure 16.3: Ownership of Land Figure 16.4: Billing Type
Source: IMM Analysis Source: IMM Analysis
Table 16.4: Ownership of Land and Billing Type
Ownership of Land Number of Respondents Billing Type Number of Respondents
Owned 100 Metered 95
Leased 0 Un-Metered 5
Total 100 Total 100
Source: IMM Analysis
To cater the power demand & supply needs of the state under the KHUSHY scheme across DISCOMs,
erection of new transformers and HVDS supply lines have taken place to enable the agricultural
consumers to receive benefits like assured quality supply of power with the aim to improve reliability.
In view of the same & as an effective outcome, Table 4.6 below , depicts that out of the 100 beneficiaries
surveyed, 0% of were having contractual demand in the range of 1-5 KVA, 51% were having in the range
of 5-10 KVA and the remaining 49% were having in the range of > 10 KVA.
It was also found that almost 91% of the total 100 beneficiaries were having distribution transformers
having ratings in the range of 10- 25 KVA, 8% of them were using transformers with ratings in the range of
25 – 65 KVA and only 1% were having transformers with ratings in the range of > 65 KVA.
100%
0%
Owned
Leased

Cost Benefit Analysis of Kisan Hit Urja Shakti Yojana (KHUSH Final Report
CONFIDENTIAL
MCB/ISA/A/0/0 10 April 2014 P:\Ahmedabad\AMC\PROJECTS\326672AA01\Documents\Report\GUVNL - KHUSHY - Final Report-V3.docx MCB/ISA/A/0/0 10 April 2014 P:\Ahmedabad\AMC\PROJECTS\326672AA01\Documents\Report\GUVNL - KHUSHY - Final Report-V3.docx
118
Figure 16.5: Contract Demand Figure 16.6: Transformer Rating
Source: IMM Analysis Source: IMM Analysis
Table 16.5: Contract Demand and Transformer Rating
Contract Demand Number of Respondents Transformer Rating Number of Respondents
1-5 KVA 0 10 – 25 KVA 91
5-10 KVA 51 25 – 65 KVA 8
>10 KVA 49 >65 KVA 1
Total 100 Total 100
Source: IMM Analysis
16.2.2 Level of Agreement on Technical and Financial Aspects
The surveyed consumers were asked to give their level of agreement on specific statements related to
changes in the technical aspects after implementation of KHUSHY. Their levels of agreement on the
specific statements are as illustrated below.
16.2.2.1 Voltage Level / Quality and Stability
Complementary to price, quality is an important feature of the electricity service provided to consumers.
With Quality comes Stability which together defines the value that customers derive from consuming
electricity. To ensure that the Quality & Stability is delivered effectively to the consumers, it is essential to
maintain the voltage at different levels.
0%
51%49% 1-5
5-10
>10
91.0%
8% 1.0%
10 - 25 KVA
25 - 65 KVA
>65 KVA

Cost Benefit Analysis of Kisan Hit Urja Shakti Yojana (KHUSH Final Report
CONFIDENTIAL
MCB/ISA/A/0/0 10 April 2014 P:\Ahmedabad\AMC\PROJECTS\326672AA01\Documents\Report\GUVNL - KHUSHY - Final Report-V3.docx MCB/ISA/A/0/0 10 April 2014 P:\Ahmedabad\AMC\PROJECTS\326672AA01\Documents\Report\GUVNL - KHUSHY - Final Report-V3.docx
119
The overall outcome of the survey
states that 100% of the surveyed
consumers strongly agree with the
statement that the overall voltage
level/ quality and stability has
improved after the implementation of
the KHUSHY scheme.
Table 16.6: Voltage Level/Quality and Stability
Statement DISCOM
Stro
ng
ly
Ag
ree
Ag
ree
No
Ch
an
ge
Dis
ag
ree
Stro
ng
ly
Dis
ag
ree
To
tal
The overall voltage level/quality and stability after implementation of KHUSHY has improved.
MGVCL
100% 0% 0% 0% 0% 100%
100 0 0 0 0 100
Source: IMM Analysis
16.2.2.2 Frequent Line break or Unscheduled Shutdown
The overall outcome of the survey states that 74% consumers strongly agree with the statement that the
frequent line break or unscheduled shutdowns has reduced after the implementation of the KHUSHY
scheme.
Figure 16.7: Voltage Level/Quality and Stability
Source: IMM Analysis
100.0%
Strongly Agree

Cost Benefit Analysis of Kisan Hit Urja Shakti Yojana (KHUSH Final Report
CONFIDENTIAL
MCB/ISA/A/0/0 10 April 2014 P:\Ahmedabad\AMC\PROJECTS\326672AA01\Documents\Report\GUVNL - KHUSHY - Final Report-V3.docx MCB/ISA/A/0/0 10 April 2014 P:\Ahmedabad\AMC\PROJECTS\326672AA01\Documents\Report\GUVNL - KHUSHY - Final Report-V3.docx
120
Figure 16.8: Frequent Line break or Unscheduled Shutdown has reduced
Source: IMM Analysis
Table 16.7: Frequent Line break or Unscheduled Shutdown
Statement DISCOM
Stro
ng
ly
Ag
ree
Ag
ree
No
C
ha
ng
e
Dis
ag
ree
Stro
ng
ly
Dis
ag
ree
To
tal
The frequent line break or unscheduled shutdown after implementation of KHUSHY Scheme has reduced
MGVCL 74% 26% 0% 0% 0% 100%
74 26 0 .0 0 100
Source: IMM Analysis
16.2.2.3 Transformer Failure
There can be various reasons to a transformer failure, some of the reasons why a transformer fails
includes design failures, inadequate or defective installation, oil contamination, insulation deterioration,
short circuits, line faults, unknown failures, improper maintenance & operation, lightning, moisture, aging
etc. The risk of a transformer failure is actually two-dimensional: the frequency of failure, and the severity
of failure.
To overcome such issues DISCOMs have provided the consumers with Step-Down Transformers ranging
from ratings 10, 16 & 25 KVA with a service connection through short LT lines and insulated cables Ariel
bunched cables (ABC/ PVC). In continuation to the same all possible measures are taken care by the
respective DISCOMs to carry out its maintenance activities.
74.0%
26%
Strongly Agree
Agree

Cost Benefit Analysis of Kisan Hit Urja Shakti Yojana (KHUSH Final Report
CONFIDENTIAL
MCB/ISA/A/0/0 10 April 2014 P:\Ahmedabad\AMC\PROJECTS\326672AA01\Documents\Report\GUVNL - KHUSHY - Final Report-V3.docx MCB/ISA/A/0/0 10 April 2014 P:\Ahmedabad\AMC\PROJECTS\326672AA01\Documents\Report\GUVNL - KHUSHY - Final Report-V3.docx
121
The overall outcome of the survey states that nearly 100% of the surveyed consumers strongly agree with
the statement that the transformer failure has reduced after the implementation of the KHUSHY scheme.
Table 16.8: Transformer Failure
Statement DISCOM
Stro
ng
ly
Ag
ree
Ag
ree
No
Ch
an
ge
Dis
ag
ree
Stro
ng
ly
Dis
ag
ree
To
tal
The transformer failure has reduced after the implementation of KHUSHY scheme.
MGVCL
100% 0 0 0 0 100%
100 0 0 0 0 100
Source: IMM Analysis
16.2.2.4 Incidence of Hooking
Normally theft and pilferage accounts for a substantial part of the high transmission and distribution losses,
which are mainly committed by two categories of consumers i.e. non-consumers and bonafide consumers.
Antisocial elements avail unauthorized/unrecorded supply by hooking or tapping the bare conductors of
L.T. feeder or tampered service wires. Pilferage is also done wilfully by way of damaging and / or creating
disturbances to measuring equipment installed at their premises.
Figure 16.9: Transformer Failure has reduced after the implementation of KHUSHY Scheme
Source: IMM Analysis
100.0%
0%
Strongly Agree
Agree
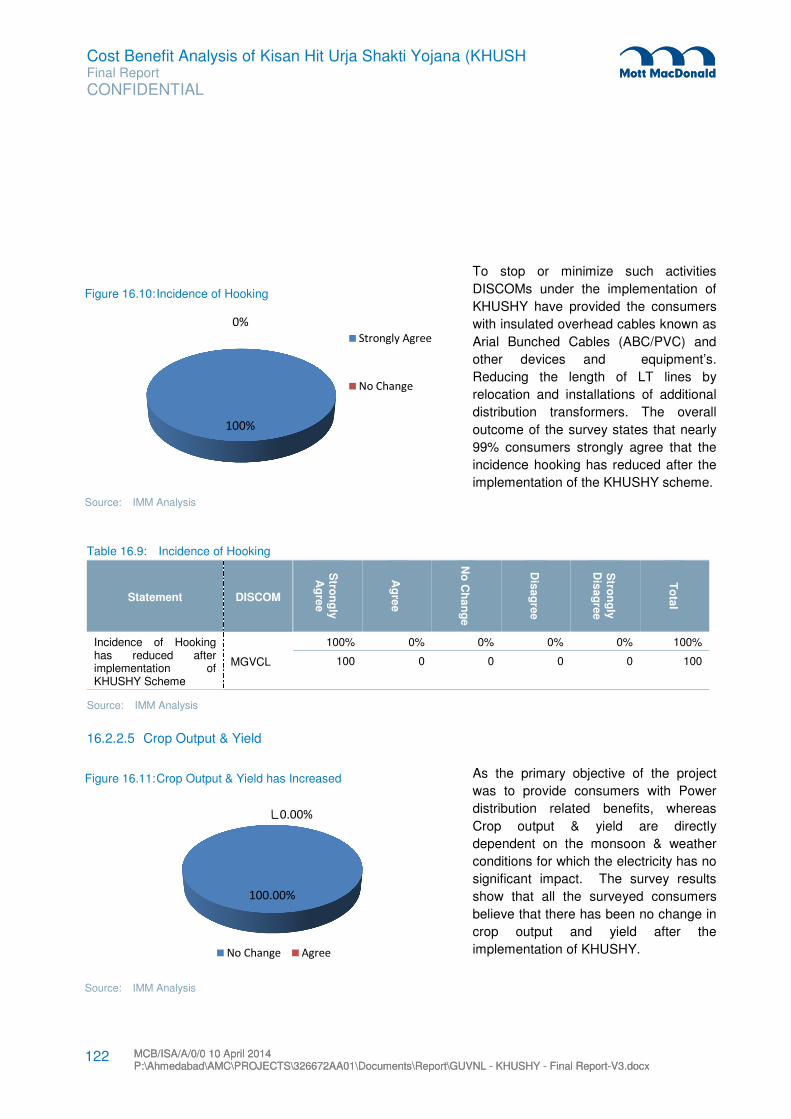
Cost Benefit Analysis of Kisan Hit Urja Shakti Yojana (KHUSH Final Report
CONFIDENTIAL
MCB/ISA/A/0/0 10 April 2014 P:\Ahmedabad\AMC\PROJECTS\326672AA01\Documents\Report\GUVNL - KHUSHY - Final Report-V3.docx MCB/ISA/A/0/0 10 April 2014 P:\Ahmedabad\AMC\PROJECTS\326672AA01\Documents\Report\GUVNL - KHUSHY - Final Report-V3.docx
122
To stop or minimize such activities
DISCOMs under the implementation of
KHUSHY have provided the consumers
with insulated overhead cables known as
Arial Bunched Cables (ABC/PVC) and
other devices and equipment’s. Reducing the length of LT lines by
relocation and installations of additional
distribution transformers. The overall
outcome of the survey states that nearly
99% consumers strongly agree that the
incidence hooking has reduced after the
implementation of the KHUSHY scheme.
Table 16.9: Incidence of Hooking
Statement DISCOM
Stro
ng
ly
Ag
ree
Ag
ree
No
Ch
an
ge
Dis
ag
ree
Stro
ng
ly
Dis
ag
ree
To
tal
Incidence of Hooking has reduced after implementation of KHUSHY Scheme
MGVCL
100% 0% 0% 0% 0% 100%
100 0 0 0 0 100
Source: IMM Analysis
16.2.2.5 Crop Output & Yield
As the primary objective of the project
was to provide consumers with Power
distribution related benefits, whereas
Crop output & yield are directly
dependent on the monsoon & weather
conditions for which the electricity has no
significant impact. The survey results
show that all the surveyed consumers
believe that there has been no change in
crop output and yield after the
implementation of KHUSHY.
Figure 16.10: Incidence of Hooking
Source: IMM Analysis
Figure 16.11: Crop Output & Yield has Increased
Source: IMM Analysis
100%
0%
Strongly Agree
No Change
100.00%
0.00%
No Change Agree

Cost Benefit Analysis of Kisan Hit Urja Shakti Yojana (KHUSH Final Report
CONFIDENTIAL
MCB/ISA/A/0/0 10 April 2014 P:\Ahmedabad\AMC\PROJECTS\326672AA01\Documents\Report\GUVNL - KHUSHY - Final Report-V3.docx MCB/ISA/A/0/0 10 April 2014 P:\Ahmedabad\AMC\PROJECTS\326672AA01\Documents\Report\GUVNL - KHUSHY - Final Report-V3.docx
123
Table 16.10: Crop Output & Yield
Statement DISCOM
Stro
ng
ly
Ag
ree
Ag
ree
No
Ch
an
ge
Dis
ag
ree
Stro
ng
ly
Dis
ag
ree
To
tal
The Crop output & yield has yield has increased after implementation of KHUSHY scheme
MGVCL
0% 0% 100% 0% 0% 100%
0 0 100 0 0 100
Source: IMM Analysis
16.2.2.6 Agricultural Income
The perception regarding Agricultural
income can be depicted from the able,
however the overall outcome of the
survey states that none of the
consumers surveyed agree with the
statement that the Agricultural income
has increased after the implementation
of the KHUSHY scheme
Table 16.11: Agricultural Income
Statement DISCOM
Stro
ng
ly
Ag
ree
Ag
ree
No
Ch
an
ge
Dis
ag
ree
Stro
ng
ly
Dis
ag
ree
To
tal
Agricultural Income has increased after the implementation of KHUSHY Scheme
MGVCL
0% 0% 100% 0% 0% 100%
0 0 100 0 0 100
Source: IMM Analysis
Figure 16.12: Agricultural Income
Source: IMM Analysis
0%
100%
Agree No Change

Cost Benefit Analysis of Kisan Hit Urja Shakti Yojana (KHUSH Final Report
CONFIDENTIAL
MCB/ISA/A/0/0 10 April 2014 P:\Ahmedabad\AMC\PROJECTS\326672AA01\Documents\Report\GUVNL - KHUSHY - Final Report-V3.docx MCB/ISA/A/0/0 10 April 2014 P:\Ahmedabad\AMC\PROJECTS\326672AA01\Documents\Report\GUVNL - KHUSHY - Final Report-V3.docx
124
16.2.2.7 Availability of Free Time
The perception regarding availability of free time,
the overall outcome of the survey states that
100% of the surveyed consumers strongly agree
with the statement that the availability of free
time after the implementation of the KHUSHY
scheme.
It was found that after the implementation of the
KHUSHY scheme, the power supply to the
consumers was distributed as per schedule &
timings which was an advantage for them. The
free time which was after the implementation
was available with the consumers are utilized by
them for other working & revenue generating
activities, also with a possibility to start a small
shop/business to increase their sources of
income which will be ultimately helping them &
their families to enhance the lifestyle and
standards of living.
Table 16.12: Availability of Free Time
Statement DISCOM
Stro
ng
ly
Ag
ree
Ag
ree
No
Ch
an
ge
Dis
ag
ree
Stro
ng
ly
Dis
ag
ree
To
tal
You get free time for yourself after implementation of KHUSHY Scheme
MGVCL 100% 0% 0% 0% 0% 100%
100 0 0 0 0 100
Source: IMM Analysis
Figure 16.13: Availability of Free Time
Source: IMM Analysis
100%
0%
Strongly Agree No Change

Cost Benefit Analysis of Kisan Hit Urja Shakti Yojana (KHUSH Final Report
CONFIDENTIAL
MCB/ISA/A/0/0 10 April 2014 P:\Ahmedabad\AMC\PROJECTS\326672AA01\Documents\Report\GUVNL - KHUSHY - Final Report-V3.docx MCB/ISA/A/0/0 10 April 2014 P:\Ahmedabad\AMC\PROJECTS\326672AA01\Documents\Report\GUVNL - KHUSHY - Final Report-V3.docx
125
16.2.2.8 Overall Satisfaction with the KHUSHY Scheme
The perception regarding Overall satisfaction
can be depicted from the table, however the
overall outcome of the survey states that
100% of the surveyed beneficiaries strongly
agree with the statement that they are overall
satisfied after the implementation of the
KHUSHY scheme.
Table 16.13: Overall Satisfaction with the KHUSHY Scheme
Statement DISCOM
Stro
ng
ly
Ag
ree
Ag
ree
No
C
ha
ng
e
Dis
ag
ree
Stro
ng
ly
Dis
ag
ree
To
tal
You are overall satisfied with the KHUSHY Scheme
MGVCL 100% 0% 0% 0% 0% 100%
100 0 0 0 0 100
Source: IMM Analysis
16.2.3 Assessment of Tangible Benefits Accrued after implementation of KHUSHY
The consumers were asked specific questions related to Technical, Operational and Financial aspects to
gauge the quantitative difference in tangible benefits before and after the implementation of KHUSHY.
Figure 16.14: Overall Satisfaction with the KHUSHY Scheme
Source: IMM Analysis
100%
0%
Strongly Agree No Change
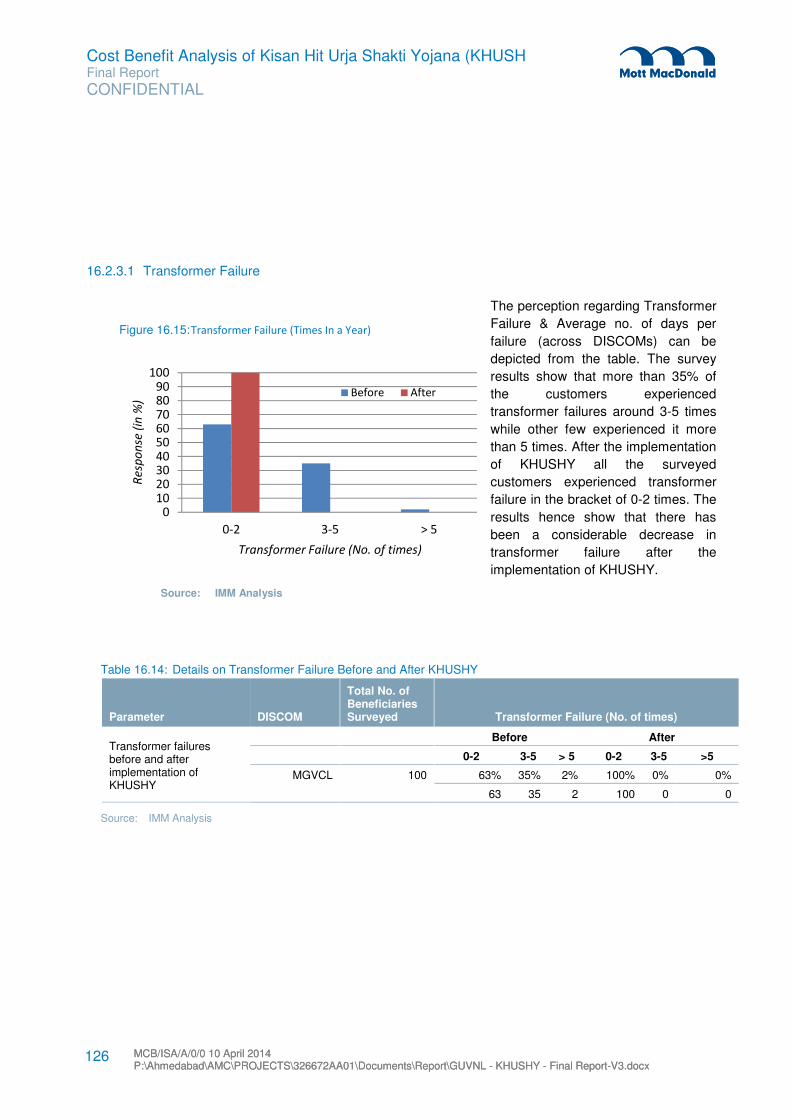
Cost Benefit Analysis of Kisan Hit Urja Shakti Yojana (KHUSH Final Report
CONFIDENTIAL
MCB/ISA/A/0/0 10 April 2014 P:\Ahmedabad\AMC\PROJECTS\326672AA01\Documents\Report\GUVNL - KHUSHY - Final Report-V3.docx MCB/ISA/A/0/0 10 April 2014 P:\Ahmedabad\AMC\PROJECTS\326672AA01\Documents\Report\GUVNL - KHUSHY - Final Report-V3.docx
126
16.2.3.1 Transformer Failure
The perception regarding Transformer
Failure & Average no. of days per
failure (across DISCOMs) can be
depicted from the table. The survey
results show that more than 35% of
the customers experienced
transformer failures around 3-5 times
while other few experienced it more
than 5 times. After the implementation
of KHUSHY all the surveyed
customers experienced transformer
failure in the bracket of 0-2 times. The
results hence show that there has
been a considerable decrease in
transformer failure after the
implementation of KHUSHY.
Figure 16.15: Transformer Failure (Times In a Year)
Source: IMM Analysis
Table 16.14: Details on Transformer Failure Before and After KHUSHY
Parameter DISCOM
Total No. of Beneficiaries Surveyed Transformer Failure (No. of times)
Transformer failures before and after implementation of KHUSHY
Before After
0-2 3-5 > 5 0-2 3-5 >5
MGVCL 100 63% 35% 2% 100% 0% 0%
63 35 2 100 0 0
Source: IMM Analysis
0102030405060708090
100
0-2 3-5 > 5
Re
spo
nse
(in
%)
Transformer Failure (No. of times)
Before After

Cost Benefit Analysis of Kisan Hit Urja Shakti Yojana (KHUSH Final Report
CONFIDENTIAL
MCB/ISA/A/0/0 10 April 2014 P:\Ahmedabad\AMC\PROJECTS\326672AA01\Documents\Report\GUVNL - KHUSHY - Final Report-V3.docx MCB/ISA/A/0/0 10 April 2014 P:\Ahmedabad\AMC\PROJECTS\326672AA01\Documents\Report\GUVNL - KHUSHY - Final Report-V3.docx
127
The survey results show that around 99% of the customers experienced 0-5 days loss due to each
transformer failure. After the implementation of KHUSHY all of the surveyed customers experienced 0-5
days loss due to each transformer failure and also the rate of failure has decreased to 0-2 per year.
Table 16.15: Details on Average number of Days Loss per Failure Before and After KHUSHY
Parameter DISCOM
No. of Beneficiaries Surveyed Average No. of Days Loss per Failure
Average No. of Days
Loss Per Failure
BEFORE AFTER
0-5 6-10 11-15 16-20 > 20 0-5 6-10 11-15 16-20 > 20
MGVCL 100 99% 1% 0% 0% 0% 100% 0% 0% 0% 0%
99 1 0 0 0 100 0 0 0 0
Source: IMM Analysis
Figure 16.16: Average Number of Days Loss Per Failure
Source: IMM Analysis
0
10
20
30
40
50
60
70
80
90
100
0-5 6-10 11-15 16-20 > 20
Re
spo
nse
(in
%)
Average No. of Days Loss per failure
Before
After
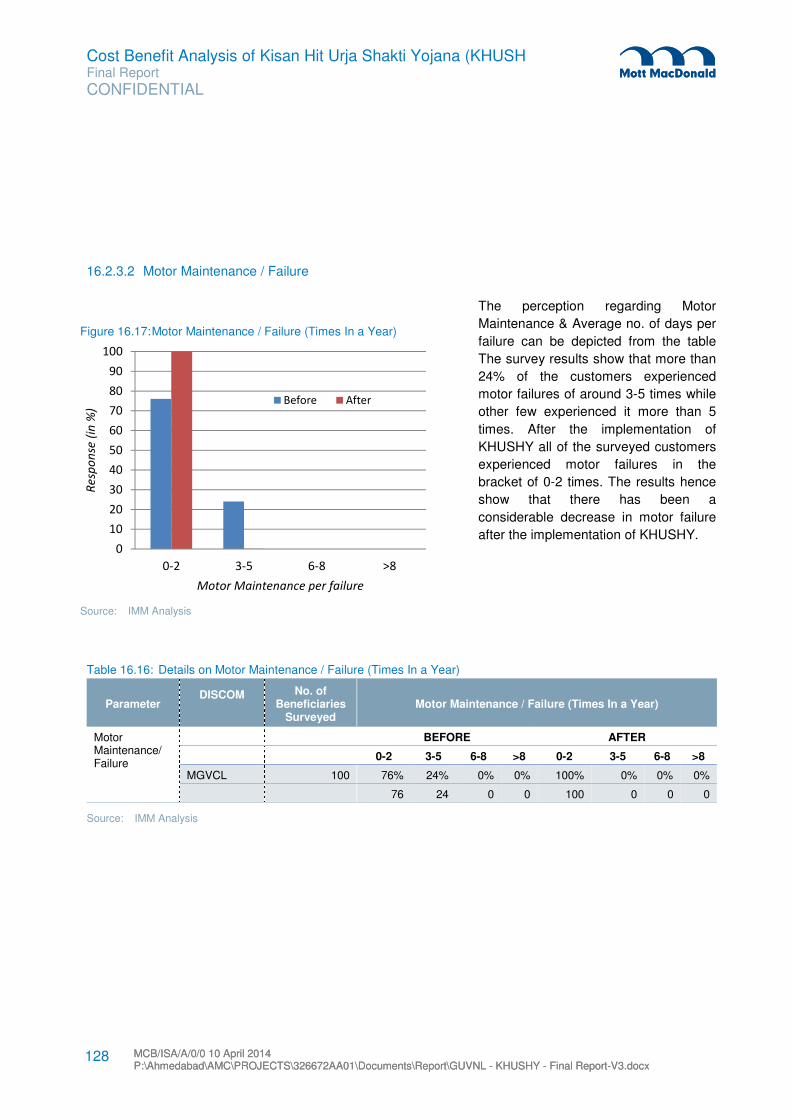
Cost Benefit Analysis of Kisan Hit Urja Shakti Yojana (KHUSH Final Report
CONFIDENTIAL
MCB/ISA/A/0/0 10 April 2014 P:\Ahmedabad\AMC\PROJECTS\326672AA01\Documents\Report\GUVNL - KHUSHY - Final Report-V3.docx MCB/ISA/A/0/0 10 April 2014 P:\Ahmedabad\AMC\PROJECTS\326672AA01\Documents\Report\GUVNL - KHUSHY - Final Report-V3.docx
128
16.2.3.2 Motor Maintenance / Failure
The perception regarding Motor
Maintenance & Average no. of days per
failure can be depicted from the table
The survey results show that more than
24% of the customers experienced
motor failures of around 3-5 times while
other few experienced it more than 5
times. After the implementation of
KHUSHY all of the surveyed customers
experienced motor failures in the
bracket of 0-2 times. The results hence
show that there has been a
considerable decrease in motor failure
after the implementation of KHUSHY.
Table 16.16: Details on Motor Maintenance / Failure (Times In a Year)
Parameter DISCOM
No. of Beneficiaries
Surveyed Motor Maintenance / Failure (Times In a Year)
Motor Maintenance/ Failure
BEFORE AFTER
0-2 3-5 6-8 >8 0-2 3-5 6-8 >8
MGVCL 100 76% 24% 0% 0% 100% 0% 0% 0%
76 24 0 0 100 0 0 0
Source: IMM Analysis
Figure 16.17: Motor Maintenance / Failure (Times In a Year)
Source: IMM Analysis
0
10
20
30
40
50
60
70
80
90
100
0-2 3-5 6-8 >8
Re
spo
nse
(in
%)
Motor Maintenance per failure
Before After

Cost Benefit Analysis of Kisan Hit Urja Shakti Yojana (KHUSH Final Report
CONFIDENTIAL
MCB/ISA/A/0/0 10 April 2014 P:\Ahmedabad\AMC\PROJECTS\326672AA01\Documents\Report\GUVNL - KHUSHY - Final Report-V3.docx MCB/ISA/A/0/0 10 April 2014 P:\Ahmedabad\AMC\PROJECTS\326672AA01\Documents\Report\GUVNL - KHUSHY - Final Report-V3.docx
129
The survey results show that 100% of the
surveyed customers experienced 0-5
days loss after each motor failure. After
the implementation of KHUSHY all of the
surveyed customers experienced day loss
after each motor failure in the bracket of
0-5 times. The results hence show that
there has been a considerable decrease
in average day loss per motor failure after
the implementation of KHUSHY.
Table 16.17: Details on Average no. of Days Loss per Maintenance/ Failure
Parameter DISCOM
No. of Beneficiaries
Surveyed Motor Maintenance / Failure (Times In a Year)
Average no. of Days Loss per Maintenance/ Failure
BEFORE AFTER
0-5 6-10 > 10 0-5 6-10 > 10
MGVCL 100 100% 0% 0% 100% 0% 0%
100 0 0 100 0 0
Source: IMM Analysis
Figure 16.18: Average no. of Days Loss per Maintenance/ Failure
Source: IMM Analysis
0
10
20
30
40
50
60
70
80
90
100
0-5 6-10 > 10
Re
spo
nse
(in
%)
Avg. No. of Days Loss per Maintenance/
Failure
Before After

Cost Benefit Analysis of Kisan Hit Urja Shakti Yojana (KHUSH Final Report
CONFIDENTIAL
MCB/ISA/A/0/0 10 April 2014 P:\Ahmedabad\AMC\PROJECTS\326672AA01\Documents\Report\GUVNL - KHUSHY - Final Report-V3.docx MCB/ISA/A/0/0 10 April 2014 P:\Ahmedabad\AMC\PROJECTS\326672AA01\Documents\Report\GUVNL - KHUSHY - Final Report-V3.docx
130
The survey results show that more than
28% of the customers had to incur
expense in the bracket of INR 0-2000 due
to each motor failure while other 30% had
to incur expense in the bracket of INR
6100-8000 due to each motor failure. After
the implementation of KHUSHY all of the
surveyed customers incurred expense in
the bracket of INR 0-2000 due to each
motor failure. The results hence show that
there has been a considerable decrease in
expense incurred on motor failures after
the implementation of KHUSHY.
Table 16.18: Details on Average Expense per Failure due to Maintenance (INR)
Parameter DISCOM
No. of Beneficiaries
Surveyed Motor Maintenance / Failure (Times In a Year)
Average Expense
per Failure due to
Maintenance (INR)
BEFORE AFTER
0-2000
2100-4000
4100-6000
6100-8000
> 8000 0-2000 2100-4000
4100-6000
6100-8000
> 8000
MGVCL 100 28% 1% 0% 30% 41% 100% 0% 0% 0% 0%
28 1 0 30 41 100 0 0 0 0
Source: IMM Analysis
16.2.3.3 Motor Starter Failure
The perception regarding Motor starter failure &
Average no. of days per failure can be depicted
from the table The survey results show that before
the implementation of KHUSHY, more than 49% of
the customers experienced motor starter failures
around 2- 3 times/year. After the implementation of
KHUSHY all of the surveyed customers
experienced motor starter failure in the bracket of
0-1 times. The results hence show that there has
been a considerable decrease in motor starter
failure after the implementation of KHUSHY.
Figure 16.19: Average Expense per Failure (INR)
Source: IMM Analysis
0102030405060708090
100
Response (
in %
)
Avg. Expense / Failure due to Maintenance
Before After
0
10
20
30
40
50
60
70
80
90
100
0-1 2-3 4-5 >5
Response (
in %
)
Motor Starter Failure (No. of times /year)
Before After

Cost Benefit Analysis of Kisan Hit Urja Shakti Yojana (KHUSH Final Report
CONFIDENTIAL
MCB/ISA/A/0/0 10 April 2014 P:\Ahmedabad\AMC\PROJECTS\326672AA01\Documents\Report\GUVNL - KHUSHY - Final Report-V3.docx MCB/ISA/A/0/0 10 April 2014 P:\Ahmedabad\AMC\PROJECTS\326672AA01\Documents\Report\GUVNL - KHUSHY - Final Report-V3.docx
131
Table 16.19: Details on Motor Starter Failure (No/Year)
Parameter DISCOM
No. of Beneficiari
es Surveyed
Motor starter Failure (Times In a Year)
Average Expense
per Failure due to
Maintenance (INR)
BEFORE AFTER
0-1 2-3 4-5 >5 0-1 2-3 4-5 >5
MGVCL 100 51% 49% 0% 0% 100% 0% 0% 0%
51 49 0 0 100 0 0 0
The survey results show that more than 49% of the
customers experienced 2-3 days loss due to each
motor starter failure while other few experienced more
than 3 days loss due to each motor starter failure. After
the implementation of KHUSHY more 100% of the
surveyed customers experienced 0-1 day loss due to
each motor starter failure. The results hence show that
there has been a considerable decrease in average
day loss per motor starter failure after the
implementation of KHUSHY.
Table 16.20: Details on Average Number of Days Loss per Failure due to Motor Starter
Parameter DISCOM
Total No. of Beneficiaries
Surveyed Days Loss Per Failure (Times In a Year)
Average Number of Days Loss Per Failure due to Motor Starter
BEFORE AFTER
0-1 2-3 4-5 >5 0-1 2-3 4-5 >5
MGVCL 100 51% 49% 0% 0% 100% 0% 0% 0%
51 49 0 0 100 0 0 0
Source: IMM Analysis
Figure 16.20: Average Number of Days Loss Per
Failure due to Motor Starter
Source: IMM Analysis
0102030405060708090
100
0-1 2-3 4-5 >5
Response (
in %
)
Motor Starter Failure (No. of Days /year)
Before After
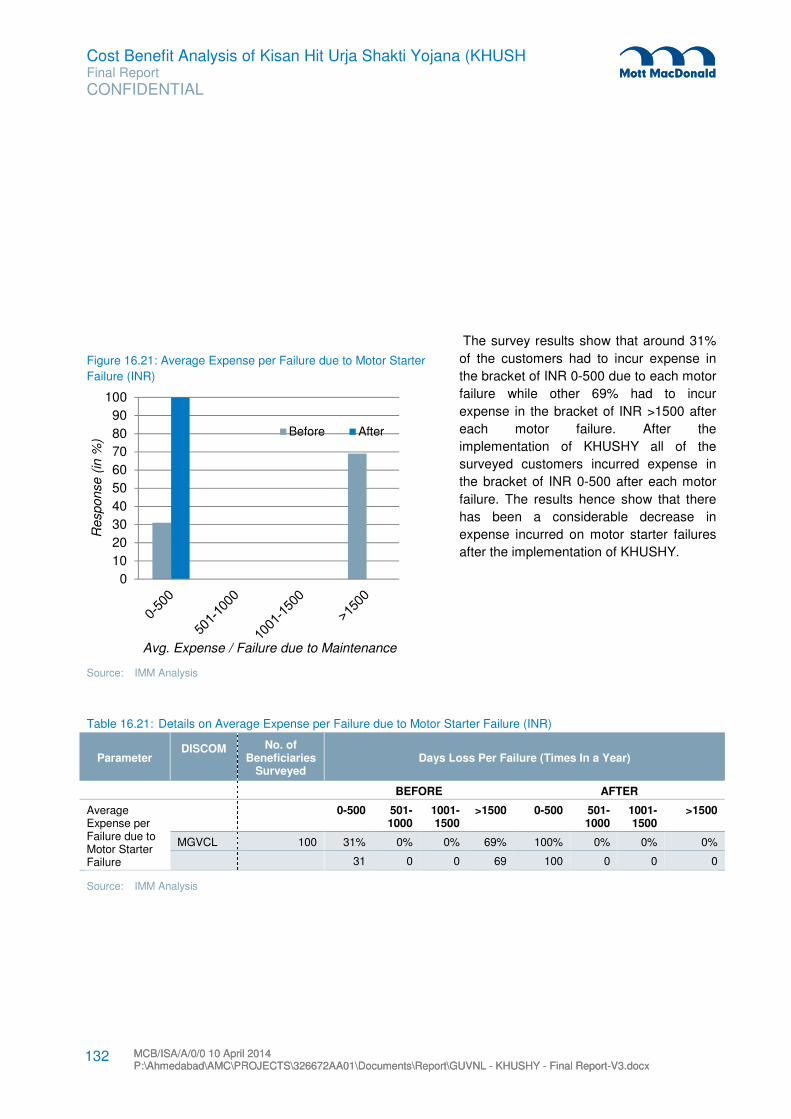
Cost Benefit Analysis of Kisan Hit Urja Shakti Yojana (KHUSH Final Report
CONFIDENTIAL
MCB/ISA/A/0/0 10 April 2014 P:\Ahmedabad\AMC\PROJECTS\326672AA01\Documents\Report\GUVNL - KHUSHY - Final Report-V3.docx MCB/ISA/A/0/0 10 April 2014 P:\Ahmedabad\AMC\PROJECTS\326672AA01\Documents\Report\GUVNL - KHUSHY - Final Report-V3.docx
132
The survey results show that around 31%
of the customers had to incur expense in
the bracket of INR 0-500 due to each motor
failure while other 69% had to incur
expense in the bracket of INR >1500 after
each motor failure. After the
implementation of KHUSHY all of the
surveyed customers incurred expense in
the bracket of INR 0-500 after each motor
failure. The results hence show that there
has been a considerable decrease in
expense incurred on motor starter failures
after the implementation of KHUSHY.
Table 16.21: Details on Average Expense per Failure due to Motor Starter Failure (INR)
Parameter DISCOM
No. of Beneficiaries
Surveyed Days Loss Per Failure (Times In a Year)
BEFORE AFTER
Average Expense per Failure due to Motor Starter Failure
0-500 501-1000
1001-1500
>1500 0-500 501-1000
1001-1500
>1500
MGVCL 100 31% 0% 0% 69% 100% 0% 0% 0%
31 0 0 69 100 0 0 0
Source: IMM Analysis
Figure 16.21: Average Expense per Failure due to Motor Starter
Failure (INR)
Source: IMM Analysis
0
10
20
30
40
50
60
70
80
90
100
Response (
in %
)
Avg. Expense / Failure due to Maintenance
Before After

Cost Benefit Analysis of Kisan Hit Urja Shakti Yojana (KHUSH Final Report
CONFIDENTIAL
MCB/ISA/A/0/0 10 April 2014 P:\Ahmedabad\AMC\PROJECTS\326672AA01\Documents\Report\GUVNL - KHUSHY - Final Report-V3.docx MCB/ISA/A/0/0 10 April 2014 P:\Ahmedabad\AMC\PROJECTS\326672AA01\Documents\Report\GUVNL - KHUSHY - Final Report-V3.docx
133
16.2.4 Single Phase Connection and Bore well Details
The figure below depicts that 62% of the total 100 surveyed beneficiaries do not have additional single
phase connection whereas all are having Bore Well facility.
Figure 16.22: Additional Single Phase Connection Figure 16.23: Bore Well Facility
Source: IMM Analysis Source: IMM Analysis
Table 16.22: Additional single phase connection and Bore Well Details
DISCOM Additional Single Phase Connection Bore Well Facility
Yes No Yes No
MGVCL 38 62 100 0
Source: IMM Analysis
16.2.5 View on continuation of the scheme
All of the 100 beneficiaries
surveyed were happy & satisfied
with the implementation of the
KHUSHY Scheme and had
expressed their interest and
willingness in support and
continuation of the scheme in
other parts of the state
aggressively.
38%
62%
Yes No
100%
-
Yes No
Figure 16.24: View on Continuation of the Scheme in other areas of Gujarat
Source: IMM Analysis

Cost Benefit Analysis of Kisan Hit Urja Shakti Yojana (KHUSH Final Report
CONFIDENTIAL
MCB/ISA/A/0/0 10 April 2014 P:\Ahmedabad\AMC\PROJECTS\326672AA01\Documents\Report\GUVNL - KHUSHY - Final Report-V3.docx MCB/ISA/A/0/0 10 April 2014 P:\Ahmedabad\AMC\PROJECTS\326672AA01\Documents\Report\GUVNL - KHUSHY - Final Report-V3.docx
134
Table 16.23: Views on continuation of the Scheme in other areas of Gujarat
DISCOM Yes No
MGVCL 100 0
Source: IMM Analysis
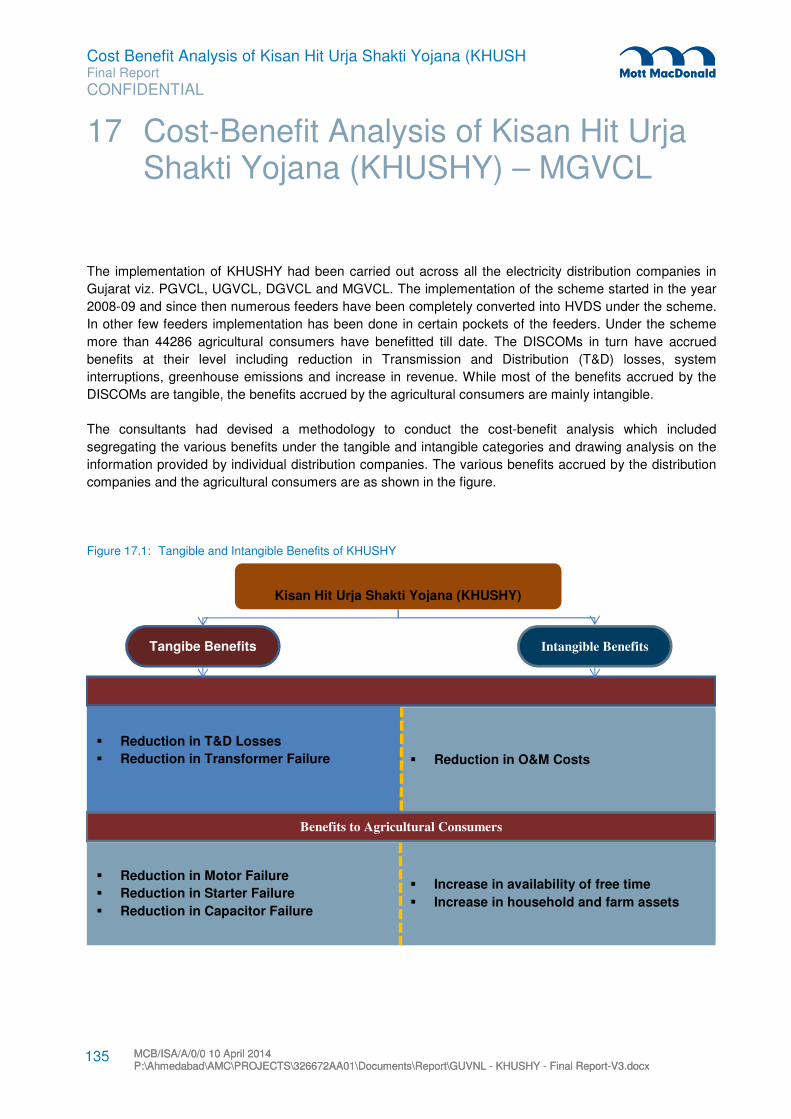
Cost Benefit Analysis of Kisan Hit Urja Shakti Yojana (KHUSH Final Report
CONFIDENTIAL
MCB/ISA/A/0/0 10 April 2014 P:\Ahmedabad\AMC\PROJECTS\326672AA01\Documents\Report\GUVNL - KHUSHY - Final Report-V3.docx MCB/ISA/A/0/0 10 April 2014 P:\Ahmedabad\AMC\PROJECTS\326672AA01\Documents\Report\GUVNL - KHUSHY - Final Report-V3.docx
135
The implementation of KHUSHY had been carried out across all the electricity distribution companies in
Gujarat viz. PGVCL, UGVCL, DGVCL and MGVCL. The implementation of the scheme started in the year
2008-09 and since then numerous feeders have been completely converted into HVDS under the scheme.
In other few feeders implementation has been done in certain pockets of the feeders. Under the scheme
more than 44286 agricultural consumers have benefitted till date. The DISCOMs in turn have accrued
benefits at their level including reduction in Transmission and Distribution (T&D) losses, system
interruptions, greenhouse emissions and increase in revenue. While most of the benefits accrued by the
DISCOMs are tangible, the benefits accrued by the agricultural consumers are mainly intangible.
The consultants had devised a methodology to conduct the cost-benefit analysis which included
segregating the various benefits under the tangible and intangible categories and drawing analysis on the
information provided by individual distribution companies. The various benefits accrued by the distribution
companies and the agricultural consumers are as shown in the figure.
Figure 17.1: Tangible and Intangible Benefits of KHUSHY
17 Cost-Benefit Analysis of Kisan Hit Urja Shakti Yojana (KHUSHY) – MGVCL
Kisan Hit Urja Shakti Yojana (KHUSHY)
Tangibe Benefits Intangible Benefits
� Reduction in T&D Losses
� Reduction in Transformer Failure
� Reduction in O&M Costs
� Reduction in Motor Failure
� Reduction in Starter Failure
� Reduction in Capacitor Failure
� Increase in availability of free time
� Increase in household and farm assets
Benefits to Agricultural Consumers

Cost Benefit Analysis of Kisan Hit Urja Shakti Yojana (KHUSH Final Report
CONFIDENTIAL
MCB/ISA/A/0/0 10 April 2014 P:\Ahmedabad\AMC\PROJECTS\326672AA01\Documents\Report\GUVNL - KHUSHY - Final Report-V3.docx MCB/ISA/A/0/0 10 April 2014 P:\Ahmedabad\AMC\PROJECTS\326672AA01\Documents\Report\GUVNL - KHUSHY - Final Report-V3.docx
136
17.1 Implementation Details of KHUSHY
The implementation of KHUSHY was done in all distribution companies. The detailed lists of feeders,
villages and which have benefitted under the scheme and corresponding details have been attached as
Appendix A.
Table 17.1: KHUSHY Implementation Details
Source: IMM Analysis
17.2 Benefits Accrued Under KHUSHY
The distribution companies have accrued varied tangible and intangible benefits under KHUSHY. The
assessments of the tangible benefits have been done on the basis of the year on year information provided
by the individual DISCOMs. The broad tangible benefits accrued by the distribution companies under the
scheme are as under
� Reduction in Transmission &Distribution (T&D) Losses
� Reduction in System Interruptions
� Decrease in O&M Costs
17.2.1 Transmission and Distribution Losses (MGVCL)
Energy losses occur in the process of supplying electricity to consumers due to technical and commercial
losses. The technical losses are due to energy dissipated in the conductors and equipment used for
transmission, transformation, sub- transmission and distribution of power. The losses can be further sub
grouped depending upon the stage of power transformation & transmission system as Transmission
Losses (400kV/220kV/132kV/66kV), as Sub transmission losses (33kV /11kV) and Distribution losses
(11kV/0.4kv). The commercial losses are caused by pilferage (Hooking), defective meters, and errors in
meter reading and in estimating unmetered supply of energy.
Under KHUSHY major investment in infrastructure has been done with the intention to reduce the
aforesaid losses. Under the scheme HT lines are stretched to individual farms and dedicated transformers
have been installed. This is expected to reduce the incidence of hooking to a large extent.
17.2.1.1 Units Sent Out and Units Billed
The figures on units sent out and units billed are a clear indication on the change in T&D losses. The
percentage of units loss was in excess of 21% in the year ending 2006-07 which has dipped to 16% in the
year ending 2012-13.
DISCOM Feeders Villages No. of Customers
MGVCL 3 25 400

Cost Benefit Analysis of Kisan Hit Urja Shakti Yojana (KHUSH Final Report
CONFIDENTIAL
MCB/ISA/A/0/0 10 April 2014 P:\Ahmedabad\AMC\PROJECTS\326672AA01\Documents\Report\GUVNL - KHUSHY - Final Report-V3.docx MCB/ISA/A/0/0 10 April 2014 P:\Ahmedabad\AMC\PROJECTS\326672AA01\Documents\Report\GUVNL - KHUSHY - Final Report-V3.docx
137
Figure 17.2: MGVCL - Year-Wise % Units Loss
Source: IMM Analysis
Table 17.2: Discom-Wise and Year-Wise Units Sent Out and Units Billed
Year Units Sent Out (MUs) Units Billed (MUs) Loss (MUs) % Dist. Loss
2006-07 11.4 9.0 2.4 21%
2007-08 12.9 9.7 3.3 25%
2008-09 13.6 10.8 2.8 21%
2009-10 14.0 11.7 2.3 16%
2010-11 10.9 9.3 1.6 15%
2011-12 13.1 11.4 1.7 13%
2012-13 14.3 11.9 2.3 16%
Source: IMM Analysis
0%
5%
10%
15%
20%
25%
30%
2006-07 2007-08 2008-09 2009-10 2010-11 2011-12 2012-13
Year-Wise % Units Loss
Year-Wise % Units Loss

Cost Benefit Analysis of Kisan Hit Urja Shakti Yojana (KHUSH Final Report
CONFIDENTIAL
MCB/ISA/A/0/0 10 April 2014 P:\Ahmedabad\AMC\PROJECTS\326672AA01\Documents\Report\GUVNL - KHUSHY - Final Report-V3.docx MCB/ISA/A/0/0 10 April 2014 P:\Ahmedabad\AMC\PROJECTS\326672AA01\Documents\Report\GUVNL - KHUSHY - Final Report-V3.docx
138
17.2.1.2 Theoretical Loss
The percentage of Theoretical Loss was around 84% in the year ending 2007-08 which has dipped to 66%
in the year ending 2012-13.
The details of the % theoretical losses are as given in the below table
Table 17.3: Year Wise % Theoretical Loss
Discom 2006-07 2007-08 2008-09 2009-10 2010-11 2011-12 2012-13
MGVCL
Theoretical Loss (%)
- 84% 41% 55% 79% 69% 66%
Figure 17.3: Year-Wise Theoretical Loss
0
10
20
30
40
50
60
70
80
90
100
2006-07 2007-08 2008-09 2009-10 2010-11 2011-12 2012-13
% Theoretical Loss
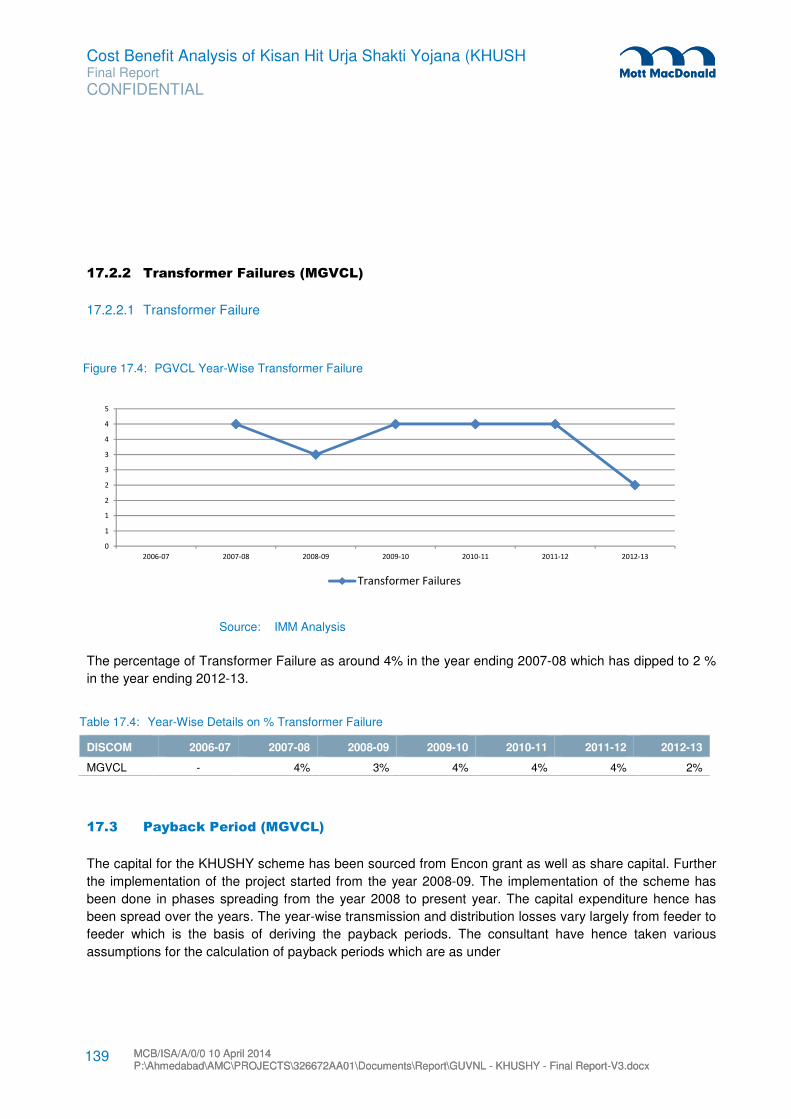
Cost Benefit Analysis of Kisan Hit Urja Shakti Yojana (KHUSH Final Report
CONFIDENTIAL
MCB/ISA/A/0/0 10 April 2014 P:\Ahmedabad\AMC\PROJECTS\326672AA01\Documents\Report\GUVNL - KHUSHY - Final Report-V3.docx MCB/ISA/A/0/0 10 April 2014 P:\Ahmedabad\AMC\PROJECTS\326672AA01\Documents\Report\GUVNL - KHUSHY - Final Report-V3.docx
139
17.2.2 Transformer Failures (MGVCL)
17.2.2.1 Transformer Failure
The percentage of Transformer Failure as around 4% in the year ending 2007-08 which has dipped to 2 %
in the year ending 2012-13.
Table 17.4: Year-Wise Details on % Transformer Failure
DISCOM 2006-07 2007-08 2008-09 2009-10 2010-11 2011-12 2012-13
MGVCL - 4% 3% 4% 4% 4% 2%
17.3 Payback Period (MGVCL)
The capital for the KHUSHY scheme has been sourced from Encon grant as well as share capital. Further
the implementation of the project started from the year 2008-09. The implementation of the scheme has
been done in phases spreading from the year 2008 to present year. The capital expenditure hence has
been spread over the years. The year-wise transmission and distribution losses vary largely from feeder to
feeder which is the basis of deriving the payback periods. The consultant have hence taken various
assumptions for the calculation of payback periods which are as under
Figure 17.4: PGVCL Year-Wise Transformer Failure
Source: IMM Analysis
0
1
1
2
2
3
3
4
4
5
2006-07 2007-08 2008-09 2009-10 2010-11 2011-12 2012-13
Transformer Failures

Cost Benefit Analysis of Kisan Hit Urja Shakti Yojana (KHUSH Final Report
CONFIDENTIAL
MCB/ISA/A/0/0 10 April 2014 P:\Ahmedabad\AMC\PROJECTS\326672AA01\Documents\Report\GUVNL - KHUSHY - Final Report-V3.docx MCB/ISA/A/0/0 10 April 2014 P:\Ahmedabad\AMC\PROJECTS\326672AA01\Documents\Report\GUVNL - KHUSHY - Final Report-V3.docx
140
17.3.1 Selection of Baseline Loss/Sent Unit
The Average yearly losses/Sent Units from 2006-07 to the year of conversion into HVDS have been taken
as the baseline loss for the calculation of payback period.
17.3.2 Selection of Cost Realization
To calculate the payback period it is necessary to convert the units saved after the implementation of
KHUSHY into monetary terms. The consultants have considered various options for the same which are
described as under
� To convert the units saved into monetary terms using Average Energy Charge Realization of HT
Industry Segment (as per GERC Filing)
� To convert the units saved into monetary terms using Total Average Energy Charge Realization
excluding Agriculture (as per GERC Filing)
� To convert the units saved into monetary terms using Average Energy Charge Realization of Agriculture
Segment ( as per GERC Filing)
For the current study the consultant are using the second option ie. Average Energy Charge Realization
excluding Agriculture (as per GERC Filing)
17.3.3 Cost of Capital
The capital sources for the scheme are the Encon grant and the share capital of individual distribution
companies. The assumptions of the cost of capital of different capital sources are as under. The cost of
capital of Encon has been taken as 0% as it is a grant.
Capital Source Cost of Capital %
Energy Conservation Grant 0%
Share Capital 12%
17.3.4 Savings due to reduction in Transformer Failures
The consultants have also taken in to consideration the savings accrued in terms of operational and
maintenance costs due to reduction in transformer failures while calculation payback periods. In absence
of accurate data related to year-wise costs on maintenance of transformers from the distribution
companies, the consultants have taken into consideration estimated costs of repairs and maintenance of a
single transformer which have been provided by PGVCL.

Cost Benefit Analysis of Kisan Hit Urja Shakti Yojana (KHUSH Final Report
CONFIDENTIAL
MCB/ISA/A/0/0 10 April 2014 P:\Ahmedabad\AMC\PROJECTS\326672AA01\Documents\Report\GUVNL - KHUSHY - Final Report-V3.docx MCB/ISA/A/0/0 10 April 2014 P:\Ahmedabad\AMC\PROJECTS\326672AA01\Documents\Report\GUVNL - KHUSHY - Final Report-V3.docx
141
17.4 Pay Back Calculations
Table 17.5: MGVCL – Payback Calculations (Dedicated Feeders)
Particulars Units
No. of Feeders 3
No. of Transformers 263
Total Expenditure 1.99 INR Crores
Base Year (1st Year) 2013-14
Payback Period 3.49 Years
Payback Year 2016-17
Source: IMM Analysis
Table 17.6: MGVCL – Payback Calculations (Scattered Feeders)
Particulars Units
No. of Feeders -
No. of Transformers 2384
Total Expenditure 27.30 INR Crores
Base Year (1st Year) 2013-14
Payback Period 9.50 Years
Payback Year 2022-23
Source: IMM Analysis
Table 17.7: MGVCL – Payback Calculations (Overall)
Particulars Units
No. of Feeders -
No. of Transformers 2910
Total Expenditure 29.29 INR Crores
Base Year (1st Year) 2013-14
Payback Period 8.83 Years
Payback Year 2021-22
Source: IMM Analysis

Cost Benefit Analysis of Kisan Hit Urja Shakti Yojana (KHUSH Final Report
CONFIDENTIAL
MCB/ISA/A/0/0 10 April 2014 P:\Ahmedabad\AMC\PROJECTS\326672AA01\Documents\Report\GUVNL - KHUSHY - Final Report-V3.docx MCB/ISA/A/0/0 10 April 2014 P:\Ahmedabad\AMC\PROJECTS\326672AA01\Documents\Report\GUVNL - KHUSHY - Final Report-V3.docx
142
18.1 Consumer Perception of KHUSHY
18.1.1 Overall Voltage Level/Quality
There has been a major improvement in the voltage level/quality after the implementation of KHUSHY. The
continuity of power supply would not be effective in absence of low or constantly fluctuating voltage. The
effectiveness of the implementation of the scheme on this parameter is crucial and has led to improve
satisfaction levels of the customers.
18.1.2 Line break/Unscheduled Breakdowns
The incidences of line breaks and unscheduled shutdowns have also drastically decreased after
implementation of KHUSHY.
18.1.3 Incidence of Hooking
Theft and pilferage account for a substantial part of the high transmission and distribution losses. One of
the objectives of the scheme was to minimize these losses. The various steps and technical interventions
during the scheme have made it cumbersome for the customers indulge in such activities.
18.1.4 Crop Output & Yield
The primary objective of the project was to provide consumers with uninterrupted and quality Power related
benefits. The Crop output & yield are directly dependent on the monsoon & weather conditions. The
electricity has little impact on the crop yield especially in cases where there is levels of underground water
are low.
18.1.5 Transformer Failure
The transformer failures have decreased drastically after the implementation of KHUSHY. Majority of the
surveyed customers strongly agree or agree to the statement that the transformer failures have reduced
after the implementation of the scheme.
The survey results show that majority of the customers experienced transformer failures around 3-5 times
while other few experienced it more than 5 times. After the implementation of KHUSHY all the surveyed
customers experienced transformer failure in the bracket of 0-2 times. The results hence show that there
has been a considerable decrease in transformer failure after the implementation of KHUSHY.
The results also show that there has been a considerable decrease in average days loss per transformer
failure after the implementation of KHUSHY.
18 Observations & Recommendations

Cost Benefit Analysis of Kisan Hit Urja Shakti Yojana (KHUSH Final Report
CONFIDENTIAL
MCB/ISA/A/0/0 10 April 2014 P:\Ahmedabad\AMC\PROJECTS\326672AA01\Documents\Report\GUVNL - KHUSHY - Final Report-V3.docx MCB/ISA/A/0/0 10 April 2014 P:\Ahmedabad\AMC\PROJECTS\326672AA01\Documents\Report\GUVNL - KHUSHY - Final Report-V3.docx
143
18.1.6 Motor Failure
The survey results show that a major portion of the customers experienced motor failures around 3-5 times
while other few experienced it more than 5 times. After the implementation of KHUSHY all the surveyed
customers experienced motor failures in the bracket of 0-2 times. The results hence show that there has
been a considerable decrease in motor failure after the implementation of KHUSHY.
The results also show that there has been a considerable decrease in average days loss per motor failure
after the implementation of KHUSHY.
The results hence show that there has been a considerable decrease in expense incurred on motor
failures after the implementation of KHUSHY.
18.1.7 Motor Starter Failure
The survey results show that a major portion of the customers experienced motor starter failures around 2-
3 times/year while other few experienced it more than 3 times. After the implementation of KHUSHY all the
surveyed customers experienced motor starter failure in the bracket of 0-1 times. The results hence show
that there has been a considerable decrease in motor starter failure after the implementation of KHUSHY.
The results also show that there has been a considerable decrease in average days loss per motor starter
failure after the implementation of KHUSHY.
The results also show that there has been a considerable decrease in expense incurred on motor starter
failures after the implementation of KHUSHY.
18.1.8 Bore Well
The operating hours of the bore well basically depends upon three variables including the monsoon, the
levels of ground water and availability of electricity. The electricity issue have been solved to a large extent
after the implementation of the scheme. The other two variables remaining unpredictable and largely
varying from location to location there, no major increase in the operating hours of the bore wells has been
observed.
18.1.9 View on continuation of the scheme
Out of the 2865 beneficiaries surveyed, 99% of them are happy & satisfied with the implementation of the
KHUSHY Scheme and have expressed their interest and willingness in support and continuation of the
scheme in other parts of the state.

Cost Benefit Analysis of Kisan Hit Urja Shakti Yojana (KHUSH Final Report
CONFIDENTIAL
MCB/ISA/A/0/0 10 April 2014 P:\Ahmedabad\AMC\PROJECTS\326672AA01\Documents\Report\GUVNL - KHUSHY - Final Report-V3.docx MCB/ISA/A/0/0 10 April 2014 P:\Ahmedabad\AMC\PROJECTS\326672AA01\Documents\Report\GUVNL - KHUSHY - Final Report-V3.docx
144
18.2 Estimated Monetary Benefit to Customers
The estimated yearly savings by the customers (across all discoms) on the cost incurred on motor failures
and motor starter failures are as under
Table 18.1: Monetary Benefits
Particulars INR Average no. of
Failures/Year Average expense
incurred/customer/year Number of Customers
Total Estimated Savings/Year
Average Savings in Motor Failure Expenses after KHUSHY
3233 2 6466 44286 28,63,53276
Average Savings in Motor Starter Failure Expenses after KHUSHY
1126 1.6 1801 44286 7,97,85657
Total INR 36,61,38934
It can be seen from the above table that there is a saving in excess of INR 360 Million to farmers only by
way of reduction in motor and motor starter failure expenses. In addition to this there is man days savings
which now is used by farmers in other productive work like different livelihood and more time spend with
their family.
18.3 Cost Benefit Analysis for DISCOMs
The implementation of the scheme had resulted into significant benefit for two discoms (UGVCL &
PGVCL). The payback of investment after considering the cost of capital associated with share capital is
reasonable as per industry standards and practise for schemes which have far reaching social
significance. The details of discom-wise investment, savings (MUs), estimated payback period is provided
in the table below:
Table 18.2: Summary of Analysis
DISCOM
Total Expenditure as on 31st March 2012-
13 (INR Crore)
Base Year (1st Year)
Payback Period from Base Year
( IN YEARS) Payback Year
Estimated Savings ( in
MUS)
DGVCL (Dedicated) 6.22 2013-14 15.48 2028-29 0.84
DGVCL (Scattered) 4.38 2013-14 53.11 2065-66 0.19
DGVCL (TOTAL) 10.59 2013-14 22.16 2034-35 1.03
MGVCL (Dedicated) 1.99 2013-14 3.49 2016-17 0.73
MGVCL (Scattered) 27.24 2013-14 9.50 2022-23 5.81
MGVCL (TOTAL) 29.23 2013-14 8.83 2021-22 6.54
PGVCL (Dedicated) 308.24 2013-14 3.20 2016-17 174.94
PGVCL(Scattered) 160.27 2013-14 12.91 2024-25 49.11
PGVCL (TOTAL) 468.51 2013-14 5.04 2018-19 224.05

Cost Benefit Analysis of Kisan Hit Urja Shakti Yojana (KHUSH Final Report
CONFIDENTIAL
MCB/ISA/A/0/0 10 April 2014 P:\Ahmedabad\AMC\PROJECTS\326672AA01\Documents\Report\GUVNL - KHUSHY - Final Report-V3.docx MCB/ISA/A/0/0 10 April 2014 P:\Ahmedabad\AMC\PROJECTS\326672AA01\Documents\Report\GUVNL - KHUSHY - Final Report-V3.docx
145
DISCOM
Total Expenditure as on 31st March 2012-
13 (INR Crore)
Base Year (1st Year)
Payback Period from Base Year
( IN YEARS) Payback Year
Estimated Savings ( in
MUS)
UGVCL (Dedicated) 4.26 2013-14 14.93 2027-28 0.67
UGVCL (Scattered) 31.52 2013-14 18.76 2031-32 3.80
UGVCL (TOTAL) 35.78 2013-14 18.30 2031-32 4.47
TOTAL 544.11 - - - 236.09
Since the implementation of scheme has accrued monetary benefits for some of the discoms, the scheme
should be implemented in line with rationale of converting high-loss Ag LVDS feeders into HVDS feeders.
The focus and priority should be given to conversion of dedicated feeders over scattered pockets.

Cost Benefit Analysis of Kisan Hit Urja Shakti Yojana (KHUSH Final Report
CONFIDENTIAL
MCB/ISA/A/0/0 10 April 2014 P:\Ahmedabad\AMC\PROJECTS\326672AA01\Documents\Report\GUVNL - KHUSHY - Final Report-V3.docx MCB/ISA/A/0/0 10 April 2014 P:\Ahmedabad\AMC\PROJECTS\326672AA01\Documents\Report\GUVNL - KHUSHY - Final Report-V3.docx
146
Appendices
Appendix A. List of Feeders Covered Under KHUSHY _______________________________________________ 147 Appendix B. Feeder Wise Change in Units Billed ___________________________________________________ 154 Appendix C. Feeder-Wise Details on Transformer Failure & Customer Complaints _________________________ 162 Appendix D. Questionnaire ____________________________________________________________________ 169

Cost Benefit Analysis of Kisan Hit Urja Shakti Yojana (KHUSH Final Report
CONFIDENTIAL
MCB/ISA/A/0/0 10 April 2014 P:\Ahmedabad\AMC\PROJECTS\326672AA01\Documents\Report\GUVNL - KHUSHY - Final Report-V3.docx MCB/ISA/A/0/0 10 April 2014 P:\Ahmedabad\AMC\PROJECTS\326672AA01\Documents\Report\GUVNL - KHUSHY - Final Report-V3.docx
147
The list of feeders covered under KHUSY and the corresponding details including Discom details, Circle,
Division, Sub-Division, villages covered, number of consumers benefitted, number of transformers installed
etc. are as given in the table:
Appendix A. List of Feeders Covered Under KHUSHY
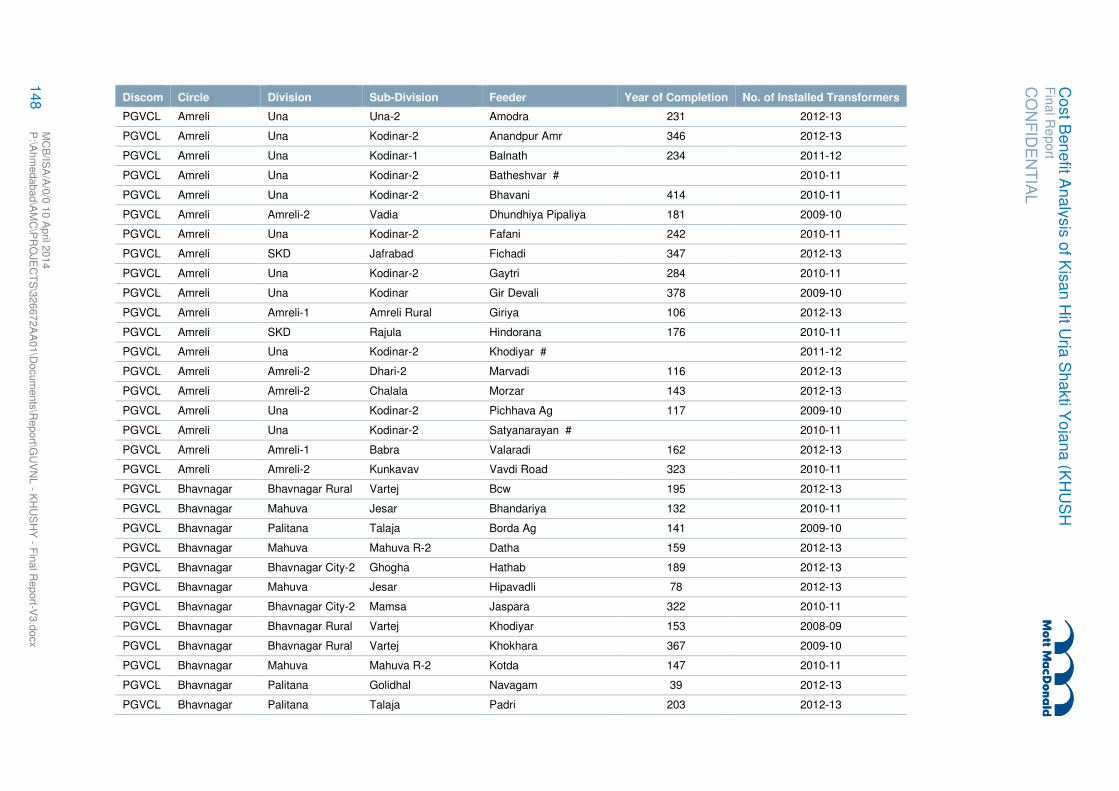
CO
NF
IDE
NT
IAL
Fin
al R
eport
Co
st B
en
efit A
na
lysis
of K
isan
Hit U
rja S
ha
kti Y
oja
na
(KH
US
H
148
MC
B/IS
A/A
/0/0
10 A
pril 2
014
P:\A
hm
edabad\A
MC
\PR
OJE
CT
S\3
26672A
A01\D
ocum
ents
\Report\G
UV
NL - K
HU
SH
Y - F
inal R
eport-V
3.d
ocx
Discom Circle Division Sub-Division Feeder Year of Completion No. of Installed Transformers
PGVCL Amreli Una Una-2 Amodra 231 2012-13
PGVCL Amreli Una Kodinar-2 Anandpur Amr 346 2012-13
PGVCL Amreli Una Kodinar-1 Balnath 234 2011-12
PGVCL Amreli Una Kodinar-2 Batheshvar # 2010-11
PGVCL Amreli Una Kodinar-2 Bhavani 414 2010-11
PGVCL Amreli Amreli-2 Vadia Dhundhiya Pipaliya 181 2009-10
PGVCL Amreli Una Kodinar-2 Fafani 242 2010-11
PGVCL Amreli SKD Jafrabad Fichadi 347 2012-13
PGVCL Amreli Una Kodinar-2 Gaytri 284 2010-11
PGVCL Amreli Una Kodinar Gir Devali 378 2009-10
PGVCL Amreli Amreli-1 Amreli Rural Giriya 106 2012-13
PGVCL Amreli SKD Rajula Hindorana 176 2010-11
PGVCL Amreli Una Kodinar-2 Khodiyar # 2011-12
PGVCL Amreli Amreli-2 Dhari-2 Marvadi 116 2012-13
PGVCL Amreli Amreli-2 Chalala Morzar 143 2012-13
PGVCL Amreli Una Kodinar-2 Pichhava Ag 117 2009-10
PGVCL Amreli Una Kodinar-2 Satyanarayan # 2010-11
PGVCL Amreli Amreli-1 Babra Valaradi 162 2012-13
PGVCL Amreli Amreli-2 Kunkavav Vavdi Road 323 2010-11
PGVCL Bhavnagar Bhavnagar Rural Vartej Bcw 195 2012-13
PGVCL Bhavnagar Mahuva Jesar Bhandariya 132 2010-11
PGVCL Bhavnagar Palitana Talaja Borda Ag 141 2009-10
PGVCL Bhavnagar Mahuva Mahuva R-2 Datha 159 2012-13
PGVCL Bhavnagar Bhavnagar City-2 Ghogha Hathab 189 2012-13
PGVCL Bhavnagar Mahuva Jesar Hipavadli 78 2012-13
PGVCL Bhavnagar Bhavnagar City-2 Mamsa Jaspara 322 2010-11
PGVCL Bhavnagar Bhavnagar Rural Vartej Khodiyar 153 2008-09
PGVCL Bhavnagar Bhavnagar Rural Vartej Khokhara 367 2009-10
PGVCL Bhavnagar Mahuva Mahuva R-2 Kotda 147 2010-11
PGVCL Bhavnagar Palitana Golidhal Navagam 39 2012-13
PGVCL Bhavnagar Palitana Talaja Padri 203 2012-13

CO
NF
IDE
NT
IAL
Fin
al R
eport
Co
st B
en
efit A
na
lysis
of K
isan
Hit U
rja S
ha
kti Y
oja
na
(KH
US
H
149
MC
B/IS
A/A
/0/0
10 A
pril 2
014
P:\A
hm
edabad\A
MC
\PR
OJE
CT
S\3
26672A
A01\D
ocum
ents
\Report\G
UV
NL - K
HU
SH
Y - F
inal R
eport-V
3.d
ocx
Discom Circle Division Sub-Division Feeder Year of Completion No. of Installed Transformers
PGVCL Bhavnagar Bhavnagar Rural Sanosara Pipardi Ag 142 2012-13
PGVCL Bhavnagar Mahuva Jesar Vadal 111 2011-12
PGVCL Bhavnagar Bhavnagar Rural Sanosara Vavadi 208 2010-11
PGVCL Bhuj Naliya Kothara Arjanpar Ag 60 2012-13
PGVCL Bhuj Anjar Anjar Rural-1 Bhalot Ag 61 2011-12
PGVCL Bhuj Anjar Anjar Rural Bhavanipar 103 2010-11
PGVCL Bhuj Anjar Anjar T Dabda 41 2012-13
PGVCL Bhuj Naliya Nakhtrana Devisar 98 2010-11
PGVCL Bhuj Mandvi Mundra Gelda 90 2011-12
PGVCL Bhuj Anjar Bhimasar Hamirpar 255 2012-13
PGVCL Bhuj Anjar Bhachau Kharoi 80 2010-11
PGVCL Bhuj Bhachau Rapar Khengarpar 97 2012-13
PGVCL Bhuj Bhuj Deshalpar Khirsara Ag 44 2012-13
PGVCL Bhuj Naliya Nakhtrana Mathal Ag 21 2012-13
PGVCL Bhuj Mandvi Dahisara Meghpar 73 2012-13
PGVCL Bhuj Mandvi Mundra Navinal 123 2010-11
PGVCL Bhuj Bhuj Madhapara Vavdi 14 2012-13
PGVCL Botad Botad Paliyad Babarkot 149 2009-10
PGVCL Botad Botad Botad (T-2) Dhakaniya 114 2011-12
PGVCL Botad Botad Barvala Mithapur Ag 151 2008-09
PGVCL Botad Gadhada Dhasa Patana 336 2008-09
PGVCL Botad Gadhada Gadhda-R Pipal 122 2012-13
PGVCL Botad Botad Botad (R) Ratanvav 21 2012-13
PGVCL Botad Gadhada DHASA Sitapar 95 2012-13
PGVCL Botad Botad Botad Zamrala Ag 31 2012-13
PGVCL Jamnagar Jamnagar City-1 Hapa Aliyabada (New) 266 2008-09
PGVCL Jamnagar Jamnagar Rural Kalavad West Bamangam 276 2010-11
PGVCL Jamnagar Jamnagar City-2 Rural Dhandha Ag 196 2012-13
PGVCL Jamnagar Jamjhodpur Bhanavad Gunda 170 2010-11
PGVCL Jamnagar Khamabhalia Khamabhalia-R Hapa Lakhasar 124 2010-11
PGVCL Jamnagar Jamjhodpur Lalpur Haripar 153 2012-13

CO
NF
IDE
NT
IAL
Fin
al R
eport
Co
st B
en
efit A
na
lysis
of K
isan
Hit U
rja S
ha
kti Y
oja
na
(KH
US
H
150
MC
B/IS
A/A
/0/0
10 A
pril 2
014
P:\A
hm
edabad\A
MC
\PR
OJE
CT
S\3
26672A
A01\D
ocum
ents
\Report\G
UV
NL - K
HU
SH
Y - F
inal R
eport-V
3.d
ocx
Discom Circle Division Sub-Division Feeder Year of Completion No. of Installed Transformers
PGVCL Jamnagar Khamabhalia Vadatra SD Juvangadh 276 2012-13
PGVCL Jamnagar Jamjhodpur Jamjhodpur West Mota Vadiya 101 2010-11
PGVCL Jamnagar Jamnagar City-2 Sikka Padana 160 2012-13
PGVCL Jamnagar Jamnagar Rural Dhrol SD Rampar 433 2012-13
PGVCL Jamnagar Jamnagar Rural Kalavad East Sanala 291 2010-11
PGVCL Jamnagar Jamjhodpur Jamjhodpur East Sidsar 183 2010-11
PGVCL Jamnagar Jamnagar City-2 Hapa Theba Ag. 174 2012-13
PGVCL Junagadh Veraval Akolvadi Amblash 157 2010-11
PGVCL Junagadh Junagadh-2 Vanthali Balot (Naredi) 223 2011-12
PGVCL Junagadh Veraval Talala Bhalchel 145 2012-13
PGVCL Junagadh Junagadh-1 Bhesan Bhatgam 165 2012-13
PGVCL Junagadh Veraval P. Patan Dari Navapara 255 2010-11
PGVCL Junagadh Veraval Pranchi Gorakhmadhi 260 2010-11
PGVCL Junagadh Veraval P. Patan Govindpara (Old Talala) 185 2010-11
PGVCL Junagadh Veraval P. Patan Harnasha 267 2012-13
PGVCL Junagadh Veraval P. Patan Khodiyar Jnd 153 2010-11
PGVCL Junagadh Veraval Akolvadi Kodidra 223 2010-11
PGVCL Junagadh Junagadh-1 VSR-2 Leriya Ag 218 2012-13
PGVCL Junagadh Veraval Pranchi Moradia 227 2010-11
PGVCL Junagadh Veraval Talala Pipalava 401 2010-11
PGVCL Junagadh Veraval Akolvadi Raydi (Rampara) 141 2010-11
PGVCL Junagadh Junagadh City GIDC Junagadh Sonrakh 11 2012-13
PGVCL Junagadh Veraval Pranchi Sunderpara 300 2010-11
PGVCL Junagadh Junagadh-1 Bilkha Swami 257 2012-13
PGVCL Morbi Halvad Sara Ambardi 60 2012-13
PGVCL Morbi Morbi Tankara Ambavadi 110 2012-13
PGVCL Morbi Morbi Morbi Rural Balwam 74 2012-13
PGVCL Morbi Halvad Charadva Chupani 146 2010-11
PGVCL Morbi Halvad Halvad Town Dhavana 31 2012-13
PGVCL Morbi Morbi Tankara Hadmatia Ag 179 2012-13
PGVCL Morbi Wankaner Wankaner Rural-1 Holmadh 150 2012-13

CO
NF
IDE
NT
IAL
Fin
al R
eport
Co
st B
en
efit A
na
lysis
of K
isan
Hit U
rja S
ha
kti Y
oja
na
(KH
US
H
151
MC
B/IS
A/A
/0/0
10 A
pril 2
014
P:\A
hm
edabad\A
MC
\PR
OJE
CT
S\3
26672A
A01\D
ocum
ents
\Report\G
UV
NL - K
HU
SH
Y - F
inal R
eport-V
3.d
ocx
Discom Circle Division Sub-Division Feeder Year of Completion No. of Installed Transformers
PGVCL Morbi Halvad Sara Jay Bhavani 66 2010-11
PGVCL Morbi Halvad Sara Jay Bhole 86 2012-13
PGVCL Morbi Halvad Halvad Town Kansari 41 2012-13
PGVCL Morbi Halvad Halvad Town Merupar 17 2012-13
PGVCL Morbi Halvad Charadva Om 35 2012-13
PGVCL Morbi Halvad Sara Pavan 90 2010-11
PGVCL Morbi Halvad Sara Ranipat 61 2012-13
PGVCL Morbi Wankaner Wankaner Rural-2 Ratadia 49 2012-13
PGVCL Morbi Wankaner Wankaner Rural-2 Samtherava 155 2010-11
PGVCL Morbi Halvad Halvad Town Shivlaheri 40 2012-13
PGVCL Morbi Halvad Sara Sundari 101 2012-13
PGVCL Morbi Halvad Charadva Sundergadh 127 2010-11
PGVCL Porbandar Keshod-2 Keshod-O&M-1 Amarnath 302 2010-11
PGVCL Porbandar Porbandar Rural Ranavav Boradi 185 2012-13
PGVCL Porbandar Keshod-2 Mangrol(R) Chakivav 331 2010-11
PGVCL Porbandar Porbandar Rural Bagvadar Chamunda 149 2012-13
PGVCL Porbandar Keshod-O&M-2 Chorwad Devgam 207 2010-11
PGVCL Porbandar Mangrol Madhavpur Diwasa 73 2011-12
PGVCL Porbandar Kutiyana RURAL Khodiyar Pbr 143 2012-13
PGVCL Porbandar Porbandar Rural Bagvadar Mariya 116 2012-13
PGVCL Porbandar Keshod-1 Rural-1 Nonjalvav 207 2012-13
PGVCL Porbandar Keshod-2 Keshod-O&M-1 Nunarda 162 2010-11
PGVCL Porbandar Keshod-2 Mangrol(R) Satmarg 175 2010-11
PGVCL Porbandar Keshod-2 Mangrol(R) Shepa 453 2010-11
PGVCL Porbandar Keshod-1 Keshod-O&M-1 Shergadh 322 2011-12
PGVCL Porbandar Keshod-O&M-2 Mangrol(T) Water Works 240 2010-11
PGVCL Rajkot City Rajkot City-3 Rajkot Rural Sub-Div Nakarawadi 218 2012-13
PGVCL Rajkot City Rajkot City-3 Madhapar Sub-Div Rangpar 220 2012-13
PGVCL Rajkot Rural Dhoraji Dhoraji (R) Bateshwar 287 2012-13
PGVCL Rajkot Rural Gondal Kotda Bhadva 195 2010-11
PGVCL Rajkot Rural Dhoraji Jetpur (R) Dedarva 154 2012-13
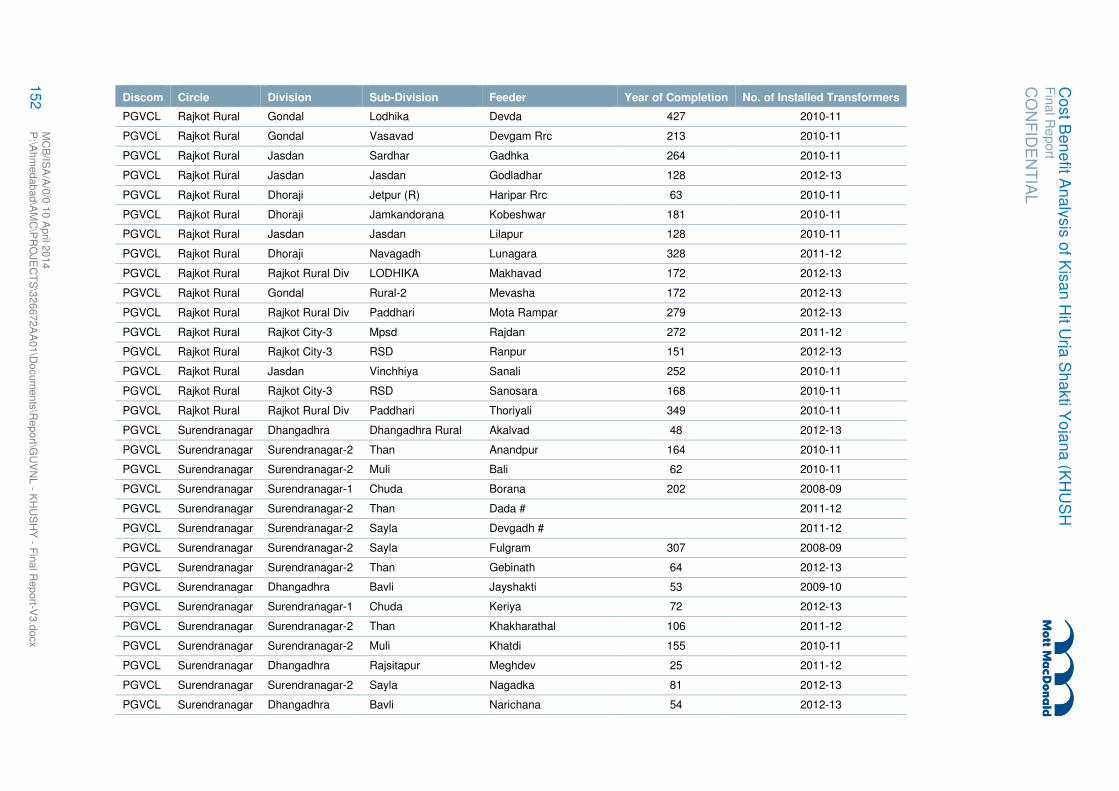
CO
NF
IDE
NT
IAL
Fin
al R
eport
Co
st B
en
efit A
na
lysis
of K
isan
Hit U
rja S
ha
kti Y
oja
na
(KH
US
H
152
MC
B/IS
A/A
/0/0
10 A
pril 2
014
P:\A
hm
edabad\A
MC
\PR
OJE
CT
S\3
26672A
A01\D
ocum
ents
\Report\G
UV
NL - K
HU
SH
Y - F
inal R
eport-V
3.d
ocx
Discom Circle Division Sub-Division Feeder Year of Completion No. of Installed Transformers
PGVCL Rajkot Rural Gondal Lodhika Devda 427 2010-11
PGVCL Rajkot Rural Gondal Vasavad Devgam Rrc 213 2010-11
PGVCL Rajkot Rural Jasdan Sardhar Gadhka 264 2010-11
PGVCL Rajkot Rural Jasdan Jasdan Godladhar 128 2012-13
PGVCL Rajkot Rural Dhoraji Jetpur (R) Haripar Rrc 63 2010-11
PGVCL Rajkot Rural Dhoraji Jamkandorana Kobeshwar 181 2010-11
PGVCL Rajkot Rural Jasdan Jasdan Lilapur 128 2010-11
PGVCL Rajkot Rural Dhoraji Navagadh Lunagara 328 2011-12
PGVCL Rajkot Rural Rajkot Rural Div LODHIKA Makhavad 172 2012-13
PGVCL Rajkot Rural Gondal Rural-2 Mevasha 172 2012-13
PGVCL Rajkot Rural Rajkot Rural Div Paddhari Mota Rampar 279 2012-13
PGVCL Rajkot Rural Rajkot City-3 Mpsd Rajdan 272 2011-12
PGVCL Rajkot Rural Rajkot City-3 RSD Ranpur 151 2012-13
PGVCL Rajkot Rural Jasdan Vinchhiya Sanali 252 2010-11
PGVCL Rajkot Rural Rajkot City-3 RSD Sanosara 168 2010-11
PGVCL Rajkot Rural Rajkot Rural Div Paddhari Thoriyali 349 2010-11
PGVCL Surendranagar Dhangadhra Dhangadhra Rural Akalvad 48 2012-13
PGVCL Surendranagar Surendranagar-2 Than Anandpur 164 2010-11
PGVCL Surendranagar Surendranagar-2 Muli Bali 62 2010-11
PGVCL Surendranagar Surendranagar-1 Chuda Borana 202 2008-09
PGVCL Surendranagar Surendranagar-2 Than Dada # 2011-12
PGVCL Surendranagar Surendranagar-2 Sayla Devgadh # 2011-12
PGVCL Surendranagar Surendranagar-2 Sayla Fulgram 307 2008-09
PGVCL Surendranagar Surendranagar-2 Than Gebinath 64 2012-13
PGVCL Surendranagar Dhangadhra Bavli Jayshakti 53 2009-10
PGVCL Surendranagar Surendranagar-1 Chuda Keriya 72 2012-13
PGVCL Surendranagar Surendranagar-2 Than Khakharathal 106 2011-12
PGVCL Surendranagar Surendranagar-2 Muli Khatdi 155 2010-11
PGVCL Surendranagar Dhangadhra Rajsitapur Meghdev 25 2011-12
PGVCL Surendranagar Surendranagar-2 Sayla Nagadka 81 2012-13
PGVCL Surendranagar Dhangadhra Bavli Narichana 54 2012-13

CO
NF
IDE
NT
IAL
Fin
al R
eport
Co
st B
en
efit A
na
lysis
of K
isan
Hit U
rja S
ha
kti Y
oja
na
(KH
US
H
153
MC
B/IS
A/A
/0/0
10 A
pril 2
014
P:\A
hm
edabad\A
MC
\PR
OJE
CT
S\3
26672A
A01\D
ocum
ents
\Report\G
UV
NL - K
HU
SH
Y - F
inal R
eport-V
3.d
ocx
Discom Circle Division Sub-Division Feeder Year of Completion No. of Installed Transformers
PGVCL Surendranagar Surendranagar-1 LSDR Navi Morvad # 2008-09
PGVCL Surendranagar Surendranagar-2 Sayla Noli 202 2010-11
PGVCL Surendranagar Surendranagar-2 SRSD Pandavra 121 2011-12
PGVCL Surendranagar Surendranagar-2 Muli Ramperda 36 2010-11
PGVCL Surendranagar Surendranagar-1 LSDR Sardar # 2008-09
PGVCL Surendranagar Dhangadhra Bavli Siddhanath 58 2009-10

Cost Benefit Analysis of Kisan Hit Urja Shakti Yojana (KHUSH Final Report
CONFIDENTIAL
MCB/ISA/A/0/0 10 April 2014 P:\Ahmedabad\AMC\PROJECTS\326672AA01\Documents\Report\GUVNL - KHUSHY - Final Report-V3.docx MCB/ISA/A/0/0 10 April 2014 P:\Ahmedabad\AMC\PROJECTS\326672AA01\Documents\Report\GUVNL - KHUSHY - Final Report-V3.docx
154
The Feeder-wise change in units billed after implementation of KHUSHY is as given in the table:
Appendix B. Feeder Wise Change in Units Billed

CO
NF
IDE
NT
IAL
Fin
al R
eport
Co
st B
en
efit A
na
lysis
of K
isan
Hit U
rja S
ha
kti Y
oja
na
(KH
US
H
155
MC
B/IS
A/A
/0/0
10 A
pril 2
014
P:\A
hm
edabad\A
MC
\PR
OJE
CT
S\3
26672A
A01\D
ocum
ents
\Report\G
UV
NL - K
HU
SH
Y - F
inal R
eport-V
3.d
ocx
Units Send (MuS) Units Billed (MuS)
Discom Circle Feeder 2006-
07 2007-
08 2008-
09 2009-
10 2010-
11 2011-
12 2012-
13 2006-
07 2007-
08 2008-
09 2009-
10 2010-
11 2011-
12 2012-
13
PGVCL Amreli Amodra 2.82 3.57 4.67 5.23 4.53 5.87 5.79 2.15 2.89 2.91 2.92 2.98 3.27 4.35
PGVCL Amreli Anandpur Amr 6.59 7.05 8.36 6.07 6.07 7.60 11.06 3.59 3.45 3.55 3.55 4.35 4.35 5.44
PGVCL Amreli Balnath 5.52 7.23 7.56 8.52 8.77 8.83 9.10 1.83 3.28 3.39 3.75 4.40 4.77 5.76
PGVCL Amreli Batheshvar #
PGVCL Amreli Bhavani 5.59 6.49 7.01 8.51 5.58 3.43 4.11 1.23 2.36 2.54 2.59 3.03 1.21 1.45
PGVCL Amreli Dhundhiya
Pipaliya 4.20 5.72 5.87 6.80 4.45 5.52 6.38 2.07 2.89 3.22 3.29 4.16 4.66 4.91
PGVCL Amreli Fafani 3.24 3.88 4.09 4.66 3.39 3.15 3.34 0.51 1.02 1.22 1.31 2.11 2.35 2.58
PGVCL Amreli Fichadi 1.65 2.15 1.80 2.06 1.82 4.01 2.42 1.50 1.83 2.00 2.24 1.87 2.28 2.42
PGVCL Amreli Gaytri 5.07 5.26 5.39 6.71 5.55 6.04 4.55 0.87 1.71 1.80 1.84 1.96 3.38 2.56
PGVCL Amreli Gir Devali 5.46 6.22 6.60 8.38 5.18 4.53 4.51 1.40 2.35 2.61 2.68 3.86 2.58 2.69
PGVCL Amreli Giriya 0.00 0.00 4.03 5.98 4.35 3.72 4.13 0.00 0.00 1.43 2.03 1.81 1.97 2.87
PGVCL Amreli Hindorana 1.42 2.42 2.33 1.77 1.50 1.76 2.43 0.81 1.10 1.16 1.52 1.63 1.91 2.28
PGVCL Amreli Khodiyar #
PGVCL Amreli Marvadi 4.06 5.26 5.48 7.70 3.58 5.05 6.02 1.55 3.17 2.98 3.08 1.59 1.73 2.59
PGVCL Amreli Morzar 4.85 5.85 6.61 7.04 4.86 5.96 8.06 1.92 2.86 3.10 2.59 2.01 2.16 3.78
PGVCL Amreli Pichhava Ag 1.06 3.09 2.53 2.75 1.86 2.13 2.29 2.47 2.47 0.58 1.07 1.08 1.12 1.23
PGVCL Amreli Satyanarayan #
PGVCL Amreli Valaradi 1.42 2.92 3.14 4.04 4.34 4.48 3.59 1.36 1.66 1.89 1.82 2.18 2.37 2.67
PGVCL Amreli Vavdi Road 2.32 5.80 3.31 5.85 5.19 6.38 3.77 1.79 2.48 1.81 2.81 3.33 4.68 3.78
PGVCL Bhavnagar Bcw 2.38 3.01 3.54 6.36 5.45 5.55 7.43 1.40 3.10 3.21 3.40 3.59 3.71 4.06
PGVCL Bhavnagar Bhandariya 0.00 0.00 2.58 2.64 1.63 2.28 3.39 0.00 0.00 0.80 1.29 1.36 1.47 2.02
PGVCL Bhavnagar Borda Ag 2.72 2.70 2.45 1.35 1.47 1.84 1.23 1.17 1.09 1.10 0.63 1.01 1.11 1.06
PGVCL Bhavnagar Datha 3.98 4.14 3.93 2.64 2.23 2.86 3.80 1.74 1.26 1.31 0.25 0.54 0.56 1.58
PGVCL Bhavnagar Hathab 2.48 3.02 3.68 4.47 3.81 4.03 4.79 0.29 0.18 0.91 1.27 1.50 1.88 2.43
PGVCL Bhavnagar Hipavadli 0.00 0.00 0.00 0.00 2.10 2.71 4.13 0.00 0.00 0.00 0.00 0.53 0.62 1.04
PGVCL Bhavnagar Jaspara 3.54 3.62 3.69 4.00 3.15 2.64 2.55 0.52 0.58 0.81 2.13 2.50 2.59 2.65
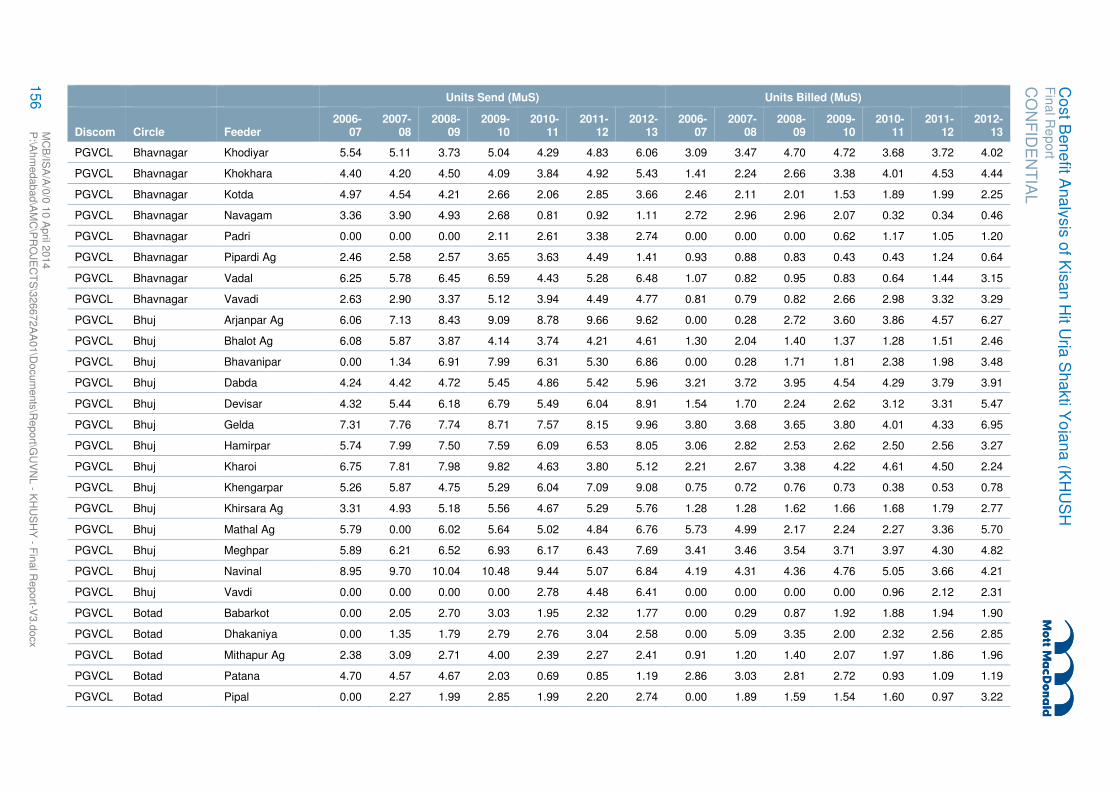
CO
NF
IDE
NT
IAL
Fin
al R
eport
Co
st B
en
efit A
na
lysis
of K
isan
Hit U
rja S
ha
kti Y
oja
na
(KH
US
H
156
MC
B/IS
A/A
/0/0
10 A
pril 2
014
P:\A
hm
edabad\A
MC
\PR
OJE
CT
S\3
26672A
A01\D
ocum
ents
\Report\G
UV
NL - K
HU
SH
Y - F
inal R
eport-V
3.d
ocx
Units Send (MuS) Units Billed (MuS)
Discom Circle Feeder 2006-
07 2007-
08 2008-
09 2009-
10 2010-
11 2011-
12 2012-
13 2006-
07 2007-
08 2008-
09 2009-
10 2010-
11 2011-
12 2012-
13
PGVCL Bhavnagar Khodiyar 5.54 5.11 3.73 5.04 4.29 4.83 6.06 3.09 3.47 4.70 4.72 3.68 3.72 4.02
PGVCL Bhavnagar Khokhara 4.40 4.20 4.50 4.09 3.84 4.92 5.43 1.41 2.24 2.66 3.38 4.01 4.53 4.44
PGVCL Bhavnagar Kotda 4.97 4.54 4.21 2.66 2.06 2.85 3.66 2.46 2.11 2.01 1.53 1.89 1.99 2.25
PGVCL Bhavnagar Navagam 3.36 3.90 4.93 2.68 0.81 0.92 1.11 2.72 2.96 2.96 2.07 0.32 0.34 0.46
PGVCL Bhavnagar Padri 0.00 0.00 0.00 2.11 2.61 3.38 2.74 0.00 0.00 0.00 0.62 1.17 1.05 1.20
PGVCL Bhavnagar Pipardi Ag 2.46 2.58 2.57 3.65 3.63 4.49 1.41 0.93 0.88 0.83 0.43 0.43 1.24 0.64
PGVCL Bhavnagar Vadal 6.25 5.78 6.45 6.59 4.43 5.28 6.48 1.07 0.82 0.95 0.83 0.64 1.44 3.15
PGVCL Bhavnagar Vavadi 2.63 2.90 3.37 5.12 3.94 4.49 4.77 0.81 0.79 0.82 2.66 2.98 3.32 3.29
PGVCL Bhuj Arjanpar Ag 6.06 7.13 8.43 9.09 8.78 9.66 9.62 0.00 0.28 2.72 3.60 3.86 4.57 6.27
PGVCL Bhuj Bhalot Ag 6.08 5.87 3.87 4.14 3.74 4.21 4.61 1.30 2.04 1.40 1.37 1.28 1.51 2.46
PGVCL Bhuj Bhavanipar 0.00 1.34 6.91 7.99 6.31 5.30 6.86 0.00 0.28 1.71 1.81 2.38 1.98 3.48
PGVCL Bhuj Dabda 4.24 4.42 4.72 5.45 4.86 5.42 5.96 3.21 3.72 3.95 4.54 4.29 3.79 3.91
PGVCL Bhuj Devisar 4.32 5.44 6.18 6.79 5.49 6.04 8.91 1.54 1.70 2.24 2.62 3.12 3.31 5.47
PGVCL Bhuj Gelda 7.31 7.76 7.74 8.71 7.57 8.15 9.96 3.80 3.68 3.65 3.80 4.01 4.33 6.95
PGVCL Bhuj Hamirpar 5.74 7.99 7.50 7.59 6.09 6.53 8.05 3.06 2.82 2.53 2.62 2.50 2.56 3.27
PGVCL Bhuj Kharoi 6.75 7.81 7.98 9.82 4.63 3.80 5.12 2.21 2.67 3.38 4.22 4.61 4.50 2.24
PGVCL Bhuj Khengarpar 5.26 5.87 4.75 5.29 6.04 7.09 9.08 0.75 0.72 0.76 0.73 0.38 0.53 0.78
PGVCL Bhuj Khirsara Ag 3.31 4.93 5.18 5.56 4.67 5.29 5.76 1.28 1.28 1.62 1.66 1.68 1.79 2.77
PGVCL Bhuj Mathal Ag 5.79 0.00 6.02 5.64 5.02 4.84 6.76 5.73 4.99 2.17 2.24 2.27 3.36 5.70
PGVCL Bhuj Meghpar 5.89 6.21 6.52 6.93 6.17 6.43 7.69 3.41 3.46 3.54 3.71 3.97 4.30 4.82
PGVCL Bhuj Navinal 8.95 9.70 10.04 10.48 9.44 5.07 6.84 4.19 4.31 4.36 4.76 5.05 3.66 4.21
PGVCL Bhuj Vavdi 0.00 0.00 0.00 0.00 2.78 4.48 6.41 0.00 0.00 0.00 0.00 0.96 2.12 2.31
PGVCL Botad Babarkot 0.00 2.05 2.70 3.03 1.95 2.32 1.77 0.00 0.29 0.87 1.92 1.88 1.94 1.90
PGVCL Botad Dhakaniya 0.00 1.35 1.79 2.79 2.76 3.04 2.58 0.00 5.09 3.35 2.00 2.32 2.56 2.85
PGVCL Botad Mithapur Ag 2.38 3.09 2.71 4.00 2.39 2.27 2.41 0.91 1.20 1.40 2.07 1.97 1.86 1.96
PGVCL Botad Patana 4.70 4.57 4.67 2.03 0.69 0.85 1.19 2.86 3.03 2.81 2.72 0.93 1.09 1.19
PGVCL Botad Pipal 0.00 2.27 1.99 2.85 1.99 2.20 2.74 0.00 1.89 1.59 1.54 1.60 0.97 3.22

CO
NF
IDE
NT
IAL
Fin
al R
eport
Co
st B
en
efit A
na
lysis
of K
isan
Hit U
rja S
ha
kti Y
oja
na
(KH
US
H
157
MC
B/IS
A/A
/0/0
10 A
pril 2
014
P:\A
hm
edabad\A
MC
\PR
OJE
CT
S\3
26672A
A01\D
ocum
ents
\Report\G
UV
NL - K
HU
SH
Y - F
inal R
eport-V
3.d
ocx
Units Send (MuS) Units Billed (MuS)
Discom Circle Feeder 2006-
07 2007-
08 2008-
09 2009-
10 2010-
11 2011-
12 2012-
13 2006-
07 2007-
08 2008-
09 2009-
10 2010-
11 2011-
12 2012-
13
PGVCL Botad Ratanvav 2.08 1.84 1.72 2.87 1.58 1.48 1.18 1.08 1.24 1.38 1.67 1.12 1.12 1.28
PGVCL Botad Sitapar 0.00 0.00 0.00 1.00 2.04 2.39 2.06 0.00 0.00 0.00 0.25 0.92 1.20 1.69
PGVCL Botad Zamrala Ag 0.00 0.00 0.00 0.00 1.08 1.37 1.01 0.00 0.00 0.00 0.00 0.59 0.92 1.43
PGVCL Jamnagar Aliyabada (New) 3.26 3.10 4.13 5.14 4.30 4.68 1.16 2.28 3.13 3.20 3.90 4.02 4.90 2.29
PGVCL Jamnagar Bamangam 4.53 4.41 5.18 6.10 4.50 5.19 4.89 0.70 0.76 1.91 2.67 3.71 4.17 4.29
PGVCL Jamnagar Dhandha Ag 0.00 1.08 3.38 4.79 3.92 4.86 5.38 0.00 0.42 0.90 0.95 0.99 1.19 1.19
PGVCL Jamnagar Gunda 3.53 3.51 4.66 4.08 2.72 4.36 2.73 0.42 1.32 1.44 3.34 3.34 3.83 2.71
PGVCL Jamnagar Hapa Lakhasar 4.11 7.64 8.15 6.37 4.30 4.73 5.48 0.32 0.69 1.08 1.93 1.88 2.18 2.25
PGVCL Jamnagar Haripar 0.68 0.68 2.00 2.33 1.18 1.61 2.03 0.64 0.64 0.64 0.96 0.96 1.19 1.21
PGVCL Jamnagar Juvangadh 4.79 3.03 3.43 3.97 2.79 4.34 5.87 1.70 1.21 1.59 1.07 0.29 0.42 0.31
PGVCL Jamnagar Mota Vadiya 1.17 2.03 2.23 2.58 2.44 2.54 2.93 0.63 0.65 0.73 0.82 0.71 0.91 1.18
PGVCL Jamnagar Padana 2.03 1.92 2.50 2.88 2.57 3.19 3.42 1.66 0.98 0.89 0.84 0.79 0.92 1.04
PGVCL Jamnagar Rampar 0.85 4.86 4.70 5.54 4.54 5.07 5.24 0.15 1.29 1.69 1.70 1.82 2.03 2.18
PGVCL Jamnagar Sanala 4.15 4.45 6.06 4.21 1.15 1.44 3.21 0.76 1.01 2.98 2.75 2.08 2.11 2.03
PGVCL Jamnagar Sidsar 3.68 3.79 4.62 5.69 4.15 2.79 2.72 1.78 1.88 2.07 2.32 2.25 2.66 3.30
PGVCL Jamnagar Theba Ag. 0.00 0.00 0.99 2.92 2.52 2.93 3.29 0.00 0.00 0.03 0.33 0.18 0.21 1.62
PGVCL Junagadh Amblash 4.64 5.28 4.81 5.90 4.22 4.49 4.43 3.45 2.58 2.56 2.88 2.93 3.13 3.90
PGVCL Junagadh Balot (Naredi) 3.96 2.68 3.00 3.93 2.38 3.18 3.68 1.91 0.52 0.53 1.85 1.50 1.71 2.16
PGVCL Junagadh Bhalchel 1.83 1.85 1.99 2.90 2.17 1.94 2.28 0.82 0.75 0.78 0.79 0.83 0.94 1.17
PGVCL Junagadh Bhatgam 4.14 4.16 4.40 7.08 3.10 3.53 4.15 1.87 2.36 2.80 3.36 1.65 1.28 1.48
PGVCL Junagadh Dari Navapara 5.93 6.95 8.51 4.02 5.67 6.14 7.05 3.88 3.35 3.35 1.94 2.92 2.94 3.49
PGVCL Junagadh Gorakhmadhi 6.06 7.21 7.58 8.93 7.16 8.63 8.30 2.57 2.57 2.75 3.53 3.76 4.19 4.92
PGVCL Junagadh Govindpara (Old
Talala) 4.36 6.35 7.68 7.70 6.42 4.00 3.81 2.10 2.94 2.99 3.11 3.20 2.62 2.66
PGVCL Junagadh Harnasha 4.03 3.13 4.00 6.04 5.32 5.89 8.40 2.20 1.77 1.79 1.83 1.96 1.92 2.36
PGVCL Junagadh Khodiyar Jnd 6.11 6.72 6.46 7.73 6.72 7.71 7.68 2.01 2.76 2.68 2.75 2.73 3.07 3.64
PGVCL Junagadh Kodidra 4.01 5.10 5.82 5.23 4.51 3.10 3.33 2.90 3.03 3.02 3.22 3.30 2.00 2.42

CO
NF
IDE
NT
IAL
Fin
al R
eport
Co
st B
en
efit A
na
lysis
of K
isan
Hit U
rja S
ha
kti Y
oja
na
(KH
US
H
158
MC
B/IS
A/A
/0/0
10 A
pril 2
014
P:\A
hm
edabad\A
MC
\PR
OJE
CT
S\3
26672A
A01\D
ocum
ents
\Report\G
UV
NL - K
HU
SH
Y - F
inal R
eport-V
3.d
ocx
Units Send (MuS) Units Billed (MuS)
Discom Circle Feeder 2006-
07 2007-
08 2008-
09 2009-
10 2010-
11 2011-
12 2012-
13 2006-
07 2007-
08 2008-
09 2009-
10 2010-
11 2011-
12 2012-
13
PGVCL Junagadh Leriya Ag 5.33 5.05 4.80 5.77 3.30 5.18 5.31 2.43 2.25 2.08 2.21 2.09 2.55 2.55
PGVCL Junagadh Moradia 6.87 6.45 6.89 8.02 6.06 6.42 4.65 1.85 1.93 1.98 2.39 2.44 2.83 3.13
PGVCL Junagadh Pipalava 9.77 8.72 7.04 8.34 6.23 7.23 7.57 3.07 3.56 3.72 3.40 3.72 3.93 4.60
PGVCL Junagadh Raydi (Rampara) 8.33 9.08 8.53 8.47 6.63 6.56 5.25 3.33 2.97 3.20 3.23 3.12 3.56 3.86
PGVCL Junagadh Sonrakh 0.00 0.00 0.00 0.00 0.03 0.16 0.15 0.00 0.00 0.00 0.00 0.02 0.10 0.12
PGVCL Junagadh Sunderpara 4.96 6.96 6.25 7.18 5.93 8.17 7.81 1.93 1.38 1.44 1.77 1.85 2.09 2.72
PGVCL Junagadh Swami 0.00 0.00 1.80 4.04 2.63 3.32 4.59 0.00 0.00 0.97 1.56 1.34 1.29 1.81
PGVCL Morbi Ambardi 7.01 5.45 4.55 10.39 9.01 9.30 10.85 2.82 2.89 3.07 3.36 3.56 3.90 5.03
PGVCL Morbi Ambavadi 0.06 2.32 3.16 3.99 3.59 3.94 5.80 0.00 0.05 0.05 0.05 1.16 1.94 4.05
PGVCL Morbi Balwam 1.71 4.37 4.35 5.32 4.03 4.28 6.87 1.02 1.30 1.31 1.30 2.34 3.05 4.11
PGVCL Morbi Chupani 12.82 13.29 12.89 14.45 13.78 17.36 21.81 6.18 6.15 6.67 6.93 7.93 9.09 12.22
PGVCL Morbi Dhavana 0.00 7.94 7.90 9.23 10.36 5.06 6.83 0.00 3.61 4.00 3.95 4.30 4.60 2.46
PGVCL Morbi Hadmatia Ag 2.78 3.28 3.68 3.19 2.31 2.38 3.43 0.72 0.74 0.70 0.76 0.69 0.76 1.77
PGVCL Morbi Holmadh 3.00 2.98 3.35 2.94 1.84 2.14 3.14 0.14 0.13 3.16 2.95 1.06 1.10 2.90
PGVCL Morbi Jay Bhavani 8.19 8.03 7.20 5.34 4.85 4.46 5.64 2.88 2.94 3.05 3.29 2.48 2.12 3.01
PGVCL Morbi Jay Bhole 0.00 0.20 2.84 6.68 5.58 7.38 10.79 0.00 0.08 0.50 0.46 2.02 3.22 4.08
PGVCL Morbi Kansari 5.41 5.39 5.12 6.61 4.62 4.56 6.20 1.00 1.53 1.60 1.69 1.87 1.90 3.47
PGVCL Morbi Merupar 0.00 7.16 7.17 8.69 8.15 8.19 9.89 0.00 2.91 2.97 3.09 3.25 4.01 5.57
PGVCL Morbi Om 3.13 2.98 2.64 3.17 2.89 4.77 5.87 0.43 0.50 0.85 1.38 1.50 1.60 2.34
PGVCL Morbi Pavan 7.38 8.37 9.29 10.05 8.65 5.45 4.68 3.17 3.23 3.62 3.76 4.06 4.28 3.34
PGVCL Morbi Ranipat 0.00 5.48 6.00 7.43 6.67 5.95 6.20 0.00 1.18 1.33 1.53 1.84 2.07 1.67
PGVCL Morbi Ratadia 5.46 5.63 5.55 7.33 2.32 2.92 3.89 0.26 0.37 0.88 1.70 0.67 0.84 2.43
PGVCL Morbi Samtherava 3.69 6.36 6.66 7.72 6.20 7.55 8.93 1.98 2.24 2.30 2.84 2.76 3.32 5.36
PGVCL Morbi Shivlaheri 5.88 8.16 8.65 10.89 8.32 6.46 7.33 2.16 2.23 2.43 2.57 2.97 2.97 4.42
PGVCL Morbi Sundari 6.77 8.11 7.94 9.46 8.05 8.53 7.37 1.45 1.59 1.72 1.95 2.14 2.27 2.42
PGVCL Morbi Sundergadh 7.74 8.13 7.34 6.51 6.41 6.99 9.07 4.58 4.40 4.59 3.23 4.94 5.11 6.03
PGVCL Porbandar Amarnath 0.00 2.56 2.88 3.29 2.62 1.98 2.32 0.00 0.82 0.71 2.18 2.17 1.86 1.92

CO
NF
IDE
NT
IAL
Fin
al R
eport
Co
st B
en
efit A
na
lysis
of K
isan
Hit U
rja S
ha
kti Y
oja
na
(KH
US
H
159
MC
B/IS
A/A
/0/0
10 A
pril 2
014
P:\A
hm
edabad\A
MC
\PR
OJE
CT
S\3
26672A
A01\D
ocum
ents
\Report\G
UV
NL - K
HU
SH
Y - F
inal R
eport-V
3.d
ocx
Units Send (MuS) Units Billed (MuS)
Discom Circle Feeder 2006-
07 2007-
08 2008-
09 2009-
10 2010-
11 2011-
12 2012-
13 2006-
07 2007-
08 2008-
09 2009-
10 2010-
11 2011-
12 2012-
13
PGVCL Porbandar Boradi 0.00 0.00 0.00 0.00 1.28 2.62 6.19 0.00 0.00 0.00 0.00 0.59 0.79 2.65
PGVCL Porbandar Chakivav 2.35 3.49 3.94 4.73 3.77 4.39 4.40 0.82 1.60 1.68 2.35 2.38 2.46 2.53
PGVCL Porbandar Chamunda 0.00 0.00 0.00 0.86 1.52 2.14 2.07 0.00 0.00 0.00 0.63 1.09 1.12 1.10
PGVCL Porbandar Devgam 3.42 4.02 3.60 4.28 3.78 3.73 3.01 2.61 1.90 2.00 1.91 1.88 2.24 2.33
PGVCL Porbandar Diwasa 1.28 1.00 1.22 1.38 1.30 1.49 1.48 0.55 0.62 0.65 0.66 0.65 0.67 0.70
PGVCL Porbandar Khodiyar Pbr 0.00 1.35 2.76 3.11 2.64 2.92 3.52 0.00 0.07 0.87 0.95 0.91 1.29 2.09
PGVCL Porbandar Mariya 0.00 0.00 0.00 2.96 1.10 1.99 2.21 0.00 0.00 0.00 2.57 1.06 1.14 1.14
PGVCL Porbandar Nonjalvav 4.86 3.22 3.48 4.80 2.95 4.18 6.24 1.98 1.90 2.04 2.47 2.37 2.80 2.94
PGVCL Porbandar Nunarda 0.00 1.25 0.75 1.66 1.35 1.61 1.64 0.00 0.97 0.18 0.55 0.53 0.46 1.12
PGVCL Porbandar Satmarg 2.11 2.67 2.93 3.33 2.23 2.46 2.68 0.88 1.61 1.31 1.06 1.03 1.12 1.15
PGVCL Porbandar Shepa 3.42 3.93 5.94 6.62 5.12 5.24 5.13 2.75 3.39 3.85 4.36 4.23 3.95 4.05
PGVCL Porbandar Shergadh 1.87 2.90 3.10 3.72 2.83 2.97 3.05 1.29 1.67 1.72 2.03 2.56 3.08 3.66
PGVCL Porbandar Water Works 2.91 3.69 3.76 4.01 3.40 3.86 4.01 2.08 2.23 2.25 2.34 2.29 2.46 2.39
PGVCL Rajkot City Nakarawadi 2.90 4.32 4.56 4.33 2.71 3.47 0.00 0.00 1.49 2.67 2.32 2.04 2.60 0.00
PGVCL Rajkot City Rangpar 3.59 3.05 3.24 4.39 2.77 3.48 0.00 0.72 1.72 1.82 2.24 2.07 1.99 0.00
PGVCL Rajkot Rural Bateshwar 0.00 1.10 2.80 5.12 2.08 1.97 2.35 0.00 1.15 1.49 1.58 1.55 1.73 1.97
PGVCL Rajkot Rural Bhadva 4.51 4.44 3.78 3.48 2.57 3.16 3.25 2.72 2.34 2.51 2.17 2.17 2.48 2.74
PGVCL Rajkot Rural Dedarva 2.02 3.32 3.40 5.22 3.95 5.67 5.94 1.19 1.79 1.97 2.37 2.39 3.06 2.92
PGVCL Rajkot Rural Devda 5.84 2.46 5.14 4.02 2.93 1.49 1.25 0.01 0.24 0.50 1.50 1.93 1.16 1.06
PGVCL Rajkot Rural Devgam Rrc 4.67 5.52 6.28 6.01 3.58 3.75 4.39 0.98 1.11 0.95 1.07 1.21 1.66 2.15
PGVCL Rajkot Rural Gadhka 0.60 2.85 3.42 3.71 2.43 2.67 2.51 0.17 1.27 1.30 2.24 2.11 2.25 2.74
PGVCL Rajkot Rural Godladhar 0.00 0.00 0.00 0.85 1.64 1.82 1.71 0.00 0.00 0.00 0.00 0.00 0.04 0.89
PGVCL Rajkot Rural Haripar Rrc 0.00 0.68 2.00 2.33 1.18 1.61 2.03 0.00 0.00 0.64 0.95 0.96 1.19 1.21
PGVCL Rajkot Rural Kobeshwar 0.00 0.00 1.75 3.10 2.20 3.22 2.96 0.00 0.00 0.61 2.47 2.33 2.32 2.93
PGVCL Rajkot Rural Lilapur 5.85 5.93 5.82 2.68 2.10 2.54 2.88 2.39 2.09 2.36 1.01 1.13 1.17 1.51
PGVCL Rajkot Rural Lunagara 0.00 0.00 1.61 2.12 2.16 3.03 2.02 0.00 0.00 1.26 2.26 2.30 2.72 2.38
PGVCL Rajkot Rural Makhavad 0.00 0.00 0.00 0.00 0.87 1.59 1.23 0.00 0.00 0.00 0.00 0.16 0.11 1.14
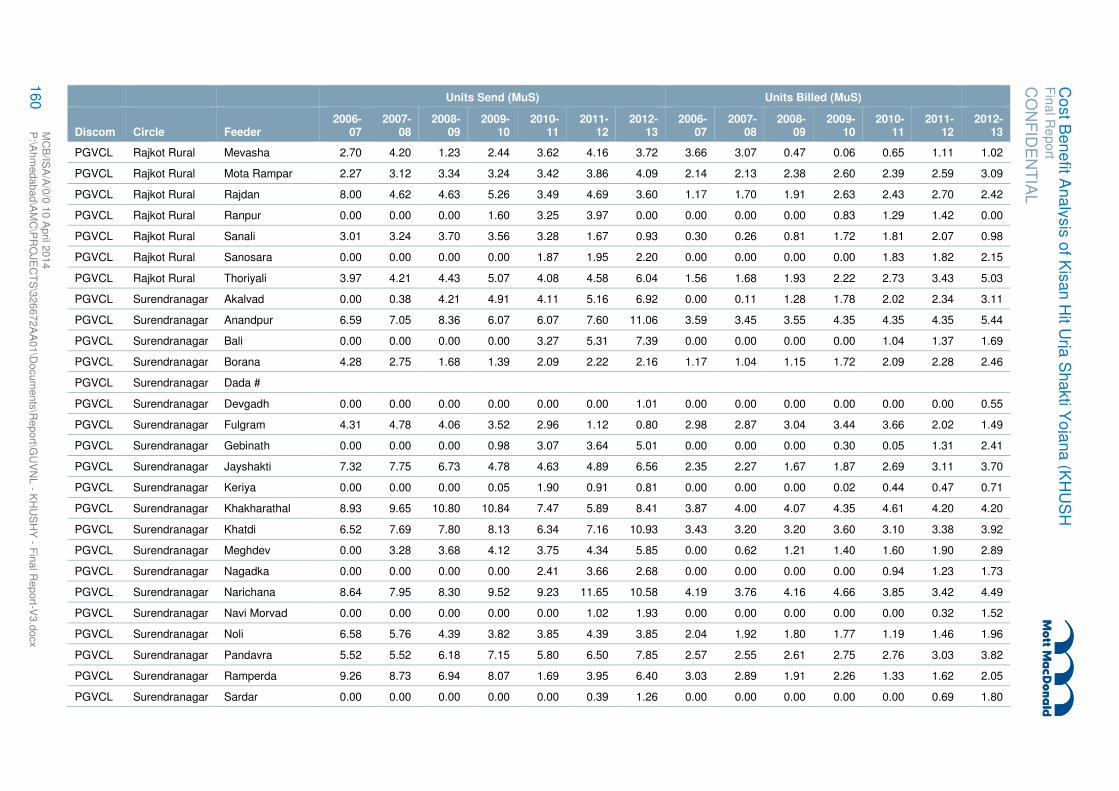
CO
NF
IDE
NT
IAL
Fin
al R
eport
Co
st B
en
efit A
na
lysis
of K
isan
Hit U
rja S
ha
kti Y
oja
na
(KH
US
H
160
MC
B/IS
A/A
/0/0
10 A
pril 2
014
P:\A
hm
edabad\A
MC
\PR
OJE
CT
S\3
26672A
A01\D
ocum
ents
\Report\G
UV
NL - K
HU
SH
Y - F
inal R
eport-V
3.d
ocx
Units Send (MuS) Units Billed (MuS)
Discom Circle Feeder 2006-
07 2007-
08 2008-
09 2009-
10 2010-
11 2011-
12 2012-
13 2006-
07 2007-
08 2008-
09 2009-
10 2010-
11 2011-
12 2012-
13
PGVCL Rajkot Rural Mevasha 2.70 4.20 1.23 2.44 3.62 4.16 3.72 3.66 3.07 0.47 0.06 0.65 1.11 1.02
PGVCL Rajkot Rural Mota Rampar 2.27 3.12 3.34 3.24 3.42 3.86 4.09 2.14 2.13 2.38 2.60 2.39 2.59 3.09
PGVCL Rajkot Rural Rajdan 8.00 4.62 4.63 5.26 3.49 4.69 3.60 1.17 1.70 1.91 2.63 2.43 2.70 2.42
PGVCL Rajkot Rural Ranpur 0.00 0.00 0.00 1.60 3.25 3.97 0.00 0.00 0.00 0.00 0.83 1.29 1.42 0.00
PGVCL Rajkot Rural Sanali 3.01 3.24 3.70 3.56 3.28 1.67 0.93 0.30 0.26 0.81 1.72 1.81 2.07 0.98
PGVCL Rajkot Rural Sanosara 0.00 0.00 0.00 0.00 1.87 1.95 2.20 0.00 0.00 0.00 0.00 1.83 1.82 2.15
PGVCL Rajkot Rural Thoriyali 3.97 4.21 4.43 5.07 4.08 4.58 6.04 1.56 1.68 1.93 2.22 2.73 3.43 5.03
PGVCL Surendranagar Akalvad 0.00 0.38 4.21 4.91 4.11 5.16 6.92 0.00 0.11 1.28 1.78 2.02 2.34 3.11
PGVCL Surendranagar Anandpur 6.59 7.05 8.36 6.07 6.07 7.60 11.06 3.59 3.45 3.55 4.35 4.35 4.35 5.44
PGVCL Surendranagar Bali 0.00 0.00 0.00 0.00 3.27 5.31 7.39 0.00 0.00 0.00 0.00 1.04 1.37 1.69
PGVCL Surendranagar Borana 4.28 2.75 1.68 1.39 2.09 2.22 2.16 1.17 1.04 1.15 1.72 2.09 2.28 2.46
PGVCL Surendranagar Dada #
PGVCL Surendranagar Devgadh 0.00 0.00 0.00 0.00 0.00 0.00 1.01 0.00 0.00 0.00 0.00 0.00 0.00 0.55
PGVCL Surendranagar Fulgram 4.31 4.78 4.06 3.52 2.96 1.12 0.80 2.98 2.87 3.04 3.44 3.66 2.02 1.49
PGVCL Surendranagar Gebinath 0.00 0.00 0.00 0.98 3.07 3.64 5.01 0.00 0.00 0.00 0.30 0.05 1.31 2.41
PGVCL Surendranagar Jayshakti 7.32 7.75 6.73 4.78 4.63 4.89 6.56 2.35 2.27 1.67 1.87 2.69 3.11 3.70
PGVCL Surendranagar Keriya 0.00 0.00 0.00 0.05 1.90 0.91 0.81 0.00 0.00 0.00 0.02 0.44 0.47 0.71
PGVCL Surendranagar Khakharathal 8.93 9.65 10.80 10.84 7.47 5.89 8.41 3.87 4.00 4.07 4.35 4.61 4.20 4.20
PGVCL Surendranagar Khatdi 6.52 7.69 7.80 8.13 6.34 7.16 10.93 3.43 3.20 3.20 3.60 3.10 3.38 3.92
PGVCL Surendranagar Meghdev 0.00 3.28 3.68 4.12 3.75 4.34 5.85 0.00 0.62 1.21 1.40 1.60 1.90 2.89
PGVCL Surendranagar Nagadka 0.00 0.00 0.00 0.00 2.41 3.66 2.68 0.00 0.00 0.00 0.00 0.94 1.23 1.73
PGVCL Surendranagar Narichana 8.64 7.95 8.30 9.52 9.23 11.65 10.58 4.19 3.76 4.16 4.66 3.85 3.42 4.49
PGVCL Surendranagar Navi Morvad 0.00 0.00 0.00 0.00 0.00 1.02 1.93 0.00 0.00 0.00 0.00 0.00 0.32 1.52
PGVCL Surendranagar Noli 6.58 5.76 4.39 3.82 3.85 4.39 3.85 2.04 1.92 1.80 1.77 1.19 1.46 1.96
PGVCL Surendranagar Pandavra 5.52 5.52 6.18 7.15 5.80 6.50 7.85 2.57 2.55 2.61 2.75 2.76 3.03 3.82
PGVCL Surendranagar Ramperda 9.26 8.73 6.94 8.07 1.69 3.95 6.40 3.03 2.89 1.91 2.26 1.33 1.62 2.05
PGVCL Surendranagar Sardar 0.00 0.00 0.00 0.00 0.00 0.39 1.26 0.00 0.00 0.00 0.00 0.00 0.69 1.80

CO
NF
IDE
NT
IAL
Fin
al R
eport
Co
st B
en
efit A
na
lysis
of K
isan
Hit U
rja S
ha
kti Y
oja
na
(KH
US
H
161
MC
B/IS
A/A
/0/0
10 A
pril 2
014
P:\A
hm
edabad\A
MC
\PR
OJE
CT
S\3
26672A
A01\D
ocum
ents
\Report\G
UV
NL - K
HU
SH
Y - F
inal R
eport-V
3.d
ocx
Units Send (MuS) Units Billed (MuS)
Discom Circle Feeder 2006-
07 2007-
08 2008-
09 2009-
10 2010-
11 2011-
12 2012-
13 2006-
07 2007-
08 2008-
09 2009-
10 2010-
11 2011-
12 2012-
13
PGVCL Surendranagar Siddhanath 10.03 10.25 7.03 6.02 5.23 5.48 7.39 3.14 3.02 2.70 1.93 2.83 3.09 3.40
DGVCL Valsad Mendharbhat 0.14 0.14 0.14 0.14 0.12 0.15 0.18 1.97 0.44 0.44 0.46 0.44 0.45 0.48
DGVCL Bharuch Pariyej - - 3.64 5.04 4.60 5.05 4.23 - - 3.10 3.58 3.73 3.83 3.89
DGVCL Valsad Rumla 8.09 2.57 1.92 2.18 2.78 2.91 2.63 3.54 2.40 1.57 1.73 1.58 1.67 1.69
DGVCL Bharuch Karena - - - - 5.26 5.15 5.20 - - - - 3.80 4.10 3.91
DGVCL Bharuch Danda - - - - - 4.71 4.94 - - - - - 4.22 4.30
DGVCL Surat Rural Siker Ag Dom - - 3.17 4.31 3.90 3.78 2.62 - - 0.52 1.03 0.72 0.76 1.90
DGVCL Valsad Maroli Rural 6.01 2.71 2.61 2.65 2.73 2.93 1.72 1.30 0.74 0.65 0.58 0.54 0.50 0.29
MGVCL Anand Pansora 3.59 3.51 4.29 4.07 2.37 2.69 3.10 2.55 2.26 2.93 3.24 2.05 2.28 2.53
MGVCL Anand Dagjipura 2.27 3.22 3.29 3.76 3.43 4.01 4.70 1.01 1.92 2.51 3.00 2.84 3.44 3.57
MGVCL Anand Kasor 3.10 2.95 3.24 3.84 3.47 4.66 4.13 2.95 2.24 2.55 3.17 2.74 3.92 3.51
MGVCL Nadiad Gangadas nu
Muvado - 3.66 3.85 5.60 4.75 4.85 4.87 - 2.52 2.68 2.71 2.79 3.11 2.77
UGCVL Mehsana Mahiyal 2.09 2.15 2.22 2.56 2.19 2.44 2.67 2.03 2.10 2.15 2.37 2.49 2.25 2.58
UGCVL Mehsana Koita 6.81 5.08 4.07 4.96 4.38 4.36 5.40 5.81 3.88 3.88 4.15 4.10 4.10 4.30
UGCVL Mehsana Delvada 0.78 3.37 4.78 5.97 5.29 5.99 7.31 0.70 2.48 3.94 4.74 5.12 5.35 5.60
UGCVL Palanpur Rampura - 1.22 1.05 1.23 1.05 1.15 1.39 - 1.14 1.23 1.06 1.09 1.14 1.19
UGCVL Palanpur Sejalpura - 1.15 1.05 1.17 0.98 1.12 1.25 - 1.18 1.18 1.11 1.13 1.19 1.20
UGCVL Hinatnagar Arsoda 2.58 2.53 1.99 2.12 1.90 2.12 2.19 2.43 1.50 1.57 1.76 1.77 1.83 1.97
UGCVL Hinatnagar Katpur 2.06 2.38 3.25 5.50 4.96 4.49 4.77 1.97 1.92 2.33 4.24 4.35 3.81 3.86

Cost Benefit Analysis of Kisan Hit Urja Shakti Yojana (KHUSH Final Report
CONFIDENTIAL
MCB/ISA/A/0/0 10 April 2014 P:\Ahmedabad\AMC\PROJECTS\326672AA01\Documents\Report\GUVNL - KHUSHY - Final Report-V3.docx MCB/ISA/A/0/0 10 April 2014 P:\Ahmedabad\AMC\PROJECTS\326672AA01\Documents\Report\GUVNL - KHUSHY - Final Report-V3.docx
162
The Feeder-wise details on transformer failure and customer interruptions are as given in the table:
Appendix C. Feeder-Wise Details on Transformer Failure & Customer Complaints

CO
NF
IDE
NT
IAL
Fin
al R
eport
Co
st B
en
efit A
na
lysis
of K
isan
Hit U
rja S
ha
kti Y
oja
na
(KH
US
H
163
MC
B/IS
A/A
/0/0
10 A
pril 2
014
P:\A
hm
edabad\A
MC
\PR
OJE
CT
S\3
26672A
A01\D
ocum
ents
\Report\G
UV
NL - K
HU
SH
Y - F
inal R
eport-V
3.d
ocx
Discom Circle Feeder
Year-Wise Transformer Failures
2006-07 2007-08 2008-09 2009-10 2010-11 2011-12 2012-13
PGVCL Amreli Amodra 38 43 35 47 47 47 13
PGVCL Amreli Anandpur Amr 15 18 23 18 18 17 12
PGVCL Amreli Balnath 37 46 34 45 43 6 6
PGVCL Amreli Batheshvar #
PGVCL Amreli Bhavani 17 15 27 20 14 12 9
PGVCL Amreli Dhundhiya Pipaliya 25 28 27 8 7 15 15
PGVCL Amreli Fafani 21 23 38 21 13 11 11
PGVCL Amreli Fichadi 28 24 17 15 10 11 2
PGVCL Amreli Gaytri 19 21 33 25 13 16 22
PGVCL Amreli Gir Devali 17 18 19 12 13 13 9
PGVCL Amreli Giriya 0 0 49 45 57 34 7
PGVCL Amreli Hindorana 56 59 58 14 8 8 14
PGVCL Amreli Khodiyar #
PGVCL Amreli Marvadi 0 0 47 52 43 40 37
PGVCL Amreli Morzar 72 56 60 45 40 38 38
PGVCL Amreli Pichhava Ag 32 36 27 24 16 18 17
PGVCL Amreli Satyanarayan #
PGVCL Amreli Valaradi 0 0 26 24 26 23 7
PGVCL Amreli Vavdi Road 0 0 21 11 0 11 11
PGVCL Bhavnagar Bcw 0 0 0 0 8 5 2
PGVCL Bhavnagar Bhandariya 60 60 17 10 10
PGVCL Bhavnagar Borda Ag 0 42 126 21 7 6 9
PGVCL Bhavnagar Datha 0 0 0 0 24 9 1
PGVCL Bhavnagar Hathab 0 0 0 0 20 18 15
PGVCL Bhavnagar Hipavadli 2 2 2
PGVCL Bhavnagar Jaspara 0 58 81 67 10 4 4
PGVCL Bhavnagar Khodiyar 0 12 7 6 11 7 1
PGVCL Bhavnagar Khokhara 0 15 8 6 4 2 2

CO
NF
IDE
NT
IAL
Fin
al R
eport
Co
st B
en
efit A
na
lysis
of K
isan
Hit U
rja S
ha
kti Y
oja
na
(KH
US
H
164
MC
B/IS
A/A
/0/0
10 A
pril 2
014
P:\A
hm
edabad\A
MC
\PR
OJE
CT
S\3
26672A
A01\D
ocum
ents
\Report\G
UV
NL - K
HU
SH
Y - F
inal R
eport-V
3.d
ocx
Discom Circle Feeder
Year-Wise Transformer Failures
2006-07 2007-08 2008-09 2009-10 2010-11 2011-12 2012-13
PGVCL Bhavnagar Kotda 0 22 64 14 1 4 3
PGVCL Bhavnagar Navagam 0 0 0 0 15 9 9
PGVCL Bhavnagar Padri 22 18 18
PGVCL Bhavnagar Pipardi Ag 0 0 0 0 12 8 8
PGVCL Bhavnagar Vadal 0 0 0 0 18 3 1
PGVCL Bhavnagar Vavadi 0 18 29 20 5 7 7
PGVCL Bhuj Arjanpar Ag 28 25 23 15 21 21 19
PGVCL Bhuj Bhalot Ag 0 0 3 3 15 10 11
PGVCL Bhuj Bhavanipar 0 0 2 8 21 21 3
PGVCL Bhuj Dabda 0 0 0 3 9 9 12
PGVCL Bhuj Devisar 24 16 20 14 14 10 10
PGVCL Bhuj Gelda 29 28 21 19 18 25 10
PGVCL Bhuj Hamirpar 14 13 14 12 12 13 11
PGVCL Bhuj Kharoi 13 12 10 9 11 8 8
PGVCL Bhuj Khengarpar 15 13 13 15 10 12 9
PGVCL Bhuj Khirsara Ag 13 13 12 13 16 11 8
PGVCL Bhuj Mathal Ag 20 16 16 15 11 7 12
PGVCL Bhuj Meghpar 30 21 28 35 27 27 30
PGVCL Bhuj Navinal 23 22 21 19 13 10 13
PGVCL Bhuj Vavdi 17 15 11
PGVCL Botad Babarkot 33 11 3 2 2
PGVCL Botad Dhakaniya 12 3 2
PGVCL Botad Mithapur Ag 38 20 3 5 9 3
PGVCL Botad Patana 12 4 5 16 13 6
PGVCL Botad Pipal 10 9 4
PGVCL Botad Ratanvav 17 5 11
PGVCL Botad Sitapar 6 7 7
PGVCL Botad Zamrala Ag 3 7

CO
NF
IDE
NT
IAL
Fin
al R
eport
Co
st B
en
efit A
na
lysis
of K
isan
Hit U
rja S
ha
kti Y
oja
na
(KH
US
H
165
MC
B/IS
A/A
/0/0
10 A
pril 2
014
P:\A
hm
edabad\A
MC
\PR
OJE
CT
S\3
26672A
A01\D
ocum
ents
\Report\G
UV
NL - K
HU
SH
Y - F
inal R
eport-V
3.d
ocx
Discom Circle Feeder
Year-Wise Transformer Failures
2006-07 2007-08 2008-09 2009-10 2010-11 2011-12 2012-13
PGVCL Jamnagar Aliyabada (New) 39 59 4 12 5 5 8
PGVCL Jamnagar Bamangam 61 26 24 8 7 6 6
PGVCL Jamnagar Dhandha Ag 74 74 42 39 52 32 9
PGVCL Jamnagar Gunda 38 34 30 26 42 28 20
PGVCL Jamnagar Hapa Lakhasar 49 51 48 43 10 12 5
PGVCL Jamnagar Haripar 34 81 67 64 45 39 24
PGVCL Jamnagar Juvangadh 60 51 53 69 65 59 34
PGVCL Jamnagar Mota Vadiya 76 72 61 56 15 8 8
PGVCL Jamnagar Padana 90 62 41 27 32 37 9
PGVCL Jamnagar Rampar 35 38 26 39 37 11 2
PGVCL Jamnagar Sanala 57 51 24 27 34 25 10
PGVCL Jamnagar Sidsar 84 64 76 65 64 61 17
PGVCL Jamnagar Theba Ag. 23 23 23 33 17 17 6
PGVCL Junagadh Amblash 11 10 9 11 17 15 16
PGVCL Junagadh Balot (Naredi) 10 8 10 12 10 9 8
PGVCL Junagadh Bhalchel 6 3 2 2 3 3 5
PGVCL Junagadh Bhatgam 5 9 16 14 13 17 12
PGVCL Junagadh Dari Navapara 12 11 11 11 11 10 10
PGVCL Junagadh Gorakhmadhi 14 14 14 14 16 15 18
PGVCL Junagadh Govindpara (Old Talala) 10 9 10 9 9 8 12
PGVCL Junagadh Harnasha 10 8 8 7 9 8 9
PGVCL Junagadh Khodiyar Jnd 10 9 10 9 10 10 12
PGVCL Junagadh Kodidra 8 7 6 9 15 14 14
PGVCL Junagadh Leriya Ag 12 13 13 17 15 16 9
PGVCL Junagadh Moradia 12 10 9 13 18 16 15
PGVCL Junagadh Pipalava 12 13 12 14 23 21 22
PGVCL Junagadh Raydi (Rampara) 10 11 11 12 13 12 14
PGVCL Junagadh Sonrakh 0 0 0 0 0 2 1
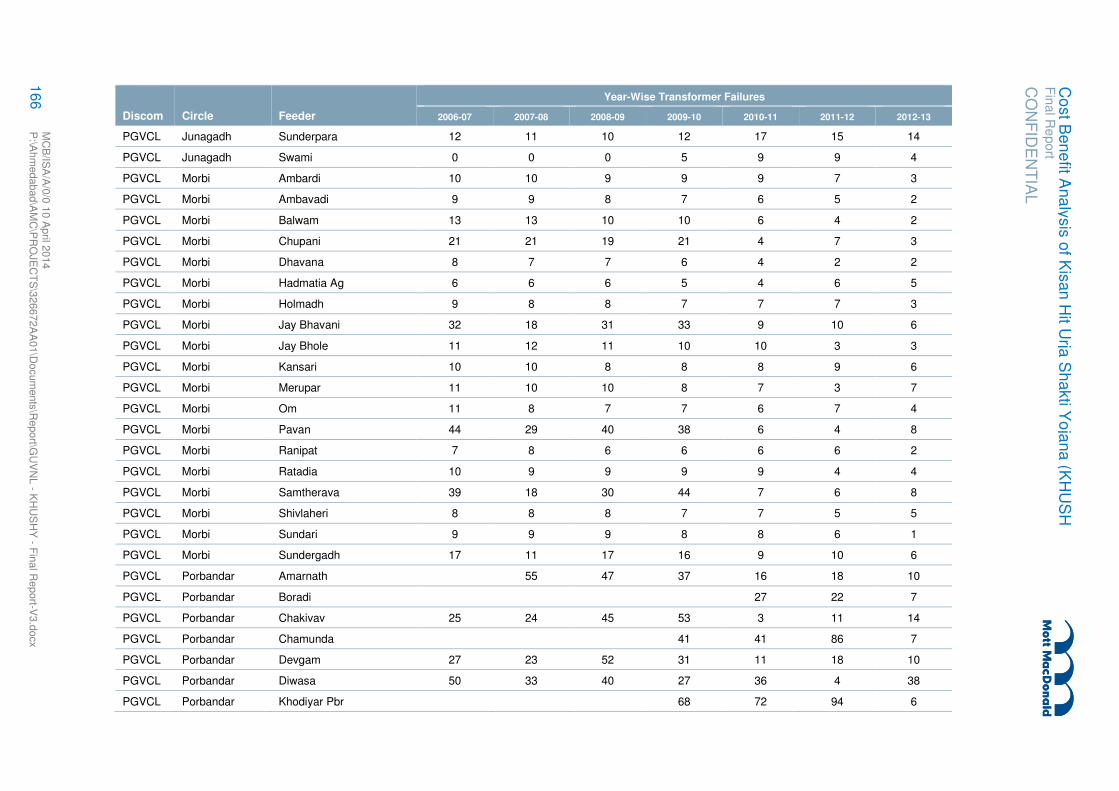
CO
NF
IDE
NT
IAL
Fin
al R
eport
Co
st B
en
efit A
na
lysis
of K
isan
Hit U
rja S
ha
kti Y
oja
na
(KH
US
H
166
MC
B/IS
A/A
/0/0
10 A
pril 2
014
P:\A
hm
edabad\A
MC
\PR
OJE
CT
S\3
26672A
A01\D
ocum
ents
\Report\G
UV
NL - K
HU
SH
Y - F
inal R
eport-V
3.d
ocx
Discom Circle Feeder
Year-Wise Transformer Failures
2006-07 2007-08 2008-09 2009-10 2010-11 2011-12 2012-13
PGVCL Junagadh Sunderpara 12 11 10 12 17 15 14
PGVCL Junagadh Swami 0 0 0 5 9 9 4
PGVCL Morbi Ambardi 10 10 9 9 9 7 3
PGVCL Morbi Ambavadi 9 9 8 7 6 5 2
PGVCL Morbi Balwam 13 13 10 10 6 4 2
PGVCL Morbi Chupani 21 21 19 21 4 7 3
PGVCL Morbi Dhavana 8 7 7 6 4 2 2
PGVCL Morbi Hadmatia Ag 6 6 6 5 4 6 5
PGVCL Morbi Holmadh 9 8 8 7 7 7 3
PGVCL Morbi Jay Bhavani 32 18 31 33 9 10 6
PGVCL Morbi Jay Bhole 11 12 11 10 10 3 3
PGVCL Morbi Kansari 10 10 8 8 8 9 6
PGVCL Morbi Merupar 11 10 10 8 7 3 7
PGVCL Morbi Om 11 8 7 7 6 7 4
PGVCL Morbi Pavan 44 29 40 38 6 4 8
PGVCL Morbi Ranipat 7 8 6 6 6 6 2
PGVCL Morbi Ratadia 10 9 9 9 9 4 4
PGVCL Morbi Samtherava 39 18 30 44 7 6 8
PGVCL Morbi Shivlaheri 8 8 8 7 7 5 5
PGVCL Morbi Sundari 9 9 9 8 8 6 1
PGVCL Morbi Sundergadh 17 11 17 16 9 10 6
PGVCL Porbandar Amarnath 55 47 37 16 18 10
PGVCL Porbandar Boradi 27 22 7
PGVCL Porbandar Chakivav 25 24 45 53 3 11 14
PGVCL Porbandar Chamunda 41 41 86 7
PGVCL Porbandar Devgam 27 23 52 31 11 18 10
PGVCL Porbandar Diwasa 50 33 40 27 36 4 38
PGVCL Porbandar Khodiyar Pbr 68 72 94 6

CO
NF
IDE
NT
IAL
Fin
al R
eport
Co
st B
en
efit A
na
lysis
of K
isan
Hit U
rja S
ha
kti Y
oja
na
(KH
US
H
167
MC
B/IS
A/A
/0/0
10 A
pril 2
014
P:\A
hm
edabad\A
MC
\PR
OJE
CT
S\3
26672A
A01\D
ocum
ents
\Report\G
UV
NL - K
HU
SH
Y - F
inal R
eport-V
3.d
ocx
Discom Circle Feeder
Year-Wise Transformer Failures
2006-07 2007-08 2008-09 2009-10 2010-11 2011-12 2012-13
PGVCL Porbandar Mariya 17 27 36 36 22 24 9
PGVCL Porbandar Nonjalvav 29 29 30 11 12 10 14
PGVCL Porbandar Nunarda 10 12 19 11 6 9 1
PGVCL Porbandar Satmarg 21 19 20 8 3 3 7
PGVCL Porbandar Shepa 15 22 25 24 49 11 6
PGVCL Porbandar Shergadh 38 40 35 43 4 7 11
PGVCL Porbandar Water Works 27 23 52 31 11 18 10
PGVCL Rajkot City Nakarawadi 12 10 11 14 13 17
PGVCL Rajkot City Rangpar 14 16 10 8 9 13
PGVCL Rajkot Rural Bateshwar 9 9 9 12 9 16 7
PGVCL Rajkot Rural Bhadva 40 34 16 9 23 12 10
PGVCL Rajkot Rural Dedarva 14 13 11 10 10 10 5
PGVCL Rajkot Rural Devda 20 20 16 7 3 3 2
PGVCL Rajkot Rural Devgam Rrc 27 23 52 31 11 18 10
PGVCL Rajkot Rural Gadhka 52 33 38 33 9 2 2
PGVCL Rajkot Rural Godladhar 13 13 13 8 21 8 3
PGVCL Rajkot Rural Haripar Rrc 134 81 67 64 45 39 24
PGVCL Rajkot Rural Kobeshwar 79 79 79 90 22 13 10
PGVCL Rajkot Rural Lilapur 63 59 23 9 10 3 2
PGVCL Rajkot Rural Lunagara 9 9 9 9 12 9 8
PGVCL Rajkot Rural Makhavad 22 22 22 22 22 6 3
PGVCL Rajkot Rural Mevasha 38 30 33 40 16 30 8
PGVCL Rajkot Rural Mota Rampar 32 31 44 29 33 19 10
PGVCL Rajkot Rural Rajdan 46 35 35 30 3 5 10
PGVCL Rajkot Rural Ranpur 22 14 13 2
PGVCL Rajkot Rural Sanali 14 9 4 3 17 3 3
PGVCL Rajkot Rural Sanosara 14 9 4 3 17 3 3
PGVCL Rajkot Rural Thoriyali 20 35 34 15 6 7 15

CO
NF
IDE
NT
IAL
Fin
al R
eport
Co
st B
en
efit A
na
lysis
of K
isan
Hit U
rja S
ha
kti Y
oja
na
(KH
US
H
168
MC
B/IS
A/A
/0/0
10 A
pril 2
014
P:\A
hm
edabad\A
MC
\PR
OJE
CT
S\3
26672A
A01\D
ocum
ents
\Report\G
UV
NL - K
HU
SH
Y - F
inal R
eport-V
3.d
ocx
Discom Circle Feeder
Year-Wise Transformer Failures
2006-07 2007-08 2008-09 2009-10 2010-11 2011-12 2012-13
PGVCL Surendranagar Akalvad 0 34 34 21 15 9 7
PGVCL Surendranagar Anandpur 15 0 23 18 18 17 12
PGVCL Surendranagar Bali 0 0 0 2 19 27 34
PGVCL Surendranagar Borana 38 55 4 2 5 1 2
PGVCL Surendranagar Dada #
PGVCL Surendranagar Devgadh 0 0 0 0 0 0 6
PGVCL Surendranagar Fulgram 37 40 3 4 3 27 11
PGVCL Surendranagar Gebinath 0 0 0 13 21 20 11
PGVCL Surendranagar Jayshakti 52 52 44 30 20 14 15
PGVCL Surendranagar Keriya 0 0 0 14 9 8 3
PGVCL Surendranagar Khakharathal 22 21 27 20 23 29 11
PGVCL Surendranagar Khatdi 34 16 10 45 20 47 34
PGVCL Surendranagar Meghdev 0 59 59 31 19 9 8
PGVCL Surendranagar Nagadka 0 0 0 0 10 8 5
PGVCL Surendranagar Narichana 38 38 17 24 19 15 16
PGVCL Surendranagar Navi Morvad 0 0 0 0 12 14 10
PGVCL Surendranagar Noli 15 10 18 23 13 12 10
PGVCL Surendranagar Pandavra 20 19 13 28 22 19 22
PGVCL Surendranagar Ramperda 40 25 17 38 43 31 31
PGVCL Surendranagar Sardar 0 0 0 0 15 13 9
PGVCL Surendranagar Siddhanath 47 47 54 40 15 10 14

Cost Benefit Analysis of Kisan Hit Urja Shakti Yojana (KHUSH Final Report
CONFIDENTIAL
MCB/ISA/A/0/0 10 April 2014 P:\Ahmedabad\AMC\PROJECTS\326672AA01\Documents\Report\GUVNL - KHUSHY - Final Report-V3.docx MCB/ISA/A/0/0 10 April 2014 P:\Ahmedabad\AMC\PROJECTS\326672AA01\Documents\Report\GUVNL - KHUSHY - Final Report-V3.docx
169
Appendix D. Questionnaire
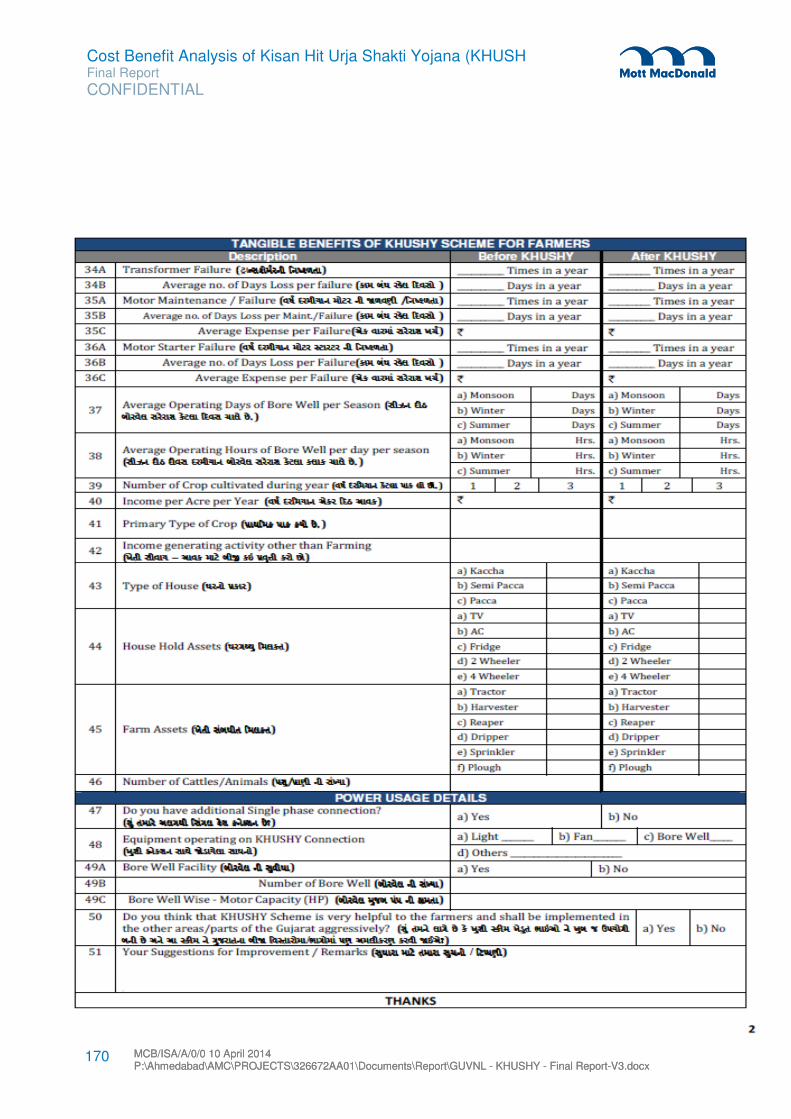
Cost Benefit Analysis of Kisan Hit Urja Shakti Yojana (KHUSH Final Report
CONFIDENTIAL
MCB/ISA/A/0/0 10 April 2014 P:\Ahmedabad\AMC\PROJECTS\326672AA01\Documents\Report\GUVNL - KHUSHY - Final Report-V3.docx MCB/ISA/A/0/0 10 April 2014 P:\Ahmedabad\AMC\PROJECTS\326672AA01\Documents\Report\GUVNL - KHUSHY - Final Report-V3.docx
170